1q 2018 ge earnings supplemental 1q_2018_ge_earnings_supplemental created date: 20180419235700z
TRANSCRIPT

GE Earnings Supplemental
1
GE 1Q'18 Supplemental InformationTABLE OF CONTENTS
Page
ORDERS & BACKLOG BY SEGMENT
INDUSTRIAL BACKLOG TO REMAINING PERFORMANCE OBLIGATION WALK – 1Q’18
EQUIPMENT/SERVICE REVENUE BY SEGMENT - 1Q'18
UNITS SUMMARY - ORDERS
UNITS SUMMARY - SALES
GE INDUSTRIAL SEGMENTS ORGANIC REVENUE GROWTH (NON-GAAP)
GE INDUSTRIAL ORGANIC OPERATING PROFIT AND ORGANIC OPERATING PROFIT MARGIN (NON-GAAP)
ORGANIC REVENUE BY SEGMENT (NON-GAAP)
ADJUSTED GE INDUSTRIAL OPERATING PROFIT AND OPERATING PROFIT MARGIN (EXCLUDING CERTAIN ITEMS) (NON-GAAP)ADJUSTED GE INDUSTRIAL EBITDA (NON-GAAP)
OIL & GAS EXCLUDING BHI REVENUE & OPERATING PROFIT (NON-GAAP)
CORPORATE OPERATIONS & ELIMINATIONS (NON-GAAP)
ADJUSTED EARNINGS AND EARNINGS PER SHARE (NON-GAAP) 8-9
ADJUSTED EARNINGS AND EARNINGS PER SHARE RESTATED FOR REVENUE RECOGNITION (NON-GAAP) 10-11
GE PRE-TAX EARNINGS (LOSS) FROM CONTINUING OPERATIONS; EXCLUDING GE CAPITAL EARNINGS (LOSS) FROMCONTINUING OPERATIONS AND THE CORRESPONDING EFFECTIVE TAX RATES (NON-GAAP)GE INDUSTRIAL STRUCTURAL COSTS (NON-GAAP)
GE INDUSTRIAL FREE CASH FLOWS (FCF) AND ADJUSTED GE INDUSTRIAL FCF (NON-GAAP)
GE CAPITAL SEGMENT RESULTS
GE CAPITAL SEGMENT ASSETS
2018 OPERATING FRAMEWORK: 2018 ADJUSTED EPS (NON-GAAP)
2018 OPERATING FRAMEWORK: ADJUSTED GE INDUSTRIAL FREE CASH FLOWS (NON-GAAP)
NON-GAAP SUPPLEMENTAL INFORMATION
In an effort to provide investors with additional information regarding the company’s results as determined by generally accepted accounting principles (GAAP), the company also discusses, in its earnings press release and earnings presentation materials, the Non-GAAP information identified above, which management believes provides useful information to investors.
2
2
2
3
3
4
4
5
6
6
7
7
12
12
13
13
13
14
14

GE Earnings Supplemental
2
ORDERS & BACKLOG BY SEGMENT
(Dollars in billions)1Q'18
Orders V%1Q'18
Backlog V%Power $ 5.6 (29)% $ 95.9 (2)%Renewable Energy 2.4 15 16.0 28Oil & Gas 5.2 F 21.8 5Aviation 8.1 13 201.6 12Healthcare 4.7 4 17.7 4Transportation 1.5 46 18.8 (1)Lighting 0.2 (9) 0.2 92
Industrial $ 27.4 10 % $ 372.3 7 %
INDUSTRIAL BACKLOG TO REMAINING PERFORMANCE OBLIGATION WALK – 1Q’18(Dollars in billions) Equipment Services TotalBacklog $ 85.7 $ 286.7 $ 372.3
Adjustments (31.9) (87.8) (119.8)Remaining Performance Obligation $ 53.7 $ 198.8 $ 252.5
Note: Backlog includes engine contracts with our customers for which we have received purchase orders that are cancelable. Additionally, our services backlog includes contracts that are cancelable without substantial penalty. We include these items in our reported backlog as our historical experience indicates that the likelihood of cancellation is remote.
EQUIPMENT/SERVICE REVENUE BY SEGMENT - 1Q'18(Dollars in billions) Equipment V% Services V% Total V%
Power $ 3.5 (16)% $ 3.7 (2)% $ 7.2 (9)%Renewable Energy 1.2 (20) 0.4 69 1.6 (7)Oil & Gas 2.2 73 3.2 76 5.4 74Aviation 2.5 (2) 4.6 12 7.1 7Healthcare 2.6 12 2.1 6 4.7 9Transportation 0.3 (47) 0.6 26 0.9 (11)Lighting 0.4 (1) — (8) 0.5 (1)
Industrial segments $ 12.8 — % $ 14.6 18 % $ 27.4 9 %

GE Earnings Supplemental
3
UNITS SUMMARY - ORDERS1Q'18 1Q'17 V
PowerGas Turbines 4 12 (8)
Renewable EnergyOnshore wind turbines 936 589 347
AviationCEO engines 1,175 870 305GEnx engines-a) 24 12 12LEAP engines-a) 994 653 341Military engines 251 72 179
TransportationLocomotives 342 37 305
UNITS SUMMARY - SALES1Q'18 1Q'17 V
PowerGas Turbines 12 20 (8)
Renewable EnergyOnshore wind turbines 352 539 (187)
AviationCEO engines 651 627 24GEnx engines-a) 50 69 (19)LEAP engines-a) 186 77 109Military engines 138 120 18Spares rate-b) $25.2 $21.7 $3.6
TransportationLocomotives 60 157 (97)
(a – GEnx & LEAP engines are a subset of CEO engines.(b – Commercial spares rate in millions of dollars per day.
GE Earnings Supplemental
*Non-GAAP Financial Measure 4
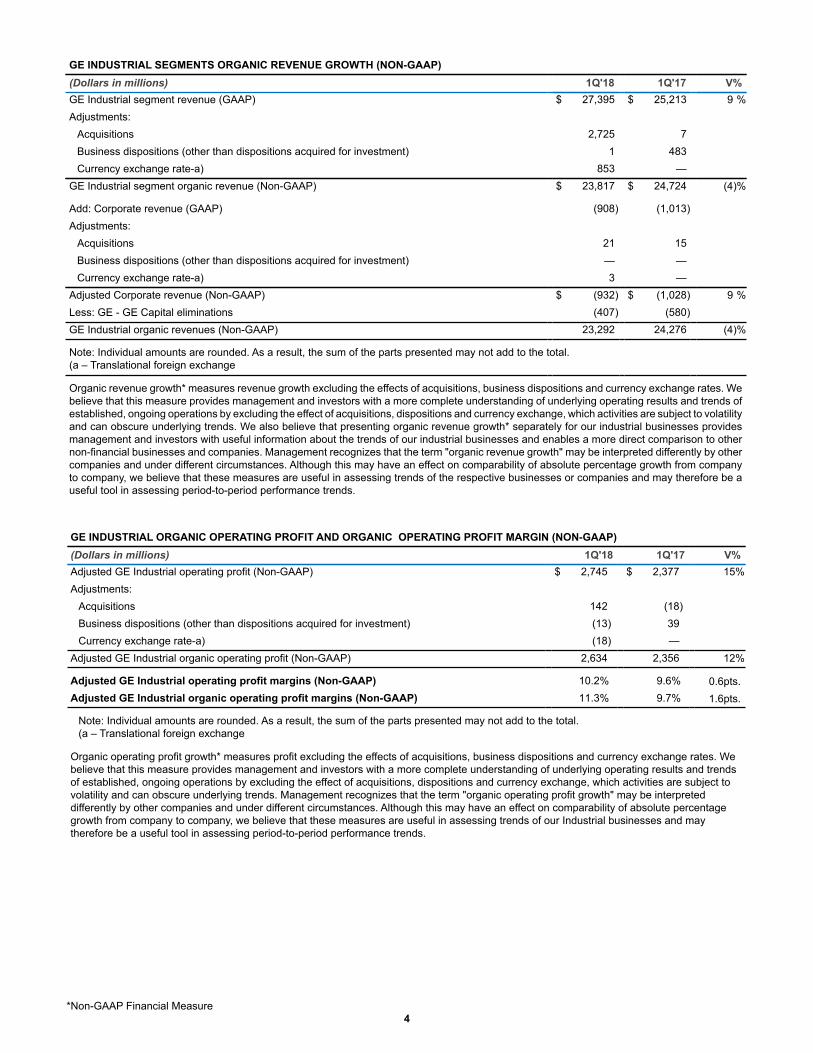
GE INDUSTRIAL SEGMENTS ORGANIC REVENUE GROWTH (NON-GAAP)(Dollars in millions) 1Q'18 1Q'17 V%GE Industrial segment revenue (GAAP) $ 27,395 $ 25,213 9 %Adjustments:
Acquisitions 2,725 7Business dispositions (other than dispositions acquired for investment) 1 483Currency exchange rate-a) 853 —
GE Industrial segment organic revenue (Non-GAAP) $ 23,817 $ 24,724 (4)%
Add: Corporate revenue (GAAP) (908) (1,013)Adjustments:
Acquisitions 21 15Business dispositions (other than dispositions acquired for investment) — —Currency exchange rate-a) 3 —
Adjusted Corporate revenue (Non-GAAP) $ (932) $ (1,028) 9 %Less: GE - GE Capital eliminations (407) (580)GE Industrial organic revenues (Non-GAAP) 23,292 24,276 (4)%
Note: Individual amounts are rounded. As a result, the sum of the parts presented may not add to the total.(a – Translational foreign exchange
Organic revenue growth* measures revenue growth excluding the effects of acquisitions, business dispositions and currency exchange rates. We believe that this measure provides management and investors with a more complete understanding of underlying operating results and trends of established, ongoing operations by excluding the effect of acquisitions, dispositions and currency exchange, which activities are subject to volatility and can obscure underlying trends. We also believe that presenting organic revenue growth* separately for our industrial businesses provides management and investors with useful information about the trends of our industrial businesses and enables a more direct comparison to other non-financial businesses and companies. Management recognizes that the term "organic revenue growth" may be interpreted differently by other companies and under different circumstances. Although this may have an effect on comparability of absolute percentage growth from company to company, we believe that these measures are useful in assessing trends of the respective businesses or companies and may therefore be a useful tool in assessing period-to-period performance trends.
GE INDUSTRIAL ORGANIC OPERATING PROFIT AND ORGANIC OPERATING PROFIT MARGIN (NON-GAAP)(Dollars in millions) 1Q'18 1Q'17 V%Adjusted GE Industrial operating profit (Non-GAAP) $ 2,745 $ 2,377 15%Adjustments:
Acquisitions 142 (18)Business dispositions (other than dispositions acquired for investment) (13) 39Currency exchange rate-a) (18) —
Adjusted GE Industrial organic operating profit (Non-GAAP) 2,634 2,356 12%
Adjusted GE Industrial operating profit margins (Non-GAAP) 10.2% 9.6% 0.6pts.Adjusted GE Industrial organic operating profit margins (Non-GAAP) 11.3% 9.7% 1.6pts.
Note: Individual amounts are rounded. As a result, the sum of the parts presented may not add to the total.(a – Translational foreign exchange
Organic operating profit growth* measures profit excluding the effects of acquisitions, business dispositions and currency exchange rates. Webelieve that this measure provides management and investors with a more complete understanding of underlying operating results and trendsof established, ongoing operations by excluding the effect of acquisitions, dispositions and currency exchange, which activities are subject tovolatility and can obscure underlying trends. Management recognizes that the term "organic operating profit growth" may be interpreteddifferently by other companies and under different circumstances. Although this may have an effect on comparability of absolute percentagegrowth from company to company, we believe that these measures are useful in assessing trends of our Industrial businesses and maytherefore be a useful tool in assessing period-to-period performance trends.

GE Earnings Supplemental
*Non-GAAP Financial Measure 5
ORGANIC REVENUE BY SEGMENT (NON-GAAP)(Dollars in millions) 1Q'18 1Q'17 V%Power
Reported Revenue $ 7,222 $ 7,940 (9)%Less Acq./Disp & FX-a) 461 470
Organic Revenue* $ 6,760 $ 7,470 (10)%Renewable Energy
Reported Revenue $ 1,646 $ 1,767 (7)%Less Acq./Disp & FX-a) 192 —
Organic Revenue* $ 1,454 $ 1,767 (18)%Oil & Gas
Reported Revenue $ 5,385 $ 3,086 74 %Less Acq./Disp & FX-a) 2,719 —
Organic Revenue* $ 2,666 $ 3,086 (14)%Aviation
Reported Revenue $ 7,112 $ 6,673 7 %Less Acq./Disp & FX-a) 23 2
Organic Revenue* $ 7,090 $ 6,671 6 %Healthcare
Reported Revenue $ 4,702 $ 4,305 9 %Less Acq./Disp & FX-a) 177 17
Organic Revenue* $ 4,525 $ 4,288 6 %Transportation
Reported Revenue $ 872 $ 979 (11)%Less Acq./Disp & FX-a) — —
Organic Revenue* $ 872 $ 979 (11)%Lighting
Reported Revenue $ 456 $ 462 (1)%Less Acq./Disp & FX-a) 7 —
Organic Revenue* $ 449 $ 462 (3)%
Note: Individual amounts are rounded. As a result, the sum of the parts presented may not add to the total.(a – Translational foreign exchange
Organic revenue growth* measures revenue growth excluding the effects of acquisitions, business dispositions and currency exchange rates. We believe that this measure provides management and investors with a more complete understanding of underlying operating results and trends of established, ongoing operations by excluding the effect of acquisitions, dispositions and currency exchange, which activities are subject to volatility and can obscure underlying trends. We also believe that presenting organic revenue growth* separately for our industrial businesses provides management and investors with useful information about the trends of our industrial businesses and enables a more direct comparison to other non-financial businesses and companies. Management recognizes that the term "organic revenue growth" may be interpreted differently by other companies and under different circumstances. Although this may have an effect on comparability of absolute percentage growth from company to company, we believe that these measures are useful in assessing trends of the respective businesses or companies and may therefore be a useful tool in assessing period-to-period performance trends.
GE Earnings Supplemental
*Non-GAAP Financial Measure 6
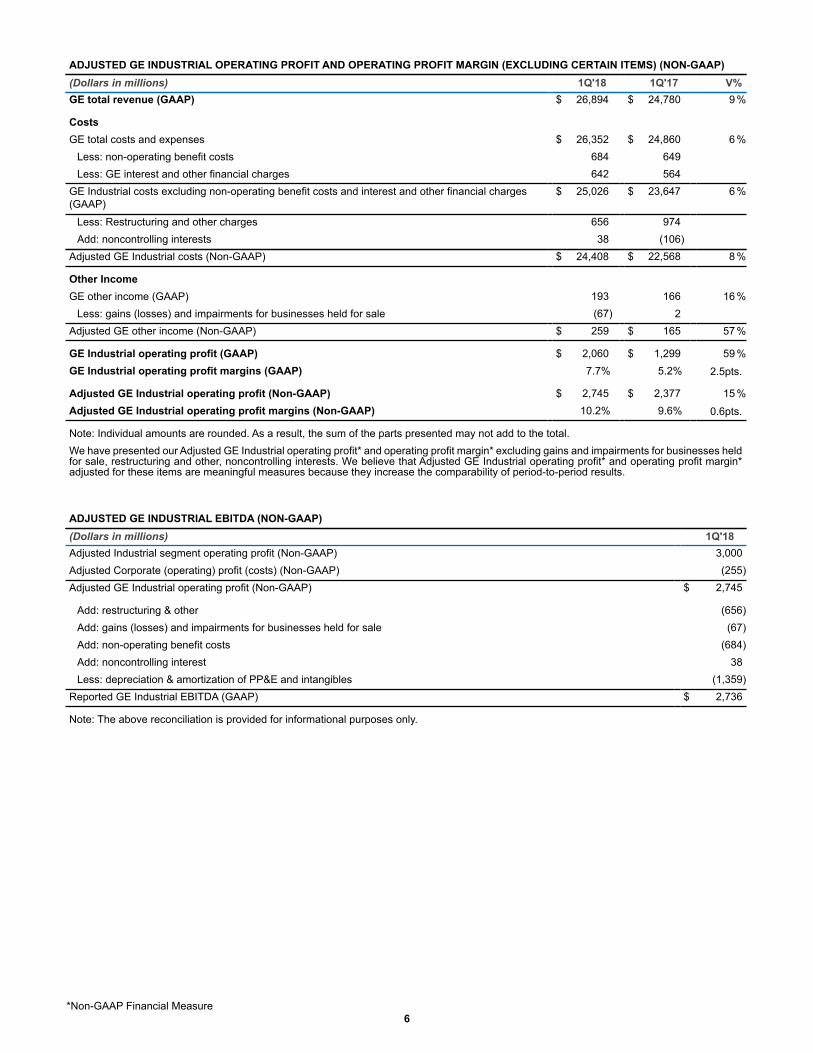
ADJUSTED GE INDUSTRIAL OPERATING PROFIT AND OPERATING PROFIT MARGIN (EXCLUDING CERTAIN ITEMS) (NON-GAAP)(Dollars in millions) 1Q'18 1Q'17 V%GE total revenue (GAAP) $ 26,894 $ 24,780 9 %
CostsGE total costs and expenses $ 26,352 $ 24,860 6 %
Less: non-operating benefit costs 684 649Less: GE interest and other financial charges 642 564
GE Industrial costs excluding non-operating benefit costs and interest and other financial charges(GAAP)
$ 25,026 $ 23,647 6 %
Less: Restructuring and other charges 656 974Add: noncontrolling interests 38 (106)
Adjusted GE Industrial costs (Non-GAAP) $ 24,408 $ 22,568 8 %
Other IncomeGE other income (GAAP) 193 166 16 %
Less: gains (losses) and impairments for businesses held for sale (67) 2Adjusted GE other income (Non-GAAP) $ 259 $ 165 57 %
GE Industrial operating profit (GAAP) $ 2,060 $ 1,299 59 %GE Industrial operating profit margins (GAAP) 7.7% 5.2% 2.5pts.
Adjusted GE Industrial operating profit (Non-GAAP) $ 2,745 $ 2,377 15 %Adjusted GE Industrial operating profit margins (Non-GAAP) 10.2% 9.6% 0.6pts.
Note: Individual amounts are rounded. As a result, the sum of the parts presented may not add to the total.We have presented our Adjusted GE Industrial operating profit* and operating profit margin* excluding gains and impairments for businesses held for sale, restructuring and other, noncontrolling interests. We believe that Adjusted GE Industrial operating profit* and operating profit margin* adjusted for these items are meaningful measures because they increase the comparability of period-to-period results.
ADJUSTED GE INDUSTRIAL EBITDA (NON-GAAP)(Dollars in millions) 1Q'18Adjusted Industrial segment operating profit (Non-GAAP) 3,000Adjusted Corporate (operating) profit (costs) (Non-GAAP) (255)Adjusted GE Industrial operating profit (Non-GAAP) $ 2,745
Add: restructuring & other (656)Add: gains (losses) and impairments for businesses held for sale (67)Add: non-operating benefit costs (684)Add: noncontrolling interest 38Less: depreciation & amortization of PP&E and intangibles (1,359)
Reported GE Industrial EBITDA (GAAP) $ 2,736
Note: The above reconciliation is provided for informational purposes only.

GE Earnings Supplemental
*Non-GAAP Financial Measure 7
OIL & GAS EXCLUDING BHI REVENUE & OPERATING PROFIT (NON-GAAP)Revenue Operating Profit Op Profit %
(Dollars in millions) 1Q'18 1Q'17 V% 1Q'18 1Q'17 V% 1Q'18 1Q'17 V pts.Oil & Gas (GAAP) $5,385 $3,086 74 % $ (144) $ 260 U (2.7)% 8.4% (11.1)pts.
Less: Restructuring & other charges(GE share)
— — (324) —
Adjusted Oil & Gas ex. restructuring & othercharges (Non-GAAP)
$ 5,385 $ 3,086 74 % $ 181 $ 260 (30)% 3.4 % 8.4% (5.0)pts.
Less: BHI -a) 2,560 — 121 —Oil & Gas excluding BHI & restructuring &other charges (Non-GAAP)
$ 2,825 $ 3,086 (8)% $ 60 $ 260 (77)% 2.1 % 8.4% (6.3)pts.
Note: Individual amounts are rounded. As a result, the sum of the parts presented may not add to the total.(a – Excludes restructuring & other charges
Oil & Gas excluding BHI revenue and operating profit measures Oil & Gas segment revenue and operating profit excluding the effects of BHI as well as Oil & Gas restructuring and other charges. We believe that this measure provides management and investors with a more complete understanding of underlying operating results and trends of established, ongoing operations of our Oil & Gas segment by excluding the effect of BHI and Oil & Gas restructuring and other charges, which activities are subject to volatility and can obscure underlying trends.
CORPORATE OPERATIONS & ELIMINATIONS (NON-GAAP)(Dollars in millions) 1Q'18 1Q'17 V%RevenueCorporate revenue (GAAP) $ (908) $ (1,013) 10%
Operating profit (cost)Gains (losses) and impairments for businesses held for sale (67) 2Restructuring and other charges (331) (974)Other Corporate costs & eliminations (255) (430)
Total Corporate Items and Eliminations (GAAP) $ (653) $ (1,402) 53%Less: gains and restructuring and other charges (398) (972)
Adjusted Corporate (operating) profit (costs) (Non-GAAP) $ (255) $ (430) 41%
Note: Individual amounts are rounded. As a result, the sum of the parts presented may not add to the total.
We believe that adjusting operating corporate costs* to exclude the effects of items that are not closely associated with ongoing corporate operations (see reconciliation below), such as earnings of previously divested businesses, gains and losses on disposed and held for sale businesses, restructuring and other charges provides management and investors with a meaningful measure that increases the period-to-period comparability of our ongoing corporate costs.

GE Earnings Supplemental
*Non-GAAP Financial Measure 8
ADJUSTED EARNINGS (NON-GAAP)(Dollars in millions) 1Q'18 1Q'17 V%Consolidated earnings (loss) from continuing operations attributable to GE commonshareowners (GAAP)
$ 369 $ 122 F
Non-operating benefits costs (pre-tax) (GAAP) (684) (649)Tax effect on non-operating benefit costs 144 227
Less: non-operating benefit costs (net of tax) (540) (422)Operating earnings (GAAP) $ 909 $ 544 67 %
Less: GE Capital earnings (loss) from continuing operations attributable to GE commonshareowners
(215) (47)
GE Industrial operating earnings (GAAP) $ 1,125 $ 591 90 %Gains (losses) and impairments for businesses held for sale (pre-tax) (67) 2Tax effect on gains (losses) and impairments for businesses held for sale 24 (1)
Less: Gains (losses) and impairments for businesses held for sale (net of tax) (43) 1Restructuring & other (pre-tax) (522) (974)Tax effect on restructuring & other 132 292
Less: restructuring & other (net of tax) (390) (681)Less: GE Industrial U.S. tax reform enactment adjustment (31) —
Adjusted GE Industrial operating earnings (Non-GAAP) $ 1,588 $ 1,271 25 %
GE Capital earnings (loss) from continuing operations attributable to GE commonshareowners (GAAP)
$ (215) $ (47) U
Less: GE Capital U.S. tax reform enactment adjustment (45) —Adjusted GE Capital earnings (Non-GAAP) $ (170) $ (47) U
Adjusted GE Industrial operating earnings (Non-GAAP) $ 1,588 $ 1,271 25 %Add: Adjusted GE Capital earnings (Non-GAAP) (170) (47)
Adjusted earnings (Non-GAAP) $ 1,418 $ 1,224 16 %
GE Earnings Supplemental
*Non-GAAP Financial Measure 9
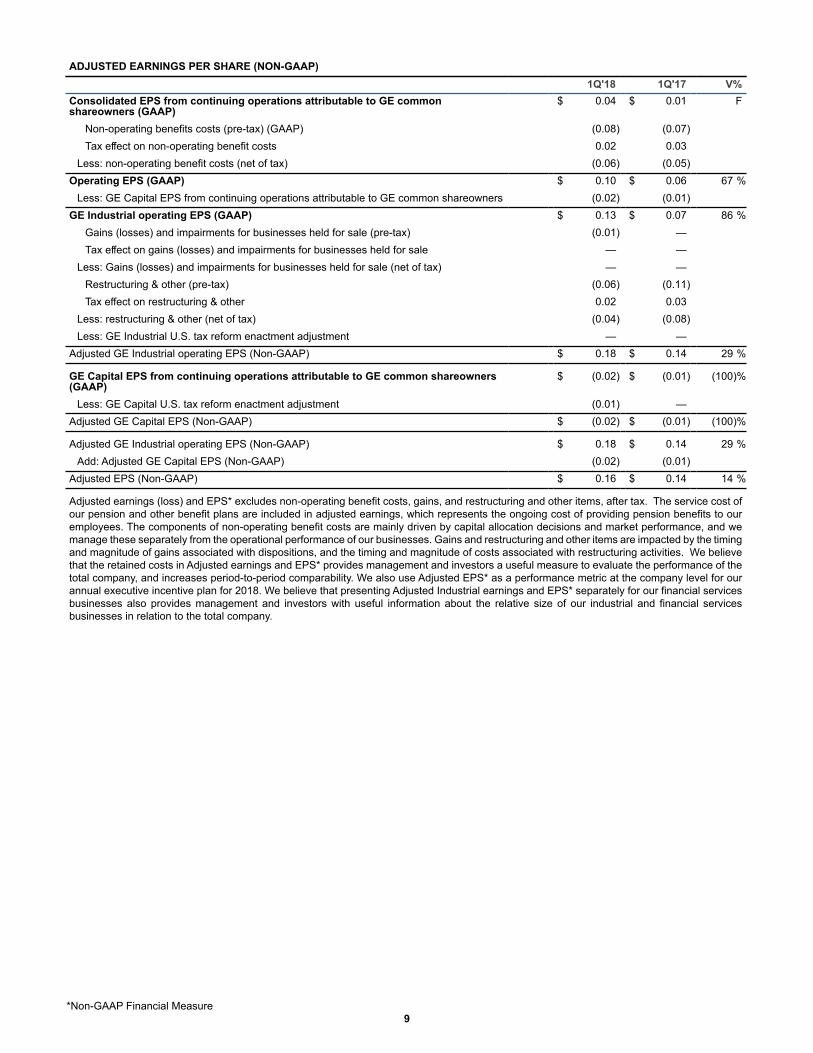
ADJUSTED EARNINGS PER SHARE (NON-GAAP)1Q'18 1Q'17 V%
Consolidated EPS from continuing operations attributable to GE commonshareowners (GAAP)
$ 0.04 $ 0.01 F
Non-operating benefits costs (pre-tax) (GAAP) (0.08) (0.07)Tax effect on non-operating benefit costs 0.02 0.03
Less: non-operating benefit costs (net of tax) (0.06) (0.05)Operating EPS (GAAP) $ 0.10 $ 0.06 67 %
Less: GE Capital EPS from continuing operations attributable to GE common shareowners (0.02) (0.01)GE Industrial operating EPS (GAAP) $ 0.13 $ 0.07 86 %
Gains (losses) and impairments for businesses held for sale (pre-tax) (0.01) —Tax effect on gains (losses) and impairments for businesses held for sale — —
Less: Gains (losses) and impairments for businesses held for sale (net of tax) — —Restructuring & other (pre-tax) (0.06) (0.11)Tax effect on restructuring & other 0.02 0.03
Less: restructuring & other (net of tax) (0.04) (0.08)Less: GE Industrial U.S. tax reform enactment adjustment — —
Adjusted GE Industrial operating EPS (Non-GAAP) $ 0.18 $ 0.14 29 %
GE Capital EPS from continuing operations attributable to GE common shareowners(GAAP)
$ (0.02) $ (0.01) (100)%
Less: GE Capital U.S. tax reform enactment adjustment (0.01) —Adjusted GE Capital EPS (Non-GAAP) $ (0.02) $ (0.01) (100)%
Adjusted GE Industrial operating EPS (Non-GAAP) $ 0.18 $ 0.14 29 %Add: Adjusted GE Capital EPS (Non-GAAP) (0.02) (0.01)
Adjusted EPS (Non-GAAP) $ 0.16 $ 0.14 14 %
Adjusted earnings (loss) and EPS* excludes non-operating benefit costs, gains, and restructuring and other items, after tax. The service cost of our pension and other benefit plans are included in adjusted earnings, which represents the ongoing cost of providing pension benefits to our employees. The components of non-operating benefit costs are mainly driven by capital allocation decisions and market performance, and we manage these separately from the operational performance of our businesses. Gains and restructuring and other items are impacted by the timing and magnitude of gains associated with dispositions, and the timing and magnitude of costs associated with restructuring activities. We believe that the retained costs in Adjusted earnings and EPS* provides management and investors a useful measure to evaluate the performance of the total company, and increases period-to-period comparability. We also use Adjusted EPS* as a performance metric at the company level for our annual executive incentive plan for 2018. We believe that presenting Adjusted Industrial earnings and EPS* separately for our financial services businesses also provides management and investors with useful information about the relative size of our industrial and financial services businesses in relation to the total company.

GE Earnings Supplemental
*Non-GAAP Financial Measure 10
ADJUSTED EARNINGS RESTATED FOR REVENUE RECOGNITION (NON-GAAP)(Dollars in millions) 2016 2017Consolidated earnings (loss) from continuing operations attributable to GE commonshareowners (GAAP)
$ 7,797 $ (8,605)
Non-operating benefits costs (pre-tax) (GAAP) (2,349) (2,385)Tax effect on non-operating benefit costs 822 835
Less: non-operating benefit costs (net of tax) (1,527) (1,550)Operating earnings (GAAP) $ 9,324 $ (7,055)
Less: GE Capital earnings (loss) from continuing operations attributable to GE commonshareowners (GAAP)
(1,251) (6,765)
GE Industrial operating earnings (GAAP) $ 10,575 $ (290)Gains (pre-tax) 3,480 1,932Tax effect on gains (1,106) (62)
Less: gains (net of tax) 2,374 1,871Restructuring & other (pre-tax) (3,544) (3,715)Tax effect on restructuring & other 1,061 1,142
Less: restructuring & other (net of tax) (2,483) (2,574)Held for sale charges (pre-tax) — (1,006)Tax effect on held for sale charges) — —
Less: held for sale charges (net of tax) — (1,007)GE Industrial impairments charges (pre-tax) — (1,479)Tax effect on GE Industrial impairments charges — 119
Less: GE Industrial impairments charges (net of tax) — (1,360)Less: GE Industrial U.S. tax reform enactment — (4,905)
Adjusted GE Industrial operating earnings (Non-GAAP) $ 10,684 $ 7,685
GE Capital earnings (loss) from continuing operations attributable to GE commonshareowners (GAAP)
$ (1,251) $ (6,765)
Less: insurance adjustment & EFS impairment — (7,943)Less: GE Capital U.S. tax reform enactment — 206
Adjusted GE Capital earnings (Non-GAAP) $ (1,251) $ 972
Adjusted GE Industrial operating earnings (Non-GAAP) $ 10,684 $ 7,685Add: Adjusted GE Capital earnings (Non-GAAP) (1,251) 972
Adjusted earnings (Non-GAAP) $ 9,433 $ 8,657

GE Earnings Supplemental
*Non-GAAP Financial Measure 11
ADJUSTED EARNINGS PER SHARE RESTATED FOR REVENUE RECOGNITION (NON-GAAP)2016 2017
Consolidated EPS from continuing operations attributable to GE common shareowners(GAAP)
$ 0.85 $ (0.99)
Non-operating benefits costs (pre-tax) (GAAP) (0.26) (0.27)Tax effect on non-operating benefit costs 0.09 0.10
Less: non-operating benefit costs (net of tax) (0.17) (0.18)Operating EPS (GAAP) $ 1.02 $ (0.81)
Less: GE Capital EPS from continuing operations attributable to GE common shareowners (0.14) (0.78)GE Industrial operating EPS (GAAP) $ 1.16 $ (0.03)
Gains (pre-tax) 0.38 0.22Tax effect on gains (0.12) (0.01)
Less: gains (after-tax) 0.26 0.22Restructuring & other (pre-tax) (0.39) (0.43)Tax effect on restructuring & other 0.12 0.13
Less: restructuring & other (net of tax) (0.27) (0.30)Held for sale charges (pre-tax) — (0.12)Tax effect on held for sale charges) — —
Less: held for sale charges (net of tax) — (0.12)GE Industrial impairments charges (pre-tax) — (0.17)Tax effect on GE Industrial impairments charges — 0.01
Less: GE Industrial impairments charges (net of tax) — (0.16)Less: GE Industrial U.S. tax reform enactment — (0.56)
Adjusted GE Industrial operating EPS (Non-GAAP) $ 1.17 $ 0.88
GE Capital EPS from continuing operations attributable to GE common shareowners (GAAP) $ (0.14) $ (0.78)Less: insurance adjustment & EFS impairment — (0.91)Less: GE Capital U.S. tax reform enactment — 0.02
Adjusted GE Capital EPS (Non-GAAP) $ (0.14) $ 0.11
Adjusted GE Industrial operating EPS (Non-GAAP) $ 1.17 $ 0.88Add: Adjusted GE Capital EPS (Non-GAAP) (0.14) 0.11
Adjusted EPS (Non-GAAP) $ 1.03 $ 1.00
Adjusted earnings (loss) and EPS* excludes non-operating benefit costs, gains, and restructuring and other items, after tax. The service cost of our pension and other benefit plans are included in adjusted earnings, which represents the ongoing cost of providing pension benefits to our employees. The components of non-operating benefit costs are mainly driven by capital allocation decisions and market performance, and we manage these separately from the operational performance of our businesses. Gains and restructuring and other items are impacted by the timing and magnitude of gains associated with dispositions, and the timing and magnitude of costs associated with restructuring activities. We believe that the retained costs in Adjusted earnings and EPS* provides management and investors a useful measure to evaluate the performance of the total company, and increases period-to-period comparability. We also use Adjusted EPS* as a performance metric at the company level for our annual executive incentive plan for 2018. We believe that presenting Adjusted Industrial earnings and EPS* separately for our financial services businesses also provides management and investors with useful information about the relative size of our industrial and financial services businesses in relation to the total company.

GE Earnings Supplemental
*Non-GAAP Financial Measure 12
GE PRE-TAX EARNINGS (LOSS) FROM CONTINUING OPERATIONS; EXCLUDING GE CAPITAL EARNINGS (LOSS) FROM CONTINUING OPERATIONS AND THE CORRESPONDING EFFECTIVE TAX RATES (NON-GAAP)(Dollars in millions) 1Q'18 1Q'17GE earnings (loss) from continuing operations before income taxes (GAAP) $ 519 $ 39
Less: GE Capital earnings (loss) from continuing operations (215) (47)GE Industrial earnings (loss) from continuing operations before income taxes (GAAP) $ 734 $ 86
Less: non-operating benefits (pre-tax) (684) (649)Less: gains (losses) and impairments for businesses held for sale (pre-tax) (67) 2Less: restructuring & other (pre-tax) (600) (974)
Adjusted GE earnings (loss) from continuing operations before income taxes (Non-GAAP) $ 2,085 $ 1,707
GE provision for income taxes (GAAP) $ 112 $ 23Less: taxes on non-operating benefits (144) (227)Less: taxes on gains (losses) and impairments for businesses held for sale (24) 1Less: taxes on restructuring & other (132) (292)Less: GE Industrial U.S. tax reform enactment adjustment (103) —
Adjusted GE Industrial taxes (Non-GAAP) $ 515 $ 541
GE effective tax rate (GAAP) 15% 27%Adjusted GE effective tax rate GE (Non-GAAP) 25% 32%
We believe that the GE effective tax rate, excluding GE Capital earnings*, is best analyzed in relation to GE earnings before income taxes excluding the GE Capital net earnings from continuing operations, as GE tax expense does not include taxes on GE Capital earnings.
GE INDUSTRIAL STRUCTURAL COSTS (NON-GAAP)(Dollars in millions) 1Q'18 1Q'17 V$GE Industrial costs excluding interest and other financial charges and non-operating benefitcosts (GAAP)
$ 25,026 $ 23,647 $ 1,379
Less: Segment variable costs 18,757 16,932Less: Segment restructuring & other charges 280 12Less: Segment acquisitions/dispositions structural costs and impact from foreign exchange 306 (376)Less: Corporate restructuring & other charges 331 974Add: Corporate revenues, other income and NCI (excluding gains and GE Capital eliminations) 373 424
GE Industrial structural costs (Non-GAAP) $ 5,725 $ 6,530 $ (805)
Industrial structural costs include segment structural costs excluding the impact of restructuring and other charges, business acquisitions and dispositions, foreign exchange, plus total Corporate operating profit excluding restructuring and other charges and gains. The Baker Hughes acquisition is represented on a pro-forma basis, which means we calculated our structural costs by including legacy Baker Hughes results for the three months ended March 31, 2017.We believe that Industrial structural cost reduction is a useful metric for management and investors to evaluate the performance of our initiatives to reduce cost because it normalizes for the impact of segment acquisitions, dispositions, and foreign exchange.
GE Earnings Supplemental
*Non-GAAP Financial Measure13
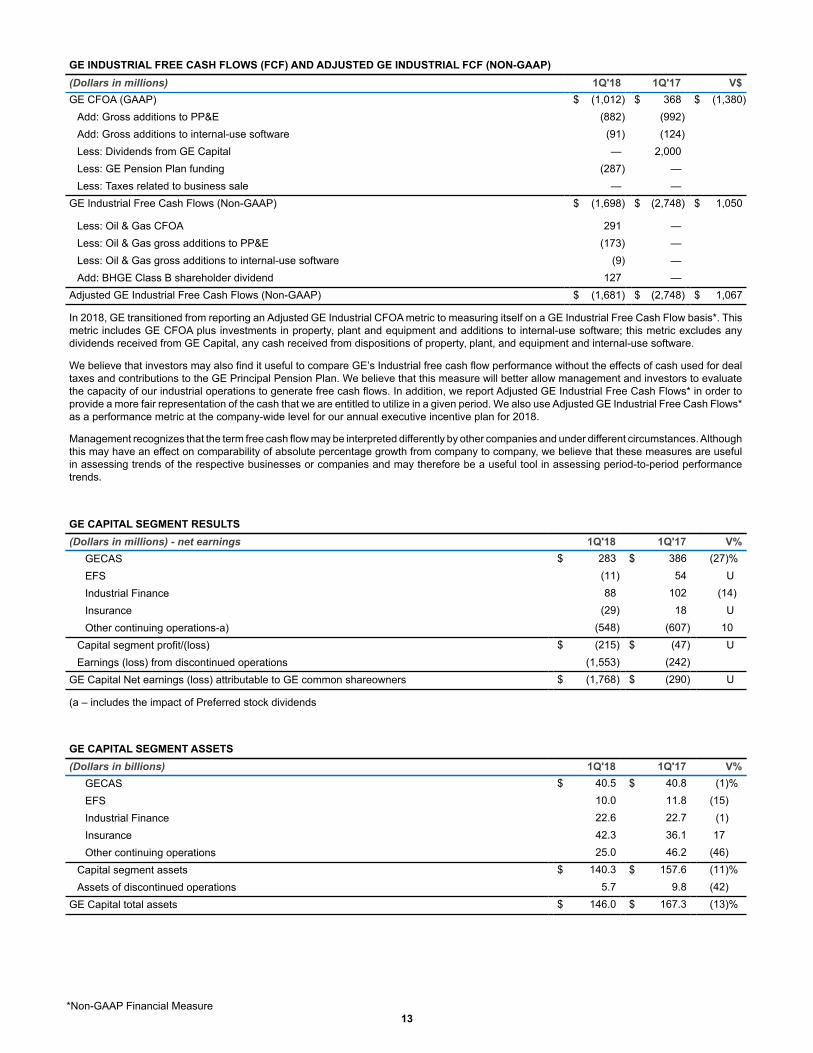
GE INDUSTRIAL FREE CASH FLOWS (FCF) AND ADJUSTED GE INDUSTRIAL FCF (NON-GAAP)(Dollars in millions) 1Q'18 1Q'17 V$GE CFOA (GAAP) $ (1,012) $ 368 $ (1,380)
Add: Gross additions to PP&E (882) (992)Add: Gross additions to internal-use software (91) (124)Less: Dividends from GE Capital — 2,000Less: GE Pension Plan funding (287) —Less: Taxes related to business sale — —
GE Industrial Free Cash Flows (Non-GAAP) $ (1,698) $ (2,748) $ 1,050
Less: Oil & Gas CFOA 291 —Less: Oil & Gas gross additions to PP&E (173) —Less: Oil & Gas gross additions to internal-use software (9) —Add: BHGE Class B shareholder dividend 127 —
Adjusted GE Industrial Free Cash Flows (Non-GAAP) $ (1,681) $ (2,748) $ 1,067
In 2018, GE transitioned from reporting an Adjusted GE Industrial CFOA metric to measuring itself on a GE Industrial Free Cash Flow basis*. This metric includes GE CFOA plus investments in property, plant and equipment and additions to internal-use software; this metric excludes any dividends received from GE Capital, any cash received from dispositions of property, plant, and equipment and internal-use software.
We believe that investors may also find it useful to compare GE’s Industrial free cash flow performance without the effects of cash used for deal taxes and contributions to the GE Principal Pension Plan. We believe that this measure will better allow management and investors to evaluate the capacity of our industrial operations to generate free cash flows. In addition, we report Adjusted GE Industrial Free Cash Flows* in order to provide a more fair representation of the cash that we are entitled to utilize in a given period. We also use Adjusted GE Industrial Free Cash Flows* as a performance metric at the company-wide level for our annual executive incentive plan for 2018.
Management recognizes that the term free cash flow may be interpreted differently by other companies and under different circumstances. Although this may have an effect on comparability of absolute percentage growth from company to company, we believe that these measures are useful in assessing trends of the respective businesses or companies and may therefore be a useful tool in assessing period-to-period performance trends.
GE CAPITAL SEGMENT RESULTS(Dollars in millions) - net earnings 1Q'18 1Q'17 V%
GECAS $ 283 $ 386 (27)%EFS (11) 54 UIndustrial Finance 88 102 (14)Insurance (29) 18 UOther continuing operations-a) (548) (607) 10
Capital segment profit/(loss) $ (215) $ (47) UEarnings (loss) from discontinued operations (1,553) (242)
GE Capital Net earnings (loss) attributable to GE common shareowners $ (1,768) $ (290) U
(a – includes the impact of Preferred stock dividends
GE CAPITAL SEGMENT ASSETS(Dollars in billions) 1Q'18 1Q'17 V%
GECAS $ 40.5 $ 40.8 (1)%EFS 10.0 11.8 (15)Industrial Finance 22.6 22.7 (1)Insurance 42.3 36.1 17Other continuing operations 25.0 46.2 (46)
Capital segment assets $ 140.3 $ 157.6 (11)%Assets of discontinued operations 5.7 9.8 (42)
GE Capital total assets $ 146.0 $ 167.3 (13)%

GE Earnings Supplemental
*Non-GAAP Financial Measure14
2018 OPERATING FRAMEWORK: 2018 ADJUSTED EPS (NON-GAAP)
2018 Adjusted EPS Target $1.00-1.07Items not included in Non-GAAP metric:1) Non operating benefit costs*. This amount is affected by, among other things, the timing of and / or amount of any curtailment gains orlosses as a result of dispositions.2) Gains and restructuring net income/(loss). This amount is affected by, among other things:
Note: The company cannot provide an equivalent GAAP guidance range without unreasonable effort because of the uncertainty of the amount and timing of events affecting earnings as we execute on the restructuring actions and business portfolio changes we have announced since John Flannery became CEO. Although we have attempted to estimate the amount of gains and restructuring charges for the purpose of explaining the probable significance of this component, as described under number 2, this calculation involves a number of unknown variables, resulting in a GAAP range that we believe is too large and variable to be meaningful.
2018 OPERATING FRAMEWORK: ADJUSTED GE INDUSTRIAL FREE CASH FLOWS (NON-GAAP)(Dollars in billions)2018 Adjusted GE Industrial Free Cash Flows $6-7Items not included in this Non-GAAP metric:1. GE Principal Pension Plan funding2. Deal taxes on completed dispositions3. BHGE free cash flows (non-GAAP metric includes BHGE on a dividend basis)4. Any dividends from GE Capital
Note: The company cannot provide an equivalent GAAP guidance range without unreasonable effort as throughout the year, we manage the individual segments on an adjusted free cash flow basis and do not manage to a reported GE CFOA metric. Furthermore, there is significant uncertainty on the timing and amount of events that could give rise to items included in the determination of this metric. As referenced above, Adjusted GE Industrial Free Cash Flows includes GE CFOA plus investments in property, plant and equipment and additions to internal-use software. This metric excludes the items noted above.