1q12 investor information
TRANSCRIPT
7/31/2019 1Q12 Investor Information
http://slidepdf.com/reader/full/1q12-investor-information 1/58
APRIL 2012
Investor Information
7/31/2019 1Q12 Investor Information
http://slidepdf.com/reader/full/1q12-investor-information 2/58
Disclaimer
1
This presentation contains certain statements, estimates and forecasts with respect to future performance and events. These statements, estimates and forecasts are “forward-looking statements.” In some cases, forward-looking statements can be identified by the use of forward-looking terminology such as “may,” “might,” “will,” “should,” “expect,” “plan,” “anticipate,” “believe,” “estimate,” “predict,” “potential” or “continue” or the negatives thereof or variations thereon or similar terminology. All statements other than statements of historical fact included in thispresentation are forward-looking statements and are based on various underlying assumptions and expectations andare subject to known and unknown risks and uncertainties, and may include projections of our future financialperformance based on our growth strategies and anticipated trends in our business. These statements are based on ourcurrent expectations and projections about future events. There are important factors that could cause our actualresults, level of activity, performance or achievements to differ materially from the results, level of activity,performance or achievements expressed or implied in the forward-looking statements. These factors include, but arenot limited to, those discussed in our Annual Report on Form 10-K under Item 1A “Risk Factors,” and also disclosedfrom time to time in our quarterly reports on Form 10-Q and current reports on Form 8-K, including the following:(a) a decline in general economic conditions or the global financial markets, (b) losses caused by financial or otherproblems experienced by third parties, (c) losses due to unidentified or unanticipated risks, (d) a lack of liquidity, i.e.,ready access to funds for use in our businesses, and (e) competitive pressure on our business and on our ability to
retain our employees. As a result, there can be no assurance that the forward-looking statements included in thispresentation will prove to be accurate or correct. In light of these risks, uncertainties and assumptions, the futureperformance or events described in the forward-looking statements in this presentation might not occur. Accordingly,you should not rely upon forward-looking statements as a prediction of actual results and we do not assume any responsibility for the accuracy or completeness of any of these forward-looking statements. We do not undertake any obligation to, and will not, update any forward-looking statements, whether as a result of new information, futureevents or otherwise.

7/31/2019 1Q12 Investor Information
http://slidepdf.com/reader/full/1q12-investor-information 3/58
Differentiating Features
Lazard’s unrivaled global network
Low-risk business model with minimal capital requirements
Substantial growth opportunities
Operating leverage as macro environment improves
Significant free cash flow
3
7/31/2019 1Q12 Investor Information
http://slidepdf.com/reader/full/1q12-investor-information 4/58
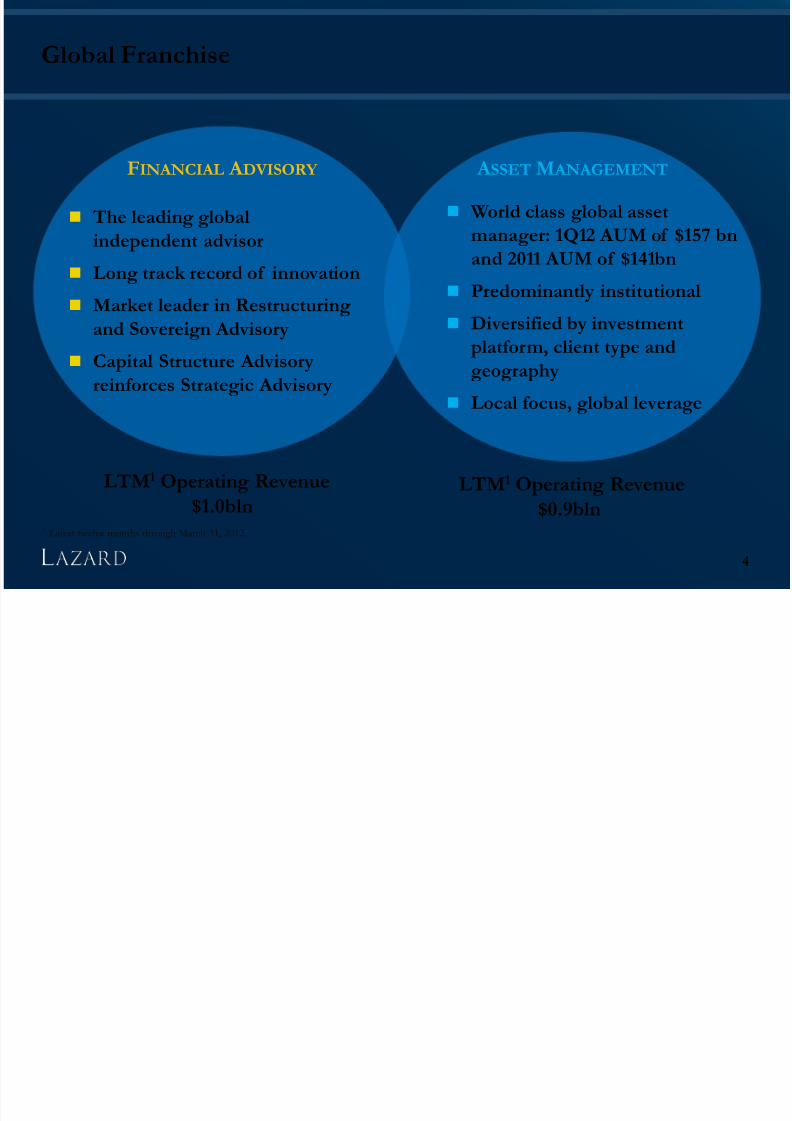
Global Franchise
4
LTM1 Operating Revenue
$1.0blnLTM1 Operating Revenue
$0.9bln
FINANCIAL A DVISORY A SSET M ANAGEMENT
The leading global
independent advisor
Long track record of innovation Market leader in Restructuring
and Sovereign Advisory
Capital Structure Advisory
reinforces Strategic Advisory
World class global asset
manager: 1Q12 AUM of $157 bn
and 2011 AUM of $141bn
Predominantly institutional
Diversified by investment
platform, client type and
geography
Local focus, global leverage
1 Latest twelve months through March 31, 2012.
7/31/2019 1Q12 Investor Information
http://slidepdf.com/reader/full/1q12-investor-information 5/58
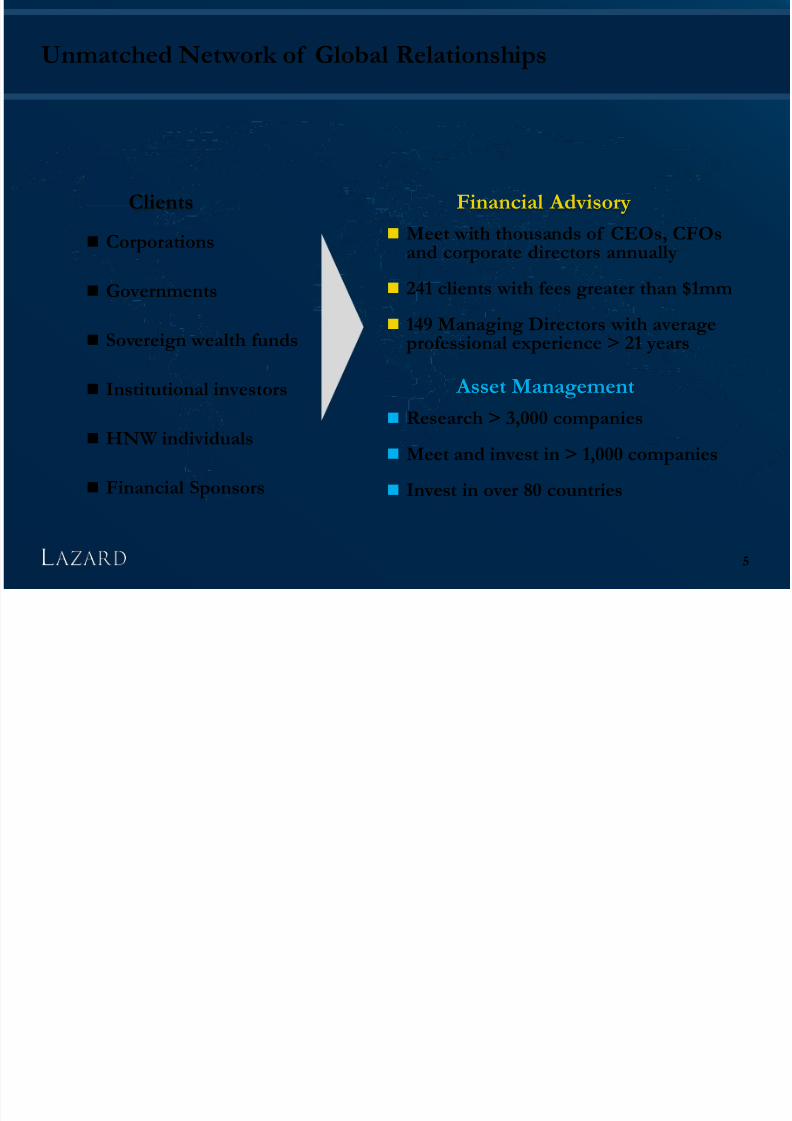
Unmatched Network of Global Relationships
5
Research > 3,000 companies
Meet and invest in > 1,000 companies
Invest in over 80 countries
Corporations
Governments
Sovereign wealth funds
Institutional investors
HNW individuals
Financial Sponsors
Meet with thousands of CEOs, CFOsand corporate directors annually
241 clients with fees greater than $1mm
149 Managing Directors with average professional experience > 21 years
Clients Financial Advisory
Asset Management
7/31/2019 1Q12 Investor Information
http://slidepdf.com/reader/full/1q12-investor-information 6/58
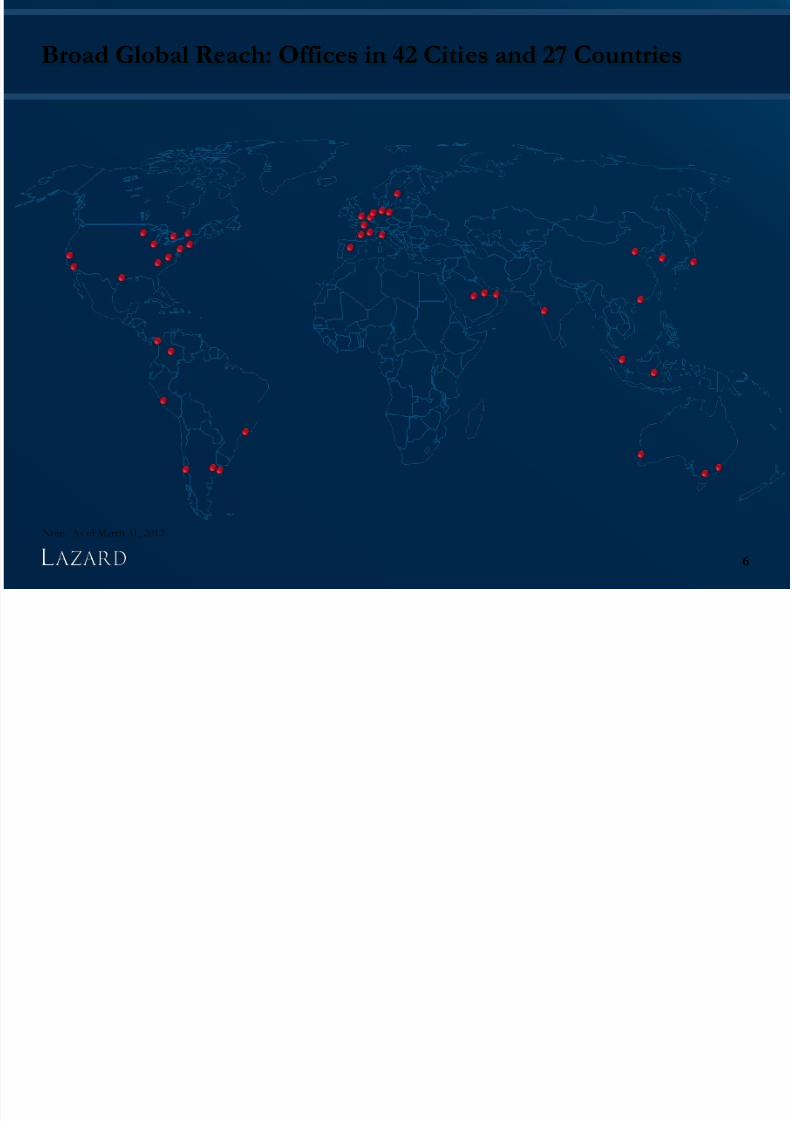
Broad Global Reach: Offices in 42 Cities and 27 Countries
6
Note: As of March 31, 2012
7/31/2019 1Q12 Investor Information
http://slidepdf.com/reader/full/1q12-investor-information 7/58
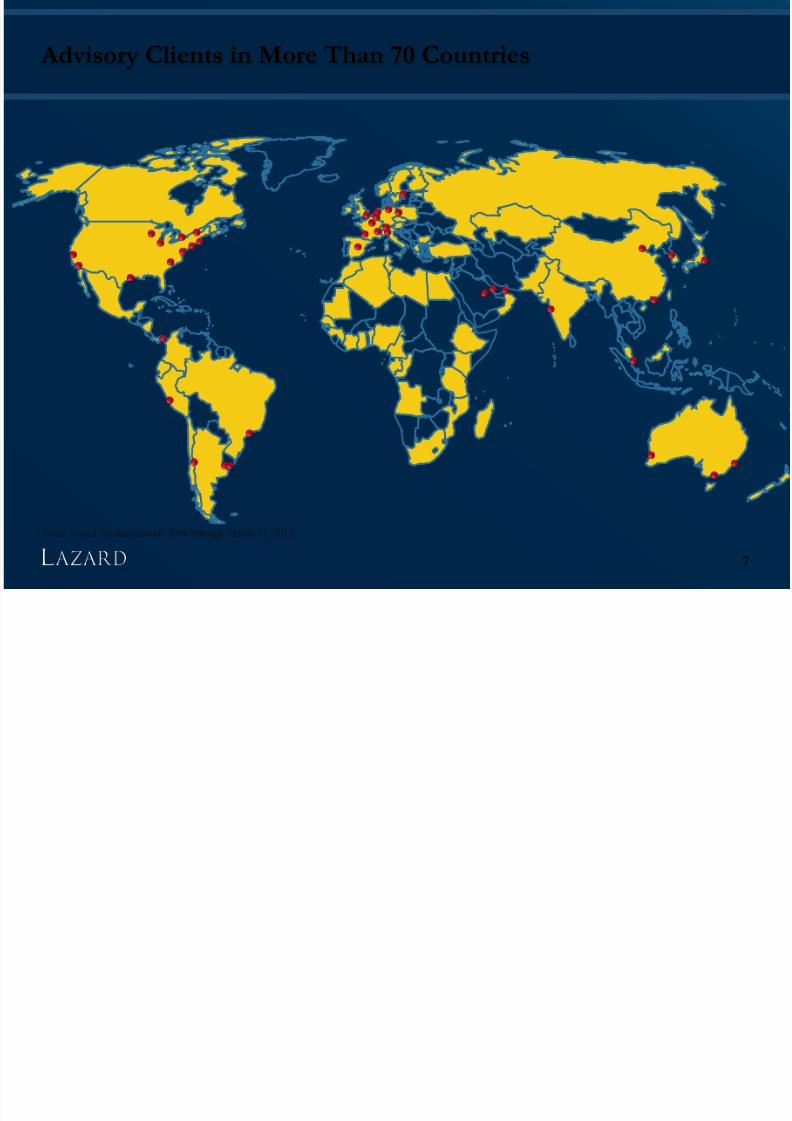
Advisory Clients in More Than 70 Countries
7
Note: Based on transactions 2008 through March 31, 2012
7/31/2019 1Q12 Investor Information
http://slidepdf.com/reader/full/1q12-investor-information 8/58
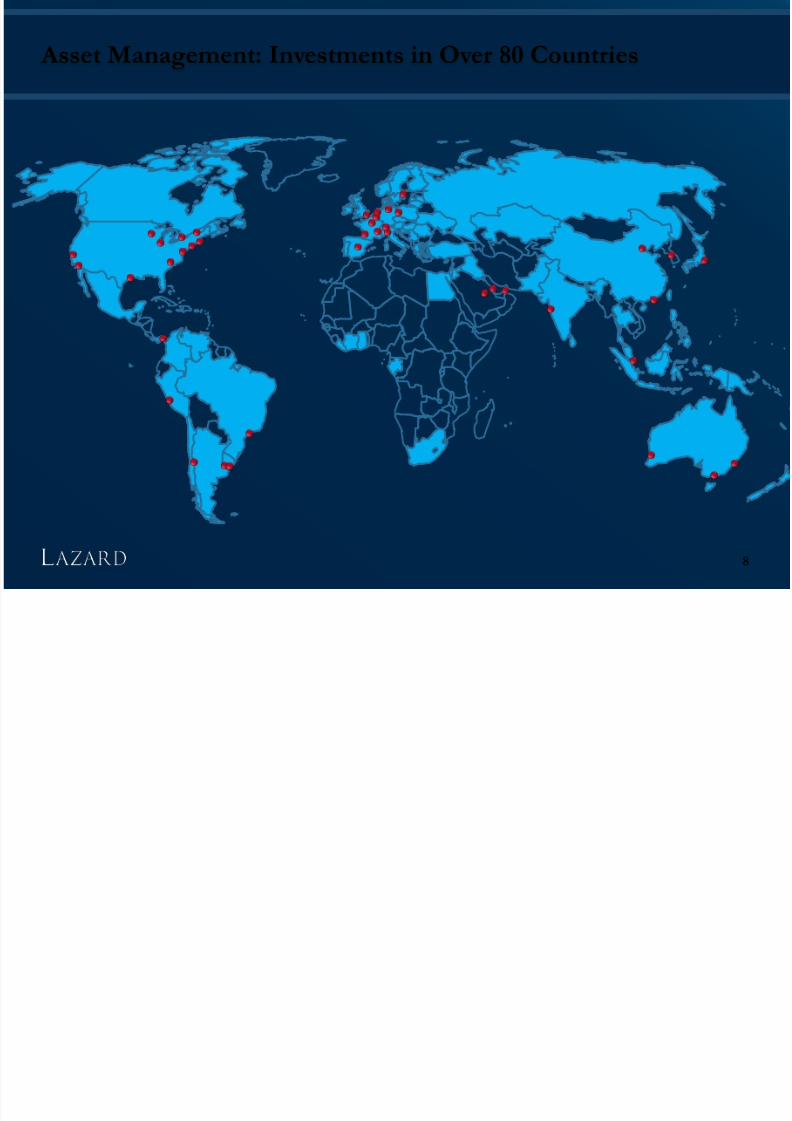
Asset Management: Investments in Over 80 Countries
8
7/31/2019 1Q12 Investor Information
http://slidepdf.com/reader/full/1q12-investor-information 9/58
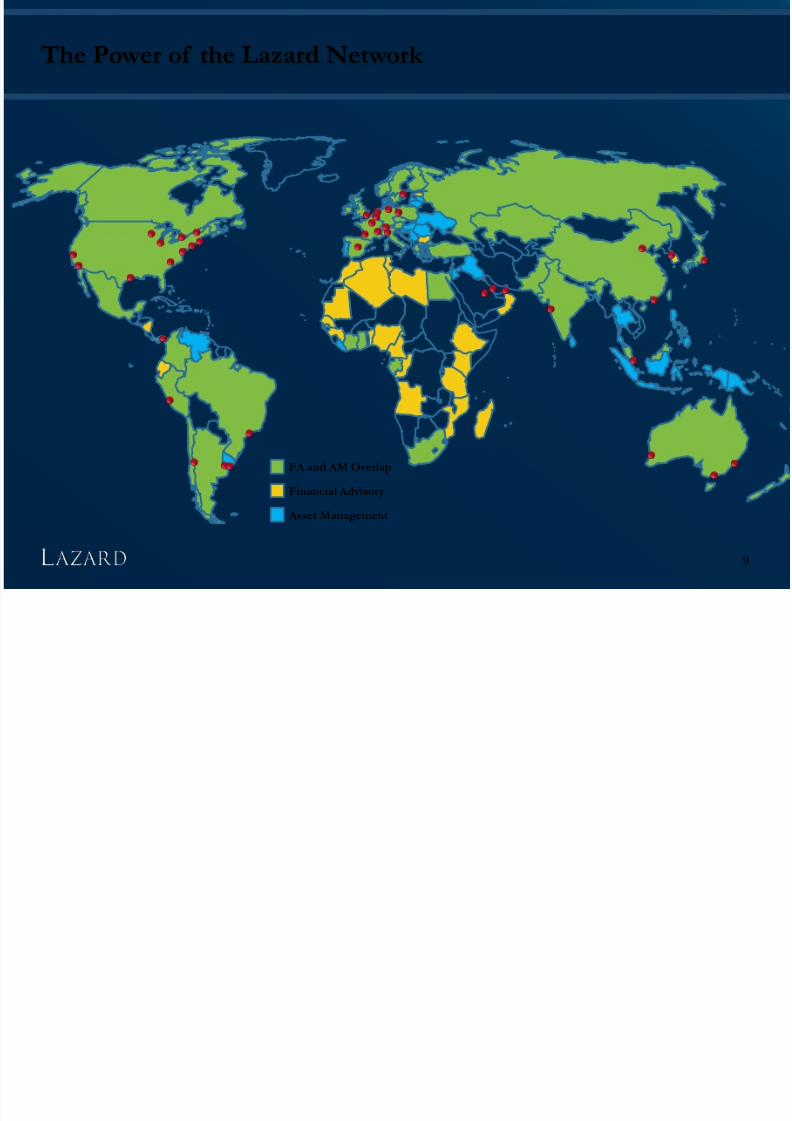
The Power of the Lazard Network
9
Asset Management
Financial Advisory
FA and AM Overlap
7/31/2019 1Q12 Investor Information
http://slidepdf.com/reader/full/1q12-investor-information 10/58
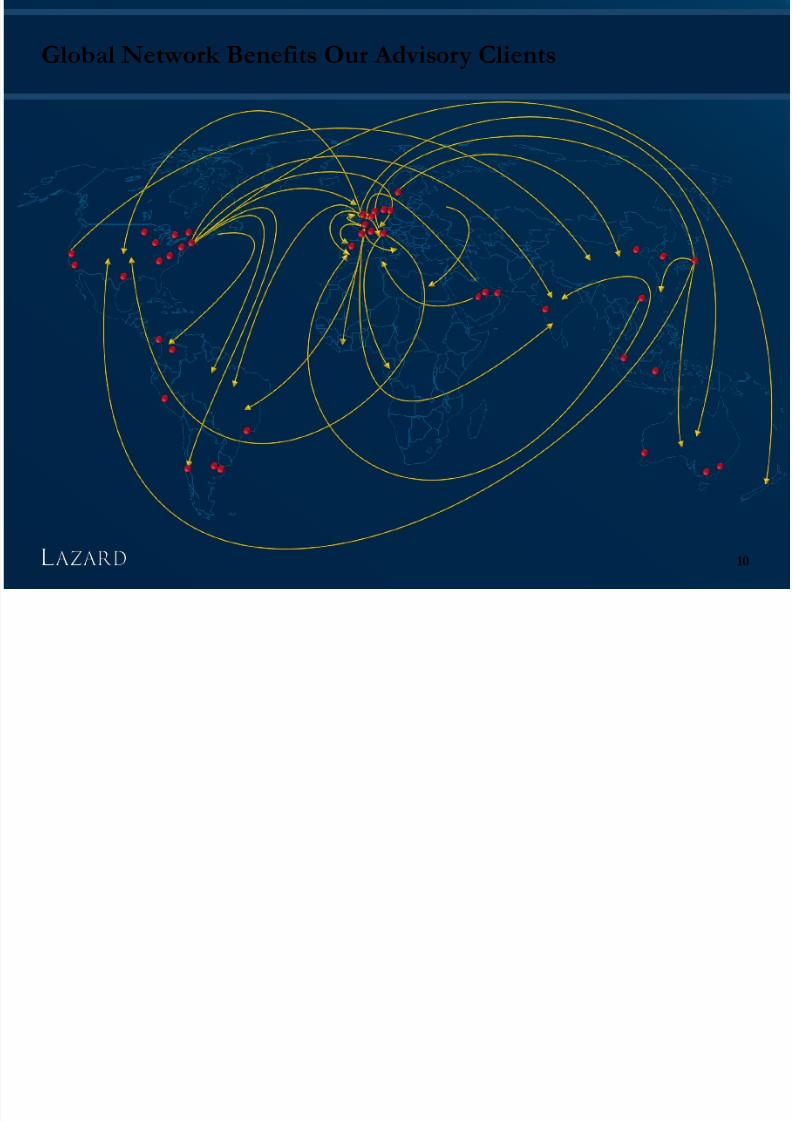
Global Network Benefits Our Advisory Clients
10
7/31/2019 1Q12 Investor Information
http://slidepdf.com/reader/full/1q12-investor-information 11/58
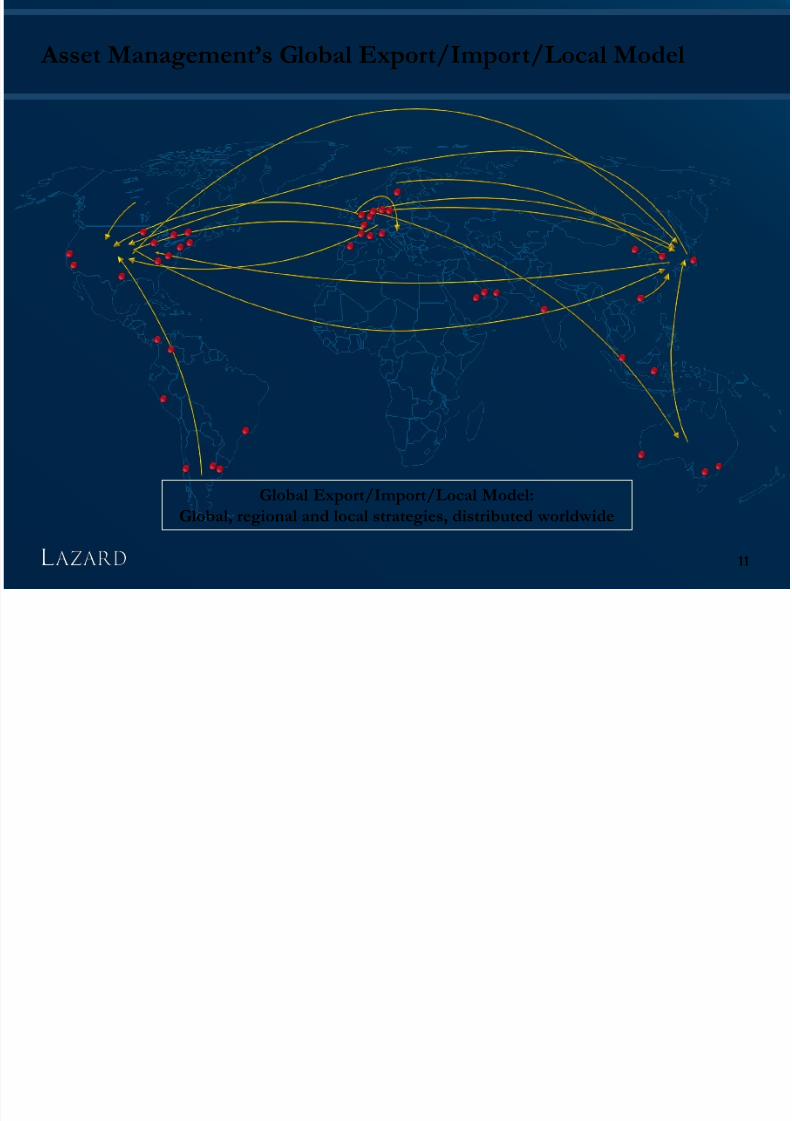
Asset Management’s Global Export/Import/Local Model
11
Global Export/Import/Local Model:
Global, regional and local strategies, distributed worldwide
7/31/2019 1Q12 Investor Information
http://slidepdf.com/reader/full/1q12-investor-information 12/58
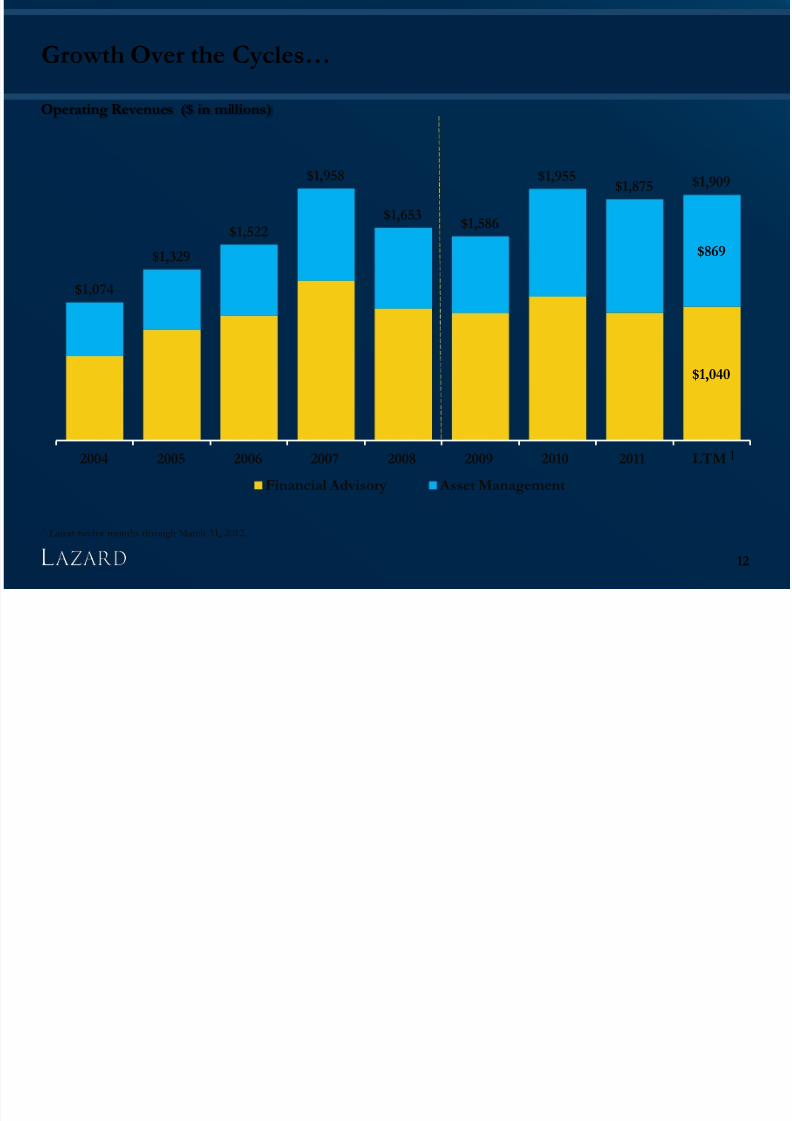
$1,040
$869
$1,074
$1,329
$1,522
$1,958
$1,653$1,586
$1,955$1,875 $1,909
2004 2005 2006 2007 2008 2009 2010 2011 LTM
Financial Advisory Asset Management
Growth Over the Cycles…
12
Operating Revenues ($ in millions)
1 Latest twelve months through March 31, 2012.
1
7/31/2019 1Q12 Investor Information
http://slidepdf.com/reader/full/1q12-investor-information 13/58
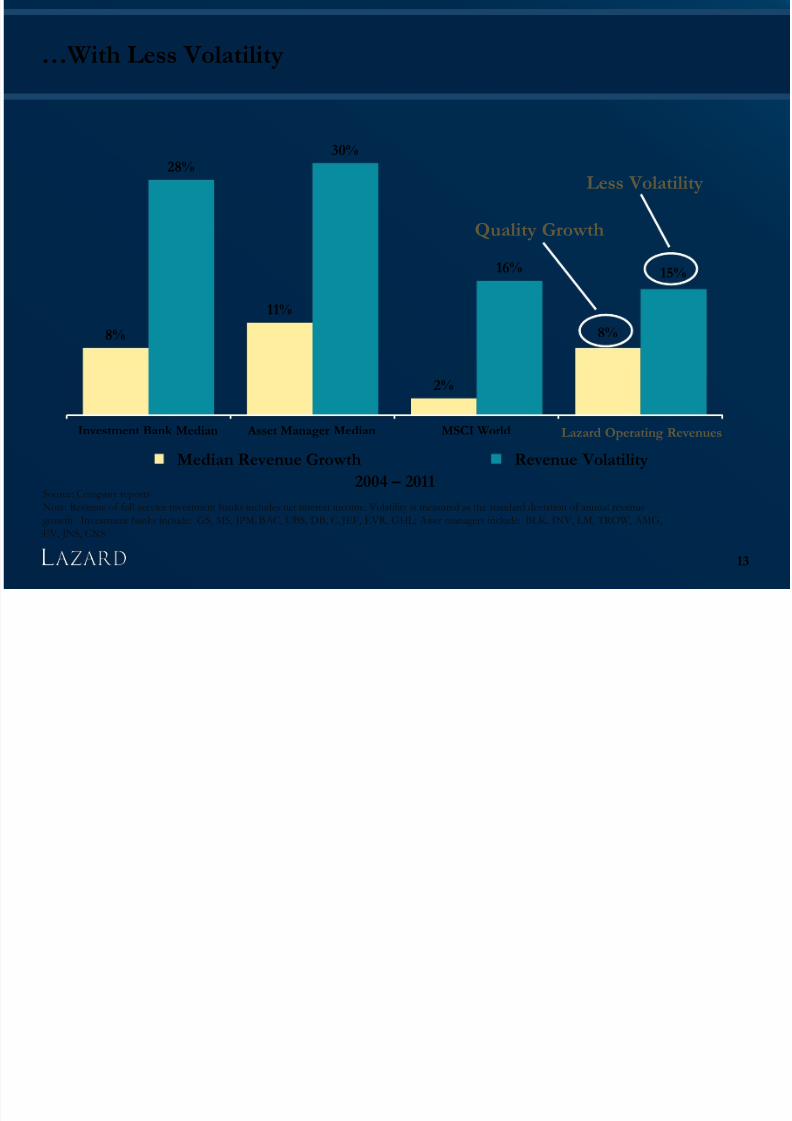
8%
11%
2%
8%
28%30%
16%15%
Investment Bank Median Asset Manager Median MSCI World
Quality Growth
Less Volatility
Lazard Operating Revenues
…With Less Volatility
13
Source: Company reports
Note: Revenue of full-service investment banks includes net interest income. Volatility is measured as the standard deviation of annual revenue
growth. Investment banks include: GS, MS, JPM, BAC, UBS, DB, C, JEF, EVR, GHL; Asset managers include: BLK, INV, LM, TROW, AMG,
EV, JNS, CNS
Median Revenue Growth Revenue Volatility 2004 – 2011
7/31/2019 1Q12 Investor Information
http://slidepdf.com/reader/full/1q12-investor-information 14/58
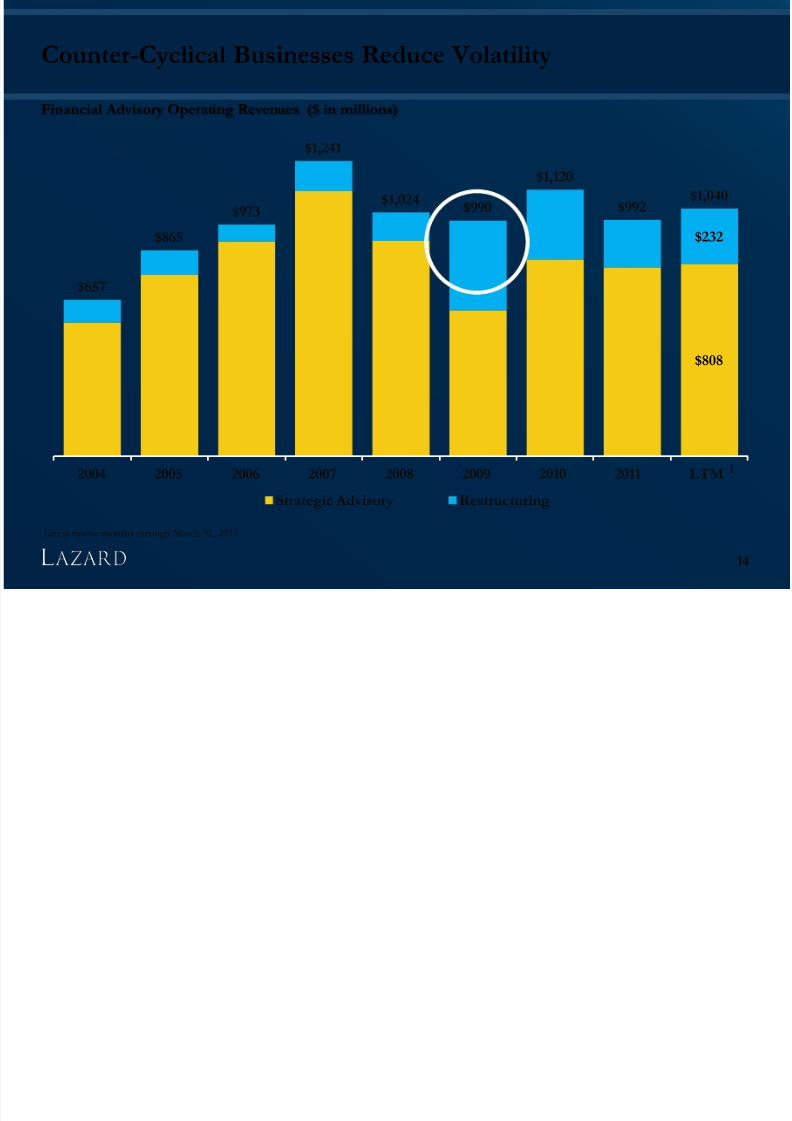
$808
$232
$657
$865
$973
$1,241
$1,024$990
$1,120
$992$1,040
2004 2005 2006 2007 2008 2009 2010 2011 LTM
Strategic Advisory Restructuring
Counter-Cyclical Businesses Reduce Volatility
14
Financial Advisory Operating Revenues ($ in millions)
1 Latest twelve months through March 31, 2012
1
7/31/2019 1Q12 Investor Information
http://slidepdf.com/reader/full/1q12-investor-information 15/58
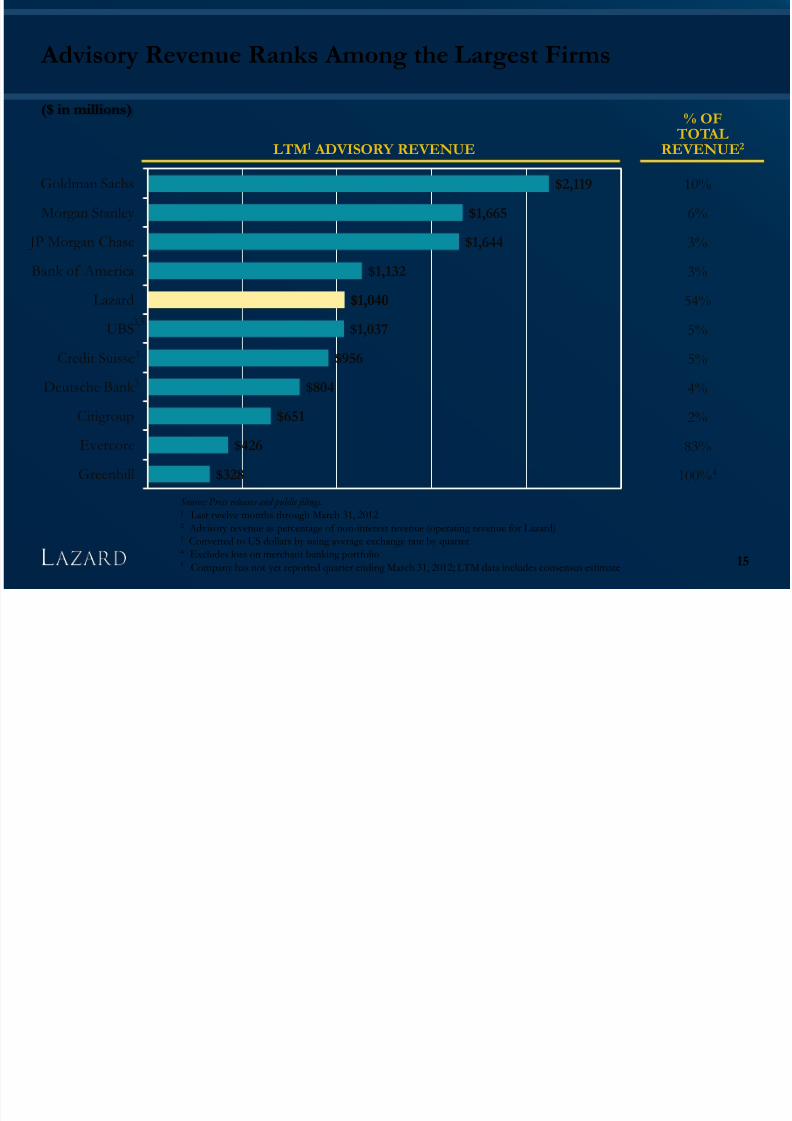
$2,119
$1,665
$1,644
$1,132$1,040
$1,037
$956
$804
$651
$426
$328
$1,040
Goldman Sachs
Morgan Stanley
JP Morgan Chase
Bank of AmericaLazard
UBS
Credit Suisse
Deutsche Bank
Citigroup
Evercore
Greenhill
LTM1 ADVISORY REVENUE
% OF
TOTALREVENUE2
10%
6%
3%
3%54%
5%
5%
4%
2%
83%
100%4
3,5
3
3
($ in millions)
Advisory Revenue Ranks Among the Largest Firms
Source: Press releases and public filings.1 Last twelve months through March 31, 2012
2 Advisory revenue as percentage of non-interest revenue (operating revenue for Lazard)3 Converted to US dollars by using average exchange rate by quarter
4 Excludes loss on merchant banking portfolio5 Company has not yet reported quarter ending March 31, 2012; LTM data includes consensus estimate 15
7/31/2019 1Q12 Investor Information
http://slidepdf.com/reader/full/1q12-investor-information 16/58
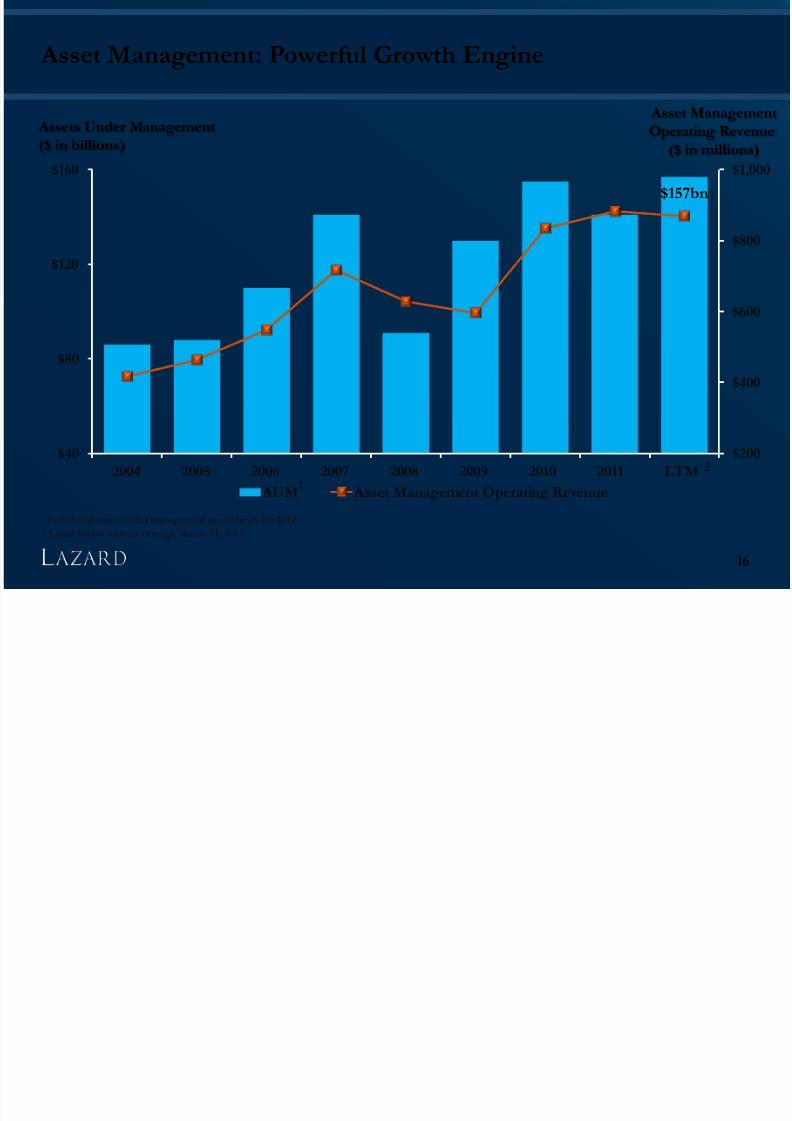
Asset Management: Powerful Growth Engine
$200
$400
$600
$800
$1,000
$40
$80
$120
$160
2004 2005 2006 2007 2008 2009 2010 2011 LTM
AUM Asset Management Operating Revenue
Asset Management
Operating Revenue
($ in millions)
Assets Under Management
($ in billions)
16
$157bn
1 Period-end assets under management as of March 31, 20122 Latest twelve months through March 31, 2012
1
2
7/31/2019 1Q12 Investor Information
http://slidepdf.com/reader/full/1q12-investor-information 17/58
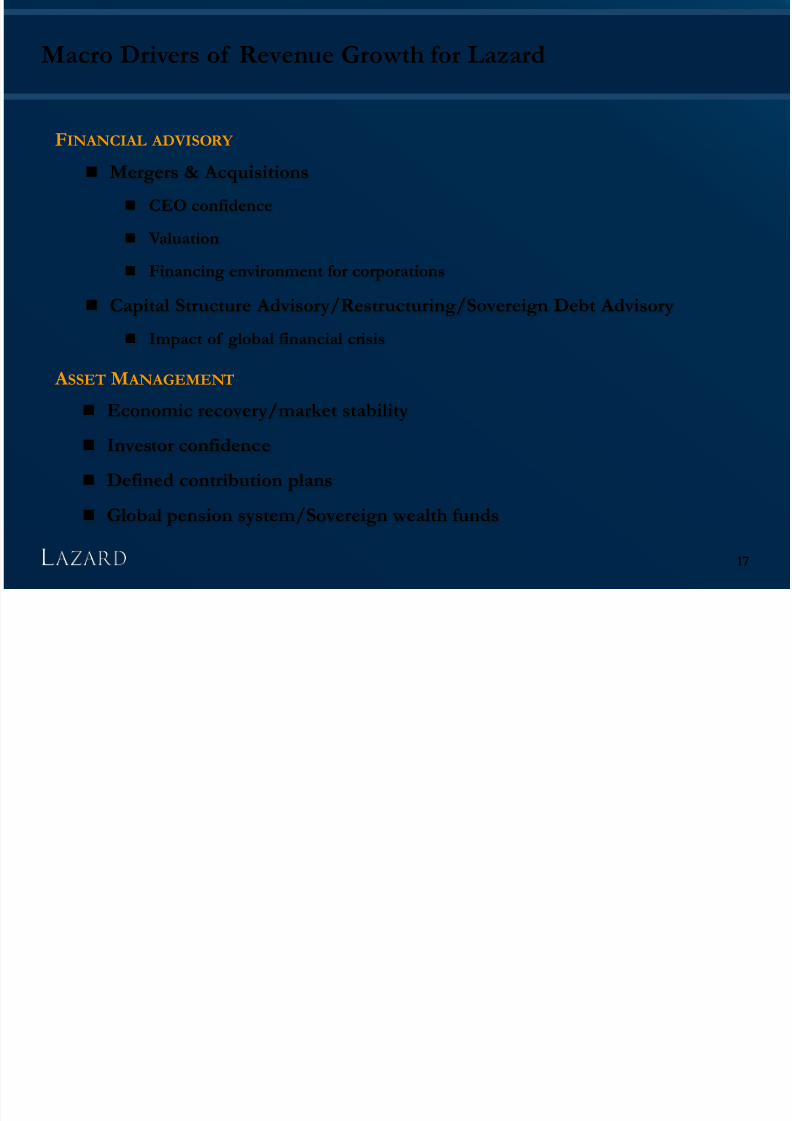
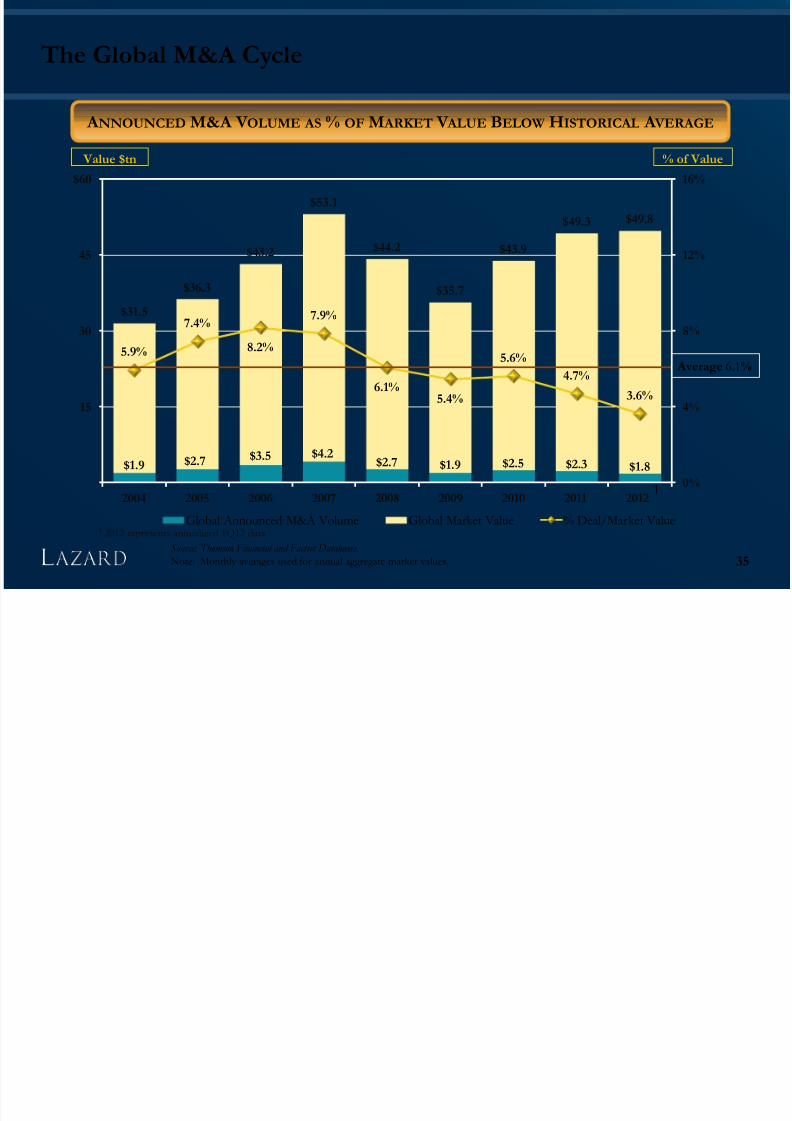
Macro Drivers of Revenue Growth for Lazard
17
Mergers & Acquisitions
CEO confidence
Valuation
Financing environment for corporations Capital Structure Advisory/Restructuring/Sovereign Debt Advisory
Impact of global financial crisis
FINANCIAL ADVISORY
Economic recovery/market stability
Investor confidence
Defined contribution plans
Global pension system/Sovereign wealth funds
A SSET M ANAGEMENT
7/31/2019 1Q12 Investor Information
http://slidepdf.com/reader/full/1q12-investor-information 18/58
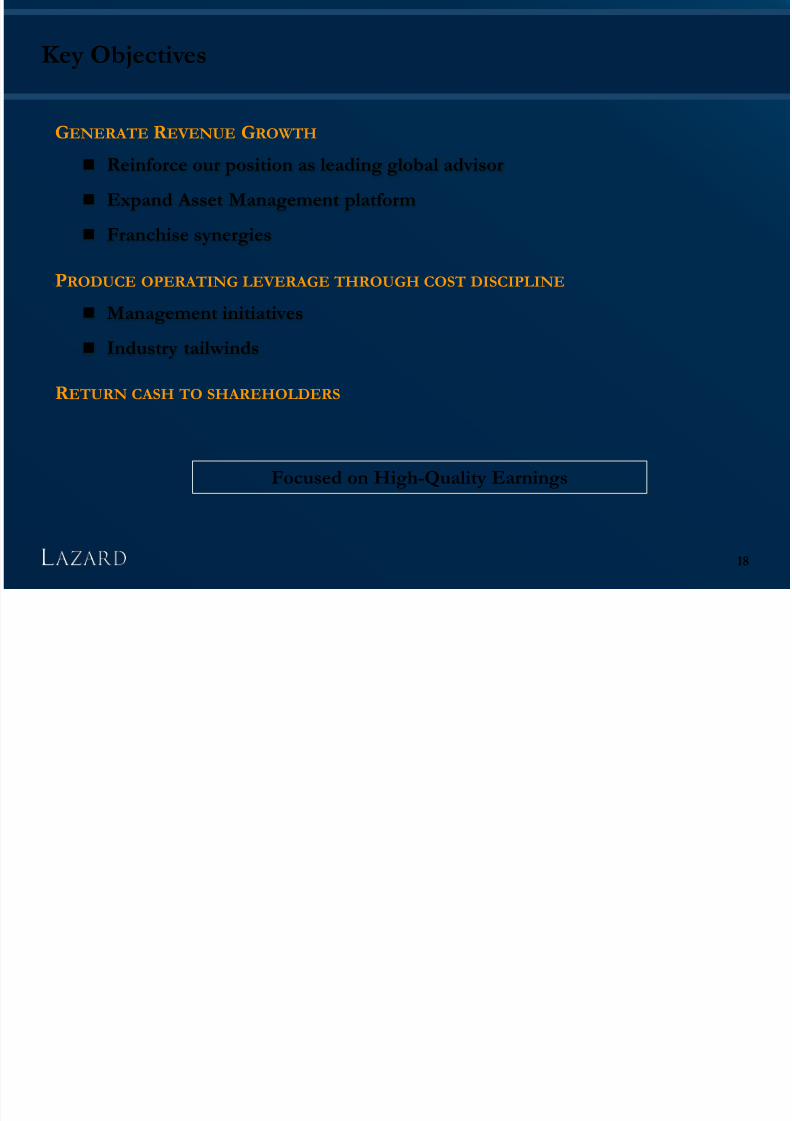
Key Objectives
18
Reinforce our position as leading global advisor
Expand Asset Management platform
Franchise synergies
GENERATE R EVENUE GROWTH
Management initiatives
Industry tailwinds
PRODUCE OPERATING LEVERAGE THROUGH COST DISCIPLINE
R ETURN CASH TO SHAREHOLDERS
Focused on High-Quality Earnings
7/31/2019 1Q12 Investor Information
http://slidepdf.com/reader/full/1q12-investor-information 19/58
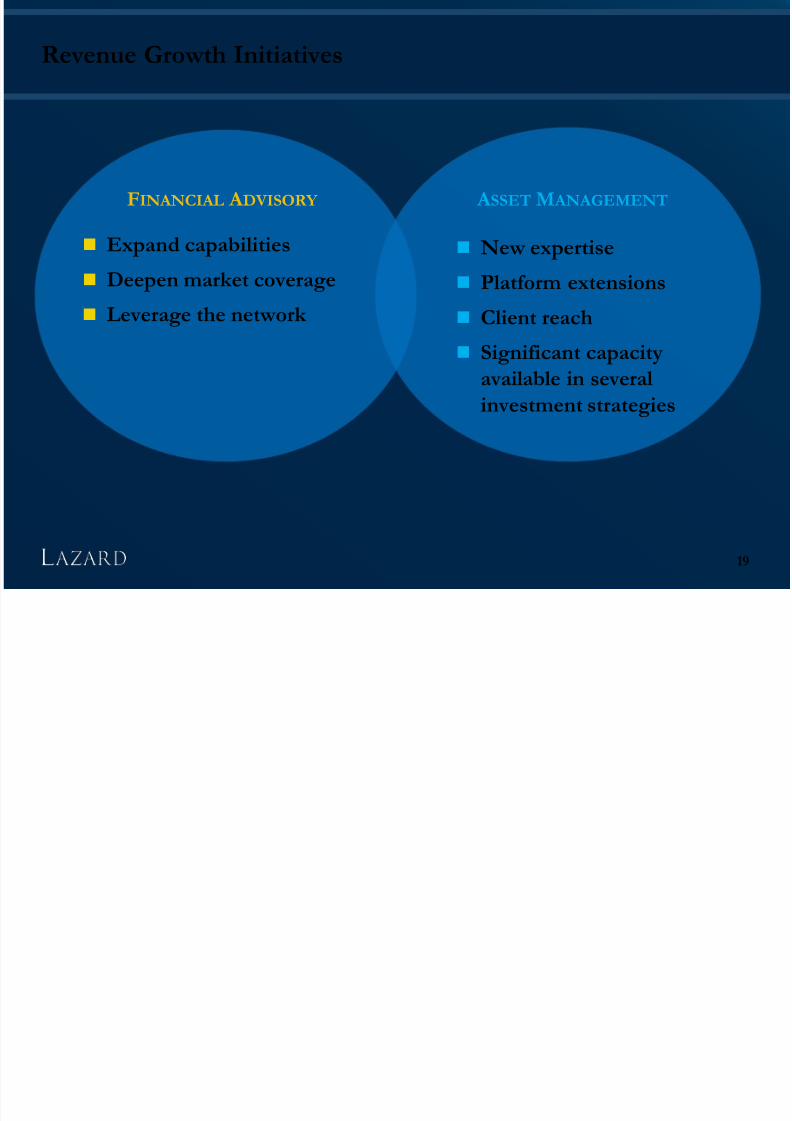
Revenue Growth Initiatives
19
FINANCIAL A DVISORY A SSET M ANAGEMENT
Expand capabilities
Deepen market coverage
Leverage the network
New expertise
Platform extensions
Client reach
Significant capacity
available in several
investment strategies
7/31/2019 1Q12 Investor Information
http://slidepdf.com/reader/full/1q12-investor-information 20/58
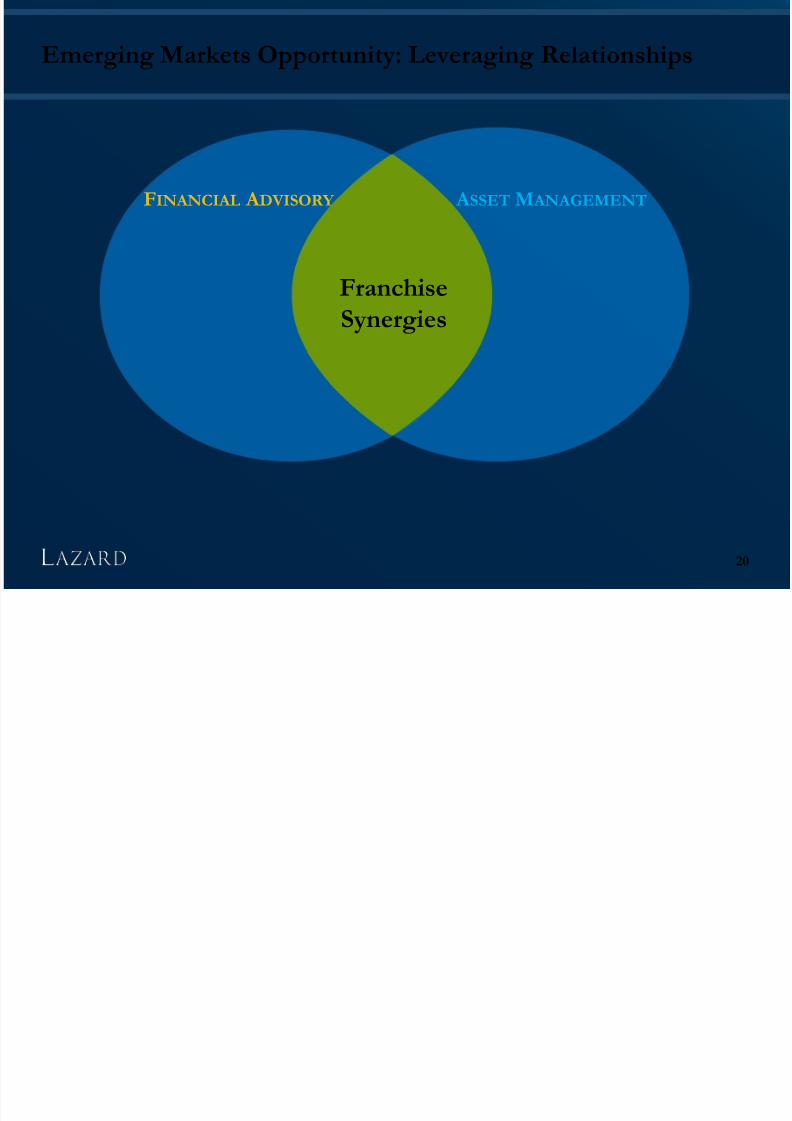
Emerging Markets Opportunity: Leveraging Relationships
20
FINANCIAL A DVISORY A SSET M ANAGEMENT
FranchiseSynergies
7/31/2019 1Q12 Investor Information
http://slidepdf.com/reader/full/1q12-investor-information 21/58
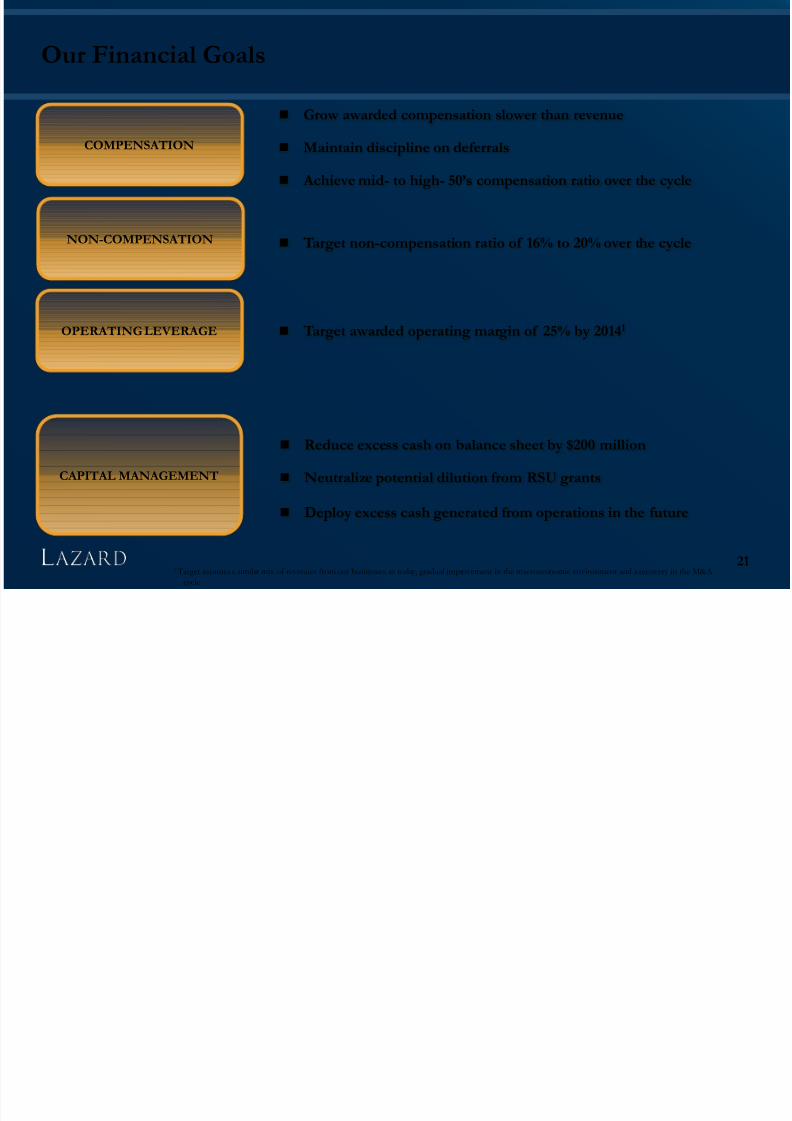
Our Financial Goals
21
Grow awarded compensation slower than revenue
Maintain discipline on deferrals
Achieve mid- to high- 50’s compensation ratio over the cycle
Target non-compensation ratio of 16% to 20% over the cycle
Target awarded operating margin of 25% by 20141
COMPENSATION
NON-COMPENSATION
CAPITAL MANAGEMENT
1 Target assumes a similar mix of revenues from our businesses as today, gradual improvement in the macroeconomic environment and a recovery in the M&Acycle
OPERATING LEVERAGE
Reduce excess cash on balance sheet by $200 million
Neutralize potential dilution from RSU grants
Deploy excess cash generated from operations in the future
7/31/2019 1Q12 Investor Information
http://slidepdf.com/reader/full/1q12-investor-information 22/58
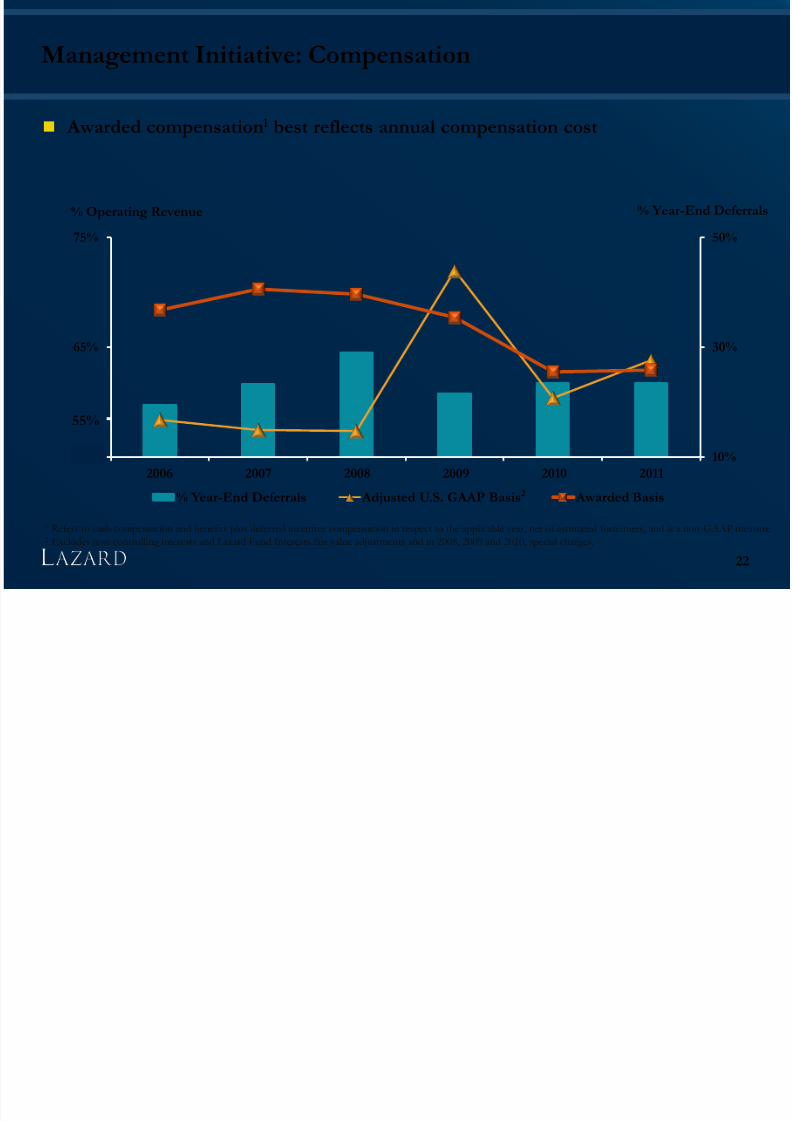
Management Initiative: Compensation
Awarded compensation1 best reflects annual compensation cost
22
10%
30%
50%
55%
65%
75%
2006 2007 2008 2009 2010 2011
% Year-End Deferrals Adjusted U.S. GAAP Basis Awarded Basis
1 Refers to cash compensation and benefits plus deferred incentive compensation in respect to the applicable year, net of estimated forfeitures, and is a non-GAAP measure2 Excludes non-controlling interests and Lazard Fund Interests fair value adjustments and in 2008, 2009 and 2010, special charges.
% Year-End Deferrals
55%
% Operating Revenue
2
7/31/2019 1Q12 Investor Information
http://slidepdf.com/reader/full/1q12-investor-information 23/58
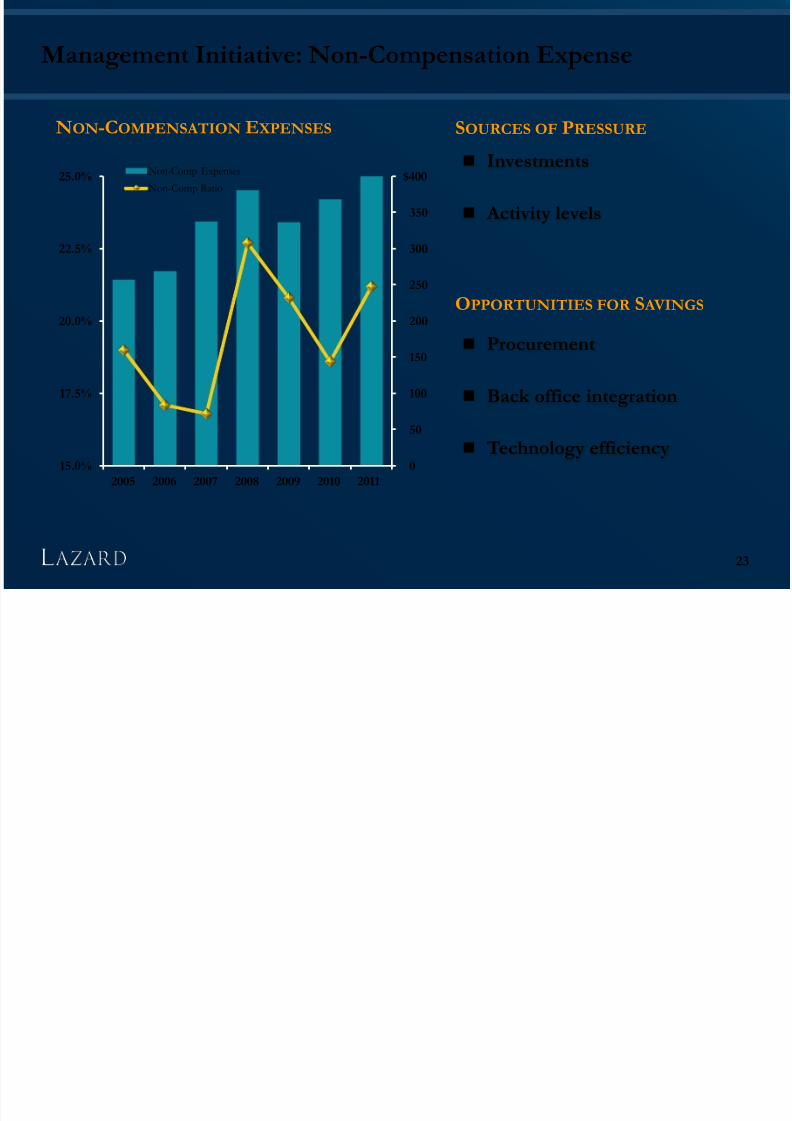
Management Initiative: Non-Compensation Expense
23
0
50
100
150
200
250
300
350
$400
15.0%
17.5%
20.0%
22.5%
25.0%
2005 2006 2007 2008 2009 2010 2011
Non-Comp Expenses
Non-Comp Ratio
NON-COMPENSATION EXPENSES
Investments
Activity levels
SOURCES OF PRESSURE
Procurement
Back office integration
Technology efficiency
OPPORTUNITIES FOR S AVINGS
7/31/2019 1Q12 Investor Information
http://slidepdf.com/reader/full/1q12-investor-information 24/58
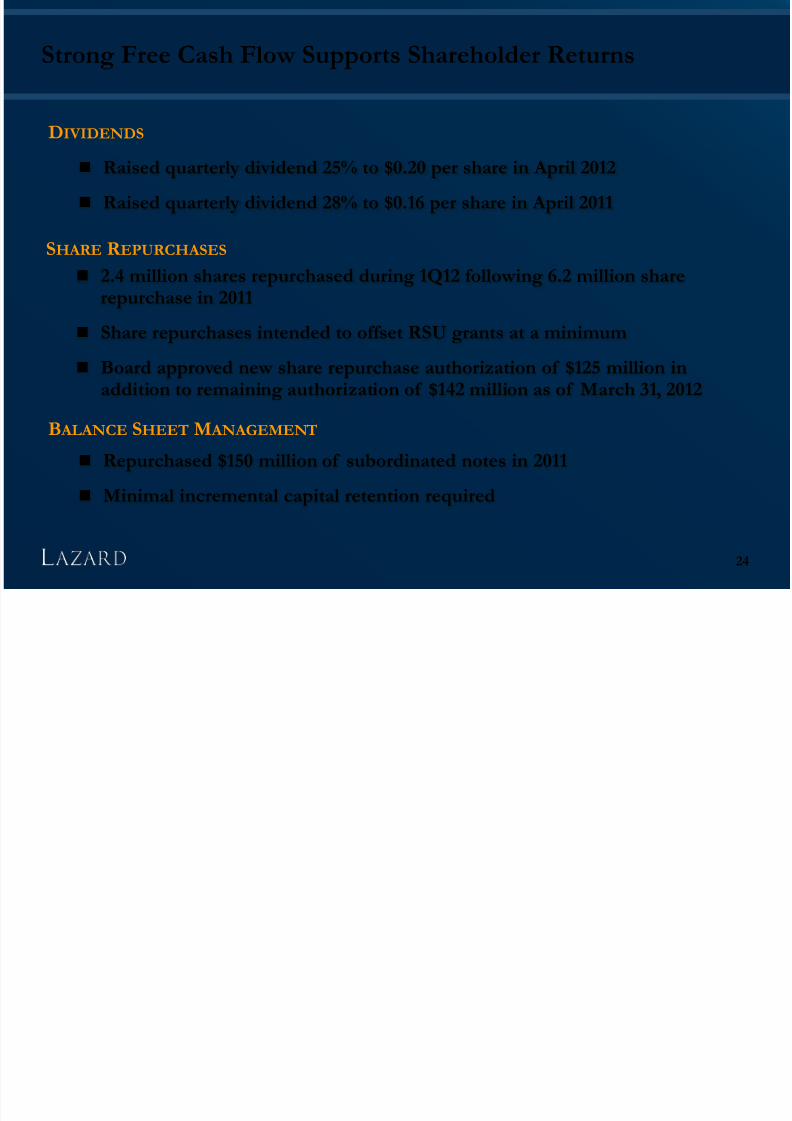
Strong Free Cash Flow Supports Shareholder Returns
2.4 million shares repurchased during 1Q12 following 6.2 million sharerepurchase in 2011
Share repurchases intended to offset RSU grants at a minimum
Board approved new share repurchase authorization of $125 million inaddition to remaining authorization of $142 million as of March 31, 2012
SHARE R EPURCHASES
Repurchased $150 million of subordinated notes in 2011
Minimal incremental capital retention required
B ALANCE SHEET M ANAGEMENT
Raised quarterly dividend 25% to $0.20 per share in April 2012
Raised quarterly dividend 28% to $0.16 per share in April 2011
DIVIDENDS
24
7/31/2019 1Q12 Investor Information
http://slidepdf.com/reader/full/1q12-investor-information 25/58
Conclusion
25
Lazard’s unrivaled global network
Low-risk business model with minimal capital requirements
Substantial growth opportunities
Operating leverage as macro environment improves
Significant free cash flow
7/31/2019 1Q12 Investor Information
http://slidepdf.com/reader/full/1q12-investor-information 26/58
APRIL 2012
Appendix
26

7/31/2019 1Q12 Investor Information
http://slidepdf.com/reader/full/1q12-investor-information 27/58
Company Overview
2 7
7/31/2019 1Q12 Investor Information
http://slidepdf.com/reader/full/1q12-investor-information 28/58
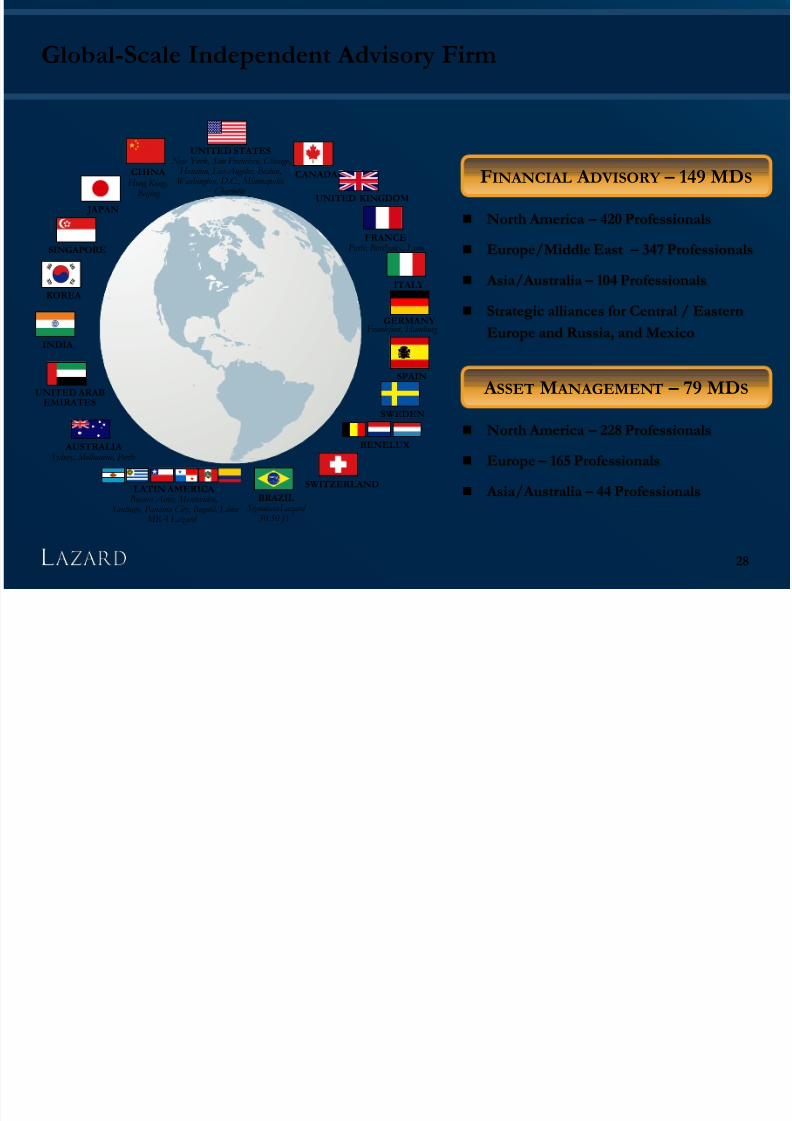
Global-Scale Independent Advisory Firm
BENELUX
CHINA Hong Kong,
Beijing
JAPAN
SINGAPORE
CANADA
UNITED KINGDOM
KOREA
INDIA
UNITED ARAB EMIRATES
AUSTRALIA Sydney, Melbourne, Perth
BRAZIL Signatura Lazard
50:50 JV
SWITZERLAND
SWEDEN
SPAIN
GERMANY
ITALY
FRANCE Paris, Bordeaux, Lyon
LATIN AMERICA
Buenos Aires, Montevideo, Santiago, Panama City, Bogotá, Lima
MBA Lazard
UNITED STATES New York, San Francisco, Chicago,
Houston, Los Angeles, Boston, Washington, D.C., Minneapolis,
Charlotte
Frankfurt, Hamburg
FINANCIAL A DVISORY – 149 MDS
North America – 420 Professionals
Europe/Middle East – 347 Professionals
Asia/Australia – 104 Professionals
Strategic alliances for Central / Eastern
Europe and Russia, and Mexico
A SSET M ANAGEMENT – 79 MDS
North America – 228 Professionals
Europe – 165 Professionals
Asia/Australia – 44 Professionals
28
7/31/2019 1Q12 Investor Information
http://slidepdf.com/reader/full/1q12-investor-information 29/58
LTM1
R EVENUE BY GEOGRAPHY LTM1
R EVENUE BY BUSINESS LINE
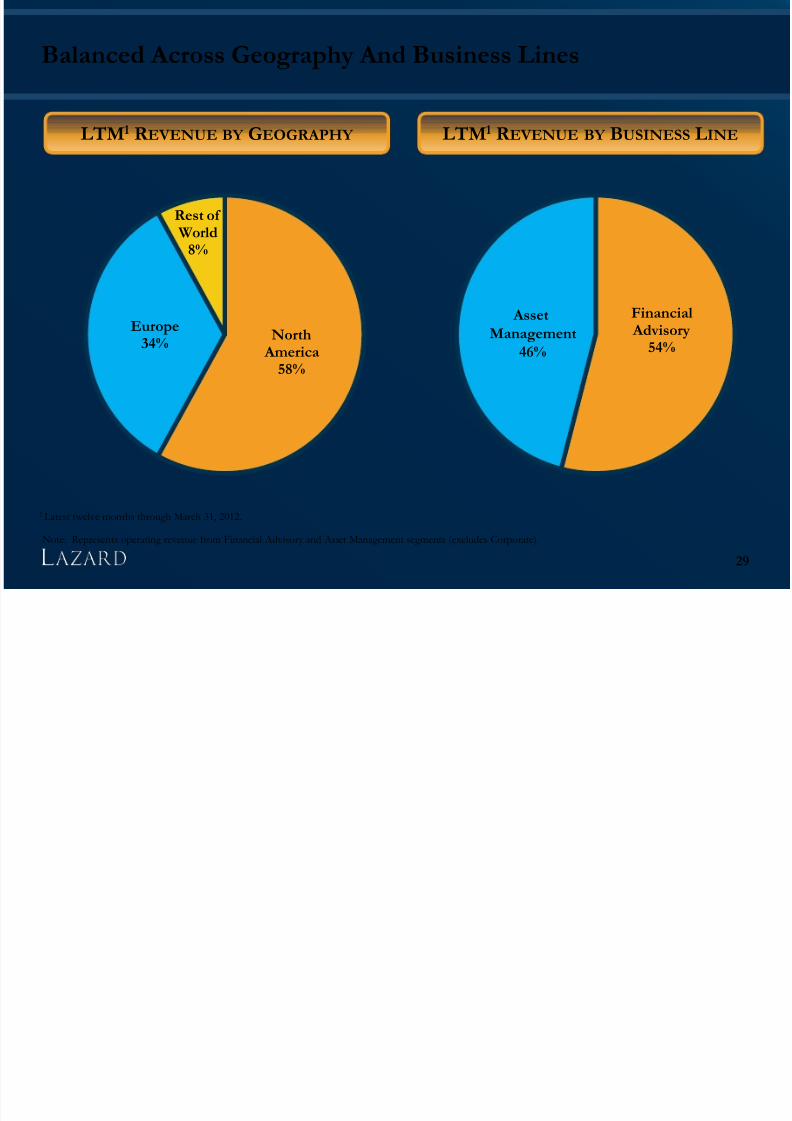
Balanced Across Geography And Business Lines
Note: Represents operating revenue from Financial Advisory and Asset Management segments (excludes Corporate).
North America
58%
Europe34%
Rest of World
8%
Financial Advisory
54%
Asset
Management
46%
29
1 Latest twelve months through March 31, 2012.
7/31/2019 1Q12 Investor Information
http://slidepdf.com/reader/full/1q12-investor-information 30/58
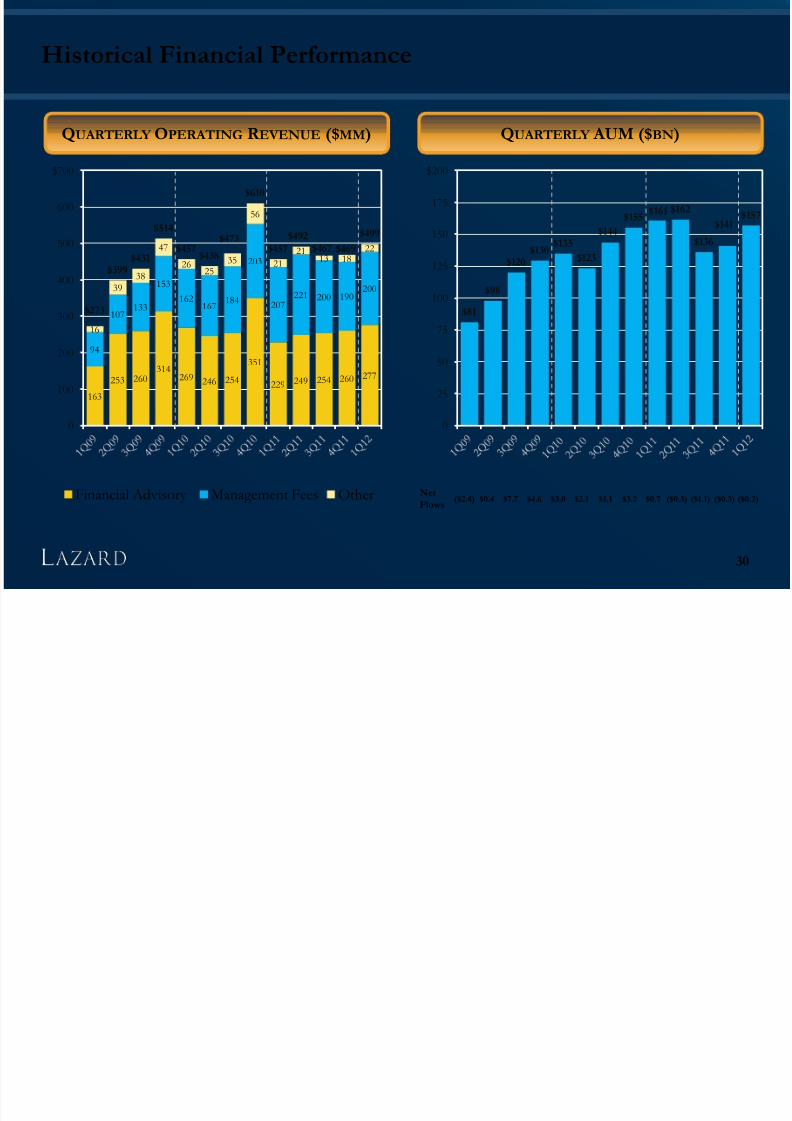
Historical Financial Performance
163
253 260314
269 246 254
351
229 249 254 260 277
94
107133
153
162167
184
203
207221 200 190
200
16
39 38
47
2625
35
56
21
2113 18
22
$273
$399$431
$514
$457$438
$473
$610
$457$492
$467 $469
$499
0
100
200
300
400
500
600
$700
Financial Advisory Management Fees Other
$81
$98
$120$130
$135
$123
$144
$155$161 $162
$136
$141$157
0
25
50
75
100
125
150
175
$200
Net
Flows($2.4) $0.4 $7.7 $4.6 $3.0 $2.1 $1.1 $3.2 $0.7 ($0.3) ($1.1) ($0.3) ($0.2)
QUARTERLY OPERATING R EVENUE ($MM) QUARTERLY AUM ($BN)
30
7/31/2019 1Q12 Investor Information
http://slidepdf.com/reader/full/1q12-investor-information 31/58
Financial Advisory
31
7/31/2019 1Q12 Investor Information
http://slidepdf.com/reader/full/1q12-investor-information 32/58
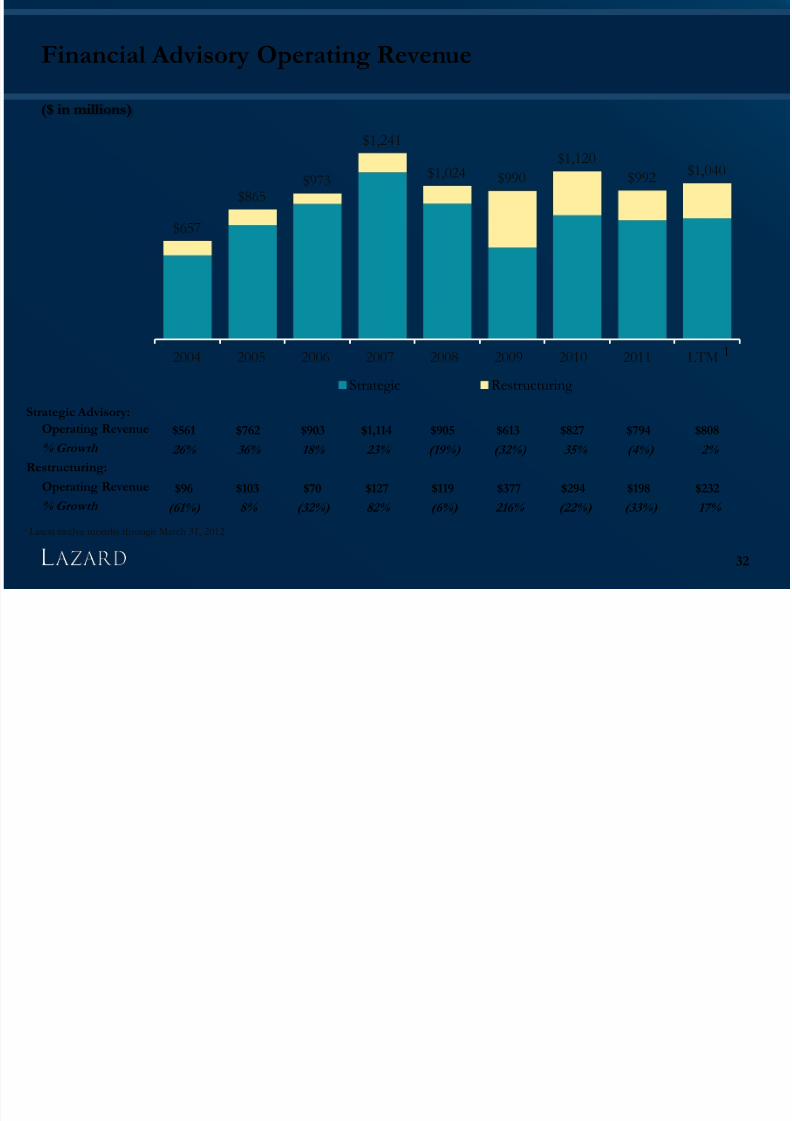
Financial Advisory Operating Revenue
$657
$865$973
$1,241
$1,024 $990
$1,120
$992 $1,040
2004 2005 2006 2007 2008 2009 2010 2011 LTM
Strategic Restructuring
Strategic Advisory:Operating Revenue $561 $762 $903 $1,114 $905 $613 $827 $794 $808
% Growth 26% 36% 18% 23% (19%) (32%) 35% (4%) 2%
Restructuring:
Operating Revenue $96 $103 $70 $127 $119 $377 $294 $198 $232
% Growth (61%) 8% (32%) 82% (6%) 216% (22%) (33%) 17%
($ in millions)
32
1
1 Latest twelve months through March 31, 2012
7/31/2019 1Q12 Investor Information
http://slidepdf.com/reader/full/1q12-investor-information 33/58
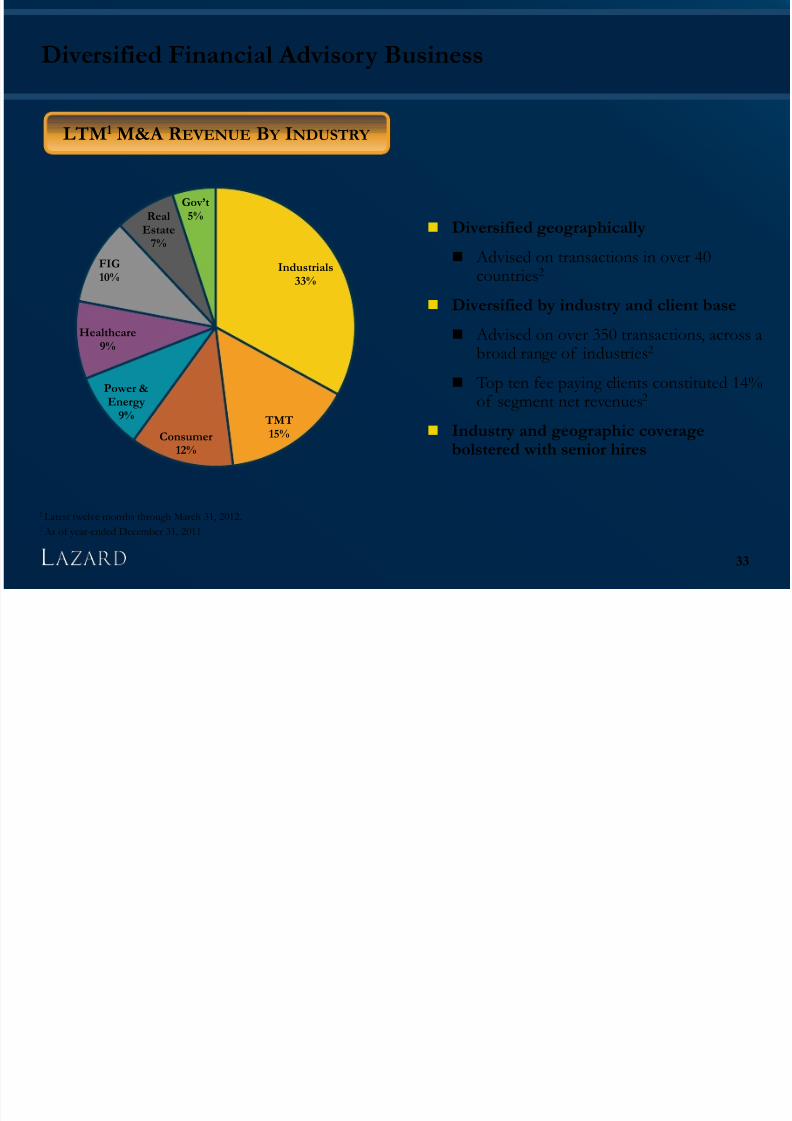
Diversified Financial Advisory Business
Diversified geographically
Advised on transactions in over 40
countries2
Diversified by industry and client base
Advised on over 350 transactions, across abroad range of industries2
Top ten fee paying clients constituted 14%of segment net revenues2
Industry and geographic coveragebolstered with senior hires
Industrials
33%
TMT15%Consumer
12%
Power &Energy
9%
Healthcare9%
FIG
10%
RealEstate
7%
Gov’t 5%
LTM1
M&A R EVENUE B Y INDUSTRY
33
2 As of year-ended December 31, 2011
1 Latest twelve months through March 31, 2012.
7/31/2019 1Q12 Investor Information
http://slidepdf.com/reader/full/1q12-investor-information 34/58
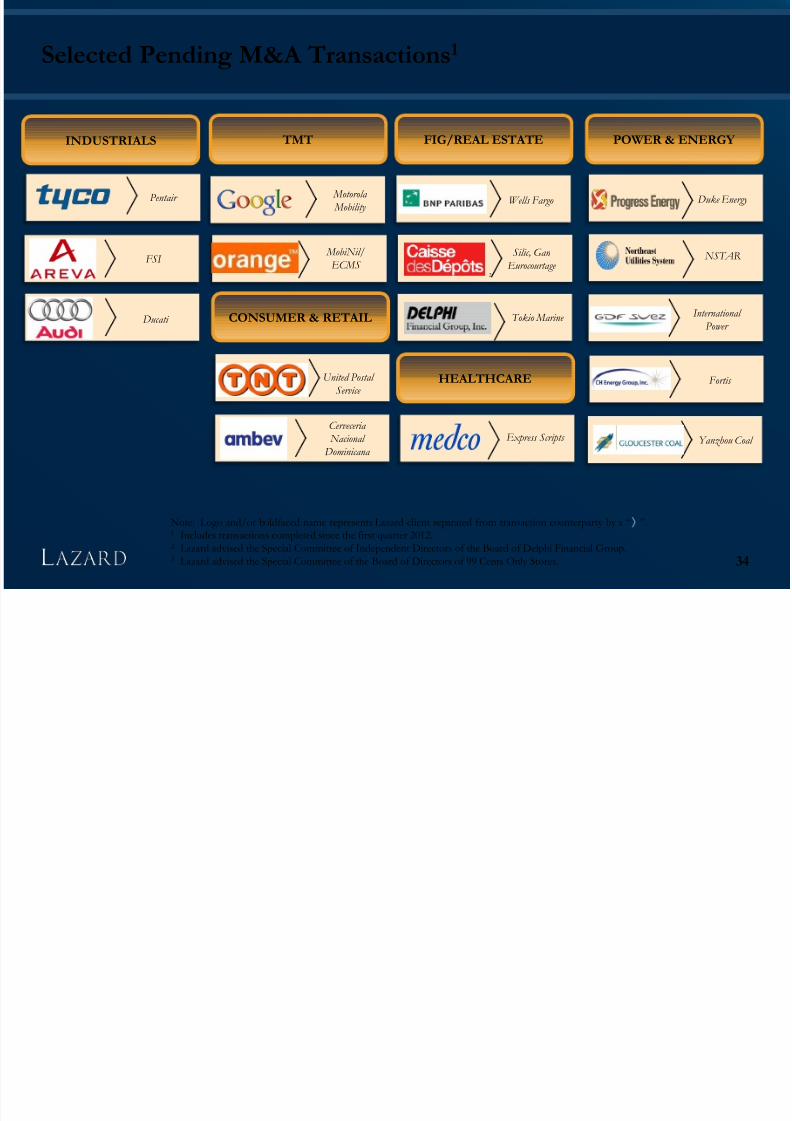
INDUSTRIALS
Selected Pending M&A Transactions1
Duke Energy
Express Scripts
Motorola
Mobility
NSTAR
Pentair
Silic, Gan
Eurocourtage
Note: Logo and/or boldfaced name represents Lazard client separated from transaction counterparty by a “ ”. 1 Includes transactions completed since the first quarter 2012.2 Lazard advised the Special Committee of Independent Directors of the Board of Delphi Financial Group.3 Lazard advised the Special Committee of the Board of Directors of 99 Cents Only Stores.
TMT
HEALTHCARE
POWER & ENERGY
CONSUMER & RETAIL
FIG/REAL ESTATE
34
Tokio Marine
2
MobiNil/
ECMS
Yanzhou Coal
Wells Fargo
FSI
United Postal
Service
Ducati
Cerveceria
Nacional
Dominicana
Fortis
International
Power
7/31/2019 1Q12 Investor Information
http://slidepdf.com/reader/full/1q12-investor-information 35/58
7/31/2019 1Q12 Investor Information
http://slidepdf.com/reader/full/1q12-investor-information 36/58
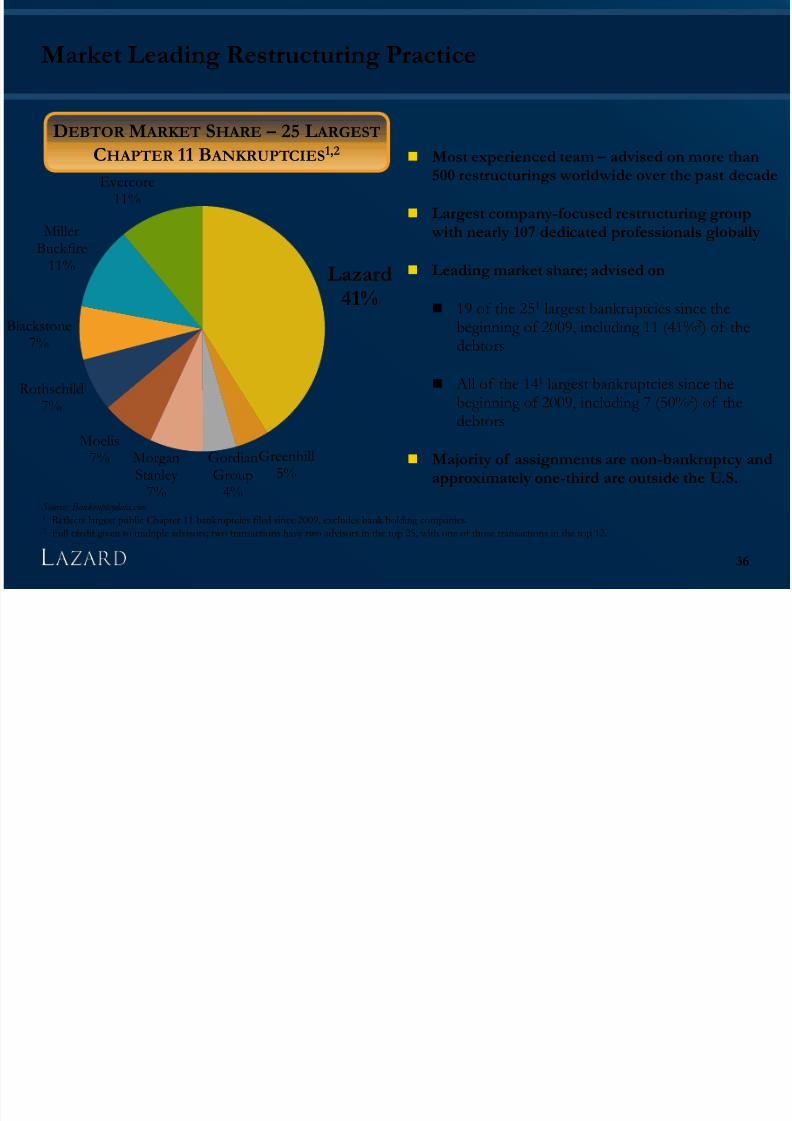
Market Leading Restructuring Practice
Most experienced team – advised on more than500 restructurings worldwide over the past decade
Largest company-focused restructuring group with nearly 107 dedicated professionals globally
Leading market share; advised on
19 of the 251 largest bankruptcies since thebeginning of 2009, including 11 (41%2 ) of thedebtors
All of the 141 largest bankruptcies since thebeginning of 2009, including 7 (50%2 ) of the
debtors
Majority of assignments are non-bankruptcy andapproximately one-third are outside the U.S.
Source: Bankruptcydata.com.1 Reflects largest public Chapter 11 bankruptcies filed since 2009, excludes bank holding companies.2 Full credit given to multiple advisors; two transactions have two advisors in the top 25, with one of those transactions in the top 12.
DEBTOR M ARKET SHARE – 25 L ARGEST
CHAPTER 11 B ANKRUPTCIES1,2
36
Lazard41%
Greenhill5%
GordianGroup
4%
MorganStanley
7%
Moelis7%
Rothschild7%
Blackstone7%
MillerBuckfire
11%
Evercore11%
7/31/2019 1Q12 Investor Information
http://slidepdf.com/reader/full/1q12-investor-information 37/58
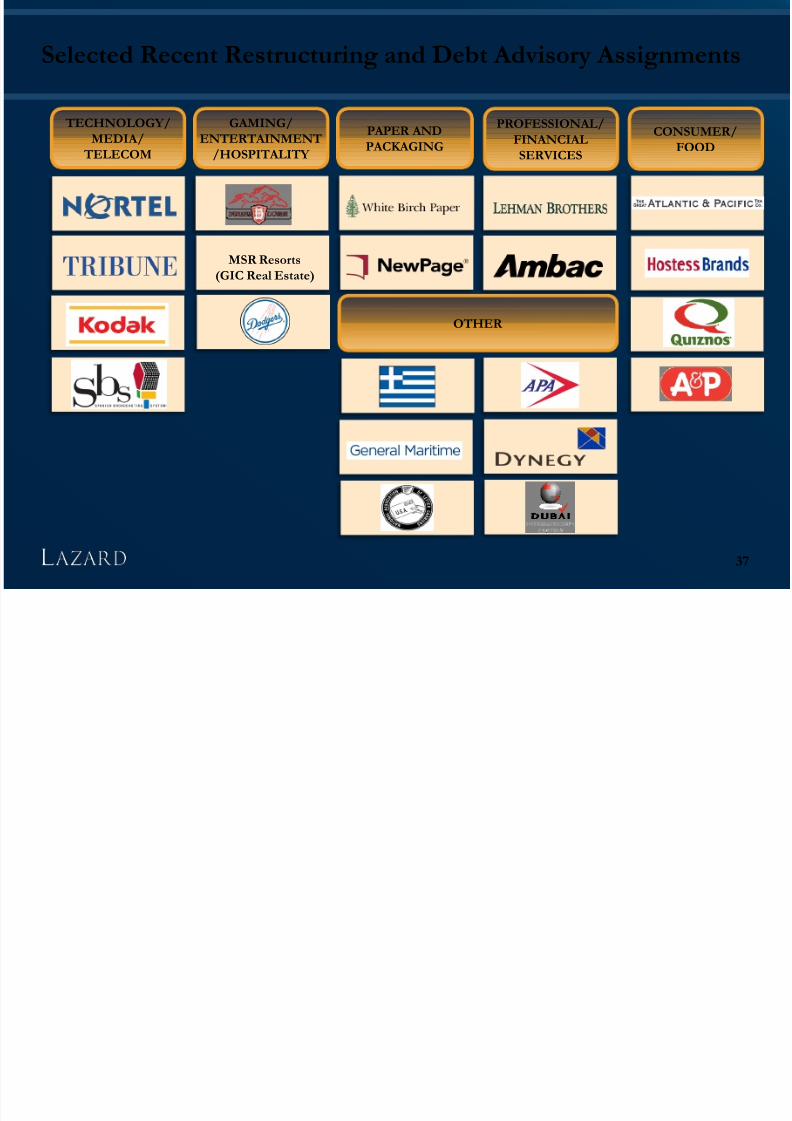
TECHNOLOGY/
MEDIA/ TELECOM
Selected Recent Restructuring and Debt Advisory Assignments
MSR Resorts
(GIC Real Estate)
PROFESSIONAL/
FINANCIALSERVICES
GAMING/
ENTERTAINMENT/HOSPITALITY
PAPER AND
PACKAGING
OTHER
37
CONSUMER/
FOOD
7/31/2019 1Q12 Investor Information
http://slidepdf.com/reader/full/1q12-investor-information 38/58
Asset Management
38
7/31/2019 1Q12 Investor Information
http://slidepdf.com/reader/full/1q12-investor-information 39/58
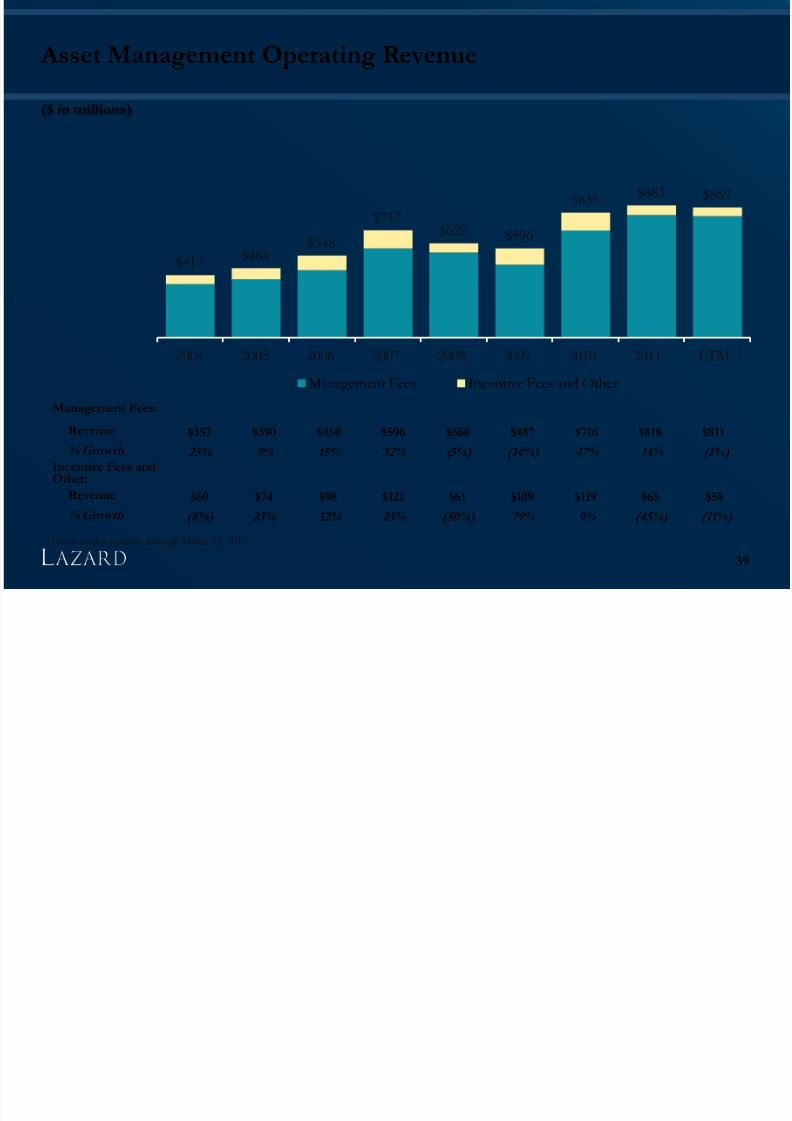
Asset Management Operating Revenue
($ in millions)
39
$417 $464$548
$717$629 $596
$835 $883 $869
2004 2005 2006 2007 2008 2009 2010 2011 LTM
Management Fees Incentive Fees and Other
Management Fees:
Revenue $357 $390 $450 $596 $568 $487 $716 $818 $811
% Growth 25% 9% 15% 32% (5%) (14%) 47% 14% (1%) Incentive Fees andOther:
Revenue $60 $74 $98 $121 $61 $109 $119 $65 $58
% Growth (8%) 23% 32% 23% (50%) 79% 9% (45%) (11%)
1
1 Latest twelve months through March 31, 2012
7/31/2019 1Q12 Investor Information
http://slidepdf.com/reader/full/1q12-investor-information 40/58
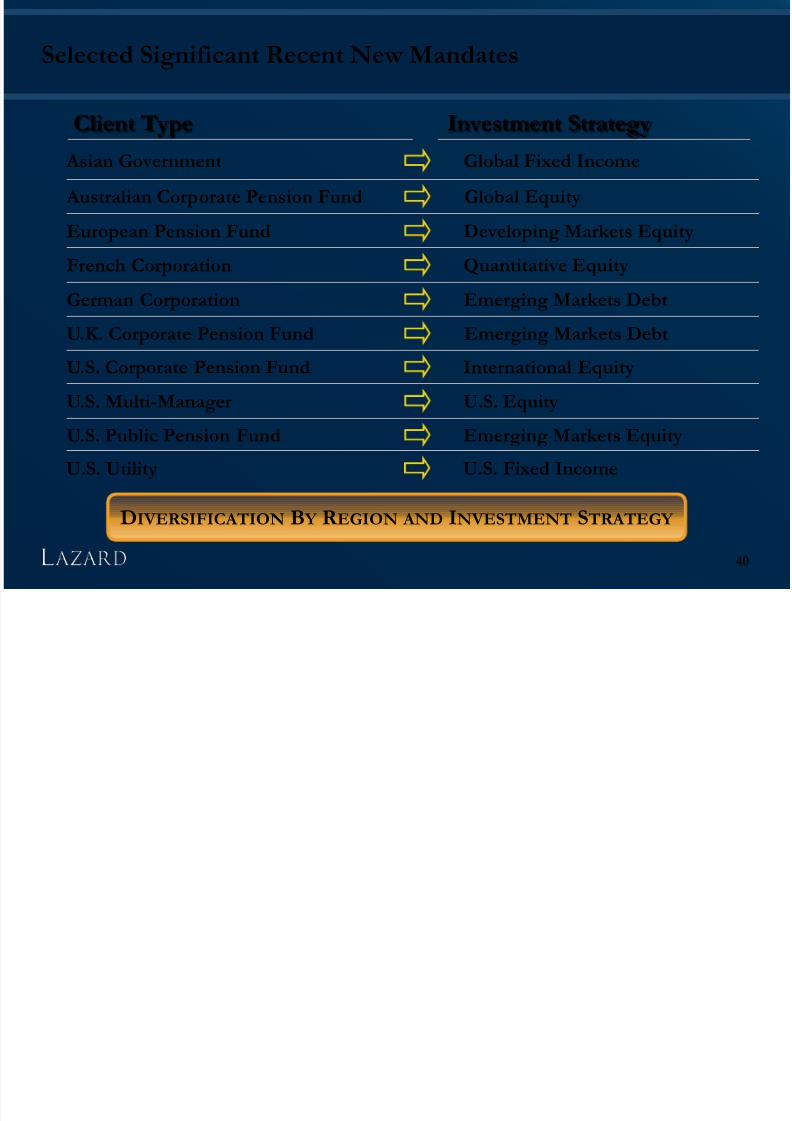
Emerging Markets EquityU.S. Public Pension Fund
Selected Significant Recent New Mandates
Client Type Investment Strategy
Developing Markets EquityEuropean Pension Fund
Quantitative EquityFrench Corporation
German Corporation Emerging Markets Debt
U.S. EquityU.S. Multi-Manager
U.K. Corporate Pension Fund Emerging Markets Debt
International EquityU.S. Corporate Pension Fund
Australian Corporate Pension Fund Global Equity
Asian Government Global Fixed Income
DIVERSIFICATION B Y R EGION AND INVESTMENT S TRATEGY
40
U.S. Fixed IncomeU.S. Utility
7/31/2019 1Q12 Investor Information
http://slidepdf.com/reader/full/1q12-investor-information 41/58
7/31/2019 1Q12 Investor Information
http://slidepdf.com/reader/full/1q12-investor-information 42/58
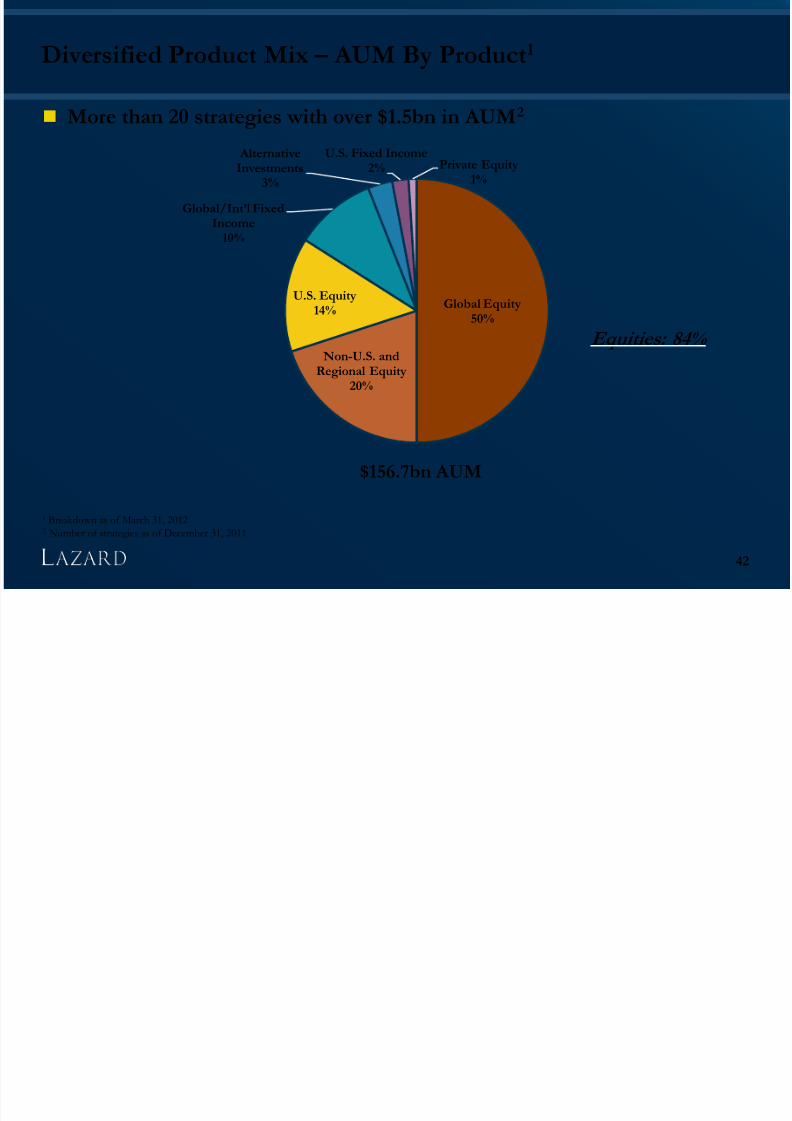
Non-U.S. andRegional Equity
20%
U.S. Equity14%
Global/Int’l FixedIncome
10%
AlternativeInvestments
3%
U.S. Fixed Income2% Private Equity
1%
Global Equity50%
Diversified Product Mix – AUM By Product1
More than 20 strategies with over $1.5bn in AUM2
$156.7bn AUM
Equities: 84%
1 Breakdown as of March 31, 20122 Number of strategies as of December 31, 2011
42
7/31/2019 1Q12 Investor Information
http://slidepdf.com/reader/full/1q12-investor-information 43/58
Compensation Data(Non-GAAP)
43
7/31/2019 1Q12 Investor Information
http://slidepdf.com/reader/full/1q12-investor-information 44/58
7/31/2019 1Q12 Investor Information
http://slidepdf.com/reader/full/1q12-investor-information 45/58
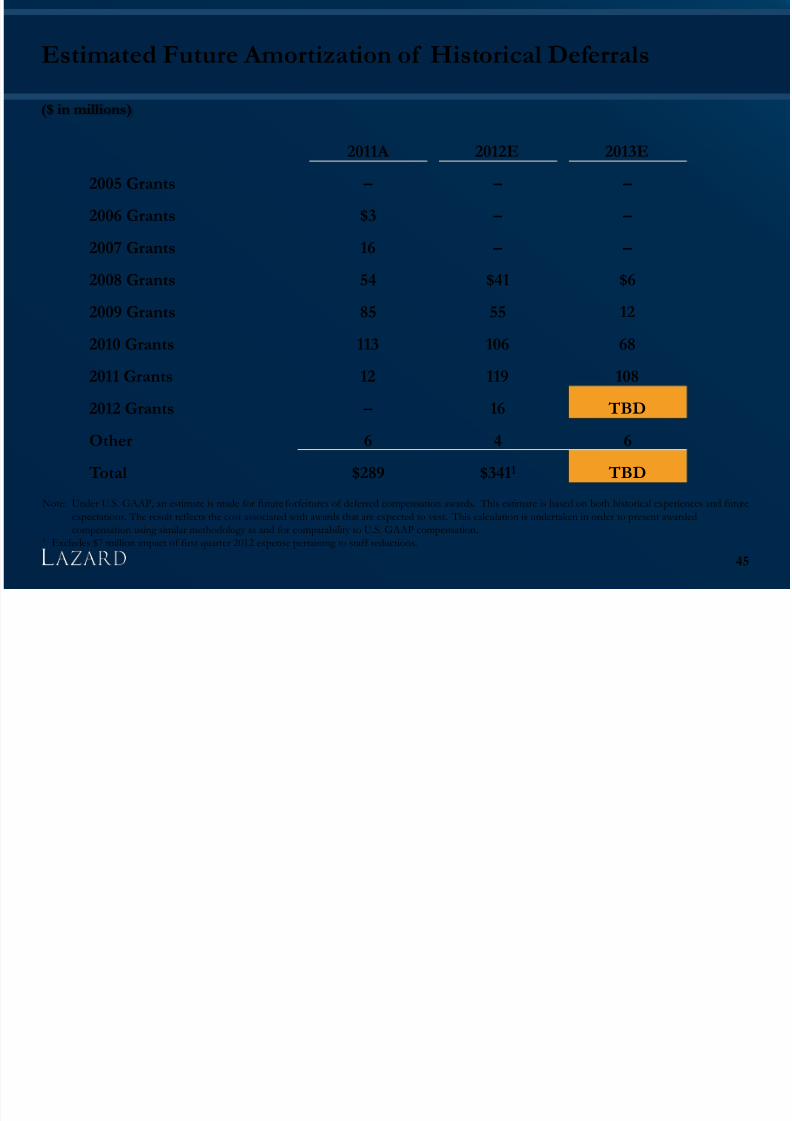
Estimated Future Amortization of Historical Deferrals
($ in millions)
45
2011A 2012E 2013E
2005 Grants – – –
2006 Grants $3 – –
2007 Grants 16 – –
2008 Grants 54 $41 $6
2009 Grants 85 55 12
2010 Grants 113 106 68
2011 Grants 12 119 108
2012 Grants – 16 TBD
Other 6 4 6
Total $289 $3411 TBD
Note: Under U.S. GAAP, an estimate is made for future forfeitures of deferred compensation awards. This estimate is based on both historical experiences and future
expectations. The result reflects the cost associated with awards that are expected to vest. This calculation is undertaken in order to present awarded
compensation using similar methodology as and for comparability to U.S. GAAP compensation.
1 Excludes $7 million impact of first quarter 2012 expense pertaining to staff reductions.
7/31/2019 1Q12 Investor Information
http://slidepdf.com/reader/full/1q12-investor-information 46/58
7/31/2019 1Q12 Investor Information
http://slidepdf.com/reader/full/1q12-investor-information 47/58
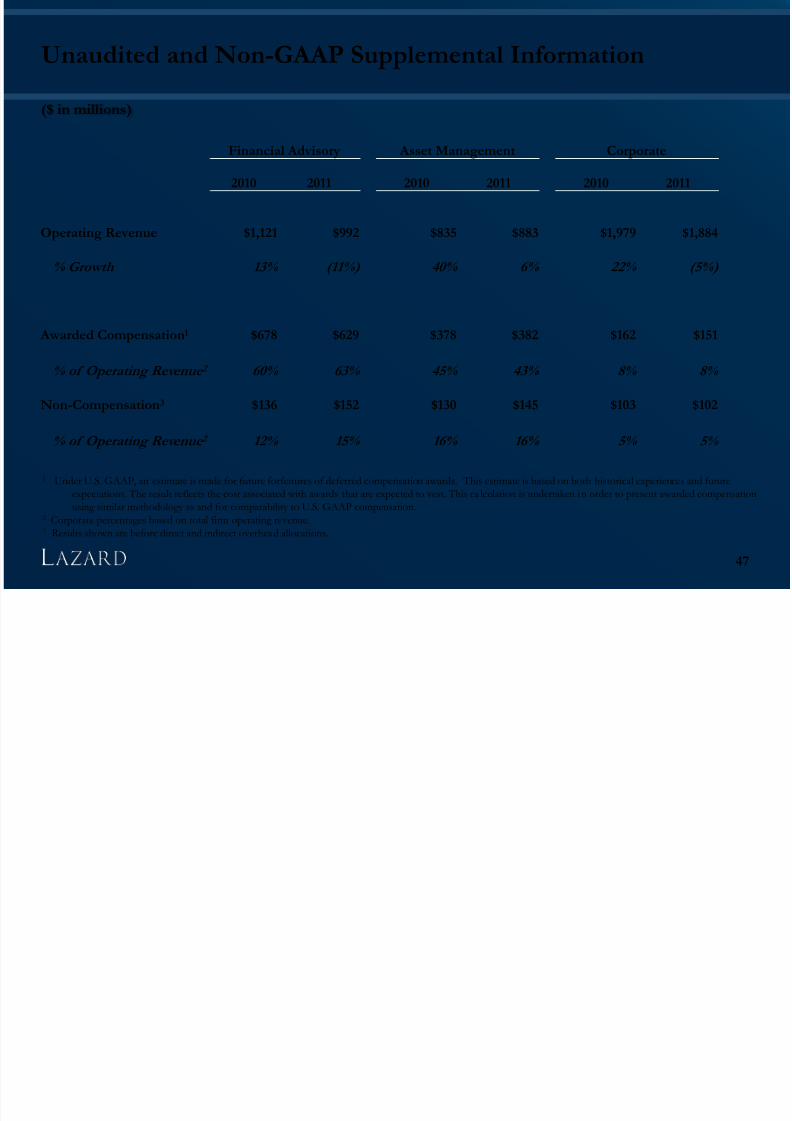
Unaudited and Non-GAAP Supplemental Information
($ in millions)
47
1 Under U.S. GAAP, an estimate is made for future forfeitures of deferred compensation awards. This estimate is based on both historical experiences and futureexpectations. The result reflects the cost associated with awards that are expected to vest. This calculation is undertaken in order to present awarded compensation
using similar methodology as and for comparability to U.S. GAAP compensation.2 Corporate percentages based on total firm operating revenue.3 Results shown are before direct and indirect overhead allocations.
Financial Advisory Asset Management Corporate
2010 2011 2010 2011 2010 2011
Operating Revenue $1,121 $992 $835 $883 $1,979 $1,884
% Growth 13% (11%) 40% 6% 22% (5%)
Awarded Compensation1 $678 $629 $378 $382 $162 $151
% of Operating Revenue 2 60% 63% 45% 43% 8% 8%
Non-Compensation3 $136 $152 $130 $145 $103 $102
% of Operating Revenue 2 12% 15% 16% 16% 5% 5%

7/31/2019 1Q12 Investor Information
http://slidepdf.com/reader/full/1q12-investor-information 48/58
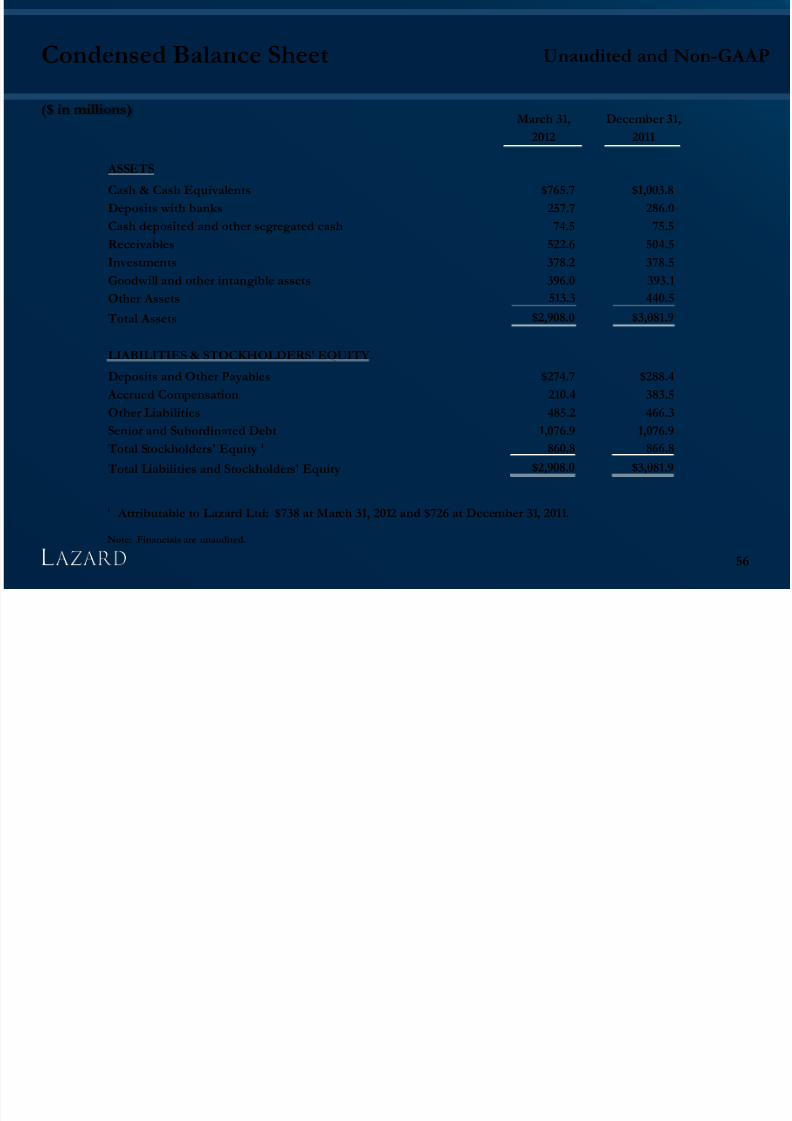
Summary Financials
48
7/31/2019 1Q12 Investor Information
http://slidepdf.com/reader/full/1q12-investor-information 49/58
Note
Lazard believes that presenting results and measures on an adjusted basis (non-GAAP) in
connection with U.S. GAAP measures provides the most meaningful basis for comparison
among present, historical and future periods.
The Company’s quarterly revenue and profits can fluctuate materially depending on the
number, size and timing of completed transactions on which it advised, as well as
seasonality, the performance of equity markets and other factors. Accordingly, the revenueand profits in any particular quarter may not be indicative of future results. As such, Lazard
management believes that annual results are the most meaningful.
A reconciliation to GAAP is provided in the schedules attached to our first-quarter earnings
release, which can be found on our web site at www.Lazard.com.
49
Unaudited and Non-GAAP
7/31/2019 1Q12 Investor Information
http://slidepdf.com/reader/full/1q12-investor-information 50/58
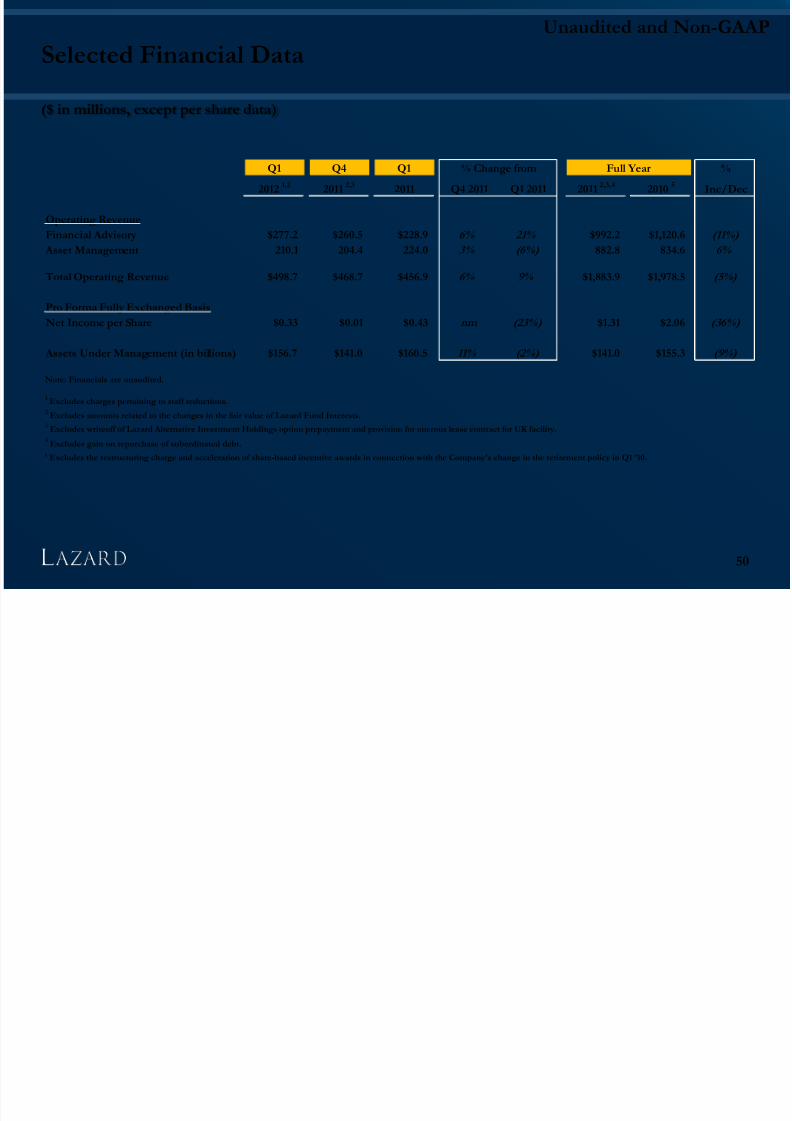
Selected Financial Data
($ in millions, except per share data)
50
Q1 Q4 Q1 % Change from Full Year %
2012 1,2 2011 2,3 2011 Q4 2011 Q1 2011 2011 2,3,4 2010 5 Inc/Dec
Operating Revenue
Financial Advisory $277.2 $260.5 $228.9 6% 21% $992.2 $1,120.6 (11%)
Asset Management 210.1 204.4 224.0 3% (6%) 882.8 834.6 6%
Total Operating Revenue $498.7 $468.7 $456.9 6% 9% $1,883.9 $1,978.5 (5%)
Pro Forma Fully Exchanged Basis
Net Income per Share $0.33 $0.01 $0.43 nm (23%) $1.31 $2.06 (36%)
Assets Under Management (in billions) $156.7 $141.0 $160.5 11% (2%) $141.0 $155.3 (9%)
Note: Financials are unaudited.
1Excludes charges pertaining to staff reductions.
2Excludes amounts related to the changes in the fair value of Lazard Fund Interests.
3Excludes writeoff of Lazard Alternative Investment Holdings option prepayment and provision for onerous lease contract for UK facility.
4Excludes gain on repurchase of subordinated debt.
5 Excludes the restructuring charge and acceleration of share-based incentive awards in connection with the Company's change in the retirement policy in Q1 '10.
7/31/2019 1Q12 Investor Information
http://slidepdf.com/reader/full/1q12-investor-information 51/58
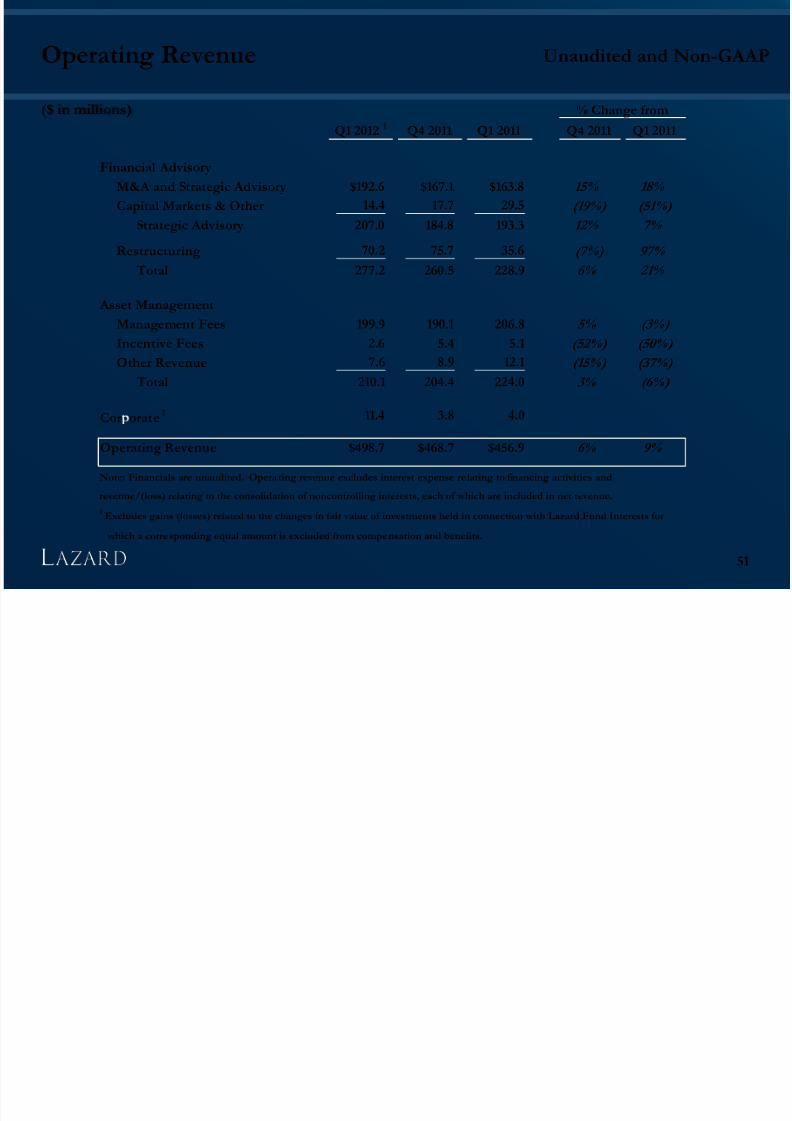
Operating Revenue
($ in millions)
51
Unaudited and Non-GAAP
% Change from
Q1 2012 1 Q4 2011 Q1 2011 Q4 2011 Q1 2011
Financial Advisory
M&A and Strategic Advisory $192.6 $167.1 $163.8 15% 18%
Capital Markets & Other 14.4 17.7 29.5 (19%) (51%)
Strategic Advisory 207.0 184.8 193.3 12% 7%
Restructuring 70.2 75.7 35.6 (7%) 97%
Total 277.2 260.5 228.9 6% 21%
Asset Management
Management Fees 199.9 190.1 206.8 5% (3%)
Incentive Fees 2.6 5.4 5.1 (52%) (50%)
Other Revenue 7.6 8.9 12.1 (15%) (37%)
Total 210.1 204.4 224.0 3% (6%)
Cor orate
1
11.4 3.8 4.0
Operating Revenue $498.7 $468.7 $456.9 6% 9%
Note: Financials are unaudited. Operating revenue excludes interest expense re lating to financing activities and
revenue/(loss) relating to the consolidation of noncontrolling interests, each of which are included in net revenue.
1Excludes gains (losses) related to the changes in fair value of investments held in connection with Lazard Fund Interests for
which a corresponding equal amount is excluded from compensation and benefits.
Unaudited and Non-GAAP
7/31/2019 1Q12 Investor Information
http://slidepdf.com/reader/full/1q12-investor-information 52/58
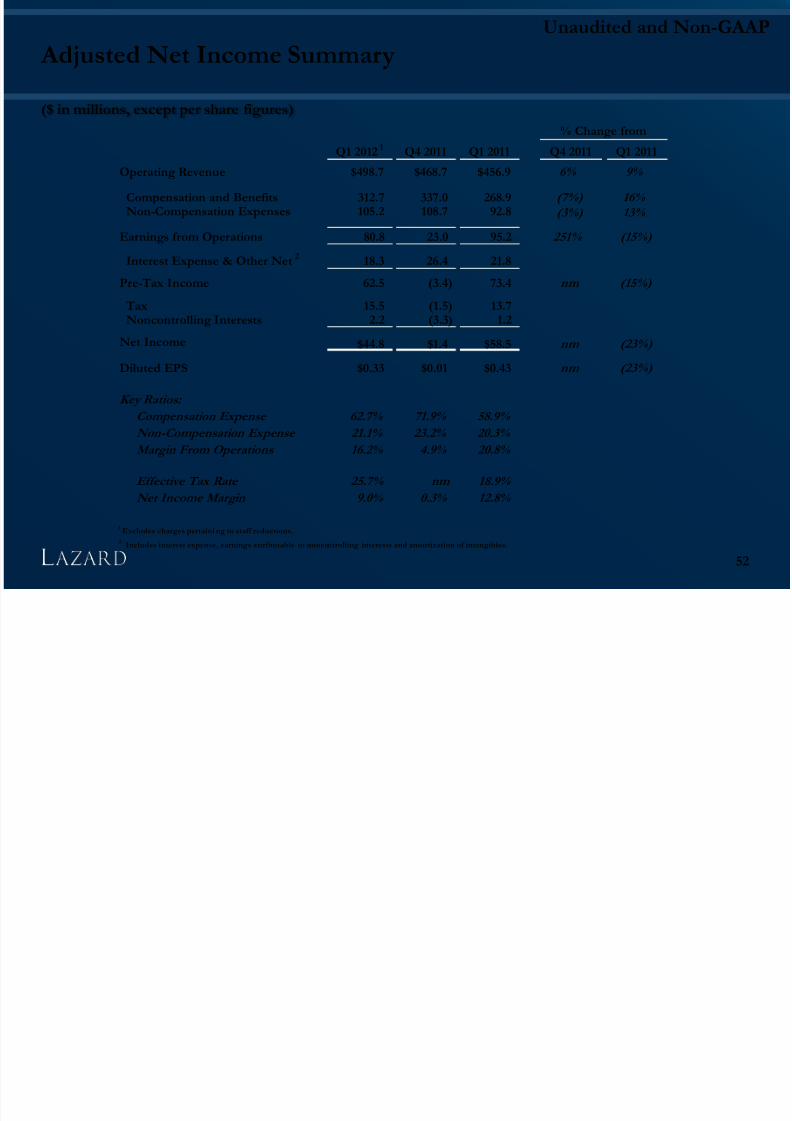
Adjusted Net Income Summary
($ in millions, except per share figures)
52
% Change from
Q1 2012 1 Q4 2011 Q1 2011 Q4 2011 Q1 2011
Operating Revenue $498.7 $468.7 $456.9 6% 9%
Compensation and Benefits 312.7 337.0 268.9 (7%) 16% Non-Compensation Expenses 105.2 108.7 92.8 (3%) 13%
Earnings from Operations 80.8 23.0 95.2 251% (15%)
Interest Expense & Other Net 2 18.3 26.4 21.8
Pre-Tax Income 62.5 (3.4) 73.4 nm (15%)
Tax 15.5 (1.5) 13.7Noncontrolling Interests 2.2 (3.3) 1.2
Net Income $44.8 $1.4 $58.5 nm (23%)
Diluted EPS $0.33 $0.01 $0.43 nm (23%)
Key Ratios:
Compensation Expense 62.7% 71.9% 58.9% Non-Compensation Expense 21.1% 23.2% 20.3%
Margin From Operations 16.2% 4.9% 20.8%
Effective Tax Rate 25.7% nm 18.9%
Net Income Margin 9.0% 0.3% 12.8%
1Excludes charges pertaini ng to staff reductions.
2Includes interest expense, earnings attributable to noncontrolling interests and amortization of intangibles.
Unaudited
7/31/2019 1Q12 Investor Information
http://slidepdf.com/reader/full/1q12-investor-information 53/58
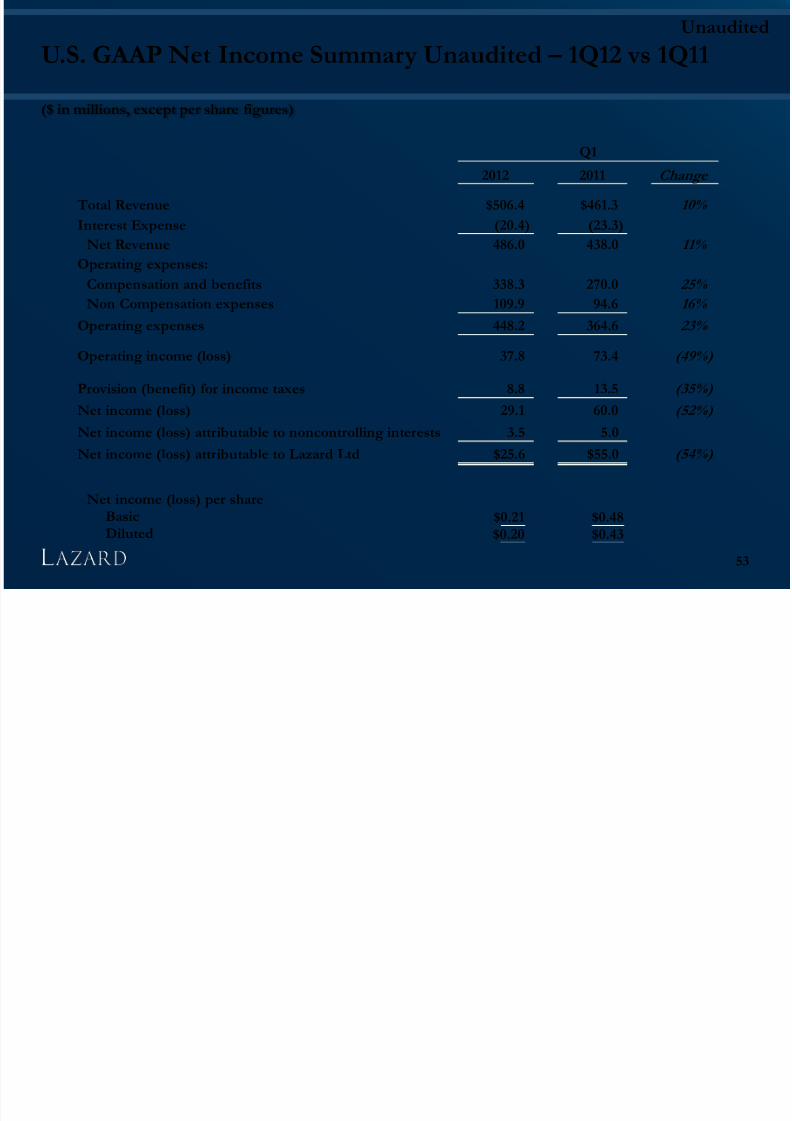
U.S. GAAP Net Income Summary Unaudited – 1Q12 vs 1Q11
($ in millions, except per share figures)
53
2012 2011
Change
Total Revenue $506.4 $461.3 10%
Interest Expense (20.4) (23.3)
Net Revenue 486.0 438.0 11%
Operating expenses:
Compensation and benefits 338.3 270.0 25% Non Compensation expenses 109.9 94.6 16%
Operating expenses 448.2 364.6 23%
Operating income (loss) 37.8 73.4 (49%)
Provision (benefit) for income taxes 8.8 13.5 (35%)
Net income (loss) 29.1 60.0 (52%)
Net income (loss) attributable to noncontrolling interests 3.5 5.0
Net income (loss) attributable to Lazard Ltd $25.6 $55.0 (54%)
Net income (loss) per shareBasic $0.21 $0.48Diluted $0.20 $0.43
Q1
Unaudited and Non-GAAP
7/31/2019 1Q12 Investor Information
http://slidepdf.com/reader/full/1q12-investor-information 54/58
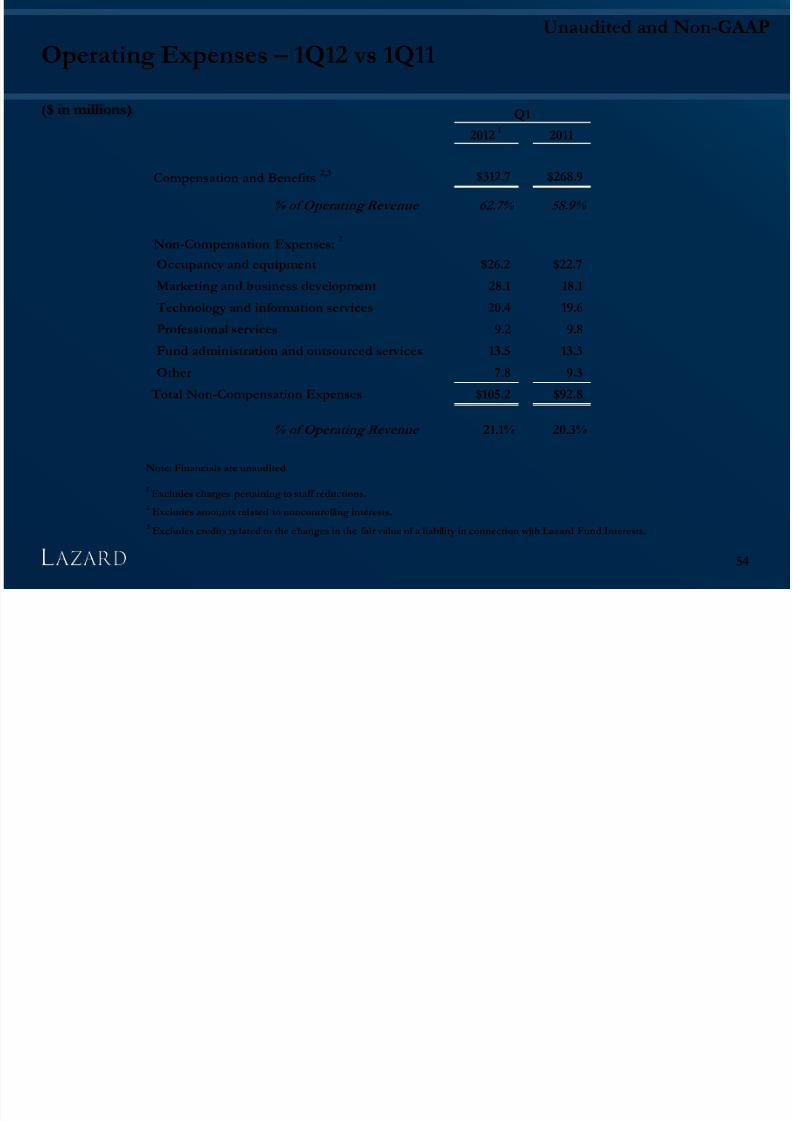
Operating Expenses – 1Q12 vs 1Q11
($ in millions)
54
2012 1 2011
Compensation and Benefits 2,3 $312.7 $268.9
% of Operating Revenue 62.7% 58.9%
Non-Compensation Expenses:2
Occupancy and equipment $26.2 $22.7
Marketing and business development 28.1 18.1
Technology and information services 20.4 19.6
Professional services 9.2 9.8
Fund administration and outsourced services 13.5 13.3
Other 7.8 9.3
Total Non-Compensation Expenses $105.2 $92.8
% of Operating Revenue 21.1% 20.3%
Note: Financials are unaudited
1Excludes charges pertaining to staff reductions.
2Excludes amounts related to noncontrolling interests.
3Excludes credits re lated to the changes in the fair value of a liability in connection with Lazard Fund Interests.
Q1
7/31/2019 1Q12 Investor Information
http://slidepdf.com/reader/full/1q12-investor-information 55/58
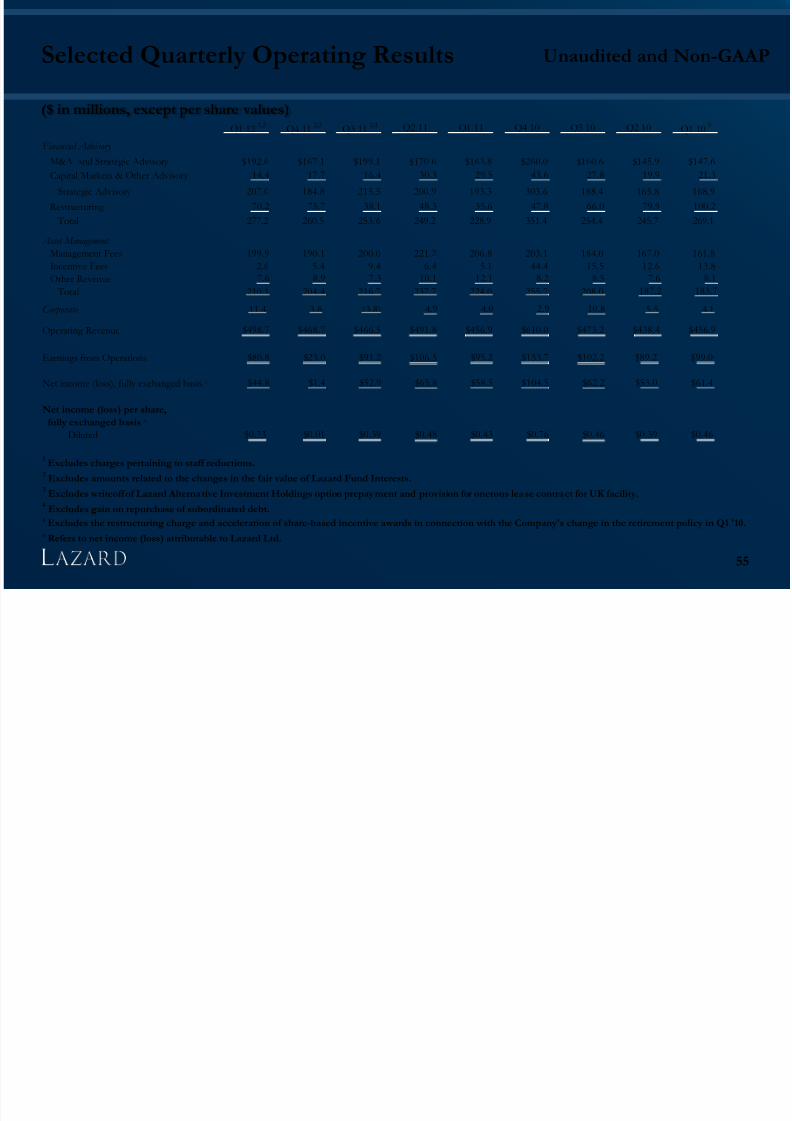
Selected Quarterly Operating Results
($ in millions, except per share values)
55
Unaudited and Non-GAAP
Q1 121,2
Q4 112,3
Q3 112,4 Q2 11 Q1 11 Q4 10 Q3 10 Q2 10 Q1 10
5
Financial Advisory M&A and Strategic Advisory $192.6 $167.1 $199.1 $170.6 $163.8 $260.0 $160.6 $145.9 $147.6
Capital Markets & Other Advisory 14.4 17.7 16.4 30.3 29.5 43.6 27.8 19.9 21.3
Strategic Advisory 207.0 184.8 215.5 200.9 193.3 303.6 188.4 165.8 168.9
Restructuring 70.2 75.7 38.1 48.3 35.6 47.8 66.0 79.9 100.2
Total 277.2 260.5 253.6 249.2 228.9 351.4 254.4 245.7 269.1
Asset Management
Management Fees 199.9 190.1 200.0 221.2 206.8 203.1 184.0 167.0 161.8
Incentive Fees 2.6 5.4 9.4 6.4 5.1 44.4 15.5 12.6 13.8
Other Revenue 7.6 8.9 7.3 10.1 12.1 8.2 8.5 7.6 8.1
Total 210.1 204.4 216.7 237.7 224.0 255.7 208.0 187.2 183.7
Corporate 11.4 3.8 (3.8) 4.9 4.0 2.9 10.8 5.5 4.1
Operating Revenue $498.7 $468.7 $466.5 $491.8 $456.9 $610.0 $473.2 $438.4 $456.9
Earnings from Operations $80.8 $23.0 $91.2 $106.5 $95.2 $153.7 $102.2 $89.2 $99.0
Net income (loss), fully exchanged basis 6 $44.8 $1.4 $52.9 $65.8 $58.5 $104.5 $62.2 $53.0 $61.4
Net income (loss) per share,
fully exchanged basis6
Diluted $0.33 $0.01 $0.39 $0.48 $0.43 $0.76 $0.46 $0.39 $0.46
1Excludes charges pertaining to staff reductions.
2Excludes amounts related to the changes in the fair value of Lazard Fund Interests.
3Excludes writeoff of Lazard Alternative Investment Holdings option prepayment and provision for onerous lease contract for UK facility.
4Excludes gain on repurchase of subordinated debt.
5 Excludes the restructuring charge and acceleration of share-based incentive awards in connection with the Company's change in the retirement policy in Q1 '10.6 Refers to net income (loss) attributable to Lazard Ltd.
7/31/2019 1Q12 Investor Information
http://slidepdf.com/reader/full/1q12-investor-information 56/58
7/31/2019 1Q12 Investor Information
http://slidepdf.com/reader/full/1q12-investor-information 57/58
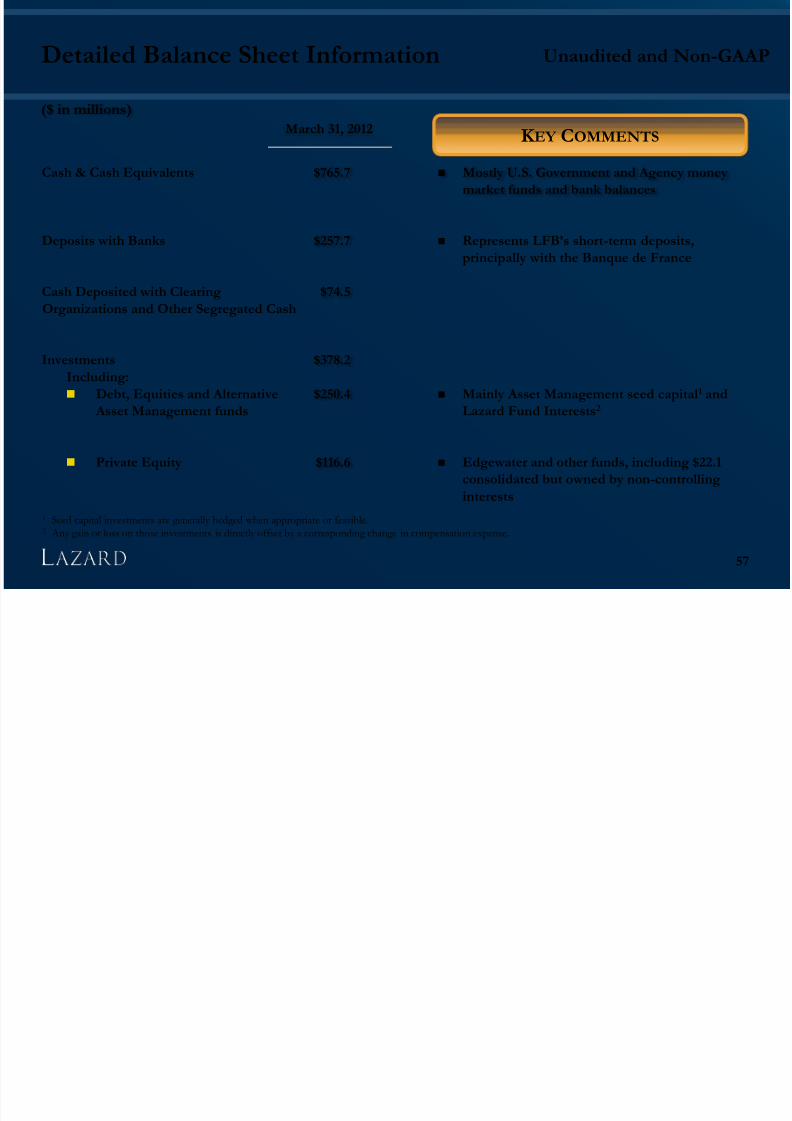
K EY COMMENTS
Detailed Balance Sheet Information
57
Mostly U.S. Government and Agency money
market funds and bank balances
Represents LFB’s short-term deposits,
principally with the Banque de France
Mainly Asset Management seed capital1 and
Lazard Fund Interests2
Edgewater and other funds, including $22.1
consolidated but owned by non-controlling
interests
March 31, 2012
$765.7
$257.7
$74.5
$378.2
$250.4
$116.6
($ in millions)
1 Seed capital investments are generally hedged when appropriate or feasible.2 Any gain or loss on those investments is directly offset by a corresponding change in compensation expense.
Cash & Cash Equivalents
Deposits with Banks
Cash Deposited with Clearing
Organizations and Other Segregated Cash
Investments
Including:
Debt, Equities and Alternative
Asset Management funds
Private Equity
Unaudited and Non-GAAP
7/31/2019 1Q12 Investor Information
http://slidepdf.com/reader/full/1q12-investor-information 58/58
APRIL 2012
Investor Information