1qfy15 results update | sector: bharti...
TRANSCRIPT

29 July 2014
1QFY15 Results Update | Sector: Telecom
Bharti Airtel
Shobhit Khare ([email protected]); +91 22 3982 5428
BSE SENSEX S&P CNX CMP: INR354 TP: INR465 Buy 25,991 7,749
Bloomberg BHARTI IN
Equity Shares (m) 3,997.4
M.Cap. (INR b) / (USD b) 1,416.5/23.6
52-Week Range (INR) 374/279
1, 6, 12 Rel. Per (%) 3/-10/-27
Financials & Valuation (INR Billion)
Y/E Mar 2015E 2016E 2017E
Net Sales 947.4 1,037.5 1,124.9
EBITDA 322.1 364.0 394.5 Adj. Net
fi 51.6 70.1 91.1
Adj. EPS ( )
12.9 17.5 22.8 Adj. EPS Gr. (%)
83.9 36.0 30.0
BV/Sh (INR) 176.9 192.8 213.5
RoE (%) 7.7 9.5 11.2
RoCE (%) 5.9 6.7 7.7
D. payout (%) 10 10 10
Valuations
P/E (x) 27.4 20.2 15.5
P/BV (x) 2.0 1.8 1.7
EV/EBITDA ( )
6.5 5.6 4.7
1QFY15 revenue/EBITDA above estimates; continued strong growth in PAT: BHARTI’s 1QFY15 EBITDA grew 18% YoY and 5.7% QoQ to INR 77.2b (est INR74.6b) driven by strong performance in India mobile business. Consolidated revenue grew 13.3% YoY and 3.3% QoQ to INR 229.6b (vs est INR224.9b), boosted by India mobile, Telemedia and DTH segments but dragged down by Africa business. Proforma PAT increased 97% YoY and 13.8% QoQ to INR13.6b. Reported PAT of INR11.1b included INR2.5b exceptional loss due to various disputes. PAT performance was strong despite INR3b forex loss.
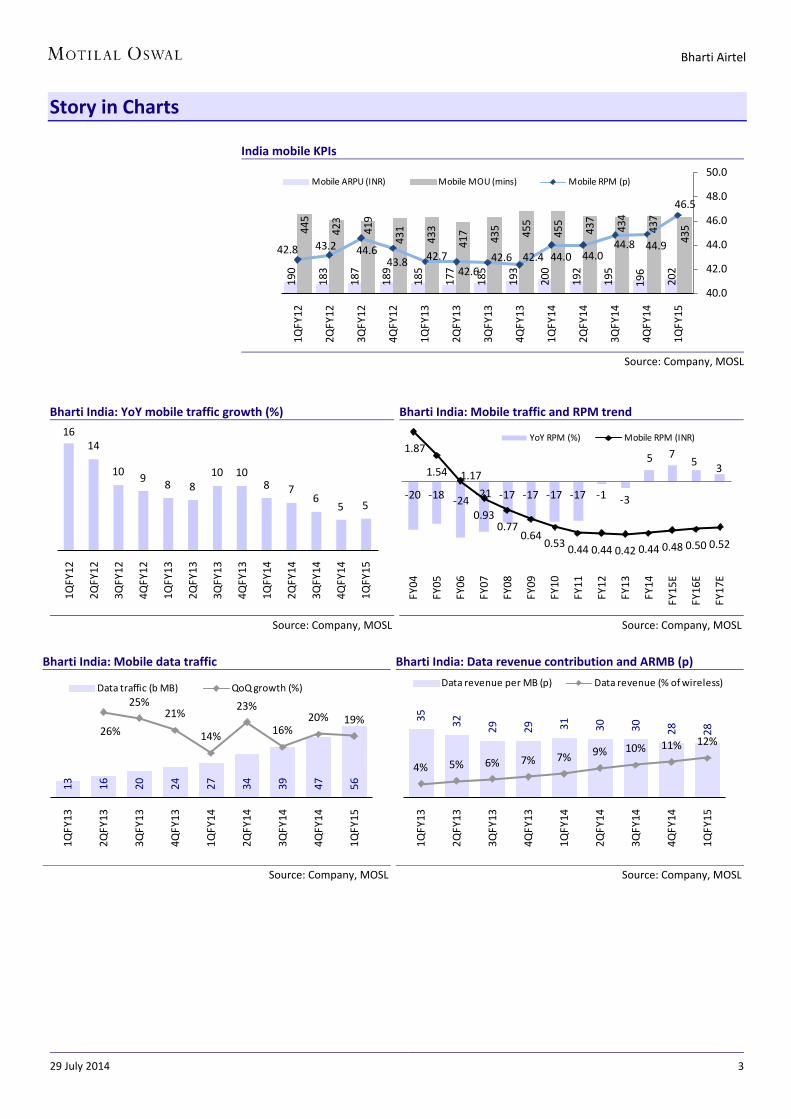
Continued robust recovery in India mobile: India mobile revenue grew 9.9% YoY and 5.5% QoQ to INR127.5b. EBITDA grew 25% YoY and 11.7% QoQ to INR47.1b (vs est of INR44b). Mobile traffic grew 2.3% QoQ (vs est of 1.5%); mobile RPM increased 3.5% QoQ to 46.5p (vs est of 45.6p). Data revenue contribution increased to 12.4% (up 90bp QoQ) on 17% QoQ traffic growth.
Africa performance remains muted: Africa EBIDTA declined 2.3% QoQ to USD283m (vs est USD286m). Revenue grew 1.6% QoQ (primarily RPM led), impacted by 1.4% revenue-weighted currency depreciation. Subscriber base declined QoQ due to promotional bans in Nigeria and KYC changes in Uganda.
Net debt down INR28b QoQ to INR577b: Net debt declined 4.6% QoQ to INR577b on strong free cash generation. 1QFY15 capex stood at INR39.9b.
Change in segment reporting: BHARTI has made changes to the segment reporting structure. India & South Asia will include 1) Bangladesh and Srilanka operations and 2) Acquisition debt/associated finance cost of Africa business.
Upgrading EBITDA by 4%; TP by 14%; maintain Buy: We are upgrading our EBITDA estimates by ~4%. We expect 14% consolidated EBITDA CAGR over FY14-16E. The stock trades at proportionate EV/EBITDA of 6.5x FY15E and 5.6x FY16E. Maintain Buy with a revised target price of INR465 (INR410 earlier) based on 6.5x FY14 EV/EBITDA for India business (ex towers), 5x EV/EBITDA for Africa, and 15% discount vs fair value for Bharti Infratel (recently upgraded).
Investors are advised to refer through disclosures made at the end of the Research Report.

29 July 2014 2
Bharti Airtel
India & South Asia EBITDA up 9% QoQ India revenue grew 12% YoY and 5.7% QoQ to INR162b (v/s our estimate of
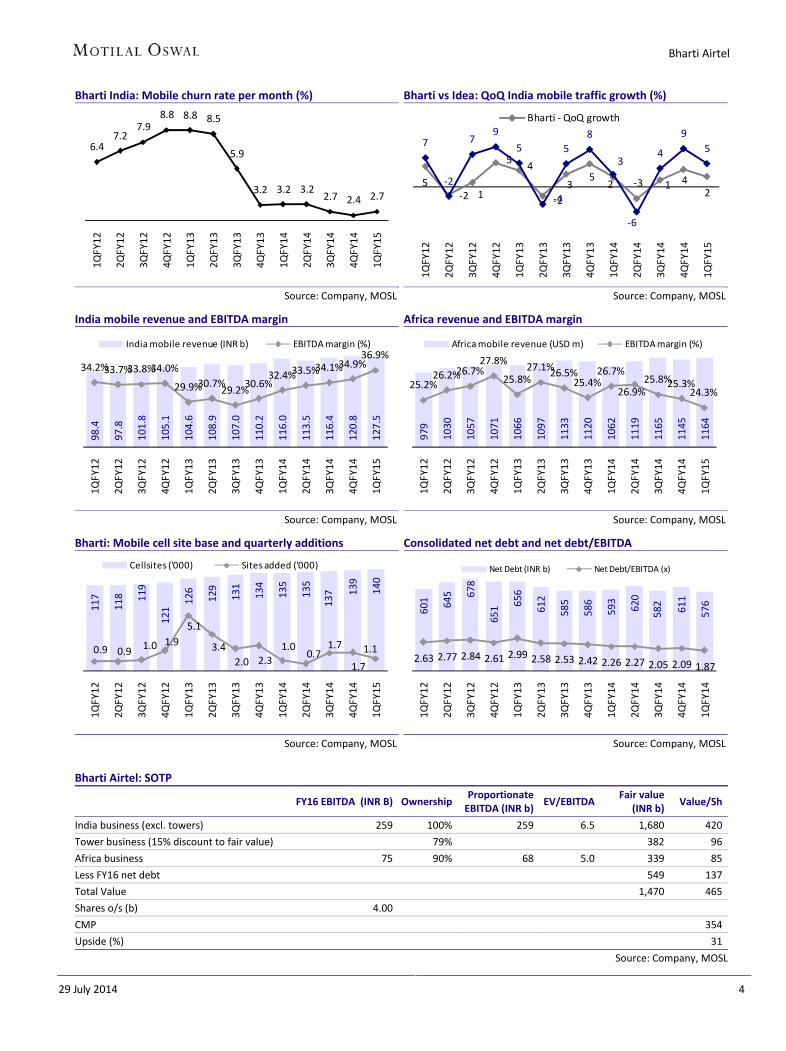
INR156.8b). EBITDA grew 22% YoY and 9.1% QoQ to INR60.2b (v/s our estimate of INR57.2b). EBITDA margin improved 300bp YoY and 120bp QoQ to 37.2% (v/s our estimate
of 36.5%), led by margin expansion in India mobile.
India Mobile: EBITDA up 12% QoQ driven by strong all round performance Mobile revenue increased 9.9% YoY and 5.5% QoQ to INR127.5b (est of
INR124.7b). Mobile EBITDA grew 25.1% YoY and 11.7% QoQ to INR47.1b (est of INR44b). EBITDA margin improved ~450bp YoY and ~200bp QoQ to 36.9%. RPM increased 5.7% YoY and 3.5% QoQ to 46.5p vs our est of 45.6p. Mobile traffic grew 4.8% YoY and 2.3% QoQ to 271b minutes, above our
estimate of 269b minutes. Data continued to grow strongly with traffic growth of 17% QoQ and data
revenue growth of 14% QoQ. Data contribution increased to 12.4% of revenue in 1QFY15 from 11.5% in 4QFY14.
MOU per subscriber declined marginally QoQ to 435 minutes (vs est of 432 minutes).
Mobile ARPU increased 3.1% QoQ to INR202 (vs est of INR197). Blended monthly churn increased marginally QoQ to 2.7%.
Africa: Performance remains muted Africa revenue increased 1.6% QoQ to USD1,164m (v/s est of USD1,162m). EBITDA declined 2.3% QoQ to USD283m implying EBITDA margin of 24.3% vs our
estimate of 24.6%. Net loss increased 31% QoQ to ~USD137m (v/s our estimate of USD142m net
loss). Total minutes increased 0.4% QoQ to 28.3b; RPM increased 1.8% QoQ. Subscriber base declined marginally to 69.1m, impacted by regulatory issues in
Nigeria and Uganda.
Net debt at INR577b; strong momentum in 3G site additions Bharti’s net debt declined 4.6% QoQ to INR577b led by strong free cash flow
during the quarter. Reported debt does not yet include INR129b spectrum related payments. Net debt/ annualized EBITDA remains comfortable at 1.9x
1QFY15 consolidated capex was ~INR40b implying capex/sales of 17%. While 2G site additions declined QoQ at ~1,100, 3G sites additions remained
strong at ~3,300.
29 July 2014 3
Bharti Airtel
Story in Charts India mobile KPIs
190
183
187
189
185
177
185
193
200
192
195
196
202
445
423
419
431
433
417
435 45
5
455
437
434
437
435
42.8 43.2 44.643.8 42.7
42.642.6 42.4 44.0 44.0
44.8 44.9
46.5
40.0
42.0
44.0
46.0
48.0
50.0
1QFY
12
2QFY
12
3QFY
12
4QFY
12
1QFY
13
2QFY
13
3QFY
13
4QFY
13
1QFY
14
2QFY
14
3QFY
14
4QFY
14
1QFY
15
Mobile ARPU (INR) Mobile MOU (mins) Mobile RPM (p)
Source: Company, MOSL
Bharti India: YoY mobile traffic growth (%)
1614
10 9 8 810 10
8 76
5 5
1QFY
12
2QFY
12
3QFY
12
4QFY
12
1QFY
13
2QFY
13
3QFY
13
4QFY
13
1QFY
14
2QFY
14
3QFY
14
4QFY
14
1QFY
15
Source: Company, MOSL
Bharti India: Mobile traffic and RPM trend
-20 -18 -24-21 -17 -17 -17 -17 -1 -3
5 75 3
1.87
1.54 1.17
0.930.77
0.640.53 0.44 0.44 0.42 0.44 0.48 0.50 0.52
FY04
FY05
FY06
FY07
FY08
FY09
FY10
FY11
FY12
FY13
FY14
FY15
E
FY16
E
FY17
E
YoY RPM (%) Mobile RPM (INR)
Source: Company, MOSL
Bharti India: Mobile data traffic
13 16 20 24 27 34 39 47 56
26%
25%21%
14%
23%
16%20% 19%
1QFY
13
2QFY
13
3QFY
13
4QFY
13
1QFY
14
2QFY
14
3QFY
14
4QFY
14
1QFY
15
Data traffic (b MB) QoQ growth (%)
Source: Company, MOSL
Bharti India: Data revenue contribution and ARMB (p)
35 32 29 29 31 30 30 28 28
4% 5% 6% 7% 7% 9% 10% 11% 12%
1QFY
13
2QFY
13
3QFY
13
4QFY
13
1QFY
14
2QFY
14
3QFY
14
4QFY
14
1QFY
15
Data revenue per MB (p) Data revenue (% of wireless)
Source: Company, MOSL
Bharti Airtel
Bharti India: Mobile churn rate per month (%)
Source: Company, MOSL
Bharti vs Idea: QoQ India mobile traffic growth (%)
Source: Company, MOSL
India mobile revenue and EBITDA margin
Source: Company, MOSL
Africa revenue and EBITDA margin
Source: Company, MOSL
Bharti: Mobile cell site base and quarterly additions
Source: Company, MOSL
Consolidated net debt and net debt/EBITDA
Source: Company, MOSL
Bharti Airtel: SOTP
FY16 EBITDA (INR B) Ownership Proportionate EBITDA (INR b)
EV/EBITDA Fair value
(INR b) Value/Sh
India business (excl. towers) 259 100% 259 6.5 1,680 420
Tower business (15% discount to fair value) 79% 382 96
Africa business 75 90% 68 5.0 339 85
Less FY16 net debt 549 137
Total Value 1,470 465
Shares o/s (b) 4.00
CMP 354
Upside (%) 31
Source: Company, MOSL
6.47.2
7.98.8 8.8 8.5
5.9
3.2 3.2 3.22.7 2.4 2.7
1QFY12
2QFY12
3QFY12
4QFY12
1QFY13
2QFY13
3QFY13
4QFY13
1QFY14
2QFY14
3QFY14
4QFY14
1QFY15
5‐2 1
54
‐2
35
2 ‐3 1 42
7
‐2
79
5
‐4
5
8
3
‐6
4
9
5
1QFY12
2QFY12
3QFY12
4QFY12
1QFY13
2QFY13
3QFY13
4QFY13
1QFY14
2QFY14
3QFY14
4QFY14
1QFY15
Bharti ‐QoQ growth
98.4
97.8
101.8
105.1
104.6
108.9
107.0
110.2
116.0
113.5
116.4
120.8
127.5
34.2%33.7%33.8%34.0%
29.9%30.7%29.2%30.6%
32.4%33.5%34.1%34.9%
36.9%
1QFY12
2QFY12
3QFY12
4QFY12
1QFY13
2QFY13
3QFY13
4QFY13
1QFY14
2QFY14
3QFY14
4QFY14
1QFY15
India mobile revenue (INR b) EBITDA margin (%)
979 1030
1057
1071
1066
1097
1133
1120
1062
1119
1165
1145
1164
25.2%26.2%26.7%
27.8%
25.8%27.1%
26.5%25.4%
26.7%
26.9%25.8%25.3%
24.3%
1QFY12
2QFY12
3QFY12
4QFY12
1QFY13
2QFY13
3QFY13
4QFY13
1QFY14
2QFY14
3QFY14
4QFY14
1QFY15
Africa mobile revenue (USD m) EBITDA margin (%)
117
118 119
121
126
129 131 134 135
135
137 139 140
0.9 0.91.0 1.9
5.1
3.4
2.0 2.31.0
0.71.7
1.7
1.1
1QFY12
2QFY12
3QFY12
4QFY12
1QFY13
2QFY13
3QFY13
4QFY13
1QFY14
2QFY14
3QFY14
4QFY14
1QFY15
Cellsites ('000) Sites added ('000)
601 64
5 678
651 656
612
585
586 593 620
582 611
576
2.63 2.77 2.84 2.61 2.99 2.58 2.53 2.42 2.26 2.27 2.05 2.09 1.87
1QFY12
2QFY12
3QFY12
4QFY12
1QFY13
2QFY13
3QFY13
4QFY13
1QFY14
2QFY14
3QFY14
4QFY14
1QFY14
Net Debt (INR b) Net Debt/EBITDA (x)
29 July 2014 4

29 July 2014 5
Bharti Airtel
Bharti Airtel - Consolidated Segment wise Summary as per IFRS (INR m) 1QFY14 4QFY14# 1QFY15# YoY% QoQ% 1QFY15E v/s Est (%)
Revenue
Mobile 116,013 120,835 127,525 9.9 5.5 124,706 2.3
Telemedia 9,484 10,242 10,705 12.9 4.5 10,362 3.3
Enterprise 14,036 16,305 16,111 14.8 -1.2 16,794 -4.1
Passive Infrastructure 12,832 13,061 13,328 3.9 2.0 13,583 -1.9
Others (incl South Asia) 9,439 10,738 11,065 17.2 3.0 10,611 4.3
Africa 59,475 70,623 69,685 17.2 -1.3 74,067 -5.9
Eliminations -18,639 -19,611 -18,803 0.9 -4.1 -20,894
Consolidated Revenue 202,639 222,193 229,616 13.3 3.3 224,878 2.1
EBITDA
Mobile 37,633 42,147 47,061 25.1 11.7 43,964 7.0
Telemedia 3,764 3,816 3,947 4.8 3.4 3,872 1.9
Enterprise 2,765 3,661 3,223 16.6 -12.0 3,660 -11.9
Passive Infrastructure 5,745 6,340 6,073 5.7 -4.2 6,527 -7.0
Others (incl South Asia) 635 730 1,244 95.9 70.4 1,244 0.0
Africa 15,867 17,816 16,958 6.9 -4.8 17,535 -3.3
Eliminations -960 -1,474 -1,306 36.0 -11.4 -1,292
Consolidated EBITDA 65,449 73,066 77,200 18.0 5.7 74,616 3.5
EBITDA margin (%)
Mobile 32.4 34.9 36.9 446bps 202bps 35.3 165bps
Telemedia 39.7 37.3 36.9 -282bps -39bps 37.4 -50bps
Enterprise 19.7 22.5 20.0 31bps -245bps 21.8 -179bps
Passive Infrastructure 44.8 48.5 45.6 79bps -298bps 48.1 -249bps
International 26.7 25.2 24.3 -234bps -89bps 23.7 66bps
Consolidated EBITDA margin 32.3 32.9 33.6 132bps 74bps 33.2 44bps
Depreciation and amortization 38,470 39,444 40,365 4.9 2.3 40,462 -0.2
Operating income 26,979 33,622 36,835 36.5 9.6 34,154 7.8
Share of JV/Associate 3,075 1,673 1,578 -48.7 -5.7 1,406 12.3
Net finance cost 11,676 9,911 9,565 -18.1 -3.5 9,431 1.4
Proforma Profit Before Taxes 18,378 25,384 28,848 57.0 13.6 26,128 10.4
Proforma Tax 9,685 13,306 14,629 51.1 9.9 12,844 13.9
Effective Tax Rate (%) 52.7 52.4 50.7 -199bps -171bps 49.2 2bps
Proforma Profit After Tax 8,693 12,078 14,219 63.6 17.7 13,284 7.0
Proforma Minority Interest 1,804 128 617 -65.8 382.0 721 -14.4
Proforma Net Profit 6,889 11,950 13,601 97.4 13.8 12,563 8.3
#4QFY14/1QFY15 numbers adjusted for exceptional expense of INR1569m/INR1820m and associated tax impact
Source: Company, MOSL
India Mobile: Operating Metrics India - Wireless KPIs 1QFY14 4QFY14 1QFY15 YoY% QoQ% 1QFY15E v/s Est (%)
Wireless traffic (b min) 258 265 271 4.8 2.3 269 0.8 RPM (p) 44.0 44.9 46.5 5.7 3.5 45.6 2.1 Subscribers (m) 191 206 209 9.7 1.9 209 0.1 ARPU (INR) 200 196 202 1.1 3.1 197 2.8 MOU (min) 455 437 435 -4.3 -0.4 432 0.8 Monthly churn (%) 3.2 2.4 2.7 -51bps 28bps Voice RPM (p) 36.6 37.2 38.1 4.1 2.5 Non-voice revenue contribution 16.9 17.4 18.2 131bps 80bps Data revenue contribution 8.2 11.5 12.4 422bps 92bps
Source: Company, MOSL

29 July 2014 6
Bharti Airtel
Bharti Africa: Quarterly Performance (USDm) 1QFY14 4QFY14 1QFY15 YoY% QoQ% 1QFY15E v/s Est (%) Revenue 1,062 1,145 1,164 9.6 1.6 1,162 -1.5 EBITDA 283 290 283 0.0 -2.3 286 1.5 EBITDA margin (%) 26.7 25.3 24.3 -233bps -98bps 24.6 75bps Depreciation and amortization 219 226 236 8.0 4.6 230 -1.9 EBIT 64 64 47 -27.4 -26.9 55 15.9 Net finance cost 59 122 124 108.7 1.3 139 -12.1 Profit Before Taxes 5 -58 -77 -1647.5 32.1 -84 -30.4 Total Tax 68 68 80 16.4 17.5 70 -2.9 Profit After Tax (before minorities) -63 -127 -157 147.4 23.3 -155 -17.8 Minority Interest -11 -23 -20 75.9 -12.0 -13 81.3 Net Profit -52 -105 -137 162.9 31.0 -142 -26.6 Bharti Africa: KPIs Mobile Subs (m) 64.2 69.4 69.1 7.6 -0.5 71.5 -2.9 Mobile ARPU (USD/month) 5.5 5.5 5.6 2.3 1.9 5.5 0.1 Total Minutes of Use (b mins) 26.0 28.2 28.3 8.8 0.4 28.9 -2.5 Minutes of Use/Sub/Month 134 136 136 1.6 0.0 137 -0.4 Effective Mobile RPM (US Cents) 4.1 4.0 4.1 0.7 1.8 4.0 0.5
Source: Company, MOSL
Summary of estimate change FY15E FY16E FY17E Revenue (INR b) Old 930 1018 1096 New 947 1037 1125 Change (%) 1.9 1.9 2.6 EBITDA (INR b) Old 310 351 380 New 322 364 395 Change (%) 3.8 3.8 3.8 EBITDA margin (%) Old 33.4 34.5 34.7 New 34.0 35.1 35.1 Change (bp) 62bps 61bps 40bps Depreciation (INR b) Old 169 188 201 New 169 190 202 Change (%) 0 1 1 Net finance cost (INR b) Old 40 41 34 New 44 46 35 Change (%) 9 10 4 Tax rate (%) Old 49 47 45 New 53 47 43 Change (bp) 332bps -62bps -161bps Net Profit (INR b) Old 51 64 81 New 52 70 91 Change (%) 0.3 9.8 12.6 EPS (INR) Old 12.9 16.0 20.3 New 12.9 17.5 22.8 Change (%) 0.3 9.8 12.6
Source: Company, MOSL

29 July 2014 7
Bharti Airtel
Key assumptions and value drivers Mobile segment FY10 FY11 FY12 FY13 FY14 FY15E FY16E FY17E
Mobile - India
Subs (m) 128 162 181 188 206 218 229 237
YoY (%) 36 27 12 4 9 6 5 4
Average subs (m) 111 145 172 185 197 212 224 233
YoY (%) 42 31 19 8 7 8 5 4
Netadds per month (m) 2.8 2.9 1.6 0.6 1.4 1.1 0.9 0.7
YoY (%) 6 3 -45 -64 150 -26 -20 -16
Total mobile traffic (b min) 610 792 889 968 1,030 1,090 1,149 1,198
YoY (%) 28 30 12 9 6 6 5 4
ARPU (INR/month) 243 201 188 185 194 204 214 221
YoY (%) -25 -17 -6 -1 5 5 5 3
MOU 459 455 431 436 436 428 428 428
YoY (%) -10 -1 -5 1 0 -2 0 0
Mobile RPM (INR) 0.53 0.44 0.44 0.42 0.44 0.48 0.50 0.52
YoY (%) -17 -17 -1 -3 5 7 5 3
Mobile EBITDA margin (%) 38.7 34.7 33.9 30.1 33.8 37.0 38.8 38.1
Mobile Capex (INR b) 34 59 32 57 42 62 62 61
Mobile Capex/sales (%) 10 16 8 13 9 12 11 10
Mobile - Africa
Subs (m) 44 53 64 69 73 81 91
YoY (%) 5 20 20 9 5 12 12
Netadds per month (m) 0.2 0.7 0.9 0.5 0.3 0.7 0.8
ARPU (USD/month) 7.3 7.1 6.3 5.6 5.6 5.5 5.4
YoY (%) -2 -11 -11 0 -2 -2
Capex (USD b) 0.9 1.5 0.7 0.6 0.7 0.8 0.8
Capex/Sales (%) 24 37 16 14 15 15 15
EBITDA margin (%) 25 27 26 26 25 25 26
Source: Company, MOSL
29 July 2014 8
Bharti Airtel
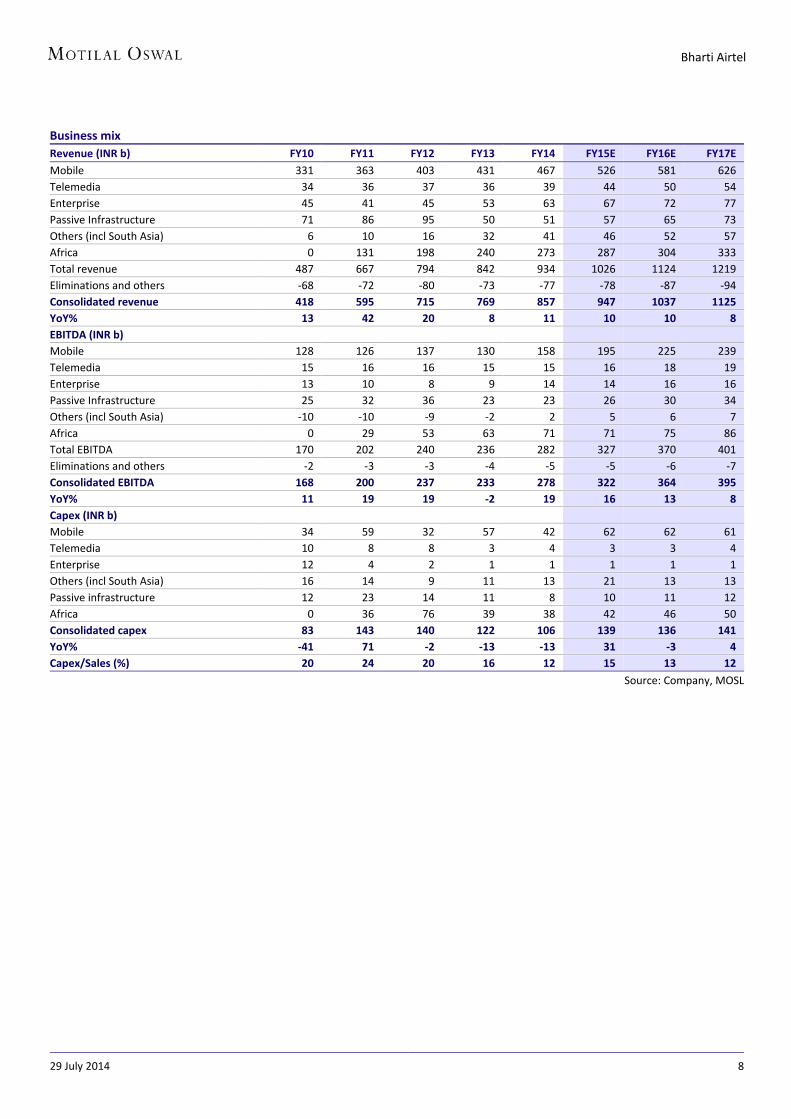
Business mix Revenue (INR b) FY10 FY11 FY12 FY13 FY14 FY15E FY16E FY17E Mobile 331 363 403 431 467 526 581 626 Telemedia 34 36 37 36 39 44 50 54 Enterprise 45 41 45 53 63 67 72 77 Passive Infrastructure 71 86 95 50 51 57 65 73 Others (incl South Asia) 6 10 16 32 41 46 52 57 Africa 0 131 198 240 273 287 304 333 Total revenue 487 667 794 842 934 1026 1124 1219 Eliminations and others -68 -72 -80 -73 -77 -78 -87 -94 Consolidated revenue 418 595 715 769 857 947 1037 1125 YoY% 13 42 20 8 11 10 10 8 EBITDA (INR b)
Mobile 128 126 137 130 158 195 225 239 Telemedia 15 16 16 15 15 16 18 19 Enterprise 13 10 8 9 14 14 16 16 Passive Infrastructure 25 32 36 23 23 26 30 34 Others (incl South Asia) -10 -10 -9 -2 2 5 6 7 Africa 0 29 53 63 71 71 75 86 Total EBITDA 170 202 240 236 282 327 370 401 Eliminations and others -2 -3 -3 -4 -5 -5 -6 -7 Consolidated EBITDA 168 200 237 233 278 322 364 395 YoY% 11 19 19 -2 19 16 13 8 Capex (INR b)
Mobile 34 59 32 57 42 62 62 61 Telemedia 10 8 8 3 4 3 3 4 Enterprise 12 4 2 1 1 1 1 1 Others (incl South Asia) 16 14 9 11 13 21 13 13 Passive infrastructure 12 23 14 11 8 10 11 12 Africa 0 36 76 39 38 42 46 50 Consolidated capex 83 143 140 122 106 139 136 141 YoY% -41 71 -2 -13 -13 31 -3 4 Capex/Sales (%) 20 24 20 16 12 15 13 12
Source: Company, MOSL

29 July 2014 9
Bharti Airtel
Bharti Airtel: an investment profile Company description Bharti Airtel is an integrated telecom operator with presence in wireless, fixed-line and broadband, long distance, enterprise, and passive infrastructure services across India, Sri Lanka, Bangladesh and Africa. Bharti is the largest Indian wireless operator with revenue market share of ~31% and population coverage of 86%. Bharti is the third largest wireless company globally by subscribers. Key investment arguments Bharti continues to maintain its wireless leadership
in India with a wireless subscriber share of ~21% and adjusted revenue share of ~31%.
Bharti is well positioned to capture rural growth by leveraging its deep coverage and favorable frequency allocation.
Bharti has the highest investment in data spectrum among Indian telecom operators
Key investment risks Overbidding in upcoming spectrum auctions Potential market disruption from entry of a well-
funded operator like Reliance Industries into the Indian telecom market
High forex risk given exposure to significant USD denominated debt
Recent developments Bharti Airtel/subsidiaries have entered into
agreements for the divestment of over 3,100 telecom towers in four countries across Africa operations to Helios Towers Africa/subsidiaries (HTA). Bharti’s subsidiaries will have access to a dedicated portion of the towers from HTA under long term lease contracts.
Valuation & View We are upgrading our EBITDA estimates by ~4%. We
expect 14% consolidated EBITDA CAGR over FY14-16E. The stock trades at proportionate EV/EBITDA of 6.5x FY15E and 5.6x FY16E. Maintain Buy with a revised target price of INR465 (INR410 earlier) based on 6.5x FY14 EV/EBITDA for India business (ex towers), 5x EV/EBITDA for Africa, and 15% discount vs fair value for Bharti Infratel (recently upgraded).
Comparative valuations Bharti
Airtel
Idea RCOM
P/E (x) FY15E 27.4 16.7 30.4 FY16E 20.2 18.2 11.8 EV/EBITDA (x) FY15E 6.5 6.4 7.3 FY16E 5.6 6.7 5.9 EV/Sales (x) FY15E 2.1 2.2 2.7 FY16E 1.9 2.3 2.2 P/BV (x) FY15E 2.0 2.3 0.9 FY16E 1.8 2.1 0.9
EPS: MOSL forecast v/s consensus (INR) MOSL
Forecast Consensus
Forecast Variation
(%) FY15 12.9 13.2 -2.3 FY16 17.5 16.7 5.0 Target price and recommendation
Current Price (INR)
Target Price (INR)
Upside (%)
Reco
354 410 15.8 Buy
Shareholding pattern (%) Jun-14 Mar-14 Jun-13
Promoter 65.4 65.3 65.2
DII 7.2 7.8 8.2
FII 17.7 16.4 16.2
Others 9.7 10.5 10.4
Stock performance (1-year)

29 July 2014 10
Bharti Airtel
Financials and valuation

29 July 2014 11
Bharti Airtel
N O T E S
29 July 2014 12
Bharti Airtel
Disclosures This research report has been prepared by MOSt to provide information about the company(ies) and sector(s), if any, covered in the report and may be distributed by it and/or its affiliated company(ies). This report is for personal information of the select recipient and does not construe to be any investment, legal or taxation advice to you. This research report does not constitute an offer, invitation or inducement to invest in securities or other investments and Motilal Oswal Securities Limited (hereinafter referred as MOSt) is not soliciting any action based upon it. This report is not for public distribution and has been furnished to you solely for your general information and should not be reproduced or redistributed to any other person in any form. This report does not constitute a personal recommendation or take into account the particular investment objectives, financial situations, or needs of individual clients. Before acting on any advice or recommendation in this material, investors should consider whether it is suitable for their particular circumstances and, if necessary, seek professional advice. The price and value of the investments referred to in this material and the income from them may go down as well as up, and investors may realize losses on any investments. Past performance is not a guide for future performance, future returns are not guaranteed and a loss of original capital may occur.
MOSt and its affiliates are a full-service, integrated investment banking, investment management, brokerage and financing group. We and our affiliates have investment banking and other business relationships with a significant percentage of the companies covered by our Research Department Our research professionals provide important input into our investment banking and other business selection processes. Investors should assume that MOSt and/or its affiliates are seeking or will seek investment banking or other business from the company or companies that are the subject of this material and that the research professionals who were involved in preparing this material may participate in the solicitation of such business. The research professionals responsible for the preparation of this document may interact with trading desk personnel, sales personnel and other parties for the purpose of gathering, applying and interpreting market information. Our research professionals are paid in part based on the profitability of MOSt which include earnings from investment banking and other business. MOSt generally prohibits its analysts, persons reporting to analysts, and members of their households from maintaining a financial interest in the securities or derivatives of any companies that the analysts cover. Additionally, MOSt generally prohibits its analysts and persons reporting to analysts from serving as an officer, director, or advisory board member of any companies that the analysts cover. Our salespeople, traders, and other professionals or affiliates may provide oral or written market commentary or trading strategies to our clients that reflect opinions that are contrary to the opinions expressed herein, and our proprietary trading and investing businesses may make investment decisions that are inconsistent with the recommendations expressed herein. In reviewing these materials, you should be aware that any or all o the foregoing, among other things, may give rise to real or potential conflicts of interest . MOSt and its affiliated company(ies), their directors and employees may; (a) from time to time, have a long or short position in, and buy or sell the securities of the company(ies) mentioned herein or (b) be engaged in any other transaction involving such securities and earn brokerage or other compensation or act as a market maker in the financial instruments of the company(ies) discussed herein or act as an advisor or lender/borrower to such company(ies) or may have any other potential conflict of interests with respect to any recommendation and other related information and opinions.
Unauthorized disclosure, use, dissemination or copying (either whole or partial) of this information, is prohibited. The person accessing this information specifically agrees to exempt MOSt or any of its affiliates or employees from, any and all responsibility/liability arising from such misuse and agrees not to hold MOSt or any of its affiliates or employees responsible for any such misuse and further agrees to hold MOSt or any of its affiliates or employees free and harmless from all losses, costs, damages, expenses that may be suffered by the person accessing this information due to any errors and delays. The information contained herein is based on publicly available data or other sources believed to be reliable. Any statements contained in this report attributed to a third party represent MOSt’s interpretation of the data, information and/or opinions provided by that third party either publicly or through a subscription service, and such use and interpretation have not been reviewed by the third party. This Report is not intended to be a complete statement or summary of the securities, markets or developments referred to in the document. While we would endeavor to update the information herein on reasonable basis, MOSt and/or its affiliates are under no obligation to update the information. Also there may be regulatory, compliance, or other reasons that may prevent MOSt and/or its affiliates from doing so. MOSt or any of its affiliates or employees shall not be in any way responsible and liable for any loss or damage that may arise to any person from any inadvertent error in the information contained in this report. MOSt or any of its affiliates or employees do not provide, at any time, any express or implied warranty of any kind, regarding any matter pertaining to this report, including without limitation the implied warranties of merchantability, fitness for a particular purpose, and non-infringement. The recipients of this report should rely on their own investigations.
Recipients who are not institutional investors should seek advice of their independent financial advisor prior to taking any investment decision based on this report or for any necessary explanation of its contents.
MOSt and/or its affiliates and/or employees may have interests/positions, financial or otherwise in the securities mentioned in this report. To enhance transparency, MOSt has incorporated a Disclosure of Interest Statement in this document. This should, however, not be treated as endorsement of the views expressed in the report.
Disclosure of Interest Statement BHARTI AIRTEL LTD Analyst ownership of the stock No
Analyst Certification The views expressed in this research report accurately reflect the personal views of the analyst(s) about the subject securities or issues, and no part of the compensation of the research analyst(s) was, is, or will be directly or indirectly related to the specific recommendations and views expressed by research analyst(s) in this report. The research analysts, strategists, or research associates principally responsible for preparation of MOSt research receive compensation based upon various factors, including quality of research, investor client feedback, stock picking, competitive factors and firm revenues.
Regional Disclosures (outside India) This report is not directed or intended for distribution to or use by any person or entity resident in a state, country or any jurisdiction, where such distribution, publication, availability or use would be contrary to law, regulation or which would subject MOSt & its group companies to registration or licensing requirements within such jurisdictions.
For U.K. This report is intended for distribution only to persons having professional experience in matters relating to investments as described in Article 19 of the Financial Services and Markets Act 2000 (Financial Promotion) Order 2005 (referred to as "investment professionals"). This document must not be acted on or relied on by persons who are not investment professionals. Any investment or investment activity to which this document relates is only available to investment professionals and will be engaged in only with such persons.
For U.S. Motilal Oswal Securities Limited (MOSL) is not a registered broker - dealer under the U.S. Securities Exchange Act of 1934, as amended (the"1934 act") and under applicable state laws in the United States. In addition MOSL is not a registered investment adviser under the U.S. Investment Advisers Act of 1940, as amended (the "Advisers Act" and together with the 1934 Act, the "Acts), and under applicable state laws in the United States. Accordingly, in the absence of specific exemption under the Acts, any brokerage and investment services provided by MOSL, including the products and services described herein are not available to or intended for U.S. persons.
This report is intended for distribution only to "Major Institutional Investors" as defined by Rule 15a-6(b)(4) of the Exchange Act and interpretations thereof by SEC (henceforth referred to as "major institutional investors"). This document must not be acted on or relied on by persons who are not major institutional investors. Any investment or investment activity to which this document relates is only available to major institutional investors and will be engaged in only with major institutional investors. In reliance on the exemption from registration provided by Rule 15a-6 of the U.S. Securities Exchange Act of 1934, as amended (the "Exchange Act") and interpretations thereof by the U.S. Securities and Exchange Commission ("SEC") in order to conduct business with Institutional Investors based in the U.S., MOSL has entered into a chaperoning agreement with a U.S. registered broker-dealer, Motilal Oswal Securities International Private Limited. ("MOSIPL"). Any business interaction pursuant to this report will have to be executed within the provisions of this chaperoning agreement.
The Research Analysts contributing to the report may not be registered /qualified as research analyst with FINRA. Such research analyst may not be associated persons of the U.S. registered broker-dealer, MOSIPL, and therefore, may not be subject to NASD rule 2711 and NYSE Rule 472 restrictions on communication with a subject company, public appearances and trading securities held by a research analyst account.
For Singapore Motilal Oswal Capital Markets Singapore Pte Limited is acting as an exempt financial advisor under section 23(1)(f) of the Financial Advisers Act(FAA) read with regulation 17(1)(d) of the Financial Advisors Regulations and is a subsidiary of Motilal Oswal Securities Limited in India. This research is distributed in Singapore by Motilal Oswal Capital Markets Singapore Pte Limited and it is only directed in Singapore to accredited investors, as defined in the Financial Advisers Regulations and the Securities and Futures Act (Chapter 289), as amended from time to time. In respect of any matter arising from or in connection with the research you could contact the following representatives of Motilal Oswal Capital Markets Singapore Pte Limited: Anosh Koppikar Kadambari Balachandran Email:[email protected] Email : [email protected] Contact(+65)68189232 Contact: (+65) 68189233 / 65249115 Office Address:21 (Suite 31),16 Collyer Quay,Singapore 04931
Motilal Oswal Securities Ltd
Motilal Oswal Tower, Level 9, Sayani Road, Prabhadevi, Mumbai 400 025 Phone: +91 22 3982 5500 E-mail: [email protected]