2+-based distance measurements by pulsed epr provide
TRANSCRIPT

Published online 25 February 2020 Nucleic Acids Research, 2020, Vol. 48, No. 9 e49doi: 10.1093/nar/gkaa133
Cu2+-based distance measurements by pulsed EPRprovide distance constraints for DNA backboneconformations in solutionShreya Ghosh1, Matthew J. Lawless1, Hanna J. Brubaker1, Kevin Singewald1, MichaelR. Kurpiewski2, Linda Jen-Jacobson2 and Sunil Saxena 1,*
1Department of Chemistry, University of Pittsburgh, Pittsburgh, PA 15260, USA and 2Department of BiologicalSciences, University of Pittsburgh, Pittsburgh, PA 15260, USA
Received December 16, 2019; Revised January 24, 2020; Editorial Decision February 14, 2020; Accepted February 17, 2020
ABSTRACT
Electron paramagnetic resonance (EPR) has becomean important tool to probe conformational changesin nucleic acids. An array of EPR labels for nucleicacids are available, but they often come at the cost oflong tethers, are dependent on the presence of a par-ticular nucleotide or can be placed only at the termini.Site directed incorporation of Cu2+-chelated to a lig-and, 2,2′dipicolylamine (DPA) is potentially an attrac-tive strategy for site-specific, nucleotide independentCu2+-labelling in DNA. To fully understand the poten-tial of this label, we undertook a systematic and de-tailed analysis of the Cu2+-DPA motif using EPR andmolecular dynamics (MD) simulations. We used con-tinuous wave EPR experiments to characterize Cu2+
binding to DPA as well as optimize Cu2+ loading con-ditions. We performed double electron-electron reso-nance (DEER) experiments at two frequencies to elu-cidate orientational selectivity effects. Furthermore,comparison of DEER and MD simulated distance dis-tributions reveal a remarkable agreement in the mostprobable distances. The results illustrate the effi-cacy of the Cu2+-DPA in reporting on DNA backboneconformations for sufficiently long base pair separa-tions. This labelling strategy can serve as an impor-tant tool for probing conformational changes in DNAupon interaction with other macromolecules.
INTRODUCTION
DNA dynamics is an important factor that affects numer-ous cellular processes mediated by protein–DNA interac-tions (1–5). Often, upon interaction with a protein at spe-cific sites, structural changes in the DNA such as bending,or twisting are induced within the DNA. The flexibility of
the DNAduplex and its ability to adapt its shape are crucialfor triggering countless cellular activities such as transcrip-tion (6), replication (7) and gene regulation (8). Often due tothe large size of protein–DNAcomplexes, low solubility andtimescale of conformational changes, these processes are in-accessible to NMR and crystallographic techniques. On theother hand, electron paramagnetic resonance (EPR) tech-niques have become an invaluable method to probe confor-mational changes in such cases. Particularly, when two ormore spins are present, pulsed EPR techniques can be em-ployed to obtain point-to-point distances within a macro-molecule. Such distance constraints in conjunction with theavailable structures of the macromolecule can be used tomodel the conformations of the macromolecule in the dif-ferent functional states (9–17).To implement pulsed EPR techniques for distance mea-
surements, one needs to incorporate two or more spin la-bels at specific sites in the DNA. To this end, a wide varietyof spin labels have been developed for nucleic acids (18,19).These methods include modification of the nucleobase (20–28), backbone (29–32) or terminal capping (33,34). Nitrox-ide based labels, particularly the cytidine analogue, C, (35–37) provide extremely rigid distance distributions as well asinformation on label orientation (38–40). These two piecesof information together have proven to be capable of re-porting on inherent DNA motions in even small systemssuch as the cocaine aptamer (41). Radicals, such as the tri-arylmethyl (TAM) spin label, often attached at the oligonu-cleotide termini, have been used to demonstrate distancemeasurements in nucleic acids at physiological tempera-tures (42,43). Sterically shielded nitroxide labels, introducedpost-synthetically, (32) and non-covalently bonded nitrox-ide labels, attached to an abasic site (44), that position thelabel closer to or within the helix have also been devel-oped. Chelation of paramagnetic metal ions such as Gd3+,Mn2+ or Cu2+ (45–48) has been introduced as an alterna-tive labelling methodology. Despite the success of such la-belling strategies, there is a need for labelling schemes that
*To whom correspondence should be addressed. Tel: +1412 6248680; Email: [email protected]
C© The Author(s) 2020. Published by Oxford University Press on behalf of Nucleic Acids Research.This is an Open Access article distributed under the terms of the Creative Commons Attribution Non-Commercial License(http://creativecommons.org/licenses/by-nc/4.0/), which permits non-commercial re-use, distribution, and reproduction in any medium, provided the original workis properly cited. For commercial re-use, please contact [email protected]
Dow
nloaded from https://academ
ic.oup.com/nar/article-abstract/48/9/e49/5755885 by guest on 16 M
ay 2020

e49 Nucleic Acids Research, 2020, Vol. 48, No. 9 PAGE 2 OF 11
are nucleotide independent, can be positioned anywherewithin the DNA, and are small enough to reside within thehelix.Recently, we reported a Cu2+ based labelling method
as a promising strategy to measure DNA backbone dis-tances (49). The method involves the incorporation of aCu2+-chelating ligand, a 2,2′-dipicolylamine (DPA) phos-phoramidite, at two specific sites in the DNA duplex. Thisstrategy introduces an abasic site (dSpacer) opposing theDPA in the complementary strand. While other methodsmay require specific secondary structures (45) or use labelswith elongated tethers that place the reporter on the exte-rior of the DNA (50), the DPA-DNA method is structure-independent and positions the probe in close proximityto the DNA backbone. Furthermore, the label is alsonucleotide independent and can be positioned anywherewithin the DNAmolecule. In the initial work, a most prob-able distance of 2.7 nm was measured with the Cu2+-DPAmotifs separated by 8 bp. This distance was in good agree-ment with both the distance calculated using the knownvalues of base-pair separation for a B-DNA and with cor-responding molecular dynamic simulations. This reporteddistance was resolved using a single measurement withoutthe need of any post-experiment analysis.In this work, we provide a comprehensive analysis of
the Cu2+-DPA motif. First, we performed continuous-waveEPR measurements to analyse the specificity of Cu2+ to-wards the DPAmotif and to rule out any possibility of non-specific binding elsewhere on the DNA molecule. Second,we obtained systematic distance measurements using dou-ble electron-electron resonance (DEER) technique to probethe flexibility of the Cu2+-DPA motif. These measurementswere performed at both Q-band and X-band frequenciesover several magnetic fields to probe any orientation ef-fects. Third, we performed molecular dynamics (MD) sim-ulations on an unmodified DNA sequence to provide in-sight on how the distance measured using the Cu2+-DPAmotif compares to the native DNA backbone. Finally, weused a physical model that depicts the DNA motion, toestimate the flexibility of the Cu2+-DPA label. Together,these efforts show that the Cu2+-DPA motif is a highlypromising labelling technique that can be used to probeDNA conformations without the need of any extensivemodelling.
MATERIALS AND METHODS
Oligonucleotides
Single-strand oligonucleotides containing 2,2′-dipicolylamine (DPA) were obtained from either TrilinkBiotechnologies (duplex with eight base pair separationbetween DPA sites) or ATDBio Ltd. (duplexes with 9–12bp separations). The suppliers purified the strands usinghigh performance liquid chromatography and character-ized using mass spectrometry (Supplementary Figure S1).The control unmodified DNA duplex was purchased fromIntegrated DNA Technologies (IDT).Equal amounts of complementary DNA strands were
mixed and CuCl2 were added such that there were slightlyless than stoichiometric equivalents of Cu2+ per DPA bind-ing site (∼0.94 equivalents of Cu2+ per DPA). Duplexes
were annealed in the presence of CuCl2 to ensure properformation and efficient Cu2+ chelation, using a GeneAmpPCR System 9700 with the following protocol: 90◦C for 1min, 60◦C for 3 min, 50◦C for 4 min, 40◦C for 4 min, 30◦Cfor 5 min and then progressively cooled to 4◦C. All duplexeswere subjected to this annealing procedure. After anneal-ing, the concentration of each duplex was again determinedspectrophotometrically using absorptivity coefficients cal-culated by nearest neighbour methods (51–53). Additionaldetails are provided in the Supplementary Information.
EPR measurements
All EPR experiments were performed on either a BrukerElexSys E580 or ElexSys E680 CW/FT spectrometerequipped with a Bruker ER4118X-MD5 or BrukerER4118X-MD4 resonator for X-band frequencies, re-spectively and Bruker ER5106-QT2 resonator for Q-bandfrequencies. The E680 spectrometer is also equipped witha 300 W amplifier. Experiments were performed at eitherX-band (∼9.68 GHz) or Q-band (∼35 GHz) frequencies.Experiments were performed at either 20 or 80 K.X-band samples had a DNA duplex concentration rang-
ing between 150 and 200 �M, with a total sample volumeof 120 �l. Q-band sample had a DNA duplex concentra-tion of 80 �M, with a total sample volume of 50 �l. Allsamples were prepared in 50 mM NEM buffer. The pH ofthe sample was 7.4 and 20% (v/v) glycerol was included asa cryoprotectant.All continuous wave (CW) EPR data were acquired at 80
K. Experiments were performed at a center field of 3100G with a sweep width of 2000 G for a total of 1024 datapoints. The data was collected using a modulation ampli-tude of 4 G, a modulation frequency of 100 kHz and a con-version time of 20.48 ms. The spectra were simulated usingthe EasySpin software (54).Double electron-electron resonance (DEER) spec-
troscopy experiments were performed using the four pulsesequence (�/2)�1 – �1 – (�)�1 – �1+T – (�)�2 – �2-T –(�)�1 – �2 – echo (55). A 16-step phase cycling was used.For X-bandDEER experiments, the observer pulse lengths,(�/2)�1 and (�)�1, were 16 and 32 ns respectively whilethe pump pulse length, (�)�2, was 16 ns. The delay, T, wasincremented using step sizes that varied from 8 up to 28ns, depending on the DPA base pair separation. The pumpfrequency was placed at the maximum of the echo detectedfield swept spectrum, and the observer frequency was offset100 MHz downfield. To probe orientational selectivityeffects at X-band, we also performed DEER experimentswith the pump frequency placed at the field correspondingto the g‖ region and the observer frequency was offset by100 MHz upfield. For Q-band DEER experiments, theobserver pulse lengths, (�/2)�1 and (�)�1 were 14 and 28ns respectively and the pump pulse, (�)�2 was 32 ns. Theobserver frequency was set 100 MHz higher in frequencythan the pump. The delay, T, was incremented with a stepsize of 24 ns. DEER spectra were acquired from 11220 G to11820 G at eight different magnetic field values. All DEERdata were collected at 20 K. All DEER data were analysedusing DeerAnalysis2018 (56).
Dow
nloaded from https://academ
ic.oup.com/nar/article-abstract/48/9/e49/5755885 by guest on 16 M
ay 2020

PAGE 3 OF 11 Nucleic Acids Research, 2020, Vol. 48, No. 9 e49
Figure 1. (A) Structures of the Cu2+ incorporated DPA phosphoramidite and the dSpacer. (B) Sequences of the control DNA and the DPA-DNA duplexeswith different base pair separation, n.
Molecular dynamics simulations
Molecular dynamics (MD) simulations on the DNA duplexwere performed using the AMBER parmbsc1 (bsc1) (57)force field. The Nucleic Acid Builder (NAB) module in theAMBER suite (58) was used to construct the B-DNA he-lix. The DNA duplex was then solvated in an explicit 12 ATIP3P water box (59) and neutralized with Na+ and Cl−ions. All simulations were performed using the pmemd pro-gram in the AMBER16 software package. The system wasoptimized, thermalized and pre-equilibrated for 2 ns beforebeing set up for the unrestrained productionMD run of 100ns at 298.15 K. Periodic boundary conditions along withparticle mesh ewald (PME) (60) were applied to account forlong-range electrostatic interactions underNPT (P= 1 atm)conditions. SHAKE (61) on bonds involving hydrogens wasused in conjunction with an integration step of 2 fs. A non-bonded cut-off of 10 A was applied. All visualizations forsimulations were done on VMD (62). From the MD trajec-tories, distances were measured between the two C4′ as wellas the two C3′ carbon atoms of the nucleotides that werereplaced by DPA in the experiment.
RESULTS AND DISCUSSION
In this work, we examined five DPA-DNA duplexes. Thestructures of Cu2+-DPA and dSpacer and the sequences ofthe DNA duplexes are shown in Figure 1. Each DNA du-plex has two DPA phosphoramidites incorporated withinthe helix, one on each strand. A dSpacer (tetrahydrofuranylresiduemimicking the sugar phosphate backbone without abase) opposes the DPA on the complementary strand. Theseparation of the DPAmotifs is monotonically increased ineach DNA duplex by increasing the base pair separation(n) between them. All DNA constructs are heteroduplexesformed from single strandswith non-palindromic sequences
to prevent the chance of base-pairing within the sameDNAstrand.Results have been previously reported for a 15-nucleotide
DNA duplex with a base pair separation, n of 8 (49), be-tween theDPA sites. In the n= 8 duplex, as shown in Figure1B, the Cu2+-binding site was flanked by only three bases.Because of the occurrence of slight unwinding at the endsof DNA duplexes, such unwinding proximal to the DPA-motif can increase the distribution of distances reported bythe DPA-motif. In this paper, the DPA motifs are flankedby at least 6 bp, thus reducing influence from terminal un-winding. Circular dichroism measurements of DPA–DNAandmelting temperatures have previously shown that incor-poration of the DPAmotif inside the DNA duplex does notperturb the native helical structure of the DNA, nor doesit influence the helical stability (49). Thus, the Cu2+-DPAmotif is suitable for probing intra-DNA distances.
Characterization of Cu2+ bound to DPA-DNA
To promote full solvent accessibility of the Cu2+ ion tothe DPA chelating site, we annealed the individual strandsof the DNA in the presence of Cu2+. The temperature ofthe samples was raised to 95◦C and incrementally broughtdown to 4◦C as described in the Experimental section. Cu2+
shows high binding affinity to a DPA ligand with an appar-ent association constant, Ka of (5.0 ± 2.0) × 106 M−1 inNEM buffer at pH of 7.4 (63). On the other hand, Cu2+
also shows affinity towards native DNA with a Ka of 2.4 ×10⁴ M−1 (64) and particularly to the purine bases adenineand guanine, with a Ka of 1.7 × 10³ M−1 (49,65). We, there-fore, added a slightly sub-stoichiometric equivalent of Cu2+
(∼0.94 equivalents of Cu2+ per DPA) to maximize loadingof the DPA sites without causing non-specific binding else-where.To verify that Cu2+ binds specifically toDPA,we first per-
formed CW EPR experiments on a Cu2+-DPA-DNA du-
Dow
nloaded from https://academ
ic.oup.com/nar/article-abstract/48/9/e49/5755885 by guest on 16 M
ay 2020
e49 Nucleic Acids Research, 2020, Vol. 48, No. 9 PAGE 4 OF 11
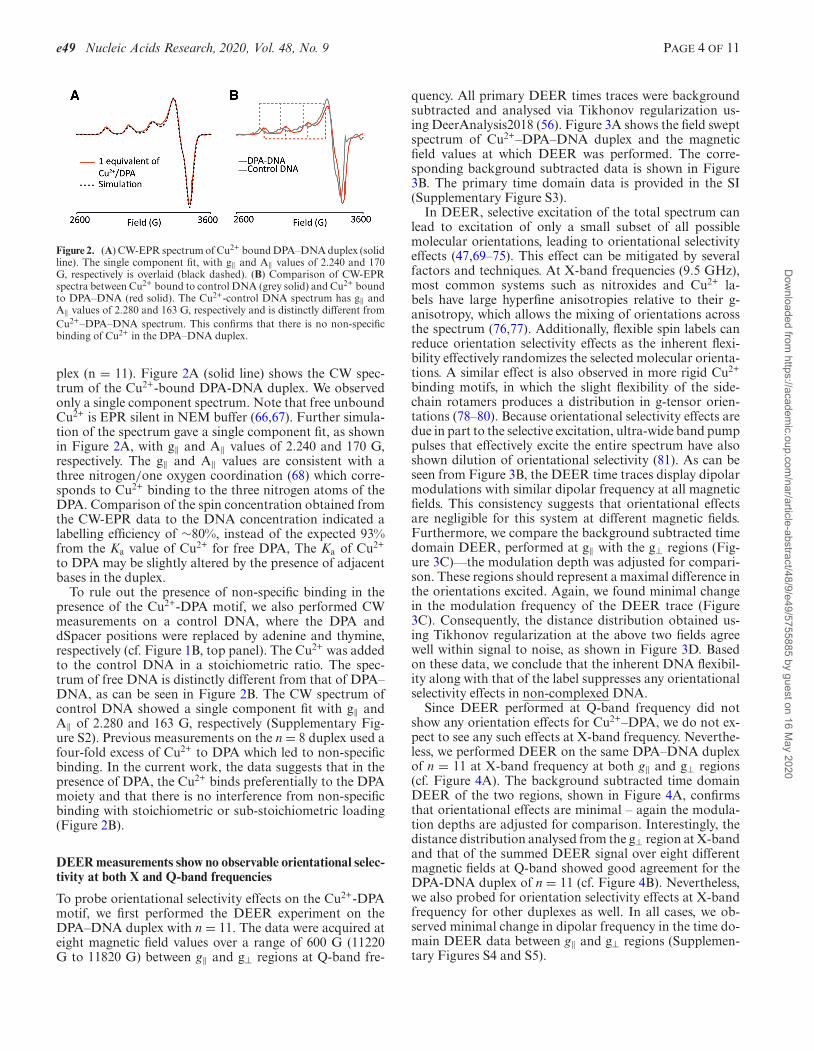
Figure 2. (A) CW-EPR spectrumofCu2+ boundDPA–DNAduplex (solidline). The single component fit, with g‖ and A‖ values of 2.240 and 170G, respectively is overlaid (black dashed). (B) Comparison of CW-EPRspectra between Cu2+ bound to control DNA (grey solid) and Cu2+ boundto DPA–DNA (red solid). The Cu2+-control DNA spectrum has g‖ andA‖ values of 2.280 and 163 G, respectively and is distinctly different fromCu2+–DPA–DNA spectrum. This confirms that there is no non-specificbinding of Cu2+ in the DPA–DNA duplex.
plex (n = 11). Figure 2A (solid line) shows the CW spec-trum of the Cu2+-bound DPA-DNA duplex. We observedonly a single component spectrum. Note that free unboundCu2+ is EPR silent in NEM buffer (66,67). Further simula-tion of the spectrum gave a single component fit, as shownin Figure 2A, with g‖ and A‖ values of 2.240 and 170 G,respectively. The g‖ and A‖ values are consistent with athree nitrogen/one oxygen coordination (68) which corre-sponds to Cu2+ binding to the three nitrogen atoms of theDPA. Comparison of the spin concentration obtained fromthe CW-EPR data to the DNA concentration indicated alabelling efficiency of ∼80%, instead of the expected 93%from the Ka value of Cu2+ for free DPA, The Ka of Cu2+
to DPA may be slightly altered by the presence of adjacentbases in the duplex.To rule out the presence of non-specific binding in the
presence of the Cu2+-DPA motif, we also performed CWmeasurements on a control DNA, where the DPA anddSpacer positions were replaced by adenine and thymine,respectively (cf. Figure 1B, top panel). The Cu2+ was addedto the control DNA in a stoichiometric ratio. The spec-trum of free DNA is distinctly different from that of DPA–DNA, as can be seen in Figure 2B. The CW spectrum ofcontrol DNA showed a single component fit with g‖ andA‖ of 2.280 and 163 G, respectively (Supplementary Fig-ure S2). Previous measurements on the n = 8 duplex used afour-fold excess of Cu2+ to DPA which led to non-specificbinding. In the current work, the data suggests that in thepresence of DPA, the Cu2+ binds preferentially to the DPAmoiety and that there is no interference from non-specificbinding with stoichiometric or sub-stoichiometric loading(Figure 2B).
DEERmeasurements show no observable orientational selec-tivity at both X and Q-band frequencies
To probe orientational selectivity effects on the Cu2+-DPAmotif, we first performed the DEER experiment on theDPA–DNA duplex with n = 11. The data were acquired ateight magnetic field values over a range of 600 G (11220G to 11820 G) between g‖ and g⊥ regions at Q-band fre-
quency. All primary DEER times traces were backgroundsubtracted and analysed via Tikhonov regularization us-ing DeerAnalysis2018 (56). Figure 3A shows the field sweptspectrum of Cu2+–DPA–DNA duplex and the magneticfield values at which DEER was performed. The corre-sponding background subtracted data is shown in Figure3B. The primary time domain data is provided in the SI(Supplementary Figure S3).In DEER, selective excitation of the total spectrum can
lead to excitation of only a small subset of all possiblemolecular orientations, leading to orientational selectivityeffects (47,69–75). This effect can be mitigated by severalfactors and techniques. At X-band frequencies (9.5 GHz),most common systems such as nitroxides and Cu2+ la-bels have large hyperfine anisotropies relative to their g-anisotropy, which allows the mixing of orientations acrossthe spectrum (76,77). Additionally, flexible spin labels canreduce orientation selectivity effects as the inherent flexi-bility effectively randomizes the selected molecular orienta-tions. A similar effect is also observed in more rigid Cu2+
binding motifs, in which the slight flexibility of the side-chain rotamers produces a distribution in g-tensor orien-tations (78–80). Because orientational selectivity effects aredue in part to the selective excitation, ultra-wide band pumppulses that effectively excite the entire spectrum have alsoshown dilution of orientational selectivity (81). As can beseen from Figure 3B, the DEER time traces display dipolarmodulations with similar dipolar frequency at all magneticfields. This consistency suggests that orientational effectsare negligible for this system at different magnetic fields.Furthermore, we compare the background subtracted timedomain DEER, performed at g‖ with the g⊥ regions (Fig-ure 3C)––the modulation depth was adjusted for compari-son. These regions should represent a maximal difference inthe orientations excited. Again, we found minimal changein the modulation frequency of the DEER trace (Figure3C). Consequently, the distance distribution obtained us-ing Tikhonov regularization at the above two fields agreewell within signal to noise, as shown in Figure 3D. Basedon these data, we conclude that the inherent DNA flexibil-ity along with that of the label suppresses any orientationalselectivity effects in non-complexed DNA.Since DEER performed at Q-band frequency did not
show any orientation effects for Cu2+–DPA, we do not ex-pect to see any such effects at X-band frequency. Neverthe-less, we performed DEER on the same DPA–DNA duplexof n = 11 at X-band frequency at both g‖ and g⊥ regions(cf. Figure 4A). The background subtracted time domainDEER of the two regions, shown in Figure 4A, confirmsthat orientational effects are minimal – again the modula-tion depths are adjusted for comparison. Interestingly, thedistance distribution analysed from the g⊥ region at X-bandand that of the summed DEER signal over eight differentmagnetic fields at Q-band showed good agreement for theDPA-DNA duplex of n = 11 (cf. Figure 4B). Nevertheless,we also probed for orientation selectivity effects at X-bandfrequency for other duplexes as well. In all cases, we ob-served minimal change in dipolar frequency in the time do-main DEER data between g‖ and g⊥ regions (Supplemen-tary Figures S4 and S5).
Dow
nloaded from https://academ
ic.oup.com/nar/article-abstract/48/9/e49/5755885 by guest on 16 M
ay 2020

PAGE 5 OF 11 Nucleic Acids Research, 2020, Vol. 48, No. 9 e49
Figure 3. (A) Field-swept electron spin echo spectrum of Cu2+-DPA–DNA (n = 11) at Q-band frequency. The lines show the different magnetic fields atwhich DEER was performed. (B) Background subtracted time domain DEER signals at the different magnetic fields. The y-axis has been offset for easeof visualization. The data show minimal difference in dipolar frequency at the different fields. (C) Background subtracted time domain data at g‖ (dashed,11220 G) and g⊥ (solid, 11820 G) regions. These two regions also do not show any distinct difference in modulation frequency, suggesting Cu2+–DPAshows minimal orientational effects. (D) Distance distribution obtained via Tikhonov regularization, for both g‖ (dashed, 11220 G) and g⊥ (solid, 11820G) regions. The similarity in the distributions further confirms that Cu2+–DPA is not orientation selective for non-complexed DNA.
Figure 4. (A) Background subtracted time domainDEER signal of Cu2+–DPA–DNA (n = 11) at X-band frequency at g‖ (grey) and g⊥ (black) re-gions. The field corresponding to the g‖ and g⊥ regions are shown in thefield-swept electron spin echo spectrum in the inset. There is no distinguish-able difference in the dipolar frequency between the two data. (B) Distancedistributions obtained as a sum of DEER time traces collected at differ-ent fields, ranging from g‖ and g⊥ regions at Q-band frequency (dashedred) and at g⊥ region at X-band frequency (solid black). Both distribu-tions, analysed via Tikhonov regularization, show similar most probabledistance and width.
DEER measurements using Cu2+-DPA motif can probe theDNA backbone
Finally, to determine if the labelling strategy can accuratelyreport on changes in distance upon incrementing base-pairseparation, we performed DEER measurements at X-bandfrequency. Figure 5 shows theDEERdata acquired at g⊥ onthe duplexes with n ranging from 9 to 12. The data at g‖ isshown in SI for all duplexes (Supplementary Figures S4 andS5). Importantly, the absence of orientation effects was ob-served for all the five different spin-label positions. DEERmeasurement performed on duplex n = 8 has been previ-ously reported (49) and are also used in the following dis-cussion. The corresponding Pake patterns, clearly show thatas the distance increases with n, the dipolar frequency of the
modulation gradually decreases as is expected (cf. Figure5C).We analysed the time domainDEER data with Tikhonov
regularization to obtain distance distributions (Figure 6A,Supplementary Figure S6). We observed an increase in themost probable distance as the base pair separation increasesfrom 8 to 12. Furthermore, we plotted the most probabledistance against the base pair separation and observed alinear trend for a y-intercept of 0 (Figure 6B). The slopeof the fit equals 0.35 nm which is in good agreement withthe ∼0.34 nm separation between adjacent bases for an ide-alized B-DNA (82). The data (Figure 6B) show that our ex-perimental technique reports accurately on B-DNA doublehelix length over the range of 8–12 bp and discerns differ-ences in length as small as one base pair.
MDsimulations show good agreement with themost probabledistance from DEER
Next, we performedMDsimulations on the control unmod-ifiedDNA (cf. Figure 1B) in order to compare themeasureddistances to native backbone conformations. We created aDNA duplex with the same sequence as the control DNA,where the DPA and dSpacer positions are replaced by ade-nine and thymine, respectively. For running MD simula-tions, we chose the newerAMBERparmbsc1 force field as ithas previously shown good agreement to EPR experimen-tal results obtained on doubly spin labelled DNA (40,44).We generated 100 ns of unrestrainedMD trajectories of theDNA duplex (Supplementary Figure S7). From the MDsimulation we extracted backbone distance distributions tocompare with our experimental results.
Dow
nloaded from https://academ
ic.oup.com/nar/article-abstract/48/9/e49/5755885 by guest on 16 M
ay 2020

e49 Nucleic Acids Research, 2020, Vol. 48, No. 9 PAGE 6 OF 11
Figure 5. (A) Background subtracted time domain DEER data of the DPA-DNA duplexes ranging from n= 8 to 12 base pairs. The modulation frequencyincreases as the base pair separation increases. The y-axis has been offset for ease of visualization. (B) Duplexes showing the Cu2+-DPA and dSpacerpositions for varying n. (C) Pake pattern for duplexes n= 8 to 12. The characteristic peak, corresponding to the perpendicular orientation, shows a gradualshift to a lower frequency as n increases.
Figure 6. (A) Area-normalized distance distributions obtained for duplexes n= 8 to 12 via Tikhonov regularization. The distributions show an increase inthe most probable distance with increasing n. (B) Plot of most probable distance versus base pair separation, n. On fitting to a linear trend with a y-interceptof 0, we obtained a slope of 0.35 nm with an error of 0.003 nm. The slope is in reasonable agreement with the reported base pair separation for a B-DNA.
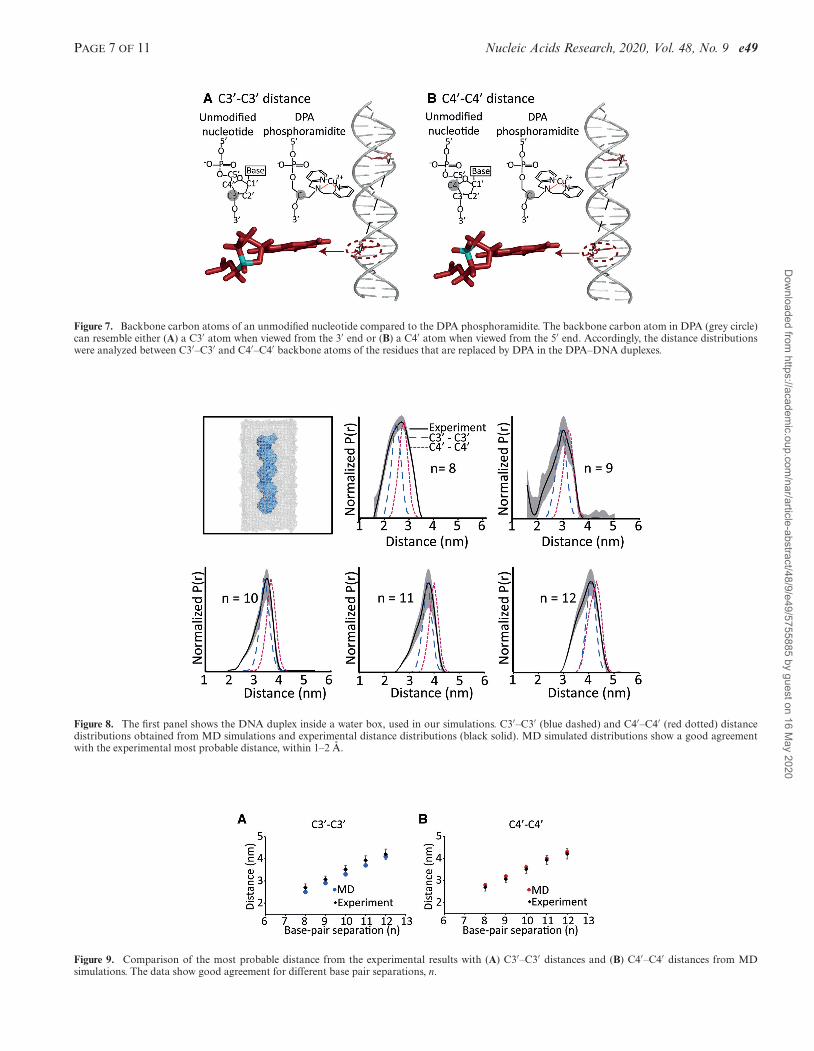
First, we determined which backbone atoms of the un-modified DNA most nearly correspond to the distance re-ported by the Cu2+-DPA label. We compared the structureof unmodified DNA to that of Cu2+–DPA–DNA with an11-bp separation (Figure 7A). The backbone carbon atomof the DPA motif is represented inside the grey circle. Thisparticular atom forms the pivotal point in the phospho-ramidite to which the DPA is attached. When comparingwith a normal nucleotide, we considered two possibilities:(a) when viewed from the 3′ end, the DPA backbone carbonatom resembles a C3′ atom in a normal nucleotide (Figure7A); (b) when viewed from the 5′ end, the same backboneatom of DPA resembles a C4′ atom of a normal nucleotide(Figure 7B). Therefore, when evaluating the distance distri-butions from the MD trajectories, we considered both C3′–C3′ and C4′–C4′ distances between the suitable bases.Figure 8 shows the MD and experimental distance dis-
tributions. The most probable distance between the experi-ment and the simulations showed a reasonable agreementwithin 1–2 A, for all the duplexes. These results are fur-ther illustrated in Figure 9. The remarkable agreement inthe most probable distances strongly supports the fact thatthe Cu2+–DPA motif is present within the DNA helix. Theagreement also confirms that the incorporation ofDPA intothe DNA does not perturb the native DNA structure. It fol-lows that the Cu2+–DPA motif is an accurate reporter ofpoint-to-point distances in the DNA backbone without re-quiring any additional modelling.
Despite the coincidence ofmost probable distance values,a discrepancy exists between the widths of the experimen-tal and MD simulated distance distributions (cf. Figure 8).Clearly, the experimental distance distributions are broader.There are three possible explanations, which are not mutu-ally exclusive. First, the DPA moiety itself has some inher-ent conformational flexibility, which adds to the distribu-tion width. Second, the MD simulations used unmodifiedDNA. It is possible that the absence of interstrand hydro-gen bonding at theDPA sites of themodifiedDNAallow ac-cess to additional conformational fluctuations that are notaccessible in the unmodifiedDNA. Third, the DNA in solu-tion may experience conformational fluctuations on a time-scale much slower than the 100 ns of the MD simulation;these cannot be captured in short simulations.
DNA breathing model to estimate label flexibility
In order to estimate the flexibility of the Cu2+–DPA label,we modelled the twist-stretch motion of the DNA duplex,taking into account the label length and flexibility. Previouswork has shown that the twist-stretchmodel is in agreementwith DEER data on DNA obtained by using the rigid cy-tidine analogue nitroxide spin label (39). Here, we adopteda similar approach but specific to our Cu2+-DPA label (de-tails are provided in Supplementary Information). One ofthe parameters that we need to account for is the length ofthe probe from theDNAbackbone.Accordingly, we created
Dow
nloaded from https://academ
ic.oup.com/nar/article-abstract/48/9/e49/5755885 by guest on 16 M
ay 2020
PAGE 7 OF 11 Nucleic Acids Research, 2020, Vol. 48, No. 9 e49
Figure 7. Backbone carbon atoms of an unmodified nucleotide compared to the DPA phosphoramidite. The backbone carbon atom in DPA (grey circle)can resemble either (A) a C3′ atom when viewed from the 3′ end or (B) a C4′ atom when viewed from the 5′ end. Accordingly, the distance distributionswere analyzed between C3′–C3′ and C4′–C4′ backbone atoms of the residues that are replaced by DPA in the DPA–DNA duplexes.
Figure 8. The first panel shows the DNA duplex inside a water box, used in our simulations. C3′–C3′ (blue dashed) and C4′–C4′ (red dotted) distancedistributions obtained from MD simulations and experimental distance distributions (black solid). MD simulated distributions show a good agreementwith the experimental most probable distance, within 1–2 A.
Figure 9. Comparison of the most probable distance from the experimental results with (A) C3′–C3′ distances and (B) C4′–C4′ distances from MDsimulations. The data show good agreement for different base pair separations, n.
Dow
nloaded from https://academ
ic.oup.com/nar/article-abstract/48/9/e49/5755885 by guest on 16 M
ay 2020

e49 Nucleic Acids Research, 2020, Vol. 48, No. 9 PAGE 8 OF 11
Figure 10. (A) Plot of most probable distance versus base pair separation for the geometric model of DNA’s twist-stretch motion (blue) and experiment(orange). The results agree within the error of the experiment. (B) Plot of standard deviation versus base pair separation for model (blue) and experimentalresults (orange). The model considers an additional ∼1.6 A flexibility of the Cu2+-DPA label and agrees with the experimental results.
an in-silico model of the Cu2+-DPA incorporated DNA du-plex and estimated the label length to be 3.3 A (Supplemen-tary Figure S8). The DNA twist-stretch motion is best rep-resented by two individual components: an axial distance,along the axis of the DNA helix and a transverse distance,in the plane perpendicular to the helical axis of the DNA(39,83) (Supplementary Figures S9 and S10). Furthermore,along with the reported standard deviation for a B-DNA(39), we added an additional flexibility corresponding to thespin label to best fit the experimental results, as has beenpreviously done (39) (details are provided in SI).Figure 10A shows the comparison of the most proba-
ble distance of the modelled data with the experimental re-sults for n ranging from 9 to 12. The DNA duplex withn = 8 was not included in the comparison since the ab-sence of sufficient flanking sequences on either side of thelabel leads to additional flexibility of the label. The re-sults agree well within the error of the experiment. Suchanalysis allows for a conceptual understanding of the ob-servations. The Cu2+–DPA spin label is relatively smallin size compared to other traditional labels. In addition,the Cu2+–DPA labels point inwards into the helix in bothstrands and therefore the offset due to linker length ismuch reduced. Additionally, the contribution of the dis-tance along the DNA helical axis is much more dominantthan the radial offset of the Cu2+. Thus, overall, the effectof the offset of Cu2+ becomes small for basepair separationsgreater than 4. Quantitative comparisons and analysis ofthe most probable distances obtained from the twist-stretchmodel and in-silicomodelling for both the native DNA andCu2+–DPA–DNAare shown in Supplementary Figures S11and S12.Finally, we calculated the standard deviations of our ex-
perimental results (Supplementary Figures S13 and S14)and compared to that obtained from themodel, as shown inFigure 10B. The experimental data agree with the model foran additional spin label flexibility of ∼1.6 A. Interestingly,the most rigid nitroxide labels, such as the cytidine ana-logue, has been reported to have a flexibility of 1 angstrom(39). Note, that these comparisons are a rough estimation ofthe label flexibility since they consider only the twist-stretchmotion (39). However, there may be an additional influenceof DNA bending (40) which has not been taken into ac-count. Nevertheless, these results indicate that the flexibil-ity of the Cu2+–DPA is only slightly higher than the mostrigid nitroxide labels. Overall, this additional flexibility ofthe Cu2+−DPA also explains the broader distance distribu-
tions obtained in our experiments versus MD (cf. Figures 8and 10).More precise information on the label flexibility can also
be obtained by elucidating the rotameric preferences of thelabel (84–88). Such analysis would require the knowledgeof force field parameters of the Cu2+–DPA label which is animportant future direction.Finally, in order to examine how the DNA backbone
and Cu2+–Cu2+ distances compare for a bent or kinkedDNA, we performed in-silico modelling on several bentDNA structures. We incorporated the Cu2+–DPA labelswith base-pair separations of 9–12 as described in Supple-mentary Figure S15. Interestingly, the Cu2+–DPA distancesis within 2–3 A of the backbone distances. Such agreementhighlights the usefulness of the short linker and the orien-tation of the Cu2+–DPA label.
CONCLUSION
Herein, we provide a comprehensive analysis of the Cu2+–DPA motif as a promising spin label for DNA. We haveshown that Cu2+ specifically binds to the DPA motif intheDNAduplex, eliminating any non-specific binding. Dis-tance distributions of several DPA–DNAduplexes andMDsimulations illustrate that the motif is capable of reportingon DNA backbone conformations in solution, without theneed for extensive modelling. Moreover, distance measure-ments on the Cu2+–DPAmotif in the non-complexed DNAdoes not show orientation effects for any base-pair separa-tion between the motifs. The methodology has the resolu-tion to detect differences in DNA length as small as onebase pair. These results also support the fact that the mo-tif is small, is present inside the helix and does not perturbthe native structure of DNA. Comparison of experimentaldistance distributions with those calculated from the geo-metric model of DNA shows that the Cu2+-DPA is onlyslightly more flexible than the most rigid nitroxide labelsavailable for DNA. Notably, the spin labelling technique isnucleotide independent, which allows the incorporation ofthe label at any position. Such Cu2+-based labelling strategycan be combined with nitroxide labelling of proteins in or-der to measure multiple structural constraints in a protein–DNA complex. The ability of the Cu2+-DPA motif to ac-curately report on DNA backbone conformation will serveas an essential tool for probing backbone fluctuations andshape adaptations (e.g. bending or unwinding) as the DNA
Dow
nloaded from https://academ
ic.oup.com/nar/article-abstract/48/9/e49/5755885 by guest on 16 M
ay 2020

PAGE 9 OF 11 Nucleic Acids Research, 2020, Vol. 48, No. 9 e49
interacts with various proteins to execute biological func-tions.
SUPPLEMENTARY DATA
Supplementary Data are available at NAR Online.
ACKNOWLEDGEMENTS
We thank Dr Jessica Sarver and Anthony Bogetti for theuseful discussions onMD simulations. All simulations werecarried out at the University of Pittsburgh’s Center for Re-search Computing.
FUNDING
National Science Foundation [NSF MCB-1613007], US-Israel Binational Science Foundation [BSF 2018029] ; theEPR spectrometer was purchased though funds from theNational Science Foundation [NSF MRI-1725678]; S.G.thanks the University of Pittsburgh for the AndrewMellonPredoctoral Fellowship. Funding for open access charge:startup funds from the University of Pittsburgh.Conflict of interest statement.None declared.
REFERENCES1. Parker,S.C., Hansen,L., Abaan,H.O., Tullius,T.D. and
Margulies,E.H. (2009) Local DNA topography correlates withfunctional noncoding regions of the human genome. Science, 324,389–392.
2. Rohs,R., West,S.M., Sosinsky,A., Liu,P., Mann,R.S. and Honig,B.(2009) The role of DNA shape in protein-DNA recognition. Nature,461, 1248–1253.
3. Harteis,S. and Schneider,S. (2014) Making the bend: DNA tertiarystructure and protein-DNA interactions. Int. J. Mol. Sci., 15,12335–12363.
4. Reginsson,G.W., Shelke,S.A., Rouillon,C., White,M.F.,Sigurdsson,S.T. and Schiemann,O. (2013) Protein-induced changes inDNA structure and dynamics observed with noncovalentsite-directed spin labeling and PELDOR. Nucleic Acids Res., 41, e11.
5. Krumkacheva,O.A., Shevelev,G.Y., Lomzov,A.A., Dyrkheeva,N.S.,Kuzhelev,A.A., Koval,V.V., Tormyshev,V.M., Polienko,Y.F.,Fedin,M.V., Pyshnyi,D.V. et al. (2019) DNA complexes with humanapurinic/apyrimidinic endonuclease 1: structural insights revealed bypulsed dipolar EPR with orthogonal spin labeling. Nucleic Acids Res.,47, 7767–7780.
6. Dickerson,R.E. (1992) DNA structure from A to Z.Methods Enzym.,211, 67–111.
7. Hwang,D.S. and Kornberg,A. (1992) Opening of the replicationorigin of Escherichia coli by DnaA protein with protein HU or IHF.J. Biol. Chem., 267, 23083–23086.
8. Kitayner,M., Rozenberg,H., Rohs,R., Suad,O., Rabinovich,D.,Honig,B. and Shakked,Z. (2010) Diversity in DNA recognition byp53 revealed by crystal structures with Hoogsteen base pairs. Nat.Struct. Mol. Biol., 17, 423–429.
9. Chuo,S.W., Wang,L.P., Britt,R.D. and Goodin,D.B. (2019) Anintermediate conformational state of cytochrome P450cam-CN incomplex with Putidaredoxin. Biochemistry, 58, 2353–2361.
10. Park,S.Y., Borbat,P.P., Gonzalez-Bonet,G., Bhatnagar,J.,Pollard,A.M., Freed,J.H., Bilwes,A.M. and Crane,B.R. (2006)Reconstruction of the chemotaxis receptor-kinase assembly. Nat.Struct. Mol. Biol., 13, 400–407.
11. Borbat,P.P. and Freed,J.H. (2007) Measuring distances by pulseddipolar ESR spectroscopy: spin-labeled histidine kinases.MethodsEnzymol., 423, 52–116.
12. Evans,E.G.B., Pushie,M.J., Markham,K.A., Lee,H.-W. andMillhauser,G.L. (2016) Interaction between prion protein’scopper-bound octarepeat domain and a charged C-terminal pocket
suggests a mechanism for N-Terminal regulation. Structure, 24,1057–1067.
13. Ceccon,A., Schmidt,T., Tugarinov,V., Kotler,S.A., Schwieters,C.D.and Clore,G.M. (2018) Interaction of Huntingtin exon-1 peptideswith lipid-based micellar nanoparticles probed by solution NMR andQ-band pulsed EPR. J. Am. Chem. Soc., 140, 6199–6202.
14. Boura,E., Rozycki,B., Herrick,D.Z., Chung,H.S., Vecer,J.,Eaton,W.A., Cafiso,D.S., Hummer,G. and Hurley,J.H. (2011)Solution structure of the ESCRT-I complex by smallangle X-rayscattering, EPR, and FRET spectroscopy. Proc. Natl. Acad. Sci.U.S.A., 108, 9437–9442.
15. Duss,O., Yulikov,M., Jeschke,G. and Allain,F.H.T. (2014) EPR-aidedapproach for solution structure determination of large RNAs orprotein–RNA complexes. Nat. Commun., 5, 3669.
16. Nicklisch,S.C.T., Wunnicke,D., Borovykh,I. V., Morbach,S.,Klare,J.P., Steinhoff,H.J. and Kramer,R. (2012) Conformationalchanges of the betaine transporter BetP from Corynebacteriumglutamicum studied by pulse EPR spectroscopy. Biochim. Biophys.Acta - Biomembr., 1818, 359–366.
17. Sameach,H., Ghosh,S., Gevorkyan-Airapetov,L., Saxena,S. andRuthstein,S. (2019) EPR spectroscopy detects various active stateconformations of the transcriptional regulator CueR. Angew. Chem.Int. Ed., 58, 3053.
18. Shelke,S.A. and Sigurdsson,S.T. (2012) Site-directed spin labelling ofnucleic acids. Eur. J. Org. Chem., 2012, 2291–2301.
19. Shelke,S.A. and Sigurdsson,S.T. (2016) Site-directed spin labeling forEPR studies of nucleic acids. In:Modified Nucleic Acids. Springer,Vol. 31, pp. 159–187.
20. Schiemann,O., Piton,N., Y.,M., Stock,G., W.,E.J., Prisner,T.F.,Schiemann,Olav, Piton,Nelly, Mu,Yuguang, Stock,Gerhard et al.(2003) A PELDOR-based nanometer distance ruler foroligonucleotides. J. Am. Chem. Soc., 126, 5722–5729.
21. Sicoli,G., Wachowius,F., Bennati,M. and Hobartner,C. (2010)Probing secondary structures of spin-labeled RNA by pulsed EPRspectroscopy. Angew. Chem. Int. Ed., 49, 6443–6447.
22. Babaylova,E.S., Ivanov,A.V., Malygin,A.A., Vorobjeva,M.A.,Venyaminova,A.G., Polienko,Y.F., Kirilyuk,I.A., Krumkacheva,O.A.,Fedin,M.V., Karpova,G.G. et al. (2014) A versatile approach forsite-directed spin labeling and structural EPR studies of RNAs. Org.Biomol. Chem., 12, 3129–3136.
23. Saha,S., Jagtap,A.P. and Sigurdsson,S.T. (2015) Site-directed spinlabeling of 2′-amino groups in RNA with isoindoline nitroxides thatare resistant to reduction. Chem. Commun., 51, 13142–13145.
24. Erlenbach,N., Endeward,B., Schops,P., Gophane,D.B.,Sigurdsson,S.T. and Prisner,T.F. (2016) Flexibilities ofisoindoline-derived spin labels for nucleic acids by orientationselective PELDOR. Phys. Chem. Chem. Phys., 18, 16196–16201.
25. Halbmair,K., Seikowski,J., Tkach,I., Hobartner,C., Sezer,D. andBennati,M. (2016) High-resolution measurement of long-rangedistances in RNA: pulse EPR spectroscopy with TEMPO-labelednucleotides. Chem. Sci., 7, 3172–3180.
26. Frolow,O., Endeward,B., Schiemann,O., Prisner,T.F. and Engels,J.W.(2008) Nitroxide spin labeled RNA for long range distancemeasurements by EPR-PELDOR. Nucleic Acids Symp. Ser., 52,153–154.
27. Kerzhner,M., Abdullin,D., Wiecek,J., Matsuoka,H., Hagelueken,G.,Schiemann,O., Famulok,M., Wiecek,J., Matsuoka,H., Hagelueken,G.et al. (2016) Post-synthetic spin-labeling of RNA through clickchemistry for PELDOR measurements. Chem. Eur. J., 22,12113–12121.
28. Cai,Q., Kusnetzow,A.K., Hubbell,W.L., Haworth,I.S., Gacho,G.P.C.,Van Eps,N., Hideg,K., Chambers,E.J. and Qin,P.Z. (2006)Site-directed spin labeling measurements of nanometer distances innucleic acids using a sequence-independent nitroxide probe. NucleicAcids Res., 34, 4722–4730.
29. Nguyan,P.H., Popova,A., Hideg,K. and Qin,P.Z. (2016) Anucleotide-independent cyclic nitroxide label for monitoringsegmental motions in nucleic acids. BMC Biophys., 8, 6–14.
30. Popova,A.M., Kalai,T., Hideg,K. and Qin,P.Z. (2009) Site-specificDNA structural and dynamic features revealed bynucleotide-independent nitroxide probes. Biochemistry, 48,8540–8550.
31. Qin,P.Z., Haworth,I.S., Cai,Q., Kusnetzow,A.K., Grant,G.P.G.,Price,E.A., Sowa,G.Z., Popova,A., Herreros,B. and He,H. (2007)
Dow
nloaded from https://academ
ic.oup.com/nar/article-abstract/48/9/e49/5755885 by guest on 16 M
ay 2020

e49 Nucleic Acids Research, 2020, Vol. 48, No. 9 PAGE 10 OF 11
Measuring nanometer distances in nucleic acids using asequence-independent nitroxide probe. Nat. Protoc., 2, 2354–2365.
32. Haugland,M.M., El-Sagheer,A.H., Porter,R.J., Pena,J., Brown,T.,Anderson,E.A. and Lovett,J.E. (2016) 2′-Alkynylnucleotides: asequence- and spin label-flexible strategy for EPR spectroscopy inDNA. J. Am. Chem. Soc., 138, 9069–9072.
33. Fedin,M. V., Shevelev,G.Y., Pyshnyi,D. V., Tormyshev,V.M.,Jeschke,G., Yulikov,M. and Bagryanskaya,E.G. (2016) Interaction oftriarylmethyl radicals with DNA termini revealed byorientation-selective W-band double electron–electron resonancespectroscopy. Phys. Chem. Chem. Phys., 18, 29549–29554.
34. Shevelev,G.Y., Krumkacheva,O., Lomzov,A.A., Kuzhelev,A.A.,Trukhin,D.V., Rogozhnikova,O.Y., Tormyshev,V.M., Pyshnyi,D.V.,Fedin,M.V. and Bagryanskaya,E.G. (2015) Triarylmethyl labels:Toward improving the accuracy of EPR nanoscale distancemeasurements in DNAs. J. Phys. Chem. B, 119, 13641–13648.
35. Barhate,N., Cekan,P., Massey,A.P. and Sigurdsson,S.T. (2007) Anucleoside that contains a rigid nitroxide spin label: a fluorophore indisguise. Angew. Chem. Int. Ed., 46, 2655–2658.
36. Cekan,P. and Sigurdsson,S.T. (2012) Conformation and dynamics ofnucleotides in bulges and symmetric internal loops in duplex DNAstudied by EPR and fluorescence spectroscopies. Biochem. Biophys.Res. Commun., 420, 656–661.
37. Cekan,P., Smith,A.L., Barhate,N., Robinson,B.H. andSigurdsson,S.T. (2008) Rigid spin-labeled nucleoside C: anonperturbing EPR probe of nucleic acid conformation. NucleicAcids Res., 36, 5946–5954.
38. Edwards,T.E., Cekan,P., Reginsson,G.W., Shelke,S.A.,Ferre-D’Amare,A.R., Schiemann,O. and Sigurdsson,S.T. (2011)Crystal structure of a DNA containing the planar,phenoxazine-derived bi-functional spectroscopic probe C. NucleicAcids Res., 39, 4419–4426.
39. Marko,A., Denysenkov,V., Margraf,D., Cekan,P., Schiemann,O.,Sigurdsson,S.T. and Prisner,T.F. (2011) Conformational flexibility ofDNA. J. Am. Chem. Soc., 133, 13375–13379.
40. Stelzl,L.S., Erlenbach,N., Heinz,M., Prisner,T.F. and Hummer,G.(2017) Resolving the conformational dynamics of DNA withangstrom resolution by PELDOR and molecular dynamics. J. Am.Chem. Soc., 139, 11674–11677.
41. Grytz,C.M., Marko,A., Cekan,P., Sigurdsson,S.T. and Prisner,T.F.(2016) Flexibility and conformation of the cocaine aptamer studiedby PELDOR. Phys. Chem. Chem. Phys., 18, 2993–3002.
42. Shevelev,G.Y., Krumkacheva,O.A., Lomzov,A.A., Kuzhelev,A.A.,Rogozhnikova,O.Y., Trukhin,D. V., Troitskaya,T.I., Tormyshev,V.M.,Fedin,M. V., Pyshnyi,D. V. et al. (2014) Physiological-Temperaturedistance measurement in nucleic acid using triarylmethyl-based spinlabels and pulsed dipolar EPR spectroscopy. J. Am. Chem. Soc., 136,9874–9877.
43. Kuzhelev,A.A., Krumkacheva,O.A., Shevelev,G.Y., Yulikov,M.,Fedin,M. V. and Bagryanskaya,E.G. (2018) Room-temperaturedistance measurements using RIDME and the orthogonal spin labelstrityl/nitroxide. Phys. Chem. Chem. Phys., 20, 10224–10230.
44. Heinz,M., Erlenbach,N., Stelzl,L.S., Thierolf,G., Kamble,N.R.,Sigurdsson,S.T.H., Prisner,T.F. and Hummer,G. (2020)High-resolution EPR distance measurements on RNA and DNAwith the non-covalent G spin label. Nucleic Acids Res., 48, 924–933.
45. Donohue,M.P. and Szalai,V.A. (2016) Distance measurementsbetween paramagnetic ligands bound to parallel stranded guaninequadruplexes. Phys. Chem. Chem. Phys., 18, 15447–15455.
46. Wojciechowski,F., Gross,A., Holder,I.T., Knorr,L., Drescher,M.,Hartig,J.S., Groß,A., Holder,I.T., Knorr,L., Drescher,M. et al. (2015)Pulsed EPR spectroscopy distance measurements of DNA internallylabelled with Gd3+-DOTA. Chem. Comm., 51, 13850–13853.
47. Engelhard,D.M., Meyer,A., Berndhauser,A., Schiemann,O. andClever,G.H. (2018) Di-copper(ii) DNA G-quadruplexes as EPRdistance rulers. Chem. Commun., 54, 7455–7458.
48. Song,Y., Meade,T.J., Astashkin,A.V., Klein,E.L., Enemark,J.H. andRaitsimring,A. (2011) Pulsed dipolar spectroscopy distancemeasurements in biomacromolecules labeled with Gd(III) markers. J.Magn. Reson., 210, 59–68.
49. Lawless,M.J., Sarver,J. and Saxena,S. (2017) Nucleotide-independentcopper(II)-based distance measurements in DNA by pulsed ESRspectroscopy. Angew. Chem. Int. Ed., 56, 2115–2117.
50. Gophane,D.B., Endeward,B., Prisner,T.F. and Sigurdsson,S.T. (2014)Conformationally restricted isoindoline-derived spin labels in duplexDNA: Distances and rotational flexibility by pulsed electron-electrondouble resonance spectroscopy. Chem. - A Eur. J., 20, 15913–15919.
51. Cantor,C.R. and Tinoco,I. (1967) Calculated optical properties of 64trinucleoside diphosphates. Biopolymers, 5, 821–835.
52. Richards,E.G. (1975) Use of tables in calculation of absorption,optical rotatory dispersion and circular dichroism ofpolyribonucleotides.Handb. Biochem. Mol. Biol. 3rd Edn., 1, 596–603.
53. Senior,M., Jones,R.A. and Breslauer,K.J. (1988) Influence ofdangling thymidine residues on the stability and structure of twoDNA duplexes. Biochemistry, 27, 3879–3885.
54. Stoll,S. and Schweiger,A. (2006) EasySpin, a comprehensive softwarepackage for spectral simulation and analysis in EPR. J. Magn. Reson.,178, 42–55.
55. Pannier,M., Veit,S., Godt,A., Jeschke,G. and Spiess,H.W. (2000)Dead-Time free measurement of Dipole-Dipole interactions betweenelectron Spins. J. Magn. Res., 142, 331–340.
56. Jeschke,G., Chechik,V., Ionita,P., Godt,A., Zimmermann,H.,Banham,J., Timmel,C.R., Hilger,D. and Jung,H. (2006)DeerAnalysis2006 - a comprehensive software package for analyzingpulsed ELDOR data. Appl. Magn. Reson., 30, 473–498.
57. Ivani,I., Dans,P.D., Noy,A., Perez,A., Faustino,I., Hospital,A.,Walther,J., Andrio,P., Goni,R., Balaceanu,A. et al. (2016) Parmbsc1:a refined force field for DNA simulations. Nat. Methods, 13, 55–58.
58. Case,D.A., Cheatham,T.E. III, Darden,T., Gohlke,H., Luo,R.,Merz,K.M. Jr, Onufriev,A., Simmerling,C., Wang,B. and Woods,R.J.(2005) The Amber biomolecular simulation programs. J. Comput.Chem., 26, 1668–1688.
59. Jorgensen,W.L., Chandrasekhar,J., Madura,J.D., Impey,R.W. andKlein,M.L. (1983) Comparison of simple potential functions forsimulating liquid water. J. Chem. Phys., 79, 926–935.
60. Darden,T., York,D. and Pedersen,L. (1993) Particle mesh Ewald: anN ·log(N) method for Ewald sums in large systems. J. Chem. Phys.,98, 10089–10092.
61. Ryckaert,J.P., Ciccotti,G. and Berendsen,H.J. (1977) Numericalintegration of the cartesian equations of motion of a system withconstraints: molecular dynamics of n-alkanes. J. Comput. Phys., 23,327–341.
62. Humphrey,W., Dalke,A. and Schulten,K. (1996) VMD: visualmolecular dynamics. J. Mol. Graph., 14, 33–38.
63. Aldakheel,F. (2017) Toward improving metalloenzyme inhibitordesign: a thermodynamic study of small molecule interactions withcopper(II), cobalt(II) and manganese(II). Coll. Sci. Heal. ThesesDiss., 248.
64. Zhou,W., Saran,R. and Liu,J. (2017) Metal sensing by DNA. Chem.Rev., 117, 8272–8325.
65. Izatt,R.M., Christensen,J.J. and Rytting,J.H. (1971) Sites andthermodynamic quantities associated with proton and metal ioninteraction with ribonucleic acid, deoxyribonucleic acid, and theirconstituent bases, nucleosides, and and nucleotides. Chem. Rev., 71,439–481.
66. Syme,C.D., Nadal,R.C., Rigby,S.E.J. and Viles,J.H. (2004) Copperbinding to the Amyloid-B (AB) peptide associated with Alzheimer’sdisease. J. Biol. Chem., 279, 18169–18177.
67. Silva,K.I. and Saxena,S. (2013) Zn(II) ions substantially perturbCu(II) ion coordination in amyloid-� at physiological pH. J. Phys.Chem. B, 117, 9386–9394.
68. Peisach,J. and Blumberg,W.E. (1974) Structural implications derivedfrom the analysis of electron paramagnetic resonance spectra ofnatural and artificial copper proteins. Arch. Biochem. Biophys., 165,691–708.
69. Gamble Jarvi,A., Ranguelova,K., Ghosh,S., Weber,R.T. andSaxena,S. (2018) On the use of Q-Band double Electron–Electronresonance to resolve the relative orientations of two doubleHistidine-Bound Cu2+ Ions in a Protein. J. Phys. Chem. B, 122,10669–10677.
70. Bowen,A.M., Jones,M.W., Lovett,J.E., Gaule,T.G., McPherson,M.J.,Dilworth,J.R., Timmel,C.R. and Harmer,J.R. (2016) Exploitingorientation-selective DEER: determining molecular structure insystems containing Cu (II) centres. Phys. Chem. Chem. Phys., 18,5981–5994.
71. Abe,C., Klose,D., Dietrich,F., Ziegler,W.H., Polyhach,Y., Jeschke,G.and Steinhoff,H.J. (2012) Orientation selective DEER measurements
Dow
nloaded from https://academ
ic.oup.com/nar/article-abstract/48/9/e49/5755885 by guest on 16 M
ay 2020

PAGE 11 OF 11 Nucleic Acids Research, 2020, Vol. 48, No. 9 e49
on vinculin tail at X-band frequencies reveal spin label orientations. J.Magn. Reson., 216, 53–61.
72. Schiemann,O., Cekan,P., Margraf,D., Prisner,T.F. andSigurdsson,S.T. (2009) Relative orientation of rigid nitroxides byPELDOR: Beyond distance measurements in nucleic acids. Angew.Chemie Int. Ed., 48, 3292–3295.
73. Bode,B.E., Plackmeyer,J., Prisner,T.F. and Schiemann,O. (2008)PELDOR measurements on a nitroxide-labeled Cu(II) porphyrin:orientation selection, spin-density distribution, and conformationalflexibility. J. Phys. Chem. A, 112, 5064–5073.
74. Denysenkov,V.P., Prisner,T.F., Stubbe,J. and Bennati,M. (2006)High-field pulsed electron-electron double resonance spectroscopy todetermine the orientation of the tyrosyl radicals in ribonucleotidereductase. Proc. Natl. Acad. Sci. U.S.A., 103, 13386–13390.
75. Yang,Z., Ji,M. and Saxena,S. (2010) Practical aspects of copperion-based double electron electron resonance distance measurements.Appl. Magn. Reson., 39, 487–500.
76. Ji,M., Ruthstein,S. and Saxena,S. (2014) Paramagnetic metal ions inpulsed ESR distance distribution measurements. Acc. Chem. Res., 47,688–695.
77. Sarver,J., Silva,K.I. and Saxena,S. (2013) Measuring Cu2+-nitroxidedistances using double electron-electron resonance and saturationrecovery. Appl. Magn. Reson., 44, 583–594.
78. Yang,Z., Kise,D. and Saxena,S. (2010) An approach towards themeasurement of nanometer range distance based on Cu2+ ions andESR. J. Phys. Chem. B, 114, 6165–6174.
79. Gamble Jarvi,A., Cunningham,T.F. and Saxena,S. (2019) Efficientlocalization of a native metal ion within a protein by Cu2+ -basedEPR distance measurements. Phys. Chem. Chem. Phys., 21,10238–10243.
80. Cunningham,T.F., Putterman,M.R., Desai,A., Horne,W.S. andSaxena,S. (2015) The double-histidine Cu2+-binding motif: a highlyrigid, Site-Specific spin probe for electron spin resonance distancemeasurements. Angew. Chem. Int. Ed., 54, 6330–6334.
81. Breitgoff,F.D., Keller,K., Qi,M., Klose,D., Yulikov,M., Godt,A. andJeschke,G. (2019) UWB DEER and RIDME distance measurementsin Cu(II)–Cu(II) spin pairs. J. Magn. Reson., 308, 106560.
82. Olson,W.K., Gorin,A.A., Lu,X.J., Hock,L.M. and Zhurkin,V.B.(1998) DNA sequence-dependent deformability deduced fromprotein-DNA crystal complexes. Proc. Natl. Acad. Sci. U.S.A., 95,11163–11168.
83. Mathew-Fenn,R.S., Das,R. and Harbury,P.A.B. (2008) Remeasuringthe double helix. Science, 322, 446–449.
84. Polyhach,Y., Bordignon,E. and Jeschke,G. (2011) Rotamer librariesof spin labeled cysteines for protein studies. Phys. Chem. Chem. Phys.,13, 2356–2366.
85. Jeschke,G. (2018) MMM: a toolbox for integrative structuremodeling. Protein Sci., 27, 76–85.
86. Hagelueken,G., Ward,R., Naismith,J.H. and Schiemann,O. (2012)MtsslWizard: in silico spin-labeling and generation of distancedistributions in PyMOL. Appl. Magn. Reson., 42, 377–391.
87. Hirst,S.J., Alexander,N., Mchaourab,H.S. and Meiler,J. (2011)RosettaEPR: an integrated tool for protein structure determinationfrom sparse EPR data. J. Struct. Biol., 173, 506–514.
88. Reichel,K., Stelzl,L.S., Kofinger,J. and Hummer,G. (2018) PrecisionDEER distances from spin-Label ensemble refinement. J. Phys.Chem. Lett., 9, 5748–5752.
Dow
nloaded from https://academ
ic.oup.com/nar/article-abstract/48/9/e49/5755885 by guest on 16 M
ay 2020