2 dave banks - envireau water...hand pump on borehole, mozambique photo by dave banks it needs a...
TRANSCRIPT

Borehole designGetting it right
David BanksHolymoor Consultancy Ltd
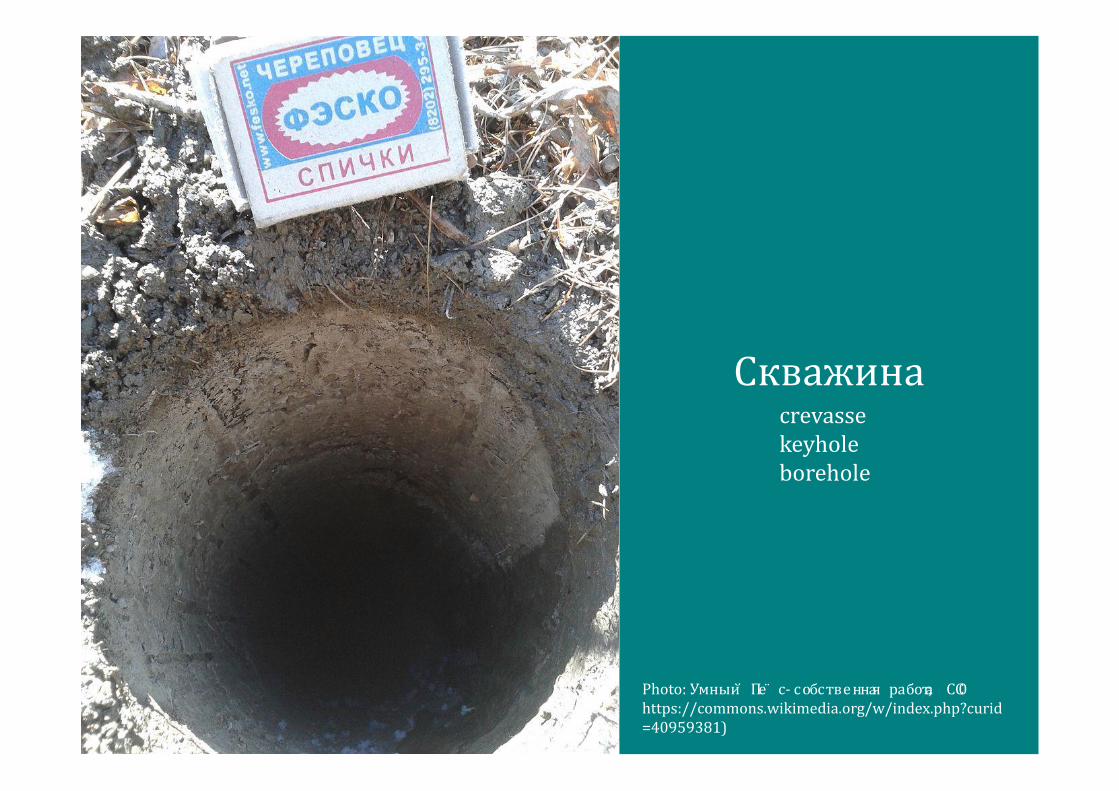
Скважина
Photo: УмныйП ёс - со бственная р бота, C 0, https://commons.wikimedia.org/w/index.php?curid=40959381)
crevassekeyholeborehole

Uses for keyholes #1
Getting a glimpse of something that’s normally hidden!
A borehole for monitoring…
• Should aim to “sample” as representative conditions as possible
• Should not have too long an open section (otherwise you end up with an “average” of the aquifer condition)
• Should be constructed of materials that are compatible with “what is to be sampled”
• Does not need a high yield or hydraulic efficiency
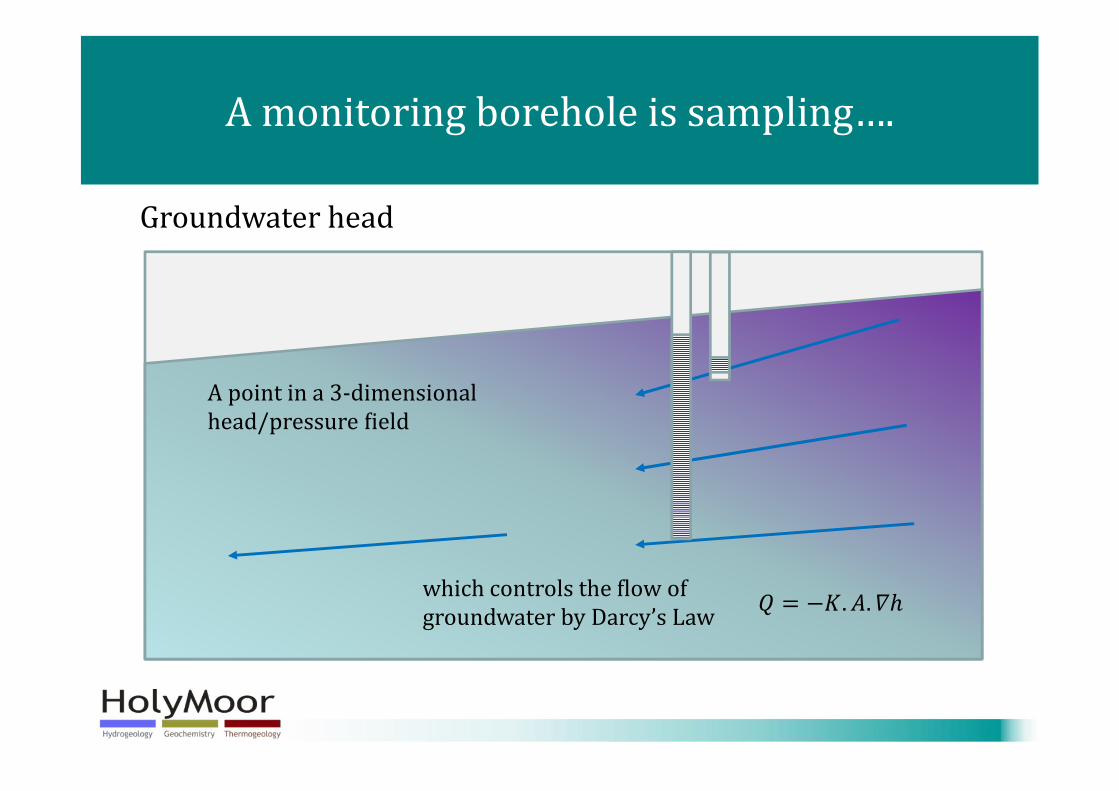
A monitoring borehole is sampling….
A point in a 3-dimensional head/pressure field
which controls the flow of groundwater by Darcy’s Law
Groundwater head

A monitoring borehole is sampling….
A point in a 3-dimensional chemical concentration field
which controls the diffusion of the chemical by Fick’s Law
Hydrochemical concentrationsChemical spill

The Third Dimension in Groundwater Monitoring
Diagram from Banks: Encyclopaedia of Life Support Systems (EOLLS): UNESCO

Placing of piezometersFrom: Misstear, Banks and Clark, “Water Wells and Boreholes”; Wiley
A: mixture of contaminated and uncontaminated water
B: uncontaminated water C: dissolved-phase contamination
D: oil-phase and dissolved-phase contamination

Uses for keyholes #2
Getting access to a resource!

Beneath our feet is an enormously valuable resource
...occasionally – it emerges from the ground by itself
Well, Siberia.photo by Dave BanksArtesian borehole: High Wycombe. Photo by D
Banks
…mostly, a well is useless without a pump!
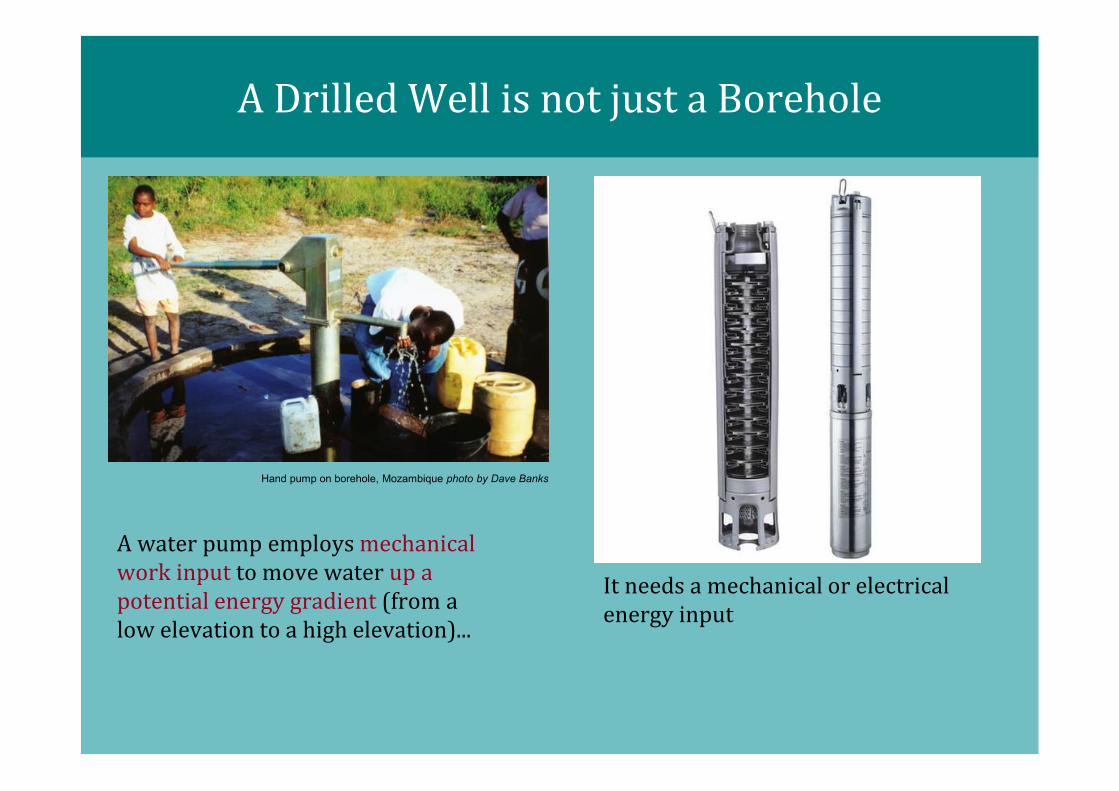
A Drilled Well is not just a Borehole
A water pump employs mechanical work input to move water up a potential energy gradient (from a low elevation to a high elevation)...
Hand pump on borehole, Mozambique photo by Dave Banks
It needs a mechanical or electrical energy input
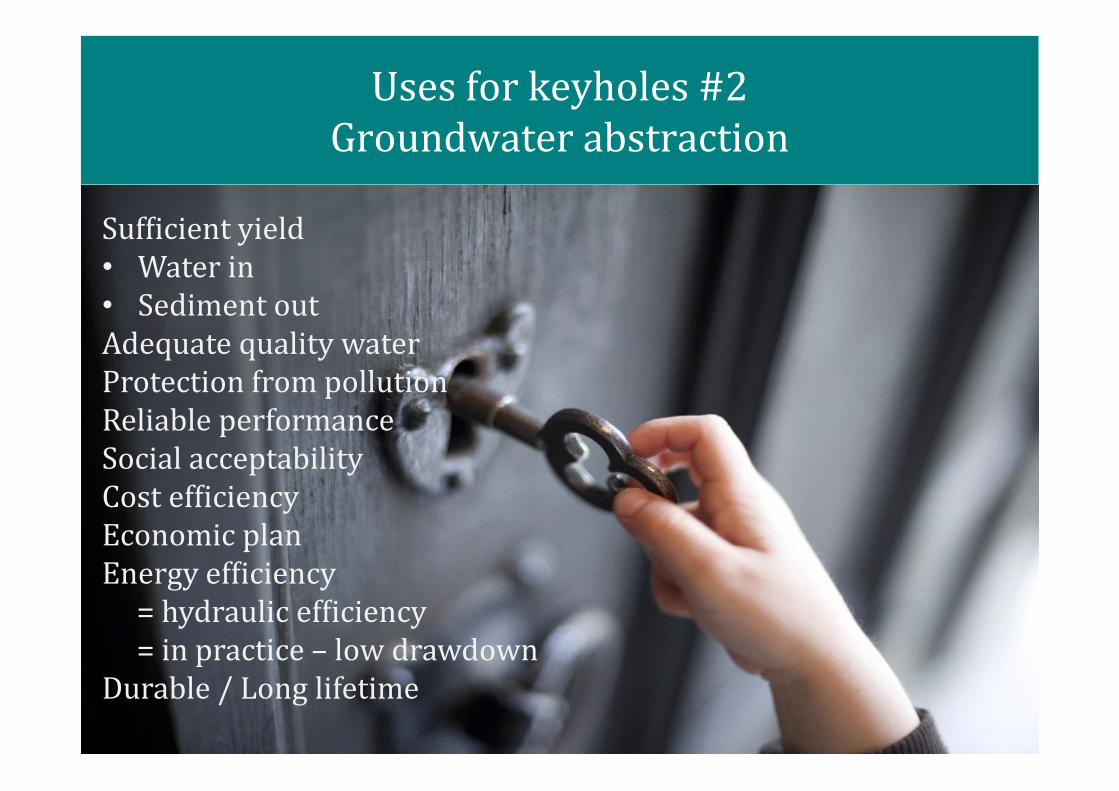
Uses for keyholes #2Groundwater abstraction
Sufficient yield• Water in• Sediment outAdequate quality waterProtection from pollutionReliable performanceSocial acceptabilityCost efficiencyEconomic planEnergy efficiency = hydraulic efficiency= in practice – low drawdown
Durable / Long lifetime

Social acceptabilityPrestige, gender, age, accessibility, safety
Zalingei, Darfur Taiba camp, Zalingei, Darfur

Social acceptabilityPrestige, gender, age, accessibility, safety
Bitale, Somalia

Economic management
Bitale borehole scheme– Human potable water free– Nomads pay to water
livestock– Income:– 1000 camels watered each
day (@ 50,000 SOS per 100) 500,000 SOS
– 4000 goats/sheep each day (@ 5000 SOS per 100) 200,000 SOS
– Total = 700,000 SOS (c.$50 USD)
– Diesel usage is 20 l/day (@ $1USD per litre) $ 20 USD
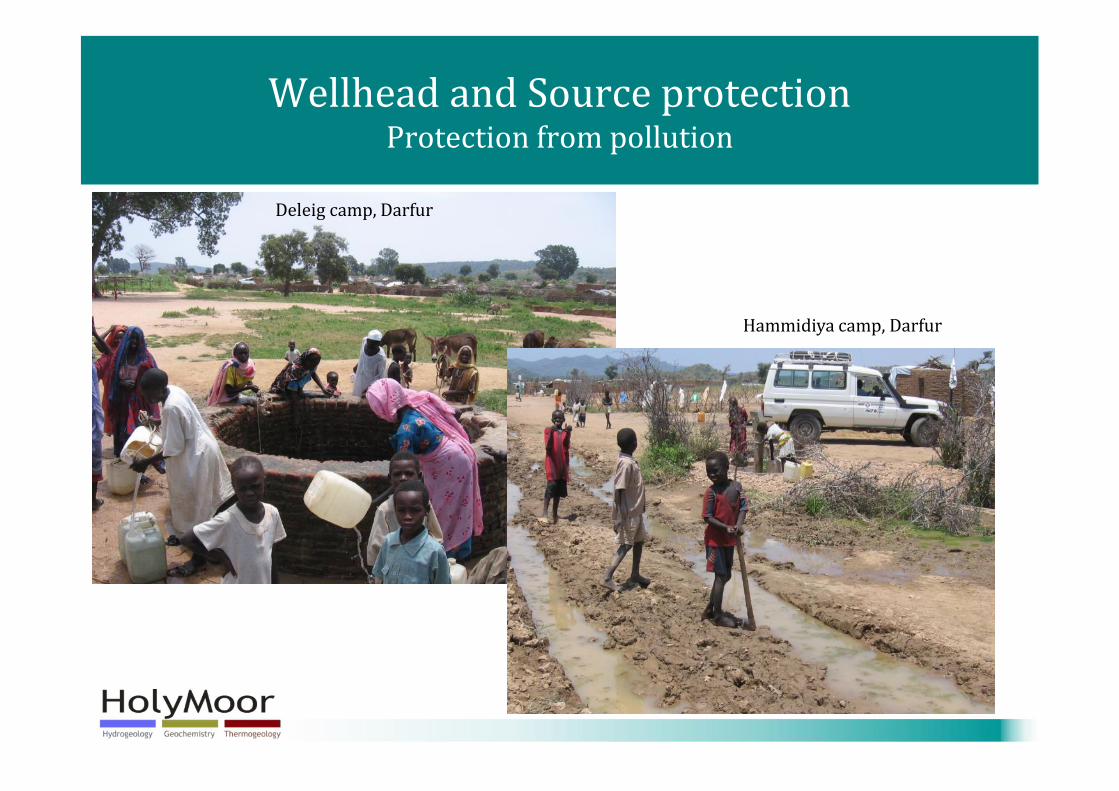
Wellhead and Source protectionProtection from pollution
Deleig camp, Darfur
Hammidiya camp, Darfur

Bacteriological non-compliance studied at 169 waterworks based on bedrock groundwater (largely untreated)
Factors• Surrounding land use (especially
agriculture and latrines)• Distance to surface water• Well head completion• Thickness of superficial deposits
(casing)• Hydrofraccing
Work by Sylvi Gaut, Geological Survey of Norway, NTNU Trondheim
Norway

Good wellhead completionAbove ground
after SEPA (2004) “Guide to Good Practice: Water Supply Borehole Location, Construction and Headworks”.
after EA (2005) “Guide to Good Practice: Water Supply Borehole Construction and Headworks: Guide
to Good Practice”.

Wellhead and Source protectionProtection from pollution
Bahn camp, Saclapea, Liberia- Tidy pipework- Concrete surround- Sealed welltop- Above ground- Away from main
contamination risks

Adequate quality water
A hierarchy of personal water needs (after Reed and Reed, 2013, How much water is needed in emergencies. Technical Notes on drinking Water, Sanitation and Hygiene in Emergencies, No. 9. Prepared for WHO by WEDC.

Borehole / well construction
• Need to let adequate yield in• Well should be hydraulically efficient• i.e. Minimum drawdown• But need to keep sediment out!
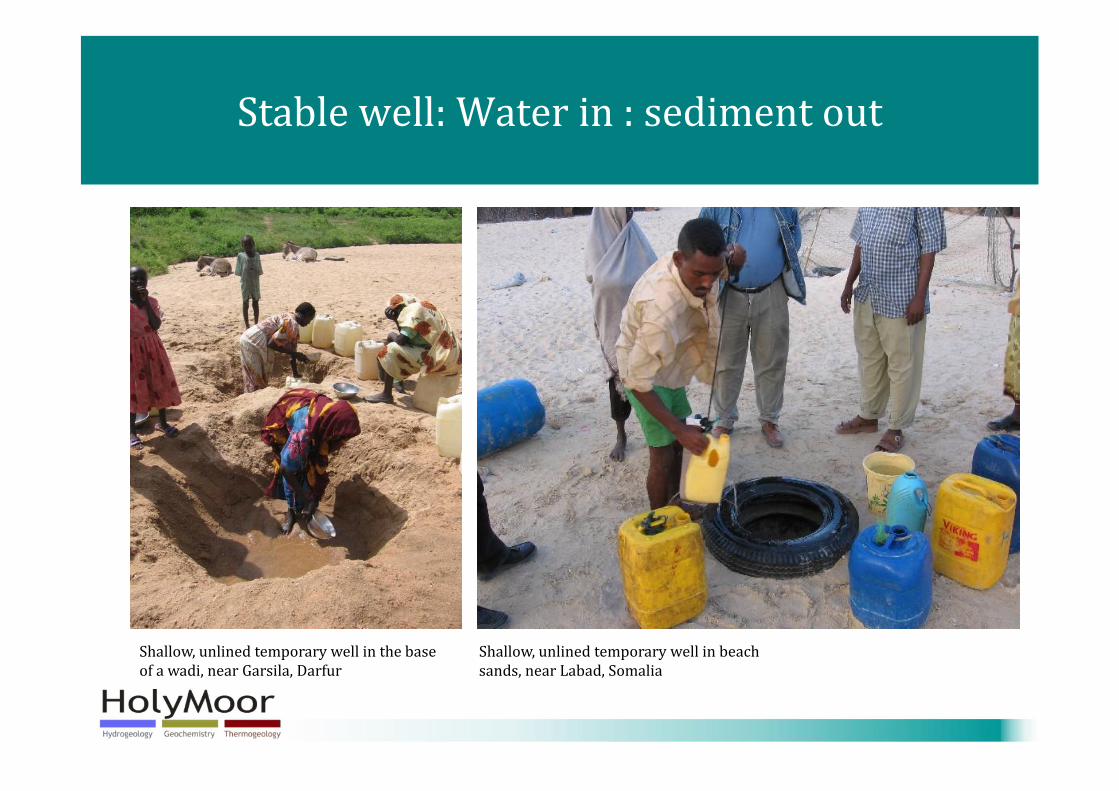
Stable well: Water in : sediment out
Shallow, unlined temporary well in the base of a wadi, near Garsila, Darfur
Shallow, unlined temporary well in beach sands, near Labad, Somalia

Shallow, timber-lined well in the base of a wadi, near Milé, had
Permanent, masonry lined well, Hamadiyacamp, Darfur

Crystalline rock aquifers
Steel casing should penetrate at least 3 m into solid bedrock
Yields typically several 100 L/hr (median = 600-700 L/hr in Scandinavia)
3-4” diameter pump typical
Thus, 5½-6” open hole diameter is typical
Borehole can be angled to allow interception of specific fracture zones
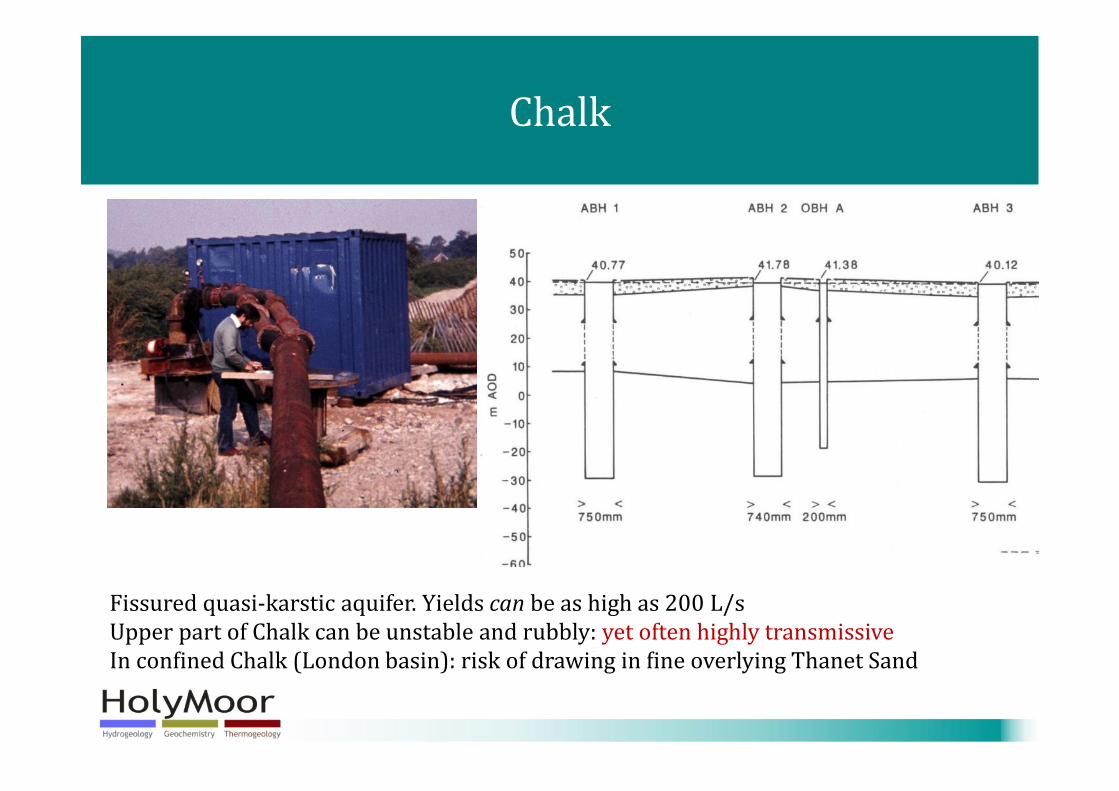
Chalk
Fissured quasi-karstic aquifer. Yields can be as high as 200 L/sUpper part of Chalk can be unstable and rubbly: yet often highly transmissiveIn confined Chalk (London basin): risk of drawing in fine overlying Thanet Sand

Confined Chalk
Made Ground / Sand and Gravel
London Clay
Lambeth Beds
Thanet Sands
CHALK
Upper fissures likely to be most transmissiveBut also highest risk of sand productionTypically case and grout to 5-7 m into Chalk…but it’s a compromise
Or use fine grained gravel packSee: Charalambous, Burnet & Jones (2013) QJEGH 46, 179-188
Water level

Intergranular / porous aquifers
• Often (depending on degree of lithification) require a screen
• Screen dimensioned according to formation grain size (and local experience)
• If very fine grained or uniform may also require a gravel pack
• Diameter of screen and casing will depend on diameter and location of the pump
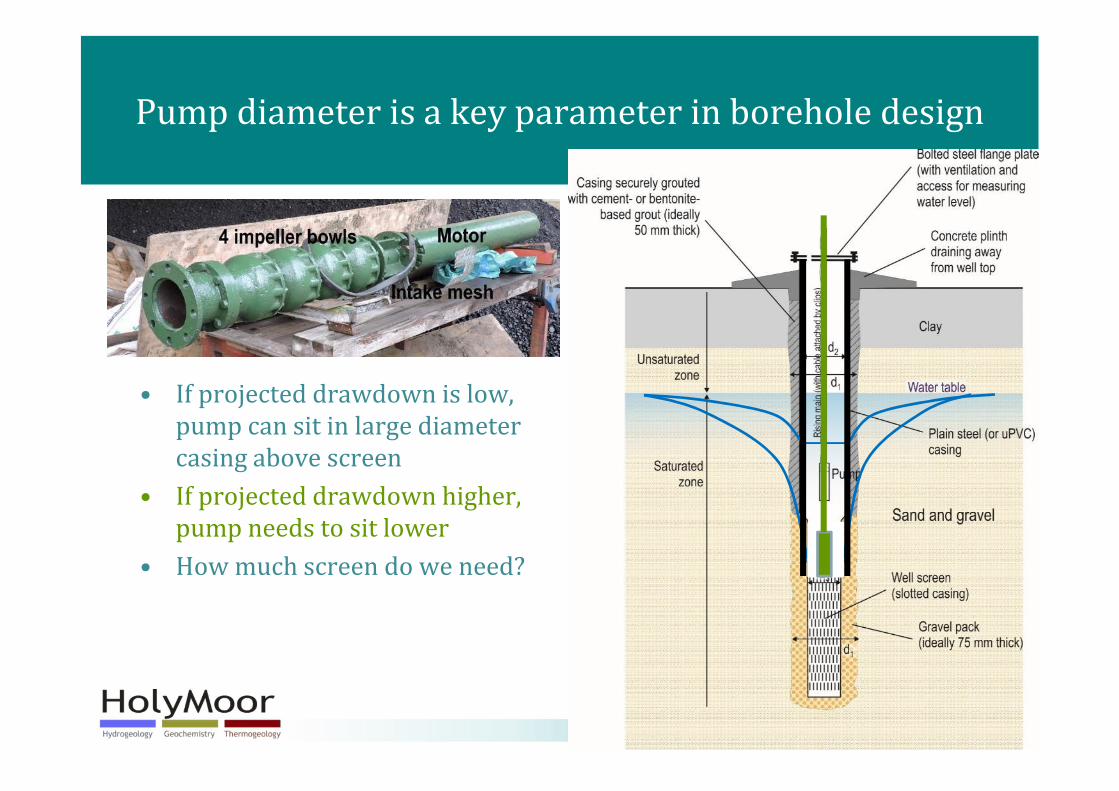
Pump diameter is a key parameter in borehole design
• If projected drawdown is low, pump can sit in large diameter casing above screen
• If projected drawdown higher, pump needs to sit lower
• How much screen do we need?
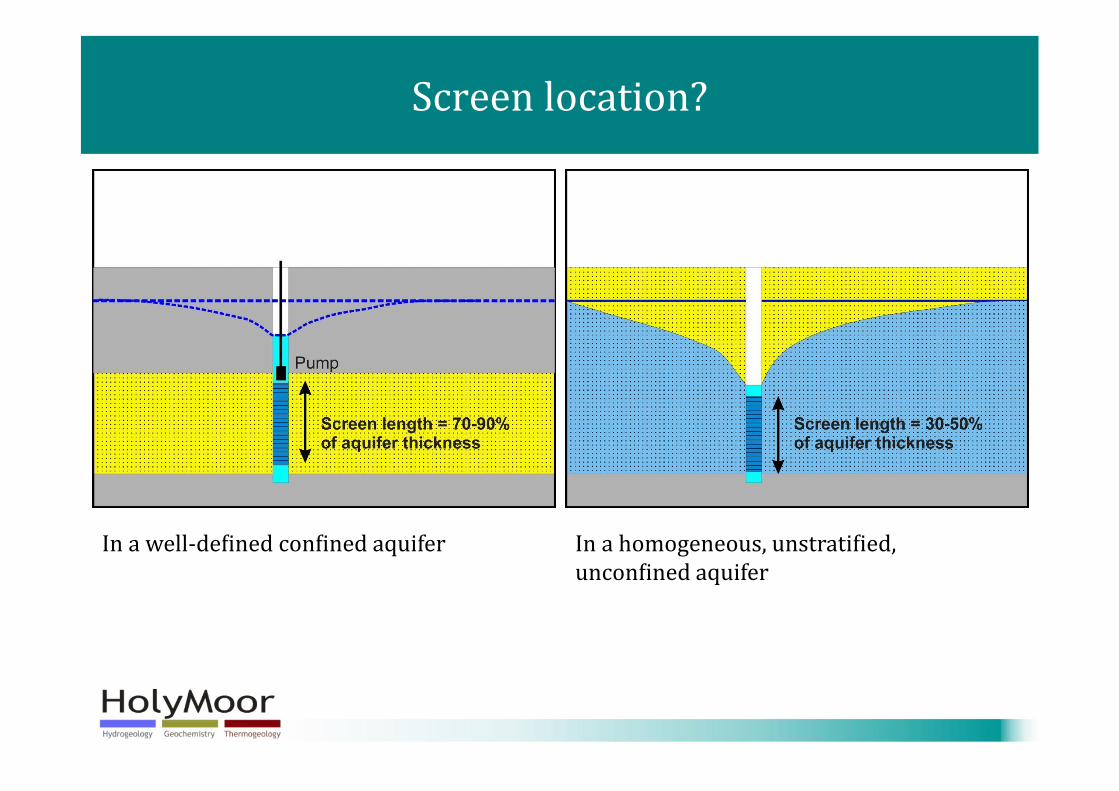
Screen location?
In a well-defined confined aquifer In a homogeneous, unstratified, unconfined aquifer

Projected drawdown (s)?
• Estimated from aquifer transmissivity (T) and pumping rate (Q)
• Logan’s approximation
s = 1.22 Q/T for ideal wellss = 2 Q/T for real, hydraulically inefficient wells

Drawdown = Energy = £ = CO2
Energy required to lift Q (L/s) water up a head difference of Δh (m)
.g– Where ρw = density of water = 1 kg/L– ε = pump efficiency (say 70% or 0.7)– g = 9.81 m/s2
If Q = 50 L/s and Δh =40 m, E = 28 kWFor a 12 hour pumping day E = 336 kWh per day= 45 GBP per day (13.5 p per kWh) = 175 kg CO2 per day

Well hydraulic efficiency
• Ohm’s Law • A groundwater well
Groundwater flow Q
Potential difference (voltage) ΔV
Electrical currentI
ResistanceR1
ResistanceR2
ΔV = I × (R1+R2)
Head difference Δh
Rbore Raquifer
Δh = Q × (Rbore+Raquifer)Raquifer is related to transmissivity.We have to live with it!
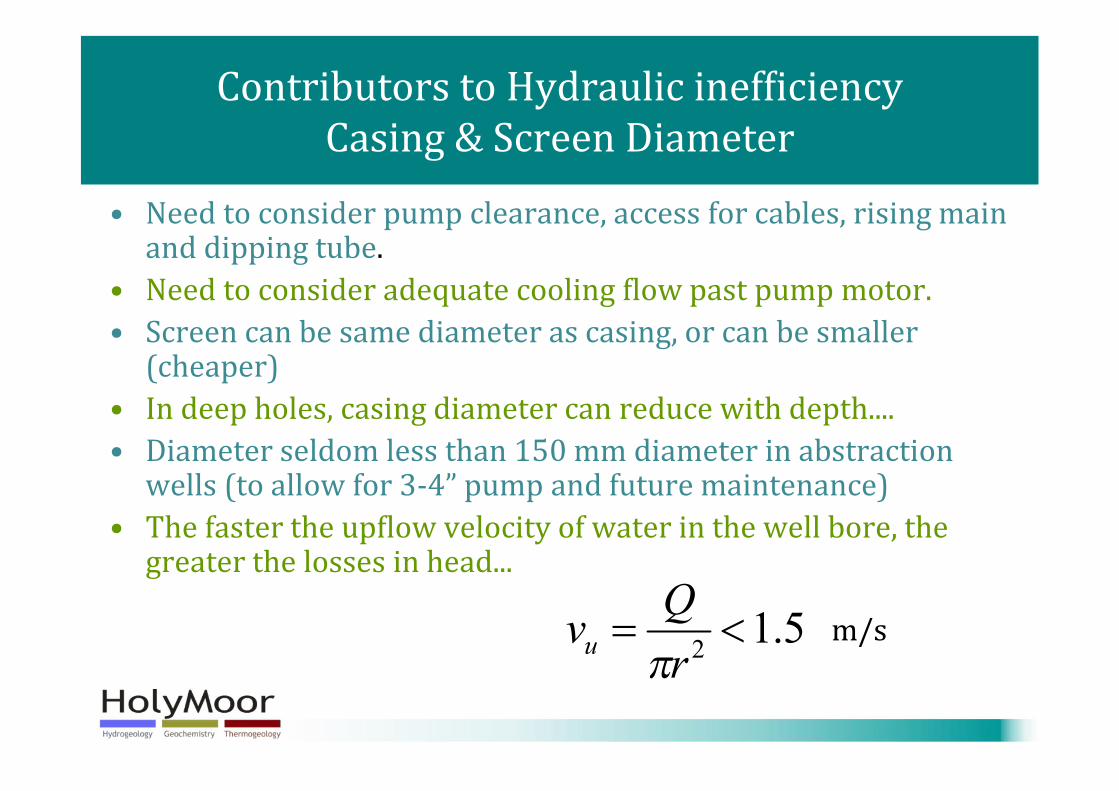
Contributors to Hydraulic inefficiencyCasing & Screen Diameter
• Need to consider pump clearance, access for cables, rising main and dipping tube.
• Need to consider adequate cooling flow past pump motor.• Screen can be same diameter as casing, or can be smaller
(cheaper)• In deep holes, casing diameter can reduce with depth....• Diameter seldom less than 150 mm diameter in abstraction
wells (to allow for 3-4” pump and future maintenance)• The faster the upflow velocity of water in the well bore, the
greater the losses in head...5.12 <=
rQvu π
m/s
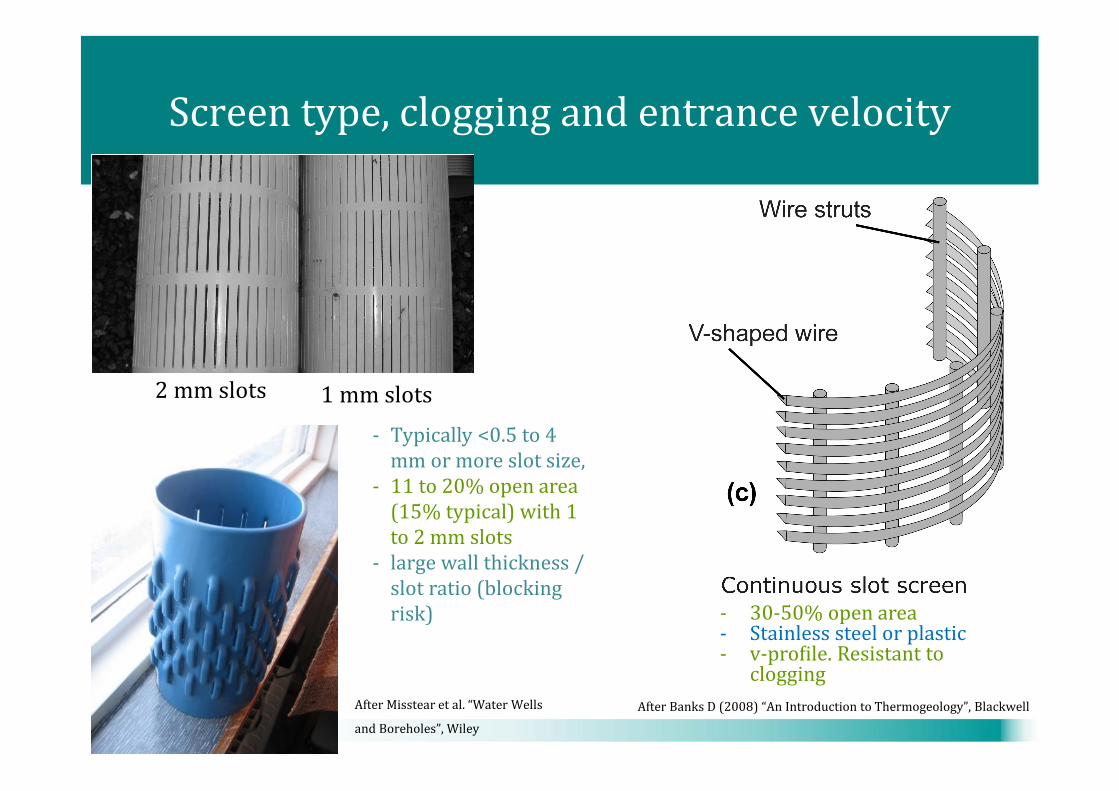
Screen type, clogging and entrance velocity
2 mm slots 1 mm slots
After Misstear et al. “Water Wells and Boreholes”, Wiley
- Typically <0.5 to 4 mm or more slot size,
- 11 to 20% open area (15% typical) with 1 to 2 mm slots
- large wall thickness / slot ratio (blocking risk)
After Banks D (2008) “An Introduction to Thermogeology”, Blackwell
- 30-50% open area- Stainless steel or plastic- v-profile. Resistant to
clogging

A Hydraulically Efficient Well??Screen Entrance Velocity
• Low open area (Aopen) may lead to high screen entrance velocities and turbulence.
• Screen entrance velocity should ideally be less than 0.03 m/s (3 cm/s)
– (although higher values are deemed acceptable in some other literature sources)
• High entrance velocities may also promote abrasion, corrosion and even incrustation
03.02
<=open
entrance rhAQv
πm/s

Step testing: hydraulic efficiency testingStep-tests: For example:
• Step 1. 2 hours, rate = 1/3 * operational rate• Recovery 2 hours• Step 2. 2 hours, rate = 2/3 * operational rate• Recovery 2 hours• Step 3. 2 hours, rate = 1 * operational rate• Recovery 2 hours• Step 4. 2 hours, rate = 4/3 * operational rate• Recovery 2 hoursOr they can be continuous steps, with the pumping rate being incrementally increased at the end of the previous step.
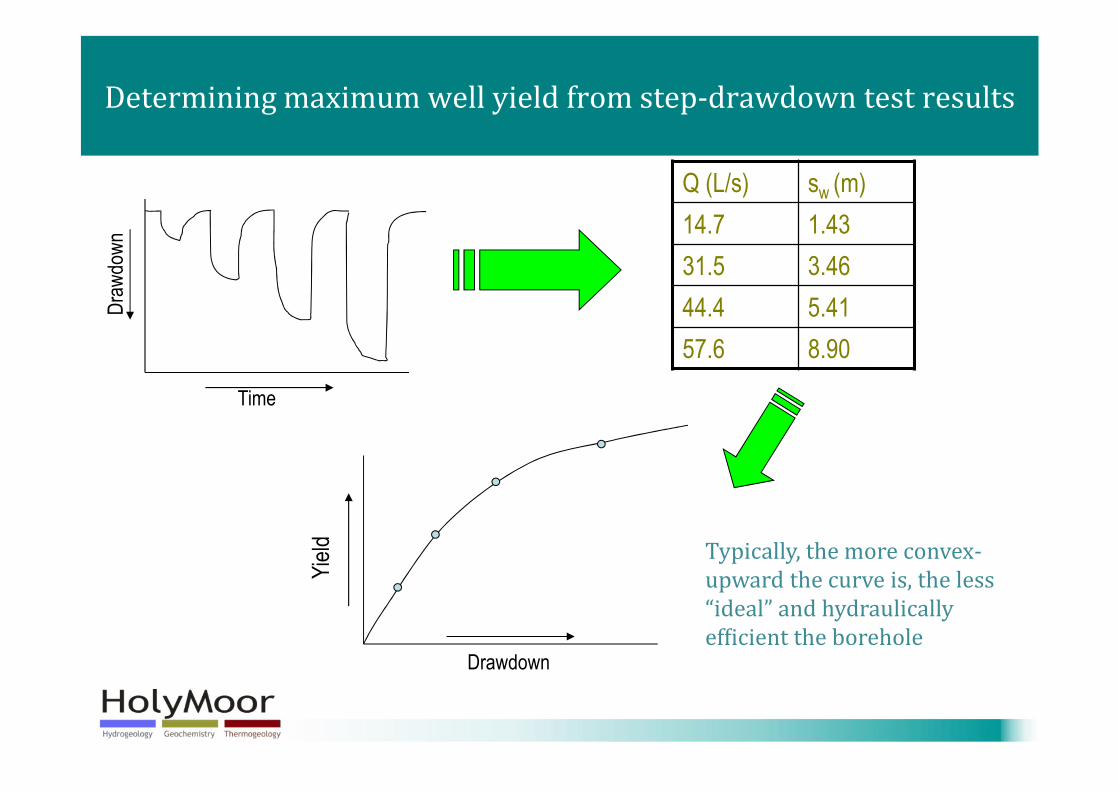
Determining maximum well yield from step-drawdown test results
Time
Draw
down
Q (L/s) sw (m)14.7 1.4331.5 3.4644.4 5.4157.6 8.90
Yield
Drawdown
Typically, the more convex-upward the curve is, the less “ideal” and hydraulically efficient the borehole
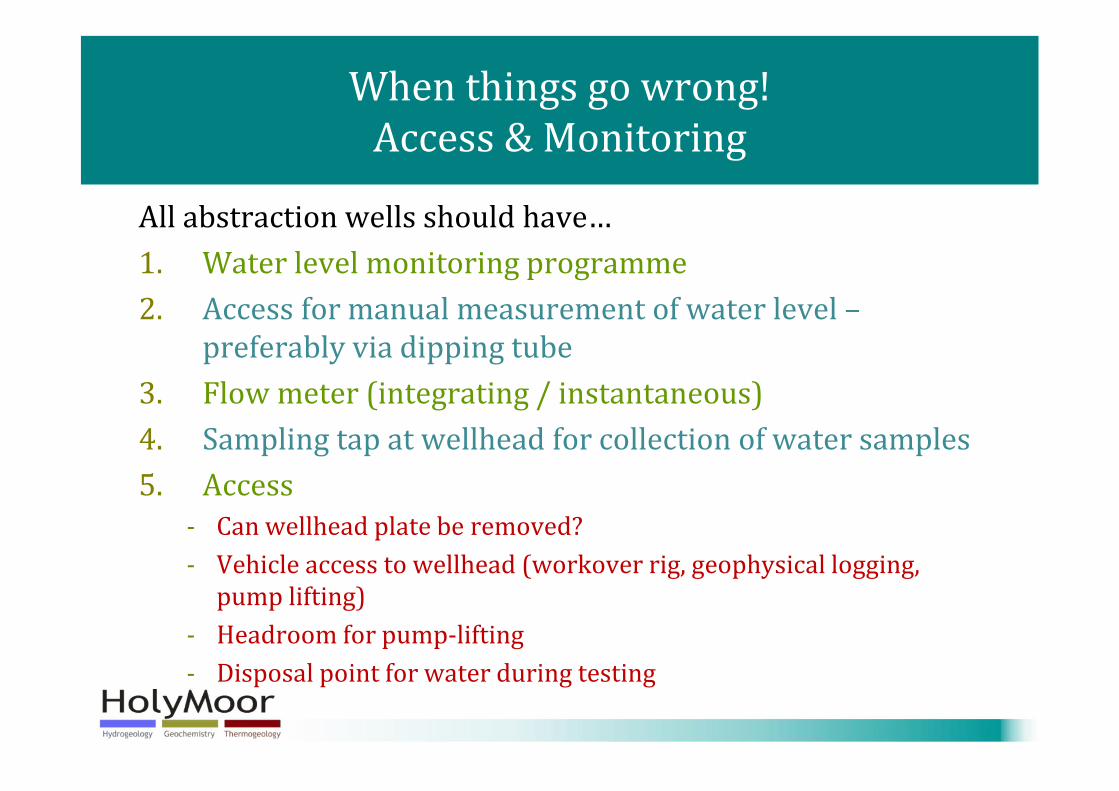
When things go wrong!Access & Monitoring
All abstraction wells should have…1. Water level monitoring programme2. Access for manual measurement of water level –
preferably via dipping tube3. Flow meter (integrating / instantaneous)4. Sampling tap at wellhead for collection of water samples5. Access
- Can wellhead plate be removed?- Vehicle access to wellhead (workover rig, geophysical logging,
pump lifting)- Headroom for pump-lifting- Disposal point for water during testing

Output / water level monitoring curve• Should be a practical, continuously
updated tool• After Misstear & Beeson 2000, Misstear and Banks
2006
• Original yield/drawdown curve• Yield water level curve in drought
condition• Operational data• Pump cut-out level• Annual licenceMisstear BDR, Beeson S (2000) Using operational data to estimate the reliable yields of water-supply wells. Hydrogeology Journal, 8, 177-187. doi: 10.1007/s100400050004Misstear BDR, Banks D (2006) Groundwater monitoring: The importance of setting clear monitoring objectives based on an appreciation of the hydrogeology. Proceedings of the International Association of Hydrogeologists (Irish Group) 26th Annual Groundwater Conference, At Tullamore Court Hotel, County Offaly, Ireland. 25th-26th April 2006, Volume: Session IV, Paper 4.1
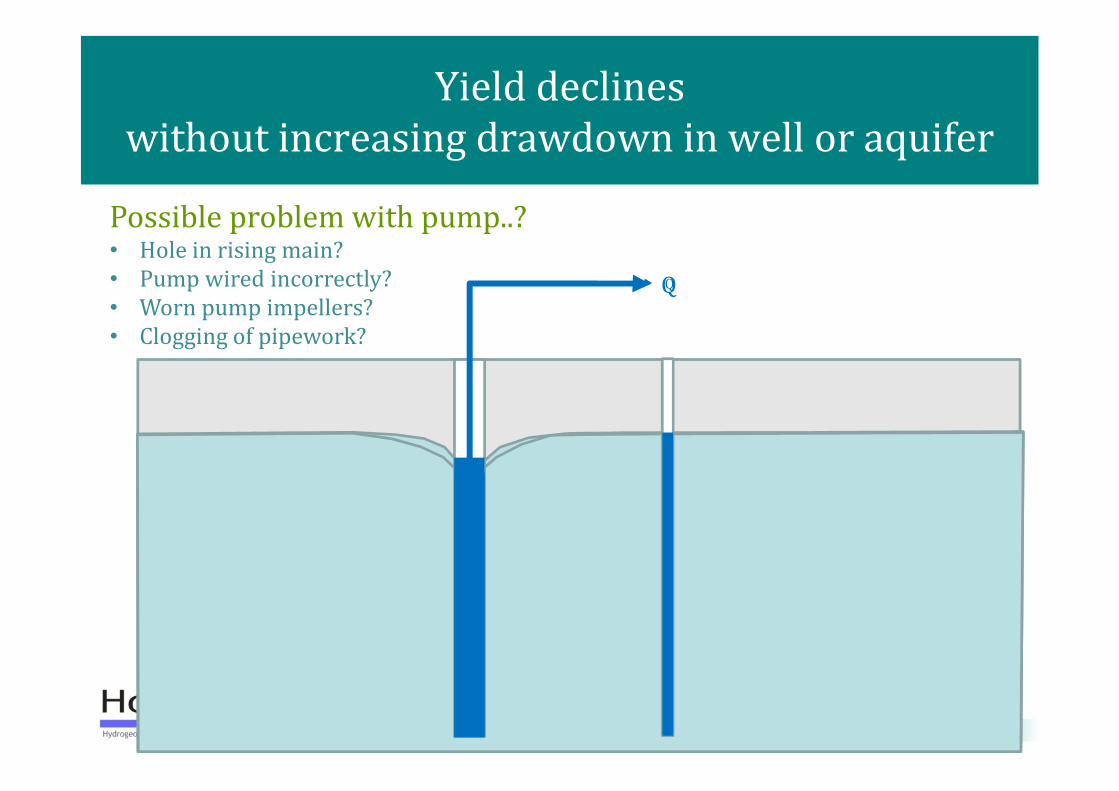
Yield declines without increasing drawdown in well or aquifer
Possible problem with pump..?• Hole in rising main?• Pump wired incorrectly?• Worn pump impellers?• Clogging of pipework?
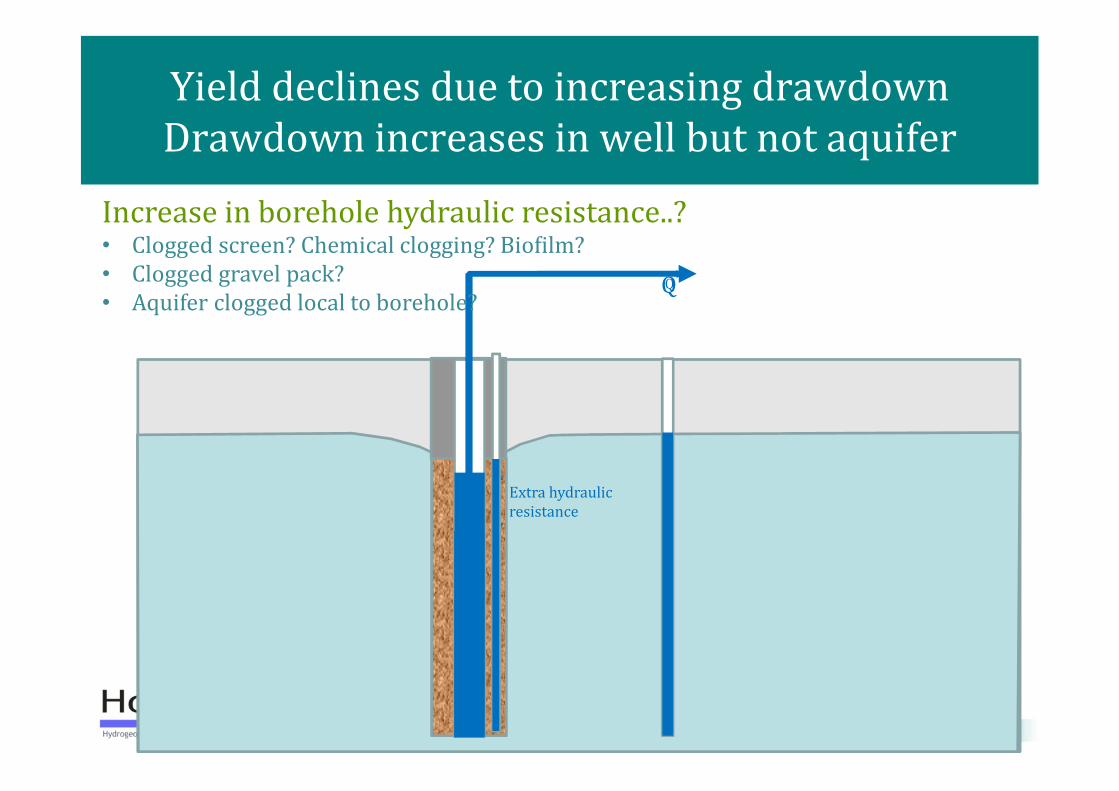
Yield declines due to increasing drawdownDrawdown increases in well but not aquifer
Increase in borehole hydraulic resistance..?• Clogged screen? Chemical clogging? Biofilm?• Clogged gravel pack?• Aquifer clogged local to borehole?
Extra hydraulic resistance

Yield declines due to increasing drawdownDrawdown increases in well and in aquifer
Local or regional water level decline• Is your abstraction not reaching equilibrium?• Interference with nearby wells?• Regional overabstraction?• “Drought”

Reasons for Deterioration of Well Performance• Clogging of local aquifer, fractures
and / or well screen..– With fine material– With chemical precipitates
(e.g. carbonates or iron hydroxides)
– With biofilm....• Can diagnose with CCTV inspection
or by examination of pump and rising main
• Can monitor by dangling “slides” or tokens in the borehole.
• Can monitor by passing water through a porous throughflow cell
• Occasional high total bacterial counts (sloughing of biofilm) may be indicative
• Check water quality for iron, manganese, hardness etc.

Be prepared for maintenance