2-meccanismi di formazione degli inquinanti e diagnostiche ...wpage.unina.it/anddanna/capri/capri...
TRANSCRIPT

Meccanismi di formazione degli inquinanti e diagnostiche in situ per la caratterizzazione delle polveri
Andrea D’Anna
Dipartimento di Ingegneria ChimicaUniversità “Federico II”, Napoli
Patrizia Minutolo
Istituto di Ricerche sulla CombustioneCNE, Napoli

Inquinanti primari da processi di combustione
monossido di carbonio (CO)
ossidi di azoto (NOx)
ossidi di zolfo (SOx)
idrocarburi incombusti (Volatile Organic Compounds – VOC)
benzene ed Idrocarburi Policiclici Aromatici (IPA o PAH)
diossine e furani
fasi condensate e composti particellari organici
particolato inorganico

Il contributo dei processi di combustione
CnH2n+2 + (3n+1)/2O2 nCO2 + (n+1)H2O
miscelazione dei reagenti a livello molecolare(condizioni ideali)
CH CH3
CH2CH2
CHCH
CH2
CH
CH2CH
O2
COCO2
CH2
CH2
0 ms
1 ms
10 ms
100 ms
nei sistemi di combustione reali la mancata miscelazione a livello molecolare favorisce reazioni di crescita molecolare rispetto a reazioni di ossidazione

Meccanismo di ossidazione del metano
ΦΦΦΦ = 1.0 ΦΦΦΦ > 1.0(C/O)
(C/O)st
ΦΦΦΦ =

Il contributo dei processi di combustione
Gassosi
Liquidi
Solidi
Premiscelati
Diffusivi
Laminare
Turbolento
combustibili sistemi di combustione

Combustione controllata dalla diffusioneΦΦΦΦ = 1ΦΦΦΦ > 1 ΦΦΦΦ < 1
prodotti di combustione ricca
prodotti di combustione povera

CH CH3
CH2CH2
CHCH
CH2
CH
CH2CH
O2
COCO2
CH2
CH2
PREMIXEDFUEL + OXIDIZER
BURNER
FLAME ZONE
POST FLAME ZONE
0 ms
1 ms
10 ms
100 ms
CH CH3
CH2CH2
CHCH
CH2
CH
CH2CH
O2
COCO2
CH2
CH2
CH CH3
CH2CH2
CHCH
CH2
CH
CH2CH
O2
COCO2
CH2
CH2
PREMIXEDFUEL + OXIDIZER
BURNER
FLAME ZONE
POST FLAME ZONE
PREMIXEDFUEL + OXIDIZER
BURNER
FLAME ZONE
POST FLAME ZONE
0 ms
1 ms
10 ms
100 ms
0 ms
1 ms
10 ms
100 ms
Combustione premiscelata

Fiamma premiscelata (metano)
Φ = 1.0
Rapporto di equivalenza
φφφφ = (C/O)/(C/O)stoich
Ossidazione in condizioni stechiometriche
Formazione di CO2 e H2O
Combustione premiscelata

Fiamma premiscelata (metano)
Φ = 1.0
Rapporto di equivalenza
φφφφ = (C/O)/(C/O)stoich
Ossidazione in condizioni stechiometriche
Formazione di CO2 e H2O
Combustione premiscelata
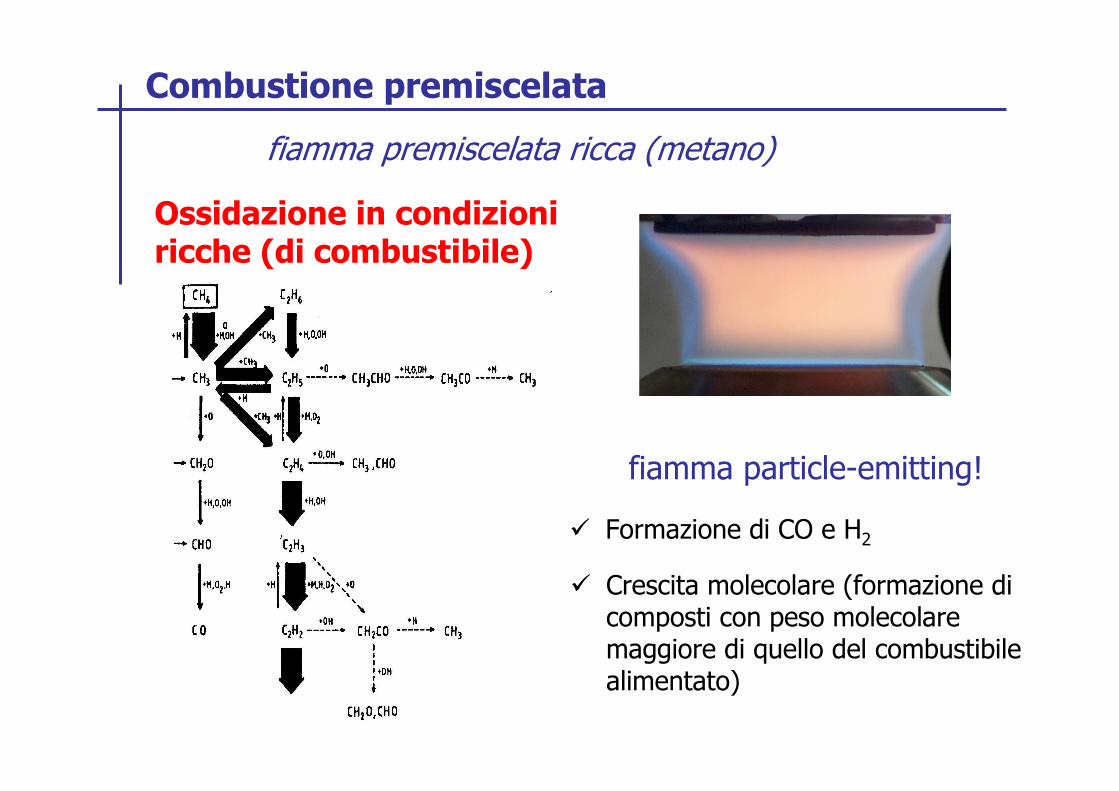
fiamma premiscelata ricca (metano)
fiamma particle-emitting!
Ossidazione in condizioni ricche (di combustibile)
Formazione di CO e H2
Crescita molecolare (formazione di composti con peso molecolare maggiore di quello del combustibile alimentato)
Combustione premiscelata

Combustione premiscelata
O2
0.00
0.05
0.10
0.15
0.20
0.25
0 0.2 0.4 0.6
Mol
e fr
actio
n
CO & CO2
0.00
0.02
0.04
0.06
0.08
0.10
0.12
0.14
0.16
Mol
e fr
actio
n
C2H2
0.0E+00
4.0E-03
8.0E-03
1.2E-02
1.6E-02
2.0E-02
0 0.2 0.4 0.6Distance from burner surface
Mol
e fr
actio
n
n-Heptane
0.000
0.005
0.010
0.015
0.020
0.025
0.030
0.035
0.040
0 0.2 0.4 0.6
Mol
e fr
actio
n
H2 & H2O
0.00
0.02
0.04
0.06
0.08
0.10
0.12
0.14
0.16
Mol
e fr
actio
n
CH4
0.0E+00
4.0E-03
8.0E-03
1.2E-02
1.6E-02
2.0E-02
0 0.2 0.4 0.6Distance from burner surface
Mol
e fr
actio
n
FuelO2
0.00
0.05
0.10
0.15
0.20
0.25
0 0.2 0.4 0.6
Mol
e fr
actio
n
CO & CO2
0.00
0.02
0.04
0.06
0.08
0.10
0.12
0.14
0.16
Mol
e fr
actio
n
C2H2
0.0E+00
4.0E-03
8.0E-03
1.2E-02
1.6E-02
2.0E-02
0 0.2 0.4 0.6Distance from burner surface
Mol
e fr
actio
n
n-Heptane
0.000
0.005
0.010
0.015
0.020
0.025
0.030
0.035
0.040
0 0.2 0.4 0.6
Mol
e fr
actio
n
H2 & H2O
0.00
0.02
0.04
0.06
0.08
0.10
0.12
0.14
0.16
Mol
e fr
actio
n
CH4
0.0E+00
4.0E-03
8.0E-03
1.2E-02
1.6E-02
2.0E-02
0 0.2 0.4 0.6Distance from burner surface
Mol
e fr
actio
n
Fueln-Heptane
0.000
0.005
0.010
0.015
0.020
0.025
0.030
0.035
0.040
0 0.2 0.4 0.6
Mol
e fr
actio
n
H2 & H2O
0.00
0.02
0.04
0.06
0.08
0.10
0.12
0.14
0.16
Mol
e fr
actio
n
CH4
0.0E+00
4.0E-03
8.0E-03
1.2E-02
1.6E-02
2.0E-02
0 0.2 0.4 0.6Distance from burner surface
Mol
e fr
actio
n
n-Heptane
0.000
0.005
0.010
0.015
0.020
0.025
0.030
0.035
0.040
0 0.2 0.4 0.6
Mol
e fr
actio
n
H2 & H2O
0.00
0.02
0.04
0.06
0.08
0.10
0.12
0.14
0.16
Mol
e fr
actio
n
CH4
0.0E+00
4.0E-03
8.0E-03
1.2E-02
1.6E-02
2.0E-02
0 0.2 0.4 0.6Distance from burner surface
Mol
e fr
actio
n
Fuel

Combustione premiscelata

Combustione premiscelata
Φ = 2.0

1.E+09
1.E+10
1.E+11
1.E+12
1.E+13
1.E+14
1 10 100 1000
DP, nm
dN
/dL
OG
(DP)
1.E+09
1.E+10
1.E+11
1.E+12
1.E+13
1 10 100 1000
DP, nm
dN
/dL
OG
(DP)
1.E+09
1.E+10
1.E+11
1.E+12
1 10 100 1000
DP, nm
dN
/dL
OG
(DP)
Combustione premiscelata
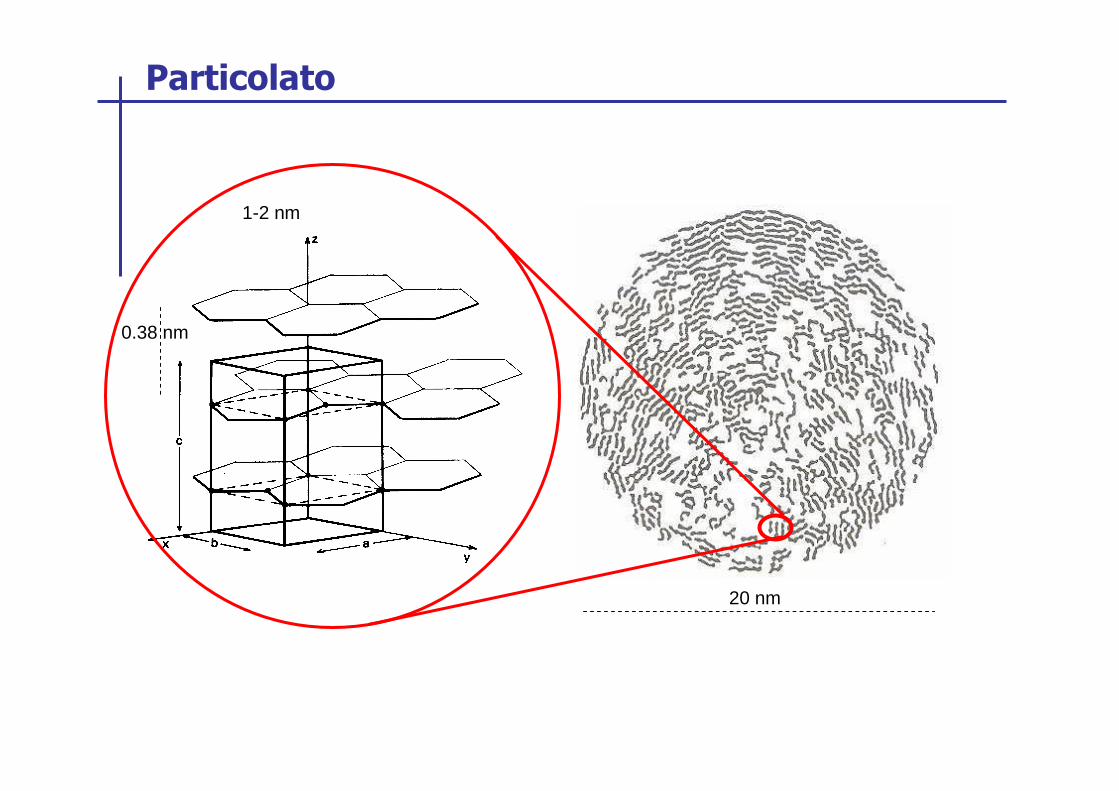
Particolato
20 nm
1-2 nm
0.38 nm

10 nm
Particolato

C2H2 addition to C4 hydrocarbons(even-carbon-atom pathways)
n-C4H3 + C2H2 phenyln-C4H5 + C2H2 benzene + H
resonantly stabilized free radical combination(odd-carbon-atom pathways)
C3H3 + C3H3 phenyl + HC3H3 + C3H3 benzeneC5H5 + CH3 benzene + H + H
Formazione del benzene

multimulti--ring aromatic formationring aromatic formationCC22HH22 addition to aromatic rings (HACA mechanism)addition to aromatic rings (HACA mechanism)
Formazione degli IPA
- H2
.
.
+ C2H2
- H
CH
+ H
.CH
.
+ C2H2
- H
+ C2H2
- H
+ C2H2
- H
CH
+ C2H2- H
CH
- H2
+ H
- H2
..
.
+ C2H2
- H
CH
+ H
..CH
.
+ C2H2
- H
+ C2H2
- H
+ C2H2
- H
CHCH
+ C2H2- H
CHCH
- H2
+ H

multimulti--ring aromatic formationring aromatic formationresonantly stabilized free radical combination
+ - H2
. .
+ C3H3
- H2
H H
.
+ - H2
.
Formazione degli IPA

• crescita molecolare dei precursori
• nucleazione delle particelle
• coagulazione (coalescenza) dei nuclei
• addizione di composti dalla fase gassosa
• coagulazione (formazione di strutture a catena)
Formazione del particolato

Formazione del particolato
OneOne--ringring
aromaticsaromatics
cyclizationcyclization
20 nm
20 20 –– 30 nm30 nm
1 1 –– 2 nm2 nm
OH
OHO CH3
3 3 –– 4 nm4 nm
OH
OH
O
CH3
OH
OH
O
CH3
OH
OH
O
CH3
3 3 –– 4 nm4 nm
molecular weight, time
C/H
1 1 –– 2 nm2 nm
growth by growth by
C2H2C2H2 coalescent coalescent
coagulationcoagulation
PCAH
AALH
growth by aromatic growth by aromatic
and aliphaticand aliphatic
OneOne--ringring
aromaticsaromatics
cyclizationcyclization
20 nm
20 20 –– 30 nm30 nm
20 nm20 nm20 nm
20 20 –– 30 nm30 nm
1 1 –– 2 nm2 nm
OH
OHO CH3
3 3 –– 4 nm4 nm
OH
OH
O
CH3
OH
OH
O
CH3
OH
OH
O
CH3
3 3 –– 4 nm4 nm
molecular weight, time
C/H
1 1 –– 2 nm2 nm
growth by growth by
C2H2C2H2 coalescent coalescent
coagulationcoagulation
PCAH
AALH
growth by aromatic growth by aromatic
and aliphaticand aliphatic

coagulazione di molecole/particelle
Formazione del particolato (coagulazione)

Formazione del particolato (coagulazione)
intermolecular potential between molecules
the interaction between two particles containing q molecules per unit volume
the overall interaction potential between two equal-sized particles is a function of the particle radius RP and the particle polarizability through the Hamackerconstant A
1 2
r
φ(r) = -φm[( )12 - 2( )6]rm rm
r rφ(r) = -φm[( )12 - 2( )6]rm rm
r r
U = ∫V1
dv1 ∫V2dv2q2φ(r)
V1 V2
r
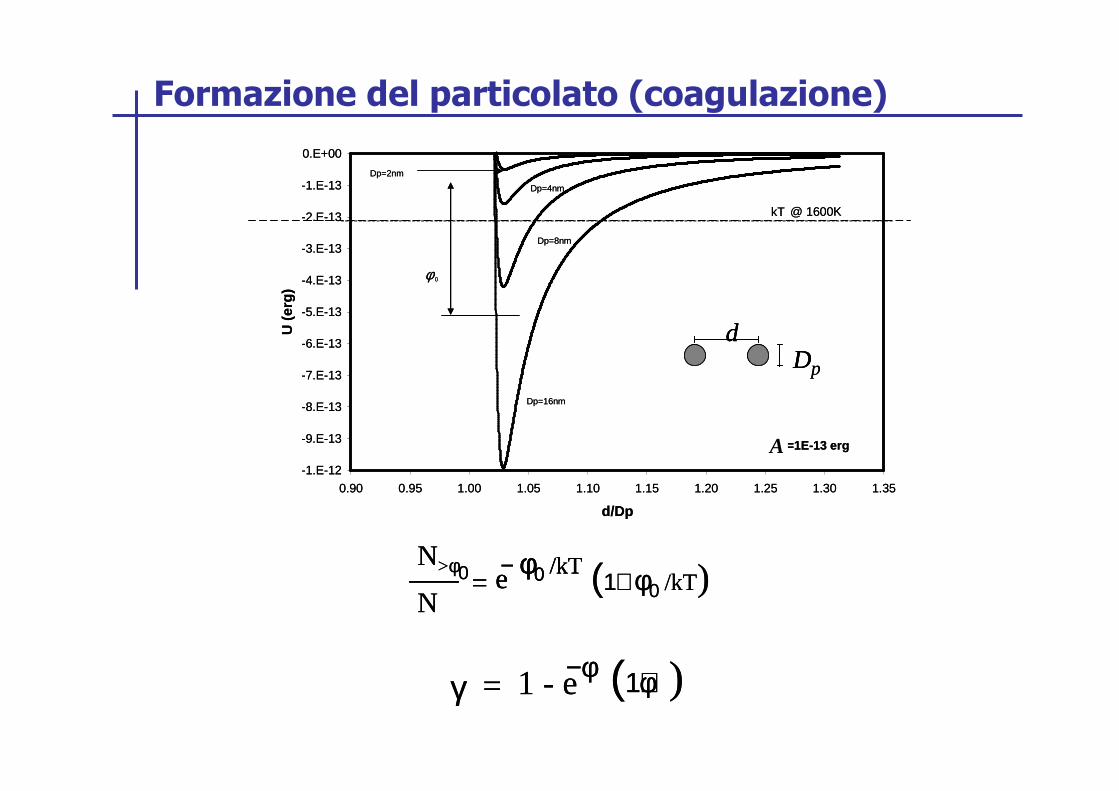
dDp
-1.E-12
-9.E-13
-8.E-13
-7.E-13
-6.E-13
-5.E-13
-4.E-13
-3.E-13
-2.E-13
-1.E-13
0.E+00
0.90 0.95 1.00 1.05 1.10 1.15 1.20 1.25 1.30 1.35
d/Dp
U (
erg
)
Dp=2nm
Dp=4nm
Dp=8nm
Dp=16nm
kT @ 1600K
Ha=1E-13 erg
φ 0
A
p
dDp
dDp
-1.E-12
-9.E-13
-8.E-13
-7.E-13
-6.E-13
-5.E-13
-4.E-13
-3.E-13
-2.E-13
-1.E-13
0.E+00
0.90 0.95 1.00 1.05 1.10 1.15 1.20 1.25 1.30 1.35
d/Dp
U (
erg
)
Dp=2nm
Dp=4nm
Dp=8nm
Dp=16nm
kT @ 1600K
Ha=1E-13 erg
φ 0
AA
p
Formazione del particolato (coagulazione)
− φ0 /kTe (1+ φ0 /kT)N>φ0
N=
− φ0 /kTe− φ0 /kTe (1+ φ0 /kT)N>φ0
N=
−φ1 - e (1+φ)γ =−φ1 - e (1+φ)γ =

1.E-12
1.E-11
1.E-10
1.E-09
1.E-08
0.0E+00 5.0E-07 1.0E-06 1.5E-06 2.0E-06
Particle Diameter, cm
Co
agu
lati
on
Co
nst
ant,
cm
3 /s
aliphatic (A=1E-13)
benzene (A=5E-13)graphite(A=5E-12)
@ T=1800KGas Kinetic Limit
Formazione del particolato (coagulazione)

Fiamma a diffusione (flussi coassiali)
z=10mm z=30mm z=50mm
0.0E+00
1.0E-06
2.0E-06
3.0E-06
4.0E-06
5.0E-06
0 2 4 6 8 10r, mm
soo
t vo
lum
e fr
acti
on
0.0E+00
1.0E-06
2.0E-06
3.0E-06
4.0E-06
5.0E-06
nan
op
arti
cle
volu
me
frac
tio
n
300
600
900
1200
1500
1800
2100
tem
per
atu
re, K
0.0
10.0
20.0
30.0
40.0
50.0
0 2 4 6 8 10r, mm
d63
, nm
z=10mm z=30mm z=50mm
I0 I

0.0
0.5
1.0
1.5
volu
me
frac
tio
n (
pp
m)
0.0E+00
5.0E+12
1.0E+13
1.5E+13
2.0E+13
2 3 4 5 6 7 8z, mm
nu
mb
er c
on
cen
trat
ion
, cm
-3
0
5
10
15
20
d63, n
m
0.0E+00
2.0E-08
4.0E-08
6.0E-08
8.0E-08
1.0E-07
LIF
an
d L
II, c
m-1
sr-1
vis-transparent vis-absorbing
LIF 350nm+ LIF 440nm LII 550nm
1.E-06
1.E-05
1.E-04
1.E-03
1.E-02
1.E-01
1.E+00
0 0.2 0.4 0.6 0.8 1z, mm
mo
le f
ract
ion
400
1100
1800
2500
T, K
O2C2H2C2H4A1sumPAHsT(K)
pyrolysis zone
stagnation plane post-oxidation zone
soot formation zone
fuel oxy
Fiamma a diffusione (flussi contrapposti)

OH
OHO CH3
chemical growth(by C2H2)
coalescentcoagulation
chemical growth(by aromatics,
aliphatics, oxygen)
OH
OH
O
CH3
OH
OH
O
CH3
OH
OH
O
CH3
coalescentcoagulation
bassa concentrazionedi precursori
alta concentrazione diprecursori
Aromatic chemical growth
Ai + H ↔ Ai* + H2
Ai* + Aj ↔ Ai+j + H
Aromatic cluster formation
Ai + Aj ↔ Ai+j
Formazione del particolato
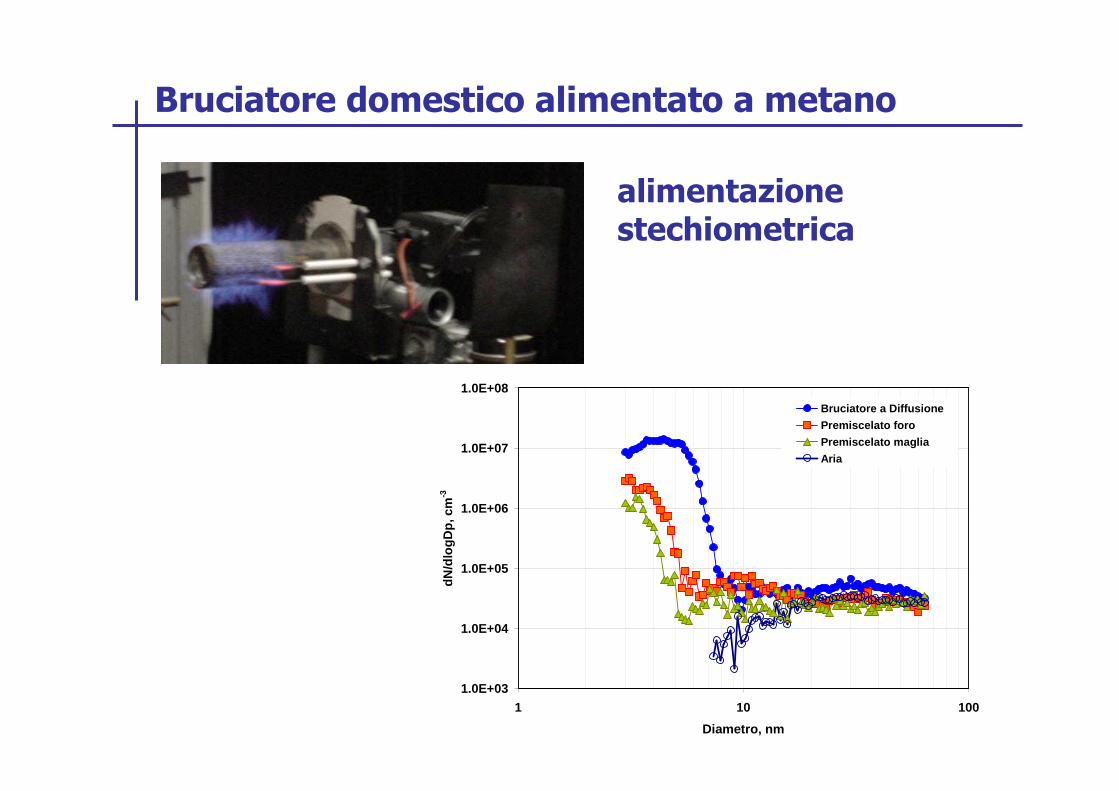
Bruciatore domestico alimentato a metano
1.0E+03
1.0E+04
1.0E+05
1.0E+06
1.0E+07
1.0E+08
1 10 100
Diametro, nm
dN
/dlo
gD
p, c
m-3
Bruciatore a Diffusione
Premiscelato foro
Premiscelato maglia
Aria
alimentazione stechiometrica

Microturbina per cogenerazione
diesel oil
1.E+03
1.E+04
1.E+05
1.E+06
1.E+07
1.E+08
1.E+09
dN
/dL
OG
(Dp
), c
m-3
1.E+03
1.E+04
1.E+05
1.E+06
1.E+07
1.E+08
1.E+09
1 10 100
Dp, nm
dN
/dL
OG
(Dp
), c
m-3
bio-diesel

Motori a combustione interna
1.E+04
1.E+05
1.E+06
1.E+07
1.E+08
1.E+09
1 10 100 1000 10000
dN
/dL
OG
(D),
cm
-3
ELPI 1500-50-r
1500-50-r
AFM
1.E+04
1.E+05
1.E+06
1.E+07
1.E+08
1 10 100 1000 10000Diametri, nm
dN
/dL
og
D, c
m-3
SMPS 1500-30Diesel MaricqELPI 1500-30-rAFM Diesel
benzina
diesel

10 nm
1.E+06
1.E+07
1.E+08
1.E+09
1.E+10
1.E+11
1.E+12
1.E+13
1.E+14
1.E+15
1.E-03 1.E-02 1.E-01 1.E+00 1.E+01 1.E+02
Dp, micron
N, #
/m3
Combustibili solidi: carbone e rifiuti

Il contributo dei processi di combustione
i processi di combustione possono contribuire alla formazione diparticolato ultrafine ed iperfine ed alla loro emissione in atmosfera
1.E+07
1.E+08
1.E+09
1.E+10
1.E+11
1.E+12
1.E+13
1 10 100 1000 10000
D, nm
dN
/dL
OG
(D),
cm
-3
PSD.10
PSD.11
PSD.12
PSD.13

Modello cinetico per la formazione del particolato
BIN1 BIN2 BIN3 BIN4
BIN2
BIN3
BIN4
BIN1
H/C=1
H/C=0
BIN1 BIN2 BIN3 BIN4
BIN2
BIN3
BIN4
BIN1
H/C=1
H/C=0H/C = 0
H/C = 1 H/C = 0.85
H/C = 0.35
H/C = 0.60
H/C = 0.10

8.85E13 T0.5 exp(-16,000/RT) nC2/3 H/C
8.85E13 T0.5 exp(-4,650/RT) nC2/3 H/C
6.00E14 T0.5 exp(-113,100/RT) nC H/C
8.00E12 T0.5 nC1/6Ri + Rj Ai+j
Ai == Ri + H
Ai + H,OH == Ri+j + H2,H2O
Modello cinetico per la formazione del particolato

3.00E6 T1.787 exp(-3262/RT) nC0.616
2.00E13 T0.5 exp(-15,000/RT) nC1/6
Ri + C2H2 Ai + H
Ri + Aj Ai+j + H
Modello cinetico per la formazione del particolato
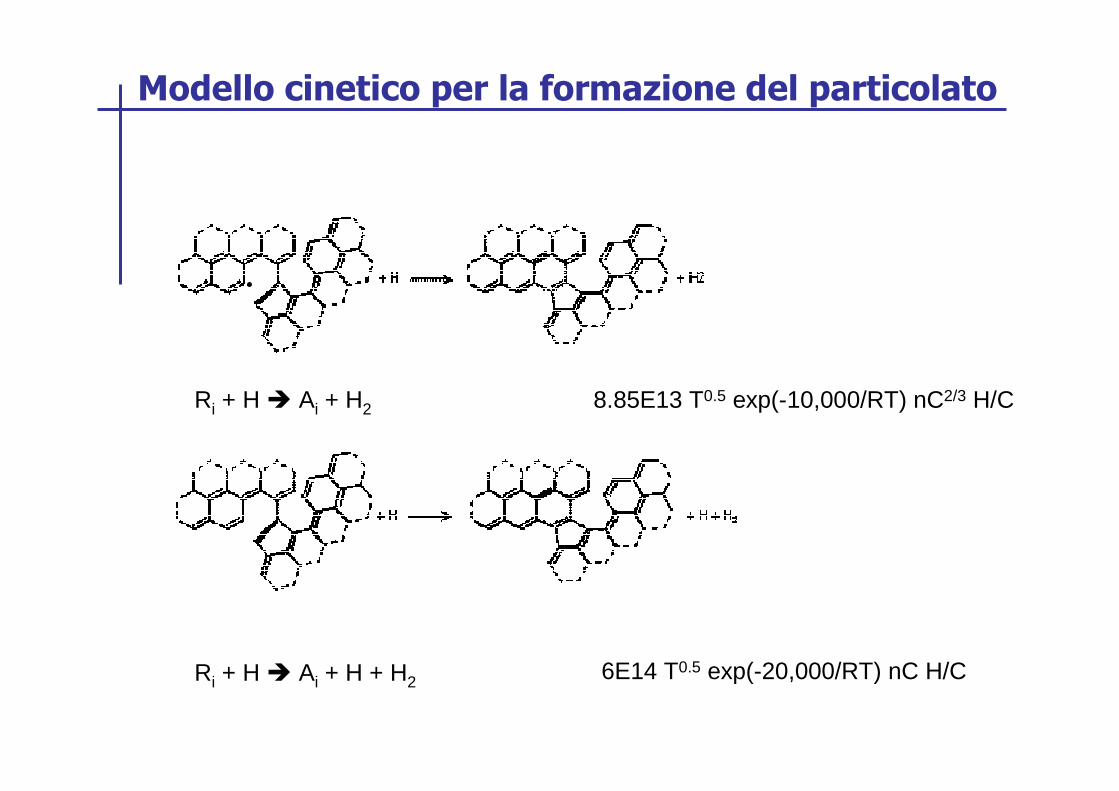
8.85E13 T0.5 exp(-10,000/RT) nC2/3 H/C
6E14 T0.5 exp(-20,000/RT) nC H/C
Ri + H Ai + H2
Ri + H Ai + H + H2
Modello cinetico per la formazione del particolato

3.00E12 T0.5 exp(-10600/RT) nC0.623
4.30E11 T0.5 exp(-8000/RT) nC2/3
2.00E13 T0.5 nC1/6 γ
Ai + OH Ai + HCO
Ri + O2 Ai + 2CO
Ai + Aj Ai+j
Modello cinetico per la formazione del particolato

0.E+00
1.E-06
2.E-06
3.E-06
4.E-06
0 2 4 6 8 10 12 14 16
HAB, mm
Co
nce
ntr
atio
n, g
/cm
3
particulate
exp data Ciajolo et al., 19960.0
0.2
0.4
0.6
0.8
1.0
0 2 4 6 8 10 12 14 16
HAB, mm
H/C
rat
io
H-to-C
Modello cinetico per la formazione del particolato

fuliggine
exp data Ciajolo et al., 1996
specie condensate
Modello cinetico per la formazione del particolato
0.0E+00
1.0E-06
2.0E-06
3.0E-06
4.0E-06
0 2 4 6 8 10 12 14
HAB, mm
Co
nce
ntr
atio
n, g
/cm
3
0.0E+00
5.0E-07
1.0E-06
1.5E-06
2.0E-06
0 2 4 6 8 10 12 14
HAB, mm
Co
nce
ntr
atio
n, g
/cm
3
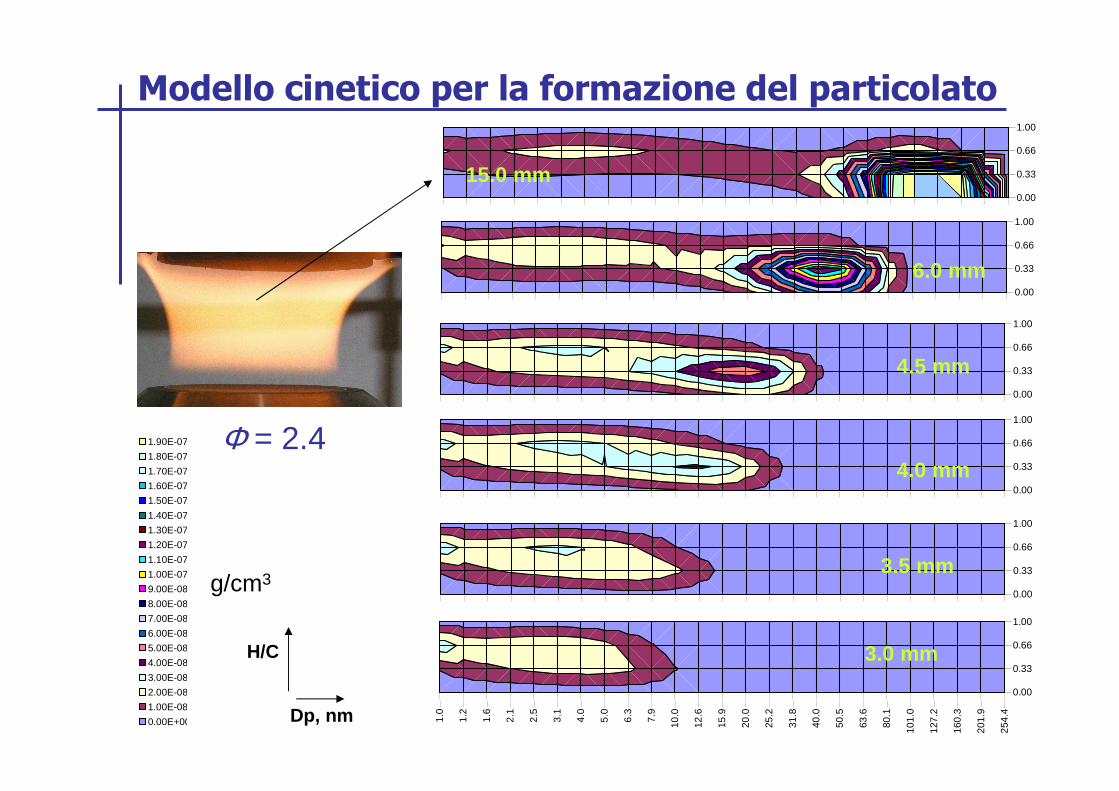
Φ = 2.4
0.00
0.33
0.66
1.00
0.00
0.33
0.66
1.00
0.00
0.33
0.66
1.00
0.00
0.33
0.66
1.00
0.00
0.33
0.66
1.00
0.00
0.33
0.66
1.00
1.0
1.2
1.6
2.1
2.5
3.1
4.0
5.0
6.3
7.9
10.0
12.6
15.9
20.0
25.2
31.8
40.0
50.5
63.6
80.1
101.
0
127.
2
160.
3
201.
9
254.
4
0.00
3.0 mm
3.5 mm
4.0 mm
4.5 mm
6.0 mm
15.0 mm
1.90E-07-2.00E-07
1.80E-07-1.90E-07
1.70E-07-1.80E-07
1.60E-07-1.70E-07
1.50E-07-1.60E-07
1.40E-07-1.50E-07
1.30E-07-1.40E-07
1.20E-07-1.30E-07
1.10E-07-1.20E-07
1.00E-07-1.10E-07
9.00E-08-1.00E-07
8.00E-08-9.00E-08
7.00E-08-8.00E-08
6.00E-08-7.00E-08
5.00E-08-6.00E-08
4.00E-08-5.00E-08
3.00E-08-4.00E-08
2.00E-08-3.00E-08
1.00E-08-2.00E-08
0.00E+00-1.00E-08
g/cm3
H/C
Dp, nm
Modello cinetico per la formazione del particolato

Light Scat./Light ext.
DLS
AFMDMA
In situ Ex-situ On line
Sizing Methods for Ultrafine Particles

The color of the sky is caused by the scatteringof sunlight by the molecules of the atmosphere.
Iscatt~1/λ4
Violet-blu components of sunlightare scatterd more efficiently so the sky appears blue.
Light ScatteringLight Scattering
At sunset or sunrise, the sunlight we observehas traveled a longer path through the atmosphere. Therefore, a large amount of blue and violet light has been scattered and the light that is recieved by an observer is red.
Light Scattering Light Scattering -- ExtinctionExtinction
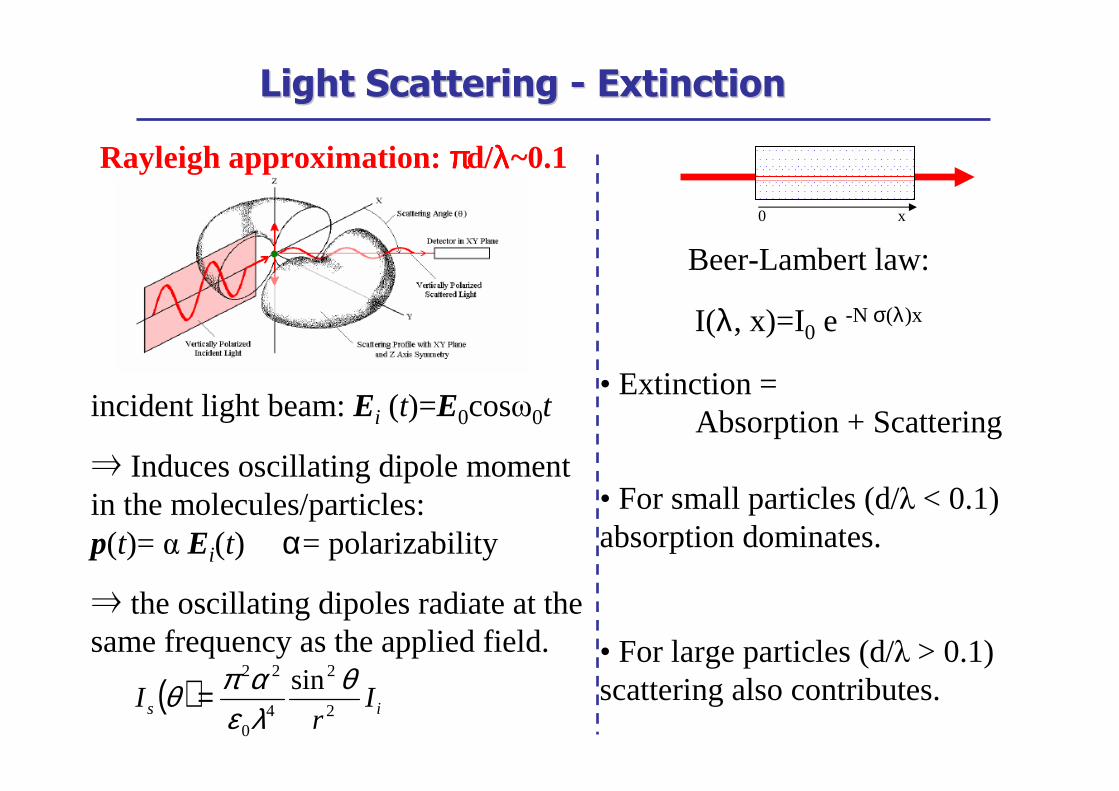
Rayleigh approximation: ππππd/λλλλ~0.1
incident light beam: Ei (t)=E0cosω0t
⇒ Induces oscillating dipole moment in the molecules/particles: p(t)= α Ei(t) α= polarizability
⇒ the oscillating dipoles radiate at the same frequency as the applied field.
( ) is Ir
I2
2
40
22 sin θλεαπθ =
• Extinction = Absorption + Scattering
• For small particles (d/λ < 0.1) absorption dominates.
• For large particles (d/λ > 0.1) scattering also contributes.
Beer-Lambert law:
I(λ, x)=I0 e -N σ(λ)x
0 x
ICCD Camera
PCDelay Generator
Lens
Lens
- -
Burner
Deuterium Lamp
Laser
62
2
2
4
4
2~1~
4 p
pVV dN
mmQ +
−= λπ
32
22
2~1~
Imp
p
oext dN
mmK
+−−=
λ
π
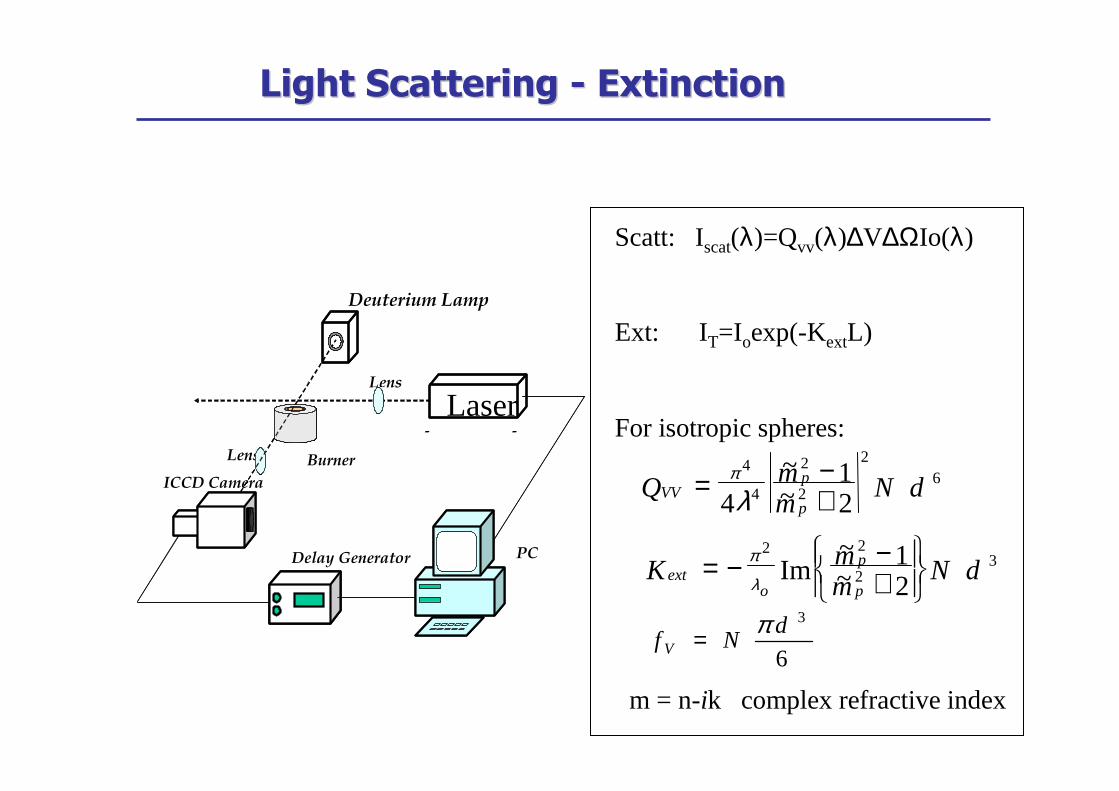
Scatt: Iscat(λ)=Qvv(λ)∆V∆ΩIo(λ)
Ext: IT=Ioexp(-KextL)
For isotropic spheres:
m = n-ik complex refractive index
6
3dNf V
π=
Light Scattering Light Scattering -- ExtinctionExtinction

1.E-8
1.E-7
1.E-6
1.E-5
1.E-4
0 5 10 15height above the burnerz, mm
Sca
t. c
oef
fici
ent,
cm
-1sr
-1
1.E-3
1.E-2
1.E-1
0 5 10 15
height above the burner z, mm
Ext
. co
effi
cien
t,cm
1
LS/LS/ExtExt –– exampleexample: : CC22HH44/air /air premixedpremixed flameflame
λ=266 nm
λ=532 nm
∑∑∑ ++=i
sootvvi
NOCvvi
gasvvvv iii
QQQQ ∑∑∑ ++=i i
sootexti i
NOCexti i
gasabsext KKKK
Qvv gas
Qvv flame

LS/LS/ExtExt --Gas Gas ContributionContribution
( ) ( )igasvvi i
gasvv nCTNQ ,λ∑= ( ) ( )TTNK ii i
gasabs ,λσ∑=
@λ=266 nm i=CO2, H2O
To estimate Qvv and Kabs is necessary to know for each specie i
Ni: Concentration
σi(λ,T): Light absorption cross section
Cvv(λ, ni) Light scattering cross section
T: Temperarure

LS/LS/ExtExt -- COCO22 contributioncontribution
0
0.01
0.02
0.03
0.04
0.05
0.06
0.07
0.08
200 220 240 260 280 300
wavelength, nm
Kab
s, c
m-1
C2H4/air
φ=1
CO2
0
20
40
60
80
100
120
1 1.2 1.4 1.6 1.8 2
φφφφ
% K
abs(
CO
2)/K
abs
Joutsenoja et al 2001

LS/LS/ExtExt –– exampleexample: : CC22HH44/air /air premixedpremixed flameflame
results
0
0.1
0.2
0.3
0.4
0.5
200 250 300 350 400
Wavelenght, nm
Kab
s, c
m-1
10-6
1010
1011
1012
1013
0 2 4 6 8 10
Num
ber
dens
ity N
, cm
-3
z, mm
Vol
ume
frac
tion
fvv
2.0 10-6
0.5 10-6
1.0 10-6
1.5 10-6
Mean
diameter
d, cm
0
010-8
10-7
Total (from Kabs(266))
soot (from Kabs(532))
sootNOC

Shortcomings
Gas
Fluorescence interference
Detection of small particles in presence of larger ones
Particles Refractive Index
Advantages
In situ measurement
Size and Concetration
Particles Refractive Index
Wavelength Dependence allows multi-species analysis
LS/LS/extext
Temperature
Species concentr.

( ) 336
i
6ii
i
3ii
2
2
22
2
23
vv
abs
d1
)),(m(fdN
dN
2)(m1)(m
2)(m1)(m
Im
Q)(K
−
λλ=
+λ−λπ
+λ−λλ−
=λλ
∑
∑
LS/LS/ExtExt -- advantagesadvantagesdependencedependence on on ParticlesParticles RefractiveRefractive IndexIndex
0.0
0.1
1.0
1.0 1.2 1.4 1.6 1.8 2.0n
k
d63=2.85λ=266 nm
Cecereet al., 2002
ikinm 09.035.1~ −=−=
0
0,1
0,2
0,3
0,4
0,5
0,6
0,7
0,8
0,9
1
1,E-01 1,E+00 1,E+01 1,E+02
Hydrodynamic Diameter [nm]
Num
ber
Dis
trib
utio
n F
unct
ion
D=2.78 nmIf particle size is known:
Particle refractive indexcan be measured

DynamicDynamic Light Scattering Light Scattering UsingUsing BrownianBrownian motiomotio toto MeasureMeasure SizeSize
Scattered light
Scatterers in solution (Brownian motion)
Laser at fo
ffo
incident laser
Doppler broadenedscattered light
∆f
0
∆f ~ 1 part in 1010 - 1015
In frequency domain
time
Scattered intensity Iaverage
In time domain
fluctuation in intensity are analysed by Its autocorrelation function
6B
K TD
Rπηπηπηπη====

DLSDLS–– exampleexample: ex: ex--situsitu
D=2.78 nmC/O = 0.77 z = 3.5mm
Normalized intensity correlation function
0
0,2
0,4
0,6
0,8
1
1,E-06 1,E-04 1,E-02 1,E+00 1,E+02 1,E+04 1,E+06
Lag time, ms
0
0,1
0,2
0,3
0,4
0,5
0,6
0,7
0,8
0,9
1
1,E-01 1,E+00 1,E+01 1,E+02
Hydrodynamic Diameter [nm]
Num
ber
Dis
trib
utio
n F
unct
ion
exhaust
H2Oin
out
H2O
condenser
water
bubblerWater cooled probe

StopperStopper
FiberFiber opticoptic
AutocorrelatorAutocorrelatorPMTsPMTs PADsPADs
GlanGlan ThompsonThompsonPrismPrism
LensLens
LensLens ArgonArgon--IonIonLaserLaser
BurnerBurner
PrismPrism
FlameFlameScattering Scattering
AngleAngle 5°5°
λλλλ=488nm488nm
DLSDLS–– exampleexample: in situ: in situ
d3TCk
D uB
πη=
Normalized Intensity Correlation Function
0
0,1
0,2
0,3
0,4
0,5
0,6
0,7
0,8
1,E-06 1,E-04 1,E-02 1,E+00 1,E+02 1,E+04 1,E+06
Lag time, ms
0
0,1
0,2
0,3
0,4
0,5
0,6
0,7
0,8
0,9
1
1,E+00 1,E+01 1,E+02Hydrodynamic Diameter [nm]
Num
ber
Dis
trib
utio
n F
unct
ion
D=11.19nm
FromFrom LS/LS/ExtExt DD6,36,3=15.5 nm=15.5 nm( )
( )r
T
T
rCu
λλ
−++= 25.1exp29.0864.01
Ethylene/air C/O=0.77 z=9.5 mm
In free molecule regime
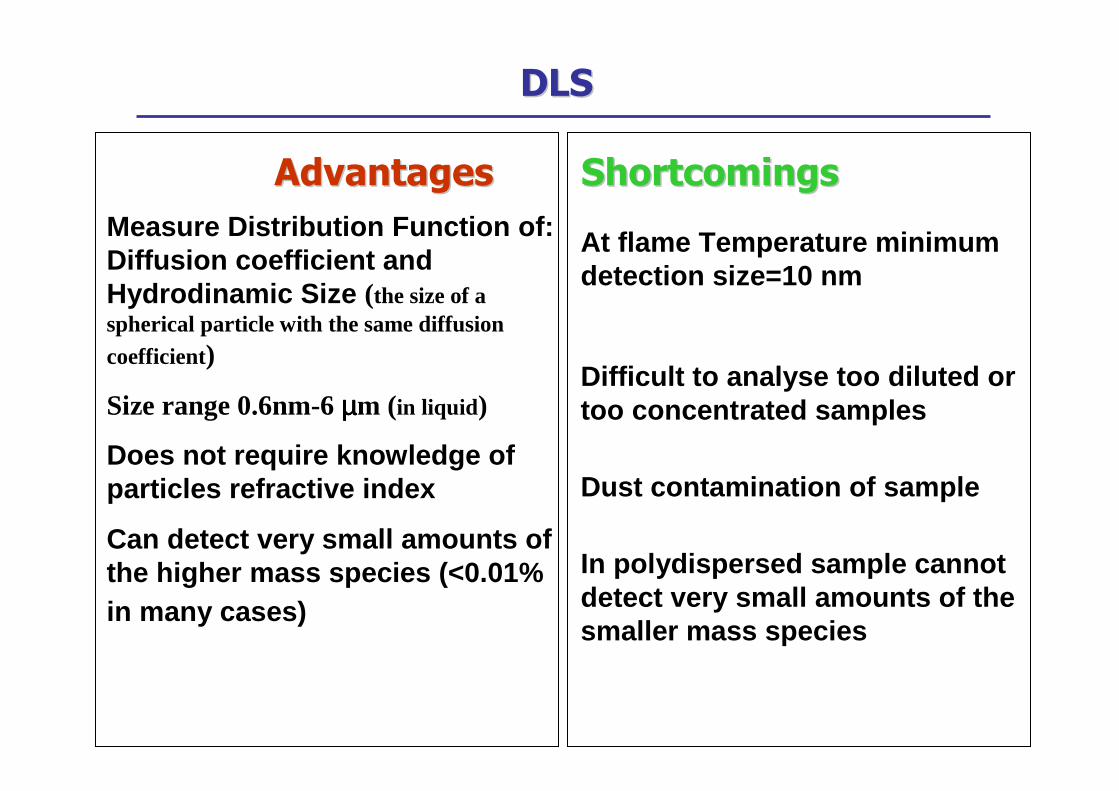
At flame Temperature minimum detection size=10 nm
Difficult to analyse too diluted or too concentrated samples
Dust contamination of sample
In polydispersed sample cannotdetect very small amounts of the smaller mass species
Measure Distribution Function of: Diffusion coefficient and Hydrodinamic Size (the size of a spherical particle with the same diffusioncoefficient)
Size range 0.6nm-6 µµµµm (in liquid )
Does not require knowledge of particles refractive index
Can detect very small amounts of the higher mass species (<0.01% in many cases)
DLSDLS
AdvantagesAdvantages ShortcomingsShortcomings
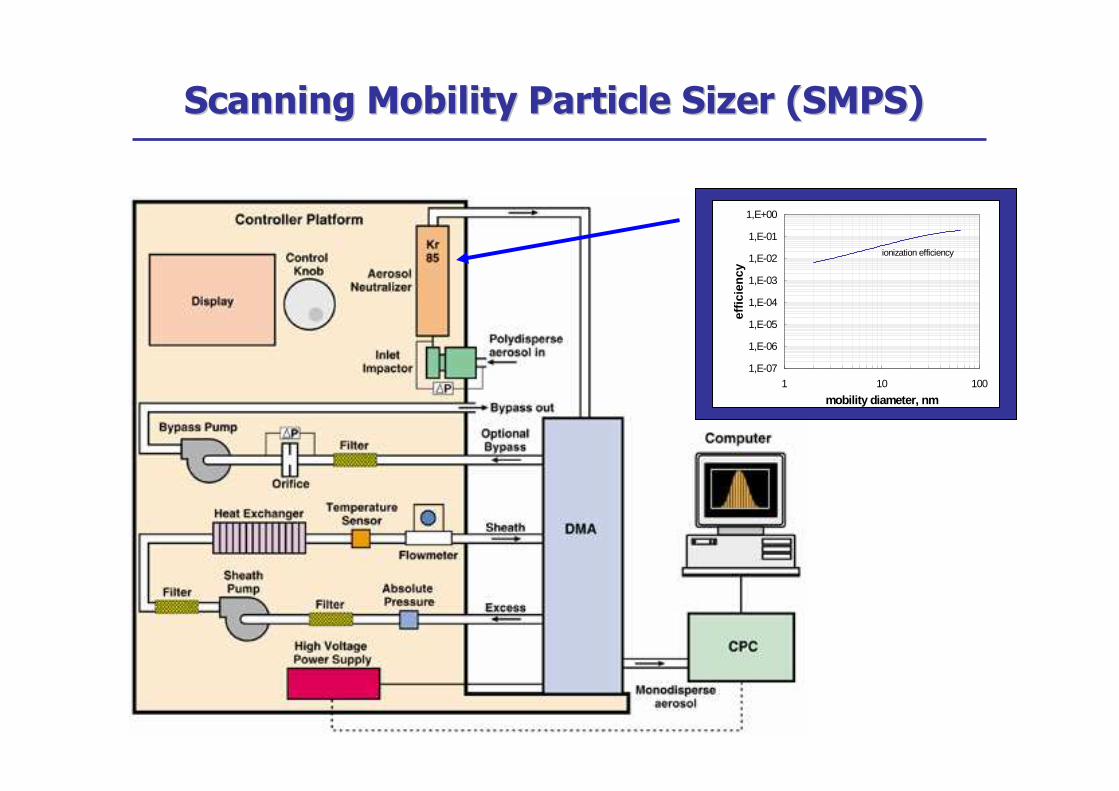
Scanning Mobility Particle Scanning Mobility Particle SizerSizer (SMPS) (SMPS)
ionization efficiency
1,E-07
1,E-06
1,E-05
1,E-04
1,E-03
1,E-02
1,E-01
1,E+00
1 10 100
mobility diameter, nm
effi
cien
cy
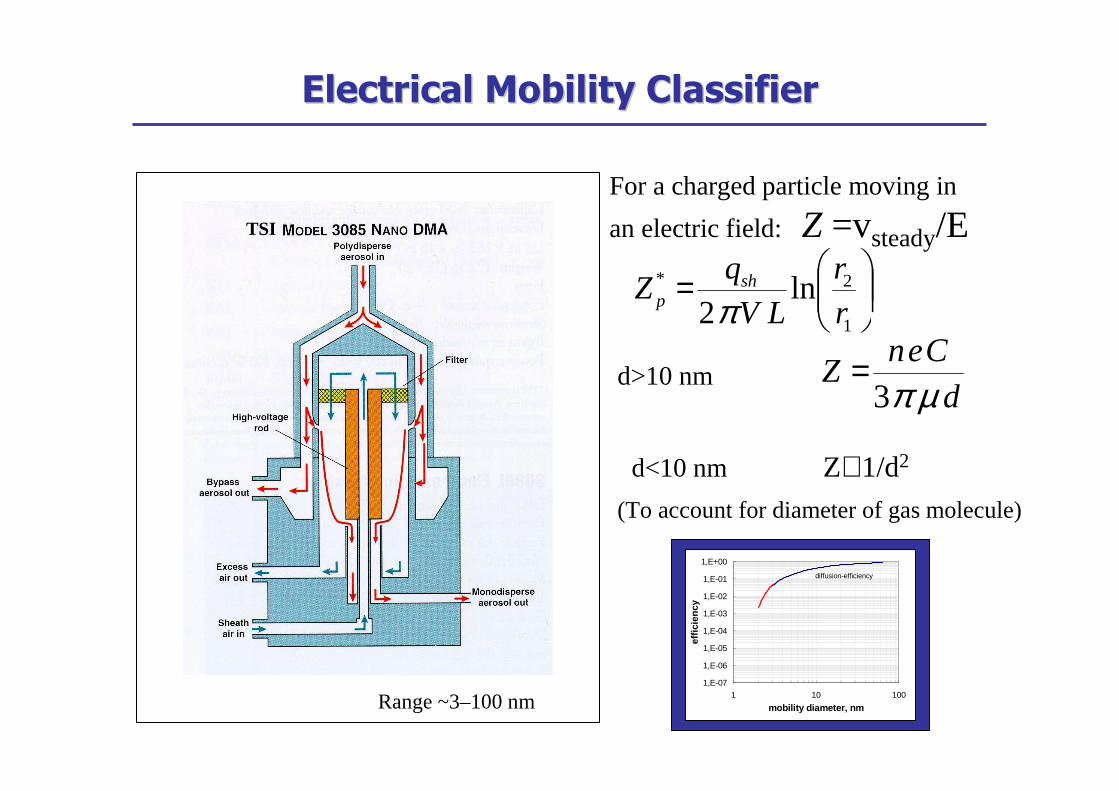
d>10 nm
d<10 nm Z∝1/d2
(To account for diameter of gas molecule)
Range ~3–100 nm
TSI
Electrical Mobility ClassifierElectrical Mobility Classifier
d
CenZ
µπ3=
For a charged particle moving in
an electric field: Z =vsteady/E
=1
2* ln2 r
r
LV
qZ sh
p π
diffusion-efficiency
1,E-07
1,E-06
1,E-05
1,E-04
1,E-03
1,E-02
1,E-01
1,E+00
1 10 100
mobility diameter, nmef
fici
ency

DetectorsDetectors
Condensation Particle Counter Condensation Particle Counter -- Faraday cup electrometerFaraday cup electrometer
• wide range of concentrations(4-5 orders of magnitude).
•particle concentrations > 103-105 cm-3
•Ultra-fast response (~ 50 ms) •No nominal minimum size limit
even below 1 nm),

SamplingSampling
Temperature effect
Typical samplingsystem
Dilution
effect
dilution

ionization
1,E-07
1,E-06
1,E-05
1,E-04
1,E-03
1,E-02
1,E-01
1,E+00
1 10 100
mobility diameter, nm
effi
cien
cy
diffusionCPC
TOTAL
SMPSSMPS
AdvantagesAdvantages ShortcomingsShortcomings
Low efficiency @d<10 nm
-Ionization
-Diffusion losses
-CPC/electrometer sensitivity
-Sampling
Size Distribution Function
Size range 1-100 nm
Polydisperse sample
Not dependent on particle properties and composition
Real time measurements
Field measurement

SMPS SMPS –– exampleexamplepremixed Cpremixed C22HH44/air flames/air flames

AtomicAtomic Force Force MicroscopyMicroscopy
UsingUsing IntermolecularIntermolecular ForcesForces toto MeasureMeasure TopographicTopographic StructureStructure
Forces between the tip and the sample surface cause the cantilever to bend, or deflect.
A detector measures the cantilever deflection as the sample is scanned under the tip.
The measured cantilever deflections allow a computer to generate a map of surface topography

AFM AFM –– examplesexamples
Image of large soot particles
and agglomerates
Image of primary soot particles
And smaller nanoparticles
Image of small nanoparticles

AdvantagesAdvantages
3D Topological images Morphology
Single particle analysis
High resolution on z axis (Ǻ)
Good resolution on x, y axes (10Ǻ)
Pdf determination
ShortcomingsShortcomings
Substrate roughness
Tip artifacts
Detection of small particles in presence of larger ones
Sampling artifacts (size dependent adesion of particles on substrate)
many particle statistics for Pdf
AFM AFM

AFM AFM –– shortcomingsshortcomings

• Minutolo, P., D’Anna, A., D’Alessio, A., “On detection of nanoparticles below the sooting threshold”, Combust. Flame, 152:287-292 (2008).
• D’Anna, A., “Detailed kinetic modelling of particulate formation in laminar premixedflames of ethylene”, Energy & Fuels, 22(3):1610-1619 (2008).
• D’Anna, A., Commodo, M., Minutolo, P., “Particle Inception in a Laminar Premixed Benzene Flame”, Combust. Sci. Technol., 180(5):758-766 (2008).
• D’Anna, A., Sirignano, M., Commodo, M., Pagliara, R., Minutolo, P., “An experimental and modelling study of particulate formation in premixed flames burning methane”, Combust. Sci. Technol., 180(5):950-958 (2008).
• D’Anna, A, Kent, J.H., “A model of particulate and species formation applied to laminar, nonpremixed flames for three aliphatic-hydrocarbon fuels”, Combust. Flame, 152:573-587 (2008).
• C.A. Echavarria, A.F. Sarofim, J. Lighty, A. D’Anna “Modeling and Measurements of SizeDistribution in Premixed Ethylene and Benzene Flames” Proc. Combust. Inst. 32:705-711 (2009).
• A. D’Anna, M. Commodo, M. Sirignano, P. Minutolo, R. Pagliara, “Particle Formation in Opposed-Flow Diffusion Flames of Ethylene: an Experimental and Numerical Study” Proc. Combust. Inst. 32:793-801 (2009).
• A. D’Anna, “Combustion-formed Nanoparticles”, Proc. Combust. Inst. 32:593-613 (2009).
• M. Sirignao, J.H. Kent, A. D’Anna, “Detailed Modeling od Size Distribution Functions and Hydrogen Content in combustio-Formed Particles”, Combust. Flame (2009).
Bibliografia