2 vibrations on sensitive...
TRANSCRIPT

1
IMPACT OF CAST IN PLACE CONCRETE COLUMN CONSTRUCTION 1
VIBRATIONS ON SENSITIVE OCCUPANCIES 2
Pinar Okumus, Michael G. Oliva, Tyler Hoehn 3
Abstract 4
Construction activities required to renovate or enlarge buildings cause vibration levels 5
that could impede facility functionality. Facility and construction managers should have an 6
understanding of the magnitude and frequencies of construction vibrations and how far their 7
effects travel in a building. 8
Vertical elements such as columns in a building transmit the vibrations into other floors. 9
The pouring and vibrating of concrete columns are expected to create high vibrations and 10
transmit them vertically. 11
This paper investigates the vibrations due to construction activities, particularly due to 12
concrete column pours, during the construction of three reinforced concrete buildings. Root 13
mean square of the velocities in the building at varying frequencies and varying building 14
locations was recorded. The vibration levels were compared to the vibration criteria set for 15
human environments by International Standards Organization and by other researchers. 16
Significant increases in velocities were observed during column pours especially for low 17
frequencies. For low frequencies, vibrations exceeded the limits for operation rooms and rat 18
vivariums. Velocities did not decrease consistently with increasing distances from the column 19
pour within one structural bay. 20
Keywords: vibration; construction; cast in place column; pour; reinforced concrete; 21
frequency; acceleration; velocity; existing facility; sensitive facilities 22
23

2
Introduction 1
Construction activities cause different levels of disturbance to the nearby facilities, in the 2
form of noise and vibrations. For renovation, extension, and maintenance projects with buildings, 3
the construction may take place while the building is partially occupied. The negative impact of 4
the construction activities on the current occupants vary based on the occupancy type of the 5
building. Construction activities taking place near vibration sensitive occupancies require special 6
attention to ameliorate the vibrations created. Examples of vibration sensitive situations include 7
research facilities, rat vivariums, MRI and x-ray facilities, lithograph and laser facilities, primate 8
laboratories, surgery rooms, and testing areas. 9
Previous research on vibrations from construction activities covered vibrations occurring 10
outside of structures and the vibrations levels that were expected to be felt inside a nearby 11
structure (Dowding 1996; Amick and Gendreau 2000; New 1990; Issa et al. 2000; Ferahian and 12
Hurst 1969). This study focused on a gap in the literature by measuring the vibrations occurring 13
inside a structure during construction on or in the structure itself. Exposure of occupants to 14
vibrations due to the construction inside the structure is a common case in extension or 15
renovation projects. 16
The impetus for the study was a project on the University of Wisconsin campus where a 7 17
story tower was being added to a building above experimental laboratories and a rodent 18
vivarium, and adjacent to hospital MRI units. Control of vibrations near rodent vivariums is 19
essential to avoid behavioral and psychological effects in the rodents and in maintaining 20
successful operation of the vivarium- particularly during breeding. Continued breeding is vital to 21
maintain the heritage lines of the rodents for research activities. 22

3
This research study is aimed at determining how significant construction induced 1
vibrations could be inside the structure where there is ongoing construction. The goal is to 2
develop an awareness of the magnitude and frequency expected from a specific type of 3
construction activity occurring in a building under construction. 4
The vibrations created at nearby column locations, during construction of three reinforced 5
concrete buildings, were measured. More specifically, the vibrations created during cast in place 6
concrete pours with the use of vibrators were monitored at various distances from the columns. 7
The vibrations measured were compared to the vibration criteria presented in the literature. 8
Conclusions are then developed based on what can be expected in similar buildings during 9
concrete column pours. 10
Background: Vibration Effects 11
The International Standards Organization (ISO) presents guidelines and vibration criteria 12
developed for the effects of vibrations on people in buildings. ISO (1981) drafted a standard 13
called the “Guide to the Evaluation of Human Exposure to Vibration and Shock in Buildings” in 14
1981 that has been in effect since 1974 under the name of ISO 2631. Gordon and Ungar (1983) 15
developed a separate set of vibration criteria (VC) curves related to facilities after reviewing a 16
large number of equipment-specific vibration limit criteria provided by equipment 17
manufacturers. These curves are for guidance only in the design of vibration sensitive facilities. 18
The VC curves were a set of limits of vibrations that could cause equipment to be 19
ineffective and the ISO curves gave limits on human comfort in varying environments. Other 20
vibration limits were developed by the mining industry (Dowding 1996) to help control 21
explosions in mines. 22

4
In limiting vibrational effects on rodents, human vibration detection thresholds have often 1
been used as the basis of controlling criteria for limiting vivarium vibration or motion. The 2
human vibration threshold of 100 micro meters (4000 micro inches) per second velocity is a 3
common limiting vibration criterion for vivarium cages (Papadimos 2010). 4
Buildings Monitored 5
Vibrations in three buildings were monitored. The structural frames of all three buildings 6
were entirely reinforced concrete. The first building construction was an addition project, while 7
the second and third buildings were new constructions. 8
The first building (Building I), Wisconsin Institute of Medical Research (WIMR) Center 9
Tower Expansion Project, in Madison Wisconsin is a medical research facility. The extension 10
project involved the addition of seven floors on top of existing floors which consist of labs for 11
primate and rodent research and housing. The cast in place concrete poured columns were 610 12
mm by 610 mm (24 in by 24 in) in cross section. The floor slab was a waffle slab that was 13
typically 762 mm (30 in) deep where the slab thickness was typically 254 mm (10 in). 14
The second building (Building II), Lakeshore Residence Hall Dormitories in Madison 15
Wisconsin, was a new construction built to serve as dormitories. The building has 29,543 m2 16
(318,000 ft2) of area and 5 floors. The columns that the data was collected from were typically 17
813 mm by 356 mm (32 in by 14 in). The floor slab that the data was collected on was a post 18
tensioned 203 mm (8 in) thick slab. 19
The third building (Building III) was a new mixed use residential and commercial use 20
building construction. The building is very similar to the second building in structural design and 21
had 5 floors. The columns that data was collected at were all 305 mm by 813 mm (12 in by 32 22
in) and the floor slab was a post tensioned 305 mm (12 in) thick floor slab. 23

5
Vibration Measurement Methods 1
Vibrations were captured in the form of acceleration with the use of extra sensitive low 2
frequency range tri-axial DC accelerometers. The tri-axial nature allowed simultaneous 3
measurement of lateral vibrations in addition to vertical vibrations. Capacitance beam 4
accelerometers were selected due to their ability to collect vibration data down to zero frequency. 5
Since buildings have a low natural frequency, this was deemed a necessary factor when 6
collecting data. 7
The data acquisition was accomplished using a 16 bit analog/digital converter with a 8
computer running data acquisition software. Subsequent post-processing provided conversion 9
from acceleration to velocity and analysis of the velocities. Data was collected at 1000 readings 10
per second. 11
The scanning rate was chosen to be ten times the highest frequency to be captured, 100 12
Hz. 100 Hz is the highest limit used in the VC and ISO curves. Data was collected in 30 or 60 13
second increments. 14
Vibration Data 15
Data was collected on multiple visits to each of the three sites during general construction 16
activities and during column pours. The column pour data was collected at Building I, Building 17
II and Building III during a total of seven, six and five column pours, respectively as summarized 18
in Table 1. The readings were taken during several visits. 19
Table 1. Number of column pours and visits to collect vibration data 20
Building Number of visits Number of column pours
Building I 2 visits 3 + 4 pours
Building II 3 visits 3 + 2 + 1 pours

6
Building III 1 visit 5 pours
For each column, data was collected from multiple locations at varying distances of 1.5 m 1
(5ft), 3.0 m (10 ft), 6.1 m (20 ft) and 9.1 m (30 ft) from the columns as shown in Figure 1. Figure 2
1 (a) shows sensors placed at the column base on each side of the column. Figure 1 (b) shows 3
sensor at a measured distance from the column. Distances measured were kept within one 4
structural bay of the building. Velocities were measured in North-South (N-S), East-West (E-W) 5
and vertical directions of the buildings. 6
Vibration measurements were first recorded during general construction activities, i.e. 7
before the column pour started. These measurements are referred as baseline measurements. 8
Then, measurements were taken during column pours to identify their impact on vibrations. 9
These measurements will be referred as loading measurements. 10
11
Figure 1. Sensor Placement at the column (a) and at varying distances from the column (b) 12
The initial baseline measurements were taken while other general construction activities 13
were ongoing, rather than early in the day before construction started, to minimize variables that 14
could have changed during the long break between an early baseline and the later loading 15
readings. Variables that could affect the comparison included: significant changes in the wind 16
velocity and direction, change in the volume of roadway traffic nearby. 17
a b
7
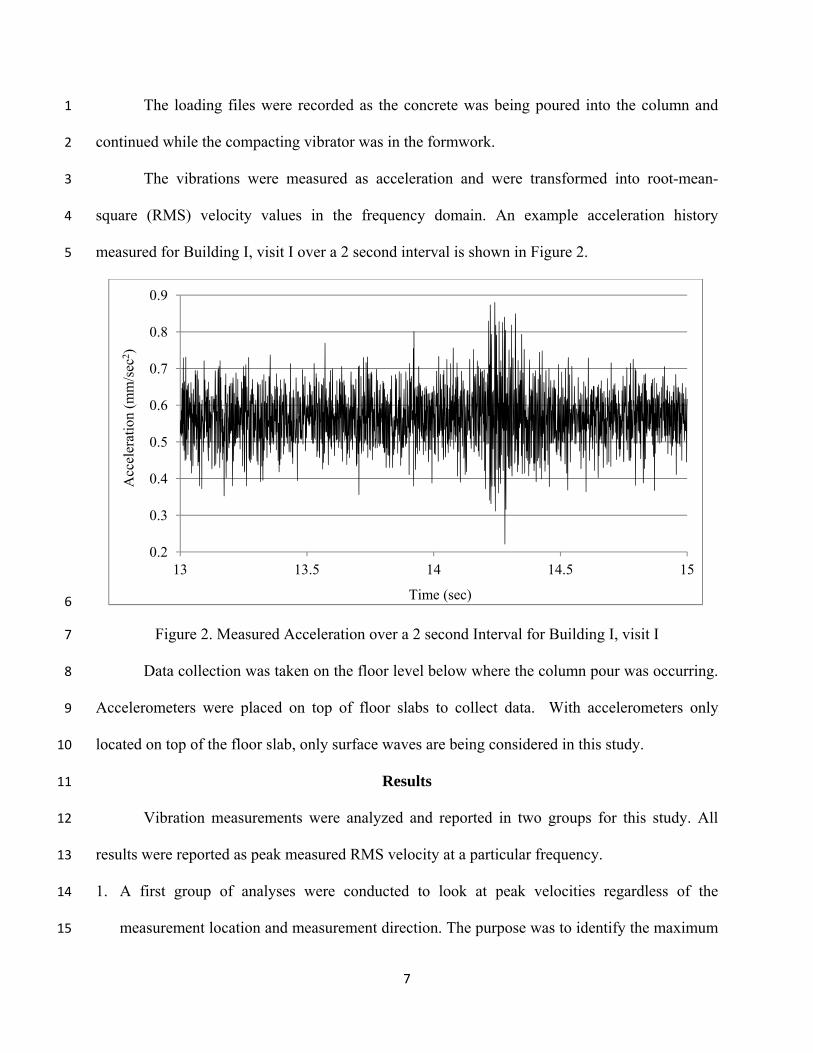
The loading files were recorded as the concrete was being poured into the column and 1
continued while the compacting vibrator was in the formwork. 2
The vibrations were measured as acceleration and were transformed into root-mean-3
square (RMS) velocity values in the frequency domain. An example acceleration history 4
measured for Building I, visit I over a 2 second interval is shown in Figure 2. 5
6
Figure 2. Measured Acceleration over a 2 second Interval for Building I, visit I 7
Data collection was taken on the floor level below where the column pour was occurring. 8
Accelerometers were placed on top of floor slabs to collect data. With accelerometers only 9
located on top of the floor slab, only surface waves are being considered in this study. 10
Results 11
Vibration measurements were analyzed and reported in two groups for this study. All 12
results were reported as peak measured RMS velocity at a particular frequency. 13
1. A first group of analyses were conducted to look at peak velocities regardless of the 14
measurement location and measurement direction. The purpose was to identify the maximum 15
0.2
0.3
0.4
0.5
0.6
0.7
0.8
0.9
13 13.5 14 14.5 15
Acc
eler
atio
n (m
m/s
ec2 )
Time (sec)

8
vibrations created during regular construction activities and during column pours. These 1
results were then compared to vibration limits set by ISO and VC, and the common threshold 2
used for vivariums- 100 μ-m/sec (4,000 μ-inch/sec) of velocity (Papadimos 2010). 3
2. A second group of analyses focused on determining if vibration velocities dissipate with 4
increasing distance from the column pour. These analyses were looked at peak velocities 5
developed at different distance, regardless of the direction of motion. 6
Results of Group 1 Measurements 7
Baseline Vibrations during General Construction Activities 8
Figure 3 shows the maximum RMS velocities measured at each site before the column 9
pours start: i.e. baseline measurements. Figure 3 also shows the VC (VC-A and VC-B) and ISO 10
criteria (workshop, office, residential day, and operation room) curves for comparison. 11
VC-A is the easiest criteria to achieve among the VC curves. VC-A criteria is adequate 12
for locations with optical microscopes to 400x, microbalances, optical balances, proximity and 13
projection aligners. VC-B curve is the limit for optical microscopes to 1000x, inspection and 14
lithography equipment to 3 micrometer line widths. ISO criteria set the limits of vibrations for 15
when the use of the facility is a workshop, office, residential day and operating room. The 16
threshold for human vibration perception commonly used for vivarium projects of 100 μ-m/sec 17
(4000μ-in/sec) is also marked on the figure. 18

9
1
Figure 3. Maximum Baseline RMS Velocities 2
Figure 3 indicates that during general construction activities, without column pours and 3
vibrator usage, all buildings performed in compliance with the limiting vibration criteria of ISO 4
for office buildings. The accelerations and velocities, however exceeded the limits for residential 5
day use, and were not suitable for the use of the equipment determined by VC A and B criteria. 6
Vibrations for Building I-Visit I, Building I-Visit II and Building II-Visit I were lower than the 7
others and satisfied the limits of ISO for operation rooms, but not VC-A and VC-B criteria. 8
Velocities in lower frequencies exceeded the 100 μ-m/sec (4000μ-in/sec) threshold commonly 9
used for vivariums for all buildings monitored. 10
0.01
0.1
1
10
1 10 100
RM
S V
eloc
ity
(mm
/sec
)
Frequency (Hz)
Building I - Visit IBuilding I - Visit IIBuilding II - Visit IBuilding II - Visit IIIBuilding II - Visit IIIBuilding III - Visit ICommon Vivarium Treshold
Workshop
Office
Residential Day
Operation Room
VC-A
VC-B

10
The differences between the baseline readings for the same buildings on different days 1
are attributed to the changing environmental conditions such as wind and varying general 2
construction activities. The baseline measurements presented in Figure 3 will be compared to the 3
vibrations that occur during concrete column pours. General construction activities were 4
assumed to be continuing during the column pours. 5
Vibrations during Cast in Place Concrete Column Pours 6
Figure 4 shows the maximum RMS velocities at all of the sites when a concrete column 7
was being poured. In general, vibrations were higher during the column pour then during the 8
baseline as expected. Maximum vibrations exceeded the limits of VC-A and VC-B for all site 9
visits. Only the vibrations at Building II on Visit III were small enough to be tolerable for an 10
operation room according to ISO. Maximum vibrations for all buildings and site visits were 11
under the limits for ISO office space. For frequencies below 10 Hz, the commonly used vivarium 12
threshold velocity of 100 μ-m/sec (4000μ-in/sec) was exceeded for all buildings. This shows 13
that the column pour alone can create vibrations that are sensible to research activities or rodents 14
at frequencies below 8Hz. 15

11
1
Figure 4. Maximum Loading RMS Velocities 2
Increase in Vibrations due to Cast in Place Concrete Column Pours 3
The expected increase in velocities due to construction is likely to be the most practical 4
piece of information needed by contractors to prepare facilities when concrete column pours are 5
to occur. The increase in velocity was found at each frequency by finding the maximum loading 6
velocity from each column pour and subtracting the maximum baseline velocity recorded before 7
the pour, for that specific direction of measurement. Increases in measured floor RMS velocities 8
for each building and site visit are shown in Figure 5. 9
0.01
0.1
1
10
1 10 100
RM
S V
eloc
ity
(mm
/sec
)
Frequency (Hz)
Building I - Visit IBuilding I - Visit IIBuilding II - Visit IBuilding II - Visit IIIBuilding II - Visit IIIBuilding III - Visit ICommon Vivarium Treshold
Workshop
Office
Residential Day
Operation Room
VC-A
VC-B

12
1
Figure 5. Increase in RMS Velocity due to Column Pours 2
Figure 5 shows that in the lower frequency range there are higher increases in velocities 3
when the concrete columns are poured. For each of the site visits there are significant increases 4
in velocities in the range of 1.25 Hz – 10 Hz. The highest increase in RMS velocity at lower 5
frequencies is also shown in Figure 6 on a linear scale. 6
7
8
0.01
0.1
1
1 10 100
RM
S V
eloc
ity
(mm
/sec
)
Frequency (Hz)
Building I - Visit IBuilding I - Visit IIBuilding II - Visit IBuilding II - Visit IIIBuilding II - Visit IIIBuilding III - Visit I
Maximum possible increase in RMS velocity

13
1
Figure 6. Increase in Maximum RMS velocity in linear scale 2
By using the two max points on Figure 5 a conservative envelope can be developed for 3
predicting velocity increases that might occur on future projects. This envelope can be used to 4
describe the likely maximum amount of an increase likely to occur during a concrete column 5
pour. The envelope line is marked as maximum possible increase in RMS velocity in Figure 5 6
and is defined by Equation (1). 7
y(x) = − 0.051 ln(x) + 0.404 Equation (1) 8
In this equation x is defined to be the frequency in Hz, and y(x) is the increase in the RMS 9
velocity in mm/sec. 10
Results of Group 2 Measurements 11
0
0.05
0.1
0.15
0.2
0.25
0.3
0.35
0.4
0.45
0 10 20 30 40 50 60 70 80
RM
S V
eloc
ity
(mm
/sec
)
Frequency (Hz)
Building I - Visit IBuilding I - Visit IIBuilding II - Visit IBuilding II - Visit IIIBuilding II - Visit IIIBuilding III - Visit I

14
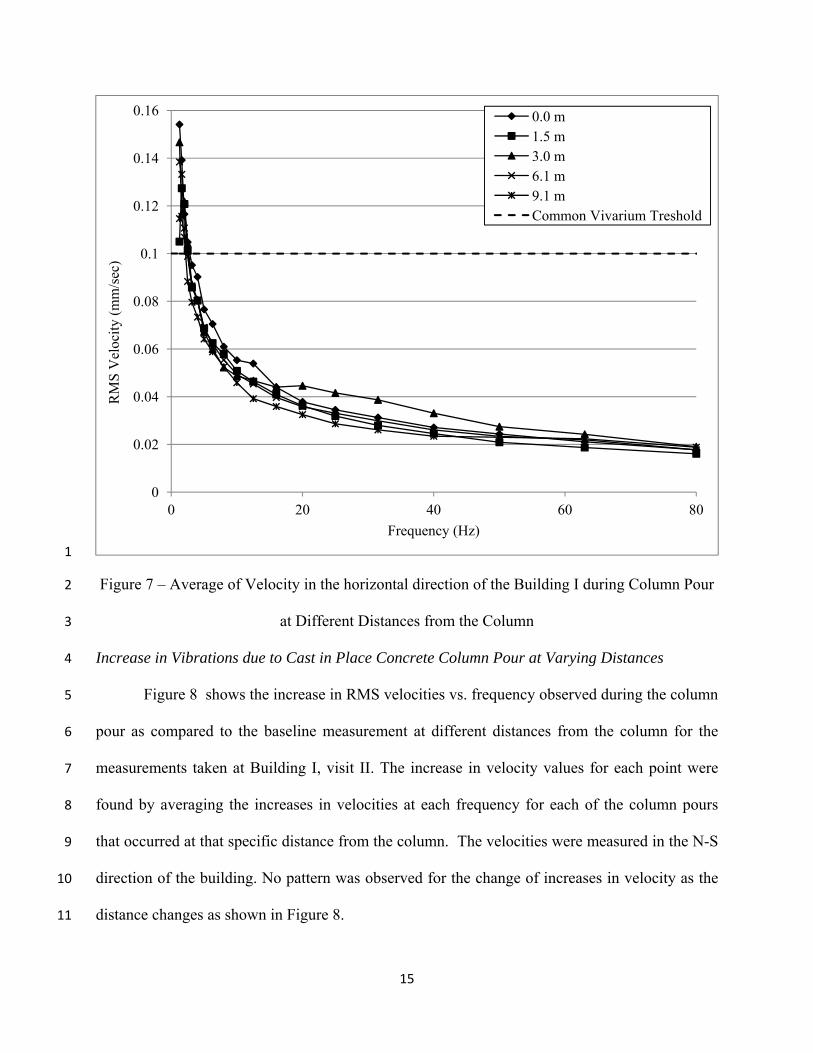
Vibrations during Cast in Place Concrete Column Pour at Varying Distances 1
These vibrations were measured at varying distances from the source of vibration, the 2
column above which a concrete pour was occurring. Sensors were placed at 1.5 m (5ft), 3.0 m 3
(10 ft), 6.1 m (20 ft) and 9.1 m (30 ft) from the column. Figure 7 shows the average velocities in 4
the lateral N-S (horizontal) floor direction measured during a column pour for Building I, visit II. 5
The largest set of data for multiple distances was collected on this visit, together with Building 6
III, visit I. The results of the measurements from other buildings and results taken in other 7
directions led to similar conclusions. 8
The figure shows that there was no significant impact of the distance from the column on 9
the velocities in the N-S direction (direction parallel to the longer dimension of the building). 10
The velocities measured do not differ significantly or consistently at varying distances from the 11
column during a column pour. 12
15
1
Figure 7 – Average of Velocity in the horizontal direction of the Building I during Column Pour 2
at Different Distances from the Column 3
Increase in Vibrations due to Cast in Place Concrete Column Pour at Varying Distances 4
Figure 8 shows the increase in RMS velocities vs. frequency observed during the column 5
pour as compared to the baseline measurement at different distances from the column for the 6
measurements taken at Building I, visit II. The increase in velocity values for each point were 7
found by averaging the increases in velocities at each frequency for each of the column pours 8
that occurred at that specific distance from the column. The velocities were measured in the N-S 9
direction of the building. No pattern was observed for the change of increases in velocity as the 10
distance changes as shown in Figure 8. 11
0
0.02
0.04
0.06
0.08
0.1
0.12
0.14
0.16
0 20 40 60 80
RM
S V
eloc
ity
(mm
/sec
)
Frequency (Hz)
0.0 m1.5 m3.0 m6.1 m9.1 mCommon Vivarium Treshold

16
1
Figure 8 – Average of Increase in Velocity for Horizontal Direction of Building during Column 2
pour at Different Distances from the column 3
Observations and Conclusions 4
The objective of this research project is to obtain an understanding of the magnitudes of 5
vibrations that could be expected in a concrete structure from concrete column pours and use of 6
vibrators during construction. Understanding what level of vibration is created in the building is 7
crucial for locations that host research facilities with sensitive equipment or animals. This 8
research measured vibrations in three reinforced concrete buildings during general construction 9
activities and cast in place column pours. The results were used to compare vibrations expected 10
-0.01
0
0.01
0.02
0.03
0.04
0.05
0.06
0.07
0 10 20 30 40 50 60 70 80
Incr
ease
in R
MS
Vel
ocit
y (m
m/s
ec)
Frequency (Hz)
0.0 m
1.5 m
3.0 m
6.1 m
9.1 m

17
to standard limits for human comfort, to limits for tool operations and to a commonly accepted 1
limit for projects adjacent to rodent vivariums. 2
The results showed that all the buildings monitored were suitable for use as an office 3
space, and three readings indicated the corresponding buildings could accommodate operation 4
rooms as set by the limits of ISO during general construction activities. Significant increases in 5
RMS velocities, however, occur due to cast in place column pours on the floor below the 6
construction activity. Only one set of velocity readings (Building II on Visit III) indicated the 7
building to be suitable for operation room use when the column concrete pour was ongoing. 8
An increase in RMS velocity due to a column pour is most significant for vibrations with 9
low frequencies. For frequencies lower than 10 Hz, the RMS velocities exceed 100 μ-m/sec 10
(4000μ-in/sec) (human threshold used commonly for vivarium) or the limits for operating rooms 11
set by ISO. For higher frequencies the increase in RMS velocity is significantly smaller. 12
No consistent decrease in RMS velocity was observed with increasing distances from the 13
column above which the pour was occurring pour. This indicates that different frequencies might 14
be excited at varying distances from a column due to the pour and the natural vibration 15
characteristics of the floor. The reason for this is likely that the floor was vibrating in different 16
modes. Within one bay of the building, the velocities remained similar at varying distances from 17
the column pour. 18
For reinforced concrete structures used as research facilities with rodents sensitive to 19
vibrations, motion large enough to cause disturbance in rodents should be expected on the floor 20
directly below a column pour. These vibrations are significantly higher at low frequencies. The 21
research showed that placing sensitive laboratories away from the column pour within the 22
structural bay is not a viable way of avoiding disturbance to research animals. 23

18
Notation 1
y(x) = Increase in RMS velocity (mm/sec) 2
x = Frequency (Hz) 3
References: 4
Amick, H., Gendreau, M. (2000). “Construction Vibrations and Their Impact on Vibration-5
Sensitive Facilities,” Construction Congress VI, ASCE, Orlando, FL, 758-767. 6
Dowding, C.H. (1996). Construction Vibrations, Upper Saddle River, NJ, Prentice-Hall. 7
Ferahian, R.H., and Hurst, W.D. (1969). “Vibration and Possible Building Damage due to 8
Operation of Construction Machinery,” National Research Council of Canada, 399, 144-155. 9
Gordon, C. G., and Ungar, E. E. (1983). “Vibration Criteria for Microelectronics Manufacturing 10
Equipment,” Proceedings of Inter-Noise 83, Edinburgh, Scotland, 487-490. 11
International Standards Organization (1981). “Guide to the Evaluation of Human Exposure to 12
Vibration and Shock in Buildings (1 Hz to 80 Hz),” Draft Proposal ISO 2631/DAD1. 13
Issa, M.A., Yousif, A.A., and Issa, M.A. (2000). “Effect of Construction Loads and Vibrations 14
on New Concrete Bridge Decks,” Journal of Bridge Engineering, 5(3), 249-268. 15
New, B.M. (1990). “Ground Vibration Caused by Construction Works,” Tunneling and 16
Underground Space Technology, 5(3), 179-190. 17
Papadimos, C., Gorton, A., Wowk, R. (2010). “Acoustic and Vibration Considerations for 18
Animal Research Facilities: Planning through Construction,” ALN Magazine, May-June. 19