2003 – 2006 monitoring cycle report u.s. department of ... school year all students are proficient...
TRANSCRIPT

2003 – 2006 Monitoring Cycle Report
U.S. Department of Education
Office of Elementary and Secondary Education
Student Achievement and School Accountability Programs
Zollie Stevenson, Jr., Ph.D., Director Student Achievement and School Accountability Programs
Charles Laster, Monitoring and Audit Group Leader
Student Achievement and School Accountability Programs
October 21, 2008

Table of Contents
Executive Summary ……………………………………………………………………….…..…i Introduction ………………………………………………………………………………1 The Monitoring Process ……………………………………………………...……………2 Results of Monitoring ………………………………………………………………..……5 ED Follow-up to Monitoring …………………………………………..…………………13 Implications for the Future …………………………………………………………………… 16 Appendices:
Appendix A: Title I, Part A Monitoring Indicators, 2003-2006 Appendix B: State-by-State Summaries of Numbers and Percentage of Indicators for which States were in Compliance, 2003-2006 Appendix C: State-by-State Summaries of Numbers and Percentage of Indicators for which States were in Compliance, by Year, 2003-2006 Appendix D: State-by-State Numbers and Percentage of Indicators for which States were in Compliance, by Indicator Area, 2003-2006 Appendix E: State-by-State Numbers and Percentage of Indicators for which States were in Compliance, by Indicator Area, by Year, 2003-2006 Appendix F: Comparison of Indicators for all Years, 2003–2006

i
United States Department of Education
Office of Elementary and Secondary Education
Student Achievement and School Accountability Programs
Title I, Part A 2003 – 2006 Monitoring Cycle Report
Executive Summary
Introduction The purpose of this document is to report to educators and the public on the outcomes of the first cycle of the U.S. Department of Education’s (ED) monitoring of programs under Title I, Part A of the Elementary and Secondary Education Act (ESEA), as amended by the No Child Left Behind Act (NCLB). Title I, Part A is designed to promote improved achievement of all students, especially educationally at-risk students who attend schools with high concentrations of students from low-income families, by holding schools accountable for steadily increasing the percentage of students performing at the proficient level on state assessments so that by the end of the 2013-14 school year all students are proficient or advanced in both reading and mathematics. The purpose of monitoring is to ensure that state educational agencies (SEAs) implement programs under Title I, Part A using policies and procedures at all levels (State, school district and school) that comply with the overall intent and specific provisions of Title I, Part A. Primary responsibility for administering the Title I program lies with Student Achievement and School Accountability Programs (SASA) in ED’s Office of Elementary and Secondary Education (OESE). SASA monitors state and local implementation of Title I, Part A on a cyclical basis. SASA staff most recently completed monitoring of all states1 over the course of a three-year monitoring cycle that began on October 1, 2003 and was completed by September 30, 2006. Monitoring during this cycle was structured around three broad areas that form a conceptual framework for the major types of activities necessary for administering Title I, Part A: accountability, instructional support, and fiduciary responsibilities. Key indicators in the three broad areas were used during on-site monitoring to evaluate state compliance with statutory and regulatory requirements. Monitoring activities included desk reviews and document reviews, telephone conversations as needed, and on-site visits to SEAs and selected school districts and schools. SASA staff monitored between 14 and 21 states each year. Over the three-year monitoring cycle, some changes, based on experience using the monitoring protocol and in response to developments in the policy environment and field, were made to the monitoring procedures and indicators. Results of Monitoring
Observation #1 – The overall percentage of indicators for which states were in compliance decreased during the three-year monitoring cycle.
1 In this report, references to “all states” include all 50 states plus the District of Columbia, Puerto Rico, and the Department of the Interior/Bureau of Indian Education.

ii
The percentage of indicators for which states were in compliance provides a measure of the overall strength of program implementation and the degree to which states were in compliance with key Title I, Part A requirements. Strong implementation is critical. If the program is not implemented as intended, it is less likely that its intended effect of improving student achievement will be realized. The percentage of indicators for which states were out of compliance provides an indication of the amount and range of change needed for states to come into full compliance with Title I, Part A requirements. Nationally, from 2003 to 2006, the percentage of all indicators for which states were in compliance was just under two-thirds (65 percent), ranging from a high of 79 percent for states monitored in 2003-04 to a low of 58 percent for states monitored in 2005-06. State experience in implementing NCLB might have been expected to lead to better implementation over time. However, the percentage of indicators for which states were in compliance decreased over the three-year cycle. (See Table S.1.) States were not in compliance with between one and 17 of approximately 30 indicators. Over half of the states (28) were not in compliance with 10 or more indicators and nine were out of compliance with 15 or more indicators. Three states were in compliance with all but three or fewer indicators. The remaining states were out of compliance with from four to nine indicators. However, within the three areas, some states were in compliance with all indicators.
Table S.1
Percentages of Indicators for Which States Were in Compliance, 2003-2006
Indicator Area Percentage of Indicators for Which States Monitored Were in Compliance
School Year 2003-04 2004-05 2005-06 All Years
All Indicators 79 62 58 65 Accountability 86 68 70 73 Instructional Support 66 46 62 58 Fiduciary Responsibilities 83 68 44 64
Observation #2 – Rates of state compliance within the three areas varied. The percentages of indicators for which states were in compliance within the three areas varied widely, ranging from a high of 73 percent for accountability to a low of 58 percent for instructional support. Variation in rates of compliance was greater when compared year to year. For example, states monitored in 2003-04 were in compliance with 83 percent of all fiduciary responsibilities indicators, but this percentage dropped to 44 percent for states monitored in 2005-06. (See Table S.1.) Differences in the percentage of indicators found to be out of compliance also may reflect differences among the groups of states monitored each year. States’ rates of compliance within the three areas also varied notably. Few states showed strong compliance in all three areas, while about half of the states had weak compliance in one or two of the three areas. By indicator area, more states were out of compliance with more than half of the fiduciary responsibilities indicators (16 states) and instructional support indicators (15 states) than the accountability indicators (5 states).

iii
Observation #3 – State compliance with indicators was strongest in the area of accountability, with the highest numbers of states in compliance with requirements for content standards and grants for state assessments. State compliance was strongest in the accountability area, and state progress in this area continued as state assessment systems evolved to meet NCLB requirements for the end of the 2005-06 school year. Overall, states were in compliance with 73 percent of the accountability indicators. Over half of the states were in compliance with all but two or fewer of the accountability requirements. The highest number of states were in compliance with requirements for content standards (51 states) and grants for state assessments under ESEA section 6111 (52 states). The smallest number of states were in compliance with all requirements for the accountability workbooks (28 states) and annual report cards (30 for SEA report cards and 21 for local educational agency (LEA) report cards). ED’s technical assistance and emphasis on accountability likely contributed to relatively higher rates of state compliance with the accountability indicators. Increased visibility on accountability has characterized ED’s implementation of NCLB. The requirement for states to develop “accountability workbooks” that outlined in detail how states planned to implement a wide range of accountability provisions in Title I, Part A, as well as annual ED review and approval of changes to the accountability workbooks, has provided a focus on and formalization of the implementation of accountability requirements that appear to have supported improvement and higher rates of compliance. State accountability workbooks generally clarified state policies reviewed during monitoring, and, notably, states that were out compliance for the accountability workbook component typically fell short on only a minority of the requirements included in this component. SASA staff has provided on-going technical assistance tailored to specific state needs and, in some cases, ED has paid for consultants to provide intensive and specialized technical assistance to states. Finally, ED peer reviews of state assessment systems for NCLB, beginning in 2004-05, have addressed most of the accountability requirements, and often included the provision of technical assistance to states. Observation #4 – States were weakest overall in compliance with the indicators for instructional support, especially with regard to parental involvement, schoolwide programs, and requirements for school improvement, corrective action and restructuring. State compliance was weakest in the area of instructional support, despite the fact that this is the area most directly related to classroom activities and the teaching and learning that the Title I program is intended to improve. Overall, states were in compliance with 58 percent of the instructional support indicators. In none of the years of monitoring were the states monitored in compliance with more than two-thirds of these indicators. Fifteen states were in compliance with less than half of the indicators in this area, and 10 states were in compliance with 25 percent or less of the indicators. Complying with certain instructional support program components appeared to be particularly challenging to states. States were weakest overall in compliance with requirements for parental involvement, and requirements for schoolwide programs. Sixteen states were in compliance with parental involvement requirements, which included parent notification requirements for public school choice and supplemental educational services; and 24 states were in compliance with requirements for schoolwide programs.

iv
Observation #5 – States had difficulty complying with indicators in the fiduciary responsibilities area, with no improvement over time. Most frequently, states showed weak compliance concerning services to private school children, comparability, and allocations, reallocation and carryover. Though various factors may have influenced the determination of states’ rates of compliance with the fiduciary responsibilities indicators, results indicate significant limitations in compliance in this area. States monitored in 2003-04 were in compliance with 83 percent of the fiduciary responsibilities indicators, and states monitored in 2005-06 were in compliance with 44 percent of these indicators despite their additional years of experience with the requirements. Sixteen states were in compliance with less than half of the indicators in this area. Monitoring showed that states were struggling more with some fiduciary responsibilities indicators than others, such as equitable services to private school children and comparability requirements. Both procedural and substantive issues may have contributed to the decrease over time in rates of compliance in the fiduciary responsibilities area. The rates at which states were out of compliance with fiduciary responsibilities is a concern both because of the specific issues involved and because of how they interact with the overall purposes of Title I, Part A. For example, reservations of funds requirements help ensure that mandated funding for Title I public school choice and supplemental educational services is available to parents of eligible children wishing to exercise these options. Though overall compliance with Title I school choice and supplemental educational services is considered in the instructional support indicator area, it is the fiduciary responsibilities indicator regarding allocation, reallocation and carryover provisions that addresses reservations of funds for Title I school choice and supplemental educational services. SASA’s monitoring showed that 24 states were not in compliance with the indicator for reservation of funds for a number of program requirements. Observation #6 – States began placing greater emphasis on their implementation of NCLB by making monitoring of their districts a higher priority than they had previously. During and since the 2003-2006 monitoring cycle, many states modified their processes for monitoring their school districts and modeled their new procedures on the SASA monitoring process, steps that have resulted in more effective implementation of Title I nationwide. In general, states developed more comprehensive processes for conducting their monitoring of subgrantees, including procedures for more effectively identifying compliance issues and ensuring that timely corrective actions are implemented. States also better integrated their existing systems for promoting compliance, including self-assessments, reviews and approvals of school district applications and complaints, and other mechanisms for data collection and management.
Follow-up to Monitoring State-specific monitoring reports were issued to the chief state school officer following each on-site state review. These monitoring reports summarized states’ compliance status for each of the indicators. The reports also included findings, which specified the particular compliance problem or problems related to an indicator and corrective actions prescribed for each finding. As described above, states were not in compliance with between one and 17 indicators each. The number of findings for individual states ranged from one to 37. States were required to respond to every finding for each indicator for which they were out of compliance by developing a corrective action plan to address the finding and submitting to ED documentation that the plan

v
had been implemented. The monitoring process was not considered closed until a State’s corrective action plan was approved. Other actions taken by ED in response to monitoring findings varied based on the finding. Placing conditions on state Title I, Part A grant awards was an additional action taken by ED for some states as a result of the compliance problems identified through monitoring. These conditions were applied to two states’ grant awards as a result of monitoring in 2003-04, to 13 states’ grant awards as a result of monitoring in 2004-05, and to nine states’ grant awards as a result of monitoring in 2005-06. ED also discussed the withholding of funds from states, sent letters to states addressing late notification to schools of prior year assessment results, and initiated phone calls to chief state school officers regarding other issues. Beyond follow-up with states on specific compliance issues, SASA has used findings from the 2003-2006 monitoring cycle to inform ED’s efforts to better support states. The technical assistance provided as a result of monitoring findings has taken many forms, from the development of new program guidance and toolkits to enhanced outreach efforts and individualized support from SASA staff. States’ responses to monitoring reports involved the implementation of corrective actions that have resulted in more effective administration of programs under Title I, Part A. For example, states followed two types of approaches in responding to findings related to lack of alignment between their accountability workbooks and actual implementation. One group of states made corrections to their NCLB accountability workbooks based on findings from monitoring while another group of states changed their practices to align with their accountability workbooks and come into compliance with NCLB. Implications for the Future: Lessons Learned and the Future of Monitoring The purpose of SASA’s monitoring efforts remains to ensure that SEAs comply with the overall intent and specific provisions of Title I, Part A with the goal of ensuring that all children are proficient in reading and mathematics by 2013-14. At the same time, the results, outcomes and observations from the monitoring cycle for 2003-2006 provide some lessons for the future on efforts to improve teaching and learning and program implementation. Both issues of quality and compliance of programs under Title I, Part A need attention. The program overall is unlikely to have its full, intended effects on student achievement if it is not implemented well. The rates at which states were out of compliance with all indicators and within and across the three areas indicate the need to attend to basic issues of compliance as a necessary foundation for effective program quality. ED is responding to the unevenness in quality of implementation across states with efforts such as targeted, issue-specific monitoring and a wider range of follow-up actions to identified compliance problems. Activities in some areas leverage more change than in others, as illustrated earlier by examples of indicators in one area affecting implementation in other areas. SASA already has increased successfully its focus on one such area (improving SEAs’ monitoring of their districts and schools). SASA similarly can use the monitoring process to emphasize efforts in other areas central to Title I, Part A, such as strengthening schools and student achievement. SASA needs to build on efforts that appear to have strengthened programs under Title I, Part A during the 2003-2006 monitoring cycle. Based on the observation that ED’s policies, procedures and enforcement in the area of accountability appear to have contributed to relatively stronger

vi
implementation in this area, SASA’s approach to supporting the accountability area may serve as a model for strengthening implementation in the other two areas. SASA’s success in using the monitoring process to promote improvements in states’ monitoring of their school districts also highlights the leverage ED can use in the future for improving state implementation of programs under Title I, Part A.
Finally, SASA anticipates that the 2006-2009 monitoring cycle also will yield valuable information on both progress and new or persistent challenges in implementing programs under Title I, Part A. The monitoring process has been improved, and ED has provided technical assistance to states in identified areas of weaknesses. Perhaps most importantly, despite lower than desired levels of compliance during 2003-2006, states significantly enhanced their assessment and accountability infrastructures during this period, and ED is hopeful that SASA’s monitoring in 2006-2009 will reflect these improvements. Future reports will document the results and outcomes of monitoring during 2006-2009 and beyond.

1
United States Department of Education
Office of Elementary and Secondary Education
Student Achievement and School Accountability Programs
Title I, Part A 2003 – 2006 Monitoring Cycle Report
Introduction Purpose of This Report The purpose of this document is to report to educators and the public on the outcomes of the first cycle of the U.S. Department of Education’s (ED) monitoring of programs under Title I, Part A of the Elementary and Secondary Education Act (ESEA), as amended by the No Child Left Behind Act (NCLB). This report describes the monitoring process for 2003-2006, presents the results and outcomes of monitoring, and highlights observations on trends in the implementation of programs under Title I, Part A. As with the monitoring process itself, this report focuses on three key areas of Title I, Part A implementation: accountability, instructional support and fiduciary responsibilities. Purpose of Title I, Part A Title I, Part A is designed to promote improved academic achievement of all students, especially educationally at-risk students who attend schools with high concentrations of students from low-income families, by holding schools accountable for steadily increasing the percentage of students performing at the proficient level on state assessments so that by the end of the 2013-14 school year all students are proficient or advanced in both reading and mathematics. To accomplish this goal, Title I, Part A requires states to establish accountability systems that hold all students to the same academic standards, promotes the use of effective instructional supports, and provides funding to support these activities. Because of these requirements and because state educational agencies (SEAs) are responsible for monitoring the implementation of programs under Title I, Part A in their school districts and schools, the role of states is critical in effectively implementing and achieving the purposes of Title I, Part A. Within ED, primary responsibility for administering the Title I program lies with Student Achievement and School Accountability Programs (SASA) in the Office of Elementary and Secondary Education (OESE). Purpose of Monitoring for Title I, Part A Monitoring the use of Federal funds by grantees is an essential function of ED. The purpose of SASA monitoring is to ensure that SEAs implement programs under Title I, Part A using policies and procedures at all levels (state, school district and school) that comply with the overall intent and specific provisions of Title I, Part A.1 1
1 In addition to monitoring for Title I, Part A (including services to eligible private school students), SASA has monitored the implementation of Even Start Programs (Title I, Part B, Subpart 3); the Neglected and Delinquent State Agency and Local Educational Agency Program (Title I, Part D); and Education for Homeless Children and Youth Grants for State and Local Activities (McKinney-Vento Homeless Assistance Act of 1987, as amended, Title VII, Subtitle B).

2
The Monitoring Process2 SASA monitors state and local implementation of programs under Title I, Part A on a cyclical basis. SASA staff most recently completed monitoring of all states3 over the course of a three-year monitoring cycle that began on October 1, 2003 and was completed by September 30, 2006. Monitoring during this cycle was structured around three broad areas that form a conceptual framework for the major types of activities necessary for administering the program:
• Accountability (standards, assessments and accountability); • Instructional support; and • Fiduciary responsibilities.
Each of these three key areas for monitoring is critical to the implementation of programs under Title I, Part A. Accountability is the broad framework within which schools operate and school improvement happens, and instructional support represents the means through which Title I, Part A works directly to improve student achievement. Fiduciary requirements address the fiscal resources Title I, Part A provides to leverage efforts in the other two areas. In addition, as illustrated in the results section of this report, these major areas are interrelated. Strengths or weaknesses in implementation in any one area are likely to impact the effectiveness of implementation in the other areas. Key indicators in the three broad areas were developed for use during on-site monitoring to evaluate state compliance with statutory and regulatory requirements. These indicators provided a performance standard against which to assess state implementation. They also helped ensure a consistent application of standards across states and monitoring teams. Examples of these indicators include indicators for determining whether SEAs have ensured that school districts have published annual report cards that meet NCLB reporting requirements for disaggregation of achievement data by student group, inclusion of graduation rates, etc. (accountability area); measuring SEA compliance in ensuring that requirements for public school choice and supplemental educational services (SES) are met (instructional support area); and fiscal requirements essential to meeting the purposes of the program, including maintenance of effort, comparability and supplement not supplant provisions of Title I (fiduciary responsibilities area). (See Appendix A for the full list of indicators by year and by area.) Each indicator addressed a specific program component, such as those noted in the previous paragraph. However, because of changes to some indicators during the monitoring cycle (described below), indicator numbers and foci varied slightly across the years of monitoring and therefore the indicators themselves cannot be used to compare results across years. Focusing on the program component represented by the indicators, as is done later in this report, allows for comparisons of state compliance across years by topic. Monitoring activities included multiple approaches to assessing each state’s compliance with the indicators. On-site visits to SEAs and selected school districts and schools (including visits to local educational agency (LEA) charter schools and private schools serving eligible students) formed a central part of the monitoring process. These visits were supported by desk reviews and
1 ED evaluations of Title I also are available. See the Title I section of ED’s Policy and Program Studies Service website at www.ed.gov/about/offices/list/opepd/ppss/reports.html#title.
2 For current information on monitoring, see ED’s Title I Program Monitoring website at www.ed.gov/admins/lead/account/monitoring/index.html.
3 In this report, references to “all states” include all 50 states plus the District of Columbia, Puerto Rico, and the Department of the Interior/Bureau of Indian Education.

3
document reviews completed prior to the on-site reviews and follow-up telephone conversations with selected school districts that were not visited. Typically, five to six SASA staff members participated in on-site monitoring visits, which lasted four to five days. During these visits, SASA staff interviewed SEA and school district staff, principals, teachers, parents, and other stakeholders, both individually and in groups. SASA staff also reviewed documentation that was not available prior to the trip and verified whether states were properly implementing their accountability plans as documented in their accountability workbooks. SASA provided copies of the indicators to SEAs and the school districts visited prior to monitoring. SASA staff monitored between 14 and 21 states each year. (See Table 1).
Table 1 Schedule of State Monitoring for Title I, Part A
2003-2006 Monitoring Cycle
School Year States Monitored
2003-04 California, Connecticut, Iowa, Maine, Massachusetts, Michigan, Minnesota, Missouri, Montana, Nebraska, New Jersey, Ohio, Rhode Island, and South Dakota
2004-05 Alabama, Arizona, Colorado, Florida, Idaho, Illinois, Indiana, Maryland, Nevada, New Mexico, North Carolina, North Dakota, Pennsylvania, Texas, Virginia, Washington, Wisconsin, and the Bureau of Indian Education
2005-06 Alaska, Arkansas, Delaware, Georgia, Hawaii, Kansas, Kentucky, Louisiana, Mississippi, New Hampshire, New York, Oklahoma, Oregon, South Carolina, Tennessee, Utah, Vermont, West Virginia, Wyoming, the District of Columbia, and Puerto Rico
Over the three-year monitoring cycle, some changes were made to the monitoring procedures and indicators. These changes were based on experience gained by SASA staff in using the monitoring protocol and in response to developments in the policy environment and field. During the first year of the monitoring cycle, 2003-04, SASA staff piloted the process and indicators. Following this first year, SASA staff reviewed the indicators and made some revisions to them. For example, accountability indicator 1.5 for 2003-04 (annual report cards) was split into two indicators (accountability indicators 1.6 and 1.7) for the later two years to allow for considering SEA and school district report cards separately. To a more limited degree, the monitoring process was reviewed and revised again after monitoring in 2004-05. Table 2 shows the total number of indicators and the number of indicators in each area for each of the three years. The specific indicators used each year and changes to the indicators between years are detailed in Appendix F.

4
Table 2 Numbers of Indicators Reviewed, 2003-2006 Indicator Area Number of Indicators
Reviewed Per State
School Year 2003-04 2004-05 2005-06 Total 29 30 27 Accountability1 7 9 9 Instructional Support2 9 8 8 Fiduciary Responsibilities3 13 13 10
In 2004-05, in response to the Improper Payments Information Act of 2002, staff from the Office of the Chief Financial Officer (OCFO) at ED joined SASA staff in monitoring to examine more intensively whether Federal funds were being properly delivered and administered. SASA and OCFO staff determined whether states and districts were documenting payments with contracts and receipts, employing competitive bid practices appropriately, and ensuring that Title I funds were not used to pay for non-Title I services, among other requirements. To accommodate the added emphases, some revisions were made to the fiduciary responsibilities indicators for 2004-05 and two fiduciary responsibilities indicators were added in 2005-06 for OCFO purposes. (See Appendix F.) During the second year of the monitoring cycle, 2004-05, SASA began to focus more on the potential for improving the quality of Federal education programs at the local level through more effective monitoring of these programs by their states. To give greater emphasis to this requirement (SEA monitoring of school districts) and to broaden the impact of the SASA monitoring process, at the beginning of 2005-06, SASA made the SEA monitoring indicator previously under fiduciary responsibilities into an overarching requirement for all SASA monitoring. Lastly, it is important to note that this continuous improvement approach to the monitoring process may have resulted in a more refined look at the indicators in later years. While best for program implementation overall, this variation over time may have affected results from year to year. Similarly, the experience gained by SASA staff over time in monitoring may have resulted 1 For the accountability indicators: In 2003-04, five indicators were addressed in monitoring for South Dakota. Because South Dakota had a waiver for its assessment system in effect during the monitoring visit, neither Indictor 1.2 nor 1.3 could be monitored. In 2004-05, seven indicators were monitored for Indiana and Nevada. These were the first two states monitored during this year, and the monitoring rubric from 2003-2004 was used for these two because the revised rubric was not yet in place.
2 For the instructional support indicators: In 2003-04, eight indicators were addressed for monitoring for Nebraska because SASA transitioned monitoring responsibilities of highly qualified teachers to the Academic Improvement and Teacher Quality Programs office. In 2004-05, SASA did not rate one indicator for Alabama due to a pending policy discussion. In 2004-05, five indicators were monitored for the Bureau of Indian Education (BIE) because the other three indicators were not applicable to the BIE. In 2005-06, one indicator was not rated for Oklahoma because SASA continued review following the monitoring report.
3 For the fiduciary responsibilities indicators: In 2003-04, 12 indicators were addressed in monitoring in Missouri because Missouri had a Bypass contract in place for services to students attending private schools. In 2004-05, one indicator was not rated for Indiana because SASA continued review following the monitoring report. In 2004-05, seven indicators were monitored for the BIE because the other indicators were not applicable. In 2005-06, Indicators 3.9 and 3.10 were not addressed in monitoring for Puerto Rico and Wyoming because OCFO did not participate in monitoring for these two states. In 2005-06, in eight states a finding not specific to one of the 10 fiduciary responsibilities indicators was identified and classified as a finding for an eleventh indicator or an “other category.” Because these findings are not associated with a particular monitoring indicator, they are not included in summaries of findings related to the indicators in this report.

5
in a more thorough look at the indicators in later years. And, since a different group of states was monitored each year to accommodate the three-year monitoring cycle, differences in the percentage of indicators for which states were out of compliance also may reflect differences between the groups of states monitored each year. The potential impact of these factors on results is discussed in relevant sections below.
Results of Monitoring
State Compliance with Indicators Across the Three Areas Observation #1 – The overall percentage of indicators for which states were in compliance decreased during the three-year monitoring cycle. The percentage of indicators for which states were in compliance provides a measure of the overall strength of program implementation and the degree to which states were in compliance with key Title I, Part A requirements. Strong implementation is critical. If the program is not implemented as designed, it is less likely that its intended effect of improving student achievement will be realized. Nationally, from 2003 to 2006, the percentage of all indicators for which states were in compliance was just under two-thirds (65 percent), ranging from a high of 79 percent for states monitored in 2003-04 to a low of 58 percent for states monitored in 2005-06. State experience in implementing NCLB might have been expected to lead to better implementation over time. However, the percentage of indicators for which states were in compliance decreased over the three-year cycle. (See Table 3.) (See Appendix B for a state-by-state table and Appendix C for state-by-state tables by year.)
• During the first year of the monitoring cycle, the states monitored were in compliance with 79 percent of the indicators. The highest percentage of indicators for which a state was in compliance was 97 percent and the lowest was 59 percent.
• During the second year of the monitoring cycle, the states monitored were in compliance with 62 percent of the indicators. The highest percentage of indictors for which a state was in compliance was 89 percent and the lowest was 38 percent.
• During the third year of the monitoring cycle, the states monitored were in compliance with 58 percent of the indicators. The highest percentage of indictors for which a state was in compliance was 78 percent and the lowest was 32 percent.
Table 3
Percentages of Indicators for Which States Were in Compliance, 2003-2006
Indicator Area Percentage of Indicators for Which States Monitored Were in Compliance
School Year 2003-04 2004-05 2005-06 All Years
All Indicators 79 62 58 65 Accountability 86 68 70 73 Instructional Support 66 46 62 58 Fiduciary Responsibilities 83 68 44 64

6
The number of indicators for which states were out of compliance provides an indication of the amount and range of change needed for states to come into full compliance with Title I, Part A requirements; this number ranged from one to 17 indicators across the states. Over half of the states (28) were not in compliance with 10 or more indicators, nine were out of compliance with 15 or more indicators. Three states were in compliance with all but three or fewer indicators. The remaining states were out of compliance with from four to nine indicators. (See Appendix B for a state-by-state table and Appendix C for state-by-state tables by year.) State Compliance with Indicators Within the Three Areas Observation #2 – Rates of state compliance within the three areas varied. The percentages of indicators for which states were in compliance varied widely across the three areas, ranging from a high of 73 percent for accountability to a low of 58 percent for instructional support. Variation in rates of compliance was greater when compared year to year. For example, states monitored in 2003-04 were in compliance with 83 percent of all fiduciary responsibilities indicators, but this percentage dropped to 44 percent for states monitored in 2005-06. (See Table 3.) States’ rates of compliance within the three areas also varied notably. Few states showed strong compliance in all three areas while about half of the states had weak compliance in one or two of the three areas. Three states were in compliance with 80 percent or more of the indicators in all three areas. At the other extreme, about half of all states were out of compliance with more than 50 percent of the indicators in at least one area and about one-fifth of all states were out of compliance with more than 50 percent of the indicators in two of the areas. Only one state was out of compliance with more than 50 percent of the indicators in all three areas. By area, more states were out of compliance with more than half of the fiduciary responsibilities indicators (16 states) and instructional support indicators (15 states) than the accountability indicators (5 states). Some states were in compliance with all indicators within an area while other states were out of compliance with up to nine indicators within an area. As noted above, states most commonly had higher rates of compliance in the area of accountability. Specifically, nine states were in compliance with all accountability indicators and another nine states were out of compliance with only one such indicator, while five states were out of compliance with more than half of the accountability indicators. One state was in compliance with all instructional support indicators and another nine states were out of compliance with only one such indicator in this area, while 15 states were out of compliance with more than half of the instructional support indicators. For the fiduciary responsibilities indicators, three states were in compliance with all of the indicators and six states were out of compliance with only one such indicator, while 16 states were out of compliance with more than half of the fiduciary responsibilities indicators. (See Table 4.) (See Appendix D for state-by-state tables by indicator area and Appendix E for state-by-state tables by indicator area by year.)

7
Table 4 Number of States Not in Compliance with Numbers of Indicators,
By Area, 2003-2006 Indicator Area Numbers of Indicators Per
Indicator Area1 Number of States Not in Compliance with
Numbers of Indicators School Year/ Numbers of Indicators 2003-04 2004-05 2005-06 0-2 3-5 6+ Accountability 7 9 9 30 23 0 Instructional Support 9 8 8 18 25 10 Fiduciary Responsibilities 13 13 10 13 24 16
The rates at which states were out of compliance with indicators are a concern not only because of the importance of the individual indicators, but also because of their interconnectedness to the indicators in the other two areas. The next sections discuss the program components represented by the indicators and provide some specific examples of how they interact with the broader purposes of Title I, Part A. Observation #3 – State compliance with indicators was strongest in the area of accountability with the highest numbers of states in compliance with requirements for content standards and grants for state assessments.
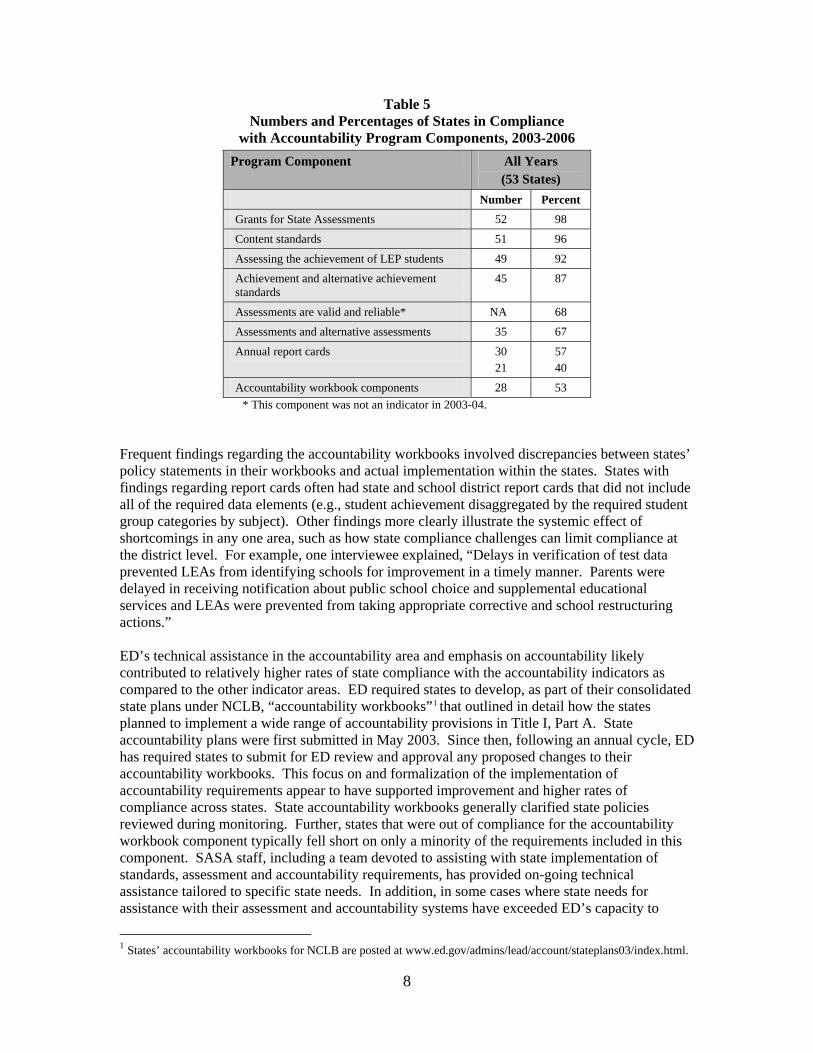
State compliance was strongest for the accountability program components, and state progress for these program components continued as state assessment systems evolved to meet NCLB requirements for the end of the 2005-06 school year. Overall, states were in compliance with 73 percent of the accountability indicators. In the accountability program components, over half of the states were in compliance with all but two or fewer of the program components requirements. The highest number of states were in compliance with requirements for content standards (51 states) and grants for state assessments under ESEA section 6111 (52 states). The smallest number of states were in compliance with all requirements for the accountability workbooks (28 states) and annual report cards (30 for SEA report cards and 21 for LEA report cards). (See Table 5 and Appendix F.)
1 See footnotes to Table 2.
8
Table 5 Numbers and Percentages of States in Compliance
with Accountability Program Components, 2003-2006 Program Component All Years
(53 States) Number Percent Grants for State Assessments 52 98
Content standards 51 96
Assessing the achievement of LEP students 49 92
Achievement and alternative achievement standards
45 87
Assessments are valid and reliable* NA 68
Assessments and alternative assessments 35 67
Annual report cards 30 21
57 40
Accountability workbook components 28 53 * This component was not an indicator in 2003-04.
Frequent findings regarding the accountability workbooks involved discrepancies between states’ policy statements in their workbooks and actual implementation within the states. States with findings regarding report cards often had state and school district report cards that did not include all of the required data elements (e.g., student achievement disaggregated by the required student group categories by subject). Other findings more clearly illustrate the systemic effect of shortcomings in any one area, such as how state compliance challenges can limit compliance at the district level. For example, one interviewee explained, “Delays in verification of test data prevented LEAs from identifying schools for improvement in a timely manner. Parents were delayed in receiving notification about public school choice and supplemental educational services and LEAs were prevented from taking appropriate corrective and school restructuring actions.” ED’s technical assistance in the accountability area and emphasis on accountability likely contributed to relatively higher rates of state compliance with the accountability indicators as compared to the other indicator areas. ED required states to develop, as part of their consolidated state plans under NCLB, “accountability workbooks”1 that outlined in detail how the states planned to implement a wide range of accountability provisions in Title I, Part A. State accountability plans were first submitted in May 2003. Since then, following an annual cycle, ED has required states to submit for ED review and approval any proposed changes to their accountability workbooks. This focus on and formalization of the implementation of accountability requirements appear to have supported improvement and higher rates of compliance across states. State accountability workbooks generally clarified state policies reviewed during monitoring. Further, states that were out of compliance for the accountability workbook component typically fell short on only a minority of the requirements included in this component. SASA staff, including a team devoted to assisting with state implementation of standards, assessment and accountability requirements, has provided on-going technical assistance tailored to specific state needs. In addition, in some cases where state needs for assistance with their assessment and accountability systems have exceeded ED’s capacity to
1 States’ accountability workbooks for NCLB are posted at www.ed.gov/admins/lead/account/stateplans03/index.html.

9
provide support directly, ED has paid for consultants to provide intensive and specialized technical assistance to states. ED peer reviews of state assessment systems for NCLB also have set high expectations for state compliance with the Title I, Part A standards and assessment requirements and involved the provision of significant amounts of technical assistance to states in this area. Beginning in the 2004-05 school year and continuing since then, these reviews of state assessment systems have focused on whether state assessment systems meet relevant NCLB standards, assessment and accountability system requirements. The reviews have addressed six of the eight accountability program components (content standards, achievement and alternate achievement standards, assessments and alternate assessments, annual report cards, assessment of the achievement of limited English proficient students, and valid and reliable assessments). In fact, as a part of ED peer reviews of states assessment systems for NCLB, many states have shown that they have addressed accountability requirements, progress that may not have been in place at the time of monitoring. Possible outcomes of the assessment system reviews, however, differ from those for monitoring. For the assessment system reviews, state systems are either approved or not approved as a whole, in contrast to monitoring for which states may be partially in or out of compliance with a particular area or program component. At the end of 2005-06, ED had approved assessment systems in 10 states. All other states had provided documentation that showed they met at least some of the requirements for assessment systems, a result consistent with monitoring findings of compliance in some areas but not others.1 Finally, the evolution of the ESEA has led to progress in the area of accountability. Under the Improving America’s Schools Act, the reauthorization of the ESEA prior to NCLB, states were required to develop content standards and performance standards (a.k.a. academic achievement standards) for three grade spans. Work that states did to meet these earlier requirements, which were incorporated into NCLB, meant that many states already had met certain NCLB requirements when the law was enacted. Further, NCLB increased requirements for state standards, assessment and accountability systems. As a result, states in partial compliance with NCLB standards, assessment and accountability requirements in 2005-06 likely had in place more comprehensive standards, assessment and accountability systems than they did in 2001. For example, under NCLB, states are assessing all students in grades 3-8 and once in high school, whereas previously many states tested students only once per grade span. Similarly, NCLB has prompted extensive developments in alternate assessments for students with disabilities. Even in cases where these new alternate assessments do not yet meet all NCLB requirements, they commonly represent improvements over earlier alternate assessments. Observation #4 – States were weakest overall in compliance with the indicators for instructional support, especially with regard to parental involvement, schoolwide programs, and requirements for school improvement, corrective action and restructuring. State compliance was weakest in the area of instructional support, despite the fact that this is the area most directly related to classroom activities and the teaching and learning that the Title I, Part A program is intended to improve. Overall, states were in compliance with 58 percent of the instructional support indicators. In none of the years of monitoring were the states monitored in compliance with more than two-thirds of the instructional support indicators. (See Table 3.) Fifteen states were in compliance with less than half of the indicators in this area, and 10 states 1 See www.ed.gov/admins/lead/account/nclbfinalassess/index.html for the status of individual state assessment systems in meeting NCLB requirements.

10
were in compliance with 25 percent or fewer of the indicators. In addition, complying with certain instructional support program components appeared to be particularly challenging to states. States were weakest overall in compliance with the program components for parental involvement, schoolwide programs, and requirements for school improvement, corrective action and restructuring. Two-thirds or more of the states were in compliance with three of the instructional support program components. For example, most states (45) were in compliance with requirements for targeted assistance programs. Fewer states were in compliance with parental involvement requirements, which included parent notification requirements for public school choice and supplemental educational services (16 states), requirements for schoolwide programs (24 states), and requirements for improvement, corrective action and restructuring (25 states). (See Table 6 and Appendix F.) Findings ranged from identification of broad compliance issues in implementation to more specific concerns (e.g., “the SEA did not ensure that its form letter and the LEAs’ form letters to parents contained all of the required information about schools that were identified as in need of improvement”).
Table 6 Numbers and Percentages of States in Compliance
with Instructional Support Program Components, 2003-2006 Program Component (Number of States Monitored)
All Years (53)
Number Percent Requirements for targeted assistance programs 45 87
Committee of Practitioners 37 71
Supplemental educational services 35 69
Statewide system of support 33 62
Public school choice 32 62
Hiring and retention of qualified paraprofessionals 30 58 Requirements for improvement, corrective action and restructuring
25 47
Requirements for schoolwide programs 24 45
Parental involvement requirements 16 30
Observation #5 – States had difficulty complying with indicators in the fiduciary responsibilities area, with no improvement over time. Most frequently, states showed weak compliance concerning services to private school children, comparability, and allocations, reallocation and carryover. Though various factors may have influenced the determination of states’ rates of compliance with the fiduciary responsibilities indicators, results indicate significant limitations in compliance in this area. States monitored in 2003-04 were in compliance with 83 percent of the fiduciary responsibilities indicators, and states monitored in 2005-06 were in compliance with 44 percent of these indicators despite their additional years of experience with the requirements. (See Table 3.) Sixteen states were in compliance with less than half of the indicators in this area. For the fiduciary responsibilities program components, from 17 to 48 states met requirements for the individual program components. Forty-eight states met requirements for school district plans,

11
but only 17 states met requirements for services to private school children. As noted above, the percentage of states monitored that were in compliance with the various fiduciary responsibilities indicators decreased over time. In 2005-06, for five of the fiduciary responsibilities program components, less than two-thirds of the states monitored were in compliance. (See Table 7 and Appendix F.)
Table 7 Numbers and Percentages of States in Compliance
with Fiduciary Responsibilities Program Components, 2003-2006 Program Component (Number of States Monitored)
All Years (53)
Number Percent LEA plan 48 91
Maintenance of effort 40 77
Supplement not supplant 39 75
Resolution of complaints 38 72
Annual audits 36 68
Rank ordering requirements for schools and reservations of funds
35 67
SEA monitoring 34 64
State administration funds 33 62
Allocation, reallocation and carryover 28 54
Comparability 26 50
Services to private school children 17 33
Monitoring showed that states were struggling more with some fiduciary responsibilities indicators than others. For example, with regard to Title I, Part A services to private school students, their families, and teachers, some states did not have processes in place to check for compliance. Similarly, for the fiduciary responsibilities program component of equipment/real property and procurement of goods and services, states were found to be out of compliance at a relatively high rate (see Appendix F). Finally, many states did not demonstrate compliance with requirements concerning reservation of funds, supplement not supplant and ensuring a prompt resolution of complaints. Both procedural and substantive issues may have contributed to the decrease over time in rates of compliance in the fiduciary responsibilities area. For example, the revision of fiduciary responsibilities indicators during the monitoring cycle as a result of the addition of OCFO staff to the monitoring teams may have affected ratings of compliance. Similarly, as noted earlier, the experience gained by SASA staff over time in monitoring and the differences among the groups of states monitored each year may have influenced changes in rates of compliance across years. In any case, however, the low rates of compliance identified represent problems found with state implementation in a number of areas. The number of program components in which states were out of compliance is a concern because of the specific issues involved and because of how they interact with the overall purposes of Title I, Part A. Compliance for the program components of comparability and reservations of funds provides instructive examples. The Title I, Part A comparability requirements,
12
prerequisites to receiving Title I, Part A funds, are designed to ensure that Title I schools receive shares of state and local funds at least comparable to those received by non-Title I schools so that Title I, Part A funds provide additional services to at-risk students in schools with high concentrations of students from low-income families. If comparability requirements are not met, it becomes unclear whether the underlying purposes of Title I, Part A are being met. For the 2003-2006 monitoring cycle, about half of the states were out of compliance in the comparability program component. Findings among these states included: “the SEA has not ensured that all schools in the LEA, including charter schools, are included in the comparability calculations” and “the SEA reviews comparability documents once every three years as a part of its regular monitoring cycle and not every two years as required.” Reservations of funds requirements help ensure that mandated funding for Title I public school choice and supplemental educational services is available to parents of eligible children wishing to exercise these options. Though overall compliance with Title I school choice and supplemental educational services is considered in the instructional support indicator area, it is the fiduciary responsibilities indicator regarding allocation, reallocation and carryover provisions that addresses reservations of funds for Title I school choice and supplemental educational services. SASA’s monitoring showed that 24 states were not in compliance with the indicator for reservation of funds for a number of program requirements. (See Appendix F.)
Observation #6 – States began placing greater emphasis on their implementation of NCLB by making monitoring of their districts a higher priority than they had previously. During and since the 2003-2006 monitoring cycle, many states modified their processes for monitoring their school districts and modeled their new procedures on the SASA monitoring process, steps that have resulted in more effective implementation of programs under Title I, Part A nationwide. Both states’ self-assessments for SASA monitoring and SASA’s direct encouragement influenced states to focus more on their responsibilities for monitoring school districts receiving Title I, Part A funds. In general, states developed more comprehensive processes for conducting their monitoring of subgrantees, including procedures for more effectively identifying compliance issues and ensuring that timely corrective actions are implemented. States also better integrated their existing systems for promoting compliance, including self-assessments; their processes for reviewing and approving school district applications for funds as well as complaints; and other mechanisms for data collection and management. States’ self-assessments of their implementation of Title I, Part A were often a part of states’ preparations for ED monitoring, and these also commonly resulted in improvements in practice. In some cases where states were out of compliance with indicators, preparing for ED monitoring enabled the states to identify and correct problems prior to the on-site monitoring. In other cases, states were not able to correct newly identified compliance problems prior to ED monitoring, but preparing for monitoring helped them become aware of the particular compliance problems and provided them with the opportunity to initiate steps to address the problems prior to ED monitoring.

13
ED Follow-up to Monitoring ED Monitoring Reports State-specific monitoring reports were issued to the chief state school officers following each on-site state review.1 These monitoring reports, prepared by SASA staff, summarized states’ compliance status for each of the indicators. The reports also included findings, which specified the particular compliance problem or problems related to an indicator and corrective actions prescribed for each finding. The number of findings per indicator for which a state was out of compliance was always at least one, and often more, depending on the scope of the compliance problem. The monitoring reports also included recommendations where appropriate. As described above, states were not in compliance with between one and 17 indicators each. The number of findings for individual states ranged from one to 37. (See Table 8.) Across all states, the total number of findings was 716.
Table 8
Numbers of States Out of Compliance with Indicators, Numbers of Indicators For which States Were Out of Compliance And Numbers of Findings, for All States
Number of States Out of Compliance with One or
More Indicators
Range of Number of Indicators for
which States were Out of
Compliance
Range of Number of Findings within
States
All Years 53 1 – 17 1 - 37
2003-04 14 1 – 12 1 – 17
2004-05 18 3 – 17 3 – 33
2005-06 21 6 – 17 11 – 37
ED Follow-up Actions to Monitoring Reports with States States were required to respond to every finding for each indicator for which they were out of compliance by developing a corrective action plan to address the finding and submitting to ED documentation that the plans had been implemented. Since all states were out of compliance with at least one indicator, this requirement applied to all states. The monitoring process was not considered closed until a state’s corrective action plan was approved. The following steps structured this stage of the monitoring process:
• Monitoring reports were issued following the SASA staff’s return from the on-site visits. For 2003-04 and 2004-05, the target timeframe for issuing these reports was within 30 business days of the SASA staff’s return. Recognizing that policy decisions regarding monitoring reports required a longer timeframe, this target was changed to 40 days for 2005-2006.
• SEAs were required to respond to the monitoring reports with proposed actions to correct compliance issues identified in the reports within 30 business days. SEA responses were required to address all findings and all required corrective actions listed in the reports.
1 The state-specific monitoring reports are available at ED’s Title I Program Monitoring website at www.ed.gov/admins/lead/account/monitoring/index.html.

14
• SASA staff reviewed each SEA’s response for completeness and to verify that the proposed actions would result in full state compliance in the area identified by the findings.
• The SASA director issued a letter to the SEA approving the proposed actions and specifying that the findings would be considered resolved upon receipt by ED of documentation that the SEA’s proposed actions had been implemented.
• SEAs were required to provide documentation of the implementation of required corrective actions.
• Following receipt of documentation of the implementation of all required corrective actions, the SASA director sent the SEA a letter of final approval of resolution of the findings.
• For SEAs that provided either inadequate corrective actions plans or inadequate documentation of implementation of corrective actions, a condition was placed on the following year’s grant award for the state. This condition remained until all compliance issues were resolved.
Other actions taken by ED in response to monitoring findings varied based on the finding. Placing conditions on state Title I, Part A grant awards was an additional action taken by ED for some states as a result of the compliance problems identified through monitoring. These conditions were applied to two states’ grant awards as a result of monitoring in 2003-04, to 13 states’ grant awards as a result of monitoring in 2004-05, and to nine states’ grant awards as a result of monitoring in 2005-06. (See Table 9.) In general, for 2003-04 monitoring, conditions were placed on the grant awards of all states with outstanding issues. For 2004-05 and 2005-06, conditions were placed on grant awards when monitoring showed significant and substantive compliance findings. For states with conditions on their grant awards, the following steps were added to the process outlined above for resolving findings: (1) Following approval of final corrective actions and closure of all issues resulting from monitoring, SASA staff prepared an internal memo for the Assistant Secretary informing him that the outstanding issues had been resolved, and (2) the Assistant Secretary for Elementary and Secondary Education sent a letter to the chief state school officer informing the SEA that conditions had been removed from the State’s grant award. ED also discussed the withholding of funds from states, sent letters to states addressing late notification to schools of prior year assessment results, and initiated phone calls to chief state school officers regarding other issues.
Table 9
States with Conditions Placed on their Title I, Part A Grants as a Result of Findings from Monitoring , 2003-2006 Monitoring Cycle
School Year
States
2003-04 California, Michigan
2004-05 Alabama, Arizona, Colorado, Florida, Idaho, Illinois, Maryland, New Mexico, North Carolina, North Dakota, Pennsylvania, Texas, Wisconsin
2005-06 Arizona, Colorado, Delaware, Florida, Idaho, Illinois, Oklahoma, Texas, Utah
Collectively, these actions generated heightened state attention to resolving compliance issues identified in monitoring. Prior to the 2003-2006 monitoring cycle, state responses to monitoring

15
reports, findings and expected corrective actions had not been timely. For the 2003-2006 monitoring cycle, state responses generally were more timely and thorough, though improvements in this regard are still needed. State Responses to ED Monitoring Reports States’ responses to monitoring reports involved the implementation of corrective actions that have resulted in more effective administration of Title I, Part A programs. States’ responses regarding findings related to lack of alignment between their accountability workbooks and actual implementation provide useful illustrations of state approaches. One set of states made corrections to their NCLB accountability workbooks based on findings from SASA’s monitoring while another group of states changed their practices to align with their accountability workbooks and come into compliance with NCLB. More specific examples of corrective actions implemented by states include:
• Implementation of policies to increase participation rates in assessments and eliminate exemptions for categories of students;
• Development of consistent processes for calculation of adequate yearly progress (AYP); • Development of a comprehensive Title I, Part A monitoring system that includes both
desk top and on-site monitoring; • Implementation of a more rigorous consolidated application review process that includes
equitable services to private school students; • Development of a supplemental educational services toolkit; and • Development of parental notification templates.
ED Technical Assistance Provided Based on Results from Monitoring SASA has used findings from the 2003-2006 monitoring cycle not only to follow-up with states on specific compliance issues, but also to inform ED’s efforts to better support states. Technical assistance provided as a result of monitoring findings has taken many forms, from the development of new program guidance and toolkits to enhanced outreach efforts and individualized support from SASA staff. Focused primarily on assisting states in implementing Title I, Part A in ways that most effectively promote improved student achievement, the assistance efforts were designed to be both reactive in terms of helping states come into compliance where needed and proactive in terms of preventing compliance problems in the future. Significant examples of such technical assistance based on SASA’s monitoring include:
• Related to findings regarding fiscal issues in the fiduciary responsibilities area, ED developed non-regulatory guidance on Title I fiscal issues (see www.ed.gov/programs/titleiparta/fiscalguid.doc).
• Related to findings regarding Title I services provided to private school students, their teachers and families, ED developed The Private School Toolkit (see www.ed.gov/programs/titleiparta/ps/titleitoolkit.pdf).
• Regarding compliance issues involving the implementation of schoolwide programs, ED issued schoolwide program guidance (see www.ed.gov/policy/elsec/guid/designingswpguid.doc).
• Concerning findings about compliance with parental involvement requirements, SASA initiated several efforts to involve the Parent Information Resource Centers (PIRCs) in providing assistance to states in implementing NCLB parental involvement requirements. These efforts included coordinating with ED’s Office of Innovation and Improvement to

16
promote outreach to parents through the PIRCs, sharing of monitoring findings with the PIRCs to better inform PIRC outreach efforts, and including the PIRCs in Title I networking with SEA parental involvement coordinators.
• Regarding findings of problems with annual report cards, SASA staff provided individualized technical assistance to states to address shortcomings in their report cards (e.g., timeliness, data quality, and user-friendliness).
In addition, as noted above, ED has coordinated peer reviews of all state assessment systems that address most of the accountability indicators. A common by-product of this process has been technical assistance provided to the states from peer reviewers and, as needed, SASA assessment experts. Implications for the Future The purpose of SASA’s monitoring efforts remains to ensure that SEAs comply with the overall intent and specific provisions of Title I, Part A, with the goal of ensuring that all children are proficient in reading and mathematics by 2013-14. At the same time, the results, outcomes and observations from the monitoring cycle for 2003-2006 provide some lessons for the future on efforts to improve teaching and learning and program implementation. Lessons Learned Both issues of quality and compliance of programs under Title I, Part A need attention. Ultimately, the success of Title, I Part A depends on the implementation of quality programs that effectively support teaching and learning in schools. The low percentages of instructional support indicators for which states were in compliance during 2003-2006 suggest improvements are particularly needed in this area. In addition, the program overall is unlikely to have its full, intended effects on student achievement if it is not implemented well. The rates at which states were out of compliance with all indicators and within and across the three areas similarly indicate the need to attend to basic issues of compliance as a necessary foundation for effective program quality. Activities in some areas leverage more change than in others, as illustrated earlier by examples of indicators in one area affecting implementation in other areas. SASA already has increased successfully its focus on one such area (improving SEAs’ monitoring of their districts and schools). SASA similarly can use the monitoring process to emphasize efforts in other areas central to Title I, Part A, such as strengthening schools and student achievement, statewide systems of support for low-performing schools and the use of data and research to inform instruction. (In fact, modifications made to the monitoring process for 2006-2009, discussed below, are intended to shift the focus of monitoring to include greater consideration of how state implementation of programs under Title I, Part A contributes to strengthening program quality.) ED also needs to build on efforts that appear to have strengthened programs under Title I, Part A during the 2003-2006 monitoring cycle. Based on the observation that ED’s policies, procedures and enforcement in the area of accountability appear to have contributed to relatively stronger implementation in this area, ED’s approach to supporting the accountability area may serve as a model for strengthening implementation in the other two areas. At the same time, the unevenness in rates of compliance among states across the three areas also shows the need for assistance focused on the particular areas in which individual state implementation of programs under Title I, Part A is weaker. ED’s success in improving state responses to monitoring findings through the

17
application of a range of consequences for lack of compliance highlights an additional means for improving states’ implementation of Title I, Part A, programs. The Future of Monitoring SASA has modified the monitoring process used in 2003-2006 for the second cycle of monitoring under NCLB for 2006-2009. A main objective of the revisions was to improve the focus on program quality, specifically issues that support teaching and learning in schools, while maintaining an emphasis on compliance, which results from monitoring in 2003-2006 demonstrated is needed. Other changes draw on SASA’s experience with monitoring during 2003-2006 and are intended to make the monitoring process more efficient. The following examples illustrate key changes made to the monitoring process for 2006-2009:
• SASA streamlined the questions asked of administrators, teachers and parents involved in the school improvement, corrective action and restructuring processes to focus more on outcomes. SASA also added interviews with supplemental educational services providers to the process so that their perspectives, as well as those of local school and district staff, are represented.
• SASA made revisions to the monitoring indicators to better link the cross-cutting issues in NCLB. The reservations of funds requirements, found in the fiduciary responsibilities area, are an example of issues that affects multiple activities in the instructional support area (parental involvement, school improvement, public school choice and supplemental educational services). Similarly, the requirement for SEAs to encourage schools operating schoolwide programs to consolidate funds involves both the fiduciary responsibilities and instructional support areas. SASA also changed the name of the instructional support area to Program Improvement, Parental Involvement, and Options (PIPIO).1 Since ED monitors activities that impact instruction, rather than instruction directly, the intent of this change was to more clearly identify what is being monitored. (The monitoring indicators for 2006-07 are posted on ED’s Title I Program Monitoring website at www.ed.gov/admins/lead/account/monitoring/index.html.)
• The current cycle of monitoring focuses more on the relationships between the SEAs and their districts for the purpose of better determining the level and effectiveness of the states’ oversight and monitoring, provision of targeted technical assistance, and timely provision of access to funds and other resources.
• States monitored will receive drafts of the ED monitoring reports for their state, and they will be given five days to review the reports before ED finalizes them.
• Considering findings from joint SASA and OCFO monitoring, SASA recommends continued monitoring of the fiduciary responsibilities indicators monitored in 2005-06 by OCFO. (For 2006-2009, SASA and OCFO monitoring will be conducted separately. OCFO has shifted to monitoring programs based on risk assessment.)
Based on the observation that states’ rates of compliance were highest in the areas of accountability, where specific ED policies, procedures and enforcement appear to have contributed to stronger implementation, SASA is developing plans to proactively support better implementation in the areas of instructional supports (or PIPIO) and fiduciary responsibilities using ED’s practices in the area of accountability as a model. However, because SASA currently
1 Program Improvement refers to statewide systems of support for schools identified for improvement, schoolwide programs and targeted assistance programs. Parental Involvement includes activities related to parental involvement requirements, including those for Title I public school choice, supplemental educational services, school improvement planning, and so forth. Options involve public school choice and supplemental educational services under Title I.

18
does not have the resources in-house to provide the level of support in these other areas that it has provided in the area of accountability, it also will rely on other ED-funded organizations to contribute to such support, most notably the Comprehensive Centers.
Similarly, ED is responding to the unevenness in quality of implementation across states with new monitoring follow-up activities. Beginning in 2006-07, ED is implementing targeted, issue-specific monitoring for states outside of the planned three-year cycle when significant concerns arise. A May 15, 2006 letter to chief state school officers from the Secretary outlined an approach to enforcement to improve compliance with Title I choice and supplemental educational services implementation. While this to some degree parallels follow-up actions to monitoring that ED has taken in the past, SASA also will use the steps outlined in this letter to inform the design of future follow-up actions. For example, for states that have a history of compliance problems and proposed corrective actions that do not successfully rectify the problems, SASA is considering compliance agreements as additional follow-up actions. For examples of strong implementation identified as a result of monitoring, SASA will work to provide some assessment of their merits and publicize examples that may be useful for improving practice to other states. Finally, ED anticipates that the 2006-2009 monitoring cycle also will yield valuable information on both progress and new or persistent challenges in implementing programs under Title I, Part A. The monitoring process has been sharpened, and ED has provided technical assistance to states in identified areas of weaknesses. Perhaps most importantly, despite lower than desired levels of compliance during 2003-2006, states significantly enhanced their standards, assessment and accountability infrastructures during this period, and ED is hopeful that SASA’s monitoring in 2006-2009 will reflect these improvements. ED will continue to use data collected through monitoring to design technical assistance initiatives, including planning national leadership activities, and improve SEAs implementation of programs under Title I, Part A. Future reports will document the results and outcomes of monitoring during 2006-2009 and beyond.

19
Appendix A: Title I, Part A Monitoring Indicators, 2003-2006 Title I, Part A Monitoring Indicators for 2003 - 2004
Accountability Indicators 1.1 The SEA has approved academic content standards for all required subjects or an
approved timeline for developing them. 1.2 The SEA has approved academic achievement standards and alternate academic
achievement standards in required subject areas and grades or an approved timeline to create them.
1.3 The SEA has approved assessments and alternate assessments in required subject
areas and grades or an approved timeline to create them. 1.4 The SEA has implemented all required components as identified in its
accountability workbook – report card requirements are addressed separately. 1.5 The SEA has published an annual report card and ensured that LEAs have
published annual report cards as required. 1.6 The SEA indicates how funds received under Grants for State Assessments and
Related Activities (§6111) will be or have been used to meet the 2005-2006 and 2007-2008 assessment requirements in NCLB.
1.7 The SEA ensures that LEAs meet all requirements for identifying and assessing
the academic achievement of limited English proficient students.
Instructional Support Indicators 2.1 The SEA designs and implements policies and procedures that ensure the hiring
and retention of qualified staff.
2.2 The SEA provides or provides for technical assistance for LEAs and schools as required.
2.3 The SEA established a Committee of Practitioners and involves the committee in
decision-making as required.
2.4 The SEA ensures that the LEA and schools meet parental involvement requirements.

20
2.5 The SEA ensures that schools and LEAs are identified for improvement, corrective action, or restructuring as required and that subsequent, required steps are taken.
2.6 The SEA ensures that requirements for public school choice are met. 2.7 The SEA ensures that the statutory requirements for the provision of supplemental
educational services (SES) are met. 2.8 The SEA ensures that LEAs and schools develop schoolwide programs that use
the flexibility provided to them by law to improve the academic achievement of all students in the school.
2.9 The SEA ensures that LEAs and schools develop and maintain targeted assistance
programs that meet all required components.
Fiduciary Responsibilities Indicators
3.1 The SEA ensures that its component LEAs are audited annually, if required, and that all corrective actions required through this process are fully implemented.
3.2 The SEA complies with the allocation, reallocation, and carryover provisions of Title I.
3.3 The SEA complies with the maintenance of effort provisions of Title I. 3.4 The SEA ensures that the LEA complies with the comparability provisions of
Title I.
3.5 The SEA ensures that LEAs provide Title I services to eligible children attending non-public schools.
3.6 The SEA has a system for ensuring and maximizing the quality, objectivity,
utility, and integrity of information disseminated by the agency.
3.7 The SEA has an accounting system for administrative funds that includes (1) state administration, (2) reallocation, and (3) reservation of funds for school improvement.
3.8 The SEA has a system for ensuring fair and prompt resolution of complaints. 3.9 The SEA ensures that the LEA complies with the rank order procedures for the
eligible school attendance area.

21
3.10 The SEA conducts monitoring of its subgrantees sufficient to ensure compliance
with Title I requirements.
3.11 The LEA complies with the provision for submitting an annual plan to the SEA. 3.12 The SEA and LEA comply with requirements regarding the reservation of
administrative funds. 3.13 The SEA ensures that Title I funds are used only to supplement or increase non-
Federal sources used for the education of participating children and do not supplant funds from non-Federal sources.
Title I, Part A Monitoring Indicators for 2004 - 2005
Accountability Indicators 1.1 The SEA has approved academic content standards for all required subjects or an
approved timeline for developing them. 1.2 The SEA has approved academic achievement standards and alternate academic
achievement standards in required subjects and grades or an approved timeline to create them.
1.3 The SEA has approved assessments and alternate assessments in required subject
areas and grades or an approved timeline to create them. 1.4 Assessments should be used for purposes for which such assessments are valid
and reliable and be consistent with relevant, nationally recognized professional and technical standards.
1.5 The SEA has implemented all required components as identified it its
accountability workbook. 1.6 The SEA has published an annual report card as required and an Annual Report to
the Secretary. 1.7 The SEA has ensured that LEAs have published annual report cards as required. 1.8 The SEA indicates how funds received under Grants for State Assessments and
related activities (§6111) will be or have been used to meet the 2005-2006 and 2007-2008 assessment requirements of NCLB.

22
1.9 The SEA ensures that LEAs meet all requirements for identifying and assessing the academic achievement of limited English proficient students.
Instructional Support Indicators 2.1 The SEA designs and implements policies and procedures that ensure the hiring
and retention of qualified paraprofessionals and ensure that parents are informed of educator credentials as required.
2.2 The SEA has established a statewide system of support that provides, or provides
for, technical assistance to LEAs and schools as required. 2.3 The SEA ensures that the LEA and schools meet parental involvement
requirements. 2.4 The SEA ensures that schools and LEAs identified for improvement, corrective
action, or restructuring have met the requirements of being so identified. 2.5 The SEA ensures that requirements for public school choice are met. 2.6 The SEA ensures that requirements for the provision of supplemental educational
services (SES) are met. 2.7 The SEA ensures that LEAs and schools develop schoolwide programs that use
the flexibility provided to them by law to improve the academic achievement of all students in the school.
2.8 The SEA ensures that LEA targeted assistance programs that meet all
requirements.
Fiduciary Responsibilities Indicators 3.1 The SEA ensures that its LEAs are audited annually in accordance with the Single
Audit Act, and that all corrective actions required through this process are fully implemented.
3.2 The SEA complies with the allocation, reallocation, and carryover provisions of
Title I. 3.3 The SEA complies with the maintenance of effort provisions of Title I. 3.4 The SEA ensures that LEAs comply with the comparability provisions of Title I.

23
3.5 The SEA ensures that LEAs provide Title I services to eligible children attending private schools.
3.6 The SEA establishes a Committee of Practitioners (COP) and involves the
committee in decision making as required. 3.7 The SEA has an accounting system in place that enables it to account for
reservation of funds for school improvement, State administration, and the State academic achievement awards program.
3.8 The SEA has a system for ensuring fair and prompt resolution of complaints. 3.9 The SEA ensures that LEAs comply with the rank order procedures for the
eligible school attendance area. 3.10 The SEA conducts monitoring of its subgrantees sufficient to ensure compliance
with Title I program requirements. 3.11 The SEA ensures that its LEAs comply with the provision for submitting an
annual application to the SEA and revising LEA plans as necessary to reflect substantial changes in the direction of their program.
3.12 The SEA ensures that Title I funds are used only to supplement or increase non-
Federal sources used for the education of participating children and not to supplant funds from non-Federal sources.
3.13 The SEA ensures that equipment and real property are procured at a cost that is
recognized as ordinary and the equipment and real property is necessary for the performance of the Federal award.
Title I, Part A Monitoring Indicators for 2005 – 2006
Overarching Requirement - The SEA conducts monitoring of its subgrantees sufficient to ensure compliance with Title I program requirements. 1.1 The SEA has approved academic content standards for all required subjects or has
an approved timeline for developing them. 1.2 The SEA has approved academic achievement standards and alternate academic
achievement standards in required subject areas and grades or an approved timeline to create them.
1.3 The SEA has approved assessments and alternate assessments in required subject
areas and grades or has an approved timeline to create them.

24
1.4 Assessments should be used for purposes for which such assessments are valid
and reliable, and be consistent with relevant, nationally recognized professional and technical standards.
1.5 The SEA has implemented all required components as identified in its
Accountability workbook. 1.6 The SEA has published an annual report card as required and an Annual Report to
the Secretary. 1.7 The SEA has ensured that LEAs have published annual report cards as required. 1.8 The SEA indicates how funds received under Grants for State Assessments and
related activities will be or have been used to meet the 2005 – 2006 and 2007 – 2008 assessment requirements of NCLB.
1.9 The SEA ensures that LEAs meet all requirements for identifying and assessing
the English language proficiency of limited English students.
Instructional Support Indicators
2.1 The SEA designs and implements procedures that ensure the hiring and retention of qualified paraprofessionals and ensure that parents are informed of educator credentials as required.
2.2 The SEA has established a statewide system of support that provides, or provides for, technical assistance to LEAs and schools as required.
2.3 The SEA ensures that the LEA and schools meet parental notice requirements and
parental involvement requirements. 2.4 The SEA ensures that schools and LEAs identified for improvement, corrective
action, or restructuring have met the requirements for being so identified. 2.5 The SEA ensures that requirements for public school choice are met. 2.6 The SEA ensures that requirements for the provision of supplemental educational
services (SES) are met. 2.7 The SEA ensures that LEAs and schools develop schoolwide programs that use
the flexibility provided to them by law to improve the academic achievement of all students in the school.
2.8 The SEA ensures that LEA targeted assistance programs meet all requirements.

25
Fiduciary Responsibilities Indicators
3.1 The SEA complies with the procedures for adjusting ED-determined allocations outlined in the regulations; the procedures for reserving funds for school improvement, State administration, and the State Academic Achievement Awards program; the reallocation and carryover provisions of the Title I statute.
3.2 The SEA ensures that its LEAs comply with the provision for submitting an annual application to the SEA and revising LEA plans as necessary to reflect substantial changes in the direction of their program.
3.3 The LEA complies with requirements in the regulations with regard to 1)
reserving funds for the various set-asides either required or allowed under the statute; 2) allocating funds to eligible school attendance areas or schools in rank order of poverty based on the number of children from low-income families who reside in an eligible attendance area.
3.4 The SEA complies with the maintenance of effort, comparability and supplement
not supplant provisions of Title I. 3.5 SEAs and LEAs comply with all of the auditee responsibilities specified in OMB
Circular A-133. 3.6 The LEA complies with requirements of the statute and regulations with regard to
services to eligible private school children, their teachers and families. 3.7 The SEA has a system for ensuring fair and prompt resolution of complaints. 3.8 The SEA establishes a Committee of Practitioners and involves them in decision
making as required. 3.9 SEAs and LEAs maintain control over the procurement, recording, custody, use
and disposition of Title I equipment in accordance with State provisions and policy, the Title I statute, the Improper Payments Act, standards of internal control and any other relevant standards, circulars, or legislative mandates.
3.10 SEAs and LEAs maintain control over the procurement of goods and services and
the disbursement of Title I funds in accordance with State provisions and policy, the Title I statute, the Improper Payments Act, standards of internal control and any other relevant standards, circulars, or legislative mandates.

26
Appendix B: State-by-State Summaries of Numbers and Percentage of Indicators for which States were in Compliance, 2003-2006
Numbers and Percentages of All Indicators for which States were in Compliance By State, 2003-2006
State-Entity Year Monitored
Number of Indicators Reviewed1
Number of Indicators in Compliance
Number of Indicators Out of Compliance
Percentage of Indicators in Compliance
Total 2003 -- 2006 1489 971 518 Avg. 65 Ohio (OH) 2003 – 2004 29 28 1 97 Nevada (NV) 2004 - 2005 28 25 3 89 South Dakota (SD) 2003 - 2004 27 24 3 89 Connecticut (CT) 2003 - 2004 29 25 4 86 Massachusetts (MA) 2003 - 2004 29 25 4 86 Montana (MT) 2003 - 2004 29 25 4 86 New Jersey (NJ) 2003 - 2004 29 25 4 86 Rhode Island (RI) 2003 - 2004 29 25 4 86 Nebraska (NE) 2003 - 2004 28 24 4 86 North Dakota (ND) 2004 - 2005 30 25 5 83 Washington (WA) 2004 - 2005 30 25 5 83 South Carolina (SC) 2005 - 2006 27 21 6 78 Tennessee (TN) 2005 - 2006 27 21 6 78 West Virginia (WV) 2005 - 2006 27 21 6 78 Wisconsin (WI) 2004 - 2005 30 23 7 77 Iowa (IA) 2003 - 2004 29 22 7 76 Wyoming (WY) 2005 - 2006 25 19 6 76 Alaska (AK) 2005 - 2006 27 20 7 74 Kansas (KS) 2005 - 2006 27 20 7 74 New York (NY) 2005 - 2006 27 19 8 70 Maryland (MD) 2004 - 2005 30 21 9 70 Minnesota (MN) 2003 - 2004 29 20 9 69 Missouri (MO) 2003 - 2004 28 19 9 68 New Hampshire (NH) 2005 - 2006 27 18 9 67 Virginia (VA) 2004 - 2005 30 20 10 67 Kentucky (KY) 2005 - 2006 27 18 9 67 New Mexico (NM) 2004- 2005 30 20 10 67 Maine (ME) 2003 - 2004 29 19 10 66 Indiana (IN) 2004 - 2005 27 17 10 63 Michigan (MI) 2003 - 2004 29 18 11 62 Arizona (AZ) 2004 - 2005 30 18 12 60 North Carolina (NC) 2004 - 2005 30 18 12 60 California (CA) 2003 - 2004 29 17 12 59 Alabama (AL) 2004 - 2005 29 17 12 59 Louisiana (LA) 2005 - 2006 27 16 11 59 Idaho (ID) 2004 - 2005 30 17 13 57 Hawaii (HI) 2005 - 2006 27 15 12 56 Georgia (GA) 2005 - 2006 27 15 12 56 Colorado (CO) 2004 - 2005 30 16 14 53 Oklahoma (OK) 2005 - 2006 26 14 12 53 Pennsylvania (PA) 2004 - 2005 30 16 14 53 Texas (TX) 2004 - 2005 30 15 15 50 Delaware (DE) 2005 – 2006 27 13 14 48 Oregon (OR) 2005 - 2006 27 13 14 48 Illinois (IL) 2004 – 2005 30 14 16 47 Arkansas (AR) 2005 – 2006 27 12 15 44 Vermont (VT) 2005 – 2006 27 12 15 44 District of Columbia (DC) 2005 - 2006 27 12 15 44 Florida (FL) 2004 – 2005 30 13 17 43 Bureau of Indian Education (BIE)
2004 – 2005 21 8 13 38
Mississippi (MS) 2005 - 2006 27 10 17 37 Utah (UT) 2005 - 2006 27 10 17 37 Puerto Rico (PR) 2005 - 2006 25 8 17 32
1 See footnotes to Table 2 and Appendix C.

27
Appendix C: State-by-State Summaries of Numbers and Percentage of Indicators for which States were in Compliance, by Year, 2003-2006
State-by-State Numbers and Percentages of All Indicators for which States Were in Compliance, 2003-2004
State Number of Indicators
Reviewed1
Number of Indicators in Compliance
Number of Indicators Out of
Compliance
Percentage of Indicators in Compliance
Total 402 316 86 Avg. 79 Ohio (OH) 29 28 1 97 South Dakota (SD) 27 24 3 89 Connecticut (CT) 29 25 4 86 Massachusetts (MA) 29 25 4 86 Montana (MT) 29 25 4 86 New Jersey (NJ) 29 25 4 86 Rhode Island (RI) 29 25 4 86 Nebraska (NE) 28 24 4 86 Iowa (IA) 29 22 7 76 Minnesota (MN) 29 20 9 69 Missouri (MO) 28 19 9 68 Maine (ME) 29 19 10 66 Michigan (MI) 29 18 11 62 California (CA) 29 17 12 59
1 In three states less than 29 indicators were reviewed. Five accountability indicators were addressed in monitoring for South Dakota; because South Dakota had a waiver for its assessment system in effect during the monitoring visit, neither Indictor 1.2 nor 1.3 could be monitored. Eight instructional support indicators were addressed for monitoring for Nebraska because SASA transitioned monitoring responsibilities of highly qualified teachers to the Academic Improvement and Teacher Quality Programs office. Twelve fiduciary responsibilities indicators were addressed in monitoring in Missouri because Missouri had a Bypass contract in place for services to students attending private schools. See also Table 2 and footnotes to Table 2.

28
State-by-State Numbers and Percentages of All Indicators for which States Were in Compliance, 2004-2005
State
Number of Indicators
Reviewed1
Number of Indicators in Compliance
Number of Indicators Out of
Compliance
Percentage of Indicators in Compliance
Total 525 328 197 Avg. 62 Nevada (NV) 28 25 3 89 North Dakota (ND) 30 25 5 83 Washington (WA) 30 25 5 83 Wisconsin (WI) 30 23 7 77 Maryland (MD) 30 21 9 70 New Mexico (NM) 30 20 10 67 Virginia (VA) 30 20 10 67 Indiana (IN) 27 17 10 63 Arizona (AZ) 30 18 12 60 North Carolina (NC) 30 18 12 60 Alabama (AL) 29 17 12 59 Idaho (ID) 30 17 13 57 Colorado (CO) 30 16 14 53 Pennsylvania (PA) 30 16 14 53 Texas (TX) 30 15 15 50 Illinois (IL) 30 14 16 47 Florida (FL) 30 13 17 43 Bureau of Indian Education (BIE)
21 8 13 38
1 In four states less than 30 indicators were reviewed. Seven accountability indicators were monitored for Indiana and Nevada. These were the first two states monitored during this year, and the monitoring rubric from 2003-2004 was used for these two because the revised rubric was not yet in place. Five instructional support indicators were monitored for the Bureau of Indian Education (BIE) because the other three indicators were not applicable to the BIE. SASA did not rate one instructional support indicator for Alabama due to a pending policy discussion. One fiduciary responsibilities indicator was not rated for Indiana because SASA continued review following the monitoring report. Seven fiduciary responsibilities indicators were monitored for the BIE because the other indicators were not applicable. See also Table 2 and footnotes to Table 2.

29
State-by-State Numbers and Percentages of All Indicators for which States Were in Compliance, 2005-2006
State
Number of Indicators
Reviewed1
Number of Indicators in Compliance
Number of Indicators Out of
Compliance
Percentage of Indicators in Compliance
Total 562 327 235 Avg. 58 South Carolina (SC) 27
21 6 78 Tennessee (TN) 27 21 6 78 West Virginia (WV) 27 21 6 78 Wyoming (WY) 25 19 6 76 Alaska (AK) 27 20 7 74 Kansas (KS) 27 20 7 74 New York (NY) 27 19 8 70 New Hampshire (NH) 27 18 9 67 Kentucky (KY) 27 18 9 67 Louisiana (LA) 27 16 11 59 Hawaii (HI) 27 15 12 56 Georgia (GA) 27 15 12 56 Oklahoma (OK) 26 14 12 53 Delaware (DE) 27 13 14 48 Oregon (OR) 27 13 14 48 Arkansas (AR) 27 12 15 44 Vermont (VT) 27 12 15 44 District of Columbia (DC) 27 12 15 44 Utah (UT) 27 10 17 37 Mississippi (MS) 27 10 17 37 Puerto Rico (PR) 25 8 17 32
1 In three states less than 25 indicators were reviewed. One instructional support indicator was not rated for Oklahoma because SASA continued review following the monitoring report. Fiduciary responsibilities Indicators 3.9 and 3.10 were not addressed in monitoring for Puerto Rico and Wyoming because OCFO did not participate in monitoring for these two states. In eight states, a finding not specific to one of the 10 fiduciary responsibilities indicators was identified and classified as a finding for an eleventh indicator or an “other category.” Because these findings are not associated with a particular monitoring indicator, they are not included in summaries of findings related to the indicators in this report. See also Table 2 and footnotes to Table 2.

30
Appendix D: State-by-State Numbers and Percentages of Indicators for which States were in Compliance, by Indicator Area, 2003-2006
Numbers and Percentages of Accountability Indicators for which States Were in Compliance by State, 2003-2006
State Number of Indicators Reviewed1
Number of Indicators in Compliance
Number of Indicators Out of
Compliance
Percentage of Indicators in Compliance
Total 443 323 120 Avg. 73 Connecticut (CT) 7 7 0 100 Minnesota (MN) 7 7 0 100 Nevada (NV) 7 7 0 100 New Jersey (NJ) 7 7 0 100 Ohio (OH) 7 7 0 100 Rhode Island (RI) 7 7 0 100 South Dakota (SD) 5 5 0 100 Tennessee (TN) 9 9 0 100 Wyoming (WY) 9 9 0 100 Alaska (AK) 9 8 1 89 New York (NY) 9 8 1 89 Virginia (VA) 9 8 1 89 Wisconsin (WI) 9 8 1 89 Indiana (IN) 7 6 1 86 Massachusetts (MA) 7 6 1 86 Maine (ME) 7 6 1 86 Montana (MT) 7 6 1 86 Nebraska (NE) 7 6 1 86 Delaware (DE) 9 7 2 78 Florida (FL) 9 7 2 78 Idaho (ID) 9 7 2 78 Kansas (KS) 9 7 2 78 Louisiana (LA) 9 7 2 78 New Hampshire (NH) 9 7 2 78 South Carolina (SC) 9 7 2 78 Washington (WA) 9 7 2 78 West Virginia (WV) 9 7 2 78 Iowa (IA) 7 5 2 71 Michigan (MI) 7 5 2 71 Missouri (MO) 7 5 2 71 Colorado (CO) 9 6 3 67 Georgia (GA) 9 6 3 67 Illinois (IL) 9 6 3 67 Kentucky (KY) 9 6 3 67 Maryland (MD) 9 6 3 67 Mississippi (MS) 9 6 3 67 North Carolina (NC) 9 6 3 67 Oklahoma (OK) 9 6 3 67 Utah (UT) 9 6 3 67 California (CA) 7 4 3 57 Alabama (AL) 9 5 4 56 Arkansas (AR) 9 5 4 56 Arizona (AZ) 9 5 4 56 Bureau of Indian Education (BIE) 9 5 4 56 North Dakota (ND) 9 5 4 56 Oregon (OR) 9 5 4 56 Pennsylvania (PA) 9 5 4 56 New Mexico (NM) 9 5 4 56 District of Columbia (DC) 9 4 5 44 Hawaii (HI) 9 4 5 44 Puerto Rico (PR) 9 4 5 44 Texas (TX) 9 4 5 44 Vermont (VT) 9 4 5 44
1 See footnotes to Table 2 and Appendix C.

31
Numbers and Percentages of Instructional Support Indicators for which States Were in Compliance by State, 2003-2006
State Number of Indicators Reviewed1
Number of Indicators in Compliance
Number of Indicators Out of
Compliance
Percentage of Indicators in Compliance
Total 432 251 181 Avg. 58 Ohio (OH) 9 9 0 100 Montana (MT) 9 8 1 89 New Jersey (NJ 9 8 1 89 South Dakota (SD) 9 8 1 89 Hawaii (HI) 8 7 1 88 North Dakota (ND 8 7 1 88 South Carolina (SC) 8 7 1 88 Tennessee (TN) 8 7 1 88 West Virginia (WV) 8 7 1 88 Wyoming (WY) 8 7 1 88 Iowa (IA) 9 7 2 78 Alaska (AK) 8 6 2 75 Arkansas (AR) 8 6 2 75 Kansas (KS) 8 6 2 75 Nevada (NV) 8 6 2 75 New Hampshire (NH) 8 6 2 75 Washington (WA) 8 6 2 75 Oklahoma (OK) 7 5 2 71 Connecticut (CT) 9 6 3 67 Massachusetts (MA) 9 6 3 67 Rhode Island (RI) 9 6 3 67 Arizona (AZ) 8 5 3 63 Georgia (GA) 8 5 3 63 Kentucky (KY) 8 5 3 63 Louisiana (LA) 8 5 3 63 Nebraska (NE) 8 5 3 63 New York (NY) 8 5 3 63 Wisconsin (WI) 8 5 3 63 Alabama (AL) 7 4 3 57 Michigan (MI) 9 5 4 56 Missouri (MO) 9 5 4 56 Maryland (MD) 8 4 4 50 North Carolina (NC) 8 4 4 50 Oregon (OR) 8 4 4 50 Pennsylvania (PA) 8 4 4 50 Texas (TX) 8 4 4 50 Vermont (VT) 8 4 4 50 District of Columbia (DC) 8 4 4 50 Maine (ME) 9 4 5 44 Idaho (ID) 8 3 5 38 Mississippi (MS) 8 3 5 38 New Mexico (NM) 8 3 5 38 Minnesota (MN) 9 3 6 33 Colorado (CO) 8 2 6 25 Delaware (DE) 8 2 6 25 Illinois (IL) 8 2 6 25 Indiana (IN) 8 2 6 25 Utah (UT) 8 2 6 25 Virginia (VA) 8 2 6 25 California (CA) 9 2 7 22 Bureau of Indian Education (BIE)
5 1 4 20
Florida (FL) 8 1 7 13 Puerto Rico (PR) 8 1 7 13
1 See footnotes to Table 2 and Appendix C.
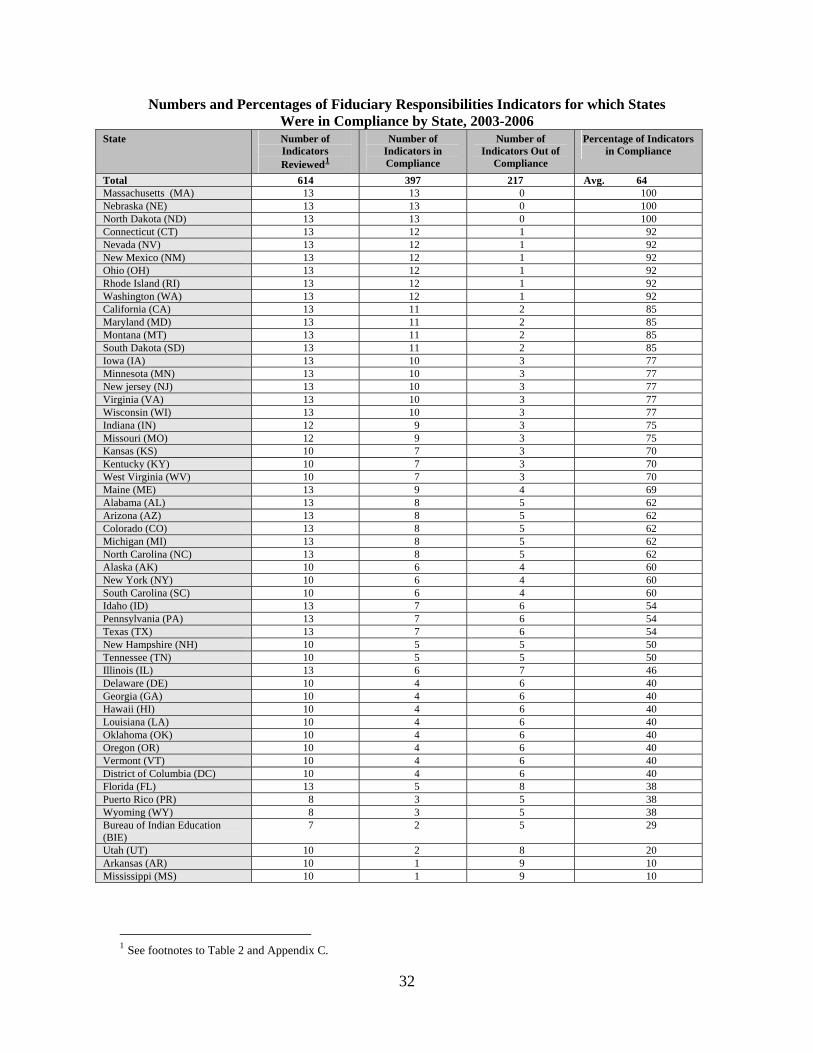
32
Numbers and Percentages of Fiduciary Responsibilities Indicators for which States Were in Compliance by State, 2003-2006
State Number of Indicators Reviewed1
Number of Indicators in Compliance
Number of Indicators Out of
Compliance
Percentage of Indicators in Compliance
Total 614 397 217 Avg. 64 Massachusetts (MA) 13 13 0 100 Nebraska (NE) 13 13 0 100 North Dakota (ND) 13 13 0 100 Connecticut (CT) 13 12 1 92 Nevada (NV) 13 12 1 92 New Mexico (NM) 13 12 1 92 Ohio (OH) 13 12 1 92 Rhode Island (RI) 13 12 1 92 Washington (WA) 13 12 1 92 California (CA) 13 11 2 85 Maryland (MD) 13 11 2 85 Montana (MT) 13 11 2 85 South Dakota (SD) 13 11 2 85 Iowa (IA) 13 10 3 77 Minnesota (MN) 13 10 3 77 New jersey (NJ) 13 10 3 77 Virginia (VA) 13 10 3 77 Wisconsin (WI) 13 10 3 77 Indiana (IN) 12 9 3 75 Missouri (MO) 12 9 3 75 Kansas (KS) 10 7 3 70 Kentucky (KY) 10 7 3 70 West Virginia (WV) 10 7 3 70 Maine (ME) 13 9 4 69 Alabama (AL) 13 8 5 62 Arizona (AZ) 13 8 5 62 Colorado (CO) 13 8 5 62 Michigan (MI) 13 8 5 62 North Carolina (NC) 13 8 5 62 Alaska (AK) 10 6 4 60 New York (NY) 10 6 4 60 South Carolina (SC) 10 6 4 60 Idaho (ID) 13 7 6 54 Pennsylvania (PA) 13 7 6 54 Texas (TX) 13 7 6 54 New Hampshire (NH) 10 5 5 50 Tennessee (TN) 10 5 5 50 Illinois (IL) 13 6 7 46 Delaware (DE) 10 4 6 40 Georgia (GA) 10 4 6 40 Hawaii (HI) 10 4 6 40 Louisiana (LA) 10 4 6 40 Oklahoma (OK) 10 4 6 40 Oregon (OR) 10 4 6 40 Vermont (VT) 10 4 6 40 District of Columbia (DC) 10 4 6 40 Florida (FL) 13 5 8 38 Puerto Rico (PR) 8 3 5 38 Wyoming (WY) 8 3 5 38 Bureau of Indian Education (BIE)
7 2 5 29
Utah (UT) 10 2 8 20 Arkansas (AR) 10 1 9 10 Mississippi (MS) 10 1 9 10
1 See footnotes to Table 2 and Appendix C.

33
Appendix E: State-by-State Numbers and Percentages of Indicators for which States were in Compliance, by Indicator Area, by Year, 2003-2006
Summary of Results for the Accountability Indicators, 2003-2004 State Number of Indicators
Reviewed1 Number of
Indicators in Compliance
Number of Indicators Out of
Compliance
Percentage of Indicators in Compliance
Total 96 83 13 Avg. 86 Connecticut (CT) 7 7 0 100 Minnesota (MN) 7 7 0 100 New Jersey (NJ) 7 7 0 100 Ohio (OH) 7 7 0 100 Rhode Island (RI) 7 7 0 100 South Dakota (SD) 5 5 0 100 Massachusetts (MA) 7 6 1 86 Maine (ME) 7 6 1 86 Montana (MT) 7 6 1 86 Nebraska (NE) 7 6 1 86 Iowa (IA) 7 5 2 71 Michigan (MI) 7 5 2 71 Missouri (MO) 7 5 2 71 California (CA) 7 4 3 57
Summary of Results for the Accountability Indicators, 2004-2005
State Number of Indicators Reviewed2
Number of Indicators in Compliance
Number of Indicators Out of
Compliance
Percentage of Indicators in Compliance
Total 158 108 50 Avg. 68 Nevada (NV) 7 7 0 100 Virginia (VA) 9 8 1 89 Wisconsin (WI) 9 8 1 89 Indiana (IN) 7 6 1 86 Florida (FL) 9 7 2 78 Idaho (ID) 9 7 2 78 Washington (WA) 9 7 2 78 Colorado (CO) 9 6 3 67 Illinois (IL) 9 6 3 67 Maryland (MD) 9 6 3 67 North Carolina (NC) 9 6 3 67 Alabama (AL) 9 5 4 56 Arizona (AZ) 9 5 4 56 Bureau of Indian Education (BIE)
9 5 4 56
North Dakota (ND) 9 5 4 56 Pennsylvania (PA) 9 5 4 56 New Mexico (NM) 9 5 4 56 Texas (TX) 9 4 5 44
1 See footnotes to Table 2 and Appendix C. 2 See footnotes to Table 2 and Appendix C.

34
Summary of Results for the Accountability Indicators, 2005-2006 State Number of Indicators
Reviewed1 Number of
Indicators in Compliance
Number of Indicators Out of
Compliance
Percentage of Indicators in Compliance
Total 189 132 57 Avg. 70 Tennessee (TN) 9 9 0 100 Wyoming (WY) 9 9 0 100 Alaska (AK) 9 8 1 89 New York (NY) 9 8 1 89 Delaware (DE) 9 7 2 78 Kansas (KS) 9 7 2 78 Louisiana (LA) 9 7 2 78 New Hampshire (NH) 9 7 2 78 South Carolina (SC) 9 7 2 78 West Virginia (WV) 9 7 2 78 Georgia (GA) 9 6 3 67 Kentucky (KY) 9 6 3 67 Mississippi (MS) 9 6 3 67 Oklahoma (OK) 9 6 3 67 Utah (UT) 9 6 3 67 Arkansas (AR) 9 5 4 56 Oregon (OR) 9 5 4 56 District of Columbia (DC) 9 4 5 44 Hawaii (HI) 9 4 5 44 Vermont (VT) 9 4 5 44 Puerto Rico (PR) 9 4 5 44
Summary of Results for the Instructional Support Indicators, 2003-2004 State Number of Indicators
Reviewed Number of
Indicators in Compliance
Number of Indicators Out of
Compliance
Percentage of Indicators in Compliance
Total 125 82 43 Avg. 66 Ohio (OH) 9 9 0 100 Montana (MT) 9 8 1 89 New Jersey (NJ 9 8 1 89 South Dakota (SD) 9 8 1 89 Iowa (IA) 9 7 2 78 Connecticut (CT) 9 6 3 67 Massachusetts (MA) 9 6 3 67 Rhode Island (RI) 9 6 3 67 Nebraska (NE) 8 5 3 63 Michigan (MI) 9 5 4 56 Missouri (MO) 9 5 4 56 Maine (ME) 9 4 5 44 Minnesota (MN) 9 3 6 33 California (CA) 9 2 7 22
1 See footnotes to Table 2 and Appendix C.

35
Summary of Results for the Instructional Support Indicators, 2004-2005 State Number of Indicators
Reviewed1 Number of
Indicators in Compliance
Number of Indicators Out of
Compliance
Percentage of Indicators in Compliance
Total 140 65 75 Avg. 46 North Dakota (ND 8 7 1 88 Nevada (NV) 8 6 2 75 Washington (WA) 8 6 2 75 Arizona (AZ) 8 5 3 63 Wisconsin (WI) 8 5 3 63 Alabama (AL) 7 4 3 57 Maryland (MD) 8 4 4 50 North Carolina (NC) 8 4 4 50 Pennsylvania (PA) 8 4 4 50 Texas (TX) 8 4 4 50 Idaho (ID) 8 3 5 38 New Mexico (NM) 8 3 5 38 Colorado (CO) 8 2 6 25 Illinois (IL) 8 2 6 25 Indiana (IN) 8 2 6 25 Virginia (VA) 8 2 6 25 Bureau of Indian Education (BIE)
5 1 4 20
Florida (FL) 8 1 7 13
Summary of Results for the Instructional Support Indicators, 2005-2006
State
Number of Indicators
Reviewed2
Number of Indicators in Compliance
Number of Indicators Out of
Compliance
Percentage of Indicators in Compliance
Total 167 104 63 Avg. 62 Hawaii (HI) 8 7 1 88 South Carolina (SC) 8 7 1 88 Tennessee (TN) 8 7 1 88 West Virginia (WV) 8 7 1 88 Wyoming (WY) 8 7 1 88 Alaska (AK) 8 6 2 75 Arkansas (AR) 8 6 2 75 Kansas (KS) 8 6 2 75 New Hampshire (NH) 8 6 2 75 Oklahoma (OK) 7 5 2 71 Georgia (GA) 8 5 3 63 Kentucky (KY) 8 5 3 63 Louisiana (LA) 8 5 3 63 New York (NY) 8 5 3 63 Oregon (OR) 8 4 4 50 Vermont (VT) 8 4 4 50 District of Columbia (DC) 8 4 4 50 Mississippi (MS) 8 3 5 38 Delaware (DE) 8 2 6 25 Utah (UT) 8 2 6 25 Puerto Rico (PR) 8 1 7 13
1 See footnotes to Table 2 and Appendix C. 2 See footnotes to Table 2 and Appendix C.

36
Summary of Results for the Fiduciary Responsibilities Indicators, 2003-2004 State Number of Indicators
Reviewed1 Number of
Indicators in Compliance
Number of Indicators Out of
Compliance
Percentage of Indicators in Compliance
Total 181 151 30 Avg. 83 Massachusetts (MA) 13 13 0 100 Nebraska (NE) 13 13 0 100 Connecticut (CT) 13 12 1 92 Ohio (OH) 13 12 1 92 Rhode Island (RI) 13 12 1 92 California (CA) 13 11 2 85 Montana (MT) 13 11 2 85 South Dakota (SD) 13 11 2 85 Iowa (IA) 13 10 3 77 Minnesota (MN) 13 10 3 77 New jersey (NJ) 13 10 3 77 Missouri (MO) 12 9 3 75 Maine (ME) 13 9 4 69 Michigan (MI) 13 8 5 62
Summary of Results for the Fiduciary Responsibilities Indicators, 2004-2005 State Number of Indicators
Reviewed2 Number of
Indicators in Compliance
Number of Indicators Out of
Compliance
Percentage of Indicators in Compliance
Total 227 155 72 Avg. 68 North Dakota (ND) 13 13 0 100 Nevada (NV) 13 12 1 92 Mew Mexico (NM) 13 12 1 92 Washington (WA) 13 12 1 92 Maryland (MD) 13 11 2 85 Virginia (VA) 13 10 3 77 Wisconsin (WI) 13 10 3 77 Indiana (IN) 12 9 3 75 Alabama (AL) 13 8 5 62 Arizona (AZ) 13 8 5 62 Colorado (CO) 13 8 5 62 North Carolina (NC) 13 8 5 62 Idaho (ID) 13 7 6 54 Pennsylvania (PA) 13 7 6 54 Texas (TX) 13 7 6 54 Illinois (IL) 13 6 7 46 Florida (FL) 13 5 8 38 Bureau of Indian Education (BIE)
7 2 5 29
1 See footnotes to Table 2 and Appendix C. 2 See footnotes to Table 2 and Appendix C.

37
Summary of Results for the Fiduciary Responsibilities Indicators, 2005-2006 State Number of Indicators
Reviewed1 Number of
Indicators in Compliance
Number of Indicators Out of
Compliance
Percentage of Indicators in Compliance
Total 206 91 115 Avg. 44 Kansas (KS) 10 7 3 70 Kentucky (KY) 10 7 3 70 West Virginia (WV) 10 7 3 70 Alaska (AK) 10 6 4 60 New York (NY) 10 6 4 60 South Carolina (SC) 10 6 4 60 New Hampshire (NH) 10 5 5 50 Tennessee (TN) 10 5 5 50 Delaware (DE) 10 4 6 40 Georgia (GA) 10 4 6 40 Hawaii (HI) 10 4 6 40 Louisiana (LA) 10 4 6 40 Oklahoma (OK) 10 4 6 40 Oregon (OR) 10 4 6 40 Vermont (VT) 10 4 6 40 District of Columbia (DC) 10 4 6 40 Puerto Rico (PR) 8 3 5 38 Wyoming (WY) 8 3 5 38 Utah (UT) 10 2 8 20 Arkansas (AR) 10 1 9 10 Mississippi (MS) 10 1 9 10
1 See footnotes to Table 2 and Appendix C.

38
Appendix F: Comparison of Indicators for all Years, 2003-2006
The tables below show the number of states monitored for compliance with each indicator along with the numbers of states in and out of compliance with each of these indicators and the percentages of states in compliance. Instances for which there were substantial changes in the indicators from one year to another year also are summarized by the bullets below; the summary below does not include changes that involved only renumbering of the indicators. Both substantial changes and renumbering of the indicators are described with the tables for each indicator in this section. Changes following monitoring in 2003-04 implemented for monitoring in 2004-05:
• Accountability indicators 1.2 and 1.3 for 2003-04 (academic achievement standards and alternate academic achievement standards, and assessments and alternate assessments, respectively) were combined into 1.3 for the two later years.
• Accountability indicator 1.4 for 2004-05 and 2005-06 (assessments are valid and reliable) was added for these years.
• Accountability indicator 1.5 for 2003-04 (annual report cards) was split into 1.6 and 1.7 for the later two years.
• Instructional support indicator 2.3 for 2003-04 was moved to fiduciary responsibilities for later years.
• Fiduciary responsibilities indicator 3.12 for 2003-04 (reservation of funds) was subsumed under fiduciary responsibilities indicator 3.7 for 2004-05 (state administrative funds).
• Fiduciary responsibilities indicator 3.6 for 2003-04 was deleted for later years. • Fiduciary responsibilities indicators 3.7 and 3.11 for 2003-04 were reworded for 2004-05
and 2005-06. • Fiduciary responsibilities indicators 3.9 for 2003-04 and 3.13 in 2004-05 (equipment and
real property) were added for these years. Changes following monitoring in 2004-05 implemented for monitoring in 2005-06:
• Fiduciary responsibilities indicator 3.10 for 2003-04 and 2004-05 became an overarching monitoring indicator for 2005-06.
• Fiduciary responsibilities indicators 3.3 and 3.9 for 2003-04 and 2004-05 (maintenance of effort, and rank ordering requirements for schools and reservations of funds, respectively) and fiduciary responsibilities indicator 3.13 for 2003-04 and 3.12 for 2004-05 (supplement not supplant) were subsumed under fiduciary responsibilities indicator 3.4 for 2005-06.
• Fiduciary responsibilities indicator 3.10 (disposition of Title I equipment) was added in 2005-06.

39
Accountability Indicators Indicator: The SEA has approved academic content standards for all required subjects or an approved timeline for developing them.
Indicator Status 2003-04 2004-05 2005-06 All Years Indicator Number 1.1 1.1 1.1 NA Number of States Reviewed 14 18 21 53 Number of States in Compliance 14 18 19 51 Number of States Out of Compliance 0 0 2 2 Percentage of States in Compliance 100 100 90 96
Indicator: The SEA has approved academic achievement standards and alternative academic achievement standards in required subjects and grades or an approved timeline to create them.
Indicator Status 2003-04 2004-05 2005-06 All Years Indicator Number 1.2 1.2 1.2 NA Number of States Reviewed 13 18 21 52 Number of States in Compliance 13 16 16 45 Number of States Out of Compliance 0 2 5 7 Percentage of States in Compliance 100 89 76 87
Indicator: The SEA has approved assessments and alternate assessments in required subject areas and grades or an approved timeline to create them.
Indicator Status 2003-04 2004-05 2005-06 All Years Indicator Number 1.3 1.3 1.3 NA Number of States Reviewed 13 18 21 52 Number of States in Compliance 10 14 11 35 Number of States Out of Compliance 3 4 10 17 Percentage of States in Compliance 77 78 52 67
Indicator: The SEA has implemented all required components as identified in its accountability workbook.
Indicator Status 2003-04 2004-05 2005-06 All Years Indicator Number 1.4 1.5* 1.5 NA Number of States Reviewed 14 18 21 53 Number of States in Compliance 8 6 14 28 Number of States Out of Compliance 6 12 7 25 Percentage of States in Compliance 57 33 67 53
*Note: Indicator 1.4 was moved to 1.5, and a new indicator, relating to the validity, reliability, and data quality of State assessments was added as Indicator 1.4.

40
Indicator (03-04): The SEA has published an annual report card and ensured that LEAs have published annual report cards as required. Indicators (04-05 and 05-06): The SEA has published an annual report card as required and an Annual Report to the Secretary. The SEA has ensured that LEAs have published annual report cards as required.
Indicator Status 2003-04 2004-05 2005-06 All Years Indicator Number 1.5 1.6*
1.7* 1.6 1.7
NA
Number of States Reviewed 14 18 18
21 21
53 53
Number of States in Compliance 11 10 4
9 6
30 21
Number of States Out of Compliance 3 8 14
12 15
23 32
Percentage of States in Compliance 79 56 22
43 29
57 40
*Note: The former Indicator 1.5, regarding SEA and LEA report cards was split into two indicators, 1.6 and 1.7.
Indicator: The SEA indicates how funds received under Grants for State Assessments and related activities will be or have been used to meet the 2005 – 2006 and 2007 – 2008 assessment requirements of NCLB.
Indicator Status 2003-04 2004-05 2005-06 All Years Indicator Number 1.6 1.8* 1.8 NA Number of States Reviewed 14 18 21 53 Number of States in Compliance 14 18 20 52 Number of States Out of Compliance 0 0 1 1 Percentage of States in Compliance 100 100 95 98
*Note: The former indicator 1.6 was renumbered as Indicator 1.8. Indicator: The SEA ensures that LEAs meet all requirements for identifying and assessing the academic achievement of limited English proficient students.
Indicator Status 2003-04 2004-05 2005-06 Total Indicator Number 1.7 1.9* 1.9 NA Number of States Reviewed 14 18 21 53 Number of States in Compliance 13 15 21 49 Number of States Out of Compliance 1 3 0 4 Percentage of States in Compliance 93 83 100 92
*Note: The former indicator 1.7 was renumbered as Indicator 1.9.
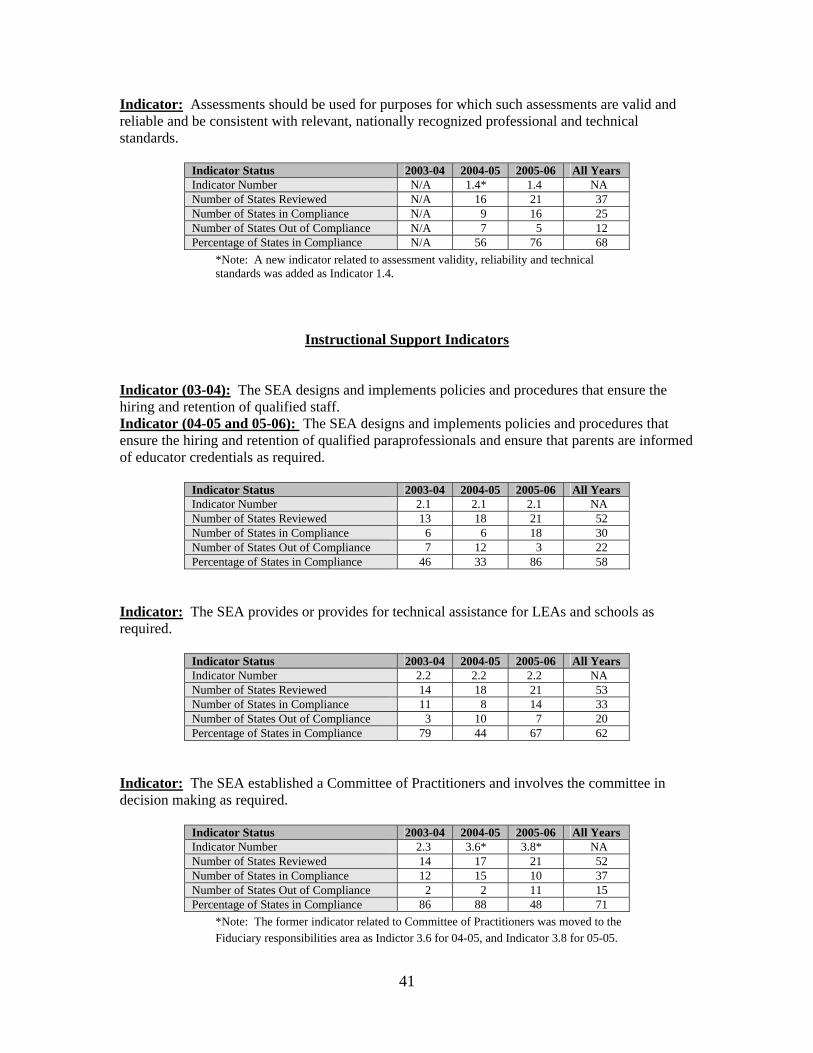
41
Indicator: Assessments should be used for purposes for which such assessments are valid and reliable and be consistent with relevant, nationally recognized professional and technical standards.
Indicator Status 2003-04 2004-05 2005-06 All Years Indicator Number N/A 1.4* 1.4 NA Number of States Reviewed N/A 16 21 37 Number of States in Compliance N/A 9 16 25 Number of States Out of Compliance N/A 7 5 12 Percentage of States in Compliance N/A 56 76 68
*Note: A new indicator related to assessment validity, reliability and technical standards was added as Indicator 1.4.
Instructional Support Indicators Indicator (03-04): The SEA designs and implements policies and procedures that ensure the hiring and retention of qualified staff. Indicator (04-05 and 05-06): The SEA designs and implements policies and procedures that ensure the hiring and retention of qualified paraprofessionals and ensure that parents are informed of educator credentials as required.
Indicator Status 2003-04 2004-05 2005-06 All Years Indicator Number 2.1 2.1 2.1 NA Number of States Reviewed 13 18 21 52 Number of States in Compliance 6 6 18 30 Number of States Out of Compliance 7 12 3 22 Percentage of States in Compliance 46 33 86 58
Indicator: The SEA provides or provides for technical assistance for LEAs and schools as required.
Indicator Status 2003-04 2004-05 2005-06 All Years Indicator Number 2.2 2.2 2.2 NA Number of States Reviewed 14 18 21 53 Number of States in Compliance 11 8 14 33 Number of States Out of Compliance 3 10 7 20 Percentage of States in Compliance 79 44 67 62
Indicator: The SEA established a Committee of Practitioners and involves the committee in decision making as required.
Indicator Status 2003-04 2004-05 2005-06 All Years Indicator Number 2.3 3.6* 3.8* NA Number of States Reviewed 14 17 21 52 Number of States in Compliance 12 15 10 37 Number of States Out of Compliance 2 2 11 15 Percentage of States in Compliance 86 88 48 71
*Note: The former indicator related to Committee of Practitioners was moved to the Fiduciary responsibilities area as Indictor 3.6 for 04-05, and Indicator 3.8 for 05-05.

42
Indicator: The SEA ensures that LEAs and schools meet parental involvement requirements.
Indicator Status 2003-04 2004-05 2005-06 All Years Indicator Number 2.4 2.3* 2.3 NA Number of States Reviewed 14 18 21 53 Number of States in Compliance 8 6 2 16 Number of States Out of Compliance 6 12 19 37 Percentage of States in Compliance 57 33 10 30
*Note: The former Indicator 2.4 was renumbered as Indicator 2.3. Indicator: The SEA ensures that schools and LEAs identified for improvement, corrective action, or restructuring as required, and that subsequent, required steps are taken.
Indicator Status 2003-04 2004-05 2005-06 All Years Indicator Number 2.5 2.4* 2.4 NA Number of States Reviewed 14 18 21 53 Number of States in Compliance 6 10 9 25 Number of States Out of Compliance 8 8 12 28 Percentage of States in Compliance 43 56 43 47
*Note: The former Indicator 2.5 was renumbered as Indicator 2.4. Indicator: The SEA ensures that the requirements for public school choice are met.
Indicator Status 2003-04 2004-05 2005-06 All Years Indicator Number 2.6 2.5* 2.5 NA Number of States Reviewed 14 17 21 52 Number of States in Compliance 10 6 16 32 Number of States Out of Compliance 4 11 5 20 Percentage of States in Compliance 71 35 76 62
*Note: The former Indicator 2.6 was renumbered as Indicator 2.5. Indicator: The SEA ensures that the statutory requirements for the provision of supplemental educational services (SES) are met.
Indicator Status 2003-04 2004-05 2005-06 All Years Indicator Number 2.7 2.6* 2.6 NA Number of States Reviewed 14 16 21 51 Number of States in Compliance 11 7 17 35 Number of States Out of Compliance 3 9 4 16 Percentage of States in Compliance 79 44 81 69
*Note: The former Indicator 2.7 was renumbered as Indicator 2.6.

43
Indicator: The SEA ensures that LEAs and schools develop schoolwide programs that use the flexibility provided to them by law to improve the academic achievement of all students in the school.
Indicator Status 2003-04 2004-05 2005-06 All Years Indicator Number 2.8 2.7* 2.7 NA Number of States Reviewed 14 18 21 53 Number of States in Compliance 5 8 11 24 Number of States Out of Compliance 9 10 10 29 Percentage of States in Compliance 36 44 52 45
*Note: The former Indicator 2.8 was renumbered as Indicator 2.7. Indicator: The SEA ensures that LEAs and schools develop and maintain targeted assistance programs that meet all required components.
Indicator Status 2003-04 2004-05 2005-06 All Years Indicator Number 2.9 2.8* 2.8 NA Number of States Reviewed 14 17 21 52 Number of States in Compliance 13 14 18 45 Number of States Out of Compliance 1 3 3 7 Percentage of States in Compliance 93 82 86 87
*Note: The former Indicator 2.9 was renumbered as Indicator 2.8.
Fiduciary Responsibilities Indicators Indicator: The SEA ensures that its component LEAs are audited annually, if required, and that all corrective actions required through this process are fully implemented.
Indicator Status 2003-04 2004-05 2005-06 All Years Indicator Number 3.1 3.1 3.5* NA Number of States Reviewed 14 18 21 53 Number of States in Compliance 13 15 8 36 Number of States Out of Compliance 1 3 13 17 Percentage of States in Compliance 93 83 38 68
*Note: The former Indicator 3.1 was renumbered as Indicator 3.5. Indicator: The SEA complies with the allocation, reallocation, and carryover provisions of Title I.
Indicator Status 2003-04 2004-05 2005-06 All Years Indicator Number 3.2 3.2 3.3* NA Number of States Reviewed 14 17 21 52 Number of States in Compliance 10 8 10 28 Number of States Out of Compliance 4 9 11 24 Percentage of States in Compliance 71 47 48 54
*Note: The former Indicator 3.2 was subsumed under Indicator 3.3

44
Indicator: The SEA complies with the maintenance of effort provisions of Title I.
Indicator Status 2003-04 2004-05 2005-06 All Years Indicator Number 3.3 3.3 3.4* NA Number of States Reviewed 14 17 21 52 Number of States in Compliance 14 16 10 40 Number of States Out of Compliance 0 1 11 12 Percentage of States in Compliance 100 94 48 77
*Note: The former Indicator 3.3 was subsumed under Indicator 3.4. Indicator: The SEA ensures that LEAs comply with the comparability provisions of Title I.
Indicator Status 2003-04 2004-05 2005-06 All Years Indicator Number 3.4 3.4 3.4 NA Number of States Reviewed 14 17 21 52 Number of States in Compliance 8 8 10 26 Number of States Out of Compliance 6 9 11 26 Percentage of States in Compliance 57 47 48 50
Indicator: The SEA ensures that LEAs provide Title I services to eligible children attending non-public schools.
Indicator Status 2003-04 2004-05 2005-06 All Years Indicator Number 3.5 3.5 3.6* NA Number of States Reviewed 13 17 21 51 Number of States in Compliance 3 6 8 17 Number of States Out of Compliance 10 11 13 34 Percentage of States in Compliance 23 35 38 33
*Note: The former Indicator 3.5 was renumbered as Indicator 3.6. Indicator: The SEA has a system for ensuring and maximizing the quality, objectivity, utility, and integrity of information disseminated by the agency.
Indicator Status 2003-04 2004-05 2005-06 All Years Indicator Number 3.6 N/A* N/A N/A Number of States Reviewed 14 N/A N/A N/A Number of States in Compliance 13 N/A N/A N/A Number of States Out of Compliance 1 N/A N/A N/A Percentage of States in Compliance 93 N/A N/A N/A
*Note: The Indicator 3.6 (data quality) was deleted.

45
Indicator (03-04): The SEA has an accounting system for administrative funds that includes (1) State administration; (2) reallocation, and (3) reservation of funds for school improvement. Indicator (04-05): The SEA has an accounting system in place that enables it to account for reservation of funds for school improvement, State administration, and the State academic achievement awards program.
Indicator Status 2003-04 2004-05 2005-06 All Years Indicator Number 3.7 3.7 3.1* NA Number of States Reviewed 14 18 21 53 Number of States in Compliance 13 6 13 32 Number of States Out of Compliance 1 12 8 21 Percentage of States in Compliance 93 33 62 60
* Note: Indicator 3.7 was renumbered as Indicator 3.1. Indicator: The SEA has a system for ensuring fair and prompt resolution of complaints.
Indicator Status 2003-04 2004-05 2005-06 All Years Indicator Number 3.8 3.8 3.7* NA Number of States Reviewed 14 18 21 53 Number of States in Compliance 12 15 11 38 Number of States Out of Compliance 2 3 10 15 Percentage of States in Compliance 86 83 52 72
* Note: Indicator 3.8 was renumbered as Indicator 3.7. Indicator: The SEA ensures that LEAs comply with the rank order procedures for the eligible school attendance area.
Indicator Status 2003-04 2004-05 2005-06 All Years Indicator Number 3.9 3.9 3.3* NA Number of States Reviewed 14 17 21 52 Number of States in Compliance 12 13 10 35 Number of States Out of Compliance 2 4 11 17 Percentage of States in Compliance 86 76 48 67
*Note: Indicator 3.9 was subsumed under Indicator 3.3. Indicator: The SEA conducts monitoring of its subgrantees sufficient to ensure compliance with Title I requirements.
Indicator Status 2003-04 2004-05 2005-06 All Years Indicator Number 3.10 3.10 * NA Number of States Reviewed 14 18 21 53 Number of States in Compliance 12 10 12 34 Number of States Out of Compliance 2 8 9 19 Percentage of States in Compliance 86 56 57 64
*Note: Indicator 3.10 became an Overarching Monitoring Indicator for 05-06.

46
Indicator (03-04): The LEA complies with the provision for submitting an annual plan to the SEA. Indicator (04-05): The SEA ensures that its LEAs comply with the provision for submitting an annual application to the SEA and revising LEA plans as necessary to reflect substantial changes in the direction of their program.
Indicator Status 2003-04 2004-05 2005-06 All Years Indicator Number 3.11 3.11 3.2* NA Number of States Reviewed 14 18 21 53 Number of States in Compliance 14 14 20 48 Number of States Out of Compliance 0 4 1 5 Percentage of States in Compliance 100 78 95 91
*Note: Indicator 3.11 was renumbered as Indicator 3.2. Indicator: The SEA and LEA comply with requirements regarding the reservation of administrative funds.
Indicator Status 2003-04 2004-05 2005-06 All Years Indicator Number 3.12 3.7* 3.1** NA Number of States Reviewed 14 18 21 53 Number of States in Compliance 14 6 13 33 Number of States Out of Compliance 0 12 8 20 Percentage of States in Compliance 100 33 62 62
*Note: Indicator 3.12 was subsumed under indicator 3.7 (Reservations for Administrative funds). ** Note: Indicator 3.7 was subsumed under Indicator 3.1.
Indicator: The SEA ensures that Title I funds are used only to supplement or increase non-federal sources used for the education of participating children and do not supplant funds from non-Federal sources.
Indicator Status 2003-04 2004-05 2005-06 All Years Indicator Number 3.13 3.12* 3.4** NA Number of States Reviewed 14 17 21 52 Number of States in Compliance 13 16 10 39 Number of States Out of Compliance 1 1 11 13 Percentage of States in Compliance 93 94 48 75
*Note: Indicator 3.13 (Supplement not Supplant) was moved up to Indicator 3.12. **Note: Indicator 3.12 was subsumed under Indicator 3.4.
Indicator: The SEA ensures that equipment and real property are procured at a cost that is recognized as ordinary and the equipment and real property are necessary for the performance of the Federal award.
Indicator Status 2003-04 2004-05 2005-06 All Years Indicator Number N/A 3.13 3.9* NA Number of States Reviewed N/A 18 19 37 Number of States in Compliance N/A 13 0 13 Number of States Out of Compliance N/A 5 19 24 Percentage of States in Compliance N/A 72 0 35
*Note: Indicator 3.13 was renumbered as Indicator 3.9.

47
Indicator: SEAs and LEAs maintain control over the procurement, recording, custody, use, and disposition of Title I equipment.
Indicator Status 2003-04 2004-05 2005-06 All Years Indicator Number N/A N/A 3.10 NA Number of States Reviewed N/A N/A 19 19 Number of States in Compliance N/A N/A 1 1 Number of States Out of Compliance N/A N/A 18 18 Percentage of States in Compliance N/A N/A 5 5