2005 annual report -...
TRANSCRIPT

2005ANNUAL REPORT
Head N.V. is a Dutch Company. It listed its ordinary shares on the New York Stock Exchange and Vienna Stock Exchangein September 2000.
We are a leading global manufacturer and marketer of premium sports equipment. We have a strong heritage in sportinggoods equipment, having brought the first metal ski to the market in 1951. More recently we introduced the firstmicro-chip controlled tennis racquets and skis. In keeping with this tradition, we believe our products are highlyinnovative and technology-driven.
We own some of the best-known and most highly respected brands in the sports equipment market:
The Head brand was established in 1950 after Howard Head invented the first laminated metal ski. It has since beenextended to cover a leading range of sports equipment including tennis, squash and racquetball racquets, alpine skis andboots, and snowboards, bindings and boots. Head is currently the number two tennis racquet brand in the world and isone of the top alpine ski and boot manufacturers.
The Penn Company was founded almost 100 years ago and has been making history ever since, introducing the firstpressurized ball cans in 1922 and the first fluorescent yellow tennis ball in 1968. Penn was acquired by Head in 1999 andtoday Penn is the official ball of the Tennis Masters Series and the number one selling tennis ball in the United States.Penn racquetball balls are currently the number one selling racquetball ball worldwide.
Tyrolia is estimated to be the world’s number one alpine ski binding producer. Tyrolia has been producing bindings since1928 and has brought to market innovations such as the first step-in alpine binding in 1962 and the first carving bindingin 1996.
Mares was founded in 1949 as one of the first industrial diving companies. Today it is one of the leading dive brandsworldwide with particular strengths in regulators and all-in-one diving systems (the H.U.B.). Dacor, founded in 1953 andbased in the United States, specializes in scuba equipment.
Our products appeal to a wide range of users from novices to some of the world’s top athletes including Andre Agassi,Gustavo Kuerten, Marat Safin, Swetlana Kusnezowa, Johann Grugger, Marco Büchel and Maria Riesch.
Our products are sold through over 30,000 accounts including pro shops, specialty sporting goods stores and massmerchants in over 85 countries around the world.
For more information, please visit our website: www.head.com
A B O U T H E A D
1
About Head . . . . . . . . . . . . . . . . . . . . . . . . . . . . . . . . . . . . . . . . . . . . . . . . Inside front cover
Financial Highlights . . . . . . . . . . . . . . . . . . . . . . . . . . . . . . . . . . . . . . . . . . . . . . . . . . . . . . . . 2
Chairman’s Letter to Shareholders . . . . . . . . . . . . . . . . . . . . . . . . . . . . . . . . . . . . . . . . . . . 3
Management’s Discussion and Analysis of Financial Statements and Results of Operations . . . . . . . . . . . . . . . . . . . . . . . . . . . . . . . . . . . . . . . . . . . . . . . . 5
Consolidated Balance Sheets . . . . . . . . . . . . . . . . . . . . . . . . . . . . . . . . . . . . . . . . . . . . . . . . 10
Consolidated Statements of Operations . . . . . . . . . . . . . . . . . . . . . . . . . . . . . . . . . . . . . . . 11
Consolidated Statements of Stockholders’ Equity . . . . . . . . . . . . . . . . . . . . . . . . . . . . . . . 12
Consolidated Statements of Cash Flows . . . . . . . . . . . . . . . . . . . . . . . . . . . . . . . . . . . . . . . 13
Notes to the Consolidated Financial Statements . . . . . . . . . . . . . . . . . . . . . . . . . . . . . . . . 14
Report of Independent Registered Public Accounting Firm . . . . . . . . . . . . . . . . . . . . . . . 33
List of Significant Participations . . . . . . . . . . . . . . . . . . . . . . . . . . . . . . . . . . . . . . . . . . . . . 34
Listing Details . . . . . . . . . . . . . . . . . . . . . . . . . . . . . . . . . . . . . . . . . . . . . . . . . . . . . . . . . . . . . 35
Shareholder Information . . . . . . . . . . . . . . . . . . . . . . . . . . . . . . . . . . . . . . . . . . . . . . . . . . . . 36
Corporate Directory . . . . . . . . . . . . . . . . . . . . . . . . . . . . . . . . . . . . . . . . . . . . . . . . . . . . . . . . 37
C O N T E N T S
Head
N.V
. An
nu
al Rep
ort 20
05
Based on US GAAPYear ended December 31,
US$ millions (except margin data) 2001 2002 2003 2004 2005
Total revenues(1) 392.0 387.5 431.2 477.8 456.5
Total net revenues(1) 384.8 380.0 422.3 467.0 446.9
Gross profit(1) 150.8 146.5 156.3 172.7 174.4
Margin 39.2% 38.6% 37.0% 37.0% 39.0%
Selling & marketing expense(1) 94.9 95.1 108.2 118.5 116.5
General & administration expense 36.9 34.2 39.5 42.4 39.5
Gain on sale of property 0.9 0.4 – 5.7 7.2
Restructuring costs (0.8) – (8.4) (2.3) (6.2)
Operating income 19.1 17.8 0.2 15.0 19.4
Margin 5.0% 4.7% 0.1% 3.2% 4.4%
Net interest expense (10.4) (10.7) (12.9) (23.6) (13.4)
Foreign exchange gain/(loss) 5.8 (7.4) (1.1) (0.6) 2.8
Income tax expense (4.0) (2.6) (0.8) (27.7) (0.9)
Net income/(loss) 9.4 (2.6) (14.7) (36.9) 8.0
These selected financial highlights should be read in conjunction with our historical consolidated financial statements andaccompanying notes included elsewhere in this annual report.
(1) As a result of the application of EITF 01-09 and EITF 00-10, prior period figures differ from those previously provided.
F I N A N C I A L H I G H L I G H T S
Head
N.V
. An
nu
al Rep
ort 20
05
2
2005 Revenues by Division (2)
46%
37% 14%
Racquet Sports
3%
Winter Sports Licensing Diving
(2) Based on total revenues
2005 Revenues by Geography (2)
59%
27%
North America
14%
Europe Rest of World
(2) Based on total revenues
Dear Shareholders,
The Head Group experienced a solid year in 2005,with strong operating income, and a substantialimprovement in net income from 2004. The sportinggoods equipment market continues to be a toughoperating environment; the development ofinnovative, high performance products remainsessential to achieve sales and margin improvements.Our implementation of cost saving & restructuringinitiatives is an on-going strategy, which continues tohave a beneficial impact on the Group’s results.
GROUP RESULTSTotal Group net revenues for 2005 were $446.9million, a decrease of 4% on 2004’s total netrevenues of $467.0 million. This decrease was due tolower sales in all of the Company’s divisions exceptLicensing and was partially offset by lower salesdeductions.
Our reported operating profit of $19.4 million is $4.4million above the reported operating profit of $15.0million in 2004. When adjusted for restructuringcosts ($6.2 million in 2005, and $2.3 million in 2004)and one-off gains on the sale of property ($7.2million in 2005, $5.7 million in 2004) the operatingprofit increase is $6.7 million from a $11.7 millionadjusted operating profit in 2004 to $18.4 million in2005.
DIVISIONAL RESULTSRevenues in our Winter Sports division decreased by3%, to $216.3 million from $223.2 million in 2004.This decrease was due to lower sales volumes forskis and bindings and the weakening of the euroagainst the U.S. dollar in the last quarter of the year,partly offset by higher sales volumes for ski bootsand the introduction of snowboard protection wear.
Revenues in our Racquet Sport division decreasedmarginally, by 1%, to $166.6 million from $168.0million in 2004. This decrease resulted mainly fromlower sales due to less favorable product and countrymix for the Company’s tennis racquets and lowersales volumes of its bags and tennis balls. This
decrease was partly offset by significantly highersales volumes in tennis racquets, better product mixin tennis balls and the strengthening of the euroagainst the U.S. dollar during the main deliveryperiod.
Revenues in our Diving division decreased 19% to$61.4 million from $75.5 million in 2004. This reflectsthe unfavorable market conditions, together with ourstrategy of improving product mix and generatinghigher margins (as opposed to increasing revenues).The strengthening of the euro against the U.S. dollarpartly offset the decline in revenues.
Revenues from licensing agreements increased by$1.2 million, or 11%, to $12.2 million from $11.1 millionin 2004. This was mainly due to increased revenuesfrom existing contracts and from new licensingagreements.
REORGANISATION AND RESTRUCTURINGDuring 2005, we continued to implementrestructuring projects; it is anticipated that these willhave a beneficial impact on future costs. The mainelements were as follows:
• Outsourcing tennis racquet production to China,resulting in a 90% reduction in our tennis racquetproduction in Kennelbach, Austria and Budweis,Czech Republic
• Restructuring of our ski binding production• Reduction of our production capacity at our plant
in Rapallo, Italy• Transfer of the remaining ski boot production from
Maser, Italy to Litovel, Czech Republic
NEW PRODUCTSAs in previous years, we have continued to focus oninnovation and the development of the nextgeneration of technologically advanced products.
In Winter Sports, we have introduced the new“Supershape” ski, appropriately named because ofthe pronounced side-cut in the design. Incorporationof Intelligence Technology ensures it rapidly adaptsto any situation, and Liquidmetal provides additional
C H A I R M A N ’ S L E T T E R T O S H A R E H O L D E R S
Head
N.V
. An
nu
al Rep
ort 20
05
3
power and vitality. We have also focused on ourrange for women; the “Cool Thang” providesoutstanding edge grip, and easy turn initiation forthe mid-speed range.
The S10 boot is designed for Freeride skiers; topspeeds & tight turns demand excellent materialcomposition, and the security of double powerbuckles. Head Winter Sports launched a newcategory of products in 2005: Head Protection. Thehighly technical products (based on spine & headprotection) are the result of 2 years of research &collaboration with international industrial designers,engineers & industry experts. The products havedistinct visual appeal, and include helmets,protection jackets, vests and backpacks, for bothskiing and snowboarding.
In Racquet Sports, our most significant new productlaunch, in Spring 2005, was Flexpoint Technology.Incorporating Liquidmetal, Flexpoint technology usestwo precisely engineered control holes, giving theracquet a revolutionary new flexpoint. This allowssignificantly more control over the ball, whileretaining all the power. It was with the FlexpointRadical that Andre Agassi reached the final of the USOpen during the summer. The other notable successwith a Head racquet was Marat Safin winning theAustralian Open.
In 2005, the Diving division launched a rangespecifically tailored to women divers, with a focus onperformance, fashion & comfort. The diving division’slatest product launch is the Quattro Excel fin.Following numerous tests on new materials, togetherwith lengthy computer simulations, the “SuperChannel Thrust” design makes it possible to channelthe water & optimize thrust in comparison to otherfins of similar size.
OUTLOOK FOR 2006Whilst market conditions have not improvedsignificantly, our performance continues to improve.We are encouraged by the strong performance in2005, and anticipate that our on-going restructuring& cost-saving initiatives will produce furtherefficiencies & savings in 2006. Our overriding
strategy continues to be the development ofinnovative products across all of the markets withinwhich we operate.
Sincerely,
Johan Eliasch
Chairman and Chief Executive Officer, Head N.V.
May 2006
C H A I R M A N ’ S L E T T E R T O S H A R E H O L D E R S( c o n t i n u e d )
He
ad
N.V
. An
nu
al R
ep
ort 2
00
5
4
Overview:The Company is a leading global manufacturer andmarketer of branded sporting goods serving theskiing, tennis and diving markets. The Company hascreated or acquired a portfolio of brands – Head(principally alpine skis, ski boots and snowboardproducts, tennis, racquetball and squash racquets),Penn (tennis balls and racquetball balls), Tyrolia (skibindings), Mares and Dacor (diving equipment). TheCompany’s key products have attained leadingmarket positions based on sales and reputation andhave gained high visibility through their use by manyof today’s top athletes.
With a broad product offering marketed mainly frommiddle to high price points, the Company suppliessporting equipment and accessories to all majordistribution channels in the skiing, tennis and divingmarkets, including pro shops, specialty sportinggoods stores and mass merchants. Head N.V.’sproducts are sold through some 30,000 customers inover 85 countries and target sports enthusiasts ofvarying levels of ability and interest ranging from thenovice to the professional athlete. The Company’sstrongest presence has traditionally been in Europe,and in recent years the Company has built marketshare in the United States, the next largest marketfor the Company’s products after Europe.
Over the last 56 years, the Company believes it hasearned a reputation as a leading developer andmanufacturer of innovative, high-quality andtechnologically advanced sporting equipment. TheCompany’s focus continues to be its core products ofskiing, tennis and diving equipment. In order toexpand market share and maximize profitability, forthe last ten years the Company has increased itsemphasis on marketing and new productdevelopment, leveraging further its brands, globaldistribution network and traditional strength inmanufacturing and in 2003, the Company initiated aprogram to reduce its fixed costs and streamline itsorganizational structure.
The Company generates revenues in its principalmarkets by selling goods directly to retail stores and toa lesser extent, by selling to distributors. It alsoreceives licensing and royalty income. As many of its
goods, especially Winter Sports goods, are shippedduring a specific part of the year, the Companyexperiences highly seasonal revenue streams.Following industry practice, the Company begins toreceive orders from its customers in the Winter Sportsdivision from March until June, during which time theCompany books approximately three quarters of itsorders for the year. The Company will typically beginshipment of skis, boots and bindings in July andAugust, with the peak shipping period occurring inOctober and November. At this time, the Company willbegin to receive re-orders from customers, whichconstitute the remaining quarter of its yearly orders.Re-orders are typically shipped in December andJanuary. Racquet Sports and Diving product revenuesalso experience seasonality, but to a lesser extent thanWinter Sports revenues. Revenue from sales isgenerally recognized at the time of shipment.
Market EnvironmentWinter Sports. Snowfalls at the end of November, andthe beginning of December 2005 in all our majorWinter Sports markets, including Japan, generatedearly interest in winter sports products and retailersreported improved sales at the beginning of thewinter sports season 2005/06 compared to theprevious year. Ski boots, in particular, were reportedcomparatively high sales. The Eastern Europe marketfor Winter Sports equipment also developed well.Although the Eastern Europe market volume for2005 remained relatively stable compared withprevious years, we may see an improvement inmarket share for 2006. The snowboard market for2005 was adversely affected by the late start of the2004/05 winter sports season, but has beenpositively affected by the early snow of the 2005/06season. However, the Company still expects themarket for snowboard products to decline byapproximately 15%.
Racquet Sports. Due to an unprecedented number ofnew racquet launches in the premium segment of theworldwide market, the US market for tennis racquetsales in 2005 improved substantially over 2004. TheEuropean tennis markets also showed slight growthfor 2005. Only the Japanese tennis market declinedin 2005 compared to 2004, albeit marginally.
M A N A G E M E N T ’ S D I S C U S S I O N A N D A N A LY S I SO F F I N A N C I A L S TAT E M E N T S A N D R E S U LT S O F O P E R AT I O N S
Head
N.V
. and
Su
bsidiaries A
nn
ual R
epo
rt 200
5 B
ased o
n U
.S. G
AA
P
5
Diving. During the first half of 2005, we experienceda decline in overall sales for diving equipment ofapproximately 8% compared to the first half of2004, due to less travel worldwide to dive centersand resorts and correspondingly fewer purchases ofequipment. For the year 2005, sales in EasternEurope and the Middle East showed a slightimprovement, and the market in Southeast Asiaexperienced moderate growth despite the decline insales reported after the tsunami at year-end 2004.As in the past few years, we continue to focus on theAsian markets and have established dedicated areamanagers and implemented marketing initiatives.Our strategy is to focus on improving gross marginsrather than revenues.
The Company operates in a multi-currency environmentand is subject to currency translation risk and, to alesser extent, currency transaction risk, principallybetween the euro and U.S. dollar. Currency translationrisk arises because the Company measures and recordsthe financial condition and results of operations of eachof its subsidiaries in their functional currency and thentranslates these amounts into U.S. dollars, theCompany’s reporting currency. The functional currencyof the Company’s European operations is the euro.Fluctuations in the value of the euro with respect to theU.S. dollar have had, and may continue to have, asignificant impact on the Company’s financial conditionand results of operations. The Company is subject tocurrency transaction risk whenever one of itssubsidiaries enters into a transaction using a currencyother than its functional currency. The Companyreduces this risk, however, by seeking to match itsrevenues and costs, as well as assets and liabilities, ineach currency.
Winter Sports revenues for the twelve months endedDecember 31, 2005 decreased by $6.9 million, or3.1%, to $216.3 million from $223.2 million in 2004.This decrease was due to lower sales volumes forskis and bindings and the weakening of the euroagainst the U.S. dollar in the last quarter of the yearpartly offset by higher sales volumes for ski bootsand the introduction of snowboard protection wear.
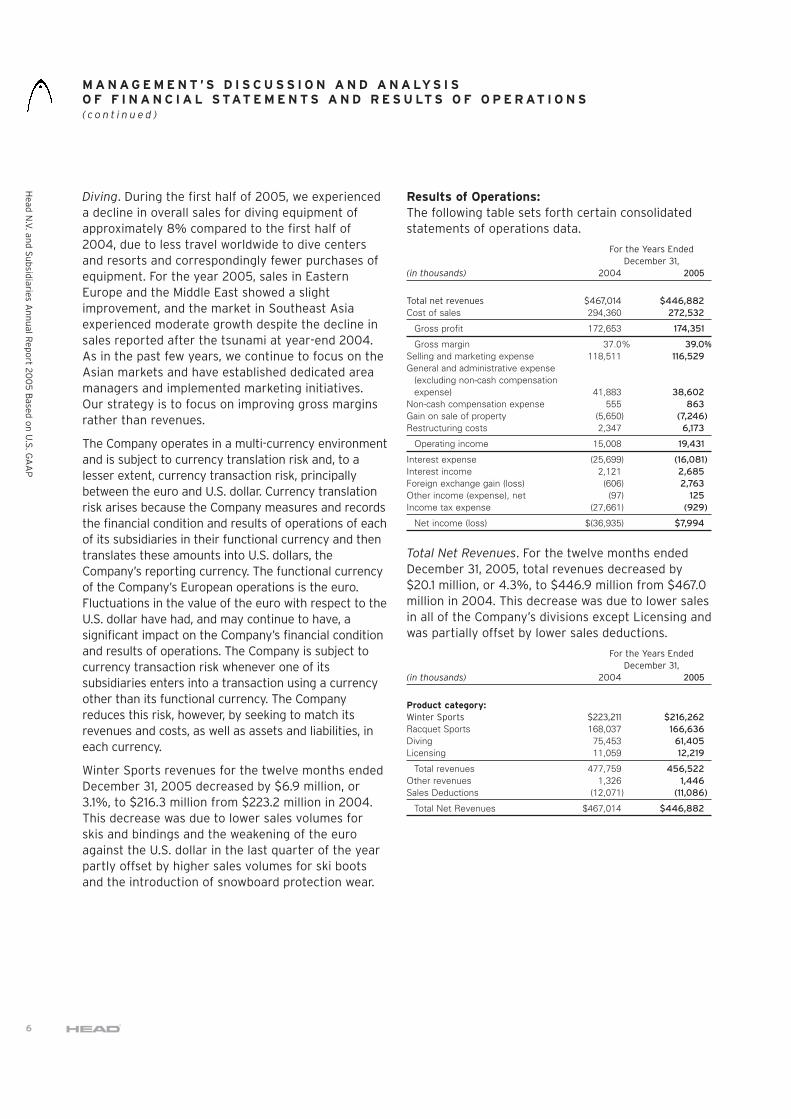
Results of Operations:The following table sets forth certain consolidatedstatements of operations data.
For the Years EndedDecember 31,
(in thousands) 2004 2005
Total net revenues $467,014 $446,882Cost of sales 294,360 272,532
Gross profit 172,653 174,351
Gross margin 37.0% 39.0%Selling and marketing expense 118,511 116,529General and administrative expense
(excluding non-cash compensation expense) 41,883 38,602
Non-cash compensation expense 555 863Gain on sale of property (5,650) (7,246)Restructuring costs 2,347 6,173
Operating income 15,008 19,431
Interest expense (25,699) (16,081)Interest income 2,121 2,685Foreign exchange gain (loss) (606) 2,763Other income (expense), net (97) 125Income tax expense (27,661) (929)
Net income (loss) $(36,935) $7,994
Total Net Revenues. For the twelve months endedDecember 31, 2005, total revenues decreased by$20.1 million, or 4.3%, to $446.9 million from $467.0million in 2004. This decrease was due to lower salesin all of the Company’s divisions except Licensing andwas partially offset by lower sales deductions.
For the Years EndedDecember 31,
(in thousands) 2004 2005
Product category:Winter Sports $223,211 $216,262Racquet Sports 168,037 166,636Diving 75,453 61,405Licensing 11,059 12,219
Total revenues 477,759 456,522Other revenues 1,326 1,446Sales Deductions (12,071) (11,086)
Total Net Revenues $467,014 $446,882
M A N A G E M E N T ’ S D I S C U S S I O N A N D A N A LY S I SO F F I N A N C I A L S TAT E M E N T S A N D R E S U LT S O F O P E R AT I O N S( c o n t i n u e d )
Head
N.V
. and
Su
bsidiaries A
nn
ual R
epo
rt 200
5 B
ased o
n U
.S. G
AA
P
6
M A N A G E M E N T ’ S D I S C U S S I O N A N D A N A LY S I SO F F I N A N C I A L S TAT E M E N T S A N D R E S U LT S O F O P E R AT I O N S( c o n t i n u e d )
Head N
.V. and Subsidiaries A
nnual Report 2005 B
ased on U.S
. GA
AP
7
Racquet Sports revenues for the twelve monthsended December 31, 2005 decreased by $1.4 million,or 0.8%, to $166.6 million from $168.0 million in2004. This decrease resulted mainly from lower salesdue to less favorable product and country mix for theCompany’s tennis racquets and lower sales volumesof its bags and tennis balls. This decrease was partlyoffset by significantly higher sales volumes in tennisracquets, better product mix in tennis balls and thestrengthening of the euro against the U.S. dollarduring the main delivery period.
Diving product revenues for the twelve monthsended December 31, 2005, decreased by $14.0million, or 18.6%, to $61.4 million from $75.5 millionin 2004, reflecting the unfavorable market conditionsand our strategy of improving product mix andgenerating higher margins rather than increasingrevenues. The strengthening of the euro against theU.S. dollar partly offset the decline in revenues.
Licensing revenues for the twelve months endedDecember 31, 2005, increased by $1.2 million, or10.5%, to $12.2 million from $11.1 million in 2004mainly due to increased revenues from existingcontracts and from new licensing agreements.
Other revenues include amounts billed to customersfor shipping and handling. These amounts arerecognized also as selling and marketing expense.
Sales deductions for the twelve months endedDecember 31, 2005, decreased by $1.0 million, or8.2%, to $11.1 million from $12.1 million in 2004mainly due to declining revenues.
Gross Profit. For the twelve months ended December31, 2005, gross profit increased by $1.7 million to$174.4 million from $172.7 million in 2004 due toimproved operating performance as a result of theCompany’s restructuring programs which positivelyaffected manufacturing cost, as well as morefavorable product mix. Gross margin increased to39.0% for the twelve months ended December 31,2005 from 37.0% in the comparable 2004 period.
Selling and Marketing Expense. For the twelvemonths ended December 31, 2005, selling andmarketing expense decreased by $2.0 million, or1.7%, to $116.5 million from $118.5 million in 2004.
The decrease was due mainly to lower variabledistribution costs as a consequence of declining salespartly offset by higher expenditures for advertisingand selling departments.
General and Administrative Expense. For the twelvemonths ended December 31, 2005, general andadministrative expense decreased by $3.3 million, or7.8%, to $38.6 million from $41.9 million in 2004.This decrease was due to lower expenses forwarehouse and administration due to tight expensecontrols and the Company’s restructuring programs.
Non-Cash Compensation Expense. For the twelvemonths ended December 2004 and 2005, theCompany recorded a non-cash compensationexpense of $0.6 million and $0.9 million, respectively,due to the grant of stock options under theCompany’s stock option plans 1998, 2001 and 2005and the resulting amortization expense.
Gain on sale of property. In June 2005, the Companysold the property in Tallinn, Estonia which waspreviously leased and realized a gain of $7.2 million.In September 2004, the Company realized a gain of$5.7 million from the sale of its property in Mullingar,Ireland.
Restructuring Costs. The Company recordedrestructuring costs of $6.2 million in the twelvemonth period ended December 31,2005 in relation tothe reduction by 90% of the Company’s tennisracquet production in Kennelbach, Austria andBudweis, Czech Republic, the restructuring programof the Company’s ski binding production, thereduction of its production capacity in its plant inRapallo, Italy and the transfer of the remaining skiboot production from Maser, Italy to Litovel, CzechRepublic. The Company recorded restructuring costsof $2.3 million in the twelve month period endedDecember 31, 2004 consisting of dismissal andtransfer costs in connection with the closing of itsproduction facility in Mullingar, Ireland and the plantin Tallinn, Estonia (see Note 25).
Operating Income. As a result of the foregoingfactors, for the twelve months ended December 31,2005, operating income increased by $4.4 million to$19.4 million from $15.0 million in 2004.
M A N A G E M E N T ’ S D I S C U S S I O N A N D A N A LY S I SO F F I N A N C I A L S TAT E M E N T S A N D R E S U LT S O F O P E R AT I O N S( c o n t i n u e d )
Head
N.V
. and
Su
bsidiaries A
nn
ual R
epo
rt 200
5 B
ased o
n U
.S. G
AA
P
8
Interest Expense. For the twelve months endedDecember 31, 2005 interest expense decreased by$9.6 million or 37.4% to $16.1 million from $25.7million in 2004. This decrease was mainly due to thewrite-off of the capitalized debt issuance costs of$3.2 million relating to the Company’s former 10.75%senior notes, which were repaid with proceeds fromits newly issued 8.5% senior notes in January 2004.The premium of $4.4 million for the early redemptionof the 10.75% senior notes was reported in 2004. Inaddition, interest expenses for the 8.5% senior notesdecreased as a result of the Company’s noterepurchase program.
Interest Income. For the twelve months endedDecember 31, 2005 interest income increased by$0.6 million to $2.7 million from $2.1 million in 2004.This increase was due mainly to higher cash on hand.
Foreign Exchange Gain (Loss). For the twelve monthsended December 31, 2005, the Company recorded aforeign currency exchange gain of $2.8 million,compared to a loss of $0.6 million in 2004 as a resultof the revaluation of foreign currency assets andliabilities at the exchange rate as of December 31,2005.
Other Income (Expense), net. For the twelve monthsended December 31, 2005, other income, netincreased by $0.2 million to $0.1 million from otherexpense, net of $0.1 million in 2004.
Income Tax Expense. For the twelve months endedDecember 31, 2005, income tax expense decreasedby $26.7 million to $1.0 million from $27.7 million in2004. This decrease in income tax expense is mainlydue to a reduction in the Austrian tax rate which, in2004, led to a decrease in deferred tax assetsresulting from tax losses carried forward of $24.9million as well as the not taxable gain on sale ofproperty in Estonia.
Net Income (Loss). As a result of the foregoingfactors, for the twelve months ended December 31,2005, the Company had net income of $8.0 million,compared to net loss of $36.9 million in 2004.
Liquidity and Capital Resources:Payments from the Company’s customers are themost important source of the Company’s liquidity.Additional sources of liquidity include credit facility,financing under capital lease arrangements andvendor financing. The cash provided by these sourceshas a variety of uses. Most importantly, the Companymust pay its employees and vendors for the servicesand materials they supply. Additional uses includecapital expenditures, development of new products,payment of interest, extension of credit to theCompany’s customers, and other general funding ofthe Company’s day-to-day operations.
For the twelve months ended December 31, 2005,cash generated from operating activities increasedby $32.2 million, or over 400% to $40.0 million from$7.8 million in 2004. This increase is mainly theresult of the Company’s higher net income and lowerworking capital requirements in 2005, due to lowertrade accounts receivable resulting from lower salesand lower inventories at year end compared to 2004.The Company used this cash from operations andcash from the sale of its premises in Estonia topurchase property, plant and equipment for $18.6million, to repurchase $18.8 million of the Company’s8.5% senior notes and to pay back $1.1 million ofother long term debt and to purchase available forsale marketable securities principally cash bonds for$5.3 million.
As of December 31, 2005, the Company had $131.1million (€111.0 million) of senior notes due 2014outstanding, $16.2 million of long-term obligationsunder a sale-leaseback agreement and a mortgageagreement due 2017 and $10.4 million of other long-term debt comprising secured loans in Italy and theCzech Republic. In addition, the Company used linesof credit with several banks in Austria, Canada andJapan of $32.7 million.
As of December 31, 2005, the Company had $1.0million in available unused credit facilities and $53.7million cash on hand, mainly in euro. In addition, theCompany had $17.4 million cash bonds held in eurowhich were recognized in the Company’s balancesheet as “Prepaid expense and other current assets”.
The Company believes that its current level of cashon hand, anticipated cash flows from operations andother available sources of liquidity are sufficient tomeet the Company’s operating needs for at least thenext twelve months.
M A N A G E M E N T ’ S D I S C U S S I O N A N D A N A LY S I SO F F I N A N C I A L S TAT E M E N T S A N D R E S U LT S O F O P E R AT I O N S( c o n t i n u e d )
Head
N.V
. and
Su
bsidiaries A
nn
ual R
epo
rt 200
5 B
ased o
n U
.S. G
AA
P
9
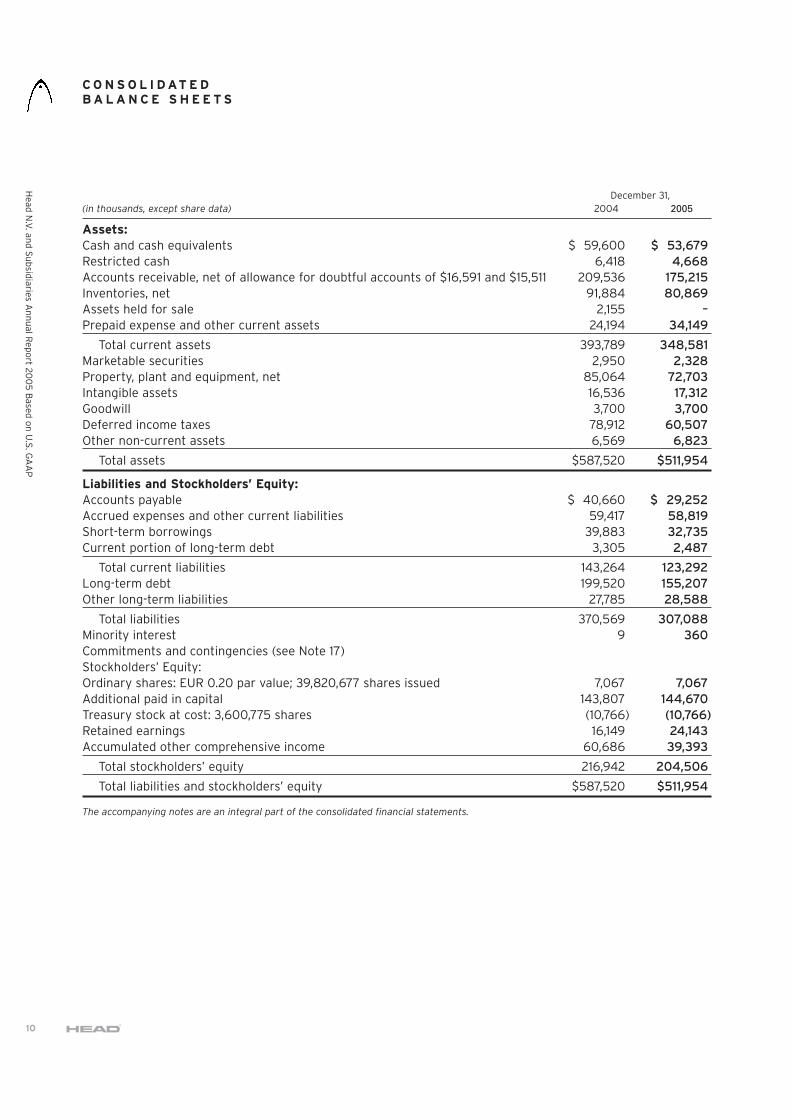
December 31,(in thousands, except share data) 2004 2005
Assets:Cash and cash equivalents $ 59,600 $ 53,679Restricted cash 6,418 4,668Accounts receivable, net of allowance for doubtful accounts of $16,591 and $15,511 209,536 175,215Inventories, net 91,884 80,869Assets held for sale 2,155 –Prepaid expense and other current assets 24,194 34,149
Total current assets 393,789 348,581Marketable securities 2,950 2,328Property, plant and equipment, net 85,064 72,703Intangible assets 16,536 17,312Goodwill 3,700 3,700Deferred income taxes 78,912 60,507Other non-current assets 6,569 6,823
Total assets $587,520 $511,954
Liabilities and Stockholders’ Equity:Accounts payable $ 40,660 $ 29,252Accrued expenses and other current liabilities 59,417 58,819Short-term borrowings 39,883 32,735Current portion of long-term debt 3,305 2,487
Total current liabilities 143,264 123,292Long-term debt 199,520 155,207Other long-term liabilities 27,785 28,588
Total liabilities 370,569 307,088Minority interest 9 360Commitments and contingencies (see Note 17)Stockholders’ Equity:Ordinary shares: EUR 0.20 par value; 39,820,677 shares issued 7,067 7,067Additional paid in capital 143,807 144,670Treasury stock at cost: 3,600,775 shares (10,766) (10,766)Retained earnings 16,149 24,143Accumulated other comprehensive income 60,686 39,393
Total stockholders’ equity 216,942 204,506
Total liabilities and stockholders’ equity $587,520 $511,954
The accompanying notes are an integral part of the consolidated financial statements.
Head
N.V
. and
Su
bsidiaries A
nn
ual R
epo
rt 200
5B
ased o
n U
.S. G
AA
P
10
C O N S O L I D AT E DB A L A N C E S H E E T S
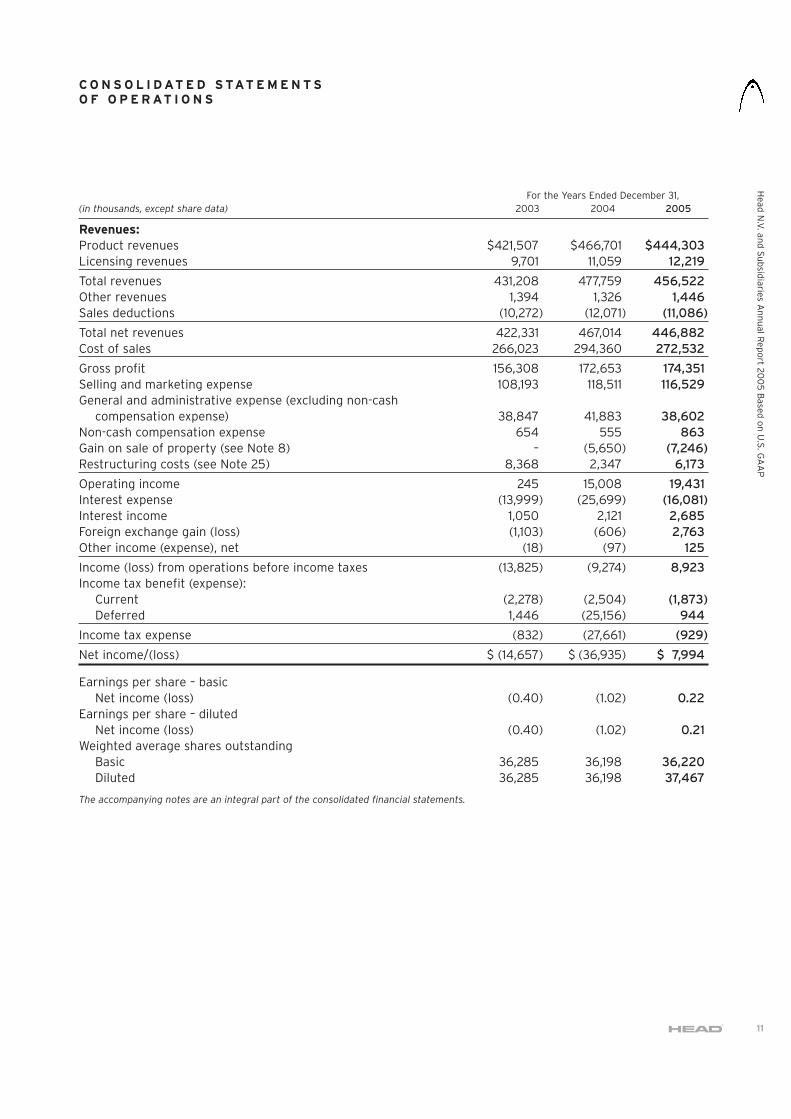
For the Years Ended December 31,(in thousands, except share data) 2003 2004 2005
Revenues:Product revenues $421,507 $466,701 $444,303Licensing revenues 9,701 11,059 12,219
Total revenues 431,208 477,759 456,522Other revenues 1,394 1,326 1,446Sales deductions (10,272) (12,071) (11,086)
Total net revenues 422,331 467,014 446,882Cost of sales 266,023 294,360 272,532
Gross profit 156,308 172,653 174,351Selling and marketing expense 108,193 118,511 116,529General and administrative expense (excluding non-cash
compensation expense) 38,847 41,883 38,602Non-cash compensation expense 654 555 863Gain on sale of property (see Note 8) – (5,650) (7,246)Restructuring costs (see Note 25) 8,368 2,347 6,173
Operating income 245 15,008 19,431Interest expense (13,999) (25,699) (16,081)Interest income 1,050 2,121 2,685Foreign exchange gain (loss) (1,103) (606) 2,763Other income (expense), net (18) (97) 125
Income (loss) from operations before income taxes (13,825) (9,274) 8,923Income tax benefit (expense):
Current (2,278) (2,504) (1,873)Deferred 1,446 (25,156) 944
Income tax expense (832) (27,661) (929)
Net income/(loss) $ (14,657) $ (36,935) $ 7,994
Earnings per share – basicNet income (loss) (0.40) (1.02) 0.22
Earnings per share – dilutedNet income (loss) (0.40) (1.02) 0.21
Weighted average shares outstandingBasic 36,285 36,198 36,220Diluted 36,285 36,198 37,467
The accompanying notes are an integral part of the consolidated financial statements.
C O N S O L I D AT E D S TAT E M E N T SO F O P E R AT I O N S
Head
N.V
. and
Su
bsidiaries A
nn
ual R
epo
rt 200
5B
ased o
n U
.S. G
AA
P
11
Head
N.V
. and
Su
bsidiaries A
nn
ual R
epo
rt 200
5B
ased o
n U
.S. G
AA
P
12
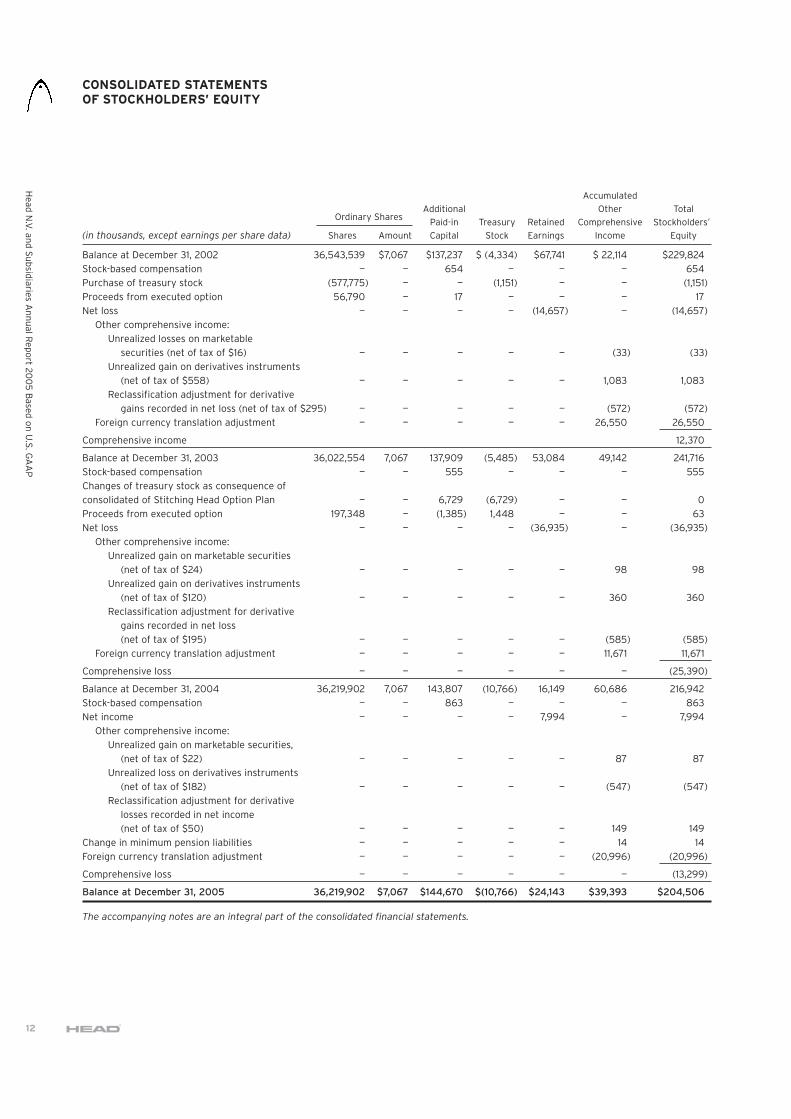
Accumulated
Ordinary SharesAdditional Other Total
Paid-in Treasury Retained Comprehensive Stockholders’(in thousands, except earnings per share data) Shares Amount Capital Stock Earnings Income Equity
Balance at December 31, 2002 36,543,539 $7,067 $137,237 $ (4,334) $67,741 $ 22,114 $229,824
Stock-based compensation — — 654 — — — 654
Purchase of treasury stock (577,775) — — (1,151) — — (1,151)
Proceeds from executed option 56,790 — 17 — — — 17
Net loss — — — — (14,657) — (14,657)
Other comprehensive income:
Unrealized losses on marketable
securities (net of tax of $16) — — — — — (33) (33)
Unrealized gain on derivatives instruments
(net of tax of $558) — — — — — 1,083 1,083
Reclassification adjustment for derivative
gains recorded in net loss (net of tax of $295) — — — — — (572) (572)
Foreign currency translation adjustment — — — — — 26,550 26,550
Comprehensive income 12,370
Balance at December 31, 2003 36,022,554 7,067 137,909 (5,485) 53,084 49,142 241,716
Stock-based compensation — — 555 — — — 555
Changes of treasury stock as consequence of
consolidated of Stitching Head Option Plan — — 6,729 (6,729) — — 0
Proceeds from executed option 197,348 — (1,385) 1,448 — — 63
Net loss — — — — (36,935) — (36,935)
Other comprehensive income:
Unrealized gain on marketable securities
(net of tax of $24) — — — — — 98 98
Unrealized gain on derivatives instruments
(net of tax of $120) — — — — — 360 360
Reclassification adjustment for derivative
gains recorded in net loss
(net of tax of $195) — — — — — (585) (585)
Foreign currency translation adjustment — — — — — 11,671 11,671
Comprehensive loss — — — — — — (25,390)
Balance at December 31, 2004 36,219,902 7,067 143,807 (10,766) 16,149 60,686 216,942
Stock-based compensation — — 863 — — — 863
Net income — — — — 7,994 — 7,994
Other comprehensive income:
Unrealized gain on marketable securities,
(net of tax of $22) — — — — — 87 87
Unrealized loss on derivatives instruments
(net of tax of $182) — — — — — (547) (547)
Reclassification adjustment for derivative
losses recorded in net income
(net of tax of $50) — — — — — 149 149
Change in minimum pension liabilities — — — — — 14 14
Foreign currency translation adjustment — — — — — (20,996) (20,996)
Comprehensive loss — — — — — — (13,299)
Balance at December 31, 2005 36,219,902 $7,067 $144,670 $(10,766) $24,143 $39,393 $204,506
The accompanying notes are an integral part of the consolidated financial statements.
CONSOLIDATED STATEMENTSOF STOCKHOLDERS’ EQUITY
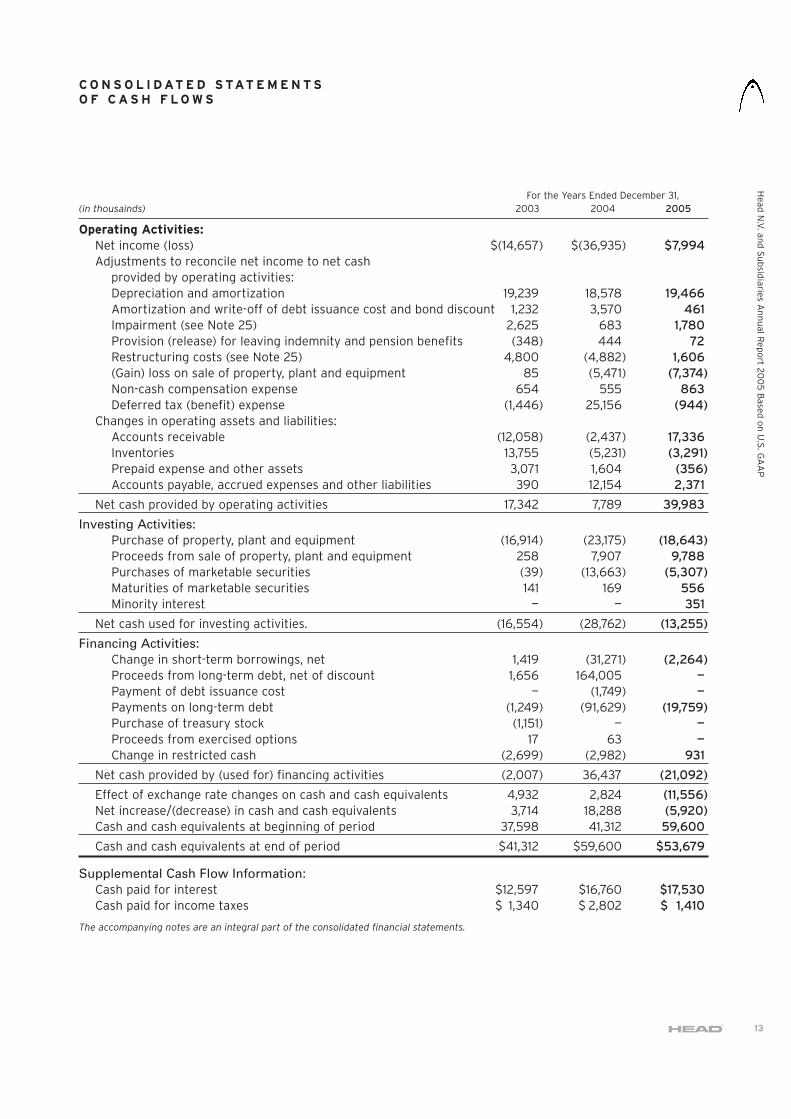
For the Years Ended December 31,(in thousainds) 2003 2004 2005
Operating Activities:Net income (loss) $(14,657) $(36,935) $7,994Adjustments to reconcile net income to net cash
provided by operating activities:Depreciation and amortization 19,239 18,578 19,466Amortization and write-off of debt issuance cost and bond discount 1,232 3,570 461Impairment (see Note 25) 2,625 683 1,780Provision (release) for leaving indemnity and pension benefits (348) 444 72Restructuring costs (see Note 25) 4,800 (4,882) 1,606(Gain) loss on sale of property, plant and equipment 85 (5,471) (7,374)Non-cash compensation expense 654 555 863Deferred tax (benefit) expense (1,446) 25,156 (944)
Changes in operating assets and liabilities:Accounts receivable (12,058) (2,437) 17,336Inventories 13,755 (5,231) (3,291)Prepaid expense and other assets 3,071 1,604 (356)Accounts payable, accrued expenses and other liabilities 390 12,154 2,371
Net cash provided by operating activities 17,342 7,789 39,983
Investing Activities:Purchase of property, plant and equipment (16,914) (23,175) (18,643)Proceeds from sale of property, plant and equipment 258 7,907 9,788Purchases of marketable securities (39) (13,663) (5,307)Maturities of marketable securities 141 169 556Minority interest — — 351
Net cash used for investing activities. (16,554) (28,762) (13,255)
Financing Activities:Change in short-term borrowings, net 1,419 (31,271) (2,264)Proceeds from long-term debt, net of discount 1,656 164,005 —Payment of debt issuance cost — (1,749) —Payments on long-term debt (1,249) (91,629) (19,759)Purchase of treasury stock (1,151) — —Proceeds from exercised options 17 63 —Change in restricted cash (2,699) (2,982) 931
Net cash provided by (used for) financing activities (2,007) 36,437 (21,092)
Effect of exchange rate changes on cash and cash equivalents 4,932 2,824 (11,556)Net increase/(decrease) in cash and cash equivalents 3,714 18,288 (5,920)Cash and cash equivalents at beginning of period 37,598 41,312 59,600
Cash and cash equivalents at end of period $41,312 $59,600 $53,679
Supplemental Cash Flow Information:Cash paid for interest $12,597 $16,760 $17,530Cash paid for income taxes $ 1,340 $ 2,802 $ 1,410
The accompanying notes are an integral part of the consolidated financial statements.
C O N S O L I D AT E D S TAT E M E N T SO F C A S H F L O W S
Head
N.V
. and
Su
bsidiaries A
nn
ual R
epo
rt 200
5B
ased o
n U
.S. G
AA
P
13
Note 1—BusinessHead N.V. (“Head“ or the “Company”) wasincorporated in Rotterdam, Netherlands, on August24, 1998. With effect from this date, Head HoldingUnternehmensbeteiligung GmbH (“Head Holding“)merged with a wholly owned subsidiary of theCompany in a transaction treated as a merger ofentities under common control and accounted for onan “as if pooling“ basis.
The Company is a global manufacturer and marketerof branded sporting goods serving the skiing, tennisand diving markets. The Company has created oracquired a portfolio of brands – Head (principallyalpine skis, ski boots and snowboard products, tennis,racquetball and squash racquets), Penn (tennis ballsand racquetball balls), Tyrolia (ski bindings), Maresand Dacor (diving equipment).
Head conducts business in Europe (primarily inAustria, Italy, Germany, France, Switzerland, theNetherlands and the United Kingdom), NorthAmerica, and Asia (primarily Japan).
Note 2—Summary of Significant Accounting PoliciesA summary of significant accounting policies used inthe preparation of the accompanying consolidatedfinancial statements is as follows:
Basis of Presentation
The Company and its subsidiaries maintain theiraccounting records in accordance with their localregulations and have made certain adjustments tothese records to present the accompanying financialstatements in conformity with accounting principlesgenerally accepted in the United States of America(“U.S. GAAP“). In addition, the Company publishes itsstatutory financial statements in accordance withDutch corporate regulations.
Effective January 1, 2006, the Company will changeits basis of accounting to International FinancialReporting Standards as adopted by the EU (“IFRS“).The Company will provide a reconciliation for netincome, stockholders’ equity, and significant balancesheet line items reported under IFRS to U.S. GAAP.The differences between IFRS and U.S. GAAP have animpact on the financials. Additionally, the Companywill change its reporting currency from the U.S.dollar to the euro.
Principles of Consolidation
The consolidated financial statements of Headinclude the accounts of all majority-ownedsubsidiaries and entities over which the Company hasfinancial and operating control and variable interestentities in which the Company has determined it isthe primary beneficiary. All intercompanytransactions and balances have been eliminated inconsolidation.
Cash and Cash Equivalents
Cash and cash equivalents comprise of cash andshort-term, highly liquid investments with an originalmaturity of three months or less.
Restricted Cash
Restricted cash comprises of deposits pledged ascollateral on outstanding lines of credit. The amountsare collateralized with one financial institution andearn interest while in deposit.
Inventories
Inventories are stated at the lower of cost or marketwith cost being determined on a first-in first-outbasis (FIFO).
Marketable Securities
Debt securities that the Company has the positiveintent and ability to hold to maturity are classified asheld-to-maturity and reported at amortized cost.Debt and equity securities held principally for sellingin the near term are classified as trading andreported at fair value, with unrealized gains andlosses included in earnings. Debt and equitysecurities not classified as either held-to-maturity ortrading are classified as available-for-sale and arereported at fair value, with unrealized gains andlosses reported in other comprehensive income.
Property, Plant and Equipment
Property, plant and equipment are recorded at costless accumulated depreciation and impairment loss.Additions and improvements that extend the usefullives of the plant and equipment and replacements,major renewals, and betterments are capitalized. Thecost of maintenance, repair and minor renewals areexpensed as incurred. When plant and equipment isretired or otherwise disposed, the cost and relatedaccumulated depreciation are removed from therelated accounts, and any gain or loss on disposition
N O T E S T O T H E C O N S O L I D AT E DF I N A N C I A L S TAT E M E N T S
Head
N.V
. and
Su
bsidiaries A
nn
ual R
epo
rt 200
5 B
ased o
n U
.S. G
AA
P
14
N O T E S T O T H E C O N S O L I D AT E DF I N A N C I A L S TAT E M E N T S( c o n t i n u e d )
is recognized in earnings. Depreciation is calculatedusing the straight-line method over the estimateduseful lives of the assets. The Company’s buildingsare depreciated over a period of 30 – 50 years,building improvements are depreciated over a periodof 10-25 years and machinery and equipment isdepreciated over a period of 2-20 years.
Impairment
The Company accounts for impairments inaccordance with the Statement of FinancialAccounting Standards (“SFAS“) No. 144, “Accountingfor the Impairment or Disposal of Long-Lived Assets“(“SFAS 144“). The Company reviews for impairmentwhenever events or changes in circumstancesindicate that the carrying amount of the long-livedasset may not be recoverable. If the fair value is lessthan the carrying amount of the asset, a loss isrecognized in the consolidated statements ofoperations for the difference. The Company’s reviewinvolves comparing current and future cash flows tothe carrying value of the assets. Long-lived assets tobe disposed of, if any, are reported at the lower oftheir carrying amount or fair value less cost to sell.The Company recorded an impairment charge of $2.6million, $0.7 million and $1.8 million for the yearsended December 31, 2003, 2004, and 2005,respectively, and has classified such impairments asrestructuring costs in 2003 and 2005 and as generaland administrative expense in 2004 in theconsolidated income statement.
Goodwill and Other Intangible Assets
Effective January 1, 2002, the Company adoptedSFAS 142, “Goodwill and Other Intangible Assets“(“SFAS 142“). SFAS 142 requires that goodwill andintangible assets with an indefinite life are no longeramortized, but instead are tested for impairment atleast annually in December or more frequently ifevents and changes in circumstances indicate thatthe carrying value may not be recoverable. SFAS142 prescribes a two-phase process for impairmenttesting of goodwill. First, each reporting unit’s(which generally represents one level below anoperating segment) carrying value is compared to itsfair value to determine if an impairment exists.Second, where the reporting unit’s carrying valueexceeds its fair value, an impairment loss is
recognized to the extent that the goodwill carryingvalue exceeds the reporting unit’s implied goodwill,which is calculated as the difference between thereporting unit’s fair value and the fair value of thereporting unit’s recognized and unrecognized assetsand liabilities. The impairment test for indefinite-livedintangible assets requires that an impairment loss berecognized equal to the excess of its carrying valueover its fair value. The Company has goodwill andidentified intangible assets comprising of trademarkswith an indefinite life and land use rights with auseful life of 50 years. For the years endedDecember 31, 2003, 2004 and 2005, no impairmentcharges were recognized for goodwill or indefinitelived intangible assets.
Revenue Recognition
The Company recognizes revenue when persuasiveevidence of a sale arrangement exists, delivery hasoccurred, the sales price is fixed and determinable,and collectibility is reasonably assured. These criteriaare generally met when finished products areshipped to the customers and both title and the risksand rewards of ownership are transferred, or serviceshave been rendered and accepted.
Revenues from licensing agreements are recognizedover the license term for the fixed license revenueportion and based on underlying customer sales onceminimum contractual sales volumes are met for thevariable license revenue portion. Prepaymentsreceived on long-term licensing agreements arerecognized as deferred income.
Provisions are recorded for estimated productreturns at the time revenues are recognized.
Payment terms differ depending on the customer(large distributors, small shops), product line (wintersports is a very seasonal business, as are racquetsports and diving, though to a lesser extent thanwinter sports), country (payment terms vary inaccordance with local practices throughout theworld) and past experiences with customers. It is theCompany’s normal procedure to agree terms oftransactions, including payment terms (60 to 180days), with customers in advance. In the rentalbusiness the Company agrees to payment terms overone year and classifies those long-term trade
Head
N.V
. and
Su
bsidiaries A
nn
ual R
epo
rt 200
5 B
ased o
n U
.S. G
AA
P
15
receivables as other non-current assets in theconsolidated balance sheet.
Shipping and handling costs
The Company classifies all amounts billed tocustomers for shipping and handling as otherrevenues. All shipping and handling costs arerecognized as selling and marketing expense in theconsolidated statement of operations. For the yearsended December 31, 2003, 2004 and 2005, theCompany incurred shipping and handling costs of$10.5 million, $12.3 million, and $11.3 million,respectively.
Sales deductions
The Company accrues for customer discounts basedupon estimated refund obligations and classifies allsales incentives, which are earned by the Company’scustomers subsequent to delivery of its product,including cash discounts for volume rebates andother than cash consideration, such as credits thatthe Company’s customer can apply against tradeamounts owed to us as sales deductions.
Translation of Foreign Currency
Finished goods sales to customers in Austria, Italy,Germany, Japan, France, Switzerland, Canada, Spain,Netherlands, United Kingdom and the United Statesof America are generally billed in local currency. Thelocal currency is the functional currency of thesubsidiaries in these countries. Foreign currency(functional currency) assets and liabilities aretranslated into U.S. dollars (the reporting currency)at the exchange rate on the balance sheet date, withresulting translation adjustments recorded in othercomprehensive income. Revenues and expenses aretranslated at average rates prevailing during the year.Foreign exchange gains and losses arising fromtransactions denominated in a currency other thanthe functional currency are included in income. Theeffect of exchange rate changes on intercompanytransactions of a long-term investment nature isincluded in other comprehensive income. Head N.V.has a functional currency of the Euro.
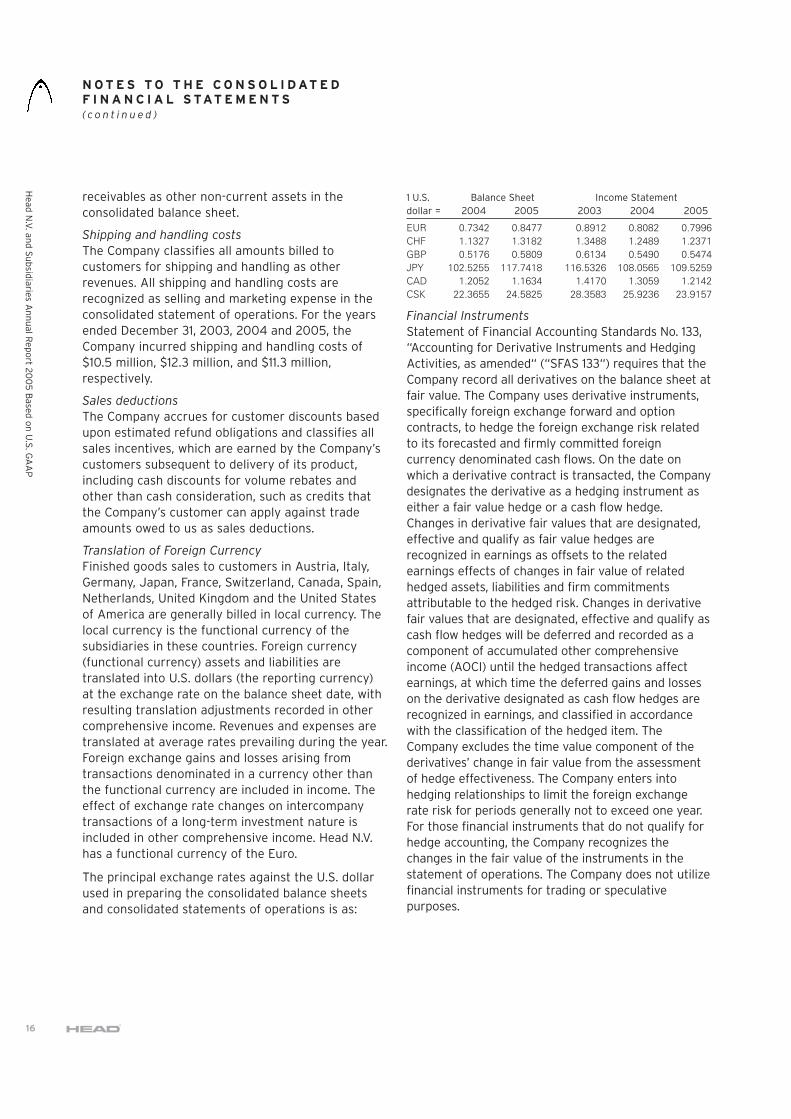
The principal exchange rates against the U.S. dollarused in preparing the consolidated balance sheetsand consolidated statements of operations is as:
1 U.S. Balance Sheet Income Statementdollar = 2004 2005 2003 2004 2005
EUR 0.7342 0.8477 0.8912 0.8082 0.7996CHF 1.1327 1.3182 1.3488 1.2489 1.2371GBP 0.5176 0.5809 0.6134 0.5490 0.5474JPY 102.5255 117.7418 116.5326 108.0565 109.5259CAD 1.2052 1.1634 1.4170 1.3059 1.2142CSK 22.3655 24.5825 28.3583 25.9236 23.9157
Financial Instruments
Statement of Financial Accounting Standards No. 133,“Accounting for Derivative Instruments and HedgingActivities, as amended“ (“SFAS 133“) requires that theCompany record all derivatives on the balance sheet atfair value. The Company uses derivative instruments,specifically foreign exchange forward and optioncontracts, to hedge the foreign exchange risk relatedto its forecasted and firmly committed foreigncurrency denominated cash flows. On the date onwhich a derivative contract is transacted, the Companydesignates the derivative as a hedging instrument aseither a fair value hedge or a cash flow hedge.Changes in derivative fair values that are designated,effective and qualify as fair value hedges arerecognized in earnings as offsets to the relatedearnings effects of changes in fair value of relatedhedged assets, liabilities and firm commitmentsattributable to the hedged risk. Changes in derivativefair values that are designated, effective and qualify ascash flow hedges will be deferred and recorded as acomponent of accumulated other comprehensiveincome (AOCI) until the hedged transactions affectearnings, at which time the deferred gains and losseson the derivative designated as cash flow hedges arerecognized in earnings, and classified in accordancewith the classification of the hedged item. TheCompany excludes the time value component of thederivatives’ change in fair value from the assessmentof hedge effectiveness. The Company enters intohedging relationships to limit the foreign exchangerate risk for periods generally not to exceed one year.For those financial instruments that do not qualify forhedge accounting, the Company recognizes thechanges in the fair value of the instruments in thestatement of operations. The Company does not utilizefinancial instruments for trading or speculativepurposes.
N O T E S T O T H E C O N S O L I D AT E DF I N A N C I A L S TAT E M E N T S( c o n t i n u e d )
Head
N.V
. and
Su
bsidiaries A
nn
ual R
epo
rt 200
5 B
ased o
n U
.S. G
AA
P
16
N O T E S T O T H E C O N S O L I D AT E DF I N A N C I A L S TAT E M E N T S( c o n t i n u e d )
Research and Development Costs
Research and development costs are expensed asincurred and are reflected in costs of sales in thestatements of operations. The Company incurredresearch and development expense in the amount of$13.6 million, $15.5 million and $13.8 million for theyears ended December 31, 2003, 2004 and 2005,respectively.
Advertising Costs
Advertising costs are expensed as incurred and arereflected in selling and marketing expense in theconsolidated statements of operations. The Companyincurred advertising costs of $36.9 million, $39.4million and $40.5 million for the years endedDecember 31, 2003, 2004 and 2005, respectively.
Stock-Based Compensation
The Company accounts for its stock option plan usingthe fair value method in accordance with SFAS 123,“Accounting for Stock-Based Compensation“ (“SFAS123“). Under the fair value recognition provisions ofSFAS 123, stock-based compensation cost ismeasured at the grant date based on the fair value ofthe award and is recognized as expense over thevesting period. Determining the fair value of stock-based awards at the grant date requires judgment,including estimating the expected term of stockoptions, the expected volatility of the Company’sstock, expected dividends, and risk-free interestrates.
Debt Issuance Costs
Debt issuance costs are capitalized and amortizedover the term of the debt using the effective interestrate method.
Pension and postretirement benefits
The Company accounts for the costs of pension plansand postretirement benefits in accordance with SFAS87, “Employers’ Accounting for Pensions“ (“SFAS87“) and SFAS 106, “Employers’ Accounting forPostretirement Benefits Other than Pensions“ (“SFAS106“), respectively.
Fair Value Disclosure
The carrying value of the Company’s financialinstruments approximates fair value at December 31,2004 and 2005. The carrying amounts reported inthe consolidated balance sheet for cash and cash
equivalents, accounts receivable, accounts payable,accrued expenses and short-term borrowingsapproximate fair value due to the short maturity ofthese instruments and the floating interest rates ofthe short-term borrowings. The carrying amounts ofmarketable securities are equal to fair value basedon quoted market prices at December 31, 2004 and2005 (see Note 7).
The carrying value of the Company’s senior notes andother long-term debt approximates fair value based oncurrent rates offered and quoted market price of debtwith similar terms.
Income Taxes
The Company utilizes the liability method ofaccounting for deferred income taxes wherebydeferred tax assets and liabilities are recognized toreflect the future tax consequences attributable totemporary differences between the financialreporting bases of existing assets and liabilities andtheir respective tax bases. With the exception ofHead Holding Unternehmensbeteiligung GmbH, all ofthe Company’s Austrian subsidiaries are included in aconsolidated Austrian federal income tax return.Separate provisions for income taxes have beenprepared for the Company’s other subsidiaries.Deferred taxes are calculated by using the prevailingtax rates.
The Company provides a valuation allowance fordeferred tax assets for which it does not considerrealization of such assets to be more likely than not.
Computation of Net Income (Loss) per Share
Net income (loss) per share is computed under SFAS128, “Earnings per Share“ (“SFAS 128“). Basic netincome (loss) per share is computed by dividing thenet income (loss) for the period by the weightedaverage number of ordinary shares outstanding duringthe period. Shares held by The Stichting Head OptionPlan (“Stichting“) are not treated as outstanding forpurposes of the income (loss) per share calculationuntil the related option has been exercised. Diluted netincome (loss) per share is computed by dividing thenet income (loss) for the period by the weightedaverage number of ordinary shares and potentialordinary shares outstanding during the period.Potential ordinary shares are composed of incremental
Head
N.V
. and
Su
bsidiaries A
nn
ual R
epo
rt 200
5 B
ased o
n U
.S. G
AA
P
17
N O T E S T O T H E C O N S O L I D AT E DF I N A N C I A L S TAT E M E N T S( c o n t i n u e d )
Head
N.V
. and
Su
bsidiaries A
nn
ual R
epo
rt 200
5 B
ased o
n U
.S. G
AA
P
18
shares issuable upon the exercise of share options,and are included in diluted net income (loss) per shareto the extent such shares are dilutive.
For the years ended December 31, 2003, 2004, and2005, the weighted average shares outstandingincluded in basic net income (loss) per share is36,285,142 shares, 36,197,980 shares, and 36,219,902shares, respectively. For the years ended December 31,2003 and 2004, the number of options that wereoutstanding but not included in the computation ofdiluted net loss per share because their effect wouldhave been anti-dilutive was, 1,347,773 options, and1,278,201 options, respectively. For the year endedDecember 31, 2005 the number of options included inthe computation of diluted net income per share was1,247,119 options.
Comprehensive income (loss)
Comprehensive income (loss) encompasses netincome and changes in the components ofaccumulated other comprehensive income notreflected in the Company's consolidated statementsof operations during the periods presented.
Concentration of business risk
Financial instruments which potentially subject theCompany to significant concentrations of credit riskconsist primarily of cash and cash equivalents,restricted cash, marketable securities and accountsreceivable. The Company places cash with highquality financial institutions. The Company’scustomers are concentrated in the retail industryhowever, concentrations of credit risk with respect totrade accounts receivable are limited due to the largenumber of customers and their dispersion acrossmany geographic areas. The Company generallyperforms credit reviews and sometimes obtainscredit insurance before extending credit.
Use of Estimates
The preparation of financial statements in conformitywith generally accepted accounting principles in theUnited States of America requires management tomake estimates and assumptions that affect thereported amounts of assets and liabilities anddisclosure of contingent assets and liabilities at thedate of the financial statements and the reportedamounts of revenues and expenses during thereporting period. The most significant of these
estimates are impairments, allowances for doubtfulaccounts, product warranties and returns, inventoryobsolescence and valuation allowances on deferredtax assets. On an ongoing basis, managementreviews its estimates based upon currently availableinformation. Actual results could differ from thoseestimates.
Reclassifications
Certain insignificant amounts in the prior yearconsolidated financial statements have beenreclassified to be consistent with the current year’spresentation.
Recent Accounting Pronouncements
In May 2005, the FASB issued Statement of FinancialAccounting Standards No. 154, “Accounting Changesand Error Corrections–a replacement of APB OpinionNo. 20 and FASB Statement No. 3“ (“SFAS 154“), whichchanges the requirement for the accounting andreporting of a change in accounting principle. SFAS 154eliminates the requirement in APB Opinion No. 20,“Accounting Changes,“ to include the cumulative effectof changes in accounting principle in the incomestatement in the period of change. Instead, to enhancethe comparability of prior period financial statements,SFAS 154 requires that changes in accounting principlesare retrospectively applied, unless directed otherwiseby a new pronouncement. SFAS 154 is effective foraccounting changes and corrections of errors made infiscal years beginning after December 15, 2005. TheCompany does not expect the initial adoption of SFAS154 to have a material impact on the Company’sfinancial statements.
In March 2005, the FASB Staff issued InterpretationNo. 47, “Accounting for Conditional Asset RetirementObligations“ (“FIN 47“). FIN 47 clarifies the termconditional asset retirement obligation as used inFASB Statement No. 143, “Accounting for AssetRetirement Obligations“ as well as other issuesrelated to asset retirement obligations. FIN 47 iseffective for fiscal years ending after December 15,2005. The adoption of FIN 47 did not have a materialimpact on the Company’s financial statements.
In December 2004, the FASB issued Statement ofFinancial Accounting Standards No. 123 (revised2004), “Share-Based Payment“ (“SFAS 123R“). SFAS123R addresses the accounting for share-based
N O T E S T O T H E C O N S O L I D AT E DF I N A N C I A L S TAT E M E N T S( c o n t i n u e d )
payment transactions in which an enterprise receivesemployee services in exchange for equityinstruments of the enterprise. It also addressestransactions in which an entity incurs liabilities inexchange for goods and services that are based onthe fair value of the enterprise’s equity instrumentsor that may be settled by the issuance of such equityinstruments. The revised statement generallyrequires that an entity account for those transactionsusing the fair-value-based method, and eliminatesthe intrinsic value method of accounting inAccounting Principles Board Opinion No. 25,“Accounting for Stock Issued to Employees“. SFAS123R requires an entity to recognize the grant-datefair-value of stock options and other equity-basedcompensation issued to employees in the incomestatement. SFAS 123R also requires entities todisclose information about the nature of the share-based payment transactions, the method used toestimate fair value of goods and services received orthe value of the equity instruments granted, and theeffects of those transactions on the financialstatements. On April 14, 2005, the U. S. Securitiesand Exchange Commission (the “SEC“) announcedthat SFAS 123R is to be effective for fiscal yearsbeginning after June 15, 2005 for entities other thansmall business issuers, and applies to all awardsgranted after the required effective date and toawards modified, repurchased, or cancelled after thatdate. The revised statement also applies to theportion of outstanding awards for which the requisiteservice has not yet been rendered based on thegrant-date value of these awards. Retrospectiveapplication is permitted. The SEC issued StaffAccounting Bulletin 107 “Share-Based Payment“(“SAB 107“) in March 2005 that interprets theinteraction of SFAS 123R and certain SEC rules thatmust be applied on the adoption of SFAS 123R. TheCompany will adopt SFAS 123R and SAB 107, usingmodified prospective application, for fiscal year2006. The adoption of SFAS 123R and SAB 107 is notexpected to materially impact the Company’sfinancial statements.
In December 2004, the FASB issued SFAS No. 153,“Exchanges of Non monetary Assets – An Amendmentof APB Opinion No. 29“ (“SFAS 153“) which eliminatesthe exception for non monetary exchanges of similarproductive assets and replaces it with a generalexception for exchanges of non monetary assets thatdo not have commercial substance. The Company isrequired to adopt SFAS 153 for non monetary assetexchanges occurring in the first quarter of 2006. TheCompany is currently in the process of evaluating theimpact of SFAS 153 and does not expect it, to have amaterial impact on its financial statements.
In November 2004, FASB issued SFAS No. 151,“Inventory Costs – an amendment of ARB No. 43,Chapter 4“ (“SFAS 151“). This Statement amends theguidance in ARB No. 43, Chapter 4, “InventoryPricing,“ to clarify the accounting for abnormalamounts of idle facility expense, freight, handlingcosts, and wasted material (spoilage). This Statementrequires that those items be recognized as current-period charges regardless of whether they meet thecriterion of abnormal. In addition, this Statementrequires that allocation of fixed productionoverheads to the costs of conversion be based on thenormal capacity of the production facilities. Theprovisions of this Statement shall be effective forinventory costs incurred during fiscal years beginningafter June 15, 2005. The Company is currently in theprocess of evaluating the impact of SFAS 151 anddoes not expect it to have a material impact on itsfinancial statements.
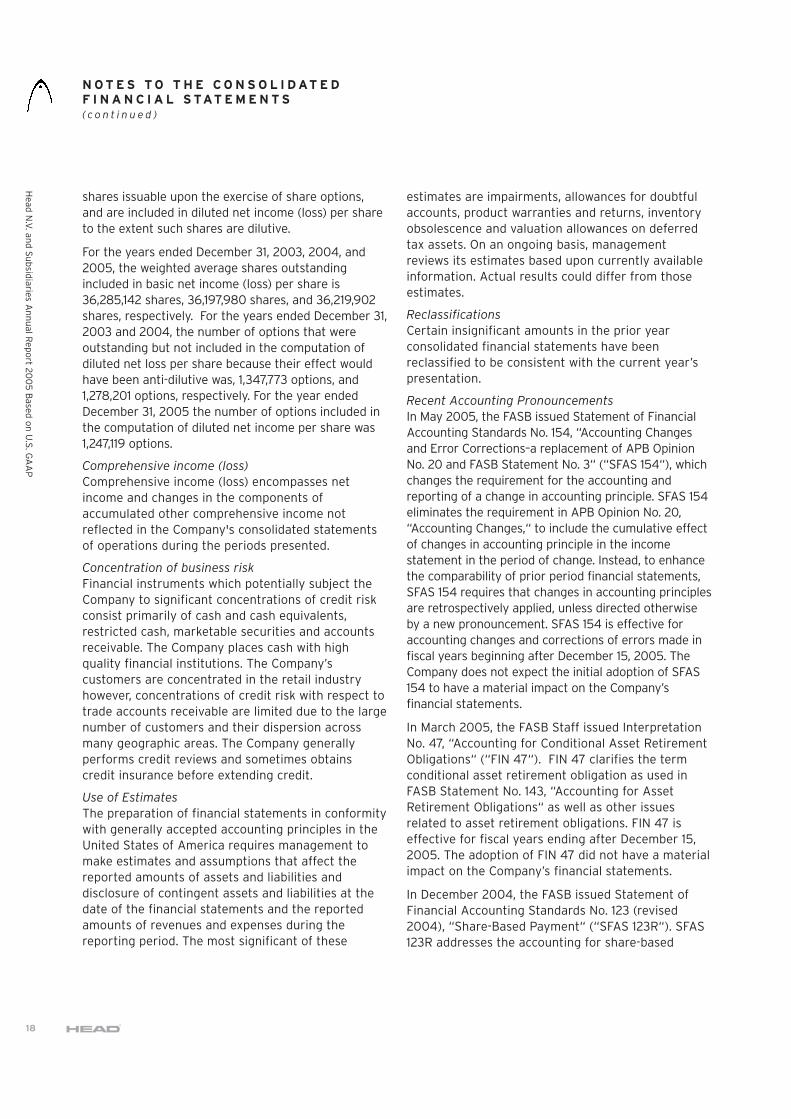
Note 3—Accounts ReceivableAccounts receivable consist of the following (inthousands):
December 31,2004 2005
Trade debtors $213,724 $182,031Other receivables 12,404 8,695Allowance for doubtful accounts (16,591) (15,511)
Accounts receivable, net $209,536 $175,215
As of December 31, 2004 and 2005, the Companyclassified long-term trade receivables of $1.9 millionand $2.2 million, respectively to other non-currentassets.
Head
N.V
. and
Su
bsidiaries A
nn
ual R
epo
rt 200
5 B
ased o
n U
.S. G
AA
P
19
20
N O T E S T O T H E C O N S O L I D AT E DF I N A N C I A L S TAT E M E N T S( c o n t i n u e d )
Head
N.V
. and
Su
bsidiaries A
nn
ual R
epo
rt 200
5 B
ased o
n U
.S. G
AA
P
Note 4—InventoriesInventories consist of the following (in thousands):
December 31,2004 2005
Raw materials and supplies $25,296 $18,460Work in process 11,187 10,095Finished goods 73,354 67,806Provisions (17,953) (15,492)
Total inventories, net $91,884 $80,869
Note 5—Assets Held for SaleDuring 2004, the Company made the decision to sellits distribution warehouse in Italy. In accordance withSFAS 144, this asset qualified as held for saletherefore, the Company recorded the asset at is fairvalue, which approximated €1.6 million ($2.2 million),and the Company incurred a $0.7 million impairmentcharge on the asset. Additionally, the Companyceased depreciation on this plant. As of December 31,2005, as a result of the warehouse not being sold,the Company reclassified the asset from held for saleto property, plant and equipment. The asset wasmeasured at its fair value and recorded at a value of€1.6 million ($1.9 million).
Note 6—Prepaid Expenses and Other Current AssetsPrepaid expenses and other current assets consist ofthe following (in thousands):
December 31,2004 2005
Marketable Securities, short term $ 14,556 $ 17,499Deferred tax assets, current 4,280 12,060Patents and royalties 2,351 1,701Advertising 1,043 904Deposits and Advances 696 1,108Other 1,269 876
Total prepaid expenses and othercurrent assets $24,194 $34,149
Note 7—Marketable Securities (continued)Marketable securities consist of the following (inthousands):
December 31,2004 2005
Available-for-SaleCorporate debt securities $432 $ —Debt security funds — 1,526Cash bonds 13,772 17,363Other securities 3,302 938
Total Marketable securities available-for-sale 17,506 19,827Less: Short-term portion (14,556) (17,499)
Total Long-term marketable securities $2,950 $2,328
Marketable securities with a maturity of less thanone year are included in prepaid expenses and othercurrent assets in the accompanying consolidatedbalance sheets.
Note 8—Property, Plant and EquipmentProperty, plant and equipment consist of thefollowing (in thousands):
December 31,2004 2005
Land $4,576 $3,901Buildings 33,021 31,740Machinery and equipment 185,599 165,556Construction in progress — 909
223,195 202,106Less: Accumulated depreciation (138,130) (129,402)
Total Property, plant and equipment, net $85,064 $72,703
For the year ended December 31, 2003, 2004, and2005, the Company recorded depreciation expenseof $19.2 million, $18.6 million, and $19.5 million,respectively.
Note 7—Marketable Securities The following table is a summary of the Company’s investments’ gross unrealized losses and fair value,aggregated by investment category and length of time that individual securities have been in a unrealized lossposition, at December 31, 2005 (in thousands):
Less than 12 months 12 months or more Total
Fair Unrealized Fair Unrealized Fair Unrealized
(in thousands) Value Losses Value Losses Value Losses
Other securities $— $— $30 $(1) $30 $(1)
Total temporarily impaired securities $— $— $30 $(1) $30 $(1)
N O T E S T O T H E C O N S O L I D AT E DF I N A N C I A L S TAT E M E N T S( c o n t i n u e d )
Head
N.V
. and
Su
bsidiaries A
nn
ual R
epo
rt 200
5 B
ased o
n U
.S. G
AA
P
21
In September 2004, the Company sold its property inMullingar, Ireland for €5.7 million ($6.9 million) witha gain of €4.7 million ($5.7 million).
In October 2004, the Company entered into a leaseagreement effective January 1, 2005 with respect tothe property in Tallinn, Estonia. The lessee had apurchase option which was exercised in June 2005.Any usufruct fees the lessee had paid until the dateof purchase had been credited against the purchaseprice of $9.5 million. The Company recorded a gainon the sale of $7.2 million.
The Company’s total proceeds on the sale of propertyand equipment were $0.3 million, $7.9 million and$9.8 million resulting in a loss of $0.1 million, a gain of$5.5 million and a gain of $7.4 million for the yearsended December 31, 2003, 2004 and 2005,respectively. As of December 31, 2004 and 2005, $5.7million and $7.2 million of these gains pertain to plantsales and are reflected as gain on sale of property onthe consolidated statements of operations as thesegains represent gains on the sale of operatingactivities. All other gains (losses) are included in otherincome (expense), net in the accompanyingconsolidated statements of operations.
Note 9—Goodwill and Intangible AssetsEffective January 1, 2002, the Company adoptedSFAS 142. Upon adoption of SFAS 142 the Companyceased amortization of purchased goodwill andtrademarks, which were determined to be indefinite-lived. The Company completed the transitionalimpairment tests for goodwill and indefinite-livedintangibles as of January 1, 2002, and the annualimpairment test, in the fourth quarter of 2004 and2005, as required by SFAS 142. Based upon theassessment, the Company determined that goodwilland trademarks are not impaired; therefore noimpairment charge was recorded.
At December 31, 2004 and 2005, the Company hasidentified intangible assets consisting of trademarkswith a book value of $16.5 million. Also, the Companyhas goodwill of $3.7 million at December 31, 2004and 2005.
In December 2005, the Company purchased land userights in China with an estimated useful life of 50years for the amount of $0.7 million to build a plant
for tennis balls (see Note 20). The Company expectsto incur $0.02 million of amortization expense foreach of the next five years.
Note 10—Fair Value of Financial InstrumentsThe Company uses derivative instruments,specifically foreign exchange forward and optioncontracts, to hedge the foreign exchange risk relatedto its forecasted and firmly committed foreigncurrency denominated cash flows.
The Company recorded the change in fair marketvalue of derivatives related to cash flow hedges toAOCI of $0.4 million and $0.5 million, net of tax, forthe year ended December 31, 2004 and 2005,respectively, all of which is expected to bereclassified to earnings during the next twelvemonths. The time value component excluded fromeffectiveness testing was not material for the periodspresented.
For the year ended December 31, 2004 and 2005,the Company reclassified a gain from AOCI toearnings of $0.6 million and $0.1 million, net of tax,respectively.
The following table provides information regardingthe Company’s foreign exchange forward and optioncontracts as of December 31, 2004 and 2005. Thefair value of the foreign currency contracts representthe amount the Company would receive or pay toterminate the contracts, considering first, quotedmarket prices of comparable agreements, or in theabsence of quoted market prices, such factors asinterest rates, currency exchange rates andremaining maturity.
December 31, 2004
Contract Carrying Fair(in thousands) amount value value
Foreign exchange forward contracts $ 37,610 $ 716 $ 716
December 31, 2005
Contract Carrying Fair(in thousands) amount value valueForeign exchange
forward contracts $21,105 $(190) $(190)
Foreign exchangeoption contracts $2,208 $15 $15
N O T E S T O T H E C O N S O L I D AT E DF I N A N C I A L S TAT E M E N T S( c o n t i n u e d )
Head
N.V
. and
Su
bsidiaries A
nn
ual R
epo
rt 200
5 B
ased o
n U
.S. G
AA
P
22
The Company formally documents all relationshipsbetween hedging instruments and hedged items, aswell as its risk-management objectives and strategiesfor undertaking various hedge transactions. TheCompany links all derivatives that are designated ashedging instruments in foreign currency cash flowhedges to forecasted transactions or firmcommitments. In accordance with the provision ofSFAS 133, the Company assesses, both at theinception of each hedge and on an on-going basis,whether the derivatives that are designated inhedging qualifying relationship are highly effective inoff-setting changes in fair values or cash flows ofhedged items. When it is determined that a derivativeis no longer highly effective as a hedge, the Companydiscontinues hedge accounting prospectively.
The counterparties to the foreign currency contractsare major international banks. Such contracts aregenerally for one year or less.
Note 11—Short-Term BorrowingsShort-term borrowings consist of the following (inthousands):
December 31,2004 2005
Lines of credit $39,883 $32,735
In the second quarter of 2001, the Company’ssubsidiaries entered into a new financing agreementproviding multiple revolving credit lines with the“Österreichische Kontrollbank” (“OEKB”) which wererenegotiated in 2003, in the total amount of €15.0million ($17.7 million) secured by all Austrian tradereceivables. As of December 31, 2005, the fair valueof trade receivables that serve as collateral for theCompany’s revolving credit lines was $72.7 million. Inaddition, the Company used lines of credit withseveral banks in Canada and Japan of $15.0 millionand had $1.0 million unused credit lines. Theweighted average interest rate on outstanding short-term borrowings was 2.7% and 2.9% as of December31, 2004 and 2005, respectively.
Note 12—Accounts PayableAccounts payable consist of the following (inthousands):
December 31,2004 2005
Accounts payable—trade $27,042 $16,042Salaries and wages 2,153 1,499Fiscal authorities 3,392 2,552Social institutions 1,354 1,542Prepayments 1,401 2,742Other 5,318 4,876
$40,660 $29,252
Note 13—Accrued Expenses and Other CurrentLiabilitiesAccrued expenses and other current liabilities consistof the following (in thousands):
December 31,2004 2005
Employee compensation and benefits $10,984 $ 9,646Allowances, credit notes 8,551 9,005Product warranties 4,627 4,328Advertising 2,235 3,441Legal, auditing and consulting fees 3,305 3,806Fiscal authorities 2,633 1,524Commissions 4,611 3,605Accrued interest 6,665 5,745Restructuring — 1,609Accrued Expenses 5,523 7,164Freight and duties 1,370 930Litigation 3,835 3,949Other 5,078 4,065
$59,417 $58,819
Note 14—Long-Term DebtLong-term debt consists of the following (inthousands):
December 31,2004 2005
Senior notes $171,843 $131,078Other long-term debt 30,982 26,616
Total long-term borrowings 202,826 157,694Less current portion (3,305) (2,487)
Long-term portion $199,520 $155,207
Senior Notes
On July 15, 1999, one of the Company’s wholly-ownedsubsidiaries, Head Holding issued €100.0 million ofsenior notes. The notes bore interest of 10.75% perannum, which was payable semi-annually and was to
N O T E S T O T H E C O N S O L I D AT E DF I N A N C I A L S TAT E M E N T S( c o n t i n u e d )
mature in total on July 15, 2006. Among otherrestrictions, the notes included certain restrictiveterms regarding investments, distributions andincurrence of additional indebtedness by the Company.On January 5, 2000, a registration statement for theexchange of the original 10.75% senior notes for new10.75% senior notes was made effective by the U.S.Securities Exchange Commission (SEC). On February 9,2000, this Exchange Offer was consummated. InOctober 2000, the Company repurchased €30.9million of its senior notes in a series of transactionsusing part of the proceeds of the Company's initialpublic offering. In July 2002, the Companyrepurchased another €3.6 million of its senior notes.At December 31, 2003, the Company had €65.5 million($82.9 million) of senior notes outstanding.
In January 2004, one of the Company's subsidiariesissued €135.0 million of 8.5% unsecured senior notesdue 2014, guaranteed by the Company and certain ofits subsidiaries. The notes are listed on the LuxembourgStock Exchange. With the proceeds from the sale, all ofthe Company's outstanding 10.75% senior notes due2006 were redeemed. The total redemption paymentwas €70.1 million of which €3.5 million represents theredemption premium. In addition, the Company used aportion of the remaining proceeds to repay €25.8million of other outstanding debt.
In June 2004, the Company repurchased theequivalent of €5.5 million of its 8.5% senior notesfor €5.0 million ($5.9 million) and realized a gain of$0.4 million. As a result of this transaction, theCompany wrote-off $0.07 million of debt issue costs.
In 2005, the Company repurchased the equivalent of€15.7 million of its 8.5% senior notes for €14.3million ($18.8 million) and realized a gain of $0.9million. As a result of this transaction, the Companywrote-off $0.2 million of debt issue costs.
At December 31, 2004 and 2005, the Company had€126.2 million ($171.8 million) and €111.1 million($131.1 million), respectively of senior notes outstanding.
Sale-Leaseback Transaction
The Company entered into an agreement on June 28,2002, whereby it sold land and building to anunrelated bank and leased it back over a 15 yearterm. The proceeds of this sale were €10.6 million.
The Company has the obligation to purchase theproperty back after 15 years for €8.2 million. TheCompany may also repurchase the property at itsoption from the first until the tenth year of thearrangement for the present value of the futurelease payments and the remaining residual value.
The Company is also required to pay the bank amonthly deposit of €0.01 million, which will be repaidto the Company, plus interest of 6.7%, at the time ofrepurchase.
Because of the Company's continuing involvement,this transaction has been accounted for as a financingsuch that the Company has recorded €10.6 million ofcash and long-term borrowings at the inception dateof this agreement. At December 31, 2004 and 2005,the remaining obligation under the financingagreement is $14.1 and $12.1 million, respectively.
The Company's future minimum lease payments as ofDecember 31, 2005, are as follows:
December 31,(in thousands) 2005
2006 $ 9482007 9482008 9482009 9482010 948Thereafter 15,785
Total minimum payments 20,523Amount representing interest (8,433)
Obligations under financing activity 12,090Obligations due within one year (147)
Long-term obligations under financing activity $11,943
As of December 31, 2005, the net book value of landand building under the sale-leaseback arrangementconsists of the following (in thousands):
Land Building
Cost $1,203 $9,893Less: Accumulated depreciation — (8,390)
Net book value $1,203 $1,504
Mortgage Agreement
In 2002, one of the Company's subsidiaries enteredinto a mortgage agreement secured by the PennPhoenix property with an unrelated financialinstitution of $4.8 million over a 15 year term at aninterest rate of 7.33%. At December 31, 2004 and
Head
N.V
. and
Su
bsidiaries A
nn
ual R
epo
rt 200
5 B
ased o
n U
.S. G
AA
P
23
N O T E S T O T H E C O N S O L I D AT E DF I N A N C I A L S TAT E M E N T S( c o n t i n u e d )
Head
N.V
. and
Su
bsidiaries A
nn
ual R
epo
rt 200
5 B
ased o
n U
.S. G
AA
P
24
2005, the outstanding balance of the mortgage is$4.3 million and $4.1 million, respectively.
Other long-term debt
Other long-term debt comprises secured loans in Italyand the Czech Republic outstanding with several banks.The weighted average interest rate on outstandingborrowings was 2.6% and 2.4% as of December 31,2004 and 2005, respectively. Borrowings mature atvarious dates through 2011. At December 31, 2004 and2005, the remaining outstanding long-term debt is$12.5 million and $10.4 million, respectively.
Maturities of long-term debt
Aggregate maturities of long-term debt are asfollows (in thousands):
December 31,2005
2006 $ 2,4872007 2,5492008 2,4992009 2,0722010 874Thereafter 147,215
$157,694
Note 15—Other Long-Term LiabilitiesOther long-term liabilities consist of the following (inthousands):
December 31,2004 2005
Accrued benefit cost $20,403 $17,842Deferred income 5,351 9,118Other 2,031 1,629
Total other long-term liabilities $27,785 $28,588
Note 16—Pension and Other PostretirementBenefit PlansThe Company funds leaving indemnities and pensionliabilities paid to employees at some Austrian andother European locations. The indemnities are basedupon years of service and compensation levels andare generally payable upon retirement or dismissal insome circumstances, after a predetermined numberof years of service. For the year ended December 31,2004 and 2005, the only pension plans that includeplan assets is the Japanese pension plans. Note thatduring 2004, the Company's pension plan in Irelandalso included plan assets, however, as a result of the
shutdown of this location, the pension plan wasterminated. All other plans do not include planassets. The Company maintains sufficient assets tomeet the minimum funding requirements set forth bythe regulations in each country. The discount rate isbased on the expected return of long-term securitiesin the secondary market.
The table below shows the obligations and fundedstatus determined as of December 31, 2003 and2004 for December 31, 2004 and 2005 (inthousands):
Pension Benefits Other Benefits
2004 2005 2004 2005
Change in benefit obligationBenefit obligation at
beginning of year $10,392 $6,225 $16,595 $18,330Service cost 395 371 2,413 1,896Interest cost 241 255 423 452Plan amendments — 6 — —Actuarial loss (gain) (21) 70 222 419Settlement — — — (776)Benefit payments (5,108) (312) (2,636) (2,438)Translation adjustment 326 (850) 1,315 (1,294)
Benefit obligation at end of year 6,225 5,766 18,330 16,589
Change in plan assetsFair value of plan assets
at beginning of year 5,730 545 — —Employer contribution 63 67 — —Benefit payments (5,158) (63) — —Plan participants’ contributions 6 — — —Translation adjustment (96) (71) — —
Fair value of plan assets at end of year 545 477 — —
Funded status 5,681 5,289 18,330 16,589Unrecognized net actuarial gain (750) (802) (2,659) (2,397)Translation adjustment (63) 42 (268) (987)
Net amount recognized $4,868 $4,529 $15,404 $13,205
Amounts recognized in the statement of financialpositions consists of (in thousands):
Pension benefits Other benefits
2004 2005 2004 2005
Accrued benefit cost $4,999 $4,637 $15,404 $13,205Accumulated other
comprehensive income (131) (108) — —
Net amount recognized $4,868 $4,529 $15,404 $13,205
Accrued benefit cost are included in the balancesheet line item “Other long-term liabilities“ on theconsolidated balance sheets. The Company expectsto make insignificant amounts of employercontributions during the years 2006 to 2010.
The accumulated benefit obligation for all definedpension benefits is $5.0 million and $4.9 million atDecember 31, 2004 and 2005, respectively.
As of December 31, 2004 and 2005, Japanese pensionplans with an accumulated benefit obligation excess ofplan assets consist of the following (in thousand).
December 31,2004 2005
Projected benefit obligation $1,016 $892Accumulated benefit obligation 832 756Fair Value of plan assets 545 477
The plan assets of the Japanese pension plans consistof equity funds at December 31, 2004 and 2005.
As of December 31, 2004 and 2005, the componentsof net periodic benefit costs consists of the following(in thousands):
Pension benefits Other benefits
2004 2005 2004 2005
Service cost $395 $371 $2,413 $1,896Interest cost 241 255 423 452Expected return on plan
assets 11 (11) — —Settlement actuarial loss — — — 189Recognized actuarial loss 3 20 100 107
Net periodic benefit cost $651 $635 $2,936 $2,644
As of December 31, 2004 and 2005, the weightedaverage assumptions used to determine benefitobligations are as follows:
Pension benefits Other benefits
2004 2005 2004 2005
Discount rate 4.5% 4.2% 5.0% 4.8%Rate of compensation increase 2.3% 2.3% 3.0% 3.0%
As of December 31, 2004 and 2005, the weightedaverage assumptions used to determine net periodicbenefit cost are as follows:
Pension benefits Other benefits
2004 2005 2004 2005
Discount rate 4.4% 4.2% 5.3% 4.8%Expected long-term return
on plan assets 2.1% 2.2% — —Rate of compensation increase 2.4% 2.4% 3.0% 3.0%
The Company invests in equity funds with anexpected stable growth rate. The expected rate ofreturn on plan assets is based upon the present rateof return and is expected to be stable.
Note 17—Commitments and ContingenciesOperating Leases
The Company leases certain office space, warehousefacilities, transportation and office equipment underoperating leases which expire at various dates through2012. Rent expense was approximately $3.6 million,$4.1 million and $4.7 million for the years endedDecember 31, 2003, 2004 and 2005, respectively.
Future minimum payments under non-cancelableoperating leases with initial or remaining lease termsin excess of one year are as follows as of December31, 2005 (in thousands):
December 31,2005
2006 $ 4,4002007 3,9102008 3,1222009 2,6622010 1,699Thereafter 1,521
$17,314
Litigation
From time to time the Company and its subsidiariesare involved in legal proceedings, claims and litigationarising in the ordinary course of business. In theopinion of management it is not possible to reasonablyestimate the outcome of current legal proceedings,claims and litigation. However, management believesthat the resolution of these matters will not materiallyaffect the Company's financial position.
The Company accrued $3.8 million and $3.9 millionfor suits with several parties including competitors,customers for past receipts, former employees,suppliers and licensees at December 31, 2004 and2005, respectively.
Product Warranties
The Company sells certain of its products tocustomers with a product warranty that providesrepairs at no cost to the customer or the issuance ofcredit to the customer. The length of the warrantyterm depends on the product being sold, but rangesfrom one year to two years. The Company accrues itsestimated exposure to warranty claims based uponhistorical warranty claim costs as a percentage ofsales multiplied by prior sales still under warranty atthe end of any period. Management reviews these
N O T E S T O T H E C O N S O L I D AT E DF I N A N C I A L S TAT E M E N T S( c o n t i n u e d )
Head
N.V
. and
Su
bsidiaries A
nn
ual R
epo
rt 200
5 B
ased o
n U
.S. G
AA
P
25
estimates on a regular basis and takes actual productperformance and field expense profiles intoconsideration to adjust the warranty provisions.
Included in accrued expenses and other currentliabilities are product warranties that have a probablelikelihood of loss and are estimated based on weightedprior year experiences for recognized revenues. For theyears ended December 31, 2004 and 2005, accruals forwarranties have developed as follows (in thousands):
December 31,2004 2005
Balance at the beginning of the period $3,103 $4,627Reclassification 65 81Current year provision 4,779 3,405Settlements made during the perid (3,717) (3,160)Translation adjustment 397 (625)
Balance at the end of the period $4,627 $4,328
N O T E S T O T H E C O N S O L I D AT E DF I N A N C I A L S TAT E M E N T S( c o n t i n u e d )
Head
N.V
. and
Su
bsidiaries A
nn
ual R
epo
rt 200
5 B
ased o
n U
.S. G
AA
P
26
Note 18—Accumulated Other Comprehensive Income BalanceThe following table shows the components of AOCI:
For the Year Ended December 31, 2005
Foreign Unrealized AccumulatedCurrency Gains on Minimum Unrealized Other
Translation Derivative Pension Gain (Loss) Comprehensive(in thousands) Adjustment Instruments Liabilities on Securities Income
Beginning balance $60,478 $420 $ (131) $ (81) $ 60,686Current-period changes — (397) 14 87 (297)Translation Adjustment (20,998) (17) 8 11 (20,996)
Ending balance $39,480 $ 6 $ (108) $ 16 $ 39,393
Note 19—Shareholders’ EquityThe Company is a Naamloze Vennootschap (“N.V.”), alimited liability company under Dutch law. Theregistered capital of a N.V. is in the form of shareswhich represent negotiable securities. The minimumregistered and authorized capital requirement is€225,000 (approximately $0.3 million) and theminimum paid in capital requirement for a N.V. is€45,000 (approximately $0.06 million).
At December 31, 2004 and 2005, 39,820,677 shareswere issued, respectively.
Dividends
In 2003, 2004 and 2005, due to the currenteconomic environment the Company did not considerit prudent to pay a dividend.
Treasury Stock
Pursuant to resolutions which were approved on May25, 2005 the Board of Management is authorized tobuy back a maximum of 30% of the Company'sissued share capital during a period of 18 months,although the Company will not hold more than 10%of the Company's issued shares at any time.
As of December 31, 2004 and 2005, the Company owned3,600,775 shares of treasury stock, of which 1,179,540was held by the Stichting at December 31, 2005.
Stichting
The Stichting Head Option Plan (the “Stichting”) is aDutch foundation, the Board of which is Head SportsHoldings N.V., an entity that is ultimately controlled byJohan Eliasch and his family members. The Stichtingholds, votes, and receives dividends on certain of theCompany’s ordinary shares. In conjunction with theCompany’s option plans (see Note 24), the Stichtingalso issues depository receipts to option holders,upon exercise of the option. Holders of depositaryreceipts are entitled to dividends paid on theCompany’s shares and to proceeds on the sales oftheir shares upon request to the Stichting. However,such holders have no voting rights.
On May 25, 2001, Head N.V. transferred 2,041,300shares, with an original cost of $10.6 million, to theStichting. The Stichting will use these shares to fulfillthe Company's obligations under the Head TyroliaMares Group Executive Stock Option Plan 1998(“Plan 1998”). The Stichting intends to remit
proceeds from the exercise of employee stockoptions to the Company. Such shares have beenrecorded as a reduction of the Company’s equity.
In 2003, 56,790 options under Plan 1998 were exercisedat a price between $0.29 and $0.31 per share. In 2004,option holders exercised 197,348 options under “Plan1998” at a price between $0.32 and $0.35 per share.
As of December 31, 2004 and 2005, the Stichtingheld 1,179,540 treasury shares. As of January 1,2004, in accordance with FIN 46R “Consolidation ofVariable Interest Entities“ the Company consolidatedthe Stichting, as the Company was considered theprimary beneficiary of the Stichting, a variableinterest entity. As a result of consolidating theStichting shares held by the Stichting at December31, 2004 and 2005 are presented as treasury stock,in the consolidated balance sheets.
Note 20—Minority InterestAs a consequence of the retirement of the director ofHTM Sports Japan K.K. his minority interest of 0.4% ofHTM Sports Japan K.K was transferred to the Company.
In July 2005, the Company signed an agreement forthe establishment of a company in the British VirginIslands. The business venture was established to founda Chinese company which will manufacture tennis ballsfor exclusive sale to the Company. The Company andits venture partner have a 70% and 30% interest inthe newly formed venture, respectively.
In accordance with the provisions of FIN 46,“Consolidation of Variable Interest Entities, aninterpretation of ARB No. 51,” this venture qualifiesas a variable interest entity due to the pricing of thepurchase option that the Company has with its 30%partner, which essentially caps the rights of theventure partner to the full appreciation of itsinterest. The entity did not have any operations as ofDecember 31, 2005 other than the commencementof the construction of a building.
The Company’s partner in this venture also has theright to receive a guaranteed yearly dividend of 12%on its investment balance. For the year endedDecember 31, 2005, a dividend in the amount of$0.01 million has been accrued.
As a result of the Company having to consolidate this
entity the Company recorded minority interest forthe contribution of its partner of $0.4 million. Theshares issued to this partner are not mandatorilyredeemable and therefore they lack the essentialcharacteristic of a liability.
Note 21—Income TaxesThe following table summarizes the significantdifferences between the Dutch federal statutory taxrate and the Company's effective tax rate forfinancial statement purposes.
For the Years ended December 31,2003 2004 2005
Dutch statutory tax rate 34.5% 34.5% 31.5%Tax rate differential (0.1) 12.3 14.4Non-taxable gain on sale
of property — — (28.5)Other (6.9) (103.3) (9.1)Foreign rate differentials 0.7 (9.5) (0.4)Changes in tax rate — (258.1) 0.3Valuation allowance (34.2) 25.9 2.3
Effective tax rate (6.0)% (298.3)% 10.4%
In 2003, the Company’s effective tax rate differedfrom the statutory tax rate in the Netherlandsprimarily due to a release of the valuation allowanceon tax losses carryforwards which the Companybelieved it was more likely than not that they wouldbe realized.
In 2004, the Company’s effective tax rate differed fromthe statutory tax rate in the Netherlands primarily dueto a reduction of the Austrian income tax rate from34% to 25% as of January 1, 2005, which was resolvedin May 2004 and led to a reduction of long-termdeferred tax assets, mainly on tax loss carried forwardof $24.9 million, and increased income tax expense.Other effects that lead to differences to the Dutchfederal statutory rate are caused by withholding taxes,other local taxes and prior year adjustments mainly inItaly, Austria and Canada.
In 2005, the Company’s effective tax rate differedfrom the statutory tax rate in the Netherlandsprimarily due to the non-taxable gain on sale of theproperty in Estonia of $7.2 million partially offset byhigher tax rates applicable to the Company in othercountries, mainly in Germany and Japan and bywithholding taxes and other local taxes mainly inItaly, Austria and Canada.
N O T E S T O T H E C O N S O L I D AT E DF I N A N C I A L S TAT E M E N T S( c o n t i n u e d )
Head
N.V
. and
Su
bsidiaries A
nn
ual R
epo
rt 200
5 B
ased o
n U
.S. G
AA
P
27
Deferred tax assets (liabilities) consist of the followingas of December 31, 2004 and 2005 (in thousands).
December 31,2004 2005
Short-term:Deferred tax asset:Tax loss carried forward $2,162 $2,478Inventory reserve 3,190 4,925Reserve for doubtful accounts 536 2,579Other 2,627 4,332
Total Short-term deferred tax assets 8,515 14,314
Deferred tax liabilities:Deferred expenses $(274) $(243)
Accrued liabilities (9) (359)Other (3,952) (1,652)
Total Short-term deferred tax liability (4,235) (2,254)
Total Short-term deferred tax asset, net $ 4,280 $12,060
The short-term deferred tax asset, net is classified inprepaid expenses.
December 31,2004 2005
Long-term:Deferred tax asset:Tax loss carried forward $112,605 $96,725Intangible assets 1 1Fixed assets 1,284 624Lease obligations 3,529 3,023Other 919 749
Total Long-term deferred tax assets 118,338 101,122Deferred tax liabilities:Investments $(18,059) $(19,350)Fixed assets (1,304) (1,390)Other (870) —
Total Long-term deferred tax liability (20,232) (20,740)Valuation allowance (19,194) (19,874)
Total Long-term deferred tax asset, net $78,912 $60,507
The Company has net operating loss carryforwardsof approximately $437.4 million and $371.2 million asof December 31, 2004 and 2005, respectively. Thesenet operating losses were experienced in thefollowing jurisdictions (in thousands):
December 31,2004 2005
Austria $384,912 $328,085Germany 20,039 13,118Other Europe 2,469 536North America 29,932 29,428
$437,352 $371,167
The table below shows income (loss) before incometaxes by geographic region (in thousands):
For the years ended December 31,2003 2004 2005
Austria $1,497 $4,858 $6,468Non-Austria (15,322) (14,132) 2,456
Total $(13,825) $(9,274) $ 8,923
In July 1996, commensurate with the EuropeanCommission's (EC) decision allowing the contributionreceived by HTM Sport- und Freizeitgeräte AG (HTM)from Austria Tabak (former owner) as restructuringaid, the EC limited the utilization of certain netoperating losses (approximately $62.2 million as ofDecember 31, 2005). These net operating losses andany related deferred tax asset are not included in theabove amounts due to the limitation.
Austria and Germany allow an unlimited carryover ofnet operating losses, whereas the United States allow15 year carryovers. The Company recorded avaluation allowance to reduce the deferred tax assetsto the amount the Company believes is more likelythan not to be realized considering future taxableincome and feasible tax planning strategies.
Note 22—Segment InformationThe Company operates in one reporting segment,Sporting Goods. The tables below show net revenuesfrom external customers based upon where the saleoriginated and long-lived assets by geographic regionbased on the location of the Company's subsidiaries(in thousands):
For the years ended December 31,2003 2004 2005
Revenues from External Customers:Austria $83,179 $201,309 $197,620Italy 60,172 49,675 41,722Germany 45,228 — —France 32,181 33,667 33,040United Kingdom/Ireland 20,202 17,954 14,051Japan 21,697 21,670 20,899Other (Europe) 39,601 20,515 21,779North America 120,070 122,225 117,771
Total net revenues $422,331 $467,014 $446,882
N O T E S T O T H E C O N S O L I D AT E DF I N A N C I A L S TAT E M E N T S( c o n t i n u e d )
Head
N.V
. and
Su
bsidiaries A
nn
ual R
epo
rt 200
5 B
ased o
n U
.S. G
AA
P
28
December 31,2004 2005
Long-lived assets:Austria $ 28,455 $ 23,783Italy 20,432 16,462Germany 691 188France 156 81United Kingdom/Ireland 1,723 1,563Other (Europe) 21,271 18,715Asia 1,711 3,149North America 30,863 29,774
Total Assets $105,301 $93,716
As of January 2004, the Company has started tocentralize its European distribution organizations forWinter Sports and Racquet Sports products so thatHead International GmbH, Austria operates asdistributor and invoices directly to the Company’scustomers in Austria, Germany, Switzerland and Italy.
Sales by product category consist of the following (inthousands):
For the years ended December 31,2003 2004 2005
Revenues by Product Category:Winter Sports $188,768 $223,211 $216,262Racquet Sports 166,417 168,037 166,636Diving 66,322 75,453 61,405Licensing 9,702 11,059 12,219
Total Revenues 431,209 477,759 456,522Other Revenes 1,394 1,326 1,446Sales Deductions (10,272) (12,071) (11,086)
Total Net Revenues $422,331 $467,014 $446,882
The Company receives administrative services fromcorporations which are ultimately owned by theprincipal shareholder of the Company. Administrativeexpenses amounted to approximately $3.5 million(€3.1 million), $5.6 million (€4.5 million) and $5.3million (€4.2 million) for the years ended December31, 2003, 2004 and 2005, respectively. The companyprovides investor relations, corporate finance, legaland consulting services and since 2004 internal auditand other services in relation to compliance with theSarbanes-Oxley Act of 2002.
One of the Company's subsidiaries leased its officebuilding from its general manager. Rental expensesamounted to approximately $0.04 million, $0.05million and $0.04 million for the years endedDecember 31, 2003, 2004 and 2005, respectively.
Note 24—Stock Option PlansThe Company accounts for its stock options inaccordance with SFAS 123. Accordingly, the Companyrecords stock-based compensation expense based onthe grant-date fair values of the stock optionscomputed using the Black-Scholes option pricingmodel. Stock-based compensation expense isrecognized over the vesting term of the options andamounted to $0.7 million, $0.6 million and $0.9million for the years ended December 31, 2003, 2004and 2005, respectively.
Plan 1998
In November 1998, the Company adopted the HeadTyrolia Mares Group Executive Stock Option Plan1998 (“Plan 1998”). A total of 2,424,242 options werereserved to be granted under the terms of the Plan1998. The Plan 1998 provided for grants of stockoptions to officers and key employees of theCompany and its subsidiaries. The exercise price forall stock options granted under the Plan 1998 wasfixed at inception of the Plan 1998 and increases atthe rate of 10% per annum until the options areexercised. Options generally vest over a period of 4years and are subject to the Company meetingcertain earnings performance targets during thisperiod. Options vested under the Plan 1998 were notexercisable prior to the end of the two year lock-upperiod following the initial public offering. Optionshave a maximum term of 10 years. As of December31, 2005, 145,848 shares were available for grantunder the Plan 1998.
The weighted average grant-date fair values usingthe Black-Scholes option pricing model was $5.42and $8.84 per share for options granted in 1999 and2000, respectively.
The fair values of options granted during 1999 and2000 were estimated on the date of grant using thefollowing weighted average assumptions: nodividends; expected volatility of 0% (all optionsgranted prior to IPO); expected terms of 3.6 and 4.0years, respectively; and risk free interest rates of5.76% and 6.63%, respectively. The Company hasalso assumed that all performance targets will beachieved and all options granted will become fullyvested.
N O T E S T O T H E C O N S O L I D AT E DF I N A N C I A L S TAT E M E N T S( c o n t i n u e d )
Head
N.V
. and
Su
bsidiaries A
nn
ual R
epo
rt 200
5 B
ased o
n U
.S. G
AA
P
29
As of December 31, 2005, the weighted averageremaining contractual life of the outstanding stockoptions is 3.6 years, and 770,528 options are vestedand exercisable.
Exercise Price Less Than
Grant Date Stock Fair Value
Number Weighted Averageof Shares Exercise Price
Balance, December 31, 2002 1,670,772 $0.29Exercised (56,790) 0.30
Balance, December 31, 2003 1,613,982 0.32Exercised (197,348) 0.33
Balance, December 31, 2004 1,416,634 0.35Balance, December 31, 2005 1,416,634 $0.38
At December 31, 2005, stock options representing770,528 shares are exercisable at price of $0.38 pershare and grant dates ranging from November 1998to January 2000.
Plan 2001
In September 2001, the Company adopted the HeadN.V. Executive Stock Option Plan 2001 (“Plan 2001”).The Plan 2001 provides for grants of stock options toofficers and employees of the Company and itssubsidiaries. On September 28, 2001, a total of3,982,068 options were granted under the terms ofthe Plan 2001. In accordance with SFAS No. 123, theCompany records stock-based compensation expenseon the grant-date fair values of the stock optionscomputed using the Black-Scholes option pricingmodel. As of December 31, 2001, the weighted-average fair value of the grant was $0.77, which wasestimated using the following assumptions: nodividends, expected volatility of 28%, expected termof 5.6 years, and risk-free interest rate of 3.6%.
The exercise price for all stock options granted underthe Plan was fixed at inception of the Plan 2001. Thevesting period varies from 0 to 6 years. TheChairman and Chief Executive Officer received1,426,470 options under this grant, which vestedimmediately. The Company assumes that all optionsgranted will become fully vested. Options have amaximum term of 10 years. As of December 31, 2005no shares were available for grant under the Plan2001.
Exercise Price Greater Than
Grant Date Stock Fair Value
Number Weighted Averageof Shares Exercise Price
Balance, December 31, 2003,2004 and 2005 3,982,068 $4.31
As of December 31, 2005, the weighted averageremaining contractual life of the outstanding stockoptions is 5.7 years, and 1,756,482 options areexercisable at a price of $4.31 per share, under thePlan 2001.
Plan 2005
In May 2005, at the annual general meeting theshareholders approved the Head N.V. Executive StockOption Plan 2005 (“Plan 2005”). The Plan 2005provides for grants of stock options to certainofficers and key employees of the Company and itssubsidiaries. As of December 31, 2005, a total of3,661,346 options were granted under the terms ofthe Plan 2005. In accordance with SFAS 123, theCompany records stock-based compensation expenseon the grant-date fair values of the stock optionscomputed using the Black-Scholes option pricingmodel. As of December 31, 2005, the weighted-average fair value of the grant was €1.22, which wasestimated using the following assumptions: nodividends, expected volatility of 41%, expected termof 6.5 years, and risk-free interest rate of 3.2%.
The exercise price for all stock options granted underthe Plan 2005 was fixed at inception of the Plan 2005at €2.168 ($2.56). Options generally vest over a periodof 4 years. The Company assumes that all optionsgranted will become fully vested. Options have amaximum term of 10 years. As of December 31, 2005,203,345 shares are available for grant under the Plan2005 and no shares are currently exercisable.
Exercise Price Greater Than
Grant Date Stock Fair Value
Number Weighted Averageof Shares Exercise Price
Balance, December 31, 2005 3,661,346 $2.56
Note 25—Business RationalizationThroughout 2003, 2004 and 2005 the Companyperformed various restructuring programs. Theseprograms consisted of the following:
N O T E S T O T H E C O N S O L I D AT E DF I N A N C I A L S TAT E M E N T S( c o n t i n u e d )
Head
N.V
. and
Su
bsidiaries A
nn
ual R
epo
rt 200
5 B
ased o
n U
.S. G
AA
P
30
Ireland facility closure
To improve utilization of the Company’s productioncapabilities, in 2003 the Company announced theclosing of its tennis ball production facility inMullingar, Ireland and the transfer of theseoperations to its existing, under-utilized plant inPhoenix, Arizona. In 2003 the Company recognizedcosts totaling $7.0 million relating to this programconsisting of an impairment of $2.6 million andemployee severance costs of $4.4 million. Futureexpected cash flows had been taken as basis for adiscounted cash flow calculation taking into accountany gain on sale.
In March 2004, the Company closed its tennis ballproduction facility in Mullingar, Ireland andrecognized $1.6 million relating to this programmainly consisting of cost for decommissioning andclearance of the plant. In September 2004, theCompany sold its property in Mullingar, Ireland for€5.7 million ($6.9 million) with a gain of €4.7 million($5.7 million).
Estonia facility closure
Starting in 2003, the Company has transferred all ofits manufacturing operations in Tallinn, Estonia,which manufactured ski boots and certain divingproducts, to its plant in Litovel, Czech Republic andexpensed $0.6 million and $0.7 million as ofDecember 31, 2003 and 2004, respectively. InOctober 2004, the Company entered into a leaseagreement effective January 1, 2005 with respect tothe property in Tallinn, Estonia. The lessee had apurchase option which he exercised in June 2005.Any usufruct fees the lessee had paid until the dateof purchase had been credited against the purchaseprice of $9.5 million. The Company recorded a gainon the sale of $7.2 million.
Kennelbach and Budweis facility closure
In April 2005, the Company decided to outsource90% of its tennis racquet production from itsEuropean sites in Kennelbach, Austria and CeskéBudejovice, Czech Republic to China. As of December31, 2005, the Company recognized $3.9 million
relating to this program mainly consisting of animpairment of $1.8 million pertaining to machineryand equipment, additional cost due to productioninefficiency of $1.1 million, $1.0 million employeeseverance costs for 250 workers and $0.3 million forother related costs. The fair value of the impairedassets was determined using the discounted cashflow method for cash flows expected to be generatedin the future. The Company has largely completedthe program during 2005.
Reorganization of ski binding production
In July 2005, the Company started to restructure theski binding production and recognized $0.7 millionemployee severance costs for 44 workers. Thisrestructuring process has been largely finalized atthe end of 2005.
Italy reorganization
In November 2005, the Company approved arestructuring program to reduce production capacityas a consequence of sales reductions and thetransfer of production to Eastern Europe and FarEast starting in January 2006. 60 people areincluded in the restructuring program (CassaIntegrazione Straordinaria) agreed with unions andlocal institutions. During a period of 12 months theemployees can voluntarily adhere to a dismissal plan(voluntary Mobilità) benefiting from incentives fromthe Company and Government otherwise allemployees will be involuntarily terminated as part ofa dismissal plan (obligatory Mobilità). The total costsfor the restructuring program are €1.0 million ($1.2million) and represent personnel costs. As ofDecember 31, 2005 those costs have been fullyaccrued. This restructuring process is expected to belargely finalized at the end of 2006.
In November 2005, the Company decided to movethe remaining ski boots production from the Maserplant to the plant in Litovel, Czech Republic. InDecember 2005, the Company recognized $0.4million of severance costs. The program is largelycompleted, however there will be some non-materialexpenses in 2006.
N O T E S T O T H E C O N S O L I D AT E DF I N A N C I A L S TAT E M E N T S( c o n t i n u e d )
Head
N.V
. and
Su
bsidiaries A
nn
ual R
epo
rt 200
5 B
ased o
n U
.S. G
AA
P
31
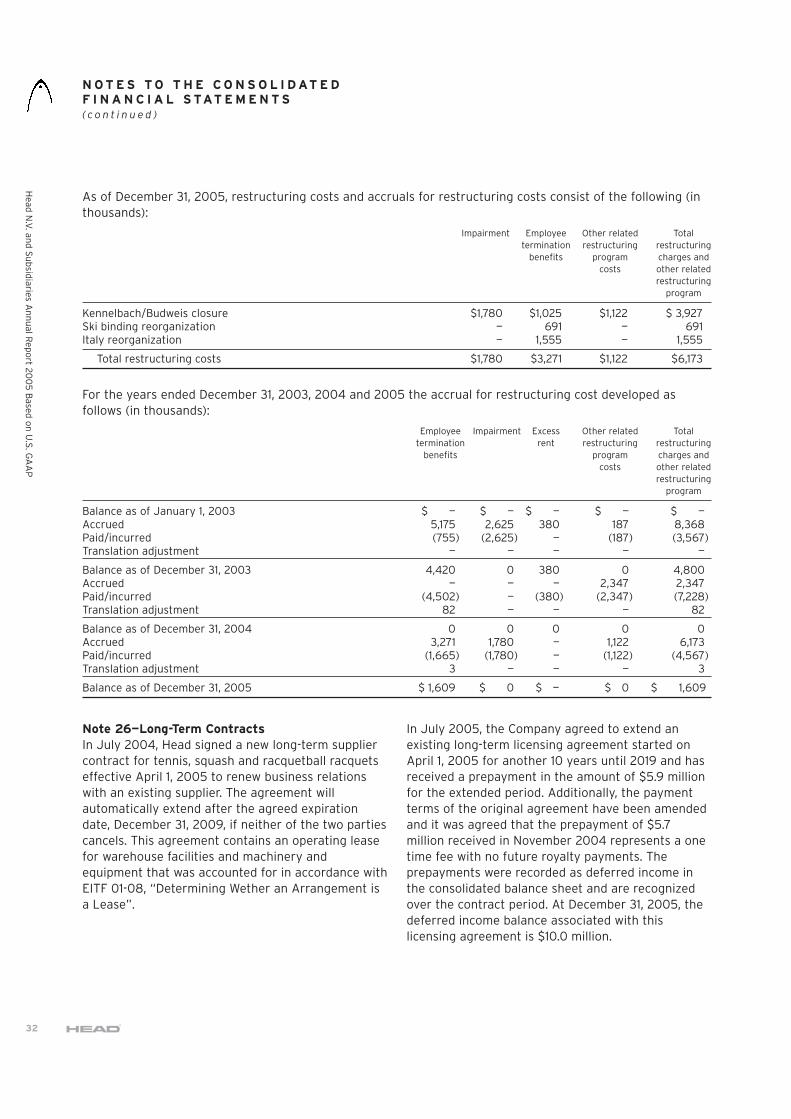
Note 26—Long-Term ContractsIn July 2004, Head signed a new long-term suppliercontract for tennis, squash and racquetball racquetseffective April 1, 2005 to renew business relationswith an existing supplier. The agreement willautomatically extend after the agreed expirationdate, December 31, 2009, if neither of the two partiescancels. This agreement contains an operating leasefor warehouse facilities and machinery andequipment that was accounted for in accordance withEITF 01-08, “Determining Wether an Arrangement isa Lease”.
In July 2005, the Company agreed to extend anexisting long-term licensing agreement started onApril 1, 2005 for another 10 years until 2019 and hasreceived a prepayment in the amount of $5.9 millionfor the extended period. Additionally, the paymentterms of the original agreement have been amendedand it was agreed that the prepayment of $5.7million received in November 2004 represents a onetime fee with no future royalty payments. Theprepayments were recorded as deferred income inthe consolidated balance sheet and are recognizedover the contract period. At December 31, 2005, thedeferred income balance associated with thislicensing agreement is $10.0 million.
N O T E S T O T H E C O N S O L I D AT E DF I N A N C I A L S TAT E M E N T S( c o n t i n u e d )
Head
N.V
. and
Su
bsidiaries A
nn
ual R
epo
rt 200
5 B
ased o
n U
.S. G
AA
P
32
For the years ended December 31, 2003, 2004 and 2005 the accrual for restructuring cost developed asfollows (in thousands):
Employee Impairment Excess Other related Totaltermination rent restructuring restructuring
benefits program charges andcosts other related
restructuringprogram
Balance as of January 1, 2003 $ — $ — $ — $ — $ —Accrued 5,175 2,625 380 187 8,368Paid/incurred (755) (2,625) — (187) (3,567)Translation adjustment — — — — —
Balance as of December 31, 2003 4,420 0 380 0 4,800Accrued — — — 2,347 2,347Paid/incurred (4,502) — (380) (2,347) (7,228)Translation adjustment 82 — — — 82
Balance as of December 31, 2004 0 0 0 0 0Accrued 3,271 1,780 — 1,122 6,173Paid/incurred (1,665) (1,780) — (1,122) (4,567)Translation adjustment 3 — — — 3
Balance as of December 31, 2005 $ 1,609 $ 0 $ — $ 0 $ 4,81,609
As of December 31, 2005, restructuring costs and accruals for restructuring costs consist of the following (inthousands):
Impairment Employee Other related Totaltermination restructuring restructuring
benefits program charges andcosts other related
restructuringprogram
Kennelbach/Budweis closure $1,780 $1,025 $1,122 $ 3,927Ski binding reorganization — 691 — 691Italy reorganization — 1,555 — 1,555
Total restructuring costs $1,780 $3,271 $1,122 $6,173
Head
N.V
. and
Su
bsidiaries A
nn
ual R
epo
rt 200
5 B
ased o
n U
.S. G
AA
P
33
To the Board of Directors and Shareholdersof Head N.V. :
In our opinion, the accompanying consolidatedbalance sheets and the related consolidatedstatements of operations, of stockholders' equity andof cash flows present fairly, in all material respects,the financial position of Head N.V. and its subsidiariesat December 31, 2005 and 2004, and the results oftheir operations and their cash flows for each of thethree years in the period ended December 31, 2005,in conformity with generally accepted accountingprinciples in the United States of America. Thesefinancial statements are the responsibility of theCompany's management; our responsibility is toexpress an opinion on these financial statementsbased on our audits. We conducted our audits ofthese statements in accordance with the standards ofthe Public Company Accounting Oversight Board(United States). Those standards require that we planand perform the audit to obtain reasonable
assurance about whether the financial statementsare free of material misstatement. An audit includesexamining, on a test basis, evidence supporting theamounts and disclosures in the financial statements,assessing the accounting principles used andsignificant estimates made by management, andevaluating the overall financial statementpresentation. We believe that our audits provide areasonable basis for the opinion expressed above.
PwC Wirtschaftsprüfung AGVienna, AustriaFebruary 22, 2006
R E P O R T O F I N D E P E N D E N TR E G I S T E R E D P U B L I C A C C O U N T I N G F I R M
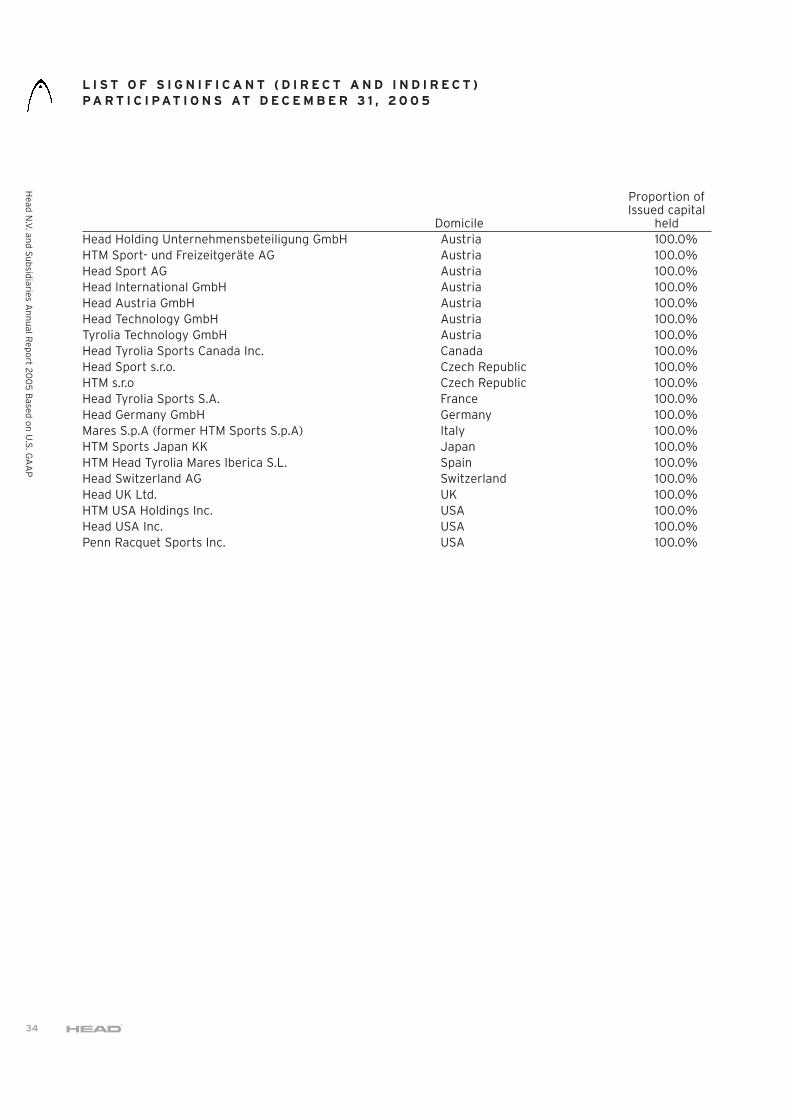
Proportion ofIssued capital
Domicile heldHead Holding Unternehmensbeteiligung GmbH Austria 100.0%HTM Sport- und Freizeitgeräte AG Austria 100.0%Head Sport AG Austria 100.0%Head International GmbH Austria 100.0%Head Austria GmbH Austria 100.0%Head Technology GmbH Austria 100.0%Tyrolia Technology GmbH Austria 100.0%Head Tyrolia Sports Canada Inc. Canada 100.0%Head Sport s.r.o. Czech Republic 100.0%HTM s.r.o Czech Republic 100.0%Head Tyrolia Sports S.A. France 100.0%Head Germany GmbH Germany 100.0%Mares S.p.A (former HTM Sports S.p.A) Italy 100.0%HTM Sports Japan KK Japan 100.0%HTM Head Tyrolia Mares Iberica S.L. Spain 100.0%Head Switzerland AG Switzerland 100.0%Head UK Ltd. UK 100.0%HTM USA Holdings Inc. USA 100.0%Head USA Inc. USA 100.0%Penn Racquet Sports Inc. USA 100.0%
Head
N.V
. and
Su
bsidiaries A
nn
ual R
epo
rt 200
5 B
ased o
n U
.S. G
AA
P
34
L I S T O F S I G N I F I C A N T ( D I R E C T A N D I N D I R E C T )PA R T I C I PAT I O N S AT D E C E M B E R 3 1 , 2 0 0 5
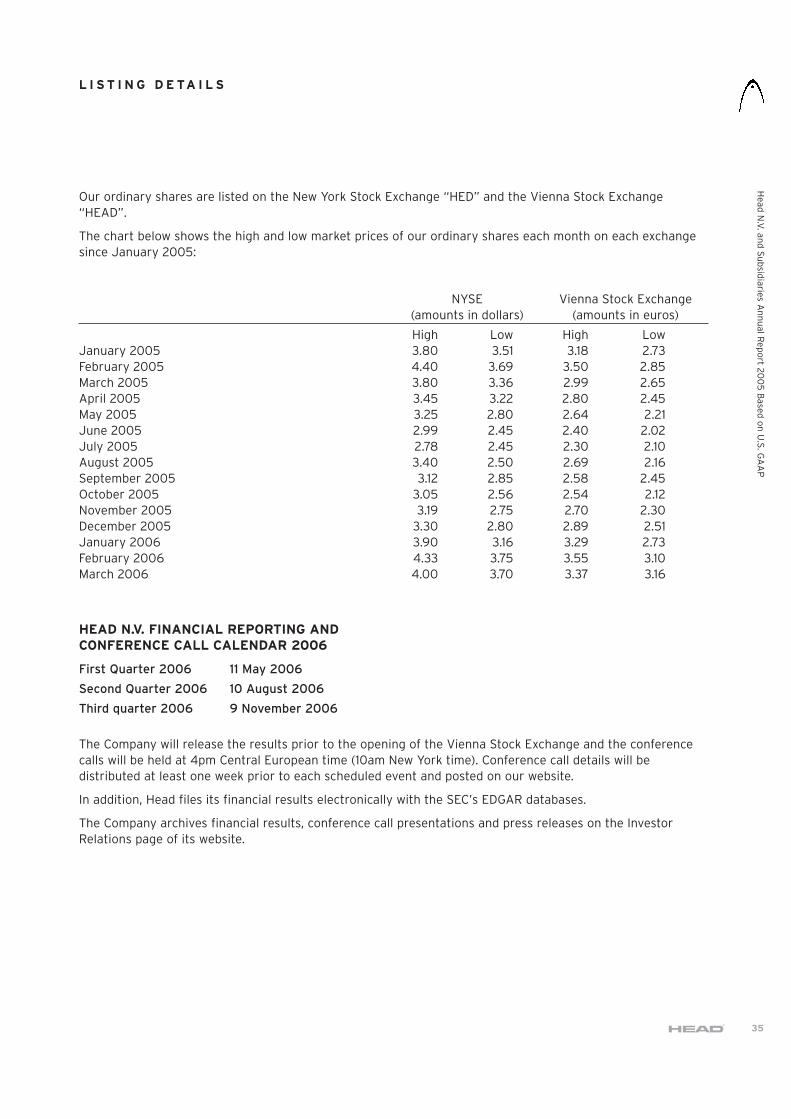
Our ordinary shares are listed on the New York Stock Exchange “HED” and the Vienna Stock Exchange“HEAD”.
The chart below shows the high and low market prices of our ordinary shares each month on each exchangesince January 2005:
NYSE Vienna Stock Exchange(amounts in dollars) (amounts in euros)
High Low High LowJanuary 2005 3.80 3.51 3.18 2.73February 2005 4.40 3.69 3.50 2.85March 2005 3.80 3.36 2.99 2.65April 2005 3.45 3.22 2.80 2.45May 2005 3.25 2.80 2.64 2.21June 2005 2.99 2.45 2.40 2.02July 2005 2.78 2.45 2.30 2.10August 2005 3.40 2.50 2.69 2.16September 2005 3.12 2.85 2.58 2.45October 2005 3.05 2.56 2.54 2.12November 2005 3.19 2.75 2.70 2.30December 2005 3.30 2.80 2.89 2.51January 2006 3.90 3.16 3.29 2.73February 2006 4.33 3.75 3.55 3.10March 2006 4.00 3.70 3.37 3.16
HEAD N.V. FINANCIAL REPORTING ANDCONFERENCE CALL CALENDAR 2006
First Quarter 2006 11 May 2006
Second Quarter 2006 10 August 2006
Third quarter 2006 9 November 2006
The Company will release the results prior to the opening of the Vienna Stock Exchange and the conferencecalls will be held at 4pm Central European time (10am New York time). Conference call details will bedistributed at least one week prior to each scheduled event and posted on our website.
In addition, Head files its financial results electronically with the SEC’s EDGAR databases.
The Company archives financial results, conference call presentations and press releases on the InvestorRelations page of its website.
Head
N.V
. and
Su
bsidiaries A
nn
ual R
epo
rt 200
5 B
ased o
n U
.S. G
AA
P
35
L I S T I N G D E TA I L S
Head
N.V
. and
Su
bsidiaries A
nn
ual R
epo
rt 200
5 B
ased o
n U
.S. G
AA
P
36
PRINCIPAL OFFICERokin 551012KK AmsterdamThe NetherlandsTel: (31) 20 625 1291Fax: (31) 20 625 0956
For additional information please visit our website atwww.head.com
ANNUAL MEETINGThe Annual General Meeting of shareholders of theCompany will be held on Wednesday 24 May, 2006 at13.00 hours local time at the Sheraton AmsterdamAirport Hotel, Schiphol Boulevard 101, 1118 BGAmsterdam, The Netherlands. The statutory accountsof the Company based on Dutch GAAP are availableat the principal office of the Company.
CORPORATE GOVERNANCEAt our annual general meeting in 2004 we asked ourshareholders to approve Head NV’s adoption of theNYSE and SEC rules of corporate governance, andnot just specifically the rules of the Duch corporategovernance code. Our shareholders approved such aproposal and we therefore comply with the NYSEcorporate governance rules applicable to controlledcompanies. We believe that by complying with theNYSE and SEC rules and our current internal Code ofConduct (setting out general standards for ethicalbehaviour) we should also meet many of therecommendations of the Austrian Code of CorporateGovernance. Both our Corporate GovernanceGuidelines, and current internal Code of Conduct areavailable to download from the Investor Relationssection of our website.
INVESTOR ENQUIRIESAnalysts, investors, media and others seekingfinancial and general information, please contact:
Vicki BoothTel: (44) 20 7499 7800Fax: (44) 20 7491 7725E-mail: [email protected]
20-F STATEMENTAnyone wishing to obtain a copy of the Company’sfull annual report (20-F) for the year ended 31December 2005 may do so on request from theInvestor Relations department or alternatively thedocument is available for download from the InvestorRelations section of our website.
SPECIAL NOTE REGARDING FORWARD-LOOKINGSTATEMENTS
This report contains forward-looking statements thatare based on the beliefs of our management, as wellas assumptions made by, and information currentlyavailable to, our management. The words“anticipates”, “believes”, “estimates”, “expects”,“plans”, “intends” and similar expressions areintended to identify these forward-looking statements,but are not the exclusive means of identifying them.These forward-looking statements reflect the currentviews of our management and are subject to variousrisks, uncertainties and contingencies which couldcause our actual results, performance orachievements to differ materially from thoseexpressed in, or implied by, these statements. Theserisks, uncertainties and contingencies include, but arenot limited to, the following:
● competitive pressures and trends in thesporting goods industry;
● our ability to introduce new and innovativeproducts;
● cyclicality and economic condition of andanticipated trends in the industries wecurrently serve;
● our ability to acquire and integratebusinesses;
● our ability to fund our future capital needs;and
● general economic conditions.
Actual results and events could differ materially fromthose contemplated by these forward-lookingstatements as a result of factors (“cautionarystatements”) such as those described above. In lightof these risks and uncertainties, there can be noassurance that the results and events contemplatedby the forward-looking statements contained in thisreport will in fact transpire. You are cautioned not toplace undue reliance on these forward-lookingstatements. We do not undertake any obligation toupdate or revise any forward-looking statements. Allsubsequent written or oral forward-lookingstatements attributable to us or persons acting onour behalf are expressly qualified in their entirety bythe cautionary statements.
S H A R E H O L D E R I N F O R M AT I O N
SUPERVISORY BOARDThe Supervisory Board is responsible for overseeing our Management Board and the general course of affairsof our business. Our Supervisory Board currently has three members, whose names and details are set forthbelow.
Name Age Title
William S. Cohen 65 Member of the Supervisory BoardViktor Klima 58 Member of the Supervisory BoardJurgen Hintz 64 Member of the Supervisory Board
MANAGEMENT BOARD AND EXECUTIVE OFFICERSOur amended articles of association provide for a Management Board (the “MB”) that is charged with ourmanagement under the general supervision of the Supervisory Board. Our Management Board currently hasfour members, whose names and details are set forth below along with those of our Executive Officers.
The day-to-day running of the Company is overseen by our Executive Committee (the “EC”), which reports tothe Management and Supervisory Boards. The names and details of the Executive Committee and other keyexecutive officers are also set forth below.
Name Age Title
Johan Eliasch 44 Chairman of MB, Chief Executive Officer and Chairman of ECRalf Bernhart 54 Member of MB, Chief Financial Officer and Member of ECGeorge F. Nicolai 53 Member of MBRobert van de Voort 50 Member of MBKlaus Hotter 50 Executive Vice President, Winter Sports Division (Managing
Director Head Sport AG) and Member of ECGeorg Kröll 57 Executive Vice President, Licensing Division (Managing Director
Head Sport AG) and Member of ECRobert Marte 52 Executive Vice President, Racquet Sports Division (Managing
Director Head Sport AG) and Member of ECEdgar Pöllmann 61 Executive Vice President, Operations (Managing Director of HTM
Sport- und Freizeitgeräte AG) and Member of ECGerald Skrobanek 40 Executive Vice President, Diving Division (Managing Director of
Head Sport AG and Mares S.p.A) and Member of ECGunter Hagspiel 42 Executive Vice President, Finance & Controlling (Managing Director
of Head Sport AG) and Member of ECJacques Altimani 59 Vice President, European Distribution (Managing Director of Head
International GmbH)Dave Haggerty 48 President, Penn Racquet Sports Inc. and Head USA Inc.Kevin Kempin 47 Vice President, Sales/Marketing Racquet Sports U.S. and Penn
Worldwide
Head
N.V
. and
Su
bsidiaries A
nn
ual R
epo
rt 200
5 B
ased o
n U
.S. G
AA
P
37
C O R P O R AT E D I R E C T O R Y
ROKIN 551012 KK AMSTERDAM
THE NETHERLANDS
TELEPHONE +31 20 625 1291FAX +31 20 625 0956