2006 annual report technical briefing
TRANSCRIPT

1
2006 Annual ReportTechnical Briefing
April 30, 2007

2
Introduction
• CIC:– is the holding company for the Crown sector.– Crowns are accountable to the CIC Board.
• Two sets of financial statements:– Consolidated:
• Use generally accepted accounting principles (GAAP); and,• Crown sector viewed as a single company.
– Non-consolidated:• Special purpose statements;• Prepared at the direction of the Legislature; and,• Primarily reflects the cash inflows (e.g., dividends from Crown
corporations) and outflows of the holding company.• Results of all subsidiary Crowns have been tabled.

3
CIC Crown Sector
SaskatchewanDevelopment
Fund

4
Significant Accounting Estimates
• Discontinued Operations– Discontinued operations refers to operations that are held for sale in the
current operating period and are expected to be disposed of in the following year.
– Centennial Foods Partnership, Hypor, MLPLP and HARO were classified as discontinued.
• Provision for Unpaid Insurance Claims• Environmental Remediation Liabilities• Deferred Pension Costs• Goodwill• Income Taxes
– Certain investments are taxable, the most significant being NewGrade.– During the year, CIC recorded $48.1 million in current and future taxes.

5
Public Policy Initiatives
• Saskatchewan Energy Share• CIC Economic Holdco Ltd. (Saskatchewan Entrepreneurial Fund
Joint Venture)• First Nations and Métis Fund Inc.• Gradworks Inc.• STC routes• STC head office and bus terminal capital expenditure

6
2006 Utility Bundle Cost Rankings
235.643,453.95Manitoba
1-3,418.31Saskatchewan
4734.534,152.84Quebec
103,181.046,599.35Ontario
82,306.875,725.18Nova Scotia
61,907.195,325.50New Brunswick
RankVariance to SKTotal Bundle CostProvince
3$ 575.86$ 3,994.17British Columbia
51,060.774,479.08Alberta
92,556.555,974.86Newfoundland
72,112.045,530.35Prince Edward Island
• Saskatchewan had the lowest cost utility bundle in 2006.

7
Consolidated Financial Statements $ Millions
2006 Earnings 2006 CIC Dividends Budget Actual Budget Actual SaskPower 102.8 92.7 66.3 60.2 SaskTel 70.5 72.5 50.0 50.0 SaskEnergy 78.3 53.2 50.6 34.5 SGI 33.8 52.1 22.0 33.9 Investment Saskatchewan 38.5 72.9 N/A 59.1 Information Services Corporation 5.4 8.7 -- -- SaskWater (0.5) 0.3 -- -- STC (6.8) (5.7) -- -- SOCO 4.9 4.9 -- -- NewGrade 61.4 102.9 76.7 105.0 CIC, Other, Adjustments (71.5) (13.4) -- --
Consolidated Earnings 316.8 441.1 265.6 342.7

8
(200)
(100)
-
100
200
300
400
500
2002 2003 2004 2005 2006
$ M
illio
ns
Earnings from OngoingOperationsOther Items
SaskPower
SaskTel
SaskEnergy
SGI
Other Crowns
Net Earnings
Consolidated Earnings
• Analysis of earnings:– Continued strong earnings from
core operations;– NewGrade had significant impact
on 2006 performance; and,– Fluctuations in net earnings related
to non-operating items.
• Other factors affecting earnings:– Gains on discontinued operations of
$44.7M;– Current and future income tax
expense of $48.1M; and,– Non-recurring items of $19M.

9
Consolidated Debt
49.9%*51.7%*50.7%*51.0%*53.3%*
0.0
1.0
2.0
3.0
4.0
5.0
6.0
7.0
8.0
9.0
10.0
2002 2003 2004 2005 2006
$ Bi
llion
s
Consolidated Debt Consolidated Assets Consolidated Debt Ratio*• Debt to equity ratio decreased to 50% from 52%.• Debt ratio has remained relatively constant over prior five years.• Debt ratio is calculated as (total debt) ÷ (total debt + equity).

10
Non-Consolidated Financial Results• These statements:
– isolate the holding company’s cash flow, subsidy support for certain Crowns, and public policy expenditures; and,
– determine dividend capacity to the GRF. $ M i l l i o n s 2 0 0 6 E a r n in g s
B u d g e t A c t u a l
D iv id e n d ( % o f
e a r n in g s ) D iv id e n d s t o C I C
S a s k P o w e r 6 6 .3 6 0 .2 6 5 %S a s k T e l 5 0 .0 5 0 .0 6 9 %
S a s k E n e r g y 5 0 .6 3 4 .5 6 5 %S G I 2 2 .0 3 3 .9 6 5 %
In v e s tm e n t S a s k a t c h e w a n 1 - 5 9 .1 8 1 %N e w G r a d e 7 6 .7 1 0 5 .0 1 0 2 %
T o t a l D iv id e n d R e v e n u e 2 6 5 .6 3 4 2 .7
G r a n t F u n d in g ( 2 0 .4 ) ( 1 0 .1 ) P u b l ic P o l ic y E x p e n d i t u r e ( 6 3 .6 ) ( 4 .1 )
O th e r In c o m e & E x p e n s e s ( 3 3 .7 ) ( 6 .2 ) N o n -C o n s o l id a t e d
E a r n in g s1 4 7 .9 3 2 2 .3
D iv id e n d t o t h e G R F 1 6 0 .0 1 6 7 .0 1 D u r in g th e 2 0 0 6 b u d g e t c y c le , I n v e s tm e n t S a s k a tc h e w a n r e v ie w e d i t s b u d g e t d iv id e n d ta r g e t s .
11
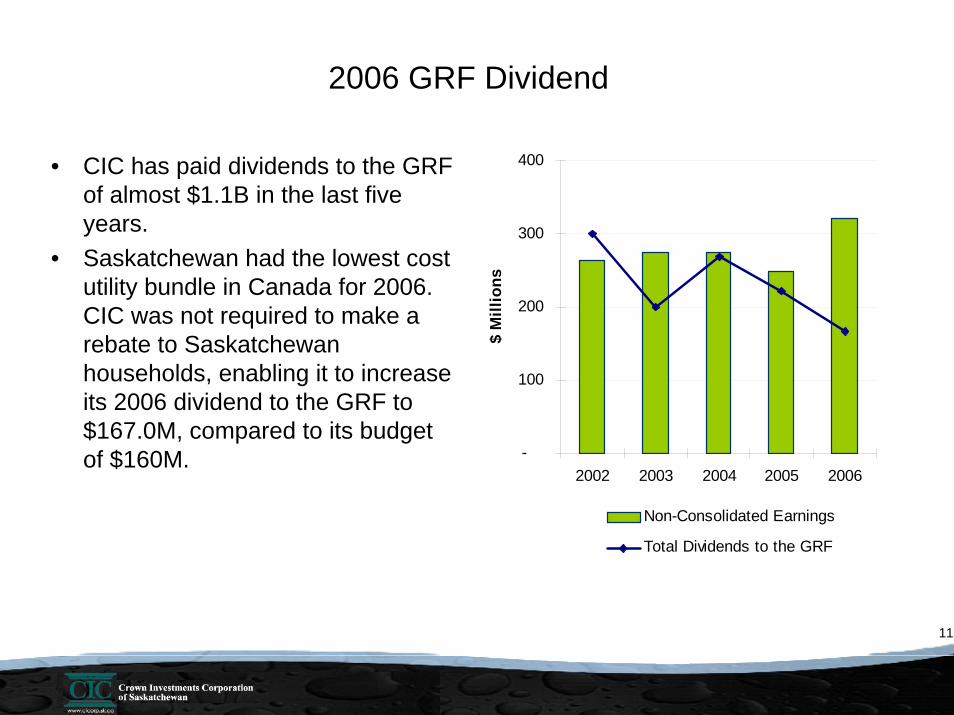
2006 GRF Dividend
-
100
200
300
400
2002 2003 2004 2005 2006$
Mill
ions
Non-Consolidated Earnings
Total Dividends to the GRF
• CIC has paid dividends to the GRF of almost $1.1B in the last five years.
• Saskatchewan had the lowest cost utility bundle in Canada for 2006. CIC was not required to make a rebate to Saskatchewan households, enabling it to increase its 2006 dividend to the GRF to $167.0M, compared to its budget of $160M.

12
Capital Allocation Framework
ReinvestmentSustain existing infrastructureGrowthDiversification
Debt Reduction(if necessary)
CrownCrownCorporationCorporation
CICCIC
Debt ReductionConsistent with capital structure (e.g. debt ratio) target
Cash Earnings
Dividends

13
Capital Structure: Industry Comparisons
N/A1.47Industry Forecast
65.0%1.9SGI – Net Risk Ratio56.6%63.3%Industry Average6
65.0%63.4%SaskEnergy52.0%43.5%Industry Average5
69.0%430.5%SaskTel
59.5%53.1%Integrated/Investor Owned/No Guarantee2
40.8%377.6%Integrated Gov’t owned and Guaranteed2
65.0%61.0%SaskPowerDividend Rate1Debt Ratio
1. Dividend payout rates in the private sector are not directly comparable to those in the CIC subsidiary Crown corporation sector.Private sector companies pay dividends out of after tax net earnings whereas the CIC Crowns are exempt from income tax and therefore pay dividends out of total net earnings.
2. Based on 2004 information. 3. Calculated as an after tax equivalent.4. Based on a flat $50.0 million dividend payment.5. Based on 2006 information.6. Substantially based on 2006 information, with 2005 and 2004 also included.7. Based on 2005 information.

14
Dividend History
• Target capital structures are based on industry factors and may change over time.
1. SGI does not have debt. Its capital structure is measured by Net Risk Ratio. A lower number indicates stronger financial health.
90% 81%N/A0%13%11%N/AN/AInvestment SK
65%1.9%65%2.065%2.765%2.70%2.8%SGI
65%63%65%65%65%68%65%72%65%73%SaskEnergy
69%30%90%28%90%26%90%33%90%38%SaskTel
65%61%65%61%90%58%90%57%65%60%SaskPower
Dividend Rate
Debt Ratio
Dividend Rate
Debt Ratio
Dividend Rate
Debt Ratio
Dividend Rate
Debt Ratio
Dividend Rate
Debt Ratio
20062005200420032002
Crown is at target capital structureCrown is not at target capital structure
1

15
Summary
• Strong Crown sector earnings result in higher than budgeted dividends to the GRF.
• Saskatchewan had the lowest cost utility bundle in Canada.• Debt continues to be maintained at a prudent level.
Outlook for 2007
• Consolidated earnings budget of $344.3M.• Dividend to the GRF of $200M targeted for 2007.• Capital spending in the Crown sector projected to increase in the
medium to longer term.

16
Significant Accounting 2007 Changes
• Accounting Changes• Capital Disclosures• Comprehensive Income• Financial Instruments – recognition and measurement• Financial Instruments – disclosures• Financial Instruments – presentation• Business Combinations

17
Questions?