2007 census of agriculture farm and ranch irrigation survey (2008
TRANSCRIPT

Farm and Ranch Irrigation Survey (2008) Volume 3 • Special Studies • Part 1
AC-07-SS-1 Issued November 2009 Updated February 2010Updated July 2010 United States Department of Agriculture Tom Vilsack, Secretary National Agricultural Statistics Service Cynthia Z.F. Clark, Administrator


2007 CENSUS OF AGRICULTURE CONTENTS III USDA, National Agricultural Statistics Service
Contents
Page
Introduction ....................................................................................................................................... V MAPS Water Resources Regions of the United States ................................................................................. 1 Percent of Normal Precipitation, January – December 2008............................................................. 2 TABLES Chapter 1 – General Data Tables 1. Irrigated Farms in the Censuses of Agriculture: 2007 and Earlier Censuses ........................... 3 2. Irrigated Farms by Acres Irrigated: 2008 and 2003 .................................................................. 4 3. Land Use on Farms with Irrigation: 2008 and 2003 ................................................................. 6 4. Land Irrigated by Method of Water Distribution: 2008 and 2003 ........................................... 8 5. Land Irrigated by Sprinkler Systems: 2008 and 2003 .............................................................. 9 6. Land Irrigated by Drip, Trickle, or Low-Flow Micro Sprinklers: 2008 and 2003 ................... 12 7. Land Irrigated with Gravity Irrigation by Field Water Delivery System: 2008 and 2003 ....... 13 8. Estimated Quantity of Water Applied Using Only One Method of Distribution: 2008 and 2003 ..................................................................................................... 17 9. Estimated Quantity of Water Applied Using Only Sprinkler Systems to Distribute Water: 2008 and 2003 .............................................................................................................. 19 10. Estimated Quantity of Water Applied Using Only Gravity Flow Systems to Distribute Water: 2008 and 2003 .............................................................................................. 23 11. Estimated Quantity of Water Applied By Source or Supplier: 2008 and 2003 ........................ 25 12. Irrigation by Estimated Quantity of Water Applied: 2008 and 2003 ....................................... 29 13. Water Transfers by Use and Source: 2008 and 2003 ............................................................... 31 14. Irrigation Wells on Farms: 2008 and 2003 ............................................................................... 32 15. Irrigation Wells Used on Farms: 2008 and 2003 ...................................................................... 34 16. Characteristics for Irrigation Wells Used on Farms: 2008 and 2003 ....................................... 36 17. Irrigation Pumps on Farms: 2008 and 2003 ............................................................................. 39 18. Irrigation Pumps on Farms for Wells: 2008 and 2003 ............................................................. 40 19. Irrigation Pumps on Farms Other Than for Wells: 2008 and 2003 .......................................... 42 20. Energy Expenses for On-Farm Pumping of Irrigation Water by Water Source and Type of Energy: 2008 and 2003 ................................................................................................ 46 21. Pumps On-Farm Powered by Solar and Other Renewable Energy Sources: 2008 and 2003 ..................................................................................................................................... 52 22. Expenses for Irrigation Water from Off-Farm Suppliers: 2008 and 2003 ............................... 53 23. Expenditures for Irrigation Equipment, Facilities, Land Improvement, and Computer Technology: 2008 and 2003 .................................................................................... 54 24. Expenses for Maintenance and Repairs of Irrigation Equipment and Facilities: 2008 and 2003 .......................................................................................................... 66

IV CONTENTS 2007 CENSUS OF AGRICULTURE USDA, National Agricultural Statistics Service
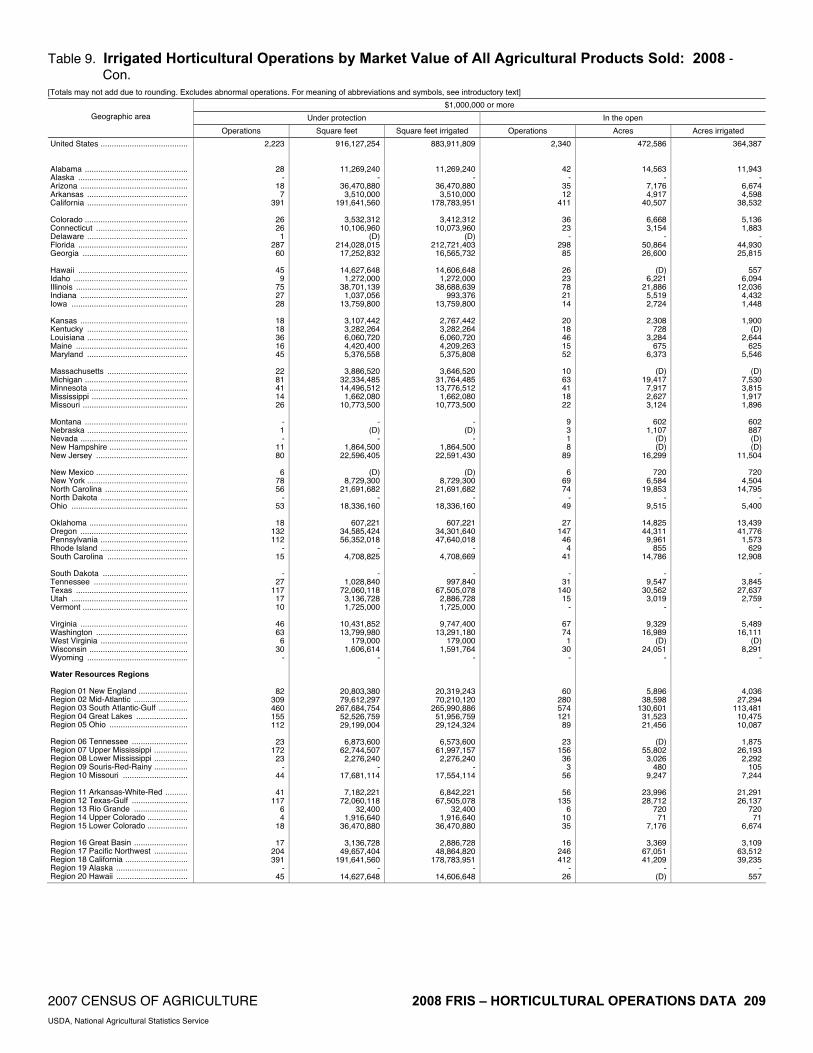
25. Expenses for Hired and Contract Irrigation Labor: 2008 and 2003 ........................................ 67 26. Farms With Diminished Crop Yields Resulting From Irrigation Interruption by Cause: 2008 and 2003 ........................................................................................................ 68 27. Crops Harvested From Irrigated Farms: 2008 and 2003 ......................................................... 70 28. Estimated Quantity of Water Applied and Primary Method of Distribution by Selected Crops Harvested: 2008 and 2003.............................................................................................. 91 29. Selected Crops Harvested by Chemigation and Water Source: 2008 and 2003 ...................... 116 30. Selected Crops Irrigated and Harvested by Primary Method of Water Distribution, United States: 2008.................................................................................................................. 140 31. Other Uses of Irrigation Water: 2008 and 2003 ....................................................................... 143 32. Irrigated Farms by Size of Farm: 2008 and 2003 .................................................................... 145 33. Irrigated Farms by North American Industrial Classification System: 2008 and 2003 .......... 148 34. Irrigated Farms by Market Value of Agricultural Products Sold: 2008 and 2003 .................. 150 35. Irrigated Farms by Percent of Total Sales from Irrigated Crops and Livestock: 2008 and 2003 ........................................................................................................ 158 36. Methods Used in Deciding When to Irrigate: 2008 and 2003 ................................................. 159 37. Water Management Practices Used by Operators with Gravity Systems: 2008 and 2003 ...... 160 38. Farms Using Recycled or Reclaimed Water: 2008 .................................................................. 163 39. Irrigators Participating in Government Programs: 2008 and 2003 .......................................... 164 40. Energy and Water Conservation Improvements: 2008 and 2003 ............................................ 166 41. Barriers to Making Improvements to Reduce Energy Use or Conserve Water: 2008 and 2003 ............................................................................................................. 169 42. Source of Irrigation Information Relied on to Reduce Irrigation Costs or to Conserve Water: 2008 and 2003 ........................................................................................ 173 43. Discontinuance of All Irrigation by Reason: 2008 and 2003 ................................................. 175 Chapter 2 – Horticultural Operations Data Tables 1. Irrigated Horticultural Operations: 2008 ................................................................................. 178 2. Irrigated Horticultural Operations by Selected Crops Irrigated: 2008 .................................... 179 3. Estimated Quantity of Water Applied to Crops Grown Under Protection on Irrigated Horticultural Operations by Method of Distribution and Water Source: 2008 ........................ 185 4. Estimated Quantity of Water Applied to Crops Grown in the Open on Irrigated Horticultural Operations by Method of Distribution and Water Source: 2008 ....................... 191 5. Recycled Water Use on Irrigated Horticultural Operations: 2008 .......................................... 197 6. Reclaimed Water Use and Cost of Purchased Reclaimed Water on Irrigated Horticultural Operations: 2008 ................................................................................................ 198 7. Other Uses of Irrigation Water on Horticultural Operations: 2008 ......................................... 199 8. Discontinuance of All Irrigation on Irrigated Horticultural Operations Since 2007 by Reason: 2008 ............................................................................................................. 200 9. Irrigated Horticultural Operations by Market Value of All Agricultural Products Sold: 2008 ................................................................................................................. 201 APPENDICES A. Statistical Methodology............................................................................................................. A-1 B. General Explanation and Report Forms .................................................................................... B-1 Publication Program...................................................................................................... Inside back cover

2007 CENSUS OF AGRICULTURE INTRODUCTION V USDA, National Agricultural Statistics Service
Introduction HISTORY Selected irrigation data for on-farm irrigation operations have been collected in the census of agriculture since 1890. A census of farms which reported irrigation in the 1900 Census of Agriculture was authorized by Congress. Surveys of irrigation in humid areas were taken in connection with the 1954 and 1959 censuses. The 2008 Farm and Ranch Irrigation Survey (FRIS) is the seventh survey devoted entirely to collecting on-farm irrigation data for the United States. For the first time, horticultural specialty operations with sales of $10,000 or greater were included in the survey. The 1979, 1984, 1988, and 1994 Farm and Ranch Irrigation Surveys were conducted by the U.S. Department of Commerce, Bureau of Census. Responsibility for the survey was transferred from the Bureau of Census to the U.S. Department of Agriculture (USDA), National Agricultural Statistics Service (NASS) in 1997. The 1998 survey utilized the resources of the 45 NASS field offices which expanded opportunities for telephone follow-up or personal enumeration of nonresponse cases. The 1998 Farm and Ranch Irrigation Survey was the first survey to collect and publish data for each of the 50 States. Previous farm and ranch irrigation surveys published data only for leading irrigation States, with a U.S. total, excluding Alaska and Hawaii. USES OF SURVEY DATA The 2008 Farm and Ranch Irrigation Survey provides data that supplement the basic irrigation data collected from all farm and ranch operators in the 2007 Census of Agriculture. Irrigation data from this survey combined with 2007 census data provide one of the most complete and detailed profiles of irrigation in the United States. Survey data are used by producers, farm
organizations, businesses, State departments of agriculture, elected representatives and legislative bodies at all levels of government, public and private sector analysts, the news media, and colleges and universities. The data are used to: • Compare water use by application method; • Develop improved technologies; • Develop Federal programs; • Appraise water use trends; • Assess impact of congressional legislation; and • Evaluate the impact of irrigated crops by State. AUTHORITY The census of agriculture is required by law under the “Census of Agriculture Act of 1997," Public Law 105-113 (Title 7, United States Code, Section 2204g). The law authorizes the Secretary of Agriculture to conduct surveys deemed necessary to furnish annual or other data on the subjects covered by the census. The 2008 Farm and Ranch Irrigation Survey was conducted under the provisions of this section. FARM DEFINITION A farm is any place from which $1,000 or more of agricultural products were produced and sold, or normally would have been sold, during the census or survey year. DATA COMPARABILITY State level general FRIS data are not comparable between the 2008 and 2003 surveys. In the 2003 survey, the data included operations that reported horticultural production with sales less than $10,000 during the previous census year. In 2008 data for these operations are included with data for horticultural specialty operations that reported $10,000 or more of horticulture sales in the previous

VI INTRODUCTION 2007 CENSUS OF AGRICULTURE USDA, National Agricultural Statistics Service
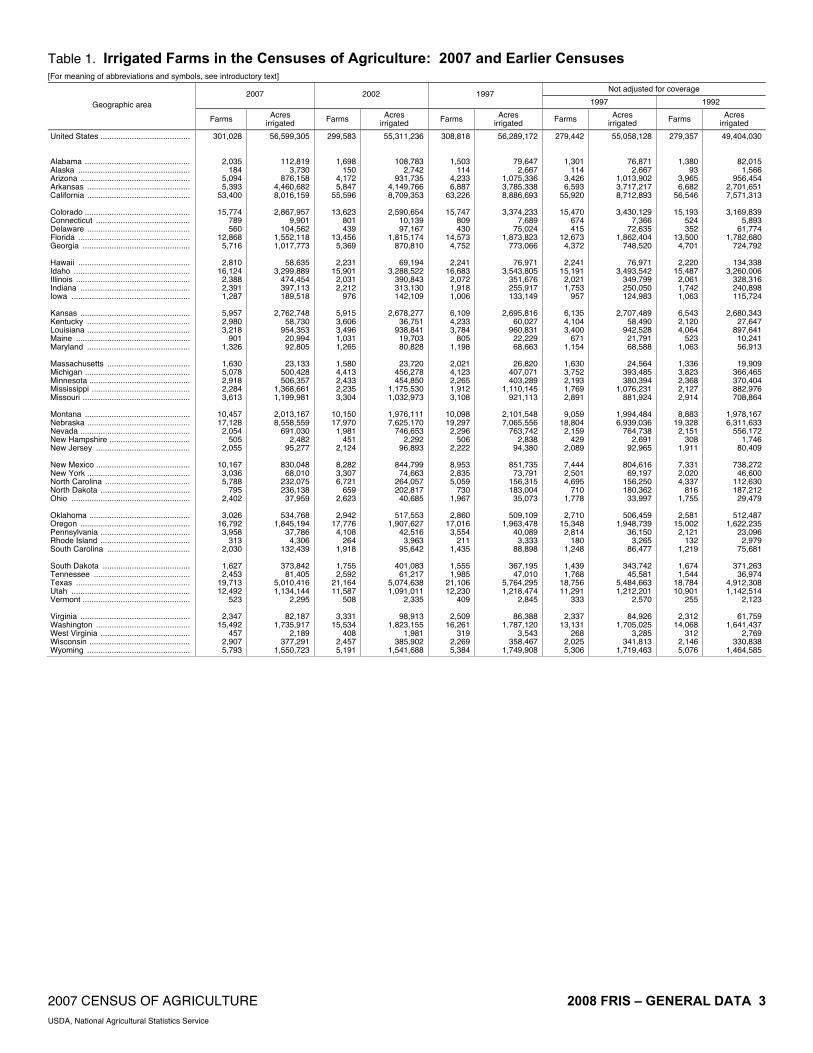
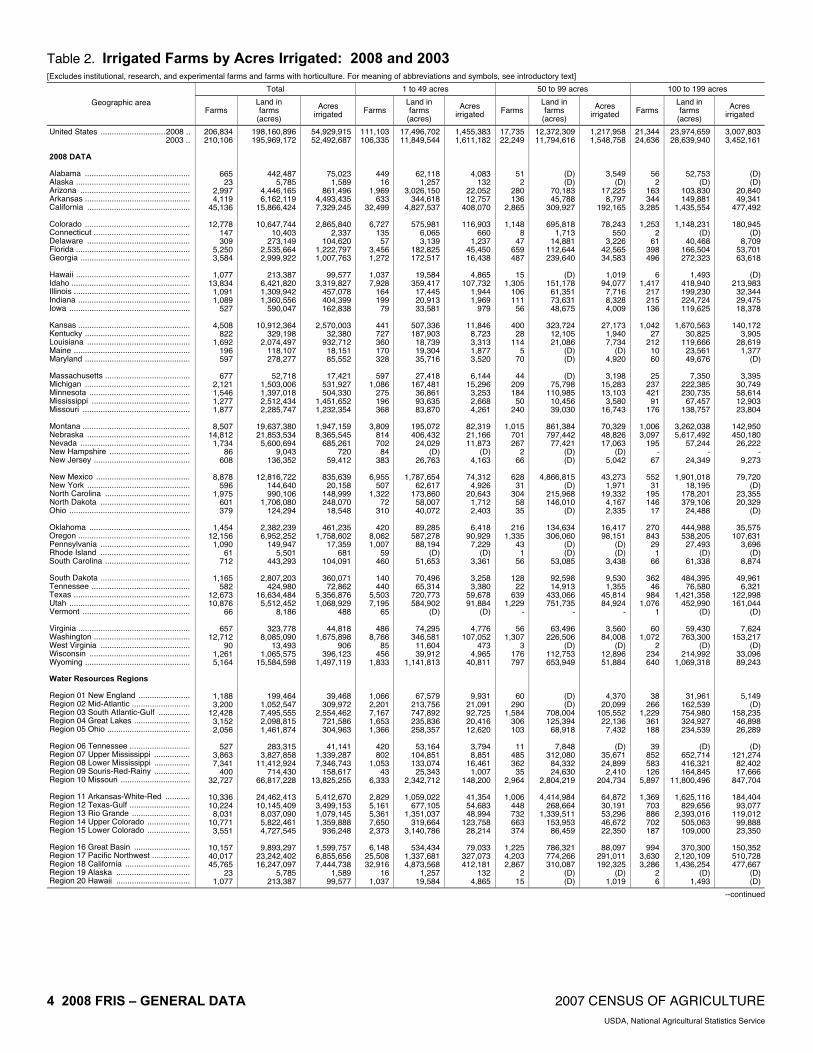
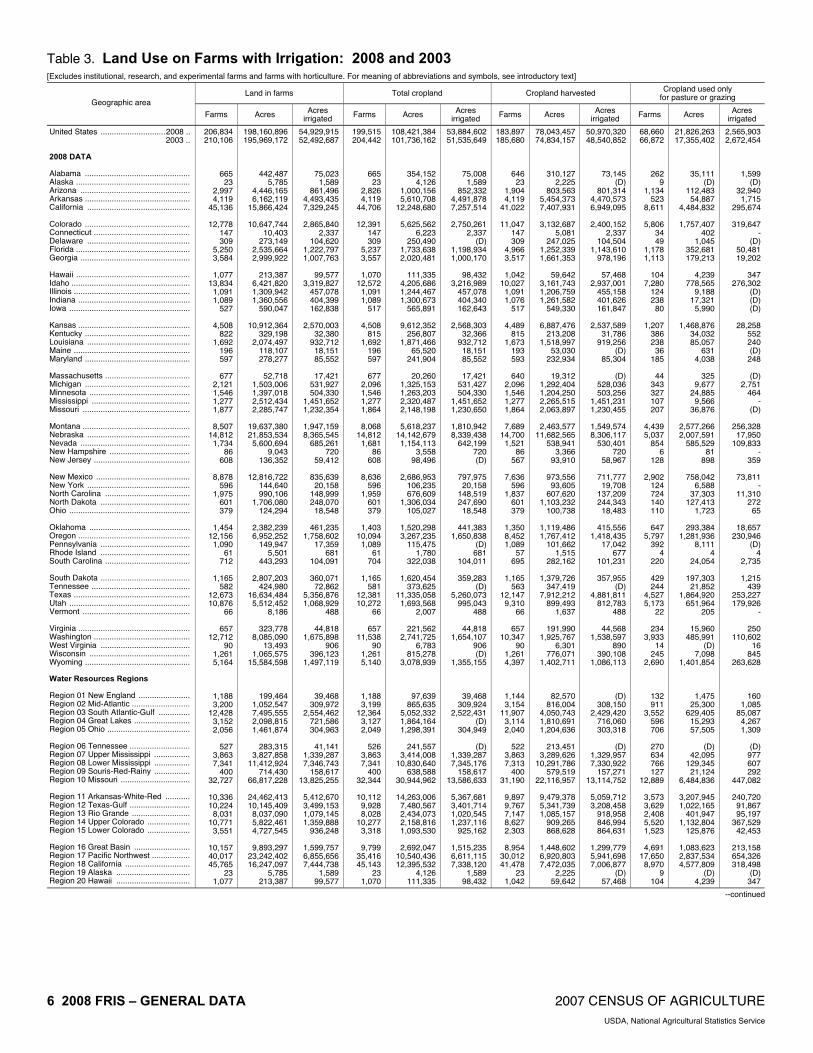
census year in a separate set of data tables. To provide a measure of comparability, the published 2003 U.S. level data were adjusted. Data for operations that reported horticultural production with sales less than $10,000 were removed. See Appendix A, Statistical Methodology for a detailed discussion of data comparability. WATER RESOURCES REGIONS MAP The map on page 1 shows Water Resources Regions delineated to approximate actual basin boundaries based on topographic drainage characteristics. Data are tabulated separately for each of the 20 Water Resources Regions shown on the map. PERCENT OF NORMAL PRECIPITATION MAP The map on page 2 shows the areas of the United States with deviations from normal precipitation during 2008. The map is included for reference purposes only. TABLES AND APPENDICES Chapter 1, General Data. Table 1 shows farms and acres irrigated for the 1992 through 2007 Censuses of Agriculture for each State. Tables 2 through 42 present detailed irrigation data collected in the farm and ranch irrigation survey from operations that reported irrigated land in the 2007 census and also in the 2008 survey. Excluded from these data are institutional, research, and experimental operations and all operations reporting horticultural sales in the previous census year. Table 43 presents data for farm operations that irrigated in 2007 but discontinued irrigation either temporarily or permanently in 2008 while continuing to operate a farm or ranch. Comparable adjusted 2003 U.S. level survey data are also presented. Data are reported at the national level, for each State, and for the 20 Water Resources Regions. Chapter 2, Horticultural Operations Data. Tables 1 through 9 present detailed 2008 irrigation data
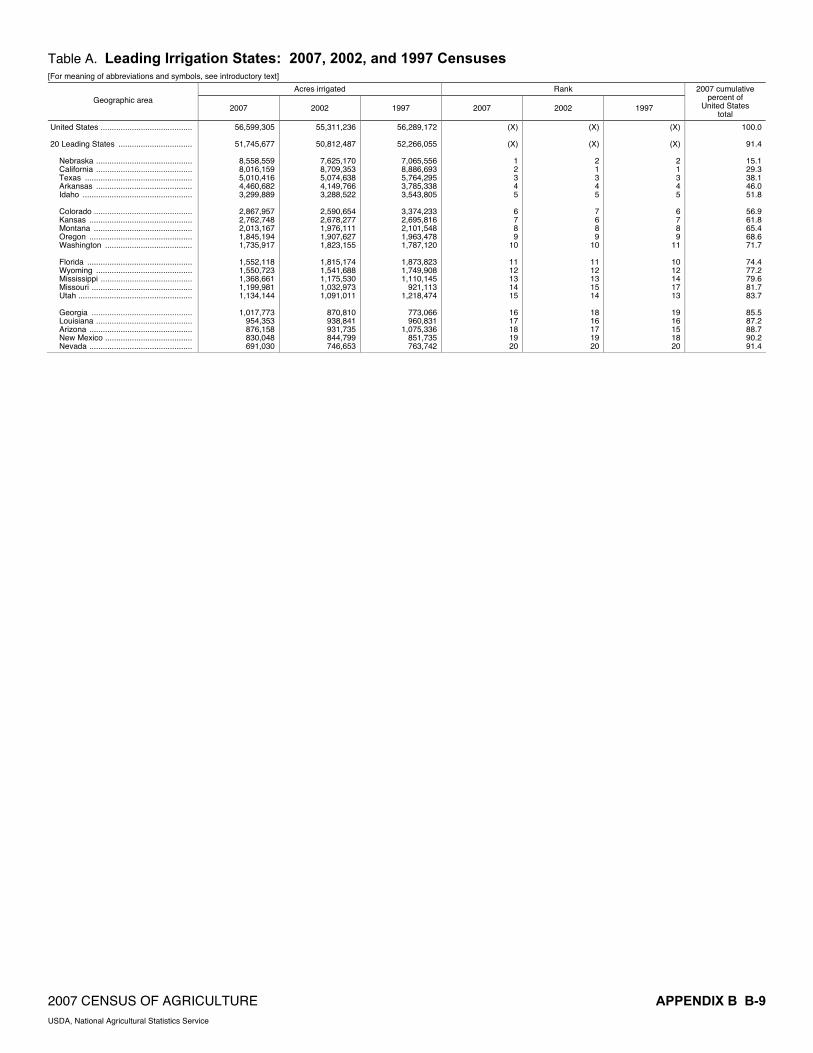
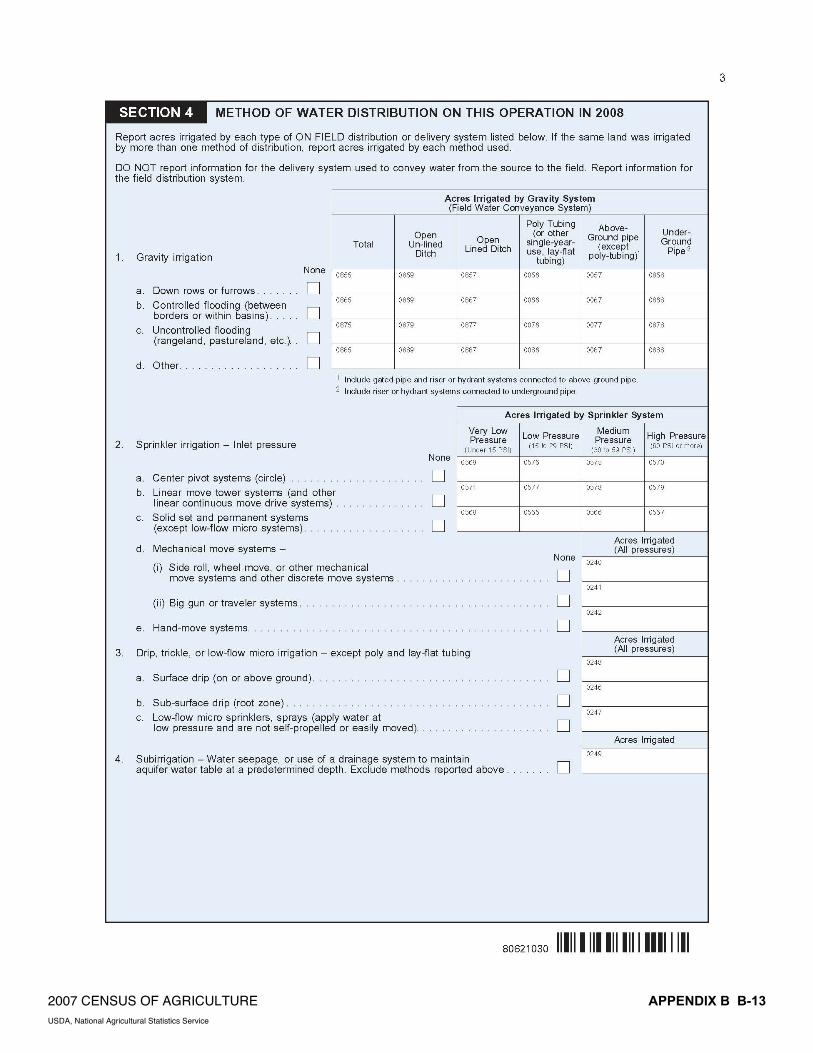
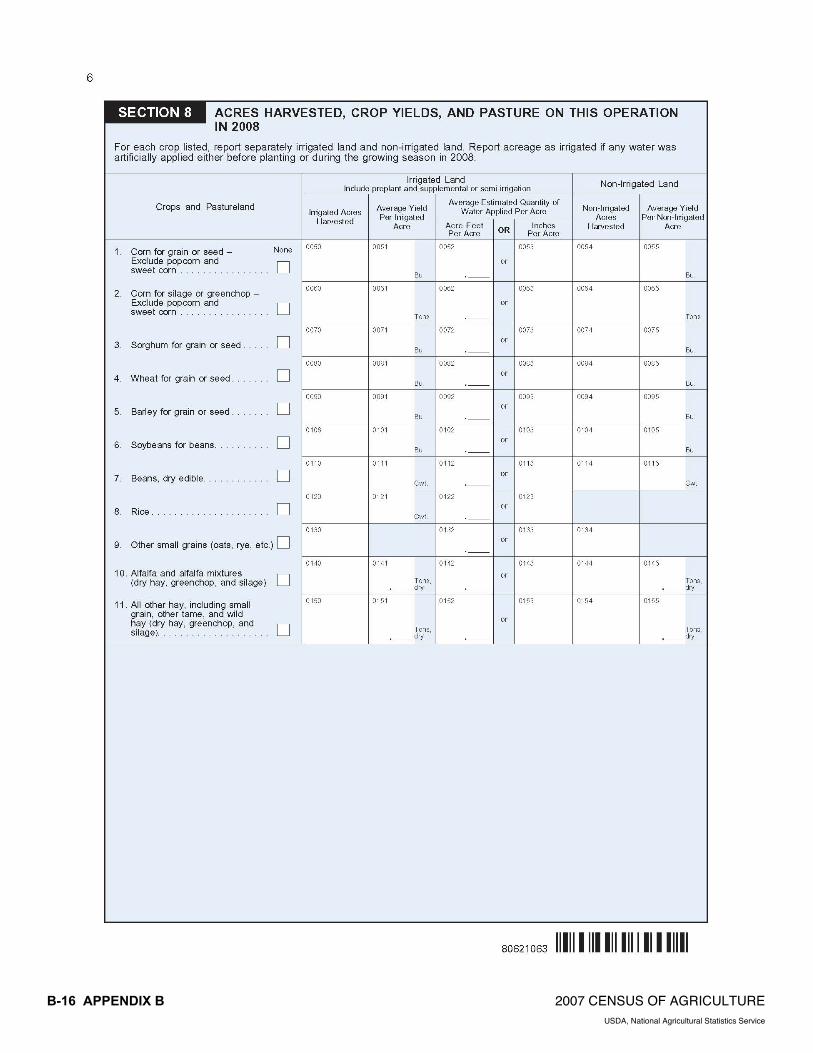
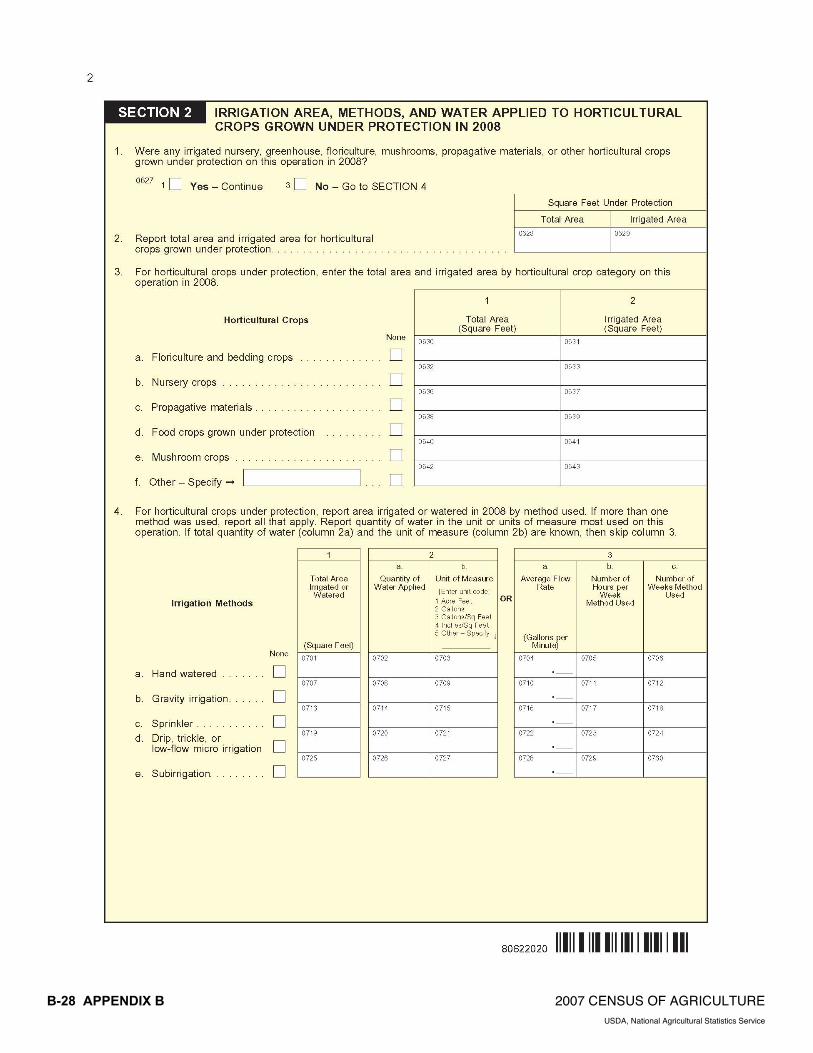
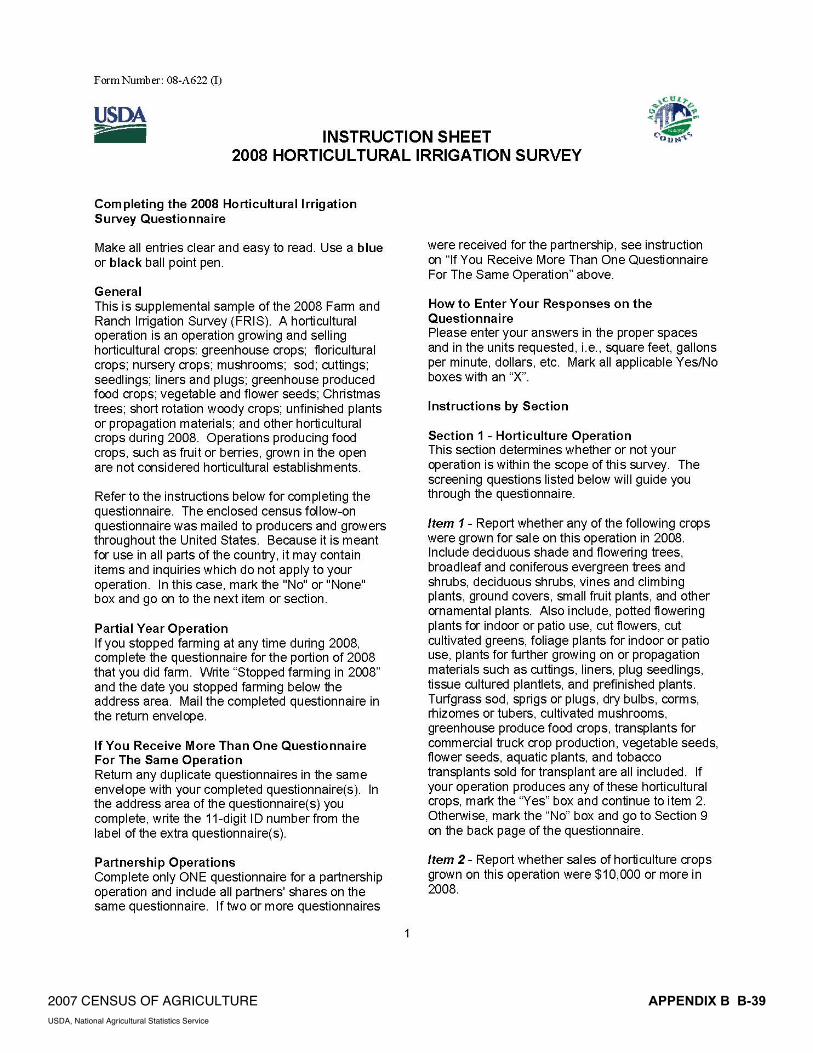
collected on the horticulture version of the irrigation survey. Data are from horticultural operations that reported irrigating in the 2007 census and also in the 2008 survey. Data are reported at the national level and for each State. Appendix A. Provides information about data collection and data processing activities and discusses the statistical methodology used in conducting and evaluating the survey. Table A provides the general 2008 FRIS sample counts and the sample’s corresponding 2007 census irrigated acreage. It also provides the general 2008 FRIS unexpanded and expanded acres irrigated and 2007 census acres irrigated. Table B provides a comparison of the irrigated acres published in the 2007 Census of Agriculture and expanded 2008 FRIS acres irrigated by size group. Table C provides the standard error for selected data in the 2008 general FRIS sample. Table D provides the standard error for selected data in the 2008 horticultural operations sample. Appendix B. Provides information about the development of the report forms and definitions of specific terms and phrases used in this publication, including items in the publication tables that carry the note “see text.” It also provides facsimiles of the report forms and instruction sheets used to collect general FRIS data. Table A provides irrigated acreage and rank for the previous three censuses. Table B combines the quantity of water applied published in Chapter 1, general FRIS, and the quantity of water applied for horticultural operations data, Chapter 2. RESPONDENT CONFIDENTIALITY In keeping with the provisions of Title 7 of the United States Code, no data are published that would disclose information about the operations of an individual farm or ranch. All tabulated data are subjected to an extensive disclosure review prior to publication. Any tabulated item that identifies data reported by a respondent or allows a respondent’s data to be accurately estimated or derived, was suppressed and coded with a ‘D’. However, the number of farms reporting an item is not considered confidential information and is provided even though other information is withheld.
2007 CENSUS OF AGRICULTURE INTRODUCTION VII USDA, National Agricultural Statistics Service
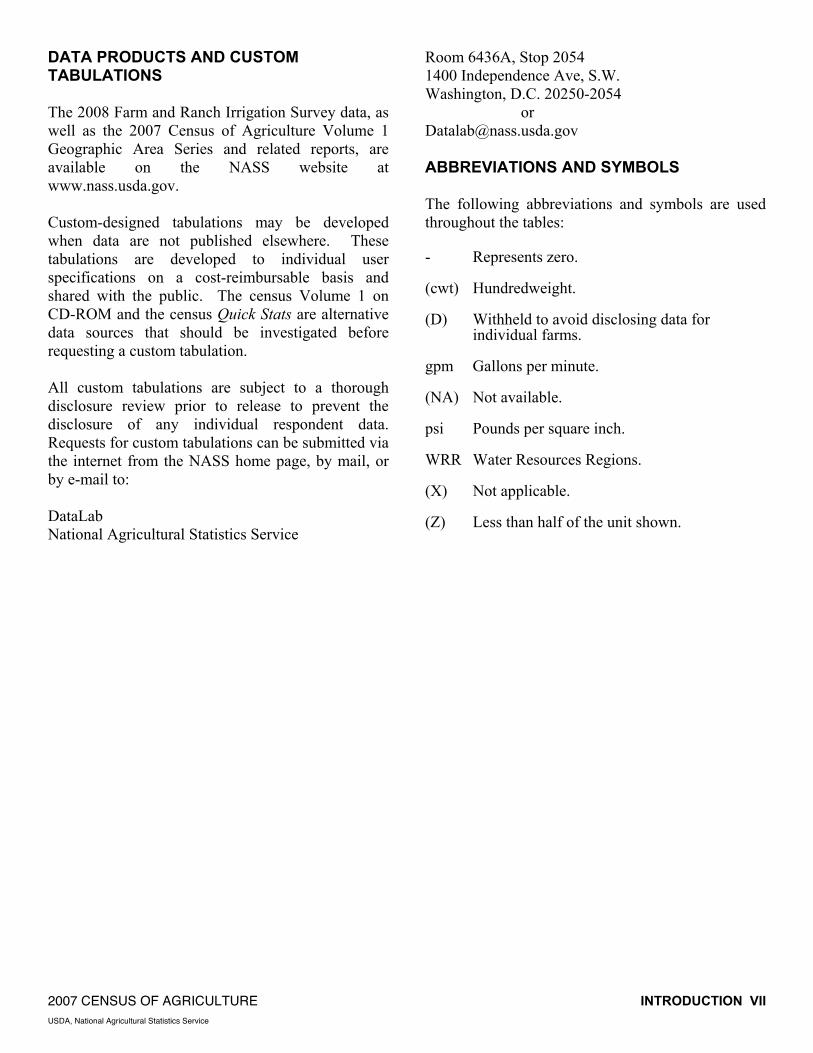
DATA PRODUCTS AND CUSTOM TABULATIONS The 2008 Farm and Ranch Irrigation Survey data, as well as the 2007 Census of Agriculture Volume 1 Geographic Area Series and related reports, are available on the NASS website at www.nass.usda.gov. Custom-designed tabulations may be developed when data are not published elsewhere. These tabulations are developed to individual user specifications on a cost-reimbursable basis and shared with the public. The census Volume 1 on CD-ROM and the census Quick Stats are alternative data sources that should be investigated before requesting a custom tabulation. All custom tabulations are subject to a thorough disclosure review prior to release to prevent the disclosure of any individual respondent data. Requests for custom tabulations can be submitted via the internet from the NASS home page, by mail, or by e-mail to: DataLab National Agricultural Statistics Service
Room 6436A, Stop 2054 1400 Independence Ave, S.W. Washington, D.C. 20250-2054 or [email protected] ABBREVIATIONS AND SYMBOLS The following abbreviations and symbols are used throughout the tables: - Represents zero. (cwt) Hundredweight. (D) Withheld to avoid disclosing data for individual farms. gpm Gallons per minute. (NA) Not available. psi Pounds per square inch. WRR Water Resources Regions. (X) Not applicable. (Z) Less than half of the unit shown.


Water Resources Areas Map of the United States
2007 CENSUS OF AGRICULTURE 2008 FARM AND RANCH IRRIGATION SURVEY 1 USDA, National Agricultural Statistics Service
06
10M
isso
uri
03So
uth
Atla
ntic
-Gul
f
11A
rkan
sas-
Whi
te-R
ed
07U
pper
Mis
siss
ippi
12Te
xas-
Gul
f
04G
reat
Lak
es
05 Ohi
o18
Cal
iforn
ia
16G
reat
Bas
in 15Lo
wer
Col
orad
o13
Rio
Gra
nde
14U
pper
Col
orad
o
02M
id-A
tlant
ic
08
Low
erM
issi
ssip
pi
Tenn
esse
e
17Pa
cific
Nor
thw
est
01 New
Engl
and
Sour
is-R
ed-R
ainy
09
20H
awai
i
19A
lask
a
Not
e:W
ater
reso
urce
sre
gion
sou
tline
the
maj
ordr
aina
gear
eas
ofth
eU
nite
dSt
ates
.Th
ese
boun
darie
sw
hich
ofte
nsp
litco
unty
lines
are
defin
edby
the
U.S
.Geo
logi
calS
urve
y.
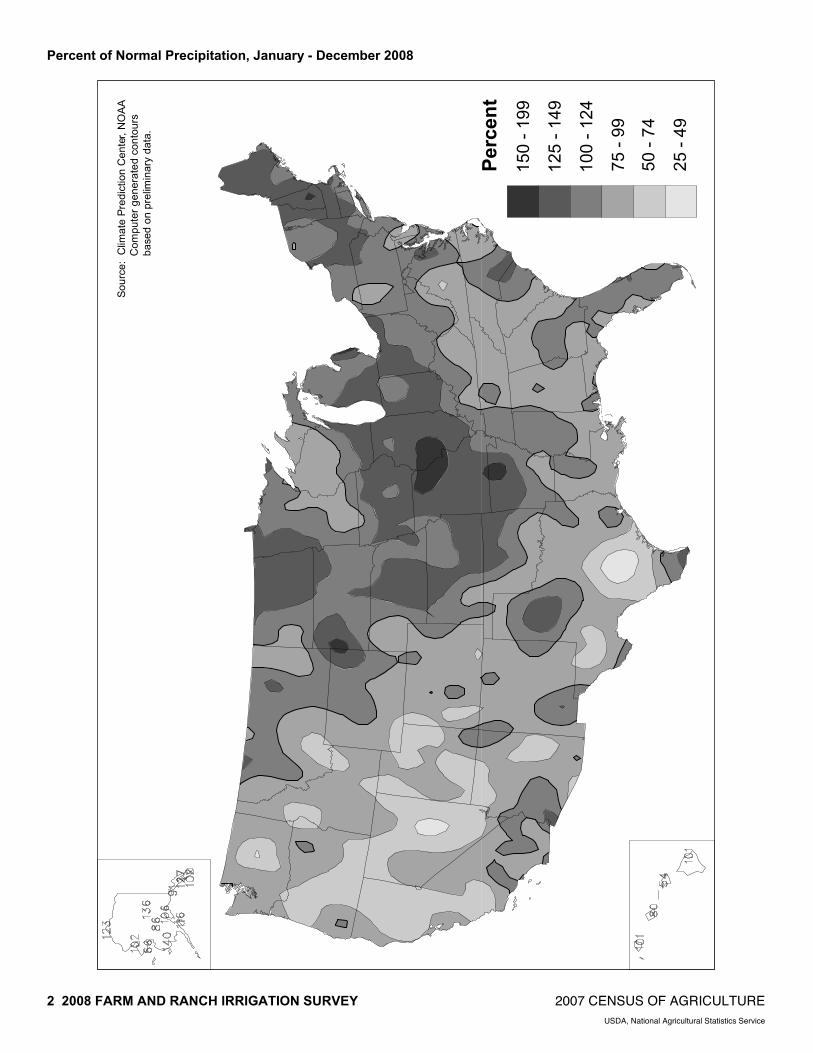
Percent of Normal Precipitation, January - December 2008
2 2008 FARM AND RANCH IRRIGATION SURVEY 2007 CENSUS OF AGRICULTURE USDA, National Agricultural Statistics Service
Sour
ce:
Clim
ate
Pred
ictio
n C
ente
r, N
OAA
Com
pute
r gen
erat
ed c
onto
urs
bas
ed o
n pr
elim
inar
y da
ta.
Perc
ent
150
- 199
125
- 149
100
- 124
75 -
99
50 -
74
25 -
49
2007 CENSUS OF AGRICULTURE 2008 FRIS – GENERAL DATA 3 USDA, National Agricultural Statistics Service
Table 1. Irrigated Farms in the Censuses of Agriculture: 2007 and Earlier Censuses [For meaning of abbreviations and symbols, see introductory text]
Not adjusted for coverage 2007 2002 1997
1997 1992 Geographic area
Farms Acres irrigated Farms Acres
irrigated Farms Acres irrigated Farms Acres
irrigated Farms Acres irrigated
United States ........................................ Alabama ............................................... Alaska .................................................. Arizona ................................................. Arkansas .............................................. California .............................................. Colorado ............................................... Connecticut .......................................... Delaware .............................................. Florida .................................................. Georgia ................................................ Hawaii .................................................. Idaho .................................................... Illinois ................................................... Indiana ................................................. Iowa ..................................................... Kansas ................................................. Kentucky .............................................. Louisiana .............................................. Maine ................................................... Maryland .............................................. Massachusetts ..................................... Michigan ............................................... Minnesota ............................................. Mississippi ............................................ Missouri ................................................ Montana ............................................... Nebraska .............................................. Nevada ................................................. New Hampshire .................................... New Jersey .......................................... New Mexico .......................................... New York .............................................. North Carolina ...................................... North Dakota ........................................ Ohio ..................................................... Oklahoma ............................................. Oregon ................................................. Pennsylvania ........................................ Rhode Island ........................................ South Carolina ..................................... South Dakota ....................................... Tennessee ........................................... Texas ................................................... Utah ..................................................... Vermont ................................................ Virginia ................................................. Washington .......................................... West Virginia ........................................ Wisconsin ............................................. Wyoming ..............................................
301,028
2,035 184
5,094 5,393
53,400
15,774 789 560
12,868 5,716
2,810
16,124 2,388 2,391 1,287
5,957 2,980 3,218
901 1,326
1,630 5,078 2,918 2,284 3,613
10,457 17,128
2,054 505
2,055
10,167 3,036 5,788
795 2,402
3,026
16,792 3,958
313 2,030
1,627 2,453
19,713 12,492
523
2,347 15,492
457 2,907 5,793
56,599,305
112,819 3,730
876,158 4,460,682 8,016,159
2,867,957
9,901 104,562
1,552,118 1,017,773
58,635
3,299,889 474,454 397,113 189,518
2,762,748
58,730 954,353 20,994 92,805
23,133
500,428 506,357
1,368,661 1,199,981
2,013,167 8,558,559
691,030 2,482
95,277
830,048 68,010
232,075 236,138 37,959
534,768
1,845,194 37,786
4,306 132,439
373,842 81,405
5,010,416 1,134,144
2,295
82,187 1,735,917
2,189 377,291
1,550,723
299,583
1,698 150
4,172 5,847
55,596
13,623 801 439
13,456 5,369
2,231
15,901 2,031 2,212
976
5,915 3,606 3,496 1,031 1,265
1,580 4,413 2,433 2,235 3,304
10,150 17,970
1,981 451
2,124
8,282 3,307 6,721
659 2,623
2,942
17,776 4,108
264 1,918
1,755 2,592
21,164 11,587
508
3,331 15,534
408 2,457 5,191
55,311,236
108,783 2,742
931,735 4,149,766 8,709,353
2,590,654
10,139 97,167
1,815,174 870,810
69,194
3,288,522 390,843 313,130 142,109
2,678,277
36,751 938,841 19,703 80,828
23,720
456,278 454,850
1,175,530 1,032,973
1,976,111 7,625,170
746,653 2,292
96,893
844,799 74,663
264,057 202,817 40,685
517,553
1,907,627 42,516
3,963 95,642
401,083 61,217
5,074,638 1,091,011
2,335
98,913 1,823,155
1,981 385,902
1,541,688
308,818
1,503 114
4,233 6,887
63,226
15,747 809 430
14,573 4,752
2,241
16,683 2,072 1,918 1,006
6,109 4,233 3,784
805 1,198
2,021 4,123 2,265 1,912 3,108
10,098 19,297
2,296 506
2,222
8,953 2,835 5,059
730 1,967
2,860
17,016 3,554
211 1,435
1,555 1,985
21,106 12,230
409
2,509 16,261
319 2,269 5,384
56,289,172
79,647 2,667
1,075,336 3,785,338 8,886,693
3,374,233
7,689 75,024
1,873,823 773,066
76,971
3,543,805 351,676 255,917 133,149
2,695,816
60,027 960,831 22,229 68,663
26,820
407,071 403,289
1,110,145 921,113
2,101,548 7,065,556
763,742 2,838
94,380
851,735 73,791
156,315 183,004 35,073
509,109
1,963,478 40,089
3,333 88,898
367,195 47,010
5,764,295 1,218,474
2,845
86,388 1,787,120
3,543 358,467
1,749,908
279,442
1,301 114
3,426 6,593
55,920
15,470 674 415
12,673 4,372
2,241
15,191 2,021 1,753
957
6,135 4,104 3,400
671 1,154
1,630 3,752 2,193 1,769 2,891
9,059
18,804 2,159
429 2,089
7,444 2,501 4,695
710 1,778
2,710
15,348 2,814
180 1,248
1,439 1,768
18,756 11,291
333
2,337 13,131
268 2,025 5,306
55,058,128
76,871 2,667
1,013,902 3,717,217 8,712,893
3,430,129
7,366 72,635
1,862,404 748,520
76,971
3,493,542 349,799 250,050 124,983
2,707,489
58,490 942,528 21,791 68,588
24,564
393,485 380,394
1,076,231 881,924
1,994,484 6,939,036
764,738 2,691
92,965
804,616 69,197
156,250 180,362 33,997
506,459
1,948,739 36,150
3,265 86,477
343,742 45,581
5,484,663 1,212,201
2,570
84,926 1,705,025
3,285 341,813
1,719,463
279,357
1,380 93
3,965 6,682
56,546
15,193 524 352
13,500 4,701
2,220
15,487 2,061 1,742 1,063
6,543 2,120 4,064
523 1,063
1,336 3,823 2,368 2,127 2,914
8,883
19,328 2,151
308 1,911
7,331 2,020 4,337
816 1,755
2,581
15,002 2,121
132 1,219
1,674 1,544
18,784 10,901
255
2,312 14,068
312 2,146 5,076
49,404,030
82,015 1,566
956,454 2,701,651 7,571,313
3,169,839
5,893 61,774
1,782,680 724,792
134,338
3,260,006 328,316 240,898 115,724
2,680,343
27,647 897,641 10,241 56,913
19,909
366,465 370,404 882,976 708,864
1,978,167 6,311,633
556,172 1,746
80,409
738,272 46,600
112,630 187,212 29,479
512,487
1,622,235 23,096
2,979 75,681
371,263 36,974
4,912,308 1,142,514
2,123
61,759 1,641,437
2,769 330,838
1,464,585
4 2008 FRIS – GENERAL DATA 2007 CENSUS OF AGRICULTURE USDA, National Agricultural Statistics Service
Table 2. Irrigated Farms by Acres Irrigated: 2008 and 2003 [Excludes institutional, research, and experimental farms and farms with horticulture. For meaning of abbreviations and symbols, see introductory text]
Total 1 to 49 acres 50 to 99 acres 100 to 199 acres
Geographic area Farms
Land in farms
(acres)
Acres irrigated Farms
Land in farms
(acres)
Acres irrigated Farms
Land in farms
(acres)
Acres irrigated Farms
Land in farms
(acres)
Acres irrigated
United States .............................2008 .. 2003 .. 2008 DATA Alabama ............................................... Alaska ................................................... Arizona ................................................. Arkansas ............................................... California .............................................. Colorado ............................................... Connecticut ........................................... Delaware .............................................. Florida ................................................... Georgia ................................................. Hawaii ................................................... Idaho ..................................................... Illinois .................................................... Indiana .................................................. Iowa ...................................................... Kansas .................................................. Kentucky ............................................... Louisiana .............................................. Maine .................................................... Maryland ............................................... Massachusetts ...................................... Michigan ............................................... Minnesota ............................................. Mississippi ............................................ Missouri ................................................ Montana ................................................ Nebraska .............................................. Nevada ................................................. New Hampshire .................................... New Jersey ........................................... New Mexico .......................................... New York .............................................. North Carolina ...................................... North Dakota ........................................ Ohio ...................................................... Oklahoma ............................................. Oregon .................................................. Pennsylvania ........................................ Rhode Island ........................................ South Carolina ...................................... South Dakota ........................................ Tennessee ............................................ Texas .................................................... Utah ...................................................... Vermont ................................................ Virginia .................................................. Washington ........................................... West Virginia ........................................ Wisconsin ............................................. Wyoming ............................................... Water Resources Regions Region 01 New England ....................... Region 02 Mid-Atlantic .......................... Region 03 South Atlantic-Gulf .............. Region 04 Great Lakes ......................... Region 05 Ohio ..................................... Region 06 Tennessee ........................... Region 07 Upper Mississippi ................ Region 08 Lower Mississippi ................ Region 09 Souris-Red-Rainy ................ Region 10 Missouri ............................... Region 11 Arkansas-White-Red ........... Region 12 Texas-Gulf ........................... Region 13 Rio Grande .......................... Region 14 Upper Colorado ................... Region 15 Lower Colorado ................... Region 16 Great Basin ......................... Region 17 Pacific Northwest ................. Region 18 California ............................. Region 19 Alaska ................................. Region 20 Hawaii .................................
206,834 210,106
665 23
2,997 4,119
45,136
12,778 147 309
5,250 3,584
1,077
13,834 1,091 1,089
527
4,508 822
1,692 196 597
677
2,121 1,546 1,277 1,877
8,507
14,812 1,734
86 608
8,878
596 1,975
601 379
1,454
12,156 1,090
61 712
1,165
582 12,673 10,876
66
657 12,712
90 1,261 5,164
1,188 3,200
12,428 3,152 2,056
527
3,863 7,341
400 32,727
10,336 10,224
8,031 10,771
3,551
10,157 40,017 45,765
23 1,077
198,160,896 195,969,172
442,487 5,785
4,446,165 6,162,119
15,866,424
10,647,744 10,403
273,149 2,535,664 2,999,922
213,387
6,421,820 1,309,942 1,360,556
590,047
10,912,364 329,198
2,074,497 118,107 278,277
52,718
1,503,006 1,397,018 2,512,434 2,285,747
19,637,380 21,853,534 5,600,694
9,043 136,352
12,816,722
144,640 990,106
1,706,080 124,294
2,382,239 6,952,252
149,947 5,501
443,293
2,807,203 424,980
16,634,484 5,512,452
8,186
323,778 8,085,090
13,493 1,065,575
15,584,598
199,464 1,052,547 7,495,555 2,098,815 1,461,874
283,315
3,827,858 11,412,924
714,430 66,817,228
24,462,413 10,145,409 8,037,090 5,822,461 4,727,545
9,893,297
23,242,402 16,247,097
5,785 213,387
54,929,915 52,492,687
75,023 1,589
861,496 4,493,435 7,329,245
2,865,840
2,337 104,620
1,222,797 1,007,763
99,577
3,319,827 457,078 404,399 162,838
2,570,003
32,380 932,712 18,151 85,552
17,421
531,927 504,330
1,451,652 1,232,354
1,947,159 8,365,545
685,261 720
59,412
835,639 20,158
148,999 248,070 18,548
461,235
1,758,602 17,359
681 104,091
360,071 72,862
5,356,876 1,068,929
488
44,818 1,675,898
906 396,123
1,497,119
39,468 309,972
2,554,462 721,586 304,963
41,141
1,339,287 7,346,743
158,617 13,825,255
5,412,670 3,499,153 1,079,145 1,359,888
936,248
1,599,757 6,855,656 7,444,738
1,589 99,577
111,103 106,335
449 16
1,969 633
32,499
6,727 135
57 3,456 1,272
1,037 7,928
164 199
79
441 727 360 170 328
597
1,086 275 196 368
3,809
814 702
84 383
6,955
507 1,322
72 310
420
8,062 1,007
59 460
140 440
5,503 7,195
65
486 8,766
85 456
1,833
1,066 2,201 7,167 1,653 1,366
420 802
1,053 43
6,333
2,829 5,161 5,361 7,650 2,373
6,148
25,508 32,916
16 1,037
17,496,702 11,849,544
62,118 1,257
3,026,150 344,618
4,827,537
575,981 6,065 3,139
182,825 172,517
19,584
359,417 17,445 20,913 33,581
507,336 187,903 18,739 19,304 35,716
27,418
167,481 36,861 93,635 83,870
195,072 406,432 24,029
(D)26,763
1,787,654
62,617 173,860 58,007 40,072
89,285
587,278 88,194
(D)51,653
70,496 65,314
720,773 584,902
(D)
74,295 346,581 11,604 39,912
1,141,813
67,579 213,756 747,892 235,836 258,357
53,164
104,851 133,074 25,343
2,342,712
1,059,022 677,105
1,351,037 319,664
3,140,786
534,434 1,337,681 4,873,568
1,257 19,584
1,455,383 1,611,182
4,083 132
22,052 12,757
408,070
116,903 660
1,237 45,450 16,438
4,865
107,732 1,944 1,969
979
11,846 8,723 3,313 1,877 3,520
6,144
15,296 3,253 2,668 4,261
82,319 21,166 11,873
(D)4,163
74,312
4,926 20,643
1,712 2,403
6,418
90,929 7,229
(D)3,361
3,258 3,380
59,678 91,884
(D)
4,776 107,052
473 4,965
40,811
9,931 21,091 92,725 20,416 12,620
3,794 8,851
16,461 1,007
148,200
41,354 54,683 48,994
123,758 28,214
79,033
327,073 412,181
132 4,865
17,735 22,249
51 2
280 136
2,865
1,148 8
47 659 487
15
1,305 106 111
56
400 28
114 5
70
44 209 184
50 240
1,015
701 267
2 66
628
31 304
58 35
216
1,335 43
1 56
128
22 639
1,229 -
56 1,307
3 176 797
60 290
1,584 306 103
11
485 362
35 2,964
1,006
448 732 663 374
1,225 4,203 2,867
2 15
12,372,309 11,794,616
(D) (D)
70,183 45,788
309,927
695,818 1,713
14,881 112,644 239,640
(D)
151,178 61,351 73,631 48,675
323,724 12,105 21,086
(D) (D)
(D)
75,798 110,985 10,456 39,030
861,384 797,442 77,421
(D) (D)
4,866,815
(D) 215,968 146,010
(D)
134,634 306,060
(D) (D)
53,085
92,598 14,913
433,066 751,735
-
63,496 226,506
(D) 112,753 653,949
(D) (D)
708,004 125,394 68,918
7,848
312,080 84,332 24,630
2,804,219
4,414,984 268,664
1,339,511 153,953 86,459
786,321 774,266 310,087
(D) (D)
1,217,958 1,548,758
3,549 (D)
17,225 8,797
192,165
78,243 550
3,226 42,565 34,583
1,019
94,077 7,716 8,328 4,009
27,173
1,940 7,734
(D) 4,920
3,198
15,283 13,103
3,580 16,743
70,329 48,826 17,063
(D) 5,042
43,273
1,971 19,332
4,167 2,335
16,417 98,151
(D) (D)
3,438
9,530 1,355
45,814 84,924
-
3,560 84,008
(D) 12,896 51,884
4,370 20,099
105,552 22,136
7,432
(D) 35,671 24,899
2,410 204,734
64,872 30,191 53,296 46,672 22,350
88,097
291,011 192,325
(D) 1,019
21,344 24,636
56 2
163 344
3,285
1,253 2
61 398 496
6
1,417 217 215 136
1,042
27 212
10 60
25
237 421
91 176
1,006 3,097
195 -
67
552 31
195 146
17
270 843
29 1
66
362 46
984 1,076
1
60 1,072
2 234 640
38 266
1,229 361 188
39
852 583 126
5,897
1,369 703 886 702 187
994
3,630 3,286
2 6
23,974,659 28,639,940
52,753 (D)
103,830 149,881
1,435,554
1,148,231 (D)
40,468 166,504 272,323
1,493
418,940 199,230 224,724 119,625
1,670,563
30,825 119,666 23,561 49,676
7,350
222,385 230,735 67,457
138,757
3,262,038 5,617,492
57,244 -
24,349
1,901,018 18,195
178,201 379,106 24,488
444,988 538,205 27,493
(D)61,338
484,395 76,580
1,421,358 452,990
(D)
59,430 763,300
(D)214,992
1,069,318
31,961 162,539 754,980 324,927 234,539
(D)
652,714 416,321 164,845
11,800,496
1,625,116 829,656
2,393,016 505,063 109,000
370,300
2,120,109 1,436,254
(D)1,493
3,007,803 3,452,161
(D)(D)
20,840 49,341
477,492
180,945 (D)
8,709 53,701 63,618
(D)
213,983 32,344 29,475 18,378
140,172
3,905 28,619
1,377 (D)
3,395
30,749 58,614 12,903 23,804
142,950 450,180 26,222
- 9,273
79,720
(D)23,355 20,329
(D)
35,575 107,631
3,696 (D)
8,874
49,961 6,321
122,998 161,044
(D)
7,624 153,217
(D)33,096 89,243
5,149 (D)
158,235 46,898 26,289
(D)
121,274 82,402 17,666
847,704
184,404 93,077
119,012 99,888 23,350
150,352 510,728 477,667
(D)(D)
--continued

2007 CENSUS OF AGRICULTURE 2008 FRIS – GENERAL DATA 5 USDA, National Agricultural Statistics Service
Table 2. Irrigated Farms by Acres Irrigated: 2008 and 2003 - Con. [Excludes institutional, research, and experimental farms and farms with horticulture. For meaning of abbreviations and symbols, see introductory text]
200 to 499 acres 500 to 999 acres 1,000 to 1,999 acres 2,000 acres or more
Geographic area Farms
Land in farms
(acres)
Acres irrigated Farms
Land in farms
(acres)
Acres irrigated Farms
Land in farms
(acres)
Acres irrigated Farms
Land in farms
(acres)
Acres irrigated
United States ............................. 2008 .. 2003 .. 2008 DATA Alabama ............................................... Alaska .................................................. Arizona ................................................. Arkansas .............................................. California .............................................. Colorado ............................................... Connecticut .......................................... Delaware .............................................. Florida .................................................. Georgia ................................................ Hawaii .................................................. Idaho .................................................... Illinois ................................................... Indiana ................................................. Iowa ..................................................... Kansas ................................................. Kentucky .............................................. Louisiana .............................................. Maine ................................................... Maryland .............................................. Massachusetts ..................................... Michigan ............................................... Minnesota ............................................. Mississippi ............................................ Missouri ................................................ Montana ............................................... Nebraska .............................................. Nevada ................................................. New Hampshire .................................... New Jersey .......................................... New Mexico .......................................... New York .............................................. North Carolina ...................................... North Dakota ........................................ Ohio ..................................................... Oklahoma ............................................. Oregon ................................................. Pennsylvania ........................................ Rhode Island ........................................ South Carolina ..................................... South Dakota ....................................... Tennessee ........................................... Texas ................................................... Utah ..................................................... Vermont ................................................ Virginia ................................................. Washington .......................................... West Virginia ........................................ Wisconsin ............................................. Wyoming .............................................. Water Resources Regions Region 01 New England ....................... Region 02 Mid-Atlantic ......................... Region 03 South Atlantic-Gulf .............. Region 04 Great Lakes ........................ Region 05 Ohio .................................... Region 06 Tennessee .......................... Region 07 Upper Mississippi ................ Region 08 Lower Mississippi ................ Region 09 Souris-Red-Rainy ................ Region 10 Missouri .............................. Region 11 Arkansas-White-Red ........... Region 12 Texas-Gulf .......................... Region 13 Rio Grande ......................... Region 14 Upper Colorado ................... Region 15 Lower Colorado ................... Region 16 Great Basin ......................... Region 17 Pacific Northwest ................ Region 18 California ............................. Region 19 Alaska ................................. Region 20 Hawaii .................................
26,699 27,980
62 3
183 504
3,170
2,112 2
79 350 777
7
1,548 301 304 164
1,074
28 368
4 97
10
303 401 218 373
1,566 4,796
233 -
68
404 23 97
179 9
310
1,070 10
- 68
344
30 1,990
929 -
33 787
- 229
1,082
16 291
1,354 444 220
31
988 1,209
107 9,125
1,857 1,466
519 1,151
193
1,003 3,425 3,290
3 7
40,637,249 45,706,423
127,258 3,885
135,990 293,083
1,507,287
2,195,928 (D)
81,477 337,186 919,747
3,745
1,300,559 365,368 386,279 196,539
3,087,500
48,859 352,654
(D) 87,428
9,163
335,375 411,673 251,716 451,741
6,149,775 4,984,591
251,094 -
39,236
1,043,290 30,142
168,840 541,368 21,167
696,748
1,494,856 15,740
- 85,596
1,347,171
74,468 3,007,322 1,668,408
-
44,464 3,045,346
- 263,780
2,764,077
18,493 258,441
1,606,171 494,232 347,987
87,541
1,112,829 1,068,243
189,923 17,345,640
4,462,640 1,964,180
592,608 1,582,035
149,090
1,811,159 5,975,115 1,563,292
3,885 3,745
8,370,607 8,905,069
19,158 995
56,586 165,169
1,012,333
619,440 (D)
24,822 108,474 235,608
1,810
488,898 92,970 97,058 48,910
367,772
7,418 118,722
(D)31,572
(D)
92,655 119,086 74,268
114,661
468,966 1,598,393
75,042 -
20,811
121,007 6,024
27,386 57,235
2,470
89,250 346,939
2,964 -
20,272
104,578 9,412
606,397 285,459
-
9,380 232,651
- 67,314
315,322
4,950 90,253
410,186 135,325 70,648
8,937
292,882 402,376 34,270
2,892,997
576,469 458,131 150,979 342,923 61,431
311,147
1,073,391 1,050,507
995 1,810
15,778 16,758
35 -
158 836
1,738
849 -
42 190 313
4
915 184 176
65
756 9
363 5
27
- 167 173 229 319
731
2,864 177
- 20
181
3 44 91
6
137 519
1 -
36
135 24
1,901 298
-
14 445
- 90
508
5 103 610 235 117
20
456 1,539
60 4,669
1,576 1,454
231 390 164
496
1,866 1,783
- 4
38,856,577 37,945,515
93,618 -
348,521 844,573
2,283,870
2,768,998 -
66,875 293,613 563,564
9,367
1,301,538 303,715 349,722 106,155
1,779,505
40,706 648,359 23,388 46,938
-
295,790 271,661 352,105 433,037
4,645,201 3,909,406 2,358,436
- 22,324
1,475,794
12,900 93,940
299,971 (D)
504,530
1,188,594 (D)
- 68,263
528,820 59,666
4,900,949 547,014
-
43,847 1,491,851
- 130,278
3,338,604
23,388 181,148
1,087,881 394,486 272,508
50,578
726,270 2,049,531
143,305 13,525,799
5,589,209 3,027,493
620,663 1,388,489
410,221
2,789,059 4,219,396 2,347,786
- 9,367
11,077,737 11,819,485
24,025 -
108,188 598,245
1,225,449
583,624 -
30,080 130,778 215,859
2,577
627,191 130,298 117,099 44,682
531,007
6,310 256,383
3,085 17,901
-
114,249 115,172 162,684 226,147
491,015
2,024,784 117,762
- 13,312
122,448
(D)29,156 63,440
4,350
100,781 365,618
(D)-
22,637
87,018 15,560
1,430,700 185,975
-
8,873 318,006
- 61,933
341,326
3,085 70,026
417,394 158,305 81,380
13,267
310,789 1,101,115
41,041 3,243,352
1,112,329 1,120,725
153,932 261,067 113,088
313,574
1,305,890 1,254,801
- 2,577
9,649 8,435
11 -
117 976 965
478
- 20 98
173
2 428
99 58 19
579
3 197
1 14
1
79 52
256 246
296
2,090 89
- 2
99
1 10 37
1
62 214
- -
18
42 13
1,202 117
-
8 232
- 41
203
2 43
308 100
47
5 189
1,516 14
2,994
1,142 758 210 127 118
193 870
1,011 - 2
29,492,718 28,013,341
56,700 -
194,795 1,701,236 1,811,693
1,760,523
- 49,187
268,103 517,824
(D)
876,084 252,382 156,176 54,394
2,061,429
8,800 486,218
(D) 33,804
(D)
183,053 133,523 596,394 489,267
2,682,736 4,090,222
995,859 -
(D)
694,538 (D)
87,608 158,914
(D)
245,400 1,107,795
- -
80,710
147,952 80,376
2,918,357 804,624
-
38,246 545,234
- 98,197
2,975,149
(D) 121,360 987,194 232,001 158,925
(D)
444,662 2,976,083
68,439 11,137,961
3,394,435 1,873,015
768,863 632,886 196,534
1,404,444 3,007,961 2,013,435
- (D)
12,988,086 11,389,255
14,990 -
163,048 1,379,559 1,307,090
611,901
- 27,983
135,901 232,101
(D)
572,351 131,304 71,770 24,655
770,289
4,084 265,064
(D) 16,709
(D)
109,319 70,439
359,665 328,523
382,905
2,835,516 118,105
- (D)
131,483
(D) 15,837 45,554
(D)
83,922 275,620
- -
23,846
56,525 16,842
1,574,530 150,783
-
10,605 312,779
- 54,426
289,868
(D) 56,148
419,933 137,809 59,124
(D)
247,571 2,106,910
18,770 4,010,116
1,523,916 1,006,322
279,014 169,026 164,227
254,712
1,158,631 1,362,388
- (D)
4,526 3,713
1 -
127 690 614
211
- 3
99 66
6
293 20 26
8
216 -
78 1 1
-
40 40
237 155
84
450 71
- 2
59
- 3
18 1
39
113 - - 8
14
7 454
32 -
- 103
- 35
101
1 6
176 53 15
1
91 1,079
15 745
557 234
92 88
142
98 515 612
- 6
35,330,682 32,019,793
(D)-
566,696 2,782,940 3,690,556
1,502,265
- 17,122
1,174,789 314,307
170,425
2,014,104 110,451 149,111 31,078
1,482,307
- 427,775
(D)(D)
-
223,124 201,580
1,140,671 650,045
1,841,174 2,047,949 1,836,611
- (D)
1,047,613
- 71,689
122,704 (D)
266,654
1,729,464 - -
42,648
135,771 53,663
3,232,659 702,779
-
- 1,666,272
- 205,663
3,641,688
(D)(D)
1,603,433 291,939 120,640
(D)
474,452 4,685,340
97,945 7,860,401
3,917,007 1,505,296
971,392 1,240,371
635,455
2,197,580 5,807,874 3,702,675
- 170,425
16,812,341 13,766,777
(D)-
473,557 2,279,567 2,706,646
674,784
- 8,563
705,928 209,556
85,434
1,215,595 60,502 78,700 21,225
721,744
- 252,877
(D)(D)
-
154,376 124,663 835,884 518,215
308,675
1,386,680 319,194
- (D)
263,396
- 13,290 55,633
(D)
128,872 473,714
- -
21,663
49,201 19,992
1,516,759 108,860
-
- 468,185
- 161,493 368,665
(D)(D)
950,437 200,697 47,470
(D)
322,249 3,612,580
43,453 2,478,152
1,909,326
736,024 273,918 316,554 523,588
402,842
2,188,932 2,694,869
- 85,434
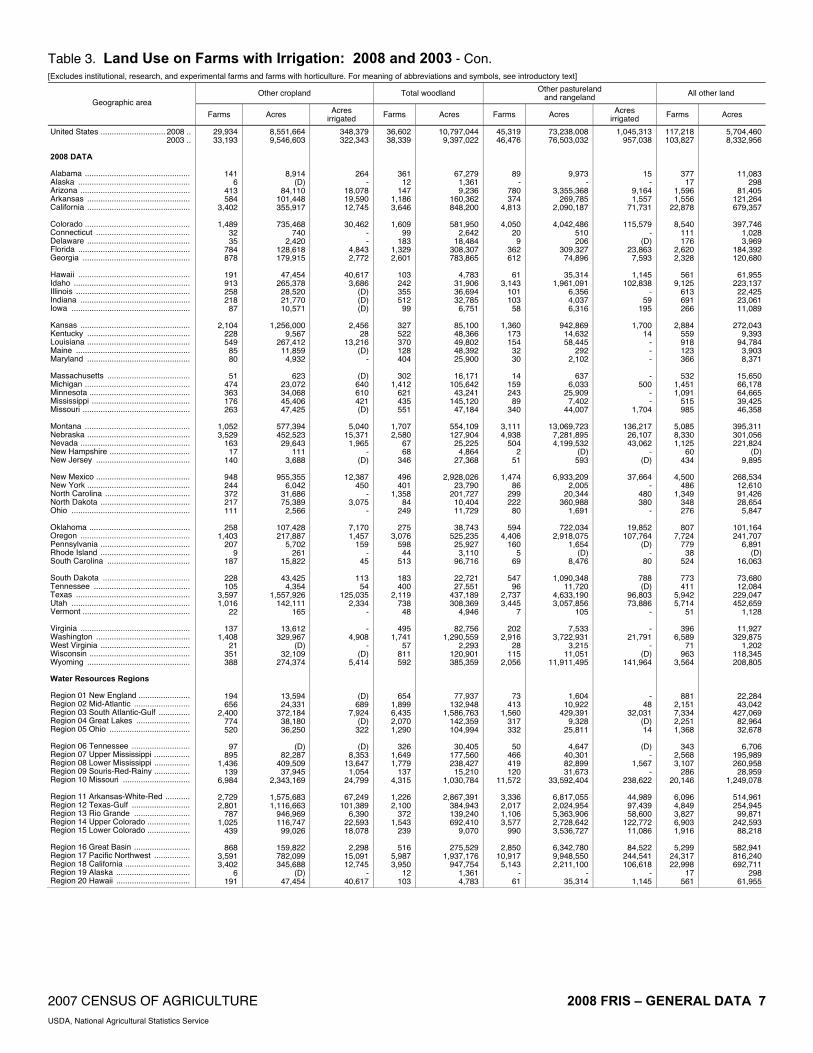
6 2008 FRIS – GENERAL DATA 2007 CENSUS OF AGRICULTURE USDA, National Agricultural Statistics Service
Table 3. Land Use on Farms with Irrigation: 2008 and 2003 [Excludes institutional, research, and experimental farms and farms with horticulture. For meaning of abbreviations and symbols, see introductory text]
Land in farms Total cropland Cropland harvested Cropland used only for pasture or grazing
Geographic area Farms Acres Acres
irrigated Farms Acres Acres irrigated Farms Acres Acres
irrigated Farms Acres Acres irrigated
United States .............................2008 .. 2003 .. 2008 DATA Alabama ............................................... Alaska ................................................... Arizona ................................................. Arkansas ............................................... California .............................................. Colorado ............................................... Connecticut ........................................... Delaware .............................................. Florida ................................................... Georgia ................................................. Hawaii ................................................... Idaho ..................................................... Illinois .................................................... Indiana .................................................. Iowa ...................................................... Kansas .................................................. Kentucky ............................................... Louisiana .............................................. Maine .................................................... Maryland ............................................... Massachusetts ...................................... Michigan ............................................... Minnesota ............................................. Mississippi ............................................ Missouri ................................................ Montana ................................................ Nebraska .............................................. Nevada ................................................. New Hampshire .................................... New Jersey ........................................... New Mexico .......................................... New York .............................................. North Carolina ...................................... North Dakota ........................................ Ohio ...................................................... Oklahoma ............................................. Oregon .................................................. Pennsylvania ........................................ Rhode Island ........................................ South Carolina ...................................... South Dakota ........................................ Tennessee ............................................ Texas .................................................... Utah ...................................................... Vermont ................................................ Virginia .................................................. Washington ........................................... West Virginia ........................................ Wisconsin ............................................. Wyoming ............................................... Water Resources Regions Region 01 New England ....................... Region 02 Mid-Atlantic .......................... Region 03 South Atlantic-Gulf .............. Region 04 Great Lakes ......................... Region 05 Ohio ..................................... Region 06 Tennessee ........................... Region 07 Upper Mississippi ................ Region 08 Lower Mississippi ................ Region 09 Souris-Red-Rainy ................ Region 10 Missouri ............................... Region 11 Arkansas-White-Red ........... Region 12 Texas-Gulf ........................... Region 13 Rio Grande .......................... Region 14 Upper Colorado ................... Region 15 Lower Colorado ................... Region 16 Great Basin ......................... Region 17 Pacific Northwest ................. Region 18 California ............................. Region 19 Alaska ................................. Region 20 Hawaii .................................
206,834 210,106
665 23
2,997 4,119
45,136
12,778 147 309
5,250 3,584
1,077
13,834 1,091 1,089
527
4,508 822
1,692 196 597
677
2,121 1,546 1,277 1,877
8,507
14,812 1,734
86 608
8,878
596 1,975
601 379
1,454
12,156 1,090
61 712
1,165
582 12,673 10,876
66
657 12,712
90 1,261 5,164
1,188 3,200
12,428 3,152 2,056
527
3,863 7,341
400 32,727
10,336 10,224
8,031 10,771
3,551
10,157 40,017 45,765
23 1,077
198,160,896 195,969,172
442,487 5,785
4,446,165 6,162,119
15,866,424
10,647,744 10,403
273,149 2,535,664 2,999,922
213,387
6,421,820 1,309,942 1,360,556
590,047
10,912,364 329,198
2,074,497 118,107 278,277
52,718
1,503,006 1,397,018 2,512,434 2,285,747
19,637,380 21,853,534 5,600,694
9,043 136,352
12,816,722
144,640 990,106
1,706,080 124,294
2,382,239 6,952,252
149,947 5,501
443,293
2,807,203 424,980
16,634,484 5,512,452
8,186
323,778 8,085,090
13,493 1,065,575
15,584,598
199,464 1,052,547 7,495,555 2,098,815 1,461,874
283,315
3,827,858 11,412,924
714,430 66,817,228
24,462,413 10,145,409 8,037,090 5,822,461 4,727,545
9,893,297
23,242,402 16,247,097
5,785 213,387
54,929,915 52,492,687
75,023 1,589
861,496 4,493,435 7,329,245
2,865,840
2,337 104,620
1,222,797 1,007,763
99,577
3,319,827 457,078 404,399 162,838
2,570,003
32,380 932,712 18,151 85,552
17,421
531,927 504,330
1,451,652 1,232,354
1,947,159 8,365,545
685,261 720
59,412
835,639 20,158
148,999 248,070 18,548
461,235
1,758,602 17,359
681 104,091
360,071 72,862
5,356,876 1,068,929
488
44,818 1,675,898
906 396,123
1,497,119
39,468 309,972
2,554,462 721,586 304,963
41,141
1,339,287 7,346,743
158,617 13,825,255
5,412,670 3,499,153 1,079,145 1,359,888
936,248
1,599,757 6,855,656 7,444,738
1,589 99,577
199,515 204,442
665 23
2,826 4,119
44,706
12,391 147 309
5,237 3,557
1,070
12,572 1,091 1,089
517
4,508 815
1,692 196 597
677
2,096 1,546 1,277 1,864
8,068
14,812 1,681
86 608
8,636
596 1,959
601 379
1,403
10,094 1,089
61 704
1,165
581 12,381 10,272
66
657 11,538
90 1,261 5,140
1,188 3,199
12,364 3,127 2,049
526
3,863 7,341
400 32,344
10,112
9,928 8,028
10,277 3,318
9,799
35,416 45,143
23 1,070
108,421,384 101,736,162
354,152 4,126
1,000,156 5,610,708
12,248,680
5,625,562 6,223
250,490 1,733,638 2,020,481
111,335
4,205,686 1,244,467 1,300,673
565,891
9,612,352 256,807
1,871,466 65,520
241,904
20,260 1,325,153 1,263,203 2,320,487 2,148,198
5,618,237
14,142,679 1,154,113
3,558 98,496
2,686,953
106,235 676,609
1,306,034 105,027
1,520,298 3,267,235
115,475 1,780
322,038
1,620,454 373,625
11,335,058 1,693,568
2,007
221,562 2,741,725
6,783 815,278
3,078,939
97,639 865,635
5,052,332 1,864,164 1,298,391
241,557
3,414,008 10,830,640
638,588 30,944,962
14,263,006 7,480,567 2,434,073 2,158,816 1,093,530
2,692,047
10,540,436 12,395,532
4,126 111,335
53,884,602 51,535,649
75,008 1,589
852,332 4,491,878 7,257,514
2,750,261
2,337 (D)
1,198,934 1,000,170
98,432
3,216,989 457,078 404,340 162,643
2,568,303
32,366 932,712 18,151 85,552
17,421
531,427 504,330
1,451,652 1,230,650
1,810,942 8,339,438
642,199 720 (D)
797,975 20,158
148,519 247,690 18,548
441,383
1,650,838 (D)
681 104,011
359,283
(D)5,260,073
995,043 488
44,818
1,654,107 906 (D)
1,355,155
39,468 309,924
2,522,431 (D)
304,949
(D)1,339,287 7,345,176
158,617 13,586,633
5,367,681 3,401,714 1,020,545 1,237,116
925,162
1,515,235 6,611,115 7,338,120
1,589 98,432
183,897 185,680
646 23
1,904 4,119
41,022
11,047 147 309
4,966 3,517
1,042
10,027 1,091 1,076
517
4,489 815
1,673 193 593
640
2,096 1,546 1,277 1,864
7,689
14,700 1,521
86 567
7,636
596 1,837
601 379
1,350 8,452 1,089
57 695
1,165
563 12,147
9,310 66
657
10,347 90
1,261 4,397
1,144 3,154
11,907 3,114 2,040
522
3,863 7,313
400 31,190
9,897 9,767 7,147 8,627 2,303
8,954
30,012 41,478
23 1,042
78,043,457 74,834,157
310,127 2,225
803,563 5,454,373 7,407,931
3,132,687
5,081 247,025
1,252,339 1,661,353
59,642
3,161,743 1,206,759 1,261,582
549,330
6,887,476 213,208
1,518,997 53,030
232,934
19,312 1,292,404 1,204,250 2,265,515 2,063,897
2,463,577
11,682,565 538,941
3,366 93,910
973,556 93,605
607,620 1,103,232
100,738
1,119,486 1,767,412
101,662 1,515
282,162
1,379,726 347,419
7,912,212 899,493
1,637
191,990 1,925,767
6,301 776,071
1,402,711
82,570 816,004
4,050,743 1,810,691 1,204,636
213,451
3,289,626 10,291,786
579,519 22,116,957
9,479,378 5,341,739 1,085,157
909,265 868,628
1,448,602 6,920,803 7,472,035
2,225 59,642
50,970,320 48,540,852
73,145 (D)
801,314 4,470,573 6,949,095
2,400,152
2,337 104,504
1,143,610 978,196
57,468
2,937,001 455,158 401,626 161,847
2,537,589
31,786 919,256
(D) 85,304
(D)
528,036 503,256
1,451,231 1,230,455
1,549,574 8,306,117
530,401 720
58,967
711,777 19,708
137,209 244,343 18,483
415,556
1,418,435 17,042
677 101,231
357,955
(D) 4,881,811
812,783 488
44,568
1,538,597 890
390,108 1,086,113
(D) 308,150
2,429,420 716,060 303,318
(D)
1,329,957 7,330,922
157,271 13,114,752
5,059,712 3,208,458
918,958 846,994 864,631
1,299,779 5,941,698 7,006,877
(D) 57,468
68,660 66,872
262 9
1,134 523
8,611
5,806 34 49
1,178 1,113
104
7,280 124 238
80
1,207 386 238
36 185
44
343 327 107 207
4,439 5,037
854 6
128
2,902 124 724 140 110
647
5,797 392
4 220
429 244
4,527 5,173
22
234 3,933
14 245
2,690
132 911
3,552 596 706
270 634 766 127
12,889
3,573 3,629 2,408 5,520 1,523
4,691
17,650 8,970
9 104
21,826,263 17,355,402
35,111 (D)
112,483 54,887
4,484,832
1,757,407 402
1,045 352,681 179,213
4,239
778,565 9,188
17,321 5,990
1,468,876
34,032 85,057
631 4,038
325
9,677 24,885
9,566 36,876
2,577,266 2,007,591
585,529 81
898
758,042 6,588
37,303 127,413
1,723
293,384 1,281,936
8,111 4
24,054
197,303 21,852
1,864,920 651,964
205
15,960 485,991
(D)7,098
1,401,854
1,475 25,300
629,405 15,293 57,505
(D)
42,095 129,345 21,124
6,484,836
3,207,945 1,022,165
401,947 1,132,804
125,876
1,083,623 2,837,534 4,577,809
(D)4,239
2,565,903 2,672,454
1,599 (D)
32,940 1,715
295,674
319,647 -
(D)50,481 19,202
347
276,302 (D)(D)(D)
28,258
552 240 (D)
248
(D)2,751
464 -
(D)
256,328 17,950
109,833 -
359
73,811 -
11,310 272
65
18,657 230,946
(D)4
2,735
1,215 439
253,227 179,926
-
250 110,602
16 845
263,628
160 1,085
85,087 4,267 1,309
(D)
977 607 292
447,082
240,720 91,867 95,197
367,529 42,453
213,158 654,326 318,498
(D)347
--continued
2007 CENSUS OF AGRICULTURE 2008 FRIS – GENERAL DATA 7 USDA, National Agricultural Statistics Service
Table 3. Land Use on Farms with Irrigation: 2008 and 2003 - Con. [Excludes institutional, research, and experimental farms and farms with horticulture. For meaning of abbreviations and symbols, see introductory text]
Other cropland Total woodland Other pastureland and rangeland All other land
Geographic area Farms Acres Acres
irrigated Farms Acres Farms Acres Acres irrigated Farms Acres
United States ............................. 2008 .. 2003 .. 2008 DATA Alabama ............................................... Alaska .................................................. Arizona ................................................. Arkansas .............................................. California .............................................. Colorado ............................................... Connecticut .......................................... Delaware .............................................. Florida .................................................. Georgia ................................................ Hawaii .................................................. Idaho .................................................... Illinois ................................................... Indiana ................................................. Iowa ..................................................... Kansas ................................................. Kentucky .............................................. Louisiana .............................................. Maine ................................................... Maryland .............................................. Massachusetts ..................................... Michigan ............................................... Minnesota ............................................. Mississippi ............................................ Missouri ................................................ Montana ............................................... Nebraska .............................................. Nevada ................................................. New Hampshire .................................... New Jersey .......................................... New Mexico .......................................... New York .............................................. North Carolina ...................................... North Dakota ........................................ Ohio ..................................................... Oklahoma ............................................. Oregon ................................................. Pennsylvania ........................................ Rhode Island ........................................ South Carolina ..................................... South Dakota ....................................... Tennessee ........................................... Texas ................................................... Utah ..................................................... Vermont ................................................ Virginia ................................................. Washington .......................................... West Virginia ........................................ Wisconsin ............................................. Wyoming .............................................. Water Resources Regions Region 01 New England ....................... Region 02 Mid-Atlantic ......................... Region 03 South Atlantic-Gulf .............. Region 04 Great Lakes ........................ Region 05 Ohio .................................... Region 06 Tennessee .......................... Region 07 Upper Mississippi ................ Region 08 Lower Mississippi ................ Region 09 Souris-Red-Rainy ................ Region 10 Missouri .............................. Region 11 Arkansas-White-Red ........... Region 12 Texas-Gulf .......................... Region 13 Rio Grande ......................... Region 14 Upper Colorado ................... Region 15 Lower Colorado ................... Region 16 Great Basin ......................... Region 17 Pacific Northwest ................ Region 18 California ............................. Region 19 Alaska ................................. Region 20 Hawaii .................................
29,934 33,193
141 6
413 584
3,402
1,489 32 35
784 878
191 913 258 218
87
2,104 228 549
85 80
51
474 363 176 263
1,052 3,529
163 17
140
948 244 372 217 111
258
1,403 207
9 187
228 105
3,597 1,016
22
137 1,408
21 351 388
194 656
2,400 774 520
97
895 1,436
139 6,984
2,729 2,801
787 1,025
439
868 3,591 3,402
6 191
8,551,664 9,546,603
8,914 (D)
84,110 101,448 355,917
735,468
740 2,420
128,618 179,915
47,454
265,378 28,520 21,770 10,571
1,256,000
9,567 267,412 11,859
4,932
623 23,072 34,068 45,406 47,425
577,394 452,523 29,643
111 3,688
955,355
6,042 31,686 75,389
2,566
107,428 217,887
5,702 261
15,822
43,425 4,354
1,557,926 142,111
165
13,612 329,967
(D) 32,109
274,374
13,594 24,331
372,184 38,180 36,250
(D)
82,287 409,509 37,945
2,343,169
1,575,683 1,116,663
946,969 116,747 99,026
159,822 782,099 345,688
(D) 47,454
348,379 322,343
264 -
18,078 19,590 12,745
30,462
- -
4,843 2,772
40,617
3,686 (D) (D) (D)
2,456
28 13,216
(D) -
(D) 640 610 421 (D)
5,040
15,371 1,965
- (D)
12,387
450 -
3,075 -
7,170 1,457
159 -
45
113 54
125,035 2,334
-
- 4,908
- (D)
5,414
(D) 689
7,924 (D)
322
(D) 8,353
13,647 1,054
24,799
67,249 101,389
6,390 22,593 18,078
2,298
15,091 12,745
- 40,617
36,602 38,339
361 12
147 1,186 3,646
1,609
99 183
1,329 2,601
103 242 355 512
99
327 522 370 128 404
302
1,412 621 435 551
1,707 2,580
67 68
346
496 401
1,358 84
249
275 3,076
598 44
513
183 400
2,119 738
48
495 1,741
57 811 592
654 1,899 6,435 2,070 1,290
326
1,649 1,779
137 4,315
1,226 2,100
372 1,543
239
516 5,987 3,950
12 103
10,797,044 9,397,022
67,279 1,361 9,236
160,362 848,200
581,950
2,642 18,484
308,307 783,865
4,783
31,906 36,694 32,785
6,751
85,100 48,366 49,802 48,392 25,900
16,171
105,642 43,241
145,120 47,184
554,109 127,904 25,225
4,864 27,368
2,928,026
23,790 201,727 10,404 11,729
38,743
525,235 25,927
3,110 96,716
22,721 27,551
437,189 308,369
4,946
82,756 1,290,559
2,293 120,901 385,359
77,937 132,948
1,586,763 142,359 104,994
30,405
177,560 238,427 15,210
1,030,784
2,867,391 384,943 139,240 692,410
9,070
275,529 1,937,176
947,754 1,361 4,783
45,319 46,476
89 -
780 374
4,813
4,050 20
9 362 612
61
3,143 101 103
58
1,360 173 154
32 30
14
159 243
89 340
3,111 4,938
504 2
51
1,474 86
299 222
80
594 4,406
160 5
69
547 96
2,737 3,445
7
202 2,916
28 115
2,056
73 413
1,560 317 332
50
466 419 120
11,572
3,336 2,017 1,106 3,577
990
2,850 10,917
5,143 -
61
73,238,008 76,503,032
9,973 -
3,355,368 269,785
2,090,187
4,042,486 510 206
309,327 74,896
35,314
1,961,091 6,356 4,037 6,316
942,869 14,632 58,445
292 2,102
637
6,033 25,909
7,402 44,007
13,069,723 7,281,895 4,199,532
(D) 593
6,933,209
2,005 20,344
360,988 1,691
722,034
2,918,075 1,654
(D) 8,476
1,090,348
11,720 4,633,190 3,057,856
105
7,533 3,722,931
3,215 11,051
11,911,495
1,604 10,922
429,391 9,328
25,811
4,647 40,301 82,899 31,673
33,592,404
6,817,055 2,024,954 5,363,906 2,728,642 3,536,727
6,342,780 9,948,550 2,211,100
- 35,314
1,045,313 957,038
15 -
9,164 1,557
71,731
115,579 -
(D) 23,863
7,593
1,145 102,838
- 59
195
1,700 14
- - -
- 500
- -
1,704
136,217 26,107 43,062
- (D)
37,664
- 480 380
-
19,852 107,764
(D) -
80
788 (D)
96,803 73,886
-
- 21,791
- (D)
141,964
- 48
32,031 (D) 14
(D)
- 1,567
- 238,622
44,989 97,439 58,600
122,772 11,086
84,522
244,541 106,618
- 1,145
117,218 103,827
377 17
1,596 1,556
22,878
8,540 111 176
2,620 2,328
561
9,125 613 691 266
2,884
559 918 123 366
532
1,451 1,091
515 985
5,085 8,330 1,125
60 434
4,500
486 1,349
348 276
807
7,724 779
38 524
773 411
5,942 5,714
51
396 6,589
71 963
3,564
881 2,151 7,334 2,251 1,368
343
2,568 3,107
286 20,146
6,096 4,849 3,827 6,903 1,916
5,299
24,317 22,998
17 561
5,704,460 8,332,956
11,083 298
81,405 121,264 679,357
397,746
1,028 3,969
184,392 120,680
61,955
223,137 22,425 23,061 11,089
272,043
9,393 94,784
3,903 8,371
15,650 66,178 64,665 39,425 46,358
395,311 301,056 221,824
(D)9,895
268,534 12,610 91,426 28,654
5,847
101,164 241,707
6,891 (D)
16,063
73,680 12,084
229,047 452,659
1,128
11,927 329,875
1,202 118,345 208,805
22,284 43,042
427,069 82,964 32,678
6,706
195,989 260,958 28,959
1,249,078
514,961 254,945 99,871
242,593 88,218
582,941 816,240 692,711
298 61,955

8 2008 FRIS – GENERAL DATA 2007 CENSUS OF AGRICULTURE USDA, National Agricultural Statistics Service
Table 4. Land Irrigated by Method of Water Distribution: 2008 and 2003 [Excludes institutional, research, and experimental farms and farms with horticulture. For meaning of abbreviations and symbols, see introductory text]
Gravity systems Sprinkler systems Drip, trickle, or low-flow micro sprinklers Subirrigation
Geographic area Acres irrigated
Farms Acres irrigated Farms Acres irrigated Farms Acres irrigated Farms Acres irrigated
United States .............................2008 .. 2003 .. 2008 DATA Alabama ............................................... Alaska ................................................... Arizona ................................................. Arkansas ............................................... California .............................................. Colorado ............................................... Connecticut ........................................... Delaware .............................................. Florida ................................................... Georgia ................................................. Hawaii ................................................... Idaho ..................................................... Illinois .................................................... Indiana .................................................. Iowa ...................................................... Kansas .................................................. Kentucky ............................................... Louisiana .............................................. Maine .................................................... Maryland ............................................... Massachusetts ...................................... Michigan ............................................... Minnesota ............................................. Mississippi ............................................ Missouri ................................................ Montana ................................................ Nebraska .............................................. Nevada ................................................. New Hampshire .................................... New Jersey ........................................... New Mexico .......................................... New York .............................................. North Carolina ...................................... North Dakota ........................................ Ohio ...................................................... Oklahoma ............................................. Oregon .................................................. Pennsylvania ........................................ Rhode Island ........................................ South Carolina ...................................... South Dakota ........................................ Tennessee ............................................ Texas .................................................... Utah ...................................................... Vermont ................................................ Virginia .................................................. Washington ........................................... West Virginia ........................................ Wisconsin ............................................. Wyoming ............................................... Water Resources Regions Region 01 New England ....................... Region 02 Mid-Atlantic .......................... Region 03 South Atlantic-Gulf .............. Region 04 Great Lakes ......................... Region 05 Ohio ..................................... Region 06 Tennessee ........................... Region 07 Upper Mississippi ................ Region 08 Lower Mississippi ................ Region 09 Souris-Red-Rainy ................ Region 10 Missouri ............................... Region 11 Arkansas-White-Red ........... Region 12 Texas-Gulf ........................... Region 13 Rio Grande .......................... Region 14 Upper Colorado ................... Region 15 Lower Colorado ................... Region 16 Great Basin ......................... Region 17 Pacific Northwest ................. Region 18 California ............................. Region 19 Alaska ................................. Region 20 Hawaii .................................
54,929,915 52,492,687
75,023 1,589
861,496 4,493,435 7,329,245
2,865,840
2,337 104,620
1,222,797 1,007,763
99,577
3,319,827 457,078 404,399 162,838
2,570,003
32,380 932,712 18,151 85,552
17,421
531,927 504,330
1,451,652 1,232,354
1,947,159 8,365,545
685,261 720
59,412
835,639 20,158
148,999 248,070 18,548
461,235
1,758,602 17,359
681 104,091
360,071 72,862
5,356,876 1,068,929
488
44,818 1,675,898
906 396,123
1,497,119
39,468 309,972
2,554,462 721,586 304,963
41,141
1,339,287 7,346,743
158,617 13,825,255
5,412,670 3,499,153 1,079,145 1,359,888
936,248
1,599,757 6,855,656 7,444,738
1,589 99,577
89,646 100,626
91 1
2,064 3,714
15,530
10,252 - -
907 447
248
7,853 32 22 57
1,475
110 1,391
- 69
52 51 51
957 867
6,064 6,506 1,308
11 52
6,742
56 70
141 53
329
4,096 84
4 79
437
89 4,567 6,278
5
67 2,042
13 115
4,197
67 302
1,599 163 184
67
211 6,180
12 18,564
4,775 3,377 6,429 7,854 2,613
6,254
14,700 16,046
1 248
22,017,757 23,106,280
2,542 (D)
764,655 3,747,542 4,189,852
1,547,072
- -
473,527 52,599
3,635
797,221 3,602 6,779 4,744
184,624
2,564 823,257
- 236
648
1,124 19,487
1,070,945 755,671
1,102,878 1,669,351
459,182 54
3,069
460,112 926
2,710 51,001
899
67,707 668,883
384 4
3,995
66,857 4,550
1,032,043 605,133
15
1,076 199,917
(D)7,683
1,156,819
706 5,650
536,569 5,158 7,857
(D)
31,229 5,799,090
14,163 4,117,142
1,232,853
820,850 660,575
1,036,243 826,066
932,543
1,767,379 4,219,623
(D)3,635
114,348 103,154
353 16
729 1,013
18,369
4,337 76
287 1,374 2,892
313
7,990 991
1,021 470
3,811
549 402 140 458
611
1,517 1,433
529 1,306
3,920
14,018 580
41 458
2,574
324 1,632
505 202
1,114 9,389
394 39
508
833 324
7,744 6,186
28
398 8,892
56 1,137 2,065
918 1,990 6,839 2,267 1,422
261
3,520 2,553
390 23,594
6,063 6,041 2,280 4,429
893
5,383 26,616 18,560
16 313
30,877,057 26,888,528
69,642 1,707
178,184 814,449
1,367,179
1,402,688 1,397
103,887 184,965 943,612
6,152
2,599,343 457,236 404,593 163,147
2,435,812
29,384 142,165 27,314 82,099
16,492
503,738 489,573 405,151 485,659
881,591
6,724,262 232,281
494 42,905
459,082 13,708
144,913 208,796 14,712
398,666
1,080,500 10,710
502 97,983
296,997 68,061
4,191,588 521,732
235
41,343 1,378,576
592 399,029 352,231
46,313 277,701
1,434,045 686,994 300,370
36,615
1,325,395 1,653,311
151,774 9,856,566
4,270,847 2,594,470
441,640 380,010 196,301
724,114
5,031,101 1,461,631
1,707 6,152
43,368 41,802
239 7
391 345
21,253
524 89 48
3,355 1,051
663 401
96 105
38
153 186
72 61
160
117 739
83 208 119
290
54 55 46
260
654 407 578
7 202
217
1,602 770
31 379
18
247 2,623
211 39
311
3,609 35
184 36
358 1,516 5,769 1,114
629
246 314 406
- 260
979
2,512 319 438 393
322
5,867 21,256
7 663
3,756,134 2,963,742
2,843 22
54,087 6,800
2,336,130
23,061 959 886
549,324 97,930
94,908 22,829
1,146 1,749
262
9,268 1,089
200 312
3,301
1,218 30,927
660 3,568 2,366
1,740 4,189
832 196
15,935
30,308 8,116 8,605
105 3,830
11,239 81,109
6,761 206
8,148
1,506 3,756
173,272 3,298
247
3,602 138,308
183 1,538 3,260
2,935 32,142
668,693 39,417
5,196
4,860 2,693 7,997
- 26,876
32,019
155,805 38,728
3,156 54,371
3,437
242,849 2,340,030
22 94,908
1,292 614
4 - - -
104
13 - -
38 52
-
432 - - -
- - - - -
- 4 - - -
114 - - - -
186 3 - - 1
- - - - -
2 -
10 246
-
- - - -
83
- 3
94 5 -
- - - -
133
62 10
124 67
-
246 444 104
- -
199,993 279,522
4 - - -
66,282
2,495 - -
55,776 520
-
44,598 - - -
- - - - -
- 684
- - -
13,332 - - - -
3,968 120
- -
(D)
- - - - -
(D)-
500 9,194
-
- - - -
2,270
- 120
56,300 814
-
- - - -
14,212
744 500
3,224 3,705
-
9,194 44,898 66,282
- -
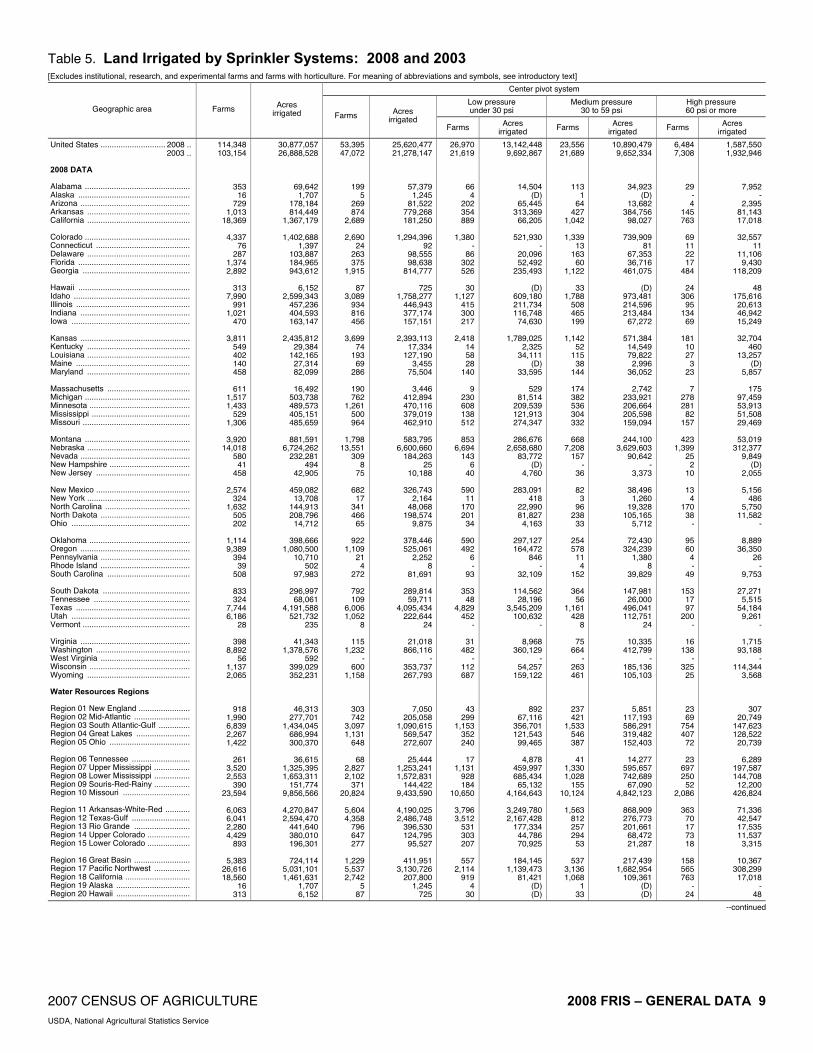
2007 CENSUS OF AGRICULTURE 2008 FRIS – GENERAL DATA 9 USDA, National Agricultural Statistics Service
Table 5. Land Irrigated by Sprinkler Systems: 2008 and 2003 [Excludes institutional, research, and experimental farms and farms with horticulture. For meaning of abbreviations and symbols, see introductory text]
Center pivot system
Low pressure under 30 psi
Medium pressure 30 to 59 psi
High pressure 60 psi or more Geographic area Farms Acres
irrigated Farms Acres irrigated
Farms Acres irrigated Farms Acres
irrigated Farms Acres irrigated
United States ............................. 2008 .. 2003 .. 2008 DATA Alabama ............................................... Alaska .................................................. Arizona ................................................. Arkansas .............................................. California .............................................. Colorado ............................................... Connecticut .......................................... Delaware .............................................. Florida .................................................. Georgia ................................................ Hawaii .................................................. Idaho .................................................... Illinois ................................................... Indiana ................................................. Iowa ..................................................... Kansas ................................................. Kentucky .............................................. Louisiana .............................................. Maine ................................................... Maryland .............................................. Massachusetts ..................................... Michigan ............................................... Minnesota ............................................. Mississippi ............................................ Missouri ................................................ Montana ............................................... Nebraska .............................................. Nevada ................................................. New Hampshire .................................... New Jersey .......................................... New Mexico .......................................... New York .............................................. North Carolina ...................................... North Dakota ........................................ Ohio ..................................................... Oklahoma ............................................. Oregon ................................................. Pennsylvania ........................................ Rhode Island ........................................ South Carolina ..................................... South Dakota ....................................... Tennessee ........................................... Texas ................................................... Utah ..................................................... Vermont ................................................ Virginia ................................................. Washington .......................................... West Virginia ........................................ Wisconsin ............................................. Wyoming .............................................. Water Resources Regions Region 01 New England ....................... Region 02 Mid-Atlantic ......................... Region 03 South Atlantic-Gulf .............. Region 04 Great Lakes ........................ Region 05 Ohio .................................... Region 06 Tennessee .......................... Region 07 Upper Mississippi ................ Region 08 Lower Mississippi ................ Region 09 Souris-Red-Rainy ................ Region 10 Missouri .............................. Region 11 Arkansas-White-Red ........... Region 12 Texas-Gulf .......................... Region 13 Rio Grande ......................... Region 14 Upper Colorado ................... Region 15 Lower Colorado ................... Region 16 Great Basin ......................... Region 17 Pacific Northwest ................ Region 18 California ............................. Region 19 Alaska ................................. Region 20 Hawaii .................................
114,348 103,154
353 16
729 1,013
18,369
4,337 76
287 1,374 2,892
313
7,990 991
1,021 470
3,811
549 402 140 458
611
1,517 1,433
529 1,306
3,920
14,018 580
41 458
2,574
324 1,632
505 202
1,114 9,389
394 39
508
833 324
7,744 6,186
28
398 8,892
56 1,137 2,065
918 1,990 6,839 2,267 1,422
261
3,520 2,553
390 23,594
6,063 6,041 2,280 4,429
893
5,383 26,616 18,560
16 313
30,877,057 26,888,528
69,642 1,707
178,184 814,449
1,367,179
1,402,688 1,397
103,887 184,965 943,612
6,152
2,599,343 457,236 404,593 163,147
2,435,812
29,384 142,165 27,314 82,099
16,492
503,738 489,573 405,151 485,659
881,591
6,724,262 232,281
494 42,905
459,082 13,708
144,913 208,796 14,712
398,666
1,080,500 10,710
502 97,983
296,997 68,061
4,191,588 521,732
235
41,343 1,378,576
592 399,029 352,231
46,313 277,701
1,434,045 686,994 300,370
36,615
1,325,395 1,653,311
151,774 9,856,566
4,270,847 2,594,470
441,640 380,010 196,301
724,114
5,031,101 1,461,631
1,707 6,152
53,395 47,072
199 5
269 874
2,689
2,690 24
263 375
1,915
87 3,089
934 816 456
3,699
74 193
69 286
190 762
1,261 500 964
1,798
13,551 309
8 75
682
17 341 466
65
922 1,109
21 4
272
792 109
6,006 1,052
8
115 1,232
- 600
1,158
303 742
3,097 1,131
648
68 2,827 2,102
371 20,824
5,604 4,358
796 647 277
1,229 5,537 2,742
5 87
25,620,477 21,278,147
57,379 1,245
81,522 779,268 181,250
1,294,396
92 98,555 98,638
814,777
725 1,758,277
446,943 377,174 157,151
2,393,113
17,334 127,190
3,455 75,504
3,446
412,894 470,116 379,019 462,910
583,795
6,600,660 184,263
25 10,188
326,743
2,164 48,068
198,574 9,875
378,446 525,061
2,252 8
81,691
289,814 59,711
4,095,434 222,644
24
21,018 866,116
- 353,737 267,793
7,050 205,058
1,090,615 569,547 272,607
25,444
1,253,241 1,572,831
144,422 9,433,590
4,190,025 2,486,748
396,530 124,795 95,527
411,951
3,130,726 207,800
1,245 725
26,970 21,619
66 4
202 354 889
1,380
- 86
302 526
30
1,127 415 300 217
2,418
14 58 28
140
9 230 608 138 512
853
6,694 143
6 40
590
11 170 201
34
590 492
6 -
93
353 48
4,829 452
-
31 482
- 112 687
43 299
1,153 352 240
17
1,131 928 184
10,650
3,796 3,512
531 303 207
557
2,114 919
4 30
13,142,448 9,692,867
14,504 (D)
65,445 313,369 66,205
521,930
- 20,096 52,492
235,493
(D)609,180 211,734 116,748 74,630
1,789,025
2,325 34,111
(D)33,595
529
81,514 209,539 121,913 274,347
286,676
2,658,680 83,772
(D)4,760
283,091
418 22,990 81,827
4,163
297,127 164,472
846 -
32,109
114,562 28,196
3,545,209 100,632
-
8,968 360,129
- 54,257
159,122
892 67,116
356,701 121,543 99,465
4,878
459,997 685,434 65,132
4,164,643
3,249,780 2,167,428
177,334 44,786 70,925
184,145
1,139,473 81,421
(D)(D)
23,556 21,689
113 1
64 427
1,042
1,339 13
163 60
1,122
33 1,788
508 465 199
1,142
52 115
38 144
174 382 536 304 332
668
7,208 157
- 36
82
3 96
238 33
254 578
11 4
152
364 56
1,161 428
8
75 664
- 263 461
237 421
1,533 546 387
41
1,330 1,028
155 10,124
1,563
812 257 294
53
537 3,136 1,068
1 33
10,890,479 9,652,334
34,923 (D)
13,682 384,756 98,027
739,909
81 67,353 36,716
461,075
(D) 973,481 214,596 213,484 67,272
571,384 14,549 79,822
2,996 36,052
2,742
233,921 206,664 205,598 159,094
244,100
3,629,603 90,642
- 3,373
38,496
1,260 19,328
105,165 5,712
72,430
324,239 1,380
8 39,829
147,981 26,000
496,041 112,751
24
10,335 412,799
- 185,136 105,103
5,851 117,193 586,291 319,482 152,403
14,277
595,657 742,689 67,090
4,842,123
868,909 276,773 201,661 68,472 21,287
217,439
1,682,954 109,361
(D) (D)
6,484 7,308
29 - 4
145 763
69 11 22 17
484
24 306
95 134
69
181 10 27
3 23
7
278 281
82 157
423
1,399 25
2 10
13
4 170
38 -
95 60
4 -
49
153 17 97
200 -
16 138
- 325
25
23 69
754 407
72
23 697 250
52 2,086
363
70 17 73 18
158 565 763
- 24
1,587,550 1,932,946
7,952 -
2,395 81,143 17,018
32,557
11 11,106
9,430 118,209
48
175,616 20,613 46,942 15,249
32,704
460 13,257
(D)5,857
175
97,459 53,913 51,508 29,469
53,019
312,377 9,849
(D)2,055
5,156
486 5,750
11,582 -
8,889 36,350
26 -
9,753
27,271 5,515
54,184 9,261
-
1,715 93,188
- 114,344
3,568
307 20,749
147,623 128,522 20,739
6,289
197,587 144,708 12,200
426,824
71,336 42,547 17,535 11,537
3,315
10,367 308,299 17,018
- 48
--continued

10 2008 FRIS – GENERAL DATA 2007 CENSUS OF AGRICULTURE USDA, National Agricultural Statistics Service
Table 5. Land Irrigated by Sprinkler Systems: 2008 and 2003 - Con. [Excludes institutional, research, and experimental farms and farms with horticulture. For meaning of abbreviations and symbols, see introductory text]
Linear move tower sprinklers Solid set and permanent sprinklers
Low pressure under 30 psi
Medium to high pressure 30 psi or more
Low pressure under 30 psi
Medium to high pressure 30 psi or more Geographic area
Farms Acres irrigated
Farms Acres irrigated Farms Acres
irrigated
Farms Acres irrigated
Farms Acres irrigated Farms Acres
irrigated
United States .............................2008 .. 2003 .. 2008 DATA Alabama ............................................... Alaska ................................................... Arizona ................................................. Arkansas ............................................... California .............................................. Colorado ............................................... Connecticut ........................................... Delaware .............................................. Florida ................................................... Georgia ................................................. Hawaii ................................................... Idaho ..................................................... Illinois .................................................... Indiana .................................................. Iowa ...................................................... Kansas .................................................. Kentucky ............................................... Louisiana .............................................. Maine .................................................... Maryland ............................................... Massachusetts ...................................... Michigan ............................................... Minnesota ............................................. Mississippi ............................................ Missouri ................................................ Montana ................................................ Nebraska .............................................. Nevada ................................................. New Hampshire .................................... New Jersey ........................................... New Mexico .......................................... New York .............................................. North Carolina ...................................... North Dakota ........................................ Ohio ...................................................... Oklahoma ............................................. Oregon .................................................. Pennsylvania ........................................ Rhode Island ........................................ South Carolina ...................................... South Dakota ........................................ Tennessee ............................................ Texas .................................................... Utah ...................................................... Vermont ................................................ Virginia .................................................. Washington ........................................... West Virginia ........................................ Wisconsin ............................................. Wyoming ............................................... Water Resources Regions Region 01 New England ....................... Region 02 Mid-Atlantic .......................... Region 03 South Atlantic-Gulf .............. Region 04 Great Lakes ......................... Region 05 Ohio ..................................... Region 06 Tennessee ........................... Region 07 Upper Mississippi ................ Region 08 Lower Mississippi ................ Region 09 Souris-Red-Rainy ................ Region 10 Missouri ............................... Region 11 Arkansas-White-Red ........... Region 12 Texas-Gulf ........................... Region 13 Rio Grande .......................... Region 14 Upper Colorado ................... Region 15 Lower Colorado ................... Region 16 Great Basin ......................... Region 17 Pacific Northwest ................. Region 18 California ............................. Region 19 Alaska ................................. Region 20 Hawaii .................................
2,583 2,311
12 2 4
62 74
589
2 6 3
12
3 214
4 32
4
14 3 2 2 7
-
18 15
8 14
172
55 23
- 13
82
9 138
4 4
20
127 8 -
15
2 18
384 234
-
4 112
2 31 20
4 42
180 64 19
3
42 83
3 427
22
394 8
478 66
130 534
79 2 3
395,380 344,100
238 (D)
6,560 1,620
22,891
15,914 (D)
1,857 6,650
762
980 87,502
708 4,630
453
1,190 560 (D) (D)
1,276
- 2,977 1,876 8,380 1,526
7,903
29,225 2,357
- 965
85,528
988 2,713
444 160
2,040
29,700 454
- 1,072
(D)
941 28,634 18,879
-
480 5,234
(D) 2,212 1,934
240 5,361
11,435 5,765 2,407
(D)
5,651 14,652
412 55,442
2,368
42,674 9,269
70,560 7,800
23,017
112,140 24,811
(D) 980
1,475 791
7 - 4
61 63
491
- 4 2 -
- 47
2 20
2
- 3 1 - 5
- - - 1 4
148
29 15
- 5
80
2 85
1 -
2 46
- - 2
-
12 28
200 -
- 82
- 19
2
- 14 96 36 11
1 8
68 -
241
4 38
6 462
66
41 317
66 - -
239,724 149,566
203 -
6,560 (D)
13,866
7,738 -
(D)(D)
-
- 40,847
(D)1,625
(D)
- (D)(D)
- (D)
- - -
(D)346
1,715
25,120 279
- 741
(D)(D)85 (D)
-
(D)12,602
- -
(D)
- 607
17,330 9,910
-
- 1,834
- 1,058
(D)
- 3,631
(D)1,263
197
(D)1,751 4,111
- 31,927
728
31,370 (D)
67,040 7,800
6,109
54,288 15,586
- -
1,129 1,523
5 2 - 1
11
98 2 2 1
12
3 167
2 25
2
14 2 1 2 2
-
18 15
7 10
27 26
8 - 8
2 7
53 3 4
18 81
8 -
13
2 6
356 37
-
4 30
2 12 18
4 28 84 41 10
2
34 15
3 189
18
356 2
16 -
92 217
13 2 3
155,656 194,534
35 (D)
- (D)
9,025
8,176 (D)(D)(D)
762
980 46,655
(D)3,005
(D)
1,190 (D)(D)(D)(D)
-
2,977 1,876
(D)1,180
6,188 4,105 2,078
- 224
(D)(D)
2,628 (D)
160
(D)17,098
454 -
(D)
(D)334
11,304 8,969
-
480 3,400
(D)1,154
(D)
240 1,730
(D)4,502 2,210
(D)
3,900 10,541
412 23,515
1,640
11,304 (D)
3,520 -
16,908 57,852
9,225 (D)
980
23,323 19,812
31 3
240 27
9,428
231 6
14 812 544
97
1,577 18 58
5
- 6
79 15
6
351 260
40 3
37
45 -
14 7
116
660 56
305 2
28
54 1,725
52 12 59
-
15 409 393
8
4 5,195
1 261
14
394 239
1,747 316
60
17 310 126
- 61
119 409 657 280 240
384
8,401 9,463
3 97
1,184,953 1,174,210
531 12
28,315 2,825
575,216
17,638 598 273
33,728 45,297
1,643
59,036 1,157 1,907
60
- 24
5,986 (D)
210
(D)17,208
3,310 7,000
37
771 -
2,233 39
8,329
2,043 1,390
13,843 (D)
212
5,532 44,799
775 129
1,175
- 975
18,631 6,724
105
(D)231,733
(D)20,153
140
21,618 10,689 96,124 19,375
2,242
1,025 22,848 13,057
- 1,595
25,609 18,631
1,679 1,170
28,315
9,391 330,837 579,093
12 1,643
6,534 5,048
12 -
223 -
3,653
38 - -
375 94
27
363 1
15 -
- - 5 2 -
8 13
6 2 -
20 - 2 - 8
330
31 47
2 4
2
14 5 5 5
- -
279 85
-
- 845
- 13
-
15 44
530 17 16
3
19 7 -
22
40 279 329
85 223
3
1,220 3,655
- 27
195,255 277,730
144 -
3,309 -
84,419
17,252 - -
13,855 8,350
(D)
20,872 (D)
613 -
- -
2,270 (D)
-
330 1,032 1,200
(D) -
600 -
(D) -
228
1,247 217
1,720 (D) 28
(D)
3,655 98 (D)
810
- -
2,511 670
-
- 23,210
- 156
-
344 543
24,759 1,060
733
(D) 1,356 4,470
- 1,284
19,672
2,511 1,023
644 3,309
630
47,577 84,579
- (D)
17,226 14,831
19 3
17 27
6,180
193 6
14 437 450
70
1,222 17 45
5
- 6
74 13
6
343 247
40 3
37
25 -
12 7
108
330 25
258 -
26
52 1,715
47 7
54
- 15
130 308
8
4 4,358
1 248
14
379 195
1,217 301
46
14 297 121
- 39
79
130 328 195
17
381 7,199 6,215
3 70
989,698 896,480
387 12
25,006 2,825
490,797
386 598 273
19,873 36,947
(D)
38,164 (D)
1,294 60
-
24 3,716
(D)210
(D)
16,176 2,110
(D)37
171
- (D)39
8,101
796 1,173
12,123 -
184
(D)41,144
677 (D)
365
- 975
16,120 6,054
105
(D)208,523
(D)19,997
140
21,274 10,146 71,365 18,315
1,509
(D)21,492
8,587 -
311
5,937 16,120
656 526
25,006
8,761 283,260 494,514
12 (D)
--continued

2007 CENSUS OF AGRICULTURE 2008 FRIS – GENERAL DATA 11 USDA, National Agricultural Statistics Service
Table 5. Land Irrigated by Sprinkler Systems: 2008 and 2003 - Con. [Excludes institutional, research, and experimental farms and farms with horticulture. For meaning of abbreviations and symbols, see introductory text]
Side roll, wheel move, or other mechanical move Big gun or traveler Hand move
Geographic area
Farms Acres irrigated Farms Acres irrigated Farms Acres irrigated
United States ............................. 2008 .. 2003 .. 2008 DATA Alabama ............................................... Alaska .................................................. Arizona ................................................. Arkansas .............................................. California .............................................. Colorado ............................................... Connecticut .......................................... Delaware .............................................. Florida .................................................. Georgia ................................................ Hawaii .................................................. Idaho .................................................... Illinois ................................................... Indiana ................................................. Iowa ..................................................... Kansas ................................................. Kentucky .............................................. Louisiana .............................................. Maine ................................................... Maryland .............................................. Massachusetts ..................................... Michigan ............................................... Minnesota ............................................. Mississippi ............................................ Missouri ................................................ Montana ............................................... Nebraska .............................................. Nevada ................................................. New Hampshire .................................... New Jersey .......................................... New Mexico .......................................... New York .............................................. North Carolina ...................................... North Dakota ........................................ Ohio ..................................................... Oklahoma ............................................. Oregon ................................................. Pennsylvania ........................................ Rhode Island ........................................ South Carolina ..................................... South Dakota ....................................... Tennessee ........................................... Texas ................................................... Utah ..................................................... Vermont ................................................ Virginia ................................................. Washington .......................................... West Virginia ........................................ Wisconsin ............................................. Wyoming .............................................. Water Resources Regions Region 01 New England ....................... Region 02 Mid-Atlantic ......................... Region 03 South Atlantic-Gulf .............. Region 04 Great Lakes ........................ Region 05 Ohio .................................... Region 06 Tennessee .......................... Region 07 Upper Mississippi ................ Region 08 Lower Mississippi ................ Region 09 Souris-Red-Rainy ................ Region 10 Missouri .............................. Region 11 Arkansas-White-Red ........... Region 12 Texas-Gulf .......................... Region 13 Rio Grande ......................... Region 14 Upper Colorado ................... Region 15 Lower Colorado ................... Region 16 Great Basin ......................... Region 17 Pacific Northwest ................ Region 18 California ............................. Region 19 Alaska ................................. Region 20 Hawaii .................................
18,656 15,025
12 2
16 76
1,584
768 - 6
43 83
17
2,818 18 56 19
54 43
6 1
35
7 93 21 12 63
2,415
341 335
4 9
697
67 52 30
6
69 2,128
4 1
60
34 13
376 3,668
-
7 1,669
- 35
783
13 121 250 115
54
18 95
118 20
2,690
207 334 597
2,539 48
2,877 6,789 1,752
2 17
1,885,420 1,819,293
1,734 (D)
3,537 22,637
140,516
58,724 -
585 5,736
21,370
(D)486,182
3,091 6,914 4,879
18,677
2,222 766 (D)
859
735 3,511 1,507 8,532
11,603
234,472 41,067 41,100
(D)(D)
31,750
3,138 1,812
(D)378
4,133
265,480 309 (D)
1,194
4,265 1,365
35,478 214,995
-
(D)127,919
- 3,024
58,827
785 6,158
31,006 5,971 6,683
(D)
10,015 41,832
6,560 239,864
33,060 33,250 27,432
153,612 5,727
213,732 866,672 200,513
(D)(D)
9,906 7,943
72 -
38 76
990
189 6
50 176 652
9
127 37
197 13
134 210
23 56 72
26
579 220
17 215
471 553
2 9
178
95 53
848 25 45
67
1,154 108
3 126
3
96 303 138
2
198 687
5 233 320
100 553
1,942 804 307
88
436 133
18 1,394
179 304
42 256
38
96 2,199 1,008
- 9
696,380 624,598
8,718 -
2,692 7,317
29,936
5,430 (D)
2,617 38,235 56,456
1,162 3,575 5,296
13,267 604
22,832
7,158 4,837
(D) 3,858
(D)
63,335 12,480
2,220 9,507
6,544
42,454 (D)
332 18,793
533
3,515 73,025
1,725 2,456
2,870
93,557 4,572
(D) 11,656
(D)
4,526 7,254 1,916
(D)
15,134 62,563
301 18,238
8,072
14,978 42,534
189,399 80,225 12,725
6,926
31,882 10,381
366 85,296
10,930
7,257 126
6,575 2,692
1,094
160,785 31,047
- 1,162
29,461 28,577
53 8
213 58
7,420
540 43
- 34
306
153 3,993
20 43
-
- 228 108
42 84
56
195 75
- 76
1,120
350 84 21
154
569 175 330
18 98
112
5,544 268
24 124
51 90
587 2,930
10
103 2,258
49 208 436
186 593 877 387 454
85
264 172
7 1,201
184 583 380
1,412 275
2,751
12,007 7,482
8 153
1,094,447 1,648,180
1,042 188
55,558 782
417,370
10,586 523
- 1,978 4,950
(D)
204,771 41
701 -
- 2,086
(D)620 392
239
3,813 284
- 76
48,106 10,856
(D)(D)(D)
12,485
2,513 5,452
69 1,631
5,645
121,903 2,348
(D)1,195
(D)
543 6,157
56,574 (D)
1,751
85,011 (D)
1,665 15,465
1,642 7,901
15,466 6,111 3,706
(D)
1,758 558
14 40,779
8,855 5,910 6,604
23,298 56,240
64,929
429,941 418,367
188 (D)

12 2008 FRIS – GENERAL DATA 2007 CENSUS OF AGRICULTURE USDA, National Agricultural Statistics Service
Table 6. Land Irrigated by Drip, Trickle, or Low-flow Micro Sprinklers: 2008 and 2003 [Excludes institutional, research, and experimental farms and farms with horticulture. For meaning of abbreviations and symbols, see introductory text]
Surface drip Sub-surface drip Low-flow micro sprinklers Geographic area Farms Acres
irrigated Farms Acres irrigated Farms Acres irrigated Farms Acres irrigated
United States .............................2008 .. 2003 .. 2008 DATA Alabama ............................................... Alaska ................................................... Arizona ................................................. Arkansas ............................................... California .............................................. Colorado ............................................... Connecticut ........................................... Delaware .............................................. Florida ................................................... Georgia ................................................. Hawaii ................................................... Idaho ..................................................... Illinois .................................................... Indiana .................................................. Iowa ...................................................... Kansas .................................................. Kentucky ............................................... Louisiana .............................................. Maine .................................................... Maryland ............................................... Massachusetts ...................................... Michigan ............................................... Minnesota ............................................. Mississippi ............................................ Missouri ................................................ Montana ................................................ Nebraska .............................................. Nevada ................................................. New Hampshire .................................... New Jersey ........................................... New Mexico .......................................... New York .............................................. North Carolina ...................................... North Dakota ........................................ Ohio ...................................................... Oklahoma ............................................. Oregon .................................................. Pennsylvania ........................................ Rhode Island ........................................ South Carolina ...................................... South Dakota ........................................ Tennessee ............................................ Texas .................................................... Utah ...................................................... Vermont ................................................ Virginia .................................................. Washington ........................................... West Virginia ........................................ Wisconsin ............................................. Wyoming ............................................... Water Resources Regions Region 01 New England ....................... Region 02 Mid-Atlantic .......................... Region 03 South Atlantic-Gulf .............. Region 04 Great Lakes ......................... Region 05 Ohio ..................................... Region 06 Tennessee ........................... Region 07 Upper Mississippi ................ Region 08 Lower Mississippi ................ Region 09 Souris-Red-Rainy ................ Region 10 Missouri ............................... Region 11 Arkansas-White-Red ........... Region 12 Texas-Gulf ........................... Region 13 Rio Grande .......................... Region 14 Upper Colorado ................... Region 15 Lower Colorado ................... Region 16 Great Basin ......................... Region 17 Pacific Northwest ................. Region 18 California ............................. Region 19 Alaska ................................. Region 20 Hawaii .................................
43,368 41,802
239 7
391 345
21,253
524 89 48
3,355 1,051
663 401
96 105
38
153 186
72 61
160
117 739
83 208 119
290
54 55 46
260
654 407 578
7 202
217
1,602 770
31 379
18
247 2,623
211 39
311
3,609 35
184 36
358 1,516 5,769 1,114
629
246 314 406
- 260
979
2,512 319 438 393
322
5,867 21,256
7 663
3,756,134 2,963,742
2,843 22
54,087 6,800
2,336,130
23,061 959 886
549,324 97,930
94,908 22,829
1,146 1,749
262
9,268 1,089
200 312
3,301
1,218 30,927
660 3,568 2,366
1,740 4,189
832 196
15,935
30,308 8,116 8,605
105 3,830
11,239 81,109
6,761 206
8,148
1,506 3,756
173,272 3,298
247
3,602 138,308
183 1,538 3,260
2,935 32,142
668,693 39,417
5,196
4,860 2,693 7,997
- 26,876
32,019
155,805 38,728
3,156 54,371
3,437
242,849 2,340,030
22 94,908
25,716 24,739
170 4
183 225
12,781
270 61 27
942 700
525
85 57 67 33
86
173 72 58
108
63 594
66 196 119
145
- 53 30
181
495 333 278
- 152
192
1,049 621
27 189
7
218 1,240
3 33
272
2,316 23
158 36
249 1,161 2,465
911 512
201 227 332
- 154
717
1,236 141 240 183
114
3,560 12,784
4 525
1,714,859 1,398,324
1,691 19
14,620 6,500
1,246,243
6,097 317 609
83,540 53,618
83,766
5,044 951 691 136
468
1,049 188 297
2,093
551 22,228
576 718 390
290
- (D)
151 9,567
7,834 5,347 3,080
- 2,422
654
12,174 5,462
168 4,379
21
2,467 24,988
120 204
2,815
95,854 (D)
1,005 3,260
1,524 20,914
147,189 28,332
3,521
2,578 1,755 6,825
- 6,426
3,175
24,456 6,219
670 14,620
502
112,225 1,250,143
19 83,766
4,694 4,744
53 3
24 20
648
102 26 21
159 271
44 21 26 27
5
67 6 2 5
45
44 104
1 65 38
-
54 3
15 60
66 31
266 -
56
21 464 140
8 83
-
28 1,296
- 7
27
212 17 13
-
102 277 878 146 115
46 45 22
- 110
173
1,253 84 22 26
3
697 648
3 44
641,370 403,302
856 3
28,086 60
242,235
4,085 (D)
277 48,376 27,999
(D)
4,076 65
1,039 126
8,800
12 (D) 15
705
(D) 7,691
(D) 1,950 1,976
-
4,189 (D) 39
5,557
18,477 881
3,133 -
1,227
9,163 58,781
1,060 (D)
3,013
- 966
133,792 -
(D)
547 10,646
(D) 26
-
538 8,174
84,339 9,289 1,578
1,979
(D) 66
- 7,389
23,582
120,634 28,515
78 28,370
(D)
73,503 242,235
3 (D)
15,871 14,418
26 -
193 140
9,344
248 2 -
2,377 240
134 295
13 15
-
- 7 2 - 7
10 53 18 12
-
145 - 3 3
25
159 54 34
7 12
45
172 31
2 109
11 21
380 208
2
12 1,287
- 13
-
17 115
2,786 74 29
19 44 96
- 54
168 318 158 214 193
209
1,899 9,344
- 134
1,399,905 1,162,116
296 -
11,381 240
847,652
12,879 (D)
- 417,408 16,313
(D)
13,709 130
19 -
- 28 (D)
- 503
(D)
1,008 (D)
900 -
1,450 -
(D)6
811
3,997 1,888 2,392
105 181
1,422
10,154 239 (D)
756
1,485 323
14,492 3,178
(D)
240 31,808
- 507
-
873 3,054
437,165 1,796
97
303 (D)
1,106 -
13,061
5,262 10,715
3,994 2,408
11,381
(D)57,121
847,652 -
(D)

2007 CENSUS OF AGRICULTURE 2008 FRIS – GENERAL DATA 13 USDA, National Agricultural Statistics Service
Table 7. Land Irrigated with Gravity Irrigation by Field Water Delivery System: 2008 and 2003 [Excludes institutional, research, and experimental farms and farms with horticulture. For meaning of abbreviations and symbols, see introductory text]
Down rows or furrows
Open surface ditches Above-ground pipe (except poly tubing)
Poly tubing (or other single-year use, lay-flat tubing) Lined Unlined
Underground pipe Geographic area Farms Acres irrigated Farms Acres
irrigated Farms Acres
irrigated Farms Acres irrigated Farms Acres
irrigated Farms Acres irrigated Farms Acres
irrigated
United States .................. 2008 .. 2003 .. 2008 DATA Alabama .................................... Alaska ....................................... Arizona ...................................... Arkansas ................................... California ................................... Colorado .................................... Connecticut ............................... Delaware ................................... Florida ....................................... Georgia ..................................... Hawaii ....................................... Idaho ......................................... Illinois ........................................ Indiana ...................................... Iowa .......................................... Kansas ...................................... Kentucky ................................... Louisiana ................................... Maine ........................................ Maryland ................................... Massachusetts .......................... Michigan .................................... Minnesota .................................. Mississippi ................................. Missouri ..................................... Montana .................................... Nebraska ................................... Nevada ...................................... New Hampshire ......................... New Jersey ............................... New Mexico ............................... New York ................................... North Carolina ........................... North Dakota ............................. Ohio .......................................... Oklahoma .................................. Oregon ...................................... Pennsylvania ............................. Rhode Island ............................. South Carolina .......................... South Dakota ............................ Tennessee ................................ Texas ........................................ Utah .......................................... Vermont ..................................... Virginia ...................................... Washington ............................... West Virginia ............................. Wisconsin .................................. Wyoming ................................... Water Resources Regions Region 01 New England ............ Region 02 Mid-Atlantic .............. Region 03 South Atlantic-Gulf ... Region 04 Great Lakes ............. Region 05 Ohio ......................... Region 06 Tennessee ............... Region 07 Upper Mississippi ..... Region 08 Lower Mississippi ..... Region 09 Souris-Red-Rainy ..... Region 10 Missouri ................... Region 11 Arkansas-White-Red Region 12 Texas-Gulf ............... Region 13 Rio Grande .............. Region 14 Upper Colorado ........ Region 15 Lower Colorado ........ Region 16 Great Basin .............. Region 17 Pacific Northwest ..... Region 18 California .................. Region 19 Alaska ...................... Region 20 Hawaii ......................
89,646 100,626
91 1
2,064 3,714
15,530
10,252 - -
907 447
248
7,853 32 22 57
1,475
110 1,391
- 69
52 51 51
957 867
6,064 6,506 1,308
11 52
6,742
56 70
141 53
329
4,096 84
4 79
437
89 4,567 6,278
5
67 2,042
13 115
4,197
67 302
1,599 163 184
67
211 6,180
12 18,564
4,775 3,377 6,429 7,854 2,613
6,254
14,700 16,046
1 248
22,017,757 23,106,280
2,542 (D)
764,655 3,747,542 4,189,852
1,547,072
- -
473,527 52,599
3,635
797,221 3,602 6,779 4,744
184,624
2,564 823,257
- 236
648
1,124 19,487
1,070,945 755,671
1,102,878 1,669,351
459,182 54
3,069
460,112 926
2,710 51,001
899
67,707 668,883
384 4
3,995
66,857 4,550
1,032,043 605,133
15
1,076 199,917
(D) 7,683
1,156,819
706 5,650
536,569 5,158 7,857
(D)
31,229 5,799,090
14,163 4,117,142
1,232,853
820,850 660,575
1,036,243 826,066
932,543
1,767,379 4,219,623
(D) 3,635
44,969 49,929
72 1
414 2,957 6,620
6,578
- -
204 172
148
4,346 17 14 33
1,282
59 675
- 47
-
51 14
859 821
948
6,218 143
8 35
1,745
45 30 79 41
198
1,139 58
- 76
115
60 2,906 2,514
5
62 1,304
4 41
1,811
8 220 551 142 119
39 87
4,726 -
11,142
3,337 2,103 2,060 4,270
696
1,876 6,675 6,769
1 148
10,930,135 11,712,603
1,958 (D)
314,888 2,104,142 1,721,479
659,459
- -
95,015 17,471
2,108
403,464 561 (D)
4,074
155,083 1,346
403,929 -
214
- 1,124
14 808,093 627,638
180,474
1,604,742 21,289
24 1,684
124,977
220 1,950
24,823 445
54,797
134,683 268
- (D)
19,616
3,221 681,133 167,426
15
416 162,003
16 557
420,278
24 2,709
117,325 1,992 3,289
(D)
13,848 3,625,897
- 2,530,620
801,038 463,964 228,875 244,507 339,906
123,923 712,041
1,717,945 (D)
2,108
16,489 19,215
12 1
29 35
501
3,464 - - 2
15
15 2,208
2 -
30
869 4
25 - -
- - -
16 3
284
5,779 53
- 2
2 3
30 18 13
113 183
26 - -
83 14
906 286
-
5 453
- 13
992
- 33 59 18 21
2
16 82
- 8,114
1,613
656 206
2,064 121
107
2,857 504
1 15
2,563,429 3,188,967
168 (D)
2,825 19,842
229,875
187,105 - -
(D)1,500
106
134,257 (D)
- 3,594
100,018
(D)14,192
- -
- - -
4,396 220
48,777
1,413,653 5,502
- (D)
(D)12
1,950 2,052
(D)
13,947 16,601
(D)- -
10,938 (D)
138,502 17,288
-
5 46,132
- 65
147,779
- (D)
4,258 107 (D)
(D)(D)
39,125 -
1,724,398
171,903 88,294 21,820 66,563
4,610
(D)193,858 234,375
(D)106
10,181 9,286
55 - 7
2,676 950
875
- -
82 95
77
106 17 14
1
96 53
633 -
25
- 27 14
856 817
45
260 4 8
35
134 38
- 3
30
48 32 31
- 71
2
25 1,146
504 5
49
9 4
26 196
8 158 300
97 96
21 69
4,446 -
793
761 1,052
2 697
8
561 86
949 -
77
4,273,202 3,002,399
1,750 -
705 1,883,935
73,378
41,011 - -
12,195 10,815
1,566 6,009
(D)(D)(D)
12,712
656 378,501
- 82
-
284 14
797,127 624,514
4,822
82,948 1,810
24 (D)
(D)
176 -
300 357
6,911
14,272 185
- (D)
(D)
2,279 245,619 20,091
15
251 397
16 (D)
27,579
24 1,749
25,542 693
2,913
(D)11,106
3,414,616 -
150,450
327,407 202,100
(D)12,744
865
22,233 19,946 73,218
- 1,566
7,040 6,467
- -
363 99
903
565 - - 4 -
2 1,760
- - -
117 - 2 -
22
- 24
- - 1
23
376 53
- -
1,063 - - 4 -
40 82
- - -
22 -
418 333
-
8 292
- 1
463
- 30
4 25
-
- 3
94 -
1,170
294 97
1,409 142 416
318
2,134 902
- 2
1,270,937 1,320,110
- -
283,631 43,697
236,174
142,828 - -
(D) -
(D) 154,563
- - -
12,722 -
(D) -
132
- 840
- -
(D)
4,320 47,131
970 - -
40,280 - -
858 -
28,687 27,291
- - -
2,168 -
97,540 26,049
-
160 51,614
- (D)
58,508
- (D)
7,700 1,140
-
- 1,200
33,277 -
161,202
109,358 27,636
122,300 27,288
293,050
24,193 233,468 228,639
- (D)
12,890 15,657
- -
78 186
1,817
2,723 - -
99 52
64
1,338 - - 2
211
2 5 - -
- - - 3 2
775 358
43 - -
618 4 -
65 2
14
959 1 - 5
30
3 278
1,573 -
- 769
- -
811
- 1
156 6 2
- -
156 -
2,959
1,036 229 416
1,529 233
1,136 3,002 1,965
- 64
2,251,902 3,040,354
- -
26,007 137,612 858,817
266,619
- -
61,796 468
238
106,315 - -
(D)
19,241 (D)(D)
- -
- - -
3,600 (D)
117,635 60,735 11,480
- -
46,299 32
- 21,613
(D)
2,080 75,779
(D)-
140
4,957 420
114,254 88,331
-
- 55,518
- -
168,911
- (D)
62,404 52 (D)
- -
110,911 -
463,241
135,987 91,754 58,558
122,808 36,009
57,873
253,367 858,478
- 238
4,555 7,387
5 - 6
97 2,768
364
- -
23 10
2 8 - - -
28 -
26 - -
- - - 5 -
37 25
7 - 1
75
- - - -
17 5 - - 3
6
19 428 397
-
- 146
- 1
46
- 1
41 - -
16 1
94 -
141
247 261 158 425 158
83
159 2,768
- 2
570,665 1,160,773
40 -
1,720 19,056
323,235
21,896 - -
12,684 4,688
(D)
2,320 - - -
10,390 -
8,977 - -
- - -
2,970 -
4,920 275
1,527 -
(D)
23,292 - - - -
3,172 740
- - 9
(D)(D)
85,218 15,667
-
- 8,342
- (D)
17,501
- (D)
17,421 - -
24 (D)
27,968 -
31,329
56,383 54,180
(D)15,104
5,372
(D)11,402
323,235 -
(D)
--continued
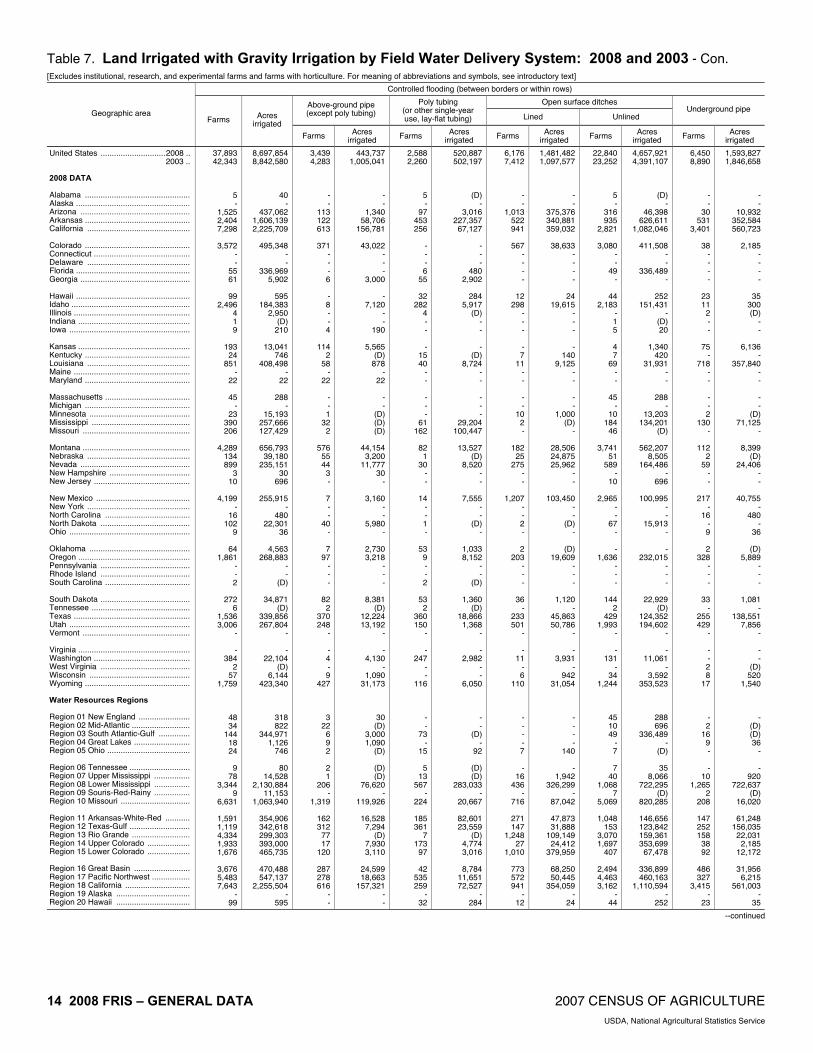
14 2008 FRIS – GENERAL DATA 2007 CENSUS OF AGRICULTURE USDA, National Agricultural Statistics Service
Table 7. Land Irrigated with Gravity Irrigation by Field Water Delivery System: 2008 and 2003 - Con. [Excludes institutional, research, and experimental farms and farms with horticulture. For meaning of abbreviations and symbols, see introductory text]
Controlled flooding (between borders or within rows)
Open surface ditches Above-ground pipe (except poly tubing)
Poly tubing (or other single-year use, lay-flat tubing) Lined Unlined
Underground pipe Geographic area Farms Acres
irrigated Farms Acres
irrigated Farms Acres irrigated Farms Acres
irrigated Farms Acres irrigated Farms Acres
irrigated
United States .............................2008 .. 2003 .. 2008 DATA Alabama ............................................... Alaska ................................................... Arizona ................................................. Arkansas ............................................... California .............................................. Colorado ............................................... Connecticut ........................................... Delaware .............................................. Florida ................................................... Georgia ................................................. Hawaii ................................................... Idaho ..................................................... Illinois .................................................... Indiana .................................................. Iowa ...................................................... Kansas .................................................. Kentucky ............................................... Louisiana .............................................. Maine .................................................... Maryland ............................................... Massachusetts ...................................... Michigan ............................................... Minnesota ............................................. Mississippi ............................................ Missouri ................................................ Montana ................................................ Nebraska .............................................. Nevada ................................................. New Hampshire .................................... New Jersey ........................................... New Mexico .......................................... New York .............................................. North Carolina ...................................... North Dakota ........................................ Ohio ...................................................... Oklahoma ............................................. Oregon .................................................. Pennsylvania ........................................ Rhode Island ........................................ South Carolina ...................................... South Dakota ........................................ Tennessee ............................................ Texas .................................................... Utah ...................................................... Vermont ................................................ Virginia .................................................. Washington ........................................... West Virginia ........................................ Wisconsin ............................................. Wyoming ............................................... Water Resources Regions Region 01 New England ....................... Region 02 Mid-Atlantic .......................... Region 03 South Atlantic-Gulf .............. Region 04 Great Lakes ......................... Region 05 Ohio ..................................... Region 06 Tennessee ........................... Region 07 Upper Mississippi ................ Region 08 Lower Mississippi ................ Region 09 Souris-Red-Rainy ................ Region 10 Missouri ............................... Region 11 Arkansas-White-Red ........... Region 12 Texas-Gulf ........................... Region 13 Rio Grande .......................... Region 14 Upper Colorado ................... Region 15 Lower Colorado ................... Region 16 Great Basin ......................... Region 17 Pacific Northwest ................. Region 18 California ............................. Region 19 Alaska ................................. Region 20 Hawaii .................................
37,893 42,343
5 -
1,525 2,404 7,298
3,572
- -
55 61
99
2,496 4 1 9
193
24 851
- 22
45
- 23
390 206
4,289
134 899
3 10
4,199
- 16
102 9
64
1,861 - - 2
272
6 1,536 3,006
-
- 384
2 57
1,759
48 34
144 18 24
9
78 3,344
9 6,631
1,591 1,119 4,334 1,933 1,676
3,676 5,483 7,643
- 99
8,697,854 8,842,580
40 -
437,062 1,606,139 2,225,709
495,348
- -
336,969 5,902
595
184,383 2,950
(D) 210
13,041
746 408,498
- 22
288
- 15,193
257,666 127,429
656,793 39,180
235,151 30
696
255,915 -
480 22,301
36
4,563 268,883
- -
(D)
34,871 (D)
339,856 267,804
-
- 22,104
(D) 6,144
423,340
318 822
344,971 1,126
746
80 14,528
2,130,884 11,153
1,063,940
354,906 342,618 299,303 393,000 465,735
470,488 547,137
2,255,504 -
595
3,439 4,283
- -
113 122 613
371
- - - 6
- 8 - - 4
114
2 58
- 22
- - 1
32 2
576
55 44
3 -
7 - -
40 -
7 97
- - -
82 2
370 248
-
- 4 - 9
427
3 22
6 9 2
2 1
206 -
1,319
162 312
77 17
120
287 278 616
- -
443,737 1,005,041
- -
1,340 58,706
156,781
43,022 - - -
3,000
- 7,120
- -
190
5,565 (D)
878 -
22
- -
(D)(D)(D)
44,154
3,200 11,777
30 -
3,160 - -
5,980 -
2,730 3,218
- - -
8,381 (D)
12,224 13,192
-
- 4,130
- 1,090
31,173
30 (D)
3,000 1,090
(D)
(D)(D)
76,620 -
119,926
16,528 7,294
(D)7,930 3,110
24,599 18,663
157,321 - -
2,588 2,260
5 -
97 453 256
- - - 6
55
32 282
4 - -
- 15 40
- -
- - -
61 162
82
1 30
- -
14 - - 1 -
53 9 - - 2
53
2 360 150
-
- 247
- -
116
- -
73 -
15
5 13
567 -
224
185 361
7 173
97
42 535 259
- 32
520,887 502,197
(D) -
3,016 227,357 67,127
- - -
480 2,902
284
5,917 (D)
- -
- (D)
8,724 - -
- - -
29,204 100,447
13,527
(D) 8,520
- -
7,555 - -
(D) -
1,033 8,152
- -
(D)
1,360 (D)
18,866 1,368
-
- 2,982
- -
6,050
- -
(D) -
92
(D) (D)
283,033 -
20,667
82,601 23,559
(D) 4,774 3,016
8,784
11,651 72,527
- 284
6,176 7,412
- -
1,013 522 941
567
- - - -
12 298
- - -
- 7
11 - -
- -
10 2 -
182 25
275 - -
1,207 - - 2 -
2 203
- - -
36 -
233 501
-
- 11
- 6
110
- - - - 7
-
16 436
- 716
271 147
1,248 27
1,010
773 572 941
- 12
1,481,482 1,097,577
- -
375,376 340,881 359,032
38,633
- - - -
24 19,615
- - -
- 140
9,125 - -
- -
1,000 (D)
-
28,506 24,875 25,962
- -
103,450 - -
(D) -
(D) 19,609
- - -
1,120 -
45,863 50,786
-
- 3,931
- 942
31,054
- - - -
140
- 1,942
326,299 -
87,042
47,873 31,888
109,149 24,412
379,959
68,250 50,445
354,059 -
24
22,840 23,252
5 -
316 935
2,821
3,080 - -
49 -
44 2,183
- 1 5
4 7
69 - -
45 -
10 184
46
3,741 51
589 -
10
2,965 - -
67 -
- 1,636
- - -
144 2
429 1,993
-
- 131
- 34
1,244
45 10 49
- 7
7
40 1,068
7 5,069
1,048
153 3,070 1,697
407
2,494 4,463 3,162
- 44
4,657,921 4,391,107
(D)-
46,398 626,611
1,082,046
411,508 - -
336,489 -
252 151,431
- (D)20
1,340
420 31,931
- -
288 -
13,203 134,201
(D)
562,207 8,505
164,486 -
696
100,995 - -
15,913 -
- 232,015
- - -
22,929 (D)
124,352 194,602
-
- 11,061
- 3,592
353,523
288 696
336,489 -
(D)
35 8,066
722,295 (D)
820,285
146,656 123,842 159,361 353,699 67,478
336,899 460,163
1,110,594 -
252
6,450 8,890
- -
30 531
3,401
38 - - - -
23 11
2 - -
75 -
718 - -
- - 2
130 -
112 2
59 - -
217 -
16 - 9
2
328 - - -
33 -
255 429
-
- - 2 8
17
- 2
16 9 -
- 10
1,265 2
208
147 252 158
38 92
486 327
3,415 -
23
1,593,827 1,846,658
- -
10,932 352,584 560,723
2,185
- - - -
35 300 (D)
- -
6,136 -
357,840 - -
- -
(D)71,125
-
8,399 (D)
24,406 - -
40,755 -
480 -
36
(D)5,889
- - -
1,081 -
138,551 7,856
-
- -
(D)520
1,540
- (D)(D)36
-
- 920
722,637 (D)
16,020
61,248 156,035 22,031
2,185 12,172
31,956
6,215 561,003
- 35
--continued

2007 CENSUS OF AGRICULTURE 2008 FRIS – GENERAL DATA 15 USDA, National Agricultural Statistics Service
Table 7. Land Irrigated with Gravity Irrigation by Field Water Delivery System: 2008 and 2003 - Con. [Excludes institutional, research, and experimental farms and farms with horticulture. For meaning of abbreviations and symbols, see introductory text]
Uncontrolled flooding
Open surface ditches Above-ground pipe (except poly tubing)
Poly tubing (or other single-year use, lay-flat tubing) Lined Unlined
Underground pipe Geographic area Farms Acres
irrigated Farms Acres
irrigated Farms Acres irrigated Farms Acres
irrigated Farms Acres irrigated Farms Acres
irrigated
United States ............................. 2008 .. 2003 .. 2008 DATA Alabama ............................................... Alaska .................................................. Arizona ................................................. Arkansas .............................................. California .............................................. Colorado ............................................... Connecticut .......................................... Delaware .............................................. Florida .................................................. Georgia ................................................ Hawaii .................................................. Idaho .................................................... Illinois ................................................... Indiana ................................................. Iowa ..................................................... Kansas ................................................. Kentucky .............................................. Louisiana .............................................. Maine ................................................... Maryland .............................................. Massachusetts ..................................... Michigan ............................................... Minnesota ............................................. Mississippi ............................................ Missouri ................................................ Montana ............................................... Nebraska .............................................. Nevada ................................................. New Hampshire .................................... New Jersey .......................................... New Mexico .......................................... New York .............................................. North Carolina ...................................... North Dakota ........................................ Ohio ..................................................... Oklahoma ............................................. Oregon ................................................. Pennsylvania ........................................ Rhode Island ........................................ South Carolina ..................................... South Dakota ....................................... Tennessee ........................................... Texas ................................................... Utah ..................................................... Vermont ................................................ Virginia ................................................. Washington .......................................... West Virginia ........................................ Wisconsin ............................................. Wyoming .............................................. Water Resources Regions Region 01 New England ....................... Region 02 Mid-Atlantic ......................... Region 03 South Atlantic-Gulf .............. Region 04 Great Lakes ........................ Region 05 Ohio .................................... Region 06 Tennessee .......................... Region 07 Upper Mississippi ................ Region 08 Lower Mississippi ................ Region 09 Souris-Red-Rainy ................ Region 10 Missouri .............................. Region 11 Arkansas-White-Red ........... Region 12 Texas-Gulf .......................... Region 13 Rio Grande ......................... Region 14 Upper Colorado ................... Region 15 Lower Colorado ................... Region 16 Great Basin ......................... Region 17 Pacific Northwest ................ Region 18 California ............................. Region 19 Alaska ................................. Region 20 Hawaii .................................
11,926 15,448
- -
234 -
1,433
1,965 - -
222 32
5
1,300 13
- 5
-
16 10
- -
1 - - 3 4
1,362
261 374
- 1
543
- 16
7 4
23
1,094 - - -
90 9
294 1,418
-
- 259
5 -
923
1 1
270 2
23
7 13 15
- 2,360
325 298 439
2,205 342
1,391 2,762 1,467
- 5
1,901,738 2,295,505
- -
7,137 -
152,114
373,552 - -
13,962 6,292
(D)
155,400 91
- 175
-
428 3,180
- -
(D) - -
1,789 604
253,846 25,429
190,166 -
(D)
47,923 -
160 77
170
2,217 238,858
- - -
8,635 (D)
10,496 117,448
-
- 10,096
25 -
280,610
(D) (D)
20,414 (D)
563
114 91
5,064 -
479,780
36,243 13,676
101,010 359,736 13,477
278,481 436,756 155,624
- (D)
1,134 1,618
- -
16 - 1
291
- - 1 6
2
299 13
- -
- - - - -
- - - - -
20 26
4 - 1
- -
16 - 2
3
219 - - -
39 2
15 25
-
- - 5 -
128
- 1
23 - 7
1
13 1 -
206
7 15
4 290
16
29 516
3 - 2
72,658 89,856
- -
880 -
(D)
22,860 - -
(D)390
(D)
5,188 91
- -
- - - - -
- - - - -
1,832 442 (D)
- (D)
- -
160 -
(D)
(D)1,871
- - -
2,374 (D)
3,800 4,925
-
- -
25 -
18,722
- (D)
575 -
(D)
(D)91 (D)
- 17,070
950
3,800 (D)
27,360 880
12,525
6,819 (D)
- (D)
69 462
- - 2 - -
18 - - 6 -
2 - - - -
- - - - -
1 - - - -
4 - - - -
1 - - - 4
-
14 - - -
3 1 - - -
- - - -
13
1 - 6 2 2
- - 1 -
38
- - 1 - 2
-
14 - - 2
8,791 19,973
- -
(D) - -
3,888 - -
600 -
(D) - - - -
- - - - -
(D) - - - -
268 - - - -
(D) - - -
(D)
- 28
- - -
(D) (D)
- - -
- - - -
2,600
(D) -
600 (D) (D)
- -
(D) -
7,096
- -
(D) -
(D)
- 28
- -
(D)
1,112 517
- -
125 - 5
100
- -
209 -
- 379
- - -
- - 4 - -
- - - - -
60 - 2 - -
92 - - - -
17 1 - - -
1 - -
43 -
- - - -
74
- -
209 - -
- - 4 -
210
19 -
91 24
125
122 302
6 - -
65,447 101,079
- -
(D) -
(D)
16,200 - -
(D) -
- 14,018
- - -
- -
400 - -
- - - - -
17,202 -
(D) - -
7,006 - - - -
867 (D)
- - -
(D) - -
1,035 -
- - - -
2,573
- -
627 - -
- -
(D) -
27,425
1,667 -
8,706 6,100
(D)
6,625 (D) (D)
- -
9,884 12,261
- -
95 -
1,423
1,756 - - 6 -
- 634
- - 5
-
16 - - -
- - - 1 4
1,294
235 368
- -
424 - - 7 -
3 939
- - -
61 4
279 1,300
-
- 259
- -
771
- - 6 -
16
4 - 1 -
2,017
263 283 342
1,999 203
1,275 2,019 1,456
- -
1,722,061 2,046,294
- -
3,748 -
142,331
326,064 - -
12,710 -
- 136,194
- -
175
- 428
- - -
- - -
(D)604
234,544 24,987
182,366 - -
35,157 - -
77 -
(D)235,875
- - -
5,361 42
6,696 106,791
-
- 10,096
- -
256,715
- -
12,710 -
(D)
(D)-
(D)-
427,679
26,406 9,876
87,624 324,954 10,088
255,956 420,697 145,101
- -
218 1,081
- -
12 - 4
11
- - -
26
1 - - - -
- -
10 - -
- - - 2 -
- - - - -
26 - - - -
- 17
- - -
3 3 -
103 -
- - - - -
- -
26 - -
3 -
12 - 3
36
- 1
94 12
9
17 4 - 1
32,781 38,303
- -
1,440 -
4,800
4,540 - - -
5,902
(D)- - - -
- -
2,780 - -
- - -
(D)-
- - - - -
(D)- - - -
- (D)
- - -
510 (D)
- 4,697
-
- - - - -
- -
5,902 - -
69 -
4,069 -
510
7,220 -
(D)1,322 1,440
3,375
(D)4,800
- (D)
--continued
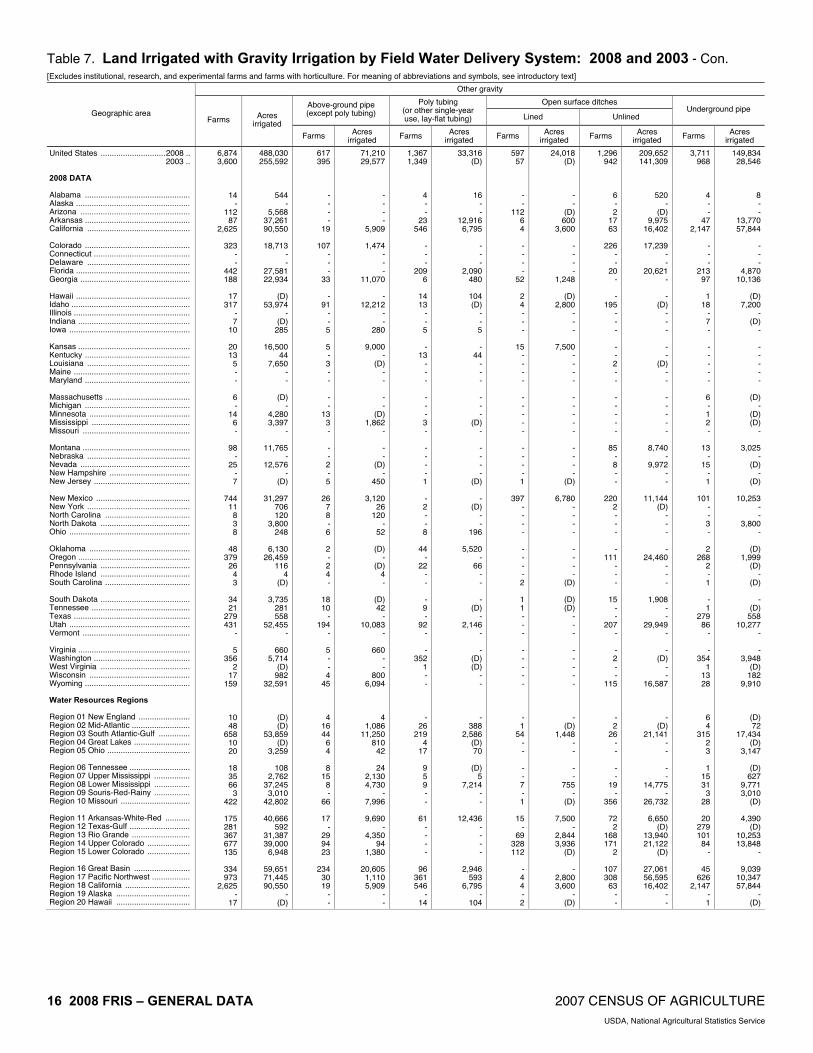
16 2008 FRIS – GENERAL DATA 2007 CENSUS OF AGRICULTURE USDA, National Agricultural Statistics Service
Table 7. Land Irrigated with Gravity Irrigation by Field Water Delivery System: 2008 and 2003 - Con. [Excludes institutional, research, and experimental farms and farms with horticulture. For meaning of abbreviations and symbols, see introductory text]
Other gravity
Open surface ditches Above-ground pipe (except poly tubing)
Poly tubing (or other single-year use, lay-flat tubing) Lined Unlined
Underground pipe Geographic area Farms Acres
irrigated Farms Acres
irrigated Farms Acres irrigated Farms Acres
irrigated Farms Acres irrigated Farms Acres
irrigated
United States .............................2008 .. 2003 .. 2008 DATA Alabama ............................................... Alaska ................................................... Arizona ................................................. Arkansas ............................................... California .............................................. Colorado ............................................... Connecticut ........................................... Delaware .............................................. Florida ................................................... Georgia ................................................. Hawaii ................................................... Idaho ..................................................... Illinois .................................................... Indiana .................................................. Iowa ...................................................... Kansas .................................................. Kentucky ............................................... Louisiana .............................................. Maine .................................................... Maryland ............................................... Massachusetts ...................................... Michigan ............................................... Minnesota ............................................. Mississippi ............................................ Missouri ................................................ Montana ................................................ Nebraska .............................................. Nevada ................................................. New Hampshire .................................... New Jersey ........................................... New Mexico .......................................... New York .............................................. North Carolina ...................................... North Dakota ........................................ Ohio ...................................................... Oklahoma ............................................. Oregon .................................................. Pennsylvania ........................................ Rhode Island ........................................ South Carolina ...................................... South Dakota ........................................ Tennessee ............................................ Texas .................................................... Utah ...................................................... Vermont ................................................ Virginia .................................................. Washington ........................................... West Virginia ........................................ Wisconsin ............................................. Wyoming ............................................... Water Resources Regions Region 01 New England ....................... Region 02 Mid-Atlantic .......................... Region 03 South Atlantic-Gulf .............. Region 04 Great Lakes ......................... Region 05 Ohio ..................................... Region 06 Tennessee ........................... Region 07 Upper Mississippi ................ Region 08 Lower Mississippi ................ Region 09 Souris-Red-Rainy ................ Region 10 Missouri ............................... Region 11 Arkansas-White-Red ........... Region 12 Texas-Gulf ........................... Region 13 Rio Grande .......................... Region 14 Upper Colorado ................... Region 15 Lower Colorado ................... Region 16 Great Basin ......................... Region 17 Pacific Northwest ................. Region 18 California ............................. Region 19 Alaska ................................. Region 20 Hawaii .................................
6,874 3,600
14 -
112 87
2,625
323 - -
442 188
17
317 - 7
10
20 13
5 - -
6 -
14 6 -
98 -
25 - 7
744
11 8 3 8
48
379 26
4 3
34 21
279 431
-
5 356
2 17
159
10 48
658 10 20
18 35 66
3 422
175 281 367 677 135
334 973
2,625 -
17
488,030 255,592
544 -
5,568 37,261 90,550
18,713
- -
27,581 22,934
(D)
53,974 -
(D) 285
16,500
44 7,650
- -
(D) -
4,280 3,397
-
11,765 -
12,576 -
(D)
31,297 706 120
3,800 248
6,130
26,459 116
4 (D)
3,735
281 558
52,455 -
660 5,714
(D) 982
32,591
(D) (D)
53,859 (D)
3,259
108 2,762
37,245 3,010
42,802
40,666 592
31,387 39,000
6,948
59,651 71,445 90,550
- (D)
617 395
- - - -
19
107 - - -
33
- 91
- - 5
5 - 3 - -
- -
13 3 -
- - 2 - 5
26
7 8 - 6
2 - 2 4 -
18 10
- 194
-
5 - - 4
45
4 16 44
6 4
8
15 8 -
66
17 -
29 94 23
234
30 19
- -
71,210 29,577
- - - -
5,909
1,474 - - -
11,070
- 12,212
- -
280
9,000 -
(D)- -
- -
(D)1,862
-
- -
(D)-
450
3,120 26
120 -
52
(D)-
(D)4 -
(D)42
- 10,083
-
660 - -
800 6,094
4 1,086
11,250 810
42
24 2,130 4,730
- 7,996
9,690
- 4,350
94 1,380
20,605
1,110 5,909
- -
1,367 1,349
4 - -
23 546
- - -
209 6
14 13
- - 5
-
13 - - -
- - - 3 -
- - - - 1
- 2 - - 8
44
- 22
- -
- 9 -
92 -
- 352
1 - -
- 26
219 4
17
9 5 9 - -
61 - - - -
96 361 546
- 14
33,316 (D)
16 - -
12,916 6,795
- - -
2,090 480
104 (D)
- - 5
-
44 - - -
- - -
(D) -
- - - -
(D)
- (D)
- -
196
5,520 -
66 - -
- (D)
- 2,146
-
- (D) (D)
- -
- 388
2,586 (D) 70
(D)
5 7,214
- -
12,436 - - - -
2,946 593
6,795 -
104
597 57
- -
112 6 4
- - - -
52
2 4 - - -
15 - - - -
- - - - -
- - - - 1
397
- - - -
- - - - 2
1 1 - - -
- - - - -
- 1
54 - -
- - 7 - 1
15
- 69
328 112
- 4 4 - 2
24,018 (D)
- -
(D) 600
3,600
- - - -
1,248
(D) 2,800
- - -
7,500 - - - -
- - - - -
- - - -
(D)
6,780 - - - -
- - - -
(D)
(D) (D)
- - -
- - - - -
- (D)
1,448 - -
- -
755 -
(D)
7,500 -
2,844 3,936
(D)
- 2,800 3,600
- (D)
1,296 942
6 - 2
17 63
226
- -
20 -
- 195
- - -
- - 2 - -
- - - - -
85 - 8 - -
220 2 - - -
- 111
- - -
15 - -
207 -
- 2 - -
115
- 2
26 - -
- -
19 -
356
72 2
168 171
2
107 308
63 - -
209,652 141,309
520 -
(D)9,975
16,402
17,239 - -
20,621 -
- (D)
- - -
- -
(D)- -
- - - - -
8,740 -
9,972 - -
11,144 (D)
- - -
- 24,460
- - -
1,908 - -
29,949 -
- (D)
- -
16,587
- (D)
21,141 - -
- -
14,775 -
26,732
6,650 (D)
13,940 21,122
(D)
27,061 56,595 16,402
- -
3,711 968
4 - -
47 2,147
- - -
213 97
1
18 - 7 -
- - - - -
6 - 1 2 -
13 -
15 - 1
101
- - 3 -
2 268
2 - 1
- 1
279 86
-
- 354
1 13 28
6 4
315 2 3
1
15 31
3 28
20
279 101
84 -
45 626
2,147 - 1
149,834 28,546
8 - -
13,770 57,844
- - -
4,870 10,136
(D)
7,200 -
(D)-
- - - - -
(D)-
(D)(D)
-
3,025 -
(D)-
(D)
10,253 - -
3,800 -
(D)1,999
(D)-
(D)
- (D)
558 10,277
-
- 3,948
(D)182
9,910
(D)72
17,434 (D)
3,147
(D)627
9,771 3,010
(D)
4,390 (D)
10,253 13,848
-
9,039 10,347 57,844
- (D)

2007 CENSUS OF AGRICULTURE 2008 FRIS – GENERAL DATA 17 USDA, National Agricultural Statistics Service
Table 8. Estimated Quantity of Water Applied Using Only One Method of Distribution: 2008 and 2003 [Excludes institutional, research, and experimental farms and farms with horticulture. For meaning of abbreviations and symbols, see introductory text]
Water applied by all methods Only sprinkler systems Only gravity flow systems
Geographic area Acres irrigated
Acre-feet applied
Average acre-feet per acre
Farms Acres irrigated
Average acre-feet per acre
Farms Acres irrigated
Average acre-feet per acre
United States ............................. 2008 .. 2003 .. 2008 DATA Alabama ............................................... Alaska .................................................. Arizona ................................................. Arkansas .............................................. California .............................................. Colorado ............................................... Connecticut .......................................... Delaware .............................................. Florida .................................................. Georgia ................................................ Hawaii .................................................. Idaho .................................................... Illinois ................................................... Indiana ................................................. Iowa ..................................................... Kansas ................................................. Kentucky .............................................. Louisiana .............................................. Maine ................................................... Maryland .............................................. Massachusetts ..................................... Michigan ............................................... Minnesota ............................................. Mississippi ............................................ Missouri ................................................ Montana ............................................... Nebraska .............................................. Nevada ................................................. New Hampshire .................................... New Jersey .......................................... New Mexico .......................................... New York .............................................. North Carolina ...................................... North Dakota ........................................ Ohio ..................................................... Oklahoma ............................................. Oregon ................................................. Pennsylvania ........................................ Rhode Island ........................................ South Carolina ..................................... South Dakota ....................................... Tennessee ........................................... Texas ................................................... Utah ..................................................... Vermont ................................................ Virginia ................................................. Washington .......................................... West Virginia ........................................ Wisconsin ............................................. Wyoming .............................................. Water Resources Regions Region 01 New England ....................... Region 02 Mid-Atlantic ......................... Region 03 South Atlantic-Gulf .............. Region 04 Great Lakes ........................ Region 05 Ohio .................................... Region 06 Tennessee .......................... Region 07 Upper Mississippi ................ Region 08 Lower Mississippi ................ Region 09 Souris-Red-Rainy ................ Region 10 Missouri .............................. Region 11 Arkansas-White-Red ........... Region 12 Texas-Gulf .......................... Region 13 Rio Grande ......................... Region 14 Upper Colorado ................... Region 15 Lower Colorado ................... Region 16 Great Basin ......................... Region 17 Pacific Northwest ................ Region 18 California ............................. Region 19 Alaska ................................. Region 20 Hawaii .................................
54,929,915 52,492,687
75,023 1,589
861,496 4,493,435 7,329,245
2,865,840
2,337 104,620
1,222,797 1,007,763
99,577
3,319,827 457,078 404,399 162,838
2,570,003
32,380 932,712 18,151 85,552
17,421
531,927 504,330
1,451,652 1,232,354
1,947,159 8,365,545
685,261 720
59,412
835,639 20,158
148,999 248,070 18,548
461,235
1,758,602 17,359
681 104,091
360,071 72,862
5,356,876 1,068,929
488
44,818 1,675,898
906 396,123
1,497,119
39,468 309,972
2,554,462 721,586 304,963
41,141
1,339,287 7,346,743
158,617 13,825,255
5,412,670 3,499,153 1,079,145 1,359,888
936,248
1,599,757 6,855,656 7,444,738
1,589 99,577
91,235,036 86,757,665
42,512 327
4,622,309 8,631,781
22,599,659
4,541,276 1,536
74,379 1,701,120
876,884
453,547 6,228,403
231,390 198,880 78,939
3,146,607
15,698 972,164
6,946 55,259
18,894
298,440 333,669
1,402,099 996,875
2,660,677 6,699,545 1,436,932
193 45,305
1,896,349
14,800 83,847
224,462 9,398
524,638
3,276,679 13,000
674 86,236
271,274 42,271
6,819,783 2,430,148
235
24,796 3,781,371
975 322,377
3,039,481
28,287 211,328
2,789,496 414,509 146,211
25,616
830,916 10,786,749
123,225 14,386,086
7,469,640 4,182,307 2,492,101 2,460,845 4,905,155
3,560,900
13,332,398 22,635,393
327 453,547
1.7 1.7
0.6 0.2 5.4 1.9 3.1
1.6 0.7 0.7 1.4 0.9
4.6 1.9 0.5 0.5 0.5
1.2 0.5 1.0 0.4 0.6
1.1 0.6 0.7 1.0 0.8
1.4 0.8 2.1 0.3 0.8
2.3 0.7 0.6 0.9 0.5
1.1 1.9 0.7 1.0 0.8
0.8 0.6 1.3 2.3 0.5
0.6 2.3 1.1 0.8 2.0
0.7 0.7 1.1 0.6 0.5
0.6 0.6 1.5 0.8 1.0
1.4 1.2 2.3 1.8 5.2
2.2 1.9 3.0 0.2 4.6
78,945 72,670
335 15
556 137
11,476
2,465 58
261 1,287 2,189
192
5,259 963 975 441
2,886
526 231 135 393
509
1,327 1,414
112 896
2,149 8,305
376 29
315
1,569 146
1,343 453 139
958
6,778 261
26 323
710 268
5,729 4,306
22
320 7,426
43 975 938
764 1,480 5,547 1,908 1,273
230
3,349 845 388
14,018
4,657 4,558 1,349 2,915
559
3,502 19,807 11,589
15 192
20,226,970 18,288,542
65,617 1,367
62,810 101,229 582,633
974,293
1,205 98,017
156,861 785,301
1,196
1,825,812 456,785 386,651 147,219
1,903,395
29,102 44,854 26,823 77,024
14,183
456,206 483,754 54,344
269,241
420,631 3,426,198
151,883 328
24,088
297,791 8,193
133,562 196,322 12,167
351,142 802,905
8,314 349
83,536
259,867 55,249
3,081,530 293,059
221
38,188 1,060,337
465 390,508 124,215
42,998 241,301
1,218,523 629,873 284,492
33,880
1,304,594 363,480 151,074
5,446,506
3,427,166 1,759,264
270,033 213,232 71,335
419,837
3,707,369 639,450
1,367 1,196
1.2 1.3
0.6 0.2 3.4 1.9 2.5
1.6 0.4 0.7 1.0 0.8
1.5 1.8 0.5 0.5 0.5
1.2 0.5 0.4 0.3 0.6
1.1 0.6 0.6 0.7 0.6
1.2 0.8 2.5 0.3 0.7
2.0 0.8 0.5 0.7 0.5
1.1 1.6 0.8 1.5 0.7
0.7 0.6 1.2 2.2 0.5
0.5 2.1 0.2 0.8 1.5
0.5 0.6 0.8 0.6 0.5
0.6 0.6 1.0 0.6 0.9
1.3 1.0 2.3 2.0 3.3
2.3 1.9 2.5 0.2 1.5
59,271 73,446
86 1
1,946 2,860
10,472
8,212 - -
571 109
194
5,529 32
- 20
580
94 1,236
- 22
7
49 37
540 495
4,296
794 1,103
8 21
5,632
4 -
89 23
132
1,928 51
4 4
327
46 3,113 4,311
5
16 1,228
7 34
3,003
19 122 771
89 113
40
120 4,516
10 8,987
3,430 2,390 5,471 6,070 2,336
4,346 9,336
10,910 1
194
13,456,627 15,743,675
2,334 (D)
578,548 2,736,611 2,472,035
1,177,311
- -
403,311 3,163
1,107
371,403 3,602
- 1,355
58,294
2,155 663,556
- 132
98
1,090 17,077
581,811 428,700
708,973 286,736 294,530
24 1,348
293,717
32 -
30,196 326
33,955
370,020 209
4 380
45,295
2,130 619,929 354,201
15
288 98,429
(D)728
811,317
126 2,114
410,264 1,474 1,842
(D)
19,555 3,989,375
13,463 1,819,039
805,685 487,563 489,062 808,674 630,079
558,344 961,667
2,456,931 (D)
1,107
2.2 2.0
0.9 (D)5.6 2.0 3.3
1.5 --
1.4 0.5
1.0 2.1 0.6
-1.7
1.1 0.4 1.1
-0.6
0.1 0.3 1.6 1.1 0.9
1.4 1.4 1.8 0.2 0.9
2.5 (D)
-1.4 0.6
1.3 1.9 0.3 4.4 0.4
1.0 0.8 1.9 2.0 0.1
0.5 2.5 5.9 3.2 2.1
0.2 1.0 1.4 0.4 0.4
(D)0.7 1.6 1.9 1.6
1.5 1.9 2.2 1.6 5.5
2.1 2.0 3.2 (D)1.0
--continued

18 2008 FRIS – GENERAL DATA 2007 CENSUS OF AGRICULTURE USDA, National Agricultural Statistics Service
Table 8. Estimated Quantity of Water Applied Using Only One Method of Distribution: 2008 and 2003 - Con.
[Excludes institutional, research, and experimental farms and farms with horticulture. For meaning of abbreviations and symbols, see introductory text]
Only drip, trickle, or low-flow micro sprinkler systems Only subirrigation
Geographic area Farms Acres
irrigated
Average acre-feet per acre
Farms Acres irrigated
Average acre-feet per acre
United States .............................2008 .. 2003 .. 2008 DATA Alabama ............................................... Alaska ................................................... Arizona ................................................. Arkansas ............................................... California .............................................. Colorado ............................................... Connecticut ........................................... Delaware .............................................. Florida ................................................... Georgia ................................................. Hawaii ................................................... Idaho ..................................................... Illinois .................................................... Indiana .................................................. Iowa ...................................................... Kansas .................................................. Kentucky ............................................... Louisiana .............................................. Maine .................................................... Maryland ............................................... Massachusetts ...................................... Michigan ............................................... Minnesota ............................................. Mississippi ............................................ Missouri ................................................ Montana ................................................ Nebraska .............................................. Nevada ................................................. New Hampshire .................................... New Jersey ........................................... New Mexico .......................................... New York .............................................. North Carolina ...................................... North Dakota ........................................ Ohio ...................................................... Oklahoma ............................................. Oregon .................................................. Pennsylvania ........................................ Rhode Island ........................................ South Carolina ...................................... South Dakota ........................................ Tennessee ............................................ Texas .................................................... Utah ...................................................... Vermont ................................................ Virginia .................................................. Washington ........................................... West Virginia ........................................ Wisconsin ............................................. Wyoming ............................................... Water Resources Regions Region 01 New England ....................... Region 02 Mid-Atlantic .......................... Region 03 South Atlantic-Gulf .............. Region 04 Great Lakes ......................... Region 05 Ohio ..................................... Region 06 Tennessee ........................... Region 07 Upper Mississippi ................ Region 08 Lower Mississippi ................ Region 09 Souris-Red-Rainy ................ Region 10 Missouri ............................... Region 11 Arkansas-White-Red ........... Region 12 Texas-Gulf ........................... Region 13 Rio Grande .......................... Region 14 Upper Colorado ................... Region 15 Lower Colorado ................... Region 16 Great Basin ......................... Region 17 Pacific Northwest ................. Region 18 California ............................. Region 19 Alaska ................................. Region 20 Hawaii .................................
28,815 29,728
218 6
311 180
13,954
13 71 22
2,974 454
548
18 68 55 28
117 179
54 56 92
58
555 74
208 76
290
- 49 37
128
438 255 343
7 150
162 834 620
18 139
5
192 1,730
140 33
243
2,481 26 77 29
250 1,049 4,289
764 497
210 212 202
- 107
735
1,712 128
2 311
187
3,652 13,954
6 548
2,099,436 1,708,752
2,209 12
26,727 2,100
1,308,221
14,000 427 175
431,097 41,398
9,577
11,250 811 719 149
3,072 1,075
54 273
1,245
387 12,809
473 3,568 2,318
1,740
- 49
116 6,104
10,863
5,611 4,503
105 1,829
8,550
57,724 5,155
151 5,015
5
2,663 37,777
1,138 213
2,640
69,595 156 398
3,190
1,394 15,721
486,802 18,007
3,551
3,276 1,451 2,947
- 14,598
15,138 27,052 20,276
(D)26,727
(D)
143,499 1,308,221
12 9,577
2.2 1.8
0.7 0.1 3.8 2.0 2.6
1.2 0.5 0.9 1.5 1.1
2.3 1.6 0.1 0.4 0.1
0.6 0.6 0.5 0.1 0.5
0.6 0.5 0.4 0.7 0.1
1.1
- 3.1 0.4 1.0
2.8 0.5 0.8 1.0 0.6
1.1 1.9 0.8 0.6 1.2
1.5 0.4 1.5 1.8 0.4
0.4 1.9 0.8 0.7 2.2
0.4 0.8 1.4 0.5 0.6
0.6 0.4 1.5
- 1.2
0.9 1.2 2.6 (D)3.8
(D)1.9 2.6 0.1 2.3
507 47
4 - - -
80
- - -
14 52
-
273 - - -
- - - - -
- - - - -
- - - - -
- - - - -
- - - - -
- - -
84 -
- - - - -
- -
70 - -
- - - - -
- - - - -
84 273
80 - -
95,103 67,435
4 - - -
58,742
- - -
34,010 520
-
819 - - -
- - - - -
- - - - -
- - - - -
- - - - -
- - - - -
- - -
1,008 -
- - - - -
- -
34,534 - -
- - - - -
- - - - -
1,008 819
58,742 - -
0.7 1.2
0.6 - - -
0.7
- - -
0.8 0.8
-
0.2 - - -
- - - - -
- - - - -
- - - - -
- - - - -
- - - - -
- - -
2.3 -
- - - - -
- -
0.8 - -
- - - - -
- - - - -
2.3 0.2 0.7
- -

2007 CENSUS OF AGRICULTURE 2008 FRIS – GENERAL DATA 19 USDA, National Agricultural Statistics Service
Table 9. Estimated Quantity of Water Applied Using Only Sprinkler Systems to Distribute Water: 2008 and 2003
[Excludes institutional, research, and experimental farms and farms with horticulture. For meaning of abbreviations and symbols, see introductory text]
Only center pivot systems 1
All pressures Only low pressure under 30 psi
Only medium pressure 30 to 59 psi
Only high pressure 60 psi or more Geographic area
Farms Acres irrigated
Average acre-feet per acre
Farms Acres irrigated
Average acre-feet per acre
Farms Acres irrigated
Average acre-feet per acre
Farms Acres irrigated
Average acre-feet per acre
United States ............................. 2008 .. 2003 .. 2008 DATA Alabama ............................................... Alaska .................................................. Arizona ................................................. Arkansas .............................................. California .............................................. Colorado ............................................... Connecticut .......................................... Delaware .............................................. Florida .................................................. Georgia ................................................ Hawaii .................................................. Idaho .................................................... Illinois ................................................... Indiana ................................................. Iowa ..................................................... Kansas ................................................. Kentucky .............................................. Louisiana .............................................. Maine ................................................... Maryland .............................................. Massachusetts ..................................... Michigan ............................................... Minnesota ............................................. Mississippi ............................................ Missouri ................................................ Montana ............................................... Nebraska .............................................. Nevada ................................................. New Hampshire .................................... New Jersey .......................................... New Mexico .......................................... New York .............................................. North Carolina ...................................... North Dakota ........................................ Ohio ..................................................... Oklahoma ............................................. Oregon ................................................. Pennsylvania ........................................ Rhode Island ........................................ South Carolina ..................................... South Dakota ....................................... Tennessee ........................................... Texas ................................................... Utah ..................................................... Vermont ................................................ Virginia ................................................. Washington .......................................... West Virginia ........................................ Wisconsin ............................................. Wyoming .............................................. Water Resources Regions Region 01 New England ....................... Region 02 Mid-Atlantic ......................... Region 03 South Atlantic-Gulf .............. Region 04 Great Lakes ........................ Region 05 Ohio .................................... Region 06 Tennessee .......................... Region 07 Upper Mississippi ................ Region 08 Lower Mississippi ................ Region 09 Souris-Red-Rainy ................ Region 10 Missouri .............................. Region 11 Arkansas-White-Red ........... Region 12 Texas-Gulf .......................... Region 13 Rio Grande ......................... Region 14 Upper Colorado ................... Region 15 Lower Colorado ................... Region 16 Great Basin ......................... Region 17 Pacific Northwest ................ Region 18 California ............................. Region 19 Alaska ................................. Region 20 Hawaii .................................
28,450 26,743
163 4
205 93
806
1,426 13
195 341
1,149
44 299 888 654 404
2,742
60 52 38
249
145 470
1,086 90
559
352 7,607
146 6
26
381 9
71 396
32
715 455
5 4
169
638 94
3,812 156
4
87 387
- 409 314
210 548
1,882 703 537
59
2,405 527 350
11,415
4,147 2,677
295 128 208
281
1,216 814
4 44
14,541,017 12,743,191
43,877 1,125
52,765 98,399 38,963
888,525
81 80,018 84,136
564,476
248 410,314 423,738 298,644 135,076
1,854,368
16,290 42,128
1,754 69,049
2,927
237,379 399,465 42,894
233,468
128,457 3,166,699
100,668 9
4,931
187,014 1,122
21,628 175,233
9,427
322,114 309,769
940 8
56,659
230,705 47,078
2,901,111 51,560
20
13,947 458,240
- 271,814 61,757
4,799 166,856 761,643 350,049 222,964
20,920
1,080,181 338,279 135,946
4,890,534
3,299,782 1,581,710
225,417 25,120 61,290
163,223
1,165,084 45,847
1,125 248
1.1 1.2
0.6 0.2 3.6 1.9 1.6
1.5 0.3 0.7 0.9 0.9
1.8 1.9 0.5 0.5 0.5
1.2 0.5 0.4 0.1 0.6
1.0 0.6 0.6 0.7 0.6
1.3 0.8 2.4 0.4 0.6
1.7 0.5 0.5 0.8 0.5
1.1 2.0 4.4 0.1 0.7
0.7 0.6 1.2 2.6 0.1
0.6 2.3
- 0.7 1.7
0.7 0.7 0.8 0.6 0.5
0.7 0.6 1.0 0.7 0.9
1.3 1.0 2.1 1.4 3.5
2.3 2.1 1.8 0.2 1.8
13,988 11,603
51 4
173 25
-
581 -
60 281 226
28
105 349 204 173
1,800
11 15 28
109
2 127 475
32 254
141
3,225 73
6 8
352
6 35
154 13
433 339
3 -
56
240 41
3,170 93
-
17 157
- 62
251
36 193 649 182 176
12
861 256 169
5,165
2,705 2,325
164 97
173
163 625
5 4
28
7,395,187 (D)
9,123 1,125
45,850 41,010
-
314,619 -
15,167 40,734
134,874
130 168,291 184,735 83,504 56,201
1,382,802
1,955 9,621
(D) 26,922
(D)
41,772 154,594 15,315
117,340
49,026 1,103,828
54,016 9
1,396
169,600 (D)
14,028 66,373
4,124
249,227 94,291
(D) -
20,007
76,420 20,583
2,304,494 23,557
-
3,587 213,637
- 28,843 51,557
563 46,063
219,209 69,144 76,759
3,398
350,346 159,903 56,258
1,993,888
2,364,543 1,365,254
62,997 15,480 45,850
75,953
484,650 3,674 1,125
130
1.1 1.2
0.4 0.2 3.8 1.7
-
1.3 -
0.9 1.0 0.9
(D)1.7 0.5 0.5 0.6
1.3 0.5 0.3 (D)0.7
(D)0.5 0.6 0.7 0.6
1.2 0.8 1.9 0.4 0.6
1.6 0.5 0.5 0.7 0.8
1.1 2.3 (D)
- 0.6
0.7 0.6 1.1 3.0
-
0.7 2.2
- 0.6 1.6
0.2 0.8 0.9 0.6 0.5
(D)0.5 0.9 0.6 0.9
1.3 1.0 1.9 1.5 3.8
2.2 2.1 2.8 0.2 (D)
10,831 9,987
85 -
28 25
806
771 13
115 51
613
16 126 423 327 156
816
38 30
7 113
136 160 365
42 194
136
3,206 54
- 10
25
- 12
206 19
206
96 2 4
73
227 38
530 63
4
51 197
- 153
63
164 289 817 259 287
26
967 204 129
4,664
1,152 303 116
31 17
111 470 809
- 16
5,113,524 5,094,445
28,224 -
4,295 44,808 38,963
504,746
81 50,644 32,194
298,321
118 183,915 179,238 149,674 54,456
418,602 13,375 25,325
1,295 29,188
2,552
103,695 124,158 21,903 81,087
47,864
1,421,059 43,742
- 1,869
13,764
- 3,800
97,838 5,303
60,417
196,990 (D)
8 27,341
109,970 17,762
331,729 28,003
20
6,310 198,768
- 99,110 10,200
3,956 88,011
381,997 161,199 111,703
11,483
398,868 133,410 58,241
2,103,953
649,369 165,613 138,807
9,640 11,900
85,080
558,003 42,173
- 118
1.1 1.2
0.6 -
2.8 2.1 1.6
1.6 0.3 0.7 0.8 0.8
(D) 1.9 0.6 0.5 0.5
1.2 0.5 0.4 0.1 0.6
1.0 0.6 0.6 0.7 0.7
1.7 0.8 2.9
- 0.6
1.8
- 0.5 0.8 0.3
1.0 1.9 (D) 0.1 0.8
0.9 0.7 1.4 2.3 0.1
0.5 2.4
- 0.8 2.0
0.7 0.7 0.8 0.6 0.5
(D) 0.6 1.2 0.7 0.9
1.2 1.4 2.1 1.4 2.6
2.3 2.1 1.7
- (D)
1,966 3,618
21 - 3
19 -
11 -
15 5
178
- 58 54 63 55
110
9 5 3
10
7 128 126
14 93
49
377 14
- 4
2 2
20 27
-
70 20
- -
31
111 5
67 - -
14 27
- 139
-
10 35
264 181
36
9 348
25 36
624
223 43
8 -
17
2 105
- - -
583,140 (D)
3,430 -
1,020 741
-
19,422 -
6,728 4,345
46,905
- 38,135 12,175 30,438 11,542
16,828
160 1,582
(D)2,858
(D)
32,665 25,539
4,510 17,149
17,717
107,470 1,720
- 1,554
(D)(D)
1,440 7,127
-
6,870 18,488
- -
4,449
18,592 3,060
30,995 - -
1,365 32,290
- 52,935
-
280 12,425 60,696 45,591
9,404
(D)110,396
8,111 8,045
162,562
29,719 25,715 15,840
- 1,940
(D)
88,913 - - -
1.1 (D)
0.7 -
4.1 3.1
-
2.9 -
0.6 0.8 0.9
-
3.6 0.4 0.4 0.4
1.1 0.3 0.3 (D)0.3
(D)0.5 0.6 1.0 0.6
1.0 0.9 1.9
- 0.7
(D)(D)0.8 0.7
-
0.8 2.0
- -
0.3
0.4 0.5 1.3
- -
0.9 2.1
- 0.7
-
0.8 0.5 0.8 0.5 0.4
(D)0.6 0.6 0.6 0.8
1.0 1.4 3.2
- 2.9
(D)2.7
- - -
See footnote(s) at end of table. --continued
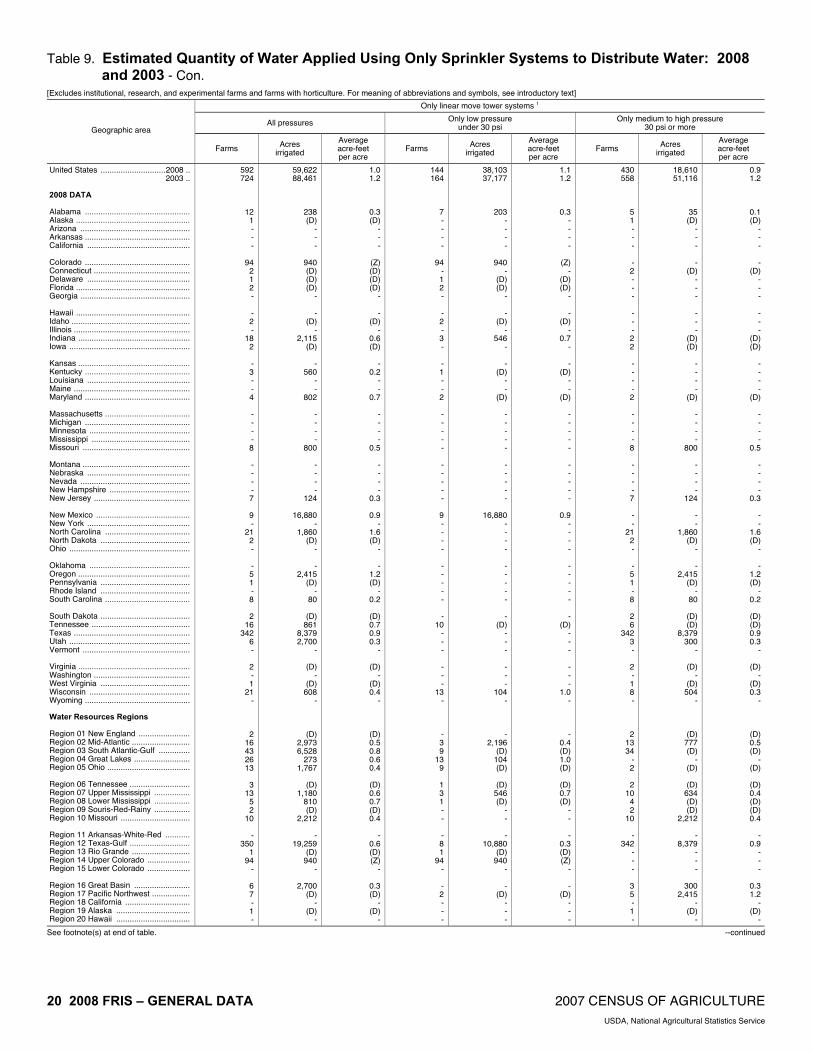
20 2008 FRIS – GENERAL DATA 2007 CENSUS OF AGRICULTURE USDA, National Agricultural Statistics Service
Table 9. Estimated Quantity of Water Applied Using Only Sprinkler Systems to Distribute Water: 2008 and 2003 - Con.
[Excludes institutional, research, and experimental farms and farms with horticulture. For meaning of abbreviations and symbols, see introductory text]
Only linear move tower systems 1
All pressures Only low pressure under 30 psi
Only medium to high pressure 30 psi or more Geographic area
Farms Acres irrigated
Average acre-feet per acre
Farms Acres irrigated
Average acre-feet per acre
Farms Acres irrigated
Average acre-feet per acre
United States .............................2008 .. 2003 .. 2008 DATA Alabama ............................................... Alaska ................................................... Arizona ................................................. Arkansas ............................................... California .............................................. Colorado ............................................... Connecticut ........................................... Delaware .............................................. Florida ................................................... Georgia ................................................. Hawaii ................................................... Idaho ..................................................... Illinois .................................................... Indiana .................................................. Iowa ...................................................... Kansas .................................................. Kentucky ............................................... Louisiana .............................................. Maine .................................................... Maryland ............................................... Massachusetts ...................................... Michigan ............................................... Minnesota ............................................. Mississippi ............................................ Missouri ................................................ Montana ................................................ Nebraska .............................................. Nevada ................................................. New Hampshire .................................... New Jersey ........................................... New Mexico .......................................... New York .............................................. North Carolina ...................................... North Dakota ........................................ Ohio ...................................................... Oklahoma ............................................. Oregon .................................................. Pennsylvania ........................................ Rhode Island ........................................ South Carolina ...................................... South Dakota ........................................ Tennessee ............................................ Texas .................................................... Utah ...................................................... Vermont ................................................ Virginia .................................................. Washington ........................................... West Virginia ........................................ Wisconsin ............................................. Wyoming ............................................... Water Resources Regions Region 01 New England ....................... Region 02 Mid-Atlantic .......................... Region 03 South Atlantic-Gulf .............. Region 04 Great Lakes ......................... Region 05 Ohio ..................................... Region 06 Tennessee ........................... Region 07 Upper Mississippi ................ Region 08 Lower Mississippi ................ Region 09 Souris-Red-Rainy ................ Region 10 Missouri ............................... Region 11 Arkansas-White-Red ........... Region 12 Texas-Gulf ........................... Region 13 Rio Grande .......................... Region 14 Upper Colorado ................... Region 15 Lower Colorado ................... Region 16 Great Basin ......................... Region 17 Pacific Northwest ................. Region 18 California ............................. Region 19 Alaska ................................. Region 20 Hawaii .................................
592 724
12 1 - - -
94 2 1 2 -
- 2 -
18 2
- 3 - - 4
- - - - 8
- - - - 7
9 -
21 2 -
- 5 1 - 8
2
16 342
6 -
2 - 1
21 -
2 16 43 26 13
3
13 5 2
10
- 350
1 94
-
6 7 - 1 -
59,622 88,461
238 (D)
- - -
940 (D) (D) (D)
-
- (D)
- 2,115
(D)
- 560
- -
802
- - - -
800
- - - -
124
16,880 -
1,860 (D)
-
- 2,415
(D) -
80
(D) 861
8,379 2,700
-
(D) -
(D) 608
-
(D) 2,973 6,528
273 1,767
(D)
1,180 810 (D)
2,212
- 19,259
(D) 940
-
2,700 (D)
- (D)
-
1.0 1.2
0.3 (D)
- - -
(Z)(D)(D)(D)
-
- (D)
- 0.6 (D)
-
0.2 - -
0.7
- - - -
0.5
- - - -
0.3
0.9 -
1.6 (D)
-
- 1.2 (D)
- 0.2
(D)0.7 0.9 0.3
-
(D)-
(D)0.4
-
(D)0.5 0.8 0.6 0.4
(D)0.6 0.7 (D)0.4
-
0.6 (D)(Z)
-
0.3 (D)
- (D)
-
144 164
7 - - - -
94 - 1 2 -
- 2 - 3 -
- 1 - - 2
- - - - -
- - - - -
9 - - - -
- - - - -
- 10
- - -
- - -
13 -
- 3 9
13 9
1 3 1 - -
- 8 1
94 -
- 2 - - -
38,103 37,177
203 - - - -
940 -
(D)(D)
-
- (D)
- 546
-
- (D)
- -
(D)
- - - - -
- - - - -
16,880 - - - -
- - - - -
- (D)
- - -
- - -
104 -
- 2,196
(D)104 (D)
(D)
546 (D)
- -
- 10,880
(D)940
-
- (D)
- - -
1.1 1.2
0.3 - - - -
(Z) -
(D) (D)
-
- (D)
- 0.7
-
- (D)
- -
(D)
- - - - -
- - - - -
0.9 - - - -
- - - - -
- (D)
- - -
- - -
1.0 -
- 0.4 (D) 1.0 (D)
(D) 0.7 (D)
- -
- 0.3 (D) (Z)
-
- (D)
- - -
430 558
5 1 - - -
- 2 - - -
- - - 2 2
- - - - 2
- - - - 8
- - - - 7
- -
21 2 -
- 5 1 - 8
2 6
342 3 -
2 - 1 8 -
2 13 34
- 2
2
10 4 2
10
- 342
- - -
3 5 - 1 -
18,610 51,116
35 (D)
- - -
- (D)
- - -
- - -
(D)(D)
- - - -
(D)
- - - -
800
- - - -
124
- -
1,860 (D)
-
- 2,415
(D)-
80
(D)(D)
8,379 300
-
(D)-
(D)504
-
(D)777 (D)
- (D)
(D)
634 (D)(D)
2,212
- 8,379
- - -
300 2,415
- (D)
-
0.9 1.2
0.1 (D)
- - -
- (D)
- - -
- - -
(D)(D)
- - - -
(D)
- - - -
0.5
- - - -
0.3
- -
1.6 (D)
-
- 1.2 (D)
- 0.2
(D)(D)0.9 0.3
-
(D)-
(D)0.3
-
(D)0.5 (D)
- (D)
(D)0.4 (D)(D)0.4
-
0.9 - - -
0.3 1.2
- (D)
-
See footnote(s) at end of table. --continued

2007 CENSUS OF AGRICULTURE 2008 FRIS – GENERAL DATA 21 USDA, National Agricultural Statistics Service
Table 9. Estimated Quantity of Water Applied Using Only Sprinkler Systems to Distribute Water: 2008 and 2003 - Con.
[Excludes institutional, research, and experimental farms and farms with horticulture. For meaning of abbreviations and symbols, see introductory text]
Only solid set and permanent systems 1
All pressures Only low pressure under 30 psi
Only medium to high pressure 30 psi or more Geographic area
Farms Acres irrigated
Average acre-feet per acre
Farms Acres irrigated
Average acre-feet per acre
Farms Acres irrigated
Average acre-feet per acre
United States ............................. 2008 .. 2003 .. 2008 DATA Alabama ............................................... Alaska .................................................. Arizona ................................................. Arkansas .............................................. California .............................................. Colorado ............................................... Connecticut .......................................... Delaware .............................................. Florida .................................................. Georgia ................................................ Hawaii .................................................. Idaho .................................................... Illinois ................................................... Indiana ................................................. Iowa ..................................................... Kansas ................................................. Kentucky .............................................. Louisiana .............................................. Maine ................................................... Maryland .............................................. Massachusetts ..................................... Michigan ............................................... Minnesota ............................................. Mississippi ............................................ Missouri ................................................ Montana ............................................... Nebraska .............................................. Nevada ................................................. New Hampshire .................................... New Jersey .......................................... New Mexico .......................................... New York .............................................. North Carolina ...................................... North Dakota ........................................ Ohio ..................................................... Oklahoma ............................................. Oregon ................................................. Pennsylvania ........................................ Rhode Island ........................................ South Carolina ..................................... South Dakota ....................................... Tennessee ........................................... Texas ................................................... Utah ..................................................... Vermont ................................................ Virginia ................................................. Washington .......................................... West Virginia ........................................ Wisconsin ............................................. Wyoming .............................................. Water Resources Regions Region 01 New England ....................... Region 02 Mid-Atlantic ......................... Region 03 South Atlantic-Gulf .............. Region 04 Great Lakes ........................ Region 05 Ohio .................................... Region 06 Tennessee .......................... Region 07 Upper Mississippi ................ Region 08 Lower Mississippi ................ Region 09 Souris-Red-Rainy ................ Region 10 Missouri .............................. Region 11 Arkansas-White-Red ........... Region 12 Texas-Gulf .......................... Region 13 Rio Grande ......................... Region 14 Upper Colorado ................... Region 15 Lower Colorado ................... Region 16 Great Basin ......................... Region 17 Pacific Northwest ................ Region 18 California ............................. Region 19 Alaska ................................. Region 20 Hawaii .................................
13,276 10,573
25 3
219 -
4,921
19 2 8
758 212
37
546 -
40 5
- 6
56 3 2
336 138
28 2
37
- - - 6
64
655 38
233 - 2
52
391 29
6 46
-
12 284 170
8
1 3,683
- 193
-
356 144
1,272 151
19
14 238 102
- -
71 284 655
- 219
170
4,618 4,923
3 37
549,546 484,511
497 12
659 -
266,034
16,720 (D)
120 26,299 24,384
206
3,003 -
1,851 60
-
24 1,388
30 (D)
9,856 5,251
700 (D) 37
- - -
36 3,188
983 667
12,210 -
(D)
4,132 15,536
330 (D)
588
- (D)
3,111 5,916
105
(D) 123,817
- 14,494
-
10,241 4,194
65,558 5,290 1,850
979
15,446 5,859
- -
20,852 3,111
983 -
659
5,916 142,036 266,354
12 206
2.2 2.4
0.4 0.3 1.8
- 2.5
1.6 (D)0.7 1.5 1.4
1.3 1.9
- 0.6 2.0
-
1.8 1.0 0.5 (D)
1.2 0.6 0.7 (D)1.0
- - -
0.4 1.2
2.3 2.3 1.1
- (D)
1.5 0.9 1.7 (D)0.7
-
(D)0.8 3.0 0.8
(D)2.4
- 3.0
-
1.2 1.3 1.3 0.6 (D)
(D)2.8 0.2
- -
1.6 0.8 2.3
- 1.8
3.0 2.3 2.5 0.3 1.3
2,762 3,343
12 -
219 -
757
19 - -
363 -
12 - - - -
- - - - -
8 - - - -
- - - - 4
327
31 47
- -
2 - 2 5 2
- -
279 - -
- 673
- - -
13 37
421 - -
3 - - - -
21 279 327
- 219
-
673 757
- 12
80,268 73,292
144 -
659 -
32,499
16,720 - -
11,803 -
12 - - - -
- - - - -
330 - - - -
- - - -
44
327 217
1,720 - -
(D)-
(D)10 (D)
- -
2,511 - -
- 10,272
- - -
340 341
14,047 - -
(D)- - - -
19,140 2,511
(D)-
659
- 10,272 32,499
- 12
2.1 1.4
0.5 -
1.8 -
2.3
1.6 - -
2.6 -
1.2 - - - -
- - - - -
0.8 - - - -
- - - -
2.7
3.0 3.6 0.9
- -
(D) -
(D) 1.0 (D)
- -
0.9 - -
- 2.1
- - -
0.8 3.4 2.3
- -
0.5 - - - -
1.7 0.9 3.0
- 1.8
-
2.1 2.3
- 1.2
10,499 7,227
13 3 - -
4,160
- 2 8
395 212
25
546 -
38 5
- 6
56 3 2
328 138
28 -
37
- - - 6
60
328 7
186 - 2
50
389 27
1 44
-
12 5
170 8
1
3,005 -
193 -
343 107 851 151
17
11 238 100
- -
50 5
328 - -
170 3,940 4,160
3 25
451,220 410,098
353 12
- -
225,627
- (D)
120 14,496 24,384
194
3,003 -
491 60
-
24 1,388
30 (D)
9,526 5,251
700 -
37
- - -
36 3,144
656 450
10,490 -
(D)
(D)15,216
(D)(D)(D)
-
(D)600
5,916 105
(D)
109,475 -
14,494 -
9,901 3,853
51,511 5,290
490
(D)15,446
1,459 - -
1,712 600 (D)
- -
5,916 127,694 225,627
12 194
2.2 2.5
0.4 0.3
- -
2.5
- (D)0.7 0.5 1.4
1.3 1.9
- 0.4 2.0
-
1.8 1.0 0.5 (D)
1.2 0.6 0.7
- 1.0
- - -
0.4 1.2
1.9 1.7 1.1
- (D)
(D)0.9 (D)(D)(D)
-
(D)0.2 3.0 0.8
(D)2.5
- 3.0
-
1.2 1.1 1.1 0.6 (D)
(D)2.8 1.0
- -
0.9 0.2 1.9
- -
3.0 2.3 2.5 0.3 1.3
See footnote(s) at end of table. --continued

22 2008 FRIS – GENERAL DATA 2007 CENSUS OF AGRICULTURE USDA, National Agricultural Statistics Service
Table 9. Estimated Quantity of Water Applied Using Only Sprinkler Systems to Distribute Water: 2008 and 2003 - Con.
[Excludes institutional, research, and experimental farms and farms with horticulture. For meaning of abbreviations and symbols, see introductory text]
Only hand move systems
Only big gun or traveler systems
Only side roll, wheel move, or other mechanical move systems
Geographic area
Farms Acres irrigated
Averageacre-feet per acre
Farms Acres irrigated
Averageacre-feet per acre
Farms Acres irrigated
Averageacre-feet per acre
United States .............................2008 .. 2003 .. 2008 DATA Alabama ............................................... Alaska ................................................... Arizona ................................................. Arkansas ............................................... California .............................................. Colorado ............................................... Connecticut ........................................... Delaware .............................................. Florida ................................................... Georgia ................................................. Hawaii ................................................... Idaho ..................................................... Illinois .................................................... Indiana .................................................. Iowa ...................................................... Kansas .................................................. Kentucky ............................................... Louisiana .............................................. Maine .................................................... Maryland ............................................... Massachusetts ...................................... Michigan ............................................... Minnesota ............................................. Mississippi ............................................ Missouri ................................................ Montana ................................................ Nebraska .............................................. Nevada ................................................. New Hampshire .................................... New Jersey ........................................... New Mexico .......................................... New York .............................................. North Carolina ...................................... North Dakota ........................................ Ohio ...................................................... Oklahoma ............................................. Oregon .................................................. Pennsylvania ........................................ Rhode Island ........................................ South Carolina ...................................... South Dakota ........................................ Tennessee ............................................ Texas .................................................... Utah ...................................................... Vermont ................................................ Virginia .................................................. Washington ........................................... West Virginia ........................................ Wisconsin ............................................. Wyoming ............................................... Water Resources Regions Region 01 New England ....................... Region 02 Mid-Atlantic .......................... Region 03 South Atlantic-Gulf .............. Region 04 Great Lakes ......................... Region 05 Ohio ..................................... Region 06 Tennessee ........................... Region 07 Upper Mississippi ................ Region 08 Lower Mississippi ................ Region 09 Souris-Red-Rainy ................ Region 10 Missouri ............................... Region 11 Arkansas-White-Red ........... Region 12 Texas-Gulf ........................... Region 13 Rio Grande .......................... Region 14 Upper Colorado ................... Region 15 Lower Colorado ................... Region 16 Great Basin ......................... Region 17 Pacific Northwest ................. Region 18 California ............................. Region 19 Alaska ................................. Region 20 Hawaii .................................
16,069 15,728
52 6
110 -
5,131
193 34
- -
155
94 2,155
13 33
-
- 206 106
11 47
7
120 74
- 76
208
- -
10 101
39 50
184 13 48
93
3,455 133
14 19
26 52
558 1,115
10
48 974
39 111 146
76 274 427 208 354
56
197 123
7 217
132 558
- 689 110
964
6,446 5,131
6 94
268,388 511,679
922 78
2,436 -
79,121
2,895 238
- -
3,654
406 29,392
13 322
-
- 1,799
318 178 169
49
1,943 281
- 76
5,974
- -
22 813
2,028
744 3,588
44 191
4,833
55,440 828 102 616
52
372 3,627
16,604 96
1,412
41,814 155
1,195 3,548
589 2,328 9,615 2,416 2,456
867
1,384 403
14 3,540
6,861 3,627
- 7,748 2,436
14,928
129,571 79,121
78 406
1.8 1.4
0.7 0.3 1.5
- 2.5
1.0 0.5
- -
2.0
1.9 2.1 1.5 0.7
-
- 0.4 1.0 0.5 0.9
0.1 0.4 1.0
- 1.0
1.2
- -
0.2 0.4
1.2 1.0 0.1 1.2 1.1
0.6 1.3 0.3 0.3 0.6
0.7 0.5 1.2 1.2 0.3
0.6 2.2 0.3 1.7 1.9
0.4 0.5 1.0 0.5 0.5
0.8 1.7 0.9 1.5 1.5
0.8 1.2
- 1.1 1.5
1.4 1.8 2.5 0.3 1.9
3,683 4,089
51 -
12 25 54
1 2 9
139 194
- -
20 73
7
112 194
17 44 41
7
213 40 15
138
144 117
- 1
72
- 22
482 4
22
3 251
44 1
31
- 72
279 - -
145 450
3 60 72
55 258 954 306 217
66
102 63
- 546
69
279 - 1
12
- 701
54 - -
271,101 299,773
5,775 -
1,200 1,500
19,440
(D)(D)
906 24,970 10,101
- -
3,895 5,704
274
3,472 5,699 1,020 2,861 2,252
231
21,481 1,150 1,680 5,175
1,152 8,190
- (D)
3,962
- 1,642
43,919 420 962
900
22,255 2,865
(D)3,719
-
2,561 2,790
- -
10,058 37,885
(D)4,607
(D)
3,260 17,321 89,848 28,069
8,640
5,100 8,232
(D)-
18,107
3,422 2,790
- (D)
1,200
- 60,140 19,440
- -
0.7 1.2
0.4 -
5.0 2.5 1.1
(D) (D) 0.6 0.2 0.7
- -
0.4 0.3 0.3
0.9 0.5 0.4 0.1 0.4
0.7 0.3 0.5 0.9 0.3
(D) 0.8
- (D) 0.5
-
0.3 0.4 1.2 0.2
1.0 2.0 0.3 (D) 0.7
-
0.3 0.5
- -
0.5 1.2 (D) 0.4 0.4
0.2 0.5 0.4 0.4 0.4
0.4 0.3 (D)
- 0.6
1.7 0.5
- (D) 5.0
-
1.5 1.1
- -
5,563 4,517
6 - 3 -
159
401 - - 6 -
- 509
2 17
-
- 42
- -
28
7 51
- 3
39
492 118 139
1 -
394 12 16
7 6
2
543 2 - 5
- 6
209 1,569
-
5 617
- -
147
8 45 33 53 40
15 10 13
- 549
66
147 331
1,510 3
867
1,687 186
- -
414,893 407,039
1,390 -
1,560 -
19,979
20,768 - -
3,228 -
- 47,760
(D)2,862
-
- 2,022
- -
492
(D)1,254
- 3,770 4,385
35,267 24,915 11,225
(D)-
8,624 1,184
560 280 378
(D)
77,561 (D)
- 380
-
614 24,352 49,268
-
290 56,886
- -
12,050
741 1,890 4,718 1,584 2,534
1,789 2,214 8,379
- 56,190
6,124
21,592 6,832
48,295 1,560
37,068
173,274 40,109
- -
1.5 1.7
0.7 -
3.1 -
2.6
1.8 - -
0.2 -
- 1.9 (D)0.2
-
- 0.4
- -
0.5
(D)0.4
- 0.8 1.4
0.7 0.9 2.4 (D)
-
2.7 0.9 0.5 0.6 0.6
(D)1.4 (D)
- 0.4
-
0.3 0.5 2.1
-
0.3 1.7
- -
1.9
0.1 0.7 0.3 0.5 0.3
0.5 0.2 1.1
- 1.0
0.5 0.7 3.1 2.1 3.1
1.8 1.6 2.1
- -
1 Farms reporting more than one pressure are not included in the "All pressures" columns.

2007 CENSUS OF AGRICULTURE 2008 FRIS – GENERAL DATA 23 USDA, National Agricultural Statistics Service
Table 10. Estimated Quantity of Water Applied Using Only Gravity Flow Systems to Distribute Water: 2008 and 2003
[Excludes institutional, research, and experimental farms and farms with horticulture. For meaning of abbreviations and symbols, see introductory text]
Total Only down rows or furrows Only controlled flooding (between borders or within basins)
Geographic area
Farms Acres irrigated
Average acre-feet per acre
Farms Acres irrigated
Average acre-feet per acre
Farms Acres irrigated
Average acre-feet per acre
United States ............................. 2008 .. 2003 .. 2008 DATA Alabama ............................................... Alaska .................................................. Arizona ................................................. Arkansas .............................................. California .............................................. Colorado ............................................... Connecticut .......................................... Delaware .............................................. Florida .................................................. Georgia ................................................ Hawaii .................................................. Idaho .................................................... Illinois ................................................... Indiana ................................................. Iowa ..................................................... Kansas ................................................. Kentucky .............................................. Louisiana .............................................. Maine ................................................... Maryland .............................................. Massachusetts ..................................... Michigan ............................................... Minnesota ............................................. Mississippi ............................................ Missouri ................................................ Montana ............................................... Nebraska .............................................. Nevada ................................................. New Hampshire .................................... New Jersey .......................................... New Mexico .......................................... New York .............................................. North Carolina ...................................... North Dakota ........................................ Ohio ..................................................... Oklahoma ............................................. Oregon ................................................. Pennsylvania ........................................ Rhode Island ........................................ South Carolina ..................................... South Dakota ....................................... Tennessee ........................................... Texas ................................................... Utah ..................................................... Vermont ................................................ Virginia ................................................. Washington .......................................... West Virginia ........................................ Wisconsin ............................................. Wyoming .............................................. Water Resources Regions Region 01 New England ....................... Region 02 Mid-Atlantic ......................... Region 03 South Atlantic-Gulf .............. Region 04 Great Lakes ........................ Region 05 Ohio .................................... Region 06 Tennessee .......................... Region 07 Upper Mississippi ................ Region 08 Lower Mississippi ................ Region 09 Souris-Red-Rainy ................ Region 10 Missouri .............................. Region 11 Arkansas-White-Red ........... Region 12 Texas-Gulf .......................... Region 13 Rio Grande ......................... Region 14 Upper Colorado ................... Region 15 Lower Colorado ................... Region 16 Great Basin ......................... Region 17 Pacific Northwest ................ Region 18 California ............................. Region 19 Alaska ................................. Region 20 Hawaii .................................
59,271 73,446
86 1
1,946 2,860
10,472
8,212 - -
571 109
194
5,529 32
- 20
580
94 1,236
- 22
7
49 37
540 495
4,296
794 1,103
8 21
5,632
4 -
89 23
132
1,928 51
4 4
327
46 3,113 4,311
5
16 1,228
7 34
3,003
19 122 771
89 113
40
120 4,516
10 8,987
3,430 2,390 5,471 6,070 2,336
4,346 9,336
10,910 1
194
13,456,627 15,743,675
2,334 (D)
578,548 2,736,611 2,472,035
1,177,311
- -
403,311 3,163
1,107
371,403 3,602
- 1,355
58,294
2,155 663,556
- 132
98
1,090 17,077
581,811 428,700
708,973 286,736 294,530
24 1,348
293,717
32 -
30,196 326
33,955
370,020 209
4 380
45,295
2,130 619,929 354,201
15
288 98,429
(D) 728
811,317
126 2,114
410,264 1,474 1,842
(D)
19,555 3,989,375
13,463 1,819,039
805,685 487,563 489,062 808,674 630,079
558,344 961,667
2,456,931 (D)
1,107
2.2 2.0
0.9 (D) 5.6 2.0 3.3
1.5
- -
1.4 0.5
1.0 2.1 0.6
- 1.7
1.1 0.4 1.1
- 0.6
0.1 0.3 1.6 1.1 0.9
1.4 1.4 1.8 0.2 0.9
2.5 (D)
- 1.4 0.6
1.3 1.9 0.3 4.4 0.4
1.0 0.8 1.9 2.0 0.1
0.5 2.5 5.9 3.2 2.1
0.2 1.0 1.4 0.4 0.4
(D) 0.7 1.6 1.9 1.6
1.5 1.9 2.2 1.6 5.5
2.1 2.0 3.2 (D) 1.0
19,086 24,813
71 1
166 834
2,525
3,902 - -
104 57
95
2,436 15
- 5
477
50 406
- 22
-
49 14
252 346
442 769
71 8
17
740 4 -
17 14
63
563 29
- 2
41 31
1,401 1,157
5
16 706
4 13
1,146
8 93
230 80 69
21 55
1,652 -
3,116
1,642 1,039 1,029 2,467
433
748 3,629 2,679
1 95
3,449,137 4,880,321
1,758 (D)
100,721 473,750 445,247
348,215
- -
58,192 1,915
131
179,332 461
- 1,155
46,778
985 195,229
- 132
-
1,090 14
152,926 250,642
71,359
257,186 7,750
24 908
58,975
32 -
8,433 146
30,175 56,321
143 -
(D)
8,031 1,952
309,320 50,061
15
288 72,029
(D) 26
257,064
24 1,502
62,041 1,294
672
(D) 11,297
991,759 -
663,879
334,713 207,723 136,148 138,233 115,716
27,143
317,075 439,727
(D) 131
2.0 1.9
1.0 (D) 5.1 2.1 3.2
2.0
- -
1.4 0.4
1.3 2.5 1.1
- 1.7
1.2 0.3 0.8
- 0.6
-
0.3 0.2 0.9 0.8
2.3 1.1 3.1 0.2 0.6
2.4 (Z)
- 1.6 0.8
1.3 2.8 0.3
- (D)
1.0 0.8 1.6 2.4 0.1
0.5 2.6 0.4 0.5 2.4
0.2 0.5 1.4 0.4 0.3
(D) 0.6 1.4
- 1.8
1.6 1.6 1.8 1.9 5.1
2.5 2.7 3.1 (D) 1.3
22,336 30,475
5 -
1,295 646
3,442
1,675 - -
29 -
70 1,907
2 - 5
88 22
691 - -
7 -
20 87 31
2,780
- 692
- 4
3,643
- -
35 -
44 837
- - -
181 -
1,284 1,672
-
- 20
2 8
1,112
7 6
39 -
22
5 30
1,328 9
3,713
899 943
3,675 1,041 1,297
2,177 3,349 3,726
- 70
4,098,939 4,767,164
40 -
249,689 491,039 837,230
263,129
- -
314,403 -
386 90,815
(D)-
20
4,016 652
340,096 - -
98 -
14,153 54,170 33,817
380,055
- 130,926
- 440
160,482
- -
5,136 -
443 118,836
- - -
21,957 -
213,417 120,097
-
- 15,980
(D)520
235,943
98 544
315,523 -
(D)
40 5,180
856,552 (D)
509,062
108,506 205,194 198,205 241,280 249,309
239,556 294,401 863,298
- 386
2.4 2.3
0.5 -
6.4 2.2 3.5
1.4
- -
1.3 -
1.0 1.2 (D)
- 5.6
1.0 0.5 1.5
- -
0.1 -
1.5 1.3 0.8
1.2
- 2.0
- 1.5
2.8
- -
0.9 -
1.9 2.1
- - -
1.0 -
2.6 2.2
-
- 1.1 (D)3.0 1.9
0.1 2.5 1.3
- 0.5
0.5 0.6 1.8 1.8 1.3
1.6 2.6 2.7 1.7 6.4
2.1 1.5 3.4
- 1.0
--continued

24 2008 FRIS – GENERAL DATA 2007 CENSUS OF AGRICULTURE USDA, National Agricultural Statistics Service
Table 10. Estimated Quantity of Water Applied Using Only Gravity Flow Systems to Distribute Water: 2008 and 2003 - Con.
[Excludes institutional, research, and experimental farms and farms with horticulture. For meaning of abbreviations and symbols, see introductory text]
Only uncontrolled flooding (rangeland, pastureland, etc.) Only other gravity
Geographic area
Farms Acres irrigated
Average acre-feet per acre
Farms Acres irrigated
Average acre-feet per acre
United States .............................2008 .. 2003 .. 2008 DATA Alabama ............................................... Alaska ................................................... Arizona ................................................. Arkansas ............................................... California .............................................. Colorado ............................................... Connecticut ........................................... Delaware .............................................. Florida ................................................... Georgia ................................................. Hawaii ................................................... Idaho ..................................................... Illinois .................................................... Indiana .................................................. Iowa ...................................................... Kansas .................................................. Kentucky ............................................... Louisiana .............................................. Maine .................................................... Maryland ............................................... Massachusetts ...................................... Michigan ............................................... Minnesota ............................................. Mississippi ............................................ Missouri ................................................ Montana ................................................ Nebraska .............................................. Nevada ................................................. New Hampshire .................................... New Jersey ........................................... New Mexico .......................................... New York .............................................. North Carolina ...................................... North Dakota ........................................ Ohio ...................................................... Oklahoma ............................................. Oregon .................................................. Pennsylvania ........................................ Rhode Island ........................................ South Carolina ...................................... South Dakota ........................................ Tennessee ............................................ Texas .................................................... Utah ...................................................... Vermont ................................................ Virginia .................................................. Washington ........................................... West Virginia ........................................ Wisconsin ............................................. Wyoming ............................................... Water Resources Regions Region 01 New England ....................... Region 02 Mid-Atlantic .......................... Region 03 South Atlantic-Gulf .............. Region 04 Great Lakes ......................... Region 05 Ohio ..................................... Region 06 Tennessee ........................... Region 07 Upper Mississippi ................ Region 08 Lower Mississippi ................ Region 09 Souris-Red-Rainy ................ Region 10 Missouri ............................... Region 11 Arkansas-White-Red ........... Region 12 Texas-Gulf ........................... Region 13 Rio Grande .......................... Region 14 Upper Colorado ................... Region 15 Lower Colorado ................... Region 16 Great Basin ......................... Region 17 Pacific Northwest ................. Region 18 California ............................. Region 19 Alaska ................................. Region 20 Hawaii .................................
6,059 9,188
- -
201 -
1,378
730 - -
213 -
2 670
13 - 5
- 7 6 - -
- - - - 4
677
- 252
- -
394 - - 7 -
23 375
- - -
30 4
14 625
-
- - - -
429
- -
213 - 7
3
13 7 -
824
277 16
125 1,058
307
659 1,174 1,374
- 2
901,645 1,197,437
- -
4,397 -
100,954
204,570 - -
9,807 -
(D)28,501
91 -
175
- (D)
3,140 - -
- - - -
604
105,450 -
105,076 - -
29,809 - -
77 -
2,217 112,718
- - -
2,885 47
2,800 46,771
-
- - - -
141,510
- -
9,807 -
(D)
32 91
3,155 -
209,849
15,823 5,400
29,558 230,954
7,967
128,815 168,174 91,974
- (D)
1.8 1.5
- -
4.3 -
4.3
1.2 - -
2.0 -
(D) 1.0 0.5
- 1.0
-
0.5 1.1
- -
- - - -
0.5
1.5 -
1.2 - -
1.2 - -
0.1 -
1.5 1.6
- - -
1.5 0.9 0.3 2.1
-
- - - -
2.0
- -
2.0 -
(D)
1.3 0.5 1.1
- 1.6
0.8 1.3 1.5 1.4 3.1
2.1 1.5 3.9
- (D)
2,794 1,090
10 -
109 -
1,059
99 - -
219 52
12
155 - - 5
15 13
4 - -
- - 3 - -
- -
12 - -
516 - - - -
- 18 22
4 2
29
9 -
100 -
- 247
1 13 66
4 23
283 -
13
9 20
4 1
92
77 -
126 452 109
90
420 1,059
- 12
193,099 110,249
536 -
218 -
59,594
6,894 - -
17,849 1,248
24
26,170 - - 5
7,500
44 6,800
- -
- -
2,910 - -
- -
12,072 - -
8,644 - - - -
- 8,558
66 4
(D)
3,080 (D)
- 11,065
-
- 1,690
(D)182
17,735
4 68
19,833 -
44
9 (D)
6,800 (D)
20,615
8,430 -
3,778 11,910
218
22,257 36,418 59,594
- 24
2.6 2.2
0.5 -
3.5 -
3.6
1.1 - -
3.2 (D)
2.2 2.0
- -
1.6
0.5 0.7 1.6
- -
- -
(D)- -
- -
2.9 - -
1.5 - - - -
- 1.3 0.3 4.4 (D)
1.1 2.9
- 2.6
-
- 2.2 (D)4.3 2.6
4.4 0.3 3.0
- 0.7
2.9 (D)1.6 (D)2.1
0.7
- 0.8 2.0 3.5
2.7 1.9 3.6
- 2.2
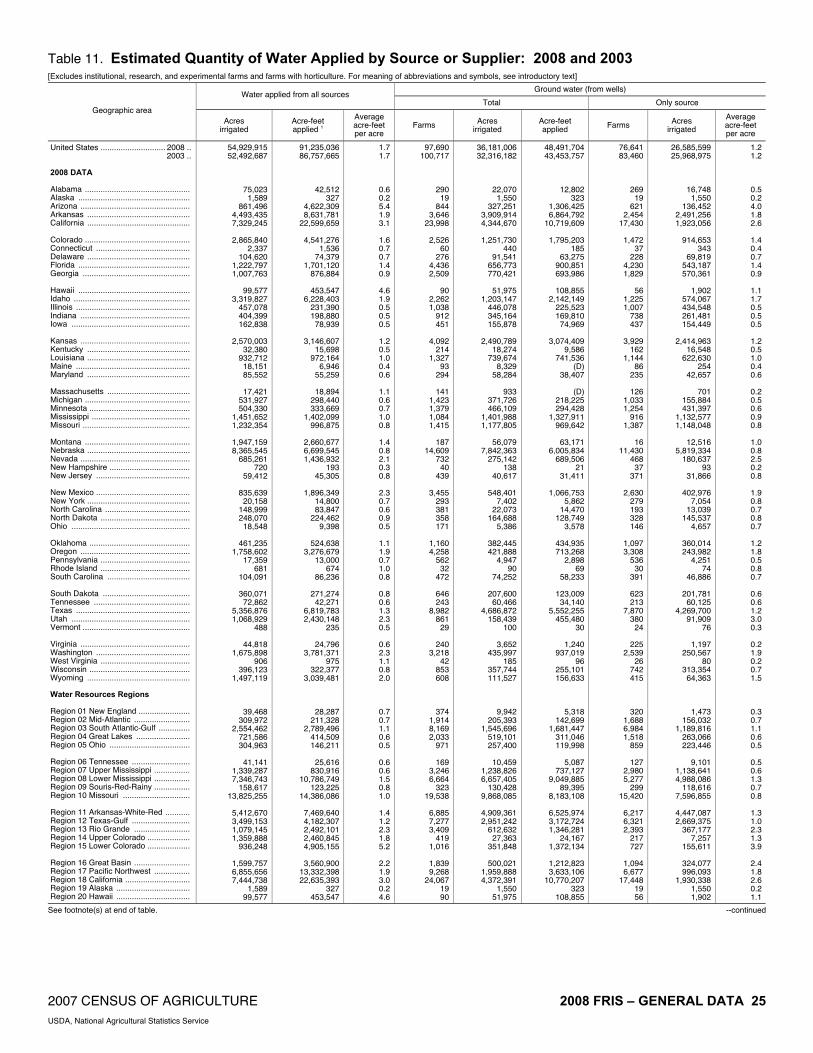
2007 CENSUS OF AGRICULTURE 2008 FRIS – GENERAL DATA 25 USDA, National Agricultural Statistics Service
Table 11. Estimated Quantity of Water Applied by Source or Supplier: 2008 and 2003 [Excludes institutional, research, and experimental farms and farms with horticulture. For meaning of abbreviations and symbols, see introductory text]
Ground water (from wells) Water applied from all sources
Total Only source Geographic area
Acres irrigated
Acre-feet applied 1
Average acre-feet per acre
Farms Acres irrigated
Acre-feet applied Farms Acres
irrigated
Average acre-feet per acre
United States ............................. 2008 .. 2003 .. 2008 DATA Alabama ............................................... Alaska .................................................. Arizona ................................................. Arkansas .............................................. California .............................................. Colorado ............................................... Connecticut .......................................... Delaware .............................................. Florida .................................................. Georgia ................................................ Hawaii .................................................. Idaho .................................................... Illinois ................................................... Indiana ................................................. Iowa ..................................................... Kansas ................................................. Kentucky .............................................. Louisiana .............................................. Maine ................................................... Maryland .............................................. Massachusetts ..................................... Michigan ............................................... Minnesota ............................................. Mississippi ............................................ Missouri ................................................ Montana ............................................... Nebraska .............................................. Nevada ................................................. New Hampshire .................................... New Jersey .......................................... New Mexico .......................................... New York .............................................. North Carolina ...................................... North Dakota ........................................ Ohio ..................................................... Oklahoma ............................................. Oregon ................................................. Pennsylvania ........................................ Rhode Island ........................................ South Carolina ..................................... South Dakota ....................................... Tennessee ........................................... Texas ................................................... Utah ..................................................... Vermont ................................................ Virginia ................................................. Washington .......................................... West Virginia ........................................ Wisconsin ............................................. Wyoming .............................................. Water Resources Regions Region 01 New England ....................... Region 02 Mid-Atlantic ......................... Region 03 South Atlantic-Gulf .............. Region 04 Great Lakes ........................ Region 05 Ohio .................................... Region 06 Tennessee .......................... Region 07 Upper Mississippi ................ Region 08 Lower Mississippi ................ Region 09 Souris-Red-Rainy ................ Region 10 Missouri .............................. Region 11 Arkansas-White-Red ........... Region 12 Texas-Gulf .......................... Region 13 Rio Grande ......................... Region 14 Upper Colorado ................... Region 15 Lower Colorado ................... Region 16 Great Basin ......................... Region 17 Pacific Northwest ................ Region 18 California ............................. Region 19 Alaska ................................. Region 20 Hawaii .................................
54,929,915 52,492,687
75,023 1,589
861,496 4,493,435 7,329,245
2,865,840
2,337 104,620
1,222,797 1,007,763
99,577
3,319,827 457,078 404,399 162,838
2,570,003
32,380 932,712 18,151 85,552
17,421
531,927 504,330
1,451,652 1,232,354
1,947,159 8,365,545
685,261 720
59,412
835,639 20,158
148,999 248,070 18,548
461,235
1,758,602 17,359
681 104,091
360,071 72,862
5,356,876 1,068,929
488
44,818 1,675,898
906 396,123
1,497,119
39,468 309,972
2,554,462 721,586 304,963
41,141
1,339,287 7,346,743
158,617 13,825,255
5,412,670 3,499,153 1,079,145 1,359,888
936,248
1,599,757 6,855,656 7,444,738
1,589 99,577
91,235,036 86,757,665
42,512 327
4,622,309 8,631,781
22,599,659
4,541,276 1,536
74,379 1,701,120
876,884
453,547 6,228,403
231,390 198,880 78,939
3,146,607
15,698 972,164
6,946 55,259
18,894
298,440 333,669
1,402,099 996,875
2,660,677 6,699,545 1,436,932
193 45,305
1,896,349
14,800 83,847
224,462 9,398
524,638
3,276,679 13,000
674 86,236
271,274 42,271
6,819,783 2,430,148
235
24,796 3,781,371
975 322,377
3,039,481
28,287 211,328
2,789,496 414,509 146,211
25,616
830,916 10,786,749
123,225 14,386,086
7,469,640 4,182,307 2,492,101 2,460,845 4,905,155
3,560,900
13,332,398 22,635,393
327 453,547
1.7 1.7
0.6 0.2 5.4 1.9 3.1
1.6 0.7 0.7 1.4 0.9
4.6 1.9 0.5 0.5 0.5
1.2 0.5 1.0 0.4 0.6
1.1 0.6 0.7 1.0 0.8
1.4 0.8 2.1 0.3 0.8
2.3 0.7 0.6 0.9 0.5
1.1 1.9 0.7 1.0 0.8
0.8 0.6 1.3 2.3 0.5
0.6 2.3 1.1 0.8 2.0
0.7 0.7 1.1 0.6 0.5
0.6 0.6 1.5 0.8 1.0
1.4 1.2 2.3 1.8 5.2
2.2 1.9 3.0 0.2 4.6
97,690 100,717
290 19
844 3,646
23,998
2,526 60
276 4,436 2,509
90
2,262 1,038
912 451
4,092
214 1,327
93 294
141
1,423 1,379 1,084 1,415
187
14,609 732
40 439
3,455
293 381 358 171
1,160 4,258
562 32
472
646 243
8,982 861
29
240 3,218
42 853 608
374 1,914 8,169 2,033
971
169 3,246 6,664
323 19,538
6,885 7,277 3,409
419 1,016
1,839 9,268
24,067 19 90
36,181,006 32,316,182
22,070 1,550
327,251 3,909,914 4,344,670
1,251,730
440 91,541
656,773 770,421
51,975
1,203,147 446,078 345,164 155,878
2,490,789
18,274 739,674
8,329 58,284
933
371,726 466,109
1,401,988 1,177,805
56,079
7,842,363 275,142
138 40,617
548,401
7,402 22,073
164,688 5,386
382,445 421,888
4,947 90
74,252
207,600 60,466
4,686,872 158,439
100
3,652 435,997
185 357,744 111,527
9,942 205,393
1,545,696 519,101 257,400
10,459
1,238,826 6,657,405
130,428 9,868,085
4,909,361 2,951,242
612,632 27,363
351,848
500,021 1,959,888 4,372,391
1,550 51,975
48,491,704 43,453,757
12,802 323
1,306,425 6,864,792
10,719,609
1,795,203 185
63,275 900,851 693,986
108,855
2,142,149 225,523 169,810 74,969
3,074,409
9,586 741,536
(D) 38,407
(D)
218,225 294,428
1,327,911 969,642
63,171
6,005,834 689,506
21 31,411
1,066,753
5,862 14,470
128,749 3,578
434,935 713,268
2,898 69
58,233
123,009 34,140
5,552,255 455,480
30
1,240 937,019
96 255,101 156,633
5,318 142,699
1,681,447 311,046 119,998
5,087
737,127 9,049,885
89,395 8,183,108
6,525,974 3,172,724 1,346,281
24,167 1,372,134
1,212,823 3,633,106
10,770,207 323
108,855
76,641 83,460
269 19
621 2,454
17,430
1,472 37
228 4,230 1,829
56
1,225 1,007
738 437
3,929
162 1,144
86 235
126
1,033 1,254
916 1,387
16
11,430 468
37 371
2,630
279 193 328 146
1,097 3,308
536 30
391
623 213
7,870 380
24
225 2,539
26 742 415
320 1,688 6,984 1,518
859
127 2,980 5,277
299 15,420
6,217 6,321 2,393
217 727
1,094 6,677
17,448 19 56
26,585,599 25,968,975
16,748 1,550
136,452 2,491,256 1,923,056
914,653
343 69,819
543,187 570,361
1,902
574,067 434,548 261,481 154,449
2,414,963
16,548 622,630
254 42,657
701
155,884 431,397
1,132,577 1,148,048
12,516
5,819,334 180,637
93 31,866
402,976
7,054 13,039
145,537 4,657
360,014 243,982
4,251 74
46,886
201,781 60,125
4,269,700 91,909
76
1,197 250,567
80 313,354 64,363
1,473 156,032
1,189,816 263,066 223,446
9,101
1,138,641 4,988,086
118,616 7,596,855
4,447,087 2,669,375
367,177 7,257
155,611
324,077 996,093
1,930,338 1,550 1,902
1.2 1.2
0.5 0.2 4.0 1.8 2.6
1.4 0.4 0.7 1.4 0.9
1.1 1.7 0.5 0.5 0.5
1.2 0.5 1.0 0.4 0.6
0.2 0.5 0.6 0.9 0.8
1.0 0.8 2.5 0.2 0.8
1.9 0.8 0.7 0.8 0.7
1.2 1.8 0.5 0.8 0.7
0.6 0.6 1.2 3.0 0.3
0.2 1.9 0.2 0.7 1.5
0.3 0.7 1.1 0.6 0.5
0.5 0.6 1.3 0.7 0.8
1.3 1.0 2.3 1.3 3.9
2.4 1.8 2.6 0.2 1.1
See footnote(s) at end of table. --continued

26 2008 FRIS – GENERAL DATA 2007 CENSUS OF AGRICULTURE USDA, National Agricultural Statistics Service
Table 11. Estimated Quantity of Water Applied by Source or Supplier: 2008 and 2003 - Con. [Excludes institutional, research, and experimental farms and farms with horticulture. For meaning of abbreviations and symbols, see introductory text]
On-farm surface source
Total Only source Geographic area
Farms Acres irrigated
Acre-feet applied Farms Acres
irrigated
Average acre-feet per acre
United States .............................2008 .. 2003 .. 2008 DATA Alabama ............................................... Alaska ................................................... Arizona ................................................. Arkansas ............................................... California .............................................. Colorado ............................................... Connecticut ........................................... Delaware .............................................. Florida ................................................... Georgia ................................................. Hawaii ................................................... Idaho ..................................................... Illinois .................................................... Indiana .................................................. Iowa ...................................................... Kansas .................................................. Kentucky ............................................... Louisiana .............................................. Maine .................................................... Maryland ............................................... Massachusetts ...................................... Michigan ............................................... Minnesota ............................................. Mississippi ............................................ Missouri ................................................ Montana ................................................ Nebraska .............................................. Nevada ................................................. New Hampshire .................................... New Jersey ........................................... New Mexico .......................................... New York .............................................. North Carolina ...................................... North Dakota ........................................ Ohio ...................................................... Oklahoma ............................................. Oregon .................................................. Pennsylvania ........................................ Rhode Island ........................................ South Carolina ...................................... South Dakota ........................................ Tennessee ............................................ Texas .................................................... Utah ...................................................... Vermont ................................................ Virginia .................................................. Washington ........................................... West Virginia ........................................ Wisconsin ............................................. Wyoming ............................................... Water Resources Regions Region 01 New England ....................... Region 02 Mid-Atlantic .......................... Region 03 South Atlantic-Gulf .............. Region 04 Great Lakes ......................... Region 05 Ohio ..................................... Region 06 Tennessee ........................... Region 07 Upper Mississippi ................ Region 08 Lower Mississippi ................ Region 09 Souris-Red-Rainy ................ Region 10 Missouri ............................... Region 11 Arkansas-White-Red ........... Region 12 Texas-Gulf ........................... Region 13 Rio Grande .......................... Region 14 Upper Colorado ................... Region 15 Lower Colorado ................... Region 16 Great Basin ......................... Region 17 Pacific Northwest ................. Region 18 California ............................. Region 19 Alaska ................................. Region 20 Hawaii .................................
54,352 45,470
318 4
751 1,471 9,092
4,028
97 76
758 1,749
335
3,650 66
316 56
358 517 335
94 310
487
1,067 227 287 486
3,901 2,519
697 48
235
1,856 230
1,682 102 224
189
4,638 470
24 308
115 248
2,148 2,094
42
375 3,059
64 504
1,645
767 1,315 4,997 1,509
989
314 810
1,591 66
7,576
1,408 1,907 1,610 4,447
866
1,947 12,588
9,306 4
335
8,813,848 7,241,081
44,833 39
127,845 985,911
1,425,715
722,231 1,646
12,685 268,153 239,624
12,707
606,693 8,388
52,618 4,800
49,330 12,454
179,850 16,277 26,205
14,620
162,048 32,482 67,607 56,061
830,781 254,738 271,419
522 18,369
98,068 11,178
123,696 22,246
9,105
36,197 542,767 11,815
383 30,668
23,022 11,082
156,965 236,592
388
38,022 309,106
742 40,035
605,120
33,594 99,489
705,037 199,242 42,886
27,075 96,432
1,042,945 20,730
1,626,506
368,524 124,114 229,547 550,383 132,647
441,888
1,603,578 1,456,485
39 12,707
13,773,706 11,737,520
24,189 4
638,978 1,720,577 2,651,880
1,199,188
1,276 10,686
317,610 175,831
38,154
980,301 3,069
26,320 2,661
33,003
4,958 191,579
(D)16,159
(D)
78,109 24,584 72,430 26,733
1,125,801
192,740 409,889
154 (D)
175,381
7,746 62,249 21,847
3,442
33,807 944,840
(D)564
27,847
21,763 6,472
141,072 503,240
205
21,414 675,006
878 64,126
1,051,516
21,982 65,108
607,791 98,968 21,082
16,543 86,164
1,662,940 19,667
2,081,846
591,367 132,254 359,827
1,020,638 648,856
838,532
2,831,203 2,630,781
4 38,154
37,973 35,718
289 4
640 328
4,848
3,149 73 30
547 1,059
321
2,754 39
154 47
218 432 182
88 251
464 679 105 128 458
3,362
25 566
41 167
1,428
207 1,492
88 191
142
3,840 444
22 221
89
218 1,311 1,830
37
357 2,830
48 390
1,340
701 1,088 3,785
987 848
270 549 290
45 4,064
833
1,287 996
3,981 752
1,612
10,530 5,030
4 321
4,551,387 4,874,155
38,831 39
54,560 78,494
293,402
458,069 1,242 4,217
143,462 118,415
4,372
371,890 4,362
22,265 2,928
17,688 10,916
115,937 5,843
15,773
12,827 67,634 21,326 12,585 48,554
695,750 13,500
155,519 326
13,638
59,743 8,550
106,580 17,967
7,721
26,705 371,589 10,372
319 16,439
18,788 10,812 64,482
205,811 304
31,876
221,871 665
24,758 541,671
20,699 68,022
420,617 86,637 32,095
25,730 59,662
127,958 17,760
1,089,568
143,361 59,322
131,463 496,580 56,262
294,543
1,107,994 308,703
39 4,372
1.6 1.6
0.5 0.1 4.7 2.3 3.8
1.5 1.0 0.8 1.3 0.7
0.6 1.6 0.3 0.4 0.5
0.5 0.4 0.9 0.1 0.6
1.3 0.4 0.9 0.6 0.5
1.3 1.5 1.2 0.4 0.8
1.6 0.6 0.5 0.8 0.4
0.8 1.7 0.8 1.6 0.8
1.0 0.6 1.3 2.1 0.6
0.6 2.1 1.3 2.1 1.7
1.0 0.7 0.8 0.4 0.5
0.6 1.1 1.1 1.0 1.4
1.8 1.4 1.2 1.8 4.6
1.8 1.7 3.5 0.1 0.6
See footnote(s) at end of table. --continued
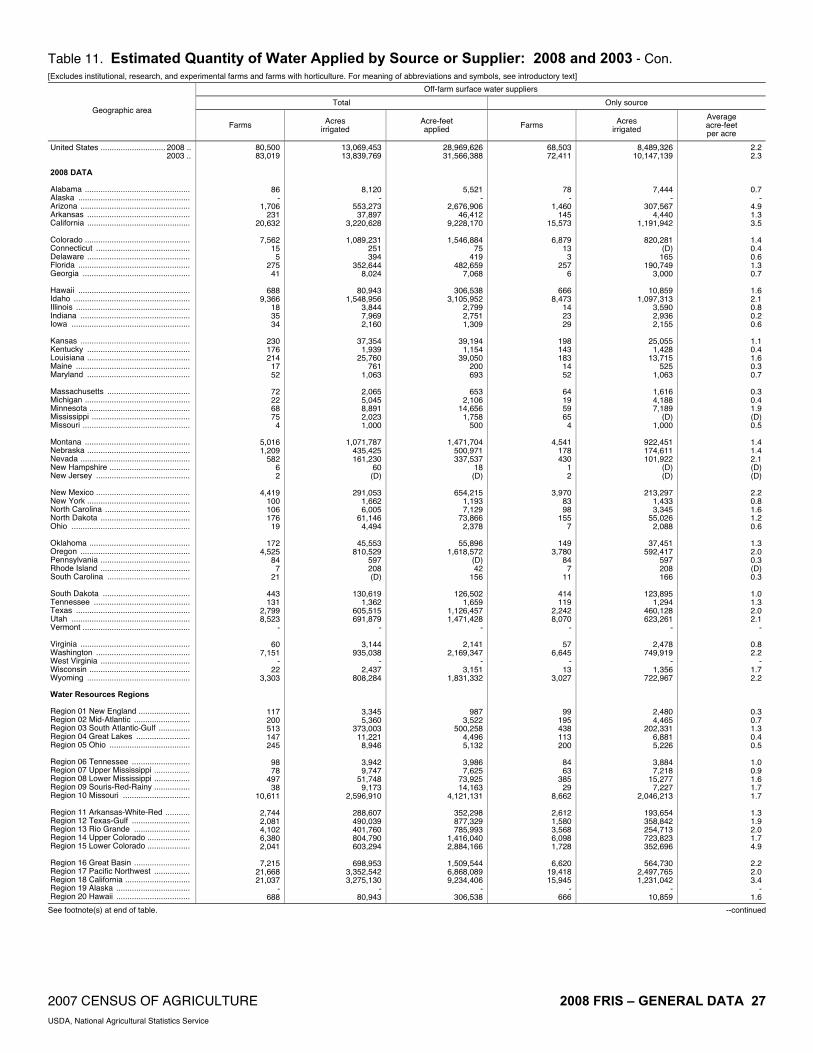
2007 CENSUS OF AGRICULTURE 2008 FRIS – GENERAL DATA 27 USDA, National Agricultural Statistics Service
Table 11. Estimated Quantity of Water Applied by Source or Supplier: 2008 and 2003 - Con. [Excludes institutional, research, and experimental farms and farms with horticulture. For meaning of abbreviations and symbols, see introductory text]
Off-farm surface water suppliers
Total Only source Geographic area
Farms Acres irrigated
Acre-feet applied Farms Acres
irrigated
Average acre-feet per acre
United States ............................. 2008 .. 2003 .. 2008 DATA Alabama ............................................... Alaska .................................................. Arizona ................................................. Arkansas .............................................. California .............................................. Colorado ............................................... Connecticut .......................................... Delaware .............................................. Florida .................................................. Georgia ................................................ Hawaii .................................................. Idaho .................................................... Illinois ................................................... Indiana ................................................. Iowa ..................................................... Kansas ................................................. Kentucky .............................................. Louisiana .............................................. Maine ................................................... Maryland .............................................. Massachusetts ..................................... Michigan ............................................... Minnesota ............................................. Mississippi ............................................ Missouri ................................................ Montana ............................................... Nebraska .............................................. Nevada ................................................. New Hampshire .................................... New Jersey .......................................... New Mexico .......................................... New York .............................................. North Carolina ...................................... North Dakota ........................................ Ohio ..................................................... Oklahoma ............................................. Oregon ................................................. Pennsylvania ........................................ Rhode Island ........................................ South Carolina ..................................... South Dakota ....................................... Tennessee ........................................... Texas ................................................... Utah ..................................................... Vermont ................................................ Virginia ................................................. Washington .......................................... West Virginia ........................................ Wisconsin ............................................. Wyoming .............................................. Water Resources Regions Region 01 New England ....................... Region 02 Mid-Atlantic ......................... Region 03 South Atlantic-Gulf .............. Region 04 Great Lakes ........................ Region 05 Ohio .................................... Region 06 Tennessee .......................... Region 07 Upper Mississippi ................ Region 08 Lower Mississippi ................ Region 09 Souris-Red-Rainy ................ Region 10 Missouri .............................. Region 11 Arkansas-White-Red ........... Region 12 Texas-Gulf .......................... Region 13 Rio Grande ......................... Region 14 Upper Colorado ................... Region 15 Lower Colorado ................... Region 16 Great Basin ......................... Region 17 Pacific Northwest ................ Region 18 California ............................. Region 19 Alaska ................................. Region 20 Hawaii .................................
80,500 83,019
86 -
1,706 231
20,632
7,562 15
5 275
41
688 9,366
18 35 34
230 176 214
17 52
72 22 68 75
4
5,016 1,209
582 6 2
4,419
100 106 176
19
172 4,525
84 7
21
443 131
2,799 8,523
-
60 7,151
- 22
3,303
117 200 513 147 245
98 78
497 38
10,611
2,744 2,081 4,102 6,380 2,041
7,215
21,668 21,037
- 688
13,069,453 13,839,769
8,120 -
553,273 37,897
3,220,628
1,089,231 251 394
352,644 8,024
80,943
1,548,956 3,844 7,969 2,160
37,354
1,939 25,760
761 1,063
2,065 5,045 8,891 2,023 1,000
1,071,787
435,425 161,230
60 (D)
291,053
1,662 6,005
61,146 4,494
45,553
810,529 597 208 (D)
130,619
1,362 605,515 691,879
-
3,144 935,038
- 2,437
808,284
3,345 5,360
373,003 11,221
8,946
3,942 9,747
51,748 9,173
2,596,910
288,607 490,039 401,760 804,790 603,294
698,953
3,352,542 3,275,130
- 80,943
28,969,626 31,566,388
5,521 -
2,676,906 46,412
9,228,170
1,546,884 75
419 482,659
7,068
306,538 3,105,952
2,799 2,751 1,309
39,194
1,154 39,050
200 693
653
2,106 14,656
1,758 500
1,471,704
500,971 337,537
18 (D)
654,215
1,193 7,129
73,866 2,378
55,896
1,618,572 (D)42
156
126,502 1,659
1,126,457 1,471,428
-
2,141 2,169,347
- 3,151
1,831,332
987 3,522
500,258 4,496 5,132
3,986 7,625
73,925 14,163
4,121,131
352,298 877,329 785,993
1,416,040 2,884,166
1,509,544 6,868,089 9,234,406
- 306,538
68,503 72,411
78 -
1,460 145
15,573
6,879 13
3 257
6
666 8,473
14 23 29
198 143 183
14 52
64 19 59 65
4
4,541 178 430
1 2
3,970
83 98
155 7
149
3,780 84
7 11
414 119
2,242 8,070
-
57 6,645
- 13
3,027
99 195 438 113 200
84 63
385 29
8,662
2,612 1,580 3,568 6,098 1,728
6,620
19,418 15,945
- 666
8,489,326 10,147,139
7,444 -
307,567 4,440
1,191,942
820,281 (D)
165 190,749
3,000
10,859 1,097,313
3,590 2,936 2,155
25,055
1,428 13,715
525 1,063
1,616 4,188 7,189
(D)1,000
922,451 174,611 101,922
(D)(D)
213,297
1,433 3,345
55,026 2,088
37,451
592,417 597 208 166
123,895
1,294 460,128 623,261
-
2,478 749,919
- 1,356
722,967
2,480 4,465
202,331 6,881 5,226
3,884 7,218
15,277 7,227
2,046,213
193,654 358,842 254,713 723,823 352,696
564,730
2,497,765 1,231,042
- 10,859
2.2 2.3
0.7 -
4.9 1.3 3.5
1.4 0.4 0.6 1.3 0.7
1.6 2.1 0.8 0.2 0.6
1.1 0.4 1.6 0.3 0.7
0.3 0.4 1.9 (D)0.5
1.4 1.4 2.1 (D)(D)
2.2 0.8 1.6 1.2 0.6
1.3 2.0 0.3 (D)0.3
1.0 1.3 2.0 2.1
-
0.8 2.2
- 1.7 2.2
0.3 0.7 1.3 0.4 0.5
1.0 0.9 1.6 1.7 1.7
1.3 1.9 2.0 1.7 4.9
2.2 2.0 3.4
- 1.6
See footnote(s) at end of table. --continued

28 2008 FRIS – GENERAL DATA 2007 CENSUS OF AGRICULTURE USDA, National Agricultural Statistics Service
Table 11. Estimated Quantity of Water Applied by Source or Supplier: 2008 and 2003 - Con. [Excludes institutional, research, and experimental farms and farms with horticulture. For meaning of abbreviations and symbols, see introductory text]
Farms using any off-farm water Farms using only off-farm water
Supplier of off-farm water 2 Supplier of off-farm water 2 Geographic area
Farms
Acres irrigated
with off-farm water
Quantity of off-farm water
(acre-feet)
Bureau of
Reclamation
Other Federal
agencies
All other
suppliers
Farms
Acres irrigated
with off-farm water
Acre-feet of
off-farm water
Bureau of
Reclamation
Other Federal
agencies
All other
suppliers
United States .............................2008 .. 2003 .. 2008 DATA Alabama ............................................... Alaska ................................................... Arizona ................................................. Arkansas ............................................... California .............................................. Colorado ............................................... Connecticut ........................................... Delaware .............................................. Florida ................................................... Georgia ................................................. Hawaii ................................................... Idaho ..................................................... Illinois .................................................... Indiana .................................................. Iowa ...................................................... Kansas .................................................. Kentucky ............................................... Louisiana .............................................. Maine .................................................... Maryland ............................................... Massachusetts ...................................... Michigan ............................................... Minnesota ............................................. Mississippi ............................................ Missouri ................................................ Montana ................................................ Nebraska .............................................. Nevada ................................................. New Hampshire .................................... New Jersey ........................................... New Mexico .......................................... New York .............................................. North Carolina ...................................... North Dakota ........................................ Ohio ...................................................... Oklahoma ............................................. Oregon .................................................. Pennsylvania ........................................ Rhode Island ........................................ South Carolina ...................................... South Dakota ........................................ Tennessee ............................................ Texas .................................................... Utah ...................................................... Vermont ................................................ Virginia .................................................. Washington ........................................... West Virginia ........................................ Wisconsin ............................................. Wyoming ............................................... Water Resources Regions Region 01 New England ....................... Region 02 Mid-Atlantic .......................... Region 03 South Atlantic-Gulf .............. Region 04 Great Lakes ......................... Region 05 Ohio ..................................... Region 06 Tennessee ........................... Region 07 Upper Mississippi ................ Region 08 Lower Mississippi ................ Region 09 Souris-Red-Rainy ................ Region 10 Missouri ............................... Region 11 Arkansas-White-Red ........... Region 12 Texas-Gulf ........................... Region 13 Rio Grande .......................... Region 14 Upper Colorado ................... Region 15 Lower Colorado ................... Region 16 Great Basin ......................... Region 17 Pacific Northwest ................. Region 18 California ............................. Region 19 Alaska ................................. Region 20 Hawaii .................................
80,500 83,019
86 -
1,706 231
20,632
7,562 15
5 275
41
688 9,366
18 35 34
230 176 214
17 52
72 22 68 75
4
5,016 1,209
582 6 2
4,419
100 106 176
19
172 4,525
84 7
21
443 131
2,799 8,523
-
60 7,151
- 22
3,303
117 200 513 147 245
98 78
497 38
10,611
2,744 2,081 4,102 6,380 2,041
7,215
21,668 21,037
- 688
13,069,453 13,839,769
8,120 -
553,273 37,897
3,220,628
1,089,231 251 394
352,644 8,024
80,943
1,548,956 3,844 7,969 2,160
37,354
1,939 25,760
761 1,063
2,065 5,045 8,891 2,023 1,000
1,071,787
435,425 161,230
60 (D)
291,053
1,662 6,005
61,146 4,494
45,553
810,529 597 208 (D)
130,619
1,362 605,515 691,879
-
3,144 935,038
- 2,437
808,284
3,345 5,360
373,003 11,221
8,946
3,942 9,747
51,748 9,173
2,596,910
288,607 490,039 401,760 804,790 603,294
698,953
3,352,542 3,275,130
- 80,943
28,969,626 31,566,388
5,521 -
2,676,906 46,412
9,228,170
1,546,884 75
419 482,659
7,068
306,538 3,105,952
2,799 2,751 1,309
39,194
1,154 39,050
200 693
653
2,106 14,656
1,758 500
1,471,704
500,971 337,537
18 (D)
654,215
1,193 7,129
73,866 2,378
55,896
1,618,572 (D) 42
156
126,502 1,659
1,126,457 1,471,428
-
2,141 2,169,347
- 3,151
1,831,332
987 3,522
500,258 4,496 5,132
3,986 7,625
73,925 14,163
4,121,131
352,298 877,329 785,993
1,416,040 2,884,166
1,509,544 6,868,089 9,234,406
- 306,538
27,847 31,190
8 -
458 -
4,564
2,176 - -
10 -
- 4,281
- 6 5
107
- 4 - -
- - - - -
1,860 605 243
- -
1,761 2 -
104 -
55 2,513
- - -
245 2
749 2,364
-
- 4,771
- -
954
- -
18 3 5
- - 6 -
3,904
533 383
2,002 2,468
484
1,697 11,384
4,960 - -
4,419 3,832
5 -
54 33
1,435
288 - -
10 -
14 338
- - -
1 7 - 2 -
- 7 - 2 -
407 51 66
- -
141 - -
14 3
54
106 - - -
75 8
322 565
-
- 211
- -
200
2 -
13 8
17
2 -
10 -
653
597 43
132 385
54
276 776
1,437 -
14
28,585 29,819
30 -
725 72
10,468
2,575 5 -
44 12
361
2,688 9
10 13
61 81 65 15 27
46 15 24 70
4
2,077 458 174
1 -
1,673 48 93 42 11
8
907 5 3
18
84 65
1,068 2,165
-
50 900
- 9
1,306
70 81
197 73
122
29 17
206 32
3,401
945 1,004 1,390 2,280
887
1,659 5,359
10,472 -
361
68,503 72,411
78 -
1,460 145
15,573
6,879 13
3 257
6
666 8,473
14 23 29
198 143 183
14 52
64 19 59 65
4
4,541 178 430
1 2
3,970
83 98
155 7
149
3,780 84
7 11
414 119
2,242 8,070
-
57 6,645
- 13
3,027
99 195 438 113 200
84 63
385 29
8,662
2,612 1,580 3,568 6,098 1,728
6,620
19,418 15,945
- 666
8,489,326 10,147,139
7,444 -
307,567 4,440
1,191,942
820,281 (D)
165 190,749
3,000
10,859 1,097,313
3,590 2,936 2,155
25,055
1,428 13,715
525 1,063
1,616 4,188 7,189
(D)1,000
922,451 174,611 101,922
(D)(D)
213,297
1,433 3,345
55,026 2,088
37,451
592,417 597 208 166
123,895
1,294 460,128 623,261
-
2,478 749,919
- 1,356
722,967
2,480 4,465
202,331 6,881 5,226
3,884 7,218
15,277 7,227
2,046,213
193,654 358,842 254,713 723,823 352,696
564,730
2,497,765 1,231,042
- 10,859
18,655,238 23,223,390
5,026 -
1,519,845 5,820
4,151,371
1,188,541 53 99
248,101 1,968
16,922
2,254,808 2,745
731 1,309
27,955
529 21,967
136 693
506
1,498 13,339
(D) 500
1,254,377
247,044 214,922
(D) (D)
478,994
1,079 5,499
68,009 1,182
47,432
1,208,448 207 (D) 51
122,029
1,618 922,412
1,321,007 -
2,014 1,665,551
- 2,300
1,626,236
745 3,074
258,373 2,443 2,764
3,965 6,457
24,841 12,627
3,431,061
249,220 693,709 505,140
1,260,022 1,720,340
1,239,989 5,099,462 4,124,087
- 16,922
23,078 26,284
8 -
359 -
2,381
1,978 - - 6 -
- 3,700
- - 5
98
- 4 - -
- - - - -
1,722 178 230
- -
1,639 2 -
95 -
47 2,061
- - -
232 -
661 2,299
-
- 4,498
- -
875
- -
14 - 2
- - 4 -
3,264
492 300
1,873 2,326
385
1,645 10,023
2,750 - -
3,333 2,998
4 -
29 25
807
287 - - 6 -
14 297
- - -
- - - - -
- 7 - - -
315 -
15 - -
133 - -
12 2
50 77
- - -
75 8
317 545
-
- 158
- -
150
- - 8 7
10
2 - - -
478
589 38
126 373
29
217 633 809
- 14
25,578 26,172
29 -
611 60
9,141
2,431 3 -
35 6
352
2,500 7 7 8
44 74 56 12 27
46 12 21 65
4
1,900 -
118 1 -
1,637 36 89 34
-
8 825
5 3 8
81 55
944 2,088
-
48 863
- 4
1,280
65 79
167 50
110
21 9
190 25
2,722
910 939
1,236 2,269
769
1,515 5,009 9,141
- 352
1 May not add to total due to rounding. 2 Counts only include farms reporting some or all of their water from a given source. Farms reporting an unknown water supplier are excluded.

2007 CENSUS OF AGRICULTURE 2008 FRIS – GENERAL DATA 29 USDA, National Agricultural Statistics Service
Table 12. Irrigation by Estimated Quantity of Water Applied: 2008 and 2003 [Excludes institutional, research, and experimental farms and farms with horticulture. For meaning of abbreviations and symbols, see introductory text]
Total Less than 100 acre-feet 100 to 199 acre-feet 200 to 499 acre-feet
Geographic area Farms Acres
irrigated
Acre-feet of water applied 1
Farms Acres irrigated
Acre-feet of water applied
Farms Acres irrigated
Acre-feet of water applied
Farms Acres irrigated
Acre-feet of water applied
United States ........................2008 .. 2003 .. 2008 DATA Alabama .......................................... Alaska ............................................. Arizona ............................................ Arkansas ......................................... California ......................................... Colorado .......................................... Connecticut ..................................... Delaware ......................................... Florida ............................................. Georgia ........................................... Hawaii ............................................. Idaho ............................................... Illinois .............................................. Indiana ............................................ Iowa ................................................ Kansas ............................................ Kentucky ......................................... Louisiana ......................................... Maine .............................................. Maryland ......................................... Massachusetts ................................ Michigan .......................................... Minnesota ........................................ Mississippi ....................................... Missouri ........................................... Montana .......................................... Nebraska ......................................... Nevada ............................................ New Hampshire ............................... New Jersey ..................................... New Mexico ..................................... New York ......................................... North Carolina ................................. North Dakota ................................... Ohio ................................................ Oklahoma ........................................ Oregon ............................................ Pennsylvania ................................... Rhode Island ................................... South Carolina ................................ South Dakota .................................. Tennessee ...................................... Texas .............................................. Utah ................................................ Vermont ........................................... Virginia ............................................ Washington ..................................... West Virginia ................................... Wisconsin ........................................ Wyoming ......................................... Water Resources Regions Region 01 New England .................. Region 02 Mid-Atlantic .................... Region 03 South Atlantic-Gulf ......... Region 04 Great Lakes ................... Region 05 Ohio ............................... Region 06 Tennessee ..................... Region 07 Upper Mississippi ........... Region 08 Lower Mississippi ........... Region 09 Souris-Red-Rainy ........... Region 10 Missouri ......................... Region 11 Arkansas-White-Red ...... Region 12 Texas-Gulf ..................... Region 13 Rio Grande .................... Region 14 Upper Colorado .............. Region 15 Lower Colorado .............. Region 16 Great Basin .................... Region 17 Pacific Northwest ........... Region 18 California ........................ Region 19 Alaska ............................ Region 20 Hawaii ............................
206,834 210,106
665 23
2,997 4,119
45,136
12,778 147 309
5,250 3,584
1,077
13,834 1,091 1,089
527
4,508 822
1,692 196 597
677
2,121 1,546 1,277 1,877
8,507
14,812 1,734
86 608
8,878
596 1,975
601 379
1,454
12,156 1,090
61 712
1,165
582 12,673 10,876
66
657 12,712
90 1,261 5,164
1,188 3,200
12,428 3,152 2,056
527
3,863 7,341
400 32,727
10,336 10,224
8,031 10,771
3,551
10,157 40,017 45,765
23 1,077
54,929,915 52,492,687
75,023 1,589
861,496 4,493,435 7,329,245
2,865,840
2,337 104,620
1,222,797 1,007,763
99,577
3,319,827 457,078 404,399 162,838
2,570,003
32,380 932,712 18,151 85,552
17,421
531,927 504,330
1,451,652 1,232,354
1,947,159 8,365,545
685,261 720
59,412
835,639 20,158
148,999 248,070 18,548
461,235
1,758,602 17,359
681 104,091
360,071 72,862
5,356,876 1,068,929
488
44,818 1,675,898
906 396,123
1,497,119
39,468 309,972
2,554,462 721,586 304,963
41,141
1,339,287 7,346,743
158,617 13,825,255
5,412,670 3,499,153 1,079,145 1,359,888
936,248
1,599,757 6,855,656 7,444,738
1,589 99,577
91,235,036 86,757,665
42,512 327
4,622,309 8,631,781
22,599,659
4,541,276 1,536
74,379 1,701,120
876,884
453,547 6,228,403
231,390 198,880 78,939
3,146,607
15,698 972,164
6,946 55,259
18,894
298,440 333,669
1,402,099 996,875
2,660,677 6,699,545 1,436,932
193 45,305
1,896,349
14,800 83,847
224,462 9,398
524,638
3,276,679 13,000
674 86,236
271,274 42,271
6,819,783 2,430,148
235
24,796 3,781,371
975 322,377
3,039,481
28,287 211,328
2,789,496 414,509 146,211
25,616
830,916 10,786,749
123,225 14,386,086
7,469,640 4,182,307 2,492,101 2,460,845 4,905,155
3,560,900
13,332,398 22,635,393
327 453,547
126,801 123,868
561 22
1,807 724
30,978
7,597 146 167
4,275 2,125
1,042 9,398
623 604 355
1,092
792 581 192 454
632
1,621 847 316 828
4,723 3,826
701 86
490
7,276 562
1,817 231 360
752
9,032 1,078
60 589
585 507
6,411 7,557
66
604 8,816
88 711
2,094
1,137 2,716 9,624 2,409 1,711
473
2,176 1,571
184 11,751
4,239 5,683 5,989 8,025 2,238
6,250
28,153 31,408
22 1,042
4,154,828 4,222,603
19,448 (D)
21,381 35,158
395,457
292,744 (D)
19,553 153,893 135,363
6,199
301,087 98,862 80,688 54,893
76,884 17,387 67,811
(D)19,078
10,375 88,928 88,474 34,348 95,898
247,543 465,963 58,720
720 17,882
160,238 12,062 78,016 21,994 10,463
41,572
185,056 14,535
(D)21,436
68,066 12,464
195,518 154,321
488
18,415 134,524
(D)47,756 61,940
20,389 88,139
414,859 129,023 78,466
(D)
255,313 164,616 21,671
980,200
206,062 167,231 128,051 208,181 31,598
162,257 675,448 403,468
(D)6,199
2,946,262 3,213,354
7,794 (D)
49,343 33,105
641,461
185,913 (D)
6,844 86,096 55,671
7,943
252,692 21,916 17,494 15,032
52,794
7,227 13,128
(D)8,391
5,814
31,117 32,580
8,809 20,962
151,475 185,377 20,483
193 8,312
155,572
6,925 24,311 11,273
3,609
22,347 177,289
6,443 (D)
8,471
29,216 4,555
98,406 198,763
235
7,638 155,607
(D)17,786 87,241
8,188 37,900
186,981 43,159 22,427
(D)
71,923 52,407
8,947 496,392
116,396 78,666
124,924 205,911 72,320
155,924 602,904 647,982
(D)7,943
20,025 24,946
42 1
331 359
3,351
1,320 -
41 176 439
12
656 170 197
87
970 16
226 2
49
28 168 333 103 218
1,201 2,976
249 -
63
433 20 84
106 14
240 879
7 -
42
208 25
1,087 761
-
24 1,352
- 220 739
30 198 778 279 140
16
707 711
95 5,601
1,243
919 486 783 331
900
3,423 3,372
1 12
3,102,443 3,719,495
14,274 (D)
12,316 45,172
204,833
157,963 -
(D)35,732 86,086
(D)
86,127 66,284 69,966 33,629
170,670
(D)55,679
(D)14,050
2,532
52,399 79,038 38,294 60,265
177,136 782,896 16,632
- 15,126
31,503
(D)21,800 25,248
3,395
50,871 115,851
(D)-
10,379
65,665 (D)
179,624 71,714
-
5,527 89,138
- 48,027 78,844
(D)47,021
167,017 79,951 50,197
(D)
195,930 157,464
(D)1,230,927
225,566 141,674 46,436 83,610 12,316
75,969
338,508 215,584
(D)(D)
2,829,459 3,662,554
5,666 (D)
42,412 52,882
457,475
181,528 -
(D) 22,257 59,477
(D)
107,677 24,109 27,713 12,051
148,127
(D) 31,580
(D) 7,368
(D)
23,738 47,187 15,803 30,479
165,754 434,100 36,629
- 9,623
55,072
(D) 10,865 14,962
2,048
33,012 130,589
1,057 -
6,028
29,177 (D)
142,317 105,997
-
3,092 195,798
- 32,854
102,980
(D) 28,935
103,833 39,102
(D)
(D) 102,718 103,293 13,024
813,011
173,334 121,398 64,126
109,063 42,412
130,873 496,439 460,648
(D) (D)
24,412 24,910
42 -
187 219
4,408
1,801 -
56 341 584
10
1,377 165 194
65
770 9
327 1
71
13 185 227 246 311
1,221 3,978
287 -
41
471 12 29
147 2
209 850
- 1
34
255 25
1,801 1,249
-
21 1,146
2 195 827
15 195
1,025 258 144
26
601 982
71 7,516
1,178 1,461
706 877 280
1,447 3,153 4,467
- 10
7,583,078 (D)
19,655 -
22,013 84,657
630,077
471,816 -
26,116 78,628
241,210
1,737 367,231 104,218 116,090 38,653
267,084
5,075 157,754
(D)29,984
(D)
110,609 112,160 129,803 173,484
348,425
1,989,220 50,989
- 14,480
90,755
4,534 11,873 60,764
(D)
66,888 176,998
- (D)
15,369
102,067 14,270
822,864 183,576
-
11,684 191,007
(D)65,013
169,154
3,190 83,812
362,767 149,013 92,613
12,749
282,785 490,503 36,324
2,987,133
387,597 730,966 139,076 213,223 26,993
247,273 690,747 644,577
- 1,737
7,939,163 (D)
12,818 -
58,849 85,469
1,455,891
597,032 -
17,277 112,675 185,015
3,421 467,379 51,165 61,106 20,220
241,179 2,723
110,972 (D)
21,313
(D)57,608 71,566 82,307
101,717
408,468 1,238,167
92,290 -
12,990
160,234 3,965 9,019
47,756 (D)
67,528 294,107
-(D)
10,320
77,581 7,743
640,782 354,496
-
6,440 337,798
(D)63,208
280,842
6,032 60,634
328,731 80,580 45,412
7,779 189,191 340,287 23,698
2,405,463
385,438 514,055 239,101 296,786 81,849
427,909 1,018,101 1,484,696
-3,421
See footnote(s) at end of table. --continued

30 2008 FRIS – GENERAL DATA 2007 CENSUS OF AGRICULTURE USDA, National Agricultural Statistics Service
Table 12. Irrigation by Estimated Quantity of Water Applied: 2008 and 2003 - Con. [Excludes institutional, research, and experimental farms and farms with horticulture. For meaning of abbreviations and symbols, see introductory text]
500 to 999 acre-feet 1,000 to 1,999 acre-feet 2,000 acre-feet or more
Geographic area Farms Acres
irrigated
Acre-feet of water applied
Farms Acres irrigated
Acre-feet of water applied
Farms Acres irrigated
Acre-feet of water applied
United States .............................2008 .. 2003 .. 2008 DATA Alabama ............................................... Alaska ................................................... Arizona ................................................. Arkansas ............................................... California .............................................. Colorado ............................................... Connecticut ........................................... Delaware .............................................. Florida ................................................... Georgia ................................................. Hawaii ................................................... Idaho ..................................................... Illinois .................................................... Indiana .................................................. Iowa ...................................................... Kansas .................................................. Kentucky ............................................... Louisiana .............................................. Maine .................................................... Maryland ............................................... Massachusetts ...................................... Michigan ............................................... Minnesota ............................................. Mississippi ............................................ Missouri ................................................ Montana ................................................ Nebraska .............................................. Nevada ................................................. New Hampshire .................................... New Jersey ........................................... New Mexico .......................................... New York .............................................. North Carolina ...................................... North Dakota ........................................ Ohio ...................................................... Oklahoma ............................................. Oregon .................................................. Pennsylvania ........................................ Rhode Island ........................................ South Carolina ...................................... South Dakota ........................................ Tennessee ............................................ Texas .................................................... Utah ...................................................... Vermont ................................................ Virginia .................................................. Washington ........................................... West Virginia ........................................ Wisconsin ............................................. Wyoming ............................................... Water Resources Regions Region 01 New England ....................... Region 02 Mid-Atlantic .......................... Region 03 South Atlantic-Gulf .............. Region 04 Great Lakes ......................... Region 05 Ohio ..................................... Region 06 Tennessee ........................... Region 07 Upper Mississippi ................ Region 08 Lower Mississippi ................ Region 09 Souris-Red-Rainy ................ Region 10 Missouri ............................... Region 11 Arkansas-White-Red ........... Region 12 Texas-Gulf ........................... Region 13 Rio Grande .......................... Region 14 Upper Colorado ................... Region 15 Lower Colorado ................... Region 16 Great Basin ......................... Region 17 Pacific Northwest ................. Region 18 California ............................. Region 19 Alaska ................................. Region 20 Hawaii .................................
14,564 16,471
15 -
109 604
1,628
876 1
24 203 263
4
990 89 70 10
695
4 256
- 19
1
92 82
196 238
732
2,124 154
- 8
376
2 37 63
2
112 673
3 -
28
87 16
1,399 790
-
5 600
- 79
805
2 58
543 132
44
8 236
1,158 30
4,097
1,454 960 328 572 107
791
2,362 1,678
- 4
8,202,706 (D)
13,953 -
19,652 328,589 526,354
407,488
(D) 22,389
102,607 217,319
3,843
410,985 98,292 78,020
(D)
440,676 4,600
206,982 -
17,229
(D) 102,031 74,261
190,321 248,343
363,384
1,866,327 64,903
- 5,692
103,735
(D) 21,910 45,180
(D)
67,642 289,847
600 -
24,478
59,634 21,629
972,493 222,584
-
4,222 190,098
- 48,617
298,631
(D) 49,482
377,423 140,133 46,263
(D)
219,137 901,369 25,410
2,829,860
837,762 688,252 96,354
231,841 20,552
253,680 921,049 552,585
- 3,843
10,337,642 (D)
9,696 -
88,079 430,968
1,200,744
629,935 (D)
16,153 145,421 191,426
2,632
729,815 63,405 45,993
(D)
500,711 2,560
175,051 -
13,116
(D)62,076 56,111
144,418 172,450
514,907
1,449,953 113,205
- (D)
243,077
(D)23,493 46,048
(D)
78,908 506,721
(D)-
18,550
59,643 12,543
995,484 539,467
-
3,728 409,683
- 53,588
570,504
(D)39,279
386,883 89,635 29,112
(D)
161,716 839,776 23,182
2,810,831
1,007,724 693,836 215,833 430,930 85,867
548,278
1,724,115 1,240,983
- 2,632
11,534 11,186
5 -
163 929
2,388
729 -
19 114
99
1 673
36 20
8
610 1
197 - 4
3
34 36
193 156
444
1,527 181
- 5
154
- 5
38 1
83
358 - -
14
19 8
1,173 325
-
3 387
- 32
359
3 30
235 49 11
4
99 1,351
12 2,721
1,303
702 221 332 170
422
1,440 2,428
- 1
10,445,476 9,895,336
7,693 -
56,635 1,024,542 1,078,552
625,085
- 21,639
141,444 139,066
(D)
455,950 59,922 35,222 16,372
679,744
(D)221,660
- 5,211
2,398
69,298 69,981
311,489 237,660
394,959
2,119,966 110,022
- (D)
98,540
- 6,000
49,772 (D)
89,733
252,565 - -
20,247
24,270 14,885
1,256,040 164,177
-
4,970 254,583
- 59,477
258,401
2,398 34,192
311,602 90,458 17,024
(D)
184,127 1,660,248
25,180 3,199,741
1,397,174
737,464 165,990 230,880 60,030
229,267 992,194
1,100,899 -
(D)
16,019,187 15,550,482
6,538 -
240,538 1,334,366 3,369,156
1,031,577
- 22,882
169,411 133,972
(D)
890,888 48,567 29,126 10,648
848,432
(D) 273,305
- 5,071
3,588
43,433 48,635
266,933 205,396
577,743
2,064,612 253,809
- 6,789
215,086
- 5,760
51,405 (D)
113,845 507,405
- -
19,346
25,266 11,953
1,623,805 434,463
-
3,898 549,144
- 40,598
527,722
3,588 37,111
332,562 64,071
(D)
5,255 133,583
1,902,996 18,437
3,685,135
1,851,246 957,362 332,061 458,435 250,070
578,037
1,969,439 3,425,161
- (D)
9,498 8,725
- -
400 1,284 2,383
455
- 2
141 74
8
740 8 4 2
371
- 105
1 -
- 21 21
223 126
186 381 162
- 1
168
- 3
16 -
58 364
2 - 5
11
1 802 194
-
- 411
- 24
340
1 3
223 25
6
- 44
1,568 8
1,041
919 499 301 182 425
347
1,486 2,412
- 8
21,441,384 18,329,956
- -
729,499 2,975,317 4,493,972
910,744
- (D)
710,493 188,719
85,432
1,698,447 29,500 24,413
(D)
934,945 -
222,826 (D)
-
- 108,662 80,416
747,397 416,704
415,712
1,141,173 383,995
- (D)
350,868
- 9,400
45,112 -
144,529 738,285
(D)-
12,182
40,369 (D)
1,930,337 272,557
-
- 816,548
- 127,233 630,149
(D)7,326
920,794 133,008 20,400
-
201,995 3,972,543
(D)2,597,394
2,358,509 1,033,566
503,238 392,153 784,759
631,311
3,237,710 4,527,625
- 85,432
51,163,322 44,599,868
- -
4,143,088 6,694,991
15,474,932
1,915,291 -
(D)1,165,260
251,324
436,186 3,779,952
22,228 17,448
(D)
1,355,363 -
368,128 (D)
-
- 80,467 77,590
883,829 465,871
842,330
1,327,336 920,516
- (D)
1,067,309
- 10,400 53,018
-
208,996 1,660,569
(D)-
23,521
50,391 (D)
3,318,989 796,961
-
- 2,133,342
- 114,342
1,470,192
(D)7,469
1,450,505 97,962
(D)
- 171,783
7,547,990 35,937
4,175,253
3,935,502 1,816,991 1,516,055
959,721 4,372,638
1,719,878 7,521,400
15,375,924 -
436,186
1 May not add to total due to rounding.
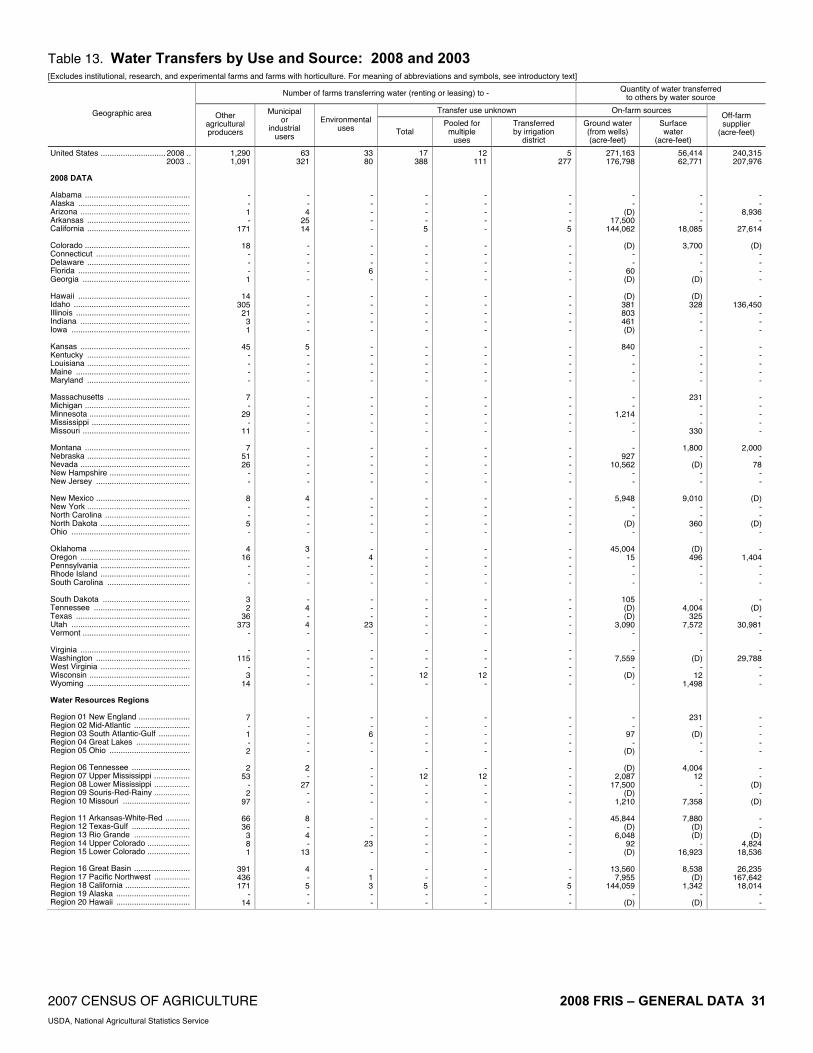
2007 CENSUS OF AGRICULTURE 2008 FRIS – GENERAL DATA 31 USDA, National Agricultural Statistics Service
Table 13. Water Transfers by Use and Source: 2008 and 2003 [Excludes institutional, research, and experimental farms and farms with horticulture. For meaning of abbreviations and symbols, see introductory text]
Number of farms transferring water (renting or leasing) to - Quantity of water transferred to others by water source
Transfer use unknown On-farm sources Geographic area Other agricultural producers
Municipal or
industrial users
Environmental uses Total
Pooled for multiple
uses
Transferred by irrigation
district
Ground water (from wells) (acre-feet)
Surface water
(acre-feet)
Off-farm supplier
(acre-feet)
United States ............................. 2008 .. 2003 .. 2008 DATA Alabama ............................................... Alaska .................................................. Arizona ................................................. Arkansas .............................................. California .............................................. Colorado ............................................... Connecticut .......................................... Delaware .............................................. Florida .................................................. Georgia ................................................ Hawaii .................................................. Idaho .................................................... Illinois ................................................... Indiana ................................................. Iowa ..................................................... Kansas ................................................. Kentucky .............................................. Louisiana .............................................. Maine ................................................... Maryland .............................................. Massachusetts ..................................... Michigan ............................................... Minnesota ............................................. Mississippi ............................................ Missouri ................................................ Montana ............................................... Nebraska .............................................. Nevada ................................................. New Hampshire .................................... New Jersey .......................................... New Mexico .......................................... New York .............................................. North Carolina ...................................... North Dakota ........................................ Ohio ..................................................... Oklahoma ............................................. Oregon ................................................. Pennsylvania ........................................ Rhode Island ........................................ South Carolina ..................................... South Dakota ....................................... Tennessee ........................................... Texas ................................................... Utah ..................................................... Vermont ................................................ Virginia ................................................. Washington .......................................... West Virginia ........................................ Wisconsin ............................................. Wyoming .............................................. Water Resources Regions Region 01 New England ....................... Region 02 Mid-Atlantic ......................... Region 03 South Atlantic-Gulf .............. Region 04 Great Lakes ........................ Region 05 Ohio .................................... Region 06 Tennessee .......................... Region 07 Upper Mississippi ................ Region 08 Lower Mississippi ................ Region 09 Souris-Red-Rainy ................ Region 10 Missouri .............................. Region 11 Arkansas-White-Red ........... Region 12 Texas-Gulf .......................... Region 13 Rio Grande ......................... Region 14 Upper Colorado ................... Region 15 Lower Colorado ................... Region 16 Great Basin ......................... Region 17 Pacific Northwest ................ Region 18 California ............................. Region 19 Alaska ................................. Region 20 Hawaii .................................
1,290 1,091
- - 1 -
171
18 - - - 1
14
305 21
3 1
45
- - - -
7 -
29 -
11
7 51 26
- -
8 - - 5 -
4 16
- - -
3 2
36 373
-
- 115
- 3
14
7 - 1 - 2
2
53 - 2
97
66 36
3 8 1
391 436 171
- 14
63 321
- - 4
25 14
- - - - -
- - - - -
5 - - - -
- - - - -
- - - - -
4 - - - -
3 - - - -
- 4 - 4 -
- - - - -
- - - - -
2 -
27 - -
8 - 4 -
13
4 - 5 - -
33 80
- - - - -
- - - 6 -
- - - - -
- - - - -
- - - - -
- - - - -
- - - - -
- 4 - - -
- - -
23 -
- - - - -
- - 6 - -
- - - - -
- - -
23 -
- 1 3 - -
17 388
- - - - 5
- - - - -
- - - - -
- - - - -
- - - - -
- - - - -
- - - - -
- - - - -
- - - - -
- - -
12 -
- - - - -
- 12
- - -
- - - - -
- - 5 - -
12 111
- - - - -
- - - - -
- - - - -
- - - - -
- - - - -
- - - - -
- - - - -
- - - - -
- - - - -
- - -
12 -
- - - - -
- 12
- - -
- - - - -
- - - - -
5 277
- - - - 5
- - - - -
- - - - -
- - - - -
- - - - -
- - - - -
- - - - -
- - - - -
- - - - -
- - - - -
- - - - -
- - - - -
- - - - -
- - 5 - -
271,163 176,798
- -
(D) 17,500
144,062
(D) - -
60 (D)
(D)
381 803 461 (D)
840
- - - -
- -
1,214 - -
- 927
10,562 - -
5,948 - -
(D) -
45,004 15
- - -
105 (D) (D)
3,090 -
- 7,559
- (D)
-
- -
97 -
(D)
(D) 2,087
17,500 (D)
1,210
45,844 (D)
6,048 92 (D)
13,560
7,955 144,059
- (D)
56,414 62,771
- - - -
18,085
3,700 - - -
(D)
(D)328
- - -
- - - - -
231 - - -
330
1,800 -
(D)- -
9,010 - -
360 -
(D)496
- - -
- 4,004
325 7,572
-
- (D)
- 12
1,498
231 -
(D)- -
4,004 12
- -
7,358
7,880 (D)(D)
- 16,923
8,538
(D)1,342
- (D)
240,315 207,976
- -
8,936 -
27,614
(D)- - - -
- 136,450
- - -
- - - - -
- - - - -
2,000 -
78 - -
(D)- -
(D)-
- 1,404
- - -
- (D)
- 30,981
-
- 29,788
- - -
- - - - -
- -
(D)-
(D)
- -
(D)4,824
18,536
26,235 167,642 18,014
- -

32 2008 FRIS – GENERAL DATA 2007 CENSUS OF AGRICULTURE USDA, National Agricultural Statistics Service
Table 14. Irrigation Wells on Farms: 2008 and 2003 [Excludes institutional, research, and experimental farms and farms with horticulture. For meaning of abbreviations and symbols, see introductory text]
Wells capable of being used Wells used
With meters With backflow prevention devices
Geographic area Farms Number Farms Number
Farms Number Acres irrigated Farms Number Acres
irrigated
United States .............................2008 .. 2003 .. 2008 DATA Alabama ............................................... Alaska ................................................... Arizona ................................................. Arkansas ............................................... California .............................................. Colorado ............................................... Connecticut ........................................... Delaware .............................................. Florida ................................................... Georgia ................................................. Hawaii ................................................... Idaho ..................................................... Illinois .................................................... Indiana .................................................. Iowa ...................................................... Kansas .................................................. Kentucky ............................................... Louisiana .............................................. Maine .................................................... Maryland ............................................... Massachusetts ...................................... Michigan ............................................... Minnesota ............................................. Mississippi ............................................ Missouri ................................................ Montana ................................................ Nebraska .............................................. Nevada ................................................. New Hampshire .................................... New Jersey ........................................... New Mexico .......................................... New York .............................................. North Carolina ...................................... North Dakota ........................................ Ohio ...................................................... Oklahoma ............................................. Oregon .................................................. Pennsylvania ........................................ Rhode Island ........................................ South Carolina ...................................... South Dakota ........................................ Tennessee ............................................ Texas .................................................... Utah ...................................................... Vermont ................................................ Virginia .................................................. Washington ........................................... West Virginia ........................................ Wisconsin ............................................. Wyoming ............................................... Water Resources Regions Region 01 New England ....................... Region 02 Mid-Atlantic .......................... Region 03 South Atlantic-Gulf .............. Region 04 Great Lakes ......................... Region 05 Ohio ..................................... Region 06 Tennessee ........................... Region 07 Upper Mississippi ................ Region 08 Lower Mississippi ................ Region 09 Souris-Red-Rainy ................ Region 10 Missouri ............................... Region 11 Arkansas-White-Red ........... Region 12 Texas-Gulf ........................... Region 13 Rio Grande .......................... Region 14 Upper Colorado ................... Region 15 Lower Colorado ................... Region 16 Great Basin ......................... Region 17 Pacific Northwest ................. Region 18 California ............................. Region 19 Alaska ................................. Region 20 Hawaii .................................
97,942 100,717
290 19
844 3,646
23,998
2,778 60
276 4,436 2,509
90
2,262 1,038
912 451
4,092
214 1,327
93 294
141
1,423 1,379 1,084 1,415
187
14,609 732
40 439
3,455
293 381 358 171
1,160 4,258
562 32
472
646 243
8,982 861
29
240 3,218
42 853 608
374 1,914 8,169 2,033
971
169 3,246 6,664
323 19,617
6,885 7,277 3,582
419 1,016
1,839 9,268
24,067 19 90
426,756 396,167
486 25
3,429 40,340 65,079
12,310
100 1,155
13,302 8,452
125
7,091 3,951 2,817 1,352
19,794
321 6,682
121 863
224
4,439 4,414
11,898 13,264
477
80,099 2,012
48 1,089
8,786
442 948
1,659 240
3,966 7,557
880 36
1,230
1,803 581
79,671 1,876
40
335 6,142
57 3,253 1,495
537 4,539
24,604 5,859 2,528
267
11,488 65,460
1,411 98,756
44,776 62,311 10,299
619 3,829
4,115
19,957 65,251
25 125
97,690 100,717
290 19
844 3,646
23,998
2,526 60
276 4,436 2,509
90
2,262 1,038
912 451
4,092
214 1,327
93 294
141
1,423 1,379 1,084 1,415
187
14,609 732
40 439
3,455
293 381 358 171
1,160 4,258
562 32
472
646 243
8,982 861
29
240 3,218
42 853 608
374 1,914 8,169 2,033
971
169 3,246 6,664
323 19,538
6,885 7,277 3,409
419 1,016
1,839 9,268
24,067 19 90
407,913 374,806
457 25
3,193 38,729 61,192
10,916
65 1,100
12,698 8,052
124
6,982 3,857 2,746 1,240
19,301
313 6,414
117 827
203
4,097 4,312
11,394 12,869
417
77,347 1,843
46 974
8,315
392 920
1,621 215
3,727 7,184
786 36
1,135
1,755 557
77,389 1,786
36
276 5,244
52 3,192 1,445
475 4,150
23,325 5,503 2,415
244
11,154 63,310
1,388 94,671
43,388 60,627
9,117 615
3,530
3,913 18,612 61,327
25 124
28,835 18,926
21 1
260 355
5,918
1,225 -
31 1,108 1,407
46
408 123 133
53
3,457 21
105 6
36
45 218 376
82 100
48
6,498 354
11 58
1,371
29 28
220 26
156 950
43 5
98
78 48
2,388 112
4
60 479
3 190
43
67 259
2,721 306 138
15
634 530 147
8,604
3,612 1,598 1,594
5 369
492
1,743 5,954
1 46
107,384 61,116
33 (D)
933 1,147
15,415
5,978 -
99 4,384 4,396
54
1,069 308 202 103
16,436
31 260
20 59
65
562 1,149
148 268
92
25,129 783
15 104
3,066
41 98
996 32
495
1,891 69
5 229
121
97 18,599
229 4
67
1,173 (D)
751 171
105 440
9,189 704 221
25
1,991 1,674
746 33,108
16,536 15,333
5,647 (D)
1,136
960 4,026
15,475 (D) 54
10,776,675 6,710,714
2,770 (D)
109,488 165,946
1,669,726
587,052 -
6,846 360,984 466,009
5,692
224,603 32,246 33,113 10,134
2,061,627
3,004 26,356
(D) 2,936
237
30,615 120,162 14,590 21,527
20,026
2,555,881 110,373
26 6,615
196,704
1,106 3,260
107,377 2,080
63,876
178,885 799
15 5,102
16,473 10,012
1,193,479 31,149
12
(D) 219,549
82 65,745 23,682
(D) 18,867
837,712 44,232 24,010
2,372
200,254 218,273 68,219
3,441,350
2,222,927 725,965 406,145
563 122,228
138,092 608,845
1,682,508 (D)
5,692
59,657 60,481
174 4
288 1,621
13,112
1,581 26
229 2,961 1,823
69
1,806 725 617 300
3,206
148 656
93 216
102
1,044 938 697 644
146
11,134 481
24 241
1,542
190 152 281 121
757
1,993 354
32 314
344 137
5,293 332
17
80 1,698
22 596 296
285 1,195 5,466 1,402
692
103 2,260 3,321
234 14,340
4,877 4,052 1,529
124 340
1,151 5,060
13,153 4
69
252,242 214,110
286 7
1,259 12,489 32,555
7,878
31 926
8,679 6,349
103
4,990 2,883 1,837
792
16,029 224
2,956 117 626
159
3,184 3,381 4,802 3,552
347
51,694 1,209
28 590
4,740
259 376
1,380 146
2,550 3,849
473 34
701
885 294
58,976 807
21
96 3,360
27 2,669
637
377 2,856
16,415 4,200 1,590
154
8,686 22,298
1,111 63,847
30,382 46,526
5,428 136
1,433
2,524 11,528 32,641
7 103
21,556,605 18,810,378
15,403 512
150,560 1,234,953 2,624,036
817,842
196 68,694
440,746 523,687
51,687
729,598 295,780 198,495 92,832
1,901,713
14,709 350,705
2,802 42,708
448
306,826 343,456 530,606 338,380
45,759
4,932,181 156,346
92 21,760
318,387
4,732 14,664
134,663 3,936
213,571 238,620
2,829 90
42,279
100,113 27,466
3,490,668 95,751
60
1,666 300,186
140 263,586 69,686
3,640 141,899
1,034,717 399,930 151,078
8,663
872,004 2,304,761
98,852 6,318,352
3,227,131 2,257,095
364,371 10,535
164,524
314,081 1,193,777 2,638,996
512 51,687
--continued

2007 CENSUS OF AGRICULTURE 2008 FRIS – GENERAL DATA 33 USDA, National Agricultural Statistics Service
Table 14. Irrigation Wells on Farms: 2008 and 2003 - Con. [Excludes institutional, research, and experimental farms and farms with horticulture. For meaning of abbreviations and symbols, see introductory text]
Farms by number of wells used
Geographic area
1 well 2 wells 3 wells 4 wells 5 wells 6 wells 7 to 9 wells
10 to 14 wells
15 to 19 wells
20 wells or more
United States ............................. 2008 .. 2003 .. 2008 DATA Alabama ............................................... Alaska .................................................. Arizona ................................................. Arkansas .............................................. California .............................................. Colorado ............................................... Connecticut .......................................... Delaware .............................................. Florida .................................................. Georgia ................................................ Hawaii .................................................. Idaho .................................................... Illinois ................................................... Indiana ................................................. Iowa ..................................................... Kansas ................................................. Kentucky .............................................. Louisiana .............................................. Maine ................................................... Maryland .............................................. Massachusetts ..................................... Michigan ............................................... Minnesota ............................................. Mississippi ............................................ Missouri ................................................ Montana ............................................... Nebraska .............................................. Nevada ................................................. New Hampshire .................................... New Jersey .......................................... New Mexico .......................................... New York .............................................. North Carolina ...................................... North Dakota ........................................ Ohio ..................................................... Oklahoma ............................................. Oregon ................................................. Pennsylvania ........................................ Rhode Island ........................................ South Carolina ..................................... South Dakota ....................................... Tennessee ........................................... Texas ................................................... Utah ..................................................... Vermont ................................................ Virginia ................................................. Washington .......................................... West Virginia ........................................ Wisconsin ............................................. Wyoming .............................................. Water Resources Regions Region 01 New England ....................... Region 02 Mid-Atlantic ......................... Region 03 South Atlantic-Gulf .............. Region 04 Great Lakes ........................ Region 05 Ohio .................................... Region 06 Tennessee .......................... Region 07 Upper Mississippi ................ Region 08 Lower Mississippi ................ Region 09 Souris-Red-Rainy ................ Region 10 Missouri .............................. Region 11 Arkansas-White-Red ........... Region 12 Texas-Gulf .......................... Region 13 Rio Grande ......................... Region 14 Upper Colorado ................... Region 15 Lower Colorado ................... Region 16 Great Basin ......................... Region 17 Pacific Northwest ................ Region 18 California ............................. Region 19 Alaska ................................. Region 20 Hawaii .................................
45,933 48,187
222 15
293 571
14,574
999 57 77
2,284 1,081
80
994 385 402 202
1,157
169 381
89 141
120 700 728 149 294
119
3,507 442
34 259
2,540
250 193 130 139
552
3,254 432
29 293
279 140
3,119 490
22
234 2,463
34 480 335
337 1,218 4,157 1,113
562
122 1,526 1,131
131 5,431
1,695 3,016 2,496
311 409
1,193 6,379
14,611 15 80
14,802 16,900
24 3
299 195
2,928
493 2
49 928 513
8
593 196 161
97
685 30
270 1
49
4 337 248
91 162
13
2,619 108
6 61
279
13 105
67 23
245 550
77 2
46
177 52
1,235 144
7
2 383
6 123
93
15 236
1,617 423 154
34
597 654
55 3,699
1,165
815 298
20 345
235
1,490 2,939
3 8
8,454 8,249
18 -
44 308
1,795
158 -
50 299 290
-
262 116 115
45
485 6
147 -
34
14 118 123
76 146
13
1,931 58
- 39
229
20 34 47
6
104 161
40 1
35
59 19
532 159
-
- 198
2 90 28
15 183 675 158
66
6 349 586
38 2,284
767 449 197
88 46
200 550
1,797 - -
6,523 5,334
13 1
42 320
2,095
155 1
27 429 185
-
52 69 73 36
390
2 104
- 22
-
73 57 96 74
20
1,251 38
- 35
74
2 11 17
3
40 81
7 -
59
37 7
318 17
-
- 56
- 34
100
1 93
697 93 59
4
160 547
17 1,651
518 217
76 -
42
63 177
2,107 1 -
3,189 3,442
5 -
30 210 451
148
- 19
118 63
-
94 71 48 13
226
- 71
- 12
-
51 57 61 81
5
750 13
- 18
42
4 9
21 -
37 43
3 -
10
28 6
302 18
-
1 26
- 17
7
- 57
205 74 39
-
140 382
10 1,010
378 187
32 -
30
32 162 451
- -
3,025 2,979
5 -
30 145 650
149
- 15 89 70
-
60 42 33 23
124
4 67
2 8
2
36 35 58 61
8
657 18
- 10
40
2 9 9 -
64 35
- - 4
7 3
368 3 -
2 35
- 22 21
4 37
175 38 21
2
108 313
11 874
327 247
37 -
30
23 127 651
- -
5,464 6,545
2 -
47 412 794
190
- 20
118 120
-
85 66 36 19
525
1 110
- 14
-
33 52
143 125
4
1,595 27
- 5
63
2 2
37 -
36 60
- - 7
30
9 593
11 -
- 26
- 32 13
- 41
248 39 36
1
142 728
35 1,996
711 391
44 -
49
46 156 801
- -
4,904 4,586
1 -
20 604 368
90
- 11 84
118
2 64 68 26
9
317 2
85 1
11
- 39 41
144 183
5
1,464 18
- 10
115
- 16 16
-
41 40
3 - 8
23
5 802
11 -
- 10
- 22
7
1 35
227 51 25
-
125 939
16 1,637
650 554 108
- 23
29
114 368
- 2
1,920 2,015
- -
14 330 133
57
- 4
32 56
-
32 10 11
5
86 -
38 - 3
-
17 15 94
109
- 372
4 - 2
27
- - 2 -
25 24
- - 5
5 1
388 6 -
- 7 - 6 -
- 9
93 22
4
- 34
515 4
411
311 248
47 -
16
10 63
133 - -
3,476 2,480
- -
25 551 210
87
- 4
55 13
-
26 15
7 2
97
- 54
- -
1 19 23
172 180
-
463 6 - -
46 - 2
12 -
16 10
- - 5
1 1
1,325 2 -
1 14
- 27
4
1 5
75 22
5
- 65
869 6
545
363 1,153
74 -
26
8 50
209 - -

34 2008 FRIS – GENERAL DATA 2007 CENSUS OF AGRICULTURE USDA, National Agricultural Statistics Service
Table 15. Irrigation Wells Used on Farms: 2008 and 2003 [Excludes institutional, research, and experimental farms and farms with horticulture. For meaning of abbreviations and symbols, see introductory text]
Change in average depth to water 1 All wells used Flowing or
artesian wells used Increased Decreased Geographic area
Farms Number Farms Number Farms Number of wells Farms Number
of wells
United States .............................2008 .. 2003 .. 2008 DATA Alabama ............................................... Alaska ................................................... Arizona ................................................. Arkansas ............................................... California .............................................. Colorado ............................................... Connecticut ........................................... Delaware .............................................. Florida ................................................... Georgia ................................................. Hawaii ................................................... Idaho ..................................................... Illinois .................................................... Indiana .................................................. Iowa ...................................................... Kansas .................................................. Kentucky ............................................... Louisiana .............................................. Maine .................................................... Maryland ............................................... Massachusetts ...................................... Michigan ............................................... Minnesota ............................................. Mississippi ............................................ Missouri ................................................ Montana ................................................ Nebraska .............................................. Nevada ................................................. New Hampshire .................................... New Jersey ........................................... New Mexico .......................................... New York .............................................. North Carolina ...................................... North Dakota ........................................ Ohio ...................................................... Oklahoma ............................................. Oregon .................................................. Pennsylvania ........................................ Rhode Island ........................................ South Carolina ...................................... South Dakota ........................................ Tennessee ............................................ Texas .................................................... Utah ...................................................... Vermont ................................................ Virginia .................................................. Washington ........................................... West Virginia ........................................ Wisconsin ............................................. Wyoming ............................................... Water Resources Regions Region 01 New England ....................... Region 02 Mid-Atlantic .......................... Region 03 South Atlantic-Gulf .............. Region 04 Great Lakes ......................... Region 05 Ohio ..................................... Region 06 Tennessee ........................... Region 07 Upper Mississippi ................ Region 08 Lower Mississippi ................ Region 09 Souris-Red-Rainy ................ Region 10 Missouri ............................... Region 11 Arkansas-White-Red ........... Region 12 Texas-Gulf ........................... Region 13 Rio Grande .......................... Region 14 Upper Colorado ................... Region 15 Lower Colorado ................... Region 16 Great Basin ......................... Region 17 Pacific Northwest ................. Region 18 California ............................. Region 19 Alaska ................................. Region 20 Hawaii .................................
97,690 100,717
290 19
844 3,646
23,998
2,526 60
276 4,436 2,509
90
2,262 1,038
912 451
4,092
214 1,327
93 294
141
1,423 1,379 1,084 1,415
187
14,609 732
40 439
3,455
293 381 358 171
1,160 4,258
562 32
472
646 243
8,982 861
29
240 3,218
42 853 608
374 1,914 8,169 2,033
971
169 3,246 6,664
323 19,538
6,885 7,277 3,409
419 1,016
1,839 9,268
24,067 19 90
407,913 374,806
457 25
3,193 38,729 61,192
10,916
65 1,100
12,698 8,052
124
6,982 3,857 2,746 1,240
19,301
313 6,414
117 827
203
4,097 4,312
11,394 12,869
417
77,347 1,843
46 974
8,315
392 920
1,621 215
3,727 7,184
786 36
1,135
1,755 557
77,389 1,786
36
276 5,244
52 3,192 1,445
475 4,150
23,325 5,503 2,415
244
11,154 63,310
1,388 94,671
43,388 60,627
9,117 615
3,530
3,913 18,612 61,327
25 124
692 1,868
- 3 3
50 11
28
- 5
231 15
4
19 1 - -
- - - - -
- 24
5 4 -
8 25
2 3
29
15 - - - -
2 27
- - 3
57
2 - 2 -
- 111
- 3 -
3 34
249 25
1
- 7
56 -
90
4 -
41 - 3
12
149 11
3 4
1,347 3,796
- 3 3
178 30
123
- 7
368 30
4
68 (D)
- -
- - - - -
- 30 11
4 -
16 25 (D)
3 50
83
- - - -
(D)98
- - 3
60 (D)
- (D)
-
- 119
- 8 -
3 57
401 31 (D)
-
18 184
- 101
10
- 202
- 3
(D)
229 30
3 4
13,477 12,936
4 4
96 606
5,616
562 - 2
226 68
11
630 22
2 11
632
- 42
- 2
-
44 35
105 58
-
1,391 135
- 8
244
- 85 15
-
108 270
1 -
21
26 21
1,586 138
-
- 602
2 33 13
- 15
404 46 14
11 91
705 9
1,939
999 1,377
271 94 96
296
1,460 5,635
4 11
71,341 64,481
4 5
407 6,509
18,562
2,558 -
(D) 746 353
11
1,841 129 (D) 77
4,831
- 148
- (D)
-
195 138
1,351 751
-
9,214 466
- 31
1,183
- 170
88 -
532 515 (D)
- 57
54 55
18,679 376
-
- 949 (D)
202 128
- 49
1,330 201
40
21 500
7,481 72
11,938
8,195 16,594
1,694 94
407
904 3,215
18,590 5
11
12,168 12,141
15 3
195 632
2,889
738 - 4
365 80
-
169 45
7 18
1,060
- 69
- 1
- 8
15 91 33
4
1,761 116
- 23
627
- -
24 -
123 37 46
- 22
21 17
2,361 248
1
9 103
5 43
140
- 61
476 26 54
16 82
777 11
2,706
1,723 1,812
663 84
196
343 246
2,889 3 -
77,810 72,055
29 3
574 8,412 9,865
3,096 -
12 1,068
426
-593 148
30 53
5,747 -
344 -
(D)
-29
155 939 305
24 10,135
370 -
89
2,564 --
85 -
579 230
46 -
56
80 26
30,390 463 (D)
9277
5277 268
-142
1,562 63 54
37 584
9,299 38
14,021
14,078 23,395
2,148 84
588
810 1,039 9,865
3-
See footnote(s) at end of table. --continued

2007 CENSUS OF AGRICULTURE 2008 FRIS – GENERAL DATA 35 USDA, National Agricultural Statistics Service
Table 15. Irrigation Wells Used on Farms: 2008 and 2003 - Con. [Excludes institutional, research, and experimental farms and farms with horticulture. For meaning of abbreviations and symbols, see introductory text]
All pumped wells 2
Geographic area Farms Number
Average well
depth (feet)
Average depth to water 3 (feet)
Average depth to bowls 4 (feet)
Average pumping capacity (gpm)
Average operating pressure
(psi)
Average engine
size (hp)
Average hours of
operation (hours)
United States ............................. 2008 .. 2003 .. 2008 DATA Alabama ............................................... Alaska .................................................. Arizona ................................................. Arkansas .............................................. California .............................................. Colorado ............................................... Connecticut .......................................... Delaware .............................................. Florida .................................................. Georgia ................................................ Hawaii .................................................. Idaho .................................................... Illinois ................................................... Indiana ................................................. Iowa ..................................................... Kansas ................................................. Kentucky .............................................. Louisiana .............................................. Maine ................................................... Maryland .............................................. Massachusetts ..................................... Michigan ............................................... Minnesota ............................................. Mississippi ............................................ Missouri ................................................ Montana ............................................... Nebraska .............................................. Nevada ................................................. New Hampshire .................................... New Jersey .......................................... New Mexico .......................................... New York .............................................. North Carolina ...................................... North Dakota ........................................ Ohio ..................................................... Oklahoma ............................................. Oregon ................................................. Pennsylvania ........................................ Rhode Island ........................................ South Carolina ..................................... South Dakota ....................................... Tennessee ........................................... Texas ................................................... Utah ..................................................... Vermont ................................................ Virginia ................................................. Washington .......................................... West Virginia ........................................ Wisconsin ............................................. Wyoming .............................................. Water Resources Regions Region 01 New England ....................... Region 02 Mid-Atlantic ......................... Region 03 South Atlantic-Gulf .............. Region 04 Great Lakes ........................ Region 05 Ohio .................................... Region 06 Tennessee .......................... Region 07 Upper Mississippi ................ Region 08 Lower Mississippi ................ Region 09 Souris-Red-Rainy ................ Region 10 Missouri .............................. Region 11 Arkansas-White-Red ........... Region 12 Texas-Gulf .......................... Region 13 Rio Grande ......................... Region 14 Upper Colorado ................... Region 15 Lower Colorado ................... Region 16 Great Basin ......................... Region 17 Pacific Northwest ................ Region 18 California ............................. Region 19 Alaska ................................. Region 20 Hawaii .................................
97,296 100,717
290 16
844 3,646
23,998
2,523 60
272 4,216 2,509
86
2,254 1,038
912 451
4,092
214 1,327
93 294
141
1,423 1,379 1,084 1,415
183
14,609 732
37 410
3,455
293 381 358 171
1,160 4,258
562 32
470
643 243
8,982 861
29
240 3,107
42 853 608
371 1,881 7,947 2,033
971
169 3,246 6,664
323 19,531
6,885 7,277 3,406
419 1,016
1,831 9,157
24,067 16 86
406,566 371,010
457 22
3,190 38,551 61,162
10,793
65 1,093
12,330 8,022
120
6,914 (D)
2,746 1,240
19,301
313 6,414
117 827
203
4,067 4,301
11,390 12,869
401
77,322 (D) 43
924
8,232 392 920
1,621 215
(D)
7,086 786
36 1,132
1,695
(D) 77,389
(D) 36
276
5,125 52
3,184 1,445
472 4,093
22,924 5,472
(D)
244 11,136 63,126
1,388 94,570
43,378 60,627
8,915 615
3,527
(D) 18,383 61,297
22 120
243 238
180 94
521 125 380
200 237 106 493 338
192 296 117
85 99
226 148 133 292 124
320 117 122 107 116
214 187 367 272 120
261
86 203
85 135
237 236 214 266 293
107 199 284 355 248
306 277 196 147 144
292 146 410 120
89
220 124 121
85 184
289 250 248 249 494
355 267 380
94 192
100 97
82 49
197 47
123
105 77 19 55
124
128 175
28 26 20
121
82 42 60 34
169
32 34 43 19
71 72 89
136 20
115
42 52 32 46
119
48 82
188 52
38 75
179 99 78
157 107 138
40 63
125 44 79 35 30
104
32 42 27 75
174 151
97 108 186
104 108 123
49 128
166 158
118 70
316 95
236
150 152
69 122 192
159 229
66 56 55
190 109
83 104
80
270 87 85 68 57
163 130 189 214
58
187 75
137 63
109
202 110 175 246 138
74
124 245 186 149
209 165 176
90 102
205 98
148 86 61
160
77 83 62
130
255 208 161 160 299
197 165 236
70 159
779 826
242 585
1,090 1,293
744
835 80
656 1,234
721
2,008 1,170
824 738 780
652 429
1,684 261 578
880 543 641
1,855 1,304
911 781
1,185 226 420
692 114 121 641 169
505 543 123
17 403
688 769 252 997 265
110 510
17 802 635
477 429 946 580 689
210 747
1,430 640 766
646 202 893 936
1,079
1,008 759 745 585
2,008
35 37
58 48 24 33 33
39 91 43 41 51
53 58 40 51 39
28 49 15 55 40
90 67 45 32 18
57 39 41 58 67
28 48 35 44 55
33 57 33 56 47
44 45 27 43 63
77 64 51 61 42
76 49 45 65 45
60 46 29 44 39
26 28 32 41 25
45 59 33 48 53
74 78
30 37
110 70 67
67 32 69
118 101
187 153
69 70 61
137
39 85 46 61
173
59 52 66 65
92 76
113 29 54
58 34 25 47 30
128
63 16 44 35
55 58 53 70 43
15 83
2 80 44
97 50
102 61 64
23 65 70 43 78
120
32 62 42
107
93 102
67 37
187
1,065 1,049
524 235
2,003 639
1,220
1,519 2,383
391 409 636
1,704 1,968
316 364 283
1,321
274 543 143 871
98
442 588 533 364
1,144
621 2,574
83 578
1,695
223 570 552 272
1,286
785 387 685 759
524 491
1,808 1,852
718
582 1,746
723 606
1,811
467 549 512 472 302
518 475 550 515 729
1,579 1,763 1,416 1,201 2,009
2,177 1,448 1,222
235 1,704
1 Increases and decreases in depth are reported over a five year period. 2 Data do not include flowing or artesian wells. 3 Depth at the start of the irrigation season. 4 Depth to bowls or impellers.

36 2008 FRIS – GENERAL DATA 2007 CENSUS OF AGRICULTURE USDA, National Agricultural Statistics Service
Table 16. Characteristics for Irrigation Wells Used on Farms: 2008 and 2003 [Excludes institutional, research, and experimental farms and farms with horticulture. For meaning of abbreviations and symbols, see introductory text]
Average well depth 1 Number of wells with an average well depth of -
Geographic area For all pumped
wells (feet)
For farms with
one well (feet)
For farms with
two wells (feet)
For farms with
three wells (feet)
Under 50 feet
50 to 99 feet
100 to 199 feet
200 to 299 feet
300 to 499 feet
500 feet or more
United States .............................2008 .. 2003 .. 2008 DATA Alabama ............................................... Alaska ................................................... Arizona ................................................. Arkansas ............................................... California .............................................. Colorado ............................................... Connecticut ........................................... Delaware .............................................. Florida ................................................... Georgia ................................................. Hawaii ................................................... Idaho ..................................................... Illinois .................................................... Indiana .................................................. Iowa ...................................................... Kansas .................................................. Kentucky ............................................... Louisiana .............................................. Maine .................................................... Maryland ............................................... Massachusetts ...................................... Michigan ............................................... Minnesota ............................................. Mississippi ............................................ Missouri ................................................ Montana ................................................ Nebraska .............................................. Nevada ................................................. New Hampshire .................................... New Jersey ........................................... New Mexico .......................................... New York .............................................. North Carolina ...................................... North Dakota ........................................ Ohio ...................................................... Oklahoma ............................................. Oregon .................................................. Pennsylvania ........................................ Rhode Island ........................................ South Carolina ...................................... South Dakota ........................................ Tennessee ............................................ Texas .................................................... Utah ...................................................... Vermont ................................................ Virginia .................................................. Washington ........................................... West Virginia ........................................ Wisconsin ............................................. Wyoming ............................................... Water Resources Regions Region 01 New England ....................... Region 02 Mid-Atlantic .......................... Region 03 South Atlantic-Gulf .............. Region 04 Great Lakes ......................... Region 05 Ohio ..................................... Region 06 Tennessee ........................... Region 07 Upper Mississippi ................ Region 08 Lower Mississippi ................ Region 09 Souris-Red-Rainy ................ Region 10 Missouri ............................... Region 11 Arkansas-White-Red ........... Region 12 Texas-Gulf ........................... Region 13 Rio Grande .......................... Region 14 Upper Colorado ................... Region 15 Lower Colorado ................... Region 16 Great Basin ......................... Region 17 Pacific Northwest ................. Region 18 California ............................. Region 19 Alaska ................................. Region 20 Hawaii .................................
243 238
180 94
521 125 380
200 237 106 493 338
192 296 117
85 99
226 148 133 292 124
320 117 122 107 116
214 187 367 272 120
261
86 203
85 135
237 236 214 266 293
107 199 284 355 248
306 277 196 147 144
292 146 410 120
89
220 124 121
85 184
289 250 248 249 494
355 267 380
94 192
258 266
179 109 431 148 312
178 257 100 296 423
183 303 121 103 136
189 155 153 342 138
503 131 149 103 289
180 212 331 263 130
215
73 239 122 136
205 209 219 (D)
304
152 200 360 310 (D)
335 154 191 199 202
372 194 319 136 120
195 158 151 110 195
228 358 224 152 346
316 198 313 109 183
295 248
176 (D)
637 165 430
308 (D) 95
558 390
204 301 188
83 92
163 140 157 (D)
163
35 114 122 114 108
174 182 292 295 104
158
89 109 118 108
213 211 238 (D)
298
115 277 397 314 (D)
(D)
269 (D)
177 185
158 160 462 113
87
332 148 149 (D)
184
313 334 220 225 575
321 261 430 (D)
204
249 253
205 -
525 143 311
146
- 89
492 324
-
303 126
79 93
184 154 173
- 134
(D)
147 99
112 239
289 221 382
- 120
198 139 203
91 89
237 175 158 (D)
280
107 185 328 383
-
- 280 (D)
168 62
73 127 387 135
81
126 124 143
82 208
260 254 225 368 522
359 257 311
- -
14,373 14,426
4 (D)
- -
54
459 14 30
1,218 -
(D) 138
95 423 130
490
11 30
- (D)
43
401 334
- 281
25
3,930 - 6
44
62 74
170 237
17
164 1,932
32 8
(D)
387 9
1,743 - 4
-
906 -
21 422
75 176
1,396 444 286
(D)
629 311 149
5,432
1,341 1,001
62 - -
- 2,986
60 (D) (D)
55,644 50,115
77 9
853 5,267 2,952
2,557
(D)679
1,651 260
-
142 1,306 1,368
486
3,686 108
1,457 (D)
419
116 1,200 1,838 2,240 4,222
81
11,571 7 -
243
1,005 226
73 935
75
962 910
69 (D)13
464
45 3,864
50 4
17
869 20
1,060 165
139 1,579 2,131 1,597 1,466
29
4,220 10,778
789 15,840
5,405 3,738 1,945
110 957
39
1,916 2,957
9 -
150,311 137,386
193 (D)
170 31,946
8,879
2,923 (D)
348 1,657 1,450
77
1,359 2,204
875 573
5,075
117 3,930
(D) 225
-
2,113 1,593 9,129 7,985
131
28,704 172 (D)
570
2,325 (D) 77
395 88
603
1,359 330
- 326
646 264
27,838 172
10
88 1,237
(D) 1,559
485
67 1,469 3,713 2,929
523
(D) 5,047
49,396 442
33,468
10,089 27,165
2,350 99
255
278 3,948 8,899
(D) 77
71,674 69,061
130 3
90 920
14,360
2,080 22 16
837 2,126
33
2,852 168
77 23
4,470
52 795
15 141
-
306 210
21 77
43
21,971 316
8 61
1,387
57 371
36 22
602 555 190
5 129
147 139
14,144 155
8
38 1,041
19 304 102
50 517
3,586 408 102
60
618 1,908
8 25,745
5,087
12,402 1,666
108 136
951
3,920 14,366
3 33
74,455 70,045
49 -
207 340
18,113
2,418 23 (D)
1,260 2,375
5
1,951 44
- 24
4,131
25 162 (D)24
7
45 314
- 72
102
10,696 923
14 4
2,860
(D)229
18 (D)
1,088 1,498
117 (D)
614
26 76
22,600 1,213
-
82 205 (D)
204 259
60 225
4,530 88 25
27
534 611
- 13,477
15,257 13,590
1,872 278 231
1,958 3,494
18,193 - 5
40,109 29,977
4 -
1,870 78
16,804
356 (D)(D)
5,707 1,811
3
472 38
3 4
1,449
- 40 27 (D)
37 (D)12
- 232
19
450 419 (D)(D)
593
- - -
(D)
302 832
48 5
46
25 22
7,200 189
10
51 867
- 36 12
81 127
7,568 6
11
18 88
122 -
608
6,199 2,731 1,020
20 1,948
618
2,119 16,822
- 3
See footnote(s) at end of table. --continued

2007 CENSUS OF AGRICULTURE 2008 FRIS – GENERAL DATA 37 USDA, National Agricultural Statistics Service
Table 16. Characteristics for Irrigation Wells Used on Farms: 2008 and 2003 - Con. [Excludes institutional, research, and experimental farms and farms with horticulture. For meaning of abbreviations and symbols, see introductory text]
Average depth to water 1 Number of wells with an average depth to water of -
Geographic area For all pumped
wells (feet)
For farms with
one well (feet)
For farms with
two wells (feet)
For farms with
three wells (feet)
Under 50 feet
50 to 99 feet
100 to 199 feet
200 to 299 feet
300 to 499 feet
500 feet or more
United States ............................. 2008 .. 2003 .. 2008 DATA Alabama ............................................... Alaska .................................................. Arizona ................................................. Arkansas .............................................. California .............................................. Colorado ............................................... Connecticut .......................................... Delaware .............................................. Florida .................................................. Georgia ................................................ Hawaii .................................................. Idaho .................................................... Illinois ................................................... Indiana ................................................. Iowa ..................................................... Kansas ................................................. Kentucky .............................................. Louisiana .............................................. Maine ................................................... Maryland .............................................. Massachusetts ..................................... Michigan ............................................... Minnesota ............................................. Mississippi ............................................ Missouri ................................................ Montana ............................................... Nebraska .............................................. Nevada ................................................. New Hampshire .................................... New Jersey .......................................... New Mexico .......................................... New York .............................................. North Carolina ...................................... North Dakota ........................................ Ohio ..................................................... Oklahoma ............................................. Oregon ................................................. Pennsylvania ........................................ Rhode Island ........................................ South Carolina ..................................... South Dakota ....................................... Tennessee ........................................... Texas ................................................... Utah ..................................................... Vermont ................................................ Virginia ................................................. Washington .......................................... West Virginia ........................................ Wisconsin ............................................. Wyoming .............................................. Water Resources Regions Region 01 New England ....................... Region 02 Mid-Atlantic ......................... Region 03 South Atlantic-Gulf .............. Region 04 Great Lakes ........................ Region 05 Ohio .................................... Region 06 Tennessee .......................... Region 07 Upper Mississippi ................ Region 08 Lower Mississippi ................ Region 09 Souris-Red-Rainy ................ Region 10 Missouri .............................. Region 11 Arkansas-White-Red ........... Region 12 Texas-Gulf .......................... Region 13 Rio Grande ......................... Region 14 Upper Colorado ................... Region 15 Lower Colorado ................... Region 16 Great Basin ......................... Region 17 Pacific Northwest ................ Region 18 California ............................. Region 19 Alaska ................................. Region 20 Hawaii .................................
100 97
82 49
197 47
123
105 77 19 55
124
128 175
28 26 20
121
82 42 60 34
169
32 34 43 19
71 72 89
136 20
115
42 52 32 46
119
48 82
188 52
38 75
179 99 78
157 107 138
40 63
125 44 79 35 30
104
32 42 27 75
174 151
97 108 186
104 108 123
49 128
97 106
96 52
167 63
123
104 83 17 46
144
123 146
30 35 32
91 88 40 73 42
256
42 43 47 49
47 79 72
132 32
91 41 77 40 47
98 43 91
229 58
51 83
170 80 39
179
61 158
46 99
158 79 79 43 55
105
40 53 37 77
107 168
95 115 131
90 61
123 52
123
101 95
77 (D)
335 41
132
133 (D) 18 73
124
145 193
43 25 21
76 84 47 (D) 58
21 33 34 42 22
92 61 71
145 16
53 34 23 53 39
107
37 87 (D) 55
44
115 194
94 139
(D)
117 (D) 38 61
73 47 85 33 37
134
36 43 (D) 66
169 133 101
27 297
100 117 132 (D)
145
92 87
84 -
149 47
115
83 -
18 69
111
- 189
31 23 18
95 80 47
- 40
(D)31 27 39 45
91 80
122 -
18
85 47 43 36 23
119
27 37 (D)52
28 67
177 102
-
- 136 (D)35 13
37 31 86 32 19
69 29 44 23 77
133 122
95 113 147
131 123 115
- -
154,457 145,380
152 12
870 23,795 13,438
3,887
37 1,040 6,542 1,651
4
597 3,469 2,465 1,193
6,031
125 4,553
86 660
117
3,383 3,489 7,387
12,304
182 27,420
395 6
877
2,225 328 349
1,277 137
1,380 4,965
281 16
576
1,328 270
9,440 257
21
55 2,423
5 2,174
783
270 3,140 9,317 4,274 2,075
79
9,231 42,813
1,275 34,281
12,030
8,467 3,887
138 1,060
604
8,003 13,497
12 4
96,525 98,750
138 7
362 11,893 18,925
2,238
(D)35
3,643 2,236
25
780 307 215
28
2,599 85
1,604 5
151
42 560 648
3,798 462
113
29,646 684 (D)25
1,864
20 512 317
53
609 1,400
263 -
459
240 170
6,283 460 (D)
106
1,173 15
900 413
55 552
7,015 1,000
215
(D)1,530
16,904 (D)
32,947
4,480 6,095 1,722
111 407
1,091 3,219
18,982 7
25
99,419 77,323
151 (D)
335 2,863
17,466
2,929 (D) (D)
2,059 3,009
85
3,338 59 63 (D)
6,803
84 (D) 26 (D)
-
124 164 205 (D)
81
19,367 704
22 22
3,020
44 59 27 17
850 584 195 (D) 94
102
85 32,055
1,019 (D)
18
714 13 97
128
75 258
5,358 194
91
82 338
3,380 (D)
24,793
7,748 30,314
2,368 346 437
2,040 4,028
17,479 (D) 85
34,883 30,680
11 -
643 -
7,412
1,391 (D)
- 44
518
- 1,738
20 -
(D)
2,961 (D) (D)
- -
- - - -
86
25 889
54 11
-
668 - - - 8
457
31 24 (D) (D)
25
- 17,350
30 -
3 360
19 -
77
23 32
575 (D) 25
-
(D) (D)
- 2,367
9,455
11,486 619
- 643
84
2,123 7,418
- -
19,606 16,675
5 -
942 -
3,041
164 - -
42 587
(D)
387 - 3 -
907 (D)
- -
(D)
7 - - -
(D)
- - - - -
455 - - - -
417 28 23
- (D)
-
30 12,081
13 (D)
94
287 -
(D)44
(D)111 638
- 7
(D)(D)24
- 182
9,512 4,230
135 20
942
25 690
3,041 -
(D)
1,676 (D)
- -
38 -
880
184 - - -
21
(D)74
- - -
- - - - -
37 - - - -
- - - - -
- - - - -
(D)78
- 5 -
- -
180 - -
- 168
- - -
42 -
(D)- -
- - - - -
153 35
184 -
38
- 320 880
- (D)
See footnote(s) at end of table. --continued

38 2008 FRIS – GENERAL DATA 2007 CENSUS OF AGRICULTURE USDA, National Agricultural Statistics Service
Table 16. Characteristics for Irrigation Wells Used on Farms: 2008 and 2003 - Con. [Excludes institutional, research, and experimental farms and farms with horticulture. For meaning of abbreviations and symbols, see introductory text]
Average depth to bowls 1 Number of wells with an average depth to bowls of -
Geographic area For all pumped
wells (feet)
For farms with
one well (feet)
For farms with
two wells (feet)
For farms with
three wells (feet)
Under 50 feet
50 to 99 feet
100 to 199 feet
200 to 299 feet
300 to 499 feet
500 feet or more
United States .............................2008 .. 2003 .. 2008 DATA Alabama ............................................... Alaska ................................................... Arizona ................................................. Arkansas ............................................... California .............................................. Colorado ............................................... Connecticut ........................................... Delaware .............................................. Florida ................................................... Georgia ................................................. Hawaii ................................................... Idaho ..................................................... Illinois .................................................... Indiana .................................................. Iowa ...................................................... Kansas .................................................. Kentucky ............................................... Louisiana .............................................. Maine .................................................... Maryland ............................................... Massachusetts ...................................... Michigan ............................................... Minnesota ............................................. Mississippi ............................................ Missouri ................................................ Montana ................................................ Nebraska .............................................. Nevada ................................................. New Hampshire .................................... New Jersey ........................................... New Mexico .......................................... New York .............................................. North Carolina ...................................... North Dakota ........................................ Ohio ...................................................... Oklahoma ............................................. Oregon .................................................. Pennsylvania ........................................ Rhode Island ........................................ South Carolina ...................................... South Dakota ........................................ Tennessee ............................................ Texas .................................................... Utah ...................................................... Vermont ................................................ Virginia .................................................. Washington ........................................... West Virginia ........................................ Wisconsin ............................................. Wyoming ............................................... Water Resources Regions Region 01 New England ....................... Region 02 Mid-Atlantic .......................... Region 03 South Atlantic-Gulf .............. Region 04 Great Lakes ......................... Region 05 Ohio ..................................... Region 06 Tennessee ........................... Region 07 Upper Mississippi ................ Region 08 Lower Mississippi ................ Region 09 Souris-Red-Rainy ................ Region 10 Missouri ............................... Region 11 Arkansas-White-Red ........... Region 12 Texas-Gulf ........................... Region 13 Rio Grande .......................... Region 14 Upper Colorado ................... Region 15 Lower Colorado ................... Region 16 Great Basin ......................... Region 17 Pacific Northwest ................. Region 18 California ............................. Region 19 Alaska ................................. Region 20 Hawaii .................................
166 (NA)
118 70
316 95
236
150 152
69 122 192
159 229
66 56 55
190 109
83 104
80
270 87 85 68 57
163 130 189 214
58
187 75
137 63
109
202 110 175 246 138
74
124 245 186 149
209 165 176
90 102
205 98
148 86 61
160
77 83 62
130
255 208 161 160 299
197 165 236
70 159
158 (NA)
123 75
296 114 185
130 162
57 94
229
141 217
72 64 77
157 107
87 (D) 85
422
98 98 65
124
143 151 155 205
71
147 64
157 80
110
162 101 169 (D)
133
106 143 249 171 147
229 102 170 113 146
256 132 138
96 89
151
95 99 75
139
173 249 150 128 236
182 113 185
75 141
180 (NA)
115 (D)
444 98
280
179 (D) 60
151 184
162 239
89 53 53
132 111
84 (D)
109
30 89 85 66 66
154 122 161 237
54
115 76 54 94
102
157 84
212 (D)
172
83 185 283 172 153
(D)
180 (D) 95
115
129 119 155
85 65
230
83 85 (D)
122
252 205 161
75 399
185 167 279 (D)
162
163 (NA)
95 -
245 117 198
122
- 57
147 192
-
253 66 49 59
146 146
99 -
93
(D)97 65 68
118
163 160 201
- 53
149 117 149
70 63
212
79 149 (D)
117
71 104 259 193
-
- 178 (D)87 37
63 92
163 90 52
104
68 98 65
151
213 185 160 209 241
215 173 198
- -
40,925 (NA)
38 4
129 1,173 1,448
1,378
(D) 322
3,094 102
(D)
197 1,208 1,339
568
1,545 60
599 27
247
43 804 913 552
4,317
25 9,730
11 6
356
464 115 186 692
28
444 2,616
32 (D) 79
789
95 2,992
7 (D)
(D)
1,051 5
417 632
102 1,034 3,503 1,023 1,097
(D)
2,941 5,986
662 13,176
3,138 2,124
575 -
191
18 3,868 1,460
4 (D)
103,752 (NA)
173 14
896 22,034
5,131
3,119 (D)
727 2,028 1,243
14
460 2,215 1,145
584
5,268 124
4,310 44
351
116 1,964 2,323
10,064 7,903
89
17,105 130
- 491
1,761
191 134 700
95
953 1,299
77 (D)95
616 209
4,005 122
14
7 1,241
15 1,898
249
166 1,815 3,712 2,824 1,019
91
6,029 39,745
482 21,657
9,469 3,888 3,388
151 947
210
2,995 5,136
14 14
145,924 (NA)
214 (D)
134 14,807 25,760
3,366
25 24
5,451 3,775
65
2,014 368 251
84
4,191 102
1,353 43
206
- 1,227
825 774 417
175
37,014 846
11 67
2,818
(D) 404 213
66
593 1,912
437 5
843
222 153
31,015 621
-
125 1,840
(D) 715 315
84 754
10,704 1,491
240
(D) 1,756
16,659 244
41,870
6,110 30,349
2,158 192 297
1,696 5,362
25,835 (D) 65
59,040 (NA)
12 -
210 448
10,703
2,035 12 (D)
1,097 1,621
32
3,131 40 (D)
-
4,659 8
115 3
(D)
- 63
211 -
114
56 12,684
732 19 10
1,933
54 143
16 13
790
1,057 148
- 77
43 64
15,201 990
8
(D) 110
23 128 172
34 273
2,950 125
30
51 325 584
- 16,364
6,210
13,031 2,038
252 271
1,751 3,979
10,740 -
32
46,728 (NA)
20 -
1,230 89
13,474
673 (D)
- 648
1,123
(D)926
12 - 4
3,308
19 33
- (D)
7 9
29 -
108
56 789 118
7 -
1,126 (D)53
- (D)
797
98 66 13 38
-
34 21,012
39 (D)
106 532 (D)26 69
40 173
1,885 (D)20
28 69
148 -
1,426
15,464 10,550
476 20
1,230
157 1,550
13,480 -
(D)
10,197 (NA)
- -
591 -
4,646
222 -
(D)12
158
3 186
12 (D)
-
330 - 4 - -
37 - - -
10
- - - - -
130 - - -
(D)
144 104
26 5 -
25 -
3,164 - 4
-
351 - - 8
46 44
170 - 7
-
16 4 -
77
2,987 685 280
- 591
12
629 4,646
- 3
1 Data do not include flowing or artesian wells.

2007 CENSUS OF AGRICULTURE 2008 FRIS – GENERAL DATA 39 USDA, National Agricultural Statistics Service
Table 17. Irrigation Pumps on Farms: 2008 and 2003 [Excludes institutional, research, and experimental farms and farms with horticulture. For meaning of abbreviations and symbols, see introductory text]
Farms with - Geographic area Farms Total
pumps 1 1 pump 2 pumps 3 pumps 4 pumps 5 pumps 6 or 7 pumps
8 or 9 pumps
10 to 19 pumps
20 to 29 pumps
30 pumps or more
United States ............................. 2008 .. 2003 .. 2008 DATA Alabama ............................................... Alaska .................................................. Arizona ................................................. Arkansas .............................................. California .............................................. Colorado ............................................... Connecticut .......................................... Delaware .............................................. Florida .................................................. Georgia ................................................ Hawaii .................................................. Idaho .................................................... Illinois ................................................... Indiana ................................................. Iowa ..................................................... Kansas ................................................. Kentucky .............................................. Louisiana .............................................. Maine ................................................... Maryland .............................................. Massachusetts ..................................... Michigan ............................................... Minnesota ............................................. Mississippi ............................................ Missouri ................................................ Montana ............................................... Nebraska .............................................. Nevada ................................................. New Hampshire .................................... New Jersey .......................................... New Mexico .......................................... New York .............................................. North Carolina ...................................... North Dakota ........................................ Ohio ..................................................... Oklahoma ............................................. Oregon ................................................. Pennsylvania ........................................ Rhode Island ........................................ South Carolina ..................................... South Dakota ....................................... Tennessee ........................................... Texas ................................................... Utah ..................................................... Vermont ................................................ Virginia ................................................. Washington .......................................... West Virginia ........................................ Wisconsin ............................................. Wyoming .............................................. Water Resources Regions Region 01 New England ....................... Region 02 Mid-Atlantic ......................... Region 03 South Atlantic-Gulf .............. Region 04 Great Lakes ........................ Region 05 Ohio .................................... Region 06 Tennessee .......................... Region 07 Upper Mississippi ................ Region 08 Lower Mississippi ................ Region 09 Souris-Red-Rainy ................ Region 10 Missouri .............................. Region 11 Arkansas-White-Red ........... Region 12 Texas-Gulf .......................... Region 13 Rio Grande ......................... Region 14 Upper Colorado ................... Region 15 Lower Colorado ................... Region 16 Great Basin ......................... Region 17 Pacific Northwest ................ Region 18 California ............................. Region 19 Alaska ................................. Region 20 Hawaii .................................
158,622 146,651
665 23
1,163 3,959
41,762
4,720 144 305
4,805 3,518
258
9,033 1,081 1,075
507
4,451 668
1,571 193 597
640
2,121 1,492 1,212 1,877
4,047
14,711 874
82 574
4,047
482 1,644
550 318
1,333
10,602 1,005
50 700
920 441
10,310 2,529
53
645 11,525
87 1,235 2,018
1,130 3,056
11,574 3,009 1,810
436
3,794 7,069
385 25,436
7,683 8,455 3,613 2,551 1,366
3,678
31,176 42,120
23 258
573,924 517,238
1,250 29
4,278 46,441
101,675
18,831 217
1,237 14,572 11,964
444
25,403 3,974 3,300 1,330
20,362
986 7,742
393 1,405
1,933 6,422 4,729
12,152 13,593
9,845
82,372 2,350
125 1,468
10,064
883 3,962 2,024
512
4,239 21,172
1,574 91
1,708
2,372 932
82,335 4,979
95
1,097 24,837
106 4,789 5,331
2,790 6,781
33,693 8,612 3,754
829
13,215 71,690
1,607 117,534
47,398 64,699 10,552
3,749 4,720
7,399
71,481 102,948
29 444
82,284 70,243
427 19
525 490
28,348
2,271 102
91 2,348 1,258
198
5,082 407 429 236
1,407
486 440 160 345
267
1,066 741 247 631
1,787 3,062
435 59
307
2,708 284 909 240 234
596
6,933 657
32 383
467 275
3,511 1,400
27
466 7,756
72 574
1,089
634 1,812 5,556 1,539 1,120
261
1,692 1,087
156 7,969
1,892 3,384 2,066 1,949
657
2,258 19,513 28,522
19 198
24,375 28,592
127 3
327 335
3,892
806 32 46
1,101 715
23
1,589 211 228 113
704 115 291
10 74
201 420 308 103 248
1,239 2,944
222 11 91
576
92 372 105
43
334 1,765
246 7
125
185 63
1,313 513
14
53 1,513
13 193 321
265 453
2,459 631 342
66
724 758
67 5,172
1,235
891 781 329 369
694
5,213 3,900
3 23
13,787 11,966
40 -
64 244
2,380
433 1
52 322 629
13
865 118 147
49
475 42
173 7
73
55 193 134
80 159
252
1,676 51
6 67
265
66 156
62 24
119 894
63 3
54
84 47
1,138 413
8
90 1,034
- 156 311
75 360
1,207 277 124
58
423 552
46 2,626
1,017
982 255 216
76
359 2,735 2,386
- 13
9,330 8,110
27 1
41 324
2,856
303 4
34 439 287
17
411 71 74 36
412
15 113
4 42
21
127 68 73 75
300
1,174 58
5 35
125
18 58 28
5
39 328
23 7
76
66 17
533 89
4
7 269
2 80
109
41 159 870 174
63
33 203 497
25 1,950
638 385 130
31 41
154 975
2,943 1
17
4,297 4,783
14 -
39 232 574
100
1 22
164 100
1
181 67 60 13
233
- 96
3 18
29 60 45 75 85
171 860
23 -
29
55 8 6
29 5
47
155 4 -
22
34 9
267 34
-
13 243
- 42 29
33 91
308 88 50
1
154 441
12 1,217
388 173
42 14 39
51
598 596
- 1
6,944 6,568
13 -
46 337
1,448
253 3
27 136 177
4
293 73 61 37
455
5 177
1 17
34 70 80
109 117
175
1,357 31
1 16
67
5 58 32
4
82 157
6 - 9
18 14
589 40
-
6 205
- 54 45
39 69
396 77 48
11
228 671
31 1,965
731 362
45 3
57
66 683
1,458 - 4
4,705 4,508
8 -
27 312
1,088
185 1
10 79
117
- 173
38 32
7
229 1
70 3
10
13 70 31 94 89
45
1,042 23
- 6
41
8 1
20 -
31 118
3 1 7
27
8 408
11 -
3 136
- 40 39
18 38
209 84 27
5
100 504
17 1,382
387 303
41 3
27
35 407
1,118 - -
8,535 8,489
9 -
62 980 807
194
- 18
143 218
-
303 79 35 14
438
4 150
2 15
10 84 60
247 291
68
2,105 22
- 18
154
1 76 22
2
63 201
1 -
17
37 7
1,172 26
-
6 290
- 67 17
12 58
464 102
31
1 200
1,540 24
2,438
976 792 163
5 66
44
798 821
- -
2,374 2,001
- -
16 361 179
54
- 2
30 10
-
82 15
5 2
58
- 44
- 3
7
18 9
111 106
7
287 5 - 2
31
- 4 5 1
16 40
2 - 6
2 1
737 2 -
- 46
- 16 52
7 9
50 22
1
- 43
541 2
392
200 677
59 -
17
12 155 187
- -
1,991 1,391
- -
16 344 190
121
- 3
43 7
2
54 2 4 -
40 -
17 3 -
3 13 16 73 76
3
204 4 - 3
25
- 4 7 -
6 11
- - 1
- -
642 1 -
1 33
- 13
6
6 7
55 15
4
- 27
478 5
325
219 506
31 1
17
5 99
189 - 2
1 Data include only well pumps for wells used.

40 2008 FRIS – GENERAL DATA 2007 CENSUS OF AGRICULTURE USDA, National Agricultural Statistics Service
Table 18. Irrigation Pumps on Farms for Wells: 2008 and 2003 [Excludes institutional, research, and experimental farms and farms with horticulture. For meaning of abbreviations and symbols, see introductory text]
Average pumping capacity (see text) for - Well pumps with average pumping capacity of -
2,000 or more gpm Geographic area Farms Pumps 1 All pumped
wells (gpm)
Farms with
one well (gpm)
Farms with
two wells (gpm)
Farms with
three wells (gpm)
Less than 500 gpm
500 to
749 gpm
750 to
999 gpm
1,000 to
1,499 gpm
1,500 to
1,999 gpm
Well pumps
Average gpm
United States ......................... 2008 .. 2003 .. 2008 DATA Alabama ........................................... Alaska ............................................... Arizona ............................................. Arkansas ........................................... California .......................................... Colorado ........................................... Connecticut ....................................... Delaware .......................................... Florida ............................................... Georgia ............................................. Hawaii ............................................... Idaho ................................................. Illinois ................................................ Indiana .............................................. Iowa .................................................. Kansas .............................................. Kentucky ........................................... Louisiana .......................................... Maine ................................................ Maryland ........................................... Massachusetts .................................. Michigan ........................................... Minnesota ......................................... Mississippi ........................................ Missouri ............................................ Montana ............................................ Nebraska .......................................... Nevada ............................................. New Hampshire ................................ New Jersey ....................................... New Mexico ...................................... New York .......................................... North Carolina .................................. North Dakota .................................... Ohio .................................................. Oklahoma ......................................... Oregon .............................................. Pennsylvania .................................... Rhode Island .................................... South Carolina .................................. South Dakota .................................... Tennessee ........................................ Texas ................................................ Utah .................................................. Vermont ............................................ Virginia .............................................. Washington ....................................... West Virginia .................................... Wisconsin ......................................... Wyoming ........................................... Water Resources Regions Region 01 New England ................... Region 02 Mid-Atlantic ...................... Region 03 South Atlantic-Gulf .......... Region 04 Great Lakes ..................... Region 05 Ohio ................................. Region 06 Tennessee ....................... Region 07 Upper Mississippi ............ Region 08 Lower Mississippi ............ Region 09 Souris-Red-Rainy ............ Region 10 Missouri ........................... Region 11 Arkansas-White-Red ....... Region 12 Texas-Gulf ....................... Region 13 Rio Grande ...................... Region 14 Upper Colorado ............... Region 15 Lower Colorado ............... Region 16 Great Basin ..................... Region 17 Pacific Northwest ............. Region 18 California ......................... Region 19 Alaska ............................. Region 20 Hawaii .............................
97,296 100,717
290 16
844 3,646
23,998
2,523 60
272 4,216 2,509
86
2,254 1,038
912 451
4,092
214 1,327
93 294
141
1,423 1,379 1,084 1,415
183
14,609 732
37 410
3,455
293 381 358 171
1,160 4,258
562 32
470
643 243
8,982 861
29
240 3,107
42 853 608
371 1,881 7,947 2,033
971
169 3,246 6,664
323 19,531
6,885 7,277 3,406
419 1,016
1,831 9,157
24,067 16 86
406,566 371,010
457 22
3,190 38,551 61,162
10,793
65 1,093
12,330 8,022
120
6,914 (D)
2,746 1,240
19,301
313 6,414
117 827
203
4,067 4,301
11,390 12,869
401
77,322 (D) 43
924
8,232 392 920
1,621 215
(D)
7,086 786
36 1,132
1,695
(D) 77,389
(D) 36
276
5,125 52
3,184 1,445
472 4,093
22,924 5,472
(D)
244 11,136 63,126
1,388 94,570
43,378 60,627
8,915 615
3,527
(D) 18,383 61,297
22 120
779 826
242 585
1,090 1,293
744
835 80
656 1,234
721
2,008 1,170
824 738 780
652 429
1,684 261 578
880 543 641
1,855 1,304
911 781
1,185 226 420
692 114 121 641 169
505 543 123
17 403
688 769 252 997 265
110 510
17 802 635
477 429 946 580 689
210 747
1,430 640 766
646 202 893 936
1,079
1,008 759 745 585
2,008
513 649
164 765 644 666 413
881
42 535
1,054 607
299 811 765 614 799
600 220
1,518 35
431
1,086 287 592 831
1,250
549 768 826 308 257
709
55 66
733 127
409 350 188
18 324
707 439 199 365 169
28
231 13
626 649
438 219 758 331 325
165 664
1,058 721 760
582 192 754 455 709
514 378 415 765 299
725 705
279 (D)
851 1,040
700
804 (D)
526 1,370
515
803 678 754 762 719
719 302
1,863 (D)
480
30 367 634
1,698 1,305
1,672
689 1,244
15 258
1,007
200 21
722 264
547 321
37 (D)
402
782 276 457
1,122 414
(D)
426 (D)
790 574
(D)309 970 425 579
69
737 1,447
761 703
636 419
1,095 1,349
879
1,172 465 706 (D)
803
811 826
136 -
1,146 935 799
956
- 548
1,103 518
-
1,069 809 683 736
638 449
2,412 -
498
(D)516 671
1,229 1,147
924 864
1,399 -
375
397 107 180 697
54
491 857
49 (D)
361
766 939 436
1,447 -
- 682 (D)
645 680
85 345 742 542 756
404 706
1,368 664 848
686 326 615
1,439 1,175
1,199
897 799
- -
139,753 113,112
403 17
514 3,765
25,675
968 (D)
300 2,699 2,641
49
1,337 147 564 122
4,900
200 256 100 361
(D)
1,772 932 260 174
100
6,380 219
34 523
4,083
357 920 583 192
1,549 3,969
714 36
526
392 192
66,013 340 (D)
255
3,170 52
271 499
382 2,293 7,250 2,108
618
201 1,587 3,793
429 10,917
16,631 55,716
2,362 206 513
744
8,259 25,678
17 49
63,313 62,452
25 (D)
498 2,490 7,832
2,731
(D)509
1,773 1,628
(D)
609 841 762 337
7,464
51 199
- 382
(D)
900 1,861
115 426
73
17,551 (D)
- 308
1,375
35 -
272 6
1,521
541 26
- 475
470
56 7,422
240 (D)
(D)
393 -
523 374
6 1,284 3,886 1,191
555
26 3,142 2,952
411 22,091
12,951
2,942 1,495
(D)578
417
1,514 7,832
(D)(D)
88,968 79,563
10 (D)
499 5,554 8,134
4,003
- 200
1,044 1,078
(D)
1,207 2,054
861 457
5,622
(D) 776
- 26
-
968 1,268
362 1,985
35
43,299 321
- 59
608
- -
617 11
504 773
- -
90
745 116
2,557 215
4
(D) 697
- 1,780
408
- 294
2,224 1,570
628
(D) 4,716 7,980
397 48,727
8,060
777 1,519
105 644
745
2,407 8,160
(D) (D)
63,882 65,212
19 (D)
1,023 11,996 11,457
2,904
- 59
2,396 2,554
(D)
1,552 746 539 309
(D) 39
1,661 (D) 23
-
396 (D)
1,498 6,940
148
9,976 617
9 30
915
- -
(D) 6
98
1,487 23
- 35
76
122 880 490
-
- 489
- 603 (D)
(D) 135
5,017 571 578
(D)
1,525 19,948
(D) 12,574
3,332
780 2,078
45 1,097
1,111 3,410
11,517 (D) (D)
27,658 25,725
- -
260 8,504 5,984
70
- 3
1,271 69
(D)
1,286 45
8 4
(D)
- 1,377
(D) (D)
-
31 (D)
4,278 2,002
17
116 330
- (D)
716
- -
(D) -
41 113
23 -
(D)
(D) 36
308 390
-
- 223
- (D)
-
(D) 47
1,346 (D) (D)
-
101 15,218
(D) 181
1,057
248 779 252 299
501
1,562 6,000
- (D)
22,992 24,946
- (D)
396 6,242 2,080
117
- 22
3,147 52
(D)
923 (D)12 11
-
(D)2,145
(D)(D)
58
- -
4,877 1,342
28
- 200
- (D)
535
- - - -
(D)203
- -
(D)
(D)(D)
209 (D)
-
- 153
- (D)(D)
(D)40
3,201 (D)19
-
65 13,235
- 80
1,347
164 682 (D)
396
(D)1,231 2,110
(D)(D)
2,464 2,402
- (D)
2,476 2,460 2,264
2,240
- (D)
2,443 3,760
(D)
2,538 2,264 2,500 2,655
-
(D)2,687
(D)(D)
(D)
- -
2,384 2,466
2,457
- 2,379
- (D)
2,440
- - - -
2,025 2,806
- -
(D)
5,400 2,394 2,746 2,182
-
- 2,513
- (D)(D)
2,810 4,160 2,464
(D)2,316
-
2,688 2,469
- 3,209
2,408 2,585 2,470
(D)2,476
2,306 2,573 2,274
(D)(D)
See footnote(s) at end of table. --continued
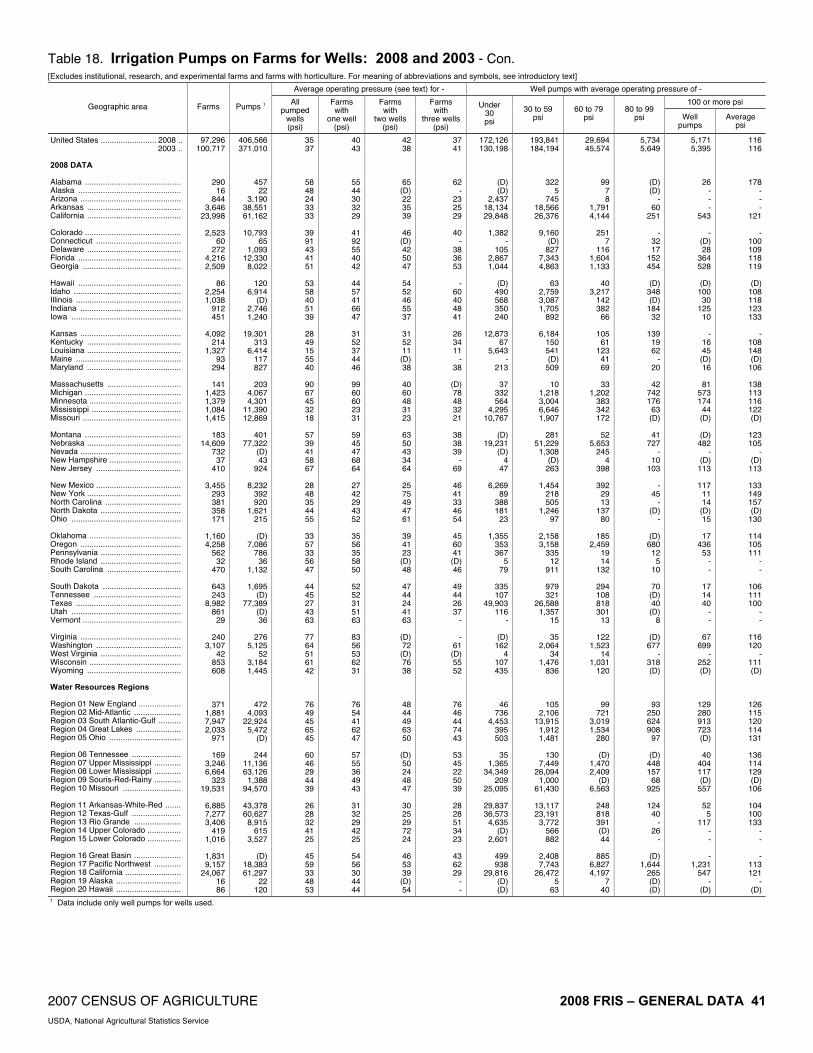
2007 CENSUS OF AGRICULTURE 2008 FRIS – GENERAL DATA 41 USDA, National Agricultural Statistics Service
Table 18. Irrigation Pumps on Farms for Wells: 2008 and 2003 - Con. [Excludes institutional, research, and experimental farms and farms with horticulture. For meaning of abbreviations and symbols, see introductory text]
Average operating pressure (see text) for - Well pumps with average operating pressure of -
100 or more psi Geographic area Farms Pumps 1 All pumped
wells (psi)
Farms with
one well (psi)
Farms with
two wells (psi)
Farms with
three wells (psi)
Under 30 psi
30 to 59 psi
60 to 79 psi
80 to 99 psi Well
pumps Average
psi
United States ......................... 2008 .. 2003 .. 2008 DATA Alabama ........................................... Alaska .............................................. Arizona ............................................. Arkansas .......................................... California .......................................... Colorado ........................................... Connecticut ...................................... Delaware .......................................... Florida .............................................. Georgia ............................................ Hawaii .............................................. Idaho ................................................ Illinois ............................................... Indiana ............................................. Iowa ................................................. Kansas ............................................. Kentucky .......................................... Louisiana .......................................... Maine ............................................... Maryland .......................................... Massachusetts ................................. Michigan ........................................... Minnesota ......................................... Mississippi ........................................ Missouri ............................................ Montana ........................................... Nebraska .......................................... Nevada ............................................. New Hampshire ................................ New Jersey ...................................... New Mexico ...................................... New York .......................................... North Carolina .................................. North Dakota .................................... Ohio ................................................. Oklahoma ......................................... Oregon ............................................. Pennsylvania .................................... Rhode Island .................................... South Carolina ................................. South Dakota ................................... Tennessee ....................................... Texas ............................................... Utah ................................................. Vermont ............................................ Virginia ............................................. Washington ...................................... West Virginia .................................... Wisconsin ......................................... Wyoming .......................................... Water Resources Regions Region 01 New England ................... Region 02 Mid-Atlantic ..................... Region 03 South Atlantic-Gulf .......... Region 04 Great Lakes .................... Region 05 Ohio ................................ Region 06 Tennessee ...................... Region 07 Upper Mississippi ............ Region 08 Lower Mississippi ............ Region 09 Souris-Red-Rainy ............ Region 10 Missouri .......................... Region 11 Arkansas-White-Red ....... Region 12 Texas-Gulf ...................... Region 13 Rio Grande ..................... Region 14 Upper Colorado ............... Region 15 Lower Colorado ............... Region 16 Great Basin ..................... Region 17 Pacific Northwest ............ Region 18 California ......................... Region 19 Alaska ............................. Region 20 Hawaii .............................
97,296 100,717
290 16
844 3,646
23,998
2,523 60
272 4,216 2,509
86
2,254 1,038
912 451
4,092
214 1,327
93 294
141
1,423 1,379 1,084 1,415
183
14,609 732
37 410
3,455
293 381 358 171
1,160 4,258
562 32
470
643 243
8,982 861
29
240 3,107
42 853 608
371 1,881 7,947 2,033
971
169 3,246 6,664
323 19,531
6,885 7,277 3,406
419 1,016
1,831 9,157
24,067 16 86
406,566 371,010
457 22
3,190 38,551 61,162
10,793
65 1,093
12,330 8,022
120
6,914 (D)
2,746 1,240
19,301
313 6,414
117 827
203
4,067 4,301
11,390 12,869
401
77,322 (D) 43
924
8,232 392 920
1,621 215
(D)
7,086 786
36 1,132
1,695
(D) 77,389
(D) 36
276
5,125 52
3,184 1,445
472 4,093
22,924 5,472
(D)
244 11,136 63,126
1,388 94,570
43,378 60,627
8,915 615
3,527
(D) 18,383 61,297
22 120
35 37
58 48 24 33 33
39 91 43 41 51
53 58 40 51 39
28 49 15 55 40
90 67 45 32 18
57 39 41 58 67
28 48 35 44 55
33 57 33 56 47
44 45 27 43 63
77 64 51 61 42
76 49 45 65 45
60 46 29 44 39
26 28 32 41 25
45 59 33 48 53
40 43
55 44 30 32 29
41 92 55 40 42
44 57 41 66 47
31 52 37 44 46
99 60 60 23 31
59 45 47 68 64
27 42 29 43 52
35 56 35 58 50
52 52 31 51 63
83 56 53 62 31
76 54 41 62 47
57 55 36 49 43
31 32 29 42 25
54 56 30 44 44
42 38
65 (D)22 35 39
46 (D)42 50 47
54 52 46 55 37
31 52 11 (D)38
40 60 48 31 23
63 50 43 34 64
25 75 49 47 61
39 41 23 (D)48
47 44 24 41 63
(D)72 (D)76 38
48 44 49 63 50
(D)50 24 48 47
30 25 29 72 24
46 53 39 (D)54
37 41
62 -
23 25 29
40
- 38 36 53
-
60 40 48 41
26 34 11
- 38
(D)78 48 32 21
38 38 39
- 69
46 41 33 46 54
45 60 41 (D)46
49 44 26 37
-
- 61 (D)55 52
76 46 44 74 43
53 45 22 50 39
28 28 51 34 23
43 62 29
- -
172,126 130,198
(D) (D)
2,437 18,134 29,848
1,382
- 105
2,867 1,044
(D)
490 568 350 240
12,873
67 5,643
- 213
37
332 564
4,295 10,767
(D)
19,231 (D)
4 47
6,269
89 388 181
23
1,355 353 367
5 79
335 107
49,903 116
-
(D) 162
4 107 435
46 736
4,453 395 503
35
1,365 34,349
209 25,095
29,837 36,573
4,635 (D)
2,601
499 938
29,816 (D) (D)
193,841 184,194
322 5
745 18,566 26,376
9,160
(D)827
7,343 4,863
63
2,759 3,087 1,705
892
6,184 150 541 (D)
509
10 1,218 3,004 6,646 1,907
281
51,229 1,308
(D)263
1,454
218 505
1,246 97
2,158 3,158
335 12
911
979 321
26,588 1,357
15
35 2,064
34 1,476
836
105 2,106
13,915 1,912 1,481
130
7,449 26,094
1,000 61,430
13,117 23,191
3,772 566 882
2,408 7,743
26,472 5
63
29,694 45,574
99 7 8
1,791 4,144
251
7 116
1,604 1,133
40
3,217 142 382
66
105 61
123 41 69
33
1,202 383 342 172
52
5,653 245
4 398
392
29 13
137 80
185
2,459 19 14
132
294 108 818 301
13
122 1,523
14 1,031
120
99 721
3,019 1,534
280
(D) 1,470 2,409
(D) 6,563
248 818 391 (D) 44
885
6,827 4,197
7 40
5,734 5,649
(D)(D)
- 60
251
- 32 17
152 454
(D)
348 (D)
184 32
139
19 62
- 20
42
742 176
63 (D)
41
727 -
10 103
-
45 -
(D)-
(D)680
12 5
10
70 (D)40 (D)
8
(D)677
- 318 (D)
93 250 624 908
97
(D)448 157
68 925
124
40 -
26 -
(D)1,644
265 (D)(D)
5,171 5,395
26 - - -
543
- (D)28
364 528
(D)
100 30
125 10
-
16 45 (D)16
81
573 174
44 (D)
(D)
482 -
(D)113
117
11 14 (D)15
17
436 53
- -
17 14 40
- -
67 699
- 252 (D)
129 280 913 723 (D)
40
404 117 (D)
557
52 5
117 - -
- 1,231
547 -
(D)
116 116
178 - - -
121
- 100 109 118 119
(D)
108 118 123 133
-
108 148 (D)
106
138 113 116 122 (D)
123 105
- (D)
113
133 149 157 (D)
130
114 105 111
- -
106 111 100
- -
116 120
- 111 (D)
126 115 120 114 131
136 114 129 (D)
106
104 100 133
- -
- 113 121
- (D)
1 Data include only well pumps for wells used.

42 2008 FRIS – GENERAL DATA 2007 CENSUS OF AGRICULTURE USDA, National Agricultural Statistics Service
Table 19. Irrigation Pumps on Farms Other Than for Wells: 2008 and 2003 [Excludes institutional, research, and experimental farms and farms with horticulture. For meaning of abbreviations and symbols, see introductory text]
Pumps to discharge water from tailwater pits
Pumps by discharge capacity
3,000 or more gpm Geographic area Farms Pumps
Average pumping
lift (feet)
Average operating pressure
(psi)
Average discharge capacity (gpm)
Less than 500 gpm
500 to 999 gpm
1,000 to 1,499 gpm
1,500 to 1,999 gpm
2,000 to 2,999 gpm Pumps Average
gpm
United States .............................2008 .. 2003 .. 2008 DATA Alabama ............................................... Alaska ................................................... Arizona ................................................. Arkansas ............................................... California .............................................. Colorado ............................................... Connecticut ........................................... Delaware .............................................. Florida ................................................... Georgia ................................................. Hawaii ................................................... Idaho ..................................................... Illinois .................................................... Indiana .................................................. Iowa ...................................................... Kansas .................................................. Kentucky ............................................... Louisiana .............................................. Maine .................................................... Maryland ............................................... Massachusetts ...................................... Michigan ............................................... Minnesota ............................................. Mississippi ............................................ Missouri ................................................ Montana ................................................ Nebraska .............................................. Nevada ................................................. New Hampshire .................................... New Jersey ........................................... New Mexico .......................................... New York .............................................. North Carolina ...................................... North Dakota ........................................ Ohio ...................................................... Oklahoma ............................................. Oregon .................................................. Pennsylvania ........................................ Rhode Island ........................................ South Carolina ...................................... South Dakota ........................................ Tennessee ............................................ Texas .................................................... Utah ...................................................... Vermont ................................................ Virginia .................................................. Washington ........................................... West Virginia ........................................ Wisconsin ............................................. Wyoming ............................................... Water Resources Regions Region 01 New England ....................... Region 02 Mid-Atlantic .......................... Region 03 South Atlantic-Gulf .............. Region 04 Great Lakes ......................... Region 05 Ohio ..................................... Region 06 Tennessee ........................... Region 07 Upper Mississippi ................ Region 08 Lower Mississippi ................ Region 09 Souris-Red-Rainy ................ Region 10 Missouri ............................... Region 11 Arkansas-White-Red ........... Region 12 Texas-Gulf ........................... Region 13 Rio Grande .......................... Region 14 Upper Colorado ................... Region 15 Lower Colorado ................... Region 16 Great Basin ......................... Region 17 Pacific Northwest ................. Region 18 California ............................. Region 19 Alaska ................................. Region 20 Hawaii .................................
10,423 11,548
23 -
161 912
2,648
1,110 - 2
61 104
12
602 4 3 8
166
4 22
2 3
132
26 10 58
1
263 1,727
84 - 8
461
7 128
2 6
104 281
24 1
17
8 2
446 401
-
9 124
- 18
228
135 43
337 37
4
5 35
880 -
2,709
812 228 224 715 188
360
1,037 2,662
- 12
22,996 21,609
49 -
291 2,110 6,041
4,350
- (D)
155 376
12
1,777 30 (D) 11
448 (D) 29 (D) (D)
276
26 10
106 (D)
479
2,918 84
- 29
499
10 294 (D) 10
155 387
26 (D) 19
11 (D)
730 550
-
34 207
- 36
384
282 73
922 43 (D)
(D) 75
2,049 -
7,392
1,313 393 327 837 318
428
2,453 6,059
- 12
16 13
16 -
25 13 13
13
- (D)11 18
15 28
7 11 22
11 11 11 (D)
8
7 15 (D)
9 (D)
18 17 17
- 7
22 20 87 (D)16
22 12 16 (D)40
14 (D)14 15
-
46 11
- 10 25
7 11 40 16 (D)
(D)
8 12
- 16
16 15 10 19 24
16 23 13
- 15
29 30
43 -
28 22 24
27
- (D)27 58
32 49 32 30 38
19 21 34 (D)27
41 32 30 24 (D)
45 19 31
- 39
31 53 78 (D)23
47 36 38 (D)62
33 (D)21 32
-
29 54
- 39 37
41 44 58 34 19
116
35 21
- 25
25 20 25 31 28
33 47 24
- 32
876 813
561 -
1,243 1,980
915
524 -
(D)2,081 1,895
1,444
687 2,896 1,275
63
441 650
3,690 (D)
540
1,007 735 600
1,764 (D)
706 531
1,108 -
890
454 1,226
423 (D)
320
434 627 358 (D)
770
1,179 (D)
968 1,588
-
131 381
- 1,384
404
1,017 692
1,304 944 100
588
1,779 1,974
- 533
751
1,216 653 769
1,265
1,453 630 914
- 1,444
5,029 7,318
(D)- -
235 1,802
74
- -
(D)-
- 25
- -
11
316 (D)
- (D)(D)
(D)
- - 7 -
177 986 (D)
- -
(D)(D)
246 -
(D)
142 51 (D)
- 6
- -
181 3 -
30 160
- (D)
315
77 26
309 -
(D)
- (D)
242 -
1,357
544 127
41 124
-
10 355
1,802 - -
11,243 8,348
20 -
45 131
1,391
4,246 -
(D) 32 79
-
1,637 -
(D) -
132 - -
(D) (D)
(D) 26 10
7 (D)
185
1,932 6 -
18
370 - -
(D) (D)
13
322 (D)
- 5
(D) (D)
444 3 -
(D) 47
- -
38
69 29
135 30
-
(D) (D)
131 -
5,867
570 174 255 509
45
23 1,972 1,411
- -
3,456 3,391
(D) -
206 164
2,439
30 - -
(D) 63
12
115 (D) (D)
-
- (D) (D)
- -
101 - -
12 -
108 -
73 -
11
(D) (D)
- - -
- (D)
- - 8
(D)
- 13
9 -
(D) - -
(D) -
101 18 95 (D)
-
- 19
165 -
128
23 -
31 -
211
77 (D)
2,442 -
12
1,576 581
- -
19 827
99
- - -
(D) -
- - - - -
- - - - -
- - -
25 -
- -
(D) - -
- (D) 48
- -
- (D)
- - -
- - -
529 -
- - -
(D) (D)
- -
58 (D)
-
- (D)
730 -
(D)
122 - -
204 41
307 (D) 99
- -
1,007 1,240
- -
(D) 403 163
- - -
75 234
- - - - -
- - 9 - -
17 - -
45 -
(D) - - - -
- - - - -
- (D)
- - -
- - 4 - -
- - - -
(D)
17 -
309 - -
- -
445 -
(D)
12 4 - -
(D)
5 (D)
158 - -
685 731
- -
(D)350 147
- - -
(D)-
- -
(D)- -
- -
(D)- -
(D)- -
10 -
(D)- - - -
- - - - -
- - -
(D)-
- -
88 6 -
- - - - -
18 -
16 - -
- (D)
336 -
(D)
42 88
- -
(D)
6 -
147 - -
4,420 4,550
- -
(D)4,318 5,894
- - -
3,500 -
- -
(D)- -
- -
4,767 - -
(D)- -
3,100 -
(D)- - - -
- - - - -
- - -
(D)-
- -
3,284 3,000
-
- - - - -
3,967 -
3,500 - -
- (D)
4,381 -
(D)
3,714 3,284
- -
(D)
3,000 -
5,894 - -
--continued

2007 CENSUS OF AGRICULTURE 2008 FRIS – GENERAL DATA 43 USDA, National Agricultural Statistics Service
Table 19. Irrigation Pumps on Farms Other Than for Wells: 2008 and 2003 - Con. [Excludes institutional, research, and experimental farms and farms with horticulture. For meaning of abbreviations and symbols, see introductory text]
Pumps to discharge water from ponds, lakes, reservoirs, and rivers
Pumps by discharge capacity
3,000 or more gpm Geographic area Farms Pumps
Average pumping
lift (feet)
Average operating pressure
(psi)
Average discharge capacity (gpm)
Less than 500 gpm
500 to 999 gpm
1,000 to 1,499 gpm
1,500 to 1,999 gpm
2,000 to 2,999 gpm Pumps Average
gpm
United States ............................. 2008 .. 2003 .. 2008 DATA Alabama ............................................... Alaska .................................................. Arizona ................................................. Arkansas .............................................. California .............................................. Colorado ............................................... Connecticut .......................................... Delaware .............................................. Florida .................................................. Georgia ................................................ Hawaii .................................................. Idaho .................................................... Illinois ................................................... Indiana ................................................. Iowa ..................................................... Kansas ................................................. Kentucky .............................................. Louisiana .............................................. Maine ................................................... Maryland .............................................. Massachusetts ..................................... Michigan ............................................... Minnesota ............................................. Mississippi ............................................ Missouri ................................................ Montana ............................................... Nebraska .............................................. Nevada ................................................. New Hampshire .................................... New Jersey .......................................... New Mexico .......................................... New York .............................................. North Carolina ...................................... North Dakota ........................................ Ohio ..................................................... Oklahoma ............................................. Oregon ................................................. Pennsylvania ........................................ Rhode Island ........................................ South Carolina ..................................... South Dakota ....................................... Tennessee ........................................... Texas ................................................... Utah ..................................................... Vermont ................................................ Virginia ................................................. Washington .......................................... West Virginia ........................................ Wisconsin ............................................. Wyoming .............................................. Water Resources Regions Region 01 New England ....................... Region 02 Mid-Atlantic ......................... Region 03 South Atlantic-Gulf .............. Region 04 Great Lakes ........................ Region 05 Ohio .................................... Region 06 Tennessee .......................... Region 07 Upper Mississippi ................ Region 08 Lower Mississippi ................ Region 09 Souris-Red-Rainy ................ Region 10 Missouri .............................. Region 11 Arkansas-White-Red ........... Region 12 Texas-Gulf .......................... Region 13 Rio Grande ......................... Region 14 Upper Colorado ................... Region 15 Lower Colorado ................... Region 16 Great Basin ......................... Region 17 Pacific Northwest ................ Region 18 California ............................. Region 19 Alaska ................................. Region 20 Hawaii .................................
63,434 45,835
409 4
62 1,350
19,491
1,702 107
81 758
1,799
98 5,682
72 327
59
432 491 335 106 359
492
1,073 213 240 481
3,536
983 117
54 230
226 204
1,282 215 168
190
6,689 462
20 309
243 189
1,946 1,242
32
406 6,843
52 504
1,069
796 1,361 4,722 1,475
916
297 790
1,542 83
6,031
955 1,841
233 1,182
72
1,631 19,590 19,815
4 98
112,661 94,179
727 4
315 4,267
24,534
2,517 146 134
1,693 3,387
153
13,089 89
537 75
563 621
1,014 265 561
1,371 2,257
395 511 697
8,245 1,395
149 82
499
514 436
2,726 375 280
290
12,516 690
36 496
505 343
2,956 2,124
59
722 13,974
54 1,402 1,871
1,923 2,416 9,165 3,000 1,269
572
1,820 4,706
208 11,699
1,841 2,761
485 1,891
334
2,473 40,365 25,576
4 153
23 19
37 36 13 13 18
18 28 13
8 28
134
18 10 11 17
15 24 15 22 19
7
11 12 13 15
29 29 22 36 11
142
18 17 31 14
15 35 35 14 20
93 31 21 17 19
28 27 28
8 20
12 24 21 11 22
24 10 14 18 27
16 20 53 42 13
18 27 19 36
134
51 49
66 51 47 32 36
45 53 59 37 74
43 58 55 63 59
52 65 16 76 58
52 77 57 34 61
48 38 38 71 71
66 66 67 45 65
50 67 68 53 54
50 64 39 46 43
89 57 53 65 41
56 69 64 75 66
57 61 27 54 47
44 40 45 50 47
49 60 37 51 43
1,088 1,014
895 (D)
1,694 2,540 1,027
708
1,503 940
2,814 736
1,352 1,126
809 1,497
549
793 358
3,124 563 499
906 664
1,123 1,996
973
1,477 815
1,505 245 952
3,855
582 604
1,191 474
742 662 440
1,727 875
3,147
554 667 789 244
634 910 (D)
1,990 916
883 604
1,112 666 545
605
1,929 2,566
(D)1,323
1,918
602 1,712 1,307 1,655
1,000
919 1,014
(D)1,352
27,639 34,645
81 (D)60
273 1,759
613
73 23
454 418
(D)
1,817 (D)69 11
-
484 62
180 154
265 663
84 -
37
1,094 (D)(D)72
149
33 181
1,657 26
121
69 5,017
520 18
121
24 167
1,811 510
53
217 7,465
54 263 346
631 1,024 2,682
908 709
297 300 178 (D)
1,103
274 1,811
33 598
60
426 14,566
1,988 (D)(D)
37,957 28,091
480 (D)
- 417
10,412
1,527 (D) 94
304 2,396
-
2,696 52
246 64
450
66 -
68 382
885
1,288 130
20 252
918
1,111 (D) (D)
113
20 184 703 104 121
198
6,745 84 (D)
275
159 133 121
1,270 -
450 2,348
- 240 389
978 1,022 4,281 1,625
267
172 436 340 (D)
3,807
628 100
92 763
18
860 11,368 11,144
(D) -
23,006 11,745
117 -
38 496
6,658
297 18
5 84
457
(D) 8,082
11 183
-
105 55 80 (D) 25
130 146 121
43 376
1,157
(D) 110 (D) 99
-
(D) 173 183
38
(D) 317 (D)
- (D)
79 34 54
288 6
31
1,332 -
191 999
157 182 833 231 199
79
369 414 (D)
2,904
361 29
105 162
39
1,103 9,020 6,724
- (D)
14,560 4,886
31 -
179 469
4,960
76 (D) (D)
128 93
103 282
- 4 -
8 7
90 (D)
-
(D) 56 (D)
111 18
4,347
- (D)
- 83
6
(D) 120
8 -
- 117
73 -
(D)
11 (D)
878 24
-
10 1,764
- 315
77
46 116 396 121
76
8 284 581
- 2,865
100 729 142
40 179
37
3,768 4,969
- 103
4,237 (D)
4 -
(D) 1,564
498
4 (D) (D)
226 14
-
66 - 8 -
- 9
139 - -
(D) 87 26
307 (D)
362 (D)
6 -
(D)
66 (D) (D) 37
-
(D) 160 (D) (D) (D)
65
- 45 32
-
(D) 117
- 197
52
44 57
355 98 (D)
4
204 1,636
(D) 461
277
45 70
- (D)
38
389 504
- -
5,262 (D)
14 -
(D)1,048
247
- (D)
7 497
9
- 146 (D)27
-
- -
643 (D)
-
44 17 (D)30 (D)
367
- 9 -
(D)
389 -
(D)17
-
(D)160 (D)(D)44
167 (D)47
- -
(D)948
- 196
8
67 15
618 17 (D)
12
227 1,557
(D)559
201
47 43
328 (D)
9
1,254 247
- -
5,297 5,148
3,429 -
3,941 4,890 4,945
-
(D)4,714 7,201 3,000
-
4,940 (D)
13,889 -
- -
4,052 (D)
-
4,511 3,647
(D)3,683 3,500
6,009
- 4,111
- (D)
4,606
- 7,900 3,341
-
(D)3,199
(D)(D)
3,750
7,149 (D)
4,064 - -
(D)5,505
- 6,569 8,000
5,910 4,307 6,946 3,647
(D)
3,283 7,377 4,039
(D)6,297
8,477 4,064 4,931 4,583 3,941
4,111 5,145 4,945
- -
--continued

44 2008 FRIS – GENERAL DATA 2007 CENSUS OF AGRICULTURE USDA, National Agricultural Statistics Service
Table 19. Irrigation Pumps on Farms Other Than for Wells: 2008 and 2003 - Con. [Excludes institutional, research, and experimental farms and farms with horticulture. For meaning of abbreviations and symbols, see introductory text]
Relifting or boosting water within systems
Pumps by discharge capacity
3,000 or more gpm Geographic area Farms Pumps
Average pumping
lift (feet)
Average operating pressure
(psi)
Average discharge capacity (gpm)
Less than 500 gpm
500 to 999 gpm
1,000 to 1,499 gpm
1,500 to 1,999 gpm
2,000 to 2,999 gpm Pumps Average
gpm
United States .............................2008 .. 2003 .. 2008 DATA Alabama ............................................... Alaska ................................................... Arizona ................................................. Arkansas ............................................... California .............................................. Colorado ............................................... Connecticut ........................................... Delaware .............................................. Florida ................................................... Georgia ................................................. Hawaii ................................................... Idaho ..................................................... Illinois .................................................... Indiana .................................................. Iowa ...................................................... Kansas .................................................. Kentucky ............................................... Louisiana .............................................. Maine .................................................... Maryland ............................................... Massachusetts ...................................... Michigan ............................................... Minnesota ............................................. Mississippi ............................................ Missouri ................................................ Montana ................................................ Nebraska .............................................. Nevada ................................................. New Hampshire .................................... New Jersey ........................................... New Mexico .......................................... New York .............................................. North Carolina ...................................... North Dakota ........................................ Ohio ...................................................... Oklahoma ............................................. Oregon .................................................. Pennsylvania ........................................ Rhode Island ........................................ South Carolina ...................................... South Dakota ........................................ Tennessee ............................................ Texas .................................................... Utah ...................................................... Vermont ................................................ Virginia .................................................. Washington ........................................... West Virginia ........................................ Wisconsin ............................................. Wyoming ............................................... Water Resources Regions Region 01 New England ....................... Region 02 Mid-Atlantic .......................... Region 03 South Atlantic-Gulf .............. Region 04 Great Lakes ......................... Region 05 Ohio ..................................... Region 06 Tennessee ........................... Region 07 Upper Mississippi ................ Region 08 Lower Mississippi ................ Region 09 Souris-Red-Rainy ................ Region 10 Missouri ............................... Region 11 Arkansas-White-Red ........... Region 12 Texas-Gulf ........................... Region 13 Rio Grande .......................... Region 14 Upper Colorado ................... Region 15 Lower Colorado ................... Region 16 Great Basin ......................... Region 17 Pacific Northwest ................. Region 18 California ............................. Region 19 Alaska ................................. Region 20 Hawaii .................................
14,754 14,613
13 3
209 579
3,622
727 1 3
74 80
96
2,202 -
10 3
34 47
111 5 5
50 53 12 56 21
281 391 165
- 6
500
39 22 14
7
38 732
38 11 57
91 25
586 280
-
65 2,886
- 84
420
67 143 255
74 62
1
88 712
8 1,467
450 462 511 365 233
316
5,801 3,640
3 96
31,701 34,236
17 3
482 1,513 9,938
1,171
(D) (D)
394 179
159
3,623 -
12 4
50 48
285 (D) (D)
83 72 23
145 25
720 737 280
- 16
819
45 22 26
7
73 1,183
72 17 61
161
25 1,260
526 -
65 5,531
- 167
1,631
113 199 682
97 64
(D)
184 1,809
(D) 3,873
866 918 825 406 541
654
10,280 10,016
3 159
46 19
20 29 28 11 59
12 (D)
7 7
28
64 33
- 18 29
18 32 16 (D)
8
7 9
15 11 25
32
8 13
- 7
113
12 8
40 20
190
80 20 95 18
20 29 20 14
-
26 67
- 18 18
23 18 14 12 35
(D)18 12 (D)17
34 20
104 19 31
13 57 59 29 64
48 45
50 60 64 31 49
28 (D)
110 34 56
39 53
- 54 44
31 61 18 (D)75
35 56 45 22 47
46 45 59
- 53
32 61 55 62 50
37 61 62 52 30
51 48 29 34
-
40 60
- 50 52
43 58 40 54 50
(D)50 29 (D)46
31 28 30 29 61
44 57 49 60 39
1,261 1,325
571 300
2,486 2,883 1,015
1,197
(D)1,054 4,823 1,509
3,691 1,275
- 1,025
132
1,116 173
2,546 (D)
483
6,728 928
1,887 2,094
788
1,133 662
1,063 -
1,491
4,663 1,688
611 2,015
291
715 829 287 (D)
281
830 2,163
692 1,093
-
458 581
- 9,056
366
5,686 777
3,244 783 906
(D)
8,425 2,468
(D)760
2,022
558 3,982 2,236 2,435
900 848
1,017 300
3,691
10,227 9,856
(D)3
39 30
3,292
23 - -
16 15
(D)
221 - - 4
-
41 18 (D)(D)
-
40 (D)(D)
9
130 (D)64
- (D)
149 (D)18 (D)
4
17 166
69 (D)(D)
- -
521 219
-
49 3,791
- 39
994
(D)119 118
56 29
-
30 65
- 1,206
65
477 145
27 55
280
4,201 3,283
3 (D)
5,792 7,755
8 -
(D) 28
1,259
544 -
(D) 82 24
(D)
264 - 5 -
31 7 4
(D) (D)
(D)
9 6
19 4
127 634
11 -
(D)
98 (D)
- (D)
3
44 788
3 -
(D)
148 -
501 37
-
(D) 568
- 8
485
(D) (D)
115 12 10
-
14 51 (D)
1,851
264 317 129
36 (D)
33
1,588 1,311
- (D)
7,815 4,865
(D) -
51 76
3,047
523 - -
14 36
-
2,868 - 7 -
(D) -
16 -
(D)
29 12
- (D) 12
247 (D)
169 - -
19 (D)
- 3 -
- 196
- - -
13 -
136 15
-
(D) 208
- -
81
29 7
52 18
5
- 10 96
- 429
267 105
37 204
51
201 3,231 3,073
- -
2,600 2,553
- -
(D) 70
1,413
3 - -
41 -
- 170
- - -
- - 4 - -
(D) -
(D) 17
-
142 -
31 -
(D)
- - -
(D) -
12 26
- - -
- -
31 234
-
- 310
- -
59
(D) (D) 42
- -
- -
90 (D)
210
38 (D)
- 119 (D)
126 499
1,422 - -
2,837 5,927
- -
261 431 855
21
- (D) 34
104
(D) (D)
- - -
(D) -
198 - -
- -
12 75
-
54 -
(D) - -
- 31
4 6 -
- (D)
- -
(D)
- 25 61
- -
9 567
- 20 12
- 42
148 -
20
(D) 30
706 (D) 93
67 (D)
- -
261
3 601 855
- (D)
2,430 3,280
- -
100 878
72
57 (D)
- 207
-
104 (D)
- - -
- -
45 (D)
-
47 11 (D)25
-
20 -
(D)- -
553 - -
(D)-
- (D)
- (D)
-
- -
10 21
-
- 87
- 100
-
57 -
207 11
-
- 100 801 (D)84
165 (D)
514 20
113
11 160
72 -
104
5,734 4,771
- -
3,989 3,710 5,664
6,502
(D)-
8,201 -
5,499 (D)
- - -
- -
3,867 (D)
-
11,147 4,000
(D)3,480
-
6,000 -
(D)- -
6,746 - -
(D)-
- (D)
- (D)
-
- -
4,000 3,692
-
- 6,133
- 14,591
-
10,630 -
8,201 4,000
-
- 14,591
3,237 (D)
6,124
6,277 (D)
6,122 (D)
4,234
5,091 5,265 5,664
- 5,499
--continued

2007 CENSUS OF AGRICULTURE 2008 FRIS – GENERAL DATA 45 USDA, National Agricultural Statistics Service
Table 19. Irrigation Pumps on Farms Other Than for Wells: 2008 and 2003 - Con. [Excludes institutional, research, and experimental farms and farms with horticulture. For meaning of abbreviations and symbols, see introductory text]
Pumps by average operating pressure (see text)
For discharge from tailwater pits For discharge from ponds, lakes, reservoirs, and rivers For relifting or boosting water Geographic area
Less than 15 psi
15 to 29 psi
30 to 59 psi
60 psi or more
Less than 15 psi
15 to 29 psi
30 to 59 psi
60 psi or more
Less than 15 psi
15 to 29 psi
30 to 59 psi
60 psi or more
United States ............................. 2008 .. 2003 .. 2008 DATA Alabama ............................................... Alaska .................................................. Arizona ................................................. Arkansas .............................................. California .............................................. Colorado ............................................... Connecticut .......................................... Delaware .............................................. Florida .................................................. Georgia ................................................ Hawaii .................................................. Idaho .................................................... Illinois ................................................... Indiana ................................................. Iowa ..................................................... Kansas ................................................. Kentucky .............................................. Louisiana .............................................. Maine ................................................... Maryland .............................................. Massachusetts ..................................... Michigan ............................................... Minnesota ............................................. Mississippi ............................................ Missouri ................................................ Montana ............................................... Nebraska .............................................. Nevada ................................................. New Hampshire .................................... New Jersey .......................................... New Mexico .......................................... New York .............................................. North Carolina ...................................... North Dakota ........................................ Ohio ..................................................... Oklahoma ............................................. Oregon ................................................. Pennsylvania ........................................ Rhode Island ........................................ South Carolina ..................................... South Dakota ....................................... Tennessee ........................................... Texas ................................................... Utah ..................................................... Vermont ................................................ Virginia ................................................. Washington .......................................... West Virginia ........................................ Wisconsin ............................................. Wyoming .............................................. Water Resources Regions Region 01 New England ....................... Region 02 Mid-Atlantic ......................... Region 03 South Atlantic-Gulf .............. Region 04 Great Lakes ........................ Region 05 Ohio .................................... Region 06 Tennessee .......................... Region 07 Upper Mississippi ................ Region 08 Lower Mississippi ................ Region 09 Souris-Red-Rainy ................ Region 10 Missouri .............................. Region 11 Arkansas-White-Red ........... Region 12 Texas-Gulf .......................... Region 13 Rio Grande ......................... Region 14 Upper Colorado ................... Region 15 Lower Colorado ................... Region 16 Great Basin ......................... Region 17 Pacific Northwest ................ Region 18 California ............................. Region 19 Alaska ................................. Region 20 Hawaii .................................
1,661 4,300
(D) -
(D) 186 434
18
- -
(D) -
- (D)
- - -
152 (D) (D)
- -
- - - 5
(D)
- 726 (D)
- -
10 - - - -
- 26
- - -
- -
66 3 -
- (D)
- - -
- -
14 - -
- -
189 -
749
180 49 (D)
- (D)
(D) 35
434 - -
14,507 6,458
- -
264 1,808 4,896
4,202
- -
98 -
- (D)
- - -
221 -
(D) -
(D)
(D) - -
83 -
9 1,762
(D) - -
412 - - -
(D)
11 - - -
(D)
- -
627 - -
30 (D)
- -
(D)
(D) (D)
132 -
(D)
- -
1,713 -
5,451
890 302 307 509 264
(D) 25
4,896 - -
5,871 8,910
31 -
(D)93
643
130 - -
38 240
12
1,655 30 (D)11
75 (D)24 (D)(D)
(D)26 10 18
-
367 430
79 -
(D)
15 6
80 (D)(D)
107 346 (D)(D)
-
11 (D)37
535 -
(D)95
- (D)
346
255 59
385 (D)(D)
(D)(D)
130 -
1,087
198 42 (D)
266 (D)
408
2,181 658
- 12
957 1,941
(D)- -
23 68
- -
(D)(D)
136
- 113
- - -
- -
(D)(D)
-
(D)- - - -
103 - - -
(D)
62 4
214 - -
37 15 (D)
- (D)
-
(D)-
12 -
(D)87
- (D)(D)
(D)(D)
391 (D)
-
(D)(D)17
- 105
45
- -
62 -
12 212
71 - -
2,168 7,231
(D) - 4
441 334
40 (D)
- 20
-
- (D)
- 3 -
- 14
253 -
36
(D) 26
- 15 48
228 226
- (D) (D)
- 8
60 18 11
8
(D) 12
- 6
32
- 25
3 -
- (D)
- -
84
14 60 43 28 26
64 38
440 -
588
288 24
- 43
4
- 174 334
- -
17,900 12,482
(D)(D)32
2,897 10,250
70 (D)13
440 143
20 (D)(D)24
8
19 144 708
27 76
(D)57 12 79 49
655
27 (D)
- (D)
(D)97
118 59 21
32 (D)83
- 43
37 38
296 41 (D)
58 (D)
6 52
112
51 230 788 135 198
43 55
3,252 (D)
743
492 145 152
35 32
42
1,210 10,250
(D)20
51,349 43,112
178 -
224 415
11,091
1,995 96 43
1,109 858
127
5,770 (D)
273 39
370
94 42 22
139
1,210 397 281 393 113
5,795 1,017
(D) 22
160
(D) 57
950 221
71
185 2,850
128 33
192
329 104
2,579 1,833
46
80 7,275
17 365
1,472
1,400 572
3,342 531 308
197 674 706 140
7,931
536 2,536
174 1,323
243
1,996 17,476 11,137
- 127
41,244 31,354
522 (D) 55
514 2,859
412 (D) 78
124 2,386
6
7,074 (D)
237 28
174 369
11 216 310
145
1,777 102
24 487
1,567
125 -
(D) 329
437 274
1,598 77
177
65 9,480
467 3
255
107 201
56 247 (D)
584
5,944 31
985 203
458 1,554 4,992 2,306
737
268 1,053
308 (D)
2,437
525 56
159 490
55
435 21,505
3,855 (D)
6
659 2,892
- - - -
95
219 - -
30 -
- - -
(D) -
- 7
(D) - -
(D) 10
- (D) (D)
105
- 13
- -
(D) - - - -
- - - - -
- -
107 12
-
(D) - - - -
(D) 9
38 (D)
7
- (D) 27
- 109
52 59 (D)
193 -
25 -
95 - -
3,507 5,145
- -
(D) 246 983
103
- -
184 -
17 165
- (D)
-
29 6
256 -
(D)
(D) - -
137 (D)
10 53
- - -
106 -
(D) - 3
(D) (D)
9 (D) 44
- -
694 229
-
- (D)
- 13 91
(D) 12
231 (D)
8
- (D)
544 -
246
350 526 (D) 13 (D)
216 245 983
- 17
18,506 16,899
17 -
(D)1,232 4,843
802
- -
158 155
142
2,612 -
(D)4
(D)19 (D)(D)
-
(D)41 23 (D)
8
414 540 157
- (D)
684
39 (D)12
-
33 (D)
- 10 (D)
146
25 416 268
-
46 (D)
- 126
1,447
94 94
336 (D)34
(D)
135 1,208
(D)3,036
395 329 704 168 (D)
288
6,530 4,835
- 142
9,029 9,300
- 3
421 35
4,017
47 (D)(D)22 24
-
846 - 4 -
(D)16 (D)(D)
9
- 21
- (D)
9
191 144 110
- (D)
(D)
6 16 14
4
(D)750
63 (D)(D)
15
- 43 17
-
(D)1,986
- 28 93
(D)84 77 (D)15
-
28 30
- 482
69
4 -
32 433
125
3,505 4,103
3 -
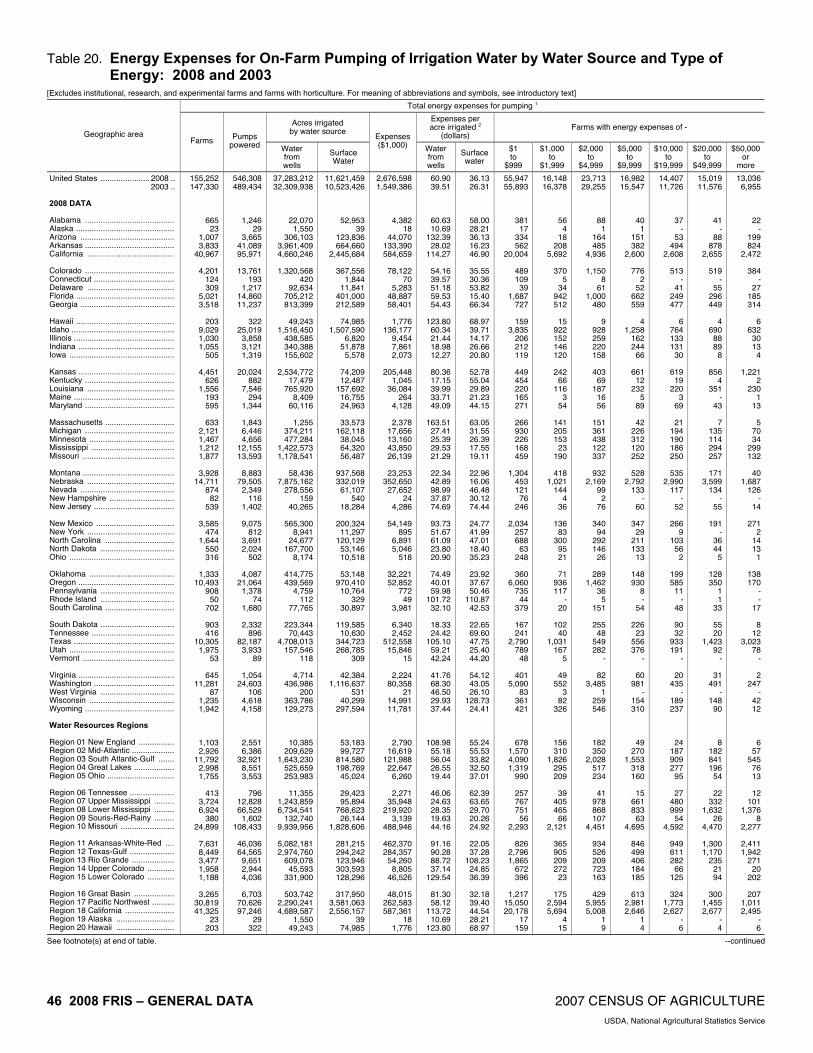
46 2008 FRIS – GENERAL DATA 2007 CENSUS OF AGRICULTURE USDA, National Agricultural Statistics Service
Table 20. Energy Expenses for On-Farm Pumping of Irrigation Water by Water Source and Type of Energy: 2008 and 2003
[Excludes institutional, research, and experimental farms and farms with horticulture. For meaning of abbreviations and symbols, see introductory text]
Total energy expenses for pumping 1
Acres irrigated by water source
Expenses per acre irrigated 2
(dollars) Farms with energy expenses of -
Geographic area Farms Pumps
powered Water from wells
Surface Water
Expenses ($1,000) Water
from wells
Surface water
$1 to
$999
$1,000 to
$1,999
$2,000 to
$4,999
$5,000 to
$9,999
$10,000 to
$19,999
$20,000 to
$49,999
$50,000 or
more
United States ...................... 2008 .. 2003 .. 2008 DATA Alabama ........................................ Alaska ............................................ Arizona .......................................... Arkansas ........................................ California ....................................... Colorado ........................................ Connecticut .................................... Delaware ....................................... Florida ............................................ Georgia .......................................... Hawaii ............................................ Idaho .............................................. Illinois ............................................. Indiana ........................................... Iowa ............................................... Kansas ........................................... Kentucky ........................................ Louisiana ....................................... Maine ............................................. Maryland ........................................ Massachusetts ............................... Michigan ........................................ Minnesota ...................................... Mississippi ..................................... Missouri ......................................... Montana ......................................... Nebraska ....................................... Nevada .......................................... New Hampshire ............................. New Jersey .................................... New Mexico ................................... New York ....................................... North Carolina ............................... North Dakota ................................. Ohio ............................................... Oklahoma ...................................... Oregon ........................................... Pennsylvania ................................. Rhode Island ................................. South Carolina ............................... South Dakota ................................. Tennessee ..................................... Texas ............................................. Utah ............................................... Vermont ......................................... Virginia ........................................... Washington .................................... West Virginia ................................. Wisconsin ...................................... Wyoming ........................................ Water Resources Regions Region 01 New England ................ Region 02 Mid-Atlantic ................... Region 03 South Atlantic-Gulf ....... Region 04 Great Lakes .................. Region 05 Ohio .............................. Region 06 Tennessee .................... Region 07 Upper Mississippi ......... Region 08 Lower Mississippi ......... Region 09 Souris-Red-Rainy ......... Region 10 Missouri ........................ Region 11 Arkansas-White-Red .... Region 12 Texas-Gulf .................... Region 13 Rio Grande ................... Region 14 Upper Colorado ............ Region 15 Lower Colorado ............ Region 16 Great Basin .................. Region 17 Pacific Northwest .......... Region 18 California ...................... Region 19 Alaska .......................... Region 20 Hawaii ..........................
155,252 147,330
665 23
1,007 3,833
40,967
4,201 124 309
5,021 3,518
203
9,029 1,030 1,055
505
4,451 626
1,556 193 595
633
2,121 1,467 1,212 1,877
3,928
14,711 874
82 539
3,585
474 1,644
550 316
1,333
10,493 908
50 702
903 416
10,305 1,975
53
645 11,281
87 1,235 1,942
1,103 2,926
11,792 2,998 1,755
413
3,724 6,924
380 24,899
7,631 8,449 3,477 1,958 1,188
3,265
30,819 41,325
23 203
546,308 489,434
1,246 29
3,665 41,089 95,971
13,761
193 1,217
14,860 11,237
322
25,019 3,858 3,121 1,319
20,024
882 7,546
294 1,344
1,843 6,446 4,656
12,155 13,593
8,883
79,505 2,349
116 1,402
9,075
812 3,691 2,024
502
4,087 21,064
1,378 74
1,680
2,332 896
82,187 3,933
89
1,054 24,603
106 4,618 4,158
2,551 6,386
32,921 8,551 3,553
796
12,828 66,529
1,602 108,433
46,036 64,565
9,651 2,944 4,036
6,703
70,626 97,246
29 322
37,283,212 32,309,938
22,070 1,550
306,103 3,961,409 4,660,246
1,320,568
420 92,634
705,212 813,399
49,243
1,516,450 438,585 340,388 155,602
2,534,772
17,479 765,920
8,409 60,116
1,255
374,211 477,284
1,422,573 1,178,541
58,436
7,875,162 278,556
159 40,265
565,300
8,941 24,677
167,700 8,174
414,775 439,569
4,759 112
77,765
223,344 70,443
4,708,013 157,546
118
4,714 436,986
200 363,786 129,273
10,385 209,629
1,643,230 525,659 253,983
11,355
1,243,859 6,734,541
132,740 9,939,956
5,082,181 2,974,760
609,078 45,593
331,900
503,742 2,290,241 4,689,587
1,550 49,243
11,621,459 10,523,426
52,953 39
123,836 664,660
2,445,684
367,556 1,844
11,841 401,000 212,589
74,985 1,507,590
6,820 51,878
5,578
74,209 12,487
157,692 16,755 24,963
33,573 162,118 38,045 64,320 56,487
937,568 332,019 61,107
540 18,284
200,324 11,297
120,129 53,146 10,518
53,148 970,410 10,764
329 30,897
119,585 10,630
344,723 268,785
309
42,384 1,116,637
531 40,299
297,594
53,183 99,727
814,580 198,769 45,024
29,423 95,894
768,623 26,144
1,828,606
281,215 294,242 123,946 303,593 128,296
317,950 3,581,063 2,556,157
39 74,985
2,676,598 1,549,386
4,382 18
44,070 133,390 584,659
78,122
70 5,283
48,887 58,401
1,776
136,177 9,454 7,861 2,073
205,448
1,045 36,084
264 4,128
2,378
17,656 13,160 43,850 26,139
23,253
352,650 27,652
24 4,286
54,149
895 6,891 5,046
518
32,221 52,852
772 49
3,981
6,340 2,452
512,558 15,846
15
2,224 80,358
21 14,991 11,781
2,790 16,619
121,988 22,647
6,260
2,271 35,948
219,920 3,139
488,946
462,370 284,357 54,260
8,805 46,526
48,015
262,583 587,361
18 1,776
60.90 39.51
60.63 10.69
132.39 28.02
114.27
54.16 39.57 51.18 59.53 54.43
123.80
60.34 21.44 18.98 12.27
80.36 17.15 39.99 33.71 49.09
163.51
27.41 25.39 29.53 21.29
22.34 42.89 98.99 37.87 74.69
93.73 51.67 61.09 23.80 20.90
74.49 40.01 59.98
101.72 32.10
18.33 24.42
105.10 59.21 42.24
41.76 68.30 46.50 29.93 37.44
108.98 55.18 56.04 26.55 19.44
46.06 24.63 28.35 19.63 44.16
91.16 90.28 88.72 37.14
129.54
81.30 58.12
113.72 10.69
123.80
36.13 26.31
58.00 28.21 36.13 16.23 46.90
35.55 30.36 53.82 15.40 66.34
68.97 39.71 14.17 26.66 20.80
52.78 55.04 29.89 21.23 44.15
63.05 31.55 26.39 17.55 19.11
22.96 16.06 46.48 30.12 74.44
24.77 41.99 47.01 18.40 35.23
23.92 37.67 50.46
110.87 42.53
22.65 69.60 47.75 25.40 44.20
54.12 43.05 26.10
128.73 24.41
55.24 55.53 33.82 32.50 37.01
62.39 63.65 29.70 20.26 24.92
22.05 37.28
108.23 24.85 36.39
32.18 39.40 44.54 28.21 68.97
55,947 55,893
381 17
334 562
20,004
489 109
39 1,687
727
159 3,835
206 212 119
449 454 220 165 271
266 930 226 168 459
1,304
453 121
76 246
2,034
257 688
63 248
360
6,060 735
44 379
167 241
2,790 789
48
401 5,090
83 361 421
678 1,570 4,090 1,319
990
257 767 751
56 2,293
826
2,796 1,865
672 396
1,217
15,050 20,178
17 159
16,148 16,378
56 4
18 208
5,692
370 5
34 942 512
15
922 152 146 120
242
66 116
3 54
141 205 153
23 190
418
1,021 144
4 36
136
83 300
95 21
71
936 117
- 20
102
40 1,031
167 5
49
552 3
82 326
156 310
1,826 295 209
39
405 465
66 2,121
365 905 209 272
23
175 2,594 5,694
4 15
23,713 29,255
88 1
164 485
4,936
1,150 8
61 1,000
480
9 928 259 220 158
403
69 187
16 56
151 361 438 122 337
932
2,169 99
2 76
340
94 292 146
26
289 1,462
36 5
151
255 48
549 282
-
82 3,485
1 259 546
182 350
2,028 517 234
41
978 868 107
4,451
934 526 209 723 163
429
5,955 5,008
1 9
16,982 15,547
40 1
151 382
2,600
776 2
52 662 559
4
1,258 162 244
66
661 12
232 5
89
42 226 312 120 252
528
2,792 133
- 60
347
29 211 133
13
148 930
8 -
54
226 23
556 376
-
60 981
- 154 310
49 270
1,553 318 160
15
661 833
63 4,695
846 499 406 184 185
613
2,981 2,646
1 4
14,407 11,726
37 -
53 494
2,608
513 -
41 249 477
6
764 133 131
30
619 19
220 3
69
21 194 190 186 250
535
2,990 117
- 52
266
9 103
56 2
199 585
11 -
48
90 32
933 191
-
20 435
- 189 237
24 187 909 277
95
27 480 999
54 4,592
949 611 282
66 125
324
1,773 2,627
- 6
15,019 11,576
41 -
88 878
2,655
519 -
55 296 449
4
690 88 89
8
856 4
351 -
43
7 135 114 294 257
171
3,599 134
- 55
191
- 36 44
5
128 350
1 1
33
55 20
1,423 92
-
31 491
- 148
90
8 182 841 196
54
22 332
1,632 26
4,470
1,300 1,170
235 21 94
300
1,455 2,677
- 4
13,036 6,955
22 -
199 824
2,472
384 -
27 185 314
6632
30 13
4
1,221 2
230 1
13
570 34
299 132
40 1,687
126 -
14
271 2
14 13
1
138 170
--
17
812
3,023 78
-
2247
-42 12
657
545 76 13
12 101
1,376 8
2,277
2,411 1,942
271 20
202
207 1,011 2,495
-6
See footnote(s) at end of table. --continued

2007 CENSUS OF AGRICULTURE 2008 FRIS – GENERAL DATA 47 USDA, National Agricultural Statistics Service
Table 20. Energy Expenses for On-Farm Pumping of Irrigation Water by Water Source and Type of Energy: 2008 and 2003 - Con.
[Excludes institutional, research, and experimental farms and farms with horticulture. For meaning of abbreviations and symbols, see introductory text]
Electricity
Acres irrigated by water source
Expenses per acre irrigated 2
(dollars) Farms with energy expenses of -
Geographic area Farms Pumps
powered Water from wells
Surface Water
Expenses ($1,000) Water
from wells
Surface water
$1 to
$999
$1,000 to
$1,999
$2,000 to
$4,999
$5,000 to
$9,999
$10,000 to
$19,999
$20,000 to
$49,999
$50,000 or
more
United States ...................... 2008 .. 2003 .. 2008 DATA Alabama ........................................ Alaska ........................................... Arizona .......................................... Arkansas ....................................... California ....................................... Colorado ........................................ Connecticut ................................... Delaware ....................................... Florida ........................................... Georgia ......................................... Hawaii ........................................... Idaho ............................................. Illinois ............................................ Indiana .......................................... Iowa .............................................. Kansas .......................................... Kentucky ....................................... Louisiana ....................................... Maine ............................................ Maryland ....................................... Massachusetts .............................. Michigan ........................................ Minnesota ...................................... Mississippi ..................................... Missouri ......................................... Montana ........................................ Nebraska ....................................... Nevada .......................................... New Hampshire ............................. New Jersey ................................... New Mexico ................................... New York ....................................... North Carolina ............................... North Dakota ................................. Ohio .............................................. Oklahoma ...................................... Oregon .......................................... Pennsylvania ................................. Rhode Island ................................. South Carolina .............................. South Dakota ................................ Tennessee .................................... Texas ............................................ Utah .............................................. Vermont ......................................... Virginia .......................................... Washington ................................... West Virginia ................................. Wisconsin ...................................... Wyoming ....................................... Water Resources Regions Region 01 New England ................ Region 02 Mid-Atlantic .................. Region 03 South Atlantic-Gulf ....... Region 04 Great Lakes ................. Region 05 Ohio ............................. Region 06 Tennessee ................... Region 07 Upper Mississippi ......... Region 08 Lower Mississippi ......... Region 09 Souris-Red-Rainy ......... Region 10 Missouri ....................... Region 11 Arkansas-White-Red .... Region 12 Texas-Gulf ................... Region 13 Rio Grande .................. Region 14 Upper Colorado ............ Region 15 Lower Colorado ............ Region 16 Great Basin .................. Region 17 Pacific Northwest ......... Region 18 California ...................... Region 19 Alaska .......................... Region 20 Hawaii ..........................
127,568 111,991
478 9
975 2,489
37,880
4,098 69
138 3,050 2,434
143
8,869 719 712 372
1,995
165 768
92 156
282
1,586 1,229
884 1,132
3,597
10,107 797
60 244
3,132
215 832 454 174
694
10,248 455
26 619
737 206
8,312 1,704
29
360 11,264
57 836
1,685
535 1,367 7,629 2,133
831
177 2,676 4,540
312 18,277
4,293 7,202 3,005 1,792 1,094
2,987
30,323 38,243
9 143
377,492 312,145
728 14
3,223 14,073 85,751
13,021
71 339
5,783 6,709
220
23,577 2,430 1,616
845
5,896 217
2,509 106 291
589
4,200 4,005 4,028 4,916
7,902
43,068 2,225
67 400
7,834
306 1,621 1,758
239
1,864 20,577
629 30
1,319
1,945 316
65,437 3,475
38
447 24,133
69 3,119 3,517
869 2,167
16,383 5,471 1,493
263
8,981 23,173
1,410 64,992
19,419 56,751
8,326 2,719 3,526
6,162
68,136 87,017
14 220
21,753,795 16,992,830
9,220 658
282,993 1,296,811 3,834,972
1,239,982
173 19,661
200,781 532,113
(D)
1,508,468 256,294 183,325 98,617
646,029
7,596 205,093
(D) 12,102
651
284,816 411,025 386,591 403,061
54,396
4,068,271 267,018
142 9,582
455,892
1,970 15,613
149,040 5,704
108,563 436,684
3,255 60
67,026
192,761 21,681
3,013,518 149,106
101
3,049 434,082
190 312,395 113,733
(D) 48,955
825,954 401,912 127,553
(D)
915,973 2,148,625
119,299 5,568,864
1,679,998 2,391,512
493,665 (D)
306,414
479,664 2,276,820 3,868,063
658 (D)
8,337,185 7,093,272
16,413 -
81,912 180,930
1,871,893
324,680 129
2,642 68,181 86,049
73,371 1,438,639
1,765 19,322
2,071
14,025 1,370
17,433 (D)
2,711
3,721 66,027 24,614 27,486 24,212
817,945 222,388 56,907
123 773
124,960 1,146
29,001 40,635
1,808
17,091 881,895
1,431 (D)
22,639
99,218 1,986
89,519 233,163
144
9,339 1,081,613
223 10,564
242,070
5,005 15,691
227,103 78,340 12,535
4,145 35,352
212,525 20,062
1,460,031
76,180 81,867 85,337
217,852 86,372
266,453 3,401,182 1,977,782
-73,371
1,542,474 951,189
916 9
37,464 30,999
456,406
73,315 14
739 10,862 23,152
1,533
133,618 4,495 3,098 1,048
29,448
138 5,263
25 393
583
8,935 9,613 7,085 6,070
20,031
146,178 26,139
11 653
45,059
198 1,717 3,959
149
4,144 49,250
268 6
2,749
4,784 407
280,496 14,131
6
262 77,522
13 9,188 9,936
639 2,466
39,343 11,553
1,980
250 21,445 46,265
2,545 241,843
118,760 209,501 40,599
7,059 39,072
44,831
253,501 459,278
9 1,533
57.80 42.65
42.36 13.93
129.47 21.28
110.50
54.83 69.51 33.46 50.56 37.88
132.01
60.62 17.51 15.14 9.74
44.64 14.40 23.87 26.08 26.07
74.06 24.44 22.19 17.56 14.43
19.79 34.71 97.80 40.73 65.02
98.08 53.79 45.47 21.16 17.65
34.27 39.59 58.25 67.75 26.86
16.42 16.92 91.43 60.14 41.84
44.17 67.42 46.50 27.65 37.70
56.39 40.84 40.50 23.04 14.78
30.65 22.29 19.47 18.54 37.36
70.02 86.34 85.38 37.14
124.68
80.74 58.06
109.74 13.93
132.01
35.07 29.75
31.76 -
32.98 34.87 44.11
34.24 17.67
(D) 15.28 41.81
(D)
39.53 9.64
20.57 19.30
43.21 12.54 17.80
(D) 14.99
143.65
21.42 16.66 14.41 11.55
22.60 16.20 51.40 40.08 79.21
34.17 24.26 36.83 16.61 15.65
28.61 37.65 66.75
200.00 34.27
20.29 23.00 78.28 23.37
(D)
18.49 42.66 27.38 81.20 23.92
111.36 30.09 28.91 21.75
(D)
27.13 30.81 27.72 15.91 23.74
36.20 37.54
164.51 26.71 33.57
32.51 39.17 41.89
- (D)
50,936 44,660
335 6
338 655
18,475
485 67 40
1,394 643
121
3,758 173 190 119
271 140 248
90 88
196 836 183 229 356
1,256
679 71 60
131
1,916 156 568
48 157
250
6,033 425
26 395
142 151
2,232 675
27
312 5,090
54 299 347
445 968
3,534 1,090
507
148 590
1,058 28
2,048
688 2,238 1,747
588 400
1,137
14,946 18,649
6 121
14,758 14,389
53 2
21 287
5,565
370 2
29 701 391
2
925 151 142
99
217 11
134 -
12
24 167 168 100 182
364 851 138
- 32
130
16 112
96 6
87
942 17
- 20
105
12 905 163
2
27 556
2 81
339
26 117
1,288 244
97
13 426 658
65 1,893
314 905 140 272
26
165 2,535 5,570
2 2
21,020 23,264
44 -
156 392
4,381
1,109 -
34 555 472
7
956 174 168 113
220
7 82
- 24
32
247 400 183 258
847
2,695 95
- 46
276
43 65
124 5
125
1,452 9 -
80
224 20
544 209
-
8 3,486
1 165 487
32 163
1,224 346 109
6
716 797
97 4,598
694 468 186 665 155
350
5,952 4,455
- 7
13,656 10,797
20 1
151 282
2,753
771 -
13 210 306
4
1,194 107 130
25
512 3
128 2
23
22 123 241 143 170
499
1,933 128
- 20
196
- 52 97
2
107 885
- -
48
145 12
531 355
-
6 1,006
- 89
211
24 62
641 163
75
1 447 653
60 3,480
662 474 253 184 185
576
2,914 2,797
1 4
10,873 8,272
12 -
53 396
2,416
507 -
16 66
315
4 749
55 59 13
333
4 108
- 9
3
107 135 127
85
452 1,999
123 -
10
202 -
17 41
2
81 428
4 -
37
82 8
869 142
-
6 486
- 105 207
3 45
444 154
24
5 272 681
34 3,258
548 657 253
55 65
284
1,655 2,432
- 4
9,264 6,440
14 -
102 322
2,483
498 - 5
87 221
-
666 48 23
2
332 -
56 - -
4 71 78 89 77
143
1,331 119
- 5
164
- 17 35
2
34 343
- -
30
31 3
1,192 88
-
1 402
- 64 82
4 11
365 99 18
4
164 515
21 2,046
703 869 209
11 106
274
1,335 2,510
- -
7,061 4,169
--
154 155
1,807
358 -1
37 86
5621
11 -1
110 -
12 --
135 24 13
4
36 619 123
--
248 -1
13 -
10 165
--9
8-
2,039 72
-
-238
-33 12
11
133 37
1
-61
178 7
954
684 1,591
217 17
157
201 986
1,830 -5
See footnote(s) at end of table. --continued

48 2008 FRIS – GENERAL DATA 2007 CENSUS OF AGRICULTURE USDA, National Agricultural Statistics Service
Table 20. Energy Expenses for On-Farm Pumping of Irrigation Water by Water Source and Type of Energy: 2008 and 2003 - Con.
[Excludes institutional, research, and experimental farms and farms with horticulture. For meaning of abbreviations and symbols, see introductory text]
Natural gas
Acres irrigated by water source
Expenses per acre irrigated 2
(dollars) Farms with energy expenses of -
Geographic area Farms Pumps
powered Water from wells
Surface Water
Expenses ($1,000) Water
from wells
Surface water
$1 to
$999
$1,000 to
$1,999
$2,000 to
$4,999
$5,000 to
$9,999
$10,000 to
$19,999
$20,000 to
$49,999
$50,000 or
more
United States ...................... 2008 .. 2003 .. 2008 DATA Alabama ........................................ Alaska ............................................ Arizona .......................................... Arkansas ........................................ California ....................................... Colorado ........................................ Connecticut .................................... Delaware ....................................... Florida ............................................ Georgia .......................................... Hawaii ............................................ Idaho .............................................. Illinois ............................................. Indiana ........................................... Iowa ............................................... Kansas ........................................... Kentucky ........................................ Louisiana ....................................... Maine ............................................. Maryland ........................................ Massachusetts ............................... Michigan ........................................ Minnesota ...................................... Mississippi ..................................... Missouri ......................................... Montana ......................................... Nebraska ....................................... Nevada .......................................... New Hampshire ............................. New Jersey .................................... New Mexico ................................... New York ....................................... North Carolina ............................... North Dakota ................................. Ohio ............................................... Oklahoma ...................................... Oregon ........................................... Pennsylvania ................................. Rhode Island ................................. South Carolina ............................... South Dakota ................................. Tennessee ..................................... Texas ............................................. Utah ............................................... Vermont ......................................... Virginia ........................................... Washington .................................... West Virginia ................................. Wisconsin ...................................... Wyoming ........................................ Water Resources Regions Region 01 New England ................ Region 02 Mid-Atlantic ................... Region 03 South Atlantic-Gulf ....... Region 04 Great Lakes .................. Region 05 Ohio .............................. Region 06 Tennessee .................... Region 07 Upper Mississippi ......... Region 08 Lower Mississippi ......... Region 09 Souris-Red-Rainy ......... Region 10 Missouri ........................ Region 11 Arkansas-White-Red .... Region 12 Texas-Gulf .................... Region 13 Rio Grande ................... Region 14 Upper Colorado ............ Region 15 Lower Colorado ............ Region 16 Great Basin .................. Region 17 Pacific Northwest .......... Region 18 California ...................... Region 19 Alaska .......................... Region 20 Hawaii ..........................
9,147 11,286
- -
72 248 492
74
1 2 2 6
12 19 14 13
2
2,311 8
53 -
22
8 4 - 4
10
87 2,596
- - -
272 1 - 6 1
420
- 2 - -
7 -
2,292 72
-
9 - - 1 4
9 33
8 14 13
-
19 223
- 3,327
3,494 1,071
192 73 76
76 15
492 -
12
36,176 41,768
- -
155 922
1,119
365 (D) (D) (D) 18
(D) 27 20 22 (D)
9,614
(D) 80
- 22
(D)
8 -
64 32
103
8,391 - - -
621 (D)
- 9
(D)
1,420 -
(D) - -
11 -
12,998 72
-
9 - -
(D) 16
19 33 24 22 13
-
34 741
- 10,939
17,557
4,737 576 (D)
161
84 15
1,119 -
(D)
4,369,862 4,794,428
- -
16,177 90,837
133,008
49,871 (D)
- (D)
3,150
- -
2,026 2,920
(D)
1,407,596 (D)
9,896 - -
(D) - -
9,940 4,450
-
904,581 - - -
74,043 - -
845 (D)
227,830
- - - -
1,290 -
1,428,378 180
-
- - -
(D) (D)
(D) -
3,600 2,270
(D)
- 3,156
82,143 -
1,194,507
2,495,906 364,332 73,173
- 17,313
180
- 133,008
- -
288,420 175,760
--
3,963 13,692 46,326
23,310 -
(D)-
300
(D)12,387
-(D)
-
20,638 21
6,250 -
132
(D)264
---
11,715 6,620
---
(D)(D)
-(D)
-
8,439 -
(D)--
--
58,720 5,188
-
9---
(D)
(D)381 300 267 257
--
19,444 -
28,171
53,423 35,746 10,960 71,504
3,963
16,600 975
46,326 -
(D)
416,334 281,029
- -
3,918 2,499
13,934
3,377 (D) (D) (D)
423
(D) 76 (D) 73 (D)
134,241
(D) 646
- 7
(D) 15
- 160
59
161 33,809
- - -
6,133 (D)
- 74 (D)
21,851
- (D)
- -
32 -
194,499 156
-
(D) - -
(D) 44
29 14
468 73
6
- (D)
2,487 -
55,003
284,587 44,577
9,613 1,214 4,021
172
60 13,934
- (D)
93.03 57.25
- -
200.00 25.86 68.03
57.44
(D) -
(D) 119.39
- -
21.04 24.20
(D)
95.53 (D)
42.12 - -
(D) - -
16.10 13.28
-
37.09 - - -
74.72 - -
70.12 (D)
96.48
- - - -
24.57 -
136.06 - -
- - -
(D) (D)
184.89 -
116.97 (D) (D)
-
21.87 26.14
- 45.58
114.97 114.36 128.51
- 191.67
- -
68.03 - -
43.85 33.67
- -
46.96 14.66
148.64
50.06 -
(D) -
156.70
125.00 6.14
- (D)
-
58.76 3.33
36.74 -
50.00
(D) 56.82
- - -
13.72 - - - -
12.57 (D)
- (D)
-
(D) -
(D) - -
- -
68.52 28.81
-
100.00 - - -
(D)
(D) (D)
156.70 59.18 9.22
- -
22.57 -
14.38
33.46 68.52
- 16.97 46.96
9.76
61.54 148.64
- 125.00
123 527
- - 1 6 4
- 1 - - -
12 - 2 - -
31 7 5 -
22
- - - - 2
4 - - - -
6 1 - - -
6 - 2 - -
2 - - - -
9 - - - -
1 31
- 1 9
- 2
11 -
37
8 - 6 - 1
- - 4 -
12
273 572
- - 3
12 5
4 - - - -
- - 7 2 2
74
- 1 - -
7 - - - 2
55 26
- - -
2 - - - 1
6 - - - -
- -
63 1 -
- - - - -
7 - - - 3
- 9 9 -
159
75 - 2 - 3
1 - 5 - -
1,936 2,031
- - -
87 112
1 - 2 - -
- 19
1 4 -
229 1
18 - -
- 2 - - 2
21
923 - - -
117 - - - -
151 - - - -
3 -
172 71
-
- - - - -
- 2 - 6 1
- 1
86 -
979
384 160
53 62
-
75 15
112 - -
1,672 2,296
- - 1
90 288
4 - - - -
- - 4 6 -
299 -
11 - -
- 2 - - 2
7
575 - - -
63 - - 3 -
35 - - - -
- -
280 - -
- - - - 2
- - - 6 -
- 6
60 -
635
533 83 60
- 1
- -
288 - -
1,247 2,289
- - 6
13 14
16
- - - 3
- - - 1 -
278 - 5 - -
- - - 2 2
-
506 - - -
26 - - 3 -
71 - - - -
2 -
296 - -
- - - 1 2
- - 3 1 -
- 1
10 -
607
490 102
13 - 6
- -
14 - -
1,853 2,238
- -
18 36 23
34
- - 2 -
- - - - -
577 -
13 - -
1 - - 1 -
- 483
- - -
39 - - - -
48 - - - -
- -
578 - -
- - - - -
1 - 2 - -
- -
42 -
687
609 436
21 10 22
- -
23 - -
2,043 1,333
--
43 4
46
15 ---3
-----
823 ----
---1-
-83
---
19 ----
103 ----
--
903 --
-----
--3--
--5-
223
1,395 290
37 1
43
--
46 --
See footnote(s) at end of table. --continued
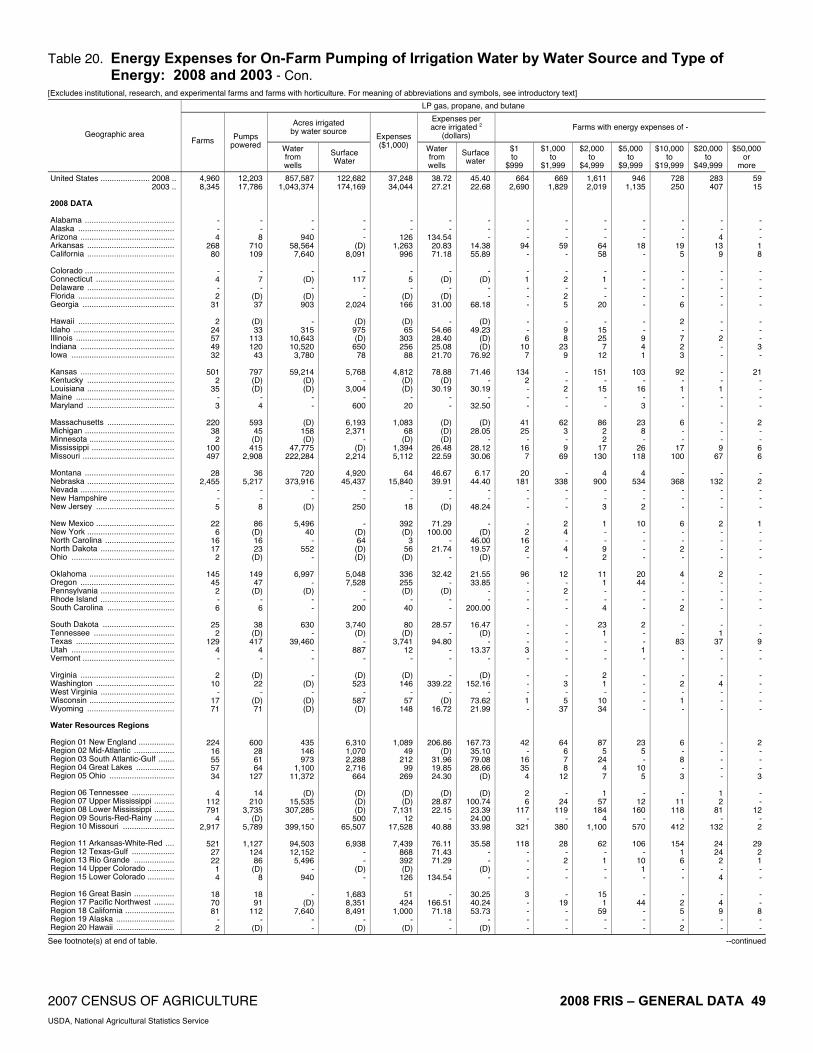
2007 CENSUS OF AGRICULTURE 2008 FRIS – GENERAL DATA 49 USDA, National Agricultural Statistics Service
Table 20. Energy Expenses for On-Farm Pumping of Irrigation Water by Water Source and Type of Energy: 2008 and 2003 - Con.
[Excludes institutional, research, and experimental farms and farms with horticulture. For meaning of abbreviations and symbols, see introductory text]
LP gas, propane, and butane
Acres irrigated by water source
Expenses per acre irrigated 2
(dollars) Farms with energy expenses of -
Geographic area Farms Pumps
powered Water from wells
Surface Water
Expenses ($1,000) Water
from wells
Surface water
$1 to
$999
$1,000 to
$1,999
$2,000 to
$4,999
$5,000 to
$9,999
$10,000 to
$19,999
$20,000 to
$49,999
$50,000 or
more
United States ...................... 2008 .. 2003 .. 2008 DATA Alabama ........................................ Alaska ........................................... Arizona .......................................... Arkansas ....................................... California ....................................... Colorado ........................................ Connecticut ................................... Delaware ....................................... Florida ........................................... Georgia ......................................... Hawaii ........................................... Idaho ............................................. Illinois ............................................ Indiana .......................................... Iowa .............................................. Kansas .......................................... Kentucky ....................................... Louisiana ....................................... Maine ............................................ Maryland ....................................... Massachusetts .............................. Michigan ........................................ Minnesota ...................................... Mississippi ..................................... Missouri ......................................... Montana ........................................ Nebraska ....................................... Nevada .......................................... New Hampshire ............................. New Jersey ................................... New Mexico ................................... New York ....................................... North Carolina ............................... North Dakota ................................. Ohio .............................................. Oklahoma ...................................... Oregon .......................................... Pennsylvania ................................. Rhode Island ................................. South Carolina .............................. South Dakota ................................ Tennessee .................................... Texas ............................................ Utah .............................................. Vermont ......................................... Virginia .......................................... Washington ................................... West Virginia ................................. Wisconsin ...................................... Wyoming ....................................... Water Resources Regions Region 01 New England ................ Region 02 Mid-Atlantic .................. Region 03 South Atlantic-Gulf ....... Region 04 Great Lakes ................. Region 05 Ohio ............................. Region 06 Tennessee ................... Region 07 Upper Mississippi ......... Region 08 Lower Mississippi ......... Region 09 Souris-Red-Rainy ......... Region 10 Missouri ....................... Region 11 Arkansas-White-Red .... Region 12 Texas-Gulf ................... Region 13 Rio Grande .................. Region 14 Upper Colorado ............ Region 15 Lower Colorado ............ Region 16 Great Basin .................. Region 17 Pacific Northwest ......... Region 18 California ...................... Region 19 Alaska .......................... Region 20 Hawaii ..........................
4,960 8,345
- - 4
268 80
- 4 - 2
31
2 24 57 49 32
501
2 35
- 3
220
38 2
100 497
28
2,455 - - 5
22
6 16 17
2
145 45
2 - 6
25
2 129
4 -
2 10
- 17 71
224 16 55 57 34
4
112 791
4 2,917
521
27 22
1 4
18 70 81
- 2
12,203 17,786
- - 8
710 109
- 7 -
(D) 37
(D) 33
113 120
43
797 (D) (D)
- 4
593
45 (D)
415 2,908
36
5,217 - - 8
86 (D) 16 23 (D)
149
47 (D)
- 6
38 (D)
417 4 -
(D) 22
- (D) 71
600 28 61 64
127
14 210
3,735 (D)
5,789
1,127 124
86 (D)
8
18 91
112 -
(D)
857,587 1,043,374
- -
940 58,564
7,640
- (D)
- (D)
903
- 315
10,643 10,520
3,780
59,214 (D) (D)
- -
(D) 158 (D)
47,775 222,284
720
373,916 - -
(D)
5,496 40
- 552
-
6,997 -
(D) - -
630 -
39,460 - -
- (D)
- (D) (D)
435 146 973
1,100 11,372
(D)
15,535 307,285
- 399,150
94,503 12,152
5,496 -
940
- (D)
7,640 - -
122,682 174,169
---
(D)8,091
-117
--
2,024
(D)975 (D)
650 78
5,768 -
3,004 -
600
6,193 2,371
-(D)
2,214
4,920 45,437
--
250
-(D)64 (D)(D)
5,048 7,528
--
200
3,740 (D)
-887
-
(D)523
-587 (D)
6,310 1,070 2,288 2,716
664
(D)(D)(D)
500 65,507
6,938 --
(D)-
1,683 8,351 8,491
-(D)
37,248 34,044
- -
126 1,263
996
- 5 -
(D) 166
(D) 65
303 256
88
4,812 (D) (D)
- 20
1,083
68 (D)
1,394 5,112
64
15,840 - -
18
392 (D)
3 56 (D)
336 255 (D)
- 40
80 (D)
3,741 12
-
(D) 146
- 57
148
1,089 49
212 99
269
(D) (D)
7,131 12
17,528
7,439 868 392 (D)
126
51 424
1,000 -
(D)
38.72 27.21
- -
134.54 20.83 71.18
-
(D) -
(D) 31.00
-
54.66 28.40 25.08 21.70
78.88
(D) 30.19
- -
(D) (D) (D)
26.48 22.59
46.67 39.91
- -
(D)
71.29 100.00
- 21.74
-
32.42 -
(D) - -
28.57 -
94.80 - -
- 339.22
- (D)
16.72
206.86 (D)
31.96 19.85 24.30
(D)
28.87 22.15
- 40.88
76.11 71.43 71.29
- 134.54
-
166.51 71.18
- -
45.40 22.68
- - -
14.38 55.89
-
(D) - -
68.18
(D) 49.23
(D) (D)
76.92
71.46 -
30.19 -
32.50
(D) 28.05
- 28.12 30.06
6.17
44.40 - -
48.24
- (D)
46.00 19.57
(D)
21.55 33.85
- -
200.00
16.47 (D)
- 13.37
-
(D) 152.16
- 73.62 21.99
167.73 35.10 79.08 28.66
(D)
(D) 100.74
23.39 24.00 33.98
35.58
- -
(D) -
30.25 40.24 53.73
- (D)
664 2,690
- - -
94 -
- 1 - - -
- - 6
10 7
134
2 - - -
41 25
- 16
7
20 181
- - -
- 2
16 2 -
96 - - - -
- - - 3 -
- - - 1 -
42 -
16 35
4
2 6
117 -
321
118 - - - -
3 - - - -
669 1,829
- - -
59 -
- 2 - 2 5
- 9 8
23 9
- - 2 - -
62 3 - 9
69
- 338
- - -
2 4 - 4 -
12 - 2 - -
- - - - -
- 3 - 5
37
64 6 7 8
12
- 24
119 -
380
28 - 2 - -
- 19
- - -
1,611 2,019
- - -
64 58
- 1 - -
20
- 15 25
7 12
151
- 15
- -
86 2 2
17 130
4
900 - - 3
1 - - 9 2
11
1 - - 4
23
1 - - -
2 1 -
10 34
87 5
24 4 7
1
57 184
4 1,100
62
- 1 - -
15 1
59 - -
946 1,135
- - -
18 -
- - - - -
- - 9 4 1
103
- 16
- 3
23
8 -
26 118
4
534 - - 2
10
- - - -
20 44
- - -
2 - - 1 -
- - - - -
23 5 -
10 5
-
12 160
- 570
106
- 10
1 -
- 44
- - -
728 250
- - -
19 5
- - - - 6
2 - 7 2 3
92
- 1 - -
6 - -
17 100
-
368 - - -
6 - - 2 -
4 - - - 2
- -
83 - -
- 2 - 1 -
6 - 8 - 3
-
11 118
- 412
154
1 6 - -
- 2 5 - 2
283 407
- - 4
13 9
- - - - -
- - 2 - -
- - 1 - -
- - - 9
67
- 132
- - -
2 - - - -
2 - - - -
- 1
37 - -
- 4 - - -
- - - - -
1 2
81 -
132
24 24
2 - 4
- 4 9 - -
59 15
---18
-----
---3-
21 ----
2--66
-2---
1----
-----
--9--
-----
2---3
--
12 -2
29 21--
--8--
See footnote(s) at end of table. --continued

50 2008 FRIS – GENERAL DATA 2007 CENSUS OF AGRICULTURE USDA, National Agricultural Statistics Service
Table 20. Energy Expenses for On-Farm Pumping of Irrigation Water by Water Source and Type of Energy: 2008 and 2003 - Con.
[Excludes institutional, research, and experimental farms and farms with horticulture. For meaning of abbreviations and symbols, see introductory text]
Diesel fuel
Acres irrigated by water source
Expenses per acre irrigated 2
(dollars) Farms with energy expenses of -
Geographic area Farms Pumps
powered Water from wells
Surface Water
Expenses ($1,000) Water
from wells
Surface water
$1 to
$999
$1,000 to
$1,999
$2,000 to
$4,999
$5,000 to
$9,999
$10,000 to
$19,999
$20,000 to
$49,999
$50,000 or
more
United States ...................... 2008 .. 2003 .. 2008 DATA Alabama ........................................ Alaska ............................................ Arizona .......................................... Arkansas ........................................ California ....................................... Colorado ........................................ Connecticut .................................... Delaware ....................................... Florida ............................................ Georgia .......................................... Hawaii ............................................ Idaho .............................................. Illinois ............................................. Indiana ........................................... Iowa ............................................... Kansas ........................................... Kentucky ........................................ Louisiana ....................................... Maine ............................................. Maryland ........................................ Massachusetts ............................... Michigan ........................................ Minnesota ...................................... Mississippi ..................................... Missouri ......................................... Montana ......................................... Nebraska ....................................... Nevada .......................................... New Hampshire ............................. New Jersey .................................... New Mexico ................................... New York ....................................... North Carolina ............................... North Dakota ................................. Ohio ............................................... Oklahoma ...................................... Oregon ........................................... Pennsylvania ................................. Rhode Island ................................. South Carolina ............................... South Dakota ................................. Tennessee ..................................... Texas ............................................. Utah ............................................... Vermont ......................................... Virginia ........................................... Washington .................................... West Virginia ................................. Wisconsin ...................................... Wyoming ........................................ Water Resources Regions Region 01 New England ................ Region 02 Mid-Atlantic ................... Region 03 South Atlantic-Gulf ....... Region 04 Great Lakes .................. Region 05 Ohio .............................. Region 06 Tennessee .................... Region 07 Upper Mississippi ......... Region 08 Lower Mississippi ......... Region 09 Souris-Red-Rainy ......... Region 10 Missouri ........................ Region 11 Arkansas-White-Red .... Region 12 Texas-Gulf .................... Region 13 Rio Grande ................... Region 14 Upper Colorado ............ Region 15 Lower Colorado ............ Region 16 Great Basin .................. Region 17 Pacific Northwest .......... Region 18 California ...................... Region 19 Alaska .......................... Region 20 Hawaii ..........................
36,661 39,688
209 8
42 3,025 4,522
235
31 241
2,784 1,862
32
232 578 602 204
1,526
392 1,147
62 389
239 858 423 933
1,249
472 8,852
45 10
293
292 207 747 121
98
324 292 231
11 113
192 213 805 119
3
341 159
9 541 346
353 1,450 5,812 1,184
888
175 1,679 5,327
93 11,182
1,981
599 345
22 104
184 716
4,527 8
32
115,249 112,133
476 9
279 25,250
8,992
375 54
847 8,511 4,318
48
1,305 1,281 1,351
421
3,695 501
4,896 133 886
466
2,118 620
7,635 5,581
734
22,803 74 16
888
468 336
1,622 234 156
631 427 369
16 237
328 458
2,428 179
3
568 430
11 1,373
412
685 3,502
15,264 2,705 1,579
323
3,513 38,662
178 26,528
7,746 2,079
597 50
341
270 2,172 8,998
9 48
10,257,875 9,421,693
12,830 880
5,993 2,504,257
684,626
30,715 (D)
72,469 497,566 277,233
(D)
7,667 169,539 143,623 52,769
421,713
9,455 546,429
(D) 46,414
244
88,477 65,679
976,497 541,388
3,320
2,528,394 11,538
17 30,165
28,613
6,391 9,000
17,263 2,053
70,185
2,820 1,199
15 10,249
28,658 48,645
218,098 8,260
9
1,665 2,559
- (D)
12,770
(D) 157,367 805,784 119,323 114,613
6,548
308,562 4,179,402
13,441 2,777,172
804,230 201,125 35,488
(D) 7,233
23,898 12,696
680,876 880 (D)
2,814,050 3,007,209
36,336 (D)
37,961 460,865 519,374
19,566 1,232
(D)332,819 123,905
1,410 52,201
(D)31,334
3,429
33,778 9,931
131,005 15,385 20,955
22,582 91,556 13,291 31,464 29,871
97,253 56,924
950 186
16,575
(D)9,124
87,540 9,383 8,018
21,690 80,987
(D)213
7,664
16,627 7,527
192,020 21,565
-
32,562 32,773
192 28,551 36,392
39,598 78,956
581,334 114,305 29,158
23,465 59,937
517,517 (D)
261,777
143,604 172,165 27,649 11,202 37,961
24,838 160,104 523,558
(D)1,410
674,614 281,173
3,457 6
2,562 97,996
113,323
1,429 39
4,531 37,621 34,617
202
2,364 4,611 4,417
930
36,938 853
29,944 228
3,603
606 8,569 3,532
35,114 14,599
2,853
156,816 1,503
7 3,527
2,504
582 4,844
957 325
5,385 3,340
333 32
1,036
1,442 1,887
32,372 1,344
1
1,935 2,434
4 5,703 1,353
913 13,682 81,137 10,748
3,883
1,862 13,924
163,063 581
174,249
50,619 28,277
3,596 522
3,306
2,748 8,144
113,149 6
202
54.20 25.09
68.40 6.72
120.51 32.79
132.68
28.99 -
56.58 62.77 86.47
113.73
49.74 26.81 23.22 16.28
83.48 22.49 45.80
(D) 55.07
(D)
39.67 45.81 34.73 25.72
44.94 60.73
121.68 (D)
77.26
83.85 45.24 74.10 42.05 21.56
73.31 27.94 34.59
160.00 54.99
29.29 26.46
105.84 45.16 83.33
29.05
218.96 -
48.95 25.68
167.10 59.29 70.94 40.99 23.35
52.11 32.54 34.09 28.56 59.15
61.82
101.58 60.48
- 240.26
87.72 72.44
132.82 6.72
113.73
41.94 16.23
68.84 (D)
47.65 21.72 54.53
46.18 30.90 52.84 17.77 81.20
83.69 37.57 14.47 31.68 18.84
56.92 66.73 32.16 21.74 49.35
19.78 43.23 46.13 21.59 24.47
27.81 36.45
104.11 25.55 73.26
40.72 39.20 47.09 24.66 36.63
26.81 40.76 38.74
140.37 56.38
36.26 79.77 36.53 45.01
-
61.47 60.89
(D) 129.72
28.26
21.51 58.14 39.02 42.13 41.51
66.07 75.31 32.33
(D) 33.55
21.08 29.01 78.55 46.72 47.65
33.39 45.39 53.59
(D) 83.69
5,391 12,226
34 5 -
288 1,584
4
20 10
655 129
14
- 97 72 30
133 258
4 38
105
132 128
49 1
213
49 262
- 8
51
62 76 90 15 50
38 48
143 7
23
20 74
5 29
3
135 - 8
47 145
205 398 987 213 340
79
260 256
20 710
176
5 62
- -
29 46
1,586 5
14
2,888 5,340
11 2 4
117 228
10
2 10
382 204
13 26 72 98 42
-
45 38
3 34
31 80 23 35
160
123 526
12 1
25
6 57
157 11 18
17
3 58
- 1
12 27 88
6 -
17 12
1 28 12
37 165 765 109 161
10
153 236
15 721
77
1 70
- 4
22 99
228 2
13
7,069 9,677
50 1 7
458 629
130
8 67
704 428
-
72 177 161
80
244 56
213 14 52
53
276 108 111 300
121
1,469 6 1
66
58 41
217 29 14
69 51 15
3 48
34 34
6 12
-
83 5 -
174 114
79 277
1,475 359 180
18
499 860
11 2,081
368
1 78
2 7
31
108 634
1 -
6,564 5,338
29 - 4
395 298
43
1 45
484 290
-
62 116 135
37
346 12
193 3
88
3 148 144 116 169
87
2,265 7 -
49
71 22
168 45 11
53 19
8 -
14
95 26
154 18
-
58 88
- 103
42
7 242
1,012 206 110
18
358 739
27 2,832
344
96 66 10
4
25 166 302
- -
6,386 3,660
32 - 6
466 672
39
- 32
183 315
-
27 76 84
7
374 15
238 3
62
16 126
65 163 186
71
2,232 8 -
47
68 9
78 10
2
66 158
6 -
12
10 24
186 45
-
20 25
- 93 29
19 161 613 170
64
20 236 923
14 2,576
383 161
36 7
68
53 210 672
- -
5,138 2,624
36 - 6
707 541
9 -
54 238 328
4
41 27 47
7
240 4
270 -
37
2 72 29
267 164
17
1,440 8 -
42
22 -
27 9 2
59 10
1 1
10
21 21
173 3 -
26 22
- 90
4
3 157 628
97 25
20
150 1,315
6 1,564
355 165
18 - 6
16 73
536 - 4
3,225 823
17 -
15 594 570
--
23 138 168
14
13 51
189 2
191 1
11
228
5240
57
4658
4-
13
52
10 21
22 3--5
-7
193 6-
27-6-
350
332 30
8
10 23
998 -
698
278 170
15 3
15
814
569 -1
See footnote(s) at end of table. --continued
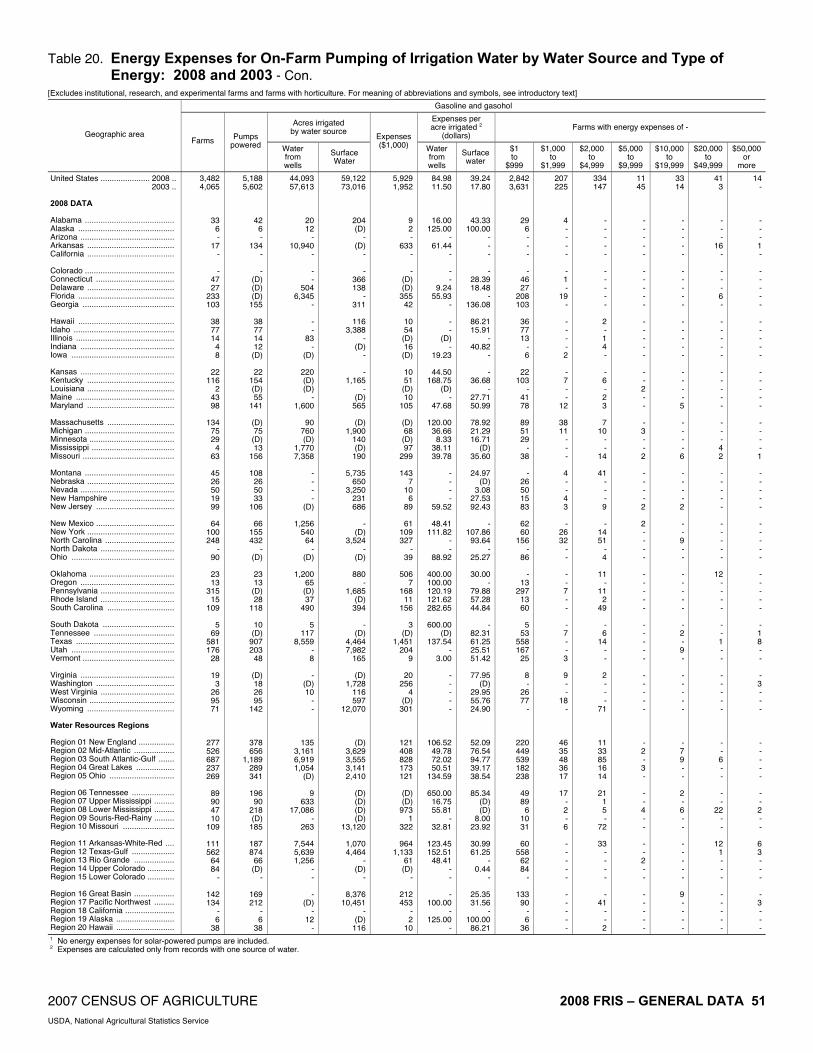
2007 CENSUS OF AGRICULTURE 2008 FRIS – GENERAL DATA 51 USDA, National Agricultural Statistics Service
Table 20. Energy Expenses for On-Farm Pumping of Irrigation Water by Water Source and Type of Energy: 2008 and 2003 - Con.
[Excludes institutional, research, and experimental farms and farms with horticulture. For meaning of abbreviations and symbols, see introductory text]
Gasoline and gasohol
Acres irrigated by water source
Expenses per acre irrigated 2
(dollars) Farms with energy expenses of -
Geographic area Farms Pumps
powered Water from wells
Surface Water
Expenses ($1,000) Water
from wells
Surface water
$1 to
$999
$1,000 to
$1,999
$2,000 to
$4,999
$5,000 to
$9,999
$10,000 to
$19,999
$20,000 to
$49,999
$50,000 or
more
United States ...................... 2008 .. 2003 .. 2008 DATA Alabama ........................................ Alaska ........................................... Arizona .......................................... Arkansas ....................................... California ....................................... Colorado ........................................ Connecticut ................................... Delaware ....................................... Florida ........................................... Georgia ......................................... Hawaii ........................................... Idaho ............................................. Illinois ............................................ Indiana .......................................... Iowa .............................................. Kansas .......................................... Kentucky ....................................... Louisiana ....................................... Maine ............................................ Maryland ....................................... Massachusetts .............................. Michigan ........................................ Minnesota ...................................... Mississippi ..................................... Missouri ......................................... Montana ........................................ Nebraska ....................................... Nevada .......................................... New Hampshire ............................. New Jersey ................................... New Mexico ................................... New York ....................................... North Carolina ............................... North Dakota ................................. Ohio .............................................. Oklahoma ...................................... Oregon .......................................... Pennsylvania ................................. Rhode Island ................................. South Carolina .............................. South Dakota ................................ Tennessee .................................... Texas ............................................ Utah .............................................. Vermont ......................................... Virginia .......................................... Washington ................................... West Virginia ................................. Wisconsin ...................................... Wyoming ....................................... Water Resources Regions Region 01 New England ................ Region 02 Mid-Atlantic .................. Region 03 South Atlantic-Gulf ....... Region 04 Great Lakes ................. Region 05 Ohio ............................. Region 06 Tennessee ................... Region 07 Upper Mississippi ......... Region 08 Lower Mississippi ......... Region 09 Souris-Red-Rainy ......... Region 10 Missouri ....................... Region 11 Arkansas-White-Red .... Region 12 Texas-Gulf ................... Region 13 Rio Grande .................. Region 14 Upper Colorado ............ Region 15 Lower Colorado ............ Region 16 Great Basin .................. Region 17 Pacific Northwest ......... Region 18 California ...................... Region 19 Alaska .......................... Region 20 Hawaii ..........................
3,482 4,065
33 6 -
17 -
- 47 27
233 103
38 77 14
4 8
22
116 2
43 98
134
75 29
4 63
45 26 50 19 99
64
100 248
- 90
23 13
315 15
109
5 69
581 176
28
19 3
26 95 71
277 526 687 237 269
89 90 47 10
109
111 562
64 84
-
142 134
- 6
38
5,188 5,602
42 6 -
134 -
- (D) (D) (D)
155
38 77 14 12 (D)
22
154 (D) 55
141
(D) 75 (D) 13
156
108 26 50 33
106
66 155 432
- (D)
23 13 (D) 28
118
10 (D)
907 203
48
(D) 18 26 95
142
378 656
1,189 289 341
196
90 218 (D)
185
187 874
66 (D)
-
169 212
- 6
38
44,093 57,613
20 12
- 10,940
-
- -
504 6,345
-
- -
83 -
(D)
220 (D) (D)
- 1,600
90
760 (D)
1,770 7,358
- - - -
(D)
1,256 540
64 -
(D)
1,200 65 (D) 37
490
5 117
8,559 - 8
-
(D) 10
- -
135 3,161 6,919 1,054
(D)
9 633
17,086 -
263
7,544 5,639 1,256
- -
- (D)
- 12
-
59,122 73,016
204 (D)
-(D)
-
-366 138
-311
116 3,388
-(D)
-
-1,165
-(D)
565
(D)1,900
140 (D)
190
5,735 650
3,250 231 686
-(D)
3,524 -
(D)
880 -
1,685 (D)
394
-(D)
4,464 7,982
165
(D)1,728
116 597
12,070
(D)3,629 3,555 3,141 2,410
(D)(D)(D)(D)
13,120
1,070 4,464
-(D)
-
8,376 10,451
-(D)
116
5,929 1,952
9 2 -
633 -
- (D) (D)
355 42
10 54 (D) 16 (D)
10 51 (D) 10
105
(D) 68 (D) 97
299
143 7
10 6
89
61 109 327
- 39
506
7 168
11 156
3
(D) 1,451
204 9
20
256 4
(D) 301
121 408 828 173 121
(D) (D)
973 1
322
964 1,133
61 (D)
-
212 453
- 2
10
84.98 11.50
16.00 125.00
- 61.44
-
- -
9.24 55.93
-
- -
(D) -
19.23
44.50 168.75
(D) -
47.68
120.00 36.66 8.33
38.11 39.78
- - - -
59.52
48.41 111.82
- -
88.92
400.00 100.00 120.19 121.62 282.65
600.00
(D) 137.54
- 3.00
- - - - -
106.52 49.78 72.02 50.51
134.59
650.00 16.75 55.81
- 32.81
123.45 152.51
48.41 - -
- 100.00
- 125.00
-
39.24 17.80
43.33 100.00
- - -
- 28.39 18.48
- 136.08
86.21 15.91
- 40.82
-
- 36.68
- 27.71 50.99
78.92 21.29 16.71
(D) 35.60
24.97
(D) 3.08
27.53 92.43
-
107.86 93.64
- 25.27
30.00
- 79.88 57.28 44.84
-
82.31 61.25 25.51 51.42
77.95
(D) 29.95 55.76 24.90
52.09 76.54 94.77 39.17 38.54
85.34
(D) (D)
8.00 23.92
30.99 61.25
- 0.44
-
25.35 31.56
- 100.00
86.21
2,842 3,631
29 6 - - -
- 46 27
208 103
36 77 13
- 6
22
103 -
41 78
89 51 29
- 38
-
26 50 15 83
62 60
156 -
86
- 13
297 13 60
5
53 558 167
25
8 -
26 77
-
220 449 539 182 238
49 89
6 10 31
60
558 62 84
-
133 90
- 6
36
207 225
4 - - - -
- 1 -
19 -
- - - - 2
- 7 - -
12
38 11
- - -
4 - - 4 3
-
26 32
- -
- - 7 - -
- 7 - - 3
9 - -
18 -
46 35 48 36 17
17
- 2 - 6
- - - - -
- - - - -
334 147
- - - - -
- - - - -
2 - 1 4 -
- 6 - 2 3
7
10 - -
14
41 - - - 9
-
14 51
- 4
11
- 11
2 49
- 6
14 - -
2 - - -
71
11 33 85 16 14
21
1 5 -
72
33 - - - -
- 41
- - 2
11 45
- - - - -
- - - - -
- - - - -
- - 2 - -
- 3 - - 2
- - - - 2
2 - - - -
- - - - -
- - - - -
- - - - -
- 2 - 3 -
- - 4 - -
- - 2 - -
- - - - -
33 14
- - - - -
- - - - -
- - - - -
- - - - 5
- - - - 6
- - - - 2
- - 9 - -
- - - - -
- 2 - 9 -
- - - - -
- 7 9 - -
2 - 6 - -
- - - - -
9 - - - -
41 3
- - -
16 -
- - - 6 -
- - - - -
- - - - -
- - - 4 2
- - - - -
- - - - -
12 - - - -
- - 1 - -
- - - - -
- - 6 - -
- -
22 - -
12 1 - - -
- - - - -
14 -
---1-
-----
-----
-----
----1
-----
-----
-----
-18--
-3---
-----
--2--
63---
-3---
1 No energy expenses for solar-powered pumps are included. 2 Expenses are calculated only from records with one source of water.

52 2008 FRIS – GENERAL DATA 2007 CENSUS OF AGRICULTURE USDA, National Agricultural Statistics Service
Table 21. Pumps On-Farm Powered by Solar and Other Renewable Energy Sources: 2008 and 2003 [Excludes institutional, research, and experimental farms and farms with horticulture. For meaning of abbreviations and symbols, see introductory text]
Using only solar and other renewable sources 1
For pumped well water only For pumped surface water only Geographic area Farms Pumps powered
Total acres
irrigated Farms Pumps
powered Acres
irrigated Farms Pumps powered
Acres irrigated
United States .............................2008 .. 2003 .. 2008 DATA Water Resources Regions Region 01 New England ....................... Region 02 Mid-Atlantic .......................... Region 03 South Atlantic-Gulf .............. Region 04 Great Lakes ......................... Region 05 Ohio ..................................... Region 06 Tennessee ........................... Region 07 Upper Mississippi ................ Region 08 Lower Mississippi ................ Region 09 Souris-Red-Rainy ................ Region 10 Missouri ............................... Region 11 Arkansas-White-Red ........... Region 12 Texas-Gulf ........................... Region 13 Rio Grande .......................... Region 14 Upper Colorado ................... Region 15 Lower Colorado ................... Region 16 Great Basin ......................... Region 17 Pacific Northwest ................. Region 18 California ............................. Region 19 Alaska ................................. Region 20 Hawaii .................................
1,405 328
10 14
6 2 7
- - 5 5 -
- - - 3 -
1 517 810
- 25
1,482 379
10 14
6 (D) (D)
- -
55 5 -
- - - 3 -
(D) 517 819
- 36
25,854 16,393
170 70
900 (D)(D)
- -
3,335 600
-
- - -
4,770 -
(D)1,609
10,294 -
(D)
372 143
- 14
6 - -
- - 5 5 -
- - - - -
1 273
68 - -
431 143
- 14
6 - -
- -
55 5 -
- - - - -
(D)273 (D)
- -
15,105 6,241
- 70
900 - -
- -
3,335 600
-
- - - - -
(D) 1,365
(D) - -
1,004 182
- - - 2 -
- - - - -
- - - 3 -
- 244 742
- 13
1,004 230
- - -
(D)-
- - - - -
- - - 3 -
- 244 (D)
- (D)
6,892 10,146
- - -
(D)-
- - - - -
- - -
4,770 -
- 244 (D)
- 174
1 Rows may not add across. Operations using more than one source of water are only included in the total columns.
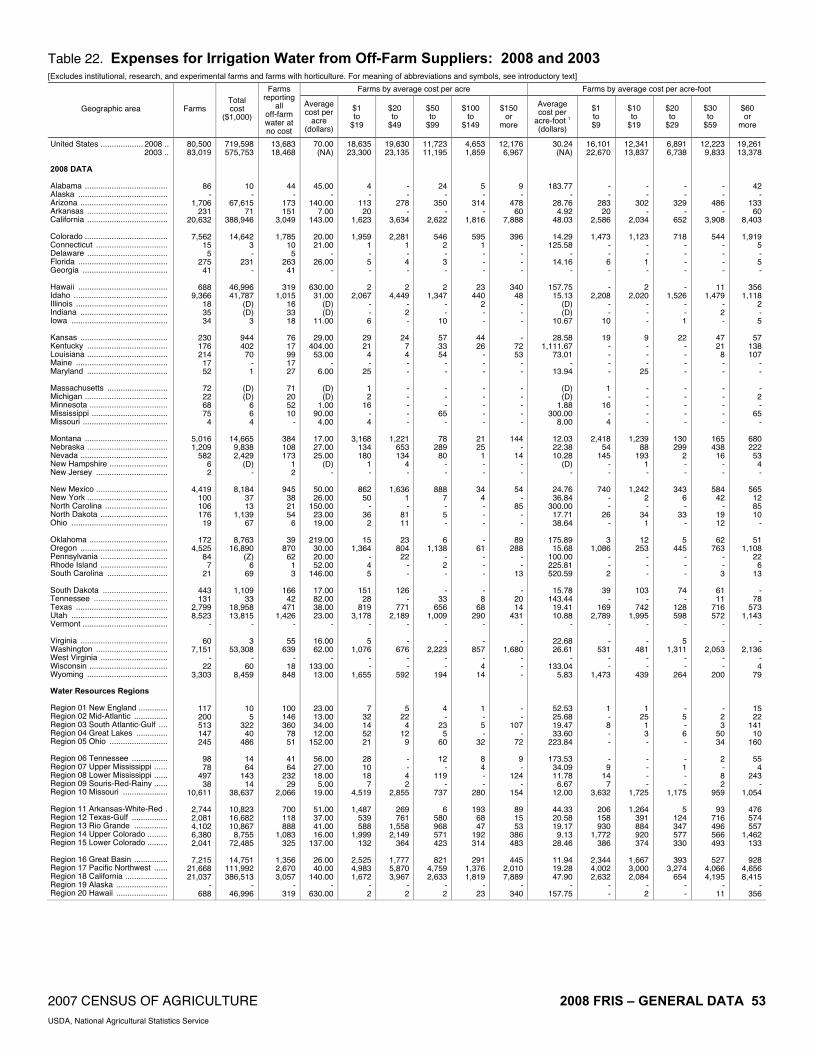
2007 CENSUS OF AGRICULTURE 2008 FRIS – GENERAL DATA 53 USDA, National Agricultural Statistics Service
Table 22. Expenses for Irrigation Water from Off-Farm Suppliers: 2008 and 2003 [Excludes institutional, research, and experimental farms and farms with horticulture. For meaning of abbreviations and symbols, see introductory text]
Farms by average cost per acre Farms by average cost per acre-foot
Geographic area Farms Total cost
($1,000)
Farms reporting
all off-farm water at no cost
Averagecost per
acre (dollars)
$1 to
$19
$20 to
$49
$50 to
$99
$100 to
$149
$150 or
more
Average cost per
acre-foot 1 (dollars)
$1 to $9
$10 to
$19
$20 to
$29
$30 to
$59
$60 or
more
United States ................... 2008 .. 2003 .. 2008 DATA Alabama ..................................... Alaska ........................................ Arizona ....................................... Arkansas .................................... California .................................... Colorado ..................................... Connecticut ................................ Delaware .................................... Florida ........................................ Georgia ...................................... Hawaii ........................................ Idaho .......................................... Illinois ......................................... Indiana ....................................... Iowa ........................................... Kansas ....................................... Kentucky .................................... Louisiana .................................... Maine ......................................... Maryland .................................... Massachusetts ........................... Michigan ..................................... Minnesota ................................... Mississippi .................................. Missouri ...................................... Montana ..................................... Nebraska .................................... Nevada ....................................... New Hampshire .......................... New Jersey ................................ New Mexico ................................ New York .................................... North Carolina ............................ North Dakota .............................. Ohio ........................................... Oklahoma ................................... Oregon ....................................... Pennsylvania .............................. Rhode Island .............................. South Carolina ........................... South Dakota ............................. Tennessee ................................. Texas ......................................... Utah ........................................... Vermont ...................................... Virginia ....................................... Washington ................................ West Virginia .............................. Wisconsin ................................... Wyoming .................................... Water Resources Regions Region 01 New England ............. Region 02 Mid-Atlantic ............... Region 03 South Atlantic-Gulf .... Region 04 Great Lakes .............. Region 05 Ohio .......................... Region 06 Tennessee ................ Region 07 Upper Mississippi ...... Region 08 Lower Mississippi ...... Region 09 Souris-Red-Rainy ...... Region 10 Missouri .................... Region 11 Arkansas-White-Red . Region 12 Texas-Gulf ................ Region 13 Rio Grande ............... Region 14 Upper Colorado ......... Region 15 Lower Colorado ......... Region 16 Great Basin ............... Region 17 Pacific Northwest ...... Region 18 California ................... Region 19 Alaska ....................... Region 20 Hawaii .......................
80,500 83,019
86 -
1,706 231
20,632
7,562 15
5 275
41
688 9,366
18 35 34
230 176 214
17 52
72 22 68 75
4
5,016 1,209
582 6 2
4,419
100 106 176
19
172 4,525
84 7
21
443 131
2,799 8,523
-
60 7,151
- 22
3,303
117 200 513 147 245
98 78
497 38
10,611
2,744 2,081 4,102 6,380 2,041
7,215
21,668 21,037
- 688
719,598 575,753
10 -
67,615 71
388,946
14,642 3 -
231 -
46,996 41,787
(D) (D)
3
944 402
70 - 1
(D) (D)
6 6 4
14,665
9,838 2,429
(D) -
8,184 37 13
1,139 67
8,763
16,890 (Z)
6 69
1,109
33 18,958 13,815
-
3 53,308
- 60
8,459
10 5
322 40
486
14 64
143 14
38,637
10,823 16,682 10,867
8,755 72,485
14,751
111,992 386,513
- 46,996
13,683 18,468
44 -
173 151
3,049
1,785 10
5 263
41
319 1,015
16 33 18
76 17 99 17 27
71 20 52 10
-
384 108 173
1 2
945
38 21 54
6
39 870
62 1 3
166
42 471
1,426 -
55 639
- 18
848
100 146 360
78 51
41 64
232 29
2,066
700 118 888
1,083 325
1,356 2,670 3,057
- 319
70.00 (NA)
45.00 -
140.00 7.00
143.00
20.00 21.00
- 26.00
-
630.00 31.00
(D)(D)
11.00
29.00 404.00
53.00 -
6.00
(D)(D)
1.00 90.00 4.00
17.00 27.00 25.00
(D)-
50.00 26.00
150.00 23.00 19.00
219.00
30.00 20.00 52.00
146.00
17.00 82.00 38.00 23.00
-
16.00 62.00
- 133.00
13.00
23.00 13.00 34.00 12.00
152.00
56.00 27.00 18.00 5.00
19.00
51.00 37.00 41.00 16.00
137.00
26.00 40.00
140.00 -
630.00
18,635 23,300
4 -
113 20
1,623
1,959 1 - 5 -
2 2,067
- - 6
29 21
4 -
25
1 2
16 - 4
3,168
134 180
1 -
862 50
- 36
2
15 1,364
- 4 5
151
28 819
3,178 -
5 1,076
- -
1,655
7 32 14 52 21
28 10 18
7 4,519
1,487
539 588
1,999 132
2,525 4,983 1,672
- 2
19,630 23,135
- -
278 -
3,634
2,281 1 - 4 -
2 4,449
- 2 -
24 7 4 - -
- - - - -
1,221 653 134
4 -
1,636 1 -
81 11
23
804 22
- -
126 -
771 2,189
-
- 676
- -
592
5 22
4 12
9
- - 4 2
2,855
269 761
1,558 2,149
364
1,777 5,870 3,967
- 2
11,723 11,195
24 -
350 -
2,622
546 2 - 3 -
2 1,347
- -
10
57 33 54
- -
- - -
65 -
78 289
80 - -
888 7 - 5 -
6 1,138
- 2 -
- 33
656 1,009
-
- 2,223
- -
194
4 -
23 5
60
12 -
119 -
737
6 580 968 571 423
821
4,759 2,633
- 2
4,653 1,859
5 -
314 -
1,816
595 1 - - -
23 440
2 - -
44 26
- - -
- - - - -
21 25
1 - -
34 4 - - -
- 61
- - -
- 8
68 290
-
- 857
- 4
14
1 - 5 -
32
8 4 - -
280
193 68 47
192 314
291
1,376 1,819
- 23
12,176 6,967
9 -
478 60
7,888
396 - - - -
340 48
- - -
- 72 53
- -
- - - - -
144 -
14 - -
54 -
85 - -
89 288
- -
13
- 20 14
431 -
- 1,680
- - -
- -
107 -
72
9 -
124 -
154
89 15 53
386 483
445
2,010 7,889
- 340
30.24 (NA)
183.77 -
28.76 4.92
48.03
14.29 125.58
- 14.16
-
157.75 15.13
(D) (D)
10.67
28.58 1,111.67
73.01 -
13.94
(D) (D)
1.88 300.00
8.00
12.03 22.38 10.28
(D) -
24.76 36.84
300.00 17.71 38.64
175.89
15.68 100.00 225.81 520.59
15.78
143.44 19.41 10.88
-
22.68 26.61
- 133.04
5.83
52.53 25.68 19.47 33.60
223.84
173.53 34.09 11.78 6.67
12.00
44.33 20.58 19.17 9.13
28.46
11.94 19.28 47.90
- 157.75
16,101 22,670
- -
283 20
2,586
1,473 - - 6 -
- 2,208
- -
10
19 - - - -
1 -
16 - 4
2,418
54 145
- -
740 - -
26 -
3 1,086
- - 2
39
- 169
2,789 -
- 531
- -
1,473
1 - 8 - -
- 9
14 7
3,632
206 158 930
1,772 386
2,344 4,002 2,632
- -
12,341 13,837
- -
302 -
2,034
1,123 - - 1 -
2 2,020
- - -
9 - - -
25
- - - - -
1,239 88
193 1 -
1,242 2 -
34 1
12
253 - - -
103 -
742 1,995
-
- 481
- -
439
1 25
1 3 -
- - - -
1,725
1,264 391 884 920 374
1,667 3,000 2,084
- 2
6,891 6,738
- -
329 -
652
718 - - - -
- 1,526
- - 1
22
- - - -
- - - - -
130 299
2 - -
343 6 -
33 -
5 445
- - -
74 -
128 598
-
5 1,311
- -
264
- 5 - 6 -
- 1 - -
1,175
5 124 347 577 330
393
3,274 654
- -
12,223 9,833
- -
486 -
3,908
544 - - - -
11 1,479
- 2 -
47 21
8 - -
- - - - -
165 438
16 - -
584 42
- 19 12
62
763 - - 3
61 11
716 572
-
- 2,053
- -
200
- 2 3
50 34
2 - 8 2
959
93 716 496 566 493
527
4,066 4,195
- 11
19,261 13,378
42 -
133 60
8,403
1,919 5 - 5 -
356 1,118
2 - 5
57
138 107
- -
- 2 -
65 -
680 222
53 4 -
565 12 85 10
-
51 1,108
22 6
13
- 78
573 1,143
-
- 2,136
- 4
79
15 22
141 10
160
55 4
243 -
1,054
476 574 557
1,462 133
928
4,656 8,415
- 356

54 2008 FRIS – GENERAL DATA 2007 CENSUS OF AGRICULTURE USDA, National Agricultural Statistics Service
Table 23. Expenditures for Irrigation Equipment, Facilities, Land Improvement, and Computer Technology: 2008 and 2003
[Excludes institutional, research, and experimental farms and farms with horticulture. For meaning of abbreviations and symbols, see introductory text]
Expenses (all types) in survey year
Farms with expenses of - Geographic area
Farms Acres irrigated
Expenses 1 ($1,000)
Average per farm (dollars) $1 to
$999 $1,000 to
$4,999 $5,000 to $14,999
$15,000 to $39,999
$40,000 to $74,999
$75,000 or more
United States .............................2008 .. 2003 .. 2008 DATA Alabama ............................................... Alaska ................................................... Arizona ................................................. Arkansas ............................................... California .............................................. Colorado ............................................... Connecticut ........................................... Delaware .............................................. Florida ................................................... Georgia ................................................. Hawaii ................................................... Idaho ..................................................... Illinois .................................................... Indiana .................................................. Iowa ...................................................... Kansas .................................................. Kentucky ............................................... Louisiana .............................................. Maine .................................................... Maryland ............................................... Massachusetts ...................................... Michigan ............................................... Minnesota ............................................. Mississippi ............................................ Missouri ................................................ Montana ................................................ Nebraska .............................................. Nevada ................................................. New Hampshire .................................... New Jersey ........................................... New Mexico .......................................... New York .............................................. North Carolina ...................................... North Dakota ........................................ Ohio ...................................................... Oklahoma ............................................. Oregon .................................................. Pennsylvania ........................................ Rhode Island ........................................ South Carolina ...................................... South Dakota ........................................ Tennessee ............................................ Texas .................................................... Utah ...................................................... Vermont ................................................ Virginia .................................................. Washington ........................................... West Virginia ........................................ Wisconsin ............................................. Wyoming ............................................... Water Resources Regions Region 01 New England ....................... Region 02 Mid-Atlantic .......................... Region 03 South Atlantic-Gulf .............. Region 04 Great Lakes ......................... Region 05 Ohio ..................................... Region 06 Tennessee ........................... Region 07 Upper Mississippi ................ Region 08 Lower Mississippi ................ Region 09 Souris-Red-Rainy ................ Region 10 Missouri ............................... Region 11 Arkansas-White-Red ........... Region 12 Texas-Gulf ........................... Region 13 Rio Grande .......................... Region 14 Upper Colorado ................... Region 15 Lower Colorado ................... Region 16 Great Basin ......................... Region 17 Pacific Northwest ................. Region 18 California ............................. Region 19 Alaska ................................. Region 20 Hawaii .................................
90,952 82,019
376 12
1,320 2,215
18,820
4,239 81
161 2,841 2,145
418
6,273 411 428 196
2,102
421 721
87 247
409
1,168 744 681 971
3,517 5,014
752 38
403
2,249 396 935 186 202
661
5,626 418
37 389
414 329
6,869 5,134
46
368 6,658
28 723
2,073
666 1,616 6,770 1,681
984
300 1,795 3,798
132 12,344
4,465 5,735 1,822 4,323 1,555
4,789
18,830 18,917
12 418
32,571,110 26,616,300
40,272 303
535,019 2,915,003 4,676,909
1,452,759
858 63,182
877,424 611,266
12,979
2,371,157 224,443 207,209 74,477
1,522,229
19,036 486,809 12,695 48,358
10,699
382,190 318,164
1,076,235 834,137
975,471
4,103,467 412,818
246 40,823
520,796 14,795 86,027
117,495 11,111
240,005 904,861
9,585 435
53,408
170,236 46,796
3,336,813 632,911
162
24,175 1,145,374
365 274,574 674,549
24,981 188,447
1,666,028 489,933 162,400
18,462
780,682 4,810,606
77,870 6,841,839
3,447,710 2,043,514
526,744 732,223 591,902
961,839
4,498,066 4,694,582
303 12,979
2,149,006 1,119,388
3,878 30
47,065 76,825
518,298
47,963 212
8,983 60,651 82,383
8,436
136,451 16,400 25,279
5,419
65,549 2,321
15,324 2,092 5,217
4,000
40,735 31,931 24,631 20,676
40,096
132,999 28,491
79 7,791
53,482
2,721 16,422
8,624 721
16,406 48,736
2,073 512
7,665
19,118 6,463
258,715 47,623
75
2,700 144,193
80 28,602 23,869
6,922 27,546
170,783 49,098 13,901
2,750
83,542 124,609
5,310 271,715
182,519 167,208 34,077 43,957 51,205
60,858
323,333 521,207
30 8,436
23,628 13,648
10,314 2,531
35,655 34,684 27,540
11,315
2,623 55,793 21,348 38,407
20,182 21,752 39,903 59,064 27,649
31,184
5,514 21,254 24,045 21,120
9,779
34,876 42,918 36,169 21,294
11,401 26,526 37,887
2,090 19,333
23,780
6,872 17,564 46,365
3,572
24,819 8,663 4,959
13,832 19,704
46,180 19,645 37,664
9,276 1,623
7,336
21,657 2,840
39,560 11,514
10,394 17,046 25,226 29,208 14,127
9,168
46,541 32,809 40,228 22,012
40,878 29,156 18,703 10,168 32,930
12,708 17,171 27,552
2,531 20,182
29,348 32,192
128 10
465 87
6,565
1,182 14 15
849 299
236
2,952 73 71 35
93
173 142
59 101
125 241 135
- 204
1,345
371 254
23 161
1,119
141 228
17 127
131
2,389 186
10 127
54
139 2,086 2,526
21
160 2,445
17 168 849
237 534
1,700 450 434
109 333 255
6 2,697
800
2,072 719
1,847 558
1,935 7,851 6,565
10 236
24,496 20,869
120 1
346 450
5,730
2,028 61 28
616 331
79
1,382 107
59 44
503 145 174
9 34
133 323 143 115 224
1,239 1,168
98 6
76
416 111 251
45 53
185
1,266 127
7 121
94 80
1,550 1,375
25
122 2,148
8 118 622
224 441
1,448 402 250
107 332 718
46 3,294
847
1,427 476
1,548 431
1,444 5,239 5,742
1 79
15,242 12,307
74 -
86 483
2,723
512 3
10 912 487
78
883 56 78 45
425
66 175
9 29
102 197
88 170 188
294
1,452 127
9 75
289 110 127
26 16
159
1,531 87 11 72
49 32
957 508
-
54 944
1 128 305
134 299
1,683 296 138
27
298 870
13 2,401
884 669 280 514 110
681
3,080 2,787
- 78
8,569 8,648
31 1
184 610
1,226
198 3
22 181 466
16
226 35 52 19
576
24 133
6 34
25
126 152 212 175
233 767 115
- 46
189
22 236
34 2
71
205 10
7 16
65 45
622 346
-
16 567
2 108 112
41 138 928 177
46
44 267 994
31 1,511
667 514 188 158 200
350
1,061 1,237
1 16
5,936 4,778
13 -
76 303 996
102
- 48 65
251
3 261
55 85 29
267
11 52
- 32
22
114 101
79 125
324 724
36 -
23
39 6
36 23
3
50 96
4 -
21
72 8
670 291
-
7 266
- 70 77
22 114 382 160
64
9 219 502
10 1,333
589 438
24 178
81
163 646 999
- 3
7,361 3,225
10 -
163 282
1,580
217 -
38 218 311
6569
85 83 24
238 2
45 4
17
2167 125 105
55
82 532 122
-22
197 6
57 41
1
65 139
42
32
80 25
984 88
-
9288
-131 108
890
629 196
52
4346 459
26 1,108
678 615 135
78 175
216 953
1,587 -6
See footnote(s) at end of table. --continued

2007 CENSUS OF AGRICULTURE 2008 FRIS – GENERAL DATA 55 USDA, National Agricultural Statistics Service
Table 23. Expenditures for Irrigation Equipment, Facilities, Land Improvement, and Computer Technology: 2008 and 2003 - Con.
[Excludes institutional, research, and experimental farms and farms with horticulture. For meaning of abbreviations and symbols, see introductory text]
Expenses (all types) in survey year - con.
Principal purpose of expenditures Primary source of funding assistance (see text) Geographic area
Replacement (dollars)
Water conservation
(dollars)
New expansion (dollars)
EQIP (farms)
Other USDA programs
(farms)
Non-USDA programs (farms)
No funding assistance
(farms)
United States ............................. 2008 .. 2003 .. 2008 DATA Alabama ............................................... Alaska .................................................. Arizona ................................................. Arkansas .............................................. California .............................................. Colorado ............................................... Connecticut .......................................... Delaware .............................................. Florida .................................................. Georgia ................................................ Hawaii .................................................. Idaho .................................................... Illinois ................................................... Indiana ................................................. Iowa ..................................................... Kansas ................................................. Kentucky .............................................. Louisiana .............................................. Maine ................................................... Maryland .............................................. Massachusetts ..................................... Michigan ............................................... Minnesota ............................................. Mississippi ............................................ Missouri ................................................ Montana ............................................... Nebraska .............................................. Nevada ................................................. New Hampshire .................................... New Jersey .......................................... New Mexico .......................................... New York .............................................. North Carolina ...................................... North Dakota ........................................ Ohio ..................................................... Oklahoma ............................................. Oregon ................................................. Pennsylvania ........................................ Rhode Island ........................................ South Carolina ..................................... South Dakota ....................................... Tennessee ........................................... Texas ................................................... Utah ..................................................... Vermont ................................................ Virginia ................................................. Washington .......................................... West Virginia ........................................ Wisconsin ............................................. Wyoming .............................................. Water Resources Regions Region 01 New England ....................... Region 02 Mid-Atlantic ......................... Region 03 South Atlantic-Gulf .............. Region 04 Great Lakes ........................ Region 05 Ohio .................................... Region 06 Tennessee .......................... Region 07 Upper Mississippi ................ Region 08 Lower Mississippi ................ Region 09 Souris-Red-Rainy ................ Region 10 Missouri .............................. Region 11 Arkansas-White-Red ........... Region 12 Texas-Gulf .......................... Region 13 Rio Grande ......................... Region 14 Upper Colorado ................... Region 15 Lower Colorado ................... Region 16 Great Basin ......................... Region 17 Pacific Northwest ................ Region 18 California ............................. Region 19 Alaska ................................. Region 20 Hawaii .................................
1,077,191,890 467,423,307
1,421,748 30,375
17,776,708 36,927,246
275,460,914
27,961,966 146,077
3,470,331 39,105,128 24,716,479
7,657,376
93,461,870 6,868,672 4,813,457 2,290,181
50,402,997
610,993 7,087,056
(D) 2,720,595
1,865,556
12,114,273 12,610,599 9,141,213 7,978,380
13,626,129 67,800,632 11,743,138
23,621 3,957,472
27,776,259
999,695 7,447,204 3,247,588
(D)
8,913,100 22,834,102
905,058 54,400
2,362,171
8,192,266 1,279,947
131,274,082 20,184,141
(D)
1,368,494 73,313,890
(D) 15,437,648 6,836,071
2,489,596 12,625,624 74,681,297 15,758,041 5,228,496
1,173,511
31,682,897 55,449,282 2,232,975
131,062,812
112,333,087 76,839,823 18,026,093 21,369,413 19,249,738
28,965,906
184,328,804 276,006,744
30,375 7,657,376
323,082,578 171,233,240
80,881 -
16,958,874 17,478,970 64,192,643
7,166,561
- 28,000
7,326,324 5,797,042
23,600
19,077,565 505,600 648,100 478,700
1,435,560
48,500 2,805,163
(D)209,028
1,401,987 1,119,012 1,452,427 3,168,291 1,061,772
14,307,186 30,328,597 6,182,035
21,290 325,882
9,498,561
285,714 1,298,500 1,295,832
(D)
3,190,792 12,466,815
292,785 18,000
231,964
359,470 66,300
36,165,837 20,869,614
(D)
320,000 28,253,511
(D)775,188
3,993,565
1,505,277 1,278,923
14,725,230 1,376,838
116,200
45,081 3,065,651
21,501,163 727,896
51,765,591
19,519,609 28,077,952 6,009,033
11,558,440 17,625,287
18,110,085 60,661,653 65,389,069
- 23,600
748,731,627 480,731,102
2,375,492 -
12,329,350 22,419,080
178,644,295
12,834,716 66,350
5,484,270 14,219,328 51,869,001
755,007
23,911,566 9,025,706
19,817,647 2,650,398
13,710,898 1,661,916 5,431,829 1,649,997 2,286,954
732,150
27,501,519 17,867,670 12,321,585 11,636,324
12,162,950 34,870,059 10,565,844
34,500 3,507,785
16,207,059 1,435,860 7,676,758 4,080,424
178,270
4,301,781 13,435,024
874,994 439,400
5,070,720
10,566,617 5,117,111
91,275,368 6,569,160
31,190
1,011,228 42,625,155
62,984 12,388,803 13,039,535
2,927,297 13,641,088 81,376,391 31,963,229 8,556,231
1,531,845
48,793,067 47,658,235 2,349,280
88,886,264
50,666,258 62,289,965 10,042,355 11,028,804 14,330,350
13,782,321 78,342,345
179,811,295 -
755,007
4,240 1,806
93 -
102 160 285
266 -
43 144
96
294
-4
10
37 7
94 -
60
72 10 50 71 62
162 129 123
-90
162 3
17 36
-
33 112
62 25 88
38 11
524 203
12
3450
-17
178
101 267 425
14 12
15 71
334 18
700
328 363 175
41 120
308 642 304
-2
1,878 738
41 -
36 43 50
49 10 19 74 79
-
17 2 7
10
22 20 26
- 18
17 25 27
9 50
25
212 13
7 9
13
4 52
- -
15 112
10 -
49
11 -
57 396
-
2 147
1 1
91
34 57
291 29 29
6
42 108
- 375
40 45
7 401
41
58 267
48 - -
1,343 608
30 - 3
61 91
41
- 8 3
41
- 38 15
6 4
6
34 14
4 6
12 25
8 76 18
10
103 - -
12
12 -
18 3 -
5 92
- 5 7
11 31
123 - -
- 266
- 51 50
21 26 91 26 31
33 73
180 2
183
80 58
9 40
3
- 396
91 - -
111,317 100,533
350 12
1,686 3,427
23,118
5,532 81
175 3,103 2,951
489
7,661 534 610 224
2,596
436 871
93 209
497
1,563 940 962
1,277
3,843 6,280
971 38
370
2,649 479
1,359 197 218
803
5,915 440
34 427
489 379
9,574 6,391
40
445 7,178
31 965
2,405
753 1,716 8,282 2,210 1,095
338
2,324 5,487
143 14,703
5,813 7,934 2,115 5,732 1,931
6,184
20,842 23,214
12 489
See footnote(s) at end of table. --continued

56 2008 FRIS – GENERAL DATA 2007 CENSUS OF AGRICULTURE USDA, National Agricultural Statistics Service
Table 23. Expenditures for Irrigation Equipment, Facilities, Land Improvement, and Computer Technology: 2008 and 2003 - Con.
[Excludes institutional, research, and experimental farms and farms with horticulture. For meaning of abbreviations and symbols, see introductory text]
Purchase of equipment and machinery in survey year
Farms with expenses of - Geographic area
Farms Acres irrigated
Expenses 1 ($1,000)
Average per farm (dollars) $1 to
$999 $1,000 to $9,999
$10,000 to $29,999
$30,000 to $74,999
$75,000 or more
United States .............................2008 .. 2003 .. 2008 DATA Alabama ............................................... Alaska ................................................... Arizona ................................................. Arkansas ............................................... California .............................................. Colorado ............................................... Connecticut ........................................... Delaware .............................................. Florida ................................................... Georgia ................................................. Hawaii ................................................... Idaho ..................................................... Illinois .................................................... Indiana .................................................. Iowa ...................................................... Kansas .................................................. Kentucky ............................................... Louisiana .............................................. Maine .................................................... Maryland ............................................... Massachusetts ...................................... Michigan ............................................... Minnesota ............................................. Mississippi ............................................ Missouri ................................................ Montana ................................................ Nebraska .............................................. Nevada ................................................. New Hampshire .................................... New Jersey ........................................... New Mexico .......................................... New York .............................................. North Carolina ...................................... North Dakota ........................................ Ohio ...................................................... Oklahoma ............................................. Oregon .................................................. Pennsylvania ........................................ Rhode Island ........................................ South Carolina ...................................... South Dakota ........................................ Tennessee ............................................ Texas .................................................... Utah ...................................................... Vermont ................................................ Virginia .................................................. Washington ........................................... West Virginia ........................................ Wisconsin ............................................. Wyoming ............................................... Water Resources Regions Region 01 New England ....................... Region 02 Mid-Atlantic .......................... Region 03 South Atlantic-Gulf .............. Region 04 Great Lakes ......................... Region 05 Ohio ..................................... Region 06 Tennessee ........................... Region 07 Upper Mississippi ................ Region 08 Lower Mississippi ................ Region 09 Souris-Red-Rainy ................ Region 10 Missouri ............................... Region 11 Arkansas-White-Red ........... Region 12 Texas-Gulf ........................... Region 13 Rio Grande .......................... Region 14 Upper Colorado ................... Region 15 Lower Colorado ................... Region 16 Great Basin ......................... Region 17 Pacific Northwest ................. Region 18 California ............................. Region 19 Alaska ................................. Region 20 Hawaii .................................
81,836 71,422
330 12
730 1,791
17,448
3,686 81
150 2,488 1,869
416
5,730 387 414 190
1,973
377 628
83 237
400
1,125 712 574 847
3,014 4,561
569 38
396
1,722 391 902 163 197
626
4,924 411
27 373
377 303
6,349 4,770
46
327 6,256
27 662
1,727
643 1,580 6,003 1,624
927
288 1,656 3,210
129 10,768
4,045 5,307 1,388 4,090
877
4,278 17,047 17,548
12 416
29,280,583 23,442,100
35,205 303
423,241 2,484,338 4,100,782
1,224,571
858 61,494
833,826 565,253
12,937
2,281,460 217,142 200,284 72,582
1,405,678
18,270 420,081 12,569 44,069
10,015
370,447 309,758 894,412 746,975
816,511
3,818,239 340,314
246 40,657
408,589 14,603 83,407
108,507 10,878
228,989 802,780
9,492 420
48,082
163,414 37,937
3,128,691 559,870
162
23,847 1,085,597
360 261,921 540,520
24,156 182,071
1,561,560 473,408 160,396
17,982
747,654 4,125,170
76,598 6,243,549
3,170,063 1,902,485
408,622 542,240 467,774
817,865
4,221,495 4,124,255
303 12,937
1,491,737 812,199
3,044 30
28,804 36,336
294,543
39,797 201
8,167 40,124 46,394
7,398
115,221 14,416 21,836
4,726
55,686 1,763 8,132
525 4,414
2,497
33,096 26,139 11,814 15,096
34,466
109,717 18,535
53 6,659
36,959
2,232 11,848
7,389 614
14,124 41,691
1,718 334
5,587
15,452 3,730
176,562 30,249
66
2,222 112,195
57 19,641 19,438
3,638 23,806
106,612 40,153 12,393
2,166
65,416 63,477
4,762 228,256
134,881 111,137 25,132 28,739 31,851
40,605
263,608 297,678
30 7,398
18,228 11,372
9,226 2,531
39,458 20,288 16,881
10,797
2,482 54,446 16,127 24,823
17,783 20,108 37,251 52,744 24,871
28,224
4,675 12,949
6,327 18,625
6,243
29,418 36,711 20,581 17,823
11,435 24,055 32,575
1,398 16,817
21,463
5,708 13,135 45,331
3,118
22,563 8,467 4,181
12,381 14,977
40,987 12,309 27,809
6,342 1,426
6,794
17,934 2,109
29,670 11,255
5,658 15,067 17,760 24,725 13,368
7,522
39,502 19,775 36,914 21,198
33,345 20,942 18,107
7,027 36,318
9,492
15,464 16,964
2,531 17,783
29,252 30,795
132 10
233 151
7,462
1,361 14 15
849 299
236
2,470 73 66 35
142 171 197
59 101
125 244 133
- 166
1,199
396 166
23 163
901 172 260
12 136
131
2,088 210
5 125
54
142 2,365 2,692
21
160 2,203
16 167 701
232 589
1,734 453 439
112 328 316
8 2,146
816
2,351 589
2,343 326
1,948 6,814 7,462
10 236
31,081 24,051
139 1
248 637
6,851
1,774 62 27
1,069 542
149
2,172 127 114
71
767 155 203
12 37
224 485 193 261 305
1,211 1,878
137 15
114
449 143 340
47 55
287
2,252 164
17 175
102 101
1,699 1,640
25
119 2,571
8 184 723
338 566
2,241 619 301
127 459
1,169 46
4,372
1,207 1,480
471 1,505
274
1,741 7,102 6,913
1 149
9,351 8,568
36 1
82 712
1,161
171 5
19 319 581
23
204 42 54 28
452
38 165
8 43
33 95
163 206 228
144
1,007 127
- 72
160
62 208
40 2
102 334
29 3
22
66 37
805 175
-
29 813
3 124 118
49 206
1,167 165
64
37 324
1,193 33
1,614
749 578 182
62 98
277
1,343 1,186
1 23
6,801 5,927
13 -
53 198
1,066
227 -
54 78
265
4 336
72 112
35
400 12 47
3 43
17
149 118
72 115
381 857
86 -
29
42 8
57 26
3
44 125
4 -
27
91 7
737 194
-
12 408
- 97 77
20 140 436 216
78
8 270 375
17 1,714
756 420
39 102
59
178 896
1,073 - 4
5,351 2,081
10 -
114 93
908
153 -
35 173 182
4
548 73 68 21
212
1 16
1 13
1
152 105
35 33
79
423 53
- 18
170
6 37 38
1
62 125
4 2
24
64 16
743 69
-
7 261
- 90
108
4 79
425 171
45
4 275 157
25 922
517 478 107
78 120
134 892 914
- 4
See footnote(s) at end of table. --continued

2007 CENSUS OF AGRICULTURE 2008 FRIS – GENERAL DATA 57 USDA, National Agricultural Statistics Service
Table 23. Expenditures for Irrigation Equipment, Facilities, Land Improvement, and Computer Technology: 2008 and 2003 - Con.
[Excludes institutional, research, and experimental farms and farms with horticulture. For meaning of abbreviations and symbols, see introductory text]
Purchase of equipment and machinery in survey year - con.
Principal purpose of expenditures Primary source of funding assistance (see text) Geographic area
Replacement (farms)
Water conservation
(farms)
New expansion
(farms)
EQIP (farms)
Other USDA programs
(farms)
Non-USDA programs (farms)
No funding assistance
(farms)
United States ............................. 2008 .. 2003 .. 2008 DATA Alabama ............................................... Alaska .................................................. Arizona ................................................. Arkansas .............................................. California .............................................. Colorado ............................................... Connecticut .......................................... Delaware .............................................. Florida .................................................. Georgia ................................................ Hawaii .................................................. Idaho .................................................... Illinois ................................................... Indiana ................................................. Iowa ..................................................... Kansas ................................................. Kentucky .............................................. Louisiana .............................................. Maine ................................................... Maryland .............................................. Massachusetts ..................................... Michigan ............................................... Minnesota ............................................. Mississippi ............................................ Missouri ................................................ Montana ............................................... Nebraska .............................................. Nevada ................................................. New Hampshire .................................... New Jersey .......................................... New Mexico .......................................... New York .............................................. North Carolina ...................................... North Dakota ........................................ Ohio ..................................................... Oklahoma ............................................. Oregon ................................................. Pennsylvania ........................................ Rhode Island ........................................ South Carolina ..................................... South Dakota ....................................... Tennessee ........................................... Texas ................................................... Utah ..................................................... Vermont ................................................ Virginia ................................................. Washington .......................................... West Virginia ........................................ Wisconsin ............................................. Wyoming .............................................. Water Resources Regions Region 01 New England ....................... Region 02 Mid-Atlantic ......................... Region 03 South Atlantic-Gulf .............. Region 04 Great Lakes ........................ Region 05 Ohio .................................... Region 06 Tennessee .......................... Region 07 Upper Mississippi ................ Region 08 Lower Mississippi ................ Region 09 Souris-Red-Rainy ................ Region 10 Missouri .............................. Region 11 Arkansas-White-Red ........... Region 12 Texas-Gulf .......................... Region 13 Rio Grande ......................... Region 14 Upper Colorado ................... Region 15 Lower Colorado ................... Region 16 Great Basin ......................... Region 17 Pacific Northwest ................ Region 18 California ............................. Region 19 Alaska ................................. Region 20 Hawaii .................................
63,282 51,507
238 12
583 1,373
14,714
2,461 48 83
2,380 1,126
359
4,784 280 244 135
1,768
251 505
40 187
277 606 488 435 619
2,329 3,267
416 22
289
945 237 660 100 139
477
3,910 341
14 202
249 158
4,990 3,597
21
198 4,943
23 462
1,297
405 1,140 4,612
909 633
174
1,124 2,419
84 7,818
2,933 4,235
938 3,038
698
3,200 13,764 14,787
12 359
5,595 4,102
9 -
88 82
951
218 - 1
28 57
-
431 11
3 12
45
- 11
- 6
71 40 80 28 43
273 724 116
4 8
154
21 51 28
2
39 280
5 4
10
15 2
329 644
4
5 441
1 26
194
83 41
148 50
-
7 124 129
21 1,347
297 234
89 234 118
547
1,153 973
- -
12,959 15,813
83 -
59 336
1,783
1,007 33 66 80
686
57 515
96 167
43
160 126 112
43 44
52
479 144 111 185
412 570
37 12 99
623 133 191
35 56
110 734
65 9
161
113 143
1,030 529
21
124 872
3 174 236
155 399
1,243 665 294
107 408 662
24 1,603
815 838 361 818
61
531 2,130 1,788
- 57
3,109 1,197
59 -
71 69
212
180 -
37 44 96
2
82 - 3
10
37 -
28 -
50
44 6
48 25 39
129 129
45 -
77
146 3 1
29 -
28 110
35 11 73
34 10
396 111
8
3 425
- 2
162
59 207 264
9 5
9
54 125
18 592
291 234 144
38 78
148 600 232
- 2
1,226 359
26 -
15 9
41
42 10 10 72 28
-
12 2 7
10
22 20 17
- 9
5
25 25
- 28
-
212 6 4 3
13
- 36
- -
13 106
8 - 4
11
- 42
123 -
2 122
1 1
84
19 31
160 25 29
6
28 50
- 343
28 35
7 145
15
28 234
43 - -
978 371
12 - 1
36 48
38
- 5 1
26
- 38
9 4 2
1
27 14
- 5
12 21
6 34 10
4
103 - - 9
4 - 6 3 -
5 63
- - 5
6
27 42
- -
- 261
- 41 49
12 19 44 22 22
31 56
103 1
167
36 16
- 38
1
- 362
48 - -
76,523 69,495
233 12
643 1,677
17,147
3,426 71 98
2,371 1,719
414 5,598
376 400 168
1,913 330 569
83 173
339 1,073
633 515 770
2,881 4,117
518 34
307
1,559 388 859 131 197
580 4,645
368 16
291
326 266
5,869 4,536
38
322 5,448
26 618
1,432
553 1,323 5,535 1,568
871
242 1,518 2,932
110 9,666
3,690 5,022 1,237 3,869
783
4,102 15,851 17,225
12 414
See footnote(s) at end of table. --continued

58 2008 FRIS – GENERAL DATA 2007 CENSUS OF AGRICULTURE USDA, National Agricultural Statistics Service
Table 23. Expenditures for Irrigation Equipment, Facilities, Land Improvement, and Computer Technology: 2008 and 2003 - Con.
[Excludes institutional, research, and experimental farms and farms with horticulture. For meaning of abbreviations and symbols, see introductory text]
New well construction or deepening of wells in survey year
Farms with expenses of - Geographic area
Farms Acres irrigated
Expenses 1 ($1,000)
Average per farm (dollars) $1 to
$999 $1,000 to $9,999
$10,000 to $29,999
$30,000 to $74,999
$75,000 or more
United States .............................2008 .. 2003 .. 2008 DATA Alabama ............................................... Alaska ................................................... Arizona ................................................. Arkansas ............................................... California .............................................. Colorado ............................................... Connecticut ........................................... Delaware .............................................. Florida ................................................... Georgia ................................................. Hawaii ................................................... Idaho ..................................................... Illinois .................................................... Indiana .................................................. Iowa ...................................................... Kansas .................................................. Kentucky ............................................... Louisiana .............................................. Maine .................................................... Maryland ............................................... Massachusetts ...................................... Michigan ............................................... Minnesota ............................................. Mississippi ............................................ Missouri ................................................ Montana ................................................ Nebraska .............................................. Nevada ................................................. New Hampshire .................................... New Jersey ........................................... New Mexico .......................................... New York .............................................. North Carolina ...................................... North Dakota ........................................ Ohio ...................................................... Oklahoma ............................................. Oregon .................................................. Pennsylvania ........................................ Rhode Island ........................................ South Carolina ...................................... South Dakota ........................................ Tennessee ............................................ Texas .................................................... Utah ...................................................... Vermont ................................................ Virginia .................................................. Washington ........................................... West Virginia ........................................ Wisconsin ............................................. Wyoming ............................................... Water Resources Regions Region 01 New England ....................... Region 02 Mid-Atlantic .......................... Region 03 South Atlantic-Gulf .............. Region 04 Great Lakes ......................... Region 05 Ohio ..................................... Region 06 Tennessee ........................... Region 07 Upper Mississippi ................ Region 08 Lower Mississippi ................ Region 09 Souris-Red-Rainy ................ Region 10 Missouri ............................... Region 11 Arkansas-White-Red ........... Region 12 Texas-Gulf ........................... Region 13 Rio Grande .......................... Region 14 Upper Colorado ................... Region 15 Lower Colorado ................... Region 16 Great Basin ......................... Region 17 Pacific Northwest ................. Region 18 California ............................. Region 19 Alaska ................................. Region 20 Hawaii .................................
9,277 8,788
51 -
405 889
2,471
220 10 54 92
452
1 155
73 114
41
192 19 85
2 18
7
162 180 240 212
112 621
87 -
21
236 37
168 28
4
88 185
39 7
90
76 51
905 172
-
1 52
2 82 68
26 172 846 206
90
38 340
1,258 11
994
729 706 154 192 405
192 443
2,474 - 1
8,975,579 5,775,725
3,495 -
122,244 1,404,029 1,499,081
204,960
20 21,479
282,066 188,682
(D)
511,109 64,596 74,630 23,377
247,328
4,788 76,363
(D) 7,906
49
166,060 137,057 479,012 350,917
30,525
912,802 128,550
- 6,325
196,450
995 18,105 21,905
380
35,107 119,495
934 75
22,060
39,214 19,327
1,198,549 69,326
-
(D) 161,241
(D) 72,200 40,910
(D) 38,429
513,612 190,734 49,307
(D)
272,008 2,107,558
20,362 1,214,108
1,082,446
695,256 141,027 23,775
122,244
202,340 791,135
1,497,291 -
(D)
336,247 150,788
289 -
6,157 15,514
145,614
2,642 11
645 3,268
18,334
(D)9,189 1,433 2,089
637
6,747 240
1,512 (D)
592
(D)4,446 5,035 4,924 2,223
1,102
14,549 5,944
- 313
7,543
288 797 707 (D)
1,177 3,569
252 88
1,253
2,151 2,319
38,884 5,770
-
(D)13,727
(D)1,717 1,706
799 2,161
23,939 5,013
906
357 8,865
23,748 (D)
22,991
29,620 21,100
4,240 4,757 6,157
8,692
26,939 145,629
- (D)
36,245 17,158
5,662 -
15,203 17,451 58,929
12,007
1,135 11,941 35,524 40,562
(D)
59,282 19,635 18,327 15,545
35,140 12,632 17,793
(D)32,908
(D)
27,446 27,971 20,515 10,485
9,844
23,428 68,323
- 14,905
31,963
7,770 4,742
25,260 (D)
13,373 19,291
6,464 12,571 13,925
28,298 45,479 42,965 33,549
-
(D)263,977
(D)20,944 25,090
30,733 12,563 28,296 24,333 10,066
9,385
26,073 18,877
(D)23,130
40,631 29,887 27,531 24,773 15,203
45,270 60,811 58,864
- (D)
279 197
12 -
109 - -
1 - - - -
- - - 4 -
- - - - -
- - - 1 -
24 - - - -
- -
85 - -
6 - - - 2
- 2 -
32 -
- - - 1 -
- -
99 2 2
2 1 1 -
24
6 - - 1
109
32 - - - -
3,003 4,046
34 -
113 267 966
142
10 32 18 77
-
38 17 52
8
76 1
42 - 2
-
33 22 53
118
25 198
7 - 4
109
34 63
7 -
46 24 35
2 61
11 20
172 17
-
- 1 -
31 15
12 107 248
50 45
16 67
389 4
323
197 199
84 96
113
24 60
969 - -
2,796 3,100
1 -
146 420 408
39
- 16 42
174
1 20 42 44 27
45 18 21
- 9
-
90 99
131 88
59
192 25
- 16
39
2 19 15
4
28 101
4 5
11
50 10
240 12
-
- 10
2 34 37
5 49
244 113
39
19 178 598
3 330
147 253
38 2
146
37 186 408
- 1
2,135 1,101
4 -
25 196 562
37
- 6 8
165
- 23 12 10
6
32 -
21 - 5
7
34 51 51
4
- 202
24 - 1
56
1 1 5 -
5 54
- -
12
13 8
346 102
-
1 16
- 13 16
7 14
191 35
4
1 79
246 3
265
253 193
13 93 25
58 93
562 - -
1,064 344
- -
12 6
535
1 - -
24 36
-
74 2 4 -
39 - 1 2 2
- 5 8 4 2
4
29 31
- -
32 - - 1 -
3 6 - - 4
2
11 147
9 -
- 25
- 3 -
2 2
64 6 -
- 15 24
1 52
126
61 19
- 12
41
104 535
- -
See footnote(s) at end of table. --continued

2007 CENSUS OF AGRICULTURE 2008 FRIS – GENERAL DATA 59 USDA, National Agricultural Statistics Service
Table 23. Expenditures for Irrigation Equipment, Facilities, Land Improvement, and Computer Technology: 2008 and 2003 - Con.
[Excludes institutional, research, and experimental farms and farms with horticulture. For meaning of abbreviations and symbols, see introductory text]
New well construction or deepening of wells in survey year - con.
Principal purpose of expenditures Primary source of funding assistance (see text) Geographic area
Replacement (farms)
Water conservation
(farms)
New expansion
(farms)
EQIP (farms)
Other USDA programs
(farms)
Non-USDA programs (farms)
No funding assistance
(farms)
United States ............................. 2008 .. 2003 .. 2008 DATA Alabama ............................................... Alaska .................................................. Arizona ................................................. Arkansas .............................................. California .............................................. Colorado ............................................... Connecticut .......................................... Delaware .............................................. Florida .................................................. Georgia ................................................ Hawaii .................................................. Idaho .................................................... Illinois ................................................... Indiana ................................................. Iowa ..................................................... Kansas ................................................. Kentucky .............................................. Louisiana .............................................. Maine ................................................... Maryland .............................................. Massachusetts ..................................... Michigan ............................................... Minnesota ............................................. Mississippi ............................................ Missouri ................................................ Montana ............................................... Nebraska .............................................. Nevada ................................................. New Hampshire .................................... New Jersey .......................................... New Mexico .......................................... New York .............................................. North Carolina ...................................... North Dakota ........................................ Ohio ..................................................... Oklahoma ............................................. Oregon ................................................. Pennsylvania ........................................ Rhode Island ........................................ South Carolina ..................................... South Dakota ....................................... Tennessee ........................................... Texas ................................................... Utah ..................................................... Vermont ................................................ Virginia ................................................. Washington .......................................... West Virginia ........................................ Wisconsin ............................................. Wyoming .............................................. Water Resources Regions Region 01 New England ....................... Region 02 Mid-Atlantic ......................... Region 03 South Atlantic-Gulf .............. Region 04 Great Lakes ........................ Region 05 Ohio .................................... Region 06 Tennessee .......................... Region 07 Upper Mississippi ................ Region 08 Lower Mississippi ................ Region 09 Souris-Red-Rainy ................ Region 10 Missouri .............................. Region 11 Arkansas-White-Red ........... Region 12 Texas-Gulf .......................... Region 13 Rio Grande ......................... Region 14 Upper Colorado ................... Region 15 Lower Colorado ................... Region 16 Great Basin ......................... Region 17 Pacific Northwest ................ Region 18 California ............................. Region 19 Alaska ................................. Region 20 Hawaii .................................
4,880 3,640
15 -
146 562
1,593
206 -
14 48 81
-
108 19 15
5
138 1
50 - 7
-
47 61
101 58
108 345
37 -
10
110 5
114 20
2
27 48
1 - 7
35 12
418 169
-
- 44
- 35 58
- 37
265 58 13
9
105 704
6 613
349 325
97 167 146
138 252
1,596 - -
- (X)
- - - - -
- - - - -
- - - - -
- - - - -
- - - - -
- - - - -
- - - - -
- - - - -
- - - - -
- - - - -
- - - - -
- - - - -
- - - - -
- - - - -
4,397 4,810
36 -
259 327 878
14 10 40 44
371
1 47 54 99 36
54 18 35
2 11
7
115 119 139 154
4
276 50
- 11
126
32 54
8 2
61
137 38
7 83
41 39
487 3 -
1 8 2
47 10
26 135 581 148
77
29 235 554
5 381
380 381
57 25
259
54 191 878
- 1
110 73
12 - 2 6 -
14 - 2 - -
- 1 - - -
- -
14 - 5
- 1 2 5 -
- - - - 4
2 - - 2 -
3 -
25 5 -
- - - - -
- 3 - - 2
5 36 11
1 -
1 2
25 - 5
3 -
15 - 2
- 4 - - -
126 17
11 - - - 5
- - 3 - -
- - - - -
- - 2 - 3
- - 2 3 8
4 - - - 3
- -
16 - -
- - - -
45
- -
10 - -
- 11
- - -
- 9
74 - -
- 2 9 - 4
2
10 - - -
- 11
5 - -
184 35
4 - 1
11 38
- - 3 - 3
- - 4 2 2
- - - 2 -
- 4 -
23 1
- - - - 3
- -
12 - -
- 13
- - 2
5 2
44 - -
- - - 5 -
2 6
19 4 -
2 11 36
- 8
26 18
- - 1
-
13 38
- -
8,857 8,663
24 -
402 872
2,428
206 10 46 92
449
1154
69 112
39
192 19 69
-10
7157 176 209 203
108 621
87 -
11
234 37
140 26
4
85 172
14 2
43
71 49
851 172
-
138
277 66
19 121 742 201
90
35 325
1,188 11
977
698 678 139 192 402
192 415
2,431 -1
See footnote(s) at end of table. --continued

60 2008 FRIS – GENERAL DATA 2007 CENSUS OF AGRICULTURE USDA, National Agricultural Statistics Service
Table 23. Expenditures for Irrigation Equipment, Facilities, Land Improvement, and Computer Technology: 2008 and 2003 - Con.
[Excludes institutional, research, and experimental farms and farms with horticulture. For meaning of abbreviations and symbols, see introductory text]
Construction of permanent storage and distribution systems in survey year
Farms with expenses of - Geographic area
Farms Acres irrigated
Expenses 1 ($1,000)
Average per farm (dollars) $1 to
$999 $1,000 to $9,999
$10,000 to $29,999
$30,000 to $74,999
$75,000 or more
United States .............................2008 .. 2003 .. 2008 DATA Alabama ............................................... Alaska ................................................... Arizona ................................................. Arkansas ............................................... California .............................................. Colorado ............................................... Connecticut ........................................... Delaware .............................................. Florida ................................................... Georgia ................................................. Hawaii ................................................... Idaho ..................................................... Illinois .................................................... Indiana .................................................. Iowa ...................................................... Kansas .................................................. Kentucky ............................................... Louisiana .............................................. Maine .................................................... Maryland ............................................... Massachusetts ...................................... Michigan ............................................... Minnesota ............................................. Mississippi ............................................ Missouri ................................................ Montana ................................................ Nebraska .............................................. Nevada ................................................. New Hampshire .................................... New Jersey ........................................... New Mexico .......................................... New York .............................................. North Carolina ...................................... North Dakota ........................................ Ohio ...................................................... Oklahoma ............................................. Oregon .................................................. Pennsylvania ........................................ Rhode Island ........................................ South Carolina ...................................... South Dakota ........................................ Tennessee ............................................ Texas .................................................... Utah ...................................................... Vermont ................................................ Virginia .................................................. Washington ........................................... West Virginia ........................................ Wisconsin ............................................. Wyoming ............................................... Water Resources Regions Region 01 New England ....................... Region 02 Mid-Atlantic .......................... Region 03 South Atlantic-Gulf .............. Region 04 Great Lakes ......................... Region 05 Ohio ..................................... Region 06 Tennessee ........................... Region 07 Upper Mississippi ................ Region 08 Lower Mississippi ................ Region 09 Souris-Red-Rainy ................ Region 10 Missouri ............................... Region 11 Arkansas-White-Red ........... Region 12 Texas-Gulf ........................... Region 13 Rio Grande .......................... Region 14 Upper Colorado ................... Region 15 Lower Colorado ................... Region 16 Great Basin ......................... Region 17 Pacific Northwest ................. Region 18 California ............................. Region 19 Alaska ................................. Region 20 Hawaii .................................
9,826 10,419
44 -
352 389 656
983
- 13
263 395
14
973 14 19
2
79 76 37
7 22
79
133 27 78 92
573 165 247
4 22
267
16 203
15 2
27
593 35
5 56
40 21
1,022 859
4
66 187
1 101 548
95 111
1,010 156
89
14 158 469
6 1,561
384 863 239 851 387
1,145 1,620
654 -
14
5,667,412 3,543,163
7,906 -
101,503 513,133 919,542
482,824
- 1,859
359,537 86,586
(D)
574,176 9,945
13,060 (D)
52,152
3,635 32,765
(D) 8,749
(D)
28,898 15,180
175,799 105,760
201,089 394,154 90,690
(D) 5,138
90,346
598 16,806
5,552 (D)
12,184
173,842 1,592
35 7,729
17,625
2,419 535,800 138,540
4
6,089 203,116
(D) 16,193
236,677
11,938 21,041
482,785 37,856
5,029
(D) 43,894
789,563 3,720
910,336
341,703 326,313 134,303 329,095 125,660
202,326 986,770 907,160
- (D)
133,815 66,494
416 -
3,229 8,212
21,571
3,460 -
47 8,658
12,803
(D)5,678
79 330 (D)
1,480
259 290 782 146
568
1,653 94
1,025 330
3,195 1,715 2,018
25 622
1,804
147 2,805
133 (D)
223
1,732 81 (D)
210
1,099 90
28,150 3,866
(D)
(D)7,562
(D)4,897 1,236
1,390 1,049
25,077 1,910
373
70 5,303 9,462
(D)8,356
6,504
23,134 1,643 3,633 3,846
6,001
13,963 21,302
- (D)
13,619 6,382
9,444 -
9,173 21,112 32,882
3,520
- 3,577
32,921 32,413
(D)
5,836 5,643
17,389 (D)
18,731
3,404 7,835
111,729 6,632
7,188
12,432 3,492
13,142 3,590
5,575
10,392 8,171 6,250
28,273
6,756 9,188
13,816 8,898
(D)
8,260 2,920 2,309
(D)3,757
27,464
4,281 27,544
4,501 (D)
(D)
40,440 (D)
48,484 2,255
14,631 9,452
24,829 12,243
4,190
5,011 33,562 20,174
(D)5,353
16,938 26,807
6,876 4,269 9,939
5,241 8,619
32,571 -
(D)
3,120 4,575
6 -
144 6 4
518
- -
66 52
12
419 - 2 -
44 14
- - 3
- - - 1
38
343 -
113 - -
132 6 - 7 -
- 442
26 - 2
3 4 -
391 -
- 23
1 -
298
- 35
126 -
16
3 2 7 -
868
72 -
87 376 144
433 935
4 -
12
4,303 4,590
28 -
161 187 451
402
- 13 80 23
-
382 12 15
-
7 52 26
- 15
51 90 25 33 52
128
25 35
4 9
83
2 149
2 -
25 114
5 5
44
29 15
708 416
4
57 106
- 8
225
60 49
367 104
58
10 61
219 3
420
200 644 119 406 185
578 367 453
- -
1,395 936
7 -
20 126
74
41 - -
55 139
-
158 2 - 2
23 10 10
4 4
27 31
2 37
2
96 140
90 - 6
46
8 36
4 2
2
28 4 - 8
- 1
33 23
-
5 23
- 42 24
31 18
249 39 15
-
43 166
1 245
20 28 20 57 26
99
264 74
- -
594 156
3 -
22 49 67
12
- -
30 134
1
10 - - -
- - 1 - -
1 3 - 5 -
4 - 4 - 3
3 - 2 2 -
- 9 - - 2
6 1
145 19
-
4 20
- 31
1
1 5
173 4 -
1 30 54
2 14
86 54 12
6 26
27 35 63
- 1
414 162
- - 5
21 60
10
- -
32 47
1 4 - 2 -
5 - - 3 -
- 9 - 2 -
2 - 5 - 4
3 -
16 - -
- - - - -
2 -
136 10
-
- 15
- 20
-
3 4
95 9 -
- 22 23
- 14
6
137 1 6 6
8
19 60
- 1
See footnote(s) at end of table. --continued
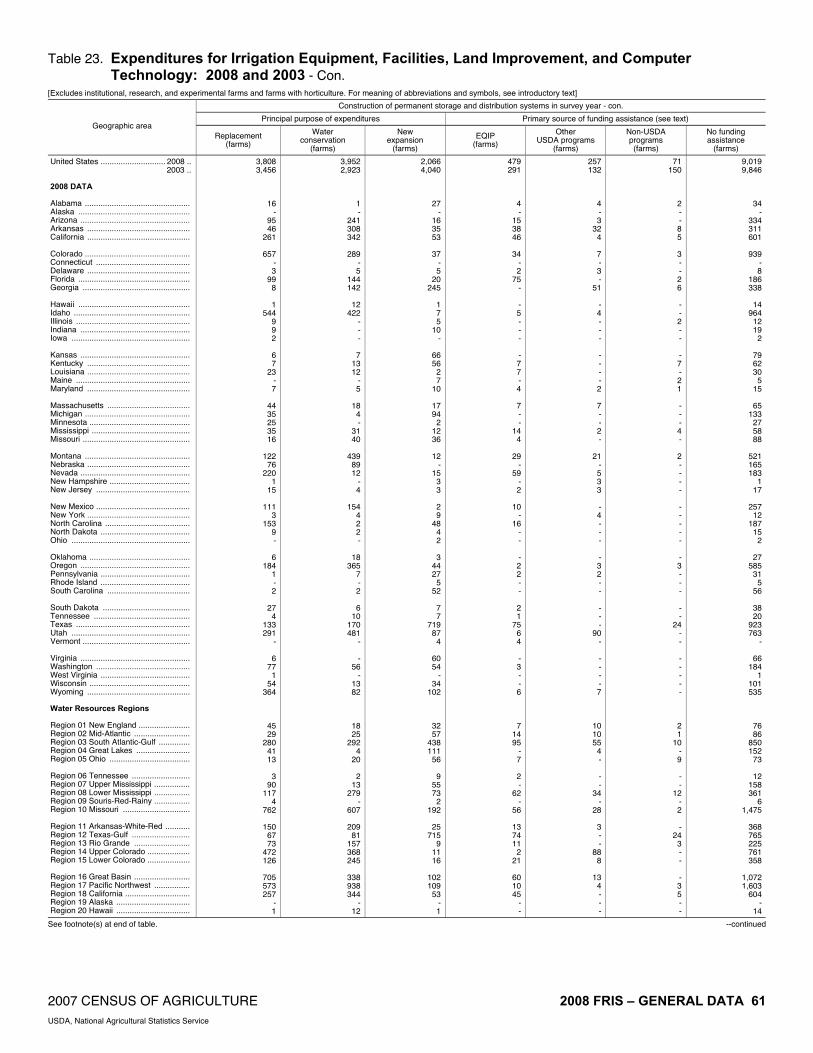
2007 CENSUS OF AGRICULTURE 2008 FRIS – GENERAL DATA 61 USDA, National Agricultural Statistics Service
Table 23. Expenditures for Irrigation Equipment, Facilities, Land Improvement, and Computer Technology: 2008 and 2003 - Con.
[Excludes institutional, research, and experimental farms and farms with horticulture. For meaning of abbreviations and symbols, see introductory text]
Construction of permanent storage and distribution systems in survey year - con.
Principal purpose of expenditures Primary source of funding assistance (see text) Geographic area
Replacement (farms)
Water conservation
(farms)
New expansion
(farms)
EQIP (farms)
Other USDA programs
(farms)
Non-USDA programs (farms)
No funding assistance
(farms)
United States ............................. 2008 .. 2003 .. 2008 DATA Alabama ............................................... Alaska .................................................. Arizona ................................................. Arkansas .............................................. California .............................................. Colorado ............................................... Connecticut .......................................... Delaware .............................................. Florida .................................................. Georgia ................................................ Hawaii .................................................. Idaho .................................................... Illinois ................................................... Indiana ................................................. Iowa ..................................................... Kansas ................................................. Kentucky .............................................. Louisiana .............................................. Maine ................................................... Maryland .............................................. Massachusetts ..................................... Michigan ............................................... Minnesota ............................................. Mississippi ............................................ Missouri ................................................ Montana ............................................... Nebraska .............................................. Nevada ................................................. New Hampshire .................................... New Jersey .......................................... New Mexico .......................................... New York .............................................. North Carolina ...................................... North Dakota ........................................ Ohio ..................................................... Oklahoma ............................................. Oregon ................................................. Pennsylvania ........................................ Rhode Island ........................................ South Carolina ..................................... South Dakota ....................................... Tennessee ........................................... Texas ................................................... Utah ..................................................... Vermont ................................................ Virginia ................................................. Washington .......................................... West Virginia ........................................ Wisconsin ............................................. Wyoming .............................................. Water Resources Regions Region 01 New England ....................... Region 02 Mid-Atlantic ......................... Region 03 South Atlantic-Gulf .............. Region 04 Great Lakes ........................ Region 05 Ohio .................................... Region 06 Tennessee .......................... Region 07 Upper Mississippi ................ Region 08 Lower Mississippi ................ Region 09 Souris-Red-Rainy ................ Region 10 Missouri .............................. Region 11 Arkansas-White-Red ........... Region 12 Texas-Gulf .......................... Region 13 Rio Grande ......................... Region 14 Upper Colorado ................... Region 15 Lower Colorado ................... Region 16 Great Basin ......................... Region 17 Pacific Northwest ................ Region 18 California ............................. Region 19 Alaska ................................. Region 20 Hawaii .................................
3,808 3,456
16 -
95 46
261
657 - 3
99 8
1
544 9 9 2
6 7
23 - 7
44 35 25 35 16
122
76 220
1 15
111
3 153
9 -
6 184
1 - 2
27
4 133 291
-
6 77
1 54
364
45 29
280 41 13
3
90 117
4 762
150
67 73
472 126
705 573 257
- 1
3,952 2,923
1 -
241 308 342
289
- 5
144 142
12
422 - - -
7 13 12
- 5
18
4 -
31 40
439
89 12
- 4
154
4 2 2 -
18 365
7 - 2
6
10 170 481
-
- 56
- 13 82
18 25
292 4
20
2 13
279 -
607
209 81
157 368 245
338 938 344
- 12
2,066 4,040
27 -
16 35 53
37
- 5
20 245
1 7 5
10 -
66 56
2 7
10
17 94
2 12 36
12
- 15
3 3
2 9
48 4 2
3
44 27
5 52
7 7
719 87
4
60 54
- 34
102
32 57
438 111
56
9 55 73
2 192
25
715 9
11 16
102 109
53 - 1
479 291
4 -
15 38 46
34
- 2
75 -
- 5 - - -
- 7 7 - 4
7 - -
14 4
29
- 59
- 2
10
- 16
- -
- 2 2 - -
2 1
75 6 4
- 3 - - 6
7 14 95
- 7
2 -
62 -
56
13 74 11
2 21
60 10 45
- -
257 132
4 - 3
32 4
7 - 3 -
51
- 4 - - -
- - - - 2
7 - - 2 -
21 - 5 3 3
- 4 - - -
- 3 2 - -
- - -
90 -
- - - - 7
10 10 55
4 -
- -
34 -
28
3 - -
88 8
13
4 - - -
71 150
2 - - 8 5
3 - - 2 6
- - 2 - -
- 7 - 2 1
- - - 4 -
2 - - - -
- - - - -
- 3 - - -
- -
24 - -
- - - - -
2 1
10 - 9
- -
12 - 2
-
24 3 - -
- 3 5 - -
9,019 9,846
34 -
334 311 601
939 -8
186 338
14 964
12 19
2
79 62 30
515
65 133
27 58 88
521 165 183
117
257 12
187 15
2
27 585
31 5
56
38 20
923 763
-
66 184
1101 535
76 86
850 152
73
12 158 361
61,475
368 765 225 761 358
1,072 1,603
604 -
14
See footnote(s) at end of table. --continued

62 2008 FRIS – GENERAL DATA 2007 CENSUS OF AGRICULTURE USDA, National Agricultural Statistics Service
Table 23. Expenditures for Irrigation Equipment, Facilities, Land Improvement, and Computer Technology: 2008 and 2003 - Con.
[Excludes institutional, research, and experimental farms and farms with horticulture. For meaning of abbreviations and symbols, see introductory text]
Land clearing and leveling in survey year
Farms with expenses of - Geographic area
Farms Acres irrigated
Expenses 1 ($1,000)
Average per farm (dollars) $1 to
$999 $1,000 to $9,999
$10,000 to $29,999
$30,000 to $74,999
$75,000 or more
United States .............................2008 .. 2003 .. 2008 DATA Alabama ............................................... Alaska ................................................... Arizona ................................................. Arkansas ............................................... California .............................................. Colorado ............................................... Connecticut ........................................... Delaware .............................................. Florida ................................................... Georgia ................................................. Hawaii ................................................... Idaho ..................................................... Illinois .................................................... Indiana .................................................. Iowa ...................................................... Kansas .................................................. Kentucky ............................................... Louisiana .............................................. Maine .................................................... Maryland ............................................... Massachusetts ...................................... Michigan ............................................... Minnesota ............................................. Mississippi ............................................ Missouri ................................................ Montana ................................................ Nebraska .............................................. Nevada ................................................. New Hampshire .................................... New Jersey ........................................... New Mexico .......................................... New York .............................................. North Carolina ...................................... North Dakota ........................................ Ohio ...................................................... Oklahoma ............................................. Oregon .................................................. Pennsylvania ........................................ Rhode Island ........................................ South Carolina ...................................... South Dakota ........................................ Tennessee ............................................ Texas .................................................... Utah ...................................................... Vermont ................................................ Virginia .................................................. Washington ........................................... West Virginia ........................................ Wisconsin ............................................. Wyoming ............................................... Water Resources Regions Region 01 New England ....................... Region 02 Mid-Atlantic .......................... Region 03 South Atlantic-Gulf .............. Region 04 Great Lakes ......................... Region 05 Ohio ..................................... Region 06 Tennessee ........................... Region 07 Upper Mississippi ................ Region 08 Lower Mississippi ................ Region 09 Souris-Red-Rainy ................ Region 10 Missouri ............................... Region 11 Arkansas-White-Red ........... Region 12 Texas-Gulf ........................... Region 13 Rio Grande .......................... Region 14 Upper Colorado ................... Region 15 Lower Colorado ................... Region 16 Great Basin ......................... Region 17 Pacific Northwest ................. Region 18 California ............................. Region 19 Alaska ................................. Region 20 Hawaii .................................
10,327 9,257
56 -
317 471
1,272
765 -
19 364 351
33
685 40 53
2
28 19
202 4 7
61
116 41
212 200
202 407 138
- 19
516
38 36 13
9
80 246
24 14 27
25 26
1,383 907
2
4 539
- 78
276
79 110 825 172
38
27 157 965
9 1,066
426
1,167 459 886 386
759
1,486 1,277
- 33
6,588,691 4,598,419
4,311 -
189,744 843,404 982,856
280,136
- 5,234
424,772 105,466
(D)
491,904 12,438 44,751
(D)
17,395 1,556
143,584 (D)
3,536
(D) 65,367 40,677
419,779 259,376
96,767
519,752 100,886
- 3,022
182,239
852 9,901
14,837 9
23,325 65,663
156 82
6,688
16,580 6,501
613,879 171,495
(D)
2,880 234,072
- 82,343 87,756
10,030 15,434
549,903 82,829 12,823
(D)
149,435 1,511,214
10,796 806,670
479,748 384,343 131,686 220,373 192,779
240,190 796,415 987,806
- (D)
141,998 75,591
92 -
8,093 15,571 47,605
1,279
- 98
7,653 4,352
(D)
2,523 265 497 (D)
252
58 5,337
245 56
474 978 316
6,831 2,783
902
2,890 1,411
- 36
3,230
52 755 200
16
764 723
13 (D)
409
284 261
11,187 6,450
(D)
(D)3,893
- 1,465 1,278
771 296
13,253 1,266
177
104 2,218
26,921 (D)
6,024
7,691 8,736 2,290 3,974 8,286
4,827 7,170
47,632 -
(D)
13,750 8,166
1,642 -
25,530 33,060 37,425
1,672
- 5,169
21,024 12,398
(D)
3,683 6,628 9,374
(D)
9,000 3,037
26,419 61,250
7,971
7,769 8,427 7,709
32,223 13,917
4,466 7,101
10,226 -
1,874
6,261 1,368
20,972 15,421
1,800
9,551 2,937
526 (D)
15,148
11,372 10,026
8,089 7,111
(D)
(D)7,222
- 18,783
4,631
9,765 2,693
16,065 7,362 4,650
3,861
14,128 27,897
(D)5,651
18,054
7,486 4,990 4,486
21,467
6,359 4,825
37,300 -
(D)
3,121 3,336
20 -
49 9 5
536
- 8 - -
13 161
15 1 -
- 13 57
- -
7 4 - 1
40
25 25 11
- 13
189
30 - - -
11 186
23 - -
- 9
895 313
-
- 317
- 18
117
7 74 16 17 14
12 20 68
- 285
42
837 242 489
54
248 678
5 -
13
3,764 3,958
34 -
156 102 304
210
- 9
283 217
4
486 19 39
2
5 5
52 - 5
38 85 28 55 59
161 261
66 - 4
255
7 15
4 9
44 44
1 14 22
12
6 113 272
2
2 145
- 18 90
52 28
567 116
21
11 77
241 7
525
187 52
150 202 220
318 677 309
- 4
2,216 1,471
2 -
40 154 455
13
- -
23 116
15 31
4 11
-
23 -
43 3 2
16 21 12 84 76
12
121 56
- 2
43
1 19
9 -
20 10
- - -
13 8
298 313
-
2 54
- 22 69
19 6
159 32
1
3 37
343 2
249
139 200
49 191
40
182 94
455 -
15
868 347
- -
47 171 344
6 - 2
26 8
1 7 2 1 -
- 1
28 - -
- 5 1
44 24
4 - 4 - -
25 - - - -
4 3 - - 4
- 3
59 9 -
- 16
- 19
-
- 2
38 6 2
1
21 244
- 7
40 60 15
3 47
10 27
344 - 1
358 145
- -
25 35
164
- - -
32 10
- - - 1 -
- -
22 1 -
- 1 -
28 1
- - 1 - -
4 - 2 - -
1 3 - - 1
- -
18 - -
- 7 - 1 -
1 -
45 1 -
- 2
69 - -
18 18
3 1
25
1 10
164 - -
See footnote(s) at end of table. --continued

2007 CENSUS OF AGRICULTURE 2008 FRIS – GENERAL DATA 63 USDA, National Agricultural Statistics Service
Table 23. Expenditures for Irrigation Equipment, Facilities, Land Improvement, and Computer Technology: 2008 and 2003 - Con.
[Excludes institutional, research, and experimental farms and farms with horticulture. For meaning of abbreviations and symbols, see introductory text]
Land clearing and leveling in survey year - con.
Principal purpose of expenditures Primary source of funding assistance (see text) Geographic area
Replacement (farms)
Water conservation
(farms)
New expansion
(farms)
EQIP (farms)
Other USDA programs
(farms)
Non-USDA programs (farms)
No funding assistance
(farms)
United States ............................. 2008 .. 2003 .. 2008 DATA Alabama ............................................... Alaska .................................................. Arizona ................................................. Arkansas .............................................. California .............................................. Colorado ............................................... Connecticut .......................................... Delaware .............................................. Florida .................................................. Georgia ................................................ Hawaii .................................................. Idaho .................................................... Illinois ................................................... Indiana ................................................. Iowa ..................................................... Kansas ................................................. Kentucky .............................................. Louisiana .............................................. Maine ................................................... Maryland .............................................. Massachusetts ..................................... Michigan ............................................... Minnesota ............................................. Mississippi ............................................ Missouri ................................................ Montana ............................................... Nebraska .............................................. Nevada ................................................. New Hampshire .................................... New Jersey .......................................... New Mexico .......................................... New York .............................................. North Carolina ...................................... North Dakota ........................................ Ohio ..................................................... Oklahoma ............................................. Oregon ................................................. Pennsylvania ........................................ Rhode Island ........................................ South Carolina ..................................... South Dakota ....................................... Tennessee ........................................... Texas ................................................... Utah ..................................................... Vermont ................................................ Virginia ................................................. Washington .......................................... West Virginia ........................................ Wisconsin ............................................. Wyoming .............................................. Water Resources Regions Region 01 New England ....................... Region 02 Mid-Atlantic ......................... Region 03 South Atlantic-Gulf .............. Region 04 Great Lakes ........................ Region 05 Ohio .................................... Region 06 Tennessee .......................... Region 07 Upper Mississippi ................ Region 08 Lower Mississippi ................ Region 09 Souris-Red-Rainy ................ Region 10 Missouri .............................. Region 11 Arkansas-White-Red ........... Region 12 Texas-Gulf .......................... Region 13 Rio Grande ......................... Region 14 Upper Colorado ................... Region 15 Lower Colorado ................... Region 16 Great Basin ......................... Region 17 Pacific Northwest ................ Region 18 California ............................. Region 19 Alaska ................................. Region 20 Hawaii .................................
- (X)
- - - - -
- - - - -
- - - - -
- - - - -
- - - - -
- - - - -
- - - - -
- - - - -
- - - - -
- - - - -
- - - - -
- - - - -
- - - - -
- - - - -
6,073 2,841
18 -
259 350 732
672
- -
70 9
2
568 2 1 -
- -
145 - -
61 4 1
82 73
110
92 81
- 15
463
5 11
- -
75 198
24 - 1
9 1
715 794
2
- 382
- 2
44
61 43
111 8 1
-
15 574
1 393
207 710 322 803 323
604
1,163 732
- 2
4,254 5,248
38 -
58 121 540
93
- 19
294 342
31
117 38 52
2
28 19 57
4 7
-
112 40
130 127
92
315 57
- 4
53 33 25 13
9
5 48
- 14 26
16 25
668 113
-
4 157
- 76
232
18 67
714 164
37
27 142 391
8 673
219 457 137
83 63
155 323 545
- 31
332 203
12 -
12 47 27
11
- 1
18 -
- - - - -
- -
45 - 1
14
- -
27 16
- -
13 - -
2 - - 2 -
2 - - 4 8
2 -
53 15
-
- - - - -
18 2
36 - -
2 -
119 - 9
21 53
5 -
17
23 -
27 - -
162 76
- -
18 2 -
- - 3 2 -
- 1 - - -
- - 7 - 2
5 - - 4
12
- - 2 - -
- - - - -
2 3 - - -
- - -
96 -
- 3 - - -
5 5 2 - -
- 12 13
- -
2 - -
84 18
14
7 - - -
53 29
4 - 1 6 -
- - - - 6
- - - - -
- - - - -
- - 2
15 3
4 - - - -
7 - - - -
- - - - -
- 1 - - -
- 2 - 1 1
- -
10 - -
- 2
24 1 6
- - 6 1 1
- 2 - - -
9,780 8,949
40 -
286 416
1,245
754 -
15 344 345
33 684
40 53
2
28 19
150 44
42 116
39 166 169
198 407 123
-19
507 38 36 11
9
76 243
24 10 19
23 25
1,330 796
2
4534
-77
275
56 103 777 172
38
25 143 809
81,051
403 1,114
448 801 350
722 1,477 1,250
-33
See footnote(s) at end of table. --continued
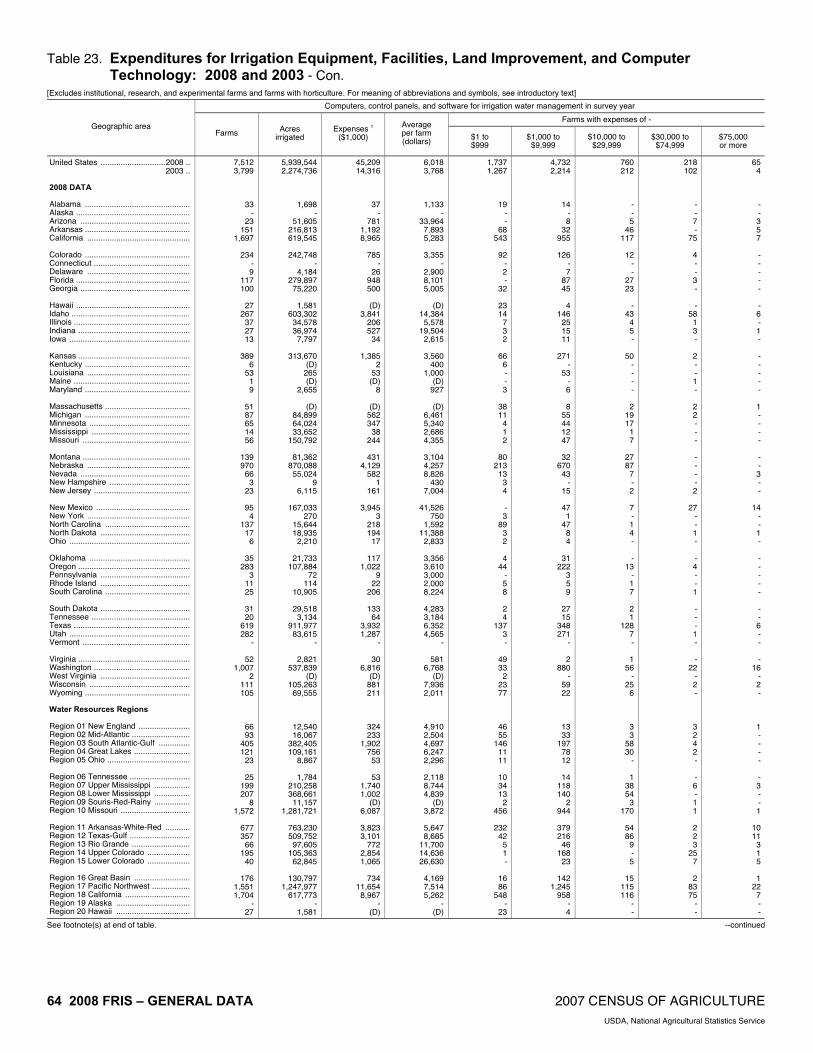
64 2008 FRIS – GENERAL DATA 2007 CENSUS OF AGRICULTURE USDA, National Agricultural Statistics Service
Table 23. Expenditures for Irrigation Equipment, Facilities, Land Improvement, and Computer Technology: 2008 and 2003 - Con.
[Excludes institutional, research, and experimental farms and farms with horticulture. For meaning of abbreviations and symbols, see introductory text]
Computers, control panels, and software for irrigation water management in survey year
Farms with expenses of - Geographic area
Farms Acres irrigated
Expenses 1 ($1,000)
Average per farm (dollars) $1 to
$999 $1,000 to $9,999
$10,000 to $29,999
$30,000 to $74,999
$75,000 or more
United States .............................2008 .. 2003 .. 2008 DATA Alabama ............................................... Alaska ................................................... Arizona ................................................. Arkansas ............................................... California .............................................. Colorado ............................................... Connecticut ........................................... Delaware .............................................. Florida ................................................... Georgia ................................................. Hawaii ................................................... Idaho ..................................................... Illinois .................................................... Indiana .................................................. Iowa ...................................................... Kansas .................................................. Kentucky ............................................... Louisiana .............................................. Maine .................................................... Maryland ............................................... Massachusetts ...................................... Michigan ............................................... Minnesota ............................................. Mississippi ............................................ Missouri ................................................ Montana ................................................ Nebraska .............................................. Nevada ................................................. New Hampshire .................................... New Jersey ........................................... New Mexico .......................................... New York .............................................. North Carolina ...................................... North Dakota ........................................ Ohio ...................................................... Oklahoma ............................................. Oregon .................................................. Pennsylvania ........................................ Rhode Island ........................................ South Carolina ...................................... South Dakota ........................................ Tennessee ............................................ Texas .................................................... Utah ...................................................... Vermont ................................................ Virginia .................................................. Washington ........................................... West Virginia ........................................ Wisconsin ............................................. Wyoming ............................................... Water Resources Regions Region 01 New England ....................... Region 02 Mid-Atlantic .......................... Region 03 South Atlantic-Gulf .............. Region 04 Great Lakes ......................... Region 05 Ohio ..................................... Region 06 Tennessee ........................... Region 07 Upper Mississippi ................ Region 08 Lower Mississippi ................ Region 09 Souris-Red-Rainy ................ Region 10 Missouri ............................... Region 11 Arkansas-White-Red ........... Region 12 Texas-Gulf ........................... Region 13 Rio Grande .......................... Region 14 Upper Colorado ................... Region 15 Lower Colorado ................... Region 16 Great Basin ......................... Region 17 Pacific Northwest ................. Region 18 California ............................. Region 19 Alaska ................................. Region 20 Hawaii .................................
7,512 3,799
33 -
23 151
1,697
234 - 9
117 100
27
267 37 27 13
389
6 53
1 9
51 87 65 14 56
139 970
66 3
23
95 4
137 17
6
35 283
3 11 25
31 20
619 282
-
52 1,007
2 111 105
66 93
405 121
23
25 199 207
8 1,572
677 357
66 195
40
176 1,551 1,704
- 27
5,939,544 2,274,736
1,698 -
51,605 216,813 619,545
242,748
- 4,184
279,897 75,220
1,581
603,302 34,578 36,974
7,797
313,670 (D)
265 (D)
2,655
(D) 84,899 64,024 33,652
150,792
81,362 870,088 55,024
9 6,115
167,033
270 15,644 18,935
2,210
21,733 107,884
72 114
10,905
29,518 3,134
911,977 83,615
-
2,821 537,839
(D) 105,263 69,555
12,540 16,067
382,405 109,161
8,867
1,784 210,258 368,661 11,157
1,281,721
763,230 509,752 97,605
105,363 62,845
130,797
1,247,977 617,773
- 1,581
45,209 14,316
37 -
781 1,192 8,965
785
- 26
948 500
(D)
3,841 206 527
34
1,385 2
53 (D)
8
(D)562 347
38 244
431
4,129 582
1 161
3,945
3 218 194
17
117 1,022
9 22
206
133 64
3,932 1,287
-
30 6,816
(D)881 211
324 233
1,902 756
53
53 1,740 1,002
(D)6,087
3,823 3,101
772 2,854 1,065
734
11,654 8,967
- (D)
6,018 3,768
1,133 -
33,964 7,893 5,283
3,355
- 2,900 8,101 5,005
(D)
14,384 5,578
19,504 2,615
3,560
400 1,000
(D)927
(D)
6,461 5,340 2,686 4,355
3,104 4,257 8,826
430 7,004
41,526
750 1,592
11,388 2,833
3,356 3,610 3,000 2,000 8,224
4,283 3,184 6,352 4,565
-
581 6,768
(D)7,936 2,011
4,910 2,504 4,697 6,247 2,296
2,118 8,744 4,839
(D)3,872
5,647 8,685
11,700 14,636 26,630
4,169 7,514 5,262
- (D)
1,737 1,267
19 - -
68 543
92
- 2 -
32
23 14
7 3 2
66
6 - - 3
38 11
4 1 2
80
213 13
3 4
- 3
89 3 2
4
44 - 5 8
2 4
137 3 -
49 33
2 23 77
46 55
146 11 11
10 34 13
2 456
232
42 5 1 -
16 86
548 -
23
4,732 2,214
14 - 8
32 955
126
- 7
87 45
4
146 25 15 11
271
- 53
- 6
8
55 44 12 47
32
670 43
- 15
47
1 47
8 4
31
222 3 5 9
27 15
348 271
-
2 880
- 59 22
13 33
197 78 12
14
118 140
2 944
379 216
46 168
23
142 1,245
958 - 4
760 212
- - 5
46 117
12
- -
27 23
-
43 4 5 -
50 - - - -
2 19 17
1 7
27 87
7 - 2
7 - 1 4 -
- 13
- 1 7
2 1
128 7 -
1 56
- 25
6
3 3
58 30
-
1 38 54
3 170
54 86
9 - 5
15
115 116
- -
218 102
- - 7 -
75
4 - - 3 -
- 58
1 3 -
2 - - 1 -
2 2 - - -
- - - - 2
27
- - 1 -
- 4 - - 1
- - - 1 -
- 22
- 2 -
3 2 4 2 -
- 6 - 1 1
2 2 3
25 7
2
83 75
- -
65 4
- - 3 5 7
- - - - -
- 6 - 1 -
- - - - -
1 - - - -
- - 3 - -
14 - - 1 -
- - - - -
- - 6 - -
- 16
- 2 -
1 - - - -
- 3 - - 1
10 11
3 1 5
1
22 7 - -
See footnote(s) at end of table. --continued

2007 CENSUS OF AGRICULTURE 2008 FRIS – GENERAL DATA 65 USDA, National Agricultural Statistics Service
Table 23. Expenditures for Irrigation Equipment, Facilities, Land Improvement, and Computer Technology: 2008 and 2003 - Con.
[Excludes institutional, research, and experimental farms and farms with horticulture. For meaning of abbreviations and symbols, see introductory text]
Computers, control panels, and software for irrigation water management in survey year - con.
Principal purpose of expenditures Primary source of funding assistance (see text) Geographic area
Replacement (farms)
Water conservation
(farms)
New expansion
(farms)
EQIP (farms)
Other USDA programs
(farms)
Non-USDA programs (farms)
No funding assistance
(farms)
United States ............................. 2008 .. 2003 .. 2008 DATA Alabama ............................................... Alaska .................................................. Arizona ................................................. Arkansas .............................................. California .............................................. Colorado ............................................... Connecticut .......................................... Delaware .............................................. Florida .................................................. Georgia ................................................ Hawaii .................................................. Idaho .................................................... Illinois ................................................... Indiana ................................................. Iowa ..................................................... Kansas ................................................. Kentucky .............................................. Louisiana .............................................. Maine ................................................... Maryland .............................................. Massachusetts ..................................... Michigan ............................................... Minnesota ............................................. Mississippi ............................................ Missouri ................................................ Montana ............................................... Nebraska .............................................. Nevada ................................................. New Hampshire .................................... New Jersey .......................................... New Mexico .......................................... New York .............................................. North Carolina ...................................... North Dakota ........................................ Ohio ..................................................... Oklahoma ............................................. Oregon ................................................. Pennsylvania ........................................ Rhode Island ........................................ South Carolina ..................................... South Dakota ....................................... Tennessee ........................................... Texas ................................................... Utah ..................................................... Vermont ................................................ Virginia ................................................. Washington .......................................... West Virginia ........................................ Wisconsin ............................................. Wyoming .............................................. Water Resources Regions Region 01 New England ....................... Region 02 Mid-Atlantic ......................... Region 03 South Atlantic-Gulf .............. Region 04 Great Lakes ........................ Region 05 Ohio .................................... Region 06 Tennessee .......................... Region 07 Upper Mississippi ................ Region 08 Lower Mississippi ................ Region 09 Souris-Red-Rainy ................ Region 10 Missouri .............................. Region 11 Arkansas-White-Red ........... Region 12 Texas-Gulf .......................... Region 13 Rio Grande ......................... Region 14 Upper Colorado ................... Region 15 Lower Colorado ................... Region 16 Great Basin ......................... Region 17 Pacific Northwest ................ Region 18 California ............................. Region 19 Alaska ................................. Region 20 Hawaii .................................
2,370 1,206
19 - 6
43 277
75
- -
45 40
25
205 22
8 8
230
- - - 6
-
42 23
9 13
100 196
22 - 5
39
4 29 10
5
24 217
3 5 5
7
10 213
89 -
9 157
- 55 70
5 18
136 64 12
19 80 61
2 532
239 145
48 81 20
31
576 276
- 25
2,642 737
- -
14 25
232
117 - -
57 8
-
41 1 9 2
99
- - 1 3
49 20 15
3 9
14
555 31
3 18
13
- 106
1 -
- 24
- 1 7
11
2 168 171
-
- 775
- 26 11
54 21
178 24
2
- 42 32
4 720
161 107
9 86 15
115 832 240
- -
2,500 1,856
14 - 3
83 1,188
42
- 9
15 52
2
21 14 10
3
60 6
53 - -
2 25 27
2 34
25
219 13
- -
43 - 2 6 1
11 42
- 5
13
13 8
238 22
-
43 75
2 30 24
7 54 91 33
9
6 77
114 2
320
277 105
9 28
5
30 143
1,188 - 2
210 42
6 - 2 - -
27 - 1 7 -
- 6 - 1 -
- - - - -
7 3 - - 3
4 - 6 - 7
2 - - 3 -
- - - 5 7
- - -
71 -
- 19
- 15
8
12 8
19 4 -
1 15
3 -
38
- 2 - 1 2
77 28
- - -
107 154
- - - - -
- - - - -
- - - - -
- - - - 2
- - - - 2
- - - - -
- - - - -
- - - - -
- - 5
87 -
- 11
- - -
- 2 - - -
- - 2 - -
5 - -
84 -
3 11
- - -
57 23
8 - - - -
- - - - -
- - - - -
5 - - - -
- - - - 4
- - - - -
1 - - - -
- 13
- 5 -
- 1
13 - -
- 3 - 4 -
5 - 8 - -
- 4 5 - -
18 - - 1 -
- 16
- - -
7,138 3,580
19 -
21 151
1,697
207 -8
110 100
27 261
37 26 13
384 6
53 17
44 84 65 14 47
135 970
60 3
16
92 4
137 14
6
35 270
31
18
31 19
601 124
-
52 974
292 97
49 83
378 117
23
24 180 197
81,534
654 355
66 109
38
96 1,496 1,704
-27
1 May not add due to rounding.
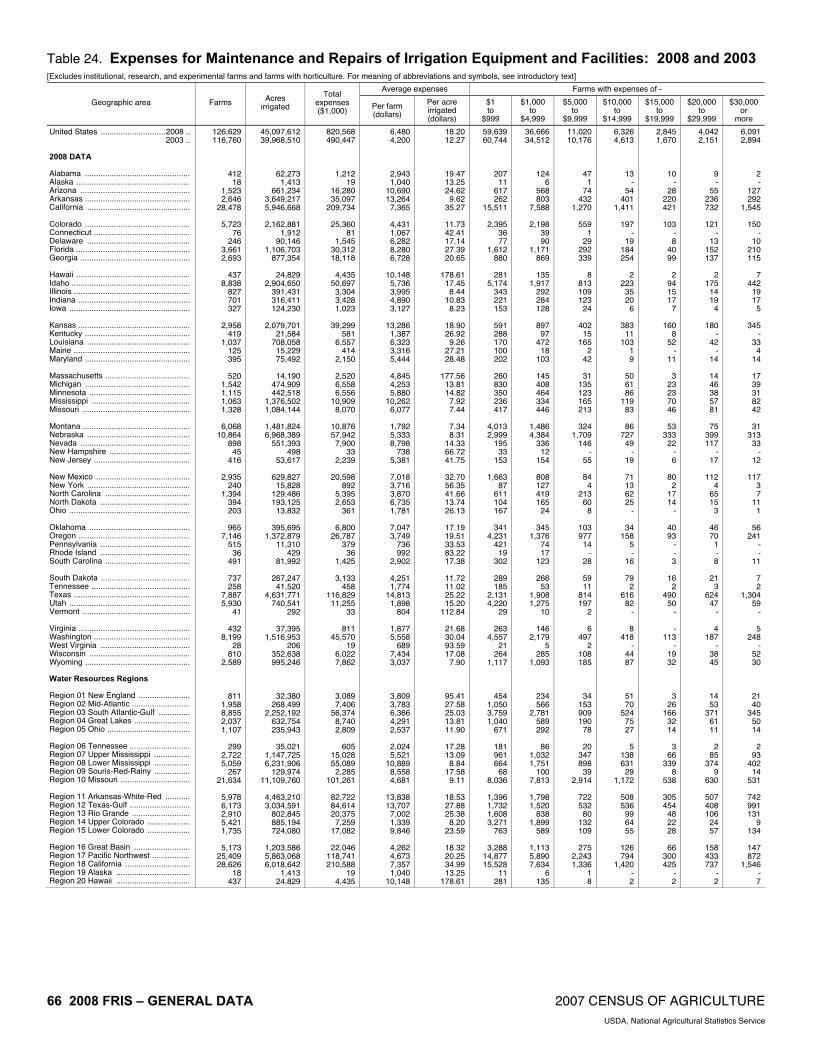
66 2008 FRIS – GENERAL DATA 2007 CENSUS OF AGRICULTURE USDA, National Agricultural Statistics Service
Table 24. Expenses for Maintenance and Repairs of Irrigation Equipment and Facilities: 2008 and 2003 [Excludes institutional, research, and experimental farms and farms with horticulture. For meaning of abbreviations and symbols, see introductory text]
Average expenses Farms with expenses of -
Geographic area Farms Acres irrigated
Total expenses ($1,000) Per farm
(dollars)
Per acre irrigated (dollars)
$1 to
$999
$1,000 to
$4,999
$5,000 to
$9,999
$10,000 to
$14,999
$15,000 to
$19,999
$20,000 to
$29,999
$30,000 or
more
United States .............................2008 .. 2003 .. 2008 DATA Alabama ............................................... Alaska ................................................... Arizona ................................................. Arkansas ............................................... California .............................................. Colorado ............................................... Connecticut ........................................... Delaware .............................................. Florida ................................................... Georgia ................................................. Hawaii ................................................... Idaho ..................................................... Illinois .................................................... Indiana .................................................. Iowa ...................................................... Kansas .................................................. Kentucky ............................................... Louisiana .............................................. Maine .................................................... Maryland ............................................... Massachusetts ...................................... Michigan ............................................... Minnesota ............................................. Mississippi ............................................ Missouri ................................................ Montana ................................................ Nebraska .............................................. Nevada ................................................. New Hampshire .................................... New Jersey ........................................... New Mexico .......................................... New York .............................................. North Carolina ...................................... North Dakota ........................................ Ohio ...................................................... Oklahoma ............................................. Oregon .................................................. Pennsylvania ........................................ Rhode Island ........................................ South Carolina ...................................... South Dakota ........................................ Tennessee ............................................ Texas .................................................... Utah ...................................................... Vermont ................................................ Virginia .................................................. Washington ........................................... West Virginia ........................................ Wisconsin ............................................. Wyoming ............................................... Water Resources Regions Region 01 New England ....................... Region 02 Mid-Atlantic .......................... Region 03 South Atlantic-Gulf .............. Region 04 Great Lakes ......................... Region 05 Ohio ..................................... Region 06 Tennessee ........................... Region 07 Upper Mississippi ................ Region 08 Lower Mississippi ................ Region 09 Souris-Red-Rainy ................ Region 10 Missouri ............................... Region 11 Arkansas-White-Red ........... Region 12 Texas-Gulf ........................... Region 13 Rio Grande .......................... Region 14 Upper Colorado ................... Region 15 Lower Colorado ................... Region 16 Great Basin ......................... Region 17 Pacific Northwest ................. Region 18 California ............................. Region 19 Alaska ................................. Region 20 Hawaii .................................
126,629 116,760
412 18
1,523 2,646
28,478
5,723 76
246 3,661 2,693
437
8,838 827 701 327
2,958
419 1,037
125 395
520
1,542 1,115 1,063 1,328
6,068
10,864 898
45 416
2,935
240 1,394
394 203
965
7,146 515
36 491
737 258
7,887 5,930
41
432 8,199
28 810
2,589
811 1,958 8,855 2,037 1,107
299
2,722 5,059
267 21,634
5,978 6,173 2,910 5,421 1,735
5,173
25,409 28,626
18 437
45,097,612 39,968,510
62,273 1,413
661,234 3,649,217 5,946,668
2,162,881
1,912 90,146
1,106,703 877,354
24,829
2,904,650 391,431 316,411 124,230
2,079,701
21,584 708,058 15,229 75,492
14,190
474,909 442,518
1,376,502 1,084,144
1,481,824 6,968,389
551,393 498
53,617
629,827 15,828
129,486 193,125 13,832
395,695
1,372,879 11,310
429 81,992
267,247 41,520
4,631,771 740,541
292
37,395 1,516,953
206 352,638 995,246
32,380 268,499
2,252,192 632,754 235,943
35,021
1,147,725 6,231,906
129,974 11,109,760
4,463,210 3,034,591
802,845 885,194 724,080
1,203,586 5,863,068 6,018,642
1,413 24,829
820,568 490,447
1,212 19
16,280 35,097
209,734
25,360 81
1,545 30,312 18,118
4,435
50,697 3,304 3,428 1,023
39,299
581 6,557
414 2,150
2,520 6,558 6,556
10,909 8,070
10,876 57,942
7,900 33
2,239
20,598 892
5,395 2,653
361
6,800 26,787
379 36
1,425
3,133 458
116,829 11,255
33
811 45,570
19 6,022 7,862
3,089 7,406
56,374 8,740 2,809
605
15,028 55,089
2,285 101,261
82,722 84,614 20,375
7,259 17,082
22,046
118,741 210,588
19 4,435
6,480 4,200
2,943 1,040
10,690 13,264
7,365
4,431 1,067 6,282 8,280 6,728
10,148
5,736 3,995 4,890 3,127
13,286
1,387 6,323 3,316 5,444
4,845 4,253 5,880
10,262 6,077
1,792 5,333 8,798
738 5,381
7,018 3,716 3,870 6,735 1,781
7,047 3,749
736 992
2,902
4,251 1,774
14,813 1,898
804
1,877 5,558
689 7,434 3,037
3,809 3,783 6,366 4,291 2,537
2,024 5,521
10,889 8,558 4,681
13,838 13,707
7,002 1,339 9,846
4,262 4,673 7,357 1,040
10,148
18.20 12.27
19.47 13.25 24.62 9.62
35.27
11.73 42.41 17.14 27.39 20.65
178.61
17.45 8.44
10.83 8.23
18.90 26.92 9.26
27.21 28.48
177.56
13.81 14.82 7.92 7.44
7.34 8.31
14.33 66.72 41.75
32.70 56.35 41.66 13.74 26.13
17.19 19.51 33.53 83.22 17.38
11.72 11.02 25.22 15.20
112.84
21.68 30.04 93.59 17.08 7.90
95.41 27.58 25.03 13.81 11.90
17.28 13.09 8.84
17.58 9.11
18.53 27.88 25.38 8.20
23.59
18.32 20.25 34.99 13.25
178.61
59,639 60,744
207 11
617 262
15,511
2,395 36 77
1,612 880
281
5,174 343 221 153
591 288 170 100 202
260 830 350 236 417
4,013 2,999
195 33
153
1,663 87
611 104 167
341
4,231 421
19 302
289 185
2,131 4,220
29
263 4,557
21 264
1,117
454 1,050 3,759 1,040
671
181 961 664
68 8,036
1,396 1,732 1,608 3,271
763
3,288 14,877 15,528
11 281
36,666 34,512
124 6
568 803
7,588
2,198 39 90
1,171 869
135
1,917 292 284 128
897
97 472
18 103
145 408 464 334 446
1,486 4,384
336 12
154
808 127 419 165
24
345 1,376
74 17
123
266 53
1,908 1,275
10
146 2,179
5 285
1,093
234 566
2,781 589 292
86
1,032 1,751
100 7,813
1,798 1,520
838 1,899
589
1,113 5,890 7,634
6 135
11,020 10,176
47 1
74 432
1,270
559 1
29 292 339
8
813 109 123
24
402 15
165 2
42
31 135 123 165 213
324
1,709 146
- 55
84
4 213
60 8
103 977
14 -
28
59 11
814 197
2
6 497
2 108 185
34 153 909 190
78
20 347 898
39 2,914
722 532
80 132 109
275
2,243 1,336
1 8
6,326 4,613
13 -
54 401
1,411
197 -
19 184 254
2
223 35 20
6
383 11
103 1 9
50 61 86
119 83
86
727 49
- 19
71 13 62 25
-
34 158
5 -
16
79 2
616 82
-
8 418
- 44 87
51 70
524 75 27
5
138 631
29 1,172
508 536
99 64 55
126 794
1,420 - 2
2,845 1,670
10 -
28 220 421
103
- 8
40 99
2
94 15 17
7
160 8
52 -
11
3 23 23 70 46
53
333 22
- 6
80
2 17 14
-
40 93
- - 3
16
2 490
50 -
- 113
- 19 32
3 26
166 32 14
3
66 339
8 538
305 454
48 22 28
66
300 425
- 2
4,042 2,151
9 -
55 236 732
121
- 13
152 137
2
175 14 19
4
180 -
42 -
14
14 46 38 57 81
75
399 117
- 17
112
4 65 15
3
46 70
1 - 8
21
3 624
47 -
4 187
- 38 45
14 53
371 61 11
2
85 374
9 630
507 408 106
24 57
158 433 737
- 2
6,091 2,894
2 -
127 292
1,545
150 -
10 210 115
7
442 19 17
5
345 -
33 4
14
17 39 31 82 42
31
313 33
- 12
117
3 7
11 1
56
241 - -
11
7 2
1,304 59
-
5 248
- 52 30
21 40
345 50 14
2
93 402
14 531
742 991 131
9 134
147 872
1,546 - 7

2007 CENSUS OF AGRICULTURE 2008 FRIS – GENERAL DATA 67 USDA, National Agricultural Statistics Service
Table 25. Expenses for Hired and Contract Irrigation Labor: 2008 and 2003 [Excludes institutional, research, and experimental farms and farms with horticulture. For meaning of abbreviations and symbols, see introductory text]
Average expenses Hired labor Contract labor
Average expenses Average expenses Geographic area Farms Acres
irrigated
Total expenses ($1,000)
Per farm (dollars)
Per acre irrigated (dollars)
Farms Expenses ($1,000) Per farm
(dollars)
Per acre irrigated (dollars)
Farms Expenses ($1,000) Per farm
(dollars)
Per acre irrigated (dollars)
United States ............................. 2008 .. 2003 .. 2008 DATA Alabama ............................................... Alaska .................................................. Arizona ................................................. Arkansas .............................................. California .............................................. Colorado ............................................... Connecticut .......................................... Delaware .............................................. Florida .................................................. Georgia ................................................ Hawaii .................................................. Idaho .................................................... Illinois ................................................... Indiana ................................................. Iowa ..................................................... Kansas ................................................. Kentucky .............................................. Louisiana .............................................. Maine ................................................... Maryland .............................................. Massachusetts ..................................... Michigan ............................................... Minnesota ............................................. Mississippi ............................................ Missouri ................................................ Montana ............................................... Nebraska .............................................. Nevada ................................................. New Hampshire .................................... New Jersey .......................................... New Mexico .......................................... New York .............................................. North Carolina ...................................... North Dakota ........................................ Ohio ..................................................... Oklahoma ............................................. Oregon ................................................. Pennsylvania ........................................ Rhode Island ........................................ South Carolina ..................................... South Dakota ....................................... Tennessee ........................................... Texas ................................................... Utah ..................................................... Vermont ................................................ Virginia ................................................. Washington .......................................... West Virginia ........................................ Wisconsin ............................................. Wyoming .............................................. Water Resources Regions Region 01 New England ....................... Region 02 Mid-Atlantic ......................... Region 03 South Atlantic-Gulf .............. Region 04 Great Lakes ........................ Region 05 Ohio .................................... Region 06 Tennessee .......................... Region 07 Upper Mississippi ................ Region 08 Lower Mississippi ................ Region 09 Souris-Red-Rainy ................ Region 10 Missouri .............................. Region 11 Arkansas-White-Red ........... Region 12 Texas-Gulf .......................... Region 13 Rio Grande ......................... Region 14 Upper Colorado ................... Region 15 Lower Colorado ................... Region 16 Great Basin ......................... Region 17 Pacific Northwest ................ Region 18 California ............................. Region 19 Alaska ................................. Region 20 Hawaii .................................
57,611 60,839
155 9
938 1,603
16,728
3,054 18 79
1,700 935
83
3,577 188 213
68
1,284 264 314
62 121
240 573 328 658 611
1,708 3,895
514 15
155
1,262 125 849 143
85
417 2,112
145 14
145
209 131
4,282 1,667
9
117 4,081
7 338
1,383
352 626
3,832 811 454
148 805
2,747 79
7,912
2,885 3,520
989 2,337
981
2,024 10,157 16,860
9 83
31,589,433 27,208,414
35,926 879
707,556 2,541,729 5,571,168
1,373,898
1,311 40,991
928,273 444,405
22,514
2,465,670 155,503 135,611 26,371
1,357,625
10,198 268,524 14,633 36,275
9,411
305,600 193,874 856,369 775,655
900,831
3,747,491 472,322
452 40,670
423,253 12,573 85,535
124,242 7,680
246,802
1,048,579 5,581
325 37,135
143,162 26,356
3,303,632 503,232
248
20,130 1,188,506
389 230,508 739,830
26,222 143,044
1,524,459 388,270 107,132
24,587
541,694 4,035,688
66,603 6,242,250
3,039,927 2,147,616
572,211 626,763 762,656
964,858
4,732,037 5,620,023
879 22,514
997,076 655,727
755 26
48,153 30,290
410,669
22,109 55
595 27,831
8,099
2,909 66,880
768 1,076
184
26,002 369
3,360 605 707
1,564 4,928 2,260 6,413 4,426
10,521 42,908 10,397
35 3,152
25,996
8,313 7,114 1,995
500
4,560 34,617
273 661 777
819 648
81,013 9,417
14
578 58,846
38 7,749
15,100
2,925 5,486
44,526 14,376
1,301
939 9,738
40,018 993
83,597
63,589 55,971 23,693
7,592 50,207
20,986
156,627 411,579
26 2,909
17,307 10,778
4,872 2,833
51,336 18,896 24,550
7,239 3,050 7,526
16,371 8,662
35,049 18,697
4,086 5,053 2,712
20,251
1,399 10,701
9,750 5,843
6,518 8,601 6,889 9,746 7,243
6,160
11,016 20,227
2,353 20,335
20,599 66,506
8,380 13,953
5,882
10,935 16,391
1,880 47,229
5,356
3,921 4,950
18,919 5,649 1,578
4,940
14,420 5,400
22,927 10,918
8,310 8,764
11,619 17,726
2,865
6,345 12,096 14,568 12,568 10,566
22,041 15,901 23,956
3,248 51,179
10,368 15,421 24,412
2,833 35,049
31.56 24.10
21.02 29.01 68.06 11.92 73.71
16.09 41.87 14.50 29.98 18.22
129.21
27.12 4.94 7.94 6.99
19.15 36.23 12.51 41.31 19.49
166.22
16.13 11.65 7.49 5.71
11.68 11.45 22.01 78.10 77.50
61.42
661.20 83.18 16.06 65.10
18.48 33.01 48.85
2,034.49 20.91
5.72
24.60 24.52 18.71 57.25
28.71 49.51 97.17 33.62 20.41
111.55 38.35 29.21 37.03 12.14
38.19 17.98 9.92
14.91 13.39
20.92 26.06 41.41 12.11 65.83
21.75 33.10 73.23 29.01
129.21
50,754 52,952
126 9
764 1,525
14,837
2,302 18 66
1,277 853
79
3,283 143 180
61
1,080 225 282
61 108
133 568 292 639 595
1,511 3,609
490 15
153
1,179 115 789 129
78
389 1,999
145 9
127
177 118
3,485 1,449
9
106 3,843
7 321 996
239 583
3,221 789 408
127 698
2,601 77
6,780
2,459 2,805
880 1,966
806
1,877 9,381
14,969 9
79
861,566 589,607
718 26
43,576 28,906
345,322
18,645 55
498 21,599
6,801
2,774 58,768
663 897 152
23,568
322 2,961
(D) 661
723
4,687 2,031 5,950 4,103
9,129
33,332 9,527
35 3,081
24,015
(D) 6,766 1,916
496
4,400 33,017
273 (D)
700
682 597
69,331 8,778
14
519 50,757
(D) 7,360
13,857
1,556 5,190
36,434 13,605
1,107
879 8,971
37,805 983
70,474
56,014 48,379 21,644
5,838 45,506
19,670
138,586 346,125
26 2,774
16,975 11,135
5,696 2,833
57,036 18,955 23,274
8,099 3,050 7,551
16,914 7,973
35,119 17,901
4,636 4,981 2,487
21,822
1,430 10,499
(D)6,120
5,435 8,251 6,956 9,311 6,896
6,042 9,236
19,442 2,353
20,138
20,369 (D)
8,576 14,855
6,362
11,312 16,517
1,880 (D)
5,513
3,851 5,056
19,894 6,058 1,578
4,895
13,208 (D)
22,929 13,913
6,511 8,903
11,311 17,243
2,714
6,919 12,852 14,535 12,761 10,394
22,779 17,247 24,595
2,970 56,459
10,479 14,773 23,123
2,833 35,119
29.27 25.71
20.62 29.01 64.19 11.77 67.40
15.30 41.87 13.85 25.30 16.28
123.87
24.98 5.03 7.75 6.48
19.81 38.03 11.45
(D) 19.56
96.35 15.54 11.88 7.05 5.39
11.07 9.75
20.40 78.10 76.60
59.88
(D) 85.58 15.98 67.96
18.23 32.43 48.85
(D) 21.14
5.41
22.81 22.93 18.57 57.25
27.34 44.13
(D) 34.13 20.32
100.40 38.75 25.81 35.86 11.48
36.24 18.96 9.65
14.91 12.29
20.81 24.06 39.98 10.54 62.18
21.06 30.62 66.91 29.01
123.87
11,916 10,565
38 -
222 220
3,766
842 -
23 615 197
17
406 59 57 10
357
46 43
2 24
112
46 64 56
115
234 995
64 -
14
255 15
100 31
7
50 173
- 7
21
46 26
1,392 252
-
22 403
2 40
430
121 92
978 76 72
33
172 389
5 2,019
839
1,189 204 379 224
217
1,117 3,773
- 17
135,510 66,119
37 -
4,578 1,384
65,347
3,464 -
96 6,232 1,298
135
8,112 105 180
33
2,435 48
399 (D)46
841 242 228 463 323
1,391 9,576
870 -
71
1,981 (D)
348 79
4
160 1,600
- (D)76
138
52 11,682
639 -
59 8,089
(D)389
1,243
1,369 296
8,092 771 193
60
766 2,213
10 13,123
7,575 7,592 2,049 1,753 4,701
1,316
18,042 65,454
- 135
11,372 6,258
986 -
20,620 6,291
17,352
4,114 -
4,181 10,133
6,588
7,922 19,980
1,783 3,153 3,275
6,821 1,039 9,286
(D)1,920
7,513 5,252 3,569 8,274 2,805
5,946 9,624
13,593 -
5,060
7,769 (D)
3,482 2,545
543
3,192 9,251
- (D)
3,636
2,995 1,993 8,392 2,534
-
2,685 20,071
(D)9,730 2,890
11,313 3,216 8,274
10,147 2,685
1,826 4,456 5,689 2,048 6,500
9,028 6,385
10,046 4,626
20,985
6,064 16,152 17,348
- 7,922
18.09 41.74
10.08 -
41.23 4.26
46.08
14.09 -
6.81 13.26 8.66
477.54
13.95 2.45 3.00 6.53
6.37
26.21 15.48
(D)6.44
377.65
9.04 4.60 7.55 3.16
7.62 9.03
26.63 -
8.44
16.89 (D)
36.28 3.68
10.03
5.02 16.74
- (D)
18.01
2.52 40.83 10.06 9.65
-
16.61 25.10
(D)4.66 9.06
119.88 8.82
12.69 19.96 5.19
44.18 3.94 4.72 1.99 8.48
8.15
10.92 28.61 11.19 39.96
14.86 17.45 45.98
- 477.54
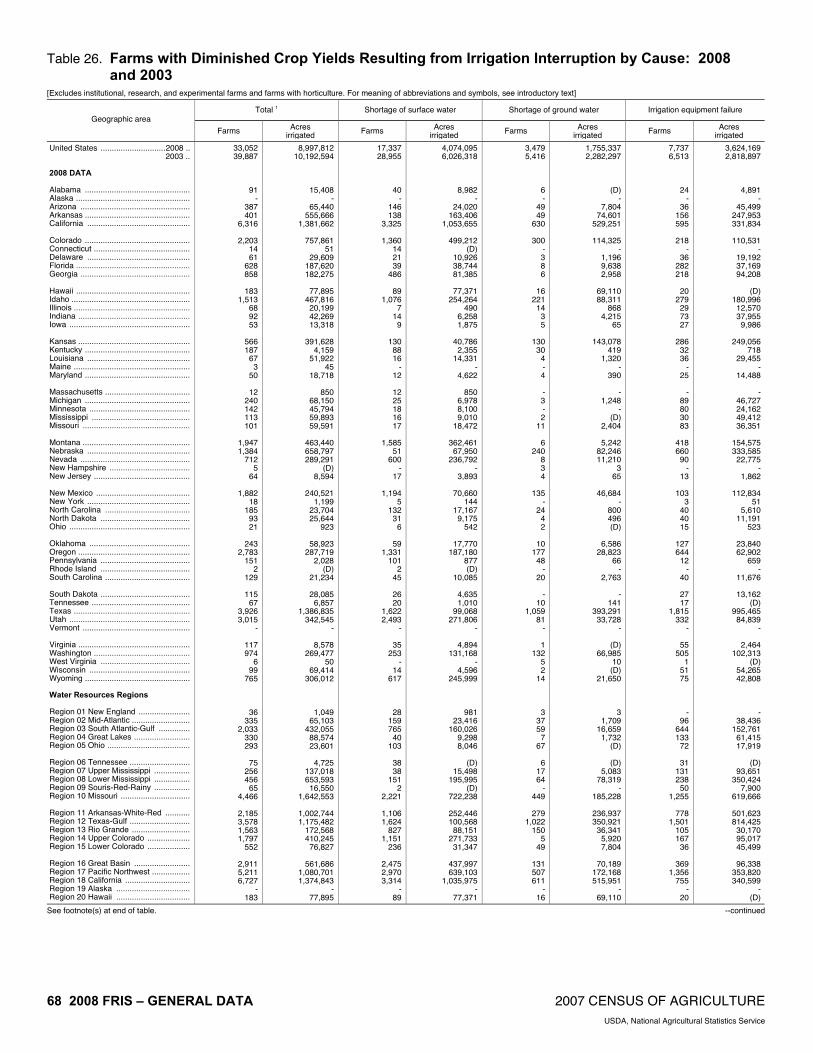
68 2008 FRIS – GENERAL DATA 2007 CENSUS OF AGRICULTURE USDA, National Agricultural Statistics Service
Table 26. Farms with Diminished Crop Yields Resulting from Irrigation Interruption by Cause: 2008 and 2003
[Excludes institutional, research, and experimental farms and farms with horticulture. For meaning of abbreviations and symbols, see introductory text]
Total 1 Shortage of surface water Shortage of ground water Irrigation equipment failure Geographic area
Farms Acres irrigated Farms Acres
irrigated Farms Acres irrigated Farms Acres
irrigated
United States .............................2008 .. 2003 .. 2008 DATA Alabama ............................................... Alaska ................................................... Arizona ................................................. Arkansas ............................................... California .............................................. Colorado ............................................... Connecticut ........................................... Delaware .............................................. Florida ................................................... Georgia ................................................. Hawaii ................................................... Idaho ..................................................... Illinois .................................................... Indiana .................................................. Iowa ...................................................... Kansas .................................................. Kentucky ............................................... Louisiana .............................................. Maine .................................................... Maryland ............................................... Massachusetts ...................................... Michigan ............................................... Minnesota ............................................. Mississippi ............................................ Missouri ................................................ Montana ................................................ Nebraska .............................................. Nevada ................................................. New Hampshire .................................... New Jersey ........................................... New Mexico .......................................... New York .............................................. North Carolina ...................................... North Dakota ........................................ Ohio ...................................................... Oklahoma ............................................. Oregon .................................................. Pennsylvania ........................................ Rhode Island ........................................ South Carolina ...................................... South Dakota ........................................ Tennessee ............................................ Texas .................................................... Utah ...................................................... Vermont ................................................ Virginia .................................................. Washington ........................................... West Virginia ........................................ Wisconsin ............................................. Wyoming ............................................... Water Resources Regions Region 01 New England ....................... Region 02 Mid-Atlantic .......................... Region 03 South Atlantic-Gulf .............. Region 04 Great Lakes ......................... Region 05 Ohio ..................................... Region 06 Tennessee ........................... Region 07 Upper Mississippi ................ Region 08 Lower Mississippi ................ Region 09 Souris-Red-Rainy ................ Region 10 Missouri ............................... Region 11 Arkansas-White-Red ........... Region 12 Texas-Gulf ........................... Region 13 Rio Grande .......................... Region 14 Upper Colorado ................... Region 15 Lower Colorado ................... Region 16 Great Basin ......................... Region 17 Pacific Northwest ................. Region 18 California ............................. Region 19 Alaska ................................. Region 20 Hawaii .................................
33,052 39,887
91 -
387 401
6,316
2,203 14 61
628 858
183
1,513 68 92 53
566 187
67 3
50
12 240 142 113 101
1,947 1,384
712 5
64
1,882 18
185 93 21
243
2,783 151
2 129
115
67 3,926 3,015
-
117 974
6 99
765
36 335
2,033 330 293
75
256 456
65 4,466
2,185 3,578 1,563 1,797
552
2,911 5,211 6,727
- 183
8,997,812 10,192,594
15,408 -
65,440 555,666
1,381,662
757,861 51
29,609 187,620 182,275
77,895
467,816 20,199 42,269 13,318
391,628
4,159 51,922
45 18,718
850
68,150 45,794 59,893 59,591
463,440 658,797 289,291
(D) 8,594
240,521
1,199 23,704 25,644
923
58,923 287,719
2,028 (D)
21,234
28,085 6,857
1,386,835 342,545
-
8,578 269,477
50 69,414
306,012
1,049 65,103
432,055 88,574 23,601
4,725
137,018 653,593 16,550
1,642,553
1,002,744 1,175,482
172,568 410,245 76,827
561,686
1,080,701 1,374,843
- 77,895
17,337 28,955
40 -
146 138
3,325
1,360 14 21 39
486
89 1,076
7 14
9
130 88 16
- 12
12 25 18 16 17
1,585
51 600
- 17
1,194
5 132
31 6
59
1,331 101
2 45
26 20
1,622 2,493
-
35 253
- 14
617
28 159 765
40 103
38 38
151 2
2,221
1,106 1,624
827 1,151
236
2,475 2,970 3,314
- 89
4,074,095 6,026,318
8,982 -
24,020 163,406
1,053,655
499,212 (D)
10,926 38,744 81,385
77,371
254,264 490
6,258 1,875
40,786
2,355 14,331
- 4,622
850
6,978 8,100 9,010
18,472
362,461 67,950
236,792 -
3,893
70,660 144
17,167 9,175
542
17,770 187,180
877 (D)
10,085
4,635 1,010
99,068 271,806
-
4,894 131,168
- 4,596
245,999
981 23,416
160,026 9,298 8,046
(D)
15,498 195,995
(D) 722,238
252,446 100,568 88,151
271,733 31,347
437,997 639,103
1,035,975 -
77,371
3,479 5,416
6 -
49 49
630
300 - 3 8 6
16
221 14
3 5
130
30 4 - 4
- 3 - 2
11
6 240
8 3 4
135
- 24
4 2
10
177 48
- 20
-
10 1,059
81 -
1 132
5 2
14
3 37 59
7 67
6
17 64
- 449
279
1,022 150
5 49
131 507 611
- 16
1,755,337 2,282,297
(D) -
7,804 74,601
529,251
114,325 -
1,196 9,638 2,958
69,110 88,311
868 4,215
65
143,078 419
1,320 -
390
- 1,248
- (D)
2,404
5,242 82,246 11,210
3 65
46,684
- 800 496 (D)
6,586
28,823 66
- 2,763
-
141 393,291 33,728
-
(D) 66,985
10 (D)
21,650
3 1,709
16,659 1,732
(D)
(D) 5,083
78,319 -
185,228
236,937 350,921 36,341
5,920 7,804
70,189
172,168 515,951
- 69,110
7,737 6,513
24 -
36 156 595
218
- 36
282 218
20
279 29 73 27
286
32 36
- 25
-
89 80 30 83
418 660
90 -
13
103 3
40 40 15
127 644
12 -
40
27 17
1,815 332
-
55 505
1 51 75
- 96
644 133
72
31 131 238
50 1,255
778
1,501 105 167
36
369 1,356
755 -
20
3,624,169 2,818,897
4,891 -
45,499 247,953 331,834
110,531
- 19,192 37,169 94,208
(D)
180,996 12,570 37,955
9,986
249,056 718
29,455 -
14,488
- 46,727 24,162 49,412 36,351
154,575 333,585 22,775
- 1,862
112,834
51 5,610
11,191 523
23,840 62,902
659 -
11,676
13,162 (D)
995,465 84,839
-
2,464 102,313
(D)54,265 42,808
- 38,436
152,761 61,415 17,919
(D)
93,651 350,424
7,900 619,666
501,623 814,425 30,170 95,017 45,499
96,338
353,820 340,599
- (D)
See footnote(s) at end of table. --continued
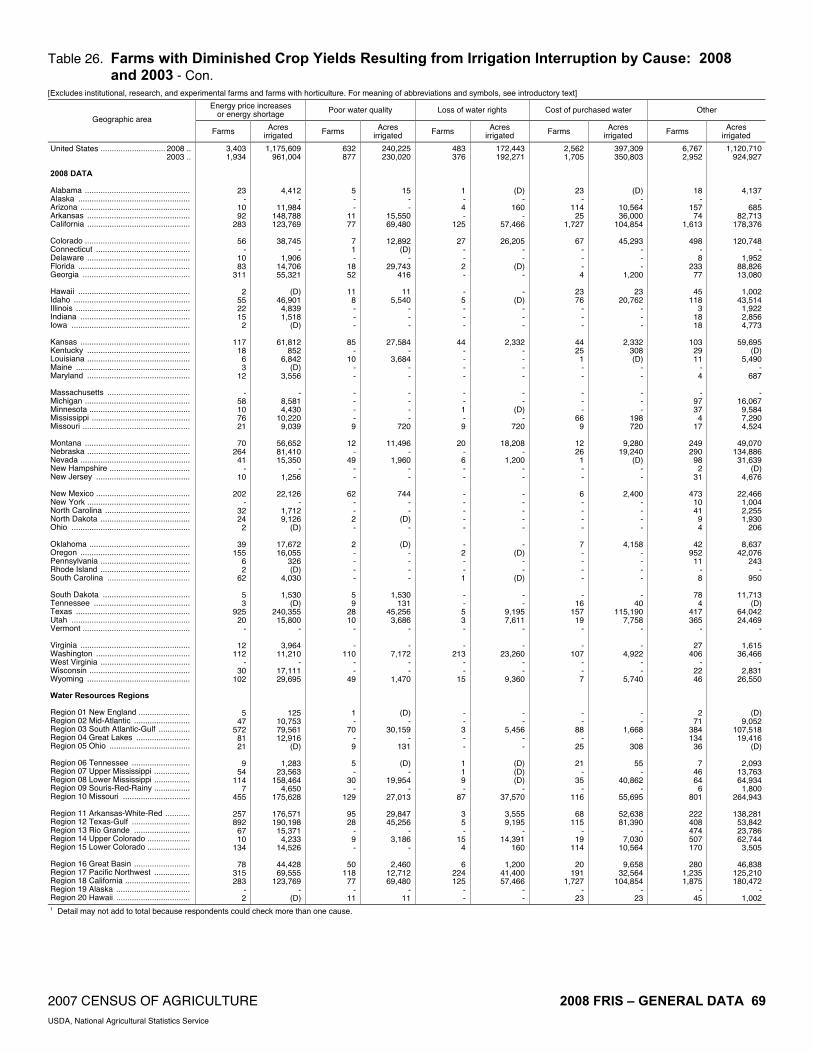
2007 CENSUS OF AGRICULTURE 2008 FRIS – GENERAL DATA 69 USDA, National Agricultural Statistics Service
Table 26. Farms with Diminished Crop Yields Resulting from Irrigation Interruption by Cause: 2008 and 2003 - Con.
[Excludes institutional, research, and experimental farms and farms with horticulture. For meaning of abbreviations and symbols, see introductory text]
Energy price increases or energy shortage Poor water quality Loss of water rights Cost of purchased water Other
Geographic area Farms Acres
irrigated Farms Acres irrigated Farms Acres
irrigated Farms Acres irrigated Farms Acres
irrigated
United States ............................. 2008 .. 2003 .. 2008 DATA Alabama ............................................... Alaska .................................................. Arizona ................................................. Arkansas .............................................. California .............................................. Colorado ............................................... Connecticut .......................................... Delaware .............................................. Florida .................................................. Georgia ................................................ Hawaii .................................................. Idaho .................................................... Illinois ................................................... Indiana ................................................. Iowa ..................................................... Kansas ................................................. Kentucky .............................................. Louisiana .............................................. Maine ................................................... Maryland .............................................. Massachusetts ..................................... Michigan ............................................... Minnesota ............................................. Mississippi ............................................ Missouri ................................................ Montana ............................................... Nebraska .............................................. Nevada ................................................. New Hampshire .................................... New Jersey .......................................... New Mexico .......................................... New York .............................................. North Carolina ...................................... North Dakota ........................................ Ohio ..................................................... Oklahoma ............................................. Oregon ................................................. Pennsylvania ........................................ Rhode Island ........................................ South Carolina ..................................... South Dakota ....................................... Tennessee ........................................... Texas ................................................... Utah ..................................................... Vermont ................................................ Virginia ................................................. Washington .......................................... West Virginia ........................................ Wisconsin ............................................. Wyoming .............................................. Water Resources Regions Region 01 New England ....................... Region 02 Mid-Atlantic ......................... Region 03 South Atlantic-Gulf .............. Region 04 Great Lakes ........................ Region 05 Ohio .................................... Region 06 Tennessee .......................... Region 07 Upper Mississippi ................ Region 08 Lower Mississippi ................ Region 09 Souris-Red-Rainy ................ Region 10 Missouri .............................. Region 11 Arkansas-White-Red ........... Region 12 Texas-Gulf .......................... Region 13 Rio Grande ......................... Region 14 Upper Colorado ................... Region 15 Lower Colorado ................... Region 16 Great Basin ......................... Region 17 Pacific Northwest ................ Region 18 California ............................. Region 19 Alaska ................................. Region 20 Hawaii .................................
3,403 1,934
23 -
10 92
283
56 -
10 83
311
2 55 22 15
2
117 18
6 3
12
- 58 10 76 21
70
264 41
- 10
202
- 32 24
2
39 155
6 2
62
5 3
925 20
-
12 112
- 30
102
5 47
572 81 21
9
54 114
7 455
257 892
67 10
134
78 315 283
- 2
1,175,609 961,004
4,412 -
11,984 148,788 123,769
38,745
- 1,906
14,706 55,321
(D)
46,901 4,839 1,518
(D)
61,812 852
6,842 (D)
3,556
- 8,581 4,430
10,220 9,039
56,652 81,410 15,350
- 1,256
22,126
- 1,712 9,126
(D)
17,672 16,055
326 (D)
4,030
1,530 (D)
240,355 15,800
-
3,964 11,210
- 17,111 29,695
125 10,753 79,561 12,916
(D)
1,283 23,563
158,464 4,650
175,628
176,571 190,198 15,371
4,233 14,526
44,428 69,555
123,769 -
(D)
632 877
5 - -
11 77
7 1 -
18 52
11
8 - - -
85 -
10 - -
- - - - 9
12
- 49
- -
62 - - 2 -
2 - - - -
5 9
28 10
-
- 110
- -
49
1 -
70 - 9
5 -
30 -
129
95 28
- 9 -
50 118
77 -
11
240,225 230,020
15 - -
15,550 69,480
12,892
(D)-
29,743 416
11
5,540 - - -
27,584 -
3,684 - -
- - - -
720
11,496 -
1,960 - -
744 - -
(D)-
(D)- - - -
1,530 131
45,256 3,686
-
- 7,172
- -
1,470
(D)-
30,159 -
131
(D)-
19,954 -
27,013
29,847 45,256
- 3,186
-
2,460 12,712 69,480
- 11
483 376
1 - 4 -
125
27 - - 2 -
- 5 - - -
44 - - - -
- - 1 - 9
20
- 6 - -
- - - - -
- 2 - - 1
- - 5 3 -
- 213
- -
15
- - 3 - -
1 1 9 -
87
3 5 -
15 4
6
224 125
- -
172,443 192,271
(D)-
160 -
57,466
26,205 - -
(D)-
- (D)
- - -
2,332 - - - -
- -
(D)-
720
18,208 -
1,200 - -
- - - - -
- (D)
- -
(D)
- -
9,195 7,611
-
- 23,260
- -
9,360
- -
5,456 - -
(D)(D)(D)
- 37,570
3,555 9,195
- 14,391
160
1,200 41,400 57,466
- -
2,562 1,705
23 -
114 25
1,727
67 - - - 4
23 76
- - -
44 25
1 - -
- - -
66 9
12 26
1 - -
6 - - - -
7 - - - -
- 16
157 19
-
- 107
- - 7
- -
88 -
25
21 -
35 -
116
68 115
- 19
114
20 191
1,727 -
23
397,309 350,803
(D) -
10,564 36,000
104,854
45,293 - - -
1,200
23 20,762
- - -
2,332 308 (D)
- -
- - -
198 720
9,280
19,240 (D)
- -
2,400 - - - -
4,158 - - - -
- 40
115,190 7,758
-
- 4,922
- -
5,740
- -
1,668 -
308
55 -
40,862 -
55,695
52,638 81,390
- 7,030
10,564
9,658 32,564
104,854 -
23
6,767 2,952
18 -
157 74
1,613
498 - 8
233 77
45
118 3
18 18
103
29 11
- 4
-
97 37
4 17
249 290
98 2
31
473 10 41
9 4
42
952 11
- 8
78
4 417 365
-
27 406
- 22 46
2 71
384 134
36
7 46 64
6 801
222 408 474 507 170
280
1,235 1,875
- 45
1,120,710 924,927
4,137 -
685 82,713
178,376
120,748 -
1,952 88,826 13,080
1,002
43,514 1,922 2,856 4,773
59,695
(D)5,490
- 687
-
16,067 9,584 7,290 4,524
49,070
134,886 31,639
(D)4,676
22,466
1,004 2,255 1,930
206
8,637 42,076
243 -
950
11,713 (D)
64,042 24,469
-
1,615 36,466
- 2,831
26,550
(D)9,052
107,518 19,416
(D)
2,093 13,763 64,934
1,800 264,943
138,281 53,842 23,786 62,744
3,505
46,838 125,210 180,472
- 1,002
1 Detail may not add to total because respondents could check more than one cause.

70 2008 FRIS – GENERAL DATA 2007 CENSUS OF AGRICULTURE USDA, National Agricultural Statistics Service
Table 27. Crops Harvested from Irrigated Farms: 2008 and 2003 [Excludes institutional, research, and experimental farms and farms with horticulture. For meaning of abbreviations and symbols, see introductory text]
Corn for grain or seed
Irrigated Non-irrigated
Farms by acres harvested Geographic area
Farms Acres harvested
Average yield per
acre (bushels)
1 to 99 acres
100 to 249 acres
250 to 499 acres
500 to 999 acres
1,000 acres or more
Farms Acres harvested
Average yield per
acre (bushels)
United States .............................2008 .. 2003 .. 2008 DATA Alabama ............................................... Alaska ................................................... Arizona ................................................. Arkansas ............................................... California .............................................. Colorado ............................................... Connecticut ........................................... Delaware .............................................. Florida ................................................... Georgia ................................................. Hawaii ................................................... Idaho ..................................................... Illinois .................................................... Indiana .................................................. Iowa ...................................................... Kansas .................................................. Kentucky ............................................... Louisiana .............................................. Maine .................................................... Maryland ............................................... Massachusetts ...................................... Michigan ............................................... Minnesota ............................................. Mississippi ............................................ Missouri ................................................ Montana ................................................ Nebraska .............................................. Nevada ................................................. New Hampshire .................................... New Jersey ........................................... New Mexico .......................................... New York .............................................. North Carolina ...................................... North Dakota ........................................ Ohio ...................................................... Oklahoma ............................................. Oregon .................................................. Pennsylvania ........................................ Rhode Island ........................................ South Carolina ...................................... South Dakota ........................................ Tennessee ............................................ Texas .................................................... Utah ...................................................... Vermont ................................................ Virginia .................................................. Washington ........................................... West Virginia ........................................ Wisconsin ............................................. Wyoming ............................................... Water Resources Regions Region 01 New England ....................... Region 02 Mid-Atlantic .......................... Region 03 South Atlantic-Gulf .............. Region 04 Great Lakes ......................... Region 05 Ohio ..................................... Region 06 Tennessee ........................... Region 07 Upper Mississippi ................ Region 08 Lower Mississippi ................ Region 09 Souris-Red-Rainy ................ Region 10 Missouri ............................... Region 11 Arkansas-White-Red ........... Region 12 Texas-Gulf ........................... Region 13 Rio Grande .......................... Region 14 Upper Colorado ................... Region 15 Lower Colorado ................... Region 16 Great Basin ......................... Region 17 Pacific Northwest ................. Region 18 California ............................. Region 19 Alaska ................................. Region 20 Hawaii .................................
33,571 32,231
140 -
40 960 433
2,337
- 223
72 1,174
10
540 875 778 430
2,896
76 470
- 231
5
778 1,071
522 1,057
162
12,530 - 2
43
88 9
210 311
23
211 291
16 -
158
669 72
1,998 296
-
86 402
2 479 395
7 587
1,761 1,098
554
55 2,616 2,483
228 17,097
3,736 1,040
78 230
44
273 1,241
433 -
10
11,991,515 9,747,474
24,111 -
13,987 381,321 122,554
796,040
- 49,381
9,899 155,035
2,037
72,800 309,187 244,574 107,979
1,368,126
14,099 212,824
- 36,981
(D)
248,790 254,960 351,869 361,275
28,653
5,058,195 -
(D) 5,620
(D)
375 24,738 90,271
7,260
95,182 32,584
912 -
35,411
175,593 17,794
954,026 26,848
-
12,729 87,919
(D) 105,809 39,896
134 104,218 244,887 330,435 156,931
15,763
734,442 1,159,644
64,333 6,541,812
1,839,620
376,884 8,980
53,182 17,621
23,995
194,043 122,554
- 2,037
181 178
173 -
182 163 177
174
- 190 155 171
(D)
179 190 176 171
191 174 161
- 188
(D)
175 174 175 172
150 184
- (D)
178
191 198 127 156 162
188 209 138
- 162
173 190 184 152
-
181 185 (D)
166 145
109 189 164 174 176
187 179 169 163 182
193 151 (D)
184 179
151 186 177
- (D)
8,281 10,798
69 -
10 217
70
696 -
83 45
675
1 338 169 178 100
400
30 126
- 112
5
328 345
22 250
58
1,965 - 2
22
24 9
163 88
6
21 195
14 -
63
175 26
252 253
-
51 161
- 192 272
7 275
1,024 430 114
13
765 484
49 3,168
621 141
53 121
10
237 698
70 - 1
10,720 9,406
34 -
17 267 293
672
- 74 14
313
5 136 325 289 204
941
28 84
- 77
-
211 458 129 331
69
4,130 - -
15
19 -
13 96
9
88 72
2 -
48
272 22
532 25
-
22 142
2 160
80
- 186 432 336 248
18
971 641
95 5,683
1,101
275 21 22 17
22
354 293
- 5
7,539 6,153
26 - 6
211 36
567
- 40 10
135
4 40
177 171
77
696 13
114 -
28
- 108 166 135 267
24
3,243 - - 6
19
- 18 82
5
44 17
- -
26
155 14
664 13
-
6 65
- 84 27
- 79
208 163 114
13
487 577
55 4,290
913 372
4 82
8
12 122
36 - 4
4,610 4,218
8 - 5
181 17
238
- 24
1 45
-
22 144
98 34
512
4 83
- 12
-
70 64
137 133
7
2,152 - - -
15 -
16 28
2
33 4 - -
15
46 7
375 5 -
6 24
- 29 14
- 42 83 95 58
7
269 469
16 2,648
634 212
- 3 5
2
50 17
- -
2,421 1,656
3 - 2
84 17
164
- 2 2 6
- 4
60 42 15
347
1 63
- 2
-
61 38 99 76
4
1,040 - - -
11 - -
17 1
25
3 - - 6
21
3 175
- -
1 10
- 14
2
- 5
14 74 20
4
124 312
13 1,308
467
40 - 2 4
-
17 17
- -
19,045 18,273
133 - -
181 4
257
20 191
7 257
- -
818 808 428
1,454
198 278
1 284
-
742 893 218 579
-
8,525 - -
34
5 32
294 232 108
44
- 259
- 139
605 115 280
- -
127 2 8
483 2
21 835 842
1,177 744
74
2,359 1,005
213 10,553
966 250
- - -
- 2 4 - -
5,075,025 4,882,482
54,460 - -
22,857 600
87,610
(D)51,463
1,837 20,179
- -
409,642 459,093 205,225
475,908 64,366
126,755 (D)
50,911
- 258,096 272,178 91,718
140,825
- 1,230,756
- -
4,263
860 20,250 82,803
162,710 33,585
18,012
- 26,300
- 48,228
301,760 46,858
110,317 - -
39,380 (D)
542 153,058
(D)
450 160,795 182,925 397,563 418,479
(D)
919,326 315,202 102,475
2,194,662
226,333 104,218
- - -
- (D)
600 - -
129 106
102 - -
120 138
56 (D)
105 74 56
- -
177 159 163
84
136 136 (D)
113
- 130 147 138 142
-
129 - -
105
39 153
56 131 127
78
- 145
- 54
134 121
47 - -
116 (D)
136 127 (D)
104 117
63 129 159
106 160 137 135 124
79 (D)
- - -
- (D)
138 - -
See footnote(s) at end of table. --continued
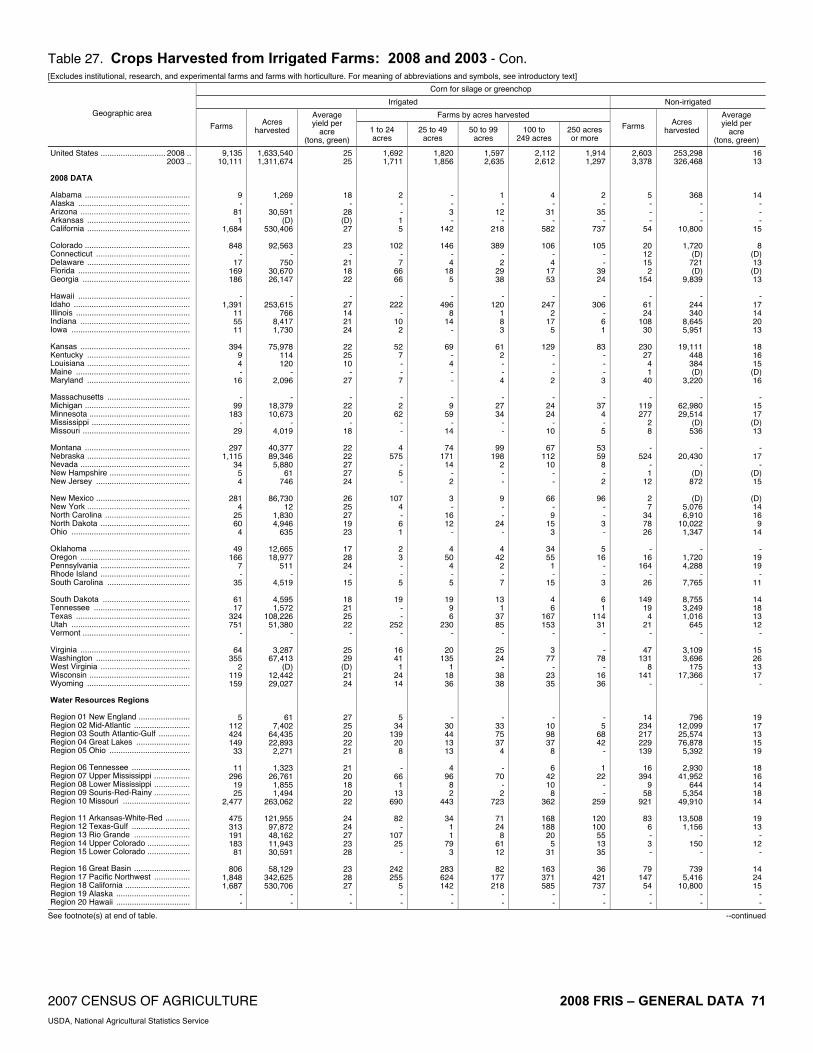
2007 CENSUS OF AGRICULTURE 2008 FRIS – GENERAL DATA 71 USDA, National Agricultural Statistics Service
Table 27. Crops Harvested from Irrigated Farms: 2008 and 2003 - Con. [Excludes institutional, research, and experimental farms and farms with horticulture. For meaning of abbreviations and symbols, see introductory text]
Corn for silage or greenchop
Irrigated Non-irrigated
Farms by acres harvested Geographic area
Farms Acres harvested
Average yield per
acre (tons, green)
1 to 24 acres
25 to 49 acres
50 to 99 acres
100 to 249 acres
250 acres or more
Farms Acres harvested
Average yield per
acre (tons, green)
United States ............................. 2008 .. 2003 .. 2008 DATA Alabama ............................................... Alaska .................................................. Arizona ................................................. Arkansas .............................................. California .............................................. Colorado ............................................... Connecticut .......................................... Delaware .............................................. Florida .................................................. Georgia ................................................ Hawaii .................................................. Idaho .................................................... Illinois ................................................... Indiana ................................................. Iowa ..................................................... Kansas ................................................. Kentucky .............................................. Louisiana .............................................. Maine ................................................... Maryland .............................................. Massachusetts ..................................... Michigan ............................................... Minnesota ............................................. Mississippi ............................................ Missouri ................................................ Montana ............................................... Nebraska .............................................. Nevada ................................................. New Hampshire .................................... New Jersey .......................................... New Mexico .......................................... New York .............................................. North Carolina ...................................... North Dakota ........................................ Ohio ..................................................... Oklahoma ............................................. Oregon ................................................. Pennsylvania ........................................ Rhode Island ........................................ South Carolina ..................................... South Dakota ....................................... Tennessee ........................................... Texas ................................................... Utah ..................................................... Vermont ................................................ Virginia ................................................. Washington .......................................... West Virginia ........................................ Wisconsin ............................................. Wyoming .............................................. Water Resources Regions Region 01 New England ....................... Region 02 Mid-Atlantic ......................... Region 03 South Atlantic-Gulf .............. Region 04 Great Lakes ........................ Region 05 Ohio .................................... Region 06 Tennessee .......................... Region 07 Upper Mississippi ................ Region 08 Lower Mississippi ................ Region 09 Souris-Red-Rainy ................ Region 10 Missouri .............................. Region 11 Arkansas-White-Red ........... Region 12 Texas-Gulf .......................... Region 13 Rio Grande ......................... Region 14 Upper Colorado ................... Region 15 Lower Colorado ................... Region 16 Great Basin ......................... Region 17 Pacific Northwest ................ Region 18 California ............................. Region 19 Alaska ................................. Region 20 Hawaii .................................
9,135 10,111
9 -
81 1
1,684
848 -
17 169 186
-
1,391 11 55 11
394
9 4 -
16
- 99
183 -
29
297 1,115
34 5 4
281
4 25 60
4
49 166
7 -
35
61 17
324 751
-
64 355
2 119 159
5 112 424 149
33
11 296
19 25
2,477
475 313 191 183
81
806 1,848 1,687
- -
1,633,540 1,311,674
1,269 -
30,591 (D)
530,406
92,563 -
750 30,670 26,147
-
253,615 766
8,417 1,730
75,978
114 120
- 2,096
-
18,379 10,673
- 4,019
40,377 89,346
5,880 61
746
86,730 12
1,830 4,946
635
12,665 18,977
511 -
4,519
4,595 1,572
108,226 51,380
-
3,287 67,413
(D) 12,442 29,027
61 7,402
64,435 22,893
2,271
1,323 26,761
1,855 1,494
263,062
121,955 97,872 48,162 11,943 30,591
58,129
342,625 530,706
- -
25 25
18 -
28 (D) 27
23
- 21 18 22
-
27 14 21 24
22 25 10
- 27
-
22 20
- 18
22 22 27 27 24
26 25 27 19 23
17 28 24
- 15
18 21 25 22
-
25 29 (D) 21 24
27 25 20 22 21
21 20 18 20 22
24 24 27 23 28
23 28 27
- -
1,692 1,711
2 - - 1 5
102
- 7
66 66
-
222 -
10 2
52
7 - - 7
- 2
62 - -
4 575
- 5 -
107 4 - 6 1
2 3 - - 5
19
- -
252 -
16 41
1 24 14
5 34
139 20
8
- 66
1 13
690
82 -
107 25
-
242 255
5 - -
1,820 1,856
- - 3 -
142
146 - 4
18 5
-
496 8
14 -
69 - 4 - -
- 9
59 -
14
74 171
14 - 2
3 -
16 12
-
4 50
4 - 5
19
9 6
230 -
20 135
1 18 36
- 30 44 13 13
4
96 8 2
443
34 1 1
79 3
283 624 142
- -
1,597 2,635
1 -
12 -
218
389 - 2
29 38
-
120 1 8 3
61
2 - - 4
-
27 34
- -
99 198
2 - -
9 - -
24 -
4 42
2 - 7
13
1 37 85
-
25 24
- 38 38
- 33 75 37
4
- 70
- 2
723
71 24
8 61 12
82
177 218
- -
2,112 2,612
4 -
31 -
582
106 - 4
17 53
-
247 2
17 5
129
- - - 2
-
24 24
- 10
67
112 10
- -
66 - 9
15 3
34 55
1 -
15
4 6
167 153
-
3 77
- 23 35
- 10 98 37
8
6 42 10
8 362
168 188
20 5
31
163 371 585
- -
1,914 1,297
2 -
35 -
737
105 - -
39 24
-
306 - 6 1
83
- - - 3
-
37 4 - 5
53 59
8 - 2
96
- - 3 -
5 16
- - 3
6 1
114 31
-
- 78
- 16 36
- 5
68 42
-
1 22
- -
259
120 100
55 13 35
36
421 737
- -
2,603 3,378
5 - - -
54
20 12 15
2 154
-
61 24
108 30
230
27 4 1
40
- 119 277
2 8
-
524 - 1
12
2 7
34 78 26
-
16 164
- 26
149
19 4
21 -
47 131
8 141
-
14 234 217 229 139
16
394 9
58 921
83
6 - 3 -
79 147
54 - -
253,298 326,468
368 - - -
10,800
1,720 (D)
721 (D)
9,839
- 244 340
8,645 5,951
19,111
448 384 (D)
3,220
- 62,980 29,514
(D)536
-
20,430 -
(D)872
(D)
5,076 6,910
10,022 1,347
-
1,720 4,288
- 7,765
8,755 3,249 1,016
645 -
3,109 3,696
175 17,366
-
796 12,099 25,574 76,878
5,392
2,930 41,952
644 5,354
49,910
13,508 1,156
- 150
-
739 5,416
10,800 - -
16 13
14 - - -
15
8 (D)13 (D)13
-
17 14 20 13
18 16 15 (D)16
-
15 17 (D)13
-
17 -
(D)15
(D)14 16
9 14
-
19 19
- 11
14 18 13 12
-
15 26 13 17
-
19 17 13 15 19
18 16 14 18 14
19 13
- 12
-
14 24 15
- -
See footnote(s) at end of table. --continued

72 2008 FRIS – GENERAL DATA 2007 CENSUS OF AGRICULTURE USDA, National Agricultural Statistics Service
Table 27. Crops Harvested from Irrigated Farms: 2008 and 2003 - Con. [Excludes institutional, research, and experimental farms and farms with horticulture. For meaning of abbreviations and symbols, see introductory text]
Sorghum for grain or seed
Irrigated Non-irrigated
Farms by acres harvested Geographic area
Farms Acres harvested
Average yield per
acre (bushels)
1 to 49 acres
50 to 99 acres
100 to 249 acres
250 to 499 acres
500 acres or more
Farms Acres harvested
Average yield per
acre (bushels)
United States .............................2008 .. 2003 .. 2008 DATA Alabama ............................................... Alaska ................................................... Arizona ................................................. Arkansas ............................................... California .............................................. Colorado ............................................... Connecticut ........................................... Delaware .............................................. Florida ................................................... Georgia ................................................. Hawaii ................................................... Idaho ..................................................... Illinois .................................................... Indiana .................................................. Iowa ...................................................... Kansas .................................................. Kentucky ............................................... Louisiana .............................................. Maine .................................................... Maryland ............................................... Massachusetts ...................................... Michigan ............................................... Minnesota ............................................. Mississippi ............................................ Missouri ................................................ Montana ................................................ Nebraska .............................................. Nevada ................................................. New Hampshire .................................... New Jersey ........................................... New Mexico .......................................... New York .............................................. North Carolina ...................................... North Dakota ........................................ Ohio ...................................................... Oklahoma ............................................. Oregon .................................................. Pennsylvania ........................................ Rhode Island ........................................ South Carolina ...................................... South Dakota ........................................ Tennessee ............................................ Texas .................................................... Utah ...................................................... Vermont ................................................ Virginia .................................................. Washington ........................................... West Virginia ........................................ Wisconsin ............................................. Wyoming ............................................... Water Resources Regions Region 01 New England ....................... Region 02 Mid-Atlantic .......................... Region 03 South Atlantic-Gulf .............. Region 04 Great Lakes ......................... Region 05 Ohio ..................................... Region 06 Tennessee ........................... Region 07 Upper Mississippi ................ Region 08 Lower Mississippi ................ Region 09 Souris-Red-Rainy ................ Region 10 Missouri ............................... Region 11 Arkansas-White-Red ........... Region 12 Texas-Gulf ........................... Region 13 Rio Grande .......................... Region 14 Upper Colorado ................... Region 15 Lower Colorado ................... Region 16 Great Basin ......................... Region 17 Pacific Northwest ................. Region 18 California ............................. Region 19 Alaska ................................. Region 20 Hawaii .................................
4,118 6,134
- -
80 290
39
103 - - 2
45
1 - 4 1 -
779 -
18 - -
- - -
25 70
-
172 - - -
69 - 2 - -
137 - - - 1
6 2
2,263 9 -
- - - - -
- -
50 - -
- 5
319 -
438
1,518 1,597
60 -
82
9 -
39 - 1
1,042,392 1,108,375
- -
24,328 65,738 14,620
8,308
- -
(D) 8,201
(D)
- 103 (D)
-
107,525 -
4,833 - -
- - -
3,895 3,135
-
12,100 - - -
15,262 -
(D) - -
26,832 - - -
(D)
456 (D)
743,172 540
-
- - - - -
- -
(D) - -
- (D)
73,200 -
31,551
332,814 545,110
8,621 -
24,428
540 -
14,620 -
(D)
77 75
- -
93 101 104
52
- -
(D) 43
(D)
- 114 (D)
-
99 -
79 - -
- - -
77 104
-
109 - - -
89 -
(D) - -
67 - - -
(D)
88 (D) 71
110 -
- - - - -
- -
(D) - -
- (D)
100 -
107
84 67
100 -
93
110 -
104 -
(D)
372 1,944
- - -
40 4
66
- - -
21
1 - 4 - -
127 - - - -
- - - 4
48
- - - - -
11 - 2 - -
8 - - - 1
- 1
34 - -
- - - - -
- -
24 - -
- 4
39 -
144
111 37
8 - -
- - 4 - 1
1,020 1,277
- -
13 31 10
21
- - 2 3
- - - - -
212 - 7 - -
- - - 4
15
- 144
- - -
24 - - - -
33 - - - -
3 -
489 9 -
- - - - -
- - 5 - -
- -
45 -
182
405 335
14 -
15
9 -
10 - -
1,384 1,514
- -
37 127
-
15 - - - 7
- - - - -
331 - 5 - -
- - -
14 6
-
28 - - -
14 - - - -
72 - - - -
3 1
724 - -
- - - - -
- - 7 - -
- -
133 -
106
604 468
29 -
37
- - - - -
584 863
- -
19 45 19
- - - - 9
- - - - -
77 - 3 - -
- - - 2 1
- - - - -
13 - - - -
12 - - - -
- -
384 - -
- - - - -
- - 9 - -
- -
51 - 5
223 250
8 -
19
- -
19 - -
758 536
- -
11 47
6
1 - - - 5
- - - 1 -
32 - 3 - -
- - - 1 -
- - - - -
7 - - - -
12 - - - -
- -
632 - -
- - - - -
- - 5 - -
- 1
51 - 1
175 507
1 -
11
- - 6 - -
4,490 6,298
7 - -
168 -
54 - 3 2
116
- -
38 11
-
1,760 1
67 -
36
- - 3
99 103
-
477 - - -
45 - 8 - -
73 - 3 - 2
2 6
1,402 - -
- - - 4 -
- 42
131 -
17
5 44
415 -
1,226
1,526 1,084
- - -
- - - - -
1,512,558 1,630,609
725 - -
37,395 -
42,332 -
131 (D)
7,539
- -
2,779 1,139
-
641,319 (D)
26,246 -
1,418
- -
918 30,703 23,052
-
49,854 - - -
9,066 -
1,800 - -
21,987 -
120 -
(D)
(D)2,086
608,407 - -
- - -
720 -
- 1,669
12,446 -
1,515
170 5,451
113,011 -
289,662
615,357 473,277
- - -
- - - - -
54 43
41 - -
75 -
33 -
46 (D)41
- -
78 60
-
72 (D)82
- 64
- -
32 59 92
-
68 - - -
19 -
65 - -
36 -
57 -
(D)
(D)115
33 - -
- - -
57 -
- 62 46
- 78
57 68 76
- 76
55 35
- - -
- - - - -
See footnote(s) at end of table. --continued

2007 CENSUS OF AGRICULTURE 2008 FRIS – GENERAL DATA 73 USDA, National Agricultural Statistics Service
Table 27. Crops Harvested from Irrigated Farms: 2008 and 2003 - Con. [Excludes institutional, research, and experimental farms and farms with horticulture. For meaning of abbreviations and symbols, see introductory text]
Wheat for grain or seed
Irrigated Non-irrigated
Farms by acres harvested Geographic area
Farms Acres harvested
Average yield per
acre (bushels)
1 to 49 acres
50 to 99 acres
100 to 249 acres
250 to 499 acres
500 acres or more
Farms Acres harvested
Average yield per
acre (bushels)
United States ............................. 2008 .. 2003 .. 2008 DATA Alabama ............................................... Alaska .................................................. Arizona ................................................. Arkansas .............................................. California .............................................. Colorado ............................................... Connecticut .......................................... Delaware .............................................. Florida .................................................. Georgia ................................................ Hawaii .................................................. Idaho .................................................... Illinois ................................................... Indiana ................................................. Iowa ..................................................... Kansas ................................................. Kentucky .............................................. Louisiana .............................................. Maine ................................................... Maryland .............................................. Massachusetts ..................................... Michigan ............................................... Minnesota ............................................. Mississippi ............................................ Missouri ................................................ Montana ............................................... Nebraska .............................................. Nevada ................................................. New Hampshire .................................... New Jersey .......................................... New Mexico .......................................... New York .............................................. North Carolina ...................................... North Dakota ........................................ Ohio ..................................................... Oklahoma ............................................. Oregon ................................................. Pennsylvania ........................................ Rhode Island ........................................ South Carolina ..................................... South Dakota ....................................... Tennessee ........................................... Texas ................................................... Utah ..................................................... Vermont ................................................ Virginia ................................................. Washington .......................................... West Virginia ........................................ Wisconsin ............................................. Wyoming .............................................. Water Resources Regions Region 01 New England ....................... Region 02 Mid-Atlantic ......................... Region 03 South Atlantic-Gulf .............. Region 04 Great Lakes ........................ Region 05 Ohio .................................... Region 06 Tennessee .......................... Region 07 Upper Mississippi ................ Region 08 Lower Mississippi ................ Region 09 Souris-Red-Rainy ................ Region 10 Missouri .............................. Region 11 Arkansas-White-Red ........... Region 12 Texas-Gulf .......................... Region 13 Rio Grande ......................... Region 14 Upper Colorado ................... Region 15 Lower Colorado ................... Region 16 Great Basin ......................... Region 17 Pacific Northwest ................ Region 18 California ............................. Region 19 Alaska ................................. Region 20 Hawaii .................................
16,265 13,524
17 -
254 160
1,338
997 -
77 6
321
- 2,062
49 69
2
1,541 -
23 -
75
- 88 88 13 87
1,235 1,000
46 - 8
174
2 51
144 -
479 747
- -
38
81 3
2,583 952
-
8 1,195
- 27
225
- 170 429
98 30
5
158 243
75 3,495
3,189 1,373
270 156 265
1,111 3,831 1,367
- -
4,107,464 3,267,978
1,850 -
138,472 46,737
493,133
171,323 -
10,929 1,750
65,933
- 638,220
5,312 10,163
(D)
455,558 -
6,706 -
7,992
- 16,732
9,450 3,941
27,163
212,886 174,922 12,282
- 1,635
83,868
(D) 4,610
30,427 -
147,489 177,497
- -
6,748
15,948 675
796,071 44,356
-
655 260,958
- 2,176
22,861
- 21,225 80,183 17,672
8,911
1,058 12,392 70,852
9,921 598,607
1,117,022
324,595 53,841 14,539
142,692
80,748 1,056,344
496,862 - -
75 76
75 -
109 61 99
75
- 83 75 67
-
104 60 66 (D)
57
- 59
- 78
-
73 60 57 63
69 66 81
- 73
46 (D) 45 56
-
49 105
- -
67
56 72 43 94
-
71 97
- 69 57
- 80 66 73 59
85 67 62 58 66
49 42 82 84
109
88 103
99 - -
3,352 2,806
2 - 3 8
194
281 -
18 -
89
- 382
22 21
2
89 - - -
28
- 29 43
1 13
391
79 28
- 2
4 2
25 20
-
14 287
- -
11
7 -
65 724
-
5 437
- 4
22
- 55
127 31
-
- 75 14 20
727
31 65 98
105 3
703
1,088 210
- -
2,691 2,609
2 -
31 31
122
183 -
30 2
21
- 467
17 16
-
224 - 2 -
17
- 14 19
- 14
215 254
2 - 1
23
- 11 24
-
86 43
- - 2
18
- 432 109
-
- 104
- 18
137
- 48 38 17 11
-
48 47 14
779
441 311
19 28 31
178 556 125
- -
5,505 4,562
12 -
64 45
439
349 -
15 2
112
- 614
6 27
-
557 - 8 -
24
- 32 19
9 24
350 533
8 - 4
71
- 12 62
-
213 243
- -
18
36 2
1,074 82
-
3 386
- 4
46
- 46
153 37 12
3
27 78 34
1,328
1,271 564
89 22 68
173
1,153 447
- -
2,684 1,914
1 -
49 44
340
118 - 9 -
67
- 303
- 2 -
427 - 9 - 6
- 9 5 1
24
212 61
4 - -
38 - 1
28 -
90 105
- - 3
17
1 525
25 -
- 144
- 1
15
- 15 71
9 2
2 5
55 6
445
787 274
33 -
55
33 553 339
- -
2,033 1,633
- -
107 32
243
66 - 5 2
32
- 296
4 3 -
244 - 4 - -
- 4 2 2
12
67 73
4 - 1
38
- 2
10 -
76 69
- - 4
3 -
487 12
-
- 124
- - 5
- 6
40 4 5
- 3
49 1
216
659 159
31 1
108
24 481 246
- -
17,097 16,859
77 - -
1,467 50
485
- 131
1 492
-
237 325 210
17
3,095 94
224 -
195
- 290 316 391 602
704
3,414 - -
28
90 16
271 302
39
549 189 151
- 84
308
79 1,446
162 -
104 138
- 170 154
- 571 930 431 311
42
708 2,390
194 6,394
3,599
665 28 29
-
273 481
51 - -
7,361,506 6,871,079
30,094 - -
561,866 52,000
418,435
- 24,743
(D)96,724
-
67,138 45,652 26,818
1,460
2,136,155 19,261 78,969
- 34,292
-
39,954 49,360
207,352 203,693
342,921 407,390
- -
4,196
188,654 4,276
97,281 248,265
5,964
421,077 72,129
7,877 -
23,831
183,626 38,422
786,096 26,461
-
29,522 195,928
- 15,704
165,920
- 91,839
239,140 54,422 59,208
24,637 83,284
994,268 99,325
2,391,478
2,436,490 293,796 137,440 27,731
-
55,696 319,752 53,000
- -
40 39
74 - -
73 31
27
- 75 (D)55
-
26 60 65 28
39 64 60
- 67
-
64 51 63 56
31 50
- -
68
11 64 39 36 72
32 60 68
- 58
56 70 17 23
-
80 31
- 53 19
- 73 50 64 66
79 53 68 50 40
30 19 11 14
-
25 37 32
- -
See footnote(s) at end of table. --continued

74 2008 FRIS – GENERAL DATA 2007 CENSUS OF AGRICULTURE USDA, National Agricultural Statistics Service
Table 27. Crops Harvested from Irrigated Farms: 2008 and 2003 - Con. [Excludes institutional, research, and experimental farms and farms with horticulture. For meaning of abbreviations and symbols, see introductory text]
Barley for grain or seed
Irrigated Non-irrigated
Farms by acres harvested Geographic area
Farms Acres harvested
Average yield per
acre (bushels)
1 to 24 acres
25 to 49 acres
50 to 99 acres
100 to 249 acres
250 acres or more
Farms Acres harvested
Average yield per
acre (bushels)
United States .............................2008 .. 2003 .. 2008 DATA Alabama ............................................... Alaska ................................................... Arizona ................................................. Arkansas ............................................... California .............................................. Colorado ............................................... Connecticut ........................................... Delaware .............................................. Florida ................................................... Georgia ................................................. Hawaii ................................................... Idaho ..................................................... Illinois .................................................... Indiana .................................................. Iowa ...................................................... Kansas .................................................. Kentucky ............................................... Louisiana .............................................. Maine .................................................... Maryland ............................................... Massachusetts ...................................... Michigan ............................................... Minnesota ............................................. Mississippi ............................................ Missouri ................................................ Montana ................................................ Nebraska .............................................. Nevada ................................................. New Hampshire .................................... New Jersey ........................................... New Mexico .......................................... New York .............................................. North Carolina ...................................... North Dakota ........................................ Ohio ...................................................... Oklahoma ............................................. Oregon .................................................. Pennsylvania ........................................ Rhode Island ........................................ South Carolina ...................................... South Dakota ........................................ Tennessee ............................................ Texas .................................................... Utah ...................................................... Vermont ................................................ Virginia .................................................. Washington ........................................... West Virginia ........................................ Wisconsin ............................................. Wyoming ............................................... Water Resources Regions Region 01 New England ....................... Region 02 Mid-Atlantic .......................... Region 03 South Atlantic-Gulf .............. Region 04 Great Lakes ......................... Region 05 Ohio ..................................... Region 06 Tennessee ........................... Region 07 Upper Mississippi ................ Region 08 Lower Mississippi ................ Region 09 Souris-Red-Rainy ................ Region 10 Missouri ............................... Region 11 Arkansas-White-Red ........... Region 12 Texas-Gulf ........................... Region 13 Rio Grande .......................... Region 14 Upper Colorado ................... Region 15 Lower Colorado ................... Region 16 Great Basin ......................... Region 17 Pacific Northwest ................. Region 18 California ............................. Region 19 Alaska ................................. Region 20 Hawaii .................................
4,334 4,651
- -
90 -
46
320 -
15 - -
- 1,446
- 1 -
- - - -
14
- 2 6 - -
927 - 8 - -
4 - -
83 -
- 201
- - -
11 -
24 702
-
1 14
- -
419
- 30
- 3 -
- 6 -
12 1,375
26
1 243
26 90
853
1,593 76
- -
762,240 990,827
- -
28,459 -
11,836
71,675 -
1,919 - -
- 329,449
- (D)
-
- - - -
918
- (D)
876 - -
180,238 -
1,330 - -
335 - -
17,088 -
- 15,159
- - -
622 -
3,840 27,027
-
(D) 1,279
- -
68,620
- 3,587
- (D)
-
- 876
- 1,618
261,260
4,080 (D)
63,115 (D)
28,459
49,475 330,799 15,202
- -
100 96
- -
116 -
71
126 -
98 - -
- 106
- (D)
-
- - - -
84
- (D) 65
- -
82 -
112 - -
81 - -
80 -
- 81
- - -
63 -
106 86
-
(D) 103
- -
99
- 96
- (D)
-
- 65
- 78 87
104 (D)
132 (D)
116
90 105
75 - -
736 962
- - - - -
3 - - - -
- 169
- - -
- - - - 2
- 2 - - -
70 - - - -
1 - - 7 -
- 14
- - -
- - -
403 -
- 3 - -
62
- 2 - 2 -
- - - -
134
- - 1 - -
403 194
- - -
838 661
- -
13 - 4
122
- 1 - -
- 324
- - -
- - - - -
- - 2 - -
61 - 1 - -
- - - - -
- 29
- - -
5 - -
156 -
- 3 - -
117
- 1 - - -
- 2 - -
154
- -
94 9
13
218 324
23 - -
859 804
- -
11 -
19
26 - 8 - -
- 304
- - -
- - - -
11
- - - - -
196 - 4 - -
1 - -
18 -
- 137
- - -
6 - -
71 -
- 3 - -
44
- 19
- - -
- - - 4
265
- 1 3 8
11
91 435
22 - -
1,027 1,100
- -
25 -
15
60 - 5 - -
- 294
- - -
- - - - 1
- - 4 - -
366 - 1 - -
2 - -
33 -
- 12
- - -
- -
24 66
-
- 4 - -
115
- 6 - - -
- 4 - 7
469
26 -
56 5
25
123 287
19 - -
874 1,124
- -
41 - 8
109
- 1 - -
- 355
- 1 -
- - - - -
- - - - -
234 - 2 - -
- - -
25 -
- 9 - - -
- - - 6 -
1 1 - -
81
- 2 - 1 -
- - - 1
353
- -
89 4
41
18 353
12 - -
1,081 1,330
- - - -
153
10 -
61 - -
- 70
1 13
7
- 7 - 8
59
- 2
22 - -
208 - - - 2
- -
11 77
-
- 124
65 - 2
14
3 -
100 -
21 9 -
30 2
8 208
13 8
21
1 52
- 19
264
- - - - -
133 200 154
- -
239,183 297,334
- - - -
27,375
2,000 -
10,449 - -
- 23,722
(D)(D)
2,980
- 714
- 5,518 5,945
-
(D)1,144
- -
102,011 - - -
(D)
- -
2,237 28,654
-
- 13,797
959 -
(D)
538 1,147
- 844
-
3,282 3,238
- 655 (D)
5,518 20,715
2,437 1,184
(D)
(D)4,774
- 3,415
119,189
- - - - -
7,766 42,865 29,375
- -
47 38
- - - -
71
10 -
82 - -
- 21 (D)(D)75
-
48 -
49 79
-
(D)61
- -
36 - - -
(D)
- -
44 46
-
- 64 88
- (D)
25 90
- 16
-
82 71
- 43 (D)
49 81 45 (D)61
(D)67
- 59 33
- - - - -
27 48 72
- -
See footnote(s) at end of table. --continued

2007 CENSUS OF AGRICULTURE 2008 FRIS – GENERAL DATA 75 USDA, National Agricultural Statistics Service
Table 27. Crops Harvested from Irrigated Farms: 2008 and 2003 - Con. [Excludes institutional, research, and experimental farms and farms with horticulture. For meaning of abbreviations and symbols, see introductory text]
Soybeans for beans
Irrigated Non-irrigated
Farms by acres harvested Geographic area
Farms Acres harvested
Average yield per
acre (bushels)
1 to 49 acres
50 to 99 acres
100 to 249 acres
250 to 499 acres
500 acres or more
Farms Acres harvested
Average yield per
acre (bushels)
United States ............................. 2008 .. 2003 .. 2008 DATA Alabama ............................................... Alaska .................................................. Arizona ................................................. Arkansas .............................................. California .............................................. Colorado ............................................... Connecticut .......................................... Delaware .............................................. Florida .................................................. Georgia ................................................ Hawaii .................................................. Idaho .................................................... Illinois ................................................... Indiana ................................................. Iowa ..................................................... Kansas ................................................. Kentucky .............................................. Louisiana .............................................. Maine ................................................... Maryland .............................................. Massachusetts ..................................... Michigan ............................................... Minnesota ............................................. Mississippi ............................................ Missouri ................................................ Montana ............................................... Nebraska .............................................. Nevada ................................................. New Hampshire .................................... New Jersey .......................................... New Mexico .......................................... New York .............................................. North Carolina ...................................... North Dakota ........................................ Ohio ..................................................... Oklahoma ............................................. Oregon ................................................. Pennsylvania ........................................ Rhode Island ........................................ South Carolina ..................................... South Dakota ....................................... Tennessee ........................................... Texas ................................................... Utah ..................................................... Vermont ................................................ Virginia ................................................. Washington .......................................... West Virginia ........................................ Wisconsin ............................................. Wyoming .............................................. Water Resources Regions Region 01 New England ....................... Region 02 Mid-Atlantic ......................... Region 03 South Atlantic-Gulf .............. Region 04 Great Lakes ........................ Region 05 Ohio .................................... Region 06 Tennessee .......................... Region 07 Upper Mississippi ................ Region 08 Lower Mississippi ................ Region 09 Souris-Red-Rainy ................ Region 10 Missouri .............................. Region 11 Arkansas-White-Red ........... Region 12 Texas-Gulf .......................... Region 13 Rio Grande ......................... Region 14 Upper Colorado ................... Region 15 Lower Colorado ................... Region 16 Great Basin ......................... Region 17 Pacific Northwest ................ Region 18 California ............................. Region 19 Alaska ................................. Region 20 Hawaii .................................
23,024 21,062
69 - -
3,119 -
30 -
187 2
413
- -
485 563 252
2,148
39 448
- 199
-
406 665 860
1,208
8 10,541
- -
36
2 -
112 106
12
95 - 9 -
77
417 65
187 - -
51 5 1
207 -
- 472 660 579 442
36
1,425 4,847
111 12,023
2,331
70 -
19 -
- 9 - - -
7,044,546 5,346,276
8,779 - -
2,167,646 -
4,832 -
33,770 (D)
71,621
- -
90,497 102,279 48,946
396,613
6,173 184,976
- 26,119
-
73,986 100,513 712,268 488,319
624
2,272,944 - -
3,418
(D) -
14,839 18,939
1,702
23,793 -
363 -
12,741
79,296 27,325 30,607
- -
8,796 382 (D)
30,410 -
- 71,515
105,746 107,159 97,622
5,012
208,298 3,240,957
19,383 2,539,475
633,293 15,205
- 475
-
- 406
- - -
49 48
55 - -
43 -
57 -
49 (D) 48
- -
52 52 48
53 49 44
- 46
-
51 45 49 48
45 57
- -
45
(D) -
42 40 60
44
- 63
- 45
44 51 31
- -
53 45 (D) 45
-
- 48 47 51 52
52 48 45 42 56
46 33
- 50
-
- 45
- - -
2,764 2,847
13 - -
228 -
19 -
32 -
71
- -
94 89 31
192
10 - -
42
- 87
144 4
115
4 1,369
- - 8
- -
47 9 2
9 - 5 -
13
33 4 5 - -
22 3 1
59 -
- 100 145 112
58
10 329 251
14 1,532
182
5 -
19 -
- 7 - - -
4,155 5,382
19 - -
196 -
- -
61 -
53
- -
118 134
55
458 6
59 -
57
- 97
198 36
198
- 2,060
- -
13
- -
29 27
7
5 - 4 -
19
109 8
64 - -
9 - -
56 -
- 144 119 130
98
8 415 334
28 2,457
416
6 - - -
- - - - -
7,726 6,022
28 - -
463 -
4 -
55 -
199
- -
166 210 102
1,013
15 171
- 74
-
134 209 152 284
4
3,867 - -
15
- -
24 53
-
52 - - -
35
190 26
110 - -
6 2 -
63 -
- 150 278 217 157
11
447 902
48 4,527
935
52 - - -
- 2 - - -
4,396 4,041
8 - -
663 -
1 -
22 2
75
- -
73 98 46
353
6 103
- 21
-
63 81
179 281
-
2,176 - - -
2 - -
12 3
16
- - - 5
61 12
5 - -
9 - -
20 -
- 52 85 84 91
6
171 1,054
16 2,349
484
4 - - -
- - - - -
3,983 2,770
1 - -
1,569 -
6 -
17 -
15
- -
34 32 18
132
2 115
- 5
-
25 33
489 330
-
1,069 - - -
- -
12 5 -
13 - - - 5
24 15
3 - -
5 - - 9 -
- 26 33 36 38
1
63 2,306
5 1,158
314
3 - - -
- - - - -
18,846 18,744
92 - -
1,256 -
- -
203 5
423
- -
778 673 376
1,079
161 569
- 277
-
646 775 701
1,058
- 7,560
- -
52
- 12
366 192
81
33 -
153 -
137
535 123
65 - -
129 2 3
331 -
- 732
1,026 922 700
56
2,036 3,114
193 9,254
805
6 - - -
- 2 - - -
5,394,776 5,474,831
46,844 - -
582,321 -
- -
67,196 2,790
84,216
- -
258,230 303,862 160,680
281,995 67,550
204,024 -
68,392
- 191,470 259,803 441,347 461,362
-
957,491 - -
10,174
- 885
145,288 153,189 33,423
14,785
- 11,356
- 55,508
277,566 106,101
3,250 - -
53,478 (D)(D)
89,440 -
- 198,454 321,707 268,635 344,452
38,139
655,455 1,563,809
111,661 1,683,134
208,832
(D)- - -
- (D)
- - -
37 33
37 - -
33 -
- -
22 37 29
- -
46 43 44
36 37 32
- 23
-
33 36 32 39
-
43 - -
26
- 49 28 32 39
30
- 39
- 35
35 36 15
- -
34 (D)(D)31
-
- 26 31 34 42
36 41 34 32 41
30 (D)
- - -
- (D)
- - -
See footnote(s) at end of table. --continued

76 2008 FRIS – GENERAL DATA 2007 CENSUS OF AGRICULTURE USDA, National Agricultural Statistics Service
Table 27. Crops Harvested from Irrigated Farms: 2008 and 2003 - Con. [Excludes institutional, research, and experimental farms and farms with horticulture. For meaning of abbreviations and symbols, see introductory text]
Beans, dry edible
Irrigated Non-irrigated
Farms by acres harvested Geographic area
Farms Acres harvested
Average yield per
acre (cwt)
1 to 24 acres
25 to 49 acres
50 to 99 acres
100 to 249 acres
250 acres or more
Farms Acres harvested
Average yield per
acre (cwt)
United States .............................2008 .. 2003 .. 2008 DATA Alabama ............................................... Alaska ................................................... Arizona ................................................. Arkansas ............................................... California .............................................. Colorado ............................................... Connecticut ........................................... Delaware .............................................. Florida ................................................... Georgia ................................................. Hawaii ................................................... Idaho ..................................................... Illinois .................................................... Indiana .................................................. Iowa ...................................................... Kansas .................................................. Kentucky ............................................... Louisiana .............................................. Maine .................................................... Maryland ............................................... Massachusetts ...................................... Michigan ............................................... Minnesota ............................................. Mississippi ............................................ Missouri ................................................ Montana ................................................ Nebraska .............................................. Nevada ................................................. New Hampshire .................................... New Jersey ........................................... New Mexico .......................................... New York .............................................. North Carolina ...................................... North Dakota ........................................ Ohio ...................................................... Oklahoma ............................................. Oregon .................................................. Pennsylvania ........................................ Rhode Island ........................................ South Carolina ...................................... South Dakota ........................................ Tennessee ............................................ Texas .................................................... Utah ...................................................... Vermont ................................................ Virginia .................................................. Washington ........................................... West Virginia ........................................ Wisconsin ............................................. Wyoming ............................................... Water Resources Regions Region 01 New England ....................... Region 02 Mid-Atlantic .......................... Region 03 South Atlantic-Gulf .............. Region 04 Great Lakes ......................... Region 05 Ohio ..................................... Region 06 Tennessee ........................... Region 07 Upper Mississippi ................ Region 08 Lower Mississippi ................ Region 09 Souris-Red-Rainy ................ Region 10 Missouri ............................... Region 11 Arkansas-White-Red ........... Region 12 Texas-Gulf ........................... Region 13 Rio Grande .......................... Region 14 Upper Colorado ................... Region 15 Lower Colorado ................... Region 16 Great Basin ......................... Region 17 Pacific Northwest ................. Region 18 California ............................. Region 19 Alaska ................................. Region 20 Hawaii .................................
2,849 2,697
4 -
18 21
245
227 - - 2
11
- 749
6 19
2
27 - - 2 -
- 51 84
- -
85 368
- - 2
15 35
- 55
-
2 50
- - 3
4
18 60
- -
2 484
- 12
186
2 39 18 53 17
19 77 13 61
859
13 61 13 58 18
-
1,283 245
- -
431,329 458,265
54 -
3,228 9,530
41,230
35,305 - -
(D) 3,219
-
63,665 980 506 (D)
8,242
- -
(D) -
- 9,637
28,747 - -
9,424 127,985
- -
(D)
9,130 37
- 11,227
-
(D) 4,756
- -
15
2,533 (D)
8,545 - -
(D) 20,826
- 5,888
24,743
(D) (D)
3,548 9,737
406
57 31,035
7,530 10,843
205,588
4,672 8,795 1,647
13,151 3,228
-
89,247 41,230
- -
24 23
15 -
17 29 23
26
- -
(D) 48
-
23 33 33 (D)
24
- -
(D) -
- 19 26
- -
24 25
- -
(D)
22 48
- 22
-
(D) 21
- -
35
15 (D) 19
- -
(D) 23
- 20 22
(D) (D) 46 20 26
11 26 30 24 25
23 19 18 23 17
-
23 23
- -
655 182
4 - - -
108
- - - - -
- 92
- 13
-
- - - 2 -
- - - - -
- - - - 2
2
35 - 2 -
- - - - 3
-
17 - - -
- 361
- -
14
2 37
5 -
13
19 - - 2
14
- - 2 - -
- 453 108
- -
427 302
- - - - 5
19
- - - -
- 326
- - -
- - - - -
- 12
5 - -
8 - - - -
- - - - -
- 5 - - -
- -
27 - -
- 6 - -
14
- - -
12 -
- 5 - -
22
- 27
- 19
-
- 337
5 - -
580 623
- - 3 8
43
107 - - - -
- 152
- 3 2
- - - - -
- 9 8 - -
32 26
- - -
4 - -
19 -
2 34
- - -
- - - - -
- 60
- 6
62
- - -
11 1
-
16 8
17 229
2 - 4 - 3
-
246 43
- -
691 1,114
- -
12 -
36
65 - - 2 4
-
129 6 3 -
15 - - - -
- 19 39
- -
44 133
- - -
7 - -
18 -
- 8 - - -
2 -
23 - -
- 41
- 4
81
- - 6
19 3
-
27 -
28 314
-
23 7
38 12
-
178 36
- -
496 476
- - 3
13 53
36
- - - 7
-
50 - - -
12 - - - -
- 11 32
- -
1 209
- - -
2 - -
16 -
- 3 - - -
2 1
10 - -
2 16
- 2
15
- 2 7
11 -
- 29
5 14
280
11 11
- 1 3
-
69 53
- -
366 449
4 - - -
64
- - - 2 -
- - 1 - -
- - - 2 -
- 72 39
- -
25 30
- - -
- - -
87 1
- - 3 - -
4 1
14 - -
- 5 -
12 -
2 3 6
73 -
- 47
1 60 70
-
14 - - -
- 26 64
- -
156,348 149,337
12 - - -
72,715
- - -
(D)-
- -
(D)- -
- - -
(D)-
- 10,114
3,575 - -
7,250 1,458
- - -
- - -
47,243 (D)
- -
420 - -
1,734 (D)
2,590 - -
- 6,469
- 1,974
-
(D)420 (D)
10,117 -
- 5,702
(D)33,453 19,229
-
2,590 - - -
- 11,719 72,715
- -
15 10
15 - - -
15
- - -
(D)-
- -
(D)- -
- - -
(D)-
- 12 20
- -
19 9 - - -
- - -
15 (D)
- -
36 - -
17 (D)
7 - -
- 17
- 15
-
(D)36 (D)12
-
- 18 (D)16 14
- 7 - - -
- 20 15
- -
See footnote(s) at end of table. --continued

2007 CENSUS OF AGRICULTURE 2008 FRIS – GENERAL DATA 77 USDA, National Agricultural Statistics Service
Table 27. Crops Harvested from Irrigated Farms: 2008 and 2003 - Con. [Excludes institutional, research, and experimental farms and farms with horticulture. For meaning of abbreviations and symbols, see introductory text]
Rice Other small grains (oats, rye, etc.)
Farms by acres harvested Irrigated Non-irrigated Geographic area
Farms Acres harvested
Average yield per
acre (cwt)
1 to 99 acres
100 to 249 acres
250 to 499 acres
500 to 999 acres
1,000 acres or more Farms Acres
harvested Farms Acres harvested
United States ............................. 2008 .. 2003 .. 2008 DATA Alabama ............................................... Alaska .................................................. Arizona ................................................. Arkansas .............................................. California .............................................. Colorado ............................................... Connecticut .......................................... Delaware .............................................. Florida .................................................. Georgia ................................................ Hawaii .................................................. Idaho .................................................... Illinois ................................................... Indiana ................................................. Iowa ..................................................... Kansas ................................................. Kentucky .............................................. Louisiana .............................................. Maine ................................................... Maryland .............................................. Massachusetts ..................................... Michigan ............................................... Minnesota ............................................. Mississippi ............................................ Missouri ................................................ Montana ............................................... Nebraska .............................................. Nevada ................................................. New Hampshire .................................... New Jersey .......................................... New Mexico .......................................... New York .............................................. North Carolina ...................................... North Dakota ........................................ Ohio ..................................................... Oklahoma ............................................. Oregon ................................................. Pennsylvania ........................................ Rhode Island ........................................ South Carolina ..................................... South Dakota ....................................... Tennessee ........................................... Texas ................................................... Utah ..................................................... Vermont ................................................ Virginia ................................................. Washington .......................................... West Virginia ........................................ Wisconsin ............................................. Wyoming .............................................. Water Resources Regions Region 01 New England ....................... Region 02 Mid-Atlantic ......................... Region 03 South Atlantic-Gulf .............. Region 04 Great Lakes ........................ Region 05 Ohio .................................... Region 06 Tennessee .......................... Region 07 Upper Mississippi ................ Region 08 Lower Mississippi ................ Region 09 Souris-Red-Rainy ................ Region 10 Missouri .............................. Region 11 Arkansas-White-Red ........... Region 12 Texas-Gulf .......................... Region 13 Rio Grande ......................... Region 14 Upper Colorado ................... Region 15 Lower Colorado ................... Region 16 Great Basin ......................... Region 17 Pacific Northwest ................ Region 18 California ............................. Region 19 Alaska ................................. Region 20 Hawaii .................................
5,265 6,836
- - -
2,550 1,033
- - - 6 -
- - 4 1 -
- -
784 - -
- - -
345 278
- - - - -
- - - - -
- - - - -
- 3
261 - -
- - - - -
- - 6 - 1
- 5
3,397 - -
562 261
- - -
- -
1,033 - -
2,683,363 2,994,757
- - -
1,303,574 432,208
- - -
11,272 -
- -
1,750 (D)
-
- -
412,691 - -
- - -
201,893 142,450
- - - - -
- - - - -
- - - - -
- (D)
174,565 - -
- - - - -
- -
11,272 -
(D)
- (D)
1,812,399 - -
248,989 174,565
- - -
- -
432,208 - -
70 69
- - -
69 78
- - -
47 -
- -
64 (D)
-
- -
62 - -
- - -
69 86
- - - - -
- - - - -
- - - - -
- (D) 73
- -
- - - - -
- -
47 -
(D)
- (D) 68
- -
70 73
- - -
- -
78 - -
425 919
- - -
330 -
- - - - -
- - - - -
- -
44 - -
- - - 9
29
- - - - -
- - - - -
- - - - -
- -
13 - -
- - - - -
- - - - -
- 1
281 - -
130 13
- - -
- - - - -
1,329 1,728
- - -
574 303
- - - - -
- - - - -
- -
226 - -
- - -
104 72
- - - - -
- - - - -
- - - - -
- 1
49 - -
- - - - -
- - - - -
- -
840 - -
137 49
- - -
- -
303 - -
1,614 2,088
- - -
718 475
- - - 2 -
- - 4 - -
- -
199 - -
- - -
94 59
- - - - -
- - - - -
- - - - -
- 2
61 - -
- - - - -
- - 2 - -
- 4
937 - -
135 61
- - -
- -
475 - -
1,234 1,523
- - -
580 177
- - - 1 -
- - - - -
- -
226 - -
- - -
67 90
- - - - -
- - - - -
- - - - -
- -
93 - -
- - - - -
- - 1 - -
- -
861 - -
102 93
- - -
- -
177 - -
663 578
- - -
348 78
- - - 3 -
- - - 1 -
- -
89 - -
- - -
71 28
- - - - -
- - - - -
- - - - -
- -
45 - -
- - - - -
- - 3 - 1
- -
478 - -
58 45
- - -
- -
78 - -
2,975 2,825
3 -
73 61
427
336 - 2
25 214
-
269 4 - 3
2 - - - -
- 5
23 2 3
138
96 21
- -
59 -
40 17
-
13 78
- 1 7
33
1 48
598 -
- 179
- 18
176
1 2
289 9 2
1
42 66
4 452
36 57
100 383
73
480 526 452
- -
344,195 240,264
194 -
6,595 1,952
114,973
21,974 -
(D)2,820
17,660
- 42,764
414 -
180
(D)- - - -
- 540
1,487 (D)(D)
13,983
6,216 2,490
- -
11,918 -
5,486 1,357
-
4,194 17,029
- (D)
155
1,118 (D)
4,724 29,763
-
- 13,687
- 1,930
16,165
(D)(D)
26,315 1,900
(D)
(D)2,373 3,350
132 42,738
6,358 9,999
15,704 7,560 6,595
30,914 68,587
121,212 - -
2,242 3,340
15 - -
84 228
70
- 8
10 203
-
62 73
4 13
121
6 2 8 4
-
206 142
3 18
45
126 - - 4
64 26 46 63 49
27 36 86
1 40
47
6 29 25
-
32 83
1 96 30
9 115 318 268
55
9 282
93 32
426
134 29
- 19
4
16 206 227
- -
363,619 282,080
1,676 - -
9,563 79,469
9,565
- (D)
3,130 16,698
-
1,575 2,732
140 1,328
31,671
48 (D)(D)38
-
7,841 6,425
57 1,570
4,856 3,089
- -
1,252
36,158 1,782 1,736
12,511 498
5,445
17,080 1,347
(D)4,188
12,425
217 4,460
62,795 -
1,256 4,663
(D)5,886 6,000
1,785 5,210
27,560 10,622
595
278 13,021 11,288
3,074 52,039
63,265
4,460 -
3,450 328
62,345 17,058 87,241
- -
See footnote(s) at end of table. --continued
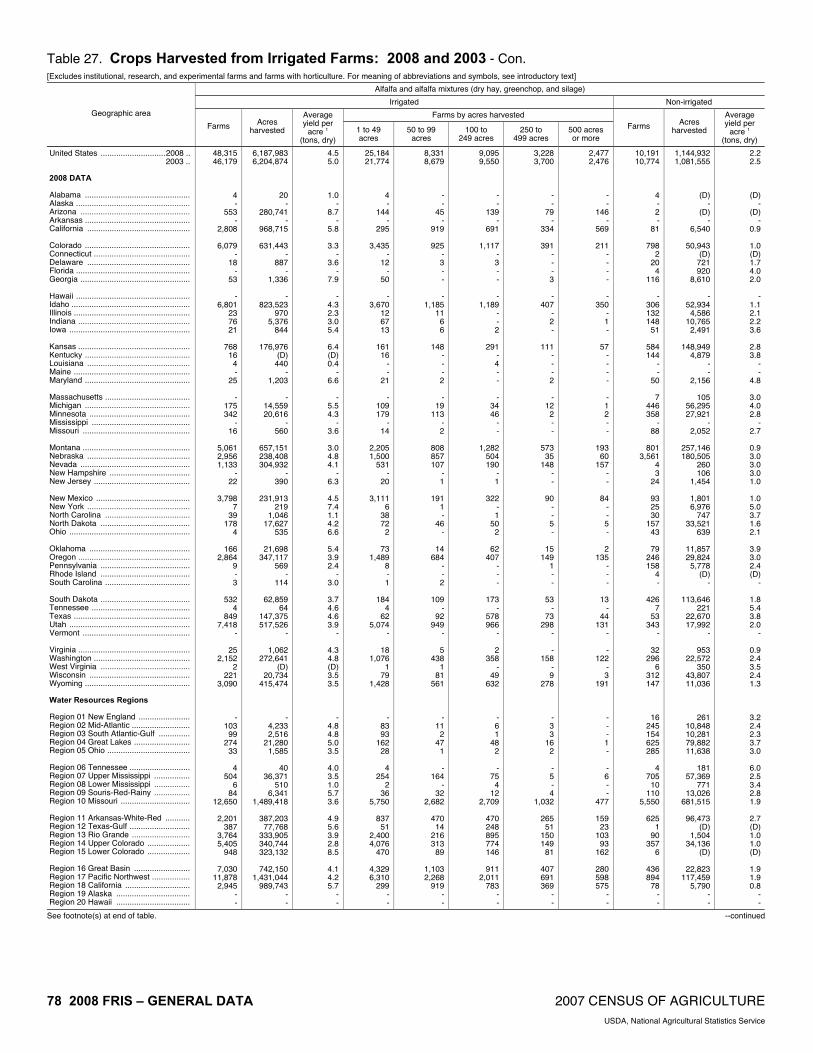
78 2008 FRIS – GENERAL DATA 2007 CENSUS OF AGRICULTURE USDA, National Agricultural Statistics Service
Table 27. Crops Harvested from Irrigated Farms: 2008 and 2003 - Con. [Excludes institutional, research, and experimental farms and farms with horticulture. For meaning of abbreviations and symbols, see introductory text]
Alfalfa and alfalfa mixtures (dry hay, greenchop, and silage)
Irrigated Non-irrigated
Farms by acres harvested Geographic area
Farms Acres harvested
Average yield per
acre 1 (tons, dry)
1 to 49 acres
50 to 99 acres
100 to 249 acres
250 to 499 acres
500 acres or more
Farms Acres harvested
Average yield per
acre 1 (tons, dry)
United States .............................2008 .. 2003 .. 2008 DATA Alabama ............................................... Alaska ................................................... Arizona ................................................. Arkansas ............................................... California .............................................. Colorado ............................................... Connecticut ........................................... Delaware .............................................. Florida ................................................... Georgia ................................................. Hawaii ................................................... Idaho ..................................................... Illinois .................................................... Indiana .................................................. Iowa ...................................................... Kansas .................................................. Kentucky ............................................... Louisiana .............................................. Maine .................................................... Maryland ............................................... Massachusetts ...................................... Michigan ............................................... Minnesota ............................................. Mississippi ............................................ Missouri ................................................ Montana ................................................ Nebraska .............................................. Nevada ................................................. New Hampshire .................................... New Jersey ........................................... New Mexico .......................................... New York .............................................. North Carolina ...................................... North Dakota ........................................ Ohio ...................................................... Oklahoma ............................................. Oregon .................................................. Pennsylvania ........................................ Rhode Island ........................................ South Carolina ...................................... South Dakota ........................................ Tennessee ............................................ Texas .................................................... Utah ...................................................... Vermont ................................................ Virginia .................................................. Washington ........................................... West Virginia ........................................ Wisconsin ............................................. Wyoming ............................................... Water Resources Regions Region 01 New England ....................... Region 02 Mid-Atlantic .......................... Region 03 South Atlantic-Gulf .............. Region 04 Great Lakes ......................... Region 05 Ohio ..................................... Region 06 Tennessee ........................... Region 07 Upper Mississippi ................ Region 08 Lower Mississippi ................ Region 09 Souris-Red-Rainy ................ Region 10 Missouri ............................... Region 11 Arkansas-White-Red ........... Region 12 Texas-Gulf ........................... Region 13 Rio Grande .......................... Region 14 Upper Colorado ................... Region 15 Lower Colorado ................... Region 16 Great Basin ......................... Region 17 Pacific Northwest ................. Region 18 California ............................. Region 19 Alaska ................................. Region 20 Hawaii .................................
48,315 46,179
4 -
553 -
2,808
6,079 -
18 -
53
- 6,801
23 76 21
768
16 4 -
25
- 175 342
- 16
5,061 2,956 1,133
- 22
3,798
7 39
178 4
166
2,864 9 - 3
532
4 849
7,418 -
25 2,152
2 221
3,090
- 103
99 274
33
4 504
6 84
12,650
2,201 387
3,764 5,405
948
7,030 11,878
2,945 - -
6,187,983 6,204,874
20 -
280,741 -
968,715
631,443 -
887 -
1,336
- 823,523
970 5,376
844
176,976 (D)
440 -
1,203
- 14,559 20,616
- 560
657,151 238,408 304,932
- 390
231,913
219 1,046
17,627 535
21,698
347,117 569
- 114
62,859
64 147,375 517,526
-
1,062 272,641
(D) 20,734
415,474
- 4,233 2,516
21,280 1,585
40
36,371 510
6,341 1,489,418
387,203 77,768
333,905 340,744 323,132
742,150
1,431,044 989,743
- -
4.5 5.0
1.0 -
8.7 -
5.8
3.3 -
3.6 -
7.9
- 4.3 2.3 3.0 5.4
6.4 (D)0.4
- 6.6
-
5.5 4.3
- 3.6
3.0 4.8 4.1
- 6.3
4.5 7.4 1.1 4.2 6.6
5.4 3.9 2.4
- 3.0
3.7 4.6 4.6 3.9
-
4.3 4.8 (D)3.5 3.5
- 4.8 4.8 5.0 3.5
4.0 3.5 1.0 5.7 3.6
4.9 5.6 3.9 2.8 8.5
4.1 4.2 5.7
- -
25,184 21,774
4 -
144 -
295
3,435 -
12 -
50
- 3,670
12 67 13
161
16 - -
21
- 109 179
- 14
2,205 1,500
531 -
20
3,111 6
38 72
2
73 1,489
8 - 1
184
4 62
5,074 -
18 1,076
1 79
1,428
- 83 93
162 28
4
254 2
36 5,750
837
51 2,400 4,076
470
4,329 6,310
299 - -
8,331 8,679
- -
45 -
919
925 - 3 - -
- 1,185
11 6 6
148
- - - 2
-
19 113
- 2
808 857 107
- 1
191
1 -
46 -
14 684
- - 2
109
- 92
949 -
5 438
1 81
561
- 11
2 47
1
- 164
- 32
2,682
470 14
216 313
89
1,103 2,268
919 - -
9,095 9,550
- -
139 -
691
1,117 - 3 - -
- 1,189
- - 2
291
- 4 - -
- 34 46
- -
1,282 504 190
- 1
322
- 1
50 2
62
407 - - -
173 -
578 966
-
2 358
- 49
632
- 6 1
48 2
-
75 4
12 2,709
470 248 895 774 146
911
2,011 783
- -
3,228 3,700
- -
79 -
334
391 - - - 3
-
407 - 2 -
111 - - - 2
-
12 2 - -
573 35
148 - -
90 - - 5 -
15 149
1 - -
53 -
73 298
-
- 158
- 9
278
- 3 3
16 2
- 5 - 4
1,032
265 51
150 149
81
407 691 369
- -
2,477 2,476
- -
146 -
569
211 - - - -
- 350
- 1 -
57 - - - -
- 1 2 - -
193 60
157 - -
84 - - 5 -
2 135
- - -
13 -
44 131
-
- 122
- 3
191
- - - 1 -
- 6 - -
477
159 23
103 93
162
280 598 575
- -
10,191 10,774
4 - 2 -
81
798 2
20 4
116
- 306 132 148
51
584 144
- -
50
7 446 358
- 88
801
3,561 4 3
24
93 25 30
157 43
79
246 158
4 -
426 7
53 343
-
32 296
6 312 147
16 245 154 625 285
4
705 10
110 5,550
625
1 90
357 6
436 894
78 - -
1,144,932 1,081,555
(D)-
(D)-
6,540
50,943 (D)
721 920
8,610
- 52,934
4,586 10,765
2,491
148,949 4,879
- -
2,156
105 56,295 27,921
- 2,052
257,146 180,505
260 106
1,454
1,801 6,976
747 33,521
639
11,857 29,824
5,778 (D)
-
113,646 221
22,670 17,992
-
953 22,572
350 43,807 11,036
261 10,848 10,281 79,882 11,638
181
57,369 771
13,026 681,515
96,473
(D)1,504
34,136 (D)
22,823
117,459 5,790
- -
2.2 2.5
(D)-
(D)-
0.9
1.0 (D)1.7 4.0 2.0
-
1.1 2.1 2.2 3.6
2.8 3.8
- -
4.8
3.0 4.0 2.8
- 2.7
0.9 3.0 3.0 3.0 1.0
1.0 5.0 3.7 1.6 2.1
3.9 3.0 2.4 (D)
-
1.8 5.4 3.8 2.0
-
0.9 2.4 3.5 2.4 1.3
3.2 2.4 2.3 3.7 3.0
6.0 2.5 3.4 2.8 1.9
2.7 (D)1.0 1.0 (D)
1.9 1.9 0.8
- -
See footnote(s) at end of table. --continued
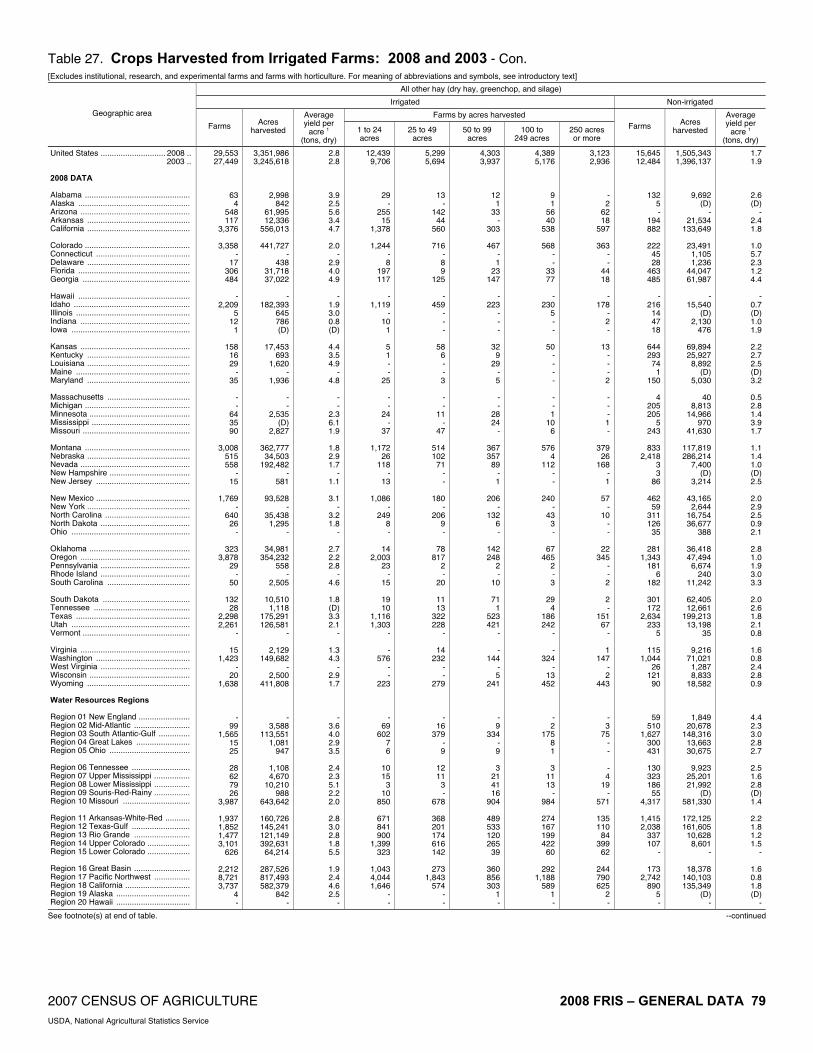
2007 CENSUS OF AGRICULTURE 2008 FRIS – GENERAL DATA 79 USDA, National Agricultural Statistics Service
Table 27. Crops Harvested from Irrigated Farms: 2008 and 2003 - Con. [Excludes institutional, research, and experimental farms and farms with horticulture. For meaning of abbreviations and symbols, see introductory text]
All other hay (dry hay, greenchop, and silage)
Irrigated Non-irrigated
Farms by acres harvested Geographic area
Farms Acres harvested
Average yield per
acre 1 (tons, dry)
1 to 24 acres
25 to 49 acres
50 to 99 acres
100 to 249 acres
250 acres or more
Farms Acres harvested
Average yield per
acre 1 (tons, dry)
United States ............................. 2008 .. 2003 .. 2008 DATA Alabama ............................................... Alaska .................................................. Arizona ................................................. Arkansas .............................................. California .............................................. Colorado ............................................... Connecticut .......................................... Delaware .............................................. Florida .................................................. Georgia ................................................ Hawaii .................................................. Idaho .................................................... Illinois ................................................... Indiana ................................................. Iowa ..................................................... Kansas ................................................. Kentucky .............................................. Louisiana .............................................. Maine ................................................... Maryland .............................................. Massachusetts ..................................... Michigan ............................................... Minnesota ............................................. Mississippi ............................................ Missouri ................................................ Montana ............................................... Nebraska .............................................. Nevada ................................................. New Hampshire .................................... New Jersey .......................................... New Mexico .......................................... New York .............................................. North Carolina ...................................... North Dakota ........................................ Ohio ..................................................... Oklahoma ............................................. Oregon ................................................. Pennsylvania ........................................ Rhode Island ........................................ South Carolina ..................................... South Dakota ....................................... Tennessee ........................................... Texas ................................................... Utah ..................................................... Vermont ................................................ Virginia ................................................. Washington .......................................... West Virginia ........................................ Wisconsin ............................................. Wyoming .............................................. Water Resources Regions Region 01 New England ....................... Region 02 Mid-Atlantic ......................... Region 03 South Atlantic-Gulf .............. Region 04 Great Lakes ........................ Region 05 Ohio .................................... Region 06 Tennessee .......................... Region 07 Upper Mississippi ................ Region 08 Lower Mississippi ................ Region 09 Souris-Red-Rainy ................ Region 10 Missouri .............................. Region 11 Arkansas-White-Red ........... Region 12 Texas-Gulf .......................... Region 13 Rio Grande ......................... Region 14 Upper Colorado ................... Region 15 Lower Colorado ................... Region 16 Great Basin ......................... Region 17 Pacific Northwest ................ Region 18 California ............................. Region 19 Alaska ................................. Region 20 Hawaii .................................
29,553 27,449
63 4
548 117
3,376
3,358 -
17 306 484
-
2,209 5
12 1
158
16 29
- 35
- -
64 35 90
3,008
515 558
- 15
1,769
- 640
26 -
323 3,878
29 -
50
132 28
2,298 2,261
-
15 1,423
- 20
1,638
- 99
1,565 15 25
28 62 79 26
3,987
1,937 1,852 1,477 3,101
626
2,212 8,721 3,737
4 -
3,351,986 3,245,618
2,998 842
61,995 12,336
556,013
441,727 -
438 31,718 37,022
-
182,393 645 786 (D)
17,453
693 1,620
- 1,936
- -
2,535 (D)
2,827
362,777 34,503
192,482 -
581
93,528 -
35,438 1,295
-
34,981 354,232
558 -
2,505
10,510 1,118
175,291 126,581
-
2,129 149,682
- 2,500
411,808
- 3,588
113,551 1,081
947
1,108 4,670
10,210 988
643,642
160,726 145,241 121,149 392,631 64,214
287,526 817,493 582,379
842 -
2.8 2.8
3.9 2.5 5.6 3.4 4.7
2.0
- 2.9 4.0 4.9
-
1.9 3.0 0.8 (D)
4.4 3.5 4.9
- 4.8
- -
2.3 6.1 1.9
1.8 2.9 1.7
- 1.1
3.1
- 3.2 1.8
-
2.7 2.2 2.8
- 4.6
1.8 (D)3.3 2.1
-
1.3 4.3
- 2.9 1.7
- 3.6 4.0 2.9 3.5
2.4 2.3 5.1 2.2 2.0
2.8 3.0 2.8 1.8 5.5
1.9 2.4 4.6 2.5
-
12,439 9,706
29 -
255 15
1,378
1,244 - 8
197 117
-
1,119 -
10 1
5 1 - -
25
- -
24 -
37
1,172 26
118 -
13
1,086 -
249 8 -
14 2,003
23 -
15
19 10
1,116 1,303
-
- 576
- -
223
- 69
602 7 6
10 15
3 10
850
671 841 900
1,399 323
1,043 4,044 1,646
- -
5,299 5,694
13 -
142 44
560
716 - 8 9
125
- 459
- - -
58 6 - - 3
- -
11 -
47
514 102
71 - -
180 -
206 9 -
78 817
2 -
20
11 13
322 228
-
14 232
- -
279
- 16
379 - 9
12 11
3 -
678
368 201 174 616 142
273
1,843 574
- -
4,303 3,937
12 1
33 -
303
467 - 1
23 147
-
223 - - -
32 9
29 - 5
- -
28 24
-
367 357
89 - 1
206
- 132
6 -
142 248
2 -
10
71 1
523 421
-
- 144
- 5
241
- 9
334 - 9
3
21 41 16
904
489 533 120 265
39
360 856 303
1 -
4,389 5,176
9 1
56 40
538
568 - -
33 77
-
230 5 - -
50 - - - -
- - 1
10 6
576
4 112
- -
240 -
43 3 -
67 465
2 - 3
29
4 186 242
-
- 324
- 13
452
- 2
175 8 1
3
11 13
- 984
274 167 199 422
60
292 1,188
589 1 -
3,123 2,936
- 2
62 18
597
363 - -
44 18
-
178 - 2 -
13 - - - 2
- - - 1 -
379 26
168 - 1
57
- 10
- -
22 345
- - 2
2 -
151 67
-
1 147
- 2
443
- 3
75 - -
- 4
19 -
571
135 110
84 399
62
244 790 625
2 -
15,645 12,484
132 5 -
194 882
222
45 28
463 485
-
216 14 47 18
644 293
74 1
150
4 205 205
5 243
833
2,418 3 3
86
462 59
311 126
35
281 1,343
181 6
182
301 172
2,634 233
5
115 1,044
26 121
90
59 510
1,627 300 431
130 323 186
55 4,317
1,415 2,038
337 107
-
173 2,742
890 5 -
1,505,343 1,396,137
9,692 (D)
- 21,534
133,649
23,491 1,105 1,236
44,047 61,987
-
15,540 (D)
2,130 476
69,894 25,927
8,892 (D)
5,030
40 8,813
14,966 970
41,630
117,819 286,214
7,400 (D)
3,214
43,165 2,644
16,754 36,677
388
36,418 47,494
6,674 240
11,242
62,405 12,661
199,213 13,198
35
9,216 71,021
1,287 8,833
18,582
1,849 20,678
148,316 13,663 30,675
9,923
25,201 21,992
(D)581,330
172,125 161,605 10,628
8,601 -
18,378 140,103 135,349
(D)-
1.7 1.9
2.6 (D)
- 2.4 1.8
1.0 5.7 2.3 1.2 4.4
-
0.7 (D)1.0 1.9
2.2 2.7 2.5 (D)3.2
0.5 2.8 1.4 3.9 1.7
1.1 1.4 1.0 (D)2.5
2.0 2.9 2.5 0.9 2.1
2.8 1.0 1.9 3.0 3.3
2.0 2.6 1.8 2.1 0.8
1.6 0.8 2.4 2.8 0.9
4.4 2.3 3.0 2.8 2.7
2.5 1.6 2.8 (D)1.4
2.2 1.8 1.2 1.5
-
1.6 0.8 1.8 (D)
-
See footnote(s) at end of table. --continued

80 2008 FRIS – GENERAL DATA 2007 CENSUS OF AGRICULTURE USDA, National Agricultural Statistics Service
Table 27. Crops Harvested from Irrigated Farms: 2008 and 2003 - Con. [Excludes institutional, research, and experimental farms and farms with horticulture. For meaning of abbreviations and symbols, see introductory text]
Peanuts for nuts
Irrigated Non-irrigated
Farms by acres harvested Geographic area
Farms Acres harvested
Average yield per
acre (pounds)
1 to 49 acres
50 to 99 acres
100 to 249 acres
250 to 499 acres
500 acres or more
Farms Acres harvested
Average yield per
acre (pounds)
United States .............................2008 .. 2003 .. 2008 DATA Alabama ............................................... Alaska ................................................... Arizona ................................................. Arkansas ............................................... California .............................................. Colorado ............................................... Connecticut ........................................... Delaware .............................................. Florida ................................................... Georgia ................................................. Hawaii ................................................... Idaho ..................................................... Illinois .................................................... Indiana .................................................. Iowa ...................................................... Kansas .................................................. Kentucky ............................................... Louisiana .............................................. Maine .................................................... Maryland ............................................... Massachusetts ...................................... Michigan ............................................... Minnesota ............................................. Mississippi ............................................ Missouri ................................................ Montana ................................................ Nebraska .............................................. Nevada ................................................. New Hampshire .................................... New Jersey ........................................... New Mexico .......................................... New York .............................................. North Carolina ...................................... North Dakota ........................................ Ohio ...................................................... Oklahoma ............................................. Oregon .................................................. Pennsylvania ........................................ Rhode Island ........................................ South Carolina ...................................... South Dakota ........................................ Tennessee ............................................ Texas .................................................... Utah ...................................................... Vermont ................................................ Virginia .................................................. Washington ........................................... West Virginia ........................................ Wisconsin ............................................. Wyoming ............................................... Water Resources Regions Region 01 New England ....................... Region 02 Mid-Atlantic .......................... Region 03 South Atlantic-Gulf .............. Region 04 Great Lakes ......................... Region 05 Ohio ..................................... Region 06 Tennessee ........................... Region 07 Upper Mississippi ................ Region 08 Lower Mississippi ................ Region 09 Souris-Red-Rainy ................ Region 10 Missouri ............................... Region 11 Arkansas-White-Red ........... Region 12 Texas-Gulf ........................... Region 13 Rio Grande .......................... Region 14 Upper Colorado ................... Region 15 Lower Colorado ................... Region 16 Great Basin ......................... Region 17 Pacific Northwest ................. Region 18 California ............................. Region 19 Alaska ................................. Region 20 Hawaii .................................
2,535 2,115
53 - - - -
- - -
82 1,268
2 - - - -
- - 1 - -
- - - - -
- - - - -
15 -
65 - -
55 - - -
114
- -
862 - -
18 - - - -
- -
1,600 - -
- - 1 - -
115 816
1 - -
- - - - 2
540,577 (D)
9,988 - - - -
- - -
22,014 227,591
(D)
- - - -
- -
(D) - -
- - - - -
- - - - -
(D) -
6,031 - -
9,020 - - -
10,864
- -
248,473 - -
1,045 - - - -
- -
277,533 - -
- -
(D) - -
20,285 (D) (D)
- -
- - - -
(D)
4,187 (D)
3,844 - - - -
- - -
4,129 4,220
(D)
- - - -
- -
(D) - -
- - - - -
- - - - -
(D) -
4,415 - -
3,781 - - -
4,356
- -
4,194 - -
4,580 - - - -
- -
4,210 - -
- -
(D) - -
(D) 4,191
(D) - -
- - - -
(D)
424 553
8 - - - -
- - - 2
293
2 - - - -
- - - - -
- - - - -
- - - - -
- -
33 - -
- - - -
56
- -
24 - -
6 - - - -
- -
398 - -
- - - - -
24 - - - -
- - - - 2
498 420
11 - - - -
- - -
36 313
- - - - -
- - 1 - -
- - - - -
- - - - -
2 - - - -
18 - - -
17
- -
92 - -
8 - - - -
- -
385 - -
- - 1 - -
18 94
- - -
- - - - -
724 656
17 - - - -
- - -
22 376
- - - - -
- - - - -
- - - - -
- - - - -
8 -
27 - -
27 - - -
26
- -
217 - -
4 - - - -
- -
472 - -
- - - - -
27 225
- - -
- - - - -
704 303
15 - - - -
- - -
11 187
- - - - -
- - - - -
- - - - -
- - - - -
3 - 5 - -
8 - - -
13
- -
462 - -
- - - - -
- -
231 - -
- - - - -
44 429
- - -
- - - - -
185 183
2 - - - -
- - -
11 99
- - - - -
- - - - -
- - - - -
- - - - -
2 - - - -
2 - - - 2
- -
67 - -
- - - - -
- -
114 - -
- - - - -
2 68
1 - -
- - - - -
1,071 740
67 - - - -
- - -
25 783
- - - 3 -
- - - - -
- - -
11 -
- - - - -
- -
82 - -
- - - -
65
- 17
- - -
18 - - - -
- -
1,040 - 3
19
- 9 - -
- - - - -
- - - - -
192,769 141,728
22,492 - - - -
- - -
8,183 108,729
- - -
168 -
- - - - -
- - -
8,194 -
- - - - -
- -
26,358 - -
- - - -
16,065
- 25
- - -
2,555 - - - -
- -
185,442 -
168
625 -
6,534 - -
- - - - -
- - - - -
3,356 2,765
3,357 - - - -
- - -
3,445 3,146
- - -
3,423 -
- - - - -
- - -
4,420 -
- - - - -
- -
3,490 - -
- - - -
3,898
- 1,360
- - -
3,816 - - - -
- -
3,318 -
3,423
3,702 -
4,400 - -
- - - - -
- - - - -
See footnote(s) at end of table. --continued
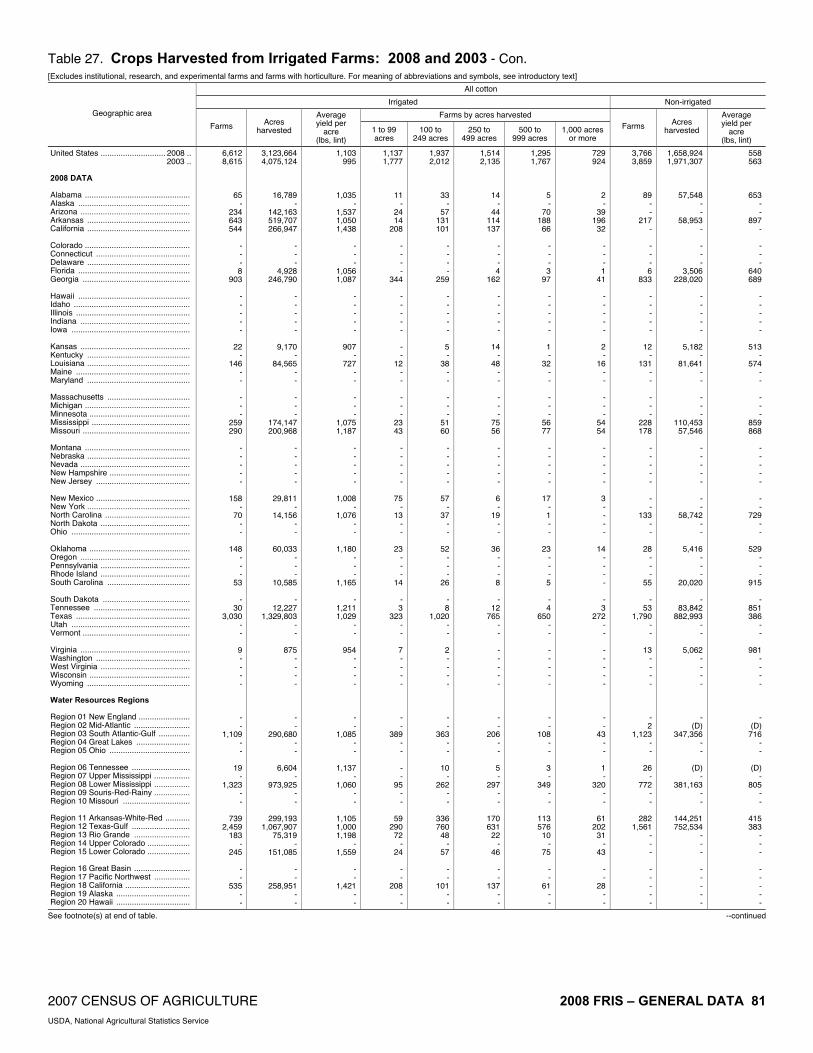
2007 CENSUS OF AGRICULTURE 2008 FRIS – GENERAL DATA 81 USDA, National Agricultural Statistics Service
Table 27. Crops Harvested from Irrigated Farms: 2008 and 2003 - Con. [Excludes institutional, research, and experimental farms and farms with horticulture. For meaning of abbreviations and symbols, see introductory text]
All cotton
Irrigated Non-irrigated
Farms by acres harvested Geographic area
Farms Acres harvested
Average yield per
acre (lbs, lint)
1 to 99 acres
100 to 249 acres
250 to 499 acres
500 to 999 acres
1,000 acres or more
Farms Acres harvested
Average yield per
acre (lbs, lint)
United States ............................. 2008 .. 2003 .. 2008 DATA Alabama ............................................... Alaska .................................................. Arizona ................................................. Arkansas .............................................. California .............................................. Colorado ............................................... Connecticut .......................................... Delaware .............................................. Florida .................................................. Georgia ................................................ Hawaii .................................................. Idaho .................................................... Illinois ................................................... Indiana ................................................. Iowa ..................................................... Kansas ................................................. Kentucky .............................................. Louisiana .............................................. Maine ................................................... Maryland .............................................. Massachusetts ..................................... Michigan ............................................... Minnesota ............................................. Mississippi ............................................ Missouri ................................................ Montana ............................................... Nebraska .............................................. Nevada ................................................. New Hampshire .................................... New Jersey .......................................... New Mexico .......................................... New York .............................................. North Carolina ...................................... North Dakota ........................................ Ohio ..................................................... Oklahoma ............................................. Oregon ................................................. Pennsylvania ........................................ Rhode Island ........................................ South Carolina ..................................... South Dakota ....................................... Tennessee ........................................... Texas ................................................... Utah ..................................................... Vermont ................................................ Virginia ................................................. Washington .......................................... West Virginia ........................................ Wisconsin ............................................. Wyoming .............................................. Water Resources Regions Region 01 New England ....................... Region 02 Mid-Atlantic ......................... Region 03 South Atlantic-Gulf .............. Region 04 Great Lakes ........................ Region 05 Ohio .................................... Region 06 Tennessee .......................... Region 07 Upper Mississippi ................ Region 08 Lower Mississippi ................ Region 09 Souris-Red-Rainy ................ Region 10 Missouri .............................. Region 11 Arkansas-White-Red ........... Region 12 Texas-Gulf .......................... Region 13 Rio Grande ......................... Region 14 Upper Colorado ................... Region 15 Lower Colorado ................... Region 16 Great Basin ......................... Region 17 Pacific Northwest ................ Region 18 California ............................. Region 19 Alaska ................................. Region 20 Hawaii .................................
6,612 8,615
65 -
234 643 544
- - - 8
903
- - - - -
22 -
146 - -
- - -
259 290
- - - - -
158 -
70 - -
148 - - -
53
- 30
3,030 - -
9 - - - -
- -
1,109 - -
19 -
1,323 - -
739 2,459
183 -
245
- -
535 - -
3,123,664 4,075,124
16,789 -
142,163 519,707 266,947
- - -
4,928 246,790
- - - - -
9,170 -
84,565 - -
- - -
174,147 200,968
- - - - -
29,811 -
14,156 - -
60,033 - - -
10,585
- 12,227
1,329,803 - -
875 - - - -
- -
290,680 - -
6,604 -
973,925 - -
299,193 1,067,907
75,319 -
151,085
- -
258,951 - -
1,103 995
1,035 -
1,537 1,050 1,438
- - -
1,056 1,087
- - - - -
907 -
727 - -
- - -
1,075 1,187
- - - - -
1,008 -
1,076 - -
1,180 - - -
1,165
- 1,211 1,029
- -
954 - - - -
- -
1,085 - -
1,137 -
1,060 - -
1,105 1,000 1,198
- 1,559
- -
1,421 - -
1,137 1,777
11 -
24 14
208
- - - -
344
- - - - -
- -
12 - -
- - -
23 43
- - - - -
75 -
13 - -
23 - - -
14
- 3
323 - -
7 - - - -
- -
389 - -
- -
95 - -
59 290
72 -
24
- -
208 - -
1,937 2,012
33 -
57 131 101
- - - -
259
- - - - -
5 -
38 - -
- - -
51 60
- - - - -
57 -
37 - -
52 - - -
26
- 8
1,020 - -
2 - - - -
- -
363 - -
10 -
262 - -
336 760
48 -
57
- -
101 - -
1,514 2,135
14 -
44 114 137
- - - 4
162
- - - - -
14 -
48 - -
- - -
75 56
- - - - -
6 -
19 - -
36 - - - 8
-
12 765
- -
- - - - -
- -
206 - -
5 -
297 - -
170 631
22 -
46
- -
137 - -
1,295 1,767
5 -
70 188
66
- - - 3
97
- - - - -
1 -
32 - -
- - -
56 77
- - - - -
17 - 1 - -
23 - - - 5
- 4
650 - -
- - - - -
- -
108 - -
3 -
349 - -
113 576
10 -
75
- -
61 - -
729 924
2 -
39 196
32
- - - 1
41
- - - - -
2 -
16 - -
- - -
54 54
- - - - -
3 - - - -
14 - - - -
- 3
272 - -
- - - - -
- -
43 - -
1 -
320 - -
61 202
31 -
43
- -
28 - -
3,766 3,859
89 - -
217 -
- - - 6
833
- - - - -
12 -
131 - -
- - -
228 178
- - - - -
- -
133 - -
28 - - -
55
- 53
1,790 - -
13 - - - -
- 2
1,123 - -
26 -
772 - -
282 1,561
- - -
- - - - -
1,658,924 1,971,307
57,548 - -
58,953 -
- - -
3,506 228,020
- - - - -
5,182 -
81,641 - -
- - -
110,453 57,546
- - - - -
- -
58,742 - -
5,416 - - -
20,020
- 83,842
882,993 - -
5,062 - - - -
- (D)
347,356 - -
(D)-
381,163 - -
144,251 752,534
- - -
- - - - -
558 563
653 - -
897 -
- - -
640 689
- - - - -
513 -
574 - -
- - -
859 868
- - - - -
- -
729 - -
529 - - -
915
- 851 386
- -
981 - - - -
- (D)
716 - -
(D)-
805 - -
415 383
- - -
- - - - -
See footnote(s) at end of table. --continued

82 2008 FRIS – GENERAL DATA 2007 CENSUS OF AGRICULTURE USDA, National Agricultural Statistics Service
Table 27. Crops Harvested from Irrigated Farms: 2008 and 2003 - Con. [Excludes institutional, research, and experimental farms and farms with horticulture. For meaning of abbreviations and symbols, see introductory text]
Sugarbeets for sugar
Irrigated Non-irrigated
Farms by acres harvested Geographic area
Farms Acres harvested
Average yield per
acre (tons)
1 to 24 acres
25 to 49 acres
50 to 99 acres
100 to 249 acres
250 acres or more
Farms Acres harvested
Average yield per
acre (tons)
United States .............................2008 .. 2003 .. 2008 DATA Alabama ............................................... Alaska ................................................... Arizona ................................................. Arkansas ............................................... California .............................................. Colorado ............................................... Connecticut ........................................... Delaware .............................................. Florida ................................................... Georgia ................................................. Hawaii ................................................... Idaho ..................................................... Illinois .................................................... Indiana .................................................. Iowa ...................................................... Kansas .................................................. Kentucky ............................................... Louisiana .............................................. Maine .................................................... Maryland ............................................... Massachusetts ...................................... Michigan ............................................... Minnesota ............................................. Mississippi ............................................ Missouri ................................................ Montana ................................................ Nebraska .............................................. Nevada ................................................. New Hampshire .................................... New Jersey ........................................... New Mexico .......................................... New York .............................................. North Carolina ...................................... North Dakota ........................................ Ohio ...................................................... Oklahoma ............................................. Oregon .................................................. Pennsylvania ........................................ Rhode Island ........................................ South Carolina ...................................... South Dakota ........................................ Tennessee ............................................ Texas .................................................... Utah ...................................................... Vermont ................................................ Virginia .................................................. Washington ........................................... West Virginia ........................................ Wisconsin ............................................. Wyoming ............................................... Water Resources Regions Region 01 New England ....................... Region 02 Mid-Atlantic .......................... Region 03 South Atlantic-Gulf .............. Region 04 Great Lakes ......................... Region 05 Ohio ..................................... Region 06 Tennessee ........................... Region 07 Upper Mississippi ................ Region 08 Lower Mississippi ................ Region 09 Souris-Red-Rainy ................ Region 10 Missouri ............................... Region 11 Arkansas-White-Red ........... Region 12 Texas-Gulf ........................... Region 13 Rio Grande .......................... Region 14 Upper Colorado ................... Region 15 Lower Colorado ................... Region 16 Great Basin ......................... Region 17 Pacific Northwest ................. Region 18 California ............................. Region 19 Alaska ................................. Region 20 Hawaii .................................
1,590 2,495
- - - -
181
199 - - - -
- 456
- - -
- - - - -
- 18 20
- -
156 257
- - -
- - -
58 -
- 85
- - -
- - - - -
- 4 - -
156
- - -
18 -
- 15
- 9
822
- - - - -
- 545 181
- -
382,267 561,653
- - - -
57,251
31,258 - - - -
- 141,792
- - -
- - - - -
- 1,388 3,313
- -
24,928 59,553
- - -
- - -
14,740 -
- 11,953
- - -
- - - - -
- 2,068
- -
34,023
- - -
1,388 -
- 2,598
- 1,461
163,756
- - - - -
- 155,813 57,251
- -
30 29
- - - -
41
27 - - - -
- 32
- - -
- - - - -
- 30 25
- -
27 23
- - -
- - -
24 -
- 31
- - -
- - - - -
- 41
- -
26
- - -
30 -
- 26
- 26 25
- - - - -
- 32 41
- -
32 47
- - - - -
- - - - -
- - - - -
- - - - -
- - - - -
- - - - -
- - - - -
- 3 - - -
- - - - -
- - - -
29
- - - - -
- - - -
29
- - - - -
- 3 - - -
122 59
- - - - 5
10
- - - -
- 86
- - -
- - - - -
- 7 - - -
- - - - -
- - - 9 -
- 3 - - -
- - - - -
- - - - 2
- - - 7 -
- - - -
21
- - - - -
- 89
5 - -
478 381
- - - - 5
88
- - - -
- 117
- - -
- - - - -
- 3 6 - -
84 119
- - -
- - - 4 -
- 38
- - -
- - - - -
- - - -
14
- - - 3 -
- 4 - 2
309
- - - - -
- 155
5 - -
502 1,430
- - - -
39
79 - - - -
- 119
- - -
- - - - -
- 8
13 - -
44 77
- - -
- - -
18 -
- 35
- - -
- - - - -
- - - -
70
- - - 8 -
- 10
- 7
284
- - - - -
- 154
39 - -
456 578
- - - -
132
22 - - - -
- 134
- - -
- - - - -
- - 1 - -
28 61
- - -
- - -
27 -
- 6 - - -
- - - - -
- 4 - -
41
- - - - -
- 1 - -
179
- - - - -
- 144 132
- -
45 87
- - - - -
- - - - -
- - - - -
- - - - -
- 23 17
- -
- - - - -
- - - 5 -
- - - - -
- - - - -
- - - - -
- - -
23 -
- 10
- 12
-
- - - - -
- - - - -
17,537 21,851
- - - - -
- - - - -
- - - - -
- - - - -
- 6,542 3,395
- -
- - - - -
- - -
7,600 -
- - - - -
- - - - -
- - - - -
- - -
6,542 -
- 1,434
- 9,561
-
- - - - -
- - - - -
27 18
- - - - -
- - - - -
- - - - -
- - - - -
- 28 25
- -
- - - - -
- - -
26 -
- - - - -
- - - - -
- - - - -
- - -
28 -
- 25
- 26
-
- - - - -
- - - - -
See footnote(s) at end of table. --continued

2007 CENSUS OF AGRICULTURE 2008 FRIS – GENERAL DATA 83 USDA, National Agricultural Statistics Service
Table 27. Crops Harvested from Irrigated Farms: 2008 and 2003 - Con. [Excludes institutional, research, and experimental farms and farms with horticulture. For meaning of abbreviations and symbols, see introductory text]
Tobacco, all types
Irrigated Non-irrigated
Farms by acres harvested Geographic area
Farms Acres harvested
Average yield per
acre (pounds)
Less than 5 acres
5 to 9 acres
10 to 24 acres
25 to 49 acres
50 acres or more
Farms Acres harvested
Average yield per
acre (pounds)
United States ............................. 2008 .. 2003 .. 2008 DATA Alabama ............................................... Alaska .................................................. Arizona ................................................. Arkansas .............................................. California .............................................. Colorado ............................................... Connecticut .......................................... Delaware .............................................. Florida .................................................. Georgia ................................................ Hawaii .................................................. Idaho .................................................... Illinois ................................................... Indiana ................................................. Iowa ..................................................... Kansas ................................................. Kentucky .............................................. Louisiana .............................................. Maine ................................................... Maryland .............................................. Massachusetts ..................................... Michigan ............................................... Minnesota ............................................. Mississippi ............................................ Missouri ................................................ Montana ............................................... Nebraska .............................................. Nevada ................................................. New Hampshire .................................... New Jersey .......................................... New Mexico .......................................... New York .............................................. North Carolina ...................................... North Dakota ........................................ Ohio ..................................................... Oklahoma ............................................. Oregon ................................................. Pennsylvania ........................................ Rhode Island ........................................ South Carolina ..................................... South Dakota ....................................... Tennessee ........................................... Texas ................................................... Utah ..................................................... Vermont ................................................ Virginia ................................................. Washington .......................................... West Virginia ........................................ Wisconsin ............................................. Wyoming .............................................. Water Resources Regions Region 01 New England ....................... Region 02 Mid-Atlantic ......................... Region 03 South Atlantic-Gulf .............. Region 04 Great Lakes ........................ Region 05 Ohio .................................... Region 06 Tennessee .......................... Region 07 Upper Mississippi ................ Region 08 Lower Mississippi ................ Region 09 Souris-Red-Rainy ................ Region 10 Missouri .............................. Region 11 Arkansas-White-Red ........... Region 12 Texas-Gulf .......................... Region 13 Rio Grande ......................... Region 14 Upper Colorado ................... Region 15 Lower Colorado ................... Region 16 Great Basin ......................... Region 17 Pacific Northwest ................ Region 18 California ............................. Region 19 Alaska ................................. Region 20 Hawaii .................................
811 1,507
- - - - -
- 17
- 2
16
- - 1 - -
- 379
- -
22
- - - - -
- - - - -
- -
222 - -
- - 3 - 3
-
72 - - -
74 - - - -
17 25
302 -
345
76 -
46 - -
- - - - -
- - - - -
23,614 35,059
- - - - -
- 837
- (D)
1,300
- -
(D) - -
- 8,498
- -
154
- - - - -
- - - - -
- -
8,488 - -
- -
24 -
195
- 1,444
- - -
2,167 - - - -
837 178
12,360 -
8,071
1,138 -
1,030 - -
- - - - -
- - - - -
2,634 2,413
- - - - -
- 1,554
- (D)
2,528
- -
(D) - -
- 3,034
- -
2,724
- - - - -
- - - - -
- -
2,198 - -
- -
2,000 -
3,000
- 3,158
- - -
2,947 - - - -
1,554 2,626 2,378
- 2,864
3,641
- 3,673
- -
- - - - -
- - - - -
97 229
- - - - -
- 10
- - -
- - - - -
- 42
- - -
- - - - -
- - - - -
- -
16 - -
- - - - -
- 21
- - -
8 - - - -
10 - 9 -
52
26 - - - -
- - - - -
- - - - -
156 298
- - - - -
- 1 - - -
- - - - -
- 63
- -
22
- - - - -
- - - - -
- -
16 - -
- - 3 - -
- 11
- - -
40 - - - -
1 25 56
- 59
9 - 6 - -
- - - - -
- - - - -
255 540
- - - - -
- - - - -
- - - - -
- 165
- - -
- - - - -
- - - - -
- -
64 - -
- - - - -
- 17
- - -
9 - - - -
- -
73 -
129
29 -
24 - -
- - - - -
- - - - -
177 255
- - - - -
- 3 - - -
- - - - -
- 89
- - -
- - - - -
- - - - -
- -
69 - -
- - - - 2
-
14 - - -
- - - - -
3 -
71 -
79
8 -
16 - -
- - - - -
- - - - -
126 185
- - - - -
- 3 - 2
16
- - 1 - -
- 20
- - -
- - - - -
- - - - -
- -
57 - -
- - - - 1
- 9 - - -
17 - - - -
3 -
93 -
26
4 - - - -
- - - - -
- - - - -
311 635
- - - - -
- - - - -
- - 3 - -
- 113
- - -
7 - - - -
- - - - -
- -
126 - -
- -
27 - 3
-
30 - - -
- - - 2 -
7 27
129 -
126
13 2 7 - -
- - - - -
- - - - -
20,753 15,409
- - - - -
- - - - -
- -
370 - -
- 1,558
- - -
(D)- - - -
- - - - -
- -
16,945 - -
- -
313 -
855
- 650
- - -
- - -
(D)-
(D)313
17,800 -
2,310
128 (D)
140 - -
- - - - -
- - - - -
1,494 1,917
- - - - -
- - - - -
- -
2,000 - -
- 2,609
- - -
(D)- - - -
- - - - -
- -
1,278 - -
- -
2,069 -
2,312
- 2,746
- - -
- - -
(D)-
(D)2,069 1,327
- 2,555
1,861
(D)3,200
- -
- - - - -
- - - - -
See footnote(s) at end of table. --continued

84 2008 FRIS – GENERAL DATA 2007 CENSUS OF AGRICULTURE USDA, National Agricultural Statistics Service
Table 27. Crops Harvested from Irrigated Farms: 2008 and 2003 - Con. [Excludes institutional, research, and experimental farms and farms with horticulture. For meaning of abbreviations and symbols, see introductory text]
Land in vegetables 2
Irrigated Non-irrigated
Farms by acres harvested Geographic area
Farms Acres harvested Less than
5 acres 5 to 24 acres
25 to 99 acres
100 to 249 acres
250 acres or more
Farms Acres harvested
United States .............................2008 .. 2003 .. 2008 DATA Alabama ............................................... Alaska ................................................... Arizona ................................................. Arkansas ............................................... California .............................................. Colorado ............................................... Connecticut ........................................... Delaware .............................................. Florida ................................................... Georgia ................................................. Hawaii ................................................... Idaho ..................................................... Illinois .................................................... Indiana .................................................. Iowa ...................................................... Kansas .................................................. Kentucky ............................................... Louisiana .............................................. Maine .................................................... Maryland ............................................... Massachusetts ...................................... Michigan ............................................... Minnesota ............................................. Mississippi ............................................ Missouri ................................................ Montana ................................................ Nebraska .............................................. Nevada ................................................. New Hampshire .................................... New Jersey ........................................... New Mexico .......................................... New York .............................................. North Carolina ...................................... North Dakota ........................................ Ohio ...................................................... Oklahoma ............................................. Oregon .................................................. Pennsylvania ........................................ Rhode Island ........................................ South Carolina ...................................... South Dakota ........................................ Tennessee ............................................ Texas .................................................... Utah ...................................................... Vermont ................................................ Virginia .................................................. Washington ........................................... West Virginia ........................................ Wisconsin ............................................. Wyoming ............................................... Water Resources Regions Region 01 New England ....................... Region 02 Mid-Atlantic .......................... Region 03 South Atlantic-Gulf .............. Region 04 Great Lakes ......................... Region 05 Ohio ..................................... Region 06 Tennessee ........................... Region 07 Upper Mississippi ................ Region 08 Lower Mississippi ................ Region 09 Souris-Red-Rainy ................ Region 10 Missouri ............................... Region 11 Arkansas-White-Red ........... Region 12 Texas-Gulf ........................... Region 13 Rio Grande .......................... Region 14 Upper Colorado ................... Region 15 Lower Colorado ................... Region 16 Great Basin ......................... Region 17 Pacific Northwest ................. Region 18 California ............................. Region 19 Alaska ................................. Region 20 Hawaii .................................
16,899 15,954
236 14 95
199 2,086
468
91 112 325 753
392 908 178 212
46
127 267 115
88 317
128 670 274
68 256
79
137 6
57 367
200 356 416
36 276
94
1,123 801
34 287
38
228 1,344
376 30
118
1,601 51
412 7
410 1,792 2,014 1,142
771
247 784 412
42 502
290
1,274 382 242 101
384
3,579 2,125
14 392
3,084,879 2,068,317
5,218 330
102,471 12,054
911,694
97,416 1,030
16,401 171,644 57,772
5,156
356,957 20,627 14,510
1,391
5,428 1,417 4,616 4,934
16,953
2,568 114,222 56,747
2,598 21,052
13,430
145,848 6,189
474 31,545
27,459 11,314 18,596 29,633
7,228
7,754 182,045 10,538
353 13,336
128
6,609 78,821
2,208 121
11,170
284,122 320
187,461 2,975
9,379 89,513
264,197 168,001 14,729
5,606
217,897 33,466 25,365
198,438
28,990 56,837
106,501 14,934
106,394
14,881 811,669 912,598
330 5,156
6,774 5,677
153 6 - -
395
- 57
9 67
169
308 -
41 91 28
56
185 109
55 144
81
214 46 66
194
8 51
- 43
126
126 197 202
- 126
38
525 453
25 151
34
155 583 276
20
12 979
45 125
-
273 867 770 368 438
150 230 170
- 178
132 583 124
2 -
276 1,504
395 6
308
3,200 3,504
55 5
22 121 404
211
29 31 95
363
62 46 15 27
4
- 68
- 14 61
28
192 32
- 42
12
- - 6
83
6 79 72
5 98
-
27 243
2 81
4
49 279
90 10
45
- 3
79 -
79 372 661 374 225
50 89
137 -
41
38 279
6 196
22
87 73
404 5
62
2,601 2,779
21 2 6
60 230
71
4 29
4 101
20
243 75 49 11
56 14
- 3
52
7 78
110 - 8
7 - 2 8
66
18 52 92
- 38
43
154 85
7 39
-
13 328
6 -
32 303
3 51
-
29 298 235 142
72
35 217
68 14
103
43 305
55 22 10
5
675 251
2 20
1,599 2,495
5 1 7 9
231
72 -
30 20 50
-
317 24 31
2
15 - 2
10 44
12 74 44
- 4
16
- - -
54
23 19 38
4 10
7
145 15
- 1
- 8
93 1 -
13 116
- 32
-
22 167 112 102
25
8 95 16
6 25
65 52 67 19
7
1 563 246
1 -
2,725 1,499
2 -
60 9
826
114 1
13 139
70
2 302
23 14
1
- - 4 6
16
- 112
42 2 8
36 86
4 -
38
27 9
12 27
4
6 272
5 -
15
- 3
61 3 -
16 203
- 125
7
7 88
236 156
11
4 153
21 22
155
12 55
130 3
62
15 764 829
- 2
2,854 2,381
78 5 -
17 405
-
25 22
3 124
11
- 79 45 14
112
86 -
77 74
28
267 49
1 8
- - -
20 34
2
140 88
7 125
3 2
303 17 31
3
77 279
- 3
37
6 12
135 -
167 458 304 459 273
79
249 25 10 61
59
279 2 - -
- 8
405 5
11
145,704 129,194
1,369 (D)
- 7,280
408
- 558
4,360 (D)
2,374
66 -
3,459 303
57
896 486
- 28,222
1,754
1,785 19,000
6,499 (D)
1,368
- - -
549 1,556
(D)
15,036 9,405 1,828 3,859
59 (D)
7,406 439 307
24
5,941 56
- 180
1,676
(D)85
14,197 -
31,553 18,449 13,747 39,865
3,312
1,537 17,823 13,348
2,259 1,464
115
56 (D)
- -
- 1,444
408 (D)66
See footnote(s) at end of table. --continued

2007 CENSUS OF AGRICULTURE 2008 FRIS – GENERAL DATA 85 USDA, National Agricultural Statistics Service
Table 27. Crops Harvested from Irrigated Farms: 2008 and 2003 - Con. [Excludes institutional, research, and experimental farms and farms with horticulture. For meaning of abbreviations and symbols, see introductory text]
Sweet corn
Irrigated Non-irrigated
Farms by acres harvested Geographic area
Farms Acres harvested Less than
5 acres 5 to 24 acres
25 to 49 acres
50 to 99 acres
100 acres or more
Farms Acres harvested
United States ............................. 2008 .. 2003 .. 2008 DATA Alabama ............................................... Alaska .................................................. Arizona ................................................. Arkansas .............................................. California .............................................. Colorado ............................................... Connecticut .......................................... Delaware .............................................. Florida .................................................. Georgia ................................................ Hawaii .................................................. Idaho .................................................... Illinois ................................................... Indiana ................................................. Iowa ..................................................... Kansas ................................................. Kentucky .............................................. Louisiana .............................................. Maine ................................................... Maryland .............................................. Massachusetts ..................................... Michigan ............................................... Minnesota ............................................. Mississippi ............................................ Missouri ................................................ Montana ............................................... Nebraska .............................................. Nevada ................................................. New Hampshire .................................... New Jersey .......................................... New Mexico .......................................... New York .............................................. North Carolina ...................................... North Dakota ........................................ Ohio ..................................................... Oklahoma ............................................. Oregon ................................................. Pennsylvania ........................................ Rhode Island ........................................ South Carolina ..................................... South Dakota ....................................... Tennessee ........................................... Texas ................................................... Utah ..................................................... Vermont ................................................ Virginia ................................................. Washington .......................................... West Virginia ........................................ Wisconsin ............................................. Wyoming .............................................. Water Resources Regions Region 01 New England ....................... Region 02 Mid-Atlantic ......................... Region 03 South Atlantic-Gulf .............. Region 04 Great Lakes ........................ Region 05 Ohio .................................... Region 06 Tennessee .......................... Region 07 Upper Mississippi ................ Region 08 Lower Mississippi ................ Region 09 Souris-Red-Rainy ................ Region 10 Missouri .............................. Region 11 Arkansas-White-Red ........... Region 12 Texas-Gulf .......................... Region 13 Rio Grande ......................... Region 14 Upper Colorado ................... Region 15 Lower Colorado ................... Region 16 Great Basin ......................... Region 17 Pacific Northwest ................ Region 18 California ............................. Region 19 Alaska ................................. Region 20 Hawaii .................................
4,341 4,052
79 - 3 -
38
231 38 35
163 227
22
267 73 83 14
-
121 4
11 131
33
183 139
68 38
9
51 -
25 115
139 162 188
- 85
43
110 207
8 144
38 79 24
4 6
46
626 17
214 -
115 617 880 364 264
65
361 25
- 105
81 24
137 233
3
4 1,003
38 -
22
294,855 282,158
467 - 6 -
23,890
4,744 213
5,760 30,459 15,209
342
23,286 5,381 1,917
393
- 376
3,402 161
7,494
1,606 3,783 9,300 2,532
114
7 34
- 310
3,599
(D) 2,455 1,587
- 1,187
610
16,474 2,060
80 901
60
159 24 (D)
1
2,405 66,522
93 54,718
-
2,370 21,682 48,306 18,274
2,323
811 58,323
5,832 -
187
724 24 (D)
4,746 6
(D)
106,282 23,890
- 342
2,445 1,909
54 - 3 - -
193 25
2 66 92
15
- 19 26
5
- 95
2 3
49
- 120
31 66 38
9
51 -
16 55
126 121 149
- 45
- -
100 4
114
36 76 24
- 6
17
490 15 87
-
48 295 558 203 194
53 83 21
- 101
38 24
124 195
3
- 490
- -
15
810 950
21 - - - -
- 10
2 66
118
4 40 25 39
2
- 26
- 5
27
14 51 12
- -
- - - 3
18
7 15 32
- 31
38 27 94
4 28
2 2 - 3 -
6 15
1 22
-
36 154 258
95 51
9
71 - - 2
38
- 7 - -
3 82
- - 4
270 346
4 - - - -
19 3 1 2 -
2 51
- 11
4
- - - 3
11
7 4
30 - -
- - - 5
19
6 14
- - 2
3
31 8 - -
- - - - -
14 7 - 9 -
18 54 11 20
8
- 38
- - 2
3 - 6
19 -
- 89
- - 2
263 279
- - - - 4
- -
15 - -
- 85 18
- 3
- - - -
11
- -
39 - -
- - - 1
13
- 6 4 - 4
2
17 3 - 1
- 1 - - -
2 10
1 23
-
1 47
5 16
2
1 73
- - -
2 - - - -
- 112
4 - -
553 568
- - - -
34
19 -
15 29 17
1
91 11
7 -
- - 2 -
33
12 8
27 2 -
- - - -
10
- 6 3 - 3
-
35 2 - 1
- - - 1 -
7 104
- 73
-
12 67 48 30
9
2 96
4 - -
- - -
19 -
1 230
34 - 1
844 874
24 - - - 5
- 7 4 1
104
- -
10 13
5
- 52
- 3
25
14 89 27
- -
- - - 9 3
-
71 - -
46
- -
211 6 -
3 36
- - 3
- - 9
64 -
39 205 129 206 151
20 86
- - 3
- - - - -
- - 5 - -
18,681 17,836
30 - - -
200
- 196 (D)(D)
312
- -
1,327 130 (D)
-
99 -
54 232
469 906
4,298 - -
- - -
264 72
-
1,099 - -
1,440
- -
2,564 32
-
6 110
- - 9
- -
31 3,652
-
1,015 2,687 1,342 4,967 1,056
78
7,330 - - 6
- - - - -
- -
200 - -
See footnote(s) at end of table. --continued

86 2008 FRIS – GENERAL DATA 2007 CENSUS OF AGRICULTURE USDA, National Agricultural Statistics Service
Table 27. Crops Harvested from Irrigated Farms: 2008 and 2003 - Con. [Excludes institutional, research, and experimental farms and farms with horticulture. For meaning of abbreviations and symbols, see introductory text]
Tomatoes
Irrigated Non-irrigated
Farms by acres harvested Geographic area
Farms Acres harvested Less than
5 acres 5 to 24 acres
25 to 49 acres
50 to 99 acres
100 acres or more
Farms Acres harvested
United States .............................2008 .. 2003 .. 2008 DATA Alabama ............................................... Alaska ................................................... Arizona ................................................. Arkansas ............................................... California .............................................. Colorado ............................................... Connecticut ........................................... Delaware .............................................. Florida ................................................... Georgia ................................................. Hawaii ................................................... Idaho ..................................................... Illinois .................................................... Indiana .................................................. Iowa ...................................................... Kansas .................................................. Kentucky ............................................... Louisiana .............................................. Maine .................................................... Maryland ............................................... Massachusetts ...................................... Michigan ............................................... Minnesota ............................................. Mississippi ............................................ Missouri ................................................ Montana ................................................ Nebraska .............................................. Nevada ................................................. New Hampshire .................................... New Jersey ........................................... New Mexico .......................................... New York .............................................. North Carolina ...................................... North Dakota ........................................ Ohio ...................................................... Oklahoma ............................................. Oregon .................................................. Pennsylvania ........................................ Rhode Island ........................................ South Carolina ...................................... South Dakota ........................................ Tennessee ............................................ Texas .................................................... Utah ...................................................... Vermont ................................................ Virginia .................................................. Washington ........................................... West Virginia ........................................ Wisconsin ............................................. Wyoming ............................................... Water Resources Regions Region 01 New England ....................... Region 02 Mid-Atlantic .......................... Region 03 South Atlantic-Gulf .............. Region 04 Great Lakes ......................... Region 05 Ohio ..................................... Region 06 Tennessee ........................... Region 07 Upper Mississippi ................ Region 08 Lower Mississippi ................ Region 09 Souris-Red-Rainy ................ Region 10 Missouri ............................... Region 11 Arkansas-White-Red ........... Region 12 Texas-Gulf ........................... Region 13 Rio Grande .......................... Region 14 Upper Colorado ................... Region 15 Lower Colorado ................... Region 16 Great Basin ......................... Region 17 Pacific Northwest ................. Region 18 California ............................. Region 19 Alaska ................................. Region 20 Hawaii .................................
5,937 6,101
109 - -
121 1,272
193
43 8
26 129
96
- 26 92 34
56
168 107
7 73
47
315 50 66 81
9 - -
43 185
13
253 138
- 162
78
3 425
16 90
35
168 303
1 11
61
703 43 78
-
160 839 527 507 473
181 196 245
- 91
134 279
37 193
-
1 706
1,272 -
96
305,565 426,656
1,125 - -
2,349 234,041
386
70 18
37,617 2,496
852
- 27
3,979 34
39
399 58
4 426
132
6,286 75
7 56
2 - -
31 1,997
25
432 852
- 2,127
298
15 1,821
33 2,837
(D)
1,888 256 (D)
1
886 1,511
41 23
-
271 5,214
44,109 8,578 3,198
2,481 1,732 2,504
- 53
337 112 (D)
386 -
(D) 1,526
234,041 -
852
4,717 4,243
73 - - -
790
193 39
5 -
92
88 -
26 65 30
56
146 107
7 56
40
291 43 66 81
9 - -
42 141
13
225 117
- 135
38
- 373
14 72
35
146 279
1 11
54
597 43 78
-
146 726 408 450 392
147 180 122
- 91
94
279 13
193 -
1 597 790
- 88
517 381
24 - -
61 29
- 3 3 2
30
5 - -
11 4
-
16 - -
11
7 - 7 - -
- - - 1
27
- 28
4 -
10
38 3
39 2 9
- 7
24 - -
6 106
- - -
13 76 69 17 60
4
11 62
- -
38 -
24 - -
- 109
29 - 5
175 103
6 - -
60 60
- 1 - - -
2 - - - -
- 6 - - 3
- 1 - - -
- - - - 9
- -
15 - 2
- - 4 - 3
- 3 - - -
- - - - -
1 16
7 3 9
17
- 60
- -
- - - - -
- -
60 - 2
100 764
6 - - -
56
- - - - -
- - - 5 -
- - - - 3
- 2 - - -
- - - - 4
- - - - 8
2 - 6 - -
- 8 - - -
- - - - -
- 13
6 10
5
7 - 1 - -
2 - - - -
- -
56 - -
428 610
- - - -
337
- - -
24 7
1 - -
11 -
- - - - -
- 21
- - -
- - - - 4
- - 2 - 7
- - 3 - 6
- 4 - - -
1 - - - -
- 8
37 27
7
6 5 - - -
- - - - -
- -
337 - 1
581 255
13 - - -
395
- 2 - - -
- - 2
13 -
- 20
- - -
- 4 - - -
- - - - -
- 10
- -
30
- -
53 5
10
3 8 - - -
- - -
13 -
7 58 23 45 35
-
15 - - 3
- - - - -
- -
395 - -
2,026 1,947
20 - - -
198
- (D)
- - -
- -
(D)13
-
- 17
- - -
- 666
- - -
- - - - -
- 60
- -
907
- -
97 (D)(D)
3 8 - - -
- - -
26 -
7 111
23 1,548
109
- 27
- - 3
- - - - -
- -
198 - -
See footnote(s) at end of table. --continued

2007 CENSUS OF AGRICULTURE 2008 FRIS – GENERAL DATA 87 USDA, National Agricultural Statistics Service
Table 27. Crops Harvested from Irrigated Farms: 2008 and 2003 - Con. [Excludes institutional, research, and experimental farms and farms with horticulture. For meaning of abbreviations and symbols, see introductory text]
Lettuce and Romaine
Irrigated Non-irrigated
Farms by acres harvested Geographic area
Farms Acres harvested Less than
5 acres 5 to 24 acres
25 to 49 acres
50 to 99 acres
100 acres or more
Farms Acres harvested
United States ............................. 2008 .. 2003 .. 2008 DATA Alabama ............................................... Alaska .................................................. Arizona ................................................. Arkansas .............................................. California .............................................. Colorado ............................................... Connecticut .......................................... Delaware .............................................. Florida .................................................. Georgia ................................................ Hawaii .................................................. Idaho .................................................... Illinois ................................................... Indiana ................................................. Iowa ..................................................... Kansas ................................................. Kentucky .............................................. Louisiana .............................................. Maine ................................................... Maryland .............................................. Massachusetts ..................................... Michigan ............................................... Minnesota ............................................. Mississippi ............................................ Missouri ................................................ Montana ............................................... Nebraska .............................................. Nevada ................................................. New Hampshire .................................... New Jersey .......................................... New Mexico .......................................... New York .............................................. North Carolina ...................................... North Dakota ........................................ Ohio ..................................................... Oklahoma ............................................. Oregon ................................................. Pennsylvania ........................................ Rhode Island ........................................ South Carolina ..................................... South Dakota ....................................... Tennessee ........................................... Texas ................................................... Utah ..................................................... Vermont ................................................ Virginia ................................................. Washington .......................................... West Virginia ........................................ Wisconsin ............................................. Wyoming .............................................. Water Resources Regions Region 01 New England ....................... Region 02 Mid-Atlantic ......................... Region 03 South Atlantic-Gulf .............. Region 04 Great Lakes ........................ Region 05 Ohio .................................... Region 06 Tennessee .......................... Region 07 Upper Mississippi ................ Region 08 Lower Mississippi ................ Region 09 Souris-Red-Rainy ................ Region 10 Missouri .............................. Region 11 Arkansas-White-Red ........... Region 12 Texas-Gulf .......................... Region 13 Rio Grande ......................... Region 14 Upper Colorado ................... Region 15 Lower Colorado ................... Region 16 Great Basin ......................... Region 17 Pacific Northwest ................ Region 18 California ............................. Region 19 Alaska ................................. Region 20 Hawaii .................................
2,203 2,051
13 2
33 -
439
6 13
- 74
-
96 -
13 13
8
56 27
- 2 2
19 85 31
- -
5 - -
17 94
10
180 89
- 25
38
- 80 19
-
5 22
- -
14
9 596
16 52
-
78 295 167 160 123
27 61
2 -
14
94 -
16 -
34
- 596 438
2 96
255,880 276,426
5 (D)
38,310 -
200,470
4,471 16
- 8,581
-
184 -
26 3 2
6
16 -
(D) (D)
26
688 23
- -
1 - - 8
918
690 494
21 -
(D)
8 -
134 9 -
1 (D)
- -
(D)
27 182
5 18
-
64 1,500 8,603 1,210
89
9 (D) (D)
- 3
13
- 5,161
- 38,899
-
182 199,881
(D) 184
1,657 1,048
13 1 - - -
- 13
- 66
-
90 -
13 13
8
56 27
- 2 2
19 84 29
- -
5 - -
16 72
-
168 89
- 23
38
- 77 19
-
5 22
- -
14
9 596
16 52
-
77 258 159 157 123
27 59
2 -
14
94 - - - -
- 596
- 1
90
83 54
- - - -
54
- - - - -
4 - - - -
- - - - -
- - 2 - -
- - - 1 6
6 8 - - -
- - 2 - -
- - - - -
- - - - -
1 16
- - -
- 2 - - -
- - 6 - -
- -
54 - 4
25 40
- 1 - -
10
- - - - -
2 - - - -
- - - - -
- - - - -
- - - -
10
- 2 - - -
- - - - -
- - - - -
- - - - -
- 12
- - -
- - - - -
- - - - -
- -
10 1 2
176 14
- - - -
170
- - - - -
- - - - -
- - - - -
- - - - -
- - - - 4
- - - - 1
- - 1 - -
- - - - -
- - - - -
- 5 - 1 -
- - - - -
- - - - -
- -
170 - -
262 895
- -
33 -
205
6 - - 8 -
- - - - -
- - - - -
- 1 - - -
- - - - 2
4 2 - - 1
- - - - -
- - - - -
- - - - -
- 4 8 2 -
- - - - -
- -
10 -
34
- -
204 - -
51 49
4 - - - -
- - - - -
- - - - 5
- - - - -
- - - - -
- - - 1 -
2 - - - 9
- - 3 5 -
- 9 - - -
- - -
13 -
6 - 4 9 3
9
18 - - -
- - 2 - -
- - - - -
340 338
8 - - - -
- - - - -
- - - - 5
- - - - -
- - - - -
- - -
(D)-
(D)- - -
(D)
- - 3
(D)-
- 14
- - -
- - -
20 -
49 - 8
(D)3
14 25
- - -
- -
(D)- -
- - - - -
See footnote(s) at end of table. --continued

88 2008 FRIS – GENERAL DATA 2007 CENSUS OF AGRICULTURE USDA, National Agricultural Statistics Service
Table 27. Crops Harvested from Irrigated Farms: 2008 and 2003 - Con. [Excludes institutional, research, and experimental farms and farms with horticulture. For meaning of abbreviations and symbols, see introductory text]
Potatoes
Irrigated Non-irrigated
Farms by acres harvested Geographic area
Farms Acres harvested Less than
15 acres 15 to 99
acres 100 to
249 acres 250 to
499 acres 500 acres or more
Farms Acres harvested
United States .............................2008 .. 2003 .. 2008 DATA Alabama ............................................... Alaska ................................................... Arizona ................................................. Arkansas ............................................... California .............................................. Colorado ............................................... Connecticut ........................................... Delaware .............................................. Florida ................................................... Georgia ................................................. Hawaii ................................................... Idaho ..................................................... Illinois .................................................... Indiana .................................................. Iowa ...................................................... Kansas .................................................. Kentucky ............................................... Louisiana .............................................. Maine .................................................... Maryland ............................................... Massachusetts ...................................... Michigan ............................................... Minnesota ............................................. Mississippi ............................................ Missouri ................................................ Montana ................................................ Nebraska .............................................. Nevada ................................................. New Hampshire .................................... New Jersey ........................................... New Mexico .......................................... New York .............................................. North Carolina ...................................... North Dakota ........................................ Ohio ...................................................... Oklahoma ............................................. Oregon .................................................. Pennsylvania ........................................ Rhode Island ........................................ South Carolina ...................................... South Dakota ........................................ Tennessee ............................................ Texas .................................................... Utah ...................................................... Vermont ................................................ Virginia .................................................. Washington ........................................... West Virginia ........................................ Wisconsin ............................................. Wyoming ............................................... Water Resources Regions Region 01 New England ....................... Region 02 Mid-Atlantic .......................... Region 03 South Atlantic-Gulf .............. Region 04 Great Lakes ......................... Region 05 Ohio ..................................... Region 06 Tennessee ........................... Region 07 Upper Mississippi ................ Region 08 Lower Mississippi ................ Region 09 Souris-Red-Rainy ................ Region 10 Missouri ............................... Region 11 Arkansas-White-Red ........... Region 12 Texas-Gulf ........................... Region 13 Rio Grande .......................... Region 14 Upper Colorado ................... Region 15 Lower Colorado ................... Region 16 Great Basin ......................... Region 17 Pacific Northwest ................. Region 18 California ............................. Region 19 Alaska ................................. Region 20 Hawaii .................................
3,727 3,126
13 3 4 -
122
137 20
8 45
103
24 520
15 22 11
-
55 53 14 18
14
226 127
- 121
66 86
3 15 99
3
62 117
30 25
78
192 132
5 97
33 37
8 2
10
28 720
14 183
7
76 318 386 356
99
35 257
60 40
266
117 8
117 2 4
14
1,382 163
3 24
974,606 1,032,155
10 (D)
2,421 -
43,304
53,878 12
1,283 26,343
62
2 286,937
(D) 639 287
-
48 53 (D)
724
14 42,363 37,642
- 9,927
11,943
145,814 (D)
7 1,156
(D)
2,094 65
28,353 30
684
46,806 2,382
(D) 58
10 25
5,083 (D)
1
3,080 142,357
5 57,287
2,975
2,619 9,120
26,552 55,030
1,202
21 75,319
9,915 (D)
177,037
4,654 1,214
52,543 (D)
2,421
12,593 465,108 46,868
(D) 2
1,996 646
13 1 - -
54
10 20
- -
103
24 -
13 17
6
- 55 53
2 8
14
157 45
- 114
11
- -
15 91
-
50 117
- 25
76
- 111
4 97
33 37
- -
10
15 490
14 91
-
63 251 341 256
94
35 128
53 -
82
114 -
10 - -
- 490
54 1
24
438 671
- 2 - - 9
27
- 4 - -
- 101
- - 4
- - - 2 7
-
13 38
- -
7 - 2 - 2
1 3 - - -
- 111
13 1 -
- - - - -
- 73
- 18
-
3 28
- 20
-
- 40
- 14 26
- 1 8 - -
2 263
31 2 -
424 708
- - 2 - 5
17
- 2
10 -
- 156
1 5 1
- - - 7 3
-
33 13
- 2
16
- - - 6
- 6 - 4 -
2 39
5 - -
- - 5 - -
9 50
- 25
-
7 30 10 42
3
- 30
2 6
18
2 5
17 - 2
-
230 20
- -
328 549
- - - -
19
39 - 2
14 -
- 89
- - -
- - - 2 -
- 11 15
- -
31 3 - - -
- 2 - 7 -
- 18
3 - -
- - 2 1 -
2 41
- 20
7
2 7
14 22
2
- 21
- 8
43
- 2
39 - -
1 144
23 - -
541 552
- - 2 -
35
44 - -
21 -
- 174
1 - -
- - - 1 -
- 12 16
- 5
1
83 1 - -
2 1 -
19 -
- 24
- - -
- - 1 1 -
2 66
- 29
-
1 2
21 16
-
- 38
5 12 97
1 -
43 2 2
11
255 35
- -
447 320
4 5 - - -
- - 2 2
52
- - -
13 5
56
7 -
14 26
7 5 1 - 2
- - - - 1
- 7 - 7
49
- 2
96 6 -
- 33
- - -
13 3 -
29 -
27 97 58 38 98
25 28
- 8 2
56
- - - -
- 5 - 5 -
13,653 26,120
4 (D)
- - -
- -
(D)(D)52
- - - 3 3
56
1 -
4,784 97
(D)
1,011 (D)
- (D)
- - - -
(D)
- 802
- 1,828
50
- (D)
1,452 (D)
-
- 37
- - -
413 (D)
- 1,183
-
4,995 2,519
156 2,085
106
29 356
- 2,129
(D)
56 - - - -
- 604
- (D)
-
See footnote(s) at end of table. --continued

2007 CENSUS OF AGRICULTURE 2008 FRIS – GENERAL DATA 89 USDA, National Agricultural Statistics Service
Table 27. Crops Harvested from Irrigated Farms: 2008 and 2003 - Con. [Excludes institutional, research, and experimental farms and farms with horticulture. For meaning of abbreviations and symbols, see introductory text]
Land in orchards, vineyards, and nut trees All berries
Irrigated Non-irrigated Irrigated Non-irrigated
Farms by acres harvested Geographic area
Farms Acres harvested Less than
5 acres 5 to 14 acres
15 to 49 acres
50 to 99 acres
100 acres or more
Farms Acres harvested Farms Acres
harvested Farms Acres harvested
United States ............................. 2008 .. 2003 .. 2008 DATA Alabama ............................................... Alaska .................................................. Arizona ................................................. Arkansas .............................................. California .............................................. Colorado ............................................... Connecticut .......................................... Delaware .............................................. Florida .................................................. Georgia ................................................ Hawaii .................................................. Idaho .................................................... Illinois ................................................... Indiana ................................................. Iowa ..................................................... Kansas ................................................. Kentucky .............................................. Louisiana .............................................. Maine ................................................... Maryland .............................................. Massachusetts ..................................... Michigan ............................................... Minnesota ............................................. Mississippi ............................................ Missouri ................................................ Montana ............................................... Nebraska .............................................. Nevada ................................................. New Hampshire .................................... New Jersey .......................................... New Mexico .......................................... New York .............................................. North Carolina ...................................... North Dakota ........................................ Ohio ..................................................... Oklahoma ............................................. Oregon ................................................. Pennsylvania ........................................ Rhode Island ........................................ South Carolina ..................................... South Dakota ....................................... Tennessee ........................................... Texas ................................................... Utah ..................................................... Vermont ................................................ Virginia ................................................. Washington .......................................... West Virginia ........................................ Wisconsin ............................................. Wyoming .............................................. Water Resources Regions Region 01 New England ....................... Region 02 Mid-Atlantic ......................... Region 03 South Atlantic-Gulf .............. Region 04 Great Lakes ........................ Region 05 Ohio .................................... Region 06 Tennessee .......................... Region 07 Upper Mississippi ................ Region 08 Lower Mississippi ................ Region 09 Souris-Red-Rainy ................ Region 10 Missouri .............................. Region 11 Arkansas-White-Red ........... Region 12 Texas-Gulf .......................... Region 13 Rio Grande ......................... Region 14 Upper Colorado ................... Region 15 Lower Colorado ................... Region 16 Great Basin ......................... Region 17 Pacific Northwest ................ Region 18 California ............................. Region 19 Alaska ................................. Region 20 Hawaii .................................
57,184 57,820
155 3
670 180
32,651
772 43
- 3,887
721
480 420
48 20 14
31 40
232 32 49
27
327 94
131 38
145 240
64 18 83
2,896
150 172
12 58
249
1,525 249
24 209
2
78 3,026
829 18
240
5,659 21
145 7
146 581
5,264 529 147
96
204 373
7 289
997
2,919 2,604
666 754
786
7,688 32,651
3 480
3,733,339 4,098,357
1,286 9
30,745 420
2,546,785
2,123 262
- 522,632 79,780
6,653 8,403
525 249
72
304 270
1,855 633 664
427
12,519 1,003
530 2,090
290 720 589
58 4,273
68,806
5,413 2,153
39 977
1,531
33,404 3,251
158 9,843
(D)
434 87,682
4,602 159
1,169
286,697 118 651
70
1,562 11,324
615,299 16,466
1,044
1,684 1,947 2,097
14 1,191
6,919
64,851 89,177
2,849 30,787
4,316
328,367 2,546,785
9 6,653
20,148 17,323
100 3
375 180
8,226
772 35
- 1,110
121
322 273
39 - 9
1
19 214
- 28
13 72 59 65
-
145 240
49 14 31
1,840
7 132
7 20
194 847 164
15 180
-
56 1,966
719 13
123
1,226 19
105 -
77 285
1,676 163 100
50
121 351
7 240
836
1,966 1,512
579 459
684
2,491 8,226
3 322
15,253 13,063
35 -
66 -
9,523
- 4 -
557 266
130
61 - 8 5
30
8 16 30 11
12
101 15 66
-
- - 2 4
18
652 82
- 5
22
42 416
31 7
11
2 21
837 3 4
117
2,001 -
25 7
59 165 971 161
25
30 40 20
- 49
104 837 588
2 66
66
2,417 9,523
- 130
11,833 15,284
16 -
160 -
8,183
- 4 -
1,032 81
18 77
- 12
-
- 13
- - 5
-
96 14
- -
- -
13 -
17
263 31 31
- 4
11
180 33
2 3
- -
51 84
-
- 1,382
2 15
-
6 74
1,159 121
19
4 28
- - -
11 51
263 84
160
13 1,639 8,183
- 18
3,707 4,714
2 -
32 -
2,359
- - -
529 71
4 - 9 - -
- - - - 3
-
33 6 -
38
- - - - 5
49 12
- -
12
- 5
15 - 2
- -
92 - -
- 429
- - -
- 30
604 49
1
- 15
- - -
38 11
130 -
32
- 434
2,359 - 4
6,243 7,436
2 -
37 -
4,360
- - -
659 182
6 9 - - -
- - 2 2 2
2
25 - - -
- - - -
12
92 18
9 - -
2 77
6 -
13
- 1
80 23
1
- 621
- - -
4 27
854 35
2
12 - 2 - -
8 54
111 1
37
23 707
4,360 - 6
3,003 2,335
56 - - 8 6
-
27 -
158 239
80
- 29 32
-
- 33
- 2
18
7 280
15 5
42
- 240
- 10 38
6
132 25
7 35
38
303 120
15 12
2
40 285
- 9
17
599 7
26 -
63 210 472 391 133
58 55 10
7 279
46
285 6 - -
- 902
6 -
80
138,879 115,298
789 - -
480 150
-
251 -
5,546 39,570
426
- 98
909 -
- 119
- (D)
819
280 61,439
45 255 649
-
240 -
(D) 379
156
5,218 2,200
6 835
684
2,922 6,758
95 737
(D)
104 331
- 379
286
3,716 1,713
72 -
915 11,452 46,940 66,145
1,113
2,006 282 275
6 881
1,164
331 156
- -
- 6,638
150 -
426
9,021 7,961
111 3 - -
1,138
- 44
9 612 351
12
1 61 40 23
-
106 53
114 47
545 451 132
65 38
- - -
52 199
-
218 385
7 116
76
1,082 311
10 80
-
157 558
84 38
122
1,107 46
417 -
776 765
1,598 669 367
140 554
74 -
17
76 558
- - -
84 2,190 1,138
3 12
222,857 225,475
394 3 - -
74,362
- 143
57 10,184 23,967
1
(D)145 336
98
- 179
53 8,082
120
13,883 16,054
798 1,950
4
- - -
119 11,391
-
1,195 8,110
105 373
114
17,275 776 136 228
-
314 4,046
84 208
567 (D)
113 21,444
-
22,476 13,124 44,923 17,316
1,162
246 22,055
111 -
111
114 4,046
- - -
84 22,724 74,362
3 1
538 649
12 - - - -
- 2 - - -
- - -
13 -
- 26
- 43
7
38 108
- - -
- - - 9
26
- 76 42
- 26
- 1
60 - -
- 8 - - 8
- 2 5
26 -
100 121
50 187
65
12 - - - -
- - - - -
- 3 - - -
15,560 21,307
120 ----
-(D)
---
---
130 -
-15
-7,645
18
22 1,660
---
---
(D)448
-170
4,902 -
95
-(D)50
--
-16
--
24
-(D)10 33
-
7,710 552
5,002 1,843
233
36 ----
-----
-185
---
See footnote(s) at end of table. --continued

90 2008 FRIS – GENERAL DATA 2007 CENSUS OF AGRICULTURE USDA, National Agricultural Statistics Service
Table 27. Crops Harvested from Irrigated Farms: 2008 and 2003 - Con. [Excludes institutional, research, and experimental farms and farms with horticulture. For meaning of abbreviations and symbols, see introductory text]
All other crops (see text) Pastureland, all types
Irrigated Non-irrigated Irrigated Non-irrigated Geographic area
Farms Acres harvested Farms Acres
harvested Farms Acres Farms Acres
United States .............................2008 .. 2003 .. 2008 DATA Alabama ............................................... Alaska ................................................... Arizona ................................................. Arkansas ............................................... California .............................................. Colorado ............................................... Connecticut ........................................... Delaware .............................................. Florida ................................................... Georgia ................................................. Hawaii ................................................... Idaho ..................................................... Illinois .................................................... Indiana .................................................. Iowa ...................................................... Kansas .................................................. Kentucky ............................................... Louisiana .............................................. Maine .................................................... Maryland ............................................... Massachusetts ...................................... Michigan ............................................... Minnesota ............................................. Mississippi ............................................ Missouri ................................................ Montana ................................................ Nebraska .............................................. Nevada ................................................. New Hampshire .................................... New Jersey ........................................... New Mexico .......................................... New York .............................................. North Carolina ...................................... North Dakota ........................................ Ohio ...................................................... Oklahoma ............................................. Oregon .................................................. Pennsylvania ........................................ Rhode Island ........................................ South Carolina ...................................... South Dakota ........................................ Tennessee ............................................ Texas .................................................... Utah ...................................................... Vermont ................................................ Virginia .................................................. Washington ........................................... West Virginia ........................................ Wisconsin ............................................. Wyoming ............................................... Water Resources Regions Region 01 New England ....................... Region 02 Mid-Atlantic .......................... Region 03 South Atlantic-Gulf .............. Region 04 Great Lakes ......................... Region 05 Ohio ..................................... Region 06 Tennessee ........................... Region 07 Upper Mississippi ................ Region 08 Lower Mississippi ................ Region 09 Souris-Red-Rainy ................ Region 10 Missouri ............................... Region 11 Arkansas-White-Red ........... Region 12 Texas-Gulf ........................... Region 13 Rio Grande .......................... Region 14 Upper Colorado ................... Region 15 Lower Colorado ................... Region 16 Great Basin ......................... Region 17 Pacific Northwest ................. Region 18 California ............................. Region 19 Alaska ................................. Region 20 Hawaii .................................
6,761 6,541
35 1
370 79
2,155
368 3 7
114 69
369 247
82 38 12
104
8 20
- 20
7
19 68
2 7
92
523 12
1 28
55 52 28 30 41
44
615 97
9 25
34 33
173 28
-
41 387
5 81
123
20 184 293
64 85
27
221 113
25 979
166 119
65 222 370
103
1,176 2,159
1 369
1,487,387 1,418,982
294 (D)
17,005 4,400
263,763
24,607 (D)
865 355,879 20,498
43,958 52,459 26,248 12,974
944
21,020 78
10,302 -
619
329 1,876
17,933 (D)
1,336
15,090 123,750
5,983 (D)
1,605
9,147 1,368 3,004 7,415
66
4,621 215,863
649 18
1,543
4,285 598
54,872 2,577
-
953 118,702
25 9,850
26,102
431 5,473
381,693 6,688
11,171
206 39,066
(D) 15,892
200,717
33,830 41,498
8,927 4,137
17,005
28,110 364,950 265,897
(D) 43,958
1,632 2,157
12 - 3 -
19
39 1 2 7
18
14 8
22 30
3
138 -
14 4
13
- 25 37
2 4
51
538 - 4 5
3 5
11 105
6
18 91 36
4 3
46
1 47 15
-
41 11
- 75
101
13 97 49 34 24
2
136 17 38
930
72 40
- 19
3
19 106
19 -
14
626,219 749,180
198 -
515 -
5,870
5,777 (D)(D)
530 7,176
14
3,136 1,432
13,558 1,018
42,861
- 5,230
564 526
-
1,396 8,729
(D)80
15,434
280,703 -
68 760
2,800
530 1,820
67,714 294
2,124
61,083 717 (D)
600
36,844 (D)
9,042 2,352
-
164 2,535
- 5,347
35,474
670 (D)
10,254 2,792 8,980
(D)
17,921 6,360
15,623 459,913
12,686 10,292
- 3,040
515
4,688 64,418
5,870 -
14
49,582 49,843
47 1
1,336 129
6,787
4,088 - 8
404 213
58
8,179 2
60 12
113
30 8 3 7
37
163 21
- 58
3,379
584 627
- 47
2,502
- 316
6 3
253
6,538 9 4
82
25 31
2,013 4,997
-
7 4,293
4 30
2,068
44 80
1,056 221
66
15 25
106 8
5,173
1,034 1,779 2,244 5,165 1,712
4,225
19,207 7,363
1 58
3,611,216 3,629,492
1,614 (D)
42,104 3,272
367,405
435,226 -
116 74,344 26,795
1,492
379,140 (D)
2,092 209
29,958
566 240
45 248
111
3,251 464
- 1,889
392,545 44,057
152,895 -
365
111,475 -
11,790 652
65
38,509 338,710
158 4
2,815
2,003 (D)
350,030 253,812
-
250 132,393
16 905
405,592
160 (D)
117,118 4,886 1,323
1,267
977 2,174
292 685,704
285,709 189,306 153,797 490,301 53,539
297,680 898,867 425,116
(D) 1,492
72,654 70,931
297 9
820 676
8,029
6,675 54 48
1,330 1,448
124
4,123 208 290 115
2,307
483 358
67 204
58
334 490 186 450
4,750 9,265
765 8
119
2,196 174 689 317 166
975
5,592 452
5 214
887 278
5,515 4,339
24
409 3,221
37 335
2,739
200 1,085 4,158
677 925
280 984 924 204
19,499
5,679 4,212 1,654 4,770 1,095
3,862
14,161 8,152
9 124
91,453,055 90,228,942
43,470 (D)
3,425,747 321,400
6,207,614
5,364,667 912
1,135 587,664 227,314
38,061 2,360,516
15,474 19,266 12,097
2,381,787 48,098
143,262 878
5,892
851 12,459 50,330 16,968 78,994
15,254,444 9,245,429 4,632,166
231 (D)
7,579,776 8,593
45,857 487,749
3,349
976,909 3,861,301
9,607 15
29,715
1,285,648 32,423
6,148,080 3,456,008
310
23,243 4,076,529
3,493 17,244
12,907,757
2,919 35,089
941,678 (D)
81,993
27,751 81,419
210,070 52,505
39,391,536
9,739,291 2,857,813 5,612,056 3,371,145 3,609,064
7,128,723 11,887,217 6,363,793
(D)38,061
1 Respondents were asked to report dry tons. 2 2003 data do not include potatoes.

2007 CENSUS OF AGRICULTURE 2008 FRIS – GENERAL DATA 91 USDA, National Agricultural Statistics Service
Table 28. Estimated Quantity of Water Applied and Primary Method of Distribution by Selected Crops Harvested: 2008 and 2003
[Excludes institutional, research, and experimental farms and farms with horticulture. For meaning of abbreviations and symbols, see introductory text]
Corn for grain or seed
Primary method of distribution
Pressure system Gravity system Geographic area Farms
Irrigated acres
harvested
Average yield per
acre (bushels)
Average acre-feet applied per acre
Farms Acres
Averageyield per
acre (bushels)
Average acre-feet applied per acre
Farms Acres
Averageyield per
acre (bushels)
Averageacre-feet applied per acre
United States ............................. 2008 .. 2003 .. 2008 DATA Alabama ............................................... Alaska .................................................. Arizona ................................................. Arkansas .............................................. California .............................................. Colorado ............................................... Connecticut .......................................... Delaware .............................................. Florida .................................................. Georgia ................................................ Hawaii .................................................. Idaho .................................................... Illinois ................................................... Indiana ................................................. Iowa ..................................................... Kansas ................................................. Kentucky .............................................. Louisiana .............................................. Maine ................................................... Maryland .............................................. Massachusetts ..................................... Michigan ............................................... Minnesota ............................................. Mississippi ............................................ Missouri ................................................ Montana ............................................... Nebraska .............................................. Nevada ................................................. New Hampshire .................................... New Jersey .......................................... New Mexico .......................................... New York .............................................. North Carolina ...................................... North Dakota ........................................ Ohio ..................................................... Oklahoma ............................................. Oregon ................................................. Pennsylvania ........................................ Rhode Island ........................................ South Carolina ..................................... South Dakota ....................................... Tennessee ........................................... Texas ................................................... Utah ..................................................... Vermont ................................................ Virginia ................................................. Washington .......................................... West Virginia ........................................ Wisconsin ............................................. Wyoming .............................................. Water Resources Regions Region 01 New England ....................... Region 02 Mid-Atlantic ......................... Region 03 South Atlantic-Gulf .............. Region 04 Great Lakes ........................ Region 05 Ohio .................................... Region 06 Tennessee .......................... Region 07 Upper Mississippi ................ Region 08 Lower Mississippi ................ Region 09 Souris-Red-Rainy ................ Region 10 Missouri .............................. Region 11 Arkansas-White-Red ........... Region 12 Texas-Gulf .......................... Region 13 Rio Grande ......................... Region 14 Upper Colorado ................... Region 15 Lower Colorado ................... Region 16 Great Basin ......................... Region 17 Pacific Northwest ................ Region 18 California ............................. Region 19 Alaska ................................. Region 20 Hawaii .................................
33,571 32,231
140 -
40 960 433
2,337
- 223
72 1,174
10
540 875 778 430
2,896
76 470
- 231
5
778 1,071
522 1,057
162
12,530 - 2
43
88 9
210 311
23
211 291
16 -
158
669 72
1,998 296
-
86 402
2 479 395
7 587
1,761 1,098
554
55 2,616 2,483
228 17,097
3,736 1,040
78 230
44
273 1,241
433 -
10
11,991,515 9,747,474
24,111 -
13,987 381,321 122,554
796,040
- 49,381
9,899 155,035
2,037
72,800 309,187 244,574 107,979
1,368,126
14,099 212,824
- 36,981
(D)
248,790 254,960 351,869 361,275
28,653
5,058,195 -
(D) 5,620
(D)
375 24,738 90,271
7,260
95,182 32,584
912 -
35,411
175,593 17,794
954,026 26,848
-
12,729 87,919
(D) 105,809 39,896
134 104,218 244,887 330,435 156,931
15,763
734,442 1,159,644
64,333 6,541,812
1,839,620
376,884 8,980
53,182 17,621
23,995
194,043 122,554
- 2,037
181 178
173 -
182 163 177
174
- 190 155 171
(D)
179 190 176 171
191 174 161
- 188
(D)
175 174 175 172
150 184
- (D)
178
191 198 127 156 162
188 209 138
- 162
173 190 184 152
-
181 185 (D)
166 145
109 189 164 174 176
187 179 169 163 182
193 151 (D)
184 179
151 186 177
- (D)
1.0 1.2
0.7 -
2.8 1.1 2.0
1.6
- 0.8 0.7 1.1
(D) 2.6 0.5 0.6 0.5
1.3 0.5 0.7
- 0.8
(D) 0.6 0.6 0.9 0.8
1.6 0.8
- (D) 0.5
2.0 0.4 1.5 0.8 1.5
1.4 3.0 0.3
- 0.8
0.8 0.6 1.7 2.8
-
0.5 2.4 (D) 0.7 1.7
0.1 0.7 1.1 0.6 0.6
0.7 0.6 0.9 0.7 0.9
1.5 1.6 (D) 2.0 2.7
2.6 2.6 2.0
- (D)
26,592 22,665
135 -
28 178 168
1,271
- 223
70 1,122
8
226 860 778 423
2,567
72 63
- 231
5
776 1,071
201 611
54
10,847 - 2
43
76 9
210 290
20
207 213
16 -
156
611 70
1,666 41
-
86 242
2 479 165
7 587
1,700 1,093
552
55 2,549
759 228
14,261
3,050 768
26 35 30
27
689 168
- 8
9,786,501 7,593,248
(D) -
12,323 106,499 22,016
599,232
- 49,381
(D) 154,983
(D)
47,094 309,026 244,574 106,440
1,307,395
13,599 33,914
- 36,981
(D) (D)
254,960 134,924 192,910
11,109
4,293,573 -
(D) 5,620
44,442
375 24,738 87,499
7,080
94,482 22,807
912 -
(D)
169,880 (D)
843,902 5,017
-
12,729 68,263
(D) 105,809 26,560
134 104,218 243,642 329,665
(D)
15,763 725,427 381,954 64,333
5,596,033
1,686,310 283,785
2,648 15,668 15,297
2,536
138,904 22,016
- (D)
183 180
(D) -
182 157 202
177
- 190 (D)
171
(D) 176 190 176 171
191 175 161
- 188
(D) (D)
174 175 173
144 185
- (D)
178
189 198 127 157 162
188 206 138
- (D)
175 (D)
193 155
-
181 185 (D)
166 157
109 189 164 174 (D)
187 179 170 163 183
196 164 (D)
173 179
145 185 202
- (D)
1.0 1.2
(D) -
2.6 0.9 1.8
1.6
- 0.8 (D) 1.1
(D) 2.4 0.5 0.6 0.4
1.4 0.5 0.8
- 0.8
(D) (D) 0.6 0.9 0.7
1.6 0.8
- (D) 0.5
2.1 0.4 1.5 0.8 1.5
1.4 2.8 0.3
- (D)
0.8 (D) 1.7 3.9
-
0.5 2.4 (D) 0.7 1.4
0.1 0.7 1.1 0.6 (D)
0.7 0.6 0.8 0.7 0.9
1.6 1.7 (D) 3.1 2.6
2.9 2.5 1.8
- (D)
6,979 8,930
5 -
12 782 265
1,066
- - 2
52
2 314
15 - 7
329
4 407
- -
- 2 -
321 446
108
1,683 - - -
12 - -
21 3
4
78 - - 2
58
2 332 255
-
- 160
- -
230
- -
61 5 2
-
67 1,724
- 2,836
686 272
52 195
14
246 552 265
- 2
2,205,014 2,128,431
(D) -
1,664 274,822 100,538
196,808
- -
(D) 52
(D)
25,706 161
- 1,539
60,731
500 178,910
- -
- (D)
- 216,945 168,365
17,544
764,622 - - -
(D) - -
2,772 180
700
9,777 - -
(D)
5,713 (D)
110,124 21,831
-
- 19,656
- -
13,336
- -
1,245 770 (D)
-
9,015 777,690
- 945,779
153,310 93,099
6,332 37,514
2,324
21,459 55,139
100,538 -
(D)
170 176
(D) -
176 166 171
167
- -
(D) 200
(D)
183 165
- 160
187 152 161
- -
- (D)
- 174 171
153 180
- - -
198 - -
119 180
157 215
- -
(D)
117 (D)
115 151
-
- 188
- -
121
- -
143 211 (D)
-
177 168
- 176
168 109 107 188 177
152 191 171
- (D)
1.1 1.3
(D)-
4.2 1.1 2.1
1.6
- -
(D)0.8
(D)3.0 0.5
- 1.1
1.2 0.3 0.7
- -
- (D)
- 0.9 0.9
1.6 0.9
- - -
1.5 - -
1.2 1.0
1.2 3.6
- -
(D)
1.2 (D)1.5 2.6
-
- 2.3
- -
2.2
- -
0.8 0.5 (D)
-
0.6 0.9
- 1.0
1.3 1.3 2.8 1.5 3.2
2.6 2.9 2.1
- (D)
See footnote(s) at end of table. --continued
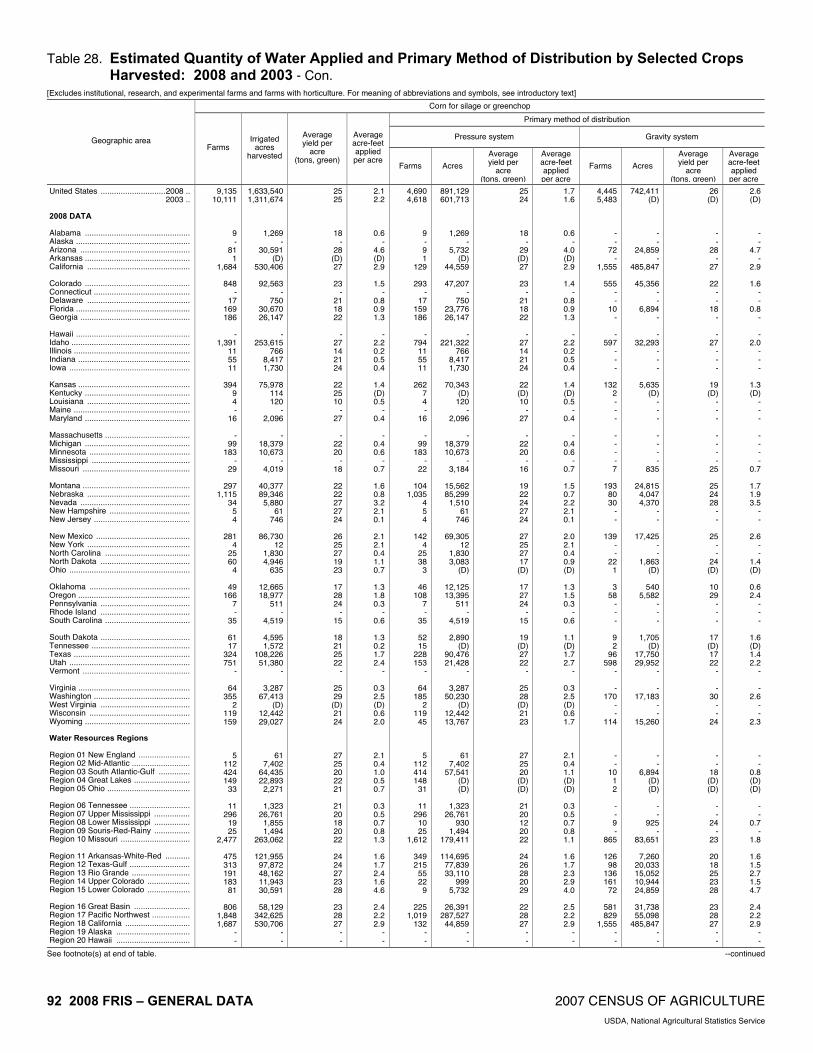
92 2008 FRIS – GENERAL DATA 2007 CENSUS OF AGRICULTURE USDA, National Agricultural Statistics Service
Table 28. Estimated Quantity of Water Applied and Primary Method of Distribution by Selected Crops Harvested: 2008 and 2003 - Con.
[Excludes institutional, research, and experimental farms and farms with horticulture. For meaning of abbreviations and symbols, see introductory text]
Corn for silage or greenchop
Primary method of distribution
Pressure system Gravity system Geographic area Farms
Irrigated acres
harvested
Average yield per
acre (tons, green)
Average acre-feet applied per acre
Farms Acres
Averageyield per
acre (tons, green)
Average acre-feet applied per acre
Farms Acres
Averageyield per
acre (tons, green)
Averageacre-feet applied per acre
United States .............................2008 .. 2003 .. 2008 DATA Alabama ............................................... Alaska ................................................... Arizona ................................................. Arkansas ............................................... California .............................................. Colorado ............................................... Connecticut ........................................... Delaware .............................................. Florida ................................................... Georgia ................................................. Hawaii ................................................... Idaho ..................................................... Illinois .................................................... Indiana .................................................. Iowa ...................................................... Kansas .................................................. Kentucky ............................................... Louisiana .............................................. Maine .................................................... Maryland ............................................... Massachusetts ...................................... Michigan ............................................... Minnesota ............................................. Mississippi ............................................ Missouri ................................................ Montana ................................................ Nebraska .............................................. Nevada ................................................. New Hampshire .................................... New Jersey ........................................... New Mexico .......................................... New York .............................................. North Carolina ...................................... North Dakota ........................................ Ohio ...................................................... Oklahoma ............................................. Oregon .................................................. Pennsylvania ........................................ Rhode Island ........................................ South Carolina ...................................... South Dakota ........................................ Tennessee ............................................ Texas .................................................... Utah ...................................................... Vermont ................................................ Virginia .................................................. Washington ........................................... West Virginia ........................................ Wisconsin ............................................. Wyoming ............................................... Water Resources Regions Region 01 New England ....................... Region 02 Mid-Atlantic .......................... Region 03 South Atlantic-Gulf .............. Region 04 Great Lakes ......................... Region 05 Ohio ..................................... Region 06 Tennessee ........................... Region 07 Upper Mississippi ................ Region 08 Lower Mississippi ................ Region 09 Souris-Red-Rainy ................ Region 10 Missouri ............................... Region 11 Arkansas-White-Red ........... Region 12 Texas-Gulf ........................... Region 13 Rio Grande .......................... Region 14 Upper Colorado ................... Region 15 Lower Colorado ................... Region 16 Great Basin ......................... Region 17 Pacific Northwest ................. Region 18 California ............................. Region 19 Alaska ................................. Region 20 Hawaii .................................
9,135 10,111
9 -
81 1
1,684
848 -
17 169 186
-
1,391 11 55 11
394
9 4 -
16
- 99
183 -
29
297 1,115
34 5 4
281
4 25 60
4
49 166
7 -
35
61 17
324 751
-
64 355
2 119 159
5 112 424 149
33
11 296
19 25
2,477
475 313 191 183
81
806 1,848 1,687
- -
1,633,540 1,311,674
1,269 -
30,591 (D)
530,406
92,563 -
750 30,670 26,147
-
253,615 766
8,417 1,730
75,978
114 120
- 2,096
-
18,379 10,673
- 4,019
40,377 89,346
5,880 61
746
86,730 12
1,830 4,946
635
12,665 18,977
511 -
4,519
4,595 1,572
108,226 51,380
-
3,287 67,413
(D) 12,442 29,027
61 7,402
64,435 22,893
2,271
1,323 26,761
1,855 1,494
263,062
121,955 97,872 48,162 11,943 30,591
58,129
342,625 530,706
- -
25 25
18 -
28 (D) 27
23
- 21 18 22
-
27 14 21 24
22 25 10
- 27
-
22 20
- 18
22 22 27 27 24
26 25 27 19 23
17 28 24
- 15
18 21 25 22
-
25 29 (D) 21 24
27 25 20 22 21
21 20 18 20 22
24 24 27 23 28
23 28 27
- -
2.1 2.2
0.6 -
4.6 (D)2.9
1.5
- 0.8 0.9 1.3
-
2.2 0.2 0.5 0.4
1.4 (D)0.5
- 0.4
-
0.4 0.6
- 0.7
1.6 0.8 3.2 2.1 0.1
2.1 2.1 0.4 1.1 0.7
1.3 1.8 0.3
- 0.6
1.3 0.2 1.7 2.4
-
0.3 2.5 (D)0.6 2.0
2.1 0.4 1.0 0.5 0.7
0.3 0.5 0.7 0.8 1.3
1.6 1.7 2.4 1.6 4.6
2.4 2.2 2.9
- -
4,690 4,618
9 - 9 1
129
293 -
17 159 186
-
794 11 55 11
262
7 4 -
16
- 99
183 -
22
104 1,035
4 5 4
142
4 25 38
3
46 108
7 -
35
52 15
228 153
-
64 185
2 119
45
5 112 414 148
31
11 296
10 25
1,612
349 215
55 22
9
225 1,019
132 - -
891,129 601,713
1,269 -
5,732 (D)
44,559
47,207 -
750 23,776 26,147
-
221,322 766
8,417 1,730
70,343
(D) 120
- 2,096
-
18,379 10,673
- 3,184
15,562 85,299
1,510 61
746
69,305 12
1,830 3,083
(D)
12,125 13,395
511 -
4,519
2,890 (D)
90,476 21,428
-
3,287 50,230
(D) 12,442 13,767
61 7,402
57,541 (D) (D)
1,323
26,761 930
1,494 179,411
114,695 77,839 33,110
999 5,732
26,391
287,527 44,859
- -
25 24
18 -
29 (D)27
23
- 21 18 22
-
27 14 21 24
22 (D)10
- 27
-
22 20
- 16
19 22 24 27 24
27 25 27 17 (D)
17 27 24
- 15
19 (D)27 22
-
25 28 (D)21 23
27 25 20 (D)(D)
21 20 12 20 22
24 26 28 20 29
22 28 27
- -
1.7 1.6
0.6 -
4.0 (D) 2.9
1.4
- 0.8 0.9 1.3
-
2.2 0.2 0.5 0.4
1.4 (D) 0.5
- 0.4
-
0.4 0.6
- 0.7
1.5 0.7 2.2 2.1 0.1
2.0 2.1 0.4 0.9 (D)
1.3 1.5 0.3
- 0.6
1.1 (D) 1.7 2.7
-
0.3 2.5 (D) 0.6 1.7
2.1 0.4 1.1 (D) (D)
0.3 0.5 0.7 0.8 1.1
1.6 1.7 2.3 2.9 4.0
2.5 2.2 2.9
- -
4,445 5,483
- -
72 -
1,555
555 - -
10 -
- 597
- - -
132 2 - - -
- - - - 7
193
80 30
- -
139 - -
22 1
3
58 - - -
9 2
96 598
-
- 170
- -
114
- -
10 1 2
- - 9 -
865
126 98
136 161
72
581 829
1,555 - -
742,411 (D)
- -
24,859 -
485,847
45,356 - -
6,894 -
- 32,293
- - -
5,635 (D)
- - -
- - - -
835
24,815 4,047 4,370
- -
17,425 - -
1,863 (D)
540
5,582 - - -
1,705 (D)
17,750 29,952
-
- 17,183
- -
15,260
- -
6,894 (D)(D)
- -
925 -
83,651
7,260 20,033 15,052 10,944 24,859
31,738 55,098
485,847 - -
26 (D)
- -
28 -
27
22 - -
18 -
- 27
- - -
19 (D)
- - -
- - - -
25
25 24 28
- -
25 - -
24 (D)
10 29
- - -
17 (D) 17 22
-
- 30
- -
24
- -
18 (D) (D)
- -
24 -
23
20 18 25 23 28
23 28 27
- -
2.6 (D)
- -
4.7 -
2.9
1.6 - -
0.8 -
- 2.0
- - -
1.3 (D)
- - -
- - - -
0.7
1.7 1.9 3.5
- -
2.6 - -
1.4 (D)
0.6 2.4
- - -
1.6 (D)1.4 2.2
-
- 2.6
- -
2.3
- -
0.8 (D)(D)
- -
0.7 -
1.8
1.6 1.5 2.7 1.5 4.7
2.4 2.2 2.9
- -
See footnote(s) at end of table. --continued

2007 CENSUS OF AGRICULTURE 2008 FRIS – GENERAL DATA 93 USDA, National Agricultural Statistics Service
Table 28. Estimated Quantity of Water Applied and Primary Method of Distribution by Selected Crops Harvested: 2008 and 2003 - Con.
[Excludes institutional, research, and experimental farms and farms with horticulture. For meaning of abbreviations and symbols, see introductory text]
Sorghum for grain or seed
Primary method of distribution
Pressure system Gravity system Geographic area Farms
Irrigated acres
harvested
Average yield per
acre (bushels)
Average acre-feet applied per acre
Farms Acres
Averageyield per
acre (bushels)
Average acre-feet applied per acre
Farms Acres
Averageyield per
acre (bushels)
Averageacre-feet applied per acre
United States ............................. 2008 .. 2003 .. 2008 DATA Alabama ............................................... Alaska .................................................. Arizona ................................................. Arkansas .............................................. California .............................................. Colorado ............................................... Connecticut .......................................... Delaware .............................................. Florida .................................................. Georgia ................................................ Hawaii .................................................. Idaho .................................................... Illinois ................................................... Indiana ................................................. Iowa ..................................................... Kansas ................................................. Kentucky .............................................. Louisiana .............................................. Maine ................................................... Maryland .............................................. Massachusetts ..................................... Michigan ............................................... Minnesota ............................................. Mississippi ............................................ Missouri ................................................ Montana ............................................... Nebraska .............................................. Nevada ................................................. New Hampshire .................................... New Jersey .......................................... New Mexico .......................................... New York .............................................. North Carolina ...................................... North Dakota ........................................ Ohio ..................................................... Oklahoma ............................................. Oregon ................................................. Pennsylvania ........................................ Rhode Island ........................................ South Carolina ..................................... South Dakota ....................................... Tennessee ........................................... Texas ................................................... Utah ..................................................... Vermont ................................................ Virginia ................................................. Washington .......................................... West Virginia ........................................ Wisconsin ............................................. Wyoming .............................................. Water Resources Regions Region 01 New England ....................... Region 02 Mid-Atlantic ......................... Region 03 South Atlantic-Gulf .............. Region 04 Great Lakes ........................ Region 05 Ohio .................................... Region 06 Tennessee .......................... Region 07 Upper Mississippi ................ Region 08 Lower Mississippi ................ Region 09 Souris-Red-Rainy ................ Region 10 Missouri .............................. Region 11 Arkansas-White-Red ........... Region 12 Texas-Gulf .......................... Region 13 Rio Grande ......................... Region 14 Upper Colorado ................... Region 15 Lower Colorado ................... Region 16 Great Basin ......................... Region 17 Pacific Northwest ................ Region 18 California ............................. Region 19 Alaska ................................. Region 20 Hawaii .................................
4,118 6,134
- -
80 290
39
103 - - 2
45
1 - 4 1 -
779 -
18 - -
- - -
25 70
-
172 - - -
69 - 2 - -
137 - - - 1
6 2
2,263 9 -
- - - - -
- -
50 - -
- 5
319 -
438
1,518 1,597
60 -
82
9 -
39 - 1
1,042,392 1,108,375
- -
24,328 65,738 14,620
8,308
- -
(D) 8,201
(D)
- 103 (D)
-
107,525 -
4,833 - -
- - -
3,895 3,135
-
12,100 - - -
15,262 -
(D) - -
26,832 - - -
(D)
456 (D)
743,172 540
-
- - - - -
- -
(D) - -
- (D)
73,200 -
31,551
332,814 545,110
8,621 -
24,428
540 -
14,620 -
(D)
77 75
- -
93 101 104
52
- -
(D)43
(D)
- 114 (D)
-
99 -
79 - -
- - -
77 104
-
109 - - -
89 -
(D)- -
67 - - -
(D)
88 (D)71
110 -
- - - - -
- -
(D)- -
- (D)
100 -
107
84 67
100 -
93
110 -
104 -
(D)
0.9 1.0
- -
3.4 1.0 1.8
0.6
- -
(D)1.2
(D)
- 0.4 (D)
-
1.0 -
0.4 - -
- - -
0.9 (D)
-
0.5 - - -
1.6 -
(D)- -
0.8 - - -
(D)
1.6 (D)0.8 1.3
-
- - - - -
- -
(D)- -
- (D)0.9
- 0.6
1.0 0.8 1.8
- 3.4
1.3
- 1.8
- (D)
2,860 3,213
- -
25 83 24
29
- - -
45
1 - 4 1 -
573 - 6 - -
- - - 5
44
- 55
- - -
43 - 2 - -
108 - - - 1
3 2
1,797 9 -
- - - - -
- -
48 - -
- 5
81 -
235
1,122 1,294
16 -
25
9 -
24 - 1
798,388 748,698
- -
4,155 20,596 11,125
4,410
- - -
8,201
(D)-
103 (D)
-
96,593 -
2,320 - -
- - -
1,100 (D)
-
5,548 - - -
10,374 -
(D)- -
23,745 - - -
(D)
306 (D)
605,219 540
-
- - - - -
- -
(D)- -
- (D)
21,806 -
22,220
289,084 435,740
(D)-
4,155
540 -
11,125 -
(D)
75 76
- -
109 107 105
52
- - -
43
(D) -
114 (D)
-
100 -
90 - -
- - -
(D) 114
-
89 - - -
75 -
(D) - -
67 - - -
(D)
95 (D) 70
110 -
- - - - -
- -
(D) - -
- (D)
108 -
100
87 65 (D)
- 109
110
- 105
- (D)
0.8 0.9
- -
3.3 0.6 1.7
0.6
- - -
1.2
(D) -
0.4 (D)
-
1.0 -
0.4 - -
- - -
0.7 (D)
-
0.4 - - -
1.4 -
(D) - -
0.8 - - -
(D)
2.0 (D) 0.8 1.3
-
- - - - -
- -
(D) - -
- (D) 0.6
- 0.7
1.1 0.6 (D)
- 3.3
1.3
- 1.7
- (D)
1,258 2,870
- -
55 207
15
74 - - 2 -
- - - - -
206 -
12 - -
- - -
20 26
-
117 - - -
26 - - - -
29 - - - -
3 -
466 - -
- - - - -
- - 2 - -
- -
238 -
203
396 303
44 -
57
- -
15 - -
244,004 344,016
- -
20,173 45,142
3,495
3,898 - -
(D) -
- - - - -
10,932 -
2,513 - -
- - -
2,795 (D)
-
6,552 - - -
4,888 - - - -
3,087 - - - -
150 -
137,953 - -
- - - - -
- -
(D) - -
- -
51,394 -
9,331
43,730 109,370
(D) -
20,273
- -
3,495 - -
83 75
- -
90 98 99
52
- -
(D)-
- - - - -
87 -
69 - -
- - -
(D)99
-
125 - - -
118 - - - -
67 - - - -
75 -
75 - -
- - - - -
- -
(D)- -
- -
96 -
123
63 79 (D)
- 90
- -
99 - -
1.4 1.1
- -
3.5 1.1 2.1
0.6
- -
(D)-
- - - - -
1.0 -
0.4 - -
- - -
1.0 (D)
-
0.5 - - -
2.1 - - - -
1.0 - - - -
0.7 -
1.2 - -
- - - - -
- -
(D)- -
- -
1.1 -
0.6
0.8 1.4 (D)
- 3.4
- -
2.1 - -
See footnote(s) at end of table. --continued

94 2008 FRIS – GENERAL DATA 2007 CENSUS OF AGRICULTURE USDA, National Agricultural Statistics Service
Table 28. Estimated Quantity of Water Applied and Primary Method of Distribution by Selected Crops Harvested: 2008 and 2003 - Con.
[Excludes institutional, research, and experimental farms and farms with horticulture. For meaning of abbreviations and symbols, see introductory text]
Wheat for grain or seed
Primary method of distribution
Pressure system Gravity system Geographic area Farms
Irrigated acres
harvested
Average yield per
acre (bushels)
Average acre-feet applied per acre
Farms Acres
Averageyield per
acre (bushels)
Average acre-feet applied per acre
Farms Acres
Averageyield per
acre (bushels)
Averageacre-feet applied per acre
United States .............................2008 .. 2003 .. 2008 DATA Alabama ............................................... Alaska ................................................... Arizona ................................................. Arkansas ............................................... California .............................................. Colorado ............................................... Connecticut ........................................... Delaware .............................................. Florida ................................................... Georgia ................................................. Hawaii ................................................... Idaho ..................................................... Illinois .................................................... Indiana .................................................. Iowa ...................................................... Kansas .................................................. Kentucky ............................................... Louisiana .............................................. Maine .................................................... Maryland ............................................... Massachusetts ...................................... Michigan ............................................... Minnesota ............................................. Mississippi ............................................ Missouri ................................................ Montana ................................................ Nebraska .............................................. Nevada ................................................. New Hampshire .................................... New Jersey ........................................... New Mexico .......................................... New York .............................................. North Carolina ...................................... North Dakota ........................................ Ohio ...................................................... Oklahoma ............................................. Oregon .................................................. Pennsylvania ........................................ Rhode Island ........................................ South Carolina ...................................... South Dakota ........................................ Tennessee ............................................ Texas .................................................... Utah ...................................................... Vermont ................................................ Virginia .................................................. Washington ........................................... West Virginia ........................................ Wisconsin ............................................. Wyoming ............................................... Water Resources Regions Region 01 New England ....................... Region 02 Mid-Atlantic .......................... Region 03 South Atlantic-Gulf .............. Region 04 Great Lakes ......................... Region 05 Ohio ..................................... Region 06 Tennessee ........................... Region 07 Upper Mississippi ................ Region 08 Lower Mississippi ................ Region 09 Souris-Red-Rainy ................ Region 10 Missouri ............................... Region 11 Arkansas-White-Red ........... Region 12 Texas-Gulf ........................... Region 13 Rio Grande .......................... Region 14 Upper Colorado ................... Region 15 Lower Colorado ................... Region 16 Great Basin ......................... Region 17 Pacific Northwest ................. Region 18 California ............................. Region 19 Alaska ................................. Region 20 Hawaii .................................
16,265 13,524
17 -
254 160
1,338
997 -
77 6
321
- 2,062
49 69
2
1,541 -
23 -
75
- 88 88 13 87
1,235 1,000
46 - 8
174
2 51
144 -
479 747
- -
38
81 3
2,583 952
-
8 1,195
- 27
225
- 170 429
98 30
5
158 243
75 3,495
3,189 1,373
270 156 265
1,111 3,831 1,367
- -
4,107,464 3,267,978
1,850 -
138,472 46,737
493,133
171,323 -
10,929 1,750
65,933
- 638,220
5,312 10,163
(D)
455,558 -
6,706 -
7,992
- 16,732
9,450 3,941
27,163
212,886 174,922 12,282
- 1,635
83,868
(D) 4,610
30,427 -
147,489 177,497
- -
6,748
15,948 675
796,071 44,356
-
655 260,958
- 2,176
22,861
- 21,225 80,183 17,672
8,911
1,058 12,392 70,852
9,921 598,607
1,117,022
324,595 53,841 14,539
142,692
80,748 1,056,344
496,862 - -
75 76
75 -
109 61 99
75
- 83 75 67
-
104 60 66 (D)
57
- 59
- 78
-
73 60 57 63
69 66 81
- 73
46 (D)45 56
-
49 105
- -
67
56 72 43 94
-
71 97
- 69 57
- 80 66 73 59
85 67 62 58 66
49 42 82 84
109
88 103
99 - -
1.4 1.5
0.4 -
3.6 0.4 2.2
1.4
- 0.4 0.5 0.4
-
1.6 0.4 0.2 (D)
0.9
- 0.8
- 0.4
-
0.3 0.5 0.2 0.4
1.0 0.8 2.8
- 0.3
1.7 (D)0.2 0.9
-
0.9 1.7
- -
0.5
0.5 0.5 1.0 1.9
-
0.3 1.9
- 0.4 1.0
- 0.4 0.4 0.3 0.3
0.4 0.4 0.4 0.6 0.9
1.0 1.0 2.3 2.5 3.6
1.7 1.7 2.2
- -
11,781 8,468
13 -
33 31
303
525 -
77 6
321
- 1,500
49 69
2
1,538 -
10 -
75
- 88 88
3 53
689 867
29 - 8
151
2 51 90
-
466 635
- -
38
68 3
2,411 275
-
8 1,001
- 27
178
- 170 425
98 30
5
158 88 75
2,495
2,943 1,287
157 109
35
426 2,939
341 - -
3,201,888 2,392,589
(D)-
9,612 6,962
83,830
135,848 -
10,929 1,750
65,933
- 571,990
5,312 10,163
(D)
(D)-
3,820 -
7,992
- 16,732
9,450 2,530
19,625
156,024 165,588 10,216
- 1,635
76,177
(D)4,610
17,604 -
145,454 152,214
- -
6,748
14,610 675
769,045 16,279
-
655 228,567
- 2,176
18,079
- 21,225 79,783 17,672
8,911
1,058 12,392 27,102
9,921 501,725
1,074,712
306,333 46,504 10,384 10,338
51,055
931,720 91,053
- -
70 71
79 -
99 59
106
75 -
83 75 67
-
104 60 66 (D)
(D)
- 60
- 78
-
73 60 (D) 63
69 68 78
- 73
44 (D) 45 58
-
49 104
- -
67
59 72 43 86
-
71 96
- 69 63
- 80 66 73 59
85 67 63 58 66
49 42 83 78 98
81
102 105
- -
1.2 1.2
0.4 -
3.2 0.4 1.9
1.3
- 0.4 0.5 0.4
-
1.6 0.4 0.2 (D)
(D)
- (D)
- 0.4
-
0.3 0.5 0.2 0.3
1.0 0.8 2.9
- 0.3
1.7 (D) 0.2 0.7
-
0.9 1.5
- -
0.5
0.5 0.5 1.0 1.7
-
0.3 1.9
- 0.4 1.0
- 0.4 0.4 0.3 0.3
0.4 0.4 0.4 0.6 0.9
0.9 1.0 2.2 2.6 3.1
1.6 1.7 1.9
- -
4,484 4,985
4 -
221 129
1,035
472 - - - -
- 562
- - -
3 -
13 - -
- - -
10 34
546 133
17 - -
23 - -
54 -
13 112
- - -
13 -
172 677
-
- 194
- -
47
- - 4 - -
- -
155 -
1,000
246 86
113 47
230
685 892
1,026 - -
905,576 873,749
(D) -
128,860 39,775
409,303
35,475 - - - -
- 66,230
- - -
(D) -
2,886 - -
- - -
1,411 7,538
56,862
9,334 2,066
- -
7,691 - -
12,823 -
2,035 25,283
- - -
1,338 -
27,026 28,077
-
- 32,391
- -
4,782
- -
400 - -
- -
43,750 -
96,882
42,310 18,262
7,337 4,155
132,354
29,693 124,624 405,809
- -
92 88
60 -
110 62 97
76
- - - -
- 106
- - -
(D)-
58 - -
- - -
(D)62
70 38 97
- -
62 - -
54 -
42 109
- - -
31 -
46 99
-
- 106
- -
33
- -
60 - -
- -
62 -
64
59 39 81 98
110
99 106
97 - -
2.2 2.1
0.5 -
3.6 0.4 2.3
1.6
- - - -
- 2.0
- - -
(D)-
(D)- -
- - -
0.2 0.5
1.1 0.7 2.5
- -
2.4 - -
1.2 -
0.6 2.9
- - -
0.8 -
1.2 2.0
-
- 2.2
- -
0.8
- -
0.5 - -
- -
0.4 -
1.1
1.1 1.4 2.8 2.1 3.6
2.0 2.2 2.3
- -
See footnote(s) at end of table. --continued
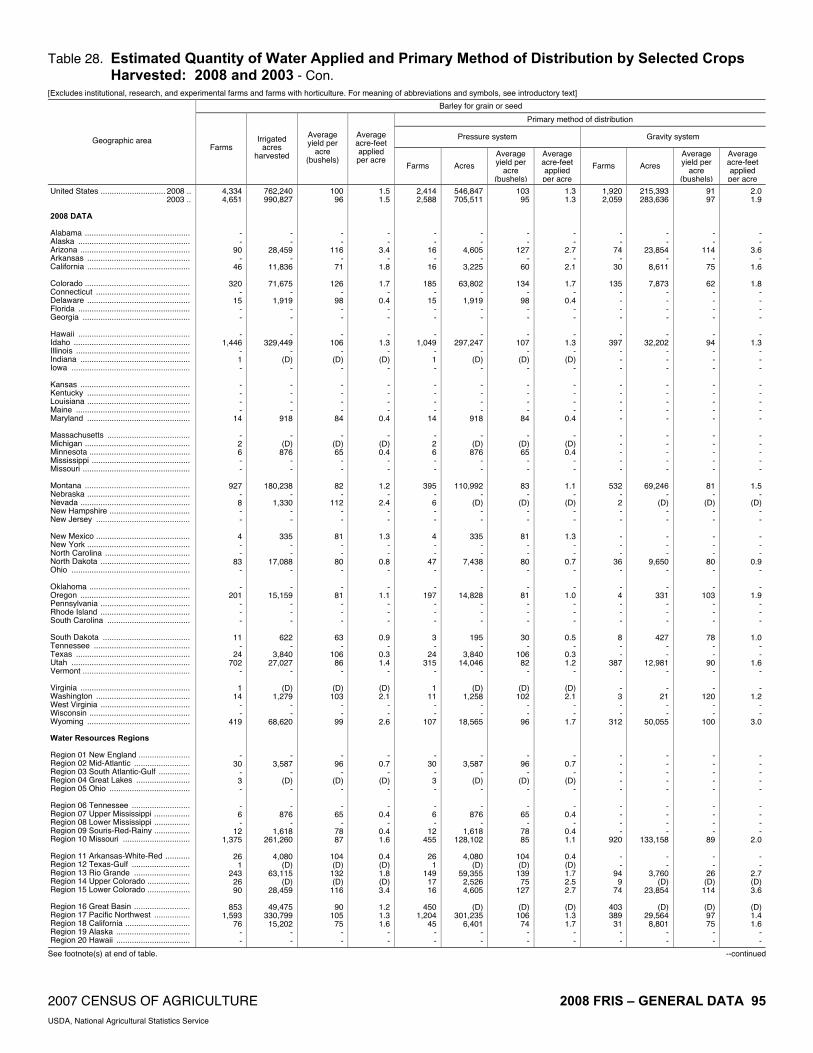
2007 CENSUS OF AGRICULTURE 2008 FRIS – GENERAL DATA 95 USDA, National Agricultural Statistics Service
Table 28. Estimated Quantity of Water Applied and Primary Method of Distribution by Selected Crops Harvested: 2008 and 2003 - Con.
[Excludes institutional, research, and experimental farms and farms with horticulture. For meaning of abbreviations and symbols, see introductory text]
Barley for grain or seed
Primary method of distribution
Pressure system Gravity system Geographic area Farms
Irrigated acres
harvested
Average yield per
acre (bushels)
Average acre-feet applied per acre
Farms Acres
Averageyield per
acre (bushels)
Average acre-feet applied per acre
Farms Acres
Averageyield per
acre (bushels)
Averageacre-feet applied per acre
United States ............................. 2008 .. 2003 .. 2008 DATA Alabama ............................................... Alaska .................................................. Arizona ................................................. Arkansas .............................................. California .............................................. Colorado ............................................... Connecticut .......................................... Delaware .............................................. Florida .................................................. Georgia ................................................ Hawaii .................................................. Idaho .................................................... Illinois ................................................... Indiana ................................................. Iowa ..................................................... Kansas ................................................. Kentucky .............................................. Louisiana .............................................. Maine ................................................... Maryland .............................................. Massachusetts ..................................... Michigan ............................................... Minnesota ............................................. Mississippi ............................................ Missouri ................................................ Montana ............................................... Nebraska .............................................. Nevada ................................................. New Hampshire .................................... New Jersey .......................................... New Mexico .......................................... New York .............................................. North Carolina ...................................... North Dakota ........................................ Ohio ..................................................... Oklahoma ............................................. Oregon ................................................. Pennsylvania ........................................ Rhode Island ........................................ South Carolina ..................................... South Dakota ....................................... Tennessee ........................................... Texas ................................................... Utah ..................................................... Vermont ................................................ Virginia ................................................. Washington .......................................... West Virginia ........................................ Wisconsin ............................................. Wyoming .............................................. Water Resources Regions Region 01 New England ....................... Region 02 Mid-Atlantic ......................... Region 03 South Atlantic-Gulf .............. Region 04 Great Lakes ........................ Region 05 Ohio .................................... Region 06 Tennessee .......................... Region 07 Upper Mississippi ................ Region 08 Lower Mississippi ................ Region 09 Souris-Red-Rainy ................ Region 10 Missouri .............................. Region 11 Arkansas-White-Red ........... Region 12 Texas-Gulf .......................... Region 13 Rio Grande ......................... Region 14 Upper Colorado ................... Region 15 Lower Colorado ................... Region 16 Great Basin ......................... Region 17 Pacific Northwest ................ Region 18 California ............................. Region 19 Alaska ................................. Region 20 Hawaii .................................
4,334 4,651
- -
90 -
46
320 -
15 - -
- 1,446
- 1 -
- - - -
14
- 2 6 - -
927 - 8 - -
4 - -
83 -
- 201
- - -
11 -
24 702
-
1 14
- -
419
- 30
- 3 -
- 6 -
12 1,375
26
1 243
26 90
853
1,593 76
- -
762,240 990,827
- -
28,459 -
11,836
71,675 -
1,919 - -
- 329,449
- (D)
-
- - - -
918
- (D)
876 - -
180,238 -
1,330 - -
335 - -
17,088 -
- 15,159
- - -
622 -
3,840 27,027
-
(D) 1,279
- -
68,620
- 3,587
- (D)
-
- 876
- 1,618
261,260
4,080 (D)
63,115 (D)
28,459
49,475 330,799 15,202
- -
100 96
- -
116 -
71
126 -
98 - -
- 106
- (D)
-
- - - -
84
- (D)65
- -
82 -
112 - -
81 - -
80 -
- 81
- - -
63 -
106 86
-
(D)103
- -
99
- 96
- (D)
-
- 65
- 78 87
104 (D)
132 (D)
116
90 105
75 - -
1.5 1.5
- -
3.4 -
1.8
1.7 -
0.4 - -
- 1.3
- (D)
-
- - - -
0.4
- (D)0.4
- -
1.2 -
2.4 - -
1.3 - -
0.8 -
- 1.1
- - -
0.9 -
0.3 1.4
-
(D)2.1
- -
2.6
- 0.7
- (D)
-
- 0.4
- 0.4 1.6
0.4 (D)1.8 (D)3.4
1.2 1.3 1.6
- -
2,414 2,588
- -
16 -
16
185 -
15 - -
- 1,049
- 1 -
- - - -
14
- 2 6 - -
395 - 6 - -
4 - -
47 -
- 197
- - -
3 -
24 315
-
1 11
- -
107
- 30
- 3 -
- 6 -
12 455
26
1 149
17 16
450
1,204 45
- -
546,847 705,511
- -
4,605 -
3,225
63,802 -
1,919 - -
- 297,247
- (D)
-
- - - -
918
- (D)
876 - -
110,992 -
(D)- -
335 - -
7,438 -
- 14,828
- - -
195 -
3,840 14,046
-
(D)1,258
- -
18,565
- 3,587
- (D)
-
- 876
- 1,618
128,102
4,080 (D)
59,355 2,526 4,605
(D)
301,235 6,401
- -
103 95
- -
127 -
60
134 -
98 - -
- 107
- (D)
-
- - - -
84
- (D) 65
- -
83 -
(D) - -
81 - -
80 -
- 81
- - -
30 -
106 82
-
(D) 102
- -
96
- 96
- (D)
-
- 65
- 78 85
104 (D)
139 75
127
(D) 106
74 - -
1.3 1.3
- -
2.7 -
2.1
1.7 -
0.4 - -
- 1.3
- (D)
-
- - - -
0.4
- (D) 0.4
- -
1.1 -
(D) - -
1.3 - -
0.7 -
- 1.0
- - -
0.5 -
0.3 1.2
-
(D) 2.1
- -
1.7
- 0.7
- (D)
-
- 0.4
- 0.4 1.1
0.4 (D) 1.7 2.5 2.7
(D) 1.3 1.7
- -
1,920 2,059
- -
74 -
30
135 - - - -
- 397
- - -
- - - - -
- - - - -
532 - 2 - -
- - -
36 -
- 4 - - -
8 - -
387 -
- 3 - -
312
- - - - -
- - - -
920
- -
94 9
74
403 389
31 - -
215,393 283,636
- -
23,854 -
8,611
7,873 - - - -
- 32,202
- - -
- - - - -
- - - - -
69,246 -
(D) - -
- - -
9,650 -
- 331
- - -
427 - -
12,981 -
- 21
- -
50,055
- - - - -
- - - -
133,158
- -
3,760 (D)
23,854
(D) 29,564
8,801 - -
91 97
- -
114 -
75
62 - - - -
- 94
- - -
- - - - -
- - - - -
81 -
(D)- -
- - -
80 -
- 103
- - -
78 - -
90 -
- 120
- -
100
- - - - -
- - - -
89
- -
26 (D)
114
(D)97 75
- -
2.0 1.9
- -
3.6 -
1.6
1.8 - - - -
- 1.3
- - -
- - - - -
- - - - -
1.5 -
(D)- -
- - -
0.9 -
- 1.9
- - -
1.0 - -
1.6 -
- 1.2
- -
3.0
- - - - -
- - - -
2.0
- -
2.7 (D)3.6
(D)1.4 1.6
- -
See footnote(s) at end of table. --continued

96 2008 FRIS – GENERAL DATA 2007 CENSUS OF AGRICULTURE USDA, National Agricultural Statistics Service
Table 28. Estimated Quantity of Water Applied and Primary Method of Distribution by Selected Crops Harvested: 2008 and 2003 - Con.
[Excludes institutional, research, and experimental farms and farms with horticulture. For meaning of abbreviations and symbols, see introductory text]
Soybeans for beans
Primary method of distribution
Pressure system Gravity system Geographic area Farms
Irrigated acres
harvested
Average yield per
acre (bushels)
Average acre-feet applied per acre
Farms Acres
Averageyield per
acre (bushels)
Average acre-feet applied per acre
Farms Acres
Averageyield per
acre (bushels)
Averageacre-feet applied per acre
United States .............................2008 .. 2003 .. 2008 DATA Alabama ............................................... Alaska ................................................... Arizona ................................................. Arkansas ............................................... California .............................................. Colorado ............................................... Connecticut ........................................... Delaware .............................................. Florida ................................................... Georgia ................................................. Hawaii ................................................... Idaho ..................................................... Illinois .................................................... Indiana .................................................. Iowa ...................................................... Kansas .................................................. Kentucky ............................................... Louisiana .............................................. Maine .................................................... Maryland ............................................... Massachusetts ...................................... Michigan ............................................... Minnesota ............................................. Mississippi ............................................ Missouri ................................................ Montana ................................................ Nebraska .............................................. Nevada ................................................. New Hampshire .................................... New Jersey ........................................... New Mexico .......................................... New York .............................................. North Carolina ...................................... North Dakota ........................................ Ohio ...................................................... Oklahoma ............................................. Oregon .................................................. Pennsylvania ........................................ Rhode Island ........................................ South Carolina ...................................... South Dakota ........................................ Tennessee ............................................ Texas .................................................... Utah ...................................................... Vermont ................................................ Virginia .................................................. Washington ........................................... West Virginia ........................................ Wisconsin ............................................. Wyoming ............................................... Water Resources Regions Region 01 New England ....................... Region 02 Mid-Atlantic .......................... Region 03 South Atlantic-Gulf .............. Region 04 Great Lakes ......................... Region 05 Ohio ..................................... Region 06 Tennessee ........................... Region 07 Upper Mississippi ................ Region 08 Lower Mississippi ................ Region 09 Souris-Red-Rainy ................ Region 10 Missouri ............................... Region 11 Arkansas-White-Red ........... Region 12 Texas-Gulf ........................... Region 13 Rio Grande .......................... Region 14 Upper Colorado ................... Region 15 Lower Colorado ................... Region 16 Great Basin ......................... Region 17 Pacific Northwest ................. Region 18 California ............................. Region 19 Alaska ................................. Region 20 Hawaii .................................
23,024 21,062
69 - -
3,119 -
30 -
187 2
413
- -
485 563 252
2,148
39 448
- 199
-
406 665 860
1,208
8 10,541
- -
36
2 -
112 106
12
95 - 9 -
77
417 65
187 - -
51 5 1
207 -
- 472 660 579 442
36
1,425 4,847
111 12,023
2,331
70 -
19 -
- 9 - - -
7,044,546 5,346,276
8,779 - -
2,167,646 -
4,832 -
33,770 (D)
71,621
- -
90,497 102,279 48,946
396,613
6,173 184,976
- 26,119
-
73,986 100,513 712,268 488,319
624
2,272,944 - -
3,418
(D) -
14,839 18,939
1,702
23,793 -
363 -
12,741
79,296 27,325 30,607
- -
8,796 382 (D)
30,410 -
- 71,515
105,746 107,159 97,622
5,012
208,298 3,240,957
19,383 2,539,475
633,293 15,205
- 475
-
- 406
- - -
49 48
55 - -
43 -
57 -
49 (D)48
- -
52 52 48
53 49 44
- 46
-
51 45 49 48
45 57
- -
45
(D)-
42 40 60
44
- 63
- 45
44 51 31
- -
53 45 (D)45
-
- 48 47 51 52
52 48 45 42 56
46 33
- 50
-
- 45
- - -
0.7 0.8
0.6 - -
0.9 -
1.2 -
0.6 (D)0.6
- -
0.5 0.5 0.4
1.0 0.4 0.7
- 0.6
-
0.5 0.6 0.8 0.7
1.0 0.6
- -
0.5
(D)-
2.5 0.7 3.2
0.8
- 0.2
- 0.6
0.5 0.6 1.0
- -
0.5 1.9 (D)0.6
-
- 0.6 0.9 0.5 0.6
0.7 0.5 0.8 0.6 0.6
0.9 1.0
- 1.2
-
- 1.9
- - -
16,906 13,890
69 - -
560 -
11 -
187 2
413
- -
481 563 252
1,784
39 84
- 199
-
406 664 219 638
4
8,989 - -
36
2 -
112 102
11
93 - 9 -
77
403 63
170 - -
51 5 1
207 -
- 472 660 578 442
36
1,411 1,180
110 10,317
1,638
53 - - -
- 9 - - -
4,158,193 2,837,915
8,779 - -
519,351 -
4,357 -
33,770 (D)
71,621
- -
89,975 102,279 48,946
360,609
6,173 42,272
- 26,119
-
73,986 (D)
192,347 188,426
24
2,043,676 - -
3,418
(D)-
14,839 18,747
(D)
(D)-
363 -
12,741
77,906 (D)
25,507 - -
8,796 382 (D)
30,410 -
- 71,515
105,746 (D)
97,622
5,012 204,047 845,809
(D)2,294,840
397,338
(D)- - -
- 406
- - -
52 50
55 - -
45 -
58 -
49 (D) 48
- -
52 52 48
53 49 45
- 46
-
51 (D) 50 47
45 57
- -
45
(D) -
42 40 (D)
(D)
- 63
- 45
44 (D) 31
- -
53 45 (D) 45
-
- 48 47 (D) 52
52 48 47 (D) 56
49 (D)
- - -
- 45
- - -
0.7 0.8
0.6 - -
0.9 -
1.2 -
0.6 (D) 0.6
- -
0.5 0.5 0.4
1.0 0.4 0.7
- 0.6
-
0.5 (D) 0.7 0.6
2.1 0.6
- -
0.5
(D) -
2.5 0.7 (D)
(D)
- 0.2
- 0.6
0.5 (D) 1.0
- -
0.5 1.9 (D) 0.6
-
- 0.6 0.9 (D) 0.6
0.7 0.5 0.8 (D) 0.6
1.0 (D)
- - -
- 1.9
- - -
6,118 7,168
- - -
2,559 -
19 - - - -
- - 4 - -
364 -
364 - -
- - 1
641 570
4
1,552 - - -
- - - 4 1
2 - - - -
14 2
17 - -
- - - - -
- - - 1 -
- 14
3,667 1
1,706
693 17
- 19
-
- - - - -
2,886,353 2,507,973
- - -
1,648,295 -
475 - - - -
- -
522 - -
36,004 -
142,704 - -
- -
(D) 519,921 299,893
600
229,268 - - -
- - -
192 (D)
(D)
- - - -
1,390 (D)
5,100 - -
- - - - -
- - -
(D) -
- 4,251
2,395,148 (D)
244,635
235,955 (D)
- 475
-
- - - - -
45 45
- - -
42 -
50 - - - -
- -
43 - -
53 -
44 - -
- -
(D)49 48
45 55
- - -
- - -
31 (D)
(D)
- - - -
41 (D)34
- -
- - - - -
- - -
(D)-
- 55 45 (D)55
40 (D)
- 50
-
- - - - -
0.8 0.8
- - -
0.9 -
1.2 - - - -
- -
1.1 - -
0.8 -
0.7 - -
- -
(D)0.8 0.7
1.0 0.5
- - -
- - -
0.9 (D)
(D)
- - - -
0.5 (D)1.0
- -
- - - - -
- - -
(D)-
- 0.5 0.8 (D)0.5
0.8 (D)
- 1.2
-
- - - - -
See footnote(s) at end of table. --continued
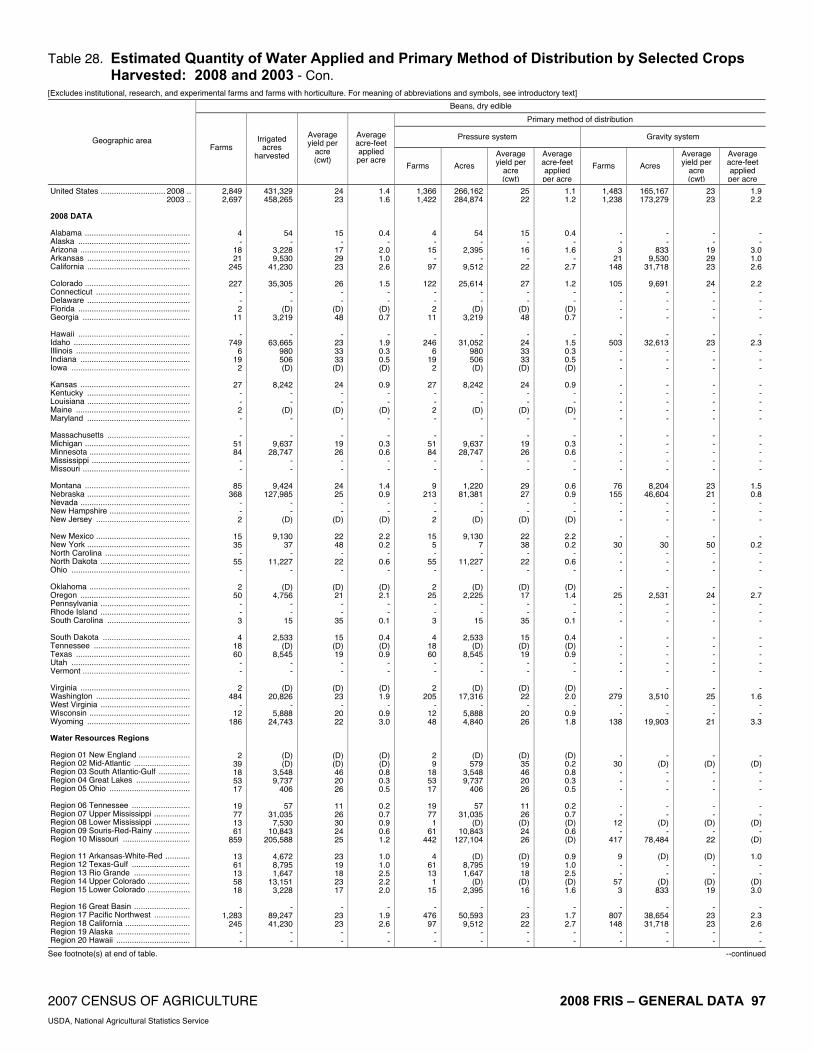
2007 CENSUS OF AGRICULTURE 2008 FRIS – GENERAL DATA 97 USDA, National Agricultural Statistics Service
Table 28. Estimated Quantity of Water Applied and Primary Method of Distribution by Selected Crops Harvested: 2008 and 2003 - Con.
[Excludes institutional, research, and experimental farms and farms with horticulture. For meaning of abbreviations and symbols, see introductory text]
Beans, dry edible
Primary method of distribution
Pressure system Gravity system Geographic area Farms
Irrigated acres
harvested
Average yield per
acre (cwt)
Average acre-feet applied per acre
Farms Acres
Averageyield per
acre (cwt)
Average acre-feet applied per acre
Farms Acres
Averageyield per
acre (cwt)
Averageacre-feet applied per acre
United States ............................. 2008 .. 2003 .. 2008 DATA Alabama ............................................... Alaska .................................................. Arizona ................................................. Arkansas .............................................. California .............................................. Colorado ............................................... Connecticut .......................................... Delaware .............................................. Florida .................................................. Georgia ................................................ Hawaii .................................................. Idaho .................................................... Illinois ................................................... Indiana ................................................. Iowa ..................................................... Kansas ................................................. Kentucky .............................................. Louisiana .............................................. Maine ................................................... Maryland .............................................. Massachusetts ..................................... Michigan ............................................... Minnesota ............................................. Mississippi ............................................ Missouri ................................................ Montana ............................................... Nebraska .............................................. Nevada ................................................. New Hampshire .................................... New Jersey .......................................... New Mexico .......................................... New York .............................................. North Carolina ...................................... North Dakota ........................................ Ohio ..................................................... Oklahoma ............................................. Oregon ................................................. Pennsylvania ........................................ Rhode Island ........................................ South Carolina ..................................... South Dakota ....................................... Tennessee ........................................... Texas ................................................... Utah ..................................................... Vermont ................................................ Virginia ................................................. Washington .......................................... West Virginia ........................................ Wisconsin ............................................. Wyoming .............................................. Water Resources Regions Region 01 New England ....................... Region 02 Mid-Atlantic ......................... Region 03 South Atlantic-Gulf .............. Region 04 Great Lakes ........................ Region 05 Ohio .................................... Region 06 Tennessee .......................... Region 07 Upper Mississippi ................ Region 08 Lower Mississippi ................ Region 09 Souris-Red-Rainy ................ Region 10 Missouri .............................. Region 11 Arkansas-White-Red ........... Region 12 Texas-Gulf .......................... Region 13 Rio Grande ......................... Region 14 Upper Colorado ................... Region 15 Lower Colorado ................... Region 16 Great Basin ......................... Region 17 Pacific Northwest ................ Region 18 California ............................. Region 19 Alaska ................................. Region 20 Hawaii .................................
2,849 2,697
4 -
18 21
245
227 - - 2
11
- 749
6 19
2
27 - - 2 -
- 51 84
- -
85 368
- - 2
15 35
- 55
-
2 50
- - 3
4
18 60
- -
2 484
- 12
186
2 39 18 53 17
19 77 13 61
859
13 61 13 58 18
-
1,283 245
- -
431,329 458,265
54 -
3,228 9,530
41,230
35,305 - -
(D) 3,219
-
63,665 980 506 (D)
8,242
- -
(D) -
- 9,637
28,747 - -
9,424 127,985
- -
(D)
9,130 37
- 11,227
-
(D) 4,756
- -
15
2,533 (D)
8,545 - -
(D) 20,826
- 5,888
24,743
(D) (D)
3,548 9,737
406
57 31,035
7,530 10,843
205,588
4,672 8,795 1,647
13,151 3,228
-
89,247 41,230
- -
24 23
15 -
17 29 23
26
- -
(D)48
-
23 33 33 (D)
24
- -
(D)-
- 19 26
- -
24 25
- -
(D)
22 48
- 22
-
(D)21
- -
35
15 (D)19
- -
(D)23
- 20 22
(D)(D)46 20 26
11 26 30 24 25
23 19 18 23 17
-
23 23
- -
1.4 1.6
0.4 -
2.0 1.0 2.6
1.5
- -
(D)0.7
-
1.9 0.3 0.5 (D)
0.9
- -
(D)-
- 0.3 0.6
- -
1.4 0.9
- -
(D)
2.2 0.2
- 0.6
-
(D)2.1
- -
0.1
0.4 (D)0.9
- -
(D)1.9
- 0.9 3.0
(D)(D)0.8 0.3 0.5
0.2 0.7 0.9 0.6 1.2
1.0 1.0 2.5 2.2 2.0
-
1.9 2.6
- -
1,366 1,422
4 -
15 -
97
122 - - 2
11
- 246
6 19
2
27 - - 2 -
- 51 84
- -
9 213
- - 2
15
5 -
55 -
2 25
- - 3
4
18 60
- -
2 205
- 12 48
2 9
18 53 17
19 77
1 61
442
4 61 13
1 15
-
476 97
- -
266,162 284,874
54 -
2,395 -
9,512
25,614 - -
(D)3,219
-
31,052 980 506 (D)
8,242
- -
(D)-
- 9,637
28,747 - -
1,220 81,381
- -
(D)
9,130 7 -
11,227 -
(D)2,225
- -
15
2,533 (D)
8,545 - -
(D)17,316
- 5,888 4,840
(D)579
3,548 9,737
406
57 31,035
(D)10,843
127,104
(D)8,795 1,647
(D)2,395
-
50,593 9,512
- -
25 22
15 -
16 -
22
27 - -
(D) 48
-
24 33 33 (D)
24
- -
(D) -
- 19 26
- -
29 27
- -
(D)
22 38
- 22
-
(D) 17
- -
35
15 (D) 19
- -
(D) 22
- 20 26
(D) 35 46 20 26
11 26 (D) 24 26
(D) 19 18 (D) 16
-
23 22
- -
1.1 1.2
0.4 -
1.6 -
2.7
1.2 - -
(D) 0.7
-
1.5 0.3 0.5 (D)
0.9
- -
(D) -
- 0.3 0.6
- -
0.6 0.9
- -
(D)
2.2 0.2
- 0.6
-
(D) 1.4
- -
0.1
0.4 (D) 0.9
- -
(D) 2.0
- 0.9 1.8
(D) 0.2 0.8 0.3 0.5
0.2 0.7 (D) 0.6 (D)
0.9 1.0 2.5 (D) 1.6
-
1.7 2.7
- -
1,483 1,238
- - 3
21 148
105
- - - -
- 503
- - -
- - - - -
- - - - -
76 155
- - -
- 30
- - -
- 25
- - -
- - - - -
- 279
- -
138
- 30
- - -
- -
12 -
417
9 - -
57 3
-
807 148
- -
165,167 173,279
- -
833 9,530
31,718
9,691 - - - -
- 32,613
- - -
- - - - -
- - - - -
8,204 46,604
- - -
- 30
- - -
- 2,531
- - -
- - - - -
- 3,510
- -
19,903
- (D)
- - -
- -
(D) -
78,484
(D) - -
(D) 833
-
38,654 31,718
- -
23 23
- -
19 29 23
24
- - - -
- 23
- - -
- - - - -
- - - - -
23 21
- - -
- 50
- - -
- 24
- - -
- - - - -
- 25
- -
21
- (D)
- - -
- -
(D)-
22
(D)- -
(D)19
-
23 23
- -
1.9 2.2
- -
3.0 1.0 2.6
2.2
- - - -
- 2.3
- - -
- - - - -
- - - - -
1.5 0.8
- - -
- 0.2
- - -
- 2.7
- - -
- - - - -
- 1.6
- -
3.3
- (D)
- - -
- -
(D)-
(D)
1.0 - -
(D)3.0
-
2.3 2.6
- -
See footnote(s) at end of table. --continued

98 2008 FRIS – GENERAL DATA 2007 CENSUS OF AGRICULTURE USDA, National Agricultural Statistics Service
Table 28. Estimated Quantity of Water Applied and Primary Method of Distribution by Selected Crops Harvested: 2008 and 2003 - Con.
[Excludes institutional, research, and experimental farms and farms with horticulture. For meaning of abbreviations and symbols, see introductory text]
Rice
Primary method of distribution
Pressure system Gravity system Geographic area Farms
Irrigated acres
harvested
Average yield per
acre (cwt)
Average acre-feet applied per acre
Farms Acres
Averageyield per
acre (cwt)
Average acre-feet applied per acre
Farms Acres
Averageyield per
acre (cwt)
Averageacre-feet applied per acre
United States .............................2008 .. 2003 .. 2008 DATA Alabama ............................................... Alaska ................................................... Arizona ................................................. Arkansas ............................................... California .............................................. Colorado ............................................... Connecticut ........................................... Delaware .............................................. Florida ................................................... Georgia ................................................. Hawaii ................................................... Idaho ..................................................... Illinois .................................................... Indiana .................................................. Iowa ...................................................... Kansas .................................................. Kentucky ............................................... Louisiana .............................................. Maine .................................................... Maryland ............................................... Massachusetts ...................................... Michigan ............................................... Minnesota ............................................. Mississippi ............................................ Missouri ................................................ Montana ................................................ Nebraska .............................................. Nevada ................................................. New Hampshire .................................... New Jersey ........................................... New Mexico .......................................... New York .............................................. North Carolina ...................................... North Dakota ........................................ Ohio ...................................................... Oklahoma ............................................. Oregon .................................................. Pennsylvania ........................................ Rhode Island ........................................ South Carolina ...................................... South Dakota ........................................ Tennessee ............................................ Texas .................................................... Utah ...................................................... Vermont ................................................ Virginia .................................................. Washington ........................................... West Virginia ........................................ Wisconsin ............................................. Wyoming ............................................... Water Resources Regions Region 01 New England ....................... Region 02 Mid-Atlantic .......................... Region 03 South Atlantic-Gulf .............. Region 04 Great Lakes ......................... Region 05 Ohio ..................................... Region 06 Tennessee ........................... Region 07 Upper Mississippi ................ Region 08 Lower Mississippi ................ Region 09 Souris-Red-Rainy ................ Region 10 Missouri ............................... Region 11 Arkansas-White-Red ........... Region 12 Texas-Gulf ........................... Region 13 Rio Grande .......................... Region 14 Upper Colorado ................... Region 15 Lower Colorado ................... Region 16 Great Basin ......................... Region 17 Pacific Northwest ................. Region 18 California ............................. Region 19 Alaska ................................. Region 20 Hawaii .................................
5,265 6,836
- - -
2,550 1,033
- - - 6 -
- - 4 1 -
- -
784 - -
- - -
345 278
- - - - -
- - - - -
- - - - -
- 3
261 - -
- - - - -
- - 6 - 1
- 5
3,397 - -
562 261
- - -
- -
1,033 - -
2,683,363 2,994,757
- - -
1,303,574 432,208
- - -
11,272 -
- -
1,750 (D)
-
- -
412,691 - -
- - -
201,893 142,450
- - - - -
- - - - -
- - - - -
- (D)
174,565 - -
- - - - -
- -
11,272 -
(D)
- (D)
1,812,399 - -
248,989 174,565
- - -
- -
432,208 - -
70 69
- - -
69 78
- - -
47 -
- -
64 (D)
-
- -
62 - -
- - -
69 86
- - - - -
- - - - -
- - - - -
- (D)73
- -
- - - - -
- -
47 -
(D)
- (D)68
- -
70 73
- - -
- -
78 - -
2.3 2.3
- - -
2.0 4.1
- - -
1.5 -
- -
(D)(D)
-
- -
1.5 - -
- - -
1.9 1.6
- - - - -
- - - - -
- - - - -
- 2.3 2.5
- -
- - - - -
- -
1.5 -
(D)
- (D)1.9
- -
1.9 2.5
- - -
- -
4.1 - -
75 111
- - -
68 -
- - - - -
- - - - -
- - 3 - -
- - - - 4
- - - - -
- - - - -
- - - - -
- - - - -
- - - - -
- - - - -
- -
43 - -
32 - - - -
- - - - -
48,154 47,838
- - -
41,434 -
- - - - -
- - - - -
- -
2,360 - -
- - - -
4,360
- - - - -
- - - - -
- - - - -
- - - - -
- - - - -
- - - - -
- -
25,658 - -
22,496 - - - -
- - - - -
71 71
- - -
70 -
- - - - -
- - - - -
- -
69 - -
- - - -
89
- - - - -
- - - - -
- - - - -
- - - - -
- - - - -
- - - - -
- -
73 - -
69 - - - -
- - - - -
2.1 1.7
- - -
2.2 -
- - - - -
- - - - -
- -
1.6 - -
- - - -
1.6
- - - - -
- - - - -
- - - - -
- - - - -
- - - - -
- - - - -
- -
1.9 - -
2.3 - - - -
- - - - -
5,190 6,725
- - -
2,482 1,033
- - - 6 -
- - 4 1 -
- -
781 - -
- - -
345 274
- - - - -
- - - - -
- - - - -
- 3
261 - -
- - - - -
- - 6 - 1
- 5
3,354 - -
530 261
- - -
- -
1,033 - -
2,635,209 2,946,919
- - -
1,262,140 432,208
- - -
11,272 -
- -
1,750 (D)
-
- -
410,331 - -
- - -
201,893 138,090
- - - - -
- - - - -
- - - - -
- (D)
174,565 - -
- - - - -
- -
11,272 -
(D)
- (D)
1,786,741 - -
226,493 174,565
- - -
- -
432,208 - -
70 69
- - -
68 78
- - -
47 -
- -
64 (D)
-
- -
62 - -
- - -
69 86
- - - - -
- - - - -
- - - - -
- (D)73
- -
- - - - -
- -
47 -
(D)
- (D)68
- -
70 73
- - -
- -
78 - -
2.3 2.3
- - -
2.0 4.1
- - -
1.5 -
- -
(D)(D)
-
- -
1.5 - -
- - -
1.9 1.6
- - - - -
- - - - -
- - - - -
- 2.3 2.5
- -
- - - - -
- -
1.5 -
(D)
- (D)1.9
- -
1.8 2.5
- - -
- -
4.1 - -
See footnote(s) at end of table. --continued
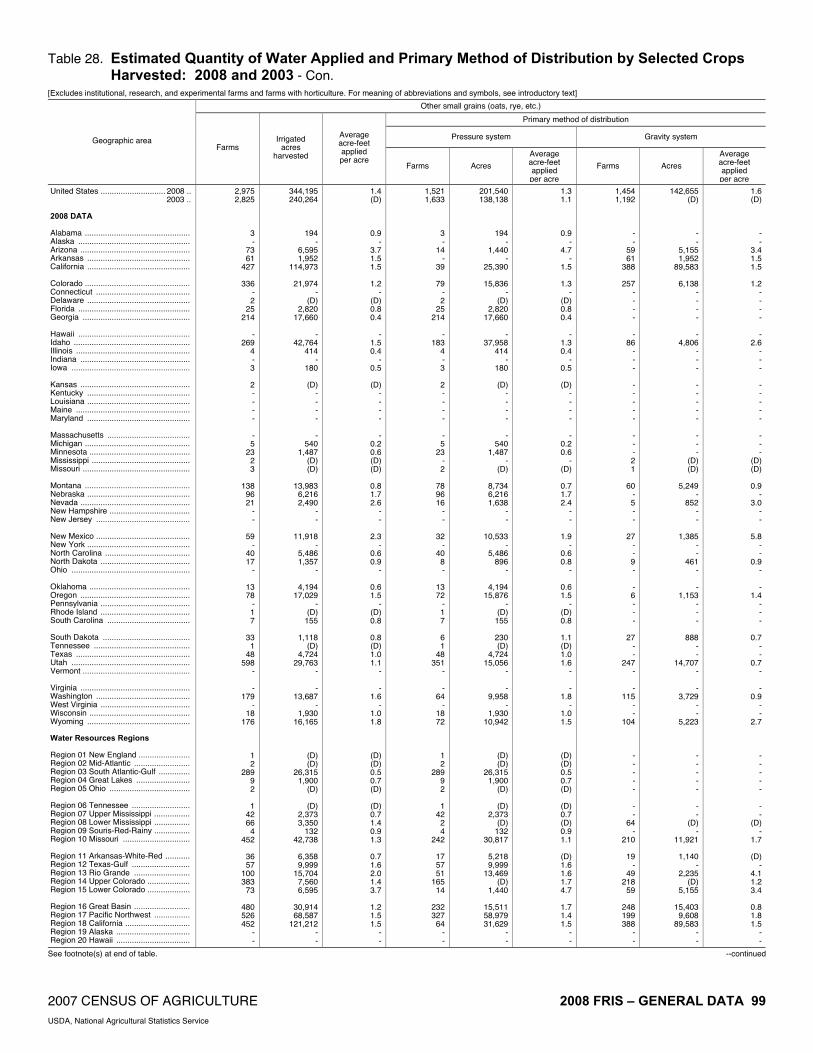
2007 CENSUS OF AGRICULTURE 2008 FRIS – GENERAL DATA 99 USDA, National Agricultural Statistics Service
Table 28. Estimated Quantity of Water Applied and Primary Method of Distribution by Selected Crops Harvested: 2008 and 2003 - Con.
[Excludes institutional, research, and experimental farms and farms with horticulture. For meaning of abbreviations and symbols, see introductory text]
Other small grains (oats, rye, etc.)
Primary method of distribution
Pressure system Gravity system Geographic area Farms
Irrigated acres
harvested
Average acre-feet applied per acre
Farms Acres
Averageacre-feet applied per acre
Farms Acres
Averageacre-feet applied per acre
United States ............................. 2008 .. 2003 .. 2008 DATA Alabama ............................................... Alaska .................................................. Arizona ................................................. Arkansas .............................................. California .............................................. Colorado ............................................... Connecticut .......................................... Delaware .............................................. Florida .................................................. Georgia ................................................ Hawaii .................................................. Idaho .................................................... Illinois ................................................... Indiana ................................................. Iowa ..................................................... Kansas ................................................. Kentucky .............................................. Louisiana .............................................. Maine ................................................... Maryland .............................................. Massachusetts ..................................... Michigan ............................................... Minnesota ............................................. Mississippi ............................................ Missouri ................................................ Montana ............................................... Nebraska .............................................. Nevada ................................................. New Hampshire .................................... New Jersey .......................................... New Mexico .......................................... New York .............................................. North Carolina ...................................... North Dakota ........................................ Ohio ..................................................... Oklahoma ............................................. Oregon ................................................. Pennsylvania ........................................ Rhode Island ........................................ South Carolina ..................................... South Dakota ....................................... Tennessee ........................................... Texas ................................................... Utah ..................................................... Vermont ................................................ Virginia ................................................. Washington .......................................... West Virginia ........................................ Wisconsin ............................................. Wyoming .............................................. Water Resources Regions Region 01 New England ....................... Region 02 Mid-Atlantic ......................... Region 03 South Atlantic-Gulf .............. Region 04 Great Lakes ........................ Region 05 Ohio .................................... Region 06 Tennessee .......................... Region 07 Upper Mississippi ................ Region 08 Lower Mississippi ................ Region 09 Souris-Red-Rainy ................ Region 10 Missouri .............................. Region 11 Arkansas-White-Red ........... Region 12 Texas-Gulf .......................... Region 13 Rio Grande ......................... Region 14 Upper Colorado ................... Region 15 Lower Colorado ................... Region 16 Great Basin ......................... Region 17 Pacific Northwest ................ Region 18 California ............................. Region 19 Alaska ................................. Region 20 Hawaii .................................
2,975 2,825
3 -
73 61
427
336 - 2
25 214
-
269 4 - 3
2 - - - -
- 5
23 2 3
138
96 21
- -
59 -
40 17
-
13 78
- 1 7
33
1 48
598 -
- 179
- 18
176
1 2
289 9 2
1
42 66
4 452
36 57
100 383
73
480 526 452
- -
344,195 240,264
194 -
6,595 1,952
114,973
21,974 -
(D) 2,820
17,660
- 42,764
414 -
180
(D) - - - -
- 540
1,487 (D) (D)
13,983
6,216 2,490
- -
11,918 -
5,486 1,357
-
4,194 17,029
- (D)
155
1,118 (D)
4,724 29,763
-
- 13,687
- 1,930
16,165
(D) (D)
26,315 1,900
(D)
(D) 2,373 3,350
132 42,738
6,358 9,999
15,704 7,560 6,595
30,914 68,587
121,212 - -
1.4 (D)
0.9 -
3.7 1.5 1.5
1.2
- (D)0.8 0.4
-
1.5 0.4
- 0.5
(D)
- - - -
- 0.2 0.6 (D)(D)
0.8 1.7 2.6
- -
2.3 -
0.6 0.9
-
0.6 1.5
- (D)0.8
0.8 (D)1.0 1.1
-
- 1.6
- 1.0 1.8
(D)(D)0.5 0.7 (D)
(D)0.7 1.4 0.9 1.3
0.7 1.6 2.0 1.4 3.7
1.2 1.5 1.5
- -
1,521 1,633
3 -
14 -
39
79 - 2
25 214
-
183 4 - 3
2 - - - -
- 5
23 - 2
78 96 16
- -
32 -
40 8 -
13 72
- 1 7
6 1
48 351
-
- 64
- 18 72
1 2
289 9 2
1
42 2 4
242
17 57 51
165 14
232 327
64 - -
201,540 138,138
194 -
1,440 -
25,390
15,836 -
(D)2,820
17,660
- 37,958
414 -
180
(D)- - - -
- 540
1,487 -
(D)
8,734 6,216 1,638
- -
10,533 -
5,486 896
-
4,194 15,876
- (D)
155
230 (D)
4,724 15,056
-
- 9,958
- 1,930
10,942
(D)(D)
26,315 1,900
(D)
(D)2,373
(D)132
30,817
5,218 9,999
13,469 (D)
1,440
15,511 58,979 31,629
- -
1.3 1.1
0.9 -
4.7 -
1.5
1.3 -
(D) 0.8 0.4
-
1.3 0.4
- 0.5
(D)
- - - -
- 0.2 0.6
- (D)
0.7 1.7 2.4
- -
1.9 -
0.6 0.8
-
0.6 1.5
- (D) 0.8
1.1 (D) 1.0 1.6
-
- 1.8
- 1.0 1.5
(D) (D) 0.5 0.7 (D)
(D) 0.7 (D) 0.9 1.1
(D) 1.6 1.6 1.7 4.7
1.7 1.4 1.5
- -
1,454 1,192
- -
59 61
388
257 - - - -
- 86
- - -
- - - - -
- - - 2 1
60
- 5 - -
27 - - 9 -
- 6 - - -
27 - -
247 -
- 115
- -
104
- - - - -
- -
64 -
210
19 -
49 218
59
248 199 388
- -
142,655 (D)
- -
5,155 1,952
89,583
6,138 - - - -
- 4,806
- - -
- - - - -
- - -
(D)(D)
5,249
- 852
- -
1,385 - -
461 -
- 1,153
- - -
888 - -
14,707 -
- 3,729
- -
5,223
- - - - -
- -
(D)-
11,921
1,140 -
2,235 (D)
5,155
15,403 9,608
89,583 - -
1.6 (D)
- -
3.4 1.5 1.5
1.2
- - - -
- 2.6
- - -
- - - - -
- - -
(D)(D)
0.9
- 3.0
- -
5.8 - -
0.9 -
- 1.4
- - -
0.7 - -
0.7 -
- 0.9
- -
2.7
- - - - -
- -
(D)-
1.7
(D)-
4.1 1.2 3.4
0.8 1.8 1.5
- -
See footnote(s) at end of table. --continued

100 2008 FRIS – GENERAL DATA 2007 CENSUS OF AGRICULTURE USDA, National Agricultural Statistics Service
Table 28. Estimated Quantity of Water Applied and Primary Method of Distribution by Selected Crops Harvested: 2008 and 2003 - Con.
[Excludes institutional, research, and experimental farms and farms with horticulture. For meaning of abbreviations and symbols, see introductory text]
Alfalfa and alfalfa mixtures (dry hay, greenchop, and silage)
Primary method of distribution
Pressure system Gravity system Geographic area Farms
Irrigated acres
harvested
Average yield per
acre 1 (tons, dry)
Average acre-feet applied per acre
Farms Acres
Averageyield per
acre 1 (tons, dry)
Averageacre-feet applied per acre
Farms Acres
Averageyield per
acre 1 (tons, dry)
Averageacre-feet applied per acre
United States .............................2008 .. 2003 .. 2008 DATA Alabama ............................................... Alaska ................................................... Arizona ................................................. Arkansas ............................................... California .............................................. Colorado ............................................... Connecticut ........................................... Delaware .............................................. Florida ................................................... Georgia ................................................. Hawaii ................................................... Idaho ..................................................... Illinois .................................................... Indiana .................................................. Iowa ...................................................... Kansas .................................................. Kentucky ............................................... Louisiana .............................................. Maine .................................................... Maryland ............................................... Massachusetts ...................................... Michigan ............................................... Minnesota ............................................. Mississippi ............................................ Missouri ................................................ Montana ................................................ Nebraska .............................................. Nevada ................................................. New Hampshire .................................... New Jersey ........................................... New Mexico .......................................... New York .............................................. North Carolina ...................................... North Dakota ........................................ Ohio ...................................................... Oklahoma ............................................. Oregon .................................................. Pennsylvania ........................................ Rhode Island ........................................ South Carolina ...................................... South Dakota ........................................ Tennessee ............................................ Texas .................................................... Utah ...................................................... Vermont ................................................ Virginia .................................................. Washington ........................................... West Virginia ........................................ Wisconsin ............................................. Wyoming ............................................... Water Resources Regions Region 01 New England ....................... Region 02 Mid-Atlantic .......................... Region 03 South Atlantic-Gulf .............. Region 04 Great Lakes ......................... Region 05 Ohio ..................................... Region 06 Tennessee ........................... Region 07 Upper Mississippi ................ Region 08 Lower Mississippi ................ Region 09 Souris-Red-Rainy ................ Region 10 Missouri ............................... Region 11 Arkansas-White-Red ........... Region 12 Texas-Gulf ........................... Region 13 Rio Grande .......................... Region 14 Upper Colorado ................... Region 15 Lower Colorado ................... Region 16 Great Basin ......................... Region 17 Pacific Northwest ................. Region 18 California ............................. Region 19 Alaska ................................. Region 20 Hawaii .................................
48,315 46,179
4 -
553 -
2,808
6,079 -
18 -
53
- 6,801
23 76 21
768
16 4 -
25
- 175 342
- 16
5,061 2,956 1,133
- 22
3,798
7 39
178 4
166
2,864 9 - 3
532
4 849
7,418 -
25 2,152
2 221
3,090
- 103
99 274
33
4 504
6 84
12,650
2,201 387
3,764 5,405
948
7,030 11,878
2,945 - -
6,187,983 6,204,874
20 -
280,741 -
968,715
631,443 -
887 -
1,336
- 823,523
970 5,376
844
176,976 (D)
440 -
1,203
- 14,559 20,616
- 560
657,151 238,408 304,932
- 390
231,913
219 1,046
17,627 535
21,698
347,117 569
- 114
62,859
64 147,375 517,526
-
1,062 272,641
(D) 20,734
415,474
- 4,233 2,516
21,280 1,585
40
36,371 510
6,341 1,489,418
387,203 77,768
333,905 340,744 323,132
742,150
1,431,044 989,743
- -
4.5 5.0
1.0 -
8.7 -
5.8
3.3 -
3.6 -
7.9
- 4.3 2.3 3.0 5.4
6.4 (D) 0.4
- 6.6
-
5.5 4.3
- 3.6
3.0 4.8 4.1
- 6.3
4.5 7.4 1.1 4.2 6.6
5.4 3.9 2.4
- 3.0
3.7 4.6 4.6 3.9
-
4.3 4.8 (D) 3.5 3.5
- 4.8 4.8 5.0 3.5
4.0 3.5 1.0 5.7 3.6
4.9 5.6 3.9 2.8 8.5
4.1 4.2 5.7
- -
2.4 2.3
0.5 -
6.2 -
4.0
1.7 -
0.8 -
0.6
- 1.9 0.3 0.5 0.7
1.5 (D)1.7
- 0.4
-
0.4 0.6
- 0.3
1.3 0.9 3.1
- 0.9
2.7 0.1 0.3 1.1 2.0
1.3 2.1 0.4
- 0.8
1.0 0.1 1.6 2.5
-
0.3 2.4 (D)0.7 2.1
- 0.5 0.5 0.5 0.9
0.1 0.6 1.5 0.7 1.5
1.5 2.0 2.2 2.0 6.0
2.7 2.0 3.8
- -
24,879 23,403
4 -
89 -
922
1,651 -
18 -
53
- 3,585
23 76 16
667
9 - -
25
- 151 341
- 16
2,839 2,466
438 -
22
547 4
39 112
4
144 2,291
9 - 3
228
4 547
4,000 -
25 2,036
2 221
1,252
- 100
99 250
26
4 499
2 83
6,660
988 373 536
2,575 272
3,531 7,812 1,069
- -
3,596,494 3,544,449
20 -
34,704 -
227,385
264,935 -
887 -
1,336
- 692,160
970 5,376
694
172,364 191
- -
1,203
- 13,719
(D) -
560
407,239 201,669 180,023
- 390
114,575
(D) 1,046
11,711 535
19,519
296,548 569
- 114
28,094
64 108,262 335,113
-
1,062 261,630
(D) 20,734
170,401
- 4,113 2,516
20,440 1,508
40
36,221 (D) (D)
854,252
239,091 75,849
140,069 191,616 49,758
469,008
1,233,098 272,579
- -
4.4 4.8
1.0 -
8.1 -
5.0
3.9 -
3.6 -
7.9
- 4.4 2.3 3.0 3.9
6.4 (D)
- -
6.6
- 5.7 (D)
- 3.6
3.3 4.9 4.2
- 6.3
5.2 6.8 1.1 4.5 6.6
5.3 4.0 2.4
- 3.0
4.1 4.6 5.2 3.8
-
4.3 4.8 (D)3.5 3.4
- 4.7 4.8 5.1 3.5
4.0 3.5 (D)(D)4.0
5.9 5.6 4.3 3.4 7.2
4.0 4.3 5.0
- -
2.0 1.9
0.5 -
4.9 -
3.5
1.8 -
0.8 -
0.6
- 1.8 0.3 0.5 0.5
1.5 (D)
- -
0.4
- 0.4 (D)
- 0.3
1.4 0.9 3.1
- 0.9
2.8 0.1 0.3 0.9 2.0
1.1 2.1 0.4
- 0.8
1.0 0.1 1.8 2.5
-
0.3 2.4 (D) 0.7 1.8
- 0.5 0.5 0.5 0.9
0.1 0.6 (D) (D) 1.4
1.5 2.0 2.3 2.3 4.5
2.8 2.0 3.2
- -
23,436 22,744
- -
464 -
1,886
4,428 - - - -
- 3,216
- - 5
101
7 4 - -
- 24
1 - -
2,222 490 695
- -
3,251 3 -
66 -
22 573
- - -
304 -
302 3,418
-
- 116
- -
1,838
- 3 -
24 7
- 5 4 1
5,990
1,213 14
3,228 2,830
676
3,499 4,066 1,876
- -
2,591,489 2,654,631
- -
246,037 -
741,330
366,508 - - - -
- 131,363
- -
150
4,612 (D)
440 - -
- 840 (D)
- -
249,912 36,739
124,909 - -
117,338 (D)
- 5,916
-
2,179 50,569
- - -
34,765 -
39,113 182,413
-
- 11,011
- -
245,073
- 120
- 840
77
- 150 (D)(D)
635,166
148,112 1,919
193,836 149,128 273,374
273,142 197,946 717,164
- -
4.6 5.2
- -
8.7 -
6.1
2.8 - - - -
- 3.5
- -
12.0
4.0 (D)0.4
- -
- 2.3 (D)
- -
2.5 4.3 4.0
- -
3.9 8.0
- 3.5
-
6.6 2.9
- - -
3.4 -
2.8 4.1
-
- 5.3
- -
3.5
- 8.0
- 2.3 4.0
-
12.0 (D)(D)3.1
3.3 4.3 3.6 2.2 8.7
4.3 3.4 6.0
- -
3.0 2.8
- -
6.4 -
4.1
1.6 - - - -
- 2.0
- -
1.7
2.1 (D)1.7
- -
- 0.2 (D)
- -
1.2 1.2 3.0
- -
2.7 0.1
- 1.3
-
2.5 1.9
- - -
1.0 -
1.0 2.4
-
- 2.5
- -
2.3
- 0.1
- 0.2 0.2
-
1.7 (D)(D)1.7
1.6 2.0 2.1 1.7 6.3
2.6 2.0 4.1
- -
See footnote(s) at end of table. --continued

2007 CENSUS OF AGRICULTURE 2008 FRIS – GENERAL DATA 101 USDA, National Agricultural Statistics Service
Table 28. Estimated Quantity of Water Applied and Primary Method of Distribution by Selected Crops Harvested: 2008 and 2003 - Con.
[Excludes institutional, research, and experimental farms and farms with horticulture. For meaning of abbreviations and symbols, see introductory text]
All other hay (dry hay, greenchop, and silage)
Primary method of distribution
Pressure system Gravity system Geographic area Farms
Irrigated acres
harvested
Average yield per
acre 1 (tons, dry)
Average acre-feet applied per acre
Farms Acres
Averageyield per
acre 1 (tons, dry)
Averageacre-feet applied per acre
Farms Acres
Averageyield per
acre 1 (tons, dry)
Averageacre-feet applied per acre
United States ............................. 2008 .. 2003 .. 2008 DATA Alabama ............................................... Alaska .................................................. Arizona ................................................. Arkansas .............................................. California .............................................. Colorado ............................................... Connecticut .......................................... Delaware .............................................. Florida .................................................. Georgia ................................................ Hawaii .................................................. Idaho .................................................... Illinois ................................................... Indiana ................................................. Iowa ..................................................... Kansas ................................................. Kentucky .............................................. Louisiana .............................................. Maine ................................................... Maryland .............................................. Massachusetts ..................................... Michigan ............................................... Minnesota ............................................. Mississippi ............................................ Missouri ................................................ Montana ............................................... Nebraska .............................................. Nevada ................................................. New Hampshire .................................... New Jersey .......................................... New Mexico .......................................... New York .............................................. North Carolina ...................................... North Dakota ........................................ Ohio ..................................................... Oklahoma ............................................. Oregon ................................................. Pennsylvania ........................................ Rhode Island ........................................ South Carolina ..................................... South Dakota ....................................... Tennessee ........................................... Texas ................................................... Utah ..................................................... Vermont ................................................ Virginia ................................................. Washington .......................................... West Virginia ........................................ Wisconsin ............................................. Wyoming .............................................. Water Resources Regions Region 01 New England ....................... Region 02 Mid-Atlantic ......................... Region 03 South Atlantic-Gulf .............. Region 04 Great Lakes ........................ Region 05 Ohio .................................... Region 06 Tennessee .......................... Region 07 Upper Mississippi ................ Region 08 Lower Mississippi ................ Region 09 Souris-Red-Rainy ................ Region 10 Missouri .............................. Region 11 Arkansas-White-Red ........... Region 12 Texas-Gulf .......................... Region 13 Rio Grande ......................... Region 14 Upper Colorado ................... Region 15 Lower Colorado ................... Region 16 Great Basin ......................... Region 17 Pacific Northwest ................ Region 18 California ............................. Region 19 Alaska ................................. Region 20 Hawaii .................................
29,553 27,449
63 4
548 117
3,376
3,358 -
17 306 484
-
2,209 5
12 1
158
16 29
- 35
- -
64 35 90
3,008
515 558
- 15
1,769
- 640
26 -
323 3,878
29 -
50
132 28
2,298 2,261
-
15 1,423
- 20
1,638
- 99
1,565 15 25
28 62 79 26
3,987
1,937 1,852 1,477 3,101
626
2,212 8,721 3,737
4 -
3,351,986 3,245,618
2,998 842
61,995 12,336
556,013
441,727 -
438 31,718 37,022
-
182,393 645 786 (D)
17,453
693 1,620
- 1,936
- -
2,535 (D)
2,827
362,777 34,503
192,482 -
581
93,528 -
35,438 1,295
-
34,981 354,232
558 -
2,505
10,510 1,118
175,291 126,581
-
2,129 149,682
- 2,500
411,808
- 3,588
113,551 1,081
947
1,108 4,670
10,210 988
643,642
160,726 145,241 121,149 392,631 64,214
287,526 817,493 582,379
842 -
2.8 2.8
3.9 2.5 5.6 3.4 4.7
2.0
- 2.9 4.0 4.9
-
1.9 3.0 0.8 (D)
4.4 3.5 4.9
- 4.8
- -
2.3 6.1 1.9
1.8 2.9 1.7
- 1.1
3.1
- 3.2 1.8
-
2.7 2.2 2.8
- 4.6
1.8 (D) 3.3 2.1
-
1.3 4.3
- 2.9 1.7
- 3.6 4.0 2.9 3.5
2.4 2.3 5.1 2.2 2.0
2.8 3.0 2.8 1.8 5.5
1.9 2.4 4.6 2.5
-
1.8 1.7
0.4 0.3 3.9 0.5 2.5
1.5
- 1.2 1.6 0.9
-
1.3 0.7 0.2 (D)
1.0 (D)0.5
- 0.3
- -
0.7 0.1 0.2
1.6 2.2 1.7
- 0.5
1.7
- 0.4 0.5
-
1.0 1.6 0.8
- 0.4
0.9 0.3 1.1 2.2
-
0.2 2.4
- 1.3 1.7
- 0.5 0.9 1.2 0.4
0.3 0.8 0.5 0.7 1.6
1.1 1.0 1.7 1.7 3.9
1.8 1.7 2.5 0.3
-
13,767 12,171
63 4
102 71
603
521 -
17 294 432
-
912 5
12 1
158
7 17
- 35
- -
64 24 90
873 489 124
- 15
746
- 640
21 -
302 2,653
29 -
48
29 24
1,505 1,159
-
15 1,243
- 20
400
- 99
1,489 15 16
25 62 59 26
1,275
771 1,359
583 781 106
1,006 5,451
640 4 -
1,110,400 (D)
2,998 842
14,733 8,286
97,348
78,785 -
438 31,033 35,982
-
91,893 645 786 (D)
17,453
173 1,020
- 1,936
- -
2,535 1,980 2,827
66,798 26,903 26,674
- 581
56,614
- 35,438
1,047 -
31,271 111,238
558 -
(D)
3,023 1,033
141,177 42,573
-
2,129 109,406
- 2,500
57,239
- 3,588
110,686 1,081
427
1,038 4,670 8,455
988 140,269
104,863 120,126 43,399 44,240 15,133
62,679
338,858 109,058
842 -
3.0 (D)
3.9 2.5 6.2 4.5 2.9
2.4
- 2.9 4.0 4.8
-
1.9 3.0 0.8 (D)
4.4 3.9 6.0
- 4.8
- -
2.3 8.4 1.9
2.0 3.3 2.3
- 1.1
3.3
- 3.2 1.5
-
2.6 2.4 2.8
- (D)
1.9 2.1 3.3 2.4
-
1.3 4.4
- 2.9 2.0
- 3.6 4.0 2.9 3.6
2.5 2.3 5.4 2.2 2.6
3.4 3.0 3.2 1.8 6.2
2.4 2.8 2.9 2.5
-
1.4 (D)
0.4 0.3 3.1 0.5 1.5
1.3
- 1.2 1.6 0.9
-
1.4 0.7 0.2 (D)
1.0 (D) 0.4
- 0.3
- -
0.7 0.1 0.2
1.6 1.6 2.1
- 0.5
1.5
- 0.4 0.6
-
1.0 1.4 0.8
- (D)
0.6 0.3 0.9 2.0
-
0.2 2.1
- 1.3 1.6
- 0.5 0.9 1.2 0.3
0.3 0.8 0.5 0.7 1.4
1.1 0.9 1.7 1.3 3.1
2.1 1.7 1.5 0.3
-
15,786 15,260
- -
446 46
2,773
2,837 - -
12 52
-
1,297 - - -
- 9
12 - -
- - -
11 -
2,135 26
434 - -
1,023 - - 5 -
21 1,225
- - 2
103
4 793
1,102 -
- 180
- -
1,238
- -
76 - 9
3 -
20 -
2,712
1,166 493 894
2,320 520
1,206 3,270 3,097
- -
2,241,586 2,128,072
- -
47,262 4,050
458,665
362,942 - -
685 1,040
-
90,500 - - -
- 520 600
- -
- - -
(D)-
295,979 7,600
165,808 - -
36,914 - -
248 -
3,710 242,994
- -
(D)
7,487 85
34,114 84,008
-
- 40,276
- -
354,569
- -
2,865 -
520
70 -
1,755 -
503,373
55,863 25,115 77,750
348,391 49,081
224,847 478,635 473,321
- -
2.7 2.4
- -
5.4 1.1 5.1
1.9
- -
3.5 6.0
-
1.8 - - -
- 3.4 3.0
- -
- - -
3.1 -
1.8 1.5 1.6
- -
2.7 - -
2.7 -
3.1 2.1
- -
(D)
1.8 (D)3.1 2.0
-
- 4.0
- -
1.6
- -
4.2 -
3.4
2.1 -
4.0 -
1.8
1.6 3.0 2.5 1.8 5.3
1.8 2.0 5.0
- -
2.0 1.8
- -
4.2 0.5 2.8
1.5
- -
0.9 0.9
-
1.1 - - -
- (D)0.7
- -
- - -
0.1 -
1.6 4.0 1.6
- -
2.1 - -
0.5 -
1.3 1.7
- -
(D)
1.0 0.1 1.5 2.3
-
- 3.2
- -
1.8
- -
0.6 -
0.5
0.1 -
0.5 -
1.6
1.2 1.5 1.8 1.8 4.1
1.8 1.7 2.7
- -
See footnote(s) at end of table. --continued
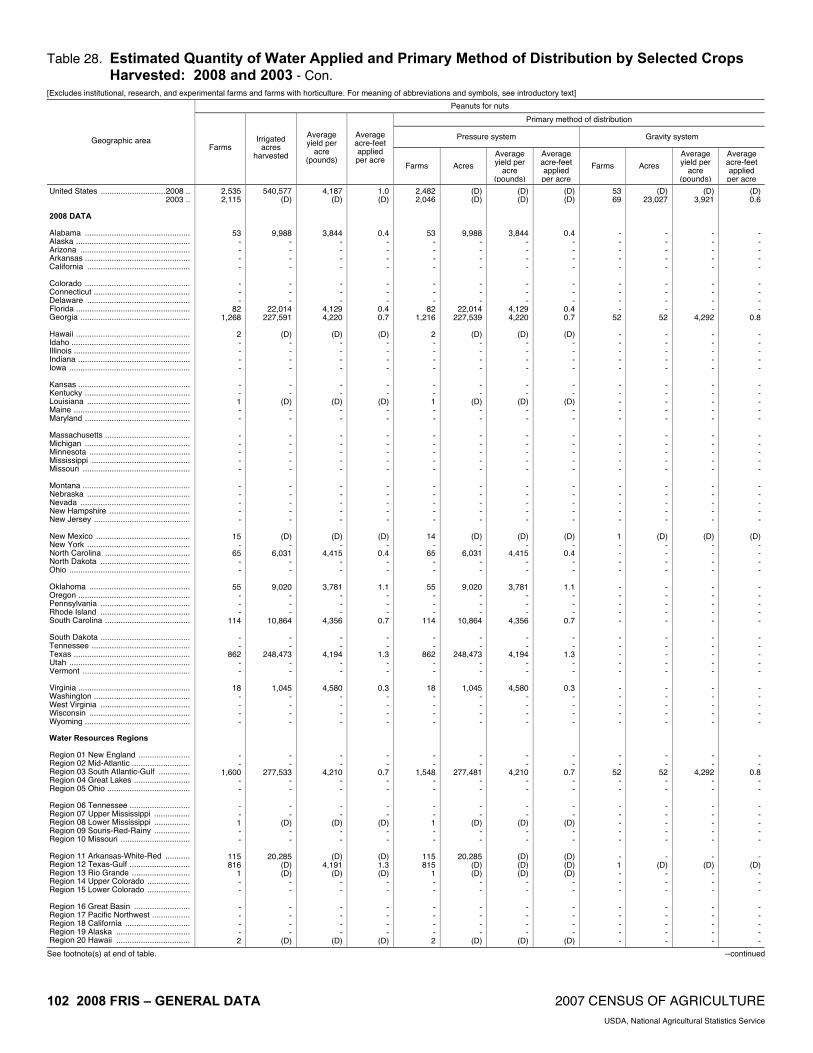
102 2008 FRIS – GENERAL DATA 2007 CENSUS OF AGRICULTURE USDA, National Agricultural Statistics Service
Table 28. Estimated Quantity of Water Applied and Primary Method of Distribution by Selected Crops Harvested: 2008 and 2003 - Con.
[Excludes institutional, research, and experimental farms and farms with horticulture. For meaning of abbreviations and symbols, see introductory text]
Peanuts for nuts
Primary method of distribution
Pressure system Gravity system Geographic area Farms
Irrigated acres
harvested
Average yield per
acre (pounds)
Average acre-feet applied per acre
Farms Acres
Averageyield per
acre (pounds)
Average acre-feet applied per acre
Farms Acres
Averageyield per
acre (pounds)
Averageacre-feet applied per acre
United States .............................2008 .. 2003 .. 2008 DATA Alabama ............................................... Alaska ................................................... Arizona ................................................. Arkansas ............................................... California .............................................. Colorado ............................................... Connecticut ........................................... Delaware .............................................. Florida ................................................... Georgia ................................................. Hawaii ................................................... Idaho ..................................................... Illinois .................................................... Indiana .................................................. Iowa ...................................................... Kansas .................................................. Kentucky ............................................... Louisiana .............................................. Maine .................................................... Maryland ............................................... Massachusetts ...................................... Michigan ............................................... Minnesota ............................................. Mississippi ............................................ Missouri ................................................ Montana ................................................ Nebraska .............................................. Nevada ................................................. New Hampshire .................................... New Jersey ........................................... New Mexico .......................................... New York .............................................. North Carolina ...................................... North Dakota ........................................ Ohio ...................................................... Oklahoma ............................................. Oregon .................................................. Pennsylvania ........................................ Rhode Island ........................................ South Carolina ...................................... South Dakota ........................................ Tennessee ............................................ Texas .................................................... Utah ...................................................... Vermont ................................................ Virginia .................................................. Washington ........................................... West Virginia ........................................ Wisconsin ............................................. Wyoming ............................................... Water Resources Regions Region 01 New England ....................... Region 02 Mid-Atlantic .......................... Region 03 South Atlantic-Gulf .............. Region 04 Great Lakes ......................... Region 05 Ohio ..................................... Region 06 Tennessee ........................... Region 07 Upper Mississippi ................ Region 08 Lower Mississippi ................ Region 09 Souris-Red-Rainy ................ Region 10 Missouri ............................... Region 11 Arkansas-White-Red ........... Region 12 Texas-Gulf ........................... Region 13 Rio Grande .......................... Region 14 Upper Colorado ................... Region 15 Lower Colorado ................... Region 16 Great Basin ......................... Region 17 Pacific Northwest ................. Region 18 California ............................. Region 19 Alaska ................................. Region 20 Hawaii .................................
2,535 2,115
53 - - - -
- - -
82 1,268
2 - - - -
- - 1 - -
- - - - -
- - - - -
15 -
65 - -
55 - - -
114
- -
862 - -
18 - - - -
- -
1,600 - -
- - 1 - -
115 816
1 - -
- - - - 2
540,577 (D)
9,988 - - - -
- - -
22,014 227,591
(D)
- - - -
- -
(D) - -
- - - - -
- - - - -
(D) -
6,031 - -
9,020 - - -
10,864
- -
248,473 - -
1,045 - - - -
- -
277,533 - -
- -
(D) - -
20,285 (D) (D)
- -
- - - -
(D)
4,187 (D)
3,844 - - - -
- - -
4,129 4,220
(D)
- - - -
- -
(D)- -
- - - - -
- - - - -
(D)-
4,415 - -
3,781 - - -
4,356
- -
4,194 - -
4,580 - - - -
- -
4,210 - -
- -
(D)- -
(D)4,191
(D)- -
- - - -
(D)
1.0 (D)
0.4 - - - -
- - -
0.4 0.7
(D)
- - - -
- -
(D)- -
- - - - -
- - - - -
(D)-
0.4 - -
1.1 - - -
0.7
- -
1.3 - -
0.3 - - - -
- -
0.7 - -
- -
(D)- -
(D)1.3 (D)
- -
- - - -
(D)
2,482 2,046
53 - - - -
- - -
82 1,216
2 - - - -
- - 1 - -
- - - - -
- - - - -
14 -
65 - -
55 - - -
114
- -
862 - -
18 - - - -
- -
1,548 - -
- - 1 - -
115 815
1 - -
- - - - 2
(D)(D)
9,988 - - - -
- - -
22,014 227,539
(D)
- - - -
- -
(D)- -
- - - - -
- - - - -
(D)-
6,031 - -
9,020 - - -
10,864
- -
248,473 - -
1,045 - - - -
- -
277,481 - -
- -
(D)- -
20,285 (D)(D)
- -
- - - -
(D)
(D) (D)
3,844 - - - -
- - -
4,129 4,220
(D)
- - - -
- -
(D) - -
- - - - -
- - - - -
(D) -
4,415 - -
3,781 - - -
4,356
- -
4,194 - -
4,580 - - - -
- -
4,210 - -
- -
(D) - -
(D) (D) (D)
- -
- - - -
(D)
(D) (D)
0.4 - - - -
- - -
0.4 0.7
(D)
- - - -
- -
(D) - -
- - - - -
- - - - -
(D) -
0.4 - -
1.1 - - -
0.7
- -
1.3 - -
0.3 - - - -
- -
0.7 - -
- -
(D) - -
(D) (D) (D)
- -
- - - -
(D)
53 69
- - - - -
- - - -
52
- - - - -
- - - - -
- - - - -
- - - - -
1 - - - -
- - - - -
- - - - -
- - - - -
- -
52 - -
- - - - -
- 1 - - -
- - - - -
(D) 23,027
- - - - -
- - - -
52
- - - - -
- - - - -
- - - - -
- - - - -
(D) - - - -
- - - - -
- - - - -
- - - - -
- -
52 - -
- - - - -
- (D)
- - -
- - - - -
(D)3,921
- - - - -
- - - -
4,292
- - - - -
- - - - -
- - - - -
- - - - -
(D)- - - -
- - - - -
- - - - -
- - - - -
- -
4,292 - -
- - - - -
- (D)
- - -
- - - - -
(D)0.6
- - - - -
- - - -
0.8
- - - - -
- - - - -
- - - - -
- - - - -
(D)- - - -
- - - - -
- - - - -
- - - - -
- -
0.8 - -
- - - - -
- (D)
- - -
- - - - -
See footnote(s) at end of table. --continued

2007 CENSUS OF AGRICULTURE 2008 FRIS – GENERAL DATA 103 USDA, National Agricultural Statistics Service
Table 28. Estimated Quantity of Water Applied and Primary Method of Distribution by Selected Crops Harvested: 2008 and 2003 - Con.
[Excludes institutional, research, and experimental farms and farms with horticulture. For meaning of abbreviations and symbols, see introductory text]
All cotton
Primary method of distribution
Sprinkler system Geographic area Farms
Irrigated acres
harvested
Average yield per
acre (lbs, lint)
Average acre-feet applied per acre
Farms Acres
Averageyield per
acre (lbs, lint)
Averageacre-feet applied per acre
United States ............................. 2008 .. 2003 .. 2008 DATA Alabama ............................................... Alaska .................................................. Arizona ................................................. Arkansas .............................................. California .............................................. Colorado ............................................... Connecticut .......................................... Delaware .............................................. Florida .................................................. Georgia ................................................ Hawaii .................................................. Idaho .................................................... Illinois ................................................... Indiana ................................................. Iowa ..................................................... Kansas ................................................. Kentucky .............................................. Louisiana .............................................. Maine ................................................... Maryland .............................................. Massachusetts ..................................... Michigan ............................................... Minnesota ............................................. Mississippi ............................................ Missouri ................................................ Montana ............................................... Nebraska .............................................. Nevada ................................................. New Hampshire .................................... New Jersey .......................................... New Mexico .......................................... New York .............................................. North Carolina ...................................... North Dakota ........................................ Ohio ..................................................... Oklahoma ............................................. Oregon ................................................. Pennsylvania ........................................ Rhode Island ........................................ South Carolina ..................................... South Dakota ....................................... Tennessee ........................................... Texas ................................................... Utah ..................................................... Vermont ................................................ Virginia ................................................. Washington .......................................... West Virginia ........................................ Wisconsin ............................................. Wyoming .............................................. Water Resources Regions Region 01 New England ....................... Region 02 Mid-Atlantic ......................... Region 03 South Atlantic-Gulf .............. Region 04 Great Lakes ........................ Region 05 Ohio .................................... Region 06 Tennessee .......................... Region 07 Upper Mississippi ................ Region 08 Lower Mississippi ................ Region 09 Souris-Red-Rainy ................ Region 10 Missouri .............................. Region 11 Arkansas-White-Red ........... Region 12 Texas-Gulf .......................... Region 13 Rio Grande ......................... Region 14 Upper Colorado ................... Region 15 Lower Colorado ................... Region 16 Great Basin ......................... Region 17 Pacific Northwest ................ Region 18 California ............................. Region 19 Alaska ................................. Region 20 Hawaii .................................
6,612 8,615
65 -
234 643 544
- - - 8
903
- - - - -
22 -
146 - -
- - -
259 290
- - - - -
158 -
70 - -
148 - - -
53
- 30
3,030 - -
9 - - - -
- -
1,109 - -
19 -
1,323 - -
739 2,459
183 -
245
- -
535 - -
3,123,664 4,075,124
16,789 -
142,163 519,707 266,947
- - -
4,928 246,790
- - - - -
9,170 -
84,565 - -
- - -
174,147 200,968
- - - - -
29,811 -
14,156 - -
60,033 - - -
10,585
- 12,227
1,329,803 - -
875 - - - -
- -
290,680 - -
6,604 -
973,925 - -
299,193 1,067,907
75,319 -
151,085
- -
258,951 - -
1,103 995
1,035 -
1,537 1,050 1,438
- - -
1,056 1,087
- - - - -
907 -
727 - -
- - -
1,075 1,187
- - - - -
1,008 -
1,076 - -
1,180 - - -
1,165
- 1,211 1,029
- -
954 - - - -
- -
1,085 - -
1,137 -
1,060 - -
1,105 1,000 1,198
- 1,559
- -
1,421 - -
1.3 1.4
0.6 -
4.8 0.8 3.1
- - -
0.6 0.8
- - - - -
0.7 -
0.6 - -
- - -
0.7 0.8
- - - - -
2.3 -
0.5 - -
1.3 - - -
0.8
- 0.6 1.1
- -
0.3 - - - -
- -
0.8 - -
0.7 -
0.8 - -
1.1 1.0 2.8
- 4.7
- -
3.0 - -
4,343 4,452
63 -
11 222
58
- - - 8
900
- - - - -
21 -
43 - -
- - -
118 121
- - - - -
32 -
70 - -
55 - - -
51
- 30
2,531 - -
9 - - - -
- -
1,102 - -
19 -
505 - -
549 2,084
15 -
11
- -
58 - -
1,854,449 (D)
(D) -
9,806 206,387 17,225
- - -
4,928 245,275
- - - - -
(D) -
22,314 - -
- - -
92,649 90,906
- - - - -
(D) -
14,156 - -
14,784 - - -
(D)
- 12,227
1,077,614 - -
875 - - - -
- -
(D) - -
6,604 -
415,552 - -
(D) 899,452
4,277 -
9,806
- -
17,225 - -
1,057 (D)
(D)-
1,717 1,084 1,415
- - -
1,056 1,089
- - - - -
(D)-
770 - -
- - -
1,128 1,164
- - - - -
1,137 -
1,076 - -
1,179 - - -
(D)
- 1,211 1,020
- -
954 - - - -
- -
1,086 - -
1,137 -
1,101 - -
1,096 1,002 1,419
- 1,717
- -
1,415 - -
1.0 (D)
(D)-
4.5 0.7 3.3
- - -
0.6 0.8
- - - - -
(D)-
(D)- -
- - -
0.7 0.8
- - - - -
2.2 -
0.5 - -
1.4 - - -
(D)
- 0.6 1.0
- -
0.3 - - - -
- -
0.8 - -
0.7 -
0.7 - -
1.1 1.0 2.4
- 4.5
- -
3.3 - -
See footnote(s) at end of table. --continued

104 2008 FRIS – GENERAL DATA 2007 CENSUS OF AGRICULTURE USDA, National Agricultural Statistics Service
Table 28. Estimated Quantity of Water Applied and Primary Method of Distribution by Selected Crops Harvested: 2008 and 2003 - Con.
[Excludes institutional, research, and experimental farms and farms with horticulture. For meaning of abbreviations and symbols, see introductory text]
All cotton - con.
Primary method of distribution - con.
Gravity system Low-flow irrigation (drip, trickle, or micro sprinklers) Geographic area
Farms Acres
Averageyield per
acres (lbs, lint)
Averageacre-feet applied per acre
Farms Acres
Averageyield per
acre (lbs, lint)
Averageacre-feet applied per acre
United States .............................2008 .. 2003 .. 2008 DATA Alabama ............................................... Alaska ................................................... Arizona ................................................. Arkansas ............................................... California .............................................. Colorado ............................................... Connecticut ........................................... Delaware .............................................. Florida ................................................... Georgia ................................................. Hawaii ................................................... Idaho ..................................................... Illinois .................................................... Indiana .................................................. Iowa ...................................................... Kansas .................................................. Kentucky ............................................... Louisiana .............................................. Maine .................................................... Maryland ............................................... Massachusetts ...................................... Michigan ............................................... Minnesota ............................................. Mississippi ............................................ Missouri ................................................ Montana ................................................ Nebraska .............................................. Nevada ................................................. New Hampshire .................................... New Jersey ........................................... New Mexico .......................................... New York .............................................. North Carolina ...................................... North Dakota ........................................ Ohio ...................................................... Oklahoma ............................................. Oregon .................................................. Pennsylvania ........................................ Rhode Island ........................................ South Carolina ...................................... South Dakota ........................................ Tennessee ............................................ Texas .................................................... Utah ...................................................... Vermont ................................................ Virginia .................................................. Washington ........................................... West Virginia ........................................ Wisconsin ............................................. Wyoming ............................................... Water Resources Regions Region 01 New England ....................... Region 02 Mid-Atlantic .......................... Region 03 South Atlantic-Gulf .............. Region 04 Great Lakes ......................... Region 05 Ohio ..................................... Region 06 Tennessee ........................... Region 07 Upper Mississippi ................ Region 08 Lower Mississippi ................ Region 09 Souris-Red-Rainy ................ Region 10 Missouri ............................... Region 11 Arkansas-White-Red ........... Region 12 Texas-Gulf ........................... Region 13 Rio Grande .......................... Region 14 Upper Colorado ................... Region 15 Lower Colorado ................... Region 16 Great Basin ......................... Region 17 Pacific Northwest ................. Region 18 California ............................. Region 19 Alaska ................................. Region 20 Hawaii .................................
2,080 4,020
1 -
211 421 471
- - - - -
- - - - -
1 -
103 - -
- - -
141 169
- - - - -
118 - - - -
85 - - - -
- -
359 - -
- - - - -
- - 1 - -
- -
818 - -
182 235 160
- 222
- -
462 - -
1,169,918 2,010,097
(D)-
125,667 313,320 245,827
- - - - -
- - - - -
(D)-
62,251 - -
- - -
81,498 110,062
- - - - -
(D)- - - -
37,659 - - - -
- -
174,112 - -
- - - - -
- -
(D)- -
- -
558,373 - -
(D)90,378 69,862
- 134,589
- -
237,831 - -
1,183 1,112
(D)-
1,512 1,028 1,443
- - - - -
- - - - -
(D)-
711 - -
- - -
1,015 1,206
- - - - -
(D)- - - -
1,216 - - - -
- -
1,114 - -
- - - - -
- -
(D)- -
- -
1,029 - -
1,138 1,015
(D)-
1,538
- -
1,424 - -
1.9 1.8
(D)-
4.8 0.9 3.1
- - - - -
- - - - -
(D)-
(D)- -
- - -
0.8 0.8
- - - - -
2.3 - - - -
1.3 - - - -
- -
1.6 - -
- - - - -
- -
(D)- -
- -
0.8 - -
(D)1.1 2.8
- 4.8
- -
3.0 - -
189 143
1 -
12 -
15
- - - - 3
- - - - -
- - - - -
- - - - -
- - - - -
8 - - - -
8 - - - 2
- -
140 - -
- - - - -
- - 6 - -
- - - - -
8 140
8 -
12
- -
15 - -
99,297 46,482
(D) -
6,690 -
3,895
- - - -
1,515
- - - - -
- - - - -
- - - - -
- - - - -
(D) - - - -
7,590 - - -
(D)
- -
78,077 - -
- - - - -
- -
(D) - -
- - - - -
(D) 78,077
1,180 -
6,690
- -
3,895 - -
1,021 997
(D)-
1,744 -
1,216
- - - -
880
- - - - -
- - - - -
- - - - -
- - - - -
(D)- - - -
1,004 - - -
(D)
- -
951 - -
- - - - -
- -
(D)- -
- - - - -
1,004 951 (D)
- 1,744
- -
1,216 - -
1.2 1.6
(D)-
3.8 -
2.6
- - - -
0.1
- - - - -
- - - - -
- - - - -
- - - - -
2.8 - - - -
1.0 - - -
(D)
- -
0.9 - -
- - - - -
- -
(D)- -
- - - - -
(D)0.9 2.8
- 3.8
- -
2.6 - -
See footnote(s) at end of table. --continued

2007 CENSUS OF AGRICULTURE 2008 FRIS – GENERAL DATA 105 USDA, National Agricultural Statistics Service
Table 28. Estimated Quantity of Water Applied and Primary Method of Distribution by Selected Crops Harvested: 2008 and 2003 - Con.
[Excludes institutional, research, and experimental farms and farms with horticulture. For meaning of abbreviations and symbols, see introductory text]
Sugarbeets for sugar
Primary method of distribution
Pressure system Gravity system Geographic area Farms
Irrigated acres
harvested
Average yield per
acre (tons)
Average acre-feet applied per acre
Farms Acres
Averageyield per
acre (tons)
Average acre-feet applied per acre
Farms Acres
Averageyield per
acre (tons)
Averageacre-feet applied per acre
United States ............................. 2008 .. 2003 .. 2008 DATA Alabama ............................................... Alaska .................................................. Arizona ................................................. Arkansas .............................................. California .............................................. Colorado ............................................... Connecticut .......................................... Delaware .............................................. Florida .................................................. Georgia ................................................ Hawaii .................................................. Idaho .................................................... Illinois ................................................... Indiana ................................................. Iowa ..................................................... Kansas ................................................. Kentucky .............................................. Louisiana .............................................. Maine ................................................... Maryland .............................................. Massachusetts ..................................... Michigan ............................................... Minnesota ............................................. Mississippi ............................................ Missouri ................................................ Montana ............................................... Nebraska .............................................. Nevada ................................................. New Hampshire .................................... New Jersey .......................................... New Mexico .......................................... New York .............................................. North Carolina ...................................... North Dakota ........................................ Ohio ..................................................... Oklahoma ............................................. Oregon ................................................. Pennsylvania ........................................ Rhode Island ........................................ South Carolina ..................................... South Dakota ....................................... Tennessee ........................................... Texas ................................................... Utah ..................................................... Vermont ................................................ Virginia ................................................. Washington .......................................... West Virginia ........................................ Wisconsin ............................................. Wyoming .............................................. Water Resources Regions Region 01 New England ....................... Region 02 Mid-Atlantic ......................... Region 03 South Atlantic-Gulf .............. Region 04 Great Lakes ........................ Region 05 Ohio .................................... Region 06 Tennessee .......................... Region 07 Upper Mississippi ................ Region 08 Lower Mississippi ................ Region 09 Souris-Red-Rainy ................ Region 10 Missouri .............................. Region 11 Arkansas-White-Red ........... Region 12 Texas-Gulf .......................... Region 13 Rio Grande ......................... Region 14 Upper Colorado ................... Region 15 Lower Colorado ................... Region 16 Great Basin ......................... Region 17 Pacific Northwest ................ Region 18 California ............................. Region 19 Alaska ................................. Region 20 Hawaii .................................
1,590 2,495
- - - -
181
199 - - - -
- 456
- - -
- - - - -
- 18 20
- -
156 257
- - -
- - -
58 -
- 85
- - -
- - - - -
- 4 - -
156
- - -
18 -
- 15
- 9
822
- - - - -
- 545 181
- -
382,267 561,653
- - - -
57,251
31,258 - - - -
- 141,792
- - -
- - - - -
- 1,388 3,313
- -
24,928 59,553
- - -
- - -
14,740 -
- 11,953
- - -
- - - - -
- 2,068
- -
34,023
- - -
1,388 -
- 2,598
- 1,461
163,756
- - - - -
- 155,813 57,251
- -
30 29
- - - -
41
27 - - - -
- 32
- - -
- - - - -
- 30 25
- -
27 23
- - -
- - -
24 -
- 31
- - -
- - - - -
- 41
- -
26
- - -
30 -
- 26
- 26 25
- - - - -
- 32 41
- -
2.6 2.7
- - - -
5.2
1.6 - - - -
- 2.5
- - -
- - - - -
- 0.5 0.7
- -
1.7 1.2
- - -
- - -
1.8 -
- 3.2
- - -
- - - - -
- 2.1
- -
3.1
- - -
0.5 -
- 0.9
- 0.5 1.8
- - - - -
- 2.6 5.2
- -
696 1,592
- - - -
15
91 - - - -
- 287
- - -
- - - - -
- 16 20
- -
16 182
- - -
- - -
14 -
- 18
- - -
- - - - -
- 4 - -
33
- - -
16 -
- 15
- 9
332
- - - - -
- 309
15 - -
223,856 365,676
- - - -
4,340
(D)- - - -
- 125,038
- - -
- - - - -
- (D)
3,313 - -
4,632 48,753
- - -
- - -
1,396 -
- 2,834
- - -
- - - - -
- 2,068
- -
9,534
- - -
(D)-
- 2,598
- 1,461
(D)
- - - - -
- 129,940
4,340 - -
29 30
- - - -
37
28 - - - -
- 32
- - -
- - - - -
- (D) 25
- -
(D) 23
- - -
- - -
24 -
- 28
- - -
- - - - -
- 41
- -
27
- - -
(D) -
- 26
- 26 (D)
- - - - -
- 32 37
- -
2.1 2.4
- - - -
3.7
(D) - - - -
- 2.5
- - -
- - - - -
- (D) 0.7
- -
1.5 1.3
- - -
- - -
1.3 -
- 2.8
- - -
- - - - -
- 2.1
- -
1.5
- - -
(D) -
- 0.9
- 0.5 (D)
- - - - -
- 2.5 3.7
- -
894 903
- - - -
166
108 - - - -
- 169
- - -
- - - - -
- 2 - - -
140 75
- - -
- - -
44 -
- 67
- - -
- - - - -
- - - -
123
- - - 2 -
- - - -
490
- - - - -
- 236 166
- -
158,411 195,977
- - - -
52,911
(D) - - - -
- 16,754
- - -
- - - - -
- (D)
- - -
20,296 10,800
- - -
- - -
13,344 -
- 9,119
- - -
- - - - -
- - - -
24,489
- - -
(D) -
- - - -
(D)
- - - - -
- 25,873 52,911
- -
32 28
- - - -
42
24 - - - -
- 32
- - -
- - - - -
- (D)
- - -
(D)21
- - -
- - -
24 -
- 32
- - -
- - - - -
- - - -
26
- - -
(D)-
- - - -
(D)
- - - - -
- 32 42
- -
3.4 3.2
- - - -
5.3
(D)- - - -
- 3.1
- - -
- - - - -
- (D)
- - -
1.8 1.1
- - -
- - -
1.8 -
- 3.4
- - -
- - - - -
- - - -
3.7
- - -
(D)-
- - - -
(D)
- - - - -
- 3.2 5.3
- -
See footnote(s) at end of table. --continued
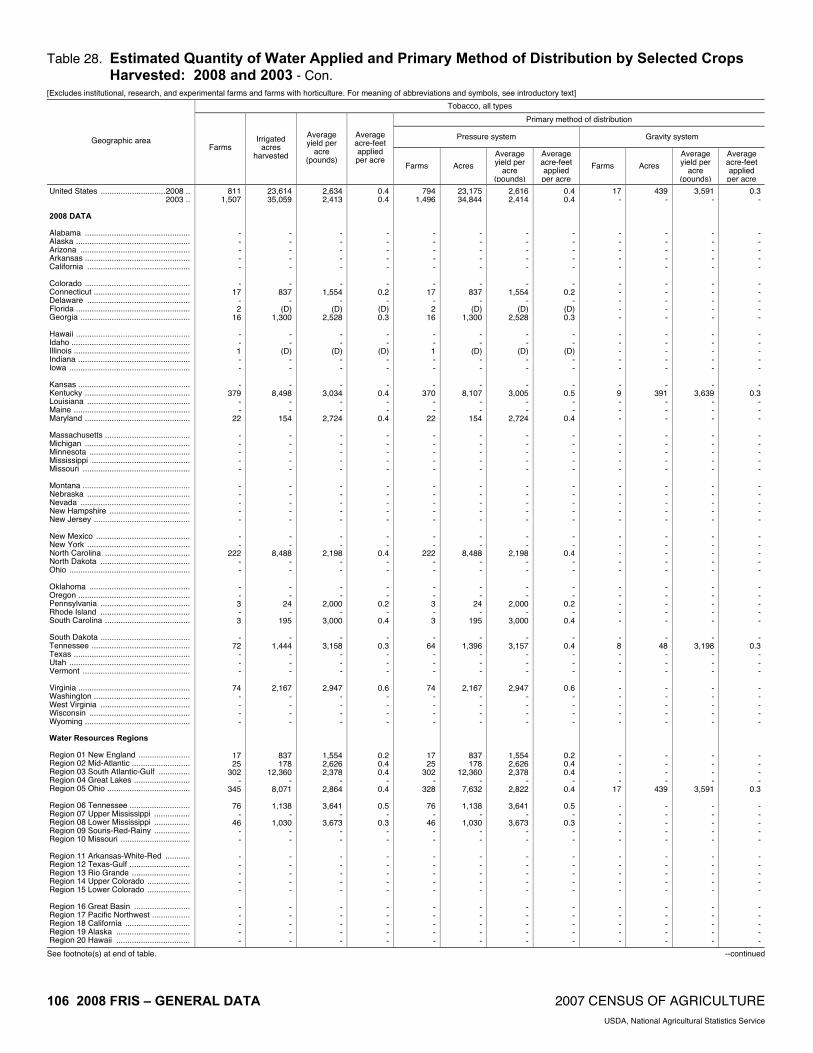
106 2008 FRIS – GENERAL DATA 2007 CENSUS OF AGRICULTURE USDA, National Agricultural Statistics Service
Table 28. Estimated Quantity of Water Applied and Primary Method of Distribution by Selected Crops Harvested: 2008 and 2003 - Con.
[Excludes institutional, research, and experimental farms and farms with horticulture. For meaning of abbreviations and symbols, see introductory text]
Tobacco, all types
Primary method of distribution
Pressure system Gravity system Geographic area Farms
Irrigated acres
harvested
Average yield per
acre (pounds)
Average acre-feet applied per acre
Farms Acres
Averageyield per
acre (pounds)
Average acre-feet applied per acre
Farms Acres
Averageyield per
acre (pounds)
Averageacre-feet applied per acre
United States .............................2008 .. 2003 .. 2008 DATA Alabama ............................................... Alaska ................................................... Arizona ................................................. Arkansas ............................................... California .............................................. Colorado ............................................... Connecticut ........................................... Delaware .............................................. Florida ................................................... Georgia ................................................. Hawaii ................................................... Idaho ..................................................... Illinois .................................................... Indiana .................................................. Iowa ...................................................... Kansas .................................................. Kentucky ............................................... Louisiana .............................................. Maine .................................................... Maryland ............................................... Massachusetts ...................................... Michigan ............................................... Minnesota ............................................. Mississippi ............................................ Missouri ................................................ Montana ................................................ Nebraska .............................................. Nevada ................................................. New Hampshire .................................... New Jersey ........................................... New Mexico .......................................... New York .............................................. North Carolina ...................................... North Dakota ........................................ Ohio ...................................................... Oklahoma ............................................. Oregon .................................................. Pennsylvania ........................................ Rhode Island ........................................ South Carolina ...................................... South Dakota ........................................ Tennessee ............................................ Texas .................................................... Utah ...................................................... Vermont ................................................ Virginia .................................................. Washington ........................................... West Virginia ........................................ Wisconsin ............................................. Wyoming ............................................... Water Resources Regions Region 01 New England ....................... Region 02 Mid-Atlantic .......................... Region 03 South Atlantic-Gulf .............. Region 04 Great Lakes ......................... Region 05 Ohio ..................................... Region 06 Tennessee ........................... Region 07 Upper Mississippi ................ Region 08 Lower Mississippi ................ Region 09 Souris-Red-Rainy ................ Region 10 Missouri ............................... Region 11 Arkansas-White-Red ........... Region 12 Texas-Gulf ........................... Region 13 Rio Grande .......................... Region 14 Upper Colorado ................... Region 15 Lower Colorado ................... Region 16 Great Basin ......................... Region 17 Pacific Northwest ................. Region 18 California ............................. Region 19 Alaska ................................. Region 20 Hawaii .................................
811 1,507
- - - - -
- 17
- 2
16
- - 1 - -
- 379
- -
22
- - - - -
- - - - -
- -
222 - -
- - 3 - 3
-
72 - - -
74 - - - -
17 25
302 -
345
76 -
46 - -
- - - - -
- - - - -
23,614 35,059
- - - - -
- 837
- (D)
1,300
- -
(D) - -
- 8,498
- -
154
- - - - -
- - - - -
- -
8,488 - -
- -
24 -
195
- 1,444
- - -
2,167 - - - -
837 178
12,360 -
8,071
1,138 -
1,030 - -
- - - - -
- - - - -
2,634 2,413
- - - - -
- 1,554
- (D)
2,528
- -
(D)- -
- 3,034
- -
2,724
- - - - -
- - - - -
- -
2,198 - -
- -
2,000 -
3,000
- 3,158
- - -
2,947 - - - -
1,554 2,626 2,378
- 2,864
3,641
- 3,673
- -
- - - - -
- - - - -
0.4 0.4
- - - - -
- 0.2
- (D)0.3
- -
(D)- -
- 0.4
- -
0.4
- - - - -
- - - - -
- -
0.4 - -
- -
0.2 -
0.4
- 0.3
- - -
0.6 - - - -
0.2 0.4 0.4
- 0.4
0.5
- 0.3
- -
- - - - -
- - - - -
794 1,496
- - - - -
- 17
- 2
16
- - 1 - -
- 370
- -
22
- - - - -
- - - - -
- -
222 - -
- - 3 - 3
-
64 - - -
74 - - - -
17 25
302 -
328
76 -
46 - -
- - - - -
- - - - -
23,175 34,844
- - - - -
- 837
- (D)
1,300
- -
(D)- -
- 8,107
- -
154
- - - - -
- - - - -
- -
8,488 - -
- -
24 -
195
- 1,396
- - -
2,167 - - - -
837 178
12,360 -
7,632
1,138 -
1,030 - -
- - - - -
- - - - -
2,616 2,414
- - - - -
- 1,554
- (D)
2,528
- -
(D) - -
- 3,005
- -
2,724
- - - - -
- - - - -
- -
2,198 - -
- -
2,000 -
3,000
- 3,157
- - -
2,947 - - - -
1,554 2,626 2,378
- 2,822
3,641
- 3,673
- -
- - - - -
- - - - -
0.4 0.4
- - - - -
- 0.2
- (D) 0.3
- -
(D) - -
- 0.5
- -
0.4
- - - - -
- - - - -
- -
0.4 - -
- -
0.2 -
0.4
- 0.4
- - -
0.6 - - - -
0.2 0.4 0.4
- 0.4
0.5
- 0.3
- -
- - - - -
- - - - -
17 -
- - - - -
- - - - -
- - - - -
- 9 - - -
- - - - -
- - - - -
- - - - -
- - - - -
- 8 - - -
- - - - -
- - - -
17
- - - - -
- - - - -
- - - - -
439 -
- - - - -
- - - - -
- - - - -
- 391
- - -
- - - - -
- - - - -
- - - - -
- - - - -
- 48
- - -
- - - - -
- - - -
439
- - - - -
- - - - -
- - - - -
3,591 -
- - - - -
- - - - -
- - - - -
- 3,639
- - -
- - - - -
- - - - -
- - - - -
- - - - -
- 3,198
- - -
- - - - -
- - - -
3,591
- - - - -
- - - - -
- - - - -
0.3 -
- - - - -
- - - - -
- - - - -
- 0.3
- - -
- - - - -
- - - - -
- - - - -
- - - - -
- 0.3
- - -
- - - - -
- - - -
0.3
- - - - -
- - - - -
- - - - -
See footnote(s) at end of table. --continued

2007 CENSUS OF AGRICULTURE 2008 FRIS – GENERAL DATA 107 USDA, National Agricultural Statistics Service
Table 28. Estimated Quantity of Water Applied and Primary Method of Distribution by Selected Crops Harvested: 2008 and 2003 - Con.
[Excludes institutional, research, and experimental farms and farms with horticulture. For meaning of abbreviations and symbols, see introductory text]
Land in vegetables 2
Primary method of distribution
Sprinkler system Gravity system Low-flow irrigation (drip, trickle, or micro sprinklers) Geographic area
Farms Irrigated
acres harvested
Average acre-feet applied per acre
Farms Acres
Average acre-feet applied per acre
Farms Acres
Average acre-feet applied per acre
Farms Acres
Average acre-feet applied per acre
United States ............................. 2008 .. 2003 .. 2008 DATA Alabama ............................................... Alaska .................................................. Arizona ................................................. Arkansas .............................................. California .............................................. Colorado ............................................... Connecticut .......................................... Delaware .............................................. Florida .................................................. Georgia ................................................ Hawaii .................................................. Idaho .................................................... Illinois ................................................... Indiana ................................................. Iowa ..................................................... Kansas ................................................. Kentucky .............................................. Louisiana .............................................. Maine ................................................... Maryland .............................................. Massachusetts ..................................... Michigan ............................................... Minnesota ............................................. Mississippi ............................................ Missouri ................................................ Montana ............................................... Nebraska .............................................. Nevada ................................................. New Hampshire .................................... New Jersey .......................................... New Mexico .......................................... New York .............................................. North Carolina ...................................... North Dakota ........................................ Ohio ..................................................... Oklahoma ............................................. Oregon ................................................. Pennsylvania ........................................ Rhode Island ........................................ South Carolina ..................................... South Dakota ....................................... Tennessee ........................................... Texas ................................................... Utah ..................................................... Vermont ................................................ Virginia ................................................. Washington .......................................... West Virginia ........................................ Wisconsin ............................................. Wyoming .............................................. Water Resources Regions Region 01 New England ....................... Region 02 Mid-Atlantic ......................... Region 03 South Atlantic-Gulf .............. Region 04 Great Lakes ........................ Region 05 Ohio .................................... Region 06 Tennessee .......................... Region 07 Upper Mississippi ................ Region 08 Lower Mississippi ................ Region 09 Souris-Red-Rainy ................ Region 10 Missouri .............................. Region 11 Arkansas-White-Red ........... Region 12 Texas-Gulf .......................... Region 13 Rio Grande ......................... Region 14 Upper Colorado ................... Region 15 Lower Colorado ................... Region 16 Great Basin ......................... Region 17 Pacific Northwest ................ Region 18 California ............................. Region 19 Alaska ................................. Region 20 Hawaii .................................
16,899 15,954
236 14 95
199 2,086
468
91 112 325 753
392 908 178 212
46
127 267 115
88 317
128 670 274
68 256
79
137 6
57 367
200 356 416
36 276
94
1,123 801
34 287
38
228 1,344
376 30
118
1,601 51
412 7
410 1,792 2,014 1,142
771
247 784 412
42 502
290
1,274 382 242 101
384
3,579 2,125
14 392
3,084,879 2,068,317
5,218 330
102,471 12,054
911,694
97,416 1,030
16,401 171,644 57,772
5,156
356,957 20,627 14,510
1,391
5,428 1,417 4,616 4,934
16,953
2,568 114,222 56,747
2,598 21,052
13,430
145,848 6,189
474 31,545
27,459 11,314 18,596 29,633
7,228
7,754 182,045 10,538
353 13,336
128
6,609 78,821
2,208 121
11,170
284,122 320
187,461 2,975
9,379 89,513
264,197 168,001 14,729
5,606
217,897 33,466 25,365
198,438
28,990 56,837
106,501 14,934
106,394
14,881 811,669 912,598
330 5,156
2.0 2.1
0.6 0.3 3.0 0.4 2.9
1.8 0.4 0.5 1.3 0.7
1.3 2.2 0.5 0.5 0.8
0.9 0.6 1.0 0.2 0.7
0.3 0.7 0.7 1.9 0.8
1.2 1.1 2.9 0.4 0.7
2.5 1.0 0.4 1.0 0.6
0.8 2.2 0.4 0.4 2.2
0.5 0.3 2.0 2.1 0.3
0.4 2.4 2.5 0.7 1.5
0.2 0.6 1.1 0.7 0.5
0.5 0.7 0.9 0.8 1.1
1.4 1.9 2.0 2.1 3.0
2.1 2.3 2.9 0.3 1.3
8,443 8,153
62 8
14 -
849
167 42 71
189 479
166 677 142 130
18
71 74 59 61
211
77 405 258
- 173
79
111 6
36 235
15
129 167
36 111
56
898 227
17 183
30 70
133 225
14
74 807
27 347
7
237 863
1,063 683 260
68
670 134
41 381
128 102 160
3 15
239
2,329 893
8 166
2,043,430 1,099,911
2,400 318
27,169 -
356,573
84,843 470
15,539 47,103 42,913
722
325,536 19,951 13,018
1,298
5,260 (D)(D)
4,907 14,688
2,258
100,588 (D)
- (D)
13,430
145,822 6,189
387 23,085
14,051
7,145 14,744 29,633
2,972
7,716 113,575
6,065 245
6,743
122 (D)
42,305 1,588
104
9,738 256,950
161 187,065
2,975
8,275 71,960
111,954 147,265
(D)
(D)217,143 18,329
(D)196,519
23,588 33,873 79,546
9,058 27,969
14,405
684,606 360,600
318 722
1.7 1.6
0.6 0.3 3.5
- 2.7
1.7 0.4 0.5 1.2 0.7
1.5 2.1 0.5 0.5 0.8
0.9 (D)0.9 0.2 0.7
0.2 0.7 (D)
- 0.8
1.2 1.1 2.9 0.3 0.7
2.0 0.4 0.4 1.0 0.6
0.8 2.1 0.4 0.3 2.5
0.5 0.2 1.7 2.0 0.3
0.5 2.3 0.2 0.7 1.5
0.2 0.6 1.0 0.7 0.5
0.3 0.7 (D)(D)1.1
1.0 1.6 1.8 (D)3.4
2.1 2.2 2.7 0.3 1.5
3,079 3,484
63 -
66 79
381
298 - -
79 161
78
218 - - 5
-
55 2 -
25
- - 1 2 2
-
26 - 7
30
169 30
- -
19
- 65 53
- -
3 31
644 148
-
8 329
2 - -
7 145 298
19 58
31
5 90
1 66
30
610 201 236
71
145 612 376
- 78
447,561 696,241
687 -
48,288 9,954
214,331
11,928 - -
69,487 2,591
212
27,621 - - 5
-
(D) (D)
- 207
- -
(D) (D) (D)
-
26 -
21 282
7,315
135 - -
427
- 12,639
192 - -
1 82
24,668 500
-
160 12,178
(D) - -
21 1,050
72,725 427 224
(D)
5 12,904
(D) 1,147
5,082
19,826 12,151
5,756 51,411
476
52,438 211,208
- 212
2.8 2.8
0.7 -
3.0 0.4 3.4
2.7
- -
1.4 0.6
1.0 3.3
- -
0.8
- (D) (D)
- 0.8
- -
(D) (D) (D)
-
0.1 -
0.3 0.7
2.8 0.2
- -
0.4
- 3.8 0.3
- -
0.4 1.1 2.4 3.0
-
0.5 2.8 (D)
- -
0.3 1.2 1.3 0.4 0.5
1.1 0.8 (D) (D) 2.5
3.1 2.3 2.8 (D) 3.1
2.9 3.3 3.4
- 1.0
5,377 4,317
111 6
15 120 856
3
49 41 57
113
148 13 36 82 23
56
138 54 27 81
51
265 15 66 81
- - -
14 102
16
197 249
- 146
38
160 521
17 104
5
127 567
3 16
36
465 22 65
-
166 784 653 440 453
148 109 188
- 55
132 562
21 3
15
- 638 856
6 148
593,888 272,164
2,130 12
27,014 2,100
340,790
645 560 862
55,054 12,268
4,222 3,800
676 1,492
88
168 (D) (D) 27
2,058
310 13,634
(D) (D) (D)
- - -
66 8,178
6,093 4,034 3,852
- 3,829
38
55,831 4,281
108 6,593
5
(D) 11,848
120 18
1,272
14,994 (D)
397 -
1,083 16,504 79,518 20,309
(D)
(D) 749
2,233 -
772
320 3,138
14,803 120
27,014
- 74,625
340,790 12
4,222
2.3 1.9
0.7 0.3 2.4 0.4 2.8
3.0 0.4 0.4 1.2 0.7
1.3 2.3 0.3 0.5 0.7
1.0 0.6 (D)0.1 0.8
0.5 0.6 0.8 (D)(D)
- - -
0.6 0.7
3.2 2.0 0.6
- 0.5
0.9 2.0 0.4 0.7 1.8
1.5 0.4 2.5 0.5 0.2
0.4 2.7 0.9 0.4
-
0.4 0.6 1.1 0.9 0.5
0.6 0.5 0.4
- 2.6
0.7 2.6 2.8 0.5 2.4
-
2.2 2.8 0.3 1.3
See footnote(s) at end of table. --continued
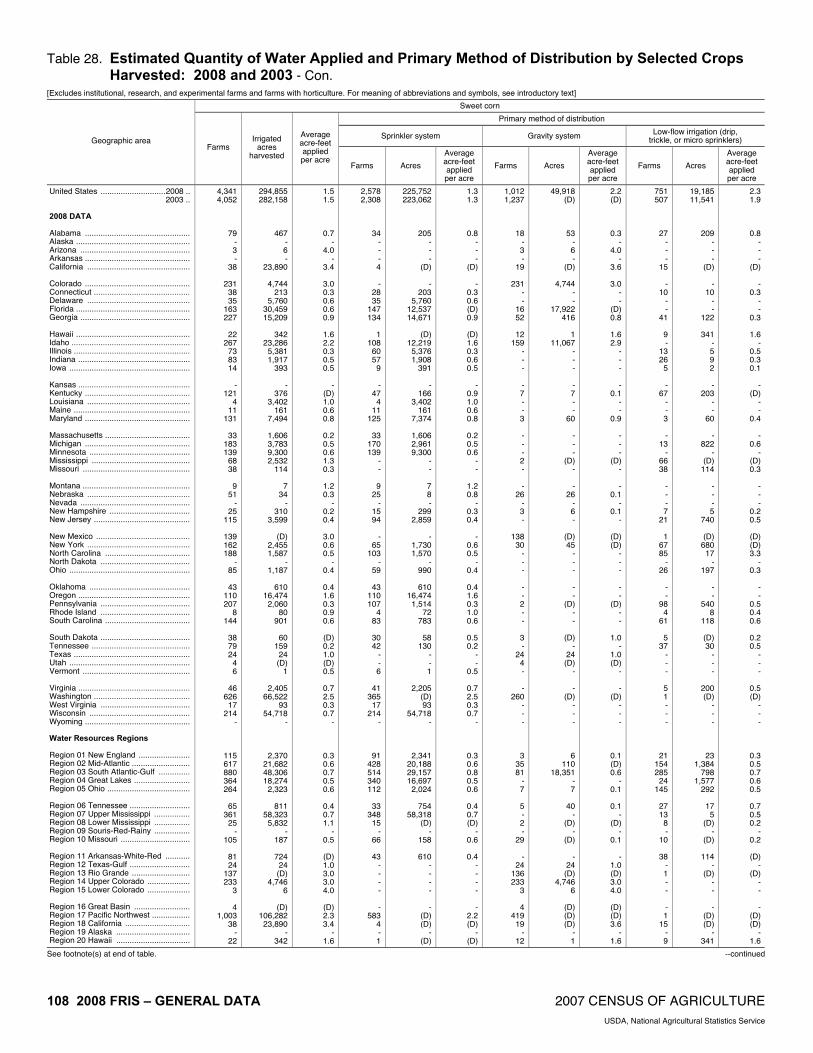
108 2008 FRIS – GENERAL DATA 2007 CENSUS OF AGRICULTURE USDA, National Agricultural Statistics Service
Table 28. Estimated Quantity of Water Applied and Primary Method of Distribution by Selected Crops Harvested: 2008 and 2003 - Con.
[Excludes institutional, research, and experimental farms and farms with horticulture. For meaning of abbreviations and symbols, see introductory text]
Sweet corn
Primary method of distribution
Sprinkler system Gravity system Low-flow irrigation (drip, trickle, or micro sprinklers) Geographic area
Farms Irrigated
acres harvested
Average acre-feet applied per acre
Farms Acres
Average acre-feet applied per acre
Farms Acres
Average acre-feet applied per acre
Farms Acres
Average acre-feet applied per acre
United States .............................2008 .. 2003 .. 2008 DATA Alabama ............................................... Alaska ................................................... Arizona ................................................. Arkansas ............................................... California .............................................. Colorado ............................................... Connecticut ........................................... Delaware .............................................. Florida ................................................... Georgia ................................................. Hawaii ................................................... Idaho ..................................................... Illinois .................................................... Indiana .................................................. Iowa ...................................................... Kansas .................................................. Kentucky ............................................... Louisiana .............................................. Maine .................................................... Maryland ............................................... Massachusetts ...................................... Michigan ............................................... Minnesota ............................................. Mississippi ............................................ Missouri ................................................ Montana ................................................ Nebraska .............................................. Nevada ................................................. New Hampshire .................................... New Jersey ........................................... New Mexico .......................................... New York .............................................. North Carolina ...................................... North Dakota ........................................ Ohio ...................................................... Oklahoma ............................................. Oregon .................................................. Pennsylvania ........................................ Rhode Island ........................................ South Carolina ...................................... South Dakota ........................................ Tennessee ............................................ Texas .................................................... Utah ...................................................... Vermont ................................................ Virginia .................................................. Washington ........................................... West Virginia ........................................ Wisconsin ............................................. Wyoming ............................................... Water Resources Regions Region 01 New England ....................... Region 02 Mid-Atlantic .......................... Region 03 South Atlantic-Gulf .............. Region 04 Great Lakes ......................... Region 05 Ohio ..................................... Region 06 Tennessee ........................... Region 07 Upper Mississippi ................ Region 08 Lower Mississippi ................ Region 09 Souris-Red-Rainy ................ Region 10 Missouri ............................... Region 11 Arkansas-White-Red ........... Region 12 Texas-Gulf ........................... Region 13 Rio Grande .......................... Region 14 Upper Colorado ................... Region 15 Lower Colorado ................... Region 16 Great Basin ......................... Region 17 Pacific Northwest ................. Region 18 California ............................. Region 19 Alaska ................................. Region 20 Hawaii .................................
4,341 4,052
79 - 3 -
38
231 38 35
163 227
22
267 73 83 14
-
121 4
11 131
33
183 139
68 38
9
51 -
25 115
139 162 188
- 85
43
110 207
8 144
38 79 24
4 6
46
626 17
214 -
115 617 880 364 264
65
361 25
- 105
81 24
137 233
3
4 1,003
38 -
22
294,855 282,158
467 - 6 -
23,890
4,744 213
5,760 30,459 15,209
342
23,286 5,381 1,917
393
- 376
3,402 161
7,494
1,606 3,783 9,300 2,532
114
7 34
- 310
3,599
(D) 2,455 1,587
- 1,187
610
16,474 2,060
80 901
60
159 24 (D)
1
2,405 66,522
93 54,718
-
2,370 21,682 48,306 18,274
2,323
811 58,323
5,832 -
187
724 24 (D)
4,746 6
(D)
106,282 23,890
- 342
1.5 1.5
0.7 -
4.0 -
3.4
3.0 0.3 0.6 0.6 0.9
1.6 2.2 0.3 0.5 0.5
-
(D) 1.0 0.6 0.8
0.2 0.5 0.6 1.3 0.3
1.2 0.3
- 0.2 0.4
3.0 0.6 0.5
- 0.4
0.4 1.6 0.3 0.9 0.6
(D) 0.2 1.0 (D) 0.5
0.7 2.5 0.3 0.7
-
0.3 0.6 0.7 0.5 0.6
0.4 0.7 1.1
- 0.5
(D) 1.0 3.0 3.0 4.0
(D) 2.3 3.4
- 1.6
2,578 2,308
34 - - - 4
-
28 35
147 134
1
108 60 57
9
- 47
4 11
125
33 170 139
- -
9 25
- 15 94
-
65 103
- 59
43
110 107
4 83
30 42
- - 6
41
365 17
214 -
91 428 514 340 112
33
348 15
- 66
43
- - - -
- 583
4 - 1
225,752 223,062
205 - - -
(D)
- 203
5,760 12,537 14,671
(D)
12,219 5,376 1,908
391
- 166
3,402 161
7,374
1,606 2,961 9,300
- -
7 8 -
299 2,859
-
1,730 1,570
- 990
610
16,474 1,514
72 783
58
130 - - 1
2,205
(D)93
54,718 -
2,341 20,188 29,157 16,697
2,024
754 58,318
(D)-
158
610 - - - -
- (D)(D)
- (D)
1.3 1.3
0.8 - - -
(D)
- 0.3 0.6 (D)0.9
(D)1.6 0.3 0.6 0.5
-
0.9 1.0 0.6 0.8
0.2 0.5 0.6
- -
1.2 0.8
- 0.3 0.4
-
0.6 0.5
- 0.4
0.4 1.6 0.3 1.0 0.6
0.5 0.2
- -
0.5
0.7 2.5 0.3 0.7
-
0.3 0.6 0.8 0.5 0.6
0.4 0.7 (D)
- 0.6
0.4
- - - -
- 2.2 (D)
- (D)
1,012 1,237
18 - 3 -
19
231 - -
16 52
12
159 - - -
- 7 - - 3
- - - 2 -
- 26
- 3 -
138 30
- - -
- - 2 - -
3 -
24 4 -
- 260
- - -
3 35 81
- 7
5 - 2 -
29
- 24
136 233
3
4 419
19 -
12
49,918 (D)
53 - 6 -
(D)
4,744 - -
17,922 416
1
11,067 - - -
- 7 - -
60
- - -
(D) -
- 26
- 6 -
(D) 45
- - -
- -
(D) - -
(D) -
24 (D)
-
- (D)
- - -
6 110
18,351 - 7
40
- (D)
- (D)
-
24 (D)
4,746 6
(D) (D) (D)
- 1
2.2 (D)
0.3 -
4.0 -
3.6
3.0 - -
(D) 0.8
1.6 2.9
- - -
- 0.1
- -
0.9
- - -
(D) -
- 0.1
- 0.1
-
(D) (D)
- - -
- -
(D) - -
1.0 -
1.0 (D)
-
- (D)
- - -
0.1 (D) 0.6
- 0.1
0.1
- (D)
- 0.1
-
1.0 (D) 3.0 4.0
(D) (D) 3.6
- 1.6
751 507
27 - - -
15
- 10
- -
41
9 -
13 26
5
- 67
- - 3
-
13 -
66 38
- - - 7
21
1 67 85
- 26
- -
98 4
61
5 37
- - -
5 1 - - -
21 154 285
24 145
27 13
8 -
10
38 - 1 - -
- 1
15 - 9
19,185 11,541
209 - - -
(D)
- 10
- -
122
341 - 5 9 2
-
203 - -
60
- 822
- (D)
114
- - - 5
740
(D) 680
17 -
197
- -
540 8
118
(D) 30
- - -
200 (D)
- - -
23 1,384
798 1,577
292
17 5
(D) -
(D)
114 -
(D) - -
- (D) (D)
- 341
2.3 1.9
0.8 - - -
(D)
- 0.3
- -
0.3
1.6 -
0.5 0.3 0.1
-
(D)- -
0.4
- 0.6
- (D)0.3
- - -
0.2 0.5
(D)(D)3.3
- 0.3
- -
0.5 0.4 0.6
0.2 0.5
- - -
0.5 (D)
- - -
0.3 0.5 0.7 0.6 0.5
0.7 0.5 0.2
- 0.2
(D)
- (D)
- -
- (D)(D)
- 1.6
See footnote(s) at end of table. --continued

2007 CENSUS OF AGRICULTURE 2008 FRIS – GENERAL DATA 109 USDA, National Agricultural Statistics Service
Table 28. Estimated Quantity of Water Applied and Primary Method of Distribution by Selected Crops Harvested: 2008 and 2003 - Con.
[Excludes institutional, research, and experimental farms and farms with horticulture. For meaning of abbreviations and symbols, see introductory text]
Tomatoes
Primary method of distribution
Sprinkler system Gravity system Low-flow irrigation (drip, trickle, or micro sprinklers) Geographic area
Farms Irrigated
acres harvested
Average acre-feet applied per acre
Farms Acres
Average acre-feet applied per acre
Farms Acres
Average acre-feet applied per acre
Farms Acres
Average acre-feet applied per acre
United States ............................. 2008 .. 2003 .. 2008 DATA Alabama ............................................... Alaska .................................................. Arizona ................................................. Arkansas .............................................. California .............................................. Colorado ............................................... Connecticut .......................................... Delaware .............................................. Florida .................................................. Georgia ................................................ Hawaii .................................................. Idaho .................................................... Illinois ................................................... Indiana ................................................. Iowa ..................................................... Kansas ................................................. Kentucky .............................................. Louisiana .............................................. Maine ................................................... Maryland .............................................. Massachusetts ..................................... Michigan ............................................... Minnesota ............................................. Mississippi ............................................ Missouri ................................................ Montana ............................................... Nebraska .............................................. Nevada ................................................. New Hampshire .................................... New Jersey .......................................... New Mexico .......................................... New York .............................................. North Carolina ...................................... North Dakota ........................................ Ohio ..................................................... Oklahoma ............................................. Oregon ................................................. Pennsylvania ........................................ Rhode Island ........................................ South Carolina ..................................... South Dakota ....................................... Tennessee ........................................... Texas ................................................... Utah ..................................................... Vermont ................................................ Virginia ................................................. Washington .......................................... West Virginia ........................................ Wisconsin ............................................. Wyoming .............................................. Water Resources Regions Region 01 New England ....................... Region 02 Mid-Atlantic ......................... Region 03 South Atlantic-Gulf .............. Region 04 Great Lakes ........................ Region 05 Ohio .................................... Region 06 Tennessee .......................... Region 07 Upper Mississippi ................ Region 08 Lower Mississippi ................ Region 09 Souris-Red-Rainy ................ Region 10 Missouri .............................. Region 11 Arkansas-White-Red ........... Region 12 Texas-Gulf .......................... Region 13 Rio Grande ......................... Region 14 Upper Colorado ................... Region 15 Lower Colorado ................... Region 16 Great Basin ......................... Region 17 Pacific Northwest ................ Region 18 California ............................. Region 19 Alaska ................................. Region 20 Hawaii .................................
5,937 6,101
109 - -
121 1,272
193
43 8
26 129
96
- 26 92 34
56
168 107
7 73
47
315 50 66 81
9 - -
43 185
13
253 138
- 162
78
3 425
16 90
35
168 303
1 11
61
703 43 78
-
160 839 527 507 473
181 196 245
- 91
134 279
37 193
-
1 706
1,272 -
96
305,565 426,656
1,125 - -
2,349 234,041
386
70 18
37,617 2,496
852
- 27
3,979 34
39
399 58
4 426
132
6,286 75
7 56
2 - -
31 1,997
25
432 852
- 2,127
298
15 1,821
33 2,837
(D)
1,888 256 (D)
1
886 1,511
41 23
-
271 5,214
44,109 8,578 3,198
2,481 1,732 2,504
- 53
337 112 (D)
386 -
(D) 1,526
234,041 -
852
2.6 2.6
0.7 - -
1.3 2.9
2.5 0.4 0.4 2.2 0.8
1.2
- 0.4 0.6 0.3
0.1 0.4 1.0 0.3 0.7
0.5 0.7 0.3 2.5 1.0
1.1
- -
0.3 0.6
3.1 0.9 1.5
- 0.4
0.4 3.0 0.3 0.2 1.5
(D) 0.4 0.7 (D) 0.6
0.5 2.0 0.5 0.6
-
0.4 0.5 2.0 0.6 0.6
0.7 0.6 1.3
- 0.9
0.4 0.8 (D) 2.5
-
(D) 2.0 2.9
- 1.2
1,872 1,876
14 - - -
449
- 27
3 2
80
39 - -
42 6
-
40 53
7 31
21
109 45
- 38
9 - -
22 81
-
73 16
- 62
40
- 90
7 52
30 48
- - 2
29
245 21 39
-
84 246 173 219 115
40
120 63
- 39
40
- - - -
- 245 449
- 39
37,191 81,084
118 - - -
25,712
- 27 15 (D)
155
16 - -
3,873 1
-
21 53
4 180
42 (D)50
- 8
2 - -
(D)1,354
-
(D)16
- 800
290
- 1,180
22 29
10 (D)
- -
(D)
(D)74 10
5 -
102 2,974
641 3,561 1,986
121
1,641 62
- 12
290
- - - -
- 74
25,712 -
16
2.0 2.7
0.4 - - -
2.6
- 0.3 0.3 (D)0.6
1.1
- -
0.6 (D)
-
0.5 1.0 0.3 0.5
0.5 0.5 0.1
- 1.0
1.1
- -
(D)0.5
-
0.8 0.1
- 0.3
0.4
- 0.3 0.2 2.0
0.5 (D)
- -
(D)
0.6 1.0 0.5 0.9
-
0.4 0.4 1.4 0.5 0.7
0.5 0.6 0.9
- 0.6
0.4
- - - -
- 1.0 2.6
- 1.1
1,050 1,240
30 - -
61 265
193
- -
10 -
24 - - - 5
-
43 - - -
- 2 - - -
- - - 7
16
12 30
- -
19
- -
45 - -
- 10 24
1 -
8 245
- - -
7 99 40 21 43
9 5
62 - -
- -
36 193
-
1 245 265
- 24
110,093 228,001
376 - -
549 101,559
386
- -
(D) -
37 - - - 5
-
76 - - -
- (D)
- - -
- - -
15 13
25 (D)
- -
23
- -
34 - -
- (D) (D) (D)
-
8 49
- - -
15 85
7,114 28 76
(D)
5 567
- -
- -
169 386
-
(D) 49
101,559 -
37
3.0 3.1
1.0 - -
1.3 3.1
2.5
- -
(D) -
1.2 - - -
0.3
- 0.5
- - -
- (D)
- - -
- - -
0.3 (D)
(D) 1.0
- -
0.3
- -
0.3 - -
- (D) 0.7 (D)
-
(D) 2.0
- - -
0.3 0.6 2.9 0.3 0.5
(D) 0.3 1.3
- -
- -
(D) 2.5
-
(D) 2.0 3.1
- 1.2
3,015 2,985
65 - -
60 558
-
16 5
14 49
33
- 26 50 23
56 85 54
- 42
26
204 5
66 43
- - -
14 88
1
150 122
- 81
38
3 290
9 38
5
110 279
- 9
24
213 22 39
-
69 494 314 267 315
132
71 120
- 52
94
279 1 - -
- 216 558
- 33
158,281 117,571
631 - -
1,800 106,770
-
43 3
(D) 2,341
798
- 27
106 28
39
301 5 -
245
90 (D) 25
7 48
- - -
(D) 630
(D)
205 836
- 1,304
8
15 608
11 2,808
2
(D) (D)
- (D)
(D)
1,389 31 18
-
154 2,156
36,353 4,989 1,136
2,360
86 1,875
- (D)
47
112 (D)
- -
- 1,404
106,770 -
798
2.4 1.6
0.5 - -
1.3 2.8
-
0.4 0.8 2.0 0.8
1.2
- 0.4 0.7 (D)
0.1 0.3 0.5
- 0.8
0.4 0.8 (D)2.5 1.0
- - -
0.3 0.8
(D)0.9 1.5
- 0.5
0.3 3.0 0.4 0.2 1.5
0.2 0.4 0.8
- 0.5
(D)2.0 0.5 0.5
-
0.4 0.6 1.9 0.8 0.5
0.7 (D)1.3
- 0.9
0.1 0.8 (D)
- -
- 2.0 2.8
- 1.2
See footnote(s) at end of table. --continued
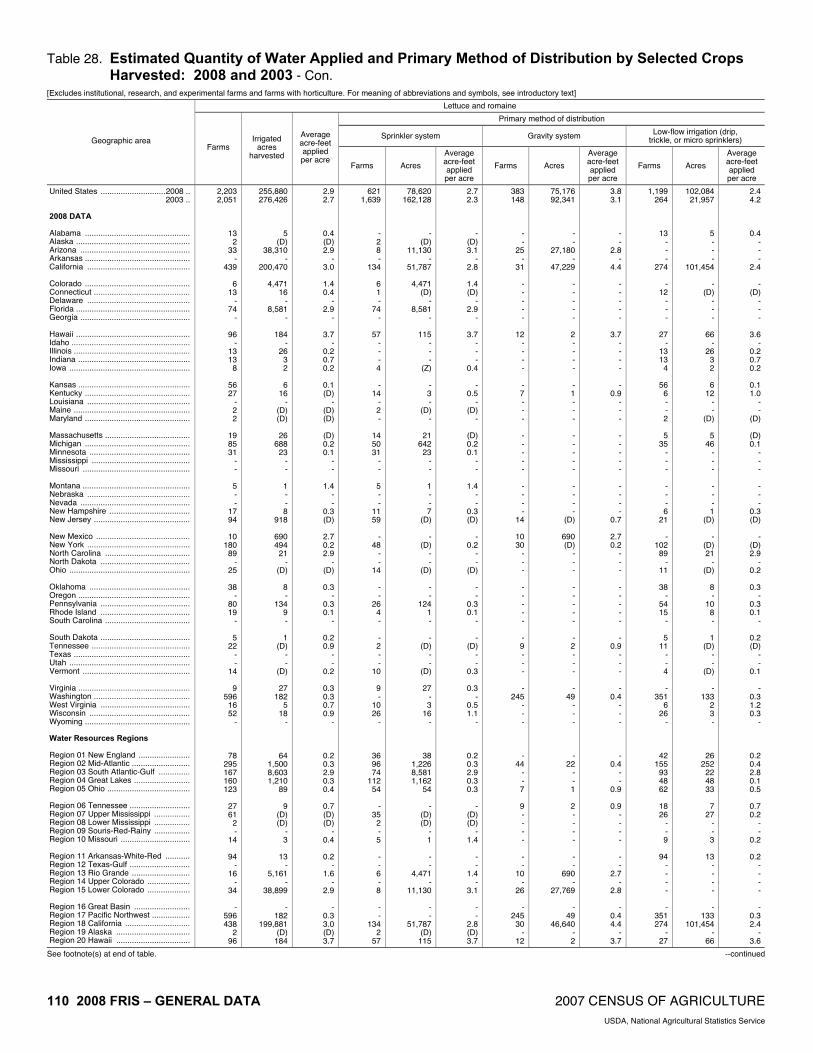
110 2008 FRIS – GENERAL DATA 2007 CENSUS OF AGRICULTURE USDA, National Agricultural Statistics Service
Table 28. Estimated Quantity of Water Applied and Primary Method of Distribution by Selected Crops Harvested: 2008 and 2003 - Con.
[Excludes institutional, research, and experimental farms and farms with horticulture. For meaning of abbreviations and symbols, see introductory text]
Lettuce and romaine
Primary method of distribution
Sprinkler system Gravity system Low-flow irrigation (drip, trickle, or micro sprinklers) Geographic area
Farms Irrigated
acres harvested
Average acre-feet applied per acre
Farms Acres
Average acre-feet applied per acre
Farms Acres
Average acre-feet applied per acre
Farms Acres
Average acre-feet applied per acre
United States .............................2008 .. 2003 .. 2008 DATA Alabama ............................................... Alaska ................................................... Arizona ................................................. Arkansas ............................................... California .............................................. Colorado ............................................... Connecticut ........................................... Delaware .............................................. Florida ................................................... Georgia ................................................. Hawaii ................................................... Idaho ..................................................... Illinois .................................................... Indiana .................................................. Iowa ...................................................... Kansas .................................................. Kentucky ............................................... Louisiana .............................................. Maine .................................................... Maryland ............................................... Massachusetts ...................................... Michigan ............................................... Minnesota ............................................. Mississippi ............................................ Missouri ................................................ Montana ................................................ Nebraska .............................................. Nevada ................................................. New Hampshire .................................... New Jersey ........................................... New Mexico .......................................... New York .............................................. North Carolina ...................................... North Dakota ........................................ Ohio ...................................................... Oklahoma ............................................. Oregon .................................................. Pennsylvania ........................................ Rhode Island ........................................ South Carolina ...................................... South Dakota ........................................ Tennessee ............................................ Texas .................................................... Utah ...................................................... Vermont ................................................ Virginia .................................................. Washington ........................................... West Virginia ........................................ Wisconsin ............................................. Wyoming ............................................... Water Resources Regions Region 01 New England ....................... Region 02 Mid-Atlantic .......................... Region 03 South Atlantic-Gulf .............. Region 04 Great Lakes ......................... Region 05 Ohio ..................................... Region 06 Tennessee ........................... Region 07 Upper Mississippi ................ Region 08 Lower Mississippi ................ Region 09 Souris-Red-Rainy ................ Region 10 Missouri ............................... Region 11 Arkansas-White-Red ........... Region 12 Texas-Gulf ........................... Region 13 Rio Grande .......................... Region 14 Upper Colorado ................... Region 15 Lower Colorado ................... Region 16 Great Basin ......................... Region 17 Pacific Northwest ................. Region 18 California ............................. Region 19 Alaska ................................. Region 20 Hawaii .................................
2,203 2,051
13 2
33 -
439
6 13
- 74
-
96 -
13 13
8
56 27
- 2 2
19 85 31
- -
5 - -
17 94
10
180 89
- 25
38
- 80 19
-
5 22
- -
14
9 596
16 52
-
78 295 167 160 123
27 61
2 -
14
94 -
16 -
34
- 596 438
2 96
255,880 276,426
5 (D)
38,310 -
200,470
4,471 16
- 8,581
-
184 -
26 3 2
6
16 -
(D) (D)
26
688 23
- -
1 - - 8
918
690 494
21 -
(D)
8 -
134 9 -
1 (D)
- -
(D)
27 182
5 18
-
64 1,500 8,603 1,210
89
9 (D) (D)
- 3
13
- 5,161
- 38,899
-
182 199,881
(D) 184
2.9 2.7
0.4 (D) 2.9
- 3.0
1.4 0.4
- 2.9
-
3.7 -
0.2 0.7 0.2
0.1 (D)
- (D) (D)
(D) 0.2 0.1
- -
1.4 - -
0.3 (D)
2.7 0.2 2.9
- (D)
0.3
- 0.3 0.1
-
0.2 0.9
- -
0.2
0.3 0.3 0.7 0.9
-
0.2 0.3 2.9 0.3 0.4
0.7 (D) (D)
- 0.4
0.2
- 1.6
- 2.9
-
0.3 3.0 (D) 3.7
621 1,639
- 2 8 -
134
6 1 -
74 -
57 - - - 4
-
14 - 2 -
14 50 31
- -
5 - -
11 59
-
48 - -
14
- -
26 4 -
- 2 - -
10
9 -
10 26
-
36 96 74
112 54
-
35 2 - 5
- - 6 - 8
- -
134 2
57
78,620 162,128
- (D)
11,130 -
51,787
4,471 (D)
- 8,581
-
115 - - -
(Z)
- 3 -
(D)-
21 642
23 - -
1 - - 7
(D)
- (D)
- -
(D)
- -
124 1 -
- (D)
- -
(D)
27 - 3
16 -
38 1,226 8,581 1,162
54
- (D)(D)
- 1
- -
4,471 -
11,130
- -
51,787 (D)
115
2.7 2.3
- (D)3.1
- 2.8
1.4 (D)
- 2.9
-
3.7 - - -
0.4
- 0.5
- (D)
-
(D)0.2 0.1
- -
1.4 - -
0.3 (D)
-
0.2 - -
(D)
- -
0.3 0.1
-
- (D)
- -
0.3
0.3 -
0.5 1.1
-
0.2 0.3 2.9 0.3 0.3
-
(D)(D)
- 1.4
- -
1.4 -
3.1
- -
2.8 (D)3.7
383 148
- -
25 -
31
- - - - -
12 - - - -
- 7 - - -
- - - - -
- - - -
14
10 30
- - -
- - - - -
- 9 - - -
- 245
- - -
- 44
- - 7
9 - - - -
- -
10 -
26
- 245
30 -
12
75,176 92,341
- -
27,180 -
47,229
- - - - -
2 - - - -
- 1 - - -
- - - - -
- - - -
(D)
690 (D)
- - -
- - - - -
- 2 - - -
- 49
- - -
- 22
- - 1
2 - - - -
- -
690 -
27,769
- 49
46,640 - 2
3.8 3.1
- -
2.8 -
4.4
- - - - -
3.7 - - - -
- 0.9
- - -
- - - - -
- - - -
0.7
2.7 0.2
- - -
- - - - -
- 0.9
- - -
- 0.4
- - -
- 0.4
- -
0.9
0.9 - - - -
- -
2.7 -
2.8
- 0.4 4.4
- 3.7
1,199 264
13 - - -
274
- 12
- - -
27 -
13 13
4
56 6 - - 2
5
35 - - -
- - - 6
21
- 102
89 -
11
38 -
54 15
-
5 11
- - 4
-
351 6
26 -
42 155
93 48 62
18 26
- - 9
94
- - - -
- 351 274
- 27
102,084 21,957
5 - - -
101,454
- (D)
- - -
66 -
26 3 2
6
12 - -
(D)
5 46
- - -
- - - 1
(D)
- (D) 21
- (D)
8 -
10 8 -
1 (D)
- -
(D)
- 133
2 3 -
26 252
22 48 33
7
27 - - 3
13
- - - -
- 133
101,454 -
66
2.4 4.2
0.4 - - -
2.4
- (D)
- - -
3.6 -
0.2 0.7 0.2
0.1 1.0
- -
(D)
(D)0.1
- - -
- - -
0.3 (D)
-
(D)2.9
- 0.2
0.3
- 0.3 0.1
-
0.2 (D)
- -
0.1
- 0.3 1.2 0.3
-
0.2 0.4 2.8 0.1 0.5
0.7 0.2
- -
0.2
0.2 - - - -
- 0.3 2.4
- 3.6
See footnote(s) at end of table. --continued

2007 CENSUS OF AGRICULTURE 2008 FRIS – GENERAL DATA 111 USDA, National Agricultural Statistics Service
Table 28. Estimated Quantity of Water Applied and Primary Method of Distribution by Selected Crops Harvested: 2008 and 2003 - Con.
[Excludes institutional, research, and experimental farms and farms with horticulture. For meaning of abbreviations and symbols, see introductory text]
Potatoes
Primary method of distribution
Sprinkler system Gravity system Low-flow irrigation (drip, trickle, or micro sprinklers) Geographic area
Farms Irrigated
acres harvested
Average acre-feet applied per acre
Farms Acres
Average acre-feet applied per acre
Farms Acres
Average acre-feet applied per acre
Farms Acres
Average acre-feet applied per acre
United States ............................. 2008 .. 2003 .. 2008 DATA Alabama ............................................... Alaska .................................................. Arizona ................................................. Arkansas .............................................. California .............................................. Colorado ............................................... Connecticut .......................................... Delaware .............................................. Florida .................................................. Georgia ................................................ Hawaii .................................................. Idaho .................................................... Illinois ................................................... Indiana ................................................. Iowa ..................................................... Kansas ................................................. Kentucky .............................................. Louisiana .............................................. Maine ................................................... Maryland .............................................. Massachusetts ..................................... Michigan ............................................... Minnesota ............................................. Mississippi ............................................ Missouri ................................................ Montana ............................................... Nebraska .............................................. Nevada ................................................. New Hampshire .................................... New Jersey .......................................... New Mexico .......................................... New York .............................................. North Carolina ...................................... North Dakota ........................................ Ohio ..................................................... Oklahoma ............................................. Oregon ................................................. Pennsylvania ........................................ Rhode Island ........................................ South Carolina ..................................... South Dakota ....................................... Tennessee ........................................... Texas ................................................... Utah ..................................................... Vermont ................................................ Virginia ................................................. Washington .......................................... West Virginia ........................................ Wisconsin ............................................. Wyoming .............................................. Water Resources Regions Region 01 New England ....................... Region 02 Mid-Atlantic ......................... Region 03 South Atlantic-Gulf .............. Region 04 Great Lakes ........................ Region 05 Ohio .................................... Region 06 Tennessee .......................... Region 07 Upper Mississippi ................ Region 08 Lower Mississippi ................ Region 09 Souris-Red-Rainy ................ Region 10 Missouri .............................. Region 11 Arkansas-White-Red ........... Region 12 Texas-Gulf .......................... Region 13 Rio Grande ......................... Region 14 Upper Colorado ................... Region 15 Lower Colorado ................... Region 16 Great Basin ......................... Region 17 Pacific Northwest ................ Region 18 California ............................. Region 19 Alaska ................................. Region 20 Hawaii .................................
3,727 3,126
13 3 4 -
122
137 20
8 45
103
24 520
15 22 11
-
55 53 14 18
14
226 127
- 121
66 86
3 15 99
3
62 117
30 25
78
192 132
5 97
33 37
8 2
10
28 720
14 183
7
76 318 386 356
99
35 257
60 40
266
117 8
117 2 4
14
1,382 163
3 24
974,606 1,032,155
10 (D)
2,421 -
43,304
53,878 12
1,283 26,343
62
2 286,937
(D) 639 287
-
48 53 (D)
724
14 42,363 37,642
- 9,927
11,943
145,814 (D)
7 1,156
(D)
2,094 65
28,353 30
684
46,806 2,382
(D) 58
10 25
5,083 (D)
1
3,080 142,357
5 57,287
2,975
2,619 9,120
26,552 55,030
1,202
21 75,319
9,915 (D)
177,037
4,654 1,214
52,543 (D)
2,421
12,593 465,108 46,868
(D) 2
1.8 1.8
1.0 (D)2.8
- 2.8
1.8 0.5 0.8 1.1 0.9
0.1 2.2 (D)0.5 1.2
-
1.0 1.0 0.1 0.7
0.1 0.9 0.8
- 1.4
1.2 1.1 (D)0.3 0.3
(D)0.4 2.5 1.0 2.8
0.6 2.3 0.5 (D)1.0
0.6 0.3 2.0 (D)(D)
0.3 2.3 0.7 1.0 1.5
0.1 0.5 1.2 0.9 0.6
0.3 0.9 1.4 0.8 1.1
(D)1.8 1.8 (D)2.8
1.9 2.3 2.8 (D)0.1
2,713 2,670
9 3 2 -
68
137 10
8 4
51
12 507
2 9
11
- 28 53 14 15
14
166 126
- 83
66 86
3 9
61
2 32 32 30 23
40
189 74
5 52
28 18
8 2 2
28
410 4
170 7
52 184 159 283
52
16 244
60 39
223
79 7
117 2 2
14
1,056 109
3 12
939,463 947,838
9 (D) (D)
- 43,293
53,878
10 1,283
(D) 10
1
284,657 (D)
636 287
-
27 53 (D)
721
14 42,304
(D) -
9,908
11,943 145,814
(D) (D)
1,118
(D) 2,049
48 28,353
(D)
680 (D)
2,367 (D) 13
9
13 5,083
(D) (D)
3,080
(D) 2
57,281 2,975
2,615 9,018 1,444
54,965 1,170
9
75,316 9,915
(D) 177,017
4,650
(D) 52,543
(D) (D)
12,593
456,223 46,857
(D) 1
1.8 1.8
1.0 (D)(D)
- 2.8
1.8 0.5 0.8 (D)1.3
0.1 2.2 (D)0.5 1.2
-
1.1 1.0 0.1 0.7
0.1 0.9 (D)
- 1.4
1.2 1.1 (D)(D)0.3
(D)0.4 3.4 1.0 (D)
0.6 (D)0.5 (D)1.8
0.7 0.2 2.0 (D)(D)
0.3 (D)0.2 1.0 1.5
0.1 0.5 1.1 0.9 0.6
0.2 0.9 1.4 (D)1.1
(D)(D)1.8 (D)(D)
1.9 2.3 2.8 (D)0.1
486 243
4 - 2 - -
- - -
39 52
12
4 - - -
- 14
- - -
- - 1 - -
- - - -
14
1 30
- - -
- 3 - - -
- - - - -
- 310
- - -
- 44 95
- 14
- - - 1 -
- 1 - - 2
-
317 - -
12
31,509 83,658
1 -
(D) - -
- - -
23,413 52
1
480 - - -
- 2 - - -
- -
(D) - -
- - - -
14
(D) 45
- - -
- (D)
- - -
- - - - -
- (D)
- - -
- 59
23,466 - 2
- - -
(D) -
- (D)
- -
(D)
- 7,085
- - 1
1.5 1.9
1.0 -
(D) - -
- - -
1.2 0.8
0.1 4.0
- - -
- 0.4
- - -
- -
(D) - -
- - - -
0.7
(D) 0.5
- - -
- (D)
- - -
- - - - -
- (D)
- - -
- 0.5 1.2
- 0.4
- - -
(D) -
- (D)
- -
(D)
- 2.6
- -
0.1
528 (NA)
- - - -
54
- 10
- 2 -
- 9
13 13
-
- 13
- - 3
-
60 - -
38
- - - 6
24
- -
85 - 2
38
- 58
- 45
5
19 - - 8
- -
10 13
-
24 90
132 73 33
19 13
- -
43
38 - - - -
- 9
54 - -
3,634 (NA)
- - - -
11
- 2 -
(D)-
- 1,800
3 3 -
- 19
- - 3
-
59 - -
19
- - -
(D)24
- -
17 -
(D)
4 -
16 -
45
1 12
- -
(D)
- - 3 7 -
4 44
1,642 66 30
12
3 - -
20
4 - - - -
- 1,800
11 - -
1.5 (NA)
- - - -
2.0
- 0.3
- (D)
-
- 2.0 0.5 0.7
-
- 0.8
- -
0.6
- 0.3
- -
1.0
- - -
0.3 0.3
- -
0.1 -
(D)
1.1 -
0.6 -
0.8
0.1 0.4
- -
0.1
- -
1.0 0.2
-
0.2 0.5 1.1 0.3 1.2
0.4 0.5
- -
1.0
1.1 - - - -
- 2.0 2.0
- -
See footnote(s) at end of table. --continued

112 2008 FRIS – GENERAL DATA 2007 CENSUS OF AGRICULTURE USDA, National Agricultural Statistics Service
Table 28. Estimated Quantity of Water Applied and Primary Method of Distribution by Selected Crops Harvested: 2008 and 2003 - Con.
[Excludes institutional, research, and experimental farms and farms with horticulture. For meaning of abbreviations and symbols, see introductory text]
All berries
Primary method of distribution
Sprinkler system Gravity system Low-flow irrigation (drip, trickle, or micro sprinklers) Geographic area
Farms Irrigated
acres harvested
Average acre-feet applied per acre
Farms Acres
Average acre-feet applied per acre
Farms Acres
Average acre-feet applied per acre
Farms Acres
Average acre-feet applied per acre
United States .............................2008 .. 2003 .. 2008 DATA Alabama ............................................... Alaska ................................................... Arizona ................................................. Arkansas ............................................... California .............................................. Colorado ............................................... Connecticut ........................................... Delaware .............................................. Florida ................................................... Georgia ................................................. Hawaii ................................................... Idaho ..................................................... Illinois .................................................... Indiana .................................................. Iowa ...................................................... Kansas .................................................. Kentucky ............................................... Louisiana .............................................. Maine .................................................... Maryland ............................................... Massachusetts ...................................... Michigan ............................................... Minnesota ............................................. Mississippi ............................................ Missouri ................................................ Montana ................................................ Nebraska .............................................. Nevada ................................................. New Hampshire .................................... New Jersey ........................................... New Mexico .......................................... New York .............................................. North Carolina ...................................... North Dakota ........................................ Ohio ...................................................... Oklahoma ............................................. Oregon .................................................. Pennsylvania ........................................ Rhode Island ........................................ South Carolina ...................................... South Dakota ........................................ Tennessee ............................................ Texas .................................................... Utah ...................................................... Vermont ................................................ Virginia .................................................. Washington ........................................... West Virginia ........................................ Wisconsin ............................................. Wyoming ............................................... Water Resources Regions Region 01 New England ....................... Region 02 Mid-Atlantic .......................... Region 03 South Atlantic-Gulf .............. Region 04 Great Lakes ......................... Region 05 Ohio ..................................... Region 06 Tennessee ........................... Region 07 Upper Mississippi ................ Region 08 Lower Mississippi ................ Region 09 Souris-Red-Rainy ................ Region 10 Missouri ............................... Region 11 Arkansas-White-Red ........... Region 12 Texas-Gulf ........................... Region 13 Rio Grande .......................... Region 14 Upper Colorado ................... Region 15 Lower Colorado ................... Region 16 Great Basin ......................... Region 17 Pacific Northwest ................. Region 18 California ............................. Region 19 Alaska ................................. Region 20 Hawaii .................................
9,021 7,961
111 3 - -
1,138
- 44
9 612 351
12
1 61 40 23
-
106 53
114 47
545 451 132
65 38
- - -
52 199
-
218 385
7 116
76
1,082 311
10 80
-
157 558
84 38
122
1,107 46
417 -
776 765
1,598 669 367
140 554
74 -
17
76 558
- - -
84 2,190 1,138
3 12
222,857 225,475
394 3 - -
74,362
- 143
57 10,184 23,967
1
(D) 145 336
98
- 179
53 8,082
120
13,883 16,054
798 1,950
4
- - -
119 11,391
-
1,195 8,110
105 373
114
17,275 776 136 228
-
314 4,046
84 208
567 (D)
113 21,444
-
22,476 13,124 44,923 17,316
1,162
246 22,055
111 -
111
114 4,046
- - -
84 22,724 74,362
3 1
2.2 2.1
2.4 0.3
- -
3.7
- 0.8 0.8 2.4 1.5
0.1 (D) 0.2 0.4 1.6
-
0.7 1.0 0.4 1.1
1.4 0.7 0.9 0.8 0.1
- - -
(D) 1.7
-
0.6 1.2 1.0 1.1
1.6 0.7 0.7 (D) 2.3
-
0.5 1.6 1.7 0.7
0.7 (D) 0.5 2.9
-
1.0 1.6 1.6 0.7 0.7
0.6 2.8 1.1
- 1.0
1.6 1.6
- - -
1.7 0.7 3.7 0.3 0.1
4,510 4,052
38 3 - -
790
- 10
5 68
126
12 1
14 26
9
- 46 53 82
5
523 260 115
- 38
- - -
20 80
-
84 167
- 50
-
539 98
5 5
-
40 279
- 14
42
501 24
338 -
647 269 392 373 156
32
446 70
- -
- 279
- - -
- 1,041
790 3
12
108,732 110,421
76 3 - -
237
- 107
41 1,530
17,962
1 (D)83
273 60
-
59 53
7,989 17
13,581 12,469
735 - 4
- - -
32 6,719
-
692 6,931
- 202
-
12,764 455 119
65
- 90
3,906 -
125
5 (D)61
19,104 -
21,938 7,343
26,550 (D)
771
63 19,604
(D)- -
- 3,906
- - -
- 14,947
237 3 1
1.5 2.4
1.3 0.3
- -
2.5
- 1.0 1.0 2.3 1.6
0.1 (D)0.3 0.5 2.0
-
0.9 1.0 0.4 1.6
1.4 0.7 0.9
- 0.1
- - -
(D)1.5
-
0.5 1.3
- 1.0
-
0.6 0.7 (D)5.2
-
(D)1.6
- 0.7
0.8 (D)0.4 3.0
-
1.0 1.4 1.6 0.7 0.7
0.6 2.9 1.2
- -
- 1.6
- - -
- 0.6 2.5 0.3 0.1
502 188
4 - - - 4
- - - - -
- - - - -
- 6 - - -
7 - - - -
- - - 4
20
- 33
- - 2
- -
23 - -
- 22
- 84
-
8 245
- 40
-
11 84
- 2 6
24 40
2 - -
- - - - -
84 245
4 - -
10,221 7,003
4 - - -
7,200
- - - - -
- - - - -
- 18
- - -
98 - - - -
- - -
12 744
-
21 - -
(D)
- -
(D) - -
- 15
- 84
-
128 49
- 1,800
-
110 905
- (D) 18
11
1,800 (D)
- -
- - - - -
84 49
7,200 - -
2.8 3.6
2.4 - - -
3.0
- - - - -
- - - - -
- 0.4
- - -
(D) - - - -
- - -
0.1 2.9
-
0.7 - -
(D)
- -
0.8 - -
- (D)
- 1.7
-
0.6 1.5
- 2.5
-
(D) 2.5
- (D) 0.4
1.4 2.5 (D)
- -
- - - - -
1.7 1.5 3.0
- -
4,009 3,721
69 - - -
344
- 34
4 544 225
- -
47 14 14
-
54 -
32 42
15
191 17 65
-
- - -
28 99
-
101 218
7 64
76
543 190
5 75
-
95 279
- 24
72
361 22 39
-
118 412
1,206 294 205
84 68
2 -
17
76 279
- - -
- 904 344
- -
103,904 108,051
314 - - -
66,925
- 36 16
8,654 6,006
- -
62 63 38
-
102 -
93 103
204
3,585 63
1,950 -
- - -
75 3,928
-
482 1,179
105 136
114
4,511 310
17 163
-
209 140
- 83
434
3,217 52
540 -
428 4,877
18,373 (D)
373
171 651 (D)
- 111
114 140
- - -
- 7,728
66,925 - -
2.9 1.7
2.6 - - -
3.8
- 0.3 0.4 2.4 1.0
- -
0.2 0.1 1.0
-
0.6 -
0.1 1.1
(D)0.6 0.9 0.8
-
- - -
0.5 2.0
-
0.6 0.4 1.0 (D)
1.6 1.0 0.6 0.2 1.1
-
0.5 1.1
- 0.6
0.7 0.8 0.5 1.0
-
(D)1.7 1.7 0.6 0.7
0.6 (D)(D)
- 1.0
1.6 1.1
- - -
- 0.9 3.8
- -
See footnote(s) at end of table. --continued

2007 CENSUS OF AGRICULTURE 2008 FRIS – GENERAL DATA 113 USDA, National Agricultural Statistics Service
Table 28. Estimated Quantity of Water Applied and Primary Method of Distribution by Selected Crops Harvested: 2008 and 2003 - Con.
[Excludes institutional, research, and experimental farms and farms with horticulture. For meaning of abbreviations and symbols, see introductory text]
Land in orchards, vineyards, and nut trees
Primary method of distribution
Sprinkler system Gravity system Low-flow irrigation (drip, trickle, or micro sprinklers) Geographic area
Farms Irrigated
acres harvested
Average acre-feet applied per acre
Farms Acres
Average acre-feet applied per acre
Farms Acres
Average acre-feet applied per acre
Farms Acres
Average acre-feet applied per acre
United States ............................. 2008 .. 2003 .. 2008 DATA Alabama ............................................... Alaska .................................................. Arizona ................................................. Arkansas .............................................. California .............................................. Colorado ............................................... Connecticut .......................................... Delaware .............................................. Florida .................................................. Georgia ................................................ Hawaii .................................................. Idaho .................................................... Illinois ................................................... Indiana ................................................. Iowa ..................................................... Kansas ................................................. Kentucky .............................................. Louisiana .............................................. Maine ................................................... Maryland .............................................. Massachusetts ..................................... Michigan ............................................... Minnesota ............................................. Mississippi ............................................ Missouri ................................................ Montana ............................................... Nebraska .............................................. Nevada ................................................. New Hampshire .................................... New Jersey .......................................... New Mexico .......................................... New York .............................................. North Carolina ...................................... North Dakota ........................................ Ohio ..................................................... Oklahoma ............................................. Oregon ................................................. Pennsylvania ........................................ Rhode Island ........................................ South Carolina ..................................... South Dakota ....................................... Tennessee ........................................... Texas ................................................... Utah ..................................................... Vermont ................................................ Virginia ................................................. Washington .......................................... West Virginia ........................................ Wisconsin ............................................. Wyoming .............................................. Water Resources Regions Region 01 New England ....................... Region 02 Mid-Atlantic ......................... Region 03 South Atlantic-Gulf .............. Region 04 Great Lakes ........................ Region 05 Ohio .................................... Region 06 Tennessee .......................... Region 07 Upper Mississippi ................ Region 08 Lower Mississippi ................ Region 09 Souris-Red-Rainy ................ Region 10 Missouri .............................. Region 11 Arkansas-White-Red ........... Region 12 Texas-Gulf .......................... Region 13 Rio Grande ......................... Region 14 Upper Colorado ................... Region 15 Lower Colorado ................... Region 16 Great Basin ......................... Region 17 Pacific Northwest ................ Region 18 California ............................. Region 19 Alaska ................................. Region 20 Hawaii .................................
57,184 57,820
155 3
670 180
32,651
772 43
- 3,887
721
480 420
48 20 14
31 40
232 32 49
27
327 94
131 38
145 240
64 18 83
2,896
150 172
12 58
249
1,525 249
24 209
2
78 3,026
829 18
240
5,659 21
145 7
146 581
5,264 529 147
96
204 373
7 289
997
2,919 2,604
666 754
786
7,688 32,651
3 480
3,733,339 4,098,357
1,286 9
30,745 420
2,546,785
2,123 262
- 522,632 79,780
6,653 8,403
525 249
72
304 270
1,855 633 664
427
12,519 1,003
530 2,090
290 720 589
58 4,273
68,806
5,413 2,153
39 977
1,531
33,404 3,251
158 9,843
(D)
434 87,682
4,602 159
1,169
286,697 118 651
70
1,562 11,324
615,299 16,466
1,044
1,684 1,947 2,097
14 1,191
6,919
64,851 89,177
2,849 30,787
4,316
328,367 2,546,785
9 6,653
2.4 2.2
0.8 0.3 5.9 0.1 2.6
0.8 0.3
- 1.5 1.2
2.4 1.6 0.4 2.3 0.1
1.5 (D) 0.9 0.2 0.6
3.3 0.5 0.4 0.7 0.1
0.8 2.3 4.8 0.3 0.5
3.6 0.6 0.4 2.0 0.3
1.7 1.3 0.3 0.8 0.8
(D) 0.4 2.8 1.9 0.3
0.7 2.5 0.9 0.5 1.0
1.1 0.5 1.4 0.4 1.0
0.4 0.6 0.8 1.5 1.9
1.2 2.1 3.9 1.5 5.9
2.1 2.4 2.6 0.3 2.4
18,487 14,016
54 3
221 60
8,802
193 4 -
892 80
130 350
1 19
4
- 20
232 5 3
25 67 50
- -
- - -
12 22
1,055
27 125
12 22
52
1,337 62 12 12
-
29 572 382
-
41 3,443
14 41
-
58 121
1,140 131
59
41 82
303 7 5
58
574 1,046
278 221
298
5,130 8,802
3 130
675,139 966,764
735 9
2,384 120
364,920
772 6 -
19,766 28,176
1,116 3,899
(D)(D)
2
- 122
1,855 471
3
(D)2,498
583 - -
- - -
(D)(D)
4,423 2,637 1,105
39 75
375
24,071 838
42 8,289
-
179 3,280 4,185
-
111 195,273
(D)109
-
659 4,130
56,928 3,986
473
1,303 921
1,994 14 25
975
3,760 3,119 2,256 2,384
2,925
223,243 364,920
9 1,116
2.4 2.4
0.9 0.3 5.7 0.1 2.7
0.4 0.4
- 1.0 1.2
0.6 2.3 (D)2.3 0.4
-
(D)0.9 0.2 0.3
(D)0.5 0.4
- -
- - -
(D)0.6
2.2 0.6 0.2 2.0 0.3
1.1 1.4 0.3 0.6 0.8
-
(D)0.9 1.9
-
1.0 2.7 0.8 0.4
-
0.4 0.5 1.1 0.4 1.7
0.5 0.8 0.9 1.5 2.3
2.6 1.3 1.6 1.5 5.7
1.9 2.6 2.7 0.3 0.6
10,044 13,725
28 -
218 -
6,179
579 - -
222 4
54
- 13
- -
- 8 - - -
- 25
- 1 -
- 240
13 - 2
1,271
- - - -
42 14 25
- -
- 2
724 309
5
41 7 5
13 -
- 78
254 38 21
- - 3 -
240
297 628
1,303 388 302
238
21 6,179
- 54
579,845 830,415
94 -
19,955 -
423,632
1,351 - -
8,697 2,800
814
- (D)
- -
- 100
- - -
- 250
- (D)
-
- 720 520
- (D)
50,858
- - - -
153 28
117 - -
- (D)
68,016 279
15
328 290 (D) (D)
-
- 1,206
11,591 276 139
- -
18 -
720
1,235 45,550 73,000
593 19,997
757 318
423,632 -
814
2.9 2.8
0.8 -
6.5 -
2.6
1.0 - -
1.7 1.2
2.5
- (D)
- -
- 0.3
- - -
- 0.4
- (D)
-
- 2.3 5.0
- (D)
3.9
- - - -
3.5 2.2 0.2
- -
- (D) 3.5 1.7 0.1
1.5 3.3 (D) 0.5
-
- 0.7 1.6 0.4 0.3
- -
0.6 -
2.3
1.8 2.7 4.2 1.4 6.5
3.8 3.2 2.6
- 2.5
28,653 30,079
73 -
231 120
17,670
- 39
- 2,773
637
296 70 34
1 10
31 12
- 27 46
2
235 44
130 38
145
- 51
6 59
570 123
47 -
36
155 174 162
12 197
2
47 1,730
138 13
158
2,209 2
91 7
88 382
3,870 360
67
55 122
67 -
44
642 1,717
255 -
231
250 2,537
17,670 -
296
2,478,355 2,301,178
457 -
8,406 300
1,758,233
- 256
- 494,169 48,804
4,723 4,504
(D) (D) 70
304
48 -
162 661
(D)
9,771 421 (D)
2,090
290 -
69 (D) (D)
13,525
2,776 1,048
- 903
1,003 9,305 2,296
116 1,554
(D)
248 16,386
138 144
731
91,134 (D)
517 70
903 5,989
546,780 12,204
432
382 1,026
85 -
446
4,709 15,541 13,058
- 8,406
634
104,806 1,758,233
- 4,723
2.3 1.8
0.5 -
4.5 0.1 2.6
-
0.3 -
1.5 1.3
2.9 1.0 0.4 (D)0.1
1.5 0.6
- 0.1 0.6
(D)0.5 0.4 (D)0.1
0.8
- 3.2 (D)(D)
2.9 0.5 0.5
- 0.3
1.6 1.2 0.4 0.9 0.6
(D)0.3 0.4 0.6 0.4
0.4 2.0 (D)0.5 1.0
1.6 0.4 1.4 0.5 0.5
0.3 0.5 0.3
- 1.3
0.8 0.3 2.9
- 4.5
0.6 1.9 2.6
- 2.9
See footnote(s) at end of table. --continued
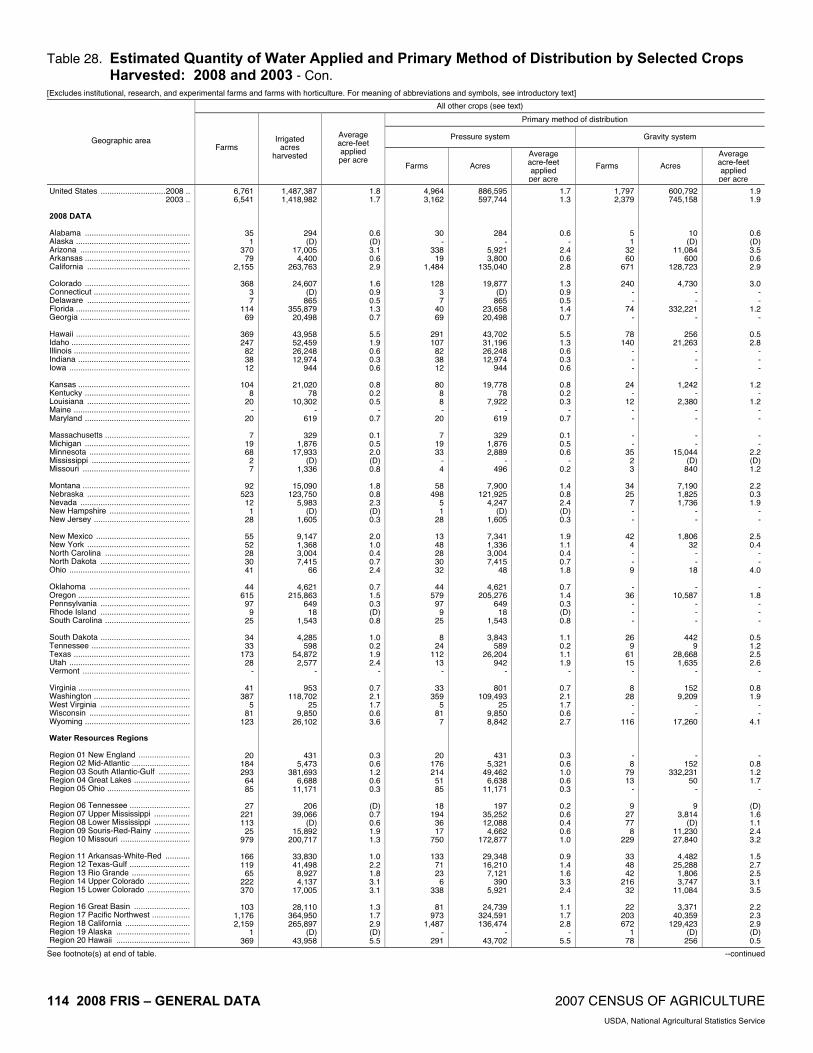
114 2008 FRIS – GENERAL DATA 2007 CENSUS OF AGRICULTURE USDA, National Agricultural Statistics Service
Table 28. Estimated Quantity of Water Applied and Primary Method of Distribution by Selected Crops Harvested: 2008 and 2003 - Con.
[Excludes institutional, research, and experimental farms and farms with horticulture. For meaning of abbreviations and symbols, see introductory text]
All other crops (see text)
Primary method of distribution
Pressure system Gravity system Geographic area Farms
Irrigated acres
harvested
Average acre-feet applied per acre
Farms Acres
Averageacre-feet applied per acre
Farms Acres
Averageacre-feet applied per acre
United States .............................2008 .. 2003 .. 2008 DATA Alabama ............................................... Alaska ................................................... Arizona ................................................. Arkansas ............................................... California .............................................. Colorado ............................................... Connecticut ........................................... Delaware .............................................. Florida ................................................... Georgia ................................................. Hawaii ................................................... Idaho ..................................................... Illinois .................................................... Indiana .................................................. Iowa ...................................................... Kansas .................................................. Kentucky ............................................... Louisiana .............................................. Maine .................................................... Maryland ............................................... Massachusetts ...................................... Michigan ............................................... Minnesota ............................................. Mississippi ............................................ Missouri ................................................ Montana ................................................ Nebraska .............................................. Nevada ................................................. New Hampshire .................................... New Jersey ........................................... New Mexico .......................................... New York .............................................. North Carolina ...................................... North Dakota ........................................ Ohio ...................................................... Oklahoma ............................................. Oregon .................................................. Pennsylvania ........................................ Rhode Island ........................................ South Carolina ...................................... South Dakota ........................................ Tennessee ............................................ Texas .................................................... Utah ...................................................... Vermont ................................................ Virginia .................................................. Washington ........................................... West Virginia ........................................ Wisconsin ............................................. Wyoming ............................................... Water Resources Regions Region 01 New England ....................... Region 02 Mid-Atlantic .......................... Region 03 South Atlantic-Gulf .............. Region 04 Great Lakes ......................... Region 05 Ohio ..................................... Region 06 Tennessee ........................... Region 07 Upper Mississippi ................ Region 08 Lower Mississippi ................ Region 09 Souris-Red-Rainy ................ Region 10 Missouri ............................... Region 11 Arkansas-White-Red ........... Region 12 Texas-Gulf ........................... Region 13 Rio Grande .......................... Region 14 Upper Colorado ................... Region 15 Lower Colorado ................... Region 16 Great Basin ......................... Region 17 Pacific Northwest ................. Region 18 California ............................. Region 19 Alaska ................................. Region 20 Hawaii .................................
6,761 6,541
35 1
370 79
2,155
368 3 7
114 69
369 247
82 38 12
104
8 20
- 20
7
19 68
2 7
92
523 12
1 28
55 52 28 30 41
44
615 97
9 25
34 33
173 28
-
41 387
5 81
123
20 184 293
64 85
27
221 113
25 979
166 119
65 222 370
103
1,176 2,159
1 369
1,487,387 1,418,982
294 (D)
17,005 4,400
263,763
24,607 (D)
865 355,879 20,498
43,958 52,459 26,248 12,974
944
21,020 78
10,302 -
619
329 1,876
17,933 (D)
1,336
15,090 123,750
5,983 (D)
1,605
9,147 1,368 3,004 7,415
66
4,621 215,863
649 18
1,543
4,285 598
54,872 2,577
-
953 118,702
25 9,850
26,102
431 5,473
381,693 6,688
11,171
206 39,066
(D) 15,892
200,717
33,830 41,498
8,927 4,137
17,005
28,110 364,950 265,897
(D) 43,958
1.8 1.7
0.6 (D)3.1 0.6 2.9
1.6 0.9 0.5 1.3 0.7
5.5 1.9 0.6 0.3 0.6
0.8 0.2 0.5
- 0.7
0.1 0.5 2.0 (D)0.8
1.8 0.8 2.3 (D)0.3
2.0 1.0 0.4 0.7 2.4
0.7 1.5 0.3 (D)0.8
1.0 0.2 1.9 2.4
-
0.7 2.1 1.7 0.6 3.6
0.3 0.6 1.2 0.6 0.3
(D)0.7 0.6 1.9 1.3
1.0 2.2 1.8 3.1 3.1
1.3 1.7 2.9 (D)5.5
4,964 3,162
30 -
338 19
1,484
128 3 7
40 69
291 107
82 38 12
80
8 8 -
20
7 19 33
- 4
58
498 5 1
28
13 48 28 30 32
44
579 97
9 25
8
24 112
13 -
33 359
5 81
7
20 176 214
51 85
18
194 36 17
750
133 71 23
6 338
81
973 1,487
- 291
886,595 597,744
284 -
5,921 3,800
135,040
19,877 (D)
865 23,658 20,498
43,702 31,196 26,248 12,974
944
19,778 78
7,922 -
619
329 1,876 2,889
- 496
7,900
121,925 4,247
(D)1,605
7,341 1,336 3,004 7,415
48
4,621 205,276
649 18
1,543
3,843 589
26,204 942
-
801 109,493
25 9,850 8,842
431 5,321
49,462 6,638
11,171
197 35,252 12,088
4,662 172,877
29,348 16,210
7,121 390
5,921
24,739 324,591 136,474
- 43,702
1.7 1.3
0.6 -
2.4 0.6 2.8
1.3 0.9 0.5 1.4 0.7
5.5 1.3 0.6 0.3 0.6
0.8 0.2 0.3
- 0.7
0.1 0.5 0.6
- 0.2
1.4 0.8 2.4 (D) 0.3
1.9 1.1 0.4 0.7 1.8
0.7 1.4 0.3 (D) 0.8
1.1 0.2 1.1 1.9
-
0.7 2.1 1.7 0.6 2.7
0.3 0.6 1.0 0.6 0.3
0.2 0.6 0.4 0.6 1.0
0.9 1.4 1.6 3.3 2.4
1.1 1.7 2.8
- 5.5
1,797 2,379
5 1
32 60
671
240 - -
74 -
78 140
- - -
24 -
12 - -
- -
35 2 3
34 25
7 - -
42 4 - - 9
-
36 - - -
26 9
61 15
-
8 28
- -
116
- 8
79 13
-
9 27 77
8 229
33 48 42
216 32
22
203 672
1 78
600,792 745,158
10 (D)
11,084 600
128,723
4,730 - -
332,221 -
256 21,263
- - -
1,242 -
2,380 - -
- -
15,044 (D)
840
7,190 1,825 1,736
- -
1,806 32
- -
18
- 10,587
- - -
442 9
28,668 1,635
-
152 9,209
- -
17,260
- 152
332,231 50
-
9 3,814
(D)11,230 27,840
4,482
25,288 1,806 3,747
11,084
3,371 40,359
129,423 (D)
256
1.9 1.9
0.6 (D)3.5 0.6 2.9
3.0
- -
1.2 -
0.5 2.8
- - -
1.2 -
1.2 - -
- -
2.2 (D)1.2
2.2 0.3 1.9
- -
2.5 0.4
- -
4.0
- 1.8
- - -
0.5 1.2 2.5 2.6
-
0.8 1.9
- -
4.1
- 0.8 1.2 1.7
-
(D)1.6 1.1 2.4 3.2
1.5 2.7 2.5 3.1 3.5
2.2 2.3 2.9 (D)0.5
See footnote(s) at end of table. --continued
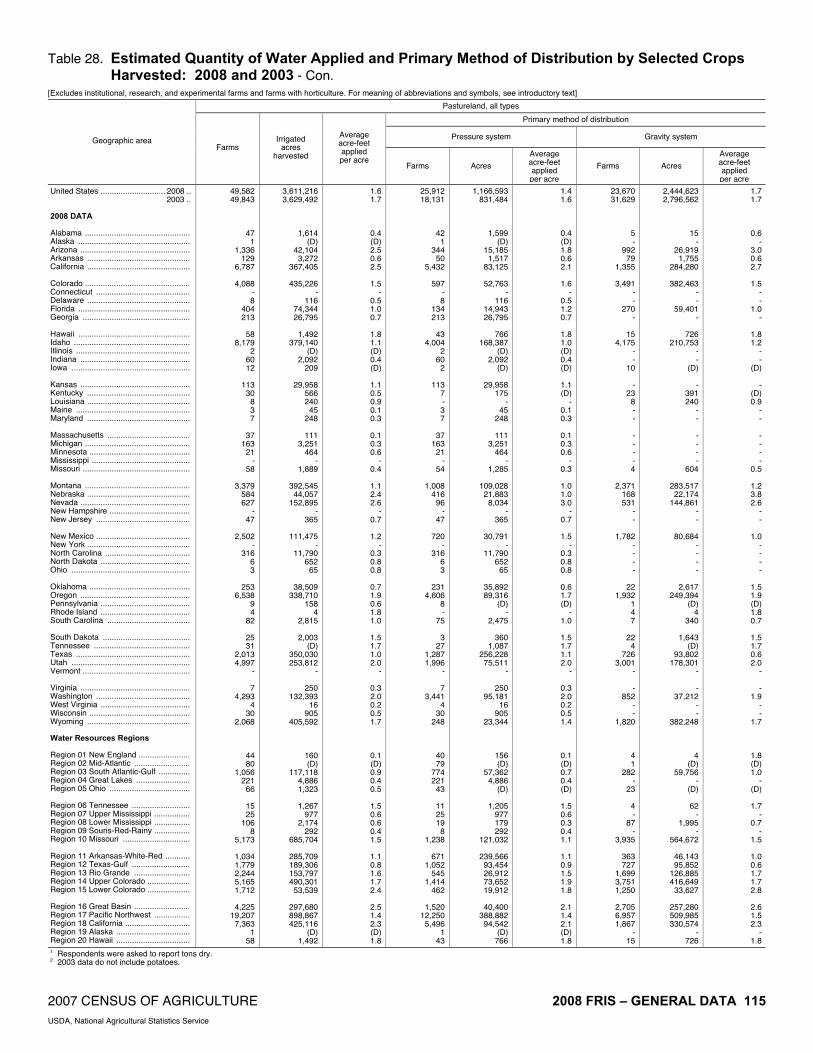
2007 CENSUS OF AGRICULTURE 2008 FRIS – GENERAL DATA 115 USDA, National Agricultural Statistics Service
Table 28. Estimated Quantity of Water Applied and Primary Method of Distribution by Selected Crops Harvested: 2008 and 2003 - Con.
[Excludes institutional, research, and experimental farms and farms with horticulture. For meaning of abbreviations and symbols, see introductory text]
Pastureland, all types
Primary method of distribution
Pressure system Gravity system Geographic area Farms
Irrigated acres
harvested
Average acre-feet applied per acre
Farms Acres
Averageacre-feet applied per acre
Farms Acres
Averageacre-feet applied per acre
United States ............................. 2008 .. 2003 .. 2008 DATA Alabama ............................................... Alaska .................................................. Arizona ................................................. Arkansas .............................................. California .............................................. Colorado ............................................... Connecticut .......................................... Delaware .............................................. Florida .................................................. Georgia ................................................ Hawaii .................................................. Idaho .................................................... Illinois ................................................... Indiana ................................................. Iowa ..................................................... Kansas ................................................. Kentucky .............................................. Louisiana .............................................. Maine ................................................... Maryland .............................................. Massachusetts ..................................... Michigan ............................................... Minnesota ............................................. Mississippi ............................................ Missouri ................................................ Montana ............................................... Nebraska .............................................. Nevada ................................................. New Hampshire .................................... New Jersey .......................................... New Mexico .......................................... New York .............................................. North Carolina ...................................... North Dakota ........................................ Ohio ..................................................... Oklahoma ............................................. Oregon ................................................. Pennsylvania ........................................ Rhode Island ........................................ South Carolina ..................................... South Dakota ....................................... Tennessee ........................................... Texas ................................................... Utah ..................................................... Vermont ................................................ Virginia ................................................. Washington .......................................... West Virginia ........................................ Wisconsin ............................................. Wyoming .............................................. Water Resources Regions Region 01 New England ....................... Region 02 Mid-Atlantic ......................... Region 03 South Atlantic-Gulf .............. Region 04 Great Lakes ........................ Region 05 Ohio .................................... Region 06 Tennessee .......................... Region 07 Upper Mississippi ................ Region 08 Lower Mississippi ................ Region 09 Souris-Red-Rainy ................ Region 10 Missouri .............................. Region 11 Arkansas-White-Red ........... Region 12 Texas-Gulf .......................... Region 13 Rio Grande ......................... Region 14 Upper Colorado ................... Region 15 Lower Colorado ................... Region 16 Great Basin ......................... Region 17 Pacific Northwest ................ Region 18 California ............................. Region 19 Alaska ................................. Region 20 Hawaii .................................
49,582 49,843
47 1
1,336 129
6,787
4,088 - 8
404 213
58
8,179 2
60 12
113
30 8 3 7
37
163 21
- 58
3,379
584 627
- 47
2,502
- 316
6 3
253
6,538 9 4
82
25 31
2,013 4,997
-
7 4,293
4 30
2,068
44 80
1,056 221
66
15 25
106 8
5,173
1,034 1,779 2,244 5,165 1,712
4,225
19,207 7,363
1 58
3,611,216 3,629,492
1,614 (D)
42,104 3,272
367,405
435,226 -
116 74,344 26,795
1,492
379,140 (D)
2,092 209
29,958
566 240
45 248
111
3,251 464
- 1,889
392,545 44,057
152,895 -
365
111,475 -
11,790 652
65
38,509 338,710
158 4
2,815
2,003 (D)
350,030 253,812
-
250 132,393
16 905
405,592
160 (D)
117,118 4,886 1,323
1,267
977 2,174
292 685,704
285,709 189,306 153,797 490,301 53,539
297,680 898,867 425,116
(D) 1,492
1.6 1.7
0.4 (D)2.5 0.6 2.5
1.5
- 0.5 1.0 0.7
1.8 1.1 (D)0.4 (D)
1.1 0.5 0.9 0.1 0.3
0.1 0.3 0.6
- 0.4
1.1 2.4 2.6
- 0.7
1.2
- 0.3 0.8 0.8
0.7 1.9 0.6 1.8 1.0
1.5 1.7 1.0 2.0
-
0.3 2.0 0.2 0.5 1.7
0.1 (D)0.9 0.4 0.5
1.5 0.6 0.6 0.4 1.5
1.1 0.8 1.6 1.7 2.4
2.5 1.4 2.3 (D)1.8
25,912 18,131
42 1
344 50
5,432
597 - 8
134 213
43
4,004 2
60 2
113
7 - 3 7
37
163 21
- 54
1,008
416 96
- 47
720
- 316
6 3
231
4,606 8 -
75
3 27
1,287 1,996
-
7 3,441
4 30
248
40 79
774 221
43
11 25 19
8 1,238
671
1,052 545
1,414 462
1,520
12,250 5,496
1 43
1,166,593 831,484
1,599 (D)
15,185 1,517
83,125
52,763 -
116 14,943 26,795
766
168,387 (D)
2,092 (D)
29,958
175 -
45 248
111
3,251 464
- 1,285
109,028 21,883
8,034 -
365
30,791 -
11,790 652
65
35,892 89,316
(D)-
2,475
360 1,087
256,228 75,511
-
250 95,181
16 905
23,344
156 (D)
57,362 4,886
(D)
1,205 977 179 292
121,032
239,566 93,454 26,912 73,652 19,912
40,400
388,882 94,542
(D)766
1.4 1.6
0.4 (D) 1.8 0.6 2.1
1.6
- 0.5 1.2 0.7
1.8 1.0 (D) 0.4 (D)
1.1 (D)
- 0.1 0.3
0.1 0.3 0.6
- 0.3
1.0 1.0 3.0
- 0.7
1.5
- 0.3 0.8 0.8
0.6 1.7 (D)
- 1.0
1.5 1.7 1.1 2.0
-
0.3 2.0 0.2 0.5 1.4
0.1 (D) 0.7 0.4 (D)
1.5 0.6 0.3 0.4 1.1
1.1 0.9 1.5 1.9 1.8
2.1 1.4 2.1 (D) 1.8
23,670 31,629
5 -
992 79
1,355
3,491 - -
270 -
15 4,175
- -
10
- 23
8 - -
- - - - 4
2,371
168 531
- -
1,782 - - - -
22 1,932
1 4 7
22
4 726
3,001 -
- 852
- -
1,820
4 1
282 -
23
4 -
87 -
3,935
363 727
1,699 3,751 1,250
2,705 6,957 1,867
- 15
2,444,623 2,796,562
15 -
26,919 1,755
284,280
382,463 - -
59,401 -
726 210,753
- -
(D)
- 391 240
- -
- - - -
604
283,517 22,174
144,861 - -
80,684 - - - -
2,617 249,394
(D)4
340
1,643 (D)
93,802 178,301
-
- 37,212
- -
382,248
4 (D)
59,756 -
(D)
62 -
1,995 -
564,672
46,143 95,852
126,885 416,649 33,627
257,280 509,985 330,574
- 726
1.7 1.7
0.6 -
3.0 0.6 2.7
1.5
- -
1.0 -
1.8 1.2
- -
(D)
- (D)0.9
- -
- - - -
0.5
1.2 3.8 2.6
- -
1.0 - - - -
1.5 1.9 (D)1.8 0.7
1.5 1.7 0.6 2.0
-
- 1.9
- -
1.7
1.8 (D)1.0
- (D)
1.7
- 0.7
- 1.5
1.0 0.6 1.7 1.7 2.8
2.6 1.5 2.3
- 1.8
1 Respondents were asked to report tons dry. 2 2003 data do not include potatoes.
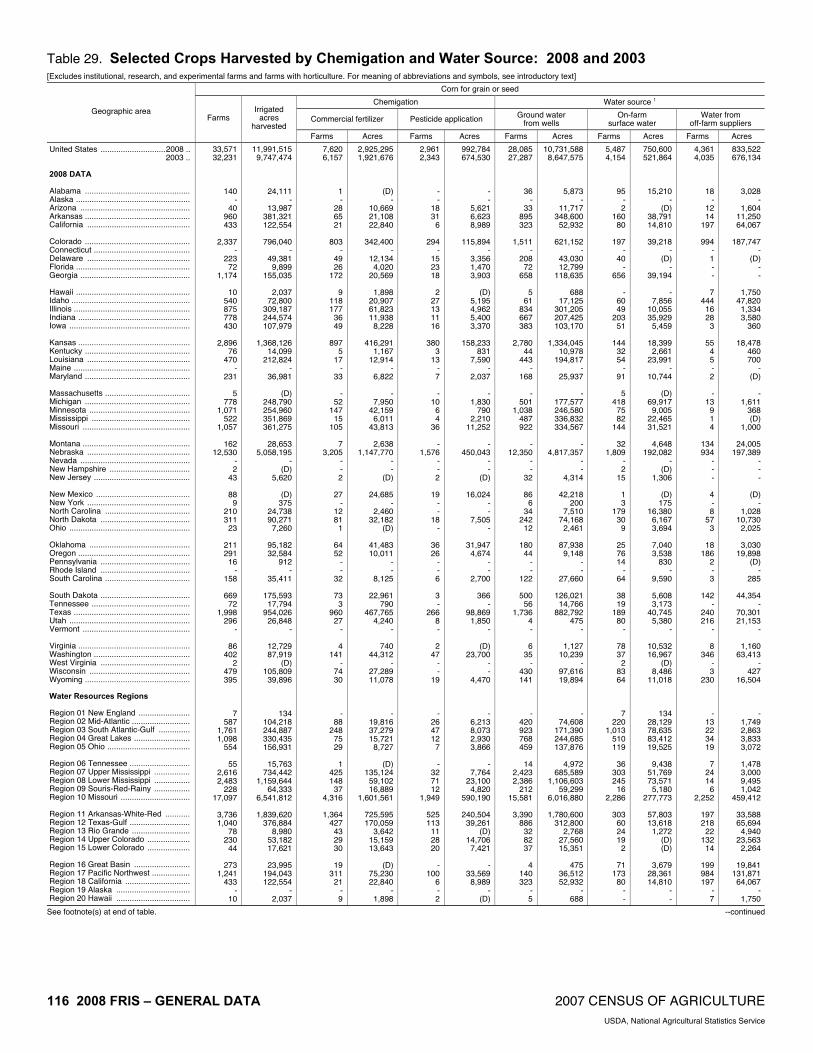
116 2008 FRIS – GENERAL DATA 2007 CENSUS OF AGRICULTURE USDA, National Agricultural Statistics Service
Table 29. Selected Crops Harvested by Chemigation and Water Source: 2008 and 2003 [Excludes institutional, research, and experimental farms and farms with horticulture. For meaning of abbreviations and symbols, see introductory text]
Corn for grain or seed
Chemigation Water source 1
Commercial fertilizer Pesticide application Ground water from wells
On-farm surface water
Water from off-farm suppliers
Geographic area Farms
Irrigated acres
harvested Farms Acres Farms Acres Farms Acres Farms Acres Farms Acres
United States .............................2008 .. 2003 .. 2008 DATA Alabama ............................................... Alaska ................................................... Arizona ................................................. Arkansas ............................................... California .............................................. Colorado ............................................... Connecticut ........................................... Delaware .............................................. Florida ................................................... Georgia ................................................. Hawaii ................................................... Idaho ..................................................... Illinois .................................................... Indiana .................................................. Iowa ...................................................... Kansas .................................................. Kentucky ............................................... Louisiana .............................................. Maine .................................................... Maryland ............................................... Massachusetts ...................................... Michigan ............................................... Minnesota ............................................. Mississippi ............................................ Missouri ................................................ Montana ................................................ Nebraska .............................................. Nevada ................................................. New Hampshire .................................... New Jersey ........................................... New Mexico .......................................... New York .............................................. North Carolina ...................................... North Dakota ........................................ Ohio ...................................................... Oklahoma ............................................. Oregon .................................................. Pennsylvania ........................................ Rhode Island ........................................ South Carolina ...................................... South Dakota ........................................ Tennessee ............................................ Texas .................................................... Utah ...................................................... Vermont ................................................ Virginia .................................................. Washington ........................................... West Virginia ........................................ Wisconsin ............................................. Wyoming ............................................... Water Resources Regions Region 01 New England ....................... Region 02 Mid-Atlantic .......................... Region 03 South Atlantic-Gulf .............. Region 04 Great Lakes ......................... Region 05 Ohio ..................................... Region 06 Tennessee ........................... Region 07 Upper Mississippi ................ Region 08 Lower Mississippi ................ Region 09 Souris-Red-Rainy ................ Region 10 Missouri ............................... Region 11 Arkansas-White-Red ........... Region 12 Texas-Gulf ........................... Region 13 Rio Grande .......................... Region 14 Upper Colorado ................... Region 15 Lower Colorado ................... Region 16 Great Basin ......................... Region 17 Pacific Northwest ................. Region 18 California ............................. Region 19 Alaska ................................. Region 20 Hawaii .................................
33,571 32,231
140 -
40 960 433
2,337
- 223
72 1,174
10
540 875 778 430
2,896
76 470
- 231
5
778 1,071
522 1,057
162
12,530 - 2
43
88 9
210 311
23
211 291
16 -
158
669 72
1,998 296
-
86 402
2 479 395
7 587
1,761 1,098
554
55 2,616 2,483
228 17,097
3,736 1,040
78 230
44
273 1,241
433 -
10
11,991,515 9,747,474
24,111 -
13,987 381,321 122,554
796,040
- 49,381
9,899 155,035
2,037
72,800 309,187 244,574 107,979
1,368,126
14,099 212,824
- 36,981
(D)
248,790 254,960 351,869 361,275
28,653
5,058,195 -
(D) 5,620
(D)
375 24,738 90,271
7,260
95,182 32,584
912 -
35,411
175,593 17,794
954,026 26,848
-
12,729 87,919
(D) 105,809 39,896
134 104,218 244,887 330,435 156,931
15,763
734,442 1,159,644
64,333 6,541,812
1,839,620
376,884 8,980
53,182 17,621
23,995
194,043 122,554
- 2,037
7,620 6,157
1 -
28 65 21
803
- 49 26
172
9 118 177
36 49
897
5 17
- 33
-
52 147
15 105
7
3,205 - - 2
27
- 12 81
1
64 52
- -
32
73 3
960 27
-
4 141
- 74 30
- 88
248 75 29
1
425 148
37 4,316
1,364
427 43 29 30
19
311 21
- 9
2,925,295 1,921,676
(D)-
10,669 21,108 22,840
342,400
- 12,134
4,020 20,569
1,898
20,907 61,823 11,938
8,228
416,291 1,167
12,914 -
6,822
- 7,950
42,159 6,011
43,813
2,638 1,147,770
- -
(D)
24,685 -
2,460 32,182
(D)
41,483 10,011
- -
8,125
22,961 790
467,765 4,240
-
740 44,312
- 27,289 11,078
- 19,816 37,279 15,721
8,727
(D)135,124 59,102 16,889
1,601,561
725,595 170,059
3,642 15,159 13,643
(D)
75,230 22,840
- 1,898
2,961 2,343
- -
18 31
6
294 -
15 23 18
2
27 13 11 16
380
3 13
- 7
-
10 6 4
36
- 1,576
- - 2
19
- -
18 -
36 26
- - 6
3 -
266 8 -
2 47
- -
19
- 26 47 12
7
- 32 71 12
1,949
525 113
11 28 20
-
100 6 - 2
992,784 674,530
- -
5,621 6,623 8,989
115,894
- 3,356 1,470 3,903
(D)
5,195 4,962 5,400 3,370
158,233
831 7,590
- 2,037
-
1,830 790
2,210 11,252
-
450,043 - -
(D)
16,024 - -
7,505 -
31,947 4,674
- -
2,700
366 -
98,869 1,850
-
(D)23,700
- -
4,470
- 6,213 8,073 2,930 3,866
-
7,764 23,100
4,820 590,190
240,504 39,261
(D)14,706
7,421
- 33,569
8,989 -
(D)
28,085 27,287
36 -
33 895 323
1,511
- 208
72 658
5
61 834 667 383
2,780
44 443
- 168
-
501 1,038
487 922
-
12,350 - -
32
86 6
34 242
12
180 44
- -
122
500 56
1,736 4 -
6 35
- 430 141
- 420 923 768 459
14
2,423 2,386
212 15,581
3,390
886 32 82 37
4
140 323
- 5
10,731,588 8,647,575
5,873 -
11,717 348,600 52,932
621,152
- 43,030 12,799
118,635
688 17,125
301,205 207,425 103,170
1,334,045
10,978 194,817
- 25,937
-
177,577 246,580 336,832 334,567
-
4,817,357 - -
4,314
42,218 200
7,510 74,168
2,461
87,938 9,148
- -
27,660
126,021 14,766
882,792 475
-
1,127 10,239
- 97,616 19,894
- 74,608
171,390 244,685 137,876
4,972
685,589 1,106,603
59,299 6,016,880
1,780,600
312,800 2,768
27,560 15,351
475
36,512 52,932
- 688
5,487 4,154
95 - 2
160 80
197
- 40
- 656
-
60 49
203 51
144
32 54
- 91
5
418 75 82
144
32 1,809
- 2
15
1 3
179 30
9
25 76 14
- 64
38 19
189 80
-
78 37
2 83 64
7 220
1,013 510 119
36
303 245
16 2,286
303
60 24 19
2
71 173
80 - -
750,600 521,864
15,210 -
(D)38,791 14,810
39,218
- (D)
- 39,194
-
7,856 10,055 35,929
5,459
18,399 2,661
23,991 -
10,744
(D)69,917
9,005 22,465 31,521
4,648
192,082 -
(D)1,306
(D)
175 16,380
6,167 3,694
7,040 3,538
830 -
9,590
5,608 3,173
40,745 5,380
-
10,532 16,967
(D)8,486
11,018
134 28,129 78,635 83,412 19,525
9,438
51,769 73,571
5,180 277,773
57,803 13,618
1,272 (D)(D)
3,679
28,361 14,810
- -
4,361 4,035
18 -
12 14
197
994 - 1 - -
7 444
16 28
3
55 4 5 - 2
-
13 9 1 4
134 934
- - -
4 - 8
57 3
18
186 2 - 3
142
- 240 216
-
8 346
- 3
230
- 13 22 34 19
7
24 14
6 2,252
197 218
22 132
14
199 984 197
- 7
833,522 676,134
3,028 -
1,604 11,250 64,067
187,747
- (D)
- -
1,750 47,820
1,334 3,580
360
18,478 460 700
- (D)
-
1,611 368 (D)
1,000
24,005 197,389
- - -
(D)-
1,028 10,730
2,025
3,030 19,898
(D)-
285
44,354 -
70,301 21,153
-
1,160 63,413
- 427
16,504
- 1,749 2,863 3,833 3,072
1,478 3,000 9,495 1,042
459,412
33,588 65,694
4,940 23,563
2,264
19,841 131,871 64,067
- 1,750
See footnote(s) at end of table. --continued

2007 CENSUS OF AGRICULTURE 2008 FRIS – GENERAL DATA 117 USDA, National Agricultural Statistics Service
Table 29. Selected Crops Harvested by Chemigation and Water Source: 2008 and 2003 - Con. [Excludes institutional, research, and experimental farms and farms with horticulture. For meaning of abbreviations and symbols, see introductory text]
Corn for silage or greenchop
Chemigation Water source 1
Commercial fertilizer Pesticide application Ground water from wells
On-farm surface water
Water from off-farm suppliers
Geographic area Farms
Irrigated acres
harvested Farms Acres Farms Acres Farms Acres Farms Acres Farms Acres
United States ............................. 2008 .. 2003 .. 2008 DATA Alabama ............................................... Alaska .................................................. Arizona ................................................. Arkansas .............................................. California .............................................. Colorado ............................................... Connecticut .......................................... Delaware .............................................. Florida .................................................. Georgia ................................................ Hawaii .................................................. Idaho .................................................... Illinois ................................................... Indiana ................................................. Iowa ..................................................... Kansas ................................................. Kentucky .............................................. Louisiana .............................................. Maine ................................................... Maryland .............................................. Massachusetts ..................................... Michigan ............................................... Minnesota ............................................. Mississippi ............................................ Missouri ................................................ Montana ............................................... Nebraska .............................................. Nevada ................................................. New Hampshire .................................... New Jersey .......................................... New Mexico .......................................... New York .............................................. North Carolina ...................................... North Dakota ........................................ Ohio ..................................................... Oklahoma ............................................. Oregon ................................................. Pennsylvania ........................................ Rhode Island ........................................ South Carolina ..................................... South Dakota ....................................... Tennessee ........................................... Texas ................................................... Utah ..................................................... Vermont ................................................ Virginia ................................................. Washington .......................................... West Virginia ........................................ Wisconsin ............................................. Wyoming .............................................. Water Resources Regions Region 01 New England ....................... Region 02 Mid-Atlantic ......................... Region 03 South Atlantic-Gulf .............. Region 04 Great Lakes ........................ Region 05 Ohio .................................... Region 06 Tennessee .......................... Region 07 Upper Mississippi ................ Region 08 Lower Mississippi ................ Region 09 Souris-Red-Rainy ................ Region 10 Missouri .............................. Region 11 Arkansas-White-Red ........... Region 12 Texas-Gulf .......................... Region 13 Rio Grande ......................... Region 14 Upper Colorado ................... Region 15 Lower Colorado ................... Region 16 Great Basin ......................... Region 17 Pacific Northwest ................ Region 18 California ............................. Region 19 Alaska ................................. Region 20 Hawaii .................................
9,135 10,111
9 -
81 1
1,684
848 -
17 169 186
-
1,391 11 55 11
394
9 4 -
16
- 99
183 -
29
297 1,115
34 5 4
281
4 25 60
4
49 166
7 -
35
61 17
324 751
-
64 355
2 119 159
5 112 424 149
33
11 296
19 25
2,477
475 313 191 183
81
806 1,848 1,687
- -
1,633,540 1,311,674
1,269 -
30,591 (D)
530,406
92,563 -
750 30,670 26,147
-
253,615 766
8,417 1,730
75,978
114 120
- 2,096
-
18,379 10,673
- 4,019
40,377 89,346
5,880 61
746
86,730 12
1,830 4,946
635
12,665 18,977
511 -
4,519
4,595 1,572
108,226 51,380
-
3,287 67,413
(D) 12,442 29,027
61 7,402
64,435 22,893
2,271
1,323 26,761
1,855 1,494
263,062
121,955 97,872 48,162 11,943 30,591
58,129
342,625 530,706
- -
2,191 1,738
- -
46 -
797
107 - -
44 24
-
283 - 6 -
90 - - - 2
-
26 22
- 7
37 82 18
3 2
115
- -
14 -
16 60
- - 6
6 -
84 103
-
19 124
1 10 37
3 23 74 29
4
- 32
7 -
276
167 66 79 16 46
106 466 797
- -
504,670 292,065
- -
12,171 -
200,674
19,085 - -
9,932 1,500
-
56,294 -
1,300 -
18,995 - - -
(D)
- 2,520 2,079
- 900
3,140
32,140 3,600
(D)(D)
34,176
- -
1,085 -
8,109 3,979
- -
860
350 -
44,418 9,414
-
910 33,031
(D)1,391 2,450
(D)1,036
12,292 2,650
(D)
- 4,040
900 -
59,775
52,239 33,996 17,938
840 12,171
12,364 93,114
200,674 - -
962 776
- - 7 -
370
47 - -
35 34
-
160 - 4 -
32 - - - -
- 1 1 - -
6 27
4 3 2
42
- - 5 -
6 39
- - 2
- -
35 42
-
17 9 1 1
30
3 19 71
2 4
- 2 - -
105
59 48 18 11
7
35 208 370
- -
271,377 121,054
- -
2,565 -
109,174
11,062 - -
7,852 2,895
-
42,447 -
1,200 -
8,715 - - - -
- (D)(D)
- -
420 26,040
2,520 (D)(D)
20,966
- -
720 -
1,563 2,168
- -
(D)
- -
15,915 10,444
-
810 1,197
(D)(D)
1,612
(D)896
11,247 (D)(D)
-
(D)- -
39,104
16,268 20,558 11,083
470 2,565
12,494 45,812
109,174 - -
5,132 5,459
2 -
40 1
1,335
339 -
11 148 120
-
300 11 49
8
393 - 4 - 9
-
56 178
- 12
1
1,114 22
3 -
270 - -
21 1
48 65
1 -
12
39 6
242 68
-
5 69
- 100
29
3 26
282 102
16
4 256
19 25
1,639
450 231 180
- 40
106 418
1,335 - -
1,011,824 718,176
(D) -
10,179 (D)
401,476
36,445 -
240 23,011 17,255
-
83,605 766
7,435 1,520
75,911
- 120
- 1,524
-
10,811 10,644
- 1,635
(D)
89,316 4,214
(D) -
80,950 - -
1,137 (D)
7,536 3,463
(D) -
2,315
1,345 785
96,316 8,123
-
375 12,390
- 10,522
9,544
(D) 2,344
43,161 14,901
1,478
(D) 22,715
1,855 1,494
158,017
113,349 86,682 41,662
- 10,179
12,652 99,143
401,476 - -
2,266 1,351
7 -
17 -
824
167 - 6
46 104
-
236 - 4 -
- 9 - - 7
-
51 3 -
17
108 54
4 2 4
15
4 25 13
3
3 79
6 -
27
6 12 76
149 -
64 22
2 31 59
2 91
209 56 17
8
45 - 2
356
42 72
6 58 17
124 334 827
- -
378,548 (D)
(D) -
4,343 -
184,227
33,624 -
510 10,359 10,938
-
39,937 -
(D) -
- 114
- -
572
- 7,821
77 -
2,384
13,098 9,470
380 (D)
746
9,146 12
1,830 1,201
(D)
(D) 8,416
(D) -
2,204
285 892
8,228 6,005
-
3,287 3,161
(D) 1,979 5,261
(D) 5,433
26,020 8,074
793
733 4,090
- (D)
56,019
9,519 13,223
4,021 4,799 4,343
5,646
51,214 184,527
- -
3,844 4,409
- -
65 -
882
426 - - 3 6
-
1,076 - 2 3
1 - - - -
- 9 5 - -
213 53 16
- -
25 - -
28 -
- 70
- - -
16 -
25 541
-
5 285
- -
89
- 5 9
11 -
- 5 - -
713
3 24 25
125 65
592
1,385 882
- -
604,188 (D)
- -
23,777 -
220,556
48,843 - -
1,002 120
-
133,673 -
(D)210
(D)
- - - -
- 1,630
100 - -
28,264 11,860
1,686 - -
8,700 - -
2,608 -
- 7,978
- - -
2,965 -
4,480 37,510
-
375 51,862
- -
15,622
- 375
1,122 1,810
-
- 100
- -
98,500
547 4,320 8,700 7,184
23,777
40,449 196,748 220,556
- -
See footnote(s) at end of table. --continued

118 2008 FRIS – GENERAL DATA 2007 CENSUS OF AGRICULTURE USDA, National Agricultural Statistics Service
Table 29. Selected Crops Harvested by Chemigation and Water Source: 2008 and 2003 - Con. [Excludes institutional, research, and experimental farms and farms with horticulture. For meaning of abbreviations and symbols, see introductory text]
Sorghum for grain or seed
Chemigation Water source 1
Commercial fertilizer Pesticide application Ground water from wells
On-farm surface water
Water from off-farm suppliers
Geographic area Farms
Irrigated acres
harvested Farms Acres Farms Acres Farms Acres Farms Acres Farms Acres
United States .............................2008 .. 2003 .. 2008 DATA Alabama ............................................... Alaska ................................................... Arizona ................................................. Arkansas ............................................... California .............................................. Colorado ............................................... Connecticut ........................................... Delaware .............................................. Florida ................................................... Georgia ................................................. Hawaii ................................................... Idaho ..................................................... Illinois .................................................... Indiana .................................................. Iowa ...................................................... Kansas .................................................. Kentucky ............................................... Louisiana .............................................. Maine .................................................... Maryland ............................................... Massachusetts ...................................... Michigan ............................................... Minnesota ............................................. Mississippi ............................................ Missouri ................................................ Montana ................................................ Nebraska .............................................. Nevada ................................................. New Hampshire .................................... New Jersey ........................................... New Mexico .......................................... New York .............................................. North Carolina ...................................... North Dakota ........................................ Ohio ...................................................... Oklahoma ............................................. Oregon .................................................. Pennsylvania ........................................ Rhode Island ........................................ South Carolina ...................................... South Dakota ........................................ Tennessee ............................................ Texas .................................................... Utah ...................................................... Vermont ................................................ Virginia .................................................. Washington ........................................... West Virginia ........................................ Wisconsin ............................................. Wyoming ............................................... Water Resources Regions Region 01 New England ....................... Region 02 Mid-Atlantic .......................... Region 03 South Atlantic-Gulf .............. Region 04 Great Lakes ......................... Region 05 Ohio ..................................... Region 06 Tennessee ........................... Region 07 Upper Mississippi ................ Region 08 Lower Mississippi ................ Region 09 Souris-Red-Rainy ................ Region 10 Missouri ............................... Region 11 Arkansas-White-Red ........... Region 12 Texas-Gulf ........................... Region 13 Rio Grande .......................... Region 14 Upper Colorado ................... Region 15 Lower Colorado ................... Region 16 Great Basin ......................... Region 17 Pacific Northwest ................. Region 18 California ............................. Region 19 Alaska ................................. Region 20 Hawaii .................................
4,118 6,134
- -
80 290
39
103 - - 2
45
1 - 4 1 -
779 -
18 - -
- - -
25 70
-
172 - - -
69 - 2 - -
137 - - - 1
6 2
2,263 9 -
- - - - -
- -
50 - -
- 5
319 -
438
1,518 1,597
60 -
82
9 -
39 - 1
1,042,392 1,108,375
- -
24,328 65,738 14,620
8,308
- -
(D) 8,201
(D)
- 103 (D)
-
107,525 -
4,833 - -
- - -
3,895 3,135
-
12,100 - - -
15,262 -
(D) - -
26,832 - - -
(D)
456 (D)
743,172 540
-
- - - - -
- -
(D) - -
- (D)
73,200 -
31,551
332,814 545,110
8,621 -
24,428
540 -
14,620 -
(D)
1,007 957
- -
47 3 5
- - - -
11
1 - 1 - -
115 - - - -
- - - 3 2
- - - - -
39 - - - -
35 - - - -
- -
745 - -
- - - - -
- -
11 - -
- 1 8 -
45
252 588
49 -
47
- - 5 - 1
190,798 171,293
- -
12,657 1,700
(D)
- - - -
3,011
(D)-
(D)- -
11,891 - - - -
- - -
450 (D)
- - - - -
8,933 - - - -
6,389 - - - -
- -
145,215 - -
- - - - -
- -
3,011 - -
- (D)
2,390 -
5,433
47,105 112,540
7,350 -
12,657
- -
(D)-
(D)
418 128
- -
17 18
5
- - - - -
- - - - -
29 - - - -
- - - - -
- - - - -
5 - - - -
15 - - - -
- -
329 - -
- - - - -
- - - - -
- -
18 - -
46 327
5 -
17
- - 5 - -
170,858 14,486
- -
4,282 3,360
(D)
- - - - -
- - - - -
2,184 - - - -
- - - - -
- - - - -
(D)- - - -
3,747 - - - -
- -
154,890 - -
- - - - -
- - - - -
- -
3,360 - -
7,091 153,730
(D)-
4,282
- -
(D)- -
3,535 4,985
- -
47 259
29
28 - - -
41
1 - 4 1 -
683 -
18 - -
- - -
25 32
-
172 - - -
68 - - - -
126 - - - 1
- 2
1,998 - -
- - - - -
- -
42 - -
- 5
288 -
298
1,432 1,355
36 -
49
- -
29 - 1
909,357 948,647
- -
11,325 56,324 13,785
(D)
- - -
6,201
(D) -
103 (D)
-
104,884 -
4,833 - -
- - -
3,895 2,565
-
12,100 - - -
15,218 - - - -
25,247 - - -
(D)
- (D)
645,448 - -
- - - - -
- -
(D) - -
- (D)
63,786 -
28,256
326,864 450,150
(D) -
11,425
- -
13,785 -
(D)
379 401
- - 8
43 5
14
- - 2 4
- - - - -
87 - - - -
- - - -
38
- - - - -
3 - - - -
5 - - - -
- -
170 - -
- - - - -
- - 6 - -
- -
43 -
125
128 39 25
- 8
- - 5 - -
59,011 54,197
- -
2,130 20,664
440
(D) - -
(D) 2,000
- - - - -
1,670 - - - -
- - - -
570
- - - - -
3,918 - - - -
699 - - - -
- -
25,470 - -
- - - - -
- -
2,150 - -
- -
20,664 -
2,240
10,996 16,177
4,214 -
2,130
- -
440 - -
387 804
- -
38 - 5
61
- - - -
- - - - -
10 - - - -
- - - - -
- - - - -
6 - 2 - -
12 - - - -
6 -
238 9 -
- - - - -
- - 2 - -
- - - -
15
75 238
3 -
40
9 - 5 - -
110,393 107,721
- -
12,073 -
395
(D)- - - -
- - - - -
981 - - - -
- - - - -
- - - - -
1,487 -
(D)- -
1,711 - - - -
456 -
89,977 540
-
- - - - -
- -
(D)- -
- - - -
1,055
4,816 89,991
(D)-
12,573
540 -
395 - -
See footnote(s) at end of table. --continued

2007 CENSUS OF AGRICULTURE 2008 FRIS – GENERAL DATA 119 USDA, National Agricultural Statistics Service
Table 29. Selected Crops Harvested by Chemigation and Water Source: 2008 and 2003 - Con. [Excludes institutional, research, and experimental farms and farms with horticulture. For meaning of abbreviations and symbols, see introductory text]
Wheat for grain or seed
Chemigation Water source 1
Commercial fertilizer Pesticide application Ground water from wells
On-farm surface water
Water from off-farm suppliers
Geographic area Farms
Irrigated acres
harvested Farms Acres Farms Acres Farms Acres Farms Acres Farms Acres
United States ............................. 2008 .. 2003 .. 2008 DATA Alabama ............................................... Alaska .................................................. Arizona ................................................. Arkansas .............................................. California .............................................. Colorado ............................................... Connecticut .......................................... Delaware .............................................. Florida .................................................. Georgia ................................................ Hawaii .................................................. Idaho .................................................... Illinois ................................................... Indiana ................................................. Iowa ..................................................... Kansas ................................................. Kentucky .............................................. Louisiana .............................................. Maine ................................................... Maryland .............................................. Massachusetts ..................................... Michigan ............................................... Minnesota ............................................. Mississippi ............................................ Missouri ................................................ Montana ............................................... Nebraska .............................................. Nevada ................................................. New Hampshire .................................... New Jersey .......................................... New Mexico .......................................... New York .............................................. North Carolina ...................................... North Dakota ........................................ Ohio ..................................................... Oklahoma ............................................. Oregon ................................................. Pennsylvania ........................................ Rhode Island ........................................ South Carolina ..................................... South Dakota ....................................... Tennessee ........................................... Texas ................................................... Utah ..................................................... Vermont ................................................ Virginia ................................................. Washington .......................................... West Virginia ........................................ Wisconsin ............................................. Wyoming .............................................. Water Resources Regions Region 01 New England ....................... Region 02 Mid-Atlantic ......................... Region 03 South Atlantic-Gulf .............. Region 04 Great Lakes ........................ Region 05 Ohio .................................... Region 06 Tennessee .......................... Region 07 Upper Mississippi ................ Region 08 Lower Mississippi ................ Region 09 Souris-Red-Rainy ................ Region 10 Missouri .............................. Region 11 Arkansas-White-Red ........... Region 12 Texas-Gulf .......................... Region 13 Rio Grande ......................... Region 14 Upper Colorado ................... Region 15 Lower Colorado ................... Region 16 Great Basin ......................... Region 17 Pacific Northwest ................ Region 18 California ............................. Region 19 Alaska ................................. Region 20 Hawaii .................................
16,265 13,524
17 -
254 160
1,338
997 -
77 6
321
- 2,062
49 69
2
1,541 -
23 -
75
- 88 88 13 87
1,235 1,000
46 - 8
174
2 51
144 -
479 747
- -
38
81 3
2,583 952
-
8 1,195
- 27
225
- 170 429
98 30
5
158 243
75 3,495
3,189 1,373
270 156 265
1,111 3,831 1,367
- -
4,107,464 3,267,978
1,850 -
138,472 46,737
493,133
171,323 -
10,929 1,750
65,933
- 638,220
5,312 10,163
(D)
455,558 -
6,706 -
7,992
- 16,732
9,450 3,941
27,163
212,886 174,922 12,282
- 1,635
83,868
(D) 4,610
30,427 -
147,489 177,497
- -
6,748
15,948 675
796,071 44,356
-
655 260,958
- 2,176
22,861
- 21,225 80,183 17,672
8,911
1,058 12,392 70,852
9,921 598,607
1,117,022
324,595 53,841 14,539
142,692
80,748 1,056,344
496,862 - -
3,358 2,573
- -
148 -
416
224 - 4 4
24
- 251
- 5 -
252 - 1 - 8
- 1 - - -
88 207
2 - -
69 -
16 22
-
112 95
- - -
30 -
865 24
-
- 474
- 2
14
- 12 44
4 3
- 1 1 7
523
835 453
43 23
159
24 816 410
- -
1,225,432 738,017
- -
87,096 -
215,282
60,832 -
525 1,600 4,970
-
125,202 -
4,600 -
80,739 -
(D)-
1,117
- (D)
- - -
28,298 50,168
(D)- -
41,813 -
(D)7,257
-
46,111 54,292
- - -
2,795 -
292,728 5,026
-
- 112,446
- (D)70
- 1,642 6,890
575 (D)
-
(D)(D)
1,645 130,540
328,387 115,617 24,741
9,275 91,317
6,234
291,240 212,387
- -
906 417
- -
34 -
166
62 - - 2
12
- 103
- 3 -
107 - - - 5
- 1 - - -
8 84
- - -
21 -
16 1 -
24 46
- - -
3 -
120 - -
- 88
- - -
- 5
30 1 3
- - - 1
129
159 109
12 20 39
-
237 161
- -
298,427 136,431
- -
18,148 -
66,062
19,485 - -
(D)710
-
28,461 -
4,200 -
29,152 - - -
897
- (D)
- - -
2,794 16,559
- - -
25,132 -
(D)(D)
-
10,051 14,402
- - -
180 -
36,875 - -
- 24,019
- - -
- 897
1,430 (D)(D)
- - -
(D)26,948
61,598 29,160 13,367
9,155 18,661
-
66,882 65,549
- -
9,535 7,831
7 -
84 144 702
522
- 67
6 281
-
748 49 57
2
1,537 -
21 -
60
- 64 82 13 87
85
895 37
- 8
165
- 10 81
-
449 181
- -
33
36 3
2,486 117
-
- 267
- 23
126
- 135 335
71 26
3
149 241
67 1,898
2,970 1,345
153 84 86
165
1,089 718
- -
2,767,469 2,121,367
496 -
42,187 41,297
233,798
125,859 -
9,547 1,750
55,107
- 340,503
5,312 8,419
(D)
459,783 -
5,486 -
6,398
- 14,403
8,580 3,941
27,163
25,382 150,849 10,510
- 1,635
72,375
- (D)
16,020 -
144,772 56,141
- -
5,258
7,709 675
777,603 5,096
-
- 91,503
- 1,694
10,032
- 17,580 62,575 15,013
8,411
(D) 10,996 69,632
8,901 342,750
1,080,460
321,936 44,801
(D) 42,913
26,638
479,031 234,274
- -
2,448 1,308
10 -
50 16
226
283 -
12 -
91
- 345
- 12
-
4 - 3 -
21
- 35
4 - -
197 76
2 - -
30 -
40 9 -
54 278
- -
11
7 -
197 193
-
6 194
- 6
36
- 39
150 38
4
2 11
3 6
445
245 71
134 9
50
224 781 236
- -
414,102 356,190
1,354 -
25,039 5,440
65,050
22,523 -
(D) -
11,486
- 74,553
- 1,436
-
480 -
1,220 -
(D)
- 2,329
(D) - -
48,972 12,275
(D) - -
6,496 -
4,246 3,234
-
11,244 30,337
- -
2,090
774 -
28,748 3,362
-
(D) 40,549
- 492
5,659
- 2,766
18,668 2,659
500
(D) 1,098 1,220 1,320
80,436
46,690 9,051 6,388
(D) 25,039
6,277
142,902 68,130
- -
5,925 5,304
- -
189 -
836
319 - 1 - -
- 1,210
- 2 -
5 - - - 1
- - 2 - -
1,034 132
9 - -
13 2 2
64 -
10 427
- - -
38 -
34 737
-
2 793
- -
63
- 6 2 - -
- 2 - 4
1,432
83 27 46
147 198
750
2,373 855
- -
1,135,509 968,721
- -
101,409 -
294,246
34,289 -
(D)- -
- 240,427
- (D)
-
668 - - -
(D)
- -
(D)- -
141,365 11,798
1,344 - -
12,537 (D)(D)
11,793 -
2,736 93,440
- - -
7,465 -
5,998 37,938
-
(D)129,347
- -
7,170
- 879 (D)
- -
- (D)
- 310
185,634
13,648 5,724
11,154 14,127
104,903
49,665 454,536 294,419
- -
See footnote(s) at end of table. --continued
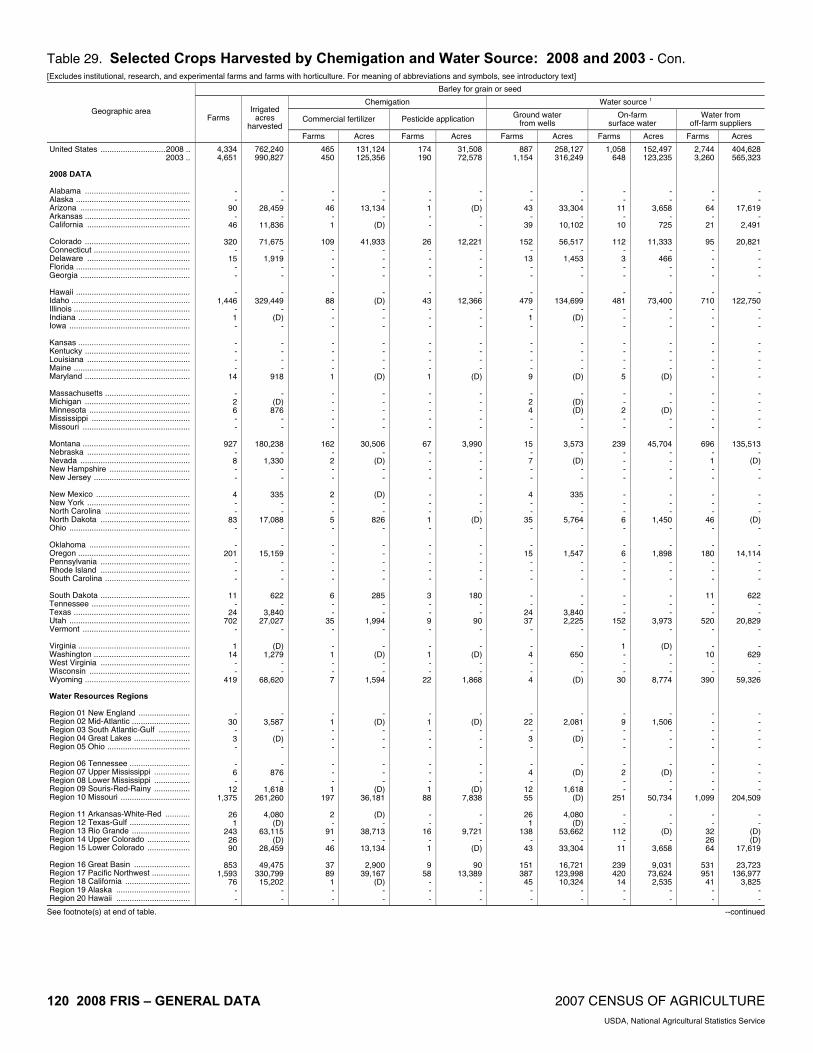
120 2008 FRIS – GENERAL DATA 2007 CENSUS OF AGRICULTURE USDA, National Agricultural Statistics Service
Table 29. Selected Crops Harvested by Chemigation and Water Source: 2008 and 2003 - Con. [Excludes institutional, research, and experimental farms and farms with horticulture. For meaning of abbreviations and symbols, see introductory text]
Barley for grain or seed
Chemigation Water source 1
Commercial fertilizer Pesticide application Ground water from wells
On-farm surface water
Water from off-farm suppliers
Geographic area Farms
Irrigated acres
harvested Farms Acres Farms Acres Farms Acres Farms Acres Farms Acres
United States .............................2008 .. 2003 .. 2008 DATA Alabama ............................................... Alaska ................................................... Arizona ................................................. Arkansas ............................................... California .............................................. Colorado ............................................... Connecticut ........................................... Delaware .............................................. Florida ................................................... Georgia ................................................. Hawaii ................................................... Idaho ..................................................... Illinois .................................................... Indiana .................................................. Iowa ...................................................... Kansas .................................................. Kentucky ............................................... Louisiana .............................................. Maine .................................................... Maryland ............................................... Massachusetts ...................................... Michigan ............................................... Minnesota ............................................. Mississippi ............................................ Missouri ................................................ Montana ................................................ Nebraska .............................................. Nevada ................................................. New Hampshire .................................... New Jersey ........................................... New Mexico .......................................... New York .............................................. North Carolina ...................................... North Dakota ........................................ Ohio ...................................................... Oklahoma ............................................. Oregon .................................................. Pennsylvania ........................................ Rhode Island ........................................ South Carolina ...................................... South Dakota ........................................ Tennessee ............................................ Texas .................................................... Utah ...................................................... Vermont ................................................ Virginia .................................................. Washington ........................................... West Virginia ........................................ Wisconsin ............................................. Wyoming ............................................... Water Resources Regions Region 01 New England ....................... Region 02 Mid-Atlantic .......................... Region 03 South Atlantic-Gulf .............. Region 04 Great Lakes ......................... Region 05 Ohio ..................................... Region 06 Tennessee ........................... Region 07 Upper Mississippi ................ Region 08 Lower Mississippi ................ Region 09 Souris-Red-Rainy ................ Region 10 Missouri ............................... Region 11 Arkansas-White-Red ........... Region 12 Texas-Gulf ........................... Region 13 Rio Grande .......................... Region 14 Upper Colorado ................... Region 15 Lower Colorado ................... Region 16 Great Basin ......................... Region 17 Pacific Northwest ................. Region 18 California ............................. Region 19 Alaska ................................. Region 20 Hawaii .................................
4,334 4,651
- -
90 -
46
320 -
15 - -
- 1,446
- 1 -
- - - -
14
- 2 6 - -
927 - 8 - -
4 - -
83 -
- 201
- - -
11 -
24 702
-
1 14
- -
419
- 30
- 3 -
- 6 -
12 1,375
26
1 243
26 90
853
1,593 76
- -
762,240 990,827
- -
28,459 -
11,836
71,675 -
1,919 - -
- 329,449
- (D)
-
- - - -
918
- (D)
876 - -
180,238 -
1,330 - -
335 - -
17,088 -
- 15,159
- - -
622 -
3,840 27,027
-
(D) 1,279
- -
68,620
- 3,587
- (D)
-
- 876
- 1,618
261,260
4,080 (D)
63,115 (D)
28,459
49,475 330,799 15,202
- -
465 450
- -
46 - 1
109
- - - -
- 88
- - -
- - - - 1
- - - - -
162 - 2 - -
2 - - 5 -
- - - - -
6 - -
35 -
- 1 - - 7
- 1 - - -
- - - 1
197
2 -
91 -
46
37 89
1 - -
131,124 125,356
- -
13,134 -
(D)
41,933 - - - -
- (D)
- - -
- - - -
(D)
- - - - -
30,506 -
(D)- -
(D)- -
826 -
- - - - -
285 - -
1,994 -
- (D)
- -
1,594
- (D)
- - -
- - -
(D)36,181
(D)
- 38,713
- 13,134
2,900
39,167 (D)
- -
174 190
- - 1 - -
26 - - - -
- 43
- - -
- - - - 1
- - - - -
67 - - - -
- - - 1 -
- - - - -
3 - - 9 -
- 1 - -
22
- 1 - - -
- - - 1
88
- -
16 - 1
9
58 - - -
31,508 72,578
- -
(D)- -
12,221 - - - -
- 12,366
- - -
- - - -
(D)
- - - - -
3,990 - - - -
- - -
(D)-
- - - - -
180 - -
90 -
- (D)
- -
1,868
- (D)
- - -
- - -
(D)7,838
- -
9,721 -
(D)
90 13,389
- - -
887 1,154
- -
43 -
39
152 -
13 - -
- 479
- 1 -
- - - - 9
- 2 4 - -
15 - 7 - -
4 - -
35 -
- 15
- - -
- -
24 37
-
- 4 - - 4
- 22
- 3 -
- 4 -
12 55
26
1 138
- 43
151 387
45 - -
258,127 316,249
- -
33,304 -
10,102
56,517 -
1,453 - -
- 134,699
- (D)
-
- - - -
(D)
- (D) (D)
- -
3,573 -
(D) - -
335 - -
5,764 -
- 1,547
- - -
- -
3,840 2,225
-
- 650
- -
(D)
- 2,081
- (D)
-
- (D)
- 1,618
(D)
4,080 (D)
53,662 -
33,304
16,721 123,998 10,324
- -
1,058 648
- -
11 -
10
112 - 3 - -
- 481
- - -
- - - - 5
- - 2 - -
239 - - - -
- - - 6 -
- 6 - - -
- - -
152 -
1 - - -
30
- 9 - - -
- 2 - -
251
- -
112 -
11
239 420
14 - -
152,497 123,235
- -
3,658 -
725
11,333 -
466 - -
- 73,400
- - -
- - - -
(D)
- -
(D) - -
45,704 - - - -
- - -
1,450 -
- 1,898
- - -
- - -
3,973 -
(D) - - -
8,774
- 1,506
- - -
- (D)
- -
50,734
- -
(D) -
3,658
9,031 73,624
2,535 - -
2,744 3,260
- -
64 -
21
95 - - - -
- 710
- - -
- - - - -
- - - - -
696 - 1 - -
- - -
46 -
- 180
- - -
11 - -
520 -
- 10
- -
390
- - - - -
- - - -
1,099
- -
32 26 64
531 951
41 - -
404,628 565,323
- -
17,619 -
2,491
20,821 - - - -
- 122,750
- - -
- - - - -
- - - - -
135,513 -
(D)- -
- - -
(D)-
- 14,114
- - -
622 - -
20,829 -
- 629
- -
59,326
- - - - -
- - - -
204,509
- -
(D)(D)
17,619
23,723 136,977
3,825 - -
See footnote(s) at end of table. --continued

2007 CENSUS OF AGRICULTURE 2008 FRIS – GENERAL DATA 121 USDA, National Agricultural Statistics Service
Table 29. Selected Crops Harvested by Chemigation and Water Source: 2008 and 2003 - Con. [Excludes institutional, research, and experimental farms and farms with horticulture. For meaning of abbreviations and symbols, see introductory text]
Soybeans for beans
Chemigation Water source 1
Commercial fertilizer Pesticide application Ground water from wells
On-farm surface water
Water from off-farm suppliers
Geographic area Farms
Irrigated acres
harvested Farms Acres Farms Acres Farms Acres Farms Acres Farms Acres
United States ............................. 2008 .. 2003 .. 2008 DATA Alabama ............................................... Alaska .................................................. Arizona ................................................. Arkansas .............................................. California .............................................. Colorado ............................................... Connecticut .......................................... Delaware .............................................. Florida .................................................. Georgia ................................................ Hawaii .................................................. Idaho .................................................... Illinois ................................................... Indiana ................................................. Iowa ..................................................... Kansas ................................................. Kentucky .............................................. Louisiana .............................................. Maine ................................................... Maryland .............................................. Massachusetts ..................................... Michigan ............................................... Minnesota ............................................. Mississippi ............................................ Missouri ................................................ Montana ............................................... Nebraska .............................................. Nevada ................................................. New Hampshire .................................... New Jersey .......................................... New Mexico .......................................... New York .............................................. North Carolina ...................................... North Dakota ........................................ Ohio ..................................................... Oklahoma ............................................. Oregon ................................................. Pennsylvania ........................................ Rhode Island ........................................ South Carolina ..................................... South Dakota ....................................... Tennessee ........................................... Texas ................................................... Utah ..................................................... Vermont ................................................ Virginia ................................................. Washington .......................................... West Virginia ........................................ Wisconsin ............................................. Wyoming .............................................. Water Resources Regions Region 01 New England ....................... Region 02 Mid-Atlantic ......................... Region 03 South Atlantic-Gulf .............. Region 04 Great Lakes ........................ Region 05 Ohio .................................... Region 06 Tennessee .......................... Region 07 Upper Mississippi ................ Region 08 Lower Mississippi ................ Region 09 Souris-Red-Rainy ................ Region 10 Missouri .............................. Region 11 Arkansas-White-Red ........... Region 12 Texas-Gulf .......................... Region 13 Rio Grande ......................... Region 14 Upper Colorado ................... Region 15 Lower Colorado ................... Region 16 Great Basin ......................... Region 17 Pacific Northwest ................ Region 18 California ............................. Region 19 Alaska ................................. Region 20 Hawaii .................................
23,024 21,062
69 - -
3,119 -
30 -
187 2
413
- -
485 563 252
2,148
39 448
- 199
-
406 665 860
1,208
8 10,541
- -
36
2 -
112 106
12
95 - 9 -
77
417 65
187 - -
51 5 1
207 -
- 472 660 579 442
36
1,425 4,847
111 12,023
2,331
70 -
19 -
- 9 - - -
7,044,546 5,346,276
8,779 - -
2,167,646 -
4,832 -
33,770 (D)
71,621
- -
90,497 102,279 48,946
396,613
6,173 184,976
- 26,119
-
73,986 100,513 712,268 488,319
624
2,272,944 - -
3,418
(D) -
14,839 18,939
1,702
23,793 -
363 -
12,741
79,296 27,325 30,607
- -
8,796 382 (D)
30,410 -
- 71,515
105,746 107,159 97,622
5,012
208,298 3,240,957
19,383 2,539,475
633,293 15,205
- 475
-
- 406
- - -
1,615 1,111
- - -
194 -
- -
12 -
30
- -
12 3 2
351
3 13
- 10
-
10 6 6
50
- 818
- - -
2 - - 7 2
12
- - - 2
38
- 25
- -
- - - 7 -
- 22 32 12 12
-
25 235
3 942
308
24 - - -
- - - - -
466,357 238,509
- - -
133,529 -
- -
613 -
1,434
- -
1,937 (D)(D)
72,474
44 6,575
- 1,557
-
1,398 822
3,130 22,202
-
207,602 - - -
(D)- -
1,080 (D)
1,535
- - -
(D)
4,790 -
3,650 - -
- - -
319 -
- 2,170 1,734
(D)1,694
-
3,074 144,776
(D)226,282
81,309
3,450 - - -
- - - - -
952 431
- - -
146 -
- - 9 - 3
- - 2 3 1
196
3 8 -
10
- 1 7
23 40
-
473 - - -
- - - 4 -
11 - - - -
5 - 5 - -
2 - - - -
- 21
3 1 5
-
10 188
3 501
215
5 - - -
- - - - -
301,167 113,035
- - -
92,779 -
- -
500 -
300
- -
(D)(D)(D)
49,121
(D)4,151
- 1,407
-
(D)922
21,925 14,112
-
109,237 - - -
- - -
620 -
2,320 - - - -
795 -
1,050 - -
(D)- - - -
- 2,641
300 (D)
636
- 1,100
126,947 (D)
119,957
47,986 1,050
- - -
- - - - -
21,340 19,702
18 - -
2,842 -
11 -
172 -
336
- -
454 479 239
1,971
28 415
- 148
-
260 639 840
1,050
- 10,397
- -
23
2 -
47 83
8
83 - - -
57
325 58
171 - -
1 3 -
180 -
- 344 452 401 370
14
1,311 4,571
98 11,518
2,204
54 - - -
- 3 - - -
6,448,846 4,851,532
1,860 - -
1,862,488 -
3,607 -
29,298 -
51,970
- -
89,053 88,668 48,212
382,680
5,262 168,413
- 20,281
-
46,851 100,076 691,105 473,942
-
2,188,152 - -
2,198
(D) -
7,405 15,019
1,852
19,263 - - -
9,613
57,533 26,589 28,433
- -
(D) (D)
- 28,403
-
- 51,787 70,183 73,834 91,323
(D)
198,545 2,956,283
17,424 2,406,182
568,862 13,031
- - -
- (D)
- - -
3,245 3,146
45 - -
771 -
3 -
30 -
175
- -
33 147
13
221 13 56
- 68
-
223 43
116 179
-
837 - -
16
- -
67 9 6
13
- 9 -
26
29 8 5 - -
47 2 1
34 -
- 162 312 295
84
18 155 842
13 1,131
226
5 - - -
- 2 - - -
619,824 407,184
5,433 - -
369,066 -
750 -
(D) -
21,187
- -
2,342 15,489
620
14,509 911
17,799 -
5,438
- 26,155
3,489 40,582 15,997
-
41,109 - -
1,220
- -
7,252 1,802
(D)
3,210 -
363 -
3,543
5,420 809 500
- -
7,830 (D) (D)
1,975 -
- 18,252 36,073 32,793
9,376
(D) 13,058
364,893 2,411
66,625
72,633 500
- - -
- (D)
- - -
928 776
11 - -
116 -
19 - 1 2 -
- - 9 4 2
46
- 2 - 2
-
10 - 3 -
8 568
- - -
- - 2
17 2
9 - - - 5
72
- 11
- -
6 - - 1 -
- 7
18 12 10
4 6
104 4
703
26 11
- 19
-
- 4 - - -
136,708 114,314
1,486 - -
28,182 -
475 -
(D)(D)
-
- -
252 454 (D)
8,664
- (D)
- (D)
-
1,220 -
70 -
624 67,183
- - -
- -
(D)2,738
(D)
1,940 - - -
385
16,733 -
1,674 - -
(D)- -
(D)-
- 1,526 2,059 1,582 1,045
792 361
23,364 500
95,418
7,888 1,674
- 475
-
- 24
- - -
See footnote(s) at end of table. --continued

122 2008 FRIS – GENERAL DATA 2007 CENSUS OF AGRICULTURE USDA, National Agricultural Statistics Service
Table 29. Selected Crops Harvested by Chemigation and Water Source: 2008 and 2003 - Con. [Excludes institutional, research, and experimental farms and farms with horticulture. For meaning of abbreviations and symbols, see introductory text]
Beans, dry edible
Chemigation Water source 1
Commercial fertilizer Pesticide application Ground water from wells
On-farm surface water
Water from off-farm suppliers
Geographic area Farms
Irrigated acres
harvested Farms Acres Farms Acres Farms Acres Farms Acres Farms Acres
United States .............................2008 .. 2003 .. 2008 DATA Alabama ............................................... Alaska ................................................... Arizona ................................................. Arkansas ............................................... California .............................................. Colorado ............................................... Connecticut ........................................... Delaware .............................................. Florida ................................................... Georgia ................................................. Hawaii ................................................... Idaho ..................................................... Illinois .................................................... Indiana .................................................. Iowa ...................................................... Kansas .................................................. Kentucky ............................................... Louisiana .............................................. Maine .................................................... Maryland ............................................... Massachusetts ...................................... Michigan ............................................... Minnesota ............................................. Mississippi ............................................ Missouri ................................................ Montana ................................................ Nebraska .............................................. Nevada ................................................. New Hampshire .................................... New Jersey ........................................... New Mexico .......................................... New York .............................................. North Carolina ...................................... North Dakota ........................................ Ohio ...................................................... Oklahoma ............................................. Oregon .................................................. Pennsylvania ........................................ Rhode Island ........................................ South Carolina ...................................... South Dakota ........................................ Tennessee ............................................ Texas .................................................... Utah ...................................................... Vermont ................................................ Virginia .................................................. Washington ........................................... West Virginia ........................................ Wisconsin ............................................. Wyoming ............................................... Water Resources Regions Region 01 New England ....................... Region 02 Mid-Atlantic .......................... Region 03 South Atlantic-Gulf .............. Region 04 Great Lakes ......................... Region 05 Ohio ..................................... Region 06 Tennessee ........................... Region 07 Upper Mississippi ................ Region 08 Lower Mississippi ................ Region 09 Souris-Red-Rainy ................ Region 10 Missouri ............................... Region 11 Arkansas-White-Red ........... Region 12 Texas-Gulf ........................... Region 13 Rio Grande .......................... Region 14 Upper Colorado ................... Region 15 Lower Colorado ................... Region 16 Great Basin ......................... Region 17 Pacific Northwest ................. Region 18 California ............................. Region 19 Alaska ................................. Region 20 Hawaii .................................
2,849 2,697
4 -
18 21
245
227 - - 2
11
- 749
6 19
2
27 - - 2 -
- 51 84
- -
85 368
- - 2
15 35
- 55
-
2 50
- - 3
4
18 60
- -
2 484
- 12
186
2 39 18 53 17
19 77 13 61
859
13 61 13 58 18
-
1,283 245
- -
431,329 458,265
54 -
3,228 9,530
41,230
35,305 - -
(D) 3,219
-
63,665 980 506 (D)
8,242
- -
(D) -
- 9,637
28,747 - -
9,424 127,985
- -
(D)
9,130 37
- 11,227
-
(D) 4,756
- -
15
2,533 (D)
8,545 - -
(D) 20,826
- 5,888
24,743
(D) (D)
3,548 9,737
406
57 31,035
7,530 10,843
205,588
4,672 8,795 1,647
13,151 3,228
-
89,247 41,230
- -
359 452
- -
10 -
12
38 - - - -
- 123
- - -
2 - - - -
- 1
19 - -
4 62
- - -
6 - -
17 -
- 3 - - -
2 9 5 - -
- 41
- 2 3
- - - 1 -
9 19
- 14
114
2 5 5 1
10
- 167
12 - -
73,830 70,279
- -
1,632 -
2,602
10,222 - - - -
- 10,901
- - -
(D)- - - -
- (D)
5,744 - -
400 17,566
- - -
(D)- -
2,364 -
- 345
- - -
(D)(D)(D)
- -
- 10,310
- (D)
420
- - -
(D)-
(D)5,869
- 1,198
30,294
(D)(D)
495 (D)
1,632
- 21,556
2,602 - -
167 243
- - 8 -
11
20 - - - -
- 25
- - -
- - - - -
- 1 - - -
- 57
- - -
6 - - 7 -
- 3 - - -
- 9 5 - -
- 15
- - -
- - - 1 -
9 - - 7
77
- 5 5 1 8
-
43 11
- -
48,696 36,561
- -
1,626 -
4,942
6,482 - - - -
- 6,465
- - -
- - - - -
- (D)
- - -
- 13,756
- - -
(D)- -
560 -
- 585
- - -
- (D)(D)
- -
- 5,043
- - -
- - -
(D)-
(D)- -
560 20,238
-
(D)845 (D)
1,626
- 12,093
4,942 - -
1,025 1,207
4 -
13 13
186
132 - - 2 7
-
50 6 6 2
27
- - - -
- 36 80
- -
- 213
- - 2
14 33
- 43
-
2 19
- - -
2 18 60
- -
- 7 -
12 36
- 35 11 38
4
19 75
5 50
426
13 61 13
- 13
-
76 186
- -
200,983 243,051
54 -
1,915 9,130
11,303
22,198 - -
(D) 1,824
-
6,987 980 493 (D)
8,242
- - - -
- 7,690
28,307 - -
- 67,201
- -
(D)
1,897 33
- 9,711
-
(D) 1,790
- - -
(D) (D)
8,545 - -
- 2,498
- 5,888 2,726
- 45
2,138 7,790
393
57 30,953
7,130 9,765
103,105
4,672 8,795 1,647
- 1,915
-
11,275 11,303
- -
689 243
- - 4 8
25
40 - - - 7
-
146 -
13 -
- - - 2 -
- 12
6 - -
22 51
- - -
1 5 - 8 -
- 16
- - 3
- 9 - - -
2 299
- -
10
2 7
10 12 13
9 2 8
11 114
- 1 -
10 4
-
461 25
- -
58,425 39,137
- -
(D) 400
7,510
9,382 - - -
1,395
- 15,862
- 13
-
- - -
(D) -
- 1,707
446 - -
3,808 5,580
- - -
(D) 7 -
856 -
- 495
- -
15
- 9 - - -
(D) 4,939
- -
4,105
(D) 567
1,410 1,707
13
9 (D)
400 (D)
21,571
- (D)
- 1,600
(D)
- 21,296
7,510 - -
1,397 1,375
- - 1 -
158
85 - - - -
- 579
- - -
- - - 2 -
- 8 - - -
63 136
- - -
1 - - 4 -
- 31
- - -
2 - - - -
- 182
- -
145
2 - - 8 -
- - - 2
386
- - -
48 1
-
792 158
- -
183,853 185,691
- -
(D)-
27,963
7,453 - - - -
- 42,416
- - -
- - -
(D)-
- 240
- - -
5,616 55,639
- - -
(D)- -
660 -
- 2,540
- - -
(D)- - - -
- 13,399
- -
18,182
(D)- -
240 -
- - -
(D)85,345
- - -
11,551 (D)
-
58,355 27,963
- -
See footnote(s) at end of table. --continued


124 2008 FRIS – GENERAL DATA 2007 CENSUS OF AGRICULTURE USDA, National Agricultural Statistics Service
Table 29. Selected Crops Harvested by Chemigation and Water Source: 2008 and 2003 - Con. [Excludes institutional, research, and experimental farms and farms with horticulture. For meaning of abbreviations and symbols, see introductory text]
Other small grains (oats, rye, etc.)
Chemigation Water source 1
Commercial fertilizer Pesticide application Ground water from wells
On-farm surface water
Water from off-farm suppliers
Geographic area Farms
Irrigated acres
harvested Farms Acres Farms Acres Farms Acres Farms Acres Farms Acres
United States .............................2008 .. 2003 .. 2008 DATA Alabama ............................................... Alaska ................................................... Arizona ................................................. Arkansas ............................................... California .............................................. Colorado ............................................... Connecticut ........................................... Delaware .............................................. Florida ................................................... Georgia ................................................. Hawaii ................................................... Idaho ..................................................... Illinois .................................................... Indiana .................................................. Iowa ...................................................... Kansas .................................................. Kentucky ............................................... Louisiana .............................................. Maine .................................................... Maryland ............................................... Massachusetts ...................................... Michigan ............................................... Minnesota ............................................. Mississippi ............................................ Missouri ................................................ Montana ................................................ Nebraska .............................................. Nevada ................................................. New Hampshire .................................... New Jersey ........................................... New Mexico .......................................... New York .............................................. North Carolina ...................................... North Dakota ........................................ Ohio ...................................................... Oklahoma ............................................. Oregon .................................................. Pennsylvania ........................................ Rhode Island ........................................ South Carolina ...................................... South Dakota ........................................ Tennessee ............................................ Texas .................................................... Utah ...................................................... Vermont ................................................ Virginia .................................................. Washington ........................................... West Virginia ........................................ Wisconsin ............................................. Wyoming ............................................... Water Resources Regions Region 01 New England ....................... Region 02 Mid-Atlantic .......................... Region 03 South Atlantic-Gulf .............. Region 04 Great Lakes ......................... Region 05 Ohio ..................................... Region 06 Tennessee ........................... Region 07 Upper Mississippi ................ Region 08 Lower Mississippi ................ Region 09 Souris-Red-Rainy ................ Region 10 Missouri ............................... Region 11 Arkansas-White-Red ........... Region 12 Texas-Gulf ........................... Region 13 Rio Grande .......................... Region 14 Upper Colorado ................... Region 15 Lower Colorado ................... Region 16 Great Basin ......................... Region 17 Pacific Northwest ................. Region 18 California ............................. Region 19 Alaska ................................. Region 20 Hawaii .................................
2,975 2,825
3 -
73 61
427
336 - 2
25 214
-
269 4 - 3
2 - - - -
- 5
23 2 3
138
96 21
- -
59 -
40 17
-
13 78
- 1 7
33
1 48
598 -
- 179
- 18
176
1 2
289 9 2
1
42 66
4 452
36 57
100 383
73
480 526 452
- -
344,195 240,264
194 -
6,595 1,952
114,973
21,974 -
(D) 2,820
17,660
- 42,764
414 -
180
(D) - - - -
- 540
1,487 (D) (D)
13,983
6,216 2,490
- -
11,918 -
5,486 1,357
-
4,194 17,029
- (D)
155
1,118 (D)
4,724 29,763
-
- 13,687
- 1,930
16,165
(D) (D)
26,315 1,900
(D)
(D) 2,373 3,350
132 42,738
6,358 9,999
15,704 7,560 6,595
30,914 68,587
121,212 - -
386 149
- - 3 -
101
19 - - 2
51
- - - - -
2 - - - -
- - - - -
2 94
2 - -
12 - - - -
3 9 - - -
2 -
14 18
-
- 15
- 5
32
- -
53 - -
- 5 - -
150
4 14 11
4 3
17 24
101 - -
43,628 21,646
- -
855 -
18,377
3,040 - -
(D)1,020
- - - - -
(D)- - - -
- - - - -
(D)(D)(D)
- -
2,009 - - - -
1,514 1,356
- - -
(D)-
(D)2,100
-
- 1,972
- 1,330 1,506
- -
1,680 - -
- 1,330
- -
11,630
1,629 (D)
1,679 (D)
855
2,010 3,328
18,377 - -
137 51
- - - - -
- - - - -
- - - - -
- - - - -
- - - - -
6 94
1 - -
5 - - - -
- - - - -
- -
14 9 -
- - - - 8
- - - - -
- - - -
108
- 14
4 1 -
10 - - - -
9,259 4,473
- - - - -
- - - - -
- - - - -
- - - - -
- - - - -
190 (D)(D)
- -
1,409 - - - -
- - - - -
- -
(D)900
-
- - - -
80
- - - - -
- - - -
6,380
- (D)
1,079 (D)
-
1,050 - - - -
1,248 927
- - 5
61 296
57
- 2
23 155
-
50 4 - 3
2 - - - -
- 3
19 2 3
29 96 19
- -
32 - - 8 -
10 38
- - 1
1 1
48 202
-
- 48
- 17 13
- 2
179 7 2
1
37 66
4 160
14 57 48
120 5
112 133 301
- -
162,800 121,692
- -
1,095 1,952
70,362
14,295 -
(D) 2,720
13,556
- 7,116
414 -
180
(D) - - - -
- (D)
1,402 (D) (D)
1,380 6,216 2,098
- -
10,298 - -
896 -
3,834 9,469
- -
(D)
(D) (D)
4,724 3,400
-
- 2,003
- 1,390
975
- (D)
16,301 1,560
(D)
(D) 2,068 3,350
132 14,699
4,858
10,009 12,859
(D) 1,095
4,790
16,694 72,314
- -
702 459
3 -
63 -
230
32 - - -
71
- 58
- - -
- - - - -
- 2 4 - -
64 - 3 - -
- -
40 - -
8 17
- - 6
5 - -
60 -
- 4 - 3
29
- -
120 4 -
- 5 - -
96
8 -
19 22 63
54 73
238 - -
101,687 32,951
194 -
3,351 -
41,697
1,913 - - -
5,214
- 9,036
- - -
- - - - -
- (D) (D)
- -
5,730 -
592 - -
- -
5,486 - -
2,654 3,850
- -
(D)
(D) - -
14,310 -
- 680
- 540
6,035
- -
11,024 340
-
- 310
- -
11,470
2,654 -
760 1,252 3,351
14,803 11,472 44,251
- -
1,453 1,528
- -
11 -
141
258 - - 2 -
- 188
- - -
- - - - -
- - - - -
70 - 1 - -
27 - - 9 -
- 31
- 1 -
27 - -
420 -
- 133
- -
134
1 - 2 - -
- - - -
221
19 -
44 325
11
316 356 158
- -
124,617 (D)
- -
3,859 -
29,164
8,186 - -
(D)-
- 27,412
- - -
- - - - -
- - - - -
7,153 -
(D)- -
1,630 - -
461 -
- 4,172
- (D)
-
888 - -
12,473 -
- 11,004
- -
17,875
(D)-
(D)- -
- - - -
25,569
2,660 -
2,985 5,103 3,859
11,561 41,221 31,359
- -
See footnote(s) at end of table. --continued

2007 CENSUS OF AGRICULTURE 2008 FRIS – GENERAL DATA 125 USDA, National Agricultural Statistics Service
Table 29. Selected Crops Harvested by Chemigation and Water Source: 2008 and 2003 - Con. [Excludes institutional, research, and experimental farms and farms with horticulture. For meaning of abbreviations and symbols, see introductory text]
Alfalfa and alfalfa mixtures (dry hay, greenchop, and silage)
Chemigation Water source 1
Commercial fertilizer Pesticide application Ground water from wells
On-farm surface water
Water from off-farm suppliers
Geographic area Farms
Irrigated acres
harvested Farms Acres Farms Acres Farms Acres Farms Acres Farms Acres
United States ............................. 2008 .. 2003 .. 2008 DATA Alabama ............................................... Alaska .................................................. Arizona ................................................. Arkansas .............................................. California .............................................. Colorado ............................................... Connecticut .......................................... Delaware .............................................. Florida .................................................. Georgia ................................................ Hawaii .................................................. Idaho .................................................... Illinois ................................................... Indiana ................................................. Iowa ..................................................... Kansas ................................................. Kentucky .............................................. Louisiana .............................................. Maine ................................................... Maryland .............................................. Massachusetts ..................................... Michigan ............................................... Minnesota ............................................. Mississippi ............................................ Missouri ................................................ Montana ............................................... Nebraska .............................................. Nevada ................................................. New Hampshire .................................... New Jersey .......................................... New Mexico .......................................... New York .............................................. North Carolina ...................................... North Dakota ........................................ Ohio ..................................................... Oklahoma ............................................. Oregon ................................................. Pennsylvania ........................................ Rhode Island ........................................ South Carolina ..................................... South Dakota ....................................... Tennessee ........................................... Texas ................................................... Utah ..................................................... Vermont ................................................ Virginia ................................................. Washington .......................................... West Virginia ........................................ Wisconsin ............................................. Wyoming .............................................. Water Resources Regions Region 01 New England ....................... Region 02 Mid-Atlantic ......................... Region 03 South Atlantic-Gulf .............. Region 04 Great Lakes ........................ Region 05 Ohio .................................... Region 06 Tennessee .......................... Region 07 Upper Mississippi ................ Region 08 Lower Mississippi ................ Region 09 Souris-Red-Rainy ................ Region 10 Missouri .............................. Region 11 Arkansas-White-Red ........... Region 12 Texas-Gulf .......................... Region 13 Rio Grande ......................... Region 14 Upper Colorado ................... Region 15 Lower Colorado ................... Region 16 Great Basin ......................... Region 17 Pacific Northwest ................ Region 18 California ............................. Region 19 Alaska ................................. Region 20 Hawaii .................................
48,315 46,179
4 -
553 -
2,808
6,079 -
18 -
53
- 6,801
23 76 21
768
16 4 -
25
- 175 342
- 16
5,061 2,956 1,133
- 22
3,798
7 39
178 4
166
2,864 9 - 3
532
4 849
7,418 -
25 2,152
2 221
3,090
- 103
99 274
33
4 504
6 84
12,650
2,201 387
3,764 5,405
948
7,030 11,878
2,945 - -
6,187,983 6,204,874
20 -
280,741 -
968,715
631,443 -
887 -
1,336
- 823,523
970 5,376
844
176,976 (D)
440 -
1,203
- 14,559 20,616
- 560
657,151 238,408 304,932
- 390
231,913
219 1,046
17,627 535
21,698
347,117 569
- 114
62,859
64 147,375 517,526
-
1,062 272,641
(D) 20,734
415,474
- 4,233 2,516
21,280 1,585
40
36,371 510
6,341 1,489,418
387,203 77,768
333,905 340,744 323,132
742,150
1,431,044 989,743
- -
3,685 3,724
- -
157 -
332
469 - - - 3
-
267 - - -
58 - - - -
- -
16 - -
339 268 185
- 13
366
- - 2 -
6 100
- - -
2 -
171 579
-
- 164
- 6
182
- 13
3 - -
- 22
- -
922
340 53
363 212 242
633 538 344
- -
859,111 731,710
- -
127,218 -
166,008
54,390 - - -
210
- 41,919
- - -
43,247 - - - -
- -
304 - -
46,708 49,353 51,980
- 13
60,487
- -
(D)-
3,378 24,657
- - -
(D)-
29,055 42,436
-
- 60,839
- 3,163
52,886
- 13
210 - -
- 3,467
- -
171,501
63,170 16,670 49,139 46,188
145,913
83,208 124,885 154,747
- -
1,819 1,481
- -
46 -
416
56 - - - -
- 69
- - -
214 - - - -
- - - - -
21 94 67
- -
174 - - - -
20 52
- - -
2 -
146 317
-
- 93
- -
32
- - - - -
- - - -
171
297 113 123
65 65
365 201 419
- -
425,254 343,827
- -
22,024 -
108,905
6,030 - - - -
- 24,267
- - -
78,212 - - - -
- - - - -
5,408 3,760
24,906 - -
43,030 - - - -
2,739 17,800
- - -
(D)-
27,120 26,712
-
- 27,741
- -
6,340
- - - - -
- - - -
19,157
83,471 25,970 19,862 26,685 35,619
50,158 63,867
100,465 - -
12,282 13,026
- -
206 -
1,968
934 -
14 -
23
- 1,131
23 49 21
661
2 - -
13
- 98
299 - 2
102
2,546 488
- 19
699
3 -
53 1
152 686
1 - -
163 -
494 590
-
5 403
- 186 247
- 55 23
166 13
2
444 2
64 3,522
1,203
368 747 122 366
1,391 1,789 2,005
- -
2,379,074 2,395,640
- -
86,295 -
614,488
171,008 -
452 -
1,021
- 248,112
970 3,996
844
170,880 (D)
- -
338
- 9,678
18,276 -
(D)
17,779 210,939 207,097
- 278
114,362
30 -
7,060 (D)
18,838
132,631 (D)
- -
12,935 -
107,122 113,846
-
325 48,418
- 18,797 41,628
- 1,728 1,021
15,236 408
(D)
33,488 (D)
4,801 371,564
259,124 75,603
152,193 5,759
99,365
338,125 399,996 620,577
- -
12,016 9,103
4 -
139 -
779
1,292 - 4 -
44
- 1,899
- 28
-
- 7 - -
15
- 118
30 -
14
1,999 256 466
- 3
973
7 39 61
2
16 1,188
8 - 3
43
4 69
1,123 -
23 627
2 44
687
- 57 90
152 12
2
69 - 5
2,676
203 6
869 1,769
212
1,151 3,931
812 - -
1,352,443 1,044,074
20 -
47,555 -
201,776
134,074 -
270 -
469
- 181,458
- (D)
-
- 175
- -
874
- 8,395 2,023
- (D)
283,393
7,503 57,402
- 112
43,718
144 1,046 3,497
(D)
2,860 91,301
(D) -
114
9,872 64
8,085 95,370
-
782 46,591
(D) 2,256
119,088
- 2,349 1,649 9,553
885
(D) 3,177
- (D)
404,752
27,095 2,300
84,588 90,189 51,345
131,655 327,702 214,277
- -
27,603 27,048
- -
335 -
1,513
4,115 - 3 - -
- 4,127
- 2 -
107 7 4 - -
- -
22 - -
3,213 208 297
- -
2,310 3 -
70 1
5
1,113 - - -
345 -
355 5,889
-
7 1,190
- -
2,362
- 13
- 2 8
- 5 4
19 6,990
836
19 2,487 3,612
565
4,794 6,642 1,607
- -
2,990,549 2,919,620
- -
189,384 -
491,991
354,673 -
165 - -
- 406,943
- (D)
-
6,931 (D)
440 - -
- -
785 - -
367,677 21,786 64,806
- -
101,994 45
- 7,150
(D)
900 131,369
- - -
40,052 -
40,253 315,730
-
605 180,350
- -
266,118
- 815
- (D)
292
- 100 (D)
925 746,995
104,559
2,294 134,223 256,943 217,511
306,215 727,144 491,983
- -
See footnote(s) at end of table. --continued

126 2008 FRIS – GENERAL DATA 2007 CENSUS OF AGRICULTURE USDA, National Agricultural Statistics Service
Table 29. Selected Crops Harvested by Chemigation and Water Source: 2008 and 2003 - Con. [Excludes institutional, research, and experimental farms and farms with horticulture. For meaning of abbreviations and symbols, see introductory text]
All other hay (dry hay, greenchop, and silage)
Chemigation Water source 1
Commercial fertilizer Pesticide application Ground water from wells
On-farm surface water
Water from off-farm suppliers
Geographic area Farms
Irrigated acres
harvested Farms Acres Farms Acres Farms Acres Farms Acres Farms Acres
United States .............................2008 .. 2003 .. 2008 DATA Alabama ............................................... Alaska ................................................... Arizona ................................................. Arkansas ............................................... California .............................................. Colorado ............................................... Connecticut ........................................... Delaware .............................................. Florida ................................................... Georgia ................................................. Hawaii ................................................... Idaho ..................................................... Illinois .................................................... Indiana .................................................. Iowa ...................................................... Kansas .................................................. Kentucky ............................................... Louisiana .............................................. Maine .................................................... Maryland ............................................... Massachusetts ...................................... Michigan ............................................... Minnesota ............................................. Mississippi ............................................ Missouri ................................................ Montana ................................................ Nebraska .............................................. Nevada ................................................. New Hampshire .................................... New Jersey ........................................... New Mexico .......................................... New York .............................................. North Carolina ...................................... North Dakota ........................................ Ohio ...................................................... Oklahoma ............................................. Oregon .................................................. Pennsylvania ........................................ Rhode Island ........................................ South Carolina ...................................... South Dakota ........................................ Tennessee ............................................ Texas .................................................... Utah ...................................................... Vermont ................................................ Virginia .................................................. Washington ........................................... West Virginia ........................................ Wisconsin ............................................. Wyoming ............................................... Water Resources Regions Region 01 New England ....................... Region 02 Mid-Atlantic .......................... Region 03 South Atlantic-Gulf .............. Region 04 Great Lakes ......................... Region 05 Ohio ..................................... Region 06 Tennessee ........................... Region 07 Upper Mississippi ................ Region 08 Lower Mississippi ................ Region 09 Souris-Red-Rainy ................ Region 10 Missouri ............................... Region 11 Arkansas-White-Red ........... Region 12 Texas-Gulf ........................... Region 13 Rio Grande .......................... Region 14 Upper Colorado ................... Region 15 Lower Colorado ................... Region 16 Great Basin ......................... Region 17 Pacific Northwest ................. Region 18 California ............................. Region 19 Alaska ................................. Region 20 Hawaii .................................
29,553 27,449
63 4
548 117
3,376
3,358 -
17 306 484
-
2,209 5
12 1
158
16 29
- 35
- -
64 35 90
3,008
515 558
- 15
1,769
- 640
26 -
323 3,878
29 -
50
132 28
2,298 2,261
-
15 1,423
- 20
1,638
- 99
1,565 15 25
28 62 79 26
3,987
1,937 1,852 1,477 3,101
626
2,212 8,721 3,737
4 -
3,351,986 3,245,618
2,998 842
61,995 12,336
556,013
441,727 -
438 31,718 37,022
-
182,393 645 786 (D)
17,453
693 1,620
- 1,936
- -
2,535 (D)
2,827
362,777 34,503
192,482 -
581
93,528 -
35,438 1,295
-
34,981 354,232
558 -
2,505
10,510 1,118
175,291 126,581
-
2,129 149,682
- 2,500
411,808
- 3,588
113,551 1,081
947
1,108 4,670
10,210 988
643,642
160,726 145,241 121,149 392,631 64,214
287,526 817,493 582,379
842 -
3,525 3,086
2 1
360 -
862
164 - -
80 -
- 306
- - -
33 7 - - -
- - - - -
359 -
117 - -
183 -
89 1 -
14 125
- -
12
3 4
266 264
-
1 132
- -
140
- -
184 - 9
2 - - -
289
115 263 115 157 362
355 792 881
1 -
500,401 341,005
(D)(D)
54,046 -
158,091
39,795 - -
4,550 -
- 11,686
- - -
2,279 420
- - -
- - - - -
42,184 -
17,449 - -
15,272 -
910 (D)
-
4,727 19,164
- -
1,114
(D)450
46,530 8,434
-
(D)31,033
- -
40,010
- -
8,394 -
444
(D)- - -
64,354
20,617 41,046
9,825 34,985 54,246
24,663 79,468
161,841 (D)
-
616 718
2 -
11 -
145
22 - - 7 -
- 8 - - -
- - - - -
- - - - -
63 -
13 - -
14 - - - -
3 4 - -
11
3 -
108 155
-
8 22
- -
17
- -
28 - -
- - - -
25
49 71
5 24 11
168
90 145
- -
95,815 55,515
(D)-
2,445 -
49,214
4,590 - -
2,450 -
- 1,600
- - -
- - - - -
- - - - -
7,058 -
3,266 - -
1,760 - - - -
1,920 590
- -
914
(D)-
13,031 1,847
-
280 2,460
- -
(D)
- -
3,764 - -
- - - -
3,708
9,715 5,096 1,900 4,610 2,445
5,113
10,250 49,214
- -
7,819 6,573
9 4
190 40
1,556
543 -
16 283 162
-
205 5
10 1
127
- 29
- 30
- -
52 1 -
17 490 216
- 15
734
- 103
5 -
227 717
25 -
13
8 4
1,315 81
-
- 487
- 15 84
- 86
567 15
3
6 55 56 14
959
629 1,209
647 115 192
305
1,384 1,573
4 -
916,199 758,309
(D) 842
23,169 6,800
332,748
53,007 -
(D) 22,101 17,887
-
50,466 645 (D) (D)
16,120
- 1,620
- 385
- -
2,315 (D)
-
3,605 27,653 31,901
- 581
61,907
- 1,313
403 -
29,423 37,675
378 -
387
884 85
138,980 12,638
-
- 31,921
- 1,745 5,286
- 1,732
41,963 1,081
(D)
(D) 3,265 8,525
(D) 61,351
99,973
117,068 53,298
5,410 23,369
46,139
114,697 336,513
842 -
9,597 8,471
55 -
140 69
766
857 - 1
93 344
-
426 - 2 -
31 16
- - 7
- -
10 34 90
1,260
- 229
- 3
591
- 535
9 -
105 1,769
4 -
33
5 21
524 433
-
15 400
- 9
711
- 18
1,085 8
21
20 3
40 10
1,261
385 515 405
1,133 142
586
3,171 794
- -
1,338,828 1,240,942
2,438 -
5,251 7,336
149,408
189,965 -
(D) 12,077 16,555
-
41,182 -
(D) -
1,333 693
- -
1,551
- -
(D) (D)
2,827
223,688 -
120,038 -
(D)
12,399 -
34,237 480
-
8,368 171,222
180 -
1,974
194 978
21,213 23,543
-
2,145 23,465
- 1,295
258,833
- 1,916
71,287 960 907
888 985
6,485 100
347,301
30,766 22,590 32,743
205,392 5,451
136,203 320,366 154,488
- -
14,444 13,174
1 -
323 25
2,080
2,040 - - 2 6
-
1,619 - - -
- - - - -
- - 2 - -
1,866 25
209 - -
501 - 4
12 -
5 1,476
- - 6
122
3 832
1,767 -
- 580
- 5
933
- -
19 - 1
2 5 - 2
1,917
950 492 530
1,879 397
1,437 4,401 2,412
- -
1,430,196 1,302,489
(D)-
41,539 3,000
316,435
208,552 - -
(D)3,000
-
95,765 - - -
- - - - -
- -
(D)- -
140,079 7,500
45,144 - -
26,656 -
560 412
-
1,060 150,000
- -
264
9,432 55
31,639 91,180
-
- 96,876
- 780
158,693
- -
5,279 -
(D)
(D)780
- (D)
250,625
36,018 23,571 45,954
184,970 43,358
110,265 394,345 334,856
- -
See footnote(s) at end of table. --continued

2007 CENSUS OF AGRICULTURE 2008 FRIS – GENERAL DATA 127 USDA, National Agricultural Statistics Service
Table 29. Selected Crops Harvested by Chemigation and Water Source: 2008 and 2003 - Con. [Excludes institutional, research, and experimental farms and farms with horticulture. For meaning of abbreviations and symbols, see introductory text]
Peanuts for nuts
Chemigation Water source 1
Commercial fertilizer Pesticide application Ground water from wells
On-farm surface water
Water from off-farm suppliers
Geographic area Farms
Irrigated acres
harvested Farms Acres Farms Acres Farms Acres Farms Acres Farms Acres
United States ............................. 2008 .. 2003 .. 2008 DATA Alabama ............................................... Alaska .................................................. Arizona ................................................. Arkansas .............................................. California .............................................. Colorado ............................................... Connecticut .......................................... Delaware .............................................. Florida .................................................. Georgia ................................................ Hawaii .................................................. Idaho .................................................... Illinois ................................................... Indiana ................................................. Iowa ..................................................... Kansas ................................................. Kentucky .............................................. Louisiana .............................................. Maine ................................................... Maryland .............................................. Massachusetts ..................................... Michigan ............................................... Minnesota ............................................. Mississippi ............................................ Missouri ................................................ Montana ............................................... Nebraska .............................................. Nevada ................................................. New Hampshire .................................... New Jersey .......................................... New Mexico .......................................... New York .............................................. North Carolina ...................................... North Dakota ........................................ Ohio ..................................................... Oklahoma ............................................. Oregon ................................................. Pennsylvania ........................................ Rhode Island ........................................ South Carolina ..................................... South Dakota ....................................... Tennessee ........................................... Texas ................................................... Utah ..................................................... Vermont ................................................ Virginia ................................................. Washington .......................................... West Virginia ........................................ Wisconsin ............................................. Wyoming .............................................. Water Resources Regions Region 01 New England ....................... Region 02 Mid-Atlantic ......................... Region 03 South Atlantic-Gulf .............. Region 04 Great Lakes ........................ Region 05 Ohio .................................... Region 06 Tennessee .......................... Region 07 Upper Mississippi ................ Region 08 Lower Mississippi ................ Region 09 Souris-Red-Rainy ................ Region 10 Missouri .............................. Region 11 Arkansas-White-Red ........... Region 12 Texas-Gulf .......................... Region 13 Rio Grande ......................... Region 14 Upper Colorado ................... Region 15 Lower Colorado ................... Region 16 Great Basin ......................... Region 17 Pacific Northwest ................ Region 18 California ............................. Region 19 Alaska ................................. Region 20 Hawaii .................................
2,535 2,115
53 - - - -
- - -
82 1,268
2 - - - -
- - 1 - -
- - - - -
- - - - -
15 -
65 - -
55 - - -
114
- -
862 - -
18 - - - -
- -
1,600 - -
- - 1 - -
115 816
1 - -
- - - - 2
540,577 (D)
9,988 - - - -
- - -
22,014 227,591
(D)
- - - -
- -
(D) - -
- - - - -
- - - - -
(D) -
6,031 - -
9,020 - - -
10,864
- -
248,473 - -
1,045 - - - -
- -
277,533 - -
- -
(D) - -
20,285 (D) (D)
- -
- - - -
(D)
502 320
- - - - -
- - - 2
38
- - - - -
- - - - -
- - - - -
- - - - -
2 - - - -
12 - - - -
- -
448 - -
- - - - -
- -
40 - -
- - - - -
21 440
1 - -
- - - - -
127,898 57,782
- - - - -
- - -
(D)5,283
- - - - -
- - - - -
- - - - -
- - - - -
(D)- - - -
1,710 - - - -
- -
118,430 - -
- - - - -
- -
6,083 - -
- - - - -
(D)116,402
(D)- -
- - - - -
163 111
- - - - -
- - - 2
34
- - - - -
- - - - -
- - - - -
- - - - -
- - - - -
12 - - - 2
- -
113 - -
- - - - -
- -
38 - -
- - - - -
16 109
- - -
- - - - -
33,842 10,765
- - - - -
- - -
(D)6,390
- - - - -
- - - - -
- - - - -
- - - - -
- - - - -
2,444 - - -
(D)
- -
23,958 - -
- - - - -
- -
7,440 - -
- - - - -
3,804 22,598
- - -
- - - - -
1,945 1,701
22 - - - -
- - -
73 862
- - - - -
- - 1 - -
- - - - -
- - - - -
14 -
15 - -
52 - - -
49
- -
854 - -
3 - - - -
- -
1,024 - -
- - 1 - -
112 807
1 - -
- - - - -
480,465 (D)
4,799 - - - -
- - -
20,084 181,168
- - - - -
- -
(D) - -
- - - - -
- - - - -
(D) -
(D) - -
8,720 - - -
9,291
- -
250,091 - -
(D) - - - -
- -
(D) - -
- -
(D) - -
19,985 242,096
(D) - -
- - - - -
755 561
30 - - - -
- - -
11 562
- - - - -
- - - - -
- - - - -
- - - - -
- -
50 - -
- - - -
67
- -
21 - -
14 - - - -
- -
734 - -
- - - - -
- 21
- - -
- - - - -
87,622 60,985
4,195 - - - -
- - -
1,930 53,443
- - - - -
- - - - -
- - - - -
- - - - -
- -
4,325 - -
- - - -
3,187
- -
19,797 - -
745 - - - -
- -
67,825 - -
- - - - -
- 19,797
- - -
- - - - -
20 11
3 - - - -
- - - - -
2 - - - -
- - - - -
- - - - -
- - - - -
1 - 2 - -
6 - - - 2
- - - - -
4 - - - -
- -
11 - -
- - - - -
6 1 - - -
- - - - 2
3,177 1,858
994 - - - -
- - - - -
(D)- - - -
- - - - -
- - - - -
- - - - -
(D)-
(D)- -
840 - - -
(D)
- - - - -
360 - - - -
- -
1,562 - -
- - - - -
(D)(D)
- - -
- - - -
(D)
See footnote(s) at end of table. --continued
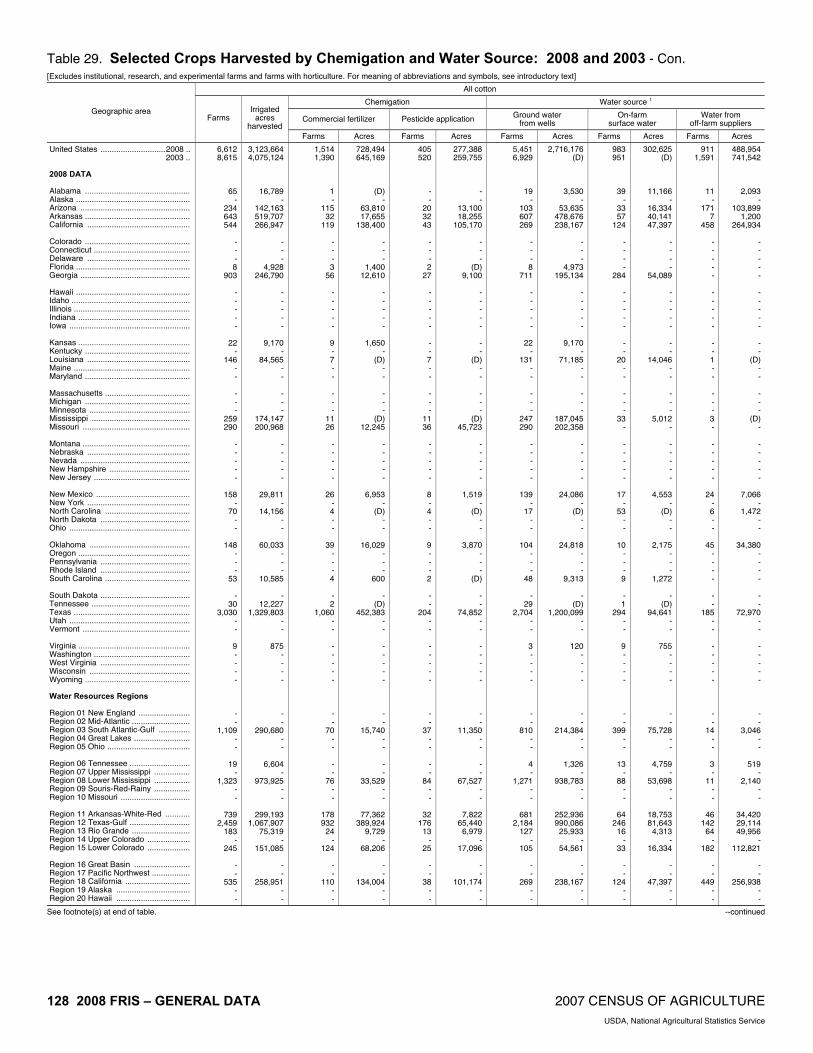
128 2008 FRIS – GENERAL DATA 2007 CENSUS OF AGRICULTURE USDA, National Agricultural Statistics Service
Table 29. Selected Crops Harvested by Chemigation and Water Source: 2008 and 2003 - Con. [Excludes institutional, research, and experimental farms and farms with horticulture. For meaning of abbreviations and symbols, see introductory text]
All cotton
Chemigation Water source 1
Commercial fertilizer Pesticide application Ground water from wells
On-farm surface water
Water from off-farm suppliers
Geographic area Farms
Irrigated acres
harvested Farms Acres Farms Acres Farms Acres Farms Acres Farms Acres
United States .............................2008 .. 2003 .. 2008 DATA Alabama ............................................... Alaska ................................................... Arizona ................................................. Arkansas ............................................... California .............................................. Colorado ............................................... Connecticut ........................................... Delaware .............................................. Florida ................................................... Georgia ................................................. Hawaii ................................................... Idaho ..................................................... Illinois .................................................... Indiana .................................................. Iowa ...................................................... Kansas .................................................. Kentucky ............................................... Louisiana .............................................. Maine .................................................... Maryland ............................................... Massachusetts ...................................... Michigan ............................................... Minnesota ............................................. Mississippi ............................................ Missouri ................................................ Montana ................................................ Nebraska .............................................. Nevada ................................................. New Hampshire .................................... New Jersey ........................................... New Mexico .......................................... New York .............................................. North Carolina ...................................... North Dakota ........................................ Ohio ...................................................... Oklahoma ............................................. Oregon .................................................. Pennsylvania ........................................ Rhode Island ........................................ South Carolina ...................................... South Dakota ........................................ Tennessee ............................................ Texas .................................................... Utah ...................................................... Vermont ................................................ Virginia .................................................. Washington ........................................... West Virginia ........................................ Wisconsin ............................................. Wyoming ............................................... Water Resources Regions Region 01 New England ....................... Region 02 Mid-Atlantic .......................... Region 03 South Atlantic-Gulf .............. Region 04 Great Lakes ......................... Region 05 Ohio ..................................... Region 06 Tennessee ........................... Region 07 Upper Mississippi ................ Region 08 Lower Mississippi ................ Region 09 Souris-Red-Rainy ................ Region 10 Missouri ............................... Region 11 Arkansas-White-Red ........... Region 12 Texas-Gulf ........................... Region 13 Rio Grande .......................... Region 14 Upper Colorado ................... Region 15 Lower Colorado ................... Region 16 Great Basin ......................... Region 17 Pacific Northwest ................. Region 18 California ............................. Region 19 Alaska ................................. Region 20 Hawaii .................................
6,612 8,615
65 -
234 643 544
- - - 8
903
- - - - -
22 -
146 - -
- - -
259 290
- - - - -
158 -
70 - -
148 - - -
53
- 30
3,030 - -
9 - - - -
- -
1,109 - -
19 -
1,323 - -
739 2,459
183 -
245
- -
535 - -
3,123,664 4,075,124
16,789 -
142,163 519,707 266,947
- - -
4,928 246,790
- - - - -
9,170 -
84,565 - -
- - -
174,147 200,968
- - - - -
29,811 -
14,156 - -
60,033 - - -
10,585
- 12,227
1,329,803 - -
875 - - - -
- -
290,680 - -
6,604 -
973,925 - -
299,193 1,067,907
75,319 -
151,085
- -
258,951 - -
1,514 1,390
1 -
115 32
119
- - - 3
56
- - - - -
9 - 7 - -
- - -
11 26
- - - - -
26 - 4 - -
39 - - - 4
- 2
1,060 - -
- - - - -
- -
70 - -
- -
76 - -
178 932
24 -
124
- -
110 - -
728,494 645,169
(D)-
63,810 17,655
138,400
- - -
1,400 12,610
- - - - -
1,650 -
(D)- -
- - -
(D)12,245
- - - - -
6,953 -
(D)- -
16,029 - - -
600
- (D)
452,383 - -
- - - - -
- -
15,740 - -
- -
33,529 - -
77,362 389,924
9,729 -
68,206
- -
134,004 - -
405 520
- -
20 32 43
- - - 2
27
- - - - -
- - 7 - -
- - -
11 36
- - - - -
8 - 4 - -
9 - - - 2
- -
204 - -
- - - - -
- -
37 - -
- -
84 - -
32 176
13 -
25
- -
38 - -
277,388 259,755
- -
13,100 18,255
105,170
- - -
(D)9,100
- - - - -
- -
(D)- -
- - -
(D)45,723
- - - - -
1,519 -
(D)- -
3,870 - - -
(D)
- -
74,852 - -
- - - - -
- -
11,350 - -
- -
67,527 - -
7,822 65,440
6,979 -
17,096
- -
101,174 - -
5,451 6,929
19 -
103 607 269
- - - 8
711
- - - - -
22 -
131 - -
- - -
247 290
- - - - -
139 -
17 - -
104 - - -
48
- 29
2,704 - -
3 - - - -
- -
810 - -
4 -
1,271 - -
681 2,184
127 -
105
- -
269 - -
2,716,176 (D)
3,530 -
53,635 478,676 238,167
- - -
4,973 195,134
- - - - -
9,170 -
71,185 - -
- - -
187,045 202,358
- - - - -
24,086 -
(D) - -
24,818 - - -
9,313
- (D)
1,200,099 - -
120 - - - -
- -
214,384 - -
1,326 -
938,783 - -
252,936 990,086 25,933
- 54,561
- -
238,167 - -
983 951
39 -
33 57
124
- - - -
284
- - - - -
- -
20 - -
- - -
33 -
- - - - -
17 -
53 - -
10 - - - 9
- 1
294 - -
9 - - - -
- -
399 - -
13 -
88 - -
64 246
16 -
33
- -
124 - -
302,625 (D)
11,166 -
16,334 40,141 47,397
- - - -
54,089
- - - - -
- -
14,046 - -
- - -
5,012 -
- - - - -
4,553 -
(D) - -
2,175 - - -
1,272
- (D)
94,641 - -
755 - - - -
- -
75,728 - -
4,759 -
53,698 - -
18,753 81,643
4,313 -
16,334
- -
47,397 - -
911 1,591
11 -
171 7
458
- - - - -
- - - - -
- - 1 - -
- - - 3 -
- - - - -
24 - 6 - -
45 - - - -
- -
185 - -
- - - - -
- -
14 - -
3 -
11 - -
46 142
64 -
182
- -
449 - -
488,954 741,542
2,093 -
103,899 1,200
264,934
- - - - -
- - - - -
- -
(D)- -
- - -
(D)-
- - - - -
7,066 -
1,472 - -
34,380 - - - -
- -
72,970 - -
- - - - -
- -
3,046 - -
519 -
2,140 - -
34,420 29,114 49,956
- 112,821
- -
256,938 - -
See footnote(s) at end of table. --continued

2007 CENSUS OF AGRICULTURE 2008 FRIS – GENERAL DATA 129 USDA, National Agricultural Statistics Service
Table 29. Selected Crops Harvested by Chemigation and Water Source: 2008 and 2003 - Con. [Excludes institutional, research, and experimental farms and farms with horticulture. For meaning of abbreviations and symbols, see introductory text]
Sugarbeets for sugar
Chemigation Water source 1
Commercial fertilizer Pesticide application Ground water from wells
On-farm surface water
Water from off-farm suppliers
Geographic area Farms
Irrigated acres
harvested Farms Acres Farms Acres Farms Acres Farms Acres Farms Acres
United States ............................. 2008 .. 2003 .. 2008 DATA Alabama ............................................... Alaska .................................................. Arizona ................................................. Arkansas .............................................. California .............................................. Colorado ............................................... Connecticut .......................................... Delaware .............................................. Florida .................................................. Georgia ................................................ Hawaii .................................................. Idaho .................................................... Illinois ................................................... Indiana ................................................. Iowa ..................................................... Kansas ................................................. Kentucky .............................................. Louisiana .............................................. Maine ................................................... Maryland .............................................. Massachusetts ..................................... Michigan ............................................... Minnesota ............................................. Mississippi ............................................ Missouri ................................................ Montana ............................................... Nebraska .............................................. Nevada ................................................. New Hampshire .................................... New Jersey .......................................... New Mexico .......................................... New York .............................................. North Carolina ...................................... North Dakota ........................................ Ohio ..................................................... Oklahoma ............................................. Oregon ................................................. Pennsylvania ........................................ Rhode Island ........................................ South Carolina ..................................... South Dakota ....................................... Tennessee ........................................... Texas ................................................... Utah ..................................................... Vermont ................................................ Virginia ................................................. Washington .......................................... West Virginia ........................................ Wisconsin ............................................. Wyoming .............................................. Water Resources Regions Region 01 New England ....................... Region 02 Mid-Atlantic ......................... Region 03 South Atlantic-Gulf .............. Region 04 Great Lakes ........................ Region 05 Ohio .................................... Region 06 Tennessee .......................... Region 07 Upper Mississippi ................ Region 08 Lower Mississippi ................ Region 09 Souris-Red-Rainy ................ Region 10 Missouri .............................. Region 11 Arkansas-White-Red ........... Region 12 Texas-Gulf .......................... Region 13 Rio Grande ......................... Region 14 Upper Colorado ................... Region 15 Lower Colorado ................... Region 16 Great Basin ......................... Region 17 Pacific Northwest ................ Region 18 California ............................. Region 19 Alaska ................................. Region 20 Hawaii .................................
1,590 2,495
- - - -
181
199 - - - -
- 456
- - -
- - - - -
- 18 20
- -
156 257
- - -
- - -
58 -
- 85
- - -
- - - - -
- 4 - -
156
- - -
18 -
- 15
- 9
822
- - - - -
- 545 181
- -
382,267 561,653
- - - -
57,251
31,258 - - - -
- 141,792
- - -
- - - - -
- 1,388 3,313
- -
24,928 59,553
- - -
- - -
14,740 -
- 11,953
- - -
- - - - -
- 2,068
- -
34,023
- - -
1,388 -
- 2,598
- 1,461
163,756
- - - - -
- 155,813 57,251
- -
385 348
- - - -
125
71 - - - -
- 34
- - -
- - - - -
- - - - -
8 122
- - -
- - - 4 -
- 5 - - -
- - - - -
- 4 - -
12
- - - - -
- - - -
217
- - - - -
- 43
125 - -
109,975 97,185
- - - -
45,422
13,667 - - - -
- 17,718
- - -
- - - - -
- - - - -
(D)21,470
- - -
- - -
(D)-
- (D)
- - -
- - - - -
- (D)
- -
7,275
- - - - -
- - - -
44,396
- - - - -
- 20,157 45,422
- -
293 162
- - - -
102
49 - - - -
- 8 - - -
- - - - -
- - - - -
- 94
- - -
- - - 4 -
- 22
- - -
- - - - -
- 4 - -
10
- - - - -
- - - -
157
- - - - -
- 34
102 - -
57,254 47,124
- - - -
32,462
10,130 - - - -
- (D)
- - -
- - - - -
- - - - -
- 5,170
- - -
- - -
(D)-
- 2,173
- - -
- - - - -
- (D)
- -
(D)
- - - - -
- - - -
18,424
- - - - -
- 6,368
32,462 - -
500 1,285
- - - -
12
77 - - - -
- 224
- - -
- - - - -
- 12 15
- -
- 111
- - -
- - - - -
- 24
- - -
- - - - -
- - - -
25
- - -
12 -
- 15
- -
213
- - - - -
- 248
12 - -
150,984 247,904
- - - -
4,112
16,364 - - - -
- 76,309
- - -
- - - - -
- 822
2,598 - -
- 42,148
- - -
- - - - -
- 2,641
- - -
- - - - -
- - - -
5,990
- - -
822 -
- 2,598
- -
64,502
- - - - -
- 78,950
4,112 - -
195 303
- - - -
15
41 - - - -
- 38
- - -
- - - - -
- 5 3 - -
9 25
- - -
- - -
10 -
- 39
- - -
- - - - -
- - - -
10
- - - 5 -
- - - 7
91
- - - - -
- 77 15
- -
28,782 53,375
- - - -
2,465
3,626 - - - -
- 7,121
- - -
- - - - -
- (D) (D)
- -
3,216 4,875
- - -
- - -
2,686 -
- 3,101
- - -
- - - - -
- - - -
877
- - -
(D) -
- - -
(D) 14,534
- - - - -
- 10,222
2,465 - -
1,096 1,192
- - - -
170
116 - - - -
- 273
- - -
- - - - -
- 2 2 - -
147 150
- - -
- - -
50 -
- 53
- - -
- - - - -
- 4 - -
129
- - - 2 -
- - - 2
592
- - - - -
- 330 170
- -
220,617 276,380
- - - -
59,036
12,533 - - - -
- 65,352
- - -
- - - - -
- (D)(D)
- -
21,712 12,530
- - -
- - -
12,054 -
- 7,290
- - -
- - - - -
- 2,068
- -
27,576
- - -
(D)-
- - -
(D)86,405
- - - - -
- 74,710 59,036
- -
See footnote(s) at end of table. --continued

130 2008 FRIS – GENERAL DATA 2007 CENSUS OF AGRICULTURE USDA, National Agricultural Statistics Service
Table 29. Selected Crops Harvested by Chemigation and Water Source: 2008 and 2003 - Con. [Excludes institutional, research, and experimental farms and farms with horticulture. For meaning of abbreviations and symbols, see introductory text]
Tobacco, all types
Chemigation Water source 1
Commercial fertilizer Pesticide application Ground water from wells
On-farm surface water
Water from off-farm suppliers
Geographic area Farms
Irrigated acres
harvested Farms Acres Farms Acres Farms Acres Farms Acres Farms Acres
United States .............................2008 .. 2003 .. 2008 DATA Alabama ............................................... Alaska ................................................... Arizona ................................................. Arkansas ............................................... California .............................................. Colorado ............................................... Connecticut ........................................... Delaware .............................................. Florida ................................................... Georgia ................................................. Hawaii ................................................... Idaho ..................................................... Illinois .................................................... Indiana .................................................. Iowa ...................................................... Kansas .................................................. Kentucky ............................................... Louisiana .............................................. Maine .................................................... Maryland ............................................... Massachusetts ...................................... Michigan ............................................... Minnesota ............................................. Mississippi ............................................ Missouri ................................................ Montana ................................................ Nebraska .............................................. Nevada ................................................. New Hampshire .................................... New Jersey ........................................... New Mexico .......................................... New York .............................................. North Carolina ...................................... North Dakota ........................................ Ohio ...................................................... Oklahoma ............................................. Oregon .................................................. Pennsylvania ........................................ Rhode Island ........................................ South Carolina ...................................... South Dakota ........................................ Tennessee ............................................ Texas .................................................... Utah ...................................................... Vermont ................................................ Virginia .................................................. Washington ........................................... West Virginia ........................................ Wisconsin ............................................. Wyoming ............................................... Water Resources Regions Region 01 New England ....................... Region 02 Mid-Atlantic .......................... Region 03 South Atlantic-Gulf .............. Region 04 Great Lakes ......................... Region 05 Ohio ..................................... Region 06 Tennessee ........................... Region 07 Upper Mississippi ................ Region 08 Lower Mississippi ................ Region 09 Souris-Red-Rainy ................ Region 10 Missouri ............................... Region 11 Arkansas-White-Red ........... Region 12 Texas-Gulf ........................... Region 13 Rio Grande .......................... Region 14 Upper Colorado ................... Region 15 Lower Colorado ................... Region 16 Great Basin ......................... Region 17 Pacific Northwest ................. Region 18 California ............................. Region 19 Alaska ................................. Region 20 Hawaii .................................
811 1,507
- - - - -
- 17
- 2
16
- - 1 - -
- 379
- -
22
- - - - -
- - - - -
- -
222 - -
- - 3 - 3
-
72 - - -
74 - - - -
17 25
302 -
345
76 -
46 - -
- - - - -
- - - - -
23,614 35,059
- - - - -
- 837
- (D)
1,300
- -
(D) - -
- 8,498
- -
154
- - - - -
- - - - -
- -
8,488 - -
- -
24 -
195
- 1,444
- - -
2,167 - - - -
837 178
12,360 -
8,071
1,138 -
1,030 - -
- - - - -
- - - - -
62 52
- - - - -
- 1 - - -
- - - - -
- 27
- - -
- - - - -
- - - - -
- -
31 - -
- - - - -
- 3 - - -
- - - - -
1 -
16 -
30
15 - - - -
- - - - -
- - - - -
1,467 628
- - - - -
- (D)
- - -
- - - - -
- 800
- - -
- - - - -
- - - - -
- -
542 - -
- - - - -
- (D)
- - -
- - - - -
(D)-
(D)-
840
30 - - - -
- - - - -
- - - - -
25 31
- - - - -
- 1 - - -
- - - - -
- 6 - - -
- - - - -
- - - - -
- -
16 - -
- - - - -
- 2 - - -
- - - - -
1 -
16 - 8
- - - - -
- - - - -
- - - - -
867 2,528
- - - - -
- (D)
- - -
- - - - -
- 240
- - -
- - - - -
- - - - -
- -
512 - -
- - - - -
- (D)
- - -
- - - - -
(D)-
(D)-
270
- - - - -
- - - - -
- - - - -
148 314
- - - - -
- 3 - 2 -
- - 1 - -
- 92
- - -
- - - - -
- - - - -
- -
41 - -
- - - - 3
- 6 - - -
- - - - -
3 -
46 -
32
27 -
40 - -
- - - - -
- - - - -
3,431 11,766
- - - - -
- (D)
- (D)
-
- -
(D) - -
- 1,679
- - -
- - - - -
- - - - -
- -
586 - -
- - - -
195
- (D)
- - -
- - - - -
(D) -
1,021 -
(D)
790 -
767 - -
- - - - -
- - - - -
696 1,226
- - - - -
- 16
- -
16
- - - - -
- 293
- -
22
- - - - -
- - - - -
- -
206 - -
- - 3 - -
- 66
- - -
74 - - - -
16 25
281 -
305
54 -
15 - -
- - - - -
- - - - -
20,154 23,467
- - - - -
- 392
- -
1,300
- - - - -
- 6,749
- -
154
- - - - -
- - - - -
- -
8,102 - -
- -
24 - -
- 1,266
- - -
2,167 - - - -
392 178
11,539 -
6,798
432 -
815 - -
- - - - -
- - - - -
39 28
- - - - -
- 2 - - -
- - - - -
- 35
- - -
- - - - -
- - - - -
- - - - -
- - - - -
- 2 - - -
- - - - -
2 - - -
28
9 - - - -
- - - - -
- - - - -
1,642 970
- - - - -
- (D)
- - -
- - - - -
- 1,479
- - -
- - - - -
- - - - -
- - - - -
- - - - -
- (D)
- - -
- - - - -
(D)- - -
1,304
(D)- - - -
- - - - -
- - - - -
See footnote(s) at end of table. --continued
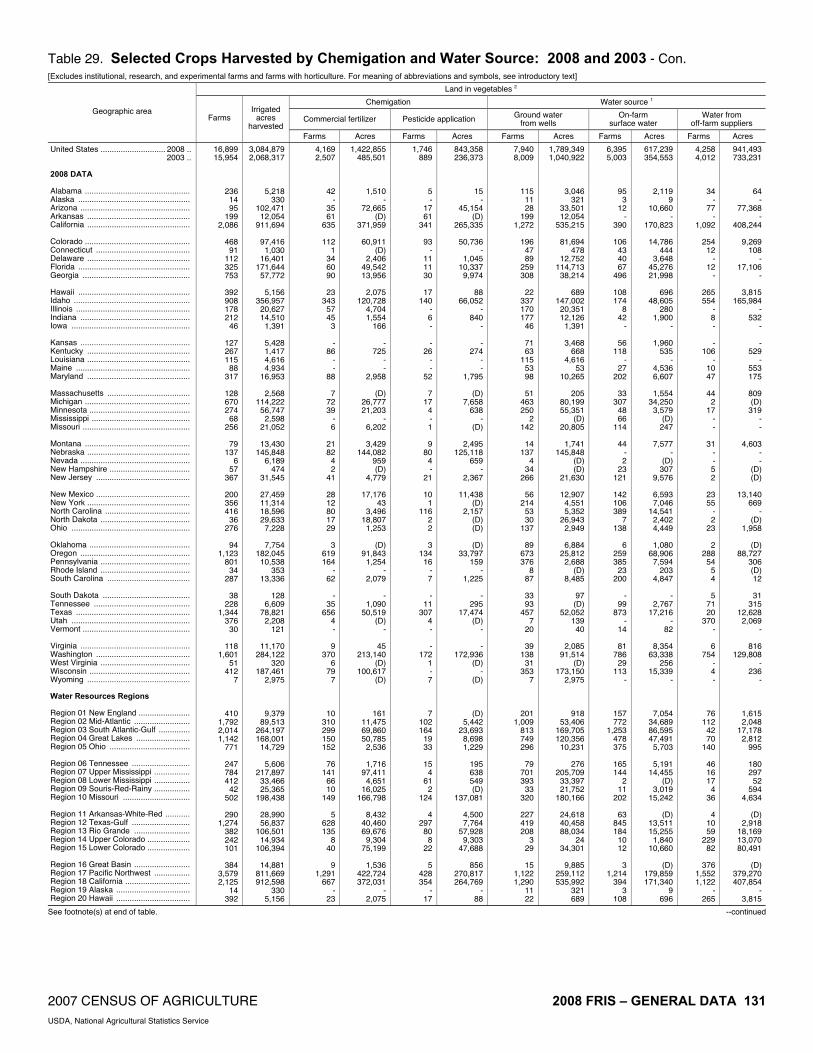
2007 CENSUS OF AGRICULTURE 2008 FRIS – GENERAL DATA 131 USDA, National Agricultural Statistics Service
Table 29. Selected Crops Harvested by Chemigation and Water Source: 2008 and 2003 - Con. [Excludes institutional, research, and experimental farms and farms with horticulture. For meaning of abbreviations and symbols, see introductory text]
Land in vegetables 2
Chemigation Water source 1
Commercial fertilizer Pesticide application Ground water from wells
On-farm surface water
Water from off-farm suppliers
Geographic area Farms
Irrigated acres
harvested Farms Acres Farms Acres Farms Acres Farms Acres Farms Acres
United States ............................. 2008 .. 2003 .. 2008 DATA Alabama ............................................... Alaska .................................................. Arizona ................................................. Arkansas .............................................. California .............................................. Colorado ............................................... Connecticut .......................................... Delaware .............................................. Florida .................................................. Georgia ................................................ Hawaii .................................................. Idaho .................................................... Illinois ................................................... Indiana ................................................. Iowa ..................................................... Kansas ................................................. Kentucky .............................................. Louisiana .............................................. Maine ................................................... Maryland .............................................. Massachusetts ..................................... Michigan ............................................... Minnesota ............................................. Mississippi ............................................ Missouri ................................................ Montana ............................................... Nebraska .............................................. Nevada ................................................. New Hampshire .................................... New Jersey .......................................... New Mexico .......................................... New York .............................................. North Carolina ...................................... North Dakota ........................................ Ohio ..................................................... Oklahoma ............................................. Oregon ................................................. Pennsylvania ........................................ Rhode Island ........................................ South Carolina ..................................... South Dakota ....................................... Tennessee ........................................... Texas ................................................... Utah ..................................................... Vermont ................................................ Virginia ................................................. Washington .......................................... West Virginia ........................................ Wisconsin ............................................. Wyoming .............................................. Water Resources Regions Region 01 New England ....................... Region 02 Mid-Atlantic ......................... Region 03 South Atlantic-Gulf .............. Region 04 Great Lakes ........................ Region 05 Ohio .................................... Region 06 Tennessee .......................... Region 07 Upper Mississippi ................ Region 08 Lower Mississippi ................ Region 09 Souris-Red-Rainy ................ Region 10 Missouri .............................. Region 11 Arkansas-White-Red ........... Region 12 Texas-Gulf .......................... Region 13 Rio Grande ......................... Region 14 Upper Colorado ................... Region 15 Lower Colorado ................... Region 16 Great Basin ......................... Region 17 Pacific Northwest ................ Region 18 California ............................. Region 19 Alaska ................................. Region 20 Hawaii .................................
16,899 15,954
236 14 95
199 2,086
468
91 112 325 753
392 908 178 212
46
127 267 115
88 317
128 670 274
68 256
79
137 6
57 367
200 356 416
36 276
94
1,123 801
34 287
38
228 1,344
376 30
118
1,601 51
412 7
410 1,792 2,014 1,142
771
247 784 412
42 502
290
1,274 382 242 101
384
3,579 2,125
14 392
3,084,879 2,068,317
5,218 330
102,471 12,054
911,694
97,416 1,030
16,401 171,644 57,772
5,156
356,957 20,627 14,510
1,391
5,428 1,417 4,616 4,934
16,953
2,568 114,222 56,747
2,598 21,052
13,430
145,848 6,189
474 31,545
27,459 11,314 18,596 29,633
7,228
7,754 182,045 10,538
353 13,336
128
6,609 78,821
2,208 121
11,170
284,122 320
187,461 2,975
9,379 89,513
264,197 168,001 14,729
5,606
217,897 33,466 25,365
198,438
28,990 56,837
106,501 14,934
106,394
14,881 811,669 912,598
330 5,156
4,169 2,507
42 -
35 61
635
112 1
34 60 90
23
343 57 45
3
- 86
- -
88
7 72 39
- 6
21 82
4 2
41
28 12 80 17 29
3
619 164
- 62
-
35 656
4 -
9 370
6 79
7
10 310 299 150 152
76
141 66 10
149
5 628 135
8 40
9
1,291 667
- 23
1,422,855 485,501
1,510 -
72,665 (D)
371,959
60,911 (D)
2,406 49,542 13,956
2,075
120,728 4,704 1,554
166
- 725
- -
2,958
(D)26,777 21,203
- 6,202
3,429
144,082 959 (D)
4,779
17,176 43
3,496 18,807
1,253
(D)91,843
1,254 -
2,079
- 1,090
50,519 (D)
-
45 213,140
(D)100,617
(D)
161 11,475 69,860 50,785
2,536
1,716 97,411
4,651 16,025
166,798
8,432 40,460 69,676
9,304 75,199
1,536
422,724 372,031
- 2,075
1,746 889
5 -
17 61
341
93 -
11 11 30
17
140 - 6 -
- 26
- -
52
7 17
4 - 1
9
80 4 -
21
10 1
116 2 2
3
134 16
- 7
-
11 307
4 -
- 172
1 - 7
7 102 164
19 33
15
4 61
2 124
4
297 80
8 22
5
428 354
- 17
843,358 236,373
15 -
45,154 (D)
265,335
50,736 -
1,045 10,337
9,974
88 66,052
- 840
-
- 274
- -
1,795
(D)7,658
638 -
(D)
2,495 125,118
659 -
2,367
11,438 (D)
2,157 (D)(D)
(D)
33,797 159
- 1,225
-
295 17,474
(D)-
- 172,936
(D)-
(D)
(D)5,442
23,693 8,698 1,229
195 638 549 (D)
137,081
4,500 7,764
57,928 9,303
47,688
856 270,817 264,769
- 88
7,940 8,009
115 11 28
199 1,272
196
47 89
259 308
22
337 170 177
46
71 63
115 53 98
51
463 250
2 142
14
137 4
34 266
56
214 53 30
137
89 673 376
8 87
33 93
457 7
20
39 138
31 353
7
201 1,009
813 749 296
79
701 393
33 320
227 419 208
3 29
15
1,122 1,290
11 22
1,789,349 1,040,922
3,046 321
33,501 12,054
535,215
81,694 478
12,752 114,713 38,214
689
147,002 20,351 12,126
1,391
3,468 668
4,616 53
10,265
205 80,199 55,351
(D) 20,805
1,741
145,848 (D) (D)
21,630
12,907 4,551 5,352
26,943 2,949
6,884
25,812 2,688
(D) 8,485
97 (D)
52,052 139
40
2,085 91,514
(D) 173,150
2,975
918 53,406
169,705 120,356 10,231
276
205,709 33,397 21,752
180,166
24,618 40,458 88,034
24 34,301
9,885
259,112 535,992
321 689
6,395 5,003
95 3
12 -
390
106 43 40 67
496
108 174
8 42
-
56 118
- 27
202
33 307
48 66
114
44 - 2
23 121
142 106 389
7 138
6
259 385
23 200
-
99 873
- 14
81
786 29
113 -
157 772
1,253 478 375
165 144
2 11
202
63 845 184
10 12
3
1,214 394
3 108
617,239 354,553
2,119 9
10,660 -
170,823
14,786 444
3,648 45,276 21,998
696
48,605 280
1,900 -
1,960 535
- 4,536 6,607
1,554
34,250 3,579
(D) 247
7,577
- (D)
307 9,576
6,593 7,046
14,541 2,402 4,449
1,080
68,906 7,594
203 4,847
-
2,767 17,216
- 82
8,354
63,338 256
15,339 -
7,054 34,689 86,595 47,491
5,703
5,191 14,455
(D) 3,019
15,242
(D) 13,511 15,255
1,840 10,660
(D)
179,859 171,340
9 696
4,258 4,012
34 -
77 -
1,092
254 12
- 12
-
265 554
- 8 -
- 106
- 10 47
44
2 17
- -
31 - - 5 2
23 55
- 2
23
2 288
54 5 4
5
71 20
370 -
6 754
- 4 -
76 112
42 70
140
46 16 17
4 36
4
10 59
229 82
376
1,552 1,122
- 265
941,493 733,231
64 -
77,368 -
408,244
9,269 108
- 17,106
-
3,815 165,984
- 532
-
- 529
- 553 175
809 (D)
319 - -
4,603 - -
(D)(D)
13,140
669 -
(D)1,958
(D)
88,727 306 (D)12
31
315 12,628
2,069 -
816 129,808
- 236
-
1,615 2,048
17,178 2,812
995
180 297
52 594
4,634
(D)2,918
18,169 13,070 80,491
(D)
379,270 407,854
- 3,815
See footnote(s) at end of table. --continued

132 2008 FRIS – GENERAL DATA 2007 CENSUS OF AGRICULTURE USDA, National Agricultural Statistics Service
Table 29. Selected Crops Harvested by Chemigation and Water Source: 2008 and 2003 - Con. [Excludes institutional, research, and experimental farms and farms with horticulture. For meaning of abbreviations and symbols, see introductory text]
Sweet corn
Chemigation Water source 1
Commercial fertilizer Pesticide application Ground water from wells
On-farm surface water
Water from off-farm suppliers
Geographic area Farms
Irrigated acres
harvested Farms Acres Farms Acres Farms Acres Farms Acres Farms Acres
United States .............................2008 .. 2003 .. 2008 DATA Alabama ............................................... Alaska ................................................... Arizona ................................................. Arkansas ............................................... California .............................................. Colorado ............................................... Connecticut ........................................... Delaware .............................................. Florida ................................................... Georgia ................................................. Hawaii ................................................... Idaho ..................................................... Illinois .................................................... Indiana .................................................. Iowa ...................................................... Kansas .................................................. Kentucky ............................................... Louisiana .............................................. Maine .................................................... Maryland ............................................... Massachusetts ...................................... Michigan ............................................... Minnesota ............................................. Mississippi ............................................ Missouri ................................................ Montana ................................................ Nebraska .............................................. Nevada ................................................. New Hampshire .................................... New Jersey ........................................... New Mexico .......................................... New York .............................................. North Carolina ...................................... North Dakota ........................................ Ohio ...................................................... Oklahoma ............................................. Oregon .................................................. Pennsylvania ........................................ Rhode Island ........................................ South Carolina ...................................... South Dakota ........................................ Tennessee ............................................ Texas .................................................... Utah ...................................................... Vermont ................................................ Virginia .................................................. Washington ........................................... West Virginia ........................................ Wisconsin ............................................. Wyoming ............................................... Water Resources Regions Region 01 New England ....................... Region 02 Mid-Atlantic .......................... Region 03 South Atlantic-Gulf .............. Region 04 Great Lakes ......................... Region 05 Ohio ..................................... Region 06 Tennessee ........................... Region 07 Upper Mississippi ................ Region 08 Lower Mississippi ................ Region 09 Souris-Red-Rainy ................ Region 10 Missouri ............................... Region 11 Arkansas-White-Red ........... Region 12 Texas-Gulf ........................... Region 13 Rio Grande .......................... Region 14 Upper Colorado ................... Region 15 Lower Colorado ................... Region 16 Great Basin ......................... Region 17 Pacific Northwest ................. Region 18 California ............................. Region 19 Alaska ................................. Region 20 Hawaii .................................
4,341 4,052
79 - 3 -
38
231 38 35
163 227
22
267 73 83 14
-
121 4
11 131
33
183 139
68 38
9
51 -
25 115
139 162 188
- 85
43
110 207
8 144
38 79 24
4 6
46
626 17
214 -
115 617 880 364 264
65
361 25
- 105
81 24
137 233
3
4 1,003
38 -
22
294,855 282,158
467 - 6 -
23,890
4,744 213
5,760 30,459 15,209
342
23,286 5,381 1,917
393
- 376
3,402 161
7,494
1,606 3,783 9,300 2,532
114
7 34
- 310
3,599
(D) 2,455 1,587
- 1,187
610
16,474 2,060
80 901
60
159 24 (D)
1
2,405 66,522
93 54,718
-
2,370 21,682 48,306 18,274
2,323
811 58,323
5,832 -
187
724 24 (D)
4,746 6
(D)
106,282 23,890
- 342
536 423
- - 3 -
14
- -
15 -
58
1 98 17 16
3
- 40
- -
12
14 4
18 - -
- - - - 7
2 - 4 - -
- 19 39
- -
- 20
- - -
- 82
1 49
-
14 74 62 19 56
20 70
- - 2
- - - 2 3
-
199 14
- 1
124,220 91,559
- - 6 -
5,160
- -
1,367 -
2,445
(D)9,515 1,404
607 166
-
200 - -
1,886
301 1,450
457 - -
- - - -
298
(D)-
360 - -
- 5,295
224 - -
- 95
- - -
- 55,470
(D)37,211
-
301 3,845 2,805 8,639
807
95 31,964
- -
(D)
- - -
(D)6
-
70,280 5,160
- (D)
176 294
4 - - - 1
- - 4 -
51
- 17
- 3 -
- 19
- - 2
14
2 2 - -
- - - - 4
2 - - - -
- 5 2 - -
- - - - -
- 42
1 1 -
14 13 55
3 22
- 2 - - -
- - - 2 -
- 64
1 - -
51,662 35,236
3 - - -
(D)
- -
380 -
15
- 2,318
- 600
-
- 81
- -
(D)
826 (D)(D)
- -
- - - -
132
(D)- - - -
- 5,155
(D)- -
- - - - -
- 40,458
(D)(D)
-
826 1,535
18 51
681
- (D)
- - -
- - -
(D)-
- 47,931
(D)- -
1,768 2,151
44 - 3 -
10
- -
30 143 120
3
72 73 43 14
-
41 4 -
51
- 80
120 2
38
- 51
- 8
54
1 118
1 -
63
43 59 96
- 49
33 27 24
3 -
13 46
6 182
-
8 321 364 202 120
18
325 17
- 91
81 24
1 - 3
3
177 10
- 3
156,598 142,057
246 - 6 -
9,900
- -
4,502 7,423
12,081
310 6,492 5,341
928 393
-
145 3,402
- 4,641
-
2,639 11,009
(D) 114
-
34 -
25 1,853
(D)
985 (D)
- 1,170
820
3,391 613
- 303
59 27 24 15
-
55 21,251
(D) 53,764
-
25 12,207 20,240 14,975
1,687
62 59,065
5,816 -
180
934 24 (D)
- 6
(D)
31,134 9,900
- 310
1,990 1,150
26 - - -
13
10 26
8 18
107
16 36
2 40
-
- 46
- 8
90
26 129
6 66
-
4 - -
17 66
130
40 188
- 22
-
26 117
4 96
-
26 - - 6
27
500 11 37
-
81 312 507 188 110
29 28
- - 4
- -
130 10
-
- 562
13 -
16
77,133 61,628
232 - - -
12,300
1,840 125
1,330 13,664
3,133
12 2,838
(D) 989
-
- 180
- 159
3,163
871 (D)
710 (D)
-
3 - -
246 2,084
258
1,475 (D)
- 777
-
1,919 1,665
72 598
-
111 - - 1
1,912
19,735 (D)
1,984 -
1,472 9,927
18,709 3,613 1,395
744
2,367 - - 3
- -
258 1,840
-
- 24,492 12,300
- 12
724 993
9 - 3 -
24
221 12
- 8 -
3 166
- - -
- 41
- 5 3
7 2
15 - -
5 - - 5 -
14 9 - - 3
2
34 - 4 -
5 26
- 1 -
6 91
- - -
33 11 17 10 43
18 15
8 -
10
2 -
12 223
3
1 291
24 - 3
78,340 91,760
9 - 6 -
9,690
2,904 88
- 9,392
-
20 14,614
- - -
- 52
- 82 60
735 (D)
2 - -
4 - -
40 -
302 173
- -
74
(D)11,164
- 8 -
1 30
- (D)
-
439 27,985
- - -
953 549
9,401 221
76
14 2
16 - 5
(D)
- 300
2,906 6
(D)
53,763 9,690
- 20
See footnote(s) at end of table. --continued

2007 CENSUS OF AGRICULTURE 2008 FRIS – GENERAL DATA 133 USDA, National Agricultural Statistics Service
Table 29. Selected Crops Harvested by Chemigation and Water Source: 2008 and 2003 - Con. [Excludes institutional, research, and experimental farms and farms with horticulture. For meaning of abbreviations and symbols, see introductory text]
Tomatoes
Chemigation Water source 1
Commercial fertilizer Pesticide application Ground water from wells
On-farm surface water
Water from off-farm suppliers
Geographic area Farms
Irrigated acres
harvested Farms Acres Farms Acres Farms Acres Farms Acres Farms Acres
United States ............................. 2008 .. 2003 .. 2008 DATA Alabama ............................................... Alaska .................................................. Arizona ................................................. Arkansas .............................................. California .............................................. Colorado ............................................... Connecticut .......................................... Delaware .............................................. Florida .................................................. Georgia ................................................ Hawaii .................................................. Idaho .................................................... Illinois ................................................... Indiana ................................................. Iowa ..................................................... Kansas ................................................. Kentucky .............................................. Louisiana .............................................. Maine ................................................... Maryland .............................................. Massachusetts ..................................... Michigan ............................................... Minnesota ............................................. Mississippi ............................................ Missouri ................................................ Montana ............................................... Nebraska .............................................. Nevada ................................................. New Hampshire .................................... New Jersey .......................................... New Mexico .......................................... New York .............................................. North Carolina ...................................... North Dakota ........................................ Ohio ..................................................... Oklahoma ............................................. Oregon ................................................. Pennsylvania ........................................ Rhode Island ........................................ South Carolina ..................................... South Dakota ....................................... Tennessee ........................................... Texas ................................................... Utah ..................................................... Vermont ................................................ Virginia ................................................. Washington .......................................... West Virginia ........................................ Wisconsin ............................................. Wyoming .............................................. Water Resources Regions Region 01 New England ....................... Region 02 Mid-Atlantic ......................... Region 03 South Atlantic-Gulf .............. Region 04 Great Lakes ........................ Region 05 Ohio .................................... Region 06 Tennessee .......................... Region 07 Upper Mississippi ................ Region 08 Lower Mississippi ................ Region 09 Souris-Red-Rainy ................ Region 10 Missouri .............................. Region 11 Arkansas-White-Red ........... Region 12 Texas-Gulf .......................... Region 13 Rio Grande ......................... Region 14 Upper Colorado ................... Region 15 Lower Colorado ................... Region 16 Great Basin ......................... Region 17 Pacific Northwest ................ Region 18 California ............................. Region 19 Alaska ................................. Region 20 Hawaii .................................
5,937 6,101
109 - -
121 1,272
193
43 8
26 129
96
- 26 92 34
56
168 107
7 73
47
315 50 66 81
9 - -
43 185
13
253 138
- 162
78
3 425
16 90
35
168 303
1 11
61
703 43 78
-
160 839 527 507 473
181 196 245
- 91
134 279
37 193
-
1 706
1,272 -
96
305,565 426,656
1,125 - -
2,349 234,041
386
70 18
37,617 2,496
852
- 27
3,979 34
39
399 58
4 426
132
6,286 75
7 56
2 - -
31 1,997
25
432 852
- 2,127
298
15 1,821
33 2,837
(D)
1,888 256 (D)
1
886 1,511
41 23
-
271 5,214
44,109 8,578 3,198
2,481 1,732 2,504
- 53
337 112 (D)
386 -
(D) 1,526
234,041 -
852
1,333 829
18 - -
61 206
- - 2
15 51
7 -
13 26
-
- 66
- - 5
14 13 16
- -
- - - 3
40
- 35
118 -
17
- 3
125 -
14
- 41
303 - -
9 106
6 - -
17 198 188
36 106
73 29 61
- -
- 279
24 - -
- 109 206
- 7
156,256 81,971
190 - -
(D)115,165
- -
(D)30,259
(D)
146 -
26 4 -
- 264
- -
108
84 3,500
41 - -
- - - 2
722
- 7
540 -
129
- 15
242 -
1,504
- 1,095
256 - -
14 1,378
6 - -
86 1,075
31,992 3,606
444
1,479 67 (D)
- -
- (D)
144 - -
- 1,393
115,165 -
146
654 323
11 - -
61 121
- - - 5
51
2 - - - -
- 26
- - -
7 11
- - -
- - - -
30
- - 4 - 1
- 3
25 - 4
-
12 279
- -
- - 1 - -
7 56 75 12 27
11
- 61
- -
- 279
- - -
- 3
121 - 2
79,990 31,156
156 - -
(D)68,997
- - -
4,917 (D)
(D)
- - - -
- 29
- - -
14 3,300
- - -
- - - -
263
- -
80 -
(D)
- 45 50
- 1,150
-
167 112
- -
- -
(D)- -
14 316
6,313 3,440
69
127 -
(D)- -
- (D)
- - -
- 45
68,997 -
(D)
2,584 2,970
65 - -
121 645
-
14 2
21 113
16
- 26 62 29
56 49
107 -
23
21 207
36 -
43
- - -
28 127
1
184 4 -
75
78 -
217 7 6
33 54
- - 9
23
- 17 65
-
74 501 208 334 176
52
126 237
- 80
134
- 1 - -
- -
645 -
16
190,580 213,337
327 - -
2,349 133,736
-
(D) (D)
34,713 2,401
105
- 27
3,876 29
39
382 58
- 222
78
4,959 68
- 48
- - -
(D) 1,634
(D)
266 80
- 1,881
298
- 467
7 1,850
(D)
113 - - 1
450
- 23 22
-
143 3,003
39,267 6,267 3,391
(D)
1,637 2,496
- 51
337
- (D)
- -
- -
133,736 -
105
2,323 1,951
40 - - -
189
- 29
6 4
16
35 - -
30 5
-
53 - 7
48
26 106
14 66 38
4 - -
10 59
6
65 134
- 82
- 3
203 9
83
- 70
303 - 2
36
490 26 26
-
81 336 310 179 208
109
70 - - 4
-
279 30
- -
- 493 189
- 35
75,905 128,955
809 - - -
63,095
- (D) (D)
2,874 95
13
- -
(D) 5
-
96 - 4
199
54 1,367
7 7 8
(D)
- -
(D) 414
1
218 772
- 894
-
15 1,335
26 (D)
-
1,687 256
- (D)
433 123
18 13
-
122 2,306 4,821 2,107
735
2,289 22
- -
(Z)
- 112 145
- -
- 138
63,095 -
13
1,401 1,378
8 - - -
749
193 - - 2 -
45 - - 1 -
- 73
- 2 3
- 2 - - -
5 - - 5 -
12 4 - - 7
- - 9 - 2
2
60 - 1 -
3 213
- - -
7 9
11 7
98
40 1 8 - 7
- -
12 193
-
1 213 749
- 45
143,649 169,686
6 - - -
139,057
386 - -
(D)-
1,908 - -
(D)-
- 236
- (D)
6
- (D)
- - -
2 - -
(D)-
25 16
- -
302
- -
53 -
(D)
(D)90
- (D)
-
3 1,389
- - -
(D)54 87
265 339
46 (D)
8 - 2
- -
25 386
-
(D)1,389
139,057 -
1,908
See footnote(s) at end of table. --continued

134 2008 FRIS – GENERAL DATA 2007 CENSUS OF AGRICULTURE USDA, National Agricultural Statistics Service
Table 29. Selected Crops Harvested by Chemigation and Water Source: 2008 and 2003 - Con. [Excludes institutional, research, and experimental farms and farms with horticulture. For meaning of abbreviations and symbols, see introductory text]
Lettuce and romaine
Chemigation Water source 1
Commercial fertilizer Pesticide application Ground water from wells
On-farm surface water
Water from off-farm suppliers
Geographic area Farms
Irrigated acres
harvested Farms Acres Farms Acres Farms Acres Farms Acres Farms Acres
United States .............................2008 .. 2003 .. 2008 DATA Alabama ............................................... Alaska ................................................... Arizona ................................................. Arkansas ............................................... California .............................................. Colorado ............................................... Connecticut ........................................... Delaware .............................................. Florida ................................................... Georgia ................................................. Hawaii ................................................... Idaho ..................................................... Illinois .................................................... Indiana .................................................. Iowa ...................................................... Kansas .................................................. Kentucky ............................................... Louisiana .............................................. Maine .................................................... Maryland ............................................... Massachusetts ...................................... Michigan ............................................... Minnesota ............................................. Mississippi ............................................ Missouri ................................................ Montana ................................................ Nebraska .............................................. Nevada ................................................. New Hampshire .................................... New Jersey ........................................... New Mexico .......................................... New York .............................................. North Carolina ...................................... North Dakota ........................................ Ohio ...................................................... Oklahoma ............................................. Oregon .................................................. Pennsylvania ........................................ Rhode Island ........................................ South Carolina ...................................... South Dakota ........................................ Tennessee ............................................ Texas .................................................... Utah ...................................................... Vermont ................................................ Virginia .................................................. Washington ........................................... West Virginia ........................................ Wisconsin ............................................. Wyoming ............................................... Water Resources Regions Region 01 New England ....................... Region 02 Mid-Atlantic .......................... Region 03 South Atlantic-Gulf .............. Region 04 Great Lakes ......................... Region 05 Ohio ..................................... Region 06 Tennessee ........................... Region 07 Upper Mississippi ................ Region 08 Lower Mississippi ................ Region 09 Souris-Red-Rainy ................ Region 10 Missouri ............................... Region 11 Arkansas-White-Red ........... Region 12 Texas-Gulf ........................... Region 13 Rio Grande .......................... Region 14 Upper Colorado ................... Region 15 Lower Colorado ................... Region 16 Great Basin ......................... Region 17 Pacific Northwest ................. Region 18 California ............................. Region 19 Alaska ................................. Region 20 Hawaii .................................
2,203 2,051
13 2
33 -
439
6 13
- 74
-
96 -
13 13
8
56 27
- 2 2
19 85 31
- -
5 - -
17 94
10
180 89
- 25
38
- 80 19
-
5 22
- -
14
9 596
16 52
-
78 295 167 160 123
27 61
2 -
14
94 -
16 -
34
- 596 438
2 96
255,880 276,426
5 (D)
38,310 -
200,470
4,471 16
- 8,581
-
184 -
26 3 2
6
16 -
(D) (D)
26
688 23
- -
1 - - 8
918
690 494
21 -
(D)
8 -
134 9 -
1 (D)
- -
(D)
27 182
5 18
-
64 1,500 8,603 1,210
89
9 (D) (D)
- 3
13
- 5,161
- 38,899
-
182 199,881
(D) 184
275 173
- -
19 -
166
2 - - - -
2 -
13 - -
- 13
- - 2
- -
14 - -
- - - -
10
8 1 - - -
- - 3 - -
- 9 - - -
- - -
13 -
- 16
- 13 13
9
27 - - -
- -
10 -
20
- -
165 - 2
120,864 103,397
- -
26,551 -
91,622
(D)- - - -
(D)-
26 - -
- (D)
- -
(D)
- - 1 - -
- - - -
330
450 (D)
- - -
- - 1 - -
- 3 - - -
- - -
13 -
- 333
- 13 (D)
3
27 - - -
- -
2,281 -
27,140
- -
91,033 -
(D)
180 94
- - 8 -
58
2 - - - -
2 - - - -
- 13
- - -
- - - - -
- - - - 7
- 1
89 - -
- - - - -
- - - - -
- - - - -
- 8
89 -
13
- - - - -
- - 2 - 9
- -
57 - 2
80,968 (D)
- -
13,273 -
65,579
(D)- - - -
(D)- - - -
- (D)
- - -
- - - - -
- - - -
230
- (D)21
- -
- - - - -
- - - - -
- - - - -
- 231
21 -
(D)
- - - - -
- -
(D)-
13,862
- -
64,990 -
(D)
1,050 1,258
4 2 6 -
355
6 - -
73 -
- -
13 - 8
56
7 - - -
7 35 31
- -
- - - 6
76
10 164
4 -
12
38 -
71 10
-
5 2 - - 8
9 - 6
26 -
31 243
81 91 72
-
48 2 - 9
94
- 16
- 6
- -
355 2 -
146,038 166,285
1 (D)
6,268 -
128,299
4,471 - -
(D) -
- -
26 - 2
6 1 - - -
7 46 23
- -
- - - 2
765
690 322
4 - 2
8 -
(D) 8 -
1 (D)
- - 1
27
- 3 4 -
17 1,096
(D) (D) 63
-
(D) (D)
- 3
13
- 5,161
- 6,268
- -
128,299 (D)
-
923 659
9 - 4 -
62
- 13
- 1 -
49 - -
13 -
- - - 2 2
12 50
- - -
4 - -
11 18
2
14 85
- 12
- - 9 9 -
- 11
- - 6
-
489 10 26
-
47 50 86 68 31
18 13
- - 4
- - 2 - 4
-
489 62
- 49
34,835 11,168
5 -
4,260 -
25,231
- 16
- (D)
-
62 - - 3 -
- - -
(D) (D)
19
642 - - -
(Z) - - 6
156
(D) 29 17
- (D)
- -
(D) 2 -
- (D)
- -
(D)
- 171
2 14
-
47 266 (D)
909 10
6 1 - -
(Z)
- -
(D) -
4,260
- 171
25,231 -
62
335 162
- -
29 -
114
- - - - -
47 - - - -
- 20
- - -
- - - - -
1 - - - -
2 4 - - 2
- - - - -
- 9 - - -
- 107
- - -
- 4 - 2
20
9 - - - 1
- - 2 -
30
- 107 113
- 47
98,559 111,269
- -
35,110 -
62,547
- - - - -
133 - - - -
- 16
- - -
- - - - -
(D)- - - -
(D)(D)
- -
(D)
- - - - -
- 3 - - -
- 11
- - -
- (D)
- (D)16
3 - - -
(D)
- -
(D)-
35,699
- 11
61,958 -
133
See footnote(s) at end of table. --continued
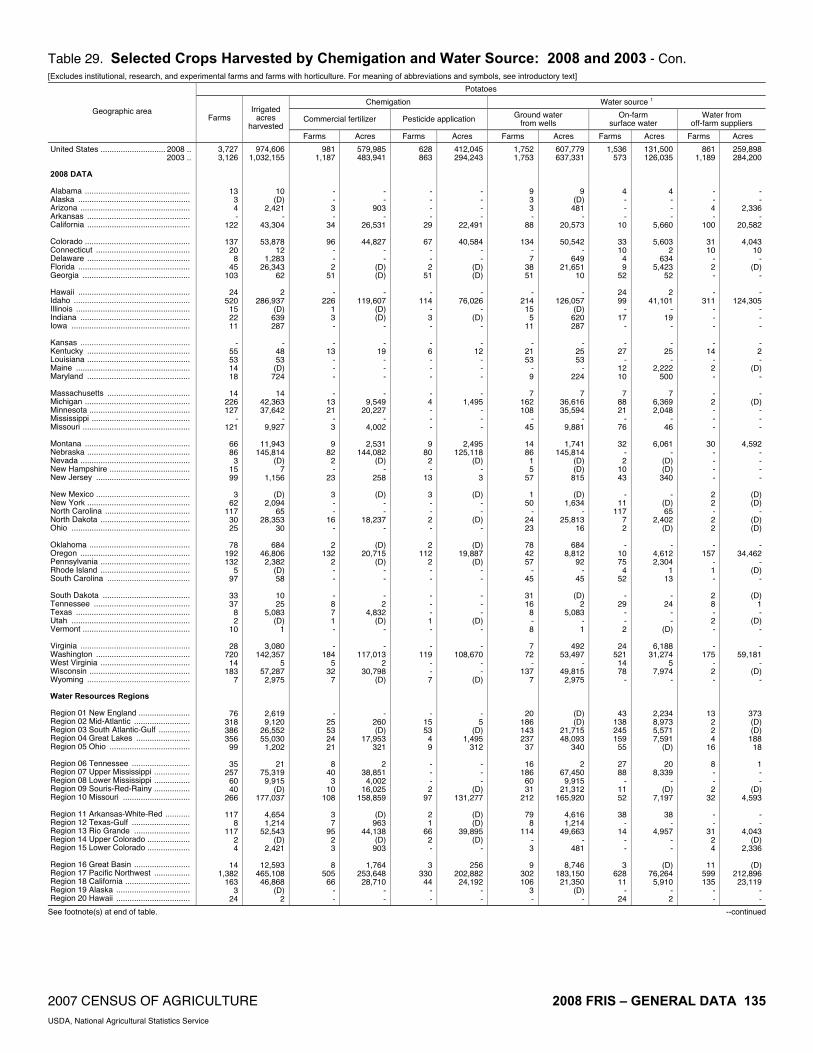
2007 CENSUS OF AGRICULTURE 2008 FRIS – GENERAL DATA 135 USDA, National Agricultural Statistics Service
Table 29. Selected Crops Harvested by Chemigation and Water Source: 2008 and 2003 - Con. [Excludes institutional, research, and experimental farms and farms with horticulture. For meaning of abbreviations and symbols, see introductory text]
Potatoes
Chemigation Water source 1
Commercial fertilizer Pesticide application Ground water from wells
On-farm surface water
Water from off-farm suppliers
Geographic area Farms
Irrigated acres
harvested Farms Acres Farms Acres Farms Acres Farms Acres Farms Acres
United States ............................. 2008 .. 2003 .. 2008 DATA Alabama ............................................... Alaska .................................................. Arizona ................................................. Arkansas .............................................. California .............................................. Colorado ............................................... Connecticut .......................................... Delaware .............................................. Florida .................................................. Georgia ................................................ Hawaii .................................................. Idaho .................................................... Illinois ................................................... Indiana ................................................. Iowa ..................................................... Kansas ................................................. Kentucky .............................................. Louisiana .............................................. Maine ................................................... Maryland .............................................. Massachusetts ..................................... Michigan ............................................... Minnesota ............................................. Mississippi ............................................ Missouri ................................................ Montana ............................................... Nebraska .............................................. Nevada ................................................. New Hampshire .................................... New Jersey .......................................... New Mexico .......................................... New York .............................................. North Carolina ...................................... North Dakota ........................................ Ohio ..................................................... Oklahoma ............................................. Oregon ................................................. Pennsylvania ........................................ Rhode Island ........................................ South Carolina ..................................... South Dakota ....................................... Tennessee ........................................... Texas ................................................... Utah ..................................................... Vermont ................................................ Virginia ................................................. Washington .......................................... West Virginia ........................................ Wisconsin ............................................. Wyoming .............................................. Water Resources Regions Region 01 New England ....................... Region 02 Mid-Atlantic ......................... Region 03 South Atlantic-Gulf .............. Region 04 Great Lakes ........................ Region 05 Ohio .................................... Region 06 Tennessee .......................... Region 07 Upper Mississippi ................ Region 08 Lower Mississippi ................ Region 09 Souris-Red-Rainy ................ Region 10 Missouri .............................. Region 11 Arkansas-White-Red ........... Region 12 Texas-Gulf .......................... Region 13 Rio Grande ......................... Region 14 Upper Colorado ................... Region 15 Lower Colorado ................... Region 16 Great Basin ......................... Region 17 Pacific Northwest ................ Region 18 California ............................. Region 19 Alaska ................................. Region 20 Hawaii .................................
3,727 3,126
13 3 4 -
122
137 20
8 45
103
24 520
15 22 11
-
55 53 14 18
14
226 127
- 121
66 86
3 15 99
3
62 117
30 25
78
192 132
5 97
33 37
8 2
10
28 720
14 183
7
76 318 386 356
99
35 257
60 40
266
117 8
117 2 4
14
1,382 163
3 24
974,606 1,032,155
10 (D)
2,421 -
43,304
53,878 12
1,283 26,343
62
2 286,937
(D) 639 287
-
48 53 (D)
724
14 42,363 37,642
- 9,927
11,943
145,814 (D)
7 1,156
(D)
2,094 65
28,353 30
684
46,806 2,382
(D) 58
10 25
5,083 (D)
1
3,080 142,357
5 57,287
2,975
2,619 9,120
26,552 55,030
1,202
21 75,319
9,915 (D)
177,037
4,654 1,214
52,543 (D)
2,421
12,593 465,108 46,868
(D) 2
981 1,187
- - 3 -
34
96 - - 2
51
- 226
1 3 -
- 13
- - -
- 13 21
- 3
9
82 2 -
23
3 - -
16 -
2 132
2 - -
- 8 7 1 -
- 184
5 32
7
- 25 53 24 21
8
40 3
10 108
3 7
95 2 3
8
505 66
- -
579,985 483,941
- -
903 -
26,531
44,827 - -
(D)(D)
-
119,607 (D)(D)
-
- 19
- - -
- 9,549
20,227 -
4,002
2,531 144,082
(D)-
258
(D)- -
18,237 -
(D)20,715
(D)- -
- 2
4,832 (D)
-
- 117,013
2 30,798
(D)
- 260 (D)
17,953 321
2
38,851 4,002
16,025 158,859
(D)
963 44,138
(D)903
1,764
253,648 28,710
- -
628 863
- - - -
29
67 - - 2
51
- 114
- 3 -
- 6 - - -
- 4 - - -
9 80
2 -
13
3 - - 2 -
2 112
2 - -
- - - 1 -
- 119
- - 7
- 15 53
4 9
- - - 2
97
2 1
66 2 -
3 330
44 - -
412,045 294,243
- - - -
22,491
40,584 - -
(D)(D)
-
76,026 -
(D)-
- 12
- - -
- 1,495
- - -
2,495 125,118
(D)- 3
(D)
- -
(D)-
(D)19,887
(D)- -
- - -
(D)-
- 108,670
- -
(D)
- 5
(D)1,495
312
- - -
(D)131,277
(D)(D)
39,895 (D)
-
256 202,882 24,192
- -
1,752 1,753
9 3 3 -
88
134 - 7
38 51
-
214 15
5 11
-
21 53
- 9
7
162 108
- 45
14 86
1 5
57
1 50
- 24 23
78 42 57
- 45
31 16
8 - 8
7
72 -
137 7
20 186 143 237
37
16 186
60 31
212
79 8
114 - 3
9
302 106
3 -
607,779 637,331
9 (D)
481 -
20,573
50,542 -
649 21,651
10
- 126,057
(D) 620 287
-
25 53
- 224
7
36,616 35,594
- 9,881
1,741
145,814 (D) (D)
815
(D) 1,634
- 25,813
16
684 8,812
92 -
45
(D) 2
5,083 - 1
492
53,497 -
49,815 2,975
(D) (D)
21,715 48,093
340
2 67,450
9,915 21,312
165,920
4,616 1,214
49,663 -
481
8,746 183,150 21,350
(D) -
1,536 573
4 - - -
10
33 10
4 9
52
24 99
- 17
-
- 27
- 12 10
7
88 21
- 76
32
- 2
10 43
-
11 117
7 2
-
10 75
4 52
-
29 - - 2
24
521 14 78
-
43 138 245 159
55
27 88
- 11 52
38
- 14
- -
3 628
11 -
24
131,500 126,035
4 - - -
5,660
5,603 2
634 5,423
52
2 41,101
- 19
-
- 25
- 2,222
500
7 6,369 2,048
- 46
6,061
- (D) (D)
340
- (D) 65
2,402 (D)
-
4,612 2,304
1 13
-
24 - -
(D)
6,188 31,274
5 7,974
-
2,234 8,973 5,571 7,591
(D)
20 8,339
- (D)
7,197
38 -
4,957 - -
(D) 76,264
5,910 - 2
861 1,189
- - 4 -
100
31 10
- 2 -
- 311
- - -
- 14
- 2 -
- 2 - - -
30 - - - -
2 2 - 2 2
-
157 - 1 -
2 8 - 2 -
- 175
- 2 -
13 2 2 4
16
8 - - 2
32
- -
31 2 4
11
599 135
- -
259,898 284,200
- -
2,336 -
20,582
4,043 10
- (D)
-
- 124,305
- - -
- 2 -
(D)-
- (D)
- - -
4,592 - - - -
(D)(D)
- (D)(D)
-
34,462 -
(D)-
(D)1 -
(D)-
- 59,181
- (D)
-
373 (D)(D)
188 18
1 - -
(D)4,593
- -
4,043 (D)
2,336
(D)212,896 23,119
- -
See footnote(s) at end of table. --continued
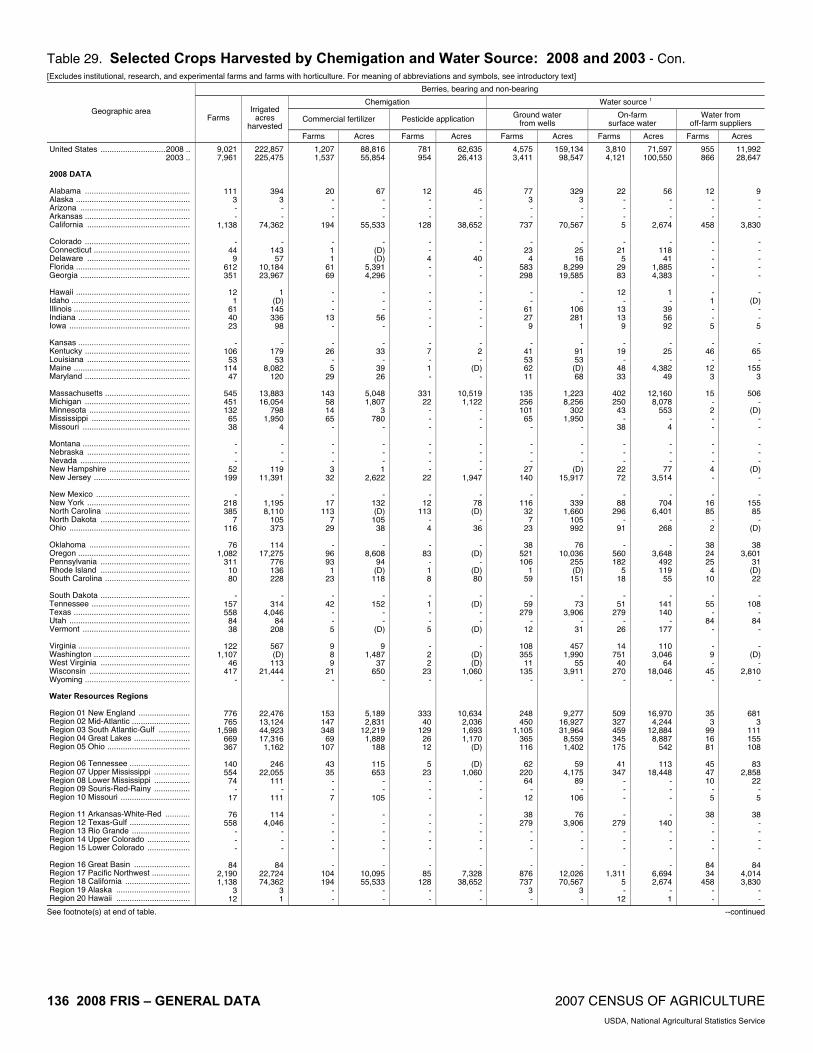
136 2008 FRIS – GENERAL DATA 2007 CENSUS OF AGRICULTURE USDA, National Agricultural Statistics Service
Table 29. Selected Crops Harvested by Chemigation and Water Source: 2008 and 2003 - Con. [Excludes institutional, research, and experimental farms and farms with horticulture. For meaning of abbreviations and symbols, see introductory text]
Berries, bearing and non-bearing
Chemigation Water source 1
Commercial fertilizer Pesticide application Ground water from wells
On-farm surface water
Water from off-farm suppliers
Geographic area Farms
Irrigated acres
harvested Farms Acres Farms Acres Farms Acres Farms Acres Farms Acres
United States .............................2008 .. 2003 .. 2008 DATA Alabama ............................................... Alaska ................................................... Arizona ................................................. Arkansas ............................................... California .............................................. Colorado ............................................... Connecticut ........................................... Delaware .............................................. Florida ................................................... Georgia ................................................. Hawaii ................................................... Idaho ..................................................... Illinois .................................................... Indiana .................................................. Iowa ...................................................... Kansas .................................................. Kentucky ............................................... Louisiana .............................................. Maine .................................................... Maryland ............................................... Massachusetts ...................................... Michigan ............................................... Minnesota ............................................. Mississippi ............................................ Missouri ................................................ Montana ................................................ Nebraska .............................................. Nevada ................................................. New Hampshire .................................... New Jersey ........................................... New Mexico .......................................... New York .............................................. North Carolina ...................................... North Dakota ........................................ Ohio ...................................................... Oklahoma ............................................. Oregon .................................................. Pennsylvania ........................................ Rhode Island ........................................ South Carolina ...................................... South Dakota ........................................ Tennessee ............................................ Texas .................................................... Utah ...................................................... Vermont ................................................ Virginia .................................................. Washington ........................................... West Virginia ........................................ Wisconsin ............................................. Wyoming ............................................... Water Resources Regions Region 01 New England ....................... Region 02 Mid-Atlantic .......................... Region 03 South Atlantic-Gulf .............. Region 04 Great Lakes ......................... Region 05 Ohio ..................................... Region 06 Tennessee ........................... Region 07 Upper Mississippi ................ Region 08 Lower Mississippi ................ Region 09 Souris-Red-Rainy ................ Region 10 Missouri ............................... Region 11 Arkansas-White-Red ........... Region 12 Texas-Gulf ........................... Region 13 Rio Grande .......................... Region 14 Upper Colorado ................... Region 15 Lower Colorado ................... Region 16 Great Basin ......................... Region 17 Pacific Northwest ................. Region 18 California ............................. Region 19 Alaska ................................. Region 20 Hawaii .................................
9,021 7,961
111 3 - -
1,138
- 44
9 612 351
12
1 61 40 23
-
106 53
114 47
545 451 132
65 38
- - -
52 199
-
218 385
7 116
76
1,082 311
10 80
-
157 558
84 38
122
1,107 46
417 -
776 765
1,598 669 367
140 554
74 -
17
76 558
- - -
84 2,190 1,138
3 12
222,857 225,475
394 3 - -
74,362
- 143
57 10,184 23,967
1
(D) 145 336
98
- 179
53 8,082
120
13,883 16,054
798 1,950
4
- - -
119 11,391
-
1,195 8,110
105 373
114
17,275 776 136 228
-
314 4,046
84 208
567 (D)
113 21,444
-
22,476 13,124 44,923 17,316
1,162
246 22,055
111 -
111
114 4,046
- - -
84 22,724 74,362
3 1
1,207 1,537
20 - - -
194
- 1 1
61 69
- - -
13 -
- 26
- 5
29
143 58 14 65
-
- - - 3
32
- 17
113 7
29
- 96 93
1 23
-
42 - - 5
9 8 9
21 -
153 147 348
69 107
43 35
- - 7
- - - - -
- 104 194
- -
88,816 55,854
67 - - -
55,533
- (D)(D)
5,391 4,296
- - -
56 -
- 33
- 39 26
5,048 1,807
3 780
-
- - - 1
2,622
- 132 (D)
105 38
-
8,608 94 (D)
118
- 152
- -
(D)
9 1,487
37 650
-
5,189 2,831
12,219 1,889
188
115 653
- -
105
- - - - -
- 10,095 55,533
- -
781 954
12 - - -
128
- - 4 - -
- - - - -
- 7 - 1 -
331 22
- - -
- - - -
22
- 12
113 - 4
-
83 - 1 8
- 1 - - 5
- 2 2
23 -
333 40
129 26 12
5
23 - - -
- - - - -
- 85
128 - -
62,635 26,413
45 - - -
38,652
- -
40 - -
- - - - -
- 2 -
(D)-
10,519 1,122
- - -
- - - -
1,947
- 78 (D)
- 36
-
(D)-
(D)80
-
(D)- -
(D)
- (D)(D)
1,060 -
10,634 2,036 1,693 1,170
(D)
(D)1,060
- - -
- - - - -
- 7,328
38,652 - -
4,575 3,411
77 3 - -
737
- 23
4 583 298
- -
61 27
9
- 41 53 62 11
135 256 101
65 -
- - -
27 140
-
116 32
7 23
38
521 106
1 59
-
59 279
- 12
108 355
11 135
-
248 450
1,105 365 116
62
220 64
- 12
38
279 - - -
- 876 737
3 -
159,134 98,547
329 3 - -
70,567
- 25 16
8,299 19,585
- -
106 281
1
- 91 53 (D) 68
1,223 8,256
302 1,950
-
- - -
(D) 15,917
-
339 1,660
105 992
76
10,036 255 (D)
151
- 73
3,906 -
31
457 1,990
55 3,911
-
9,277 16,927 31,964
8,559 1,402
59
4,175 89
- 106
76
3,906 - - -
- 12,026 70,567
3 -
3,810 4,121
22 - - - 5
-
21 5
29 83
12
- 13 13
9
- 19
- 48 33
402 250
43 -
38
- - -
22 72
-
88 296
- 91
-
560 182
5 18
-
51 279
- 26
14
751 40
270 -
509 327 459 345 175
41
347 - - -
- 279
- - -
- 1,311
5 -
12
71,597 100,550
56 - - -
2,674
- 118
41 1,885 4,383
1 -
39 56 92
-
25 -
4,382 49
12,160
8,078 553
- 4
- - -
77 3,514
-
704 6,401
- 268
-
3,648 492 119
55
- 141 140
- 177
110
3,046 64
18,046 -
16,970 4,244
12,884 8,887
542
113 18,448
- - -
- 140
- - -
- 6,694 2,674
- 1
955 866
12 - - -
458
- - - - -
- 1 - - 5
-
46 -
12 3
15
- 2 - -
- - - 4 -
- 16 85
- 2
38 24 25
4 10
-
55 -
84 -
- 9 -
45 -
35 3
99 16 81
45 47 10
- 5
38
- - - -
84 34
458 - -
11,992 28,647
9 - - -
3,830
- - - - -
- (D)
- - 5
-
65 -
155 3
506
- (D)
- -
- - -
(D)-
- 155
85 -
(D)
38 3,601
31 (D)22
-
108 -
84 -
- (D)
- 2,810
-
681 3
111 155 108
83
2,858 22
- 5
38
- - - -
84 4,014 3,830
- -
See footnote(s) at end of table. --continued
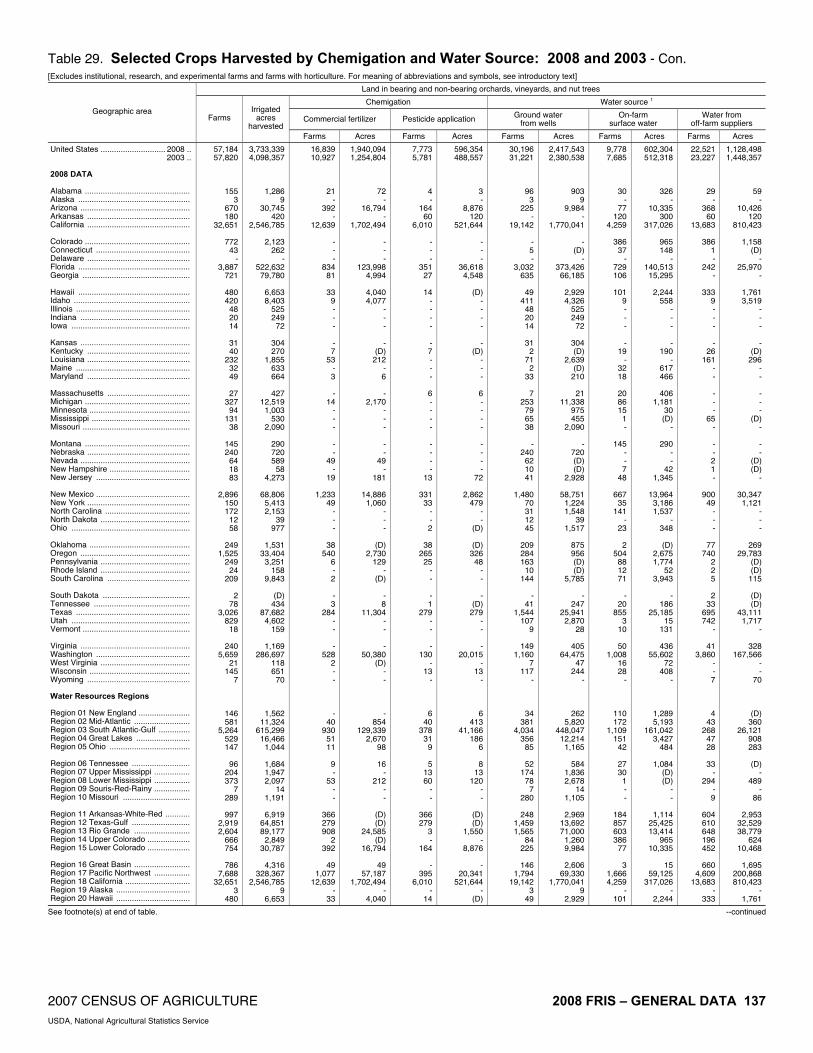
2007 CENSUS OF AGRICULTURE 2008 FRIS – GENERAL DATA 137 USDA, National Agricultural Statistics Service
Table 29. Selected Crops Harvested by Chemigation and Water Source: 2008 and 2003 - Con. [Excludes institutional, research, and experimental farms and farms with horticulture. For meaning of abbreviations and symbols, see introductory text]
Land in bearing and non-bearing orchards, vineyards, and nut trees
Chemigation Water source 1
Commercial fertilizer Pesticide application Ground water from wells
On-farm surface water
Water from off-farm suppliers
Geographic area Farms
Irrigated acres
harvested Farms Acres Farms Acres Farms Acres Farms Acres Farms Acres
United States ............................. 2008 .. 2003 .. 2008 DATA Alabama ............................................... Alaska .................................................. Arizona ................................................. Arkansas .............................................. California .............................................. Colorado ............................................... Connecticut .......................................... Delaware .............................................. Florida .................................................. Georgia ................................................ Hawaii .................................................. Idaho .................................................... Illinois ................................................... Indiana ................................................. Iowa ..................................................... Kansas ................................................. Kentucky .............................................. Louisiana .............................................. Maine ................................................... Maryland .............................................. Massachusetts ..................................... Michigan ............................................... Minnesota ............................................. Mississippi ............................................ Missouri ................................................ Montana ............................................... Nebraska .............................................. Nevada ................................................. New Hampshire .................................... New Jersey .......................................... New Mexico .......................................... New York .............................................. North Carolina ...................................... North Dakota ........................................ Ohio ..................................................... Oklahoma ............................................. Oregon ................................................. Pennsylvania ........................................ Rhode Island ........................................ South Carolina ..................................... South Dakota ....................................... Tennessee ........................................... Texas ................................................... Utah ..................................................... Vermont ................................................ Virginia ................................................. Washington .......................................... West Virginia ........................................ Wisconsin ............................................. Wyoming .............................................. Water Resources Regions Region 01 New England ....................... Region 02 Mid-Atlantic ......................... Region 03 South Atlantic-Gulf .............. Region 04 Great Lakes ........................ Region 05 Ohio .................................... Region 06 Tennessee .......................... Region 07 Upper Mississippi ................ Region 08 Lower Mississippi ................ Region 09 Souris-Red-Rainy ................ Region 10 Missouri .............................. Region 11 Arkansas-White-Red ........... Region 12 Texas-Gulf .......................... Region 13 Rio Grande ......................... Region 14 Upper Colorado ................... Region 15 Lower Colorado ................... Region 16 Great Basin ......................... Region 17 Pacific Northwest ................ Region 18 California ............................. Region 19 Alaska ................................. Region 20 Hawaii .................................
57,184 57,820
155 3
670 180
32,651
772 43
- 3,887
721
480 420
48 20 14
31 40
232 32 49
27
327 94
131 38
145 240
64 18 83
2,896
150 172
12 58
249
1,525 249
24 209
2
78 3,026
829 18
240
5,659 21
145 7
146 581
5,264 529 147
96
204 373
7 289
997
2,919 2,604
666 754
786
7,688 32,651
3 480
3,733,339 4,098,357
1,286 9
30,745 420
2,546,785
2,123 262
- 522,632 79,780
6,653 8,403
525 249
72
304 270
1,855 633 664
427
12,519 1,003
530 2,090
290 720 589
58 4,273
68,806
5,413 2,153
39 977
1,531
33,404 3,251
158 9,843
(D)
434 87,682
4,602 159
1,169
286,697 118 651
70
1,562 11,324
615,299 16,466
1,044
1,684 1,947 2,097
14 1,191
6,919
64,851 89,177
2,849 30,787
4,316
328,367 2,546,785
9 6,653
16,839 10,927
21 -
392 -
12,639
- - -
834 81
33
9 - - -
- 7
53 - 3
-
14 - - -
- -
49 -
19
1,233 49
- - -
38 540
6 - 2
- 3
284 - -
- 528
2 - -
- 40
930 51 11
9 -
53 - -
366 279 908
2 392
49
1,077 12,639
- 33
1,940,094 1,254,804
72 -
16,794 -
1,702,494
- - -
123,998 4,994
4,040 4,077
- - -
- (D)
212 - 6
-
2,170 - - -
- -
49 -
181
14,886 1,060
- - -
(D)2,730
129 -
(D)
- 8
11,304 - -
- 50,380
(D)- -
- 854
129,339 2,670
98
16 -
212 - -
(D)(D)
24,585 (D)
16,794
49 57,187
1,702,494 -
4,040
7,773 5,781
4 -
164 60
6,010
- - -
351 27
14
- - - -
- 7 - - -
6 - - - -
- - - -
13
331 33
- - 2
38
265 25
- -
- 1
279 - -
- 130
- 13
-
6 40
378 31
9
5 13 60
- -
366 279
3 -
164
- 395
6,010 -
14
596,354 488,557
3 -
8,876 120
521,644
- - -
36,618 4,548
(D)
- - - -
- (D)
- - -
6 - - - -
- - - -
72
2,862 479
- -
(D)
(D)326
48 - -
- (D)
279 - -
- 20,015
- 13
-
6 413
41,166 186
6
8 13
120 - -
(D)(D)
1,550 -
8,876
- 20,341
521,644 -
(D)
30,196 31,221
96 3
225 -
19,142
- 5 -
3,032 635
49
411 48 20 14
31
2 71
2 33
7
253 79 65 38
-
240 62 10 41
1,480
70 31 12 45
209 284 163
10 144
-
41 1,544
107 9
149
1,160 7
117 -
34 381
4,034 356
85
52 174
78 7
280
248 1,459 1,565
84 225
146
1,794 19,142
3 49
2,417,543 2,380,538
903 9
9,984 -
1,770,041
- (D)
- 373,426 66,185
2,929 4,326
525 249
72
304 (D)
2,639 (D)
210
21 11,338
975 455
2,090
- 720 (D) (D)
2,928
58,751 1,224 1,548
39 1,517
875 956 (D) (D)
5,785
- 247
25,941 2,870
28
405 64,475
47 244
-
262 5,820
448,047 12,214
1,165
584 1,836 2,678
14 1,105
2,969
13,692 71,000
1,260 9,984
2,606
69,330 1,770,041
9 2,929
9,778 7,685
30 -
77 120
4,259
386 37
- 729 106
101
9 - - -
- 19
- 32 18
20 86 15
1 -
145 - - 7
48
667 35
141 -
23
2 504
88 12 71
-
20 855
3 10
50
1,008 16 28
-
110 172
1,109 151
42
27 30
1 - -
184 857 603 386
77
3 1,666 4,259
- 101
602,304 512,318
326 -
10,335 300
317,026
965 148
- 140,513 15,295
2,244
558 - - -
- 190
- 617 466
406
1,181 30 (D)
-
290 - -
42 1,345
13,964
3,186 1,537
- 348
(D)
2,675 1,774
52 3,943
-
186 25,185
15 131
436
55,602 72
408 -
1,289 5,193
161,042 3,427
484
1,084 (D) (D)
- -
1,114 25,425 13,414
965 10,335
15
59,125 317,026
- 2,244
22,521 23,227
29 -
368 60
13,683
386 1 -
242 -
333 9 - - -
- 26
161 - -
- - -
65 -
- - 2 1 -
900 49
- - -
77 740
2 2 5
2
33 695 742
-
41 3,860
- - 7
4 43
268 47 28
33
- 294
- 9
604 610 648 196 452
660
4,609 13,683
- 333
1,128,498 1,448,357
59 -
10,426 120
810,423
1,158 (D)
- 25,970
-
1,761 3,519
- - -
- (D)
296 - -
- - -
(D)-
- -
(D)(D)
-
30,347 1,121
- - -
269 29,783
(D)(D)
115
(D)(D)
43,111 1,717
-
328 167,566
- -
70
(D)360
26,121 908 283
(D)
- 489
- 86
2,953
32,529 38,779
624 10,468
1,695
200,868 810,423
- 1,761
See footnote(s) at end of table. --continued

138 2008 FRIS – GENERAL DATA 2007 CENSUS OF AGRICULTURE USDA, National Agricultural Statistics Service
Table 29. Selected Crops Harvested by Chemigation and Water Source: 2008 and 2003 - Con. [Excludes institutional, research, and experimental farms and farms with horticulture. For meaning of abbreviations and symbols, see introductory text]
All other crops
Chemigation Water source 1
Commercial fertilizer Pesticide application Ground water from wells
On-farm surface water
Water from off-farm suppliers
Geographic area Farms
Irrigated acres
harvested Farms Acres Farms Acres Farms Acres Farms Acres Farms Acres
United States .............................2008 .. 2003 .. 2008 DATA Alabama ............................................... Alaska ................................................... Arizona ................................................. Arkansas ............................................... California .............................................. Colorado ............................................... Connecticut ........................................... Delaware .............................................. Florida ................................................... Georgia ................................................. Hawaii ................................................... Idaho ..................................................... Illinois .................................................... Indiana .................................................. Iowa ...................................................... Kansas .................................................. Kentucky ............................................... Louisiana .............................................. Maine .................................................... Maryland ............................................... Massachusetts ...................................... Michigan ............................................... Minnesota ............................................. Mississippi ............................................ Missouri ................................................ Montana ................................................ Nebraska .............................................. Nevada ................................................. New Hampshire .................................... New Jersey ........................................... New Mexico .......................................... New York .............................................. North Carolina ...................................... North Dakota ........................................ Ohio ...................................................... Oklahoma ............................................. Oregon .................................................. Pennsylvania ........................................ Rhode Island ........................................ South Carolina ...................................... South Dakota ........................................ Tennessee ............................................ Texas .................................................... Utah ...................................................... Vermont ................................................ Virginia .................................................. Washington ........................................... West Virginia ........................................ Wisconsin ............................................. Wyoming ............................................... Water Resources Regions Region 01 New England ....................... Region 02 Mid-Atlantic .......................... Region 03 South Atlantic-Gulf .............. Region 04 Great Lakes ......................... Region 05 Ohio ..................................... Region 06 Tennessee ........................... Region 07 Upper Mississippi ................ Region 08 Lower Mississippi ................ Region 09 Souris-Red-Rainy ................ Region 10 Missouri ............................... Region 11 Arkansas-White-Red ........... Region 12 Texas-Gulf ........................... Region 13 Rio Grande .......................... Region 14 Upper Colorado ................... Region 15 Lower Colorado ................... Region 16 Great Basin ......................... Region 17 Pacific Northwest ................. Region 18 California ............................. Region 19 Alaska ................................. Region 20 Hawaii .................................
6,761 6,541
35 1
370 79
2,155
368 3 7
114 69
369 247
82 38 12
104
8 20
- 20
7
19 68
2 7
92
523 12
1 28
55 52 28 30 41
44
615 97
9 25
34 33
173 28
-
41 387
5 81
123
20 184 293
64 85
27
221 113
25 979
166 119
65 222 370
103
1,176 2,159
1 369
1,487,387 1,418,982
294 (D)
17,005 4,400
263,763
24,607 (D)
865 355,879 20,498
43,958 52,459 26,248 12,974
944
21,020 78
10,302 -
619
329 1,876
17,933 (D)
1,336
15,090 123,750
5,983 (D)
1,605
9,147 1,368 3,004 7,415
66
4,621 215,863
649 18
1,543
4,285 598
54,872 2,577
-
953 118,702
25 9,850
26,102
431 5,473
381,693 6,688
11,171
206 39,066
(D) 15,892
200,717
33,830 41,498
8,927 4,137
17,005
28,110 364,950 265,897
(D) 43,958
864 825
- -
25 -
112
39 - - 9 -
99 70 19
4 3
7 - - - -
- -
12 - 4
7
136 2 -
14
33 - - 3 -
- 85
- - 8
3 -
38 9 -
- 84
- 37
2
- 14 17
2 2
-
67 - 4
181
21 27 43
3 25
69
178 112
- 99
338,294 275,574
- -
7,537 -
74,766
5,947 - -
4,208 -
42,779 21,216
6,034 650 320
2,493
- - - -
- -
(D)-
496
1,270 57,229
(D)-
907
6,476 - -
1,360 -
- 26,255
- -
72
2,939 -
12,572 480
-
- 51,459
- 5,999
(D)
- 907
4,280 (D)(D)
-
11,913 -
3,670 66,811
5,811
10,870 6,556
210 7,537
18,734 80,630 74,766
- 42,779
490 307
- - 1 -
105
35 - - - -
29 65
2 2 -
5 - - - -
- -
10 - -
- 133
2 - 2
3 - - 1 -
- 28
- - -
2 - 5 6 -
- 42
- 12
-
- 2 - - -
- 26
- 1
160
4 3
16 - 1
69 74
105 -
29
182,141 103,520
- -
(D)-
55,836
5,710 - - - -
1,896 20,920
(D)(D)
-
1,200 - - - -
- -
100 - -
- 55,589
(D)-
(D)
3,511 - -
(D)-
- 13,040
- - -
(D)-
492 270
-
- 19,081
- 48
-
- (D)
- - -
- 1,278
- (D)
60,549
252 2,040 4,201
- (D)
19,624 34,741 55,836
- 1,896
2,984 2,908
18 -
127 79
786
111 1 2
45 62
50 78 80 32
6
95 -
20 - 9
-
17 24
2 3
13
498 5 -
24
21 12 21 21 19
32
182 32
5 12
5 1
125 3 -
13 226
- 67
-
6 60
163 43 48
4
170 105
13 686
131
69 29
- 127
77
417 786
- 50
605,386 563,017
118 -
6,982 4,400
110,301
14,056 (D) (D)
27,374 18,878
(D)
23,320 25,872
8,556 (D)
18,776
- 10,302
- 264
-
1,700 4,071
(D) 840
1,268
121,925 3,807
- 1,165
8,534
799 (D)
5,959 19
4,628
78,840 120
10 1,251
638 (D)
29,588 195
-
343 53,540
- 9,920
-
(D) 2,796
48,870 6,286 6,583
4
36,920 16,792
3,776 146,144
32,680 16,220
7,504 -
6,982
23,942 135,760 110,301
- (D)
2,040 838
17 1
115 -
855
241 2 5
50 7
130
23 4 9 6
9 8 - -
14
7 6
38 2 4
5 - 4 - 4
12 42
8 2
13
12 161
64 -
10
3 15
5 6 -
28 55
5 29
4
9 131 109
18 37
14 64
2 10 51
35
7 10
196 115
7
236 858
1 130
188,144 294,969
176 (D)
2,240 -
59,085
7,366 (D) (D)
32,561 1,760
1,919 4,280
420 2,573
(D)
2,244 78
- -
360
329 176
9,442 (D)
496
538 -
3,224 -
140
1,000 837
1,378 (D) 29
600
26,828 549
- 172
390 151
1,200 300
-
610 13,650
25 263
8,475
(D) 2,676
36,499 454
2,737
121 1,923
(D) 8,226
17,351
1,761 1,330
870 1,531 2,240
3,344
43,324 60,519
(D) 1,919
2,284 3,581
- -
137 -
676
54 - -
29 -
215 166
- 3 -
- - - - -
- - 7 - -
79 25
5 1 2
34
2 2 9 9
3
446 3 4 3
31 17 47 22
-
- 131
- 2
120
5 4
34 11
6
9 2 8 5
282
12 47 38 26
137
24 742 677
- 215
742,710 607,103
- -
7,783 -
124,452
6,819 - -
297,969 -
38,621 27,319
- 1,845
-
- - - - -
- -
4,490 - -
13,284 1,825
912 (D)(D)
1,244
(D)(D)(D)18
360
113,019 6 8
120
3,647 (D)
24,888 2,277
-
- 51,512
- (D)
17,627
(D)858
298,489 84
1,851
81 (D)(D)
3,890 40,796
810
24,888 2,044 2,606 7,783
2,979
191,150 125,152
- 38,621
See footnote(s) at end of table. --continued

2007 CENSUS OF AGRICULTURE 2008 FRIS – GENERAL DATA 139 USDA, National Agricultural Statistics Service
Table 29. Selected Crops Harvested by Chemigation and Water Source: 2008 and 2003 - Con. [Excludes institutional, research, and experimental farms and farms with horticulture. For meaning of abbreviations and symbols, see introductory text]
Pastureland, all types
Chemigation Water source 1
Commercial fertilizer Pesticide application Ground water from wells
On-farm surface water
Water from off-farm suppliers
Geographic area Farms
Irrigated acres
harvested Farms Acres Farms Acres Farms Acres Farms Acres Farms Acres
United States ............................. 2008 .. 2003 .. 2008 DATA Alabama ............................................... Alaska .................................................. Arizona ................................................. Arkansas .............................................. California .............................................. Colorado ............................................... Connecticut .......................................... Delaware .............................................. Florida .................................................. Georgia ................................................ Hawaii .................................................. Idaho .................................................... Illinois ................................................... Indiana ................................................. Iowa ..................................................... Kansas ................................................. Kentucky .............................................. Louisiana .............................................. Maine ................................................... Maryland .............................................. Massachusetts ..................................... Michigan ............................................... Minnesota ............................................. Mississippi ............................................ Missouri ................................................ Montana ............................................... Nebraska .............................................. Nevada ................................................. New Hampshire .................................... New Jersey .......................................... New Mexico .......................................... New York .............................................. North Carolina ...................................... North Dakota ........................................ Ohio ..................................................... Oklahoma ............................................. Oregon ................................................. Pennsylvania ........................................ Rhode Island ........................................ South Carolina ..................................... South Dakota ....................................... Tennessee ........................................... Texas ................................................... Utah ..................................................... Vermont ................................................ Virginia ................................................. Washington .......................................... West Virginia ........................................ Wisconsin ............................................. Wyoming .............................................. Water Resources Regions Region 01 New England ....................... Region 02 Mid-Atlantic ......................... Region 03 South Atlantic-Gulf .............. Region 04 Great Lakes ........................ Region 05 Ohio .................................... Region 06 Tennessee .......................... Region 07 Upper Mississippi ................ Region 08 Lower Mississippi ................ Region 09 Souris-Red-Rainy ................ Region 10 Missouri .............................. Region 11 Arkansas-White-Red ........... Region 12 Texas-Gulf .......................... Region 13 Rio Grande ......................... Region 14 Upper Colorado ................... Region 15 Lower Colorado ................... Region 16 Great Basin ......................... Region 17 Pacific Northwest ................ Region 18 California ............................. Region 19 Alaska ................................. Region 20 Hawaii .................................
49,582 49,843
47 1
1,336 129
6,787
4,088 - 8
404 213
58
8,179 2
60 12
113
30 8 3 7
37
163 21
- 58
3,379
584 627
- 47
2,502
- 316
6 3
253
6,538 9 4
82
25 31
2,013 4,997
-
7 4,293
4 30
2,068
44 80
1,056 221
66
15 25
106 8
5,173
1,034 1,779 2,244 5,165 1,712
4,225
19,207 7,363
1 58
3,611,216 3,629,492
1,614 (D)
42,104 3,272
367,405
435,226 -
116 74,344 26,795
1,492
379,140 (D)
2,092 209
29,958
566 240
45 248
111
3,251 464
- 1,889
392,545 44,057
152,895 -
365
111,475 -
11,790 652
65
38,509 338,710
158 4
2,815
2,003 (D)
350,030 253,812
-
250 132,393
16 905
405,592
160 (D)
117,118 4,886 1,323
1,267
977 2,174
292 685,704
285,709 189,306 153,797 490,301 53,539
297,680 898,867 425,116
(D) 1,492
2,831 2,472
1 -
145 - 4
28
- - 1 -
- 293
- - -
39 - - - -
- - - - -
25 138
57 - -
108 - - - -
16 1,568
- -
44
- 9
247 44
-
- 52
- 1
11
- -
46 - 9
- 1 - -
151
109 195 108
35 145
96
1,932 4 - -
115,681 112,945
(D)-
5,677 -
1,744
5,548 - -
(D)-
- 848
- - -
11,722 - - - -
- - - - -
2,545 3,466 2,260
- -
4,838 - - - -
2,940 16,636
- -
220
- 27
43,721 3,398
-
- 4,430
- (D)
4,886
- -
970 -
(D)
- (D)
- -
8,539
25,142 33,801
5,183 7,851 5,677
2,928
23,794 1,744
- -
910 1,083
- - 3 - -
3 - - - -
- 273
- - -
1 - - - -
- - - - -
- - 4 - -
- - - - -
- 542
- -
44
- -
38 - -
- 2 - - -
- -
44 - -
- - - - 3
1
38 - - 3
4
817 - - -
23,144 32,449
- -
36 - -
168 - - - -
- (D)
- - -
(D)- - - -
- - - - -
- -
504 - -
- - - - -
- 5,096
- -
(D)
- -
16,350 - -
- (D)
- - -
- -
(D)- -
- - - -
168
(D)16,350
- -
36
504 5,373
- - -
9,967 11,006
17 1
416 50
1,202
250 - 7
358 88
17
1,034 2
47 7
109
7 8 3 3
37 68 15
- 4
13
559 109
- 47
489
- 16
6 3
163
2,047 - 4
16
- 10
1,291 261
-
- 1,012
- 15
156
44 57
495 111
19
1 25 42
2 772
549
1,058 393 112 538
727
3,509 1,495
1 17
834,039 703,220
95 (D)
23,064 1,707
191,817
25,049 -
(D) 42,174 10,816
446
32,716 (D)
1,832 34
29,921
140 240
45 (D)
111
1,815 338
- 604
1,340
23,807 12,805
- 365
40,536
- 288 652
65
30,118 45,668
- 4
1,987
- 102
254,233 13,779
-
- 33,175
- 793
10,727
160 (D)
55,360 3,338
572
(D) 977
1,224 (D)
42,458
232,024 94,099 42,259
7,320 27,215
29,176 91,226
205,018 (D)
446
14,673 11,289
27 -
225 79
1,950
1,158 - 1
47 134
7
2,184 -
13 -
4 16
- - 2
-
95 6 -
54
1,571 -
221 - -
959 -
300 - -
82 2,394
9 -
66
- 11
473 850
-
7 1,123
4 2
599
- 21
568 97 31
13
- 64
6 1,445
245 450 875
1,511 288
835
6,068 2,149
- 7
1,377,830 1,240,469
1,461 -
9,630 2,800
202,872
181,103 -
(D) 32,420 13,709
750
134,248 -
260 -
480 349
- -
(D)
- 1,436
186 -
1,285
196,776 -
94,367 - -
15,753 -
13,105 - -
8,824 146,503
158 -
828
- 302
28,174 75,052
-
250 43,179
16 (D)
171,404
- 494
61,283 1,496
629
(D) -
950 (D)
293,350
18,494 28,174 52,922
181,392 11,812
150,613 360,411 214,382
- 750
26,876 28,748
3 -
923 -
3,734
2,931 - - 5 4
36
5,331 - - 5
- 7 - - 2
- - - - -
1,900 25
333 - -
1,169 - - - -
30 2,313
- - -
25 10
429 4,085
-
- 2,245
- 13
1,318
- 2
12 13 16
1 - - -
2,975
304 432
1,095 3,741 1,174
2,866
10,369 3,840
- 36
1,648,457 1,723,395
(D)-
15,810 -
129,707
232,615 - -
6,050 3,600
302
239,393 - -
175
- 77
- -
(D)
- - - - -
195,052 20,250 47,698
- -
62,810 - - - -
2,097 152,412
- - -
2,003 (D)
74,394 168,074
-
- 58,139
- 1,300
235,576
- (D)
9,740 1,300
122
(D)- - -
363,082
42,323 74,519 62,811
306,641 21,298
119,912 482,642 162,977
- 302
1 Column totals may exceed total farms and acres of crop because more than one water source could be reported. 2 2003 data do not include potatoes.

140 2008 FRIS – GENERAL DATA 2007 CENSUS OF AGRICULTURE USDA, National Agricultural Statistics Service
Table 30. Selected Crops Irrigated and Harvested by Primary Method of Water Distribution, United States: 2008
[Excludes institutional, research, and experimental farms and farms with horticulture. For meaning of abbreviations and symbols, see introductory text]
All methods Pressure systems Gravity systems Crop
Farms Acres Farms Acres Farms Acres
Corn for grain or seed ........................... Corn for silage or greenchop ................ Sorghum for grain or seed .................... Wheat for grain or seed ........................ Barley for grain or seed ........................ Soybeans for beans .............................. Beans, dry edible .................................. Rice ...................................................... Other small grains (oats, rye, etc.) .................................... Alfalfa and alfalfa mixtures (dry hay, greenchop, and silage) ............................................... All other hay (dry hay, greenchop, and silage) ....................... Peanuts ................................................ All cotton ............................................... Sugarbeets for sugar ............................ Tobacco ................................................ Land in vegetables ............................... Selected vegetables: Sweet corn ........................................ Tomatoes in the open ....................... Lettuce and romaine ......................... Potatoes, excluding sweet potatoes .......................................... All berries .............................................. Land in orchards, vineyards, and nut trees ....................................... All other crops (see text) ....................... Pastureland, all types ...........................
33,571 9,135 4,118
16,265 4,334
23,024
2,849 5,265
2,975
48,315
29,553
2,535 6,612 1,590
811 16,899
4,341 5,937 2,203
3,727
9,021
57,184
6,761 49,582
11,991,515 1,633,540 1,042,392 4,107,464
762,240
7,044,546 431,329
2,683,363
344,195
6,187,983
3,351,986
540,577 3,123,664
382,267 23,614
3,084,879
294,855 305,565 255,880
974,606
222,857
3,733,339 1,487,387 3,611,216
26,592 4,690 2,860
11,781 2,414
16,906
1,366 75
1,521
24,879
13,767
2,482 4,532
696 794
13,820
3,329 4,887 1,820
3,241
8,519
47,140
4,964 25,912
9,786,501 891,129 798,388
3,201,888 546,847
4,158,193
266,162 48,154
201,540
3,596,494
1,110,400
(D) 1,953,746
223,856 23,175
2,637,318
244,937 195,472 180,704
943,097
212,636
3,153,494
886,595 1,166,593
6,979 4,445 1,258 4,484 1,920
6,118 1,483 5,190
1,454
23,436
15,786
53 2,080
894 17
3,079
1,012 1,050
383
486
502
10,044 1,797
23,670
2,205,014 742,411 244,004 905,576 215,393
2,886,353
165,167 2,635,209
142,655
2,591,489
2,241,586
(D)1,169,918
158,411 439
447,561
49,918 110,093 75,176
31,509
10,221
579,845 600,792
2,444,623
Pressure irrigation distribution systems 1
Hand move Solid or permanent set
Side roll or wheel line Big gun Low-flow irrigation (drip,
trickle, or micro sprinklers) Crop Percent
of farms
Percent of
acres 2
Percent of
farms
Percent of
acres 2
Percent of
farms
Percent of
acres 2
Percent of
farms
Percent of
acres 2
Percent of
farms
Percent of
acres 2
Corn for grain or seed ........................... Corn for silage or greenchop ................ Sorghum for grain or seed .................... Wheat for grain or seed ........................ Barley for grain or seed ........................ Soybeans for beans .............................. Beans, dry edible .................................. Rice ...................................................... Other small grains (oats, rye, etc.) .................................... Alfalfa and alfalfa mixtures (dry hay, greenchop, and silage) ............................................... All other hay (dry hay, greenchop, and silage) ....................... Peanuts ................................................ All cotton ............................................... Sugarbeets for sugar ............................ Tobacco ................................................ Land in vegetables ............................... Selected vegetables: Sweet corn ........................................ Tomatoes in the open ....................... Lettuce and romaine ......................... Potatoes, excluding sweet potatoes .......................................... All berries .............................................. Land in orchards, vineyards, and nut trees ....................................... All other crops (see text) ....................... Pastureland, all types ...........................
0.4 0.6 0.1 3.4 5.5
0.1 5.3
-
0.8
6.2
11.7
- 0.5
- 33.8 18.7
20.2 22.4 13.8
19.3
21.5
9.0
13.5 24.9
(Z) 0.8 0.1 1.4 1.6
(Z) 2.5
-
1.9
2.6
1.6
- 0.2
- 24.7
6.2
2.1 5.8
14.2
0.7
2.7
0.7 3.0 4.0
0.3 0.4 0.1 0.4 0.3
(Z)3.9 (Z)
1.5
1.0
2.0
1.9 0.2 0.3 1.4 5.3
7.0 3.0 5.9
6.5
19.0
19.6
9.2 7.5
(Z) 0.5 0.4 0.6 0.3
(Z) 0.2 (D)
1.1
0.5
1.0
0.1 0.3 0.4 (D) 4.1
0.7 0.3 4.9
5.8
33.2
14.2
1.7 0.7
0.7 1.8 0.3 8.6
22.8
0.6 3.5 0.1
16.7
17.4
10.6
- 1.5 7.7 7.9 2.0
1.5 0.5 0.1
4.9
0.2
0.2 2.7 7.3
0.2 1.1 0.1 3.8
11.4
0.3 2.9 0.2
7.2
8.9
5.4
- 0.5 6.8 8.6 1.7
1.0 1.4 (Z)
3.5
0.4
(Z) 2.2 4.6
2.0 7.0 0.2 0.8 0.2
1.7 0.6
-
5.3
2.5
5.6
4.6 1.1 0.5
43.6 5.1
10.5 1.6 1.1
5.9
1.7
0.2 2.9 2.6
0.4 1.8 (Z) 0.1 (Z)
0.4 0.3
-
2.3
0.9
2.5
1.2 0.2 0.1
45.1 2.8
5.3 0.9 1.6
1.3
4.0
0.4 2.6 1.8
0.5 0.3 0.7 0.4 0.4
0.1 4.2 0.1
0.5
0.5
1.1
0.2 2.9 0.9 2.2
31.8
17.3 50.8 54.4
14.2
44.4
50.1 19.7
2.2
0.1 0.2 0.4 0.4 0.6
0.1 1.3 0.1
0.9
0.5
0.2
0.2 2.6 0.5 0.6
17.5
6.1 47.4 35.2
0.4
44.3
62.3 11.5
0.7
See footnote(s) at end of table. --continued
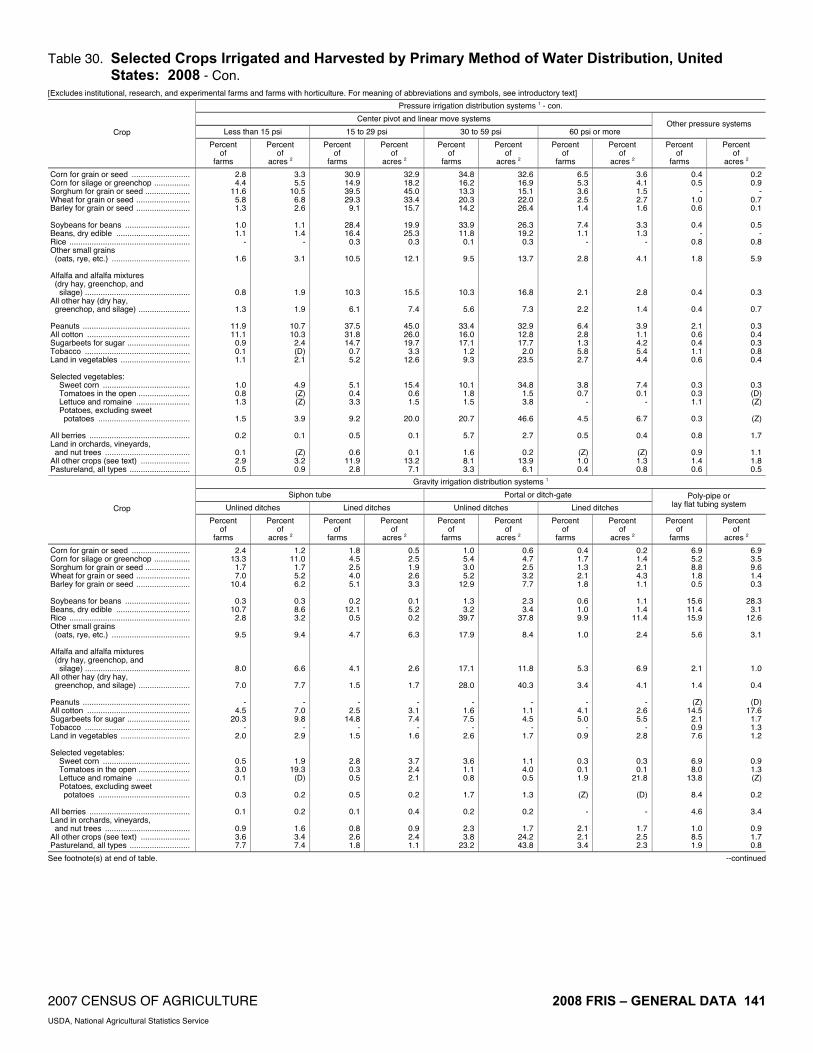
2007 CENSUS OF AGRICULTURE 2008 FRIS – GENERAL DATA 141 USDA, National Agricultural Statistics Service
Table 30. Selected Crops Irrigated and Harvested by Primary Method of Water Distribution, United States: 2008 - Con.
[Excludes institutional, research, and experimental farms and farms with horticulture. For meaning of abbreviations and symbols, see introductory text]
Pressure irrigation distribution systems 1 - con.
Center pivot and linear move systems
Less than 15 psi 15 to 29 psi 30 to 59 psi 60 psi or more Other pressure systems
Crop
Percent of
farms
Percent of
acres 2
Percent of
farms
Percent of
acres 2
Percent of
farms
Percent of
acres 2
Percent of
farms
Percent of
acres 2
Percent of
farms
Percent of
acres 2
Corn for grain or seed .......................... Corn for silage or greenchop ................ Sorghum for grain or seed .................... Wheat for grain or seed ........................ Barley for grain or seed ........................ Soybeans for beans ............................. Beans, dry edible ................................. Rice ...................................................... Other small grains (oats, rye, etc.) ................................... Alfalfa and alfalfa mixtures (dry hay, greenchop, and silage) ............................................... All other hay (dry hay, greenchop, and silage) ....................... Peanuts ................................................ All cotton .............................................. Sugarbeets for sugar ............................ Tobacco ............................................... Land in vegetables ............................... Selected vegetables: Sweet corn ....................................... Tomatoes in the open ....................... Lettuce and romaine ........................ Potatoes, excluding sweet potatoes ......................................... All berries ............................................. Land in orchards, vineyards, and nut trees ...................................... All other crops (see text) ...................... Pastureland, all types ...........................
2.8 4.4
11.6 5.8 1.3
1.0 1.1
-
1.6
0.8
1.3
11.9 11.1
0.9 0.1 1.1
1.0 0.8 1.3
1.5
0.2
0.1 2.9 0.5
3.3 5.5
10.5 6.8 2.6
1.1 1.4
-
3.1
1.9
1.9
10.7 10.3
2.4 (D) 2.1
4.9 (Z) (Z)
3.9
0.1
(Z) 3.2 0.9
30.9 14.9 39.5 29.3
9.1
28.4 16.4
0.3
10.5
10.3
6.1
37.5 31.8 14.7
0.7 5.2
5.1 0.4 3.3
9.2
0.5
0.6
11.9 2.8
32.9 18.2 45.0 33.4 15.7
19.9 25.3
0.3
12.1
15.5
7.4
45.0 26.0 19.7
3.3 12.6
15.4 0.6 1.5
20.0
0.1
0.1
13.2 7.1
34.8 16.2 13.3 20.3 14.2
33.9 11.8
0.1
9.5
10.3
5.6
33.4 16.0 17.1
1.2 9.3
10.1 1.8 1.5
20.7
5.7
1.6 8.1 3.3
32.6 16.9 15.1 22.0 26.4
26.3 19.2
0.3
13.7
16.8
7.3
32.9 12.8 17.7
2.0 23.5
34.8 1.5 3.8
46.6
2.7
0.2
13.9 6.1
6.5 5.3 3.6 2.5 1.4
7.4 1.1
-
2.8
2.1
2.2
6.4 2.8 1.3 5.8 2.7
3.8 0.7
-
4.5
0.5
(Z) 1.0 0.4
3.6 4.1 1.5 2.7 1.6
3.3 1.3
-
4.1
2.8
1.4
3.9 1.1 4.2 5.4 4.4
7.4 0.1
-
6.7
0.4
(Z) 1.3 0.8
0.4 0.5
- 1.0 0.6
0.4
- 0.8
1.8
0.4
0.4
2.1 0.6 0.4 1.1 0.6
0.3 0.3 1.1
0.3
0.8
0.9 1.4 0.6
0.2 0.9
- 0.7 0.1
0.5
- 0.8
5.9
0.3
0.7
0.3 0.4 0.3 0.8 0.4
0.3 (D)(Z)
(Z)
1.7
1.1 1.8 0.5
Gravity irrigation distribution systems 1
Siphon tube Portal or ditch-gate
Unlined ditches Lined ditches Unlined ditches Lined ditches Poly-pipe or
lay flat tubing system Crop
Percent of
farms
Percent of
acres 2
Percent of
farms
Percent of
acres 2
Percent of
farms
Percent of
acres 2
Percent of
farms
Percent of
acres 2
Percent of
farms
Percent of
acres 2
Corn for grain or seed .......................... Corn for silage or greenchop ................ Sorghum for grain or seed .................... Wheat for grain or seed ........................ Barley for grain or seed ........................ Soybeans for beans ............................. Beans, dry edible ................................. Rice ...................................................... Other small grains (oats, rye, etc.) ................................... Alfalfa and alfalfa mixtures (dry hay, greenchop, and silage) ............................................... All other hay (dry hay, greenchop, and silage) ....................... Peanuts ................................................ All cotton .............................................. Sugarbeets for sugar ............................ Tobacco ............................................... Land in vegetables ............................... Selected vegetables: Sweet corn ....................................... Tomatoes in the open ....................... Lettuce and romaine ........................ Potatoes, excluding sweet potatoes ......................................... All berries ............................................. Land in orchards, vineyards, and nut trees ...................................... All other crops (see text) ...................... Pastureland, all types ...........................
2.4 13.3
1.7 7.0
10.4
0.3 10.7
2.8
9.5
8.0
7.0
- 4.5
20.3 -
2.0
0.5 3.0 0.1
0.3
0.1
0.9 3.6 7.7
1.2 11.0
1.7 5.2 6.2
0.3 8.6 3.2
9.4
6.6
7.7
- 7.0 9.8
- 2.9
1.9 19.3
(D)
0.2
0.2
1.6 3.4 7.4
1.8 4.5 2.5 4.0 5.1
0.2
12.1 0.5
4.7
4.1
1.5
- 2.5
14.8 -
1.5
2.8 0.3 0.5
0.5
0.1
0.8 2.6 1.8
0.5 2.5 1.9 2.6 3.3
0.1 5.2 0.2
6.3
2.6
1.7
- 3.1 7.4
- 1.6
3.7 2.4 2.1
0.2
0.4
0.9 2.4 1.1
1.0 5.4 3.0 5.2
12.9
1.3 3.2
39.7
17.9
17.1
28.0
- 1.6 7.5
- 2.6
3.6 1.1 0.8
1.7
0.2
2.3 3.8
23.2
0.6 4.7 2.5 3.2 7.7
2.3 3.4
37.8
8.4
11.8
40.3
- 1.1 4.5
- 1.7
1.1 4.0 0.5
1.3
0.2
1.7
24.2 43.8
0.4 1.7 1.3 2.1 1.8
0.6 1.0 9.9
1.0
5.3
3.4
- 4.1 5.0
- 0.9
0.3 0.1 1.9
(Z)
-
2.1 2.1 3.4
0.2 1.4 2.1 4.3 1.1
1.1 1.4
11.4
2.4
6.9
4.1
- 2.6 5.5
- 2.8
0.3 0.1
21.8
(D)
-
1.7 2.5 2.3
6.9 5.2 8.8 1.8 0.5
15.6 11.4 15.9
5.6
2.1
1.4
(Z)14.5
2.1 0.9 7.6
6.9 8.0
13.8
8.4
4.6
1.0 8.5 1.9
6.9 3.5 9.6 1.4 0.3
28.3
3.1 12.6
3.1
1.0
0.4
(D)17.6
1.7 1.3 1.2
0.9 1.3 (Z)
0.2
3.4
0.9 1.7 0.8
See footnote(s) at end of table. --continued

142 2008 FRIS – GENERAL DATA 2007 CENSUS OF AGRICULTURE USDA, National Agricultural Statistics Service
Table 30. Selected Crops Irrigated and Harvested by Primary Method of Water Distribution, United States: 2008 - Con.
[Excludes institutional, research, and experimental farms and farms with horticulture. For meaning of abbreviations and symbols, see introductory text]
Gravity irrigation distribution systems 1 - con.
Gated-pipe (not poly-pipe)
Improved gated-pipe (surge-flow or cablegation) Subirrigation Open discharge
(from a well or pump) Other gravity systems Crop
Percent of
farms
Percent of
acres 2
Percent of
farms
Percent of
acres 2
Percent of
farms
Percent of
acres 2
Percent of
farms
Percent of
acres 2
Percent of
farms
Percent of
acres 2
Corn for grain or seed ........................... Corn for silage or greenchop ................ Sorghum for grain or seed .................... Wheat for grain or seed ........................ Barley for grain or seed ........................ Soybeans for beans .............................. Beans, dry edible .................................. Rice ...................................................... Other small grains (oats, rye, etc.) .................................... Alfalfa and alfalfa mixtures (dry hay, greenchop, and silage) ............................................... All other hay (dry hay, greenchop, and silage) ....................... Peanuts ................................................ All cotton ............................................... Sugarbeets for sugar ............................ Tobacco ................................................ Land in vegetables ............................... Selected vegetables: Sweet corn ........................................ Tomatoes in the open ....................... Lettuce and romaine ......................... Potatoes, excluding sweet potatoes .......................................... All berries .............................................. Land in orchards, vineyards, and nut trees ....................................... All other crops (see text) ....................... Pastureland, all types ...........................
7.4 10.7 11.1
4.6 10.0
7.5
13.3 0.8
8.7
8.3
7.5
- 3.5 4.7 0.2 2.7
7.5 5.1 0.2
0.1
0.3
2.0 2.0 6.5
5.4 7.3 3.7 2.1 4.5
2.8 8.0 0.9
9.9
5.9
3.8
- 1.8 2.6 (D) 1.5
2.0 6.6 0.8
(D)
(Z)
1.8 1.1 2.9
0.5 0.4 1.2 0.8 2.3
0.3 0.1 0.8
0.5
1.1
0.7
- 0.4 0.3 1.0 0.1
0.1 - -
-
-
0.2 3.0 0.5
0.4 0.2 0.3 0.1 0.4
0.1 0.1 0.6
0.1
0.4
0.3
- 0.5 0.4 (D)(Z)
(Z)- -
-
-
0.7 0.1 0.3
0.2 0.1
- (Z)
-
(Z)-
0.1
-
0.5
0.1
2.1 -
0.1 -
0.4
1.4 (Z)
-
1.6
-
0.1 0.2 0.6
0.2 0.1
- 0.1
-
(D) -
(Z)
-
(Z)
0.4
(Z) -
(D) -
0.8
4.1 (D)
-
0.4
-
0.3 1.4 0.3
(Z) 3.1 0.9 1.8
-
0.8 0.1
27.8
0.7
1.4
1.6
- 0.1
- -
(Z)
0.1 - -
-
0.1
4.3 0.3 1.4
(Z) 7.5 0.2 0.7
-
1.3 (D)
27.0
1.4
2.0
2.9
- 0.1
- -
(Z)
(Z) - -
-
0.2
2.8 0.5 3.6
0.1 4.3
- 0.2 1.3
0.1 0.1 0.2
0.1
0.6
2.3
- -
1.4 -
0.3
0.2 0.1 0.2
0.3
0.2
3.9 0.5 0.8
0.1 4.8
-0.3 0.8
0.1 0.4 0.6
0.1
1.0
2.8
--
1.2 -
0.6
1.6 (Z)(Z)
0.7
0.1
2.0 0.8 1.1
1 Percentages are calculated across all methods by irrigated crop. 2 The sum of percent acres irrigated across systems for a crop may not add to 100 percent due to the use of unknown secondary irrigation systems by crop.
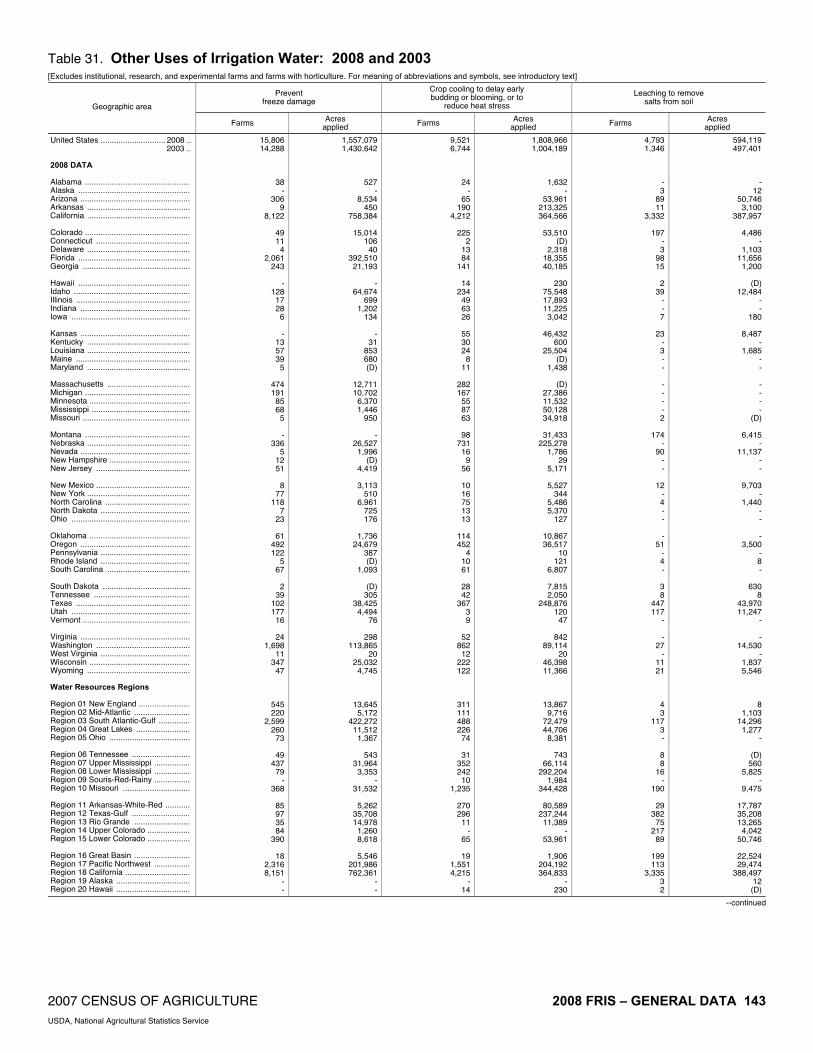
2007 CENSUS OF AGRICULTURE 2008 FRIS – GENERAL DATA 143 USDA, National Agricultural Statistics Service
Table 31. Other Uses of Irrigation Water: 2008 and 2003 [Excludes institutional, research, and experimental farms and farms with horticulture. For meaning of abbreviations and symbols, see introductory text]
Prevent freeze damage
Crop cooling to delay early budding or blooming, or to
reduce heat stress
Leaching to remove salts from soil
Geographic area
Farms Acres applied Farms Acres
applied Farms Acres applied
United States ............................. 2008 .. 2003 .. 2008 DATA Alabama ............................................... Alaska .................................................. Arizona ................................................. Arkansas .............................................. California .............................................. Colorado ............................................... Connecticut .......................................... Delaware .............................................. Florida .................................................. Georgia ................................................ Hawaii .................................................. Idaho .................................................... Illinois ................................................... Indiana ................................................. Iowa ..................................................... Kansas ................................................. Kentucky .............................................. Louisiana .............................................. Maine ................................................... Maryland .............................................. Massachusetts ..................................... Michigan ............................................... Minnesota ............................................. Mississippi ............................................ Missouri ................................................ Montana ............................................... Nebraska .............................................. Nevada ................................................. New Hampshire .................................... New Jersey .......................................... New Mexico .......................................... New York .............................................. North Carolina ...................................... North Dakota ........................................ Ohio ..................................................... Oklahoma ............................................. Oregon ................................................. Pennsylvania ........................................ Rhode Island ........................................ South Carolina ..................................... South Dakota ....................................... Tennessee ........................................... Texas ................................................... Utah ..................................................... Vermont ................................................ Virginia ................................................. Washington .......................................... West Virginia ........................................ Wisconsin ............................................. Wyoming .............................................. Water Resources Regions Region 01 New England ....................... Region 02 Mid-Atlantic ......................... Region 03 South Atlantic-Gulf .............. Region 04 Great Lakes ........................ Region 05 Ohio .................................... Region 06 Tennessee .......................... Region 07 Upper Mississippi ................ Region 08 Lower Mississippi ................ Region 09 Souris-Red-Rainy ................ Region 10 Missouri .............................. Region 11 Arkansas-White-Red ........... Region 12 Texas-Gulf .......................... Region 13 Rio Grande ......................... Region 14 Upper Colorado ................... Region 15 Lower Colorado ................... Region 16 Great Basin ......................... Region 17 Pacific Northwest ................ Region 18 California ............................. Region 19 Alaska ................................. Region 20 Hawaii .................................
15,806 14,288
38 -
306 9
8,122
49 11
4 2,061
243
- 128
17 28
6
- 13 57 39
5
474 191
85 68
5
- 336
5 12 51
8
77 118
7 23
61
492 122
5 67
2
39 102 177
16
24 1,698
11 347
47
545 220
2,599 260
73
49 437
79 -
368
85 97 35 84
390
18 2,316 8,151
- -
1,557,079 1,430,642
527 -
8,534 450
758,384
15,014 106
40 392,510 21,193
-
64,674 699
1,202 134
-
31 853 680 (D)
12,711 10,702
6,370 1,446
950
- 26,527
1,996 (D)
4,419
3,113 510
6,961 725 176
1,736
24,679 387 (D)
1,093
(D)305
38,425 4,494
76
298 113,865
20 25,032
4,745
13,645 5,172
422,272 11,512
1,367
543 31,964
3,353 -
31,532
5,262 35,708 14,978
1,260 8,618
5,546
201,986 762,361
- -
9,521 6,744
24 -
65 190
4,212
225 2
13 84
141
14 234
49 63 26
55 30 24
8 11
282 167
55 87 63
98
731 16
9 56
10 16 75 13 13
114 452
4 10 61
28 42
367 3 9
52
862 12
222 122
311 111 488 226
74
31 352 242
10 1,235
270 296
11 -
65
19 1,551 4,215
- 14
1,808,966 1,004,189
1,632 -
53,961 213,325 364,566
53,510
(D) 2,318
18,355 40,185
230
75,548 17,893 11,225
3,042
46,432 600
25,504 (D)
1,438
(D) 27,386 11,532 50,128 34,918
31,433
225,278 1,786
29 5,171
5,527
344 5,486 5,370
127
10,867 36,517
10 121
6,807
7,815 2,050
248,876 120
47
842 89,114
20 46,398 11,366
13,867 9,716
72,479 44,706
8,381
743 66,114
292,204 1,984
344,428
80,589 237,244 11,389
- 53,961
1,906
204,192 364,833
- 230
4,793 1,346
- 3
89 11
3,332
197 - 3
98 15
2
39 - - 7
23
- 3 - -
- - - - 2
174
- 90
- -
12 - 4 - -
- 51
- 4 -
3 8
447 117
-
- 27
- 11 21
4 3
117 3 -
8 8
16 -
190
29 382
75 217
89
199 113
3,335 3 2
594,119 497,401
- 12
50,746 3,100
387,957
4,486 -
1,103 11,656
1,200
(D)12,484
- -
180
8,487 -
1,685 - -
- - - -
(D)
6,415 -
11,137 - -
9,703 -
1,440 - -
- 3,500
- 8 -
630 8
43,970 11,247
-
- 14,530
- 1,837 5,546
8 1,103
14,296 1,277
-
(D)560
5,825 -
9,475
17,787 35,208 13,265
4,042 50,746
22,524 29,474
388,497 12 (D)
--continued
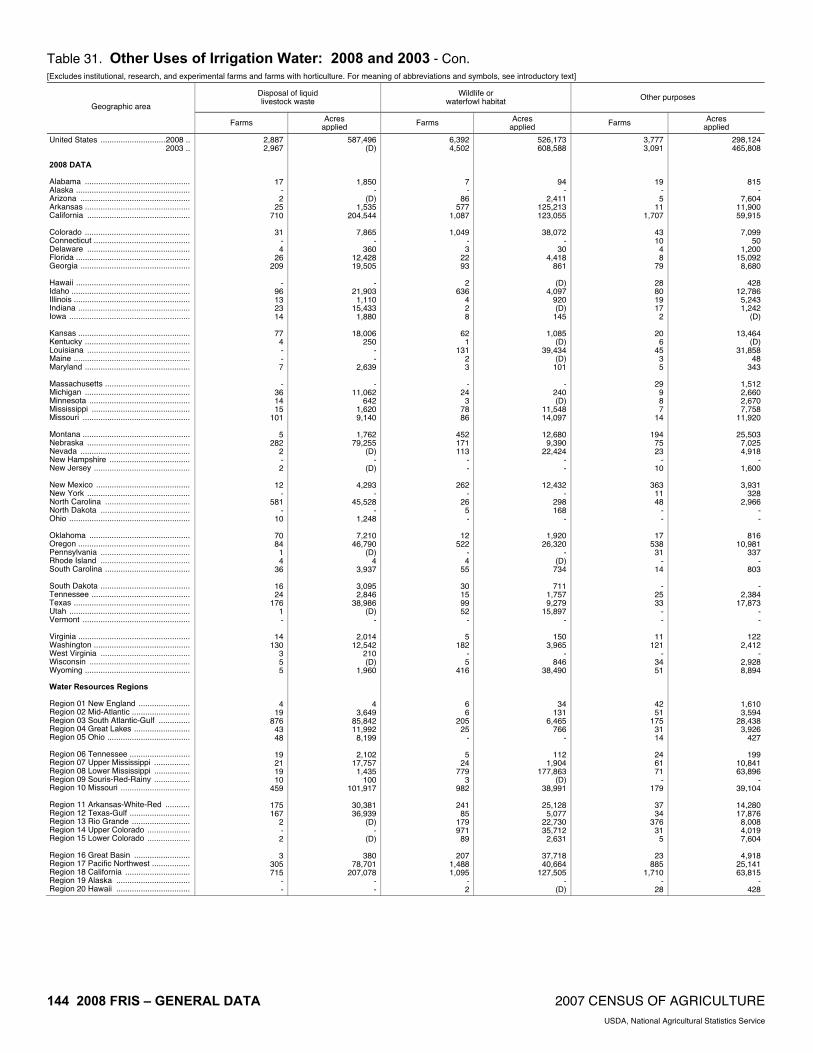
144 2008 FRIS – GENERAL DATA 2007 CENSUS OF AGRICULTURE USDA, National Agricultural Statistics Service
Table 31. Other Uses of Irrigation Water: 2008 and 2003 - Con. [Excludes institutional, research, and experimental farms and farms with horticulture. For meaning of abbreviations and symbols, see introductory text]
Disposal of liquid livestock waste
Wildlife or waterfowl habitat Other purposes
Geographic area
Farms Acresapplied Farms Acres
applied Farms Acresapplied
United States .............................2008 .. 2003 .. 2008 DATA Alabama ............................................... Alaska ................................................... Arizona ................................................. Arkansas ............................................... California .............................................. Colorado ............................................... Connecticut ........................................... Delaware .............................................. Florida ................................................... Georgia ................................................. Hawaii ................................................... Idaho ..................................................... Illinois .................................................... Indiana .................................................. Iowa ...................................................... Kansas .................................................. Kentucky ............................................... Louisiana .............................................. Maine .................................................... Maryland ............................................... Massachusetts ...................................... Michigan ............................................... Minnesota ............................................. Mississippi ............................................ Missouri ................................................ Montana ................................................ Nebraska .............................................. Nevada ................................................. New Hampshire .................................... New Jersey ........................................... New Mexico .......................................... New York .............................................. North Carolina ...................................... North Dakota ........................................ Ohio ...................................................... Oklahoma ............................................. Oregon .................................................. Pennsylvania ........................................ Rhode Island ........................................ South Carolina ...................................... South Dakota ........................................ Tennessee ............................................ Texas .................................................... Utah ...................................................... Vermont ................................................ Virginia .................................................. Washington ........................................... West Virginia ........................................ Wisconsin ............................................. Wyoming ............................................... Water Resources Regions Region 01 New England ....................... Region 02 Mid-Atlantic .......................... Region 03 South Atlantic-Gulf .............. Region 04 Great Lakes ......................... Region 05 Ohio ..................................... Region 06 Tennessee ........................... Region 07 Upper Mississippi ................ Region 08 Lower Mississippi ................ Region 09 Souris-Red-Rainy ................ Region 10 Missouri ............................... Region 11 Arkansas-White-Red ........... Region 12 Texas-Gulf ........................... Region 13 Rio Grande .......................... Region 14 Upper Colorado ................... Region 15 Lower Colorado ................... Region 16 Great Basin ......................... Region 17 Pacific Northwest ................. Region 18 California ............................. Region 19 Alaska ................................. Region 20 Hawaii .................................
2,887 2,967
17 - 2
25 710
31
- 4
26 209
-
96 13 23 14
77
4 - - 7
-
36 14 15
101
5 282
2 - 2
12
- 581
- 10
70 84
1 4
36
16 24
176 1 -
14 130
3 5 5
4 19
876 43 48
19 21 19 10
459
175 167
2 - 2
3
305 715
- -
587,496 (D)
1,850 -
(D)1,535
204,544
7,865 -
360 12,428 19,505
-
21,903 1,110
15,433 1,880
18,006
250 - -
2,639
- 11,062
642 1,620 9,140
1,762
79,255 (D)
- (D)
4,293
- 45,528
- 1,248
7,210
46,790 (D)
4 3,937
3,095 2,846
38,986 (D)
-
2,014 12,542
210 (D)
1,960
4 3,649
85,842 11,992
8,199
2,102 17,757
1,435 100
101,917
30,381 36,939
(D)-
(D)
380 78,701
207,078 - -
6,392 4,502
7 -
86 577
1,087
1,049 - 3
22 93
2
636 4 2 8
62
1 131
2 3
-
24 3
78 86
452 171 113
- -
262 -
26 5 -
12 522
- 4
55
30 15 99 52
-
5 182
- 5
416
6 6
205 25
-
5 24
779 3
982
241 85
179 971
89
207 1,488 1,095
- 2
526,173 608,588
94 -
2,411 125,213 123,055
38,072
- 30
4,418 861
(D)
4,097 920 (D)
145
1,085 (D)
39,434 (D)
101
- 240 (D)
11,548 14,097
12,680
9,390 22,424
- -
12,432 -
298 168
-
1,920 26,320
- (D)
734
711 1,757 9,279
15,897 -
150 3,965
- 846
38,490
34 131
6,465 766
-
112 1,904
177,863 (D)
38,991
25,128 5,077
22,730 35,712
2,631
37,718 40,664
127,505 -
(D)
3,777 3,091
19 - 5
11 1,707
43 10
4 8
79
28 80 19 17
2
20 6
45 3 5
29
9 8 7
14
194 75 23
- 10
363
11 48
- -
17 538
31 -
14
- 25 33
- -
11 121
- 34 51
42 51
175 31 14
24 61 71
- 179
37 34
376 31
5
23 885
1,710 -
28
298,124 465,808
815 -
7,604 11,900 59,915
7,099
50 1,200
15,092 8,680
428
12,786 5,243 1,242
(D)
13,464 (D)
31,858 48
343
1,512 2,660 2,670 7,758
11,920
25,503 7,025 4,918
- 1,600
3,931
328 2,966
- -
816 10,981
337 -
803
- 2,384
17,873 - -
122 2,412
- 2,928 8,894
1,610 3,594
28,438 3,926
427
199 10,841 63,896
- 39,104
14,280 17,876
8,008 4,019 7,604
4,918
25,141 63,815
- 428

2007 CENSUS OF AGRICULTURE 2008 FRIS – GENERAL DATA 145 USDA, National Agricultural Statistics Service
Table 32. Irrigated Farms by Size of Farm: 2008 and 2003 [Excludes institutional, research, and experimental farms and farms with horticulture. For meaning of abbreviations and symbols, see introductory text]
Total 1 to 49 acres 50 to 99 acres
Geographic area Farms
Land in farms
(acres)
Acres irrigated Farms
Land in farms
(acres)
Acres irrigated Farms
Land in farms
(acres)
Acres irrigated
United States ............................. 2008 .. 2003 .. 2008 DATA Alabama ............................................... Alaska .................................................. Arizona ................................................. Arkansas .............................................. California .............................................. Colorado ............................................... Connecticut .......................................... Delaware .............................................. Florida .................................................. Georgia ................................................ Hawaii .................................................. Idaho .................................................... Illinois ................................................... Indiana ................................................. Iowa ..................................................... Kansas ................................................. Kentucky .............................................. Louisiana .............................................. Maine ................................................... Maryland .............................................. Massachusetts ..................................... Michigan ............................................... Minnesota ............................................. Mississippi ............................................ Missouri ................................................ Montana ............................................... Nebraska .............................................. Nevada ................................................. New Hampshire .................................... New Jersey .......................................... New Mexico .......................................... New York .............................................. North Carolina ...................................... North Dakota ........................................ Ohio ..................................................... Oklahoma ............................................. Oregon ................................................. Pennsylvania ........................................ Rhode Island ........................................ South Carolina ..................................... South Dakota ....................................... Tennessee ........................................... Texas ................................................... Utah ..................................................... Vermont ................................................ Virginia ................................................. Washington .......................................... West Virginia ........................................ Wisconsin ............................................. Wyoming .............................................. Water Resources Regions Region 01 New England ....................... Region 02 Mid-Atlantic ......................... Region 03 South Atlantic-Gulf .............. Region 04 Great Lakes ........................ Region 05 Ohio .................................... Region 06 Tennessee .......................... Region 07 Upper Mississippi ................ Region 08 Lower Mississippi ................ Region 09 Souris-Red-Rainy ................ Region 10 Missouri .............................. Region 11 Arkansas-White-Red ........... Region 12 Texas-Gulf .......................... Region 13 Rio Grande ......................... Region 14 Upper Colorado ................... Region 15 Lower Colorado ................... Region 16 Great Basin ......................... Region 17 Pacific Northwest ................ Region 18 California ............................. Region 19 Alaska ................................. Region 20 Hawaii .................................
206,834 210,106
665 23
2,997 4,119
45,136
12,778 147 309
5,250 3,584
1,077
13,834 1,091 1,089
527
4,508 822
1,692 196 597
677
2,121 1,546 1,277 1,877
8,507
14,812 1,734
86 608
8,878
596 1,975
601 379
1,454
12,156 1,090
61 712
1,165
582 12,673 10,876
66
657 12,712
90 1,261 5,164
1,188 3,200
12,428 3,152 2,056
527
3,863 7,341
400 32,727
10,336 10,224
8,031 10,771
3,551
10,157 40,017 45,765
23 1,077
198,160,896 195,969,172
442,487 5,785
4,446,165 6,162,119
15,866,424
10,647,744 10,403
273,149 2,535,664 2,999,922
213,387
6,421,820 1,309,942 1,360,556
590,047
10,912,364 329,198
2,074,497 118,107 278,277
52,718
1,503,006 1,397,018 2,512,434 2,285,747
19,637,380 21,853,534 5,600,694
9,043 136,352
12,816,722
144,640 990,106
1,706,080 124,294
2,382,239 6,952,252
149,947 5,501
443,293
2,807,203 424,980
16,634,484 5,512,452
8,186
323,778 8,085,090
13,493 1,065,575
15,584,598
199,464 1,052,547 7,495,555 2,098,815 1,461,874
283,315
3,827,858 11,412,924
714,430 66,817,228
24,462,413 10,145,409 8,037,090 5,822,461 4,727,545
9,893,297
23,242,402 16,247,097
5,785 213,387
54,929,915 52,492,687
75,023 1,589
861,496 4,493,435 7,329,245
2,865,840
2,337 104,620
1,222,797 1,007,763
99,577
3,319,827 457,078 404,399 162,838
2,570,003
32,380 932,712 18,151 85,552
17,421
531,927 504,330
1,451,652 1,232,354
1,947,159 8,365,545
685,261 720
59,412
835,639 20,158
148,999 248,070 18,548
461,235
1,758,602 17,359
681 104,091
360,071 72,862
5,356,876 1,068,929
488
44,818 1,675,898
906 396,123
1,497,119
39,468 309,972
2,554,462 721,586 304,963
41,141
1,339,287 7,346,743
158,617 13,825,255
5,412,670 3,499,153 1,079,145 1,359,888
936,248
1,599,757 6,855,656 7,444,738
1,589 99,577
82,150 77,738
225 9
1,568 180
26,632
4,822 81 26
2,562 429
1,009 7,077
104 78 32
56
228 272
88 137
425 429 176
66 151
2,607
338 648
39 238
5,362
294 398
14 130
153
6,262 515
40 279
80
231 3,627 5,908
23
209 6,324
48 206
1,315
677 1,157 3,992
723 471
239 464 466
7 3,659
1,401 3,348 4,518 6,115 1,786
5,272
20,050 26,787
9 1,009
1,342,378 1,383,478
4,149 132
21,409 3,540
392,133
119,908 (D) (D)
38,150 6,730
9,194
108,945 2,145 1,755
343
336 5,189 2,465 1,851
(D)
6,910 10,003
3,815 2,310 2,735
65,169
7,446 16,505
555 4,595
63,215
7,792 12,595
140 2,986
3,120
90,199 10,726
(D) 7,087
2,208 4,965
56,358 88,523
(D)
4,965 99,220
955 4,466
39,274
11,195 23,195 72,534 17,062 10,715
5,522
10,037 6,227
35 94,885
16,964 53,010 50,576
151,619 27,049
78,512
309,767 394,148
132 9,194
920,648 962,067
1,113 (D)
11,977 2,760
327,022
67,072 263 375
23,198 2,938
4,463
89,649 975 195
80
168 1,396
748 260 (D)
2,633 3,801
782 198 379
53,598
6,659 11,509
109 1,505
47,814
1,891 3,062
119 645
535
50,075 2,694
(D) 1,320
1,407
926 34,038 59,707
(D)
920 69,236
174 1,161
28,052
3,400 6,761
32,046 5,099 1,954
(D)
2,682 3,499
14 73,744
9,662
31,248 37,802 89,284 14,729
57,109
216,581 329,037
(D) 4,463
21,771 20,206
96 5
123 258
4,720
1,707 33 30
781 319
32
1,416 14 58
5
117 116
80 35 95
111 289
43 12
168
1,162 113 228
20 100
653
64 424
11 108
168
1,693 271
10 50
35 73
900 1,297
10
88 3,016
13 138 463
217 485
1,644 442 337
87
155 417
- 1,966
632 900 522
1,355 191
1,058 6,604 4,722
5 32
1,515,731 1,421,185
6,988 (D)
7,224 18,484
321,402
124,753 2,125 2,021
51,243 21,800
2,498
94,112 1,218 4,631
460
10,370 8,328 6,382 2,725 5,919
7,150
20,171 2,876
900 12,957
76,383
5,763 16,821
1,345 (D)
45,828
4,293 30,196
985 7,929
12,414
126,293 19,986
944 4,169
2,630 4,891
68,931 89,730
814
6,664 201,669
909 9,623
32,346
14,949 34,567
113,044 30,925 24,413
(D)
10,842 30,909
- 139,640
45,670 68,931 36,526 93,377 11,304
77,218
453,324 321,562
(D)2,498
761,854 (D)
1,184 (D)
5,217 8,458
183,987
54,657 (D)(D)
39,498 5,275
(D)
60,977 868
1,934 175
5,490 1,565 3,017
(D)1,108
2,438 5,497
885 720
8,158
39,813 2,712
11,315 124
3,891
19,641 1,216 6,106
635 (D)
4,098
73,580 2,401
218 269
1,402
804 15,777 61,534
(D)
1,328 94,431
(D)2,272
23,758
3,287 9,858
51,610 8,234 2,810
(D)
3,476 15,940
- 79,816
16,896 15,777 19,943 41,680
8,617
59,076 238,237 184,147
(D)(D)
--continued

146 2008 FRIS – GENERAL DATA 2007 CENSUS OF AGRICULTURE USDA, National Agricultural Statistics Service
Table 32. Irrigated Farms by Size of Farm: 2008 and 2003 - Con. [Excludes institutional, research, and experimental farms and farms with horticulture. For meaning of abbreviations and symbols, see introductory text]
100 to 219 acres 220 to 499 acres 500 to 999 acres
Geographic area Farms
Land in farms
(acres)
Acres irrigated Farms
Land in farms
(acres)
Acres irrigated Farms
Land in farms
(acres)
Acres irrigated
United States .............................2008 .. 2003 .. 2008 DATA Alabama ............................................... Alaska ................................................... Arizona ................................................. Arkansas ............................................... California .............................................. Colorado ............................................... Connecticut ........................................... Delaware .............................................. Florida ................................................... Georgia ................................................. Hawaii ................................................... Idaho ..................................................... Illinois .................................................... Indiana .................................................. Iowa ...................................................... Kansas .................................................. Kentucky ............................................... Louisiana .............................................. Maine .................................................... Maryland ............................................... Massachusetts ...................................... Michigan ............................................... Minnesota ............................................. Mississippi ............................................ Missouri ................................................ Montana ................................................ Nebraska .............................................. Nevada ................................................. New Hampshire .................................... New Jersey ........................................... New Mexico .......................................... New York .............................................. North Carolina ...................................... North Dakota ........................................ Ohio ...................................................... Oklahoma ............................................. Oregon .................................................. Pennsylvania ........................................ Rhode Island ........................................ South Carolina ...................................... South Dakota ........................................ Tennessee ............................................ Texas .................................................... Utah ...................................................... Vermont ................................................ Virginia .................................................. Washington ........................................... West Virginia ........................................ Wisconsin ............................................. Wyoming ............................................... Water Resources Regions Region 01 New England ....................... Region 02 Mid-Atlantic .......................... Region 03 South Atlantic-Gulf .............. Region 04 Great Lakes ......................... Region 05 Ohio ..................................... Region 06 Tennessee ........................... Region 07 Upper Mississippi ................ Region 08 Lower Mississippi ................ Region 09 Souris-Red-Rainy ................ Region 10 Missouri ............................... Region 11 Arkansas-White-Red ........... Region 12 Texas-Gulf ........................... Region 13 Rio Grande .......................... Region 14 Upper Colorado ................... Region 15 Lower Colorado ................... Region 16 Great Basin ......................... Region 17 Pacific Northwest ................. Region 18 California ............................. Region 19 Alaska ................................. Region 20 Hawaii .................................
19,674 22,425
94 3
389 213
4,769
858 25 29
853 536
9
1,370 61 96 45
253 139 120
3 111
87
311 119
99 168
648 703 179
15 112
850 114 415
36 49
104
1,185 155
9 105
76 53
868 1,195
28
77 1,320
11 103 504
146 538
2,027 404 278
41
287 335
24 2,273
644 551 981 614 570
1,049 3,869 5,031
3 9
2,928,650 3,329,484
13,572 (D)
58,534 36,256
678,708
130,786 3,387 4,207
128,407 82,277
(D)
204,175 8,496
14,071 7,501
33,873 21,073 18,938
420 14,891
12,401 46,463 18,790 11,886 24,448
105,601 112,804 29,345
2,109 16,167
127,640 16,203 66,371
5,248 7,178
17,024
185,535 20,187
1,070 15,204
12,759
8,379 102,329 177,665
3,974
11,319 214,944
(D) 15,386 77,757
20,391 75,259
308,783 59,378 40,857
6,571
44,249 47,842
3,578 356,670
98,590 71,879
127,361 101,841 81,898
163,053 596,007 722,724
(D) (D)
1,695,105 1,950,841
2,234 (D)
28,256 20,130
473,535
97,214 643
2,502 50,656 21,351
761
174,568 3,602 4,311 3,814
19,417
1,848 11,201
45 4,830
4,604
13,889 11,835
4,415 9,874
58,880 67,504 22,112
245 7,519
65,014
4,648 11,723
2,820 1,082
10,254 87,325
2,669 137
3,088
7,025 1,065
58,898 124,039
166
3,141 131,815
(D)4,090
54,030
5,784 23,353 90,468 18,446
4,909
(D)19,873 26,108
2,430 228,724
48,205 28,763
103,840 60,177 35,208
119,367 402,467 475,631
(D)761
22,670 26,836
64 3
191 562
3,273
1,980 7
64 361 650
6
1,421 148 157
67
404 159 207
43 87
41
301 399 120 213
1,068 3,362
134 8
77
359 85
375 34 15
164
1,072 90
1 70
141
72 1,566 1,122
2
115 812
9 250 739
100 467
1,542 453 273
59
727 846
76 5,965
1,025 1,454
447 1,236
172
960 3,498 3,361
3 6
7,487,102 9,111,292
19,934 880
68,122 197,346
1,037,385
651,185 2,229
22,493 123,103 205,637
1,753
434,737 52,531 54,048 23,440
149,554 51,025 71,184 12,419 31,596
12,681
108,052 140,655 40,535 69,187
356,992
1,152,337 45,887
2,914 24,950
111,990 24,350
122,305 11,178
4,424
58,370 351,465 27,810
(D) 22,756
48,350 23,255
512,853 363,864
(D)
36,035 275,904
2,550 87,875
236,022
30,718 150,515 501,187 157,178 91,942
18,880
254,207 296,522 29,074
2,006,492
346,756 477,426 156,017 418,893 61,272
315,240
1,103,010 1,069,140
880 1,753
4,178,236 4,835,531
4,626 185
37,341 106,893 778,295
407,699
785 10,295 68,065 79,367
1,041
338,158 20,842 21,941 10,881
65,287
3,508 35,453
1,541 11,843
2,936
31,793 62,852 26,095 33,474
171,306 692,083 30,733
(D)13,449
68,557
5,336 32,969
6,978 1,133
18,613
239,831 3,312
(D)7,105
21,608
2,094 183,017 180,767
(D)
3,676 195,658
132 28,801
109,596
5,508 44,795
191,914 47,144 15,140
3,111
109,043 163,959
8,990 1,165,149
158,318 167,794 105,160 195,312 35,746
160,916 793,118 805,893
185 1,041
19,338 21,694
44 2
287 897
2,105
758 -
64 254 697
7
1,140 254 202 139
751 105 307
12 87
7
345 310 169 357
562
3,988 183
4 49
283
16 133
81 43
145 863
36 -
63
249 45
1,249 714
1
82 415
6 228 600
23 270
1,250 509 238
31
785 1,446
73 5,888
1,502
850 343 298 291
958
2,412 2,162
2 7
13,778,706 15,684,216
32,586 (D)
206,621 657,621
1,489,146
525,665 -
43,763 171,512 494,402
(D)
827,606 184,557 145,462 101,858
544,973 72,419
222,173 (D)
61,835
4,791 250,488 221,762 128,450 265,187
374,404
2,876,806 126,887
2,120 33,809
200,042
9,549 84,674 63,024 27,244
106,057 578,610 24,943
- 42,038
174,040 30,544
942,043 500,339
(D)
55,041 293,964
4,706 156,031 403,803
15,203 189,525 860,627 364,942 169,085
22,848
559,863 1,058,356
57,365 4,196,889
1,119,676
625,355 235,892 206,364 209,721
669,161
1,681,524 1,530,091
(D) (D)
7,584,484 7,997,496
5,546 (D)
101,661 477,410
1,193,489
321,880 -
17,959 96,085
160,003
1,350 588,888 72,144 58,448 32,381
238,674
5,813 121,281
919 22,793
1,625
84,879 83,994 76,901
133,254
221,330 1,673,762
75,249 (D)
15,183
78,357 1,976
17,361 29,920
4,346
24,964 280,746
2,251 -
14,245
52,359 4,714
468,240 198,006
(D)
6,398 251,761
(D)65,256
199,719
2,640 64,196
295,770 130,007 37,820
(D)
215,647 703,043 19,476
2,325,255
509,009 327,254 115,861 128,236 104,761
312,051
1,068,478 1,218,777
(D)1,350
--continued

2007 CENSUS OF AGRICULTURE 2008 FRIS – GENERAL DATA 147 USDA, National Agricultural Statistics Service
Table 32. Irrigated Farms by Size of Farm: 2008 and 2003 - Con. [Excludes institutional, research, and experimental farms and farms with horticulture. For meaning of abbreviations and symbols, see introductory text]
1,000 to 1,999 acres 2,000 to 4,999 acres 5,000 acres or more
Geographic area Farms
Land in farms
(acres)
Acres irrigated Farms
Land in farms
(acres)
Acres irrigated Farms
Land in farms
(acres)
Acres irrigated
United States ............................. 2008 .. 2003 .. 2008 DATA Alabama ............................................... Alaska .................................................. Arizona ................................................. Arkansas .............................................. California .............................................. Colorado ............................................... Connecticut .......................................... Delaware .............................................. Florida .................................................. Georgia ................................................ Hawaii .................................................. Idaho .................................................... Illinois ................................................... Indiana ................................................. Iowa ..................................................... Kansas ................................................. Kentucky .............................................. Louisiana .............................................. Maine ................................................... Maryland .............................................. Massachusetts ..................................... Michigan ............................................... Minnesota ............................................. Mississippi ............................................ Missouri ................................................ Montana ............................................... Nebraska .............................................. Nevada ................................................. New Hampshire .................................... New Jersey .......................................... New Mexico .......................................... New York .............................................. North Carolina ...................................... North Dakota ........................................ Ohio ..................................................... Oklahoma ............................................. Oregon ................................................. Pennsylvania ........................................ Rhode Island ........................................ South Carolina ..................................... South Dakota ....................................... Tennessee ........................................... Texas ................................................... Utah ..................................................... Vermont ................................................ Virginia ................................................. Washington .......................................... West Virginia ........................................ Wisconsin ............................................. Wyoming .............................................. Water Resources Regions Region 01 New England ....................... Region 02 Mid-Atlantic ......................... Region 03 South Atlantic-Gulf .............. Region 04 Great Lakes ........................ Region 05 Ohio .................................... Region 06 Tennessee .......................... Region 07 Upper Mississippi ................ Region 08 Lower Mississippi ................ Region 09 Souris-Red-Rainy ................ Region 10 Missouri .............................. Region 11 Arkansas-White-Red ........... Region 12 Texas-Gulf .......................... Region 13 Rio Grande ......................... Region 14 Upper Colorado ................... Region 15 Lower Colorado ................... Region 16 Great Basin ......................... Region 17 Pacific Northwest ................ Region 18 California ............................. Region 19 Alaska ................................. Region 20 Hawaii .................................
19,378 20,402
70 -
145 1,019 2,096
1,168
1 54
213 588
1
693 332 261 158
1,027
41 354
2 39
6
258 340 343 466
614
3,784 110
- 27
425
6 124 120
23
315 453
12 -
82
206 45
1,956 277
2
45 404
3 201 469
11 164
1,147 371 211
27
977 1,874
96 5,754
2,109 1,542
400 363 230
301
1,683 2,117
- 1
26,932,682 28,567,950
103,838 -
215,654 1,470,648 2,778,312
1,677,301
(D) 71,628
311,997 841,754
(D)
935,101 466,534 361,449 222,504
1,468,208
54,572 502,478
(D) 56,112
8,785
358,189 448,713 483,687 674,265
782,674
5,239,769 163,253
- 35,464
576,897
8,912 173,596 177,181 33,688
424,490 644,167 15,658
- 115,391
297,907 71,937
2,723,759 369,374
(D)
59,588 558,830
(D) 280,637 656,531
15,635 218,596
1,634,931 522,270 287,587
(D)
1,341,898 2,708,518
136,531 8,039,580
2,951,257 2,108,292
555,898 484,809 340,341
430,244
2,304,324 2,809,435
- (D)
12,437,643 12,317,012
21,357 -
145,605 1,225,136 1,268,017
512,693 (D)
33,187 125,168 285,050
(D)572,966 162,525 111,087 52,433
448,072 5,982
246,495 (D)
16,524
3,185 130,372 137,118 247,963 344,478
269,463 2,970,388
69,599 -
10,565
126,740 88
24,942 42,837
3,388
104,951 235,630
1,682 -
26,905
77,794 11,615
1,579,594 158,058
(D)
10,423 299,253
(D)84,062
232,229
4,359 70,374
484,291 180,368 66,318
(D)405,020
1,866,168 34,552
3,826,281
1,055,778 1,219,788
271,956 172,412 153,917
198,832 1,131,084 1,287,043
-(D)
14,670 14,439
58 1
153 813 731
1,052
- 40
156 305
8
503 158 218
78
1,413 30
294 7
40
- 153 138 364 302
697
1,840 125
- 5
644
12 92
220 6
323 367
11 1
51
248 46
1,863 182
-
32 279
- 109 502
8 112 660 205 223
29
399 1,609
102 4,372
2,216 1,207
578 568 165
278
1,172 758
1 8
43,446,247 (D)
175,749 (D)
447,620 2,408,982 2,171,466
3,273,253
- 115,538 496,028 860,804
23,587
1,431,501 448,547 614,119 213,215
4,373,002
79,107 827,577
(D)98,410
-
446,736 400,353
1,115,246 882,478
2,129,168 5,235,394
369,079 -
(D)
1,732,957 29,292
307,178 696,869 15,845
994,884
1,203,703 30,637
(D)141,298
721,510 135,187
5,306,741 575,620
-
94,780 888,337
- 310,518
1,582,654
24,801 310,489
1,962,532 593,749 627,703
(D)
1,123,110 4,760,086
315,017 13,048,299
6,706,179 3,447,108 1,587,789 1,698,934
487,372
821,544 3,574,141 2,238,888
(D)23,587
15,360,655 13,454,565
27,145 (D)
324,667 1,853,313 1,464,346
761,770
- 33,335
221,271 336,663
9,726
746,555 147,930 167,765 55,073
1,071,049
9,813 369,323
(D) 27,547
-
156,848 138,568 659,672 494,456
396,701
2,114,280 134,468
- 7,300
145,363
2,123 28,946 99,421
(D)
173,207 287,828
2,350 (D)
29,344
110,682 24,687
1,864,862 159,573
-
14,137 296,467
- 99,723
286,139
2,619 80,014
642,965 202,226 134,528
(D)
384,281 3,073,575
52,636 3,484,553
2,082,778 1,173,555
250,637 327,197 355,911
287,486
1,322,913 1,482,753
(D) 9,726
7,183 6,366
14 -
141 177 810
433
- 2
70 60
5
214 20 19
3
487 4
58 6 1
-
35 21
104 52
1,149
684 127
- -
302 5
14 85
5
82 261
- -
12
130 17
644 181
-
9 142
- 26
572
6 7
166 45 25
14 69
348 22
2,850
807 372 242 222 146
281 729 827
- 5
100,729,400 (D)
85,671 -
3,420,981 1,369,242 6,997,872
4,144,893
- (D)
1,215,224 486,518
169,442
2,385,643 145,914 165,021 20,726
4,332,048
37,485 423,300 66,572
(D)
- 262,904 160,054 729,420 354,490
15,746,989 7,223,215 4,832,917
- -
9,958,153 44,249
193,191 751,455 25,000
765,880
3,772,280 - -
95,350
1,547,799 145,822
6,921,470 3,347,337
-
55,386 5,552,222
- 201,039
12,556,211
66,572 50,401
2,041,917 353,311 209,572
89,755
483,652 2,504,464
172,830 38,934,773
13,177,321 3,293,408 5,287,031 2,666,624 3,508,588
7,338,325
13,220,305 7,161,109
- 169,442
11,991,290 (D)
11,818 -
206,772 799,335
1,640,554
642,855 -
(D)598,856 117,116
80,796
748,066 48,192 38,718
8,001
721,846 2,455
145,194 11,871
(D)
- 104,848 68,296
435,688 208,281
736,068 838,157 330,276
- -
284,153 2,880
23,890 65,340
(D)
124,613 503,587
- -
21,815
87,794 26,957
1,152,450 127,245
-
4,795 337,277
- 110,758 563,596
11,871 10,621
765,398 130,062 41,484
12,042
199,265 1,494,451
40,519 2,641,733
1,532,024
534,974 173,946 345,590 227,359
404,920
1,682,778 1,661,457
- 80,796

148 2008 FRIS – GENERAL DATA 2007 CENSUS OF AGRICULTURE USDA, National Agricultural Statistics Service
Table 33. Irrigated Farms by North American Industrial Classification System: 2008 and 2003 [Excludes institutional, research, and experimental farms and farms with horticulture. For meaning of abbreviations and symbols, see introductory text]
Other crop farming (1119)
Total Oilseed and grain farming (1111) Total Tobacco farming
(11191) Cotton farming
(11192)
Sugarcane farming, hay farming, and
all other crop farming (11193, 11194, 11199)
Geographic area
Farms Acres irrigated Farms Acres
irrigated Farms Acres irrigated Farms Acres
irrigated Farms Acres irrigated Farms Acres
irrigated
United States .............................2008 .. 2003 .. 2008 DATA Alabama ............................................... Alaska ................................................... Arizona ................................................. Arkansas ............................................... California .............................................. Colorado ............................................... Connecticut ........................................... Delaware .............................................. Florida ................................................... Georgia ................................................. Hawaii ................................................... Idaho ..................................................... Illinois .................................................... Indiana .................................................. Iowa ...................................................... Kansas .................................................. Kentucky ............................................... Louisiana .............................................. Maine .................................................... Maryland ............................................... Massachusetts ...................................... Michigan ............................................... Minnesota ............................................. Mississippi ............................................ Missouri ................................................ Montana ................................................ Nebraska .............................................. Nevada ................................................. New Hampshire .................................... New Jersey ........................................... New Mexico .......................................... New York .............................................. North Carolina ...................................... North Dakota ........................................ Ohio ...................................................... Oklahoma ............................................. Oregon .................................................. Pennsylvania ........................................ Rhode Island ........................................ South Carolina ...................................... South Dakota ........................................ Tennessee ............................................ Texas .................................................... Utah ...................................................... Vermont ................................................ Virginia .................................................. Washington ........................................... West Virginia ........................................ Wisconsin ............................................. Wyoming ............................................... Water Resources Regions Region 01 New England ....................... Region 02 Mid-Atlantic .......................... Region 03 South Atlantic-Gulf .............. Region 04 Great Lakes ......................... Region 05 Ohio ..................................... Region 06 Tennessee ........................... Region 07 Upper Mississippi ................ Region 08 Lower Mississippi ................ Region 09 Souris-Red-Rainy ................ Region 10 Missouri ............................... Region 11 Arkansas-White-Red ........... Region 12 Texas-Gulf ........................... Region 13 Rio Grande .......................... Region 14 Upper Colorado ................... Region 15 Lower Colorado ................... Region 16 Great Basin ......................... Region 17 Pacific Northwest ................. Region 18 California ............................. Region 19 Alaska ................................. Region 20 Hawaii .................................
206,834 210,106
665 23
2,997 4,119
45,136
12,778 147 309
5,250 3,584
1,077
13,834 1,091 1,089
527
4,508 822
1,692 196 597
677
2,121 1,546 1,277 1,877
8,507
14,812 1,734
86 608
8,878
596 1,975
601 379
1,454
12,156 1,090
61 712
1,165
582 12,673 10,876
66
657 12,712
90 1,261 5,164
1,188 3,200
12,428 3,152 2,056
527
3,863 7,341
400 32,727
10,336 10,224
8,031 10,771
3,551
10,157 40,017 45,765
23 1,077
54,929,915 52,492,687
75,023 1,589
861,496 4,493,435 7,329,245
2,865,840
2,337 104,620
1,222,797 1,007,763
99,577
3,319,827 457,078 404,399 162,838
2,570,003
32,380 932,712 18,151 85,552
17,421
531,927 504,330
1,451,652 1,232,354
1,947,159 8,365,545
685,261 720
59,412
835,639 20,158
148,999 248,070 18,548
461,235
1,758,602 17,359
681 104,091
360,071 72,862
5,356,876 1,068,929
488
44,818 1,675,898
906 396,123
1,497,119
39,468 309,972
2,554,462 721,586 304,963
41,141
1,339,287 7,346,743
158,617 13,825,255
5,412,670 3,499,153 1,079,145 1,359,888
936,248
1,599,757 6,855,656 7,444,738
1,589 99,577
36,333 34,567
56 -
55 3,127 1,877
1,511
- 135
19 439
3
1,041 918 723 409
3,514
101 1,197
- 140
-
649 787 802
1,161
790 11,014
2 -
34
141 37 51
350 49
394 164
32 -
86
553 70
2,516 363
-
85 330
1 252 355
- 404 656 907 620
29
2,164 5,353
252 15,769
4,561 1,444
160 77 55
457
1,542 1,880
- 3
23,131,333 18,783,189
19,081 -
56,478 3,786,193
580,440
827,955 -
54,494 11,270
123,823
440 391,663 416,816 335,099 149,883
2,122,952
20,491 808,660
- 49,152
-
281,057 327,690
1,100,602 956,053
315,881
6,985,034 (D)
- 7,854
133,728
754 11,484
140,910 8,540
224,749 74,599
499 -
36,801
218,492 35,198
2,083,714 56,344
-
17,883 170,433
(D) 109,371 73,073
- 126,612 195,861 372,704 263,583
14,522
886,272 5,925,942
107,515 9,087,787
3,835,749
892,771 44,024 29,920 56,478
81,995
626,768 582,390
- 440
40,982 37,179
131 6
706 479
2,077
4,717 42 12
265 1,243
99
4,998 1
16 4
241 294 124
- 62
7
193 40
248 220
2,812
943 746
11 36
3,234
70 362
86 40
252
3,120 74
- 112
210 116
3,846 4,756
4
129 1,890
6 45
1,857
64 291
2,196 245 314
92 60
1,038 15
6,586
2,083 3,001 3,067 4,365
854
4,123 10,145
2,338 6
99
12,458,071 12,909,092
38,120 1,247
566,688 640,684
1,666,534
648,139 1,004
746 377,221 551,085
76,942
1,218,312 (D)
2,327 (D)
201,741
8,371 93,258
- 4,069
385
25,775 7,345
338,322 225,002
413,299 220,646 270,133
106 1,001
313,812
(D)42,580 49,769
1,952
100,212 640,392
1,009 -
22,005
34,369 22,372
2,428,281 319,313
8
4,980 518,752
46 7,198
350,390
1,503 9,181
1,030,952 28,815 10,674
12,961 13,266
1,290,349 7,365
1,272,031
805,073 2,013,128
408,766 259,771 609,984
591,846
2,303,063 1,711,154
1,247 76,942
536 1,195
- - - - -
- 27
- - -
- - - - -
- 230
- - -
7 - - - -
- - - - -
- -
176 - -
- -
26 - 2
-
45 - - -
23 - - - -
34 26
201 -
204
38 -
33 - -
- - - - -
- - - - -
18,977 39,605
- - - - -
- 957
- - -
- - - - -
- 6,524
- - -
385 - - - -
- - - - -
- -
(D) - -
- -
116 -
(D)
- (D)
- - -
1,635 - - - -
1,342 116
9,831 -
5,995
923 -
770 - -
- - - - -
- - - - -
4,084 5,767
34 -
156 413 213
- - - 1
284
- - - - -
- -
82 - -
- - -
217 202
- - - - -
85 -
14 - -
82 - - - 3
-
33 2,262
- -
3 - - - -
- -
330 - -
23 -
920 - -
339 1,970
131 -
162
- -
209 - -
3,935,982 4,583,003
13,133 -
165,862 631,384 351,854
- - -
(D)172,642
- - - - -
- -
80,675 - -
- - -
325,295 222,333
- - - - -
23,683 -
(D)- -
50,623 - - -
(D)
- 20,488
1,870,770 - -
360 - - - -
- -
186,412 - -
10,729 -
1,265,675 - -
274,963 1,593,419
85,368 -
176,362
- -
343,054 - -
36,362 30,217
97 6
550 66
1,864
4,717 15 12
264 959
99
4,998 1
16 4
241
64 42
- 62
-
193 40 31 18
2,812
943 746
11 36
3,149
70 172
86 40
170
3,120 48
- 107
210
38 1,584 4,756
4
103 1,890
6 45
1,857
30 265
1,665 245 110
31 60 85 15
6,586
1,744 1,031 2,936 4,365
692
4,123 10,145
2,129 6
99
8,503,112 8,286,484
24,987 1,247
400,826 9,300
1,314,680
648,139 47
746 (D)
378,443
76,942 1,218,312
(D)2,327
(D)
201,741 1,847
12,583 -
4,069
- 25,775
7,345 13,027
2,669
413,299 220,646 270,133
106 1,001
290,129
(D)30,310 49,769
1,952
49,589 640,392
893 -
21,699
34,369 (D)
557,511 319,313
8
2,985 518,752
46 7,198
350,390
161 9,065
834,709 28,815
4,679
1,309 13,266 23,904
7,365 1,272,031
530,110 419,709 323,398 259,771 433,622
591,846
2,303,063 1,368,100
1,247 76,942
--continued
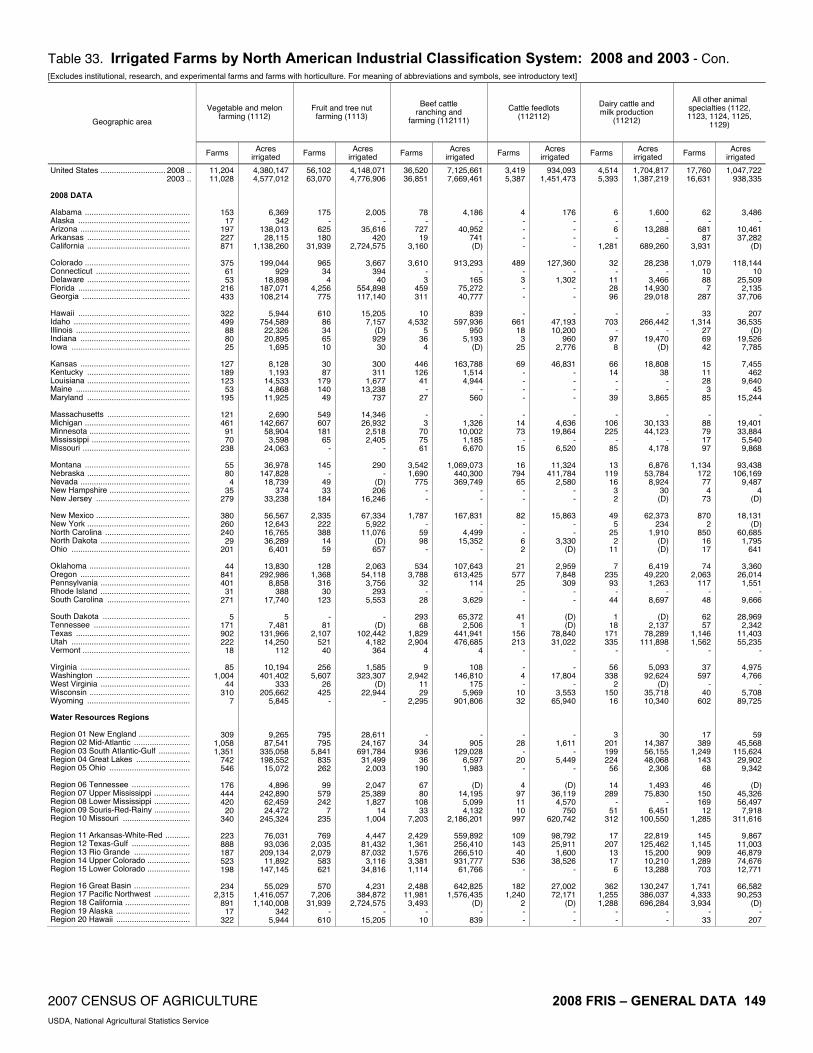
2007 CENSUS OF AGRICULTURE 2008 FRIS – GENERAL DATA 149 USDA, National Agricultural Statistics Service
Table 33. Irrigated Farms by North American Industrial Classification System: 2008 and 2003 - Con. [Excludes institutional, research, and experimental farms and farms with horticulture. For meaning of abbreviations and symbols, see introductory text]
Vegetable and melon farming (1112)
Fruit and tree nut farming (1113)
Beef cattle ranching and
farming (112111)
Cattle feedlots (112112)
Dairy cattle and milk production
(11212)
All other animal specialties (1122, 1123, 1124, 1125,
1129) Geographic area
Farms Acres irrigated Farms Acres
irrigated Farms Acres irrigated Farms Acres
irrigated Farms Acres irrigated Farms Acres
irrigated
United States ............................. 2008 .. 2003 .. 2008 DATA Alabama ............................................... Alaska .................................................. Arizona ................................................. Arkansas .............................................. California .............................................. Colorado ............................................... Connecticut .......................................... Delaware .............................................. Florida .................................................. Georgia ................................................ Hawaii .................................................. Idaho .................................................... Illinois ................................................... Indiana ................................................. Iowa ..................................................... Kansas ................................................. Kentucky .............................................. Louisiana .............................................. Maine ................................................... Maryland .............................................. Massachusetts ..................................... Michigan ............................................... Minnesota ............................................. Mississippi ............................................ Missouri ................................................ Montana ............................................... Nebraska .............................................. Nevada ................................................. New Hampshire .................................... New Jersey .......................................... New Mexico .......................................... New York .............................................. North Carolina ...................................... North Dakota ........................................ Ohio ..................................................... Oklahoma ............................................. Oregon ................................................. Pennsylvania ........................................ Rhode Island ........................................ South Carolina ..................................... South Dakota ....................................... Tennessee ........................................... Texas ................................................... Utah ..................................................... Vermont ................................................ Virginia ................................................. Washington .......................................... West Virginia ........................................ Wisconsin ............................................. Wyoming .............................................. Water Resources Regions Region 01 New England ....................... Region 02 Mid-Atlantic ......................... Region 03 South Atlantic-Gulf .............. Region 04 Great Lakes ........................ Region 05 Ohio .................................... Region 06 Tennessee .......................... Region 07 Upper Mississippi ................ Region 08 Lower Mississippi ................ Region 09 Souris-Red-Rainy ................ Region 10 Missouri .............................. Region 11 Arkansas-White-Red ........... Region 12 Texas-Gulf .......................... Region 13 Rio Grande ......................... Region 14 Upper Colorado ................... Region 15 Lower Colorado ................... Region 16 Great Basin ......................... Region 17 Pacific Northwest ................ Region 18 California ............................. Region 19 Alaska ................................. Region 20 Hawaii .................................
11,204 11,028
153 17
197 227 871
375
61 53
216 433
322 499
88 80 25
127 189 123
53 195
121 461
91 70
238
55 80
4 35
279
380 260 240
29 201
44
841 401
31 271
5
171 902 222
18
85 1,004
44 310
7
309 1,058 1,351
742 546
176 444 420
20 340
223 888 187 523 198
234
2,315 891
17 322
4,380,147 4,577,012
6,369 342
138,013 28,115
1,138,260
199,044 929
18,898 187,071 108,214
5,944
754,589 22,326 20,895
1,695
8,128 1,193
14,533 4,868
11,925
2,690 142,667 58,904
3,598 24,063
36,978
147,828 18,739
374 33,238
56,567 12,643 16,765 36,289
6,401
13,830 292,986
8,858 388
17,740
5 7,481
131,966 14,250
112
10,194 401,402
333 205,662
5,845
9,265 87,541
335,058 198,552 15,072
4,896
242,890 62,459 24,472
245,324
76,031 93,036
209,134 11,892
147,145
55,029 1,416,057 1,140,008
342 5,944
56,102 63,070
175 -
625 180
31,939
965 34
4 4,256
775
610 86 34 65 10
30 87
179 140
49
549 607 181
65 -
145 -
49 33
184
2,335 222 388
14 59
128
1,368 316
30 123
-
81 2,107
521 40
256
5,607 26
425 -
795 795
5,841 835 262
99
579 242
7 235
769
2,035 2,079
583 621
570
7,206 31,939
- 610
4,148,071 4,776,906
2,005 -
35,616 420
2,724,575
3,667 394
40 554,898 117,140
15,205
7,157 (D)
929 30
300 311
1,677 13,238
737
14,346 26,932
2,518 2,405
-
290 -
(D) 206
16,246
67,334 5,922
11,076 (D)
657
2,063 54,118
3,756 293
5,553
- (D)
102,442 4,182
364
1,585 323,307
(D) 22,944
-
28,611 24,167
691,784 31,499
2,003
2,047 25,389
1,827 14
1,004
4,447 81,432 87,032
3,116 34,816
4,231
384,872 2,724,575
- 15,205
36,520 36,851
78 -
727 19
3,160
3,610 - 3
459 311
10
4,532 5
36 4
446 126
41 -
27
- 3
70 75 61
3,542 1,690
775 - -
1,787 -
59 98
-
534 3,788
32 -
28
293 68
1,829 2,904
4
9 2,942
11 29
2,295
- 34
936 36
190
67 80
108 33
7,203
2,429 1,361 1,576 3,381 1,114
2,488
11,981 3,493
- 10
7,125,661 7,669,461
4,186 -
40,952 741 (D)
913,293
- 165
75,272 40,777
839
597,936 950
5,193 (D)
163,788
1,514 4,944
- 560
-
1,326 10,002
1,185 6,670
1,069,073
440,300 369,749
- -
167,831 -
4,499 15,352
-
107,643 613,425
114 -
3,629
65,372 2,506
441,941 476,685
4
108 146,810
175 5,969
901,806
- 905
129,028 6,597 1,983
(D)
14,195 5,099 4,132
2,186,201
559,892 256,410 266,510 931,777 61,766
642,825
1,576,435 (D)
- 839
3,419 5,387
4 - - - -
489 - 3 - -
- 661
18 3
25
69 - - - -
- 14 73
- 15
16
794 65
- -
82 - - 6 2
21
577 25
- -
41 1
156 213
-
- 4 -
10 32
- 28
- 20
-
4 97 11 10
997
109 143
40 536
-
182 1,240
2 - -
934,093 1,451,473
176 - - - -
127,360 -
1,302 - -
- 47,193 10,200
960 2,776
46,831
- - - -
- 4,636
19,864 -
6,520
11,324 411,784
2,580 - -
15,863 - -
3,330 (D)
2,959 7,848
309 - -
(D) (D)
78,840 31,022
-
- 17,804
- 3,553
65,940
- 1,611
- 5,449
-
(D) 36,119
4,570 750
620,742
98,792 25,911
1,600 38,526
-
27,002 72,171
(D) - -
4,514 5,393
6 - 6 -
1,281
32 -
11 28 96
-
703 -
97 8
66 14
- -
39
- 106 225
- 85
13
119 16
3 2
49
5 25
2 11
7
235 93
- 44
1
18 171 335
-
56 338
2 150
16
3 201 199 224
56
14 289
- 51
312
17 207
13 17
6
362 1,255 1,288
- -
1,704,817 1,387,219
1,600 -
13,288 -
689,260
28,238 -
3,466 14,930 29,018
-
266,442 -
19,470 (D)
18,808
38 - -
3,865
- 30,133 44,123
- 4,178
6,876
53,784 8,924
30 (D)
62,373
234 1,910
(D)(D)
6,419
49,220 1,263
- 8,697
(D)
2,137 78,289
111,898 -
5,093 92,624
(D)35,718 10,340
30 14,387 56,155 48,068
2,306
1,493 75,830
- 6,451
100,550
22,819 125,462 15,200 10,210 13,288
130,247 386,037 696,284
- -
17,760 16,631
62 -
681 87
3,931
1,079 10 88
7 287
33
1,314 27 69 42
15 11 28
3 85
-
88 79 17 97
1,134
172 77
4 73
870
2 850
16 17
74
2,063 117
- 48
62 57
1,146 1,562
-
37 597
- 40
602
17 389
1,249 143
68
46 150 169
12 1,285
145
1,145 909
1,289 703
1,741 4,333 3,934
- 33
1,047,722 938,335
3,486 -
10,461 37,282
(D)
118,144 10
25,509 2,135
37,706
207 36,535
(D)19,526
7,785
7,455 462
9,640 45
15,244
- 19,401 33,884
5,540 9,868
93,438
106,169 9,487
4 (D)
18,131
(D)60,685
1,795 641
3,360
26,014 1,551
- 9,666
28,969
2,342 11,403 55,235
-
4,975 4,766
- 5,708
89,725
59 45,568
115,624 29,902
9,342
(D)45,326 56,497
7,918 311,616
9,867
11,003 46,879 74,676 12,771
66,582 90,253
(D)-
207

150 2008 FRIS – GENERAL DATA 2007 CENSUS OF AGRICULTURE USDA, National Agricultural Statistics Service
Table 34. Irrigated Farms by Market Value of Agricultural Products Sold: 2008 and 2003 [Excludes institutional, research, and experimental farms and farms with horticulture. For meaning of abbreviations and symbols, see introductory text]
All farms
Farms with irrigation Water source Quantity of water applied 1
Surface water Surface water Geographic area
Farms Land in farms
(acres)
Acres irrigated
Irrigated cropland
harvested (acres)
Ground- water
(acres) On-farm (acres)
Off-farm (acres)
Ground- water
(acre-feet) On-farm
(acre-feet) Off-farm
(acre-feet)
United States .............................2008 .. 2003 .. 2008 DATA Alabama ............................................... Alaska ................................................... Arizona ................................................. Arkansas ............................................... California .............................................. Colorado ............................................... Connecticut ........................................... Delaware .............................................. Florida ................................................... Georgia ................................................. Hawaii ................................................... Idaho ..................................................... Illinois .................................................... Indiana .................................................. Iowa ...................................................... Kansas .................................................. Kentucky ............................................... Louisiana .............................................. Maine .................................................... Maryland ............................................... Massachusetts ...................................... Michigan ............................................... Minnesota ............................................. Mississippi ............................................ Missouri ................................................ Montana ................................................ Nebraska .............................................. Nevada ................................................. New Hampshire .................................... New Jersey ........................................... New Mexico .......................................... New York .............................................. North Carolina ...................................... North Dakota ........................................ Ohio ...................................................... Oklahoma ............................................. Oregon .................................................. Pennsylvania ........................................ Rhode Island ........................................ South Carolina ...................................... South Dakota ........................................ Tennessee ............................................ Texas .................................................... Utah ...................................................... Vermont ................................................ Virginia .................................................. Washington ........................................... West Virginia ........................................ Wisconsin ............................................. Wyoming ............................................... Water Resources Regions Region 01 New England ....................... Region 02 Mid-Atlantic .......................... Region 03 South Atlantic-Gulf .............. Region 04 Great Lakes ......................... Region 05 Ohio ..................................... Region 06 Tennessee ........................... Region 07 Upper Mississippi ................ Region 08 Lower Mississippi ................ Region 09 Souris-Red-Rainy ................ Region 10 Missouri ............................... Region 11 Arkansas-White-Red ........... Region 12 Texas-Gulf ........................... Region 13 Rio Grande .......................... Region 14 Upper Colorado ................... Region 15 Lower Colorado ................... Region 16 Great Basin ......................... Region 17 Pacific Northwest ................. Region 18 California ............................. Region 19 Alaska ................................. Region 20 Hawaii .................................
206,834 210,106
665 23
2,997 4,119
45,136
12,778 147 309
5,250 3,584
1,077
13,834 1,091 1,089
527
4,508 822
1,692 196 597
677
2,121 1,546 1,277 1,877
8,507
14,812 1,734
86 608
8,878
596 1,975
601 379
1,454
12,156 1,090
61 712
1,165
582 12,673 10,876
66
657 12,712
90 1,261 5,164
1,188 3,200
12,428 3,152 2,056
527
3,863 7,341
400 32,727
10,336 10,224
8,031 10,771
3,551
10,157 40,017 45,765
23 1,077
198,160,896 195,969,172
442,487 5,785
4,446,165 6,162,119
15,866,424
10,647,744 10,403
273,149 2,535,664 2,999,922
213,387
6,421,820 1,309,942 1,360,556
590,047
10,912,364 329,198
2,074,497 118,107 278,277
52,718
1,503,006 1,397,018 2,512,434 2,285,747
19,637,380 21,853,534 5,600,694
9,043 136,352
12,816,722
144,640 990,106
1,706,080 124,294
2,382,239 6,952,252
149,947 5,501
443,293
2,807,203 424,980
16,634,484 5,512,452
8,186
323,778 8,085,090
13,493 1,065,575
15,584,598
199,464 1,052,547 7,495,555 2,098,815 1,461,874
283,315
3,827,858 11,412,924
714,430 66,817,228
24,462,413 10,145,409 8,037,090 5,822,461 4,727,545
9,893,297
23,242,402 16,247,097
5,785 213,387
54,929,915 52,492,687
75,023 1,589
861,496 4,493,435 7,329,245
2,865,840
2,337 104,620
1,222,797 1,007,763
99,577
3,319,827 457,078 404,399 162,838
2,570,003
32,380 932,712 18,151 85,552
17,421
531,927 504,330
1,451,652 1,232,354
1,947,159 8,365,545
685,261 720
59,412
835,639 20,158
148,999 248,070 18,548
461,235
1,758,602 17,359
681 104,091
360,071 72,862
5,356,876 1,068,929
488
44,818 1,675,898
906 396,123
1,497,119
39,468 309,972
2,554,462 721,586 304,963
41,141
1,339,287 7,346,743
158,617 13,825,255
5,412,670 3,499,153 1,079,145 1,359,888
936,248
1,599,757 6,855,656 7,444,738
1,589 99,577
50,970,320 48,540,852
73,145 (D)
801,314 4,470,573 6,949,095
2,400,152
2,337 104,504
1,143,610 978,196
57,468
2,937,001 455,158 401,626 161,847
2,537,589
31,786 919,256
(D) 85,304
(D)
528,036 503,256
1,451,231 1,230,455
1,549,574 8,306,117
530,401 720
58,967
711,777 19,708
137,209 244,343 18,483
415,556
1,418,435 17,042
677 101,231
357,955
(D) 4,881,811
812,783 488
44,568
1,538,597 890
390,108 1,086,113
(D) 308,150
2,429,420 716,060 303,318
(D)
1,329,957 7,330,922
157,271 13,114,752
5,059,712 3,208,458
918,958 846,994 864,631
1,299,779 5,941,698 7,006,877
(D) 57,468
36,181,006 32,316,182
22,070 1,550
327,251 3,909,914 4,344,670
1,251,730
440 91,541
656,773 770,421
51,975
1,203,147 446,078 345,164 155,878
2,490,789
18,274 739,674
8,329 58,284
933
371,726 466,109
1,401,988 1,177,805
56,079
7,842,363 275,142
138 40,617
548,401
7,402 22,073
164,688 5,386
382,445 421,888
4,947 90
74,252
207,600 60,466
4,686,872 158,439
100
3,652 435,997
185 357,744 111,527
9,942 205,393
1,545,696 519,101 257,400
10,459
1,238,826 6,657,405
130,428 9,868,085
4,909,361 2,951,242
612,632 27,363
351,848
500,021 1,959,888 4,372,391
1,550 51,975
8,813,848 7,241,081
44,833 39
127,845 985,911
1,425,715
722,231 1,646
12,685 268,153 239,624
12,707
606,693 8,388
52,618 4,800
49,330 12,454
179,850 16,277 26,205
14,620
162,048 32,482 67,607 56,061
830,781 254,738 271,419
522 18,369
98,068 11,178
123,696 22,246
9,105
36,197 542,767 11,815
383 30,668
23,022 11,082
156,965 236,592
388
38,022 309,106
742 40,035
605,120
33,594 99,489
705,037 199,242 42,886
27,075 96,432
1,042,945 20,730
1,626,506
368,524 124,114 229,547 550,383 132,647
441,888
1,603,578 1,456,485
39 12,707
13,069,453 13,839,769
8,120 -
553,273 37,897
3,220,628
1,089,231 251 394
352,644 8,024
80,943
1,548,956 3,844 7,969 2,160
37,354
1,939 25,760
761 1,063
2,065 5,045 8,891 2,023 1,000
1,071,787
435,425 161,230
60 (D)
291,053
1,662 6,005
61,146 4,494
45,553
810,529 597 208 (D)
130,619
1,362 605,515 691,879
-
3,144 935,038
- 2,437
808,284
3,345 5,360
373,003 11,221
8,946
3,942 9,747
51,748 9,173
2,596,910
288,607 490,039 401,760 804,790 603,294
698,953
3,352,542 3,275,130
- 80,943
48,491,704 43,453,757
12,802 323
1,306,425 6,864,792
10,719,609
1,795,203 185
63,275 900,851 693,986
108,855
2,142,149 225,523 169,810 74,969
3,074,409
9,586 741,536
(D) 38,407
(D)
218,225 294,428
1,327,911 969,642
63,171
6,005,834 689,506
21 31,411
1,066,753
5,862 14,470
128,749 3,578
434,935 713,268
2,898 69
58,233
123,009 34,140
5,552,255 455,480
30
1,240 937,019
96 255,101 156,633
5,318 142,699
1,681,447 311,046 119,998
5,087
737,127 9,049,885
89,395 8,183,108
6,525,974 3,172,724 1,346,281
24,167 1,372,134
1,212,823 3,633,106
10,770,207 323
108,855
13,773,706 11,737,520
24,189 4
638,978 1,720,577 2,651,880
1,199,188
1,276 10,686
317,610 175,831
38,154
980,301 3,069
26,320 2,661
33,003
4,958 191,579
(D) 16,159
(D)
78,109 24,584 72,430 26,733
1,125,801
192,740 409,889
154 (D)
175,381
7,746 62,249 21,847
3,442
33,807 944,840
(D) 564
27,847
21,763 6,472
141,072 503,240
205
21,414 675,006
878 64,126
1,051,516
21,982 65,108
607,791 98,968 21,082
16,543 86,164
1,662,940 19,667
2,081,846
591,367 132,254 359,827
1,020,638 648,856
838,532
2,831,203 2,630,781
4 38,154
28,969,626 31,566,388
5,521 -
2,676,906 46,412
9,228,170
1,546,884 75
419 482,659
7,068
306,538 3,105,952
2,799 2,751 1,309
39,194
1,154 39,050
200 693
653
2,106 14,656
1,758 500
1,471,704
500,971 337,537
18 (D)
654,215
1,193 7,129
73,866 2,378
55,896
1,618,572 (D)42
156
126,502 1,659
1,126,457 1,471,428
-
2,141 2,169,347
- 3,151
1,831,332
987 3,522
500,258 4,496 5,132
3,986 7,625
73,925 14,163
4,121,131
352,298 877,329 785,993
1,416,040 2,884,166
1,509,544 6,868,089 9,234,406
- 306,538
See footnote(s) at end of table. --continued

2007 CENSUS OF AGRICULTURE 2008 FRIS – GENERAL DATA 151 USDA, National Agricultural Statistics Service
Table 34. Irrigated Farms by Market Value of Agricultural Products Sold: 2008 and 2003 - Con. [Excludes institutional, research, and experimental farms and farms with horticulture. For meaning of abbreviations and symbols, see introductory text]
Less than $25,000
Farms with irrigation Water source Quantity of water applied
Surface water Surface water Geographic area
Farms Land in farms
(acres)
Acres irrigated
Irrigated cropland
harvested (acres)
Ground- water
(acres) On-farm (acres)
Off-farm (acres)
Ground- water
(acre-feet) On-farm
(acre-feet) Off-farm
(acre-feet)
United States ............................. 2008 .. 2003 .. 2008 DATA Alabama ............................................... Alaska .................................................. Arizona ................................................. Arkansas .............................................. California .............................................. Colorado ............................................... Connecticut .......................................... Delaware .............................................. Florida .................................................. Georgia ................................................ Hawaii .................................................. Idaho .................................................... Illinois ................................................... Indiana ................................................. Iowa ..................................................... Kansas ................................................. Kentucky .............................................. Louisiana .............................................. Maine ................................................... Maryland .............................................. Massachusetts ..................................... Michigan ............................................... Minnesota ............................................. Mississippi ............................................ Missouri ................................................ Montana ............................................... Nebraska .............................................. Nevada ................................................. New Hampshire .................................... New Jersey .......................................... New Mexico .......................................... New York .............................................. North Carolina ...................................... North Dakota ........................................ Ohio ..................................................... Oklahoma ............................................. Oregon ................................................. Pennsylvania ........................................ Rhode Island ........................................ South Carolina ..................................... South Dakota ....................................... Tennessee ........................................... Texas ................................................... Utah ..................................................... Vermont ................................................ Virginia ................................................. Washington .......................................... West Virginia ........................................ Wisconsin ............................................. Wyoming .............................................. Water Resources Regions Region 01 New England ....................... Region 02 Mid-Atlantic ......................... Region 03 South Atlantic-Gulf .............. Region 04 Great Lakes ........................ Region 05 Ohio .................................... Region 06 Tennessee .......................... Region 07 Upper Mississippi ................ Region 08 Lower Mississippi ................ Region 09 Souris-Red-Rainy ................ Region 10 Missouri .............................. Region 11 Arkansas-White-Red ........... Region 12 Texas-Gulf .......................... Region 13 Rio Grande ......................... Region 14 Upper Colorado ................... Region 15 Lower Colorado ................... Region 16 Great Basin ......................... Region 17 Pacific Northwest ................ Region 18 California ............................. Region 19 Alaska ................................. Region 20 Hawaii .................................
100,371 96,850
372 6
1,941 463
22,017
8,056 64 24
2,555 1,062
780
9,372 106 124
46
183 331 420
88 201
224 557 249 186 275
5,269
804 962
44 299
7,219
209 837
61 182
389
8,221 487
32 413
273 293
5,091 8,467
22
361 7,542
57 257
2,878
460 1,232 5,409
873 764
261 524 910
49 8,084
3,159 4,363 6,118 8,693 2,446
7,322
26,467 22,451
6 780
19,858,301 14,946,746
34,169 255
1,609,071 61,364
2,381,118
1,550,935 1,210 1,474
123,963 146,186
7,958
626,063 5,290
19,653 3,628
47,988 42,253 41,437
2,301 10,145
3,108
28,767 30,411 20,251 30,029
2,682,242
65,881 181,828
5,044 18,156
2,559,268
6,377 121,613 49,320 18,974
115,910
1,014,198 21,960
509 38,856
134,057 26,057
1,093,308 806,514
1,777
61,456 804,645
3,124 24,011
3,174,189
12,844 74,651
507,180 51,705 79,624
24,049 43,246
101,829 26,433
5,517,074
1,609,174 952,328
1,703,933 1,175,808 1,744,993
782,227
2,999,947 2,443,043
255 7,958
2,911,875 2,651,893
3,442 15
42,510 33,063
321,277
413,047 95
690 29,104 17,491
2,961
354,741 1,359 4,398 1,072
17,779
2,509 15,170
281 1,319
787
7,172 12,207
5,748 7,874
298,112 38,905 54,738
107 2,185
162,263
1,036 16,196
3,178 875
20,554
194,487 1,385
61 3,570
20,677
2,998 166,093 254,023
65
2,620 125,064
258 5,652
240,662
1,359 7,143
72,752 10,671
6,315
3,122 13,118 52,882
6,232 500,037
152,627 125,298 176,279 389,391 56,707
235,574 768,470 330,922
15 2,961
1,993,322 1,715,702
2,769 15
17,463 31,413
258,603
242,061 (D)
638 22,676 17,071
2,360
219,058 1,359 3,592
877
5,459 1,925
11,718 (D)
1,231
(D) 5,882
12,041 5,748 6,730
214,334 35,433 39,002
107 1,856
97,700
1,036 13,045
3,178 875
15,489
122,117 1,224
(D) 2,970
19,989
2,014 131,821 183,742
(D)
2,620 69,198
(D) 5,552
157,960
(D) 6,517
61,720 8,475 5,666
(D)
13,118 48,503
6,066 358,278
106,707 91,026
126,115 202,048 24,719
175,861 492,206 260,753
15 2,360
647,455 638,528
995 15
13,860 14,823
123,881
21,368 (D)
690 20,062
7,043
276 85,543
1,359 4,320
868
17,779 207
10,417 (D)
560
185 2,870
10,783 2,385 6,846
-
38,457 8,929
78 1,254
40,550
668 (D)
687 262
14,661 24,865
515 (D)
1,682
8,932 598
87,283 23,030
22
753 30,690
(D) 4,226 9,512
(D) 3,711
32,132 5,489 3,339
(D)
10,675 33,667
5,762 58,841
64,966 77,178 25,507 15,613 16,893
29,928
137,967 124,555
15 276
862,792 670,242
2,196 -
13,388 13,800 28,526
131,367
(D)-
7,502 10,448
(D)
66,451 -
78 4
-
1,844 4,484
(D)605
602
5,142 990
3,298 1,028
137,136
448 27,275
29 1,005
42,850
182 (D)(D)
613
5,703 92,105
665 (D)
1,873
704 1,344
18,216 61,115
43
1,379 59,166
(D)1,426
105,046
(D)(D)
35,748 5,836 2,437
(D)
2,259 17,384
- 196,811
20,970 19,976 39,302
146,129 15,210
63,220
257,746 33,661
- (D)
1,466,477 1,353,059
251 -
15,902 4,440
180,180
271,472 - -
2,840 -
1,859 202,747
- -
200
- 458 269
- 154
- -
434 65
-
161,476 -
19,014 - -
92,877 186
3,345 (D)
-
190 80,597
205 -
15
11,041 (D)
60,594 175,016
-
488 35,208
- -
142,094
- 847
6,427 186 544
985 184
1,831 470
260,375
73,251 29,904
116,296 240,657 26,112
146,196 376,337 184,016
- 1,859
913,653 844,798
771 4
47,968 15,106
243,673
18,736 40
547 16,530
7,200
332 129,929
800 1,551
255
21,218 171
6,262 (D)
348
(D) 779
5,389 788
5,081
- 32,533 30,745
19 775
90,437
427 2,332
599 132
15,786 42,208
(D) (D)
1,112
5,812 321
69,578 49,136
20
222 36,337
23 1,394 9,592
(D) 2,438
27,995 1,567 1,662
124
4,072 26,584
3,675 49,140
72,898 65,151 65,892
(D) 58,288
74,579
201,230 245,021
4 332
1,339,114 844,685
1,022 -
28,741 20,850 98,904
215,925
38 -
9,938 11,249
1,309
79,826 - 8 1
-
910 3,688
12 357
443
1,450 243
1,821 611
155,018
302 57,395
10 1,118
64,473
302 4,855
(D) 457
5,136
133,196 618
1 1,198
774 773
37,661 123,126
6
911 112,754
(D) 790
160,267
509 2,197
30,218 2,142 1,264
949 904
20,938 -
241,841
37,744 41,181 38,696
272,347 32,119
131,612 375,006 108,139
- 1,309
2,438,975 2,400,074
65 -
60,488 5,820
329,745
333,430 - -
(D)-
2,851 334,199
- -
(D)
- 116 161
- 123
- -
320 20
-
260,408 -
52,133 - -
154,264 19
5,499 1,845
-
(D)122,404
95 - 5
9,743 1,496
40,303 344,398
-
604 68,457
- -
302,571
- 823
12,225 19 (D)
(D)(D)
3,035 401
505,747
97,894 30,538
140,111 320,737 91,702
313,881 580,793 336,539
- 2,851
See footnote(s) at end of table. --continued

152 2008 FRIS – GENERAL DATA 2007 CENSUS OF AGRICULTURE USDA, National Agricultural Statistics Service
Table 34. Irrigated Farms by Market Value of Agricultural Products Sold: 2008 and 2003 - Con. [Excludes institutional, research, and experimental farms and farms with horticulture. For meaning of abbreviations and symbols, see introductory text]
$25,000 to $49,999
Farms with irrigation Water source Quantity of water applied
Surface water Surface water Geographic area
Farms Land in farms
(acres)
Acres irrigated
Irrigated cropland
harvested (acres)
Ground- water
(acres) On-farm (acres)
Off-farm (acres)
Ground- water
(acre-feet) On-farm
(acre-feet) Off-farm
(acre-feet)
United States .............................2008 .. 2003 .. 2008 DATA Alabama ............................................... Alaska ................................................... Arizona ................................................. Arkansas ............................................... California .............................................. Colorado ............................................... Connecticut ........................................... Delaware .............................................. Florida ................................................... Georgia ................................................. Hawaii ................................................... Idaho ..................................................... Illinois .................................................... Indiana .................................................. Iowa ...................................................... Kansas .................................................. Kentucky ............................................... Louisiana .............................................. Maine .................................................... Maryland ............................................... Massachusetts ...................................... Michigan ............................................... Minnesota ............................................. Mississippi ............................................ Missouri ................................................ Montana ................................................ Nebraska .............................................. Nevada ................................................. New Hampshire .................................... New Jersey ........................................... New Mexico .......................................... New York .............................................. North Carolina ...................................... North Dakota ........................................ Ohio ...................................................... Oklahoma ............................................. Oregon .................................................. Pennsylvania ........................................ Rhode Island ........................................ South Carolina ...................................... South Dakota ........................................ Tennessee ............................................ Texas .................................................... Utah ...................................................... Vermont ................................................ Virginia .................................................. Washington ........................................... West Virginia ........................................ Wisconsin ............................................. Wyoming ............................................... Water Resources Regions Region 01 New England ....................... Region 02 Mid-Atlantic .......................... Region 03 South Atlantic-Gulf .............. Region 04 Great Lakes ......................... Region 05 Ohio ..................................... Region 06 Tennessee ........................... Region 07 Upper Mississippi ................ Region 08 Lower Mississippi ................ Region 09 Souris-Red-Rainy ................ Region 10 Missouri ............................... Region 11 Arkansas-White-Red ........... Region 12 Texas-Gulf ........................... Region 13 Rio Grande .......................... Region 14 Upper Colorado ................... Region 15 Lower Colorado ................... Region 16 Great Basin ......................... Region 17 Pacific Northwest ................. Region 18 California ............................. Region 19 Alaska ................................. Region 20 Hawaii .................................
16,554 20,196
45 -
168 111
6,373
1,074 14 21
589 467
82
481 34 27 19
233
76 98 29 50
156 135 103
5 80
446 328 173
20 22
429 135
32 23 31
293
1,115 126
- 24
61 62
624 724
12
29 841
5 69
460
225 280
1,173 262 146
48
151 246
40 1,621
784 638 397 828 182
538
2,522 6,391
- 82
5,552,985 12,145,037
16,899 -
241,084 46,815
192,049
853,345 (D)
3,575 47,636
133,625
2,018 153,205 13,567 14,732
7,318
126,199 16,586 19,186
2,185 5,090
3,929
18,502 40,938
5,467 12,325
570,307 954,542 63,351
(D) 2,966
193,059 10,961
1,328 19,395
2,625
244,659 192,832
(D) -
16,477
137,230 9,962
170,291 319,633
2,630
7,701 44,754
(D) 9,324
593,284
9,139 27,862
222,889 27,829 41,763
8,195
42,916 75,834 24,500
2,307,857
747,291 210,638 76,870
584,291 245,644
262,426 424,642 210,381
- 2,018
1,214,046 1,973,241
1,813 -
16,260 18,685
136,551
189,482 88
1,755 23,720 25,969
1,099
76,399 3,063 3,367 4,419
30,494
804 8,812
202 1,372
865
3,318 9,611 2,750 6,478
88,707 43,720 20,027
(D)1,096
29,891
1,237 368
3,117 393
26,364 78,351
956 -
1,036
6,857 889
72,851 122,033
(D)
497 36,679
5 2,059
109,390
1,282 6,143
53,342 6,158 4,112
325
12,665 33,253
3,188 288,969
95,967 69,029 48,155
147,034 17,180
77,705
204,697 143,743
- 1,099
1,003,589 1,610,428
1,699 -
8,544 17,830
132,351
167,328 88
1,755 16,985 19,047
489
58,534 3,063 3,367 4,419
30,494
804 8,812
202 1,282
865
3,158 9,611 2,750 6,478
74,683 43,720 14,726
95 1,096
23,160
1,117 368
3,051 393
23,591 58,834
956 -
1,036
6,857 809
50,388 75,197
52
497 32,404
5 2,059
88,540
1,282 5,933
39,571 5,998 4,112
285
12,665 32,358
3,188 266,092
91,634 43,623 35,127 95,591
9,464
61,234 161,292 133,651
- 489
439,877 725,987
377 -
10,020 18,685 81,692
27,130
- (D)
19,445 16,363
47
2,315 3,063 2,926 4,419
26,614
181 8,812
- 803
-
1,687 8,611 2,750 3,793
4,125
43,720 8,174
(D) 570
20,860
818 -
1,537 253
(D)
18,293 (D)
- 846
621 (D)
65,237 (D) (D)
45
- -
1,354 3,770
11 3,950
37,031 3,624 3,196
(D)
11,025 33,183
(D) 65,374
80,157 61,415
7,476 3,572
10,940
9,938 22,939 83,486
- 47
292,985 385,414
1,304 -
2,220 -
44,120
72,558 88 (D)(D)
9,606
755 8,436
- 441
-
1,548 609
1,200 202 547
(D)
1,631 1,000
- 2,685
29,775
- 6,922
(D)526
3,000
388 368 960 140
-
20,124 575
- 24
1,090
476 7,056
24,043 (D)
452
4,988 5
705 37,017
1,186 1,982
16,021 2,503
822
264 1,640 1,270
560 64,090
6,068 7,056
28,140 50,153
2,220
15,352 48,039 44,864
- 755
520,440 865,154
132 -
7,170 -
27,489
95,874 -
(D) (D)
-
318 65,648
- - -
2,332 14
- -
22
(D) - - - -
54,807 -
7,141 (D)
-
6,031 31
- 620
-
(D) 40,142
(D) -
166
5,146 (D)
7,614 95,552
-
- 31,691
- -
70,703
85 211 725
31 94
(D)
- -
(D) 167,135
9,742 7,614
13,089 93,309
7,170
54,671 133,927 32,143
- 318
551,445 827,568
190 -
29,880 25,075
180,163
18,763 -
693 12,449 17,275
30
4,435 967
1,503 3,096
35,777
108 6,990
- 391
-
323 6,117 2,351 2,356
4,950
37,210 13,537
(Z) 123
23,228
483 -
1,294 118
19,240 27,911
162 -
279
62 217
62,184 3,064
1
14 - -
1,708 6,728
1 1,796
30,193 2,514 1,417
27
8,174 36,192
1,229 58,765
72,683 47,806 20,841
5,358 31,224
15,737 33,924
183,534 -
30
435,889 511,656
578 -
12,186 -
62,884
123,248 50
210 3,438 6,013
269
6,753 -
88 -
1,548 (D)
360 20
318
640 1,096
(D) -
2,442
33,810 -
10,483 27 (D)
6,840
206 152 880
29
- 39,658
(D) -
19
1,180 182
1,411 40,142
34
483 10,429
(D) 213
65,908
738 1,275
10,679 1,349
360
(D) 928 374 280
124,380
10,972 (D)
39,295 72,738 12,186
17,344 77,197 64,000
- 269
889,458 2,219,051
78 -
34,005 -
49,266
82,123 -
(D)(D)
-
505 105,462
- - -
7,462 7 - -
15
(D)- - - -
97,383 -
15,779 (D)
-
7,624 3 -
969 -
(D)83,512
(D)-
51
4,188 (D)
6,538 190,712
-
- 41,193
- -
161,065
83 (D)
908 3
(D)
8 - -
(D)266,941
14,203
6,538 22,649
151,569 34,005
110,588 218,010 63,228
- 505
See footnote(s) at end of table. --continued

2007 CENSUS OF AGRICULTURE 2008 FRIS – GENERAL DATA 153 USDA, National Agricultural Statistics Service
Table 34. Irrigated Farms by Market Value of Agricultural Products Sold: 2008 and 2003 - Con. [Excludes institutional, research, and experimental farms and farms with horticulture. For meaning of abbreviations and symbols, see introductory text]
$50,000 to $99,999
Farms with irrigation Water source Quantity of water applied
Surface water Surface water Geographic area
Farms Land in farms
(acres)
Acres irrigated
Irrigated cropland
harvested (acres)
Ground- water
(acres) On-farm (acres)
Off-farm (acres)
Ground- water
(acre-feet) On-farm
(acre-feet) Off-farm
(acre-feet)
United States ............................. 2008 .. 2003 .. 2008 DATA Alabama ............................................... Alaska .................................................. Arizona ................................................. Arkansas .............................................. California .............................................. Colorado ............................................... Connecticut .......................................... Delaware .............................................. Florida .................................................. Georgia ................................................ Hawaii .................................................. Idaho .................................................... Illinois ................................................... Indiana ................................................. Iowa ..................................................... Kansas ................................................. Kentucky .............................................. Louisiana .............................................. Maine ................................................... Maryland .............................................. Massachusetts ..................................... Michigan ............................................... Minnesota ............................................. Mississippi ............................................ Missouri ................................................ Montana ............................................... Nebraska .............................................. Nevada ................................................. New Hampshire .................................... New Jersey .......................................... New Mexico .......................................... New York .............................................. North Carolina ...................................... North Dakota ........................................ Ohio ..................................................... Oklahoma ............................................. Oregon ................................................. Pennsylvania ........................................ Rhode Island ........................................ South Carolina ..................................... South Dakota ....................................... Tennessee ........................................... Texas ................................................... Utah ..................................................... Vermont ................................................ Virginia ................................................. Washington .......................................... West Virginia ........................................ Wisconsin ............................................. Wyoming .............................................. Water Resources Regions Region 01 New England ....................... Region 02 Mid-Atlantic ......................... Region 03 South Atlantic-Gulf .............. Region 04 Great Lakes ........................ Region 05 Ohio .................................... Region 06 Tennessee .......................... Region 07 Upper Mississippi ................ Region 08 Lower Mississippi ................ Region 09 Souris-Red-Rainy ................ Region 10 Missouri .............................. Region 11 Arkansas-White-Red ........... Region 12 Texas-Gulf .......................... Region 13 Rio Grande ......................... Region 14 Upper Colorado ................... Region 15 Lower Colorado ................... Region 16 Great Basin ......................... Region 17 Pacific Northwest ................ Region 18 California ............................. Region 19 Alaska ................................. Region 20 Hawaii .................................
13,774 23,520
38 9
183 303
1,195
825 26 45
590 190
78
926 90 65 53
453 119 134
12 46
62
301 158
61 161
684
1,508 156
7 19
381
33 186
47 50
140 631 242
10 44
104
32 1,137
558 13
37
1,062 20 68
482
121 365
1,049 382 228
38
348 450
24 3,310
910 862 542 417 183
706
2,535 1,217
9 78
13,738,171 18,268,767
14,406 3,342
56,399 159,807 556,755
889,379
2,286 9,370
164,927 77,903
10,392
534,726 38,216 22,987 33,417
593,321 33,315 70,340
2,016 8,474
2,845
48,359 54,474 39,177 46,970
1,459,559 1,025,592
191,279 168
4,884
1,082,432 3,552
33,562 57,970
8,472
240,535 778,523 17,333
925 19,316
139,835
5,397 1,477,035
547,811 1,551
7,782
1,843,323 5,145
18,648 1,293,939
8,632 44,366
315,190 66,881 63,415
1,742
128,174 257,227 20,452
4,446,566
1,092,229 437,530
1,753,948 714,860 56,399
600,803
3,143,508 572,515
3,342 10,392
2,174,311 3,825,340
2,690 (D)
14,316 96,216
128,034
254,651 268
4,742 34,152 29,236
1,154
186,455 (D)
6,395 7,045
56,088
1,665 28,259
168 3,467
980
14,611 14,864 21,932 21,541
181,550 240,468 50,710
21 1,799
37,325
640 6,620
10,650 875
26,916
108,357 2,742
70 4,330
23,727
620 150,545 128,902
103
972 86,211
(D)5,962
165,776
1,515 13,551 78,916 18,502
6,272
(D)34,271
131,434 4,568
652,994
185,980 82,208
122,185 141,448 14,316
168,487 376,405 138,858
(D)1,154
1,791,294 3,324,227
2,576 369
10,656 96,216 88,790
197,479
268 4,742
32,752 25,686
1,112
128,300 8,608 6,395 7,045
50,463
1,665 27,419
117 3,467
980
14,061 14,749 21,932 21,541
147,957 240,468 34,376
21 1,799
31,114
640 5,516
10,405 875
23,704 79,680
2,742 70
4,285
23,232 (D)
137,774 92,210
103
972 71,981
(D) 5,762
107,461
1,464 13,551 72,703 17,952
6,272
503 33,956
130,594 4,568
592,541
163,310 79,085 81,977 88,917 10,656
130,613 271,965 89,186
369 1,112
950,202 1,982,150
727 (D)
4,476 91,416 84,130
58,698
30 4,702
30,836 17,326
324
16,356 8,555 5,269 6,510
50,268
208 22,233
48 2,428
-
7,144 13,666 20,132 20,653
-
220,287 15,348
12 1,230
20,565
330 448
3,033 358
(D)
8,580 968
- 3,496
4,308
200 130,090 19,780
4
(D) 11,880
(D) 4,731
14,224
94 9,910
52,833 10,012
3,685
(D) 31,275
125,368 2,268
287,075
143,630 71,903 45,450
(D) 4,476
43,308 25,996 86,770
(D) 324
610,779 689,937
1,963 39
6,780 4,800
33,774
63,186 (D)40 (D)
8,910
52 88,644
(D)(D)
535
5,820 1,457 4,618
45 1,039
903
7,467 1,548 2,700
888
78,226 20,181 29,384
9 569
10,564
214 6,172
(D)517
(D)
65,503 1,762
(D)1,874
1,753
420 4,060
40,967 99
(D)
26,588 (D)
1,231 75,000
1,137 3,641
24,047 8,394 2,561
(D)
2,796 5,558 2,300
155,213
16,139 (D)
44,534 61,055
6,780
56,987 176,965 41,928
39 52
654,500 1,182,640
- -
5,300 -
17,620
142,132 (D)
- (D)
3,000
778 81,455
(D) (D)
-
- -
1,408 75
-
77 - - - -
103,324 -
10,858 - -
11,056 96
- (D)
-
(D) 34,274
12 (D)
-
17,666 -
20,455 71,260
-
- 50,623
- -
76,552
284 -
3,076 96 26
-
(D) 1,408
- 210,706
28,036
(D) 46,921 76,863
5,300
76,177 176,324 17,650
- 778
1,152,382 2,298,820
267 (D)
13,539 146,873 193,512
92,513
(D) 3,066
33,651 16,072
74
25,998 4,385 2,248 2,365
62,311
73 19,233
24 1,688
-
3,101 7,124
23,815 11,456
-
155,907 40,211
(D) 586
35,895
178 179
2,488 160
25,537 16,548
352 -
1,675
1,922 114
112,316 46,138
(Z)
54 32,132
(D) 2,815
13,606
36 5,913
51,843 4,784 1,806
(D)
15,243 183,454
1,593 223,123
139,405 65,372 89,275
2,180 13,539
101,507 55,320
197,712 (D) 74
1,037,945 1,023,832
961 4
27,536 2,400
155,689
88,281 60 40
6,480 3,336
83
107,243 23
254 269
1,746
450 8,322
23 552
1,218 2,185
863 2,775
178
98,053 9,960
42,887 15
615
26,900 59
1,961 (D)
307
2,903 131,888
1,596 35
788
1,793 273
1,450 96,918
112
238 56,428
(D) 1,068
150,248
1,352 2,397
16,200 2,798 1,677
(D)
1,747 8,407
448 206,270
14,243
(D) 63,845
127,672 27,536
103,066 287,322 172,711
4 83
1,193,945 2,016,513
- -
31,956 -
40,236
196,587 (D)
- (D)
1,968
639 171,484
(D)(D)
-
- -
3,208 (D)
-
100 - - - -
123,141 -
16,863 - -
22,729 20
- 5,397
-
(D)56,417
1 2 -
19,232 -
22,954 189,602
-
- 97,889
- -
192,977
192 -
2,097 20 (D)
-
(D)3,208
- 339,436
34,030 20,344 70,994
132,473 31,956
188,895 329,298 40,356
- 639
See footnote(s) at end of table. --continued

154 2008 FRIS – GENERAL DATA 2007 CENSUS OF AGRICULTURE USDA, National Agricultural Statistics Service
Table 34. Irrigated Farms by Market Value of Agricultural Products Sold: 2008 and 2003 - Con. [Excludes institutional, research, and experimental farms and farms with horticulture. For meaning of abbreviations and symbols, see introductory text]
$100,000 to $249,999
Farms with irrigation Water source Quantity of water applied
Surface water Surface water Geographic area
Farms Land in farms
(acres)
Acres irrigated
Irrigated cropland
harvested (acres)
Ground- water
(acres) On-farm (acres)
Off-farm (acres)
Ground- water
(acre-feet) On-farm
(acre-feet) Off-farm
(acre-feet)
United States .............................2008 .. 2003 .. 2008 DATA Alabama ............................................... Alaska ................................................... Arizona ................................................. Arkansas ............................................... California .............................................. Colorado ............................................... Connecticut ........................................... Delaware .............................................. Florida ................................................... Georgia ................................................. Hawaii ................................................... Idaho ..................................................... Illinois .................................................... Indiana .................................................. Iowa ...................................................... Kansas .................................................. Kentucky ............................................... Louisiana .............................................. Maine .................................................... Maryland ............................................... Massachusetts ...................................... Michigan ............................................... Minnesota ............................................. Mississippi ............................................ Missouri ................................................ Montana ................................................ Nebraska .............................................. Nevada ................................................. New Hampshire .................................... New Jersey ........................................... New Mexico .......................................... New York .............................................. North Carolina ...................................... North Dakota ........................................ Ohio ...................................................... Oklahoma ............................................. Oregon .................................................. Pennsylvania ........................................ Rhode Island ........................................ South Carolina ...................................... South Dakota ........................................ Tennessee ............................................ Texas .................................................... Utah ...................................................... Vermont ................................................ Virginia .................................................. Washington ........................................... West Virginia ........................................ Wisconsin ............................................. Wyoming ............................................... Water Resources Regions Region 01 New England ....................... Region 02 Mid-Atlantic .......................... Region 03 South Atlantic-Gulf .............. Region 04 Great Lakes ......................... Region 05 Ohio ..................................... Region 06 Tennessee ........................... Region 07 Upper Mississippi ................ Region 08 Lower Mississippi ................ Region 09 Souris-Red-Rainy ................ Region 10 Missouri ............................... Region 11 Arkansas-White-Red ........... Region 12 Texas-Gulf ........................... Region 13 Rio Grande .......................... Region 14 Upper Colorado ................... Region 15 Lower Colorado ................... Region 16 Great Basin ......................... Region 17 Pacific Northwest ................. Region 18 California ............................. Region 19 Alaska ................................. Region 20 Hawaii .................................
24,979 29,410
59 4
181 641
5,660
1,341 32 61
547 402
74
1,304 159 176
84
1,067 148 267
34 98
115 215 319 198 299
1,085 3,863
177 8
72
331 93
297 131
48
195 610 114
13 61
244
41 1,702
483 14
50
961 3
196 702
205 457
1,424 329 264
69
677 1,130
47 7,110
1,274 1,446
372 544 195
663
2,967 5,728
4 74
29,307,976 41,290,907
37,625 845
112,782 599,670
1,506,983
3,016,978 2,508
23,706 156,596 348,648
2,787
1,046,072 95,047 91,453 50,718
1,537,573
47,075 236,090
9,053 35,232
11,984 93,563
179,733 168,487 171,421
3,878,063 3,004,090
574,972 1,691
17,515
4,197,556 13,769 76,188
304,292 9,422
375,492
1,325,191 26,089
1,067 35,622
316,960 19,263
1,678,868 1,103,996
1,224
17,616 219,215
1,820 81,906
2,443,460
26,903 118,788 749,836 140,456 116,344
12,082
351,963 718,027 57,801
11,378,855
6,264,459 1,362,518
346,014 1,335,973
127,482
1,623,518 2,933,185 1,640,140
845 2,787
5,890,912 9,275,214
4,642 178
49,974 213,686 508,414
575,778
289 9,860
67,236 84,589
1,135
418,417 34,079 27,460 17,231
205,611
3,979 99,307
1,178 10,714
3,014
27,633 66,377 57,587 87,533
474,094
1,072,326 93,538
286 5,733
70,799
2,932 15,780 32,768
1,399
57,924 250,614
2,225 235
6,497
50,954 1,233
543,217 183,463
164
2,296 99,492
270 23,982
322,790
5,092 32,181
181,044 43,652 20,530
1,940
122,376 370,722 12,904
2,039,458
482,976 428,583 110,093 349,417 55,619
270,486 812,453 550,073
178 1,135
5,212,683 8,529,248
4,167 178
44,754 213,686 452,304
459,255
289 9,860
56,698 78,741
1,043
364,721 34,009 27,200 17,231
204,291
3,979 98,207
1,178 10,644
3,014
27,612 66,365 57,587 87,348
381,475
1,050,666 68,209
286 5,733
61,376
2,932 10,392 32,220
1,399
52,733 156,646
2,069 235
6,477
50,095 1,193
519,914 132,541
164
2,296 91,862
270 23,157
233,982
5,092 31,955
158,775 43,621 20,270
1,900
121,479 369,622 12,734
1,899,163
464,004 405,830 88,097
211,188 46,799
209,053 648,574 473,306
178 1,043
3,258,968 5,712,797
1,255 178
24,928 159,263 320,912
207,562
(D) 8,912
58,322 57,932
140
83,767 31,339 22,076 17,102
199,369
1,698 70,457
- (D)
210
11,203 58,943 55,558 79,882
7,958
988,440 30,195
- 2,732
47,058
1,116 1,076
17,085 732
51,093 49,021
(D) 21
3,822
24,668 (D)
480,107 23,071
(D)
279 19,750
- 20,834 10,734
242 20,710
124,692 24,025 14,970
(D)
109,726 320,193
(D) 1,259,722
388,791 376,618 54,683
- 29,828
63,259
128,683 330,414
178 140
1,170,802 1,406,760
3,067 -
7,409 54,423
147,235
170,686 258 948
12,034 24,887
112
78,989 2,250 4,828
129
3,346 2,322
20,746 1,028 3,162
2,584
14,350 8,356 3,339 7,651
186,114 33,430 36,393
(D)3,001
7,735 1,428
14,704 2,507
633
2,840 69,900
1,476 214
2,565
5,377 917
24,657 52,097
(D)
2,017 10,070
270 3,617
134,313
4,440 10,897 57,272 17,316
4,688
(D)13,304 43,735
1,670 277,603
75,890
(D)34,378
157,414 7,409
97,355
211,255 146,399
- 112
1,725,879 2,235,666
320 -
31,902 -
173,685
237,108 (D)
- (D)
3,754
883 257,191
490 556
-
2,896 246
8,246 150 (D)
290
2,080 980 (D)
-
281,622 74,777 31,937
(D) -
21,576 388
- 13,176
184
4,531 132,703
(D) -
(D)
20,909 (D)
57,950 110,640
-
- 69,672
- -
181,985
480 574
6,544 2,780 1,022
(D) (D)
8,286 (D)
552,061
38,545 (D)
31,602 198,503 32,647
117,146 475,113 206,678
- 883
3,960,293 6,703,650
482 32
93,101 310,208 767,443
279,484
9 5,591
72,337 45,752
364
155,569 15,639 11,109
7,589
221,262 747
88,365 -
4,611
25 6,776
33,508 52,032 61,513
8,303
647,682 91,285
- 1,880
83,387
988 194
13,873 561
70,287 88,672
466 12
2,955
12,484 94
555,823 73,502
4
79 45,886
- 12,814 15,518
45 13,597
123,584 14,349
7,787
264 58,817
442,820 7,788
962,426
464,751 435,902 111,500
- 117,173
157,726 251,315 790,053
32 364
1,797,628 1,983,894
1,742 -
35,873 80,564
285,187
281,484 67
694 20,843 10,059
(D)
129,348 297
2,056 21
2,342
994 31,249
181 1,782
1,537 5,340 4,075 1,726 5,018
241,078 27,866 39,423
(D) 1,945
16,104
2,491 11,414
2,248 421
3,098
115,884 863 (D)
2,332
5,887 392
8,494 115,519
(D)
1,277 24,222
(D) 6,089
267,694
1,956 7,834
45,713 7,453 2,300
1,468 9,431
70,285 (D)
349,465
105,845 1,821
50,563 297,701 35,873
222,837 357,138 228,841
- (D)
3,259,502 4,516,273
284 -
163,015 -
423,588
423,669 (D)
- 5,700 3,614
2,578
443,551 245 (D)
-
3,081 92
10,685 47 (D)
24
1,040 827 (D)
-
322,537 149,698 61,981
(D)-
56,425 737
- 13,206
56
6,633 265,503
(D)-
(D)
21,559 (D)
105,972 230,702
-
- 136,295
- -
405,416
77 479
9,655 1,207 1,043
(D)
109 10,741
(D)938,931
38,725 82,032 72,616
358,690 164,579
247,669 836,727 492,862
- 2,578
See footnote(s) at end of table. --continued

2007 CENSUS OF AGRICULTURE 2008 FRIS – GENERAL DATA 155 USDA, National Agricultural Statistics Service
Table 34. Irrigated Farms by Market Value of Agricultural Products Sold: 2008 and 2003 - Con. [Excludes institutional, research, and experimental farms and farms with horticulture. For meaning of abbreviations and symbols, see introductory text]
$250,000 to $499,999
Farms with irrigation Water source Quantity of water applied
Surface water Surface water Geographic area
Farms Land in farms
(acres)
Acres irrigated
Irrigated cropland
harvested (acres)
Ground- water
(acres) On-farm (acres)
Off-farm (acres)
Ground- water
(acre-feet) On-farm
(acre-feet) Off-farm
(acre-feet)
United States ............................. 2008 .. 2003 .. 2008 DATA Alabama ............................................... Alaska .................................................. Arizona ................................................. Arkansas .............................................. California .............................................. Colorado ............................................... Connecticut .......................................... Delaware .............................................. Florida .................................................. Georgia ................................................ Hawaii .................................................. Idaho .................................................... Illinois ................................................... Indiana ................................................. Iowa ..................................................... Kansas ................................................. Kentucky .............................................. Louisiana .............................................. Maine ................................................... Maryland .............................................. Massachusetts ..................................... Michigan ............................................... Minnesota ............................................. Mississippi ............................................ Missouri ................................................ Montana ............................................... Nebraska .............................................. Nevada ................................................. New Hampshire .................................... New Jersey .......................................... New Mexico .......................................... New York .............................................. North Carolina ...................................... North Dakota ........................................ Ohio ..................................................... Oklahoma ............................................. Oregon ................................................. Pennsylvania ........................................ Rhode Island ........................................ South Carolina ..................................... South Dakota ....................................... Tennessee ........................................... Texas ................................................... Utah ..................................................... Vermont ................................................ Virginia ................................................. Washington .......................................... West Virginia ........................................ Wisconsin ............................................. Wyoming .............................................. Water Resources Regions Region 01 New England ....................... Region 02 Mid-Atlantic ......................... Region 03 South Atlantic-Gulf .............. Region 04 Great Lakes ........................ Region 05 Ohio .................................... Region 06 Tennessee .......................... Region 07 Upper Mississippi ................ Region 08 Lower Mississippi ................ Region 09 Souris-Red-Rainy ................ Region 10 Missouri .............................. Region 11 Arkansas-White-Red ........... Region 12 Texas-Gulf .......................... Region 13 Rio Grande ......................... Region 14 Upper Colorado ................... Region 15 Lower Colorado ................... Region 16 Great Basin ......................... Region 17 Pacific Northwest ................ Region 18 California ............................. Region 19 Alaska ................................. Region 20 Hawaii .................................
18,856 18,644
30 3
126 816
3,326
573 1
73 294 465
22
695 219 195 107
1,025
86 300
6 112
55
241 268 198 368
616
3,667 117
5 48
161
44 178
87 12
244 496
64 4
32
195 42
1,502 390
5
95 820
1 194 233
71 386
1,022 373 226
30
712 1,414
75 5,667
1,478 1,051
187 156 129
485
1,975 3,394
3 22
32,968,236 32,633,629
34,343 (D)
180,940 950,368
1,212,487
1,393,581 (D)
65,431 144,096 461,511
(D)
732,552 189,833 143,612 95,127
2,250,536
56,526 456,804
3,560 70,701
8,620
154,170 226,687 282,938 422,070
4,963,869 7,376,575
807,220 (D)
11,589
1,057,540 14,784 68,906
232,324 5,184
474,446 941,720 18,774
(D) 39,987
403,411 33,045
3,034,603 1,270,834
1,004
69,384 616,904
(D) 124,262
1,861,857
13,500 199,758 788,861 237,845 171,943
28,465
572,799 1,778,050
116,418 16,408,716
3,201,160 2,161,256
963,160 434,941 184,079
2,041,747 2,339,618 1,324,469
(D) (D)
8,051,610 9,500,557
7,979 472
60,745 689,529 568,875
373,288
(D)(D)
83,305 139,304
234
369,128 72,205 50,740 28,477
480,084
5,439 187,349
319 23,791
2,647
49,412 78,624
135,966 168,655
369,909
1,643,726 100,731
(D)4,930
97,716
1,958 11,751 33,154
384
93,489 250,851
3,154 (D)
8,752
65,724 6,398
1,161,374 140,806
(D)
8,091 186,450
(D)40,787
225,210
3,583 57,563
251,249 76,051 39,518
4,988
196,118 1,023,497
26,153 2,671,180
1,007,940
781,371 105,570 111,797 63,324
225,777 788,539 616,686
472 234
7,474,773 9,045,139
7,567 (D)
57,120 670,329 503,275
340,969
(D) 18,937 62,675
130,309
234 331,827 71,765 50,288 27,681
479,184
5,429 184,760
319 23,791
2,647
48,589 78,378
135,966 168,655
318,540
1,638,559 89,103
(D) 4,930
91,062
1,958 10,968 32,438
(D)
82,578 197,021
3,154 116
8,752
65,724 6,378
1,018,634 120,774
(D)
8,091 160,663
(D) 40,075
173,120
3,583 57,563
220,429 75,148 39,066
(D)
194,064 1,020,898
26,027 2,582,136
913,129 695,957 96,155 76,065 58,819
203,573 666,986 539,481
(D) 234
5,594,976 6,691,963
2,070 472
31,495 579,736 335,707
199,925
- (D)
60,121 94,446
-
108,519 69,825 38,026 26,297
449,378
2,416 146,976
(D) 16,006
(D)
32,069 73,151
126,339 155,531
12,804
1,510,442 45,141
(D) 3,679
84,563
488 (D)
19,130 184
73,424 63,491
241 (D)
5,855
43,316 4,592
1,046,861 (D) (D)
-
49,933 -
36,166 13,360
(D) 36,737
161,517 50,737 30,783
2,308
176,127 902,909 22,622
1,891,367
915,816 670,858 78,292
(D) 32,895
64,083
206,274 349,406
472 -
1,300,152 1,034,317
4,661 -
6,000 178,789 142,637
82,778
(D)(D)
11,310 47,931
(D)
115,728 2,812 9,013
(D)
20,076 1,982
35,647 (D)
7,698
2,101 (D)
4,645 11,247 13,124
151,790 105,462 39,703
(D)1,251
7,496 1,391
(D)(D)
200
8,300 54,518
2,589 (D)
2,887
4,200 1,706
12,250 29,014
(D)
8,091 8,908
(D)4,691
121,975
(D)(D)
79,673 24,010
5,453
2,598 18,325
175,660 3,529
403,136
74,014 8,970
20,941 55,319
6,880
62,184 185,029 151,128
- (D)
1,510,003 1,868,015
1,248 -
31,813 7,558
212,841
135,070 -
(D) 12,572
-
(D) 153,015
800 3,701
(D)
10,630 1,041 9,344
(D) 87
(D) (D)
1,448 - -
212,115 68,303 20,262
- -
15,487 83
- (D)
-
11,765 133,812
324 (D) (D)
19,378
100 116,253 99,798
-
- 127,609
- -
89,875
809 (D)
13,920 1,308 3,282
82
2,968 16,920
622 439,833
43,320
112,253 33,377
(D) 32,112
107,503 406,340 238,462
- (D)
6,675,330 8,322,139
860 85
103,983 1,027,370
856,429
293,267 -
10,670 62,017 64,600
-
213,970 33,697 20,444 10,466
500,151
1,001 154,104
(D) 12,145
5
16,822 45,478
124,112 115,267
13,941
1,208,114 100,179
(D) 2,150
127,142
(D) 259
14,426 113
92,426
122,715 38 (D)
3,680
31,470 3,351
1,116,280 46,956
5
- 87,443
- 25,464 11,592
(D) 25,593
130,812 29,741 14,934
(D)
100,388 1,255,379
15,565 1,588,352
1,171,680
652,265 152,523
2,448 104,068
156,626 384,240 889,547
85 -
2,128,416 1,597,339
2,251 -
27,194 377,488 399,843
169,166
(D) 1,303
13,466 36,573
(D)
216,906 1,254 3,548
606
11,021 946
47,798 12
4,247
(D) 7,577 3,548
10,686 4,806
210,456 97,049 51,706
(D) 677
14,514
650 4,669 1,911
416
7,921 94,343
654 (D)
1,539
5,490 917
6,226 49,902
(D)
3,484 23,662
(D) 5,051
203,867
2,919 9,626
58,955 11,385
2,518
1,737 10,285
314,821 (D)
509,734
151,939 6,206
54,218 102,674 31,594
93,338
357,227 406,515
- (D)
3,011,752 4,192,454
708 -
124,705 10,255
656,794
208,933 -
(D)32,937
-
262 358,038
200 1,616
437
9,374 903
17,286 64 35
(D)(D)
1,328 - -
265,316 69,343 47,806
- -
39,888 25
- 12,608
-
14,311 273,227
69 (D)(D)
17,818
55 129,524 217,393
-
- 303,857
- -
196,371
142 86
33,665 521
2,024
31 1,734
27,565 400
632,646
63,324 115,524 64,963 96,918
126,051
236,912 913,665 695,320
- 262
See footnote(s) at end of table. --continued

156 2008 FRIS – GENERAL DATA 2007 CENSUS OF AGRICULTURE USDA, National Agricultural Statistics Service
Table 34. Irrigated Farms by Market Value of Agricultural Products Sold: 2008 and 2003 - Con. [Excludes institutional, research, and experimental farms and farms with horticulture. For meaning of abbreviations and symbols, see introductory text]
$500,000 to $999,999
Farms with irrigation Water source Quantity of water applied
Surface water Surface water Geographic area
Farms Land in farms
(acres)
Acres irrigated
Irrigated cropland
harvested (acres)
Ground- water
(acres) On-farm (acres)
Off-farm (acres)
Ground- water
(acre-feet) On-farm
(acre-feet) Off-farm
(acre-feet)
United States .............................2008 .. 2003 .. 2008 DATA Alabama ............................................... Alaska ................................................... Arizona ................................................. Arkansas ............................................... California .............................................. Colorado ............................................... Connecticut ........................................... Delaware .............................................. Florida ................................................... Georgia ................................................. Hawaii ................................................... Idaho ..................................................... Illinois .................................................... Indiana .................................................. Iowa ...................................................... Kansas .................................................. Kentucky ............................................... Louisiana .............................................. Maine .................................................... Maryland ............................................... Massachusetts ...................................... Michigan ............................................... Minnesota ............................................. Mississippi ............................................ Missouri ................................................ Montana ................................................ Nebraska .............................................. Nevada ................................................. New Hampshire .................................... New Jersey ........................................... New Mexico .......................................... New York .............................................. North Carolina ...................................... North Dakota ........................................ Ohio ...................................................... Oklahoma ............................................. Oregon .................................................. Pennsylvania ........................................ Rhode Island ........................................ South Carolina ...................................... South Dakota ........................................ Tennessee ............................................ Texas .................................................... Utah ...................................................... Vermont ................................................ Virginia .................................................. Washington ........................................... West Virginia ........................................ Wisconsin ............................................. Wyoming ............................................... Water Resources Regions Region 01 New England ....................... Region 02 Mid-Atlantic .......................... Region 03 South Atlantic-Gulf .............. Region 04 Great Lakes ......................... Region 05 Ohio ..................................... Region 06 Tennessee ........................... Region 07 Upper Mississippi ................ Region 08 Lower Mississippi ................ Region 09 Souris-Red-Rainy ................ Region 10 Missouri ............................... Region 11 Arkansas-White-Red ........... Region 12 Texas-Gulf ........................... Region 13 Rio Grande .......................... Region 14 Upper Colorado ................... Region 15 Lower Colorado ................... Region 16 Great Basin ......................... Region 17 Pacific Northwest ................. Region 18 California ............................. Region 19 Alaska ................................. Region 20 Hawaii .................................
16,518 11,875
57 1
129 927
2,588
389 7
42 260 443
18
484 264 220 135
1,026
39 265
10 43
44
271 300 282 406
279
2,841 80
1 71
184
39 211 142
32
114 714
26 -
70
143 46
1,583 137
-
47 615
2 196 295
62 236
1,039 403 200
26
786 1,628
111 4,273
1,527 1,193
193 74
133
259 1,750 2,606
1 18
40,096,061 31,483,878
91,131 (D)
139,394 1,504,734 3,516,991
1,252,183
(D) 71,385
243,798 699,641
(D)
701,216 372,137 322,606 215,250
3,416,902
60,027 490,015
5,092 54,334
9,075
309,895 386,023 560,515 585,610
3,617,120 4,877,749 2,173,523
(D) 24,087
2,154,522
19,885 160,193 442,696 27,321
442,836
1,351,687 15,170
- 109,966
850,240 78,718
3,624,718 885,625
-
51,788 2,166,738
(D) 195,499
1,814,417
16,060 204,401
1,285,115 432,426 299,250
47,818
1,037,851 2,820,573
210,221 12,228,791
4,805,720 2,484,382 2,038,484 1,029,295
199,694
2,745,899 4,628,044 3,580,485
(D) (D)
11,411,910 10,062,682
15,843 (D)
95,467 1,219,074
881,895
414,796 (D)(D)
88,356 254,395
739
438,532 139,913 93,858 45,952
822,515
8,206 220,768
612 13,447
3,778
104,211 111,219 324,305 329,553
268,140
2,538,015 128,377
(D)13,674
101,584
2,940 34,838 58,580
4,993
87,645 336,271
2,244 -
25,946
86,975 9,715
1,465,433 99,397
-
8,997 215,687
(D)58,756
205,291
4,920 67,700
419,149 145,859 63,809
(D)
317,119 1,907,055
34,411 3,583,888
1,327,339 1,098,423
118,508 103,855 98,967
236,171 978,711 899,188
(D)739
10,980,082 9,660,544
15,753 (D)
92,969 1,218,972
850,392
386,938 (D)
30,104 83,713
253,460
739 420,104 138,783 93,272 45,952
815,039
8,206 220,768
612 13,447
3,778
103,266 111,139 324,305 329,143
208,996
2,517,858 77,899
(D) 13,588
98,980
2,940 34,838 58,040
4,988
79,463 297,743
2,244 -
25,886
86,975 9,711
1,373,234 87,888
-
8,747 207,306
(D) 58,756
162,334
4,920 67,304
413,421 144,335 63,805
(D)
315,897 1,906,943
34,111 3,471,338
1,283,327 1,032,270
112,626 74,514 96,455
188,706 898,897 864,375
(D) 739
8,807,619 7,554,819
4,199 (D)
35,819 1,069,050
534,664
232,022 (D) (D)
69,420 205,116
268
190,370 135,201 81,375 44,600
801,423
5,465 187,938
- (D)
(D)
73,317 102,616 316,533 315,751
12,532
2,370,253 44,895
- 9,981
99,364
926 11,278 29,582
1,162
75,415 89,052
462 -
20,752
64,951 7,149
1,340,015 40,857
-
(D) 55,281
- 51,736 38,677
(D) 49,102
309,689 106,349 52,801
(D)
291,392 1,736,443
28,088 2,888,103
1,268,202
987,676 93,852
(D) 39,319
119,432 295,823 538,064
(D) 268
1,451,728 1,002,757
9,464 -
12,243 290,271 149,786
89,748
(D)(D)
19,935 50,407
(D)
87,903 (D)(D)(D)
12,290
2,561 31,976
612 3,203
(D)
29,436 7,088
12,743 12,802
114,125 47,830 71,288
(D)3,693
7,785 1,530
24,520 8,739 1,918
(D)
132,549 1,782
- 5,194
3,098 2,566
39,930 14,629
-
(D)45,133
(D)6,322
64,892
3,970 15,782
109,927 37,455
8,930
(D)22,729
293,208 3,708
230,803
68,877 40,930 17,190 61,513 12,243
71,609
300,783 148,366
- (D)
1,751,217 1,673,528
2,180 -
72,770 4,044
463,538
129,486 -
(D) 7,493
120
(D) 172,059
(D) (D) (D)
8,802
180 4,430
- (D)
855
1,458 1,789
(D) 1,000
141,503 172,871 13,769
- -
7,090 484 (D)
20,259 1,940
10,288
115,850 - - -
18,926 -
102,513 44,020
-
2,656 115,273
- 698
107,202
855 2,816
11,393 2,082 2,598
-
2,998 5,440 2,889
525,621
28,860 87,342 40,681
(D) 74,470
49,314
395,085 476,351
- (D)
10,307,238 9,880,712
3,033 (D)
139,001 1,899,016 1,322,343
330,822
(D) 21,577 89,028
180,561
185 286,478 69,012 42,692 21,986
984,994
2,542 185,221
- 6,521
(D)
40,793 59,223
294,676 252,339
12,166
1,700,151 122,275
- 6,859
208,456
1,127 3,991
21,636 387
75,662
141,859 669
- 15,639
24,463
3,382 1,392,617
122,245 -
(D) 108,915
- 43,518 68,870
(D) 36,828
291,342 64,910 27,119
(D)
161,840 2,435,886
20,517 2,209,275
1,649,998
958,358 203,894
(D) 141,972
269,645 502,225
1,330,123 (D)
185
2,206,756 1,683,805
4,983 -
71,393 593,215 183,029
120,349
(D) 3,664
27,512 41,004
(D)
137,311 1,163 7,195
749
13,221 841
34,790 (D)
2,312
6,543 15,801
1,838 10,751
5,466
172,443 31,096
114,262 (D)
2,067
12,903 660
11,148 10,567
786
5,694 247,350
597 -
3,703
1,982 1,930
62,568 42,559
-
3,031 95,464
(D) 11,313 90,372
6,873 11,593 88,290 20,574
4,346
2,604 16,644
549,046 (D)
256,318
140,395 62,768 26,903
108,407 71,393
141,529 528,489 168,484
- (D)
3,757,191 4,076,996
677 -
341,691 4,776
1,178,053
201,338 -
(D)9,645
48
1,256 385,396
(D)(D)(D)
8,203
36 5,215
- (D)
182 (D)
1,497 (D)
500
215,370 167,919 24,812
- -
13,098 295 (D)
31,825 1,144
11,209
251,746 - - -
16,074 -
275,660 90,621
-
1,537 261,752
- 216
251,148
182 1,709
11,198 581
1,335
- 2,516 7,105 1,772
734,385
39,527 228,394 94,624
111,891 342,541
95,649
880,853 1,201,676
- 1,256
See footnote(s) at end of table. --continued
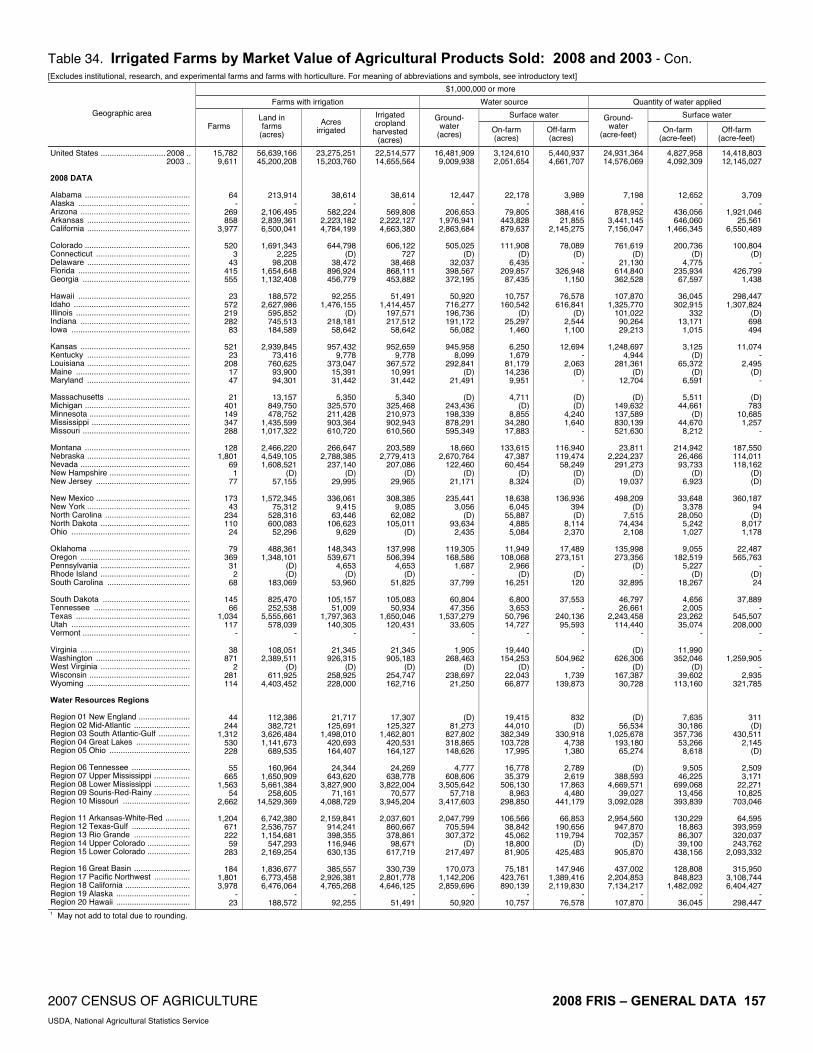
2007 CENSUS OF AGRICULTURE 2008 FRIS – GENERAL DATA 157 USDA, National Agricultural Statistics Service
Table 34. Irrigated Farms by Market Value of Agricultural Products Sold: 2008 and 2003 - Con. [Excludes institutional, research, and experimental farms and farms with horticulture. For meaning of abbreviations and symbols, see introductory text]
$1,000,000 or more
Farms with irrigation Water source Quantity of water applied
Surface water Surface water Geographic area
Farms Land in farms
(acres)
Acres irrigated
Irrigated cropland
harvested (acres)
Ground- water
(acres) On-farm (acres)
Off-farm (acres)
Ground- water
(acre-feet) On-farm
(acre-feet) Off-farm
(acre-feet)
United States ............................. 2008 .. 2003 .. 2008 DATA Alabama ............................................... Alaska .................................................. Arizona ................................................. Arkansas .............................................. California .............................................. Colorado ............................................... Connecticut .......................................... Delaware .............................................. Florida .................................................. Georgia ................................................ Hawaii .................................................. Idaho .................................................... Illinois ................................................... Indiana ................................................. Iowa ..................................................... Kansas ................................................. Kentucky .............................................. Louisiana .............................................. Maine ................................................... Maryland .............................................. Massachusetts ..................................... Michigan ............................................... Minnesota ............................................. Mississippi ............................................ Missouri ................................................ Montana ............................................... Nebraska .............................................. Nevada ................................................. New Hampshire .................................... New Jersey .......................................... New Mexico .......................................... New York .............................................. North Carolina ...................................... North Dakota ........................................ Ohio ..................................................... Oklahoma ............................................. Oregon ................................................. Pennsylvania ........................................ Rhode Island ........................................ South Carolina ..................................... South Dakota ....................................... Tennessee ........................................... Texas ................................................... Utah ..................................................... Vermont ................................................ Virginia ................................................. Washington .......................................... West Virginia ........................................ Wisconsin ............................................. Wyoming .............................................. Water Resources Regions Region 01 New England ....................... Region 02 Mid-Atlantic ......................... Region 03 South Atlantic-Gulf .............. Region 04 Great Lakes ........................ Region 05 Ohio .................................... Region 06 Tennessee .......................... Region 07 Upper Mississippi ................ Region 08 Lower Mississippi ................ Region 09 Souris-Red-Rainy ................ Region 10 Missouri .............................. Region 11 Arkansas-White-Red ........... Region 12 Texas-Gulf .......................... Region 13 Rio Grande ......................... Region 14 Upper Colorado ................... Region 15 Lower Colorado ................... Region 16 Great Basin ......................... Region 17 Pacific Northwest ................ Region 18 California ............................. Region 19 Alaska ................................. Region 20 Hawaii .................................
15,782 9,611
64 -
269 858
3,977
520 3
43 415 555
23
572 219 282
83
521 23
208 17 47
21
401 149 347 288
128
1,801 69
1 77
173
43 234 110
24
79 369
31 2
68
145 66
1,034 117
-
38 871
2 281 114
44 244
1,312 530 228
55
665 1,563
54 2,662
1,204
671 222
59 283
184
1,801 3,978
- 23
56,639,166 45,200,208
213,914 -
2,106,495 2,839,361 6,500,041
1,691,343
2,225 98,208
1,654,648 1,132,408
188,572
2,627,986 595,852 745,513 184,589
2,939,845
73,416 760,625 93,900 94,301
13,157
849,750 478,752
1,435,599 1,017,322
2,466,220 4,549,105 1,608,521
(D) 57,155
1,572,345
75,312 528,316 600,083 52,296
488,361
1,348,101 (D) (D)
183,069
825,470 252,538
5,555,661 578,039
-
108,051 2,389,511
(D) 611,925
4,403,452
112,386 382,721
3,626,484 1,141,673
689,535
160,964 1,650,909 5,661,384
258,605 14,529,369
6,742,380 2,536,757 1,154,681
547,293 2,169,254
1,836,677 6,773,458 6,476,064
- 188,572
23,275,251 15,203,760
38,614 -
582,224 2,223,182 4,784,199
644,798
(D)38,472
896,924 456,779
92,255
1,476,155 (D)
218,181 58,642
957,432
9,778 373,047 15,391 31,442
5,350
325,570 211,428 903,364 610,720
266,647
2,788,385 237,140
(D)29,995
336,061
9,415 63,446
106,623 9,629
148,343 539,671
4,653 (D)
53,960
105,157 51,009
1,797,363 140,305
-
21,345 926,315
(D)258,925 228,000
21,717 125,691
1,498,010 420,693 164,407
24,344
643,620 3,827,900
71,161 4,088,729
2,159,841
914,241 398,355 116,946 630,135
385,557
2,926,381 4,765,268
- 92,255
22,514,577 14,655,564
38,614 -
569,808 2,222,127 4,663,380
606,122
727 38,468
868,111 453,882
51,491
1,414,457 197,571 217,512 58,642
952,659
9,778 367,572 10,991 31,442
5,340
325,468 210,973 902,943 610,560
203,589
2,779,413 207,086
(D) 29,965
308,385
9,085 62,082
105,011 (D)
137,998 506,394
4,653 (D)
51,825
105,083 50,934
1,650,046 120,431
-
21,345 905,183
(D) 254,747 162,716
17,307 125,327
1,462,801 420,531 164,127
24,269
638,778 3,822,004
70,577 3,945,204
2,037,601
860,667 378,861 98,671
617,719
330,739 2,801,778 4,646,125
- 51,491
16,481,909 9,009,938
12,447 -
206,653 1,976,941 2,863,684
505,025
(D) 32,037
398,567 372,195
50,920
716,277 196,736 191,172 56,082
945,958
8,099 292,841
(D) 21,491
(D)
243,436 198,339 878,291 595,349
18,660
2,670,764 122,460
(D) 21,171
235,441
3,056 (D)
93,634 2,435
119,305 168,586
1,687 -
37,799
60,804 47,356
1,537,279 33,605
-
1,905 268,463
(D) 238,697 21,250
(D) 81,273
827,802 318,865 148,626
4,777
608,606 3,505,642
57,718 3,417,603
2,047,799
705,594 307,372
(D) 217,497
170,073
1,142,206 2,859,696
- 50,920
3,124,610 2,051,654
22,178 -
79,805 443,828 879,637
111,908
(D)6,435
209,857 87,435
10,757
160,542 (D)
25,297 1,460
6,250 1,679
81,179 14,236
9,951
4,711 (D)
8,855 34,280 17,883
133,615 47,387 60,454
(D)8,324
18,638
6,045 55,887
4,885 5,084
11,949
108,068 2,966
(D)16,251
6,800 3,653
50,796 14,727
-
19,440 154,253
(D)22,043 66,877
19,415 44,010
382,349 103,728 17,995
16,778 35,379
506,130 8,963
298,850
106,566 38,842 45,062 18,800 81,905
75,181
423,761 890,139
- 10,757
5,440,937 4,661,707
3,989 -
388,416 21,855
2,145,275
78,089 (D)
- 326,948
1,150
76,578 616,841
(D) 2,544 1,100
12,694
- 2,063
(D) -
(D) (D)
4,240 1,640
-
116,940 119,474 58,249
(D) (D)
136,936
394 (D)
8,114 2,370
17,489
273,151 -
(D) 120
37,553
- 240,136 95,593
-
- 504,962
- 1,739
139,873
832 (D)
330,918 4,738 1,380
2,789 2,619
17,863 4,480
441,179
66,853 190,656 119,794
(D) 425,483
147,946
1,389,416 2,119,830
- 76,578
24,931,364 14,576,069
7,198 -
878,952 3,441,145 7,156,047
761,619
(D) 21,130
614,840 362,528
107,870
1,325,770 101,022 90,264 29,213
1,248,697
4,944 281,361
(D) 12,704
(D)
149,632 137,589 830,139 521,630
23,811
2,224,237 291,273
(D) 19,037
498,209
(D) 7,515
74,434 2,108
135,998 273,356
(D) -
32,895
46,797 26,661
2,243,458 114,440
-
(D) 626,306
(D) 167,387 30,728
(D) 56,534
1,025,678 193,180 65,274
(D)
388,593 4,669,571
39,027 3,092,028
2,954,560
947,870 702,357
(D) 905,870
437,002
2,204,853 7,134,217
- 107,870
4,827,958 4,092,309
12,652 -
436,056 646,060
1,466,345
200,736 (D)
4,775 235,934 67,597
36,045
302,915 332
13,171 1,015
3,125
(D) 65,372
(D) 6,591
5,511
44,661 (D)
44,670 8,212
214,942 26,466 93,733
(D) 6,923
33,648
3,378 28,050
5,242 1,027
9,055
182,519 5,227
(D) 18,267
4,656 2,005
23,262 35,074
-
11,990 352,046
(D) 39,602
113,160
7,635 30,186
357,736 53,266
8,618
9,505 46,225
699,068 13,456
393,839
130,229 18,863 86,307 39,100
438,156
128,808 848,823
1,482,092 -
36,045
14,418,803 12,145,027
3,709 -
1,921,046 25,561
6,550,489
100,804 (D)
- 426,799
1,438
298,447 1,307,824
(D)698 494
11,074
- 2,495
(D)-
(D)783
10,685 1,257
-
187,550 114,011 118,162
(D)(D)
360,187
94 (D)
8,017 1,178
22,487
565,763 -
(D)24
37,889
- 545,507 208,000
-
- 1,259,905
- 2,935
321,785
311 (D)
430,511 2,145
(D)
2,509 3,171
22,271 10,825
703,046
64,595 393,959 320,037 243,762
2,093,332
315,950 3,108,744 6,404,427
- 298,447
1 May not add to total due to rounding.

158 2008 FRIS – GENERAL DATA 2007 CENSUS OF AGRICULTURE USDA, National Agricultural Statistics Service
Table 35. Irrigated Farms by Percent of Total Sales from Irrigated Crops and Livestock: 2008 and 2003 [Excludes institutional, research, and experimental farms and farms with horticulture. For meaning of abbreviations and symbols, see introductory text]
Farms by percent of total sales from -
Irrigated crop Non-irrigated crop or livestock Geographic area
None 1 to 24 percent
25 to 49 percent
50 to 74 percent
75 to 99 percent
100 percent None 1 to 49
percent 50 to 99 percent
100 percent
United States .............................2008 .. 2003 .. 2008 DATA Alabama ............................................... Alaska ................................................... Arizona ................................................. Arkansas ............................................... California .............................................. Colorado ............................................... Connecticut ........................................... Delaware .............................................. Florida ................................................... Georgia ................................................. Hawaii ................................................... Idaho ..................................................... Illinois .................................................... Indiana .................................................. Iowa ...................................................... Kansas .................................................. Kentucky ............................................... Louisiana .............................................. Maine .................................................... Maryland ............................................... Massachusetts ...................................... Michigan ............................................... Minnesota ............................................. Mississippi ............................................ Missouri ................................................ Montana ................................................ Nebraska .............................................. Nevada ................................................. New Hampshire .................................... New Jersey ........................................... New Mexico .......................................... New York .............................................. North Carolina ...................................... North Dakota ........................................ Ohio ...................................................... Oklahoma ............................................. Oregon .................................................. Pennsylvania ........................................ Rhode Island ........................................ South Carolina ...................................... South Dakota ........................................ Tennessee ............................................ Texas .................................................... Utah ...................................................... Vermont ................................................ Virginia .................................................. Washington ........................................... West Virginia ........................................ Wisconsin ............................................. Wyoming ............................................... Water Resources Regions Region 01 New England ....................... Region 02 Mid-Atlantic .......................... Region 03 South Atlantic-Gulf .............. Region 04 Great Lakes ......................... Region 05 Ohio ..................................... Region 06 Tennessee ........................... Region 07 Upper Mississippi ................ Region 08 Lower Mississippi ................ Region 09 Souris-Red-Rainy ................ Region 10 Missouri ............................... Region 11 Arkansas-White-Red ........... Region 12 Texas-Gulf ........................... Region 13 Rio Grande .......................... Region 14 Upper Colorado ................... Region 15 Lower Colorado ................... Region 16 Great Basin ......................... Region 17 Pacific Northwest ................. Region 18 California ............................. Region 19 Alaska ................................. Region 20 Hawaii .................................
9,345 17,018
8 1
788 19
1,335
584 - -
63 51
4
1,545 -
13 -
- 14
2 3 5
37 86
- - 9
4
734 140
- 41
508
- 90
- -
36 1,754
3 4 3
-
15 27
437 -
- 700
- 13
269
44 49
215 112
23
6 -
21 -
1,301
111 25
435 369 769
525
3,978 1,357
1 4
13,780 19,309
109 -
96 176 213
1,178
17 20
278 363
15
366 232 263 186
872 125 142
4 116
14
391 340
69 259
816
1,083 79
9 56
276 117 480 244
82
177 1,093
313 11 75
266 119
1,110 531
6
97 215
2 206 473
57 568
1,299 598 447
89
858 487 116
3,341
812 1,008
266 966 169
385
2,085 214
- 15
11,141 14,535
107 1 2
205 616
379
11 75
178 319
38
254 258 275 113
819 113 130
41 104
14
300 230 152 195
588
1,798 72 12 24
97 29
168 98 67
209 594 192
8 66
228
49 424 364
-
37 878
9 148
53
86 430 830 457 349
48
650 596
92 3,259
955 244
70 250
10
488 1,664
624 1
38
15,611 16,944
72 1
126 261 506
1,034
49 67
626 707
84
1,336 214 211
86
783 175 255
10 120
14
286 237 216 360
350
2,840 53 13 73
327
35 106
49 56
170 527 200
5 98
165
58 1,309
315 27
118 245
20 182 434
110 547
1,629 475 357
41
619 901
44 4,461
1,413
997 321 389 212
330
2,154 526
1 84
37,903 37,260
88 3
261 1,278 3,210
2,807
26 89
273 921
90
1,792 226 202
74
1,391 172 364
66 142
42
426 319 458 552
2,166 5,874
265 14 85
1,521
142 297
55 69
359
1,946 65
9 127
261 135
3,039 2,529
9
41 2,106
11 248
1,258
157 442
1,711 682 353
137 770
2,293 58
9,643
3,424 2,014 1,040 2,898
408
1,888 6,172 3,720
3 90
119,054 105,040
281 17
1,724 2,180
39,256
6,796 44 58
3,832 1,223
846
8,541 161 125
68
643 223 799
72 110
556 632 420 382 502
4,583 2,483 1,125
38 329
6,149
273 834 155 105
503
6,242 317
24 343
245 206
6,764 6,700
24
364 8,568
48 464
2,677
734 1,164 6,744
828 527
206 966
3,043 90
10,722
3,621 5,936 5,899 5,899 1,983
6,541
23,964 39,324
17 846
119,054 (NA)
281 17
1,724 2,180
39,256
6,796 44 58
3,832 1,223
846
8,541 161 125
68
643 223 799
72 110
556 632 420 382 502
4,583 2,483 1,125
38 329
6,149
273 834 155 105
503
6,242 317
24 343
245 206
6,764 6,700
24
364 8,568
48 464
2,677
734 1,164 6,744
828 527
206 966
3,043 90
10,722
3,621 5,936 5,899 5,899 1,983
6,541
23,964 39,324
17 846
46,220 (NA)
122 4
265 1,471 3,653
3,057
41 128 338
1,476
125 2,625
342 326 127
1,949
273 540
74 235
49
545 494 636 769
2,296 7,697
299 26
124
1,601 166 338
83 101
460
2,018 166
9 154
359 178
3,724 2,620
12
73 2,303
23 376
1,350
199 720
2,446 918 574
156
1,195 2,957
82 12,144
4,185 2,523 1,119 2,967
412
1,998 7,330 4,166
4 125
32,215 (NA)
254 1
220 449 892
2,341
62 123
1,017 834
102
1,123 588 625 332
1,916
312 351
47 247
35
858 632 259 597
1,624 3,898
170 22
114
620 157 713 363 173
455
2,142 604
24 212
561 183
2,158 1,119
30
220 1,141
19 408 868
211 1,267 3,023 1,294
932
159 1,702 1,320
228 8,560
2,419 1,740
578 1,536
387
1,093 4,745
918 1
102
9,345 (NA)
8 1
788 19
1,335
584 - -
63 51
4
1,545 -
13 -
- 14
2 3 5
37 86
- - 9
4
734 140
- 41
508
- 90
- -
36 1,754
3 4 3
-
15 27
437 -
- 700
- 13
269
44 49
215 112
23
6 -
21 -
1,301
111 25
435 369 769
525
3,978 1,357
1 4

2007 CENSUS OF AGRICULTURE 2008 FRIS – GENERAL DATA 159 USDA, National Agricultural Statistics Service
Table 36. Methods Used in Deciding When to Irrigate: 2008 and 2003 [Excludes institutional, research, and experimental farms and farms with horticulture. For meaning of abbreviations and symbols, see introductory text]
Farms reporting method used 1
Geographic area All farms Any
method Condition
of crop Feel of
soil
Soil moisture sensing device
Plant moisture sensing device
Commercial or
government scheduling
service
Reports on daily
crop-water evapo-
transpiration (ET)
Scheduled by water delivery
organization
Personal calendar schedule
Computer simulation
models
When neighborsbegin to irrigate
Other
United States .................... 2008 .. 2003 .. 2008 DATA Alabama ...................................... Alaska ......................................... Arizona ........................................ Arkansas ..................................... California ..................................... Colorado ...................................... Connecticut ................................. Delaware ..................................... Florida ......................................... Georgia ....................................... Hawaii ......................................... Idaho ........................................... Illinois .......................................... Indiana ........................................ Iowa ............................................ Kansas ........................................ Kentucky ..................................... Louisiana ..................................... Maine .......................................... Maryland ..................................... Massachusetts ............................ Michigan ...................................... Minnesota .................................... Mississippi ................................... Missouri ....................................... Montana ...................................... Nebraska ..................................... Nevada ........................................ New Hampshire ........................... New Jersey ................................. New Mexico ................................. New York ..................................... North Carolina ............................. North Dakota ............................... Ohio ............................................ Oklahoma .................................... Oregon ........................................ Pennsylvania ............................... Rhode Island ............................... South Carolina ............................ South Dakota .............................. Tennessee .................................. Texas .......................................... Utah ............................................ Vermont ....................................... Virginia ........................................ Washington ................................. West Virginia ............................... Wisconsin .................................... Wyoming ..................................... Water Resources Regions Region 01 New England .............. Region 02 Mid-Atlantic ................ Region 03 South Atlantic-Gulf ..... Region 04 Great Lakes ............... Region 05 Ohio ........................... Region 06 Tennessee ................. Region 07 Upper Mississippi ....... Region 08 Lower Mississippi ....... Region 09 Souris-Red-Rainy ....... Region 10 Missouri ..................... Region 11 Arkansas-White-Red .. Region 12 Texas-Gulf ................. Region 13 Rio Grande ................ Region 14 Upper Colorado .......... Region 15 Lower Colorado .......... Region 16 Great Basin ................ Region 17 Pacific Northwest ....... Region 18 California .................... Region 19 Alaska ........................ Region 20 Hawaii ........................
206,834 210,106
665 23
2,997 4,119
45,136
12,778 147 309
5,250 3,584
1,077
13,834 1,091 1,089
527
4,508 822
1,692 196 597
677
2,121 1,546 1,277 1,877
8,507
14,812 1,734
86 608
8,878
596 1,975
601 379
1,454
12,156 1,090
61 712
1,165
582 12,673 10,876
66
657 12,712
90 1,261 5,164
1,188 3,200
12,428 3,152 2,056
527
3,863 7,341
400 32,727
10,336 10,224
8,031 10,771
3,551
10,157 40,017 45,765
23 1,077
160,636 166,858
563 20
2,023 3,863
29,829
9,574 119 263
4,551 3,099
926
10,779 994 981 487
3,959
740 1,544
191 562
556
1,881 1,384 1,117 1,763
6,982
13,207 1,280
72 536
6,577
533 1,790
471 334
1,247 8,588 1,043
60 681
992 483
11,325 7,249
57
518 9,568
73 1,139 4,063
1,019 2,857
10,951 2,768 1,868
422
3,485 6,779
316 28,626
8,176 9,096 5,993 7,843 2,348
7,131
30,027 29,985
20 926
88,080 73,154
244 21
901 1,632
20,432
4,923 73
149 2,077 1,436
454
5,056 610 533 270
1,888
395 450 146 301
518
1,114 930 565 863
3,449 8,920
562 65
344
3,231 358 891 358 180
579
4,331 553
39 314
620 304
5,003 2,372
60
281 6,746
34 835
1,670
862 1,576 5,143 1,717 1,022
219
2,285 2,854
222 16,573
3,464 4,406 2,689 3,993
914
2,316 16,758 20,592
21 454
17,874 14,233
57 3
68 273
6,400
335 1
78 552 382
25
680 108 101
32
558 70 53 53 95
136 164 135 108
74
198 2,109
16 8
114
206 61 71 61 44
114
1,158 88 13 81
96 22
653 232
1
82 1,714
2 153
36
211 434
1,209 275 209
13
379 434
42 2,951
807 437
89 45
135
226 3,544 6,406
3 25
3,553 3,078
8 2 7
103 1,419
39
1 7
23 146
2
323 1
12 3
121
- 29 28
1
5 29 16
1 34
46
323 9 - 6
8 2
42 7 -
4 250
3 - 5
3 3
98 157
-
9 193
- 23
2
34 28
224 38
5
1 41
157 2
456
117 64 19
5 8
170 762
1,418 2 2
16,625 13,461
23 -
110 269
4,367
1,236 -
41 246 132
31
744 22 27
8
1,116 18 49
3 11
47 88
126 32
132
409 2,962
37 3
24
410 5
75 53
2
46 1,137
26 -
11
20 10
426 941
-
61 557
- 78
454
53 149 501 132
22
8 213 395
43 4,650
1,301
250 277 556 121
852
2,533 4,538
- 31
18,862 15,177
25 1
54 305
5,566
862 -
23 247 247
23
723 88 90 61
660
32 61
4 12
63
273 315 228 120
193
4,413 27
1 36
31 23 79
111 9
73
951 36
2 26
73 36
1,149 188
-
10 991
- 217 104
70 127 688 390
89
16 550 547 107
5,558
916 884 228 101
64
215 2,708 5,580
1 23
24,322 26,200
7 -
523 20
4,727
3,518 - 1
53 9
21
2,481 21
6 7
118
- 18
2 -
- 2
24 2
14
1,452 901 441
- 6
2,184
32 16 26
-
17 2,005
- - -
50 3
78 3,706
-
- 960
- 2
869
2 39 85
5 9
1
26 56 17
3,929
1,067 69
1,793 2,660
680
3,380 5,341 5,142
- 21
51,986 40,644
135 7
1,279 853
14,427
3,334 21 59
898 540
228
4,171 163 187
93
495 134 372
13 83
171 602 205 186 257
2,450 1,717
398 12 93
3,099
64 313 142
75
261 4,208
159 10
144
137 128
2,125 1,942
6
53 4,126
16 168
1,227
227 422
2,007 748 378
131 549
1,549 58
5,945
973 1,499 3,103 3,300 1,341
2,015
13,030 14,476
7 228
2,859 1,201
9 3 4
41 1,225
42
- 1
38 104
17
297 1
12 7
101
1 8 1 5
2
20 5 5
19
34 170
13 - 8
21
2 -
11 -
5 169
1 - 1
7 7
38 139
-
1 243
- 21
-
3 18
152 37
4
- 23 76
8 284
83 23 38
- 16
140 709
1,225 3
17
14,213 14,048
24 3
124 196
2,767
1,493 11 19
300 205
-
797 100 105
70
232 70 33
1 21
27 86
119 52 81
1,023 1,370
225 -
19
739 12 27 55 12
20
975 27
- 17
105
20 470 473
4
7 866
- 54
757
39 105 572 142 115
13
308 329
25 3,792
406 422 225
1,309 125
669
2,695 2,919
3 -
18,033 18,802
79 3
186 369
2,474
1,018 15 24
588 369
194
1,823 89 70 38
664
65 107
7 36
99
151 104
72 81
929
1,296 216
3 49
1,242
59 290
40 36
155
1,332 106
- 51
96 39
1,133 468
16
13 1,124
5 84
526
128 150
1,390 243 228
41
270 486
24 3,033
1,120
875 819
1,296 244
518
4,485 2,486
3 194
1 Respondents could choose more than one method.

160 2008 FRIS – GENERAL DATA 2007 CENSUS OF AGRICULTURE USDA, National Agricultural Statistics Service
Table 37. Water Management Practices Used by Operators with Gravity Systems: 2008 and 2003 [Excludes institutional, research, and experimental farms and farms with horticulture. For meaning of abbreviations and symbols, see introductory text]
Conservation technique used 1
Tailwater pits Restricting run-off by diking end of field Geographic area All
farms Acres
irrigated Farms Acres irrigated
Farms Acres irrigated Farms Acres
irrigated
United States .............................2008 .. 2003 .. 2008 DATA Alabama ............................................... Alaska ................................................... Arizona ................................................. Arkansas ............................................... California .............................................. Colorado ............................................... Connecticut ........................................... Delaware .............................................. Florida ................................................... Georgia ................................................. Hawaii ................................................... Idaho ..................................................... Illinois .................................................... Indiana .................................................. Iowa ...................................................... Kansas .................................................. Kentucky ............................................... Louisiana .............................................. Maine .................................................... Maryland ............................................... Massachusetts ...................................... Michigan ............................................... Minnesota ............................................. Mississippi ............................................ Missouri ................................................ Montana ................................................ Nebraska .............................................. Nevada ................................................. New Hampshire .................................... New Jersey ........................................... New Mexico .......................................... New York .............................................. North Carolina ...................................... North Dakota ........................................ Ohio ...................................................... Oklahoma ............................................. Oregon .................................................. Pennsylvania ........................................ Rhode Island ........................................ South Carolina ...................................... South Dakota ........................................ Tennessee ............................................ Texas .................................................... Utah ...................................................... Vermont ................................................ Virginia .................................................. Washington ........................................... West Virginia ........................................ Wisconsin ............................................. Wyoming ............................................... Water Resources Regions Region 01 New England ....................... Region 02 Mid-Atlantic .......................... Region 03 South Atlantic-Gulf .............. Region 04 Great Lakes ......................... Region 05 Ohio ..................................... Region 06 Tennessee ........................... Region 07 Upper Mississippi ................ Region 08 Lower Mississippi ................ Region 09 Souris-Red-Rainy ................ Region 10 Missouri ............................... Region 11 Arkansas-White-Red ........... Region 12 Texas-Gulf ........................... Region 13 Rio Grande .......................... Region 14 Upper Colorado ................... Region 15 Lower Colorado ................... Region 16 Great Basin ......................... Region 17 Pacific Northwest ................. Region 18 California ............................. Region 19 Alaska ................................. Region 20 Hawaii .................................
89,646 100,626
91 1
2,064 3,714
15,530
10,252 - -
907 447
248
7,853 32 22 57
1,475
110 1,391
- 69
52 51 51
957 867
6,064 6,506 1,308
11 52
6,742
56 70
141 53
329
4,096 84
4 79
437
89 4,567 6,278
5
67 2,042
13 115
4,197
67 302
1,599 163 184
67
211 6,180
12 18,564
4,775 3,377 6,429 7,854 2,613
6,254
14,700 16,046
1 248
22,017,757 23,106,280
2,542 (D)
764,655 3,747,542 4,189,852
1,547,072
- -
473,527 52,599
3,635
797,221 3,602 6,779 4,744
184,624
2,564 823,257
- 236
648
1,124 19,487
1,070,945 755,671
1,102,878 1,669,351
459,182 54
3,069
460,112 926
2,710 51,001
899
67,707 668,883
384 4
3,995
66,857 4,550
1,032,043 605,133
15
1,076 199,917
(D)7,683
1,156,819
706 5,650
536,569 5,158 7,857
(D)
31,229 5,799,090
14,163 4,117,142
1,232,853
820,850 660,575
1,036,243 826,066
932,543
1,767,379 4,219,623
(D)3,635
45,458 52,910
7 1
1,167 1,681 8,467
4,765
- -
117 61
115
4,328 4 -
13
984 28
552 - -
- 51 16
425 398
2,650 5,261
722 -
20
3,985 30
- 99 11
114
1,554 22
- 2
227
24 1,741 3,003
-
41 1,059
1 29
1,683
- 114 188
73 30
12 40
2,723 5
11,419
2,163 1,247 3,768 2,874 1,503
3,174 7,232 8,777
1 115
12,863,645 12,905,822
1,426 (D)
621,190 2,005,017 2,857,809
737,779
- -
389,759 5,703
772
462,961 1,272
- 1,620
126,233
657 357,726
- -
- 1,124
12,851 522,108 347,142
528,289
1,411,198 243,603
- 326
190,167
120 -
37,349 200
26,729
319,293 66
- (D)
30,935
1,939 564,560 275,610
-
123 139,151
(D)2,133
638,493
- 637
397,128 1,369
677
(D)8,604
2,939,033 9,851
2,807,066
611,124 432,329 314,384 377,922 662,762
486,443 953,040
2,860,304 (D)
772
7,619 7,074
- -
147 716
1,901
821 - -
13 -
- 409
2 - -
128 2 7 - -
- 24
- 50
1
117 1,644
76 - 2
408
- - 2 2
7
252 - - -
- -
414 305
-
- 101
- -
68
- 2
13 24
4
- 2
708 -
2,338
403 188 180 602 169
342 731
1,913 - -
1,561,839 1,502,671
- -
59,545 316,665 637,908
88,267
- -
14,958 -
- 32,492
(D) - -
23,658 (D)
1,790 - -
- 840
- 12,986
(D)
18,612 117,685
5,204 -
(D)
14,993 - -
(D) (D)
1,279
61,356 - - -
- -
77,513 36,704
-
- 5,021
- -
32,893
- (D)
14,958 840
40
- (D)
311,981 -
194,657
75,943 46,448 19,863 60,548 59,875
45,689 90,409
639,708 - -
13,237 15,563
- -
397 540
3,806
1,174 - -
55 57
26
439 2 - 9
474
9 133
- -
- 24 12
136 46
588
1,790 223
- 6
904
- -
16 9
47 63
- - -
38 9
587 1,157
-
- 212
- 8
241
- 6
112 33
9
4 22
737 1
3,438
611 424
1,026 349 468
1,309
842 3,820
- 26
2,719,793 2,636,369
--
155,510 250,399 989,253
77,674 --
23,184 1,707
128 80,488
(D)-
715
51,283 (D)
85,554 --
-840
6,711 103,163 16,112
52,211 323,574 31,548
-256
47,153 --
1,765 18
8,683 39,481
---
3,102 286
238,631 55,367
-
-13,967
-1,548
58,615
-256
24,891 (D)17
26 5,478
422,721 (D)
462,897
103,972 191,475 103,890 31,320
184,685
85,999 129,711 967,758
-128
See footnote(s) at end of table. --continued

2007 CENSUS OF AGRICULTURE 2008 FRIS – GENERAL DATA 161 USDA, National Agricultural Statistics Service
Table 37. Water Management Practices Used by Operators with Gravity Systems: 2008 and 2003 - Con. [Excludes institutional, research, and experimental farms and farms with horticulture. For meaning of abbreviations and symbols, see introductory text]
Conservation technique used 1 - con.
Surge flow or cablegation
Shortening of furrow length
Reducing set time or number of irrigations
Alternate row irrigation Geographic area
Farms Acres irrigated Farms Acres
irrigated Farms Acres irrigated Farms Acres
irrigated
United States ............................. 2008 .. 2003 .. 2008 DATA Alabama ............................................... Alaska .................................................. Arizona ................................................. Arkansas .............................................. California .............................................. Colorado ............................................... Connecticut .......................................... Delaware .............................................. Florida .................................................. Georgia ................................................ Hawaii .................................................. Idaho .................................................... Illinois ................................................... Indiana ................................................. Iowa ..................................................... Kansas ................................................. Kentucky .............................................. Louisiana .............................................. Maine ................................................... Maryland .............................................. Massachusetts ..................................... Michigan ............................................... Minnesota ............................................. Mississippi ............................................ Missouri ................................................ Montana ............................................... Nebraska .............................................. Nevada ................................................. New Hampshire .................................... New Jersey .......................................... New Mexico .......................................... New York .............................................. North Carolina ...................................... North Dakota ........................................ Ohio ..................................................... Oklahoma ............................................. Oregon ................................................. Pennsylvania ........................................ Rhode Island ........................................ South Carolina ..................................... South Dakota ....................................... Tennessee ........................................... Texas ................................................... Utah ..................................................... Vermont ................................................ Virginia ................................................. Washington .......................................... West Virginia ........................................ Wisconsin ............................................. Wyoming .............................................. Water Resources Regions Region 01 New England ....................... Region 02 Mid-Atlantic ......................... Region 03 South Atlantic-Gulf .............. Region 04 Great Lakes ........................ Region 05 Ohio .................................... Region 06 Tennessee .......................... Region 07 Upper Mississippi ................ Region 08 Lower Mississippi ................ Region 09 Souris-Red-Rainy ................ Region 10 Missouri .............................. Region 11 Arkansas-White-Red ........... Region 12 Texas-Gulf .......................... Region 13 Rio Grande ......................... Region 14 Upper Colorado ................... Region 15 Lower Colorado ................... Region 16 Great Basin ......................... Region 17 Pacific Northwest ................ Region 18 California ............................. Region 19 Alaska ................................. Region 20 Hawaii .................................
2,784 1,796
- 1
10 29 48
57
- - - -
- 367
- - -
33 - 2 - -
- 24
- -
69
15 807
6 - -
341 - - 4 -
2 52
- - -
17 1
450 325
-
- 46
- 2
76
- - -
24 -
- 2
101 -
961
56 433 342 148
10
193 465
48 1 -
337,641 374,147
- (D)
9,724 10,066 28,455
9,214
- - - -
- 13,875
- - -
3,735 -
(D)- -
- 840
- -
28,967
1,605 159,001
390 - -
4,631 - -
470 -
(D)6,980
- - -
740 (D)
42,622 4,529
-
- 3,461
- (D)
5,856
- - -
840 -
- (D)
40,913 -
171,562
7,685 39,016
4,711 6,104 9,724
3,815
24,316 28,455
(D)-
1,921 1,682
- -
30 68
210
523 - - - -
11 44
- - -
120 - 7 - -
- 24
- 14 10
12
201 21
- -
165 - - - -
11 9 - - -
19 -
85 160
-
- 55
- -
122
- - -
24 -
- -
91 -
555
335 80 41
195 96
179 108 206
- 11
337,827 434,168
- -
27,125 48,376
141,362
15,173 - - - -
11 1,330
- - -
10,172 -
3,448 - -
- 840
- 7,320
654
2,080 25,108
951 - -
4,200 - - - -
2,105 1,891
- - -
418 -
25,796 3,590
-
- 3,687
- -
12,190
- - -
840 -
- -
58,558 -
47,447
21,531 25,696
1,410 1,538
29,165
4,161 6,908
140,562 -
11
14,089 20,851
4 -
469 121
2,139
1,602 - -
36 -
52 1,667
- - 5
365
2 119
- -
- 26
- 59 79
1,645 1,681
228 - -
631 - -
42 -
15 1,038
- - -
133 11
189 618
-
- 429
1 -
683
- 1
40 26
2
8 3
366 -
4,338
261 184 585
1,131 479
742
3,444 2,427
- 52
2,537,699 2,784,078
16 -
97,039 68,794
674,896
196,669 - -
9,729 -
128 118,478
- -
(D)
44,143 (D)
91,397 - -
- 860
- 64,430 39,122
199,294 352,115 44,154
- -
27,083 - -
9,111 -
6,497 85,682
- - -
16,450 188
37,493 53,884
-
- 47,742
(D) -
251,803
- (D)
9,745 860 (D)
8
1,100 253,997
- 846,328
68,603 37,393 47,470
118,291 114,119
84,372
276,824 678,359
- 128
11,103 11,826
- -
87 455
1,214
1,462 - -
27 -
11 1,324
- - 6
361
6 161
- -
- 24
- 184 256
98
2,888 4 - -
740 - -
17 -
52 53 22
- -
31 4
543 158
-
- 507
- -
408
- 22 28 24
6
- 3
984 -
4,073
825 394 420 994 173
109
1,823 1,214
- 11
2,224,802 2,572,135
--
46,096 375,795 232,873
91,235 --
4,094 -
11 87,013
--
440
45,725 30
104,665 --
-840
-137,318 171,991
13,037 636,779
1,840 --
16,528 --
5,394 -
11,768 16,807
66 --
4,120 380
122,682 8,732
-
-49,696
--
38,847
-66
4,124 840
30
-1,100
746,655 -
776,484
126,832 81,187 25,330 23,053 48,888
4,545 152,784 232,873
-11
See footnote(s) at end of table. --continued

162 2008 FRIS – GENERAL DATA 2007 CENSUS OF AGRICULTURE USDA, National Agricultural Statistics Service
Table 37. Water Management Practices Used by Operators with Gravity Systems: 2008 and 2003 - Con. [Excludes institutional, research, and experimental farms and farms with horticulture. For meaning of abbreviations and symbols, see introductory text]
Conservation technique used 1 - con.
Polyacrylamide (PAM) Mulch or other type of row covers Laser leveling Special furrowing Geographic area
Farms Acres irrigated Farms Acres
irrigated Farms Acres irrigated Farms Acres
irrigated
United States .............................2008 .. 2003 .. 2008 DATA Alabama ............................................... Alaska ................................................... Arizona ................................................. Arkansas ............................................... California .............................................. Colorado ............................................... Connecticut ........................................... Delaware .............................................. Florida ................................................... Georgia ................................................. Hawaii ................................................... Idaho ..................................................... Illinois .................................................... Indiana .................................................. Iowa ...................................................... Kansas .................................................. Kentucky ............................................... Louisiana .............................................. Maine .................................................... Maryland ............................................... Massachusetts ...................................... Michigan ............................................... Minnesota ............................................. Mississippi ............................................ Missouri ................................................ Montana ................................................ Nebraska .............................................. Nevada ................................................. New Hampshire .................................... New Jersey ........................................... New Mexico .......................................... New York .............................................. North Carolina ...................................... North Dakota ........................................ Ohio ...................................................... Oklahoma ............................................. Oregon .................................................. Pennsylvania ........................................ Rhode Island ........................................ South Carolina ...................................... South Dakota ........................................ Tennessee ............................................ Texas .................................................... Utah ...................................................... Vermont ................................................ Virginia .................................................. Washington ........................................... West Virginia ........................................ Wisconsin ............................................. Wyoming ............................................... Water Resources Regions Region 01 New England ....................... Region 02 Mid-Atlantic .......................... Region 03 South Atlantic-Gulf .............. Region 04 Great Lakes ......................... Region 05 Ohio ..................................... Region 06 Tennessee ........................... Region 07 Upper Mississippi ................ Region 08 Lower Mississippi ................ Region 09 Souris-Red-Rainy ................ Region 10 Missouri ............................... Region 11 Arkansas-White-Red ........... Region 12 Texas-Gulf ........................... Region 13 Rio Grande .......................... Region 14 Upper Colorado ................... Region 15 Lower Colorado ................... Region 16 Great Basin ......................... Region 17 Pacific Northwest ................. Region 18 California ............................. Region 19 Alaska ................................. Region 20 Hawaii .................................
2,169 1,817
- -
22 15
106
204 - - - -
- 946
- - -
- 7 - - -
- - - - 1
90 27 60
- -
62 - - - -
- 68
- - -
2 -
18 13
-
- 314
- -
214
- - - - 7
- -
15 -
490
32 13 62 21 22
73
1,328 106
- -
380,424 385,231
- -
21,095 6,750
59,874
33,546 - - - -
- 100,579
- - -
- 7 - - -
- - - -
(D)
9,340 12,000
538 - -
(D)- - - -
- 19,028
- - -
(D)-
17,315 1,820
-
- 62,789
- -
34,557
- - - - 7
- -
6,750 -
79,301
13,251 10,400
186 4,806
21,095
2,358 182,396 59,874
- -
1,811 1,920
- -
14 -
734
230 - -
14 4
26 65
- - -
37 13
5 - -
- 27
- 3 3
117
53 - -
14
15 30
- 8 -
2 128
22 - -
- 8
72 12
-
- 120
1 13 21
- 67 18 40 13
8 -
11 -
217
290 9
20 19 14
12
313 734
- 26
229,300 227,397
- -
7,487 -
98,079
9,384 - -
5,780 200
49
14,314 - - -
4,049 13
4,500 - -
- 284
- 1,050 3,156
15,596 21,890
- -
42
2,910 30
- 684
-
(D)8,976
66 - -
- 8
12,133 3,150
-
- 6,559
(D)65
8,300
- 140
5,980 349
13
8 -
8,706 -
48,090
8,613 3,370 8,425 6,992 7,487
3,150
29,849 98,079
- 49
11,590 13,176
1 -
579 868
3,696
258 - -
45 -
- 546
4 - 1
98
- 340
- -
- - 4
206 264
715 187 488
- 2
1,919
- -
50 -
13 57
- - -
36 4
321 824
-
41 8 - 8 7
- 43 46
- -
- 22
1,423 3
1,028
363 236
1,963 194 651
1,309
613 3,696
- -
3,985,596 3,711,987
(D) -
391,499 607,437
1,195,521
31,925 - -
319,191 -
- 68,433
1,272 -
(D)
9,866 -
172,760 - -
- -
7,068 212,215 233,052
127,747 77,048
105,206 -
(D)
109,243 - -
24,025 -
3,312 25,760
- - -
3,962 1,190
170,675 79,347
-
123 719
- 520
5,250
- 223
320,241 - -
- 6,056
1,044,957 5,068
243,392
210,405 130,965 152,493
1,391 414,339
184,193 95,923
1,175,950 - -
6,458 6,189
2 -
82 359
2,336
581 - -
15 -
14 440
- - -
197 -
19 - -
- - 1
28 36
497 104
10 - -
89 - -
21 -
40 74
- - 2
53
4 332 311
-
- 370
- -
441
- -
19 - -
- -
337 1
1,266
479 146 132 362 234
183 948
2,337 -
14
1,019,828 1,277,211
(D)-
20,925 179,698 219,135
77,288 --
7,511 -
206 15,269
---
16,050 -
16,661 --
--
(D)22,711 29,054
73,160 24,880
690 --
8,110 --
5,482 -
8,220 18,693
--
(D)
4,982 210
66,159 24,475
-
-27,736
--
151,501
--
(D)--
--
216,182 (D)
247,050
77,477 43,685 20,186 57,373 25,585
27,988 73,428
222,135 -
206
1 More than one technique can be used on an irrigated acre during the survey year.
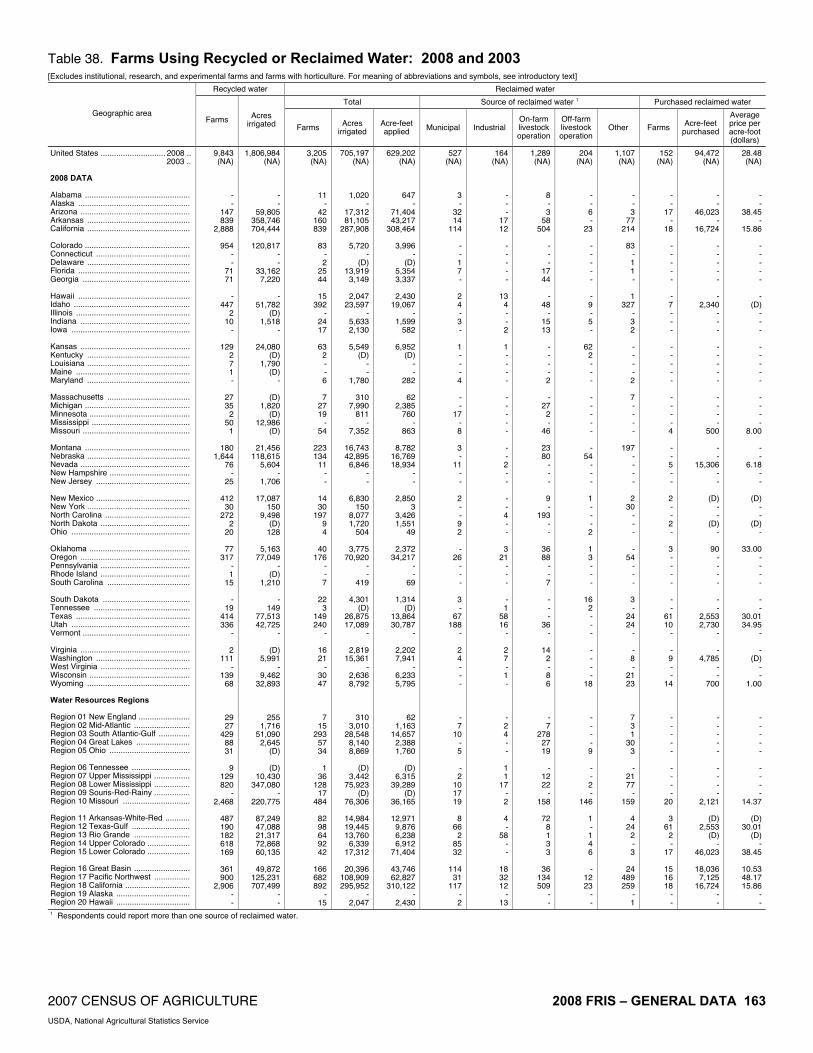
2007 CENSUS OF AGRICULTURE 2008 FRIS – GENERAL DATA 163 USDA, National Agricultural Statistics Service
Table 38. Farms Using Recycled or Reclaimed Water: 2008 and 2003 [Excludes institutional, research, and experimental farms and farms with horticulture. For meaning of abbreviations and symbols, see introductory text]
Recycled water Reclaimed water
Total Source of reclaimed water 1 Purchased reclaimed water Geographic area
Farms Acres irrigated Farms Acres
irrigated Acre-feet applied Municipal Industrial
On-farm livestock operation
Off-farm livestock operation
Other Farms Acre-feet purchased
Average price per acre-foot (dollars)
United States ............................. 2008 .. 2003 .. 2008 DATA Alabama ............................................... Alaska .................................................. Arizona ................................................. Arkansas .............................................. California .............................................. Colorado ............................................... Connecticut .......................................... Delaware .............................................. Florida .................................................. Georgia ................................................ Hawaii .................................................. Idaho .................................................... Illinois ................................................... Indiana ................................................. Iowa ..................................................... Kansas ................................................. Kentucky .............................................. Louisiana .............................................. Maine ................................................... Maryland .............................................. Massachusetts ..................................... Michigan ............................................... Minnesota ............................................. Mississippi ............................................ Missouri ................................................ Montana ............................................... Nebraska .............................................. Nevada ................................................. New Hampshire .................................... New Jersey .......................................... New Mexico .......................................... New York .............................................. North Carolina ...................................... North Dakota ........................................ Ohio ..................................................... Oklahoma ............................................. Oregon ................................................. Pennsylvania ........................................ Rhode Island ........................................ South Carolina ..................................... South Dakota ....................................... Tennessee ........................................... Texas ................................................... Utah ..................................................... Vermont ................................................ Virginia ................................................. Washington .......................................... West Virginia ........................................ Wisconsin ............................................. Wyoming .............................................. Water Resources Regions Region 01 New England ....................... Region 02 Mid-Atlantic ......................... Region 03 South Atlantic-Gulf .............. Region 04 Great Lakes ........................ Region 05 Ohio .................................... Region 06 Tennessee .......................... Region 07 Upper Mississippi ................ Region 08 Lower Mississippi ................ Region 09 Souris-Red-Rainy ................ Region 10 Missouri .............................. Region 11 Arkansas-White-Red ........... Region 12 Texas-Gulf .......................... Region 13 Rio Grande ......................... Region 14 Upper Colorado ................... Region 15 Lower Colorado ................... Region 16 Great Basin ......................... Region 17 Pacific Northwest ................ Region 18 California ............................. Region 19 Alaska ................................. Region 20 Hawaii .................................
9,843 (NA)
- -
147 839
2,888
954 - -
71 71
-
447 2
10 -
129 2 7 1 -
27 35
2 50
1
180 1,644
76 -
25
412 30
272 2
20
77 317
- 1
15
- 19
414 336
-
2 111
- 139
68
29 27
429 88 31
9
129 820
- 2,468
487 190 182 618 169
361 900
2,906 - -
1,806,984 (NA)
- -
59,805 358,746 704,444
120,817
- -
33,162 7,220
-
51,782 (D)
1,518 -
24,080 (D)
1,790 (D)
-
(D) 1,820
(D) 12,986
(D)
21,456 118,615
5,604 -
1,706
17,087 150
9,498 (D)
128
5,163 77,049
- (D)
1,210
- 149
77,513 42,725
-
(D) 5,991
- 9,462
32,893
255 1,716
51,090 2,645
(D)
(D) 10,430
347,080 -
220,775
87,249 47,088 21,317 72,868 60,135
49,872
125,231 707,499
- -
3,205 (NA)
11 -
42 160 839
83
- 2
25 44
15
392 -
24 17
63
2 - - 6
7
27 19
- 54
223 134
11 - -
14 30
197 9 4
40
176 - - 7
22
3 149 240
-
16 21
- 30 47
7 15
293 57 34
1
36 128
17 484
82 98 64 92 42
166 682 892
- 15
705,197 (NA)
1,020 -
17,312 81,105
287,908
5,720 -
(D)13,919
3,149
2,047 23,597
- 5,633 2,130
5,549
(D)- -
1,780
310 7,990
811 -
7,352
16,743 42,895
6,846 - -
6,830 150
8,077 1,720
504
3,775 70,920
- -
419
4,301 (D)
26,875 17,089
-
2,819 15,361
- 2,636 8,792
310 3,010
28,548 8,140 8,869
(D)
3,442 75,923
(D)76,306
14,984 19,445 13,760
6,339 17,312
20,396
108,909 295,952
- 2,047
629,202 (NA)
647 -
71,404 43,217
308,464
3,996 -
(D) 5,354 3,337
2,430
19,067 -
1,599 582
6,952
(D) - -
282
62 2,385
760 -
863
8,782 16,769 18,934
- -
2,850 3
3,426 1,551
49
2,372 34,217
- -
69
1,314 (D)
13,864 30,787
-
2,202 7,941
- 6,233 5,795
62 1,163
14,657 2,388 1,760
(D)
6,315 39,289
(D) 36,165
12,971
9,876 6,238 6,912
71,404
43,746 62,827
310,122 -
2,430
527 (NA)
3 -
32 14
114
- - 1 7 -
2 4 - 3 -
1 - - - 4
- -
17 - 8
3 -
11 - -
2 - - 9 2
-
26 - - -
3 -
67 188
-
2 4 - - -
- 7
10 - 5
- 2
10 17 19
8
66 2
85 32
114
31 117
- 2
164 (NA)
- - -
17 12
- - - - -
13 4 - - 2
1 - - - -
- - - - -
- - 2 - -
- - 4 - -
3 21
- - -
- 1
58 16
-
2 7 - 1 -
- 2 4 - -
1 1
17 - 2
4 -
58 - -
18 32 12
- 13
1,289 (NA)
8 - 3
58 504
- - -
17 44
-
48 -
15 13
- - - - 2
-
27 2 -
46
23 80
- - -
9 -
193 - -
36 88
- - 7
- - -
36 -
14 2 - 8 6
- 7
278 27 19
-
12 22
- 158
72
8 1 3 3
36
134 509
- -
204 (NA)
- - 6 -
23
- - - - -
- 9 - 5 -
62 2 - - -
- - - - -
- 54
- - -
1 - - - 2
1 3 - - -
16 2 - - -
- - - -
18
- - - - 9
- - 2 -
146
1 - 1 4 6
-
12 23
- -
1,107 (NA)
- - 3
77 214
83
- 1 1 -
1 327
- 3 2
- - - - 2
7 - - - -
197 - - - -
2 30
- - -
- 54
- - -
3 -
24 24
-
- 8 -
21 23
7 3 1
30 3
-
21 77
- 159
4
24 2 - 3
24
489 259
- 1
152 (NA)
- -
17 -
18
- - - - -
- 7 - - -
- - - - -
- - - - 4
- - 5 - -
2 - - 2 -
3 - - - -
- -
61 10
-
- 9 - -
14
- - - - -
- - - -
20
3 61
2 -
17
15 16 18
- -
94,472 (NA)
- -
46,023 -
16,724
- - - - -
- 2,340
- - -
- - - - -
- - - -
500
- -
15,306 - -
(D) - -
(D) -
90 - - - -
- -
2,553 2,730
-
- 4,785
- -
700
- - - - -
- - - -
2,121
(D) 2,553
(D) -
46,023
18,036 7,125
16,724 - -
28.48 (NA)
- -
38.45 -
15.86
- - - - -
- (D)
- - -
- - - - -
- - - -
8.00
- -
6.18 - -
(D)- -
(D)-
33.00 - - - -
- -
30.01 34.95
-
- (D)
- -
1.00
- - - - -
- - - -
14.37
(D)30.01
(D)-
38.45
10.53 48.17 15.86
- -
1 Respondents could report more than one source of reclaimed water.
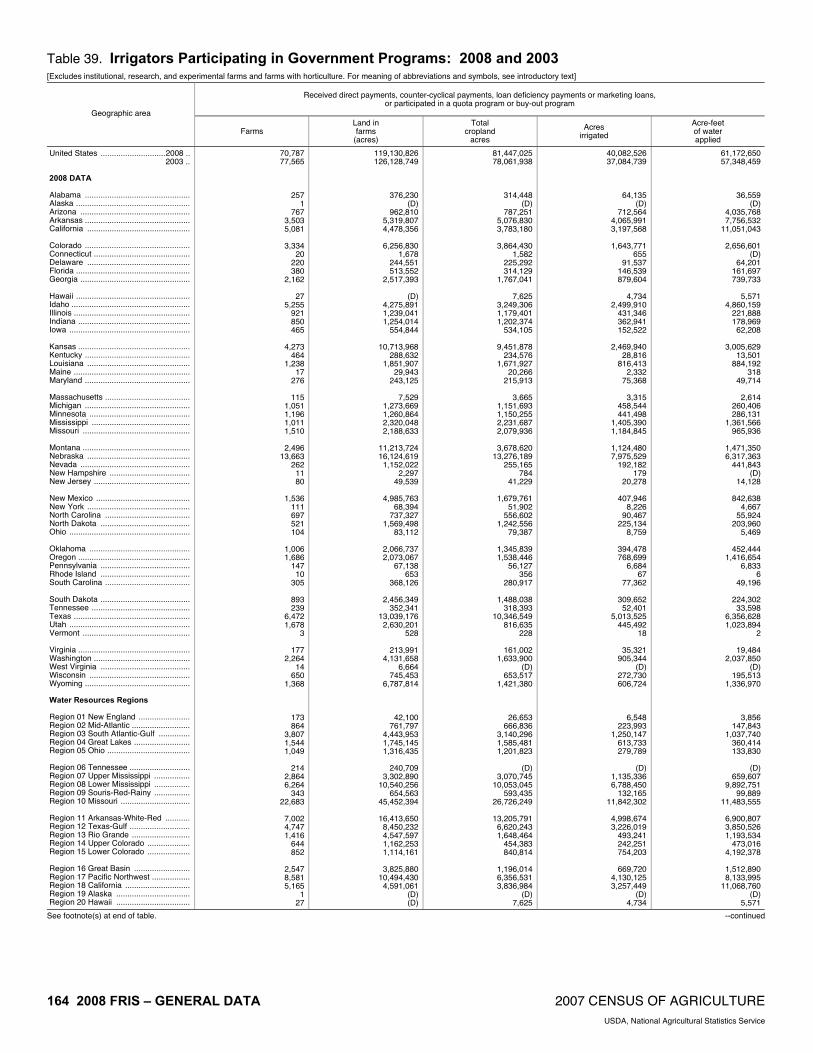
164 2008 FRIS – GENERAL DATA 2007 CENSUS OF AGRICULTURE USDA, National Agricultural Statistics Service
Table 39. Irrigators Participating in Government Programs: 2008 and 2003 [Excludes institutional, research, and experimental farms and farms with horticulture. For meaning of abbreviations and symbols, see introductory text]
Received direct payments, counter-cyclical payments, loan deficiency payments or marketing loans, or participated in a quota program or buy-out program
Geographic area
Farms Land in farms
(acres)
Total cropland
acres
Acres irrigated
Acre-feet of water applied
United States .............................2008 .. 2003 .. 2008 DATA Alabama ............................................... Alaska ................................................... Arizona ................................................. Arkansas ............................................... California .............................................. Colorado ............................................... Connecticut ........................................... Delaware .............................................. Florida ................................................... Georgia ................................................. Hawaii ................................................... Idaho ..................................................... Illinois .................................................... Indiana .................................................. Iowa ...................................................... Kansas .................................................. Kentucky ............................................... Louisiana .............................................. Maine .................................................... Maryland ............................................... Massachusetts ...................................... Michigan ............................................... Minnesota ............................................. Mississippi ............................................ Missouri ................................................ Montana ................................................ Nebraska .............................................. Nevada ................................................. New Hampshire .................................... New Jersey ........................................... New Mexico .......................................... New York .............................................. North Carolina ...................................... North Dakota ........................................ Ohio ...................................................... Oklahoma ............................................. Oregon .................................................. Pennsylvania ........................................ Rhode Island ........................................ South Carolina ...................................... South Dakota ........................................ Tennessee ............................................ Texas .................................................... Utah ...................................................... Vermont ................................................ Virginia .................................................. Washington ........................................... West Virginia ........................................ Wisconsin ............................................. Wyoming ............................................... Water Resources Regions Region 01 New England ....................... Region 02 Mid-Atlantic .......................... Region 03 South Atlantic-Gulf .............. Region 04 Great Lakes ......................... Region 05 Ohio ..................................... Region 06 Tennessee ........................... Region 07 Upper Mississippi ................ Region 08 Lower Mississippi ................ Region 09 Souris-Red-Rainy ................ Region 10 Missouri ............................... Region 11 Arkansas-White-Red ........... Region 12 Texas-Gulf ........................... Region 13 Rio Grande .......................... Region 14 Upper Colorado ................... Region 15 Lower Colorado ................... Region 16 Great Basin ......................... Region 17 Pacific Northwest ................. Region 18 California ............................. Region 19 Alaska ................................. Region 20 Hawaii .................................
70,787 77,565
257 1
767 3,503 5,081
3,334
20 220 380
2,162
27 5,255
921 850 465
4,273
464 1,238
17 276
115
1,051 1,196 1,011 1,510
2,496
13,663 262
11 80
1,536
111 697 521 104
1,006 1,686
147 10
305
893 239
6,472 1,678
3
177 2,264
14 650
1,368
173 864
3,807 1,544 1,049
214
2,864 6,264
343 22,683
7,002 4,747 1,416
644 852
2,547 8,581 5,165
1 27
119,130,826 126,128,749
376,230 (D)
962,810 5,319,807 4,478,356
6,256,830
1,678 244,551 513,552
2,517,393
(D) 4,275,891 1,239,041 1,254,014
554,844
10,713,968 288,632
1,851,907 29,943
243,125
7,529 1,273,669 1,260,864 2,320,048 2,188,633
11,213,724 16,124,619 1,152,022
2,297 49,539
4,985,763
68,394 737,327
1,569,498 83,112
2,066,737 2,073,067
67,138 653
368,126
2,456,349 352,341
13,039,176 2,630,201
528
213,991 4,131,658
6,664 745,453
6,787,814
42,100 761,797
4,443,953 1,745,145 1,316,435
240,709
3,302,890 10,540,256
654,563 45,452,394
16,413,650 8,450,232 4,547,597 1,162,253 1,114,161
3,825,880
10,494,430 4,591,061
(D) (D)
81,447,025 78,061,938
314,448 (D)
787,251 5,076,830 3,783,180
3,864,430
1,582 225,292 314,129
1,767,041
7,625 3,249,306 1,179,401 1,202,374
534,105
9,451,878 234,576
1,671,927 20,266
215,913
3,665 1,151,693 1,150,255 2,231,687 2,079,936
3,678,620
13,276,189 255,165
784 41,229
1,679,761
51,902 556,602
1,242,556 79,387
1,345,839 1,538,446
56,127 356
280,917
1,488,038 318,393
10,346,549 816,635
228
161,002 1,633,900
(D)653,517
1,421,380
26,653 666,836
3,140,296 1,585,481 1,201,823
(D)
3,070,745 10,053,045
593,435 26,726,249
13,205,791 6,620,243 1,648,464
454,383 840,814
1,196,014 6,356,531 3,836,984
(D)7,625
40,082,526 37,084,739
64,135 (D)
712,564 4,065,991 3,197,568
1,643,771
655 91,537
146,539 879,604
4,734
2,499,910 431,346 362,941 152,522
2,469,940
28,816 816,413
2,332 75,368
3,315
458,544 441,498
1,405,390 1,184,845
1,124,480 7,975,529
192,182 179
20,278
407,946 8,226
90,467 225,134
8,759
394,478 768,699
6,684 67
77,362
309,652 52,401
5,013,525 445,492
18
35,321 905,344
(D) 272,730 606,724
6,548 223,993
1,250,147 613,733 279,789
(D)
1,135,336 6,788,450
132,165 11,842,302
4,998,674 3,226,019
493,241 242,251 754,203
669,720
4,130,125 3,257,449
(D) 4,734
61,172,650 57,348,459
36,559 (D)
4,035,768 7,756,532
11,051,043
2,656,601 (D)
64,201 161,697 739,733
5,571
4,860,159 221,888 178,969 62,208
3,005,629
13,501 884,192
318 49,714
2,614
260,406 286,131
1,361,566 965,936
1,471,350 6,317,363
441,843 (D)
14,128
842,638 4,667
55,924 203,960
5,469
452,444 1,416,654
6,833 6
49,196
224,302 33,598
6,356,628 1,023,894
2
19,484 2,037,850
(D)195,513
1,336,970
3,856 147,843
1,037,740 360,414 133,830
(D)
659,607 9,892,751
99,889 11,483,555
6,900,807 3,850,526 1,193,534
473,016 4,192,378
1,512,890 8,133,995
11,068,760 (D)
5,571
See footnote(s) at end of table. --continued

2007 CENSUS OF AGRICULTURE 2008 FRIS – GENERAL DATA 165 USDA, National Agricultural Statistics Service
Table 39. Irrigators Participating in Government Programs: 2008 and 2003 - Con. [Excludes institutional, research, and experimental farms and farms with horticulture. For meaning of abbreviations and symbols, see introductory text]
Received payments for irrigation and/or drainage improvements from any of the following organizations 1
USDA programs Non-USDA Federal programs State, local, or district programs Other programs Geographic area
Farms Land in farms
(acres)
Acres irrigated Farms
Land in farms
(acres)
Acres irrigated Farms
Land in farms
(acres)
Acres irrigated Farms
Land in farms
(acres)
Acres irrigated
United States ............................. 2008 .. 2003 .. 2008 DATA Alabama ............................................... Alaska .................................................. Arizona ................................................. Arkansas .............................................. California .............................................. Colorado ............................................... Connecticut .......................................... Delaware .............................................. Florida .................................................. Georgia ................................................ Hawaii .................................................. Idaho .................................................... Illinois ................................................... Indiana ................................................. Iowa ..................................................... Kansas ................................................. Kentucky .............................................. Louisiana .............................................. Maine ................................................... Maryland .............................................. Massachusetts ..................................... Michigan ............................................... Minnesota ............................................. Mississippi ............................................ Missouri ................................................ Montana ............................................... Nebraska .............................................. Nevada ................................................. New Hampshire .................................... New Jersey .......................................... New Mexico .......................................... New York .............................................. North Carolina ...................................... North Dakota ........................................ Ohio ..................................................... Oklahoma ............................................. Oregon ................................................. Pennsylvania ........................................ Rhode Island ........................................ South Carolina ..................................... South Dakota ....................................... Tennessee ........................................... Texas ................................................... Utah ..................................................... Vermont ................................................ Virginia ................................................. Washington .......................................... West Virginia ........................................ Wisconsin ............................................. Wyoming .............................................. Water Resources Regions Region 01 New England ....................... Region 02 Mid-Atlantic ......................... Region 03 South Atlantic-Gulf .............. Region 04 Great Lakes ........................ Region 05 Ohio .................................... Region 06 Tennessee .......................... Region 07 Upper Mississippi ................ Region 08 Lower Mississippi ................ Region 09 Souris-Red-Rainy ................ Region 10 Missouri .............................. Region 11 Arkansas-White-Red ........... Region 12 Texas-Gulf .......................... Region 13 Rio Grande ......................... Region 14 Upper Colorado ................... Region 15 Lower Colorado ................... Region 16 Great Basin ......................... Region 17 Pacific Northwest ................ Region 18 California ............................. Region 19 Alaska ................................. Region 20 Hawaii .................................
33,684 (NA)
145 1
568 1,089 3,313
2,702
41 136 598 760
83
1,665 269 243 144
1,624
113 511
14 134
253 396 442 459 736
1,385 3,736
359 25
176
1,215 56
235 188
27
434 1,066
71 29
201
338 95
3,250 1,173
10
57 1,588
21 292
1,218
366 598
1,928 544 355
66
973 2,312
144 8,351
3,397 2,480 1,202 1,031
647
1,314 4,500 3,392
1 83
65,280,052 (NA)
191,068 (D)
2,133,507 1,995,983 3,550,701
4,936,489
2,248 167,148 669,912
1,122,469
(D) 1,531,563
349,466 426,314 193,487
4,357,096
70,720 850,019 27,793
120,634
29,067 519,575 505,226
1,158,479 1,259,706
6,233,001 5,595,612 1,460,306
3,022 61,143
3,337,193
34,565 362,454 703,294 29,410
806,662
1,978,970 40,070
1,496 205,043
1,257,478
187,705 5,755,584 1,617,053
730
83,390 4,360,577
6,892 386,126
4,597,923
63,654 461,108
2,515,339 688,934 499,054
112,039
1,220,954 4,588,038
267,059 21,647,074
7,465,592 4,179,377 2,934,267 1,617,161 2,186,976
2,893,419 8,268,723 3,665,601
(D) (D)
19,140,464 (NA)
28,806 (D)
388,825 1,544,386 2,004,367
1,205,600
937 66,230
245,895 403,307
1,948
781,364 122,718 118,797 53,180
1,035,800
7,289 379,680
2,182 42,620
10,605
186,290 201,170 690,917 680,531
501,309
2,575,988 214,958
248 25,593
355,494
6,954 34,109 83,919
4,941
169,551 562,308
4,299 267
35,082
153,378 28,052
2,723,836 355,702
52
14,822 504,703
(D)126,252 454,481
14,247 154,522 745,763 247,363 92,699
(D)
432,955 2,950,049
49,992 4,617,758
2,361,916 1,887,770
369,275 400,786 417,856
507,497
1,818,411 2,056,333
(D)1,948
954 (NA)
- -
12 1
51
9 - - 3
52
1 85
- - -
44 - 1 - 3
- 2
10 2 7
32
188 2 - 1
- 1 - 3 -
2 9 - - 3
7 - 4
95 -
- 278
- 1
45
- 5
58 2 -
- 11
6 -
321
6 - 4
92 12
5
377 54
- 1
2,608,230 (NA)
- -
17,740 (D)
129,003
115,252 - -
2,312 13,000
(D)
52,096 - - -
59,840 -
(D)-
1,554
- (D)
4,400 (D)
3,730
103,048 125,728
(D)-
(D)
- (D)
- 7,245
-
(D)27,890
- -
9,120
11,543 -
11,920 342,445
-
- 1,435,293
- (D)
61,970
- 2,160
24,432 (D)
-
- (D)
18,896 -
375,844
35,000 -
11,920 48,445 17,740
301,184
1,595,391 139,403
- (D)
397,474 (NA)
- -
16,940 (D)
119,773
31,170 - -
1,130 3,640
(D)
25,392 - - -
7,832 -
(D) -
90
- (D)
2,710 (D)
3,350
18,816 54,445
(D) -
(D)
- (D)
- 873
-
(D) 13,246
- -
150
2,758 -
11,780 13,749
-
- 37,126
- (D)
10,270
- 315
4,920 (D)
-
- 2,910 9,831
- 119,814
4,100
- 11,780 13,734 16,940
4,553
75,014 127,523
- (D)
3,939 (NA)
5 -
26 130 187
85
- 19
115 121
3
137 21 11
1
122 47 29 10 56
1
53 31
9 104
53
921 - -
25
4 4
64 6
10
20 554
16 - 7
7
31 491
56 -
14 305
- 17 11
11 132 312
65 66
19 74
203 12
1,101
224 406
6 32 39
34
1,014 186
- 3
5,788,053 (NA)
9,516 -
44,330 153,628 213,426
199,367
- 31,392
144,190 154,288
(D)
89,685 30,093 31,620
(D)
836,737 14,345 51,344
(D) 49,989
(D)
47,252 34,173 21,816
186,061
184,960 972,136
- -
12,347
17,690 8,509
41,372 23,716 13,922
161,347 245,782
(D) -
16,164
23,500 18,806
636,223 369,793
-
11,686 490,485
- 25,900 97,670
36,201 115,056 364,204 76,922 44,656
(D)
114,259 326,738 14,236
1,515,506
1,032,451 589,613 20,680 19,160 67,559
344,848 856,012 213,402
- (D)
2,065,492 (NA)
1,286 -
24,820 131,801 184,028
61,498
- 11,021 65,456 62,487
(D)
73,486 10,405 17,853
(D)
61,268 756
26,428 (D)
15,957
(D) 11,546 14,080 10,650 69,644
21,424
543,628 - -
7,403
3,226 2,658 5,836 4,484 1,775
17,717 62,557
1,516 -
746
4,200 (D)
406,446 32,044
-
2,912 59,177
- 3,567
14,928
10,262 39,547
136,581 16,711
6,118
(D) 44,559
207,245 2,734
648,446
114,527 380,356
7,136 9,344
40,470
22,222 195,750 179,878
- (D)
2,206 (NA)
10 -
20 56
108
38 2 4 5
159
17 58 12
- 14
48 40 14
2 1
13 19 19 11 28
154 368
13 - 8
68
4 68
8 2
18
216 9 4 6
29 10
177 210
-
- 44
5 23 64
21 31
245 19 45
15 57 94
2 667
124
87 67 86 21
186 312 110
- 17
5,080,668 (NA)
4,768 -
33,616 113,804 184,911
119,712
(D)4,298
40,798 79,966
2,486
163,480 15,162
- 12,400
209,585
4,579 23,838
(D)(D)
2,202
28,916 6,064
27,296 34,928
139,600 608,357 42,530
- 2,211
924,644
260 28,944 22,806
(D)
19,821 174,723
3,725 396
14,224
62,557 (D)
229,772 108,164
-
- 1,420,346
1,330 12,019
139,582
3,898 14,124
180,100 28,916
9,839
(D)30,737
173,916 (D)
1,210,227
130,949 150,619 922,544 124,857 35,716
120,392
1,711,369 219,291
- 2,486
1,123,135 (NA)
784 -
23,185 92,834
150,826
45,427 (D)
2,640 26,416 17,479
716
73,850 9,330
- 1,902
39,755
414 11,520
(D)(D)
649
8,628 2,425 5,766
23,241
9,155 226,744 22,194
- 1,253
9,054
120 3,056 3,926
(D)
2,982 34,975
362 32
2,953
19,692 (D)
125,532 62,367
-
- 23,309
15 4,537
31,304
941 5,025
51,308 8,628 2,912
(D)
13,424 122,736
(D)335,581
58,313 91,986
6,954 44,869 25,285
75,614
120,554 156,406
- 716
1 Respondents could choose more than one program.
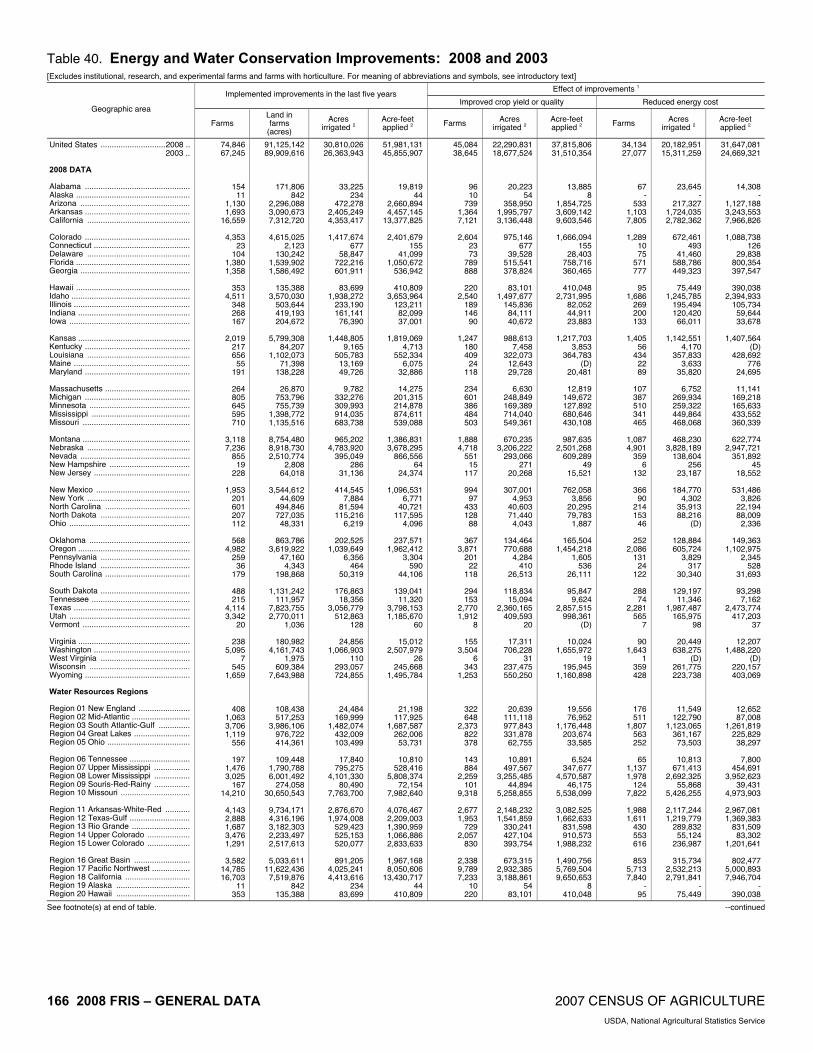
166 2008 FRIS – GENERAL DATA 2007 CENSUS OF AGRICULTURE USDA, National Agricultural Statistics Service
Table 40. Energy and Water Conservation Improvements: 2008 and 2003 [Excludes institutional, research, and experimental farms and farms with horticulture. For meaning of abbreviations and symbols, see introductory text]
Effect of improvements 1 Implemented improvements in the last five years
Improved crop yield or quality Reduced energy cost Geographic area
Farms Land in farms
(acres)
Acres irrigated 2
Acre-feet applied 2 Farms Acres
irrigated 2 Acre-feet applied 2 Farms Acres
irrigated 2 Acre-feet applied 2
United States .............................2008 .. 2003 .. 2008 DATA Alabama ............................................... Alaska ................................................... Arizona ................................................. Arkansas ............................................... California .............................................. Colorado ............................................... Connecticut ........................................... Delaware .............................................. Florida ................................................... Georgia ................................................. Hawaii ................................................... Idaho ..................................................... Illinois .................................................... Indiana .................................................. Iowa ...................................................... Kansas .................................................. Kentucky ............................................... Louisiana .............................................. Maine .................................................... Maryland ............................................... Massachusetts ...................................... Michigan ............................................... Minnesota ............................................. Mississippi ............................................ Missouri ................................................ Montana ................................................ Nebraska .............................................. Nevada ................................................. New Hampshire .................................... New Jersey ........................................... New Mexico .......................................... New York .............................................. North Carolina ...................................... North Dakota ........................................ Ohio ...................................................... Oklahoma ............................................. Oregon .................................................. Pennsylvania ........................................ Rhode Island ........................................ South Carolina ...................................... South Dakota ........................................ Tennessee ............................................ Texas .................................................... Utah ...................................................... Vermont ................................................ Virginia .................................................. Washington ........................................... West Virginia ........................................ Wisconsin ............................................. Wyoming ............................................... Water Resources Regions Region 01 New England ....................... Region 02 Mid-Atlantic .......................... Region 03 South Atlantic-Gulf .............. Region 04 Great Lakes ......................... Region 05 Ohio ..................................... Region 06 Tennessee ........................... Region 07 Upper Mississippi ................ Region 08 Lower Mississippi ................ Region 09 Souris-Red-Rainy ................ Region 10 Missouri ............................... Region 11 Arkansas-White-Red ........... Region 12 Texas-Gulf ........................... Region 13 Rio Grande .......................... Region 14 Upper Colorado ................... Region 15 Lower Colorado ................... Region 16 Great Basin ......................... Region 17 Pacific Northwest ................. Region 18 California ............................. Region 19 Alaska ................................. Region 20 Hawaii .................................
74,846 67,245
154 11
1,130 1,693
16,559
4,353 23
104 1,380 1,358
353
4,511 348 268 167
2,019
217 656
55 191
264 805 645 595 710
3,118 7,236
855 19
228
1,953 201 601 207 112
568
4,982 259
36 179
488 215
4,114 3,342
20
238 5,095
7 545
1,659
408 1,063 3,706 1,119
556
197 1,476 3,025
167 14,210
4,143 2,888 1,687 3,476 1,291
3,582
14,785 16,703
11 353
91,125,142 89,909,616
171,806 842
2,296,088 3,090,673 7,312,720
4,615,025
2,123 130,242
1,539,902 1,586,492
135,388
3,570,030 503,644 419,193 204,672
5,799,308
84,207 1,102,073
71,398 138,228
26,870
753,796 755,739
1,398,772 1,135,516
8,754,480 8,918,730 2,510,774
2,808 64,018
3,544,612
44,609 494,846 727,035 48,331
863,786
3,619,922 47,160
4,343 198,868
1,131,242
111,957 7,823,755 2,770,011
1,036
180,982 4,161,743
1,975 609,384
7,643,988
108,438 517,253
3,986,106 976,722 414,361
109,448
1,790,788 6,001,492
274,058 30,650,543
9,734,171 4,316,196 3,182,303 2,233,497 2,517,613
5,033,611
11,622,436 7,519,876
842 135,388
30,810,026 26,363,943
33,225 234
472,278 2,405,249 4,353,417
1,417,674
677 58,847
722,216 601,911
83,699
1,938,272 233,190 161,141 76,390
1,448,805
9,165 505,783 13,169 49,726
9,782
332,276 309,993 914,035 683,738
965,202
4,783,920 395,049
286 31,136
414,545
7,884 81,594
115,216 6,219
202,525
1,039,649 6,356
464 50,319
176,863 18,356
3,056,779 512,863
128
24,856 1,066,903
110 293,057 724,855
24,484 169,999
1,482,074 432,009 103,499
17,840
795,275 4,101,330
80,490 7,763,700
2,876,670 1,974,008
529,423 525,153 520,077
891,205
4,025,241 4,413,616
234 83,699
51,981,131 45,855,907
19,819 44
2,660,894 4,457,145
13,377,825
2,401,679 155
41,099 1,050,672
536,942
410,809 3,653,964
123,211 82,099 37,001
1,819,069
4,713 552,334
6,075 32,886
14,275
201,315 214,878 874,611 539,088
1,386,831 3,678,295
866,556 64
24,374
1,096,531 6,771
40,721 117,595
4,096
237,571 1,962,412
3,304 590
44,106
139,041 11,320
3,798,153 1,185,670
60
15,012 2,507,979
26 245,668
1,495,784
21,198 117,925
1,687,587 262,006 53,731
10,810
528,416 5,808,374
72,154 7,982,640
4,076,467 2,209,003 1,390,959 1,066,886 2,833,633
1,967,168 8,050,606
13,430,717 44
410,809
45,084 38,645
96 10
739 1,364 7,121
2,604
23 73
789 888
220
2,540 189 146
90
1,247 180 409
24 118
234 601 386 484 503
1,888 4,718
551 15
117
994 97
433 128
88
367 3,871
201 22
118
294 153
2,770 1,912
8
155 3,504
6 343
1,253
322 648
2,373 822 378
143 884
2,259 101
9,318
2,677 1,953
729 2,057
830
2,338 9,789 7,233
10 220
22,290,831 18,677,524
20,223 54
358,950 1,995,797 3,136,448
975,146
677 39,528
515,541 378,824
83,101
1,497,677 145,836 84,111 40,672
988,613
7,458 322,073 12,643 29,728
6,630
248,849 169,389 714,040 549,361
670,235
3,206,222 293,066
271 20,268
307,001
4,953 40,603 71,440
4,043
134,464 770,688
4,284 410
26,513
118,834 15,094
2,360,165 409,593
20
17,311 706,228
31 237,475 550,250
20,639 111,118 977,843 331,878 62,755
10,891
497,567 3,255,485
44,894 5,258,855
2,148,232 1,541,859
330,241 427,104 393,754
673,315
2,932,385 3,188,861
54 83,101
37,815,806 31,510,354
13,885 8
1,854,725 3,609,142 9,603,546
1,666,094
155 28,403
758,716 360,465
410,048
2,731,995 82,052 44,911 23,883
1,217,703
3,853 364,783
(D) 20,481
12,819
149,672 127,892 680,646 430,108
987,635
2,501,268 609,289
49 15,521
762,058
3,856 20,295 79,783
1,887
165,504 1,454,218
1,605 536
26,111
95,847 9,624
2,857,515 998,361
(D)
10,024 1,655,972
19 195,945
1,160,898
19,556 76,952
1,176,448 203,674 33,585
6,524
347,677 4,570,587
46,175 5,538,099
3,082,525 1,662,633
831,598 910,573
1,988,232
1,490,756 5,769,504 9,650,653
8 410,048
34,134 27,077
67 -
533 1,103 7,805
1,289
10 75
571 777
95
1,686 269 200 133
1,405
56 434
22 89
107 387 510 341 465
1,087 4,901
359 6
132
366 90
214 153
46
252 2,086
131 24
122
288 74
2,281 565
7
90 1,643
1 359 428
176 511
1,807 563 252
65
1,137 1,978
124 7,822
1,988 1,611
430 553 616
853
5,713 7,840
- 95
20,182,951 15,311,259
23,645 -
217,327 1,724,035 2,782,362
672,461
493 41,460
588,786 449,323
75,449
1,245,785 195,494 120,420 66,011
1,142,551
4,170 357,833
3,633 35,820
6,752
269,934 259,322 449,864 468,068
468,230
3,828,189 138,604
256 23,187
184,770
4,302 35,913 88,216
(D)
128,884 605,724
3,829 317
30,340
129,197 11,346
1,987,487 165,975
98
20,449 638,275
(D)261,775 223,738
11,549 122,790
1,123,065 361,167 73,503
10,813
671,413 2,692,325
55,868 5,426,255
2,117,244 1,219,779
289,832 55,124
236,987
315,734 2,532,213 2,791,841
- 75,449
31,647,081 24,669,321
14,308 -
1,127,188 3,243,553 7,966,826
1,088,738
126 29,838
800,354 397,547
390,038
2,394,933 105,734 59,644 33,678
1,407,564
(D)428,692
776 24,695
11,141
169,218 165,633 433,552 360,339
622,774
2,947,721 351,892
45 18,552
531,486
3,826 22,194 88,009
2,336
149,363 1,102,975
2,345 528
31,693
93,298 7,162
2,473,774 417,203
37
12,207 1,488,220
(D)220,157 403,069
12,652 87,008
1,261,819 225,829 38,297
7,800
454,691 3,952,623
39,431 4,973,903
2,967,081 1,369,383
831,509 83,302
1,201,641
802,477 5,000,893 7,946,704
- 390,038
See footnote(s) at end of table. --continued

2007 CENSUS OF AGRICULTURE 2008 FRIS – GENERAL DATA 167 USDA, National Agricultural Statistics Service
Table 40. Energy and Water Conservation Improvements: 2008 and 2003 - Con. [Excludes institutional, research, and experimental farms and farms with horticulture. For meaning of abbreviations and symbols, see introductory text]
Effect of improvements 1 - con.
Reduced water applied Reduced labor costs Reduced fertilizer or pesticide losses Geographic area
Farms Acres irrigated 2
Acre-feet applied 2 Farms Acres
irrigated 2 Acre-feet applied 2 Farms Acres
irrigated 2 Acre-feet applied 2
United States ............................. 2008 .. 2003 .. 2008 DATA Alabama ............................................... Alaska .................................................. Arizona ................................................. Arkansas .............................................. California .............................................. Colorado ............................................... Connecticut .......................................... Delaware .............................................. Florida .................................................. Georgia ................................................ Hawaii .................................................. Idaho .................................................... Illinois ................................................... Indiana ................................................. Iowa ..................................................... Kansas ................................................. Kentucky .............................................. Louisiana .............................................. Maine ................................................... Maryland .............................................. Massachusetts ..................................... Michigan ............................................... Minnesota ............................................. Mississippi ............................................ Missouri ................................................ Montana ............................................... Nebraska .............................................. Nevada ................................................. New Hampshire .................................... New Jersey .......................................... New Mexico .......................................... New York .............................................. North Carolina ...................................... North Dakota ........................................ Ohio ..................................................... Oklahoma ............................................. Oregon ................................................. Pennsylvania ........................................ Rhode Island ........................................ South Carolina ..................................... South Dakota ....................................... Tennessee ........................................... Texas ................................................... Utah ..................................................... Vermont ................................................ Virginia ................................................. Washington .......................................... West Virginia ........................................ Wisconsin ............................................. Wyoming .............................................. Water Resources Regions Region 01 New England ....................... Region 02 Mid-Atlantic ......................... Region 03 South Atlantic-Gulf .............. Region 04 Great Lakes ........................ Region 05 Ohio .................................... Region 06 Tennessee .......................... Region 07 Upper Mississippi ................ Region 08 Lower Mississippi ................ Region 09 Souris-Red-Rainy ................ Region 10 Missouri .............................. Region 11 Arkansas-White-Red ........... Region 12 Texas-Gulf .......................... Region 13 Rio Grande ......................... Region 14 Upper Colorado ................... Region 15 Lower Colorado ................... Region 16 Great Basin ......................... Region 17 Pacific Northwest ................ Region 18 California ............................. Region 19 Alaska ................................. Region 20 Hawaii .................................
44,473 39,573
73 2
883 1,056 9,552
2,525
10 68
839 681
170
2,537 207 142 110
1,285
76 378
13 83
226 361 408 269 405
1,902 5,396
593 13
123
1,265 88
278 154
54
259 3,137
142 30 80
343
62 2,136 1,776
8
81 2,997
2 269 926
295 479
1,936 541 238
67
853 1,850
108 9,591
2,566 1,492 1,067 1,640
973
2,020 8,922 9,663
2 170
21,428,273 18,549,164
19,187 (D)
366,068 1,559,798 3,125,873
962,493
493 41,963
585,186 381,339
77,056
1,389,470 151,044 85,700 47,476
1,051,207
3,774 300,345
1,294 31,894
7,921
203,905 227,574 488,317 435,563
604,078
3,843,891 257,458
277 21,859
301,237
4,136 45,500 92,750
2,896
123,076 728,326
3,327 409
38,566
126,865 11,249
1,956,264 323,454
100
14,320 820,678
(D) 123,173 439,139
10,484 111,888
1,064,827 249,513 56,856
(D)
478,333 2,513,224
62,701 5,862,804
1,893,923 1,270,276
396,718 285,295 408,204
593,362
2,917,391 3,166,681
(D) 77,056
36,361,523 32,392,166
10,683 (D)
2,087,556 2,648,153 9,689,204
1,537,431
126 28,852
801,888 338,784
397,823
2,706,319 76,760 42,320 18,589
1,312,748
1,627 331,723
299 22,277
12,301
122,367 159,718 467,701 321,407
919,974
2,953,999 602,551
61 17,645
728,737
3,899 25,434 94,069
1,069
145,018 1,396,189
2,534 552
33,635
97,303 7,416
2,460,846 765,841
48
8,211 1,923,828
(D)111,434 924,513
13,375 79,197
1,206,875 148,255 30,872
(D)
307,240 3,360,407
60,045 5,870,912
2,609,489 1,454,300
969,363 550,745
2,246,338
1,335,678 6,005,417 9,708,692
(D)397,823
30,800 27,105
50 3
610 805
7,177
1,954 10 31
361 307
86
2,161 97 88 50
851
35 258
21 40
56
269 150 232 359
1,286 3,424
395 6
88
884 97
340 76 40
144
2,243 57 12 32
152
44 1,872 1,270
7
79 1,084
1 213 893
112 363
1,063 414
88
63 411
1,397 54
6,455
1,482 1,310
969 1,412
696
1,635 5,570 7,217
3 86
15,746,960 13,807,531
8,442 (D)
356,401 1,349,693 2,398,395
619,869
493 16,955
208,634 194,646
7,650
1,161,164 93,466 51,327 24,117
698,993
1,940 220,714 11,738 14,585
4,687
172,449 83,998
389,693 316,634
503,590
2,439,400 222,174
256 16,920
188,712
4,792 40,861 50,532
3,274
97,565 583,055
2,582 236
8,975
60,075 6,179
1,729,173 278,988
98
8,841 513,529
(D)143,258 437,187
17,508 60,537
457,588 238,188 30,909
(D)
289,838 2,025,284
24,406 3,874,211
1,402,430 1,209,909
279,854 226,345 380,661
536,920
2,272,888 2,405,997
(D)7,650
27,282,360 24,649,072
5,607 (D)
1,995,411 2,433,908 6,934,978
994,776
126 10,884
288,369 185,626
10,442
2,191,554 54,524 25,541
7,024
860,297 647
300,920 (D)
9,987
7,862 101,194 62,440
402,400 240,672
784,008
1,837,398 522,857
45 14,360
584,837
3,010 19,125 63,767
1,309
114,149 1,023,990
1,593 (D)
15,223
51,696 2,215
2,095,231 676,621
37
3,846 1,238,836
(D) 122,278 974,418
14,374 41,366
510,777 145,574 19,030
(D)
198,973 2,959,988
24,335 4,113,515
1,962,328 1,318,719
828,412 425,408
2,101,979
1,229,117 4,483,703 6,890,388
(D) 10,442
13,408 9,919
14 -
366 261
3,908
699 6
11 277 157
72
426 53 24
8
234 36
120 3
17
117 108
90 41
138
231 2,030
130 8
56
554 14
134 43 15
26
555 79
3 38
49 13
892 289
4
2 729
6 122 200
141 153 619 164
79
12 234 422
53 2,806
748 783 240 507 389
423
1,649 3,914
- 72
8,075,076 5,742,343
(D)-
218,172 441,532
1,826,067
292,692 263
6,405 150,292 57,247
8,833
429,273 38,126 16,416
4,386
291,569 1,361
124,562 24
4,945
3,065 90,556 31,748 81,015
136,936
174,497 1,455,767
62,587 202
11,330
150,033 1,142
11,919 21,098
1,344
29,401 322,914
493 175
8,597
29,319 1,018
842,684 96,688
8
(D)374,400
31 65,684
155,005
3,737 24,334
228,405 110,348
(D)
(D)131,743 666,834 15,384
2,049,862
533,120 721,492 101,551 134,325 248,624
153,443
1,125,655 1,808,169
- 8,833
15,470,797 10,369,455
(D)-
1,168,259 896,222
5,715,016
558,636 (D)
4,162 205,285 66,935
20,158
879,369 20,930
9,138 1,331
359,476
557 104,281
30 3,249
5,243
61,551 23,361 90,747
101,328
296,764 1,217,950
153,496 27
9,447
414,929 1,724 8,218
18,921 454
41,893
574,066 210 (D)
15,226
26,557 583
840,021 243,663
1
(D)884,948
19 63,829
359,689
5,852 17,734
296,032 77,676
(D)
(D)100,644 984,890 12,373
2,256,540
787,803 673,130 259,228 341,882
1,296,679
379,634 2,339,737 5,614,565
- 20,158
See footnote(s) at end of table. --continued

168 2008 FRIS – GENERAL DATA 2007 CENSUS OF AGRICULTURE USDA, National Agricultural Statistics Service
Table 40. Energy and Water Conservation Improvements: 2008 and 2003 - Con. [Excludes institutional, research, and experimental farms and farms with horticulture. For meaning of abbreviations and symbols, see introductory text]
Effect of improvements 1 - con.
Reduced soil erosion Reduced tailwater Other Geographic area
Farms Acres irrigated 2
Acre-feet applied 2 Farms Acres
irrigated 2 Acre-feet applied 2 Farms Acres
irrigated 2 Acre-feet applied 2
United States .............................2008 .. 2003 .. 2008 DATA Alabama ............................................... Alaska ................................................... Arizona ................................................. Arkansas ............................................... California .............................................. Colorado ............................................... Connecticut ........................................... Delaware .............................................. Florida ................................................... Georgia ................................................. Hawaii ................................................... Idaho ..................................................... Illinois .................................................... Indiana .................................................. Iowa ...................................................... Kansas .................................................. Kentucky ............................................... Louisiana .............................................. Maine .................................................... Maryland ............................................... Massachusetts ...................................... Michigan ............................................... Minnesota ............................................. Mississippi ............................................ Missouri ................................................ Montana ................................................ Nebraska .............................................. Nevada ................................................. New Hampshire .................................... New Jersey ........................................... New Mexico .......................................... New York .............................................. North Carolina ...................................... North Dakota ........................................ Ohio ...................................................... Oklahoma ............................................. Oregon .................................................. Pennsylvania ........................................ Rhode Island ........................................ South Carolina ...................................... South Dakota ........................................ Tennessee ............................................ Texas .................................................... Utah ...................................................... Vermont ................................................ Virginia .................................................. Washington ........................................... West Virginia ........................................ Wisconsin ............................................. Wyoming ............................................... Water Resources Regions Region 01 New England ....................... Region 02 Mid-Atlantic .......................... Region 03 South Atlantic-Gulf .............. Region 04 Great Lakes ......................... Region 05 Ohio ..................................... Region 06 Tennessee ........................... Region 07 Upper Mississippi ................ Region 08 Lower Mississippi ................ Region 09 Souris-Red-Rainy ................ Region 10 Missouri ............................... Region 11 Arkansas-White-Red ........... Region 12 Texas-Gulf ........................... Region 13 Rio Grande .......................... Region 14 Upper Colorado ................... Region 15 Lower Colorado ................... Region 16 Great Basin ......................... Region 17 Pacific Northwest ................. Region 18 California ............................. Region 19 Alaska ................................. Region 20 Hawaii .................................
21,782 21,373
42 1
614 740
3,524
2,028 6
12 317 245
86
1,459 59 46 17
448
55 266
13 39
9
223 144 131 227
773
2,661 221
5 61
541
32 146
72 35
122
1,009 39 16 33
168
12 1,512 1,233
3
61 1,536
1 129 610
52 225 775 299
97
14 342
1,096 60
5,306
1,174 1,125
468 1,292
756
1,048 3,950 3,616
1 86
12,119,994 9,972,000
15,396 (D)
235,184 1,129,998 1,652,275
648,103
263 6,329
105,191 173,392
6,784
724,375 51,246 28,891
5,194
456,813 1,036
207,821 10,474 18,469
1,051
167,132 76,764
221,249 199,714
377,871
1,994,365 164,460
196 13,676
180,740
1,653 18,427 43,794
1,985
73,873 458,982
(D) 220
17,378
67,935 2,801
1,346,565 253,989
90
5,645 526,290
(D) 65,880
359,155
12,294 45,430
323,276 189,030 13,703
(D)
187,611 1,517,028
22,264 3,282,618
1,040,293 1,006,308
146,185 289,933 249,812
368,526
1,723,529 1,688,033
(D) 6,784
20,839,498 17,463,670
9,039 (D)
1,339,250 2,007,721 5,123,722
1,018,199
87 3,477
141,836 145,961
5,418
1,555,096 30,052 16,874
1,798
558,712 374
246,253 (D)
13,771
(D)107,239 57,813
228,351 144,591
507,770
1,546,953 328,781
27 11,536
492,982
1,969 12,558 50,626
1,074
93,690 902,914
(D)(D)
21,773
58,616 1,279
1,399,586 558,519
36
4,115 1,218,291
(D)55,829
805,549
9,263 33,607
326,526 124,290
9,173
(D)124,822
2,235,527 24,359
3,457,607
1,496,094 996,257 326,901 638,287
1,404,458
796,024 3,663,322 5,162,231
(D)5,418
16,076 15,919
12 1
421 537
4,230
1,708 - -
77 71
5
923 10
6 4
550
2 104
2 7
17
5 43
114 183
430
1,822 301
2 11
378
6 107
27 9
130 629
- 6 5
62
5 996 726
-
5 846
- 36
505
27 27
266 30
9
8 89
787 21
3,600
1,038 715 346
1,180 503
817
2,331 4,276
1 5
9,100,478 8,709,088
5,130 (D)
265,432 833,953
1,962,493
419,170 - -
91,283 47,470
(D)
382,930 15,820
4,920 1,934
462,074
(D)86,220
(D)3,518
1,153
10,020 24,065
189,751 171,918
263,969
1,525,986 154,871
(D)1,996
78,135
162 6,963
11,265 180
64,887
314,109 -
(D)1,403
18,433
4,997 949,807 166,556
-
790 302,008
- 6,329
245,839
1,567 6,424
147,649 12,257 11,330
4,670
40,884 1,089,680
11,395 2,374,403
944,601 624,895 120,394 152,389 287,420
292,821 987,086
1,988,548 (D)(D)
18,108,819 17,220,968
3,440 (D)
1,535,753 1,538,432 6,502,295
746,008
- -
126,991 68,406
(D)
858,317 9,707 3,180
582
538,066 (D)
102,316 (D)
3,277
(D) (D)
23,280 196,474 120,547
435,887
1,134,087 394,184
(D) 1,370
212,726
308 2,476
12,183 90
83,799
576,635 -
(D) 995
17,710
1,899 1,200,815
399,139 -
986 664,189
- 11,100
566,571
4,006 5,933
199,318 8,418 5,899
(D)
32,813 1,639,577
17,571 2,544,864
1,261,132
796,083 333,763 331,698
1,640,637
726,503 2,042,208 6,511,849
(D) (D)
5,073 5,656
5 - 7
101 1,023
512
1 1
353 150
29
210 15 12
7
142 17 34 30 29
1
34 27 27 16
76
122 88
- 21
4
41 48 13
4
54 395
5 1
22
22 26
202 395
-
2 573
- 34
142
33 99
578 40 39
9
68 163
12 571
148 179
4 544
13
338 1,182 1,024
- 29
1,233,067 831,261
522 -
11,300 109,854 208,330
84,436
(D)(D)
14,701 24,291
139
68,517 12,048 19,333
1,593
88,578 830
13,047 (D)
2,187
(D)7,126 4,937
23,448 9,850
38,502 55,370 24,369
- 2,132
5,140
621 1,664 4,531
144
22,700 46,947
65 (D)
5,279
12,769 1,461
162,091 31,322
-
(D)66,774
- 4,845
38,592
571 7,116
46,457 8,366 5,490
(D)
34,003 134,491
(D)218,636
130,024 137,106
7,050 38,388 22,027
52,158
187,234 201,018
- 139
2,261,961 1,469,581
241 -
65,072 166,037 645,124
136,403
(D)(D)
19,667 20,448
257
169,004 6,559
10,308 332
120,208
404 17,775
17 1,133
(D)
4,594 3,515
32,813 5,224
74,375 44,342 41,515
- 1,700
13,518
1,196 222
4,820 144
29,221 90,510
23 (D)
13,399
12,167 1,100
165,546 89,261
-
(D)173,411
- 2,743
75,832
(D)5,322
53,977 5,104 2,551
33
19,851 200,847
(D)300,352
189,801 133,704 12,120 57,103 99,879
116,807 440,567 621,368
- 257
1 Respondents could choose more than one improvement project. 2 Acres irrigated and acre-feet applied are totals for all irrigation on these farms and not the amounts conserved as a result of the conservation improvement.

2007 CENSUS OF AGRICULTURE 2008 FRIS – GENERAL DATA 169 USDA, National Agricultural Statistics Service
Table 41. Barriers to Making Improvements to Reduce Energy Use or Conserve Water: 2008 and 2003 [Excludes institutional, research, and experimental farms and farms with horticulture. For meaning of abbreviations and symbols, see introductory text]
Total 1 Investigating improvements not a priority
Geographic area Farms Land in farms
(acres) Acres
irrigated Acre-feet applied Farms Acres
irrigated 2 Acre-feet applied 2
United States ............................. 2008 .. 2003 .. 2008 DATA Alabama ............................................... Alaska .................................................. Arizona ................................................. Arkansas .............................................. California .............................................. Colorado ............................................... Connecticut .......................................... Delaware .............................................. Florida .................................................. Georgia ................................................ Hawaii .................................................. Idaho .................................................... Illinois ................................................... Indiana ................................................. Iowa ..................................................... Kansas ................................................. Kentucky .............................................. Louisiana .............................................. Maine ................................................... Maryland .............................................. Massachusetts ..................................... Michigan ............................................... Minnesota ............................................. Mississippi ............................................ Missouri ................................................ Montana ............................................... Nebraska .............................................. Nevada ................................................. New Hampshire .................................... New Jersey .......................................... New Mexico .......................................... New York .............................................. North Carolina ...................................... North Dakota ........................................ Ohio ..................................................... Oklahoma ............................................. Oregon ................................................. Pennsylvania ........................................ Rhode Island ........................................ South Carolina ..................................... South Dakota ....................................... Tennessee ........................................... Texas ................................................... Utah ..................................................... Vermont ................................................ Virginia ................................................. Washington .......................................... West Virginia ........................................ Wisconsin ............................................. Wyoming .............................................. Water Resources Regions Region 01 New England ....................... Region 02 Mid-Atlantic ......................... Region 03 South Atlantic-Gulf .............. Region 04 Great Lakes ........................ Region 05 Ohio .................................... Region 06 Tennessee .......................... Region 07 Upper Mississippi ................ Region 08 Lower Mississippi ................ Region 09 Souris-Red-Rainy ................ Region 10 Missouri .............................. Region 11 Arkansas-White-Red ........... Region 12 Texas-Gulf .......................... Region 13 Rio Grande ......................... Region 14 Upper Colorado ................... Region 15 Lower Colorado ................... Region 16 Great Basin ......................... Region 17 Pacific Northwest ................ Region 18 California ............................. Region 19 Alaska ................................. Region 20 Hawaii .................................
131,988 142,861
511 12
1,867 2,426
28,577
8,425 124 205
3,870 2,226
724
9,323 743 821 360
2,489
605 1,036
141 406
413
1,316 901 682
1,167
5,389 7,576
879 67
380
6,925 395
1,374 394 267
886
7,174 831
25 533
677 367
8,559 7,534
46
419 7,617
83 716
3,505
780 2,137 8,722 2,033 1,500
330
2,387 4,316
233 18,517
6,193 7,336 6,344 7,295 2,260
6,575
25,232 29,062
12 724
107,035,754 106,059,556
270,681 4,943
2,150,077 3,071,446 8,553,704
6,032,719
8,280 142,907 995,762
1,413,430
77,999 2,851,790
806,298 941,363 385,375
5,113,056
244,991 972,424 46,709
140,049
25,848 749,210 641,279
1,113,662 1,150,231
10,882,900 12,934,804 3,089,920
6,235 72,334
9,272,110
100,031 495,260 979,045 75,963
1,518,453 3,332,330
102,787 1,158
244,425
1,675,961 313,023
8,810,729 2,742,441
7,150
142,796 3,923,347
11,518 456,191
7,940,610
91,026 535,294
3,509,449 1,122,093 1,047,513
173,867
2,037,070 5,411,432
440,372 36,166,685
14,728,242 5,829,213 4,854,787 3,588,964 2,209,932
4,859,686
11,619,966 8,727,221
4,943 77,999
24,119,889 26,128,744
41,798 1,355
389,218 2,088,186 2,975,828
1,448,166
1,660 45,773
500,581 405,852
15,878
1,381,555 223,888 243,258 86,448
1,121,198
23,215 426,929
4,982 35,826
7,639
199,651 194,337 537,617 548,616
981,957
3,581,625 290,212
434 28,276
421,094 12,274 67,405
132,854 12,329
258,710 718,953 11,003
217 53,772
183,208 54,506
2,300,097 556,066
360
19,962 608,995
796 103,066 772,264
14,984 139,973
1,072,388 289,577 201,464
23,301
544,012 3,245,413
78,127 6,061,555
2,536,000 1,525,145
549,722 834,735 416,171
708,552
2,830,415 3,031,122
1,355 15,878
39,253,905 40,901,757
22,693 283
1,961,414 4,174,636 9,221,834
2,139,597
1,381 33,280
650,448 339,942
42,738
2,574,439 108,179 116,781 41,938
1,327,538
10,985 419,830
871 22,373
4,619
97,124 118,791 527,488 457,786
1,273,846 3,021,250
570,376 129
20,931
799,818 8,029
43,126 106,867
5,302
287,067 1,314,267
9,696 85
42,129
132,233 30,951
3,021,630 1,244,478
175
9,783 1,273,392
948 76,710
1,543,697
7,089 93,403
1,101,909 152,503 92,480
14,806
302,500 4,978,375
51,072 6,403,446
3,393,173 1,973,304 1,101,142 1,393,959 2,071,523
1,593,732 5,281,792 9,204,676
283 42,738
46,825 9,055
185 9
846 795
11,508
2,788 48 83
1,032 796
221
2,634 395 369 161
721 265 465
65 241
170 585 209 288 520
1,451 2,545
161 28
137
2,932 98
658 124 182
404
1,836 490
20 334
300 202
3,185 2,888
20
155 1,481
30 298
1,467
335 1,060 3,084
860 763
163 916
1,617 80
6,173
1,831 2,886 2,319 3,037 1,094
2,315 6,538
11,524 9
221
7,275,728 2,548,537
10,117 834
126,478 568,483 840,947
582,679
270 18,307
125,042 103,255
12,026
310,048 104,265 110,648 33,917
281,771
9,825 159,471
611 13,715
4,253
74,986 39,828
227,448 164,571
311,890 741,139 76,537
73 10,513
170,620
5,843 36,556 43,933 10,252
74,561
186,459 6,619
212 32,054
55,908 32,912
829,796 192,159
89
9,618 181,179
371 49,359
293,281
5,439 57,056
313,300 114,148 102,782
7,106
200,893 990,604 21,809
1,599,090
812,593 576,715 159,375 331,742 145,436
216,181 761,294 847,305
834 12,026
12,058,774 4,228,360
5,523 223
617,356 1,057,520 2,784,571
863,248
49 14,331
172,915 83,708
(D)
579,687 56,812 52,633 19,513
384,809
4,283 153,182
159 8,670
2,481
36,735 22,844
203,779 132,709
496,370 689,165 132,344
26 7,557
319,912
2,256 25,797 35,509
4,187
90,934 350,911
7,408 60
26,545
39,652 19,631
1,085,918 437,377
9
4,792 355,518
(D)29,957
603,643
2,776 38,300
319,983 58,397 48,600
(D)
109,886 1,355,874
12,699 1,962,618
1,162,078
700,732 358,101 528,225 701,413
499,365
1,387,950 2,772,162
223 (D)
See footnote(s) at end of table. --continued

170 2008 FRIS – GENERAL DATA 2007 CENSUS OF AGRICULTURE USDA, National Agricultural Statistics Service
Table 41. Barriers to Making Improvements to Reduce Energy Use or Conserve Water: 2008 and 2003 - Con.
[Excludes institutional, research, and experimental farms and farms with horticulture. For meaning of abbreviations and symbols, see introductory text]
Risk of reduced yield or poor crop quality
Physical field/crop condition limit system improvements
Improvements will not reduce costs enough to cover installation costs
Geographic area Farms Acres
irrigated 2 Acre-feet applied 2 Farms Acres
irrigated 2 Acre-feet applied 2 Farms Acres
irrigated 2 Acre-feet applied 2
United States .............................2008 .. 2003 .. 2008 DATA Alabama ............................................... Alaska ................................................... Arizona ................................................. Arkansas ............................................... California .............................................. Colorado ............................................... Connecticut ........................................... Delaware .............................................. Florida ................................................... Georgia ................................................. Hawaii ................................................... Idaho ..................................................... Illinois .................................................... Indiana .................................................. Iowa ...................................................... Kansas .................................................. Kentucky ............................................... Louisiana .............................................. Maine .................................................... Maryland ............................................... Massachusetts ...................................... Michigan ............................................... Minnesota ............................................. Mississippi ............................................ Missouri ................................................ Montana ................................................ Nebraska .............................................. Nevada ................................................. New Hampshire .................................... New Jersey ........................................... New Mexico .......................................... New York .............................................. North Carolina ...................................... North Dakota ........................................ Ohio ...................................................... Oklahoma ............................................. Oregon .................................................. Pennsylvania ........................................ Rhode Island ........................................ South Carolina ...................................... South Dakota ........................................ Tennessee ............................................ Texas .................................................... Utah ...................................................... Vermont ................................................ Virginia .................................................. Washington ........................................... West Virginia ........................................ Wisconsin ............................................. Wyoming ............................................... Water Resources Regions Region 01 New England ....................... Region 02 Mid-Atlantic .......................... Region 03 South Atlantic-Gulf .............. Region 04 Great Lakes ......................... Region 05 Ohio ..................................... Region 06 Tennessee ........................... Region 07 Upper Mississippi ................ Region 08 Lower Mississippi ................ Region 09 Souris-Red-Rainy ................ Region 10 Missouri ............................... Region 11 Arkansas-White-Red ........... Region 12 Texas-Gulf ........................... Region 13 Rio Grande .......................... Region 14 Upper Colorado ................... Region 15 Lower Colorado ................... Region 16 Great Basin ......................... Region 17 Pacific Northwest ................. Region 18 California ............................. Region 19 Alaska ................................. Region 20 Hawaii .................................
18,578 9,818
54 1
314 355
6,904
342 7
57 451 282
97
1,281 128 104
58
440 131 123
5 22
88
234 35 78
293
572 1,255
48 20 57
368
38 75 16 24
98
560 115
- 175
62 33
390 698
2
38 1,461
15 102 472
120 298
1,063 301 245
26
278 622
10 2,660
674 278 251 303 336
949
3,159 6,907
1 97
3,559,851 4,708,089
7,593 (D)
43,359 363,468 518,786
149,000
(D) 13,722 52,419 25,602
838
221,505 37,307 41,675 13,009
227,624
5,186 95,677
322 4,873
480
30,599 25,649 52,239
122,257
93,049 673,229 47,517
288 3,980
60,567
2,918 8,962 7,836 1,633
24,095 82,220
961 -
6,133
13,419 6,713
209,434 68,245
(D)
4,360 72,797
(D) 24,105 93,501
1,315 28,082
104,079 45,143 40,002
(D)
88,215 564,449
4,732 989,152
386,855 107,688 45,870 76,946 45,669
122,758 384,895 521,486
(D) 838
5,742,434 8,881,210
3,877 (D)
197,244 631,344
1,570,471
197,741 160
9,149 64,807 26,146
1,867
390,929 15,294 20,654 12,610
270,419
2,348 93,365
(D)2,811
402
14,659 15,842 53,108
108,434
137,309 696,873 76,902
87 3,690
130,067
2,302 4,878 6,423
585
28,401 140,296
605 -
5,017
10,586 4,218
277,796 161,706
(D)
2,266 158,883
(D)23,804
165,925
708 18,879
108,500 25,143 18,078
(D)
54,646 724,912
3,107 1,099,654
622,544 129,390 91,862
124,356 199,323
228,458 719,184
1,571,011 (D)
1,867
20,888 8,951
36 -
191 195
8,219
515 7
12 657 145
93
1,576 145
89 22
222
60 98
1 20
45 88 12 82
235
1,091 1,670
53 9
49
594 15 77 44
9
13 1,048
104 -
29
160 56
245 1,017
-
74 1,231
2 55
478
62 242 974 140 139
48
198 433
20 3,430
341 204 442 637 276
1,094 3,884 8,231
- 93
3,254,283 4,379,816
4,032 -
52,928 215,570 475,868
184,896
225 1,783
53,091 11,633
725
327,748 38,086 16,065
4,361
131,770 2,773
87,728 (D)
4,403
292 26,081
1,760 49,902 54,120
109,202 647,936 76,361
(D)3,779
44,072
(D)6,390
11,359 1,724
7,684
120,228 692
- 4,252
32,392
2,951 132,402 75,970
-
5,703 84,239
(D)8,766
131,347
856 14,696 82,955 31,313 20,676
2,863
47,601 362,514
3,786 1,007,623
223,861 89,502 34,005
105,049 55,610
142,379 541,801 486,468
- 725
5,717,695 8,049,323
2,617 -
285,587 430,124
1,522,380
271,558 116
1,853 104,365 10,370
946
629,184 17,164
6,299 3,244
192,681
1,311 79,265
(D) 2,351
105
13,035 1,180
55,465 44,821
148,008 589,908 100,357
43 2,659
89,009
510 2,570 9,486
549
11,208 207,203
489 -
1,846
25,089 2,564
226,766 152,448
-
2,561 213,984
(D) 5,812
248,585
(D) 9,133
125,491 15,100
9,318
2,564 25,609
550,714 (D)
1,060,100
334,620 164,590 74,112
220,162 292,409
254,685
1,055,965 1,519,970
- 946
33,725 21,304
108 2
113 566
7,426
1,976 20 56
575 553
134
3,149 187 213
82
721 132 252
42 102
147 310 308 190 227
1,950 1,866
239 18 49
1,555
90 380 136
52
250 3,060
64 9
73
253 81
2,415 1,467
4
108 652
28 259
1,076
236 360
1,716 477 378
80
725 1,054
54 5,389
1,694 1,920 1,680
921 145
1,705 7,593 7,462
2 134
7,132,837 10,442,599
14,152 (D)
74,454 672,025
1,047,357
420,945 593
7,036 133,943 119,069
846
372,797 55,273 81,228 23,220
375,507
6,967 129,603
2,251 9,902
2,532
61,477 68,295
178,425 157,135
290,477
1,066,039 73,479
254 7,020
57,446
1,517 21,644 41,082
2,860
43,227 333,023
2,045 14
16,212
54,014 11,466
517,013 151,142
4
7,833 155,576
(D)35,600
228,206
5,644 32,753
303,817 90,884 57,396
(D)
164,121 1,031,443
22,736 1,824,039
671,646 314,557 147,390 189,062 79,884
219,915 884,469
1,083,398 (D)
846
11,934,612 18,326,913
7,854 (D)
405,689 1,366,433 3,392,938
676,440
(D)4,949
137,160 87,124
1,162
633,562 22,935 34,356 10,884
434,685
3,807 115,482
413 7,601
1,041
27,025 42,165
208,974 124,025
335,391 984,982 131,393
(D)5,172
116,569
568 13,551 34,436
1,537
47,770 581,205
874 10
18,092
40,513 7,103
703,761 345,289
5
3,414 358,579
(D)21,985
434,584
2,386 21,192
261,981 42,014 22,825
(D)
88,680 1,624,563
15,274 2,001,163
944,504 425,248 278,954 322,578 429,434
421,896
1,577,873 3,445,872
(D)1,162
See footnote(s) at end of table. --continued

2007 CENSUS OF AGRICULTURE 2008 FRIS – GENERAL DATA 171 USDA, National Agricultural Statistics Service
Table 41. Barriers to Making Improvements to Reduce Energy Use or Conserve Water: 2008 and 2003 - Con.
[Excludes institutional, research, and experimental farms and farms with horticulture. For meaning of abbreviations and symbols, see introductory text]
Cannot finance improvements Landlord will not share in cost Uncertainty about future availability of water
Geographic area Farms Acres
irrigated 2 Acre-feet applied 2 Farms Acres
irrigated 2 Acre-feet applied 2 Farms Acres
irrigated 2 Acre-feet applied 2
United States ............................. 2008 .. 2003 .. 2008 DATA Alabama ............................................... Alaska .................................................. Arizona ................................................. Arkansas .............................................. California .............................................. Colorado ............................................... Connecticut .......................................... Delaware .............................................. Florida .................................................. Georgia ................................................ Hawaii .................................................. Idaho .................................................... Illinois ................................................... Indiana ................................................. Iowa ..................................................... Kansas ................................................. Kentucky .............................................. Louisiana .............................................. Maine ................................................... Maryland .............................................. Massachusetts ..................................... Michigan ............................................... Minnesota ............................................. Mississippi ............................................ Missouri ................................................ Montana ............................................... Nebraska .............................................. Nevada ................................................. New Hampshire .................................... New Jersey .......................................... New Mexico .......................................... New York .............................................. North Carolina ...................................... North Dakota ........................................ Ohio ..................................................... Oklahoma ............................................. Oregon ................................................. Pennsylvania ........................................ Rhode Island ........................................ South Carolina ..................................... South Dakota ....................................... Tennessee ........................................... Texas ................................................... Utah ..................................................... Vermont ................................................ Virginia ................................................. Washington .......................................... West Virginia ........................................ Wisconsin ............................................. Wyoming .............................................. Water Resources Regions Region 01 New England ....................... Region 02 Mid-Atlantic ......................... Region 03 South Atlantic-Gulf .............. Region 04 Great Lakes ........................ Region 05 Ohio .................................... Region 06 Tennessee .......................... Region 07 Upper Mississippi ................ Region 08 Lower Mississippi ................ Region 09 Souris-Red-Rainy ................ Region 10 Missouri .............................. Region 11 Arkansas-White-Red ........... Region 12 Texas-Gulf .......................... Region 13 Rio Grande ......................... Region 14 Upper Colorado ................... Region 15 Lower Colorado ................... Region 16 Great Basin ......................... Region 17 Pacific Northwest ................ Region 18 California ............................. Region 19 Alaska ................................. Region 20 Hawaii .................................
37,512 20,122
97 3
844 807
5,365
2,471 16 21
647 794
190
3,957 56
120 43
647 130 190
11 39
78
256 159 126 334
1,329 1,233
280 13
132
2,519 189 249
77 48
125
4,346 74
9 245
188
50 2,273 3,058
17
233 2,018
21 175
1,210
131 414
2,160 471 293
52
388 1,157
36 4,254
1,525 1,878 2,643 1,992
936
2,710 10,449
5,830 3
190
6,428,045 8,318,070
10,012 995
104,168 761,984 732,336
395,334
150 5,842
64,154 145,692
9,085
516,020 19,896 21,050 14,446
186,413
1,714 95,374
472 5,389
1,531
37,433 35,408
121,970 114,335
234,443 700,554 96,326
236 6,950
112,713
2,034 12,068 34,768
2,035
68,290 302,999
1,172 14
5,342
65,585 3,494
625,830 197,579
127
8,620 221,858
114 34,305
289,386
2,411 27,504
236,209 55,027 22,869
5,587
87,692 1,001,060
17,303 1,307,704
561,407 384,796 200,677 318,493 108,875
279,780
1,018,000 782,571
995 9,085
11,221,456 14,804,544
5,226 222
544,529 1,473,040 2,563,354
531,977
91 5,424
62,541 123,479
(D)
960,300 9,686 9,375 5,978
224,688
625 97,245
107 3,452
792
15,052 22,324
122,525 89,142
238,001 696,644 195,419
55 5,273
195,855
1,323 3,310
25,733 1,264
76,222
545,999 772
10 (D)
59,027
1,342 832,449 421,784
115
3,588 407,448
28 26,356
577,495
1,056 18,619
197,375 29,321 10,899
(D)
50,699 1,607,760
11,080 1,529,909
771,151 518,724 350,963 485,701 555,523
572,839
1,821,803 2,653,438
222 (D)
6,815 8,194
5 -
58 688 427
427
6 23 28
140
42 430
62 41 41
369
54 148
- 18
7
52 72
139 173
191 829
37 3
11
52 -
12 47
4
33 391
- - 1
21 15
831 384
-
16 336
- 69 82
16 59
202 73 88
17
205 967
23 1,542
554 704
91 131 142
321
1,180 458
- 42
4,026,107 6,382,676
1,514 -
109,197 788,829 408,676
165,774
200 2,046
11,857 38,980
(D)
169,000 36,200 25,087 11,439
273,511
1,415 101,685
- 4,068
147
12,249 14,676
105,020 108,265
90,328
746,112 16,260
12 972
21,343
- 3,020
17,667 2,020
16,981
125,098 - -
(D)
6,619 3,218
423,777 43,287
-
2,362 79,637
- 11,401 25,796
359 9,268
57,830 19,821 30,279
(D)
55,648 1,019,553
5,966 994,227
480,823 268,491 49,314 54,147
110,289
62,147 370,057 436,592
- (D)
6,850,516 11,026,594
1,180 -
602,661 1,503,783 1,492,869
258,064
111 1,494
22,336 22,629
(D)
300,212 21,707
7,338 4,008
318,385
875 103,411
- 2,281
147
6,613 6,638
102,749 94,576
93,520
615,083 42,335
5 1,145
55,022
- 1,082
14,242 1,015
18,240
226,402 - -
(D)
4,767 1,922
587,635 85,275
-
817 171,800
- 5,742
50,084
262 5,628
50,232 11,612
9,470
(D) 27,686
1,656,606 3,969
898,893
664,400 367,862 149,807 69,983
608,012
117,648 666,545
1,540,762 -
(D)
19,536 13,790
70 -
355 168
5,729
1,054 8
16 134 127
62
1,953 18
8 -
427 47 56
8 3
38 31 29 38 59
736 502 299
4 62
1,741
5 93 37 10
38
1,051 13
- 31
62 10
1,974 1,231
-
5 64 12 11
1,107
58 102 442
49 64
16 57
269 6
2,694
1,152 1,542 1,846
540 425
1,703 2,482 6,027
- 62
3,703,317 5,408,640
4,113 -
37,610 170,290 685,633
280,816
148 6,900
20,541 18,942
626
240,730 11,900
5,565 -
307,584 561
25,786 427 138
190
10,395 2,764
30,707 24,524
169,008 410,996 70,878
180 2,485
104,174
374 7,439 9,038 1,669
36,964
136,992 610
- 2,270
13,270
743 524,780 89,954
-
1,614 50,438
155 1,956
180,440
945 11,552 53,094 13,806
5,486
421 15,565
237,277 3,220
867,500
544,050 369,670 154,866 111,251 41,606
134,588 421,690 716,104
- 626
6,489,259 9,577,502
2,139 -
208,255 281,662
2,221,331
383,757 59
5,025 19,279 14,437
730
495,522 6,565 2,160
-
373,359 376
37,349 71 10
95
5,586 863
31,407 22,439
137,678 321,898 152,521
36 2,125
165,199
98 2,763 7,757
619
37,916 252,787
208 -
1,688
10,850 326
617,288 192,950
-
747 97,702
142 1,096
372,392
261 8,078
40,208 7,030 3,373
162
6,951 352,403
2,212 867,325
697,952 461,936 213,820 239,032 216,746
310,546 779,548
2,280,947 -
730
See footnote(s) at end of table. --continued

172 2008 FRIS – GENERAL DATA 2007 CENSUS OF AGRICULTURE USDA, National Agricultural Statistics Service
Table 41. Barriers to Making Improvements to Reduce Energy Use or Conserve Water: 2008 and 2003 - Con.
[Excludes institutional, research, and experimental farms and farms with horticulture. For meaning of abbreviations and symbols, see introductory text]
Will not be farming this operation long enough to justify improvements Other
Geographic area Farms Acres
irrigated 2 Acre-feet applied 2 Farms Acres
irrigated 2 Acre-feet applied 2
United States .............................2008 .. 2003 .. 2008 DATA Alabama ............................................... Alaska ................................................... Arizona ................................................. Arkansas ............................................... California .............................................. Colorado ............................................... Connecticut ........................................... Delaware .............................................. Florida ................................................... Georgia ................................................. Hawaii ................................................... Idaho ..................................................... Illinois .................................................... Indiana .................................................. Iowa ...................................................... Kansas .................................................. Kentucky ............................................... Louisiana .............................................. Maine .................................................... Maryland ............................................... Massachusetts ...................................... Michigan ............................................... Minnesota ............................................. Mississippi ............................................ Missouri ................................................ Montana ................................................ Nebraska .............................................. Nevada ................................................. New Hampshire .................................... New Jersey ........................................... New Mexico .......................................... New York .............................................. North Carolina ...................................... North Dakota ........................................ Ohio ...................................................... Oklahoma ............................................. Oregon .................................................. Pennsylvania ........................................ Rhode Island ........................................ South Carolina ...................................... South Dakota ........................................ Tennessee ............................................ Texas .................................................... Utah ...................................................... Vermont ................................................ Virginia .................................................. Washington ........................................... West Virginia ........................................ Wisconsin ............................................. Wyoming ............................................... Water Resources Regions Region 01 New England ....................... Region 02 Mid-Atlantic .......................... Region 03 South Atlantic-Gulf .............. Region 04 Great Lakes ......................... Region 05 Ohio ..................................... Region 06 Tennessee ........................... Region 07 Upper Mississippi ................ Region 08 Lower Mississippi ................ Region 09 Souris-Red-Rainy ................ Region 10 Missouri ............................... Region 11 Arkansas-White-Red ........... Region 12 Texas-Gulf ........................... Region 13 Rio Grande .......................... Region 14 Upper Colorado ................... Region 15 Lower Colorado ................... Region 16 Great Basin ......................... Region 17 Pacific Northwest ................. Region 18 California ............................. Region 19 Alaska ................................. Region 20 Hawaii .................................
17,280 6,204
44 2
355 226
4,420
1,098 32 41
432 213
143 583
89 79 51
258
64 96
- 53
51 50
155 141 231
540 933
40 7
71
842 25 88 55 30
19
824 131
5 68
48 35
1,549 1,070
-
26 1,575
18 120 254
95 300 870 138 160
28
335 496
24 2,668
495
1,334 956 263 356
1,054 2,992 4,571
2 143
2,451,156 1,798,301
904 (D)
35,365 237,606 272,740
152,075
265 7,456
32,007 23,224
855
105,428 19,310 18,764 12,199
87,918
1,366 20,966
- 7,181
331
14,644 17,340 59,179 40,555
96,719
387,143 13,519
33 12,652
28,875
970 4,272
12,823 1,627
8,824
45,517 1,458
5 6,480
15,095
558 387,366 66,917
-
2,837 110,204
(D)10,002 69,364
634 31,856 69,031 22,205 12,036
(D)
51,312 332,242
4,461 677,688
190,475 298,880 49,741 52,896 36,544
79,006
274,384 266,355
(D)855
3,879,158 3,672,011
406 (D)
196,255 482,235 825,254
243,095
105 4,839
40,160 15,558
1,882
209,291 9,650 6,676 4,188
94,954
811 30,202
- 3,255
44
7,300 9,647
51,906 31,224
128,327 323,381 34,084
9 9,276
64,823
1,374 1,949 9,388
666
21,345 78,612
565 25
7,365
13,103 353
478,210 141,856
-
1,413 185,886
(D)5,047
103,121
182 19,686 68,364 10,487
5,776
(D)22,359
562,857 3,432
722,131
247,938 358,488 115,752 79,563
202,000
227,473 478,885 751,579
(D)1,882
14,272 15,995
74 -
440 96
2,223
2,276 11 22
820 202
139 777
58 68 28
292
22 26 33 47
3
117 174
26 139
465 573 189
14 39
153
67 157
42 8
118 135
49 -
13
36 38
1,065 900
5
8 1,996
11 17 61
63 205
1,252 180
85
32 223 198
35 1,452
742
1,012 126
2,053 554
573
3,124 2,224
- 139
2,814,618 5,820,210
6,637 -
64,016 107,753 526,092
176,617
(D) 6,142
163,856 62,541
1,395
137,627 30,001 27,002
7,904
131,431 625
22,014 2,292 3,765
525
33,737 25,106 20,218 57,220
115,566 376,233 40,512
(D) 1,093
38,940
1,205 4,465
14,271 960
66,628 71,796
323 -
5,808
26,620 9,527
235,826 47,143
140
160 108,148
271 4,285
29,678
3,345 12,744
243,604 43,198 26,244
3,119
48,098 188,929 12,074
616,724
337,092 135,811 63,846 96,907 67,016
38,417
344,463 531,592
- 1,395
4,767,103 10,807,884
2,977 -
313,329 281,925
1,417,991
256,265 95
4,950 247,149 58,067
3,699
351,167 17,509 15,057
4,270
154,212 274
16,211 313
1,741
704 19,821 17,754 15,854 40,618
171,995 262,501 87,635
5 847
51,081
1,543 1,391
11,701 587
62,381
149,643 124
- 3,943
5,103 5,654
248,960 121,981
46
96 253,001
30 1,804
83,102
1,118 9,281
314,415 24,843 15,376
1,611
28,465 331,992
8,036 614,576
357,434 141,917 135,856 146,662 328,217
94,765
779,098 1,429,741
- 3,699
1 Data for 2008 include only positive responses and respondents could choose more than one source of information. 2 Acres irrigated and acre-feet applied are totals for all irrigation on these farms.

2007 CENSUS OF AGRICULTURE 2008 FRIS – GENERAL DATA 173 USDA, National Agricultural Statistics Service
Table 42. Source of Irrigation Information Relied on to Reduce Irrigation Costs or to Conserve Water: 2008 and 2003
[Excludes institutional, research, and experimental farms and farms with horticulture. For meaning of abbreviations and symbols, see introductory text]
Total 1 Extension agents or university specialists
Private irrigation specialists or consultants
Irrigation equipment dealers
Irrigation district or water supplier
Geographic area
Farms Acres irrigated 2 Farms Acres
irrigated 2 Farms Acresirrigated 2 Farms Acres
irrigated 2 Farms Acresirrigated 2
United States ............................. 2008 .. 2003 .. 2008 DATA Alabama ............................................... Alaska .................................................. Arizona ................................................. Arkansas .............................................. California .............................................. Colorado ............................................... Connecticut .......................................... Delaware .............................................. Florida .................................................. Georgia ................................................ Hawaii .................................................. Idaho .................................................... Illinois ................................................... Indiana ................................................. Iowa ..................................................... Kansas ................................................. Kentucky .............................................. Louisiana .............................................. Maine ................................................... Maryland .............................................. Massachusetts ..................................... Michigan ............................................... Minnesota ............................................. Mississippi ............................................ Missouri ................................................ Montana ............................................... Nebraska .............................................. Nevada ................................................. New Hampshire .................................... New Jersey .......................................... New Mexico .......................................... New York .............................................. North Carolina ...................................... North Dakota ........................................ Ohio ..................................................... Oklahoma ............................................. Oregon ................................................. Pennsylvania ........................................ Rhode Island ........................................ South Carolina ..................................... South Dakota ....................................... Tennessee ........................................... Texas ................................................... Utah ..................................................... Vermont ................................................ Virginia ................................................. Washington .......................................... West Virginia ........................................ Wisconsin ............................................. Wyoming .............................................. Water Resources Regions Region 01 New England ....................... Region 02 Mid-Atlantic ......................... Region 03 South Atlantic-Gulf .............. Region 04 Great Lakes ........................ Region 05 Ohio .................................... Region 06 Tennessee .......................... Region 07 Upper Mississippi ................ Region 08 Lower Mississippi ................ Region 09 Souris-Red-Rainy ................ Region 10 Missouri .............................. Region 11 Arkansas-White-Red ........... Region 12 Texas-Gulf .......................... Region 13 Rio Grande ......................... Region 14 Upper Colorado ................... Region 15 Lower Colorado ................... Region 16 Great Basin ......................... Region 17 Pacific Northwest ................ Region 18 California ............................. Region 19 Alaska ................................. Region 20 Hawaii .................................
168,473 210,106
537 18
2,557 3,567
37,878
9,141 100 269
4,702 3,136
894
9,818 935 920 473
4,224
688 1,331
115 480
666
1,779 1,384 1,076 1,599
6,481
12,543 1,449
72 489
6,947
466 1,629
536 291
1,127
10,214 765
38 615
977 507
10,534 8,911
62
611 10,049
38 1,094 3,741
1,008 2,509
10,799 2,626 1,677
487
3,373 6,222
362 26,876
8,512 8,492 6,407 7,343 3,019
8,511
31,127 38,211
18 894
48,059,412 52,492,687
68,578 1,554
756,041 3,904,133 6,695,590
2,470,118
1,992 95,618
1,143,006 917,766
98,396
2,733,945 395,590 358,622 153,399
2,479,856
26,528 762,453 16,591 76,181
16,228
483,419 478,011
1,386,803 1,075,992
1,603,173 7,315,431
599,007 683
49,173
701,389 18,769
127,227 225,766 15,720
355,116
1,465,941 14,115
421 86,051
305,773 70,279
4,651,870 909,065
480
42,038 1,429,678
270 379,026
1,096,541
36,065 275,038
2,341,206 655,598 274,636
37,012
1,228,247 6,477,232
138,128 11,975,048
4,693,428 3,141,397
921,748 1,039,223
828,948
1,411,484 5,708,972 6,776,052
1,554 98,396
61,269 70,300
266 3
615 2,327
10,462
3,470 26
160 2,350 1,992
331
1,957 292 295 144
1,511
421 810
95 244
462 886 663 571 805
1,848 6,509
375 54
300
2,106 252 868 272 120
434
3,183 239
14 398
319 286
4,469 3,073
27
188 3,293
16 461
1,007
666 1,126 5,838 1,231
821
287 1,342 3,935
192 11,351
3,549 3,759 1,779 2,843
812
2,307 8,519
10,578 3
331
23,619,226 21,560,294
40,155 767
353,464 2,666,542 3,465,478
930,080
1,210 53,154
906,585 631,376
77,473
923,595 129,661 113,112 51,304
917,691 12,455
484,945 3,903
35,503
12,829 279,275 257,978 818,331 555,815
595,496
3,811,352 240,255
611 34,612
193,545
9,332 79,412
136,756 5,339
128,955 762,447
6,556 237
47,869
100,173 42,629
2,079,372 444,950
222
20,134 559,180
179 170,316 426,616
18,916 149,952
1,694,997 336,636 84,243
26,591
546,065 4,095,794
90,992 5,680,361
1,905,910 1,419,002
343,261 440,885 403,216
575,527
2,220,095 3,508,543
767 77,473
39,557 31,511
62 -
380 894
12,568
1,780 5
69 1,008
685
113 1,203
165 227
95
2,445 24
266 17 64
150 384 281 402 355
725
5,735 148
7 58
423
51 172 142
35
210 1,753
104 4
132
202 77
2,169 892
1
77 2,049
- 308 441
183 298
2,142 595 222
65
704 1,501
140 8,728
3,285 1,349
773 621 390
917
4,952 12,579
- 113
19,225,263 15,991,695
14,770 -
230,479 1,214,703 3,066,576
1,040,940
225 36,363
525,658 322,502
8,215
990,611 81,220
125,367 30,925
1,906,306
4,356 147,480
2,226 25,538
3,372
177,898 143,290 489,586 260,757
314,756
3,766,754 142,900
110 10,287
261,337
3,080 41,810 72,224
1,168
109,175 555,738
4,517 (D)
26,010
67,271 24,102
1,820,685 163,683
(D)
10,004 713,337
- 118,000 148,753
6,032 83,712
929,783 239,900 62,950
14,647
346,391 1,865,906
57,157 5,285,851
2,798,131 1,098,625
337,462 187,247 253,734
357,194
2,227,475 3,064,851
- 8,215
46,514 50,476
159 9
256 739
6,331
1,930 13
137 1,092 1,018
193
2,298 636 621 263
1,716
180 380
63 231
250 997 758 445 670
2,060 5,212
186 32
232
429 159 692 254 121
460
2,844 329
15 283
390 200
3,936 1,403
38
262 4,161
16 661 754
382 1,137 3,325 1,499
693
175 1,965 1,932
218 10,012
2,320 3,253
492 1,208
277
1,288 9,694 6,442
9 193
21,065,996 18,576,691
37,831 481
119,704 1,081,841 2,349,885
807,745
1,269 55,146
292,213 464,397
16,428
1,483,623 310,178 255,995 98,368
1,210,027
12,540 298,942 12,287 56,189
7,338
379,367 312,573 689,019 437,342
757,165
3,512,232 251,989
505 28,935
250,369
9,047 89,477
119,408 5,950
149,597 793,776
7,613 141
55,636
178,999 50,338
2,254,185 313,050
294
18,503 799,077
158 320,618 308,206
21,662 165,379 935,341 517,589 194,266
22,598
899,659 2,308,902
78,904 5,652,097
1,932,140 1,618,627
264,014 245,140 125,544
538,618
3,114,877 2,413,730
481 16,428
25,624 31,362
4 -
690 325
6,799
2,191 10
7 197 198
50
2,394 11 14 11
393
6 33
- 6
48 29 58 51 63
1,791 1,554
292 - 5
384
33 80 69 12
29
1,001 23
1 3
142
16 1,588 2,081
-
- 2,034
- 9
889
59 41
482 60 28
9
70 411
25 5,121
1,313
995 433
1,076 847
2,048 5,721 6,835
- 50
7,037,970 7,264,004
32 -
121,225 334,383
1,587,547
389,676 (D)
2,530 161,882 59,863
1,687
596,563 2,745 7,970 5,611
259,902
120 24,865
- 1,069
857
21,970 23,133 58,486 28,711
317,588 926,437 76,341
- 1,150
64,662
400 8,865
37,410 44
23,446
310,142 166 (D)
1,000
37,307 4,812
832,078 177,953
-
- 246,895
- 5,261
275,173
870 4,915
231,642 22,156
3,903
45 35,629
385,423 3,969
1,795,030
564,261 600,673 104,101 146,733 134,159
247,483
1,160,716 1,594,575
- 1,687
See footnote(s) at end of table. --continued
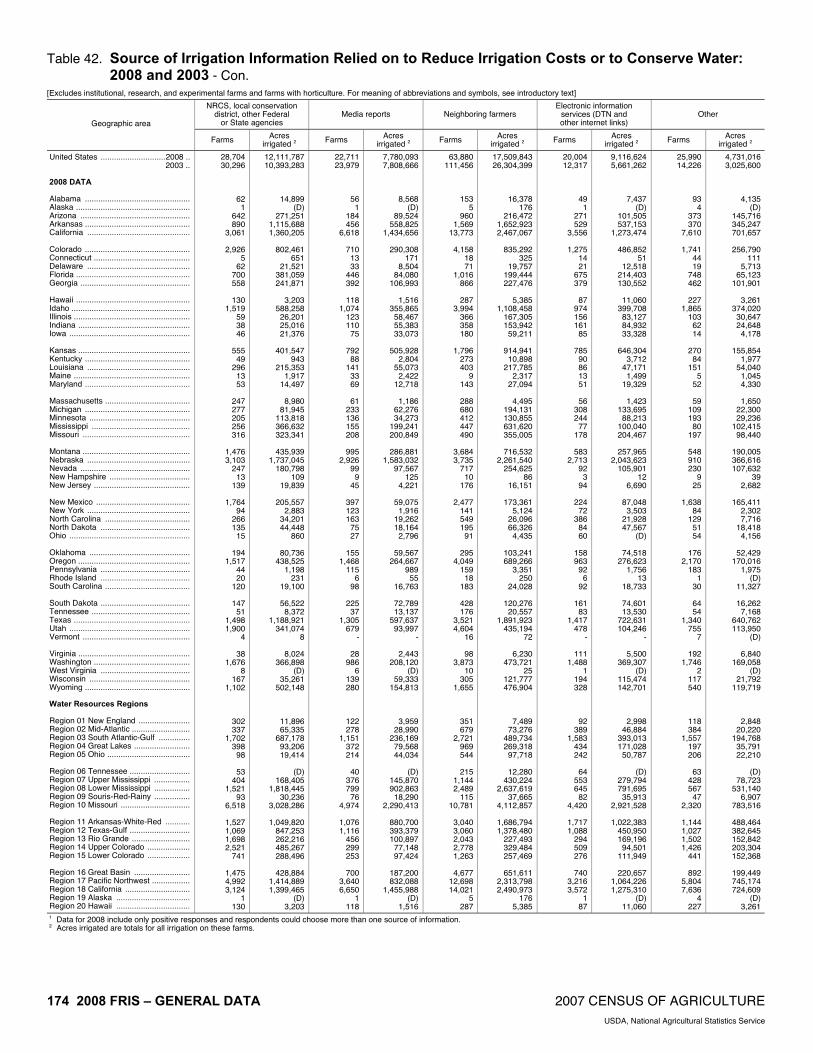
174 2008 FRIS – GENERAL DATA 2007 CENSUS OF AGRICULTURE USDA, National Agricultural Statistics Service
Table 42. Source of Irrigation Information Relied on to Reduce Irrigation Costs or to Conserve Water: 2008 and 2003 - Con.
[Excludes institutional, research, and experimental farms and farms with horticulture. For meaning of abbreviations and symbols, see introductory text]
NRCS, local conservation district, other Federal
or State agencies Media reports Neighboring farmers
Electronic information services (DTN and other internet links)
Other Geographic area
Farms Acres irrigated 2 Farms Acres
irrigated 2 Farms Acres irrigated 2 Farms Acres
irrigated 2 Farms Acres irrigated 2
United States .............................2008 .. 2003 .. 2008 DATA Alabama ............................................... Alaska ................................................... Arizona ................................................. Arkansas ............................................... California .............................................. Colorado ............................................... Connecticut ........................................... Delaware .............................................. Florida ................................................... Georgia ................................................. Hawaii ................................................... Idaho ..................................................... Illinois .................................................... Indiana .................................................. Iowa ...................................................... Kansas .................................................. Kentucky ............................................... Louisiana .............................................. Maine .................................................... Maryland ............................................... Massachusetts ...................................... Michigan ............................................... Minnesota ............................................. Mississippi ............................................ Missouri ................................................ Montana ................................................ Nebraska .............................................. Nevada ................................................. New Hampshire .................................... New Jersey ........................................... New Mexico .......................................... New York .............................................. North Carolina ...................................... North Dakota ........................................ Ohio ...................................................... Oklahoma ............................................. Oregon .................................................. Pennsylvania ........................................ Rhode Island ........................................ South Carolina ...................................... South Dakota ........................................ Tennessee ............................................ Texas .................................................... Utah ...................................................... Vermont ................................................ Virginia .................................................. Washington ........................................... West Virginia ........................................ Wisconsin ............................................. Wyoming ............................................... Water Resources Regions Region 01 New England ....................... Region 02 Mid-Atlantic .......................... Region 03 South Atlantic-Gulf .............. Region 04 Great Lakes ......................... Region 05 Ohio ..................................... Region 06 Tennessee ........................... Region 07 Upper Mississippi ................ Region 08 Lower Mississippi ................ Region 09 Souris-Red-Rainy ................ Region 10 Missouri ............................... Region 11 Arkansas-White-Red ........... Region 12 Texas-Gulf ........................... Region 13 Rio Grande .......................... Region 14 Upper Colorado ................... Region 15 Lower Colorado ................... Region 16 Great Basin ......................... Region 17 Pacific Northwest ................. Region 18 California ............................. Region 19 Alaska ................................. Region 20 Hawaii .................................
28,704 30,296
62 1
642 890
3,061
2,926 5
62 700 558
130
1,519 59 38 46
555
49 296
13 53
247 277 205 256 316
1,476 3,103
247 13
139
1,764 94
266 135
15
194 1,517
44 20
120
147 51
1,498 1,900
4
38 1,676
8 167
1,102
302 337
1,702 398
98
53 404
1,521 93
6,518
1,527 1,069 1,698 2,521
741
1,475 4,992 3,124
1 130
12,111,787 10,393,283
14,899 (D)
271,251 1,115,688 1,360,205
802,461
651 21,521
381,059 241,871
3,203
588,258 26,201 25,016 21,376
401,547
943 215,353
1,917 14,497
8,980
81,945 113,818 366,632 323,341
435,939
1,737,045 180,798
109 19,839
205,557
2,883 34,201 44,448
860
80,736 438,525
1,198 231
19,100
56,522 8,372
1,188,921 341,074
8
8,024 366,898
(D) 35,261
502,148
11,896 65,335
687,178 93,206 19,414
(D)
168,405 1,818,445
30,236 3,028,286
1,049,820
847,253 262,216 485,267 288,496
428,884
1,414,889 1,399,465
(D) 3,203
22,711 23,979
56 1
184 456
6,618
710 13 33
446 392
118
1,074 123 110
75
792 88
141 33 69
61
233 136 155 208
995
2,926 99
9 45
397 123 163
75 27
155
1,468 115
6 98
225
37 1,305
679 -
28 986
6 139 280
122 278
1,151 372 214
40
376 799
76 4,974
1,076 1,116
456 299 253
700
3,640 6,650
1 118
7,780,093 7,808,666
8,568 (D)
89,524 558,825
1,434,656
290,308 171
8,504 84,080
106,993
1,516 355,865 58,467 55,383 33,073
505,928
2,804 55,073
2,422 12,718
1,186
62,276 34,273
199,241 200,849
286,881
1,583,032 97,567
125 4,221
59,075
1,916 19,262 18,164
2,796
59,567 264,667
989 55
16,763
72,789 13,137
597,637 93,997
-
2,443 208,120
(D) 59,333
154,813
3,959 28,990
236,169 79,568 44,034
(D)
145,870 902,863 18,290
2,290,413
880,700 393,379 100,897 77,148 97,424
187,200 832,088
1,455,988 (D)
1,516
63,880 111,456
153 5
960 1,569
13,773
4,158 18 71
1,016 866
287
3,994 366 358 180
1,796
273 403
9 143
288 680 412 447 490
3,684 3,735
717 10
176
2,477 141 549 195
91
295 4,049
159 18
183
428 176
3,521 4,604
16
98 3,873
10 305
1,655
351 679
2,721 969 544
215
1,144 2,489
115 10,781
3,040 3,060 2,043 2,778 1,263
4,677
12,698 14,021
5 287
17,509,843 26,304,399
16,378 176
216,472 1,652,923 2,467,067
835,292
325 19,757
199,444 227,476
5,385
1,108,458 167,305 153,942 59,211
914,941 10,898
217,785 2,317
27,094
4,495 194,131 130,855 631,620 355,005
716,532
2,261,540 254,625
86 16,151
173,361
5,124 26,096 66,326
4,435
103,241 689,266
3,351 250
24,028
120,276 20,557
1,891,923 435,194
72
6,230 473,721
25 121,777 476,904
7,489 73,276
489,734 269,318 97,718
12,280
430,224 2,637,619
37,665 4,112,857
1,686,794 1,378,480
227,493 329,484 257,469
651,611
2,313,798 2,490,973
176 5,385
20,004 12,317
49 1
271 529
3,556
1,275 14 21
675 379
87
974 156 161
85
785 90 86 13 51
56
308 244
77 178
583
2,713 92
3 94
224
72 386
84 60
158 963
92 6
92
161 83
1,417 478
-
111 1,488
1 194 328
92 389
1,583 434 242
64
553 645
82 4,420
1,717 1,088
294 509 276
740
3,216 3,572
1 87
9,116,624 5,661,262
7,437 (D)
101,505 537,153
1,273,474
486,852 51
12,518 214,403 130,552
11,060
399,708 83,127 84,932 33,328
646,304
3,712 47,171
1,499 19,329
1,423
133,695 88,213
100,040 204,467
257,965
2,043,623 105,901
12 6,690
87,048
3,503 21,928 47,567
(D)
74,518 276,623
1,756 13
18,733
74,601 13,530
722,631 104,246
-
5,500 369,307
(D) 115,474 142,701
2,998 46,884
393,013 171,028 50,787
(D)
279,794 791,695 35,913
2,921,528
1,022,383 450,950 169,196 94,501
111,949
220,657 1,064,226 1,275,310
(D) 11,060
25,990 14,226
93 4
373 370
7,610
1,741 44 19
748 462
227
1,865 103
62 14
270
84 151
5 52
59
109 193
80 197
548 910 230
9 25
1,638
84 129
51 54
176
2,170 183
1 30
64 54
1,340 755
7
192 1,746
2 117 540
118 384
1,557 197 206
63
428 567
47 2,320
1,144 1,027 1,502 1,426
441
892 5,804 7,636
4 227
4,731,016 3,025,600
4,135 (D)
145,716 345,247 701,657
256,790
111 5,713
65,123 101,901
3,261
374,020 30,647 24,648
4,178
155,854 1,977
54,040 1,045 4,330
1,650
22,300 29,236
102,415 98,440
190,005 366,616 107,632
39 2,682
165,411
2,302 7,716
18,418 4,156
52,429
170,016 1,975
(D)11,327
16,262
7,168 640,762 113,950
(D)
6,840 169,058
(D)21,792
119,719
2,848 20,220
194,768 35,791 22,210
(D)
78,723 531,140
6,907 783,516
488,464 382,645 152,842 203,304 152,368
199,449 745,174 724,609
(D)3,261
1 Data for 2008 include only positive responses and respondents could choose more than one source of information. 2 Acres irrigated are totals for all irrigation on these farms.

2007 CENSUS OF AGRICULTURE 2008 FRIS – GENERAL DATA 175 USDA, National Agricultural Statistics Service
Table 43. Discontinuance of All Irrigation by Reason: 2008 and 2003 [Excludes institutional, research, and experimental farms and farms with horticulture. For meaning of abbreviations and symbols, see introductory text]
Discontinued irrigation since previous census year Reason for discontinuance 1
Farms reporting discontinuance to be
permanent
Sufficient soil moisture
Surplus soil moisture or flooding
Shortage of surface water
Shortage of ground water
Geographic area Farms
Acres irrigated
in previous census year 2 Farms
Acres irrigated
in previous census year 2
Farms
Acres irrigated
in previous census year 2
Farms
Acres irrigated
in previous census year 2
Farms
Acres irrigated
in previous census year 2
Farms
Acres irrigated
in previous census year 2
United States ............................2008 .. 2003 .. 2008 DATA Alabama .............................................. Alaska ................................................. Arizona ................................................ Arkansas ............................................. California ............................................. Colorado .............................................. Connecticut ......................................... Delaware ............................................. Florida ................................................. Georgia ............................................... Hawaii ................................................. Idaho ................................................... Illinois .................................................. Indiana ................................................ Iowa .................................................... Kansas ................................................ Kentucky ............................................. Louisiana ............................................. Maine .................................................. Maryland ............................................. Massachusetts .................................... Michigan .............................................. Minnesota ............................................ Mississippi ........................................... Missouri ............................................... Montana .............................................. Nebraska ............................................. Nevada ................................................ New Hampshire ................................... New Jersey ......................................... New Mexico ......................................... New York ............................................. North Carolina ..................................... North Dakota ....................................... Ohio .................................................... Oklahoma ............................................ Oregon ................................................ Pennsylvania ....................................... Rhode Island ....................................... South Carolina .................................... South Dakota ...................................... Tennessee .......................................... Texas .................................................. Utah .................................................... Vermont ............................................... Virginia ................................................ Washington ......................................... West Virginia ....................................... Wisconsin ............................................ Wyoming ............................................. Water Resources Regions Region 01 New England ...................... Region 02 Mid-Atlantic ........................ Region 03 South Atlantic-Gulf ............. Region 04 Great Lakes ....................... Region 05 Ohio ................................... Region 06 Tennessee ......................... Region 07 Upper Mississippi ............... Region 08 Lower Mississippi ............... Region 09 Souris-Red-Rainy ............... Region 10 Missouri ............................. Region 11 Arkansas-White-Red .......... Region 12 Texas-Gulf ......................... Region 13 Rio Grande ........................ Region 14 Upper Colorado .................. Region 15 Lower Colorado .................. Region 16 Great Basin ........................ Region 17 Pacific Northwest ............... Region 18 California ............................ Region 19 Alaska ................................ Region 20 Hawaii ................................
22,416 30,057
330 19
440 319
1,746
1,094 81 66
1,132 385
170
1,172 311 320 197
266 729 551 103 124
169 577 306 249 442
216
1,187 70 54
105
499 527 894
80 380
339
1,242 388
18 353
113 430
2,264 690
69
246 483
45 270 156
435 1,067 3,170 1,088 1,583
306
1,067 973
55 2,102
1,154 1,801
702 1,221
395
458 2,857 1,793
19 170
1,302,296 1,780,887
9,360 1,339 7,775
31,485 118,380
37,397
1,001 1,019
44,490 25,706
3,014
38,834 31,342 21,573 13,472
60,626 10,410 35,215
3,420 1,751
1,189
18,443 22,133 16,643 66,300
12,320
235,758 5,226
98 890
28,258 13,380 21,207 13,124
3,784
20,302 38,387
3,581 59
6,092
17,626 5,290
144,098 17,164
501
8,079 29,051
424 11,345 43,935
5,726 17,571
108,665 33,392 29,693
3,516
96,928 97,969
8,366 374,751
113,174 102,243 22,325 26,472
9,844
20,858 101,120 125,330
1,339 3,014
2,236 2,553
24 1
218 60
753
- 11
- 7 -
13 - 2
16 7
-
50 108
27 -
- 75 21
3 46
- -
16 -
13
2 45 85 11 32
41
3 103
- 179
-
38 68 87
-
9 - 9
39 14
38 105 294 148 129
36 41
211 4
28
43 68
- 109 109
103
- 756
1 13
71,186 148,928
646 (D)
218 1,500
17,286
- 99
- 2,100
-
91 -
(D)1,219
169
- 514
4,924 27
-
- 527
4,526 717
1,870
- -
2,176 -
26
(D)664
85 2,474
563
896 2,550
530 -
1,815
- 644
11,500 3,252
-
135 -
63 78
4,480
126 663
4,491 1,615 2,598
348
5,162 8,949 2,460 4,663
2,838
11,500 -
(D)109
5,428
- 19,836
(D)91
3,345 24,880
65 9 2
50 -
- 27 15 94 79
63 15 84 62 48
66
145 116
12 33
43
109 91 97 75
-
119 52 23 15
64
163 238
16 103
79 47
163 14
7
60 121
88 84 20
103 283
17 63
3
128 368 507 249 369
72
239 297
25 300
84 88 64 84
4
50 345
- 9
63
247,512 1,444,676
2,006 (D)(D)
19,398 -
- 314 115
7,333 9,330
297
6,000 10,514
5,912 2,836
14,811
5,496 6,803 1,368
212
188 3,016 4,554 7,908
23,650
- 36,250
1,050 41
748
4,350 6,189
11,209 2,048 1,428
4,730 8,000 1,982
19 668
5,643 2,156 8,000
(D)191
4,572 5,412
83 1,838
(D)
1,951 8,676
32,014 8,421
11,649
528 25,206 44,365
1,918 64,601
10,730
8,000 4,350 1,176
(D)
(D)19,412
- (D)
297
399 (NA)
- 1 - - -
- - - - -
- -
40 2
23
49 2
67 - -
5 3 - -
27
- 117
- - -
- 7 - - -
- - - - -
3 - - - 8
- - -
45 -
5 11
- 8
14
- 110
67 -
134
49 - - - -
- - - 1 -
51,948 (NA)
- (D)
- - -
- - - - -
- -
7,130 (D)
1,993
12,070 (D)
3,757 - -
250 1,030
- -
11,595
- 8,307
- - -
- 112
- - -
- - - - -
900 - - -
40
- - -
3,519 -
250 (D)
- 2,743 2,448
-
15,193 3,757
- 15,102
12,070
- - - -
- - -
(D) -
939 1,606
11 - -
25 18
81
- - -
154
11 - -
13 5
-
61 53
- 3
- 1 -
66 -
- - - - -
88 4
85 5 9
39
3 5 -
89
- 15
- - -
20 73
2 - -
- 12
350 10 80
19
5 145
- 5
146
- - -
62
- 76 18
- 11
47,590 (D)
586 - -
3,500 9,000
11,000
- - -
1,652
11 - -
39 15
-
510 2,014
- 30
-
(D)-
1,650 -
- - - - -
4,428 100
85 450
9
156 3,735
112 -
(D)
- 163
- - -
870 5,475
(D)- -
- 242
4,418 (D)
658
(D)15
7,214 -
450
14,406 - - -
1,178
- 9,210 9,000
- 11
684 1,082
12 -
218 - 5
- - - 1 -
- 273
13 - -
- 27
- - 3
- 1 - - -
- - - - -
- - 9 5 9
- - 3 -
88
- 10
- - -
- - 7 - -
- 6
110 10 35
9
13 - - 5
- - -
109 109
-
273 5 - -
12,330 (D)
24 -
218 -
5,000
- - -
(D)-
- 273
26 - -
- 160
- -
210
- (D)
- - -
- - - - -
- -
1,170 (D)
9
- -
36 -
88
- 21
- - -
- -
25 - -
- 246
5,282 (D)
197
9 26
- -
450
- - -
(D)109
-
273 5,000
- -
See footnote(s) at end of table. --continued

176 2008 FRIS – GENERAL DATA 2007 CENSUS OF AGRICULTURE USDA, National Agricultural Statistics Service
Table 43. Discontinuance of All Irrigation by Reason: 2008 and 2003 - Con. [Excludes institutional, research, and experimental farms and farms with horticulture. For meaning of abbreviations and symbols, see introductory text]
Reason for discontinuance 1 - con.
Irrigation is uneconomical
Land degradation (erosion, salinity, etc.) Loss of water rights Restrictions on
water use Sold or leased
water rights Geographic area
Farms
Acres irrigated
in previous census year 2
Farms
Acresirrigated
in previous census year 2
Farms
Acresirrigated
in previous census year 2
Farms
Acres irrigated
in previous census year 2
Farms
Acresirrigated
in previous census year 2
United States ...........................2008 .. 2003 .. 2008 DATA Alabama ............................................. Alaska ................................................. Arizona ............................................... Arkansas ............................................. California ............................................ Colorado ............................................. Connecticut ......................................... Delaware ............................................ Florida ................................................. Georgia ............................................... Hawaii ................................................. Idaho ................................................... Illinois .................................................. Indiana ................................................ Iowa .................................................... Kansas ................................................ Kentucky ............................................. Louisiana ............................................ Maine .................................................. Maryland ............................................. Massachusetts .................................... Michigan ............................................. Minnesota ........................................... Mississippi .......................................... Missouri .............................................. Montana .............................................. Nebraska ............................................ Nevada ............................................... New Hampshire .................................. New Jersey ......................................... New Mexico ........................................ New York ............................................ North Carolina .................................... North Dakota ...................................... Ohio .................................................... Oklahoma ........................................... Oregon ................................................ Pennsylvania ...................................... Rhode Island ...................................... South Carolina .................................... South Dakota ...................................... Tennessee .......................................... Texas .................................................. Utah .................................................... Vermont .............................................. Virginia ................................................ Washington ......................................... West Virginia ...................................... Wisconsin ........................................... Wyoming ............................................. Water Resources Regions Region 01 New England ..................... Region 02 Mid-Atlantic ........................ Region 03 South Atlantic-Gulf ............ Region 04 Great Lakes ....................... Region 05 Ohio ................................... Region 06 Tennessee ......................... Region 07 Upper Mississippi .............. Region 08 Lower Mississippi .............. Region 09 Souris-Red-Rainy .............. Region 10 Missouri ............................. Region 11 Arkansas-White-Red ......... Region 12 Texas-Gulf ......................... Region 13 Rio Grande ........................ Region 14 Upper Colorado ................. Region 15 Lower Colorado ................. Region 16 Great Basin ....................... Region 17 Pacific Northwest ............... Region 18 California ........................... Region 19 Alaska ............................... Region 20 Hawaii ...............................
2,502 1,778
30 1
110 60
743
- - -
303 51
16 29 23
5 1
-
111 53
2 7
-
33 17
3 3
- - - 4 3
6
13 46
6 34
42
154 62
2 52
16 70
132 138
-
30 42
8 41
-
8 84
489 71
177
42 44
135 16 23
42
132 6
138 110
14
211 743
1 16
90,713 86,289
1,626 (D)
660 1,500 1,486
- - -
8,983 204
1,379
10,872 1,202
820 (D)
-
3,495 2,014
(D) 256
-
3,018 2,665 2,538 5,695
- - - 4
(D)
1,260 616
5,198 585 976
2,630 3,080
956 (D)
124
1,120 1,044
14,700 276
-
2,038 6,180
109 1,011
-
144 2,534
16,818 4,498 6,035
426
3,398 8,179
695 5,370
2,630
14,700 1,260
(D) 660
4,872
15,260 1,486
(D) 1,379
7 159
- - - - -
- - - - -
- - - - -
- 6 - - -
- 1 - - -
- - - - -
- - - - -
- - - - -
- - - - -
- - - - -
- - - 1 6
- - - - -
- - - - -
- - - - -
(D)17,124
- - - - -
- - - - -
- - - - -
- 12
- - -
- (D)
- - -
- - - - -
- - - - -
- - - - -
- - - - -
- - - - -
- - -
(D)12
- - - - -
- - - - -
- - - - -
125 -
- -
109 - -
- - - - -
- - - - -
- 7 - - -
- - - - 9
- - - - -
- - - - -
- - - - -
- - - - -
- - - - -
- - - - 7
- 9 - - -
- - - -
109
- - - - -
735 -
- -
109 - -
- - - - -
- - - - -
- 14
- - -
- - - -
612
- - - - -
- - - - -
- - - - -
- - - - -
- - - - -
- - - -
14
- 612
- - -
- - - -
109
- - - - -
963 (NA)
4 - - -
743
193 - - - -
23 - - - -
- - - - -
- - - - -
- - - - -
- - - - -
- - - - -
- - - - -
- - - - -
- - 4 - -
- - - - -
193 - - - -
- -
743 -
23
3,467 (NA)
4 - - -
1,486
1,930 - - - -
47 - - - -
- - - - -
- - - - -
- - - - -
- - - - -
- - - - -
- - - - -
- - - - -
- - 4 - -
- - - - -
1,930 - - - -
- -
1,486 -
47
268 270
- - - - -
- - - 2 -
11 - - - -
- - - - -
- - - - -
- -
16 - -
- - - - -
- 154
- - -
- - -
84 -
- - - - 1
- - 2 - -
- - - - 1
- - - - -
100 154
- -
11
19,084 35,369
- - - - -
- - -
(D)-
11 - - - -
- - - - -
- - - - -
- -
2,176 - -
- - - - -
- 3,080
- - -
- - -
1,092 -
- - - -
(D)
- -
(D)- -
- - - -
(D)
- - - - -
3,268 3,080
- -
11
See footnote(s) at end of table. --continued
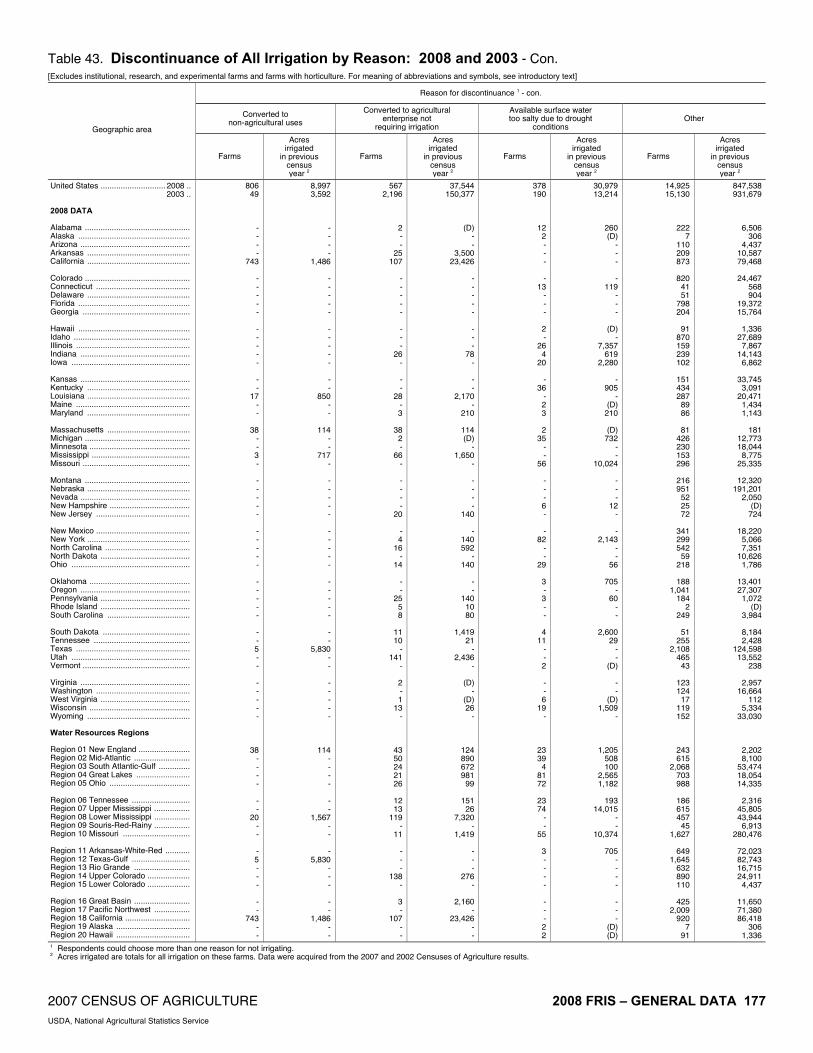
2007 CENSUS OF AGRICULTURE 2008 FRIS – GENERAL DATA 177 USDA, National Agricultural Statistics Service
Table 43. Discontinuance of All Irrigation by Reason: 2008 and 2003 - Con. [Excludes institutional, research, and experimental farms and farms with horticulture. For meaning of abbreviations and symbols, see introductory text]
Reason for discontinuance 1 - con.
Converted to non-agricultural uses
Converted to agriculturalenterprise not
requiring irrigation
Available surface water too salty due to drought
conditionsOther
Geographic area
Farms
Acres irrigated
in previous census year 2
Farms
Acresirrigated
in previous census year 2
Farms
Acres irrigated
in previous census year 2
Farms
Acresirrigated
in previous census year 2
United States ............................. 2008 .. 2003 .. 2008 DATA Alabama ............................................... Alaska .................................................. Arizona ................................................. Arkansas .............................................. California .............................................. Colorado ............................................... Connecticut .......................................... Delaware .............................................. Florida .................................................. Georgia ................................................ Hawaii .................................................. Idaho .................................................... Illinois ................................................... Indiana ................................................. Iowa ..................................................... Kansas ................................................. Kentucky .............................................. Louisiana .............................................. Maine ................................................... Maryland .............................................. Massachusetts ..................................... Michigan ............................................... Minnesota ............................................. Mississippi ............................................ Missouri ................................................ Montana ............................................... Nebraska .............................................. Nevada ................................................. New Hampshire .................................... New Jersey .......................................... New Mexico .......................................... New York .............................................. North Carolina ...................................... North Dakota ........................................ Ohio ..................................................... Oklahoma ............................................. Oregon ................................................. Pennsylvania ........................................ Rhode Island ........................................ South Carolina ..................................... South Dakota ....................................... Tennessee ........................................... Texas ................................................... Utah ..................................................... Vermont ................................................ Virginia ................................................. Washington .......................................... West Virginia ........................................ Wisconsin ............................................. Wyoming .............................................. Water Resources Regions Region 01 New England ....................... Region 02 Mid-Atlantic ......................... Region 03 South Atlantic-Gulf .............. Region 04 Great Lakes ........................ Region 05 Ohio .................................... Region 06 Tennessee .......................... Region 07 Upper Mississippi ................ Region 08 Lower Mississippi ................ Region 09 Souris-Red-Rainy ................ Region 10 Missouri .............................. Region 11 Arkansas-White-Red ........... Region 12 Texas-Gulf .......................... Region 13 Rio Grande ......................... Region 14 Upper Colorado ................... Region 15 Lower Colorado ................... Region 16 Great Basin ......................... Region 17 Pacific Northwest ................ Region 18 California ............................. Region 19 Alaska ................................. Region 20 Hawaii .................................
806 49
- - - -
743
- - - - -
- - - - -
- -
17 - -
38 - - 3 -
- - - - -
- - - - -
- - - - -
- - 5 - -
- - - - -
38 - - - -
- -
20 - -
- 5 - - -
- -
743 - -
8,997 3,592
- - - -
1,486
- - - - -
- - - - -
- -
850 - -
114 - -
717 -
- - - - -
- - - - -
- - - - -
- -
5,830 - -
- - - - -
114 - - - -
- -
1,567 - -
- 5,830
- - -
- -
1,486 - -
567 2,196
2 - -
25 107
- - - - -
- - -
26 -
- -
28 - 3
38
2 -
66 -
- - - -
20
- 4
16 -
14
- -
25 5 8
11 10
- 141
-
2 - 1
13 -
43 50 24 21 26
12 13
119 -
11
- - -
138 -
3 -
107 - -
37,544 150,377
(D)- -
3,500 23,426
- - - - -
- - -
78 -
- -
2,170 -
210
114 (D)
- 1,650
-
- - - -
140
- 140 592
- 140
- -
140 10 80
1,419
21 -
2,436 -
(D)-
(D)26
-
124 890 672 981
99
151 26
7,320 -
1,419
- - -
276 -
2,160 -
23,426 - -
378 190
12 2 - - -
- 13
- - -
2 -
26 4
20
- 36
- 2 3
2
35 - -
56
- - - 6 -
- 82
- -
29
3 - 3 - -
4 11
- - 2
- - 6
19 -
23 39
4 81 72
23 74
- -
55
3 - - - -
- - - 2 2
30,979 13,214
260 (D)
- - -
- 119
- - -
(D) -
7,357 619
2,280
- 905
- (D)
210
(D) 732
- -
10,024
- - -
12 -
- 2,143
- -
56
705 -
60 - -
2,600 29
- -
(D)
- -
(D) 1,509
-
1,205 508 100
2,565 1,182
193
14,015 - -
10,374
705 - - - -
- - -
(D) (D)
14,925 15,130
222 7
110 209 873
820
41 51
798 204
91
870 159 239 102
151 434 287
89 86
81
426 230 153 296
216 951
52 25 72
341 299 542
59 218
188
1,041 184
2 249
51
255 2,108
465 43
123 124
17 119 152
243 615
2,068 703 988
186 615 457
45 1,627
649
1,645 632 890 110
425
2,009 920
7 91
847,538 931,679
6,506 306
4,437 10,587 79,468
24,467
568 904
19,372 15,764
1,336
27,689 7,867
14,143 6,862
33,745
3,091 20,471
1,434 1,143
181
12,773 18,044
8,775 25,335
12,320
191,201 2,050
(D)724
18,220
5,066 7,351
10,626 1,786
13,401 27,307
1,072 (D)
3,984
8,184 2,428
124,598 13,552
238
2,957 16,664
112 5,334
33,030
2,202 8,100
53,474 18,054 14,335
2,316
45,805 43,944
6,913 280,476
72,023 82,743 16,715 24,911
4,437
11,650 71,380 86,418
306 1,336
1 Respondents could choose more than one reason for not irrigating. 2 Acres irrigated are totals for all irrigation on these farms. Data were acquired from the 2007 and 2002 Censuses of Agriculture results.

178 2008 FRIS – HORTICULTURAL OPERATIONS DATA 2007 CENSUS OF AGRICULTURE USDA, National Agricultural Statistics Service
Table 1. Irrigated Horticultural Operations: 2008 [Totals may not add due to rounding. Excludes abnormal operations. For meaning of abbreviations and symbols, see introductory text]
Area under protection Area in the open Geographic area Operations
Operations Square feet Square feet irrigated Operations Acres Acres irrigated
United States ...................................... Alabama ............................................. Alaska ................................................. Arizona ............................................... Arkansas ............................................. California ............................................ Colorado ............................................. Connecticut ......................................... Delaware ............................................ Florida ................................................. Georgia ............................................... Hawaii ................................................. Idaho ................................................... Illinois .................................................. Indiana ................................................ Iowa .................................................... Kansas ................................................ Kentucky ............................................. Louisiana ............................................ Maine .................................................. Maryland ............................................. Massachusetts .................................... Michigan ............................................. Minnesota ........................................... Mississippi .......................................... Missouri .............................................. Montana .............................................. Nebraska ............................................ Nevada ............................................... New Hampshire .................................. New Jersey ......................................... New Mexico ........................................ New York ............................................ North Carolina .................................... North Dakota ...................................... Ohio .................................................... Oklahoma ........................................... Oregon ................................................ Pennsylvania ...................................... Rhode Island ...................................... South Carolina .................................... South Dakota ...................................... Tennessee .......................................... Texas .................................................. Utah .................................................... Vermont .............................................. Virginia ................................................ Washington ......................................... West Virginia ...................................... Wisconsin ........................................... Wyoming ............................................. Water Resources Regions Region 01 New England ..................... Region 02 Mid-Atlantic ........................ Region 03 South Atlantic-Gulf ............ Region 04 Great Lakes ....................... Region 05 Ohio ................................... Region 06 Tennessee ......................... Region 07 Upper Mississippi .............. Region 08 Lower Mississippi .............. Region 09 Souris-Red-Rainy .............. Region 10 Missouri ............................. Region 11 Arkansas-White-Red ......... Region 12 Texas-Gulf ......................... Region 13 Rio Grande ........................ Region 14 Upper Colorado ................. Region 15 Lower Colorado ................. Region 16 Great Basin ....................... Region 17 Pacific Northwest ............... Region 18 California ........................... Region 19 Alaska ............................... Region 20 Hawaii ...............................
28,881
375 78
175 193
2,566
343 379 113
2,794 620
861 306 617 509 267
230 654 350 379 404
519
1,372 461 230 453
269 248
28 280 808
122
1,095 1,159
30 998
271
1,536 1,571
171 326
67
739 1,054
173 289
496 744 159 960
40
1,817 3,844 5,330 2,647 2,341
724
1,951 472
48 1,128
766 989 106 123 216
174
2,697 2,569
78 861
20,610
248 69
111 110
1,636
176 318
88 1,377
305
562 140 482 393 215
189 564 236 354 307
448
1,043 350 146 370
203 137
17 241 613
92
951 828
27 807
184
1,099 1,353
133 170
52
576 720
93 239
386 506 138 778
30
1,569 3,102 2,945 2,108 1,924
601
1,551 348
40 777
513 676
72 43
129
99 1,829 1,653
69 562
1,423,578,687
19,804,213 493,524
41,873,904 4,384,340
239,155,164
7,137,602 21,783,684 1,609,512
342,186,011 24,155,246
29,271,934 2,302,790
44,950,503 7,145,044
15,538,896
7,526,148 13,405,128 9,955,738 7,171,628
10,954,369
9,849,814 64,442,619 20,495,877 6,159,100
14,267,264
1,494,034 1,830,496
50,325 4,088,644
44,994,489
9,613,518 21,584,724 34,350,958
742,626 37,135,295
2,863,686
46,247,355 74,926,310 1,358,596 7,066,826
489,936
9,753,743 99,314,549 8,627,968 3,269,212
15,709,916 18,628,574 1,918,400
10,873,679 624,776
44,764,456 138,504,942 428,947,796 105,073,601
57,432,358
16,294,364 82,317,955 8,604,138
735,226 30,456,928
12,749,404 98,600,961
801,718 2,264,250
51,097,904
8,204,293 67,700,491
239,262,444 493,524
29,271,934
1,369,090,815
19,793,413 493,524
41,872,084 4,384,340
221,413,474
6,920,954 17,408,464 1,600,512
338,298,971 22,951,834
28,749,930 2,288,790
44,801,203 7,015,798
15,482,226
7,180,898 13,318,362 9,920,738 6,833,315
10,791,959
9,508,662 62,986,691 19,742,327 6,062,850
14,167,884
1,391,172 1,796,561
46,725 4,013,644
44,443,422
7,769,978 21,380,080 33,926,877
742,626 36,921,081
2,863,686
45,513,689 64,534,712 1,315,996 6,713,170
478,832
9,603,037 94,533,909 8,375,468 3,228,820
14,769,134 17,603,094 1,918,400
10,605,423 612,076
39,551,779 126,858,705 423,432,868 103,282,299
56,636,700
15,810,663 81,222,769 8,410,152
735,226 30,080,101
12,291,954 93,820,321
733,858 2,238,570
49,342,484
7,951,793 65,926,365
221,520,754 493,524
28,749,930
18,797
303 29
142 128
1,897
265 234
55 2,211
507
494 236 413 289 155
154 340 290 214 272
314 659 282 177 284
199 166
28 170 560
73
575 782
3 463
154
1,182 817
98 273
43
391 727 111 139
359 511
78 521
30
1,087 2,307 4,187 1,311 1,207
345
1,165 330
20 749
488 687
76 107 171
117
2,026 1,894
29 494
791,987
25,209 31
8,004 8,487
57,732
13,646 6,884 1,896
84,332 39,145
2,124
11,041 31,979
9,228 5,440
4,482 6,708 7,383 2,506
11,356
2,140 36,755 14,130
5,509 11,842
1,784 5,098
829 972
30,506
2,948 15,142 30,369
61 18,798
23,753 59,225 17,301
3,177 21,228
1,316
25,198 51,103
5,051 617
13,388 20,398
1,619 33,308
813
15,767 75,467
205,830 56,842 46,124
12,410 81,659 10,467
487 26,299
42,874 47,703
3,117 1,673 8,903
5,638
90,847 57,725
31 2,124
579,633
20,170 31
7,451 7,412
52,886
11,841 2,356 1,856
72,609 36,568
1,793
10,719 17,274
7,268 3,178
3,074 1,909 5,401 1,327 8,764
1,444
16,882 7,165 4,172 7,269
1,769 3,926
829 714
21,409
2,679 8,765
20,932 61
7,238
19,836 52,679
4,115 2,383
18,418
966 12,046 45,134
4,601 186
8,285
19,172 339
11,543 793
8,284 49,633
173,361 23,113 18,012
6,791
39,991 7,394
112 20,172
35,188 42,144
2,851 1,593 8,350
5,189
82,753 52,878
31 1,793
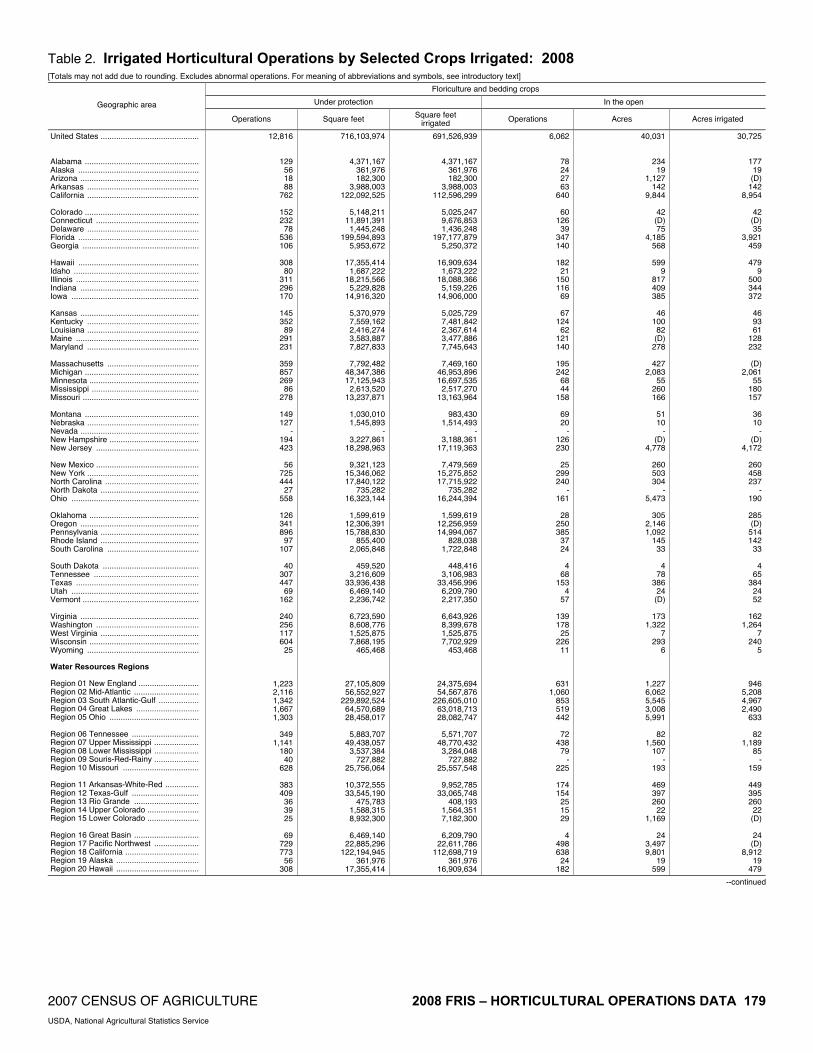
2007 CENSUS OF AGRICULTURE 2008 FRIS – HORTICULTURAL OPERATIONS DATA 179 USDA, National Agricultural Statistics Service
Table 2. Irrigated Horticultural Operations by Selected Crops Irrigated: 2008 [Totals may not add due to rounding. Excludes abnormal operations. For meaning of abbreviations and symbols, see introductory text]
Floriculture and bedding crops
Under protection In the open Geographic area
Operations Square feet Square feet irrigated Operations Acres Acres irrigated
United States ............................................ Alabama ................................................... Alaska ...................................................... Arizona ..................................................... Arkansas .................................................. California .................................................. Colorado ................................................... Connecticut .............................................. Delaware .................................................. Florida ...................................................... Georgia .................................................... Hawaii ...................................................... Idaho ........................................................ Illinois ....................................................... Indiana ..................................................... Iowa ......................................................... Kansas ..................................................... Kentucky .................................................. Louisiana .................................................. Maine ....................................................... Maryland .................................................. Massachusetts ......................................... Michigan ................................................... Minnesota ................................................. Mississippi ................................................ Missouri .................................................... Montana ................................................... Nebraska .................................................. Nevada ..................................................... New Hampshire ........................................ New Jersey .............................................. New Mexico .............................................. New York .................................................. North Carolina .......................................... North Dakota ............................................ Ohio ......................................................... Oklahoma ................................................. Oregon ..................................................... Pennsylvania ............................................ Rhode Island ............................................ South Carolina ......................................... South Dakota ........................................... Tennessee ............................................... Texas ....................................................... Utah ......................................................... Vermont .................................................... Virginia ..................................................... Washington .............................................. West Virginia ............................................ Wisconsin ................................................. Wyoming .................................................. Water Resources Regions Region 01 New England ........................... Region 02 Mid-Atlantic ............................. Region 03 South Atlantic-Gulf .................. Region 04 Great Lakes ............................ Region 05 Ohio ........................................ Region 06 Tennessee .............................. Region 07 Upper Mississippi .................... Region 08 Lower Mississippi .................... Region 09 Souris-Red-Rainy .................... Region 10 Missouri .................................. Region 11 Arkansas-White-Red ............... Region 12 Texas-Gulf .............................. Region 13 Rio Grande ............................. Region 14 Upper Colorado ....................... Region 15 Lower Colorado ....................... Region 16 Great Basin ............................. Region 17 Pacific Northwest .................... Region 18 California ................................. Region 19 Alaska ..................................... Region 20 Hawaii .....................................
12,816
129 56 18 88
762
152 232
78 536 106
308
80 311 296 170
145 352
89 291 231
359 857 269
86 278
149 127
- 194 423
56
725 444
27 558
126 341 896
97 107
40
307 447
69 162
240 256 117 604
25
1,223 2,116 1,342 1,667 1,303
349
1,141 180
40 628
383 409
36 39 25
69
729 773
56 308
716,103,974
4,371,167 361,976 182,300
3,988,003 122,092,525
5,148,211
11,891,391 1,445,248
199,594,893 5,953,672
17,355,414 1,687,222
18,215,566 5,229,828
14,916,320
5,370,979 7,559,162 2,416,274 3,583,887 7,827,833
7,792,482
48,347,386 17,125,943 2,613,520
13,237,871
1,030,010 1,545,893
- 3,227,861
18,298,963
9,321,123 15,346,062 17,840,122
735,282 16,323,144
1,599,619
12,306,391 15,788,830
855,400 2,065,848
459,520
3,216,609 33,936,438 6,469,140 2,236,742
6,723,590 8,608,776 1,525,875 7,868,195
465,468
27,105,809 56,552,927
229,892,524 64,570,689 28,458,017
5,883,707
49,438,057 3,537,384
727,882 25,756,064
10,372,555 33,545,190
475,783 1,588,315 8,932,300
6,469,140
22,885,296 122,194,945
361,976 17,355,414
691,526,939
4,371,167 361,976 182,300
3,988,003 112,596,299
5,025,247 9,676,853 1,436,248
197,177,879 5,250,372
16,909,634 1,673,222
18,088,366 5,159,226
14,906,000
5,025,729 7,481,842 2,367,614 3,477,886 7,745,643
7,469,160
46,953,896 16,697,535 2,517,270
13,163,964
983,430 1,514,493
- 3,188,361
17,119,363
7,479,569 15,275,852 17,715,922
735,282 16,244,394
1,599,619
12,256,959 14,994,067
828,038 1,722,848
448,416
3,106,983 33,456,996 6,209,790 2,217,350
6,643,926 8,399,678 1,525,875 7,702,929
453,468
24,375,694 54,567,876
226,605,010 63,018,713 28,082,747
5,571,707
48,770,432 3,284,048
727,882 25,557,548
9,952,785
33,065,748 408,193
1,564,351 7,182,300
6,209,790
22,611,786 112,698,719
361,976 16,909,634
6,062
78 24 27 63
640
60 126
39 347 140
182
21 150 116
69
67 124
62 121 140
195 242
68 44
158
69 20
- 126 230
25
299 240
- 161
28
250 385
37 24
4
68 153
4 57
139 178
25 226
11
631 1,060
853 519 442
72
438 79
- 225
174 154
25 15 29
4
498 638
24 182
40,031
234 19
1,127 142
9,844
42 (D)75
4,185 568
599
9 817 409 385
46
100 82 (D)
278
427 2,083
55 260 166
51 10
- (D)
4,778
260 503 304
- 5,473
305
2,146 1,092
145 33
4
78 386
24 (D)
173
1,322 7
293 6
1,227 6,062 5,545 3,008 5,991
82
1,560 107
- 193
469 397 260
22 1,169
24
3,497 9,801
19 599
30,725
177 19 (D)
142 8,954
42 (D)35
3,921 459
479
9 500 344 372
46 93 61
128 232
(D)
2,061 55
180 157
36 10
- (D)
4,172
260 458 237
- 190
285 (D)
514 142
33
4 65
384 24 52
162
1,264 7
240 5
946 5,208 4,967 2,490
633
82 1,189
85 -
159
449 395 260
22 (D)
24 (D)
8,912 19
479
--continued

180 2008 FRIS – HORTICULTURAL OPERATIONS DATA 2007 CENSUS OF AGRICULTURE USDA, National Agricultural Statistics Service
Table 2. Irrigated Horticultural Operations by Selected Crops Irrigated: 2008 - Con. [Totals may not add due to rounding. Excludes abnormal operations. For meaning of abbreviations and symbols, see introductory text]
Nursery crops
Under protection In the open Geographic area
Operations Square feet Square feet irrigated Operations Acres Acres irrigated
United States ............................................ Alabama ................................................... Alaska ....................................................... Arizona ..................................................... Arkansas ................................................... California .................................................. Colorado ................................................... Connecticut ............................................... Delaware .................................................. Florida ....................................................... Georgia ..................................................... Hawaii ....................................................... Idaho ......................................................... Illinois ........................................................ Indiana ...................................................... Iowa .......................................................... Kansas ...................................................... Kentucky ................................................... Louisiana .................................................. Maine ........................................................ Maryland ................................................... Massachusetts .......................................... Michigan ................................................... Minnesota ................................................. Mississippi ................................................ Missouri .................................................... Montana .................................................... Nebraska .................................................. Nevada ..................................................... New Hampshire ........................................ New Jersey ............................................... New Mexico .............................................. New York .................................................. North Carolina .......................................... North Dakota ............................................ Ohio .......................................................... Oklahoma ................................................. Oregon ...................................................... Pennsylvania ............................................ Rhode Island ............................................ South Carolina .......................................... South Dakota ............................................ Tennessee ................................................ Texas ........................................................ Utah .......................................................... Vermont .................................................... Virginia ...................................................... Washington ............................................... West Virginia ............................................ Wisconsin ................................................. Wyoming ................................................... Water Resources Regions Region 01 New England ........................... Region 02 Mid-Atlantic .............................. Region 03 South Atlantic-Gulf .................. Region 04 Great Lakes ............................. Region 05 Ohio ......................................... Region 06 Tennessee ............................... Region 07 Upper Mississippi .................... Region 08 Lower Mississippi .................... Region 09 Souris-Red-Rainy .................... Region 10 Missouri ................................... Region 11 Arkansas-White-Red ............... Region 12 Texas-Gulf ............................... Region 13 Rio Grande .............................. Region 14 Upper Colorado ....................... Region 15 Lower Colorado ....................... Region 16 Great Basin ............................. Region 17 Pacific Northwest ..................... Region 18 California ................................. Region 19 Alaska ..................................... Region 20 Hawaii .....................................
6,061
94 16 72 46
652
36 63
1 740 132
202
22 121
90 28
56
139 125
42 72
70
169 52 48 82
81
6 12 30
201
30 165 275
- 150
33
547 240
36 29
4
230 302
11 45
133 187
26 108
10
265 710
1,289 382 390
202 262 159
- 176
122 282
29 12 78
17
816 652
16 202
476,031,408
12,560,816 47,452
9,938,184 349,702
65,468,527
1,414,949 6,378,289
(D)131,565,104
11,164,780
6,655,222 247,050
2,844,224 1,268,062
(D)
2,118,482 4,560,890 5,998,511
118,503 1,368,827
416,850
9,616,219 1,531,648 3,014,800
461,512
257,761 102,000 29,400 83,120
26,104,558
75,606 2,615,018
12,716,914 -
19,828,817
522,000 23,689,768 26,900,509
301,360 (D)
8,280
5,251,391 57,760,222
(D)202,824
7,561,245 6,933,700
280,725 1,521,992
34,500
7,409,806 62,493,488
173,203,461 30,604,541 8,347,349
7,921,543 5,740,772 4,137,816
- 3,473,911
1,310,054
57,455,832 82,206
545,620 9,962,184
127,900
31,043,724 65,468,527
47,452 6,655,222
452,048,743
12,560,816 47,452
9,938,184 349,702
59,483,974
1,373,352 5,799,749
(D)130,193,584
11,148,580
6,655,222 247,050
2,842,608 1,261,660
(D)
2,118,482 4,502,570 5,880,341
116,828 1,289,917
413,618
9,566,611 1,251,648 3,014,800
459,112
257,761 101,500 25,800 70,120
25,676,566
74,292 2,611,016
12,527,039 -
19,744,817
522,000 23,300,912 17,814,486
298,960 (D)
8,280
5,174,761 53,803,482
(D)184,824
6,945,373 6,454,668
280,725 1,518,312
34,500
6,792,959 52,281,091
171,625,710 30,470,531 8,258,029
7,890,913 5,449,074
(D)-
3,400,619
1,300,599 53,499,092
82,152 544,360
9,958,584
(D)30,175,836 59,483,974
47,452 6,655,222
9,983
182 8
91 34
933
142 118
4 1,543
274
261 96
237 145
50
67 157 208
92 122
101 309 176
82 85
81
108 12 55
318
32 259 449
- 197
67
781 297
36 186
30
269 372
52 88
173 261
55 273
15
433 1,077 2,677
657 528
219 625 216
20 335
217 360
25 56
110
60 1,173
926 8
261
290,530
5,125 5
2,936 (D)
24,619
4,204 5,555
32 34,912
8,727
1,078 3,697
20,348 4,640
286
222 2,888 4,711 1,044 6,835
585
12,376 5,755 1,678 2,330
517
1,950 9
359 15,985
(D)
4,676 14,332
- 6,096
1,948
32,928 5,197
400 5,907
464
13,610 9,448
277 512
7,492 3,226 1,487 8,724
(D)
7,959 36,038 71,760 18,859 23,887
4,529
33,692 4,027
487 6,922
3,351 9,064
139 676
3,615
289 39,500 24,652
5 1,078
198,768
3,947 5
2,406 169
22,290
3,635 1,617
32 29,381
7,890
884 3,542 6,398 3,605
163
132 658
3,242 400
5,211
414 4,369 3,375 1,398 1,674
517
1,285 (D)
274 10,215
165
3,161 9,007
- 4,351
1,488
29,128 2,171
248 5,123
114
4,371 7,815
276 116
3,893 2,989
282 4,895
(D)
2,963 22,976 57,796
8,052 9,322
2,029
15,429 2,411
112 4,729
2,846 7,430
139 641
3,085
289 35,307 22,323
5 884
--continued

2007 CENSUS OF AGRICULTURE 2008 FRIS – HORTICULTURAL OPERATIONS DATA 181 USDA, National Agricultural Statistics Service
Table 2. Irrigated Horticultural Operations by Selected Crops Irrigated: 2008 - Con. [Totals may not add due to rounding. Excludes abnormal operations. For meaning of abbreviations and symbols, see introductory text]
Propagative materials
Under protection In the open Geographic area
Operations Square feet Square feet irrigated Operations Acres Acres irrigated
United States ............................................ Alabama ................................................... Alaska ...................................................... Arizona ..................................................... Arkansas .................................................. California .................................................. Colorado ................................................... Connecticut .............................................. Delaware .................................................. Florida ...................................................... Georgia .................................................... Hawaii ...................................................... Idaho ........................................................ Illinois ....................................................... Indiana ..................................................... Iowa ......................................................... Kansas ..................................................... Kentucky .................................................. Louisiana .................................................. Maine ....................................................... Maryland .................................................. Massachusetts ......................................... Michigan ................................................... Minnesota ................................................. Mississippi ................................................ Missouri .................................................... Montana ................................................... Nebraska .................................................. Nevada ..................................................... New Hampshire ........................................ New Jersey .............................................. New Mexico .............................................. New York .................................................. North Carolina .......................................... North Dakota ............................................ Ohio ......................................................... Oklahoma ................................................. Oregon ..................................................... Pennsylvania ............................................ Rhode Island ............................................ South Carolina ......................................... South Dakota ........................................... Tennessee ............................................... Texas ....................................................... Utah ......................................................... Vermont .................................................... Virginia ..................................................... Washington .............................................. West Virginia ............................................ Wisconsin ................................................. Wyoming .................................................. Water Resources Regions Region 01 New England ........................... Region 02 Mid-Atlantic ............................. Region 03 South Atlantic-Gulf .................. Region 04 Great Lakes ............................ Region 05 Ohio ........................................ Region 06 Tennessee .............................. Region 07 Upper Mississippi .................... Region 08 Lower Mississippi .................... Region 09 Souris-Red-Rainy .................... Region 10 Missouri .................................. Region 11 Arkansas-White-Red ............... Region 12 Texas-Gulf .............................. Region 13 Rio Grande ............................. Region 14 Upper Colorado ....................... Region 15 Lower Colorado ....................... Region 16 Great Basin ............................. Region 17 Pacific Northwest .................... Region 18 California ................................. Region 19 Alaska ..................................... Region 20 Hawaii .....................................
3,150
66 4
29 17
284
12 47 10
290 59
73 12 55 42 24
20 78 66 16 38
34
121 45 32 57
28 15
5 31
130
24 115 136
9 38
35
276 133
6 14
-
120 200
15 26
74 72
5 108
4
146 430 586 213 217
106 201
63 9
64
104 181
23 6
29
20 391 284
4 73
71,334,757
1,944,796 (D)
303,400 19,823
24,149,621
260,687 380,793
(D)8,800,622 1,904,506
634,700 33,103
382,338 156,138 148,500
9,388
512,682 1,868,783
19,788 482,165
867,820
5,425,342 1,137,587
319,180 185,724
12,209 33,600
1,125 540,619
1,226,927
98,574 570,394
1,934,328 7,344
436,288
283,447 4,973,738 2,742,488
18,000 430,480
-
601,524 4,943,426
146,600 26,004
777,462
1,148,818 15,000
412,914 3,462
1,837,820 5,358,410
15,781,367 6,254,378
(D)
(D)1,872,337
(D)7,344
392,082
436,408 4,933,924
110,514 3,060
303,400
(D)6,168,630
24,149,621 (D)
634,700
68,221,983
1,941,796 (D)
303,400 19,823
22,149,266
208,600 360,556
(D)8,727,724 1,891,594
634,700 33,103
369,838 147,576 148,500
9,388
510,732 1,868,783
17,508 482,165
861,820
5,424,512 1,096,337
319,180 171,864
12,209 33,600
1,125 539,369
1,172,474
98,118 552,894
1,934,328 7,344
436,288
283,447 4,692,330 2,568,700
18,000 430,480
-
599,284 4,651,774
133,450 26,004
770,870
1,138,018 15,000
402,850 2,762
1,808,053 (D)
15,693,937 6,253,548 1,152,390
596,949
1,802,121 1,182,848
7,344 345,380
416,463
4,642,272 110,514
2,604 303,400
(D)
5,876,422 22,149,266
(D)634,700
792
14 8 6 6
95
16 2 -
147 21
22 13 13
6 10
13
6 - 5 3
12 21 14
- 6
5 5 5
10 11
-
32 13
- 14
4
72 20
- 3
-
11 39
5 6
19 21
5 32
1
35 77
192 38 34
13 57 16
- 25
5
39 3 6 6
10
111 95
8 22
10,689
53 (D)(D)24
2,753
268 (D)
- 696
24
(D)1,482
37 27
5
13 12
- 8 3
11 15 10
- 1
15 (Z)(Z)10
6
- 152
6 -
79
310 (D)
313 - 5
- 8
107 2
(D)
6 (D)
5 117 (D)
255 470 774
71 114
17
132 25
- 243
311 107 177 (D)(D)
2
5,065 2,753
(D)(D)
10,211
49 (D)
143 24
2,733
214 (D)
- 691
24
20 1,482
37 12
5
13 12
- 4 3
11 11
9 - 1
15 (Z)(Z)
5 6
-
152 6 -
54
310 (D)13
- 5
- 7
107 2
12
6 (D)
5 117 (D)
(D)170 769
42 99
13
131 25
- 189
311 107 177 (D)
143
2 (D)
2,733 (D)20
--continued
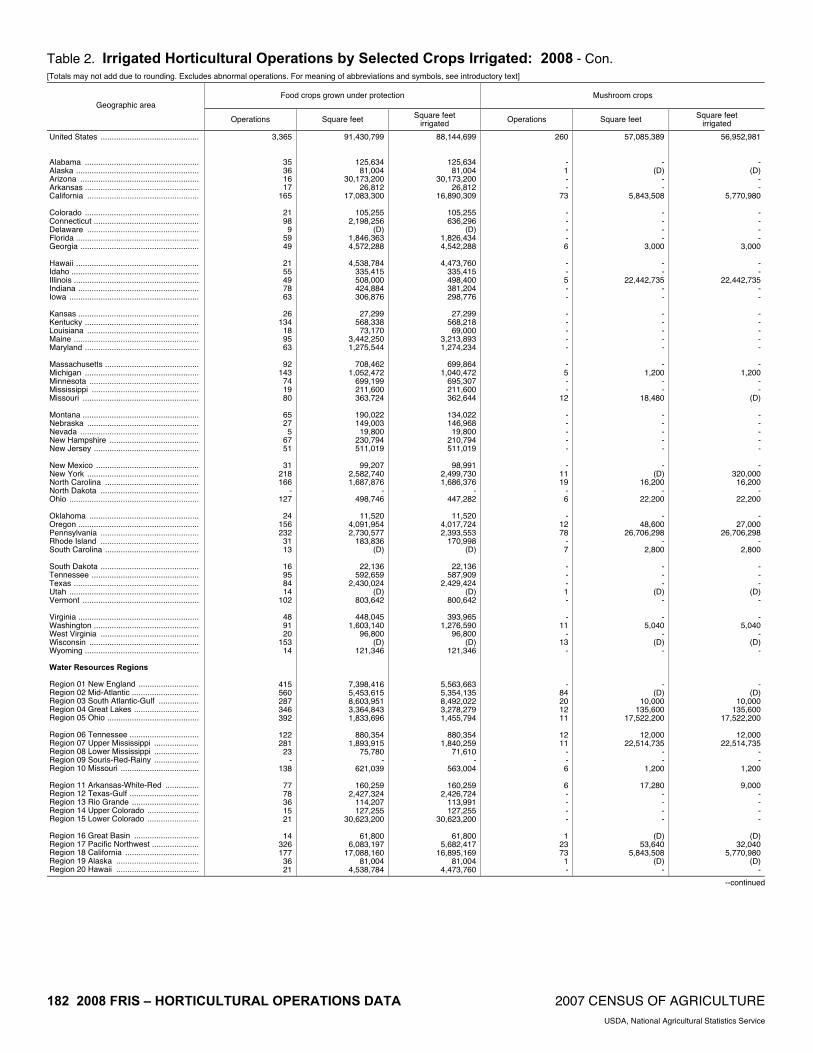
182 2008 FRIS – HORTICULTURAL OPERATIONS DATA 2007 CENSUS OF AGRICULTURE USDA, National Agricultural Statistics Service
Table 2. Irrigated Horticultural Operations by Selected Crops Irrigated: 2008 - Con. [Totals may not add due to rounding. Excludes abnormal operations. For meaning of abbreviations and symbols, see introductory text]
Food crops grown under protection Mushroom crops Geographic area
Operations Square feet Square feet irrigated Operations Square feet Square feet
irrigated
United States ............................................ Alabama ................................................... Alaska ....................................................... Arizona ..................................................... Arkansas ................................................... California .................................................. Colorado ................................................... Connecticut ............................................... Delaware .................................................. Florida ....................................................... Georgia ..................................................... Hawaii ....................................................... Idaho ......................................................... Illinois ........................................................ Indiana ...................................................... Iowa .......................................................... Kansas ...................................................... Kentucky ................................................... Louisiana .................................................. Maine ........................................................ Maryland ................................................... Massachusetts .......................................... Michigan ................................................... Minnesota ................................................. Mississippi ................................................ Missouri .................................................... Montana .................................................... Nebraska .................................................. Nevada ..................................................... New Hampshire ........................................ New Jersey ............................................... New Mexico .............................................. New York .................................................. North Carolina .......................................... North Dakota ............................................ Ohio .......................................................... Oklahoma ................................................. Oregon ...................................................... Pennsylvania ............................................ Rhode Island ............................................ South Carolina .......................................... South Dakota ............................................ Tennessee ................................................ Texas ........................................................ Utah .......................................................... Vermont .................................................... Virginia ...................................................... Washington ............................................... West Virginia ............................................ Wisconsin ................................................. Wyoming ................................................... Water Resources Regions Region 01 New England ........................... Region 02 Mid-Atlantic .............................. Region 03 South Atlantic-Gulf .................. Region 04 Great Lakes ............................. Region 05 Ohio ......................................... Region 06 Tennessee ............................... Region 07 Upper Mississippi .................... Region 08 Lower Mississippi .................... Region 09 Souris-Red-Rainy .................... Region 10 Missouri ................................... Region 11 Arkansas-White-Red ............... Region 12 Texas-Gulf ............................... Region 13 Rio Grande .............................. Region 14 Upper Colorado ....................... Region 15 Lower Colorado ....................... Region 16 Great Basin ............................. Region 17 Pacific Northwest ..................... Region 18 California ................................. Region 19 Alaska ..................................... Region 20 Hawaii .....................................
3,365
35 36 16 17
165
21 98
9 59 49
21 55 49 78 63
26
134 18 95 63
92
143 74 19 80
65 27
5 67 51
31
218 166
- 127
24
156 232
31 13
16 95 84 14
102
48 91 20
153 14
415 560 287 346 392
122 281
23 -
138
77 78 36 15 21
14
326 177
36 21
91,430,799
125,634 81,004
30,173,200 26,812
17,083,300
105,255 2,198,256
(D)1,846,363 4,572,288
4,538,784
335,415 508,000 424,884 306,876
27,299
568,338 73,170
3,442,250 1,275,544
708,462
1,052,472 699,199 211,600 363,724
190,022 149,003 19,800
230,794 511,019
99,207
2,582,740 1,687,876
- 498,746
11,520
4,091,954 2,730,577
183,836 (D)
22,136
592,659 2,430,024
(D)803,642
448,045
1,603,140 96,800
(D)121,346
7,398,416 5,453,615 8,603,951 3,364,843 1,833,696
880,354
1,893,915 75,780
- 621,039
160,259
2,427,324 114,207 127,255
30,623,200
61,800 6,083,197
17,088,160 81,004
4,538,784
88,144,699
125,634 81,004
30,173,200 26,812
16,890,309
105,255 636,296
(D)1,826,434 4,542,288
4,473,760
335,415 498,400 381,204 298,776
27,299
568,218 69,000
3,213,893 1,274,234
699,864
1,040,472 695,307 211,600 362,644
134,022 146,968 19,800
210,794 511,019
98,991
2,499,730 1,686,376
- 447,282
11,520
4,017,724 2,393,553
170,998 (D)
22,136
587,909 2,429,424
(D)800,642
393,965
1,276,590 96,800
(D)121,346
5,563,663 5,354,135 8,492,022 3,278,279 1,455,794
880,354
1,840,259 71,610
- 563,004
160,259
2,426,724 113,991 127,255
30,623,200
61,800 5,682,417
16,895,169 81,004
4,473,760
260
- 1 - -
73
- - - - 6
- - 5 - -
- - - - -
- 5 - -
12
- - - - -
- 11 19
- 6
-
12 78
- 7
- - - 1 -
- 11
- 13
-
- 84 20 12 11
12 11
- - 6
6 - - - -
1 23 73
1 -
57,085,389
- (D)
- -
5,843,508
- - - -
3,000
- -
22,442,735 - -
- - - - -
- 1,200
- -
18,480
- - - - -
- (D)
16,200 -
22,200
- 48,600
26,706,298 -
2,800
- - -
(D)-
- 5,040
- (D)
-
- (D)
10,000 135,600
17,522,200
12,000 22,514,735
- -
1,200
17,280 - - - -
(D)53,640
5,843,508 (D)
-
56,952,981
- (D)
- -
5,770,980
- - - -
3,000
- -
22,442,735 - -
- - - - -
- 1,200
- -
(D)
- - - - -
- 320,000 16,200
- 22,200
-
27,000 26,706,298
- 2,800
- - -
(D)-
- 5,040
- (D)
-
- (D)
10,000 135,600
17,522,200
12,000 22,514,735
- -
1,200
9,000 - - - -
(D)32,040
5,770,980 (D)
-
--continued

2007 CENSUS OF AGRICULTURE 2008 FRIS – HORTICULTURAL OPERATIONS DATA 183 USDA, National Agricultural Statistics Service
Table 2. Irrigated Horticultural Operations by Selected Crops Irrigated: 2008 - Con. [Totals may not add due to rounding. Excludes abnormal operations. For meaning of abbreviations and symbols, see introductory text]
Sod Christmas trees and short rotation woody crops Geographic area
Operations Acres Acres irrigated Operations Acres Acres irrigated
United States ............................................ Alabama ................................................... Alaska ...................................................... Arizona ..................................................... Arkansas .................................................. California .................................................. Colorado ................................................... Connecticut .............................................. Delaware .................................................. Florida ...................................................... Georgia .................................................... Hawaii ...................................................... Idaho ........................................................ Illinois ....................................................... Indiana ..................................................... Iowa ......................................................... Kansas ..................................................... Kentucky .................................................. Louisiana .................................................. Maine ....................................................... Maryland .................................................. Massachusetts ......................................... Michigan ................................................... Minnesota ................................................. Mississippi ................................................ Missouri .................................................... Montana ................................................... Nebraska .................................................. Nevada ..................................................... New Hampshire ........................................ New Jersey .............................................. New Mexico .............................................. New York .................................................. North Carolina .......................................... North Dakota ............................................ Ohio ......................................................... Oklahoma ................................................. Oregon ..................................................... Pennsylvania ............................................ Rhode Island ............................................ South Carolina ......................................... South Dakota ........................................... Tennessee ............................................... Texas ....................................................... Utah ......................................................... Vermont .................................................... Virginia ..................................................... Washington .............................................. West Virginia ............................................ Wisconsin ................................................. Wyoming .................................................. Water Resources Regions Region 01 New England ........................... Region 02 Mid-Atlantic ............................. Region 03 South Atlantic-Gulf .................. Region 04 Great Lakes ............................ Region 05 Ohio ........................................ Region 06 Tennessee .............................. Region 07 Upper Mississippi .................... Region 08 Lower Mississippi .................... Region 09 Souris-Red-Rainy .................... Region 10 Missouri .................................. Region 11 Arkansas-White-Red ............... Region 12 Texas-Gulf .............................. Region 13 Rio Grande ............................. Region 14 Upper Colorado ....................... Region 15 Lower Colorado ....................... Region 16 Great Basin ............................. Region 17 Pacific Northwest .................... Region 18 California ................................. Region 19 Alaska ..................................... Region 20 Hawaii .....................................
1,237
50 1 7
31 43
42
5 3
110 59
23 32 20
7 22
23 16
7 5
16
1 37 24 24 33
7
31 4 1
29
4 16 68
3 38
57 13 19 13 22
5
45 119
31 -
16 17
- 32
6
25 91
324 63 66
30 80 29
- 119
102 114
4 15
9
33 66 43
1 23
348,905
19,458 (D)
3,293 8,133
15,162
8,318 (D)
1,780 41,374 28,884
(D)
5,384 10,430
3,289 4,413
4,154 3,568 2,215 1,125 3,971
(D)
7,195 6,300 3,495 8,009
1,145 2,954
(D)(D)
8,934
1,746 9,074
14,875 61
5,471
20,882 1,599
551 2,506
14,339
841 11,426 38,423
4,595 -
5,538 2,531
- 8,800
540
4,984 28,305
121,746 10,186 13,560
7,409
30,091 5,872
- 16,967
37,262 36,533
1,746 (D)
3,467
4,997 9,974
15,162 (D)(D)
286,762
15,891 (D)
3,293 7,069
15,038
7,136 (D)
1,780 36,319 27,853
(D)
5,337 10,099
2,834 2,340
2,836 1,084 1,840
725 3,071
(D)
5,567 3,294 2,539 5,369
1,145 2,567
(D)(D)
6,454
1,497 4,852
11,138 61
2,274
17,647 1,599
301 1,966
12,538
841 7,539
34,858 4,146
-
4,046 2,003
- 5,771
540
3,584 19,574
105,807 7,223 6,909
4,564
21,777 4,574
- 14,510
30,571 33,118
1,497 (D)
3,467
4,548 9,399
15,038 (D)(D)
1,305
13 - 9 6
145
32 - 9
130 12
28 30 19 31 10
8
30 26
6 12
6
83 12
8 12
21 11
- -
59
18 12 69
- 48
10 69 76
6 36
- 9
78 18
-
11 47
3 27
-
18 160 247 103 107
24 67 32
- 63
35 67 18 18
9
13 151 145
- 28
75,203
286 -
(D)1
1,210
724 - 9
1,001 42
(D)
158 112 671
6
41 84
231 120
26
48 14,141
1,202 13
1,290
22 137
- -
568
769 379 750
- 1,272
251 (D)
1,747 24
920
- 30
2,340 45
-
14 (D)
120 14,813
-
192 2,272 2,704
16,694 1,887
325
14,303 247
- 1,786
1,394 1,239
769 401 (D)
25
29,379 1,210
- (D)
43,210
74 -
(D)1
759
724 - 9
(D)42
(D)
118 112 295
6
41 33
231 8
13
(D)4,769
426 13 67
22 17
- -
488
757 52
516 -
237
50 (D)
695 3
695
- 22
1,570 45
-
14 (D)45
485 -
(D)937
2,195 5,072
660
70 1,013
247 -
443
932 729 757 401 (D)
25 (D)
759 -
(D)
--continued

184 2008 FRIS – HORTICULTURAL OPERATIONS DATA 2007 CENSUS OF AGRICULTURE USDA, National Agricultural Statistics Service
Table 2. Irrigated Horticultural Operations by Selected Crops Irrigated: 2008 - Con. [Totals may not add due to rounding. Excludes abnormal operations. For meaning of abbreviations and symbols, see introductory text]
Other horticultural crops
Under protection In the open Geographic area
Operations Square feet Square feet irrigated Operations Acres Acres irrigated
United States ............................................ Alabama ................................................... Alaska ....................................................... Arizona ..................................................... Arkansas ................................................... California .................................................. Colorado ................................................... Connecticut ............................................... Delaware .................................................. Florida ....................................................... Georgia ..................................................... Hawaii ....................................................... Idaho ......................................................... Illinois ........................................................ Indiana ...................................................... Iowa .......................................................... Kansas ...................................................... Kentucky ................................................... Louisiana .................................................. Maine ........................................................ Maryland ................................................... Massachusetts .......................................... Michigan ................................................... Minnesota ................................................. Mississippi ................................................ Missouri .................................................... Montana .................................................... Nebraska .................................................. Nevada ..................................................... New Hampshire ........................................ New Jersey ............................................... New Mexico .............................................. New York .................................................. North Carolina .......................................... North Dakota ............................................ Ohio .......................................................... Oklahoma ................................................. Oregon ...................................................... Pennsylvania ............................................ Rhode Island ............................................ South Carolina .......................................... South Dakota ............................................ Tennessee ................................................ Texas ........................................................ Utah .......................................................... Vermont .................................................... Virginia ...................................................... Washington ............................................... West Virginia ............................................ Wisconsin ................................................. Wyoming ................................................... Water Resources Regions Region 01 New England ........................... Region 02 Mid-Atlantic .............................. Region 03 South Atlantic-Gulf .................. Region 04 Great Lakes ............................. Region 05 Ohio ......................................... Region 06 Tennessee ............................... Region 07 Upper Mississippi .................... Region 08 Lower Mississippi .................... Region 09 Souris-Red-Rainy .................... Region 10 Missouri ................................... Region 11 Arkansas-White-Red ............... Region 12 Texas-Gulf ............................... Region 13 Rio Grande .............................. Region 14 Upper Colorado ....................... Region 15 Lower Colorado ....................... Region 16 Great Basin ............................. Region 17 Pacific Northwest ..................... Region 18 California ................................. Region 19 Alaska ..................................... Region 20 Hawaii .....................................
596
14 4
15 -
92
11 28
- 32 13
22
- 24 10
2
- 24
9 6 -
13 - 5 - 1
6 - - 5 -
6 12 15
- 20
25 53 19
- 13
-
18 34
- -
5 19
- 21
-
52 19 73 19 50
31 49 15
- 18
31 28
6 -
15
- 72 92
4 22
13,044,447
797,000 (D)
1,275,000 -
4,522,646
208,500 935,010
- 385,350 116,000
89,200
- 559,256 66,132
(D)
- 255,000 260,000
7,200 -
64,200 -
1,500 -
(D)
4,032 - -
6,250 -
19,008 120,588 161,693
- 26,100
447,100
1,351,964 57,608
- 387,567
-
134,100 192,257
- -
20,000 329,100
- 196,594
-
1,012,660 (D)
1,023,189 125,628 165,540
976,421 852,102 392,000
- 212,632
452,848 186,509 19,008
- 1,275,000
-
1,681,064 4,522,646
(D)89,200
12,724,080
794,000 (D)
1,275,000 -
4,522,646
208,500 935,010
- 373,350 116,000
78,000
- 559,256 66,132
(D)
- 255,000 225,000
7,200 -
64,200 -
1,500 -
(D)
3,750 - -
5,000 -
19,008 120,588 47,012
- 26,100
447,100
1,219,964 57,608
- 387,567
-
134,100 192,257
- -
15,000 329,100
- 190,640
-
1,011,410 (D)
1,006,189 125,628 165,540
858,740 846,148 357,000
- 212,350
452,848 186,509 19,008
- 1,275,000
-
1,549,064 4,522,646
(D)78,000
1,515
5 -
17 6
205
18 12
- 221
30
36 56 36 21 17
7
23 7
24 23
46 25 15 35
3
34 11
7 10 16
6
27 31
- 33
9
100 76
6 6
8
35 67 14 12
45 40
- 33
1
104 140 324
80 96
24 80 22
- 47
27 48 13 17 23
10
213 211
- 36
13,009
33 -
164 7
4,106
90 11
- 1,447
900
(D)231 236 194 345
7
29 28 63
243
769 105
7 63
1
34 47 (D)40 75
1
201 51
- 160
56
797 656 102
24
7 47
400 109
5
164 438
- 35 (D)
990 1,013 2,527
373 410
(D)
611 73
- 143
78
364 22
120 168
301
1,495 4,107
- (D)
9,965
33 -
164 7
3,112
90 11
- (D)
300
182 231 129 178 294
7
29 28 63
234
391 105
6 42
1
34 47 (D)30 75
1
90 34
- 132
56
718 421
24 24
7
42 400 109
5
164 213
- 35 (D)
524 769
1,832 233 390
34
451 52
- 143
78
364 22
120 168
301
1,191 3,114
- 182

2007 CENSUS OF AGRICULTURE 2008 FRIS – HORTICULTURAL OPERATIONS DATA 185 USDA, National Agricultural Statistics Service
Table 3. Estimated Quantity of Water Applied to Crops Grown Under Protection on Irrigated Horticultural Operations by Method of Distribution and Water Source: 2008
[Totals may not add due to rounding. Excludes abnormal operations. For meaning of abbreviations and symbols, see introductory text]
All methods
Water source
Ground water (from wells) On-farm surface water Water from off-farm suppliers Geographic area Operations Square feet
irrigated
Gallons applied (1,000)
Operations Gallons applied (1,000) Operations Gallons applied
(1,000) Operations Gallons applied (1,000)
United States .................................. Alabama ......................................... Alaska ............................................ Arizona ........................................... Arkansas ........................................ California ........................................ Colorado ......................................... Connecticut .................................... Delaware ........................................ Florida ............................................ Georgia .......................................... Hawaii ............................................ Idaho .............................................. Illinois ............................................. Indiana ........................................... Iowa ............................................... Kansas ........................................... Kentucky ........................................ Louisiana ........................................ Maine ............................................. Maryland ........................................ Massachusetts ............................... Michigan ......................................... Minnesota ....................................... Mississippi ...................................... Missouri .......................................... Montana ......................................... Nebraska ........................................ Nevada ........................................... New Hampshire .............................. New Jersey .................................... New Mexico .................................... New York ........................................ North Carolina ................................ North Dakota .................................. Ohio ............................................... Oklahoma ....................................... Oregon ........................................... Pennsylvania .................................. Rhode Island .................................. South Carolina ............................... South Dakota ................................. Tennessee ..................................... Texas ............................................. Utah ............................................... Vermont .......................................... Virginia ........................................... Washington .................................... West Virginia .................................. Wisconsin ....................................... Wyoming ........................................ Water Resources Regions Region 01 New England ................. Region 02 Mid-Atlantic ................... Region 03 South Atlantic-Gulf ........ Region 04 Great Lakes .................. Region 05 Ohio .............................. Region 06 Tennessee .................... Region 07 Upper Mississippi .......... Region 08 Lower Mississippi .......... Region 09 Souris-Red-Rainy .......... Region 10 Missouri ........................ Region 11 Arkansas-White-Red ..... Region 12 Texas-Gulf .................... Region 13 Rio Grande ................... Region 14 Upper Colorado ............. Region 15 Lower Colorado ............. Region 16 Great Basin ................... Region 17 Pacific Northwest .......... Region 18 California ....................... Region 19 Alaska ........................... Region 20 Hawaii ...........................
20,610
248 69
111 110
1,636
176 318
88 1,377
305
562 140 482 393 215
189 564 236 354 307
448
1,043 350 146 370
203 137
17 241 613
92
951 828
27 807
184
1,099 1,353
133 170
52
576 720
93 239
386 506 138 778
30
1,569 3,102 2,945 2,108 1,924
601
1,551 348
40 777
513 676
72 43
129
99 1,829 1,653
69 562
1,369,090,815
19,793,413 493,524
41,872,084 4,384,340
221,413,474
6,920,954 17,408,464 1,600,512
338,298,971 22,951,834
28,749,930 2,288,790
44,801,203 7,015,798
15,482,226
7,180,898 13,318,362 9,920,738 6,833,315
10,791,959
9,508,662 62,986,691 19,742,327 6,062,850
14,167,884
1,391,172 1,796,561
46,725 4,013,644
44,443,422
7,769,978 21,380,080 33,926,877
742,626 36,921,081
2,863,686
45,513,689 64,534,712 1,315,996 6,713,170
478,832
9,603,037 94,533,909 8,375,468 3,228,820
14,769,134 17,603,094 1,918,400
10,605,423 612,076
39,551,779 126,858,705 423,432,868 103,282,299
56,636,700
15,810,663 81,222,769 8,410,152
735,226 30,080,101
12,291,954 93,820,321
733,858 2,238,570
49,342,484
7,951,793 65,926,365
221,520,754 493,524
28,749,930
25,768,753
425,848 1,671
997,810 43,599
3,950,979
86,149 83,464 11,572
9,144,430 644,814
266,305
9,982 340,178 51,722
203,774
53,840 111,348 156,126 61,892 96,320
93,683
795,444 328,008 64,643
169,785
17,206 12,267
1,310 82,426
385,431
86,860 322,320 561,950
7,901 398,445
12,095
1,061,588 558,752
9,031 225,068
6,712
252,018 2,425,360
100,432 38,652
371,391 415,542 17,405
193,349 11,854
339,923 1,332,748
10,962,565 1,251,889
667,468
310,164 938,967 190,458
7,952 314,121
113,966
2,400,723 16,500 35,804
1,069,316
100,236 1,496,668 3,951,309
1,671 266,305
14,796
146 57 77 52
944
75 209
68 1,247
250
177 99
385 267 169
121 137 203 311 257
272 831 305 129 276
186 126
11 214 538
80
684 680
27 526
99
796 1,106
71 139
24
311 452
45 154
278 357
76 741
11
1,135 2,566 2,520 1,594
940
368 1,332
268 35
560
313 415
72 10 89
51
1,338 956
57 177
15,979,605
307,729 1,583
676,163 5,684
2,120,403
29,608 44,352
5,826 7,383,134
367,392
86,569 3,924
84,948 36,094 41,982
16,923 22,130 85,369 30,899 66,216
64,817
475,326 289,967 58,147 64,494
14,486 10,184
1,003 78,687
333,486
83,740 161,527 106,013
7,352 159,912
1,830
458,883 231,966
4,184 43,713
2,857
110,791 1,207,984
21,301 18,510
41,312
371,604 10,692
123,990 3,920
235,846 773,647
8,168,274 636,865 187,318
187,306 500,256 139,543
(D)78,543
31,891
1,197,698 14,550
(D)747,363
(D)
841,366 2,120,468
1,583 86,569
3,520
45 8
12 7
226
18 88 11
234 48
104
10 101
69 35
23
128 50 50 40
31
110 27 10 63
11 16
6 35
100
6 163 228
9 216
42
238 231
50 22
4
133 162
4 95
102
45 25 29
-
278 564 574 280 446
127 189
49 14 85
87
156 -
12 12
10
299 226
8 104
6,600,479
98,904 5
207,921 3,497
662,546
16,354 28,156
1,859 1,466,388
273,720
79,195 201
245,801 11,200 49,132
21,988 48,631 49,998 23,722 26,655
6,246
101,189 2,069 6,307
68,586
497 2,064
(Z) 2,416
34,485
6 77,448
441,233 516
206,531
9,100 437,006 250,182
2,625 180,605
35
83,692 968,916
6,720 8,509
325,143
2,405 1,039
59,035 -
59,181 449,905
2,473,452 307,332 379,929
70,876
309,162 18,836
(D) 124,958
25,672
968,356 -
(D) 207,921
(D)
439,984 662,546
5 79,195
4,785
96 12 38 53
676
99 66 20
100 62
311
38 61
114 36
69
334 19 39 35
163 207
43 13 75
29
6 6
12 77
18
212 81
9 174
67
221 178
38 11
24
215 250
54 34
45
129 47 46 23
330 363 313 425 775
180 173
61 9
227
153 243
12 27 44
54
392 681
12 311
3,188,668
19,216 83
113,727 34,419
1,168,030
40,188 10,956
3,887 294,908
3,702
100,541 5,858 9,429 4,428
112,660
14,929 40,587 20,759
7,271 3,449
22,620
218,929 35,971
189 36,705
2,223
19 306
1,323 17,460
3,115
83,345 14,703
34 32,002
1,164
165,700 76,604
2,223 750
3,821
57,536 248,459 72,411 11,633
4,935
41,533 5,673
10,325 7,934
44,896 109,196 320,838 307,692 100,220
51,982
129,550 32,079
34 110,620
56,403
234,669 1,950
17,860 114,033
72,411
215,317 1,168,295
83 100,541
--continued

186 2008 FRIS – HORTICULTURAL OPERATIONS DATA 2007 CENSUS OF AGRICULTURE USDA, National Agricultural Statistics Service
Table 3. Estimated Quantity of Water Applied to Crops Grown Under Protection on Irrigated Horticultural Operations by Method of Distribution and Water Source: 2008 - Con.
[Totals may not add due to rounding. Excludes abnormal operations. For meaning of abbreviations and symbols, see introductory text]
Hand watered
Water source
Ground water (from wells) On-farm surface water Water from off-farm suppliers Geographic area Operations Square feet
irrigated
Gallons applied (1,000)
Operations Gallons applied (1,000) Operations Gallons applied
(1,000) Operations Gallons applied (1,000)
United States ................................. Alabama ........................................ Alaska ............................................ Arizona .......................................... Arkansas ........................................ California ....................................... Colorado ........................................ Connecticut .................................... Delaware ....................................... Florida ............................................ Georgia .......................................... Hawaii ............................................ Idaho .............................................. Illinois ............................................. Indiana ........................................... Iowa ............................................... Kansas ........................................... Kentucky ........................................ Louisiana ....................................... Maine ............................................. Maryland ........................................ Massachusetts ............................... Michigan ........................................ Minnesota ...................................... Mississippi ..................................... Missouri ......................................... Montana ......................................... Nebraska ....................................... Nevada .......................................... New Hampshire ............................. New Jersey .................................... New Mexico ................................... New York ....................................... North Carolina ............................... North Dakota ................................. Ohio ............................................... Oklahoma ...................................... Oregon ........................................... Pennsylvania ................................. Rhode Island ................................. South Carolina ............................... South Dakota ................................. Tennessee ..................................... Texas ............................................. Utah ............................................... Vermont ......................................... Virginia ........................................... Washington .................................... West Virginia ................................. Wisconsin ...................................... Wyoming ........................................ Water Resources Regions Region 01 New England ................ Region 02 Mid-Atlantic ................... Region 03 South Atlantic-Gulf ....... Region 04 Great Lakes .................. Region 05 Ohio .............................. Region 06 Tennessee .................... Region 07 Upper Mississippi ......... Region 08 Lower Mississippi ......... Region 09 Souris-Red-Rainy ......... Region 10 Missouri ........................ Region 11 Arkansas-White-Red .... Region 12 Texas-Gulf .................... Region 13 Rio Grande ................... Region 14 Upper Colorado ............ Region 15 Lower Colorado ............ Region 16 Great Basin .................. Region 17 Pacific Northwest .......... Region 18 California ...................... Region 19 Alaska .......................... Region 20 Hawaii ..........................
14,535
131 57 76 85
947
135 265
68 317 168
244 110 376 321 179
165 435
87 308 232
416 894 318
75 291
174 132
11 199 434
73
829 516
27 614
142 603
1,123 119
91
40 411 537
78 182
284 393 132 665
26
1,350 2,438 1,206 1,769 1,522
464
1,308 177
40 681
387 499
60 26 82
83
1,184 958
57 244
338,548,915
2,335,232 440,324
1,450,623 3,900,200
43,357,705
4,250,972 5,425,748
827,248 5,626,925 4,570,316
3,248,257 1,166,760 6,236,125 4,438,748 9,885,700
2,891,456 6,233,848 1,146,612 2,875,902 5,132,866
6,744,482
45,013,899 13,308,060
832,720 8,527,360
1,285,762 1,619,061
21,525 3,242,745 9,453,444
579,494
15,060,526 5,994,836
720,126 9,805,411
1,389,459 7,876,424
40,872,837 1,021,296
639,654
461,976 4,290,187
16,390,571 7,004,798 2,042,546
2,643,852 7,971,934 1,517,600 6,356,805
417,958
19,125,269 51,295,651 18,584,230 56,440,051 37,342,792
5,880,817
27,545,574 2,132,214
712,126 21,743,553
7,290,457
15,749,043 528,374
1,022,320 1,471,023
7,005,923
17,529,292 43,461,625
440,324 3,248,257
3,720,238
17,899 1,384
14,111 40,209
553,338
46,520 41,313
6,845 (D)
58,371
16,651 3,289
56,392 40,288
145,814
29,330 47,276
6,146 32,773 51,628
67,645
493,070 165,622 14,430 89,323
14,378 11,884
368 34,162 71,719
10,176
157,263 68,535
7,887 105,384
3,840
119,579 387,996
6,531 21,052
5,137
67,717 218,328 67,563 17,432
(D)
67,688 11,702 83,753
8,615
179,532 472,516 250,444 608,329 364,140
79,553
336,994 23,648
7,938 246,101
61,491
211,476 9,590
15,247 14,417
67,625
199,529 553,632
1,384 16,651
10,220
54 45 61 41
462
57 167
48 277 136
85 79
317 219 134
108 104
61 274 191
253 703 273
68 209
163 121
5 172 373
61
599 434
27 400
75
415 924
64 70
16
219 306
40 115
222 263
70 633
7
968 2,023
979 1,334
735
294 1,139
110 35
479
242 275
60 6
61
45 837 468
45 85
2,015,279
(D)1,296
(D)3,320
205,517
13,918 24,108
3,874 80,572 55,365
11,033
1,456 43,933 30,319 27,838
11,139 19,577
1,267 25,539 33,112
41,076
300,795 137,620 14,367 25,751
12,041
9,916 62
32,127 64,478
8,978
103,024 52,798
7,339 53,319
(D)
64,652 154,062
(D)18,425
1,685
21,363 104,106 16,625
(D)
15,417 55,723
6,617 74,090
1,949
128,206 337,252 209,148 362,825 109,585
34,079
265,556 12,314
(D)54,124
9,420
101,400 9,563
(D)(D)
(D)
128,543 205,546
1,296 11,033
1,981
18 8 - 5
128
6 72 10 52 14
46
- 57 39 25
14
100 7
41 29
24 75 22
- 44
11 16
- 30 53
6
114 80
9 116
34
110 183
36 15
4
44 87
4 71
57 33 20 12
-
209 385 176 172 297
60
107 12 14 67
66 81
- - -
4 149 128
8 46
586,832
(D) 5 -
3,120 44,090
340 (D)
1,770 (D) (D)
(D)
- 7,524 6,476
47,416
3,570 5,087 1,400 3,814
16,141
(D) 38,339
2,042 -
45,493
435 1,949
- (D)
3,611
6 (D)
7,365 514
29,267
2,439 10,786
190,714 (D) (D)
35
3,281 40,879
6,720 (D)
1,580 2,023
960 170
-
15,015 60,036 24,524 69,519
194,016
3,078 (D) (D) (D)
92,019
9,307 40,723
- - -
(D) 13,182 44,090
5 (D)
3,641
71 12 16 39
440
79 60 20 40 38
120
38 41 90 30
62
266 19 33 35
150 184
43 7
63
23 6 6
12 66
12
178 49
9 147
49
144 139
38 8
20
182 219
44 34
39
111 47 40 23
305 318 182 370 625
146 141
55 9
203
109 212
6 20 22
44
297 445
12 120
1,118,127
11,847 83 (D)
33,769 303,731
32,262
(D)1,202
(D)(D)
(D)
1,833 4,934 3,493
70,560
14,621 22,612
3,479 3,420 2,375
(D)
153,936 25,960
63 18,079
1,902
19 306 (D)
3,630
1,192 (D)
8,372 34
22,797
(D)44,141 43,220
(D)(D)
3,418
43,073 73,343 44,218 11,470
(D)
9,942 4,125 9,492 6,666
36,311 75,228 16,771
175,985 60,539
42,397
(D)(D)34
99,958
42,764 69,353
27 (D)(D)
44,218 57,804
303,996 83 (D)
--continued

2007 CENSUS OF AGRICULTURE 2008 FRIS – HORTICULTURAL OPERATIONS DATA 187 USDA, National Agricultural Statistics Service
Table 3. Estimated Quantity of Water Applied to Crops Grown Under Protection on Irrigated Horticultural Operations by Method of Distribution and Water Source: 2008 - Con.
[Totals may not add due to rounding. Excludes abnormal operations. For meaning of abbreviations and symbols, see introductory text]
Gravity irrigation
Water source
Ground water (from wells) On-farm surface water Water from off-farm suppliers Geographic area Operations Square feet
irrigated
Gallons applied (1,000)
Operations Gallons applied (1,000) Operations Gallons applied
(1,000) Operations Gallons applied (1,000)
United States .................................. Alabama ......................................... Alaska ............................................ Arizona ........................................... Arkansas ........................................ California ........................................ Colorado ......................................... Connecticut .................................... Delaware ........................................ Florida ............................................ Georgia .......................................... Hawaii ............................................ Idaho .............................................. Illinois ............................................. Indiana ........................................... Iowa ............................................... Kansas ........................................... Kentucky ........................................ Louisiana ........................................ Maine ............................................. Maryland ........................................ Massachusetts ............................... Michigan ......................................... Minnesota ....................................... Mississippi ...................................... Missouri .......................................... Montana ......................................... Nebraska ........................................ Nevada ........................................... New Hampshire .............................. New Jersey .................................... New Mexico .................................... New York ........................................ North Carolina ................................ North Dakota .................................. Ohio ............................................... Oklahoma ....................................... Oregon ........................................... Pennsylvania .................................. Rhode Island .................................. South Carolina ............................... South Dakota ................................. Tennessee ..................................... Texas ............................................. Utah ............................................... Vermont .......................................... Virginia ........................................... Washington .................................... West Virginia .................................. Wisconsin ....................................... Wyoming ........................................ Water Resources Regions Region 01 New England ................. Region 02 Mid-Atlantic ................... Region 03 South Atlantic-Gulf ........ Region 04 Great Lakes .................. Region 05 Ohio .............................. Region 06 Tennessee .................... Region 07 Upper Mississippi .......... Region 08 Lower Mississippi .......... Region 09 Souris-Red-Rainy .......... Region 10 Missouri ........................ Region 11 Arkansas-White-Red ..... Region 12 Texas-Gulf .................... Region 13 Rio Grande ................... Region 14 Upper Colorado ............. Region 15 Lower Colorado ............. Region 16 Great Basin ................... Region 17 Pacific Northwest .......... Region 18 California ....................... Region 19 Alaska ........................... Region 20 Hawaii ...........................
191
- - - -
29
6 - -
12 6
7 7 - - 2
- - - - -
- 16
- - 6
- - - 5 -
- 11
- - -
- 30
6 - -
- -
38 - -
- 10
- - -
5 12 18 21
-
- 2 - - 6
-
38 - 6 -
- 47 29
- 7
14,584,204
- - - -
7,779,250
(D) - -
3,504,200 1,306,800
192,500 21,000
- -
(D)
- - - - -
- 800,000
- -
6,300
- - -
45,000 -
- 86,000
- - -
- 175,064 141,120
- -
- -
455,170 - -
- 30,000
- - -
45,000 177,120
4,811,000 850,000
-
- (D)
- -
(D)
- 455,170
- 1,800
-
- 226,064
7,779,250 -
192,500
223,036
- - - -
201,443
17 - -
4,372 1,307
(D)
168 - -
(D)
- - - - -
- 1,378
- -
(D)
- - -
608 -
- (D)
- - -
- 3,007 1,128
- -
- -
7,782 - -
- 108
- - -
608 1,488 5,679 1,878
-
- (D)
- -
(D)
- 7,782
- 17
-
- 3,283
201,443 -
(D)
126
- - - -
17
- - -
12 6
- 7 - - -
- - - - -
- 10
- - 6
- - - - -
- - - - -
- 14
6 - -
- -
38 - -
- 10
- - -
- 6
18 10
-
- - - - 6
-
38 - - -
- 31 17
- -
39,076
- - - -
20,803
- - -
4,372 1,307
-
168 - - -
- - - - -
- (D)
- -
(D)
- - - - -
- - - - -
- 2,512 1,128
- -
- -
7,665 - -
- (D)
- - -
- (D)
5,679 (D)
-
- - - -
(D)
- 7,665
- - -
- (D)
20,803 - -
59
- - - - 5
6 - - - -
7 - - - 2
- - - - -
- 6 - - -
- - - 5 -
- 11
- - -
- 6 - - -
- - 6 - -
- 5 - - -
5 6 -
11 -
- 2 - - -
- 6 - 6 -
- 11
5 - 7
67,783
- - - -
64,800
17 - - - -
(D) - - -
(D)
- - - - -
- (D)
- - -
- - -
608 -
- (D)
- - -
- (D)
- - -
- -
118 - -
- (D)
- - -
608 (D)
- (D)
-
- (D)
- - -
- 118
- 17
-
- (D)
64,800 -
(D)
29
- - - -
12
- - - - -
7 - - - -
- - - - -
- - - - -
- - - - -
- - - - -
- 10
- - -
- - - - -
- - - - -
- - - - -
- - - - -
- - - - -
- 10 12
- 7
116,177
- - - -
115,840
- - - - -
(D)- - - -
- - - - -
- - - - -
- - - - -
- - - - -
- (D)
- - -
- - - - -
- - - - -
- - - - -
- - - - -
- - - - -
- (D)
115,840 -
(D)
--continued

188 2008 FRIS – HORTICULTURAL OPERATIONS DATA 2007 CENSUS OF AGRICULTURE USDA, National Agricultural Statistics Service
Table 3. Estimated Quantity of Water Applied to Crops Grown Under Protection on Irrigated Horticultural Operations by Method of Distribution and Water Source: 2008 - Con.
[Totals may not add due to rounding. Excludes abnormal operations. For meaning of abbreviations and symbols, see introductory text]
Sprinkler
Water source
Ground water (from wells) On-farm surface water Water from off-farm suppliers Geographic area Operations Square feet
irrigated
Gallons applied (1,000)
Operations Gallons applied (1,000) Operations Gallons applied
(1,000) Operations Gallons applied (1,000)
United States ................................. Alabama ........................................ Alaska ............................................ Arizona .......................................... Arkansas ........................................ California ....................................... Colorado ........................................ Connecticut .................................... Delaware ....................................... Florida ............................................ Georgia .......................................... Hawaii ............................................ Idaho .............................................. Illinois ............................................. Indiana ........................................... Iowa ............................................... Kansas ........................................... Kentucky ........................................ Louisiana ....................................... Maine ............................................. Maryland ........................................ Massachusetts ............................... Michigan ........................................ Minnesota ...................................... Mississippi ..................................... Missouri ......................................... Montana ......................................... Nebraska ....................................... Nevada .......................................... New Hampshire ............................. New Jersey .................................... New Mexico ................................... New York ....................................... North Carolina ............................... North Dakota ................................. Ohio ............................................... Oklahoma ...................................... Oregon ........................................... Pennsylvania ................................. Rhode Island ................................. South Carolina ............................... South Dakota ................................. Tennessee ..................................... Texas ............................................. Utah ............................................... Vermont ......................................... Virginia ........................................... Washington .................................... West Virginia ................................. Wisconsin ...................................... Wyoming ........................................ Water Resources Regions Region 01 New England ................ Region 02 Mid-Atlantic ................... Region 03 South Atlantic-Gulf ....... Region 04 Great Lakes .................. Region 05 Ohio .............................. Region 06 Tennessee .................... Region 07 Upper Mississippi ......... Region 08 Lower Mississippi ......... Region 09 Souris-Red-Rainy ......... Region 10 Missouri ........................ Region 11 Arkansas-White-Red .... Region 12 Texas-Gulf .................... Region 13 Rio Grande ................... Region 14 Upper Colorado ............ Region 15 Lower Colorado ............ Region 16 Great Basin .................. Region 17 Pacific Northwest .......... Region 18 California ...................... Region 19 Alaska .......................... Region 20 Hawaii ..........................
6,328
129 -
40 30
579
39 65 41
1,001 115
324
31 125
87 37
16 87
149 42 72
28
279 98 59 88
27
- -
31 234
-
156 278
- 200
68
523 201
13 50
4
224 286
21 39
147 147
21 90
7
191 769
1,589 522 402
164 294 191
- 97
141 273
5 6
40
21 720 579
- 324
752,511,338
14,126,346 -
3,824,535 416,488
87,859,901
2,183,012 9,065,929
380,264 285,101,956
14,770,998
17,320,275 784,110
35,928,652 1,186,622 4,503,050
4,192,642 5,346,880 8,367,086
182,300 3,740,159
1,009,122
19,561,671 11,134,630 2,063,460 3,174,620
109,520
- -
901,785 29,948,625
-
3,938,672 16,916,462
- 23,152,994
824,007
36,112,885 18,300,876
159,900 5,145,251
151,360
4,513,128 53,807,546
625,670 72,960
10,485,167 9,039,760
295,500 1,742,444
42,118
11,346,036 60,767,243
336,655,699 44,185,961 13,513,748
7,214,150
53,292,122 6,548,670
- 4,486,474
4,386,175
53,374,346 15,000
1,073,740 3,824,535
625,670
46,021,593 87,859,901
- 17,320,275
16,586,309
403,055 -
97,366 2,545
1,740,884
31,427 (D)
3,456 8,255,537
570,669
118,476 2,835
250,376 5,627
44,668
22,558 51,222
134,369 955
26,859
(D)140,225 86,780 20,568 65,666
532
- -
(D)194,229
-
72,030 365,236
- 240,758
7,829
886,835 113,701
1,037 180,510
1,008
140,933 1,554,354
7,945 876
318,084 325,792
4,319 45,089
548
50,857 598,886
9,716,870 398,274 237,281
189,871 423,021 141,658
- 49,130
39,366
1,543,542 225
16,770 97,366
7,945
1,215,887 1,740,884
- 118,476
4,567
93 -
32 16
380
28 41 31
931 91
92 21 91 63 26
7
12 136
42 62
28
216 89 56 61
21
- -
31 208
-
117 169
- 92
41
388 160
6 44
4
136 169
7 19
95
124 6
85 -
154 622
1,360 384 159
107 228 173
- 64
88
163 5 -
32
7 549 380
- 92
10,219,216
302,547 -
(D)1,576
883,639
11,938 4,375 1,193
6,684,968 298,600
13,330
2,155 34,624
2,869 (D)
4,140
812 68,491
798 21,192
(D)
63,819 76,772 20,275 37,798
167
- -
(D)151,063
-
32,448 (D)
- 60,185
(D)(D)
30,638 (D)(D)
1,008
60,352 551,979
(D)(D)
15,643
(D)3,226
16,401 -
(D)238,047
7,250,037 129,457
(D)
123,002 128,338 110,057
- 17,700
12,550
551,372 225
- (D)
(D)
652,089 883,639
- 13,330
1,450
34 - 3 2
100
7 27 11
167 39
54
3 51 18
6
9 28 43 11 17
-
34 - 3
14
5 - - 5
50
- 26
155 -
80
9 136
51 7 3
-
73 95
- 13
51
5 - 5 -
56 174 403 104 129
50 56 30
- 23
29 89
- 6 3
-
144 100
- 54
5,050,157
(D) -
(D) (D)
401,220
15,997 19,675
89 1,283,254
271,880
20,868 130
211,992 2,594
(D)
18,418 40,342 48,598
157 5,547
-
47,409 -
294 (D)
62
- -
(D) 29,599
-
36,706 342,557
- 173,831
6,653
417,011 54,579
(D) 168,899
-
72,909 911,090
- (D)
299,939
42 -
28,688 -
20,564 333,053
2,175,300 217,952 177,069
61,270
239,883 (D)
- 24,044
16,317
910,686 -
(D) (D)
-
417,182 401,220
- 20,868
1,230
24 -
12 14
197
10 8
10 34 18
194
7 9
24 9
-
53 6 - 6
-
56 13
- 32
12
- - -
10
- 25 32
- 34
26 97 32
- 3
-
45 102
14 7
12 21 15
- 7
8 67 86 85
162
34 44 18
- 37
41 95
- 2
12
14 134 197
- 194
1,316,935
(D)-
49,955 (D)
456,026
3,492 (D)
2,175 287,315
189
84,279 550
3,759 164
31,628
- 10,068 17,280
- 120
-
28,997 10,008
- (D)
303
- - -
13,566
- 2,876
(D)-
6,742
(D)(D)
28,484 -
(D)
- 7,672
91,285 (D)(D)
2,503
(D)1,094
- 548
(D)27,786
291,533 50,864
(D)
5,599 54,800
(D)-
7,386
10,499 81,485
- (D)
49,955
(D)146,616 456,026
- 84,279
--continued

2007 CENSUS OF AGRICULTURE 2008 FRIS – HORTICULTURAL OPERATIONS DATA 189 USDA, National Agricultural Statistics Service
Table 3. Estimated Quantity of Water Applied to Crops Grown Under Protection on Irrigated Horticultural Operations by Method of Distribution and Water Source: 2008 - Con.
[Totals may not add due to rounding. Excludes abnormal operations. For meaning of abbreviations and symbols, see introductory text]
Drip, trickle, or low-flow micro irrigation
Water source
Ground water (from wells) On-farm surface water Water from off-farm suppliers Geographic area Operations Square feet
irrigated
Gallons applied (1,000)
Operations Gallons applied (1,000) Operations Gallons applied
(1,000) Operations Gallons applied (1,000)
United States .................................. Alabama ......................................... Alaska ............................................ Arizona ........................................... Arkansas ........................................ California ........................................ Colorado ......................................... Connecticut .................................... Delaware ........................................ Florida ............................................ Georgia .......................................... Hawaii ............................................ Idaho .............................................. Illinois ............................................. Indiana ........................................... Iowa ............................................... Kansas ........................................... Kentucky ........................................ Louisiana ........................................ Maine ............................................. Maryland ........................................ Massachusetts ............................... Michigan ......................................... Minnesota ....................................... Mississippi ...................................... Missouri .......................................... Montana ......................................... Nebraska ........................................ Nevada ........................................... New Hampshire .............................. New Jersey .................................... New Mexico .................................... New York ........................................ North Carolina ................................ North Dakota .................................. Ohio ............................................... Oklahoma ....................................... Oregon ........................................... Pennsylvania .................................. Rhode Island .................................. South Carolina ............................... South Dakota ................................. Tennessee ..................................... Texas ............................................. Utah ............................................... Vermont .......................................... Virginia ........................................... Washington .................................... West Virginia .................................. Wisconsin ....................................... Wyoming ........................................ Water Resources Regions Region 01 New England ................. Region 02 Mid-Atlantic ................... Region 03 South Atlantic-Gulf ........ Region 04 Great Lakes .................. Region 05 Ohio .............................. Region 06 Tennessee .................... Region 07 Upper Mississippi .......... Region 08 Lower Mississippi .......... Region 09 Souris-Red-Rainy .......... Region 10 Missouri ........................ Region 11 Arkansas-White-Red ..... Region 12 Texas-Gulf .................... Region 13 Rio Grande ................... Region 14 Upper Colorado ............. Region 15 Lower Colorado ............. Region 16 Great Basin ................... Region 17 Pacific Northwest .......... Region 18 California ....................... Region 19 Alaska ........................... Region 20 Hawaii ...........................
6,336
71 28 46 19
570
36 137
29 374
75
118 39
141 151
82
44 145
34 86
103
188 458 132
59 113
41 24 11 94
181
38 329 298
9 239
33
197 513
40 38
16
134 172
12 128
95
127 41
240 8
595 1,085
898 765 591
126 547
67 15
154
121 159
31 9
58
18 375 576
28 118
371,620,978
3,633,401 87,280
35,927,810 71,652
110,645,964
545,170 3,411,087
403,000 55,164,918 6,604,232
9,088,398
663,560 2,504,726 1,745,028 1,250,476
182,600
1,496,316 806,792
4,075,419 3,919,850
2,281,978
17,900,212 3,506,605 3,313,670 6,038,024
192,610 239,300 25,200
2,032,834 12,203,705
7,197,484 7,354,246 8,134,399
22,500 5,662,472
674,400
3,691,744 7,654,810
148,200 780,698
16,856
1,516,526 27,876,702 1,175,000 1,146,620
2,436,530 2,655,300
335,300 3,027,374
152,000
12,594,126 30,341,489 76,117,215 23,341,962 7,859,594
3,047,979
11,072,441 1,007,384
23,100 5,824,034
1,304,002
27,667,342 197,484 140,710
43,377,810
750,200 7,129,104
110,649,324 87,280
9,088,398
4,946,370
4,895 287
853,546 845
1,396,511
8,186 16,373
1,270 778,419 13,160
130,589
3,691 9,410 5,687
(D)
1,952 10,821 15,611 27,783 16,258
8,455
145,678 59,470 29,645
(D)
2,296 363 941
32,152 119,478
76,684 89,220
(D)14
52,303
426 51,417 53,769
1,456 18,149
567
42,966 644,890
(D)20,344
32,547 14,669
1,384 63,949
2,691
98,213 254,391 885,747 226,640 63,951
40,404
133,398 25,152
14 18,762
13,104
637,922 6,684 3,771
924,746
16,116 69,932
1,396,547 287
130,589
4,595
40 28 35 11
368
14 99 19
321 69
65 22
103 115
53
25 32 34 59 85
110 350 132
46 58
41 24 11 83
163
38 204 251
9 171
16
135 399
20 37
12 81
114 7
97
48 89 20
228 4
410 871 761 560 323
72
437 43 15
110
72 101
31 4
47
13 258 374
28 65
3,610,778
(D)287
625,032 788
962,901
3,752 15,869
760 611,876 10,814
62,206
145 6,390 2,787 1,053
1,644 1,612
15,611 4,196
10,337
(D)107,323 59,440 23,506
(D)
2,278 248 941
31,075 117,939
74,761
(D)33,842
13 46,408
58 (D)
44,666 (D)(D)
164
29,075 544,229
(D)13,365
(D)(D)
850 32,940
1,971
68,447 192,440 697,151 140,719 40,599
30,225
(D)17,173
13 6,591
9,916
537,261 4,761
(D)696,232
(D)
50,593 962,937
287 62,206
957
11 - 9 2
59
- 33
- 50
2
12 7
25 21 18
-
16 - 9
17
7 33
5 7
31
- 6 6
10 12
-
69 42
9 49
16 60
100 13
1
- 41 23
- 51
35 13 10 17
-
90 202 117
87 99
29 81 12
9 24
18 23
- - 9
6
80 59
- 12
763,334
(D) -
(D) (D)
146,007
- (D)
- (D) (D)
56,628
71 2,284 2,130 1,195
-
3,160 -
19,736 4,967
(D)
11,345 27
6,013 (D)
-
115 (Z) (D)
1,275
- (D) (D)
1 3,433
8
(D) 4,289
(D) (D)
-
7,502 16,829
- (D)
23,624
(D) 80
30,177 -
22,909 (D)
176,063 15,264
(D)
6,528 33,840
(D) 1
8,894
48 16,829
- -
(D)
(Z) (D)
146,007 -
56,628
1,418
31 - 6 6
217
22 10 10 36
6
48 10 19 30 21
19
102 -
18 12
71
128 4 6
25
12 - - 6
23
12 80 53
- 41
17 35 65 20
-
4 36 55
5 6
17 34 16 20
4
131 121 119 191 214
42 76 12
- 32
47 55 12
5 6
5
85 217
- 48
572,257
(D)-
(D)(D)
287,602
4,434 (D)
510 (D)(D)
11,755
3,474 736 771 (D)
308
6,049 -
3,851 954
(D)
27,010 3
126 (D)
18
- -
(D)263
1,923
45,312 (D)
- 2,463
361 (D)
4,814 (D)
-
403 6,388
83,831 (D)(D)
(D)(D)
455 832 720
6,857 (D)
12,533 70,657
(D)
3,650 (D)(D)
- 3,276
3,140
83,831 1,923
(D)(D)
(D)(D)
287,602 -
11,755
--continued

190 2008 FRIS – HORTICULTURAL OPERATIONS DATA 2007 CENSUS OF AGRICULTURE USDA, National Agricultural Statistics Service
Table 3. Estimated Quantity of Water Applied to Crops Grown Under Protection on Irrigated Horticultural Operations by Method of Distribution and Water Source: 2008 - Con.
[Totals may not add due to rounding. Excludes abnormal operations. For meaning of abbreviations and symbols, see introductory text]
Subirrigation
Water source
Ground water (from wells) On-farm surface water Water from off-farm suppliers Geographic area Operations Square feet
irrigated
Gallons applied (1,000)
Operations Gallons applied (1,000) Operations Gallons applied
(1,000) Operations Gallons applied (1,000)
United States ................................. Alabama ........................................ Alaska ............................................ Arizona .......................................... Arkansas ........................................ California ....................................... Colorado ........................................ Connecticut .................................... Delaware ....................................... Florida ............................................ Georgia .......................................... Hawaii ............................................ Idaho .............................................. Illinois ............................................. Indiana ........................................... Iowa ............................................... Kansas ........................................... Kentucky ........................................ Louisiana ....................................... Maine ............................................. Maryland ........................................ Massachusetts ............................... Michigan ........................................ Minnesota ...................................... Mississippi ..................................... Missouri ......................................... Montana ......................................... Nebraska ....................................... Nevada .......................................... New Hampshire ............................. New Jersey .................................... New Mexico ................................... New York ....................................... North Carolina ............................... North Dakota ................................. Ohio ............................................... Oklahoma ...................................... Oregon ........................................... Pennsylvania ................................. Rhode Island ................................. South Carolina ............................... South Dakota ................................. Tennessee ..................................... Texas ............................................. Utah ............................................... Vermont ......................................... Virginia ........................................... Washington .................................... West Virginia ................................. Wisconsin ...................................... Wyoming ........................................ Water Resources Regions Region 01 New England ................ Region 02 Mid-Atlantic ................... Region 03 South Atlantic-Gulf ....... Region 04 Great Lakes .................. Region 05 Ohio .............................. Region 06 Tennessee .................... Region 07 Upper Mississippi ......... Region 08 Lower Mississippi ......... Region 09 Souris-Red-Rainy ......... Region 10 Missouri ........................ Region 11 Arkansas-White-Red .... Region 12 Texas-Gulf .................... Region 13 Rio Grande ................... Region 14 Upper Colorado ............ Region 15 Lower Colorado ............ Region 16 Great Basin .................. Region 17 Pacific Northwest .......... Region 18 California ...................... Region 19 Alaska .......................... Region 20 Hawaii ..........................
420
- - 7 -
26
- 5 -
12 6
15
- 3 6
10
- 41
- 18 12
8
29 9 - -
- 6 -
16 6
-
23 8 - -
- 18 44
7 7
-
12 6 5 -
6 17
- 32
-
54 73 39 60 47
6
41 - - 6
6 - - - 7
5
35 26
- 15
18,950,180
- -
669,116 -
4,026,460
- (D)
- (D)
1,306,800
78,000 -
1,200,000 14,400
338,700
- 477,852
- 127,200 155,448
340,000
1,915,390 380,112
- -
- 18,000
- (D)
1,200
- 162,200
(D) - -
- 151,638
1,437,637 9,800
147,567
- 36,000
2,700 250,000
-
60,000 526,000
- 151,280
-
845,320 1,648,485 6,112,727 2,096,670
483,852
30,000 2,011,212
- -
18,000
2,700 - - -
669,116
250,000 677,638
4,026,460 -
78,000
292,799
- -
32,787 -
58,802
- (D)
- (D)
1,307
(D)-
24,000 120 (D)
-
2,030 -
381 1,574
(D)
15,093 16,136
- -
- 21
- (D)
6
- (D)(D)
- -
- 752
2,158 7
5,357
- 402
6 (D)
-
(D)7,285
- 558
-
10,713 5,467
103,826 16,768
2,096
336 (D)
- -
(D)
6 - - -
32,787
8,550 8,037
58,802 -
(D)
282
- - - -
22
- - -
12 6
- - - 6 5
- 6 -
18 12
8
21 9 - -
- 6 -
16 6
-
17 7 - -
- 12 30
7 1
- - 6 - -
6 11
- 32
-
49 59 32 46
6
- 33
- - 6
6 - - - -
- 23 22
- -
95,255
- - - -
47,543
- - -
1,346 1,307
- - -
120 (D)
-
130 -
366 1,574
(D)(D)
16,136 - -
- 21
- (D)
6
- (D)(D)
- -
- (D)
1,471 7
(D)
- - 6 - -
(D)7,218
- 558
-
(D)(D)
6,260 (D)(D)
-
(D)- -
(D)
6 - - - -
- (D)
47,543 - -
61
- - - - 4
- - - 5 -
- - 3 - -
- 6 - 6 -
7 4 - - -
- - - - -
- - 8 - -
- - 7 - 6
- - - - -
- 5 - - -
13 7
19 4 6
- 3 - - -
- - - - -
- 5 4 - -
132,372
- - - -
6,429
- - -
(D) -
- -
24,000 - -
- 42
- 15
-
70 (D)
- - -
- - - - -
- -
(D) - -
- -
600 -
(D)
- - - - -
- 18
- - -
85 (D)
97,566 (D) (D)
-
24,000 - - -
- - - - -
- 18
6,429 - -
120
- - 7 - 4
- 5 - - -
15 - - - 5
-
29 - - -
- 13
- - -
- - - - -
- 6 - - -
- 6 7 - -
- 12
- 5 -
- 6 - - -
5 7 -
19 35
6 5 - - -
- - - - 7
5
12 4 -
15
65,172
- -
32,787 -
4,829
- (D)
- - -
(D)- - -
(D)
- 1,858
- - -
- 8,987
- - -
- - - - -
- (D)
- - -
- (D)87
- -
- 402
- (D)
-
- 49
- - -
(D)(D)
- 10,187
1,924
336 4,628
- - -
- - - -
32,787
8,550 (D)
4,829 -
(D)

2007 CENSUS OF AGRICULTURE 2008 FRIS – HORTICULTURAL OPERATIONS DATA 191 USDA, National Agricultural Statistics Service
Table 4. Estimated Quantity of Water Applied to Crops Grown in the Open on Irrigated Horticultural Operations by Method of Distribution and Water Source: 2008
[Totals may not add due to rounding. Excludes abnormal operations. For meaning of abbreviations and symbols, see introductory text]
All methods
Water source
Ground water (from wells) On-farm surface water Water from off-farm suppliers Geographic area Operations Acres
irrigated
Gallons applied (1,000)
Operations Gallons applied (1,000) Operations Gallons applied
(1,000) Operations Gallons applied (1,000)
United States .................................. Alabama ......................................... Alaska ............................................ Arizona ........................................... Arkansas ........................................ California ........................................ Colorado ......................................... Connecticut .................................... Delaware ........................................ Florida ............................................ Georgia .......................................... Hawaii ............................................ Idaho .............................................. Illinois ............................................. Indiana ........................................... Iowa ............................................... Kansas ........................................... Kentucky ........................................ Louisiana ........................................ Maine ............................................. Maryland ........................................ Massachusetts ............................... Michigan ......................................... Minnesota ....................................... Mississippi ...................................... Missouri .......................................... Montana ......................................... Nebraska ........................................ Nevada ........................................... New Hampshire .............................. New Jersey .................................... New Mexico .................................... New York ........................................ North Carolina ................................ North Dakota .................................. Ohio ............................................... Oklahoma ....................................... Oregon ........................................... Pennsylvania .................................. Rhode Island .................................. South Carolina ............................... South Dakota ................................. Tennessee ..................................... Texas ............................................. Utah ............................................... Vermont .......................................... Virginia ........................................... Washington .................................... West Virginia .................................. Wisconsin ....................................... Wyoming ........................................ Water Resources Regions Region 01 New England ................. Region 02 Mid-Atlantic ................... Region 03 South Atlantic-Gulf ........ Region 04 Great Lakes .................. Region 05 Ohio .............................. Region 06 Tennessee .................... Region 07 Upper Mississippi .......... Region 08 Lower Mississippi .......... Region 09 Souris-Red-Rainy .......... Region 10 Missouri ........................ Region 11 Arkansas-White-Red ..... Region 12 Texas-Gulf .................... Region 13 Rio Grande ................... Region 14 Upper Colorado ............. Region 15 Lower Colorado ............. Region 16 Great Basin ................... Region 17 Pacific Northwest .......... Region 18 California ....................... Region 19 Alaska ........................... Region 20 Hawaii ...........................
18,797
303 29
142 128
1,897
265 234
55 2,211
507
494 236 413 289 155
154 340 290 214 272
314 659 282 177 284
199 166
28 170 560
73
575 782
3 463
154
1,182 817
98 273
43
391 727 111 139
359 511
78 521
30
1,087 2,307 4,187 1,311 1,207
345
1,165 330
20 749
488 687
76 107 171
117
2,026 1,894
29 494
579,633
20,170 31
7,451 7,412
52,886
11,841 2,356 1,856
72,609 36,568
1,793
10,719 17,274
7,268 3,178
3,074 1,909 5,401 1,327 8,764
1,444
16,882 7,165 4,172 7,269
1,769 3,926
829 714
21,409
2,679 8,765
20,932 61
7,238
19,836 52,679
4,115 2,383
18,418
966 12,046 45,134
4,601 186
8,285
19,172 339
11,543 793
8,284 49,633
173,361 23,113 18,012
6,791
39,991 7,394
112 20,172
35,188 42,144
2,851 1,593 8,350
5,189
82,753 52,878
31 1,793
209,392,915
5,974,133 1,018
10,077,845 1,803,809
35,010,414
6,949,727 855,216 518,906
22,643,702 9,700,097
597,133
2,594,648 2,200,463
864,166 249,234
637,861 339,217
1,071,775 341,545
1,496,310
87,480 2,089,767 1,092,200
680,039 1,140,890
474,005 844,086 459,737 94,465
5,043,410
682,488 568,642
5,525,033 23,037
1,121,831
5,231,080 37,357,580
646,683 502,113
3,107,420
273,591 2,611,749
16,902,881 2,842,612
24,322
2,158,406 12,132,212
94,356 1,175,724
477,856
1,895,120 9,540,818
47,943,730 3,080,851 3,217,907
768,497
5,272,121 1,156,714
27,670 7,498,686
9,457,012
16,667,686 695,697 982,265
10,180,527
3,238,770 51,637,205 35,533,490
1,018 597,133
12,707
196 21 85 72
1,031
134 159
36 1,896
399
192 129 292 221
86
80 99
223 157 212
172 487 250 127 179
156 137
16 141 469
59
375 459
- 301
86
819 588
45 220
32
203 509
27 84
222 290
57 466
11
726 1,721 3,272
913 623
210 940 257
9 473
281 493
58 26
100
41 1,321 1,030
21 192
103,727,069
2,538,857 552
2,028,954 844,893
25,227,979
4,295,123 45,727
441,236 15,353,479 5,323,255
261,368 966,561
1,745,574 631,472 228,227
434,444
(D)718,307
(D)1,252,631
(D)
1,271,447 706,794 275,585 492,683
291,106 814,654
(D)64,895
3,294,626
254,621 239,129 623,037
- 433,783
2,462,131
10,616,889 97,028
9,452 1,841,111
(D)
436,987 10,531,005 1,883,333
18,804
473,088 2,144,364
88,808 1,049,656
234,882
197,292 5,769,947
25,883,645 1,475,476
745,078
301,405 4,149,949
708,298 22,468
4,927,900
5,125,957 10,472,916
253,317 72,981
2,057,810
2,311,911 13,207,216 25,781,583
552 261,368
5,303
112 4
22 47
303
52 76 31
557 187
77 63
123 60 49
25
120 99 46 63
101 202
75 23 81
35 25
7 18
145
19 175 422
3 179
54
391 241
41 114
7
182 228
18 55
174
90 15 59
8
294 732
1,417 376 417
128 271
79 14
145
177 202
26 28 30
25
559 302
4 77
50,764,157
3,219,758 72
873,473 (D)
2,716,989
849,107 806,975 77,559
(D) 4,324,422
50,370
(D) 448,795 229,997 20,266
185,039 263,562 332,921 280,836
(D)
27,225 637,838 383,309 401,756 640,385
172,302 12,195
(D) 22,930
1,740,331
62,771 324,155
4,748,839 23,037
647,124
2,016,968 (D)
220,410 446,121
(D)
(D) 2,096,564 3,443,072
(D) 4,761
1,653,257
(D) 3,398
121,693 203,754
1,583,653 3,718,759
20,433,313 1,416,610 2,042,764
421,089
1,110,347 428,711
5,202 1,454,349
3,359,130 3,347,505
(D) 129,881 914,890
(D)
7,046,242 2,716,984
72 50,370
3,943
61 4
66 33
890
124 27 10
175 27
299 102
53 48 36
60
149 26 24 24
84 91 15 34 47
29 11 12 18 41
14
129 60
- 59
43
229 109
20 9
9
72 225
75 13
35
162 11 26 23
173 223 344 207 350
40
105 49
- 218
105 204
18 63 86
65
503 887
4 299
54,901,690
215,517 394
7,175,418 (D)
7,065,446
1,805,496 2,514
111 (D)
52,420
285,395 (D)
6,094 2,696
740
18,379 (D)
20,547 (D)(D)
(D)180,481
2,096 2,698 7,822
10,596 17,237
1,161 6,639 8,454
365,097 5,357
153,156 -
40,924
751,981 (D)
329,244 46,539
(D)
(D)78,198
2,928,803 (D)
757
32,061 (D)
2,150 4,375
39,220
114,175 52,112
1,626,771 188,765 430,065
46,004 11,825 19,706
-1,116,437
971,925 2,847,266
(D)779,403
7,207,827
(D)31,383,747 7,034,923
394 285,395
--continued
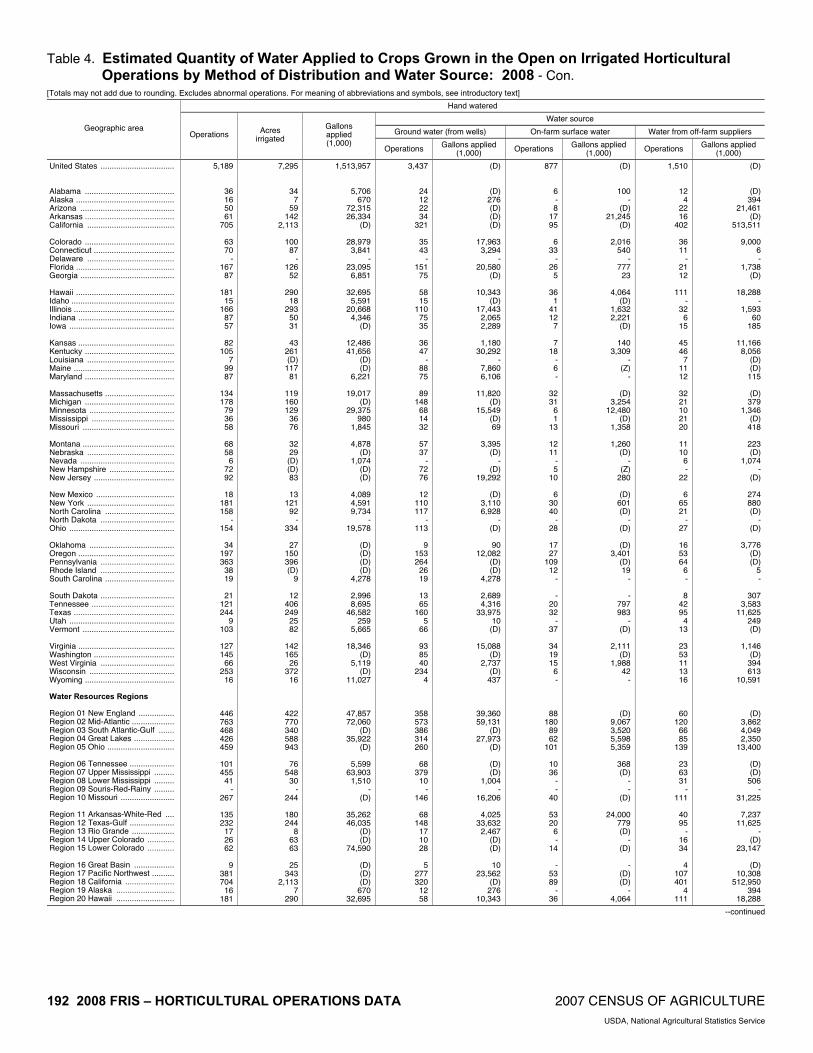
192 2008 FRIS – HORTICULTURAL OPERATIONS DATA 2007 CENSUS OF AGRICULTURE USDA, National Agricultural Statistics Service
Table 4. Estimated Quantity of Water Applied to Crops Grown in the Open on Irrigated Horticultural Operations by Method of Distribution and Water Source: 2008 - Con.
[Totals may not add due to rounding. Excludes abnormal operations. For meaning of abbreviations and symbols, see introductory text]
Hand watered
Water source
Ground water (from wells) On-farm surface water Water from off-farm suppliers Geographic area Operations Acres
irrigated
Gallons applied (1,000)
Operations Gallons applied (1,000) Operations Gallons applied
(1,000) Operations Gallons applied (1,000)
United States ................................. Alabama ........................................ Alaska ............................................ Arizona .......................................... Arkansas ........................................ California ....................................... Colorado ........................................ Connecticut .................................... Delaware ....................................... Florida ............................................ Georgia .......................................... Hawaii ............................................ Idaho .............................................. Illinois ............................................. Indiana ........................................... Iowa ............................................... Kansas ........................................... Kentucky ........................................ Louisiana ....................................... Maine ............................................. Maryland ........................................ Massachusetts ............................... Michigan ........................................ Minnesota ...................................... Mississippi ..................................... Missouri ......................................... Montana ......................................... Nebraska ....................................... Nevada .......................................... New Hampshire ............................. New Jersey .................................... New Mexico ................................... New York ....................................... North Carolina ............................... North Dakota ................................. Ohio ............................................... Oklahoma ...................................... Oregon ........................................... Pennsylvania ................................. Rhode Island ................................. South Carolina ............................... South Dakota ................................. Tennessee ..................................... Texas ............................................. Utah ............................................... Vermont ......................................... Virginia ........................................... Washington .................................... West Virginia ................................. Wisconsin ...................................... Wyoming ........................................ Water Resources Regions Region 01 New England ................ Region 02 Mid-Atlantic ................... Region 03 South Atlantic-Gulf ....... Region 04 Great Lakes .................. Region 05 Ohio .............................. Region 06 Tennessee .................... Region 07 Upper Mississippi ......... Region 08 Lower Mississippi ......... Region 09 Souris-Red-Rainy ......... Region 10 Missouri ........................ Region 11 Arkansas-White-Red .... Region 12 Texas-Gulf .................... Region 13 Rio Grande ................... Region 14 Upper Colorado ............ Region 15 Lower Colorado ............ Region 16 Great Basin .................. Region 17 Pacific Northwest .......... Region 18 California ...................... Region 19 Alaska .......................... Region 20 Hawaii ..........................
5,189
36 16 50 61
705
63 70
- 167
87
181 15
166 87 57
82
105 7
99 87
134 178
79 36 58
68 58
6 72 92
18
181 158
- 154
34
197 363
38 19
21
121 244
9 103
127 145
66 253
16
446 763 468 426 459
101 455
41 -
267
135 232
17 26 62
9
381 704
16 181
7,295
34 7
59 142
2,113
100 87
- 126
52
290 18
293 50 31
43
261 (D)
117 81
119 160 129
36 76
32 29 (D) (D) 83
13
121 92
- 334
27
150 396 (D)
9
12 406 249
25 82
142 165
26 372
16
422 770 340 588 943
76
548 30
- 244
180 244
8 63 63
25
343 2,113
7 290
1,513,957
5,706 670
72,315 26,334
(D)
28,979 3,841
- 23,095
6,851
32,695 5,591
20,668 4,346
(D)
12,486 41,656
(D) (D)
6,221
19,017 (D)
29,375 980
1,845
4,878 (D)
1,074 (D) (D)
4,089 4,591 9,734
- 19,578
(D) (D) (D) (D)
4,278
2,996 8,695
46,582 259
5,665
18,346 (D)
5,119 (D)
11,027
47,857 72,060
(D) 35,922
(D)
5,599 63,903
1,510 -
(D)
35,262 46,035
(D) (D)
74,590
(D) (D) (D)
670 32,695
3,437
24 12 22 34
321
35 43
- 151
75
58 15
110 75 35
36 47
- 88 75
89
148 68 14 32
57 37
- 72 76
12
110 117
- 113
9
153 264
26 19
13 65
160 5
66
93 85 40
234 4
358 573 386 314 260
68
379 10
- 146
68
148 17 10 28
5
277 320
12 58
(D)
(D)276 (D)(D)(D)
17,963
3,294 -
20,580 (D)
10,343
(D)17,443
2,065 2,289
1,180
30,292 -
7,860 6,106
11,820
(D)15,549
(D)69
3,395
(D)-
(D)19,292
(D)
3,110 6,928
- (D)
90
12,082 (D)(D)
4,278
2,689 4,316
33,975 10 (D)
15,088
(D)2,737
(D)437
39,360 59,131
(D)27,973
(D)
(D)(D)
1,004 -
16,206
4,025 33,632
2,467 (D)(D)
10
23,562 (D)
276 10,343
877
6 - 8
17 95
6
33 -
26 5
36
1 41 12
7
7 18
- 6 -
32 31
6 1
13
12 11
- 5
10
6 30 40
- 28
17 27
109 12
-
- 20 32
- 37
34 19 15
6 -
88 180
89 62
101
10 36
- -
40
53 20
6 -
14
- 53 89
- 36
(D)
100 -
(D) 21,245
(D)
2,016 540
- 777
23
4,064 (D)
1,632 2,221
(D)
140 3,309
- (Z)
-
(D) 3,254
12,480 (D)
1,358
1,260 (D)
- (Z)
280
(D) 601 (D)
- (D)
(D)
3,401 (D) 19
-
- 797 983
- (D)
2,111
(D) 1,988
42 -
(D) 9,067 3,520 5,598 5,359
368 (D)
- -
(D)
24,000 779 (D)
- (D)
-
(D) (D)
- 4,064
1,510
12 4
22 16
402
36 11
- 21 12
111
- 32
6 15
45 46
7 11 12
32 21 10 21 20
11 10
6 -
22
6 65 21
- 27
16 53 64
6 -
8 42 95
4 13
23 53 11 13 16
60 120
66 85
139
23 63 31
- 111
40 95
- 16 34
4
107 401
4 111
(D)
(D)394
21,461 (D)
513,511
9,000 6-
1,738 (D)
18,288 -
1,593 60
185
11,166 8,056
(D)(D)
115
(D)379
1,346 (D)
418
223 (D)
1,074 -
(D)
274 880 (D)
-(D)
3,776 (D)(D)
5-
307 3,583
11,625 249 (D)
1,146 (D)
394 613
10,591
(D)3,862 4,049 2,350
13,400
(D)(D)
506 -
31,225
7,237 11,625
-(D)
23,147
(D)10,308
512,950 394
18,288
--continued
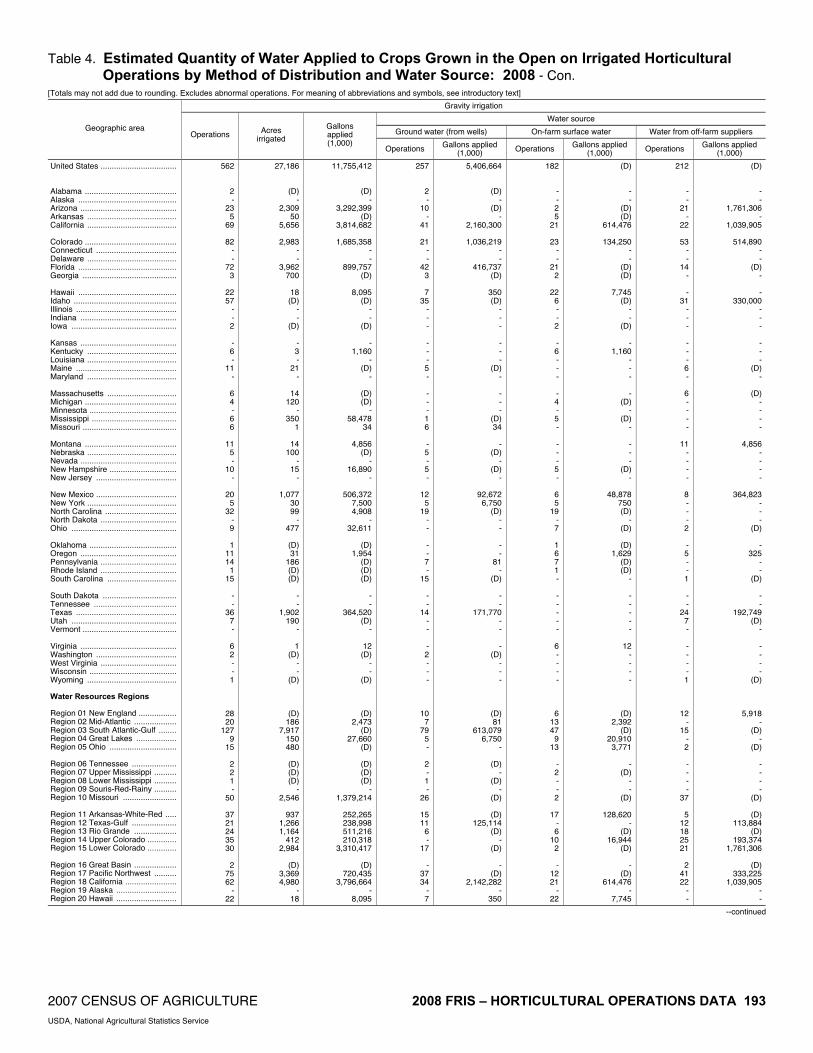
2007 CENSUS OF AGRICULTURE 2008 FRIS – HORTICULTURAL OPERATIONS DATA 193 USDA, National Agricultural Statistics Service
Table 4. Estimated Quantity of Water Applied to Crops Grown in the Open on Irrigated Horticultural Operations by Method of Distribution and Water Source: 2008 - Con.
[Totals may not add due to rounding. Excludes abnormal operations. For meaning of abbreviations and symbols, see introductory text]
Gravity irrigation
Water source
Ground water (from wells) On-farm surface water Water from off-farm suppliers Geographic area Operations Acres
irrigated
Gallons applied (1,000)
Operations Gallons applied (1,000) Operations Gallons applied
(1,000) Operations Gallons applied (1,000)
United States .................................. Alabama ......................................... Alaska ............................................ Arizona ........................................... Arkansas ........................................ California ........................................ Colorado ......................................... Connecticut .................................... Delaware ........................................ Florida ............................................ Georgia .......................................... Hawaii ............................................ Idaho .............................................. Illinois ............................................. Indiana ........................................... Iowa ............................................... Kansas ........................................... Kentucky ........................................ Louisiana ........................................ Maine ............................................. Maryland ........................................ Massachusetts ............................... Michigan ......................................... Minnesota ....................................... Mississippi ...................................... Missouri .......................................... Montana ......................................... Nebraska ........................................ Nevada ........................................... New Hampshire .............................. New Jersey .................................... New Mexico .................................... New York ........................................ North Carolina ................................ North Dakota .................................. Ohio ............................................... Oklahoma ....................................... Oregon ........................................... Pennsylvania .................................. Rhode Island .................................. South Carolina ............................... South Dakota ................................. Tennessee ..................................... Texas ............................................. Utah ............................................... Vermont .......................................... Virginia ........................................... Washington .................................... West Virginia .................................. Wisconsin ....................................... Wyoming ........................................ Water Resources Regions Region 01 New England ................. Region 02 Mid-Atlantic ................... Region 03 South Atlantic-Gulf ........ Region 04 Great Lakes .................. Region 05 Ohio .............................. Region 06 Tennessee .................... Region 07 Upper Mississippi .......... Region 08 Lower Mississippi .......... Region 09 Souris-Red-Rainy .......... Region 10 Missouri ........................ Region 11 Arkansas-White-Red ..... Region 12 Texas-Gulf .................... Region 13 Rio Grande ................... Region 14 Upper Colorado ............. Region 15 Lower Colorado ............. Region 16 Great Basin ................... Region 17 Pacific Northwest .......... Region 18 California ....................... Region 19 Alaska ........................... Region 20 Hawaii ...........................
562
2 -
23 5
69
82 - -
72 3
22 57
- - 2
- 6 -
11 -
6 4 - 6 6
11
5 -
10 -
20 5
32 - 9
1
11 14
1 15
- -
36 7 -
6 2 - - 1
28 20
127 9
15
2 2 1 -
50
37 21 24 35 30
2
75 62
- 22
27,186
(D) -
2,309 50
5,656
2,983 - -
3,962 700
18 (D)
- -
(D)
- 3 -
21 -
14 120
- 350
1
14 100
- 15
-
1,077 30 99
- 477
(D) 31
186 (D) (D)
- -
1,902 190
-
1 (D)
- -
(D)
(D) 186
7,917 150 480
(D) (D) (D)
- 2,546
937
1,266 1,164
412 2,984
(D)
3,369 4,980
- 18
11,755,412
(D) -
3,292,399 (D)
3,814,682
1,685,358 - -
899,757 (D)
8,095
(D) - -
(D)
- 1,160
- (D)
-
(D) (D)
- 58,478
34
4,856 (D)
- 16,890
-
506,372 7,500 4,908
- 32,611
(D)
1,954 (D) (D) (D)
- -
364,520 (D)
-
12 (D)
- -
(D)
(D) 2,473
(D) 27,660
(D)
(D) (D) (D)
- 1,379,214
252,265 238,998 511,216 210,318
3,310,417
(D) 720,435
3,796,664 -
8,095
257
2 -
10 -
41
21 - -
42 3
7
35 - - -
- - - 5 -
- - - 1 6
- 5 - 5 -
12 5
19 - -
- - 7 -
15
- -
14 - -
- 2 - - -
10 7
79 5 -
2 - 1 -
26
15 11
6 -
17
- 37 34
- 7
5,406,664
(D)-
(D)-
2,160,300
1,036,219 - -
416,737 (D)
350 (D)
- - -
- - -
(D)-
- - -
(D)34
-
(D)-
(D)-
92,672 6,750
(D)- -
- -
81 -
(D)
- -
171,770 - -
- (D)
- - -
(D)81
613,079 6,750
-
(D)-
(D)-
(D)
(D)125,114
(D)-
(D)
- (D)
2,142,282 -
350
182
- - 2 5
21
23 - -
21 2
22
6 - - 2
- 6 - - -
- 4 - 5 -
- - - 5 -
6 5
19 - 7
1 6 7 1 -
- - - - -
6 - - - -
6 13 47
9 13
- 2 - - 2
17
- 6
10 2
-
12 21
- 22
(D)
- -
(D) (D)
614,476
134,250 - -
(D) (D)
7,745
(D) - -
(D)
- 1,160
- - -
- (D)
- (D)
-
- - -
(D) -
48,878 750 (D)
- (D)
(D)
1,629 (D) (D)
-
- - - - -
12 - - - -
(D) 2,392
(D) 20,910
3,771
- (D)
- -
(D)
128,620 -
(D) 16,944
(D)
- (D)
614,476 -
7,745
212
- -
21 -
22
53 - -
14 -
- 31
- - -
- - - 6 -
6 - - - -
11 - - - -
8 - - - 2
- 5 - - 1
- -
24 7 -
- - - - 1
12 -
15 - 2
- - - -
37
5 12 18 25 21
2
41 22
- -
(D)
--
1,761,306 -
1,039,905
514,890 --
(D)-
-330,000
---
---
(D)-
(D)----
4,856 ----
364,823 ---
(D)
-325
--
(D)
--
192,749 (D)
-
----
(D)
5,918 -
(D)-
(D)
----
(D)
(D)113,884
(D)193,374
1,761,306
(D)333,225
1,039,905 --
--continued
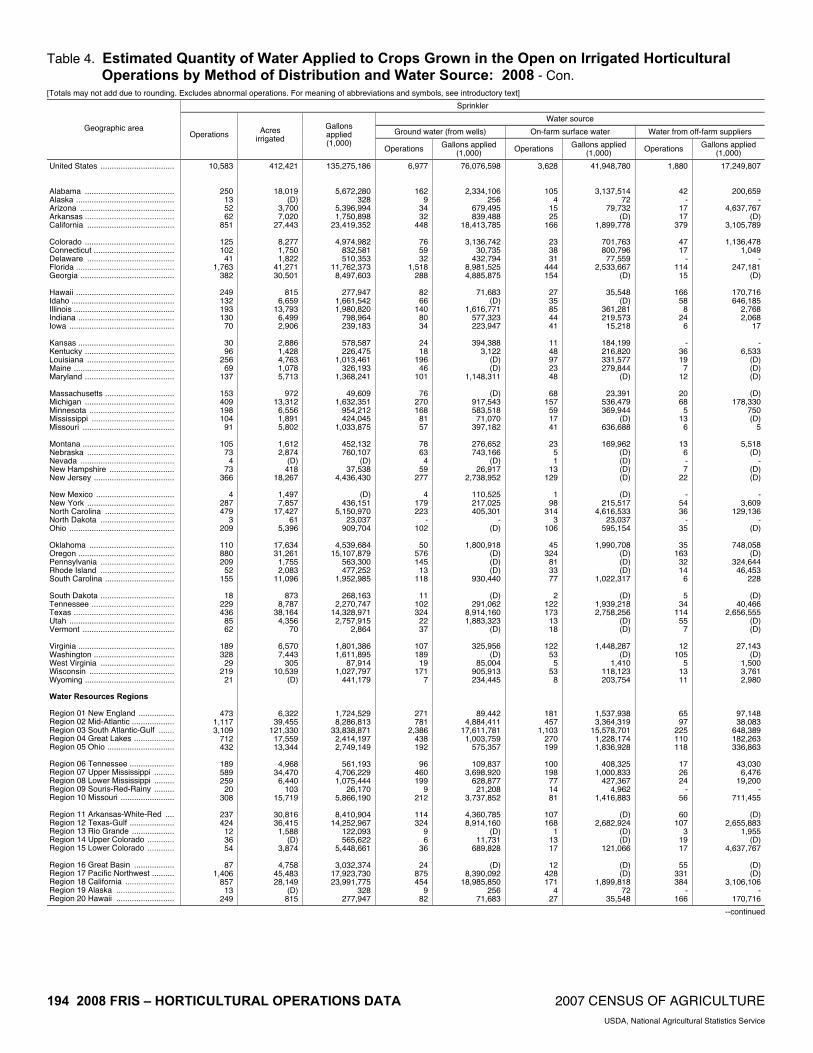
194 2008 FRIS – HORTICULTURAL OPERATIONS DATA 2007 CENSUS OF AGRICULTURE USDA, National Agricultural Statistics Service
Table 4. Estimated Quantity of Water Applied to Crops Grown in the Open on Irrigated Horticultural Operations by Method of Distribution and Water Source: 2008 - Con.
[Totals may not add due to rounding. Excludes abnormal operations. For meaning of abbreviations and symbols, see introductory text]
Sprinkler
Water source
Ground water (from wells) On-farm surface water Water from off-farm suppliers Geographic area Operations Acres
irrigated
Gallons applied (1,000)
Operations Gallons applied (1,000) Operations Gallons applied
(1,000) Operations Gallons applied (1,000)
United States ................................. Alabama ........................................ Alaska ............................................ Arizona .......................................... Arkansas ........................................ California ....................................... Colorado ........................................ Connecticut .................................... Delaware ....................................... Florida ............................................ Georgia .......................................... Hawaii ............................................ Idaho .............................................. Illinois ............................................. Indiana ........................................... Iowa ............................................... Kansas ........................................... Kentucky ........................................ Louisiana ....................................... Maine ............................................. Maryland ........................................ Massachusetts ............................... Michigan ........................................ Minnesota ...................................... Mississippi ..................................... Missouri ......................................... Montana ......................................... Nebraska ....................................... Nevada .......................................... New Hampshire ............................. New Jersey .................................... New Mexico ................................... New York ....................................... North Carolina ............................... North Dakota ................................. Ohio ............................................... Oklahoma ...................................... Oregon ........................................... Pennsylvania ................................. Rhode Island ................................. South Carolina ............................... South Dakota ................................. Tennessee ..................................... Texas ............................................. Utah ............................................... Vermont ......................................... Virginia ........................................... Washington .................................... West Virginia ................................. Wisconsin ...................................... Wyoming ........................................ Water Resources Regions Region 01 New England ................ Region 02 Mid-Atlantic ................... Region 03 South Atlantic-Gulf ....... Region 04 Great Lakes .................. Region 05 Ohio .............................. Region 06 Tennessee .................... Region 07 Upper Mississippi ......... Region 08 Lower Mississippi ......... Region 09 Souris-Red-Rainy ......... Region 10 Missouri ........................ Region 11 Arkansas-White-Red .... Region 12 Texas-Gulf .................... Region 13 Rio Grande ................... Region 14 Upper Colorado ............ Region 15 Lower Colorado ............ Region 16 Great Basin .................. Region 17 Pacific Northwest .......... Region 18 California ...................... Region 19 Alaska .......................... Region 20 Hawaii ..........................
10,583
250 13 52 62
851
125 102
41 1,763
382
249 132 193 130
70
30 96
256 69
137
153 409 198 104
91
105 73
4 73
366
4 287 479
3 209
110 880 209
52 155
18
229 436
85 62
189 328
29 219
21
473 1,117 3,109
712 432
189 589 259
20 308
237 424
12 36 54
87
1,406 857
13 249
412,421
18,019 (D)
3,700 7,020
27,443
8,277 1,750 1,822
41,271 30,501
815
6,659 13,793
6,499 2,906
2,886 1,428 4,763 1,078 5,713
972
13,312 6,556 1,891 5,802
1,612 2,874
(D) 418
18,267
1,497 7,857
17,427 61
5,396
17,634 31,261
1,755 2,083
11,096
873 8,787
38,164 4,356
70
6,570 7,443
305 10,539
(D)
6,322 39,455
121,330 17,559 13,344
4,968
34,470 6,440
103 15,719
30,816 36,415
1,588 (D)
3,874
4,758 45,483 28,149
(D) 815
135,275,186
5,672,280 328
5,396,994 1,750,898
23,419,352
4,974,982 832,581 510,353
11,762,373 8,497,603
277,947
1,661,542 1,980,820
798,964 239,183
578,587 226,475
1,013,461 326,193
1,368,241
49,609 1,632,351
954,212 424,045
1,033,875
452,132 760,107
(D) 37,538
4,436,430
(D) 436,151
5,150,970 23,037
909,704
4,539,684 15,107,879
563,300 477,252
1,952,985
268,163 2,270,747
14,328,971 2,757,915
2,864
1,801,386 1,611,895
87,914 1,027,797
441,179
1,724,529 8,286,813
33,838,871 2,414,197 2,749,149
561,193
4,706,229 1,075,444
26,170 5,866,190
8,410,904
14,252,967 122,093 565,622
5,448,661
3,032,374 17,923,730 23,991,775
328 277,947
6,977
162 9
34 32
448
76 59 32
1,518 288
82 66
140 80 34
24 18
196 46
101
76 270 168
81 57
78 63
4 59
277
4 179 223
- 102
50
576 145
13 118
11
102 324
22 37
107 189
19 171
7
271 781
2,386 438 192
96
460 199
9 212
114 324
9 6
36
24 875 454
9 82
76,076,598
2,334,106 256
679,495 839,488
18,413,785
3,136,742 30,735
432,794 8,981,525 4,885,875
71,683
(D)1,616,771
577,323 223,947
394,388
3,122 (D)(D)
1,148,311
(D)917,543 583,518 71,070
397,182
276,652 743,166
(D)26,917
2,738,952
110,525 217,025 405,301
- (D)
1,800,918
(D)(D)(D)
930,440
(D)291,062
8,914,160 1,883,323
(D)
325,956 (D)
85,004 905,913 234,445
89,442 4,884,411
17,611,781 1,003,759
575,357
109,837 3,698,920
628,877 21,208
3,737,852
4,360,785 8,914,160
(D)11,731
689,828
(D)8,390,092
18,985,850 256
71,683
3,628
105 4
15 25
166
23 38 31
444 154
27 35 85 44 41
11 48 97 23 48
68
157 59 17 41
23
5 1
13 129
1
98 314
3 106
45
324 81 33 77
2
122 173
13 18
122
53 5
53 8
181 457
1,103 270 199
100 198
77 14 81
107 168
1 13 17
12
428 171
4 27
41,948,780
3,137,514 72
79,732 (D)
1,899,778
701,763 800,796 77,559
2,533,667 (D)
35,548
(D) 361,281 219,573 15,218
184,199 216,820 331,577 279,844
(D)
23,391 536,479 369,944
(D) 636,688
169,962
(D) (D) (D) (D)
(D)
215,517 4,616,533
23,037 595,154
1,990,708
(D) (D) (D)
1,022,317
(D) 1,939,218 2,758,256
(D) (D)
1,448,287
(D) 1,410
118,123 203,754
1,537,938 3,364,319
15,578,701 1,228,174 1,836,928
408,325
1,000,833 427,367
4,962 1,416,883
(D)
2,682,924 (D) (D)
121,066
(D) (D)
1,899,818 72
35,548
1,880
42 -
17 17
379
47 17
- 114
15
166 58
8 24
6
- 36 19
7 12
20 68
5 13
6
13 6 - 7
22
- 54 36
- 35
35
163 32 14
6
5 34
114 55
7
12 105
5 13 11
65 97
225 110 118
17 26 24
- 56
60
107 3
19 17
55
331 384
- 166
17,249,807
200,659 -
4,637,767 (D)
3,105,789
1,136,478 1,049
-247,181
(D)
170,716 646,185
2,768 2,068
17
-6,533
(D)(D)(D)
(D)178,330
750 (D)
5
5,518 (D)
-(D)(D)
-3,609
129,136 -
(D)
748,058 (D)
324,644 46,453
228
(D)40,466
2,656,555 (D)(D)
27,143 (D)
1,500 3,761 2,980
97,148 38,083
648,389 182,263 336,863
43,030 6,476
19,200 -
711,455
(D)2,655,883
1,955 (D)
4,637,767
(D)(D)
3,106,106 -
170,716
--continued

2007 CENSUS OF AGRICULTURE 2008 FRIS – HORTICULTURAL OPERATIONS DATA 195 USDA, National Agricultural Statistics Service
Table 4. Estimated Quantity of Water Applied to Crops Grown in the Open on Irrigated Horticultural Operations by Method of Distribution and Water Source: 2008 - Con.
[Totals may not add due to rounding. Excludes abnormal operations. For meaning of abbreviations and symbols, see introductory text]
Drip, trickle, or low-flow micro irrigation
Water source
Ground water (from wells) On-farm surface water Water from off-farm suppliers Geographic area Operations Acres
irrigated
Gallons applied (1,000)
Operations Gallons applied (1,000) Operations Gallons applied
(1,000) Operations Gallons applied (1,000)
United States .................................. Alabama ......................................... Alaska ............................................ Arizona ........................................... Arkansas ........................................ California ........................................ Colorado ......................................... Connecticut .................................... Delaware ........................................ Florida ............................................ Georgia .......................................... Hawaii ............................................ Idaho .............................................. Illinois ............................................. Indiana ........................................... Iowa ............................................... Kansas ........................................... Kentucky ........................................ Louisiana ........................................ Maine ............................................. Maryland ........................................ Massachusetts ............................... Michigan ......................................... Minnesota ....................................... Mississippi ...................................... Missouri .......................................... Montana ......................................... Nebraska ........................................ Nevada ........................................... New Hampshire .............................. New Jersey .................................... New Mexico .................................... New York ........................................ North Carolina ................................ North Dakota .................................. Ohio ............................................... Oklahoma ....................................... Oregon ........................................... Pennsylvania .................................. Rhode Island .................................. South Carolina ............................... South Dakota ................................. Tennessee ..................................... Texas ............................................. Utah ............................................... Vermont .......................................... Virginia ........................................... Washington .................................... West Virginia .................................. Wisconsin ....................................... Wyoming ........................................ Water Resources Regions Region 01 New England ................. Region 02 Mid-Atlantic ................... Region 03 South Atlantic-Gulf ........ Region 04 Great Lakes .................. Region 05 Ohio .............................. Region 06 Tennessee .................... Region 07 Upper Mississippi .......... Region 08 Lower Mississippi .......... Region 09 Souris-Red-Rainy .......... Region 10 Missouri ........................ Region 11 Arkansas-White-Red ..... Region 12 Texas-Gulf .................... Region 13 Rio Grande ................... Region 14 Upper Colorado ............. Region 15 Lower Colorado ............. Region 16 Great Basin ................... Region 17 Pacific Northwest .......... Region 18 California ....................... Region 19 Alaska ........................... Region 20 Hawaii ...........................
7,153
109 4
74 12
949
68 108
20 876 130
177
78 217 152
59
56 175
43 97
138
143 215
60 48
138
43 80 18 83
216
31 210 250
- 178
45
316 429
32 138
17
125 257
23 31
149 156
19 153
8
474 1,002 1,534
460 558
100 420
67 3
259
135 256
31 36 82
32
565 958
4 177
183,569
1,862 (Z)
1,414 128
17,648
477 536
3 19,271
5,316
864 855
3,339 770 245
146 407 582 114
3,048
336 3,382
530 735
1,396
111 935 (D)
261 2,989
91
765 3,178
- 1,568
2,571
79,507 1,801
88 4,287
86
2,546 5,306
(D) 49
1,604
11,349 16
726 4
1,364 9,244
34,502 5,437 3,588
1,136 5,240
682 9
1,664
3,615 4,705
91 324
1,419
277 91,758 17,650
(Z) 864
56,058,674
290,307 20
1,315,835 (D)
6,340,224
255,236 18,794
489 6,696,979
(D)
277,192 349,445 198,975 60,857
7,492
46,789 69,926 55,361
3,823 121,707
9,148
422,626 108,612
(D) 105,136
12,139 74,384
(D) 30,359
565,428
(D) (D)
307,322 -
159,938
664,522 22,216,399
59,331 16,995
(D)
2,433 326,547
2,156,775 (D)
15,793
338,633 (D)
1,324 (D) (D)
90,114 1,077,697 8,907,607
603,072 366,036
(D)
501,568 (D)
1,500 181,742
737,693
2,129,685 (D) (D)
1,315,928
(D) 32,895,360 6,340,668
20 277,192
5,019
59 4
38 12
500
28 83 10
755 98
72 32
150 122
28
34 58 41 74
111
84 182
60 48 91
43 71 12 71
207
31 156 151
- 123
20
244 344
19 120
17 76
190 -
19
95 76 13
147 -
343 823
1,214 356 303
76
329 65
3 177
91
189 31
8 38
12
379 506
4 72
19,617,193
196,106 20
264,630 (D)
4,119,703
99,029 11,698
378 (D)(D)
178,012
(D)111,359 52,084
1,990
38,876 (D)(D)
2,822 98,072
5,631
(D)107,727
(D)95,399
11,059 63,922
(D)27,609
536,382
(D)12,244
161,482 -
104,946
(D)(D)
47,944 (D)(D)
2,428
141,608 1,411,099
- (D)
132,015
(D)1,068
(D)-
61,487 818,119
5,987,059 436,993
(D)
182,893 403,691
(D)1,260
(D)
(D)1,400,010
(D)42,361
264,630
(D)(D)
4,119,757 20
178,012
1,627
33 -
13 -
139
6 24
- 178
57
19 32 66 24 21
7
48 2
17 31
26 41 13
7 30
6
15 6 2
13
- 54
123 -
71
17 100 104
7 42
5
57 79
5 12
53 16
- 6 -
75 214 445 110 172
18
109 2 3
36
26 77
- 9
13
13 142 144
- 19
4,641,396
82,144 -
296,382 -
123,513
11,079 5,638
- 1,316,396
(D)
3,013 (D)
85,883 8,204 4,963
700
42,273 (D)
992 22,968
(D) (D)
885 (D)
2,339
1,080 10,462
465 (D) (D)
-
(D) (D)
- 48,430
(D)
150,062 9,320
(D) 194,126
5
150,790 677,802
9,125 (D)
202,846
(D) -
3,528 -
(D) 249,862
2,491,648 161,927 196,705
(D) (D) (D)
240 (D)
22,548
663,802 -
(D) 296,382
3,059
(D) 123,553
- 3,013
1,448
32 -
26 -
486
38 16 10 56
-
112 31 20 18 15
15 85
- 6 6
45 15
- -
21
- - 6
11 8
-
38 21
- 10
16 44 43
6 8
-
14 52 18
-
18 68
6 - 8
84 73
117 49
144
12 23
- -
57
30 50
- 23 34
13
138 489
- 112
31,800,085
12,057 -
754,823 -
2,097,008
145,128 1,458
111 (D)
-
96,167 (D)
1,733 568 538
7,213 (D)
-8
667
(D)1,772
--
7,398
--
86 (D)(D)
-868 (D)
-6,562
147 (D)
2,066 81 (D)
-34,149 67,874
(D)-
3,772 (D)
256 -
(D)
(D)9,716
428,900 4,151
(D)
577 (D)
--
(D)
(D)65,874
-(D)
754,916
4,371 (D)
2,097,359 -
96,167
--continued

196 2008 FRIS – HORTICULTURAL OPERATIONS DATA 2007 CENSUS OF AGRICULTURE USDA, National Agricultural Statistics Service
Table 4. Estimated Quantity of Water Applied to Crops Grown in the Open on Irrigated Horticultural Operations by Method of Distribution and Water Source: 2008 - Con.
[Totals may not add due to rounding. Excludes abnormal operations. For meaning of abbreviations and symbols, see introductory text]
Subirrigation
Water source
Ground water (from wells) On-farm surface water Water from off-farm suppliers Geographic area Operations Acres
irrigated
Gallons applied (1,000)
Operations Gallons applied (1,000) Operations Gallons applied
(1,000) Operations Gallons applied (1,000)
United States ................................. Alabama ........................................ Alaska ............................................ Arizona .......................................... Arkansas ........................................ California ....................................... Colorado ........................................ Connecticut .................................... Delaware ....................................... Florida ............................................ Georgia .......................................... Hawaii ............................................ Idaho .............................................. Illinois ............................................. Indiana ........................................... Iowa ............................................... Kansas ........................................... Kentucky ........................................ Louisiana ....................................... Maine ............................................. Maryland ........................................ Massachusetts ............................... Michigan ........................................ Minnesota ...................................... Mississippi ..................................... Missouri ......................................... Montana ......................................... Nebraska ....................................... Nevada .......................................... New Hampshire ............................. New Jersey .................................... New Mexico ................................... New York ....................................... North Carolina ............................... North Dakota ................................. Ohio ............................................... Oklahoma ...................................... Oregon ........................................... Pennsylvania ................................. Rhode Island ................................. South Carolina ............................... South Dakota ................................. Tennessee ..................................... Texas ............................................. Utah ............................................... Vermont ......................................... Virginia ........................................... Washington .................................... West Virginia ................................. Wisconsin ...................................... Wyoming ........................................ Water Resources Regions Region 01 New England ................ Region 02 Mid-Atlantic ................... Region 03 South Atlantic-Gulf ....... Region 04 Great Lakes .................. Region 05 Ohio .............................. Region 06 Tennessee .................... Region 07 Upper Mississippi ......... Region 08 Lower Mississippi ......... Region 09 Souris-Red-Rainy ......... Region 10 Missouri ........................ Region 11 Arkansas-White-Red .... Region 12 Texas-Gulf .................... Region 13 Rio Grande ................... Region 14 Upper Colorado ............ Region 15 Lower Colorado ............ Region 16 Great Basin .................. Region 17 Pacific Northwest .......... Region 18 California ...................... Region 19 Alaska .......................... Region 20 Hawaii ..........................
238
1 - 7 5
23
6 - 4
51 -
15 1 - - -
- - 2 - 6
6 - - 4 -
- - - 5 5
6 2 6 - -
8 16
6 - 7
- 5 7 8 -
6 11
- 6 3
11 23 74
- -
6 6 2 - 3
13
- 13
6 9
8
28 21
- 15
15,420
(D) -
14 125
1,827
18 -
32 9,852
-
9 (D)
- - -
- -
(D) - 1
14
- -
1,160 -
- - - 1
150
9 (D)
168 - -
16 42
3 -
(D)
- 380
21 30
-
1 (D)
- 3
(D)
15 786
11,805 - -
455 3
(D) -
25
141 -
30 (D) 54
30
213 1,787
- 9
4,789,688
(D) -
302 16,293
(D)
5,171 -
8,064 3,261,498
-
1,204 (D)
- - -
- -
(D) -
141
(D) - -
(D) -
- - -
(D) (D)
3,910
(D) 52,099
- -
(D) (D) (D)
- (D)
-
5,760 6,032 1,552
-
30 536
- 390 (D)
(D) 101,775
3,991,391 - -
7,760 (D) (D)
- (D)
20,889
- 9,943
(D) 30,932
1,552
(D) (D)
- 1,204
135
- - 7 - 7
6 - 4
39 -
7 1 - - -
- - - - 6
6 - - 4 -
- - - 5 -
6 - 5 - -
8 6 - - 1
- - - - -
6 5 - 6 -
11 10 55
- -
- 6 - - -
8 - 6 6 7
-
12 7 - 7
(D)
- -
241 -
(D)
5,171 -
8,064 (D)
-
980 (D)
- - -
- - - -
141
(D)- -
(D)-
- - -
(D)-
978 -
(D)- -
(D)(D)
- -
(D)
- - - - -
30 9 -
390 -
(D)8,205
(D)- -
- (D)
- - -
(D)-
978 (D)
241
- (D)(D)
- 980
77
- - - 5 8
- - -
15 -
- - - - -
- - 2 - -
- - - - -
- - - - 5
6 2 1 - -
- - - - 6
- 5 7 4 -
- 11
- - -
- 7
22 - -
5 - 2 - -
5 -
13 - -
4 11
8 - -
(D)
- - -
16,293 (D)
- - -
(D) -
- - - - -
- -
(D) - -
- - - - -
- - - -
(D)
2,933 (D) (D)
- -
- - - -
(D)
- 5,760 6,032 1,303
-
- 527
- - -
- 93,120
(D) - -
(D) -
(D) - -
(D) -
8,965 - -
1,303 527 (D)
- -
55
1 - 7 -
10
- - - 6 -
8 - - - -
- - - - -
- - - - -
- - - - -
- - - - -
- 10
6 - -
- - - 4 -
- - - - 3
- 6 6 - -
1 - - - 3
- - - - 9
4
10 8 - 8
(D)
(D)-
60 -
309,233
---
309,300 -
224 ----
-----
-----
-----
-----
-(D)(D)
--
---
249 -
----
(D)
-450 (D)
--
(D)---
(D)
----
30,690
249 (D)
278,603 -
224
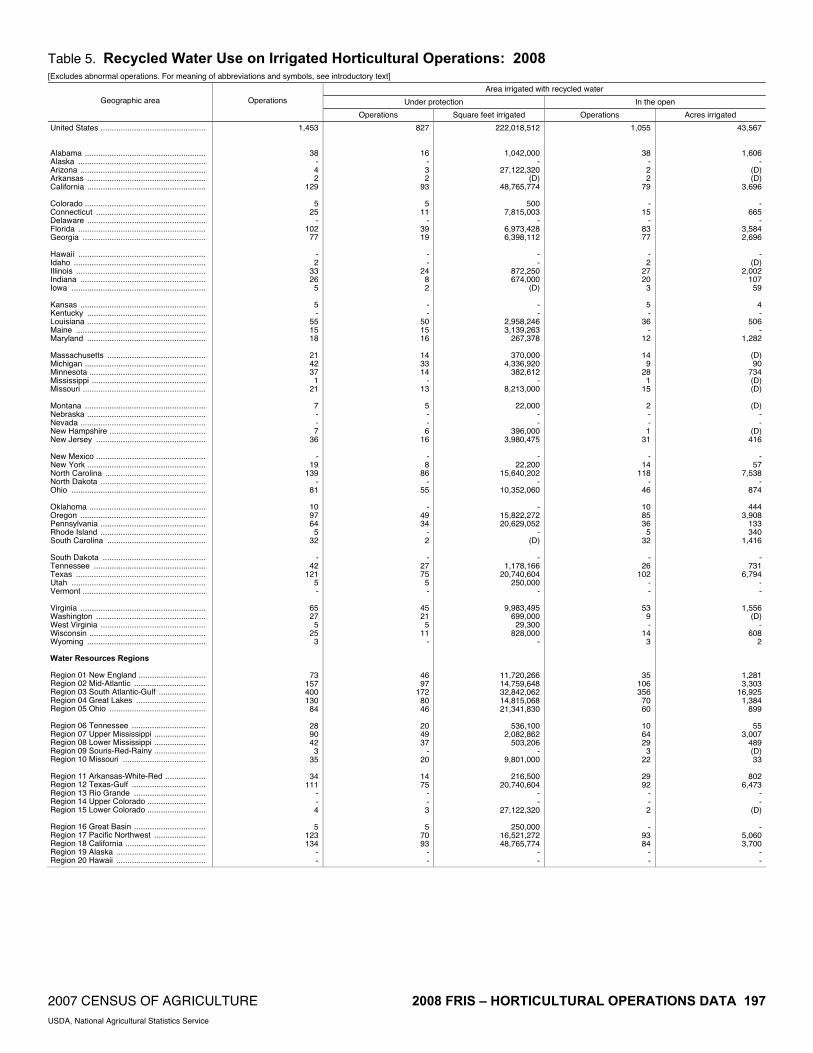
2007 CENSUS OF AGRICULTURE 2008 FRIS – HORTICULTURAL OPERATIONS DATA 197 USDA, National Agricultural Statistics Service
Table 5. Recycled Water Use on Irrigated Horticultural Operations: 2008 [Excludes abnormal operations. For meaning of abbreviations and symbols, see introductory text]
Area irrigated with recycled water
Under protection In the open Geographic area Operations
Operations Square feet irrigated Operations Acres irrigated
United States ............................................... Alabama ...................................................... Alaska ......................................................... Arizona ........................................................ Arkansas ..................................................... California ..................................................... Colorado ...................................................... Connecticut ................................................. Delaware ..................................................... Florida ......................................................... Georgia ....................................................... Hawaii ......................................................... Idaho ........................................................... Illinois .......................................................... Indiana ........................................................ Iowa ............................................................ Kansas ........................................................ Kentucky ..................................................... Louisiana ..................................................... Maine .......................................................... Maryland ..................................................... Massachusetts ............................................ Michigan ...................................................... Minnesota .................................................... Mississippi ................................................... Missouri ....................................................... Montana ...................................................... Nebraska ..................................................... Nevada ........................................................ New Hampshire ........................................... New Jersey ................................................. New Mexico ................................................. New York ..................................................... North Carolina ............................................. North Dakota ............................................... Ohio ............................................................ Oklahoma .................................................... Oregon ........................................................ Pennsylvania ............................................... Rhode Island ............................................... South Carolina ............................................ South Dakota .............................................. Tennessee .................................................. Texas .......................................................... Utah ............................................................ Vermont ....................................................... Virginia ........................................................ Washington ................................................. West Virginia ............................................... Wisconsin .................................................... Wyoming ..................................................... Water Resources Regions Region 01 New England .............................. Region 02 Mid-Atlantic ................................ Region 03 South Atlantic-Gulf ..................... Region 04 Great Lakes ............................... Region 05 Ohio ........................................... Region 06 Tennessee ................................. Region 07 Upper Mississippi ....................... Region 08 Lower Mississippi ....................... Region 09 Souris-Red-Rainy ....................... Region 10 Missouri ..................................... Region 11 Arkansas-White-Red .................. Region 12 Texas-Gulf ................................. Region 13 Rio Grande ................................ Region 14 Upper Colorado .......................... Region 15 Lower Colorado .......................... Region 16 Great Basin ................................ Region 17 Pacific Northwest ....................... Region 18 California .................................... Region 19 Alaska ........................................ Region 20 Hawaii ........................................
1,453
38 - 4 2
129
5 25
- 102
77
- 2
33 26
5
5 -
55 15 18
21 42 37
1 21
7 - - 7
36
- 19
139 -
81
10 97 64
5 32
-
42 121
5 -
65 27
5 25
3
73 157 400 130
84
28 90 42
3 35
34
111 - - 4
5
123 134
- -
827
16 - 3 2
93
5 11
- 39 19
- -
24 8 2
- -
50 15 16
14 33 14
- 13
5 - - 6
16
- 8
86 -
55
- 49 34
- 2
-
27 75
5 -
45 21
5 11
-
46 97
172 80 46
20 49 37
- 20
14 75
- - 3
5
70 93
- -
222,018,512
1,042,000 -
27,122,320 (D)
48,765,774
500 7,815,003
- 6,973,428 6,398,112
- -
872,250 674,000
(D)
- -
2,958,246 3,139,263
267,378
370,000 4,336,920
382,612 -
8,213,000
22,000 - -
396,000 3,980,475
-
22,200 15,640,202
- 10,352,060
-
15,822,272 20,629,052
- (D)
-
1,178,166 20,740,604
250,000 -
9,983,495 699,000 29,300
828,000 -
11,720,266 14,759,648 32,842,062 14,815,068 21,341,830
536,100
2,082,862 503,206
- 9,801,000
216,500
20,740,604 - -
27,122,320
250,000 16,521,272 48,765,774
- -
1,055
38 - 2 2
79
- 15
- 83 77
- 2
27 20
3
5 -
36 -
12
14 9
28 1
15
2 - - 1
31
- 14
118 -
46
10 85 36
5 32
-
26 102
- -
53 9 -
14 3
35 106 356
70 60
10 64 29
3 22
29 92
- - 2
-
93 84
- -
43,567
1,606 -
(D)(D)
3,696
- 665
- 3,584 2,696
-
(D)2,002
107 59
4 -
506 -
1,282
(D)90
734 (D)(D)
(D)
- -
(D)416
-
57 7,538
- 874
444
3,908 133 340
1,416
- 731
6,794 - -
1,556 (D)
- 608
2
1,281 3,303
16,925 1,384
899
55 3,007
489 (D)33
802
6,473 - -
(D)
- 5,060 3,700
- -
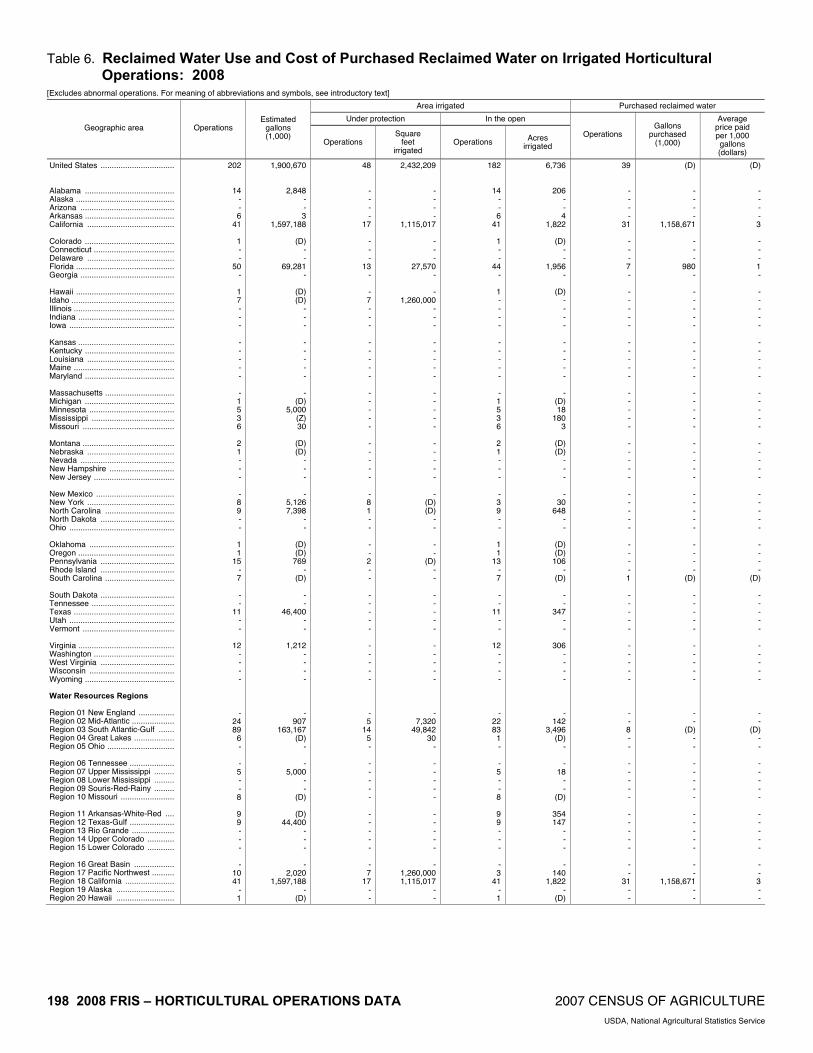
198 2008 FRIS – HORTICULTURAL OPERATIONS DATA 2007 CENSUS OF AGRICULTURE USDA, National Agricultural Statistics Service
Table 6. Reclaimed Water Use and Cost of Purchased Reclaimed Water on Irrigated Horticultural Operations: 2008
[Excludes abnormal operations. For meaning of abbreviations and symbols, see introductory text]
Area irrigated Purchased reclaimed water
Under protection In the open Geographic area Operations
Estimated gallons (1,000)
Operations Square
feet irrigated
Operations Acres irrigated
Operations Gallons
purchased (1,000)
Average price paid per 1,000 gallons (dollars)
United States ................................. Alabama ........................................ Alaska ............................................ Arizona .......................................... Arkansas ........................................ California ....................................... Colorado ........................................ Connecticut .................................... Delaware ....................................... Florida ............................................ Georgia .......................................... Hawaii ............................................ Idaho .............................................. Illinois ............................................. Indiana ........................................... Iowa ............................................... Kansas ........................................... Kentucky ........................................ Louisiana ....................................... Maine ............................................. Maryland ........................................ Massachusetts ............................... Michigan ........................................ Minnesota ...................................... Mississippi ..................................... Missouri ......................................... Montana ......................................... Nebraska ....................................... Nevada .......................................... New Hampshire ............................. New Jersey .................................... New Mexico ................................... New York ....................................... North Carolina ............................... North Dakota ................................. Ohio ............................................... Oklahoma ...................................... Oregon ........................................... Pennsylvania ................................. Rhode Island ................................. South Carolina ............................... South Dakota ................................. Tennessee ..................................... Texas ............................................. Utah ............................................... Vermont ......................................... Virginia ........................................... Washington .................................... West Virginia ................................. Wisconsin ...................................... Wyoming ........................................ Water Resources Regions Region 01 New England ................ Region 02 Mid-Atlantic ................... Region 03 South Atlantic-Gulf ....... Region 04 Great Lakes .................. Region 05 Ohio .............................. Region 06 Tennessee .................... Region 07 Upper Mississippi ......... Region 08 Lower Mississippi ......... Region 09 Souris-Red-Rainy ......... Region 10 Missouri ........................ Region 11 Arkansas-White-Red .... Region 12 Texas-Gulf .................... Region 13 Rio Grande ................... Region 14 Upper Colorado ............ Region 15 Lower Colorado ............ Region 16 Great Basin .................. Region 17 Pacific Northwest .......... Region 18 California ...................... Region 19 Alaska .......................... Region 20 Hawaii ..........................
202
14 - - 6
41
1 - -
50 -
1 7 - - -
- - - - -
- 1 5 3 6
2 1 - - -
- 8 9 - -
1 1
15 - 7
- -
11 - -
12 - - - -
- 24 89
6 -
- 5 - - 8
9 9 - - -
- 10 41
- 1
1,900,670
2,848 - - 3
1,597,188
(D) - -
69,281 -
(D) (D)
- - -
- - - - -
- (D)
5,000 (Z) 30
(D) (D)
- - -
- 5,126 7,398
- -
(D) (D)
769 -
(D)
- -
46,400 - -
1,212 - - - -
- 907
163,167 (D)
-
- 5,000
- -
(D)
(D) 44,400
- - -
- 2,020
1,597,188 -
(D)
48
- - - -
17
- - -
13 -
- 7 - - -
- - - - -
- - - - -
- - - - -
- 8 1 - -
- - 2 - -
- - - - -
- - - - -
- 5
14 5 -
- - - - -
- - - - -
- 7
17 - -
2,432,209
- - - -
1,115,017
- - -
27,570 -
- 1,260,000
- - -
- - - - -
- - - - -
- - - - -
- (D) (D)
- -
- -
(D) - -
- - - - -
- - - - -
- 7,320
49,842 30
-
- - - - -
- - - - -
- 1,260,000 1,115,017
- -
182
14 - - 6
41
1 - -
44 -
1 - - - -
- - - - -
- 1 5 3 6
2 1 - - -
- 3 9 - -
1 1
13 - 7
- -
11 - -
12 - - - -
- 22 83
1 -
- 5 - - 8
9 9 - - -
- 3
41 - 1
6,736
206 - - 4
1,822
(D)- -
1,956 -
(D)- - - -
- - - - -
- (D)18
180 3
(D)(D)
- - -
- 30
648 - -
(D)(D)
106 -
(D)
- -
347 - -
306 - - - -
- 142
3,496 (D)
-
- 18
- -
(D)
354 147
- - -
- 140
1,822 -
(D)
39
- - - -
31
- - - 7 -
- - - - -
- - - - -
- - - - -
- - - - -
- - - - -
- - - - 1
- - - - -
- - - - -
- - 8 - -
- - - - -
- - - - -
- -
31 - -
(D)
- - - -
1,158,671
- - -
980 -
- - - - -
- - - - -
- - - - -
- - - - -
- - - - -
- - - -
(D)
- - - - -
- - - - -
- -
(D)- -
- - - - -
- - - - -
- -
1,158,671 - -
(D)
- - - - 3
- - - 1 -
- - - - -
- - - - -
- - - - -
- - - - -
- - - - -
- - - -
(D)
- - - - -
- - - - -
- -
(D)- -
- - - - -
- - - - -
- - 3 - -

2007 CENSUS OF AGRICULTURE 2008 FRIS – HORTICULTURAL OPERATIONS DATA 199 USDA, National Agricultural Statistics Service
Table 7. Other Uses of Irrigation Water on Horticultural Operations: 2008 [Excludes abnormal operations. For meaning of abbreviations and symbols, see introductory text]
Operations reporting 1
Geographic area Prevent freeze damage
Crop cooling to delay early budding or blooming, or to
reduce heat stress
Leaching to remove salts from soil Other purpose
United States ................................................ Alabama ....................................................... Alaska .......................................................... Arizona ......................................................... Arkansas ...................................................... California ...................................................... Colorado ....................................................... Connecticut .................................................. Delaware ...................................................... Florida .......................................................... Georgia ........................................................ Hawaii .......................................................... Idaho ............................................................ Illinois ........................................................... Indiana ......................................................... Iowa ............................................................. Kansas ......................................................... Kentucky ...................................................... Louisiana ...................................................... Maine ........................................................... Maryland ...................................................... Massachusetts ............................................. Michigan ....................................................... Minnesota ..................................................... Mississippi .................................................... Missouri ........................................................ Montana ....................................................... Nebraska ...................................................... Nevada ......................................................... New Hampshire ............................................ New Jersey .................................................. New Mexico .................................................. New York ...................................................... North Carolina .............................................. North Dakota ................................................ Ohio ............................................................. Oklahoma ..................................................... Oregon ......................................................... Pennsylvania ................................................ Rhode Island ................................................ South Carolina ............................................. South Dakota ............................................... Tennessee ................................................... Texas ........................................................... Utah ............................................................. Vermont ........................................................ Virginia ......................................................... Washington .................................................. West Virginia ................................................ Wisconsin ..................................................... Wyoming ...................................................... Water Resources Regions Region 01 New England ............................... Region 02 Mid-Atlantic ................................. Region 03 South Atlantic-Gulf ...................... Region 04 Great Lakes ................................ Region 05 Ohio ............................................ Region 06 Tennessee .................................. Region 07 Upper Mississippi ........................ Region 08 Lower Mississippi ........................ Region 09 Souris-Red-Rainy ........................ Region 10 Missouri ...................................... Region 11 Arkansas-White-Red ................... Region 12 Texas-Gulf .................................. Region 13 Rio Grande ................................. Region 14 Upper Colorado ........................... Region 15 Lower Colorado ........................... Region 16 Great Basin ................................. Region 17 Pacific Northwest ........................ Region 18 California ..................................... Region 19 Alaska ......................................... Region 20 Hawaii .........................................
1,886
22 4 8 2
145
5 14
- 792
67
8 11 24 17
-
7 12 23
7 14
20 88
5 16 37
7 - - 1
34
- 17 82
- 9
3
71 55
- 33
4
70 66
4 -
12 32 13 25
-
42 134
1,011 109
49
53 50 10
- 23
50 60
5 - 8
4
121 145
4 8
2,057
36 8
26 6
188
17 14 11
253 90
59 38 43 63
6
11 23 53 20 26
17 75 34 26 34
6
16 -
17 39
-
41 80
- 60
29
165 68
2 26
6
78 86 11 12
41 40
5 44
8
70 192 504 133 166
59
118 52
5 59
92 68
- 4
26
11 236 195
8 59
592
6 8 8 -
113
10 7 -
63 8
8 7
14 20
4
7 16 18
- 6
6
28 21
- 6
5 6 - 5 7
- 8
28 - 3
2
20 25
- -
4 12 25
6 -
7 18
5 19
3
18 41
110 31 36
12 66 18
- 32
10 25
5 - 8
6
45 113
8 8
764
15 4 5 2
45
- 14
- 93 34
14 15 28
6 5
16 37
6 8 -
- 23
- 1
15
33 - -
11 15
-
26 56
3 27
2
32 70
1 7
1
25 22
5 -
17 11
- 14
-
34 89
211 64 74
20 47
8 -
45
14 16
- - 5
12 62 45
4 14
1 Respondents could report more than one other use of irrigation water.
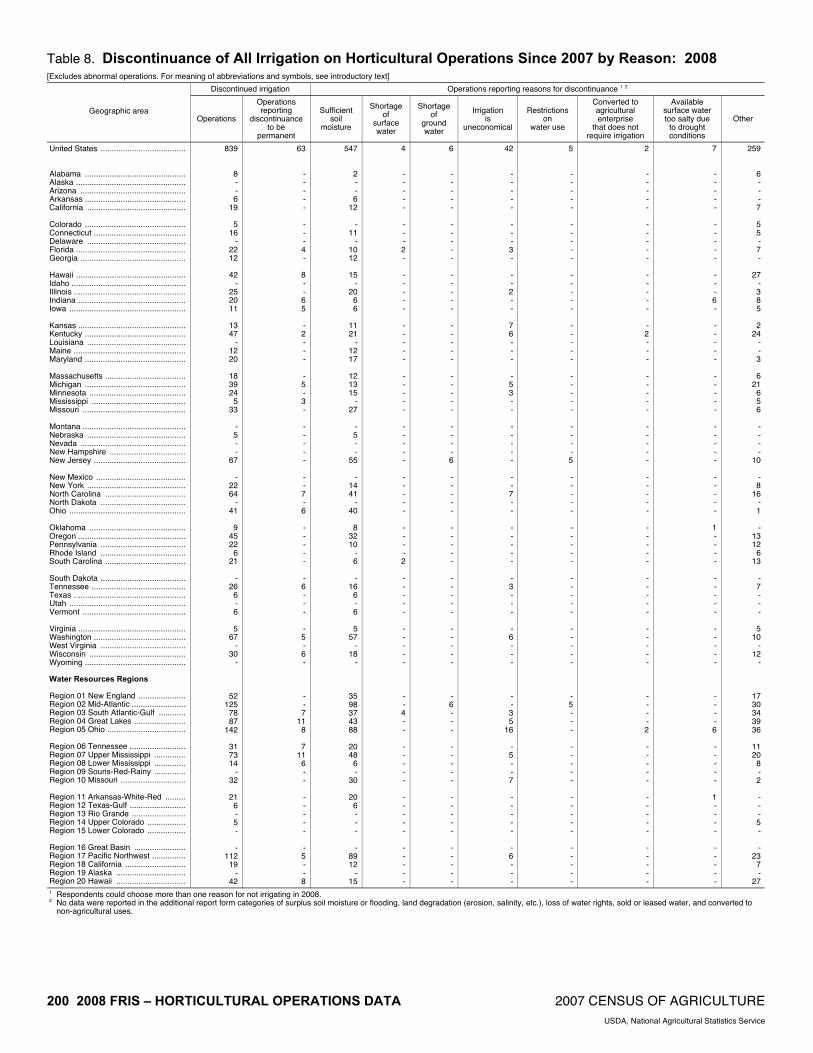
200 2008 FRIS – HORTICULTURAL OPERATIONS DATA 2007 CENSUS OF AGRICULTURE USDA, National Agricultural Statistics Service
Table 8. Discontinuance of All Irrigation on Horticultural Operations Since 2007 by Reason: 2008 [Excludes abnormal operations. For meaning of abbreviations and symbols, see introductory text]
Discontinued irrigation Operations reporting reasons for discontinuance 1 2
Geographic area Operations
Operations reporting
discontinuance to be
permanent
Sufficient soil
moisture
Shortage of
surface water
Shortage of
ground water
Irrigation is
uneconomical
Restrictions on
water use
Converted to agricultural enterprise
that does not require irrigation
Available surface water too salty due
to drought conditions
Other
United States ...................................... Alabama ............................................. Alaska ................................................. Arizona ............................................... Arkansas ............................................. California ............................................ Colorado ............................................. Connecticut ......................................... Delaware ............................................ Florida ................................................. Georgia ............................................... Hawaii ................................................. Idaho ................................................... Illinois .................................................. Indiana ................................................ Iowa .................................................... Kansas ................................................ Kentucky ............................................. Louisiana ............................................ Maine .................................................. Maryland ............................................. Massachusetts .................................... Michigan ............................................. Minnesota ........................................... Mississippi .......................................... Missouri .............................................. Montana .............................................. Nebraska ............................................ Nevada ............................................... New Hampshire .................................. New Jersey ......................................... New Mexico ........................................ New York ............................................ North Carolina .................................... North Dakota ...................................... Ohio .................................................... Oklahoma ........................................... Oregon ................................................ Pennsylvania ...................................... Rhode Island ...................................... South Carolina .................................... South Dakota ...................................... Tennessee .......................................... Texas .................................................. Utah .................................................... Vermont .............................................. Virginia ................................................ Washington ......................................... West Virginia ...................................... Wisconsin ........................................... Wyoming ............................................. Water Resources Regions Region 01 New England ..................... Region 02 Mid-Atlantic ........................ Region 03 South Atlantic-Gulf ............ Region 04 Great Lakes ....................... Region 05 Ohio ................................... Region 06 Tennessee ......................... Region 07 Upper Mississippi .............. Region 08 Lower Mississippi .............. Region 09 Souris-Red-Rainy .............. Region 10 Missouri ............................. Region 11 Arkansas-White-Red ......... Region 12 Texas-Gulf ......................... Region 13 Rio Grande ........................ Region 14 Upper Colorado ................. Region 15 Lower Colorado ................. Region 16 Great Basin ....................... Region 17 Pacific Northwest ............... Region 18 California ........................... Region 19 Alaska ............................... Region 20 Hawaii ...............................
839
8 - - 6
19
5 16
- 22 12
42
- 25 20 11
13 47
- 12 20
18 39 24
5 33
- 5 - -
67
- 22 64
- 41
9
45 22
6 21
-
26 6 - 6
5
67 -
30 -
52 125
78 87
142
31 73 14
- 32
21
6 - 5 -
- 112
19 -
42
63
- - - - -
- - - 4 -
8 - - 6 5
- 2 - - -
- 5 - 3 -
- - - - -
- - 7 - 6
- - - - -
- 6 - - -
- 5 - 6 -
- - 7
11 8
7
11 6 - -
- - - - -
- 5 - - 8
547
2 - - 6
12
- 11
- 10 12
15
- 20
6 6
11 21
- 12 17
12 13 15
- 27
- 5 - -
55
- 14 41
- 40
8
32 10
- 6
-
16 6 - 6
5
57 -
18 -
35 98 37 43 88
20 48
6 -
30
20 6 - - -
- 89 12
- 15
4
- - - - -
- - - 2 -
- - - - -
- - - - -
- - - - -
- - - - -
- - - - -
- - - - 2
- - - - -
- - - - -
- - 4 - -
- - - - -
- - - - -
- - - - -
6
- - - - -
- - - - -
- - - - -
- - - - -
- - - - -
- - - - 6
- - - - -
- - - - -
- - - - -
- - - - -
- 6 - - -
- - - - -
- - - - -
- - - - -
42
- - - - -
- - - 3 -
- - 2 - -
7 6 - - -
- 5 3 - -
- - - - -
- - 7 - -
- - - - -
- 3 - - -
- 6 - - -
- - 3 5
16
- 5 - - 7
- - - - -
- 6 - - -
5
- - - - -
- - - - -
- - - - -
- - - - -
- - - - -
- - - - 5
- - - - -
- - - - -
- - - - -
- - - - -
- 5 - - -
- - - - -
- - - - -
- - - - -
2
- - - - -
- - - - -
- - - - -
- 2 - - -
- - - - -
- - - - -
- - - - -
- - - - -
- - - - -
- - - - -
- - - - 2
- - - - -
- - - - -
- - - - -
7
- - - - -
- - - - -
- - - 6 -
- - - - -
- - - - -
- - - - -
- - - - -
1 - - - -
- - - - -
- - - - -
- - - - 6
- - - - -
1 - - - -
- - - - -
259
6 - - - 7
5 5 - 7 -
27 - 3 8 5
2
24 - - 3
6
21 6 5 6
- - - -
10
- 8
16 - 1
-
13 12
6 13
- 7 - - -
5 10
- 12
-
17 30 34 39 36
11 20
8 - 2
- - - 5 -
- 23
7 -
27
1 Respondents could choose more than one reason for not irrigating in 2008. 2 No data were reported in the additional report form categories of surplus soil moisture or flooding, land degradation (erosion, salinity, etc.), loss of water rights, sold or leased water, and converted to
non-agricultural uses.

2007 CENSUS OF AGRICULTURE 2008 FRIS – HORTICULTURAL OPERATIONS DATA 201 USDA, National Agricultural Statistics Service
Table 9. Irrigated Horticultural Operations by Market Value of All Agricultural Products Sold: 2008 [Totals may not add due to rounding. Excludes abnormal operations. For meaning of abbreviations and symbols, see introductory text]
All operations with irrigated horticulture
Under protection In the open Geographic area
Operations Square feet Square feet irrigated Operations Acres Acres irrigated
United States ....................................... Alabama .............................................. Alaska ................................................. Arizona ................................................ Arkansas ............................................. California ............................................. Colorado .............................................. Connecticut ......................................... Delaware ............................................. Florida ................................................. Georgia ............................................... Hawaii ................................................. Idaho ................................................... Illinois .................................................. Indiana ................................................ Iowa .................................................... Kansas ................................................ Kentucky ............................................. Louisiana ............................................. Maine .................................................. Maryland ............................................. Massachusetts .................................... Michigan .............................................. Minnesota ............................................ Mississippi ........................................... Missouri ............................................... Montana .............................................. Nebraska ............................................. Nevada ................................................ New Hampshire ................................... New Jersey ......................................... New Mexico ......................................... New York ............................................. North Carolina ..................................... North Dakota ....................................... Ohio .................................................... Oklahoma ............................................ Oregon ................................................ Pennsylvania ....................................... Rhode Island ....................................... South Carolina .................................... South Dakota ...................................... Tennessee .......................................... Texas .................................................. Utah .................................................... Vermont ............................................... Virginia ................................................ Washington ......................................... West Virginia ....................................... Wisconsin ............................................ Wyoming ............................................. Water Resources Regions Region 01 New England ...................... Region 02 Mid-Atlantic ........................ Region 03 South Atlantic-Gulf ............. Region 04 Great Lakes ....................... Region 05 Ohio ................................... Region 06 Tennessee ......................... Region 07 Upper Mississippi ............... Region 08 Lower Mississippi ............... Region 09 Souris-Red-Rainy ............... Region 10 Missouri ............................. Region 11 Arkansas-White-Red .......... Region 12 Texas-Gulf ......................... Region 13 Rio Grande ........................ Region 14 Upper Colorado .................. Region 15 Lower Colorado .................. Region 16 Great Basin ........................ Region 17 Pacific Northwest ............... Region 18 California ............................ Region 19 Alaska ................................ Region 20 Hawaii ................................
20,610
248 69
111 110
1,636
176 318
88 1,377
305
562 140 482 393 215
189 564 236 354 307
448
1,043 350 146 370
203 137
17 241 613
92
951 828
27 807
184
1,099 1,353
133 170
52
576 720
93 239
386 506 138 778
30
1,569 3,102 2,945 2,108 1,924
601
1,551 348
40 777
513 676
72 43
129
99 1,829 1,653
69 562
1,423,578,687
19,804,213 493,524
41,873,904 4,384,340
239,155,164
7,137,602 21,783,684 1,609,512
342,186,011 24,155,246
29,271,934 2,302,790
44,950,503 7,145,044
15,538,896
7,526,148 13,405,128 9,955,738 7,171,628
10,954,369
9,849,814 64,442,619 20,495,877 6,159,100
14,267,264
1,494,034 1,830,496
50,325 4,088,644
44,994,489
9,613,518 21,584,724 34,350,958
742,626 37,135,295
2,863,686
46,247,355 74,926,310 1,358,596 7,066,826
489,936
9,753,743 99,314,549 8,627,968 3,269,212
15,709,916 18,628,574 1,918,400
10,873,679 624,776
44,764,456 138,504,942 428,947,796 105,073,601
57,432,358
16,294,364 82,317,955 8,604,138
735,226 30,456,928
12,749,404 98,600,961
801,718 2,264,250
51,097,904
8,204,293 67,700,491
239,262,444 493,524
29,271,934
1,369,090,815
19,793,413 493,524
41,872,084 4,384,340
221,413,474
6,920,954 17,408,464 1,600,512
338,298,971 22,951,834
28,749,930 2,288,790
44,801,203 7,015,798
15,482,226
7,180,898 13,318,362 9,920,738 6,833,315
10,791,959
9,508,662 62,986,691 19,742,327 6,062,850
14,167,884
1,391,172 1,796,561
46,725 4,013,644
44,443,422
7,769,978 21,380,080 33,926,877
742,626 36,921,081
2,863,686
45,513,689 64,534,712 1,315,996 6,713,170
478,832
9,603,037 94,533,909 8,375,468 3,228,820
14,769,134 17,603,094 1,918,400
10,605,423 612,076
39,551,779 126,858,705 423,432,868 103,282,299
56,636,700
15,810,663 81,222,769 8,410,152
735,226 30,080,101
12,291,954 93,820,321
733,858 2,238,570
49,342,484
7,951,793 65,926,365
221,520,754 493,524
28,749,930
18,797
303 29
142 128
1,897
265 234
55 2,211
507
494 236 413 289 155
154 340 290 214 272
314 659 282 177 284
199 166
28 170 560
73
575 782
3 463
154
1,182 817
98 273
43
391 727 111 139
359 511
78 521
30
1,087 2,307 4,187 1,311 1,207
345
1,165 330
20 749
488 687
76 107 171
117
2,026 1,894
29 494
791,987
25,209 31
8,004 8,487
57,732
13,646 6,884 1,896
84,332 39,145
2,124
11,041 31,979
9,228 5,440
4,482 6,708 7,383 2,506
11,356
2,140 36,755 14,130
5,509 11,842
1,784 5,098
829 972
30,506
2,948 15,142 30,369
61 18,798
23,753 59,225 17,301
3,177 21,228
1,316
25,198 51,103
5,051 617
13,388 20,398
1,619 33,308
813
15,767 75,467
205,830 56,842 46,124
12,410 81,659 10,467
487 26,299
42,874 47,703
3,117 1,673 8,903
5,638
90,847 57,725
31 2,124
579,633
20,170 31
7,451 7,412
52,886
11,841 2,356 1,856
72,609 36,568
1,793
10,719 17,274
7,268 3,178
3,074 1,909 5,401 1,327 8,764
1,444
16,882 7,165 4,172 7,269
1,769 3,926
829 714
21,409
2,679 8,765
20,932 61
7,238
19,836 52,679
4,115 2,383
18,418
966 12,046 45,134
4,601 186
8,285
19,172 339
11,543 793
8,284 49,633
173,361 23,113 18,012
6,791
39,991 7,394
112 20,172
35,188 42,144
2,851 1,593 8,350
5,189
82,753 52,878
31 1,793
--continued

202 2008 FRIS – HORTICULTURAL OPERATIONS DATA 2007 CENSUS OF AGRICULTURE USDA, National Agricultural Statistics Service
Table 9. Irrigated Horticultural Operations by Market Value of All Agricultural Products Sold: 2008 - Con.
[Totals may not add due to rounding. Excludes abnormal operations. For meaning of abbreviations and symbols, see introductory text]
$0 - $9,999
Under protection In the open Geographic area
Operations Square feet Square feet irrigated Operations Acres Acres irrigated
United States ....................................... Alabama .............................................. Alaska .................................................. Arizona ................................................ Arkansas .............................................. California ............................................. Colorado .............................................. Connecticut .......................................... Delaware ............................................. Florida .................................................. Georgia ................................................ Hawaii .................................................. Idaho .................................................... Illinois ................................................... Indiana ................................................. Iowa ..................................................... Kansas ................................................. Kentucky .............................................. Louisiana ............................................. Maine ................................................... Maryland .............................................. Massachusetts ..................................... Michigan .............................................. Minnesota ............................................ Mississippi ........................................... Missouri ............................................... Montana ............................................... Nebraska ............................................. Nevada ................................................ New Hampshire ................................... New Jersey .......................................... New Mexico ......................................... New York ............................................. North Carolina ..................................... North Dakota ....................................... Ohio ..................................................... Oklahoma ............................................ Oregon ................................................. Pennsylvania ....................................... Rhode Island ....................................... South Carolina ..................................... South Dakota ....................................... Tennessee ........................................... Texas ................................................... Utah ..................................................... Vermont ............................................... Virginia ................................................. Washington .......................................... West Virginia ....................................... Wisconsin ............................................ Wyoming .............................................. Water Resources Regions Region 01 New England ...................... Region 02 Mid-Atlantic ......................... Region 03 South Atlantic-Gulf ............. Region 04 Great Lakes ........................ Region 05 Ohio .................................... Region 06 Tennessee .......................... Region 07 Upper Mississippi ............... Region 08 Lower Mississippi ............... Region 09 Souris-Red-Rainy ............... Region 10 Missouri .............................. Region 11 Arkansas-White-Red .......... Region 12 Texas-Gulf .......................... Region 13 Rio Grande ......................... Region 14 Upper Colorado .................. Region 15 Lower Colorado .................. Region 16 Great Basin ........................ Region 17 Pacific Northwest ................ Region 18 California ............................ Region 19 Alaska ................................ Region 20 Hawaii ................................
2,398
18 5 8
12 152
10 11
- 137
68
99 48 12 24
5
19 137
26 60 33
37
113 31 19 30
71 10
- 20 24
-
79 171
- 93
24
215 121
6 18
4
99 76
4 31
34
105 10 69
-
153 211 410 196 302
99
116 37
- 75
61 64
- - 8
4
400 158
5 99
5,242,090
14,940 5,808 1,024
33,648 234,072
16,500 81,000
- 216,850 297,482
298,628 35,920 24,600 17,712 11,280
51,800
270,342 24,052 62,298 32,974
89,472
386,314 26,240 40,800 33,396
61,201
102,400 -
21,220 30,366
-
119,484 756,298
- 188,696
5,440
549,992 184,554
7,200 23,400
1,176
203,379 128,639 40,000 63,884
32,896
306,632 47,500 60,581
-
324,198 331,780
1,217,154 532,358 474,857
285,610 126,761 68,452
- 191,989
94,188 95,939
- -
1,024
40,000 915,912 237,432
5,808 298,628
4,693,599
14,940 5,808 1,024
33,648 211,438
16,500 81,000
- 212,700 297,482
298,628 35,920 15,000 17,712 11,280
51,800
256,092 24,052 58,578 32,974
86,352
370,714 26,240 40,800 22,596
60,919
102,400 -
21,220 30,366
-
110,884 332,217
- 188,696
5,440
543,872 184,554
7,200 23,400
1,176
198,629 128,639 40,000 56,492
31,840
294,296 47,500 60,581
-
309,966 327,124 903,604 511,758 455,857
170,929 117,161 57,652
- 191,707
94,188 95,939
- -
1,024
40,000 897,456 214,798
5,808 298,628
2,851
6 4 -
24 302
17 24
9 320
99
166 111
26 18 15
6
74 21 29 11
37 92 40 48 12
94 37
6 25 63
12 27
130 -
61
16 251 110
- 45
4
38 99 33 25
51
128 10 75
-
128 230 632 161 186
28
114 38
5 102
53 87 19 27
6
25 532 308
4 166
6,000
1 4 -
22 1,002
73 11
9 663 108
213 298
17 11
7
1 96
581 78
6
114 152
26 65
1
99 45
4 19
346
24 18
177 -
103
32 481 160
- 46
1
54 149 122
16
64 336
9 140
-
236 577
1,019 276 181
29
126 627
5 (D)
73
124 (D)
140 4
61
1,161 1,003
4 213
4,824
1 4 -
19 993
73 11
9 652
96
192 298
17 11
7
1 (D)42 78
4
114 101
21 44
1
(D)38
4 19
195
7 18
135 -
73
32 324 108
- 44
1
54 149 122
16
64 332
9 140
-
236 374 952 193 155
29
121 (D)
5 75
73
124 (D)
140 4
61
1,001 994
4 192
--continued

2007 CENSUS OF AGRICULTURE 2008 FRIS – HORTICULTURAL OPERATIONS DATA 203 USDA, National Agricultural Statistics Service
Table 9. Irrigated Horticultural Operations by Market Value of All Agricultural Products Sold: 2008 - Con.
[Totals may not add due to rounding. Excludes abnormal operations. For meaning of abbreviations and symbols, see introductory text]
$10,000 - $24,999
Under protection In the open Geographic area
Operations Square feet Square feet irrigated Operations Acres Acres irrigated
United States ....................................... Alabama .............................................. Alaska ................................................. Arizona ................................................ Arkansas ............................................. California ............................................. Colorado .............................................. Connecticut ......................................... Delaware ............................................. Florida ................................................. Georgia ............................................... Hawaii ................................................. Idaho ................................................... Illinois .................................................. Indiana ................................................ Iowa .................................................... Kansas ................................................ Kentucky ............................................. Louisiana ............................................. Maine .................................................. Maryland ............................................. Massachusetts .................................... Michigan .............................................. Minnesota ............................................ Mississippi ........................................... Missouri ............................................... Montana .............................................. Nebraska ............................................. Nevada ................................................ New Hampshire ................................... New Jersey ......................................... New Mexico ......................................... New York ............................................. North Carolina ..................................... North Dakota ....................................... Ohio .................................................... Oklahoma ............................................ Oregon ................................................ Pennsylvania ....................................... Rhode Island ....................................... South Carolina .................................... South Dakota ...................................... Tennessee .......................................... Texas .................................................. Utah .................................................... Vermont ............................................... Virginia ................................................ Washington ......................................... West Virginia ....................................... Wisconsin ............................................ Wyoming ............................................. Water Resources Regions Region 01 New England ...................... Region 02 Mid-Atlantic ........................ Region 03 South Atlantic-Gulf ............. Region 04 Great Lakes ....................... Region 05 Ohio ................................... Region 06 Tennessee ......................... Region 07 Upper Mississippi ............... Region 08 Lower Mississippi ............... Region 09 Souris-Red-Rainy ............... Region 10 Missouri ............................. Region 11 Arkansas-White-Red .......... Region 12 Texas-Gulf ......................... Region 13 Rio Grande ........................ Region 14 Upper Colorado .................. Region 15 Lower Colorado .................. Region 16 Great Basin ........................ Region 17 Pacific Northwest ............... Region 18 California ............................ Region 19 Alaska ................................ Region 20 Hawaii ................................
2,842
19 8 8
40 172
12 52 28
197 12
95
7 56 36 37
44 59
- 85 35
38
103 40 14 79
37 21 11 26 85
6
117 139
- 120
17
177 219
27 33
8
99 80
4 31
60
108 15
126 -
234 467 399 280 213
97
216 28
5 118
94 74
6 6 8
15
301 178
8 95
26,460,781
1,832,000 36,000
100,000 271,892 633,573
9,720
275,848 (D)
9,619,207 9,000
1,741,060
19,600 254,500 122,640
(D)
100,652 460,664
- 239,788 92,932
182,266 643,340 366,170 306,600 286,440
112,392
(D)26,325 83,344
1,089,380
(D)305,260
1,083,338 -
537,286
167,000 1,009,386 1,011,666
63,184 110,700
16,000
527,392 734,196 16,000 64,992
535,680 335,230 169,680 499,670
-
856,430 2,778,362
13,123,595 1,341,286 1,125,298
560,762 991,382 90,880 50,000
338,256
533,848 706,548
(D)(D)
100,000
42,325 1,379,256
635,493 36,000
1,741,060
25,357,055
1,826,000 36,000
100,000 271,892 623,353
6,600
206,848 (D)
9,545,523 9,000
1,643,060
19,600 254,500 122,640
(D)
100,652 460,664
- 180,292 92,932
170,266 515,340 366,170 306,600 259,812
111,412
(D) 26,325 75,844
749,180
(D) 300,560
1,083,338 -
537,286
167,000 927,356 988,638 63,184
110,700
16,000 527,392 709,596 16,000 61,992
479,060 317,178 169,680 460,762
-
705,434 2,411,634
12,993,291 1,184,778 1,125,298
554,762 961,122 90,880 50,000
312,328
530,728 681,948
(D) (D)
100,000
42,325 1,278,194
625,273 36,000
1,643,060
2,626
43 8
13 23
210
44 36 19
291 81
82 15 57 30 22
25 63 28 39 29
18
106 14 20 61
27 25 12 22 85
12 66
135 -
77
17 197 110
6 54
-
84 63 14 25
38
109 3
68 -
134 311 604 178 210
69
148 25
- 101
79 63 12 16 13
26
337 210
8 82
21,974
2,123 8
62 77
775
140 40 72
2,489 654
148 124 554
74 158
21
172 46 (D)54
(D)
1,170 11 21 66
34
554 13 20
1,971
252 161 749
- 5,527
61
998 371 120 214
-
254 510 180 139
117 359
24 110
-
390 2,509 6,017 1,441 6,028
413 809
80 -
688
115 510 252
40 62
193
1,499 775
8 148
12,445
1,941 8
62 69
673
136 40 32
2,029 627
99
124 78 31
137
21 161
46 57 29
45
502 11 21 35
34
229 13 20
1,833
252 161 422
- 130
27
766 153 (D)
214
- 152 426 180 (D)
107 202
12 51
-
187 2,155 5,304
711 332
108 287
74 -
353
72 426 252
40 62
193
1,110 673
8 99
--continued

204 2008 FRIS – HORTICULTURAL OPERATIONS DATA 2007 CENSUS OF AGRICULTURE USDA, National Agricultural Statistics Service
Table 9. Irrigated Horticultural Operations by Market Value of All Agricultural Products Sold: 2008 - Con.
[Totals may not add due to rounding. Excludes abnormal operations. For meaning of abbreviations and symbols, see introductory text]
$25,000 - $49,999
Under protection In the open Geographic area
Operations Square feet Square feet irrigated Operations Acres Acres irrigated
United States ....................................... Alabama .............................................. Alaska .................................................. Arizona ................................................ Arkansas .............................................. California ............................................. Colorado .............................................. Connecticut .......................................... Delaware ............................................. Florida .................................................. Georgia ................................................ Hawaii .................................................. Idaho .................................................... Illinois ................................................... Indiana ................................................. Iowa ..................................................... Kansas ................................................. Kentucky .............................................. Louisiana ............................................. Maine ................................................... Maryland .............................................. Massachusetts ..................................... Michigan .............................................. Minnesota ............................................ Mississippi ........................................... Missouri ............................................... Montana ............................................... Nebraska ............................................. Nevada ................................................ New Hampshire ................................... New Jersey .......................................... New Mexico ......................................... New York ............................................. North Carolina ..................................... North Dakota ....................................... Ohio ..................................................... Oklahoma ............................................ Oregon ................................................. Pennsylvania ....................................... Rhode Island ....................................... South Carolina ..................................... South Dakota ....................................... Tennessee ........................................... Texas ................................................... Utah ..................................................... Vermont ............................................... Virginia ................................................. Washington .......................................... West Virginia ....................................... Wisconsin ............................................ Wyoming .............................................. Water Resources Regions Region 01 New England ...................... Region 02 Mid-Atlantic ......................... Region 03 South Atlantic-Gulf ............. Region 04 Great Lakes ........................ Region 05 Ohio .................................... Region 06 Tennessee .......................... Region 07 Upper Mississippi ............... Region 08 Lower Mississippi ............... Region 09 Souris-Red-Rainy ............... Region 10 Missouri .............................. Region 11 Arkansas-White-Red .......... Region 12 Texas-Gulf .......................... Region 13 Rio Grande ......................... Region 14 Upper Colorado .................. Region 15 Lower Colorado .................. Region 16 Great Basin ........................ Region 17 Pacific Northwest ................ Region 18 California ............................ Region 19 Alaska ................................ Region 20 Hawaii ................................
2,691
35 20
7 6
143
15 54 10
132 54
53 14 38 72 38
19 92 39 40 52
57
112 38 19 87
22 41
- 45 72
18
149 75
- 81
42
126 201
18 13
4
89 117
5 72
58 54 30
113 -
221 483 333 257 264
101 191
39 6
151
85 117
12 4 7
5
199 143
20 53
31,644,424
199,800 54,320 31,500
9,600 3,733,644
44,600
429,300 35,000
5,828,893 2,032,068
1,741,660
53,620 250,304 549,636 258,456
97,250
794,336 323,608 128,178 222,486
327,660
1,165,182 228,200 151,000 428,140
407,600 375,920
- 134,660 846,758
113,382 798,328 734,512
- 962,615
185,545 883,790
1,864,038 113,400 72,600
7,200
1,340,512 1,408,940
30,000 411,534
687,576 216,240 284,500 646,333
-
1,134,598 3,807,602 9,135,969 2,294,548 2,278,461
1,662,820 1,084,367
323,608 9,600
1,144,960
405,795 1,408,940
104,382 4,000
31,500
30,000 1,253,650 3,733,644
54,320 1,741,660
30,878,885
199,800 54,320 29,680
9,600 3,590,795
44,600
426,800 35,000
5,828,893 1,996,068
1,741,660
53,620 243,104 527,430 255,456
92,000
778,316 323,608 118,578 222,486
316,628
1,160,682 215,900 151,000 391,300
407,000 372,570
- 132,410 834,566
113,382 773,584 734,512
- 951,863
185,545 837,890
1,565,818 96,000 72,600
7,200
1,338,212 1,402,940
30,000 411,534
687,576 216,240 284,500 615,619
-
1,091,816 3,478,390 9,099,969 2,246,350 2,258,801
1,660,520 1,042,589
323,608 9,600
1,131,170
370,545 1,402,940
104,382 4,000
29,680
30,000 1,207,750 3,590,795
54,320 1,741,660
2,034
24 8
21 17
188
35 37
- 249
28
60 38 28 36 11
27 36 44 29 53
50 51 26 11 49
11 30
- 30 29
12 76 74
3 37
-
82 121
24 26
4
38 113
4 27
23 45 10 56
3
177 265 413 133
95
48 103
44 6
123
54 105
6 11 34
4
170 175
8 60
13,534
56 12 53
114 1,550
627 139
- 1,706
747
151 485 289 116
2
66 59
155 178 406
136
1,100 38
151 44
21
198 -
23 46
39
197 353
61 427
-
271 890 (D)46
6
325 1,563
24 (D)
26 49 (D)
331 (D)
687 1,532 3,010 1,308
436
374 673 155
2 684
979 888
18 175 729
24
825 873
12 151
9,709
56 12 27
114 1,263
573
42 -
1,574 571
116 445
32 68
2
66 (D)
155 63
354
73 120
22 151
30
21 174
- 22 45
39
128 294
61 169
-
271 297 186
36
6 320
1,472 24 21
26 49 (D)65 (D)
387 834
2,633 262 159
369 123 155
1 592
919 857
18 175 703
24
785 587
12 116
--continued

2007 CENSUS OF AGRICULTURE 2008 FRIS – HORTICULTURAL OPERATIONS DATA 205 USDA, National Agricultural Statistics Service
Table 9. Irrigated Horticultural Operations by Market Value of All Agricultural Products Sold: 2008 - Con.
[Totals may not add due to rounding. Excludes abnormal operations. For meaning of abbreviations and symbols, see introductory text]
$50,000 - $99,999
Under protection In the open Geographic area
Operations Square feet Square feet irrigated Operations Acres Acres irrigated
United States ....................................... Alabama .............................................. Alaska ................................................. Arizona ................................................ Arkansas ............................................. California ............................................. Colorado .............................................. Connecticut ......................................... Delaware ............................................. Florida ................................................. Georgia ............................................... Hawaii ................................................. Idaho ................................................... Illinois .................................................. Indiana ................................................ Iowa .................................................... Kansas ................................................ Kentucky ............................................. Louisiana ............................................. Maine .................................................. Maryland ............................................. Massachusetts .................................... Michigan .............................................. Minnesota ............................................ Mississippi ........................................... Missouri ............................................... Montana .............................................. Nebraska ............................................. Nevada ................................................ New Hampshire ................................... New Jersey ......................................... New Mexico ......................................... New York ............................................. North Carolina ..................................... North Dakota ....................................... Ohio .................................................... Oklahoma ............................................ Oregon ................................................ Pennsylvania ....................................... Rhode Island ....................................... South Carolina .................................... South Dakota ...................................... Tennessee .......................................... Texas .................................................. Utah .................................................... Vermont ............................................... Virginia ................................................ Washington ......................................... West Virginia ....................................... Wisconsin ............................................ Wyoming ............................................. Water Resources Regions Region 01 New England ...................... Region 02 Mid-Atlantic ........................ Region 03 South Atlantic-Gulf ............. Region 04 Great Lakes ....................... Region 05 Ohio ................................... Region 06 Tennessee ......................... Region 07 Upper Mississippi ............... Region 08 Lower Mississippi ............... Region 09 Souris-Red-Rainy ............... Region 10 Missouri ............................. Region 11 Arkansas-White-Red .......... Region 12 Texas-Gulf ......................... Region 13 Rio Grande ........................ Region 14 Upper Colorado .................. Region 15 Lower Colorado .................. Region 16 Great Basin ........................ Region 17 Pacific Northwest ............... Region 18 California ............................ Region 19 Alaska ................................ Region 20 Hawaii ................................
3,018
30 16
7 22
207
11 52 10
126 37
83
- 57 84 47
20 88 40 36 28
91
145 36 20 53
33 16
6 42
100
43 198 136
9 147
25
121 247
27 38
12 89 85 24
7
37 74 36
120 -
248 463 365 317 382
96
219 69 14
101
61 79 37 12 13
24
212 207
16 83
45,125,143
257,520 71,280
245,000 178,200
3,310,237
81,600 1,267,110
350,000 8,787,622
222,408
2,842,070 -
558,600 776,556 292,000
106,068
1,067,966 286,086 162,048 513,904
536,700
1,976,532 349,380 171,500 451,192
255,149 105,236 24,000
287,550 1,124,074
567,136
2,022,880 2,363,624
39,600 1,260,280
155,920
1,178,506 3,632,562
210,132 377,148
54,936
1,465,812 1,950,540
194,170 21,000
418,840
1,191,500 293,210
1,069,759 -
2,463,540 5,915,240
12,220,182 3,514,300 3,948,356
1,511,712 2,067,087
572,886 134,600 707,857
354,040
1,918,500 540,736 86,400
269,000
194,170 2,482,950 3,310,237
71,280 2,842,070
43,515,189
257,520 71,280
245,000 178,200
3,059,507
81,600 1,267,110
350,000 8,785,382
190,008
2,830,870 -
558,600 769,596 283,750
106,068
1,067,966 251,086 159,648 496,404
505,700
1,940,532 328,130 171,500 448,192
202,149 105,236 20,400
260,300 1,098,874
490,876
1,962,180 2,363,624
39,600 1,260,280
155,920
1,122,874 3,300,036
198,932 377,148
52,280
1,424,292 1,950,540
194,170 21,000
418,840 732,920 293,210
1,065,859 -
2,391,690 5,706,414
12,185,542 3,433,200 3,759,396
1,470,192 2,041,937
537,886 134,600 640,951
354,040
1,918,500 472,876 78,000
265,400
194,170 1,968,738 3,059,507
71,280 2,830,870
2,388
15 1 8
20 191
19 33
- 315
69
42 8
44 58 26
22 47 32 12 28
72 77 33 14 39
23 22
6 17 65
13 92
127 -
80
33 113 121
20 53
13 33 91 18 18
25 63 13
104 -
154 282 589 194 198
40
152 32
- 91
83 85 13 13 16
18
196 189
1 42
30,633
371 (D)79
502 2,099
322 162
- 5,062
571
191 32
371 662 425
75 69 84 20
370
(D)1,443
171 334
2,703
189 323
3 (D)
750
3 1,794 1,668
- 1,265
576 388 641
8 1,210
87
351 1,762
178 183
792 290 (D)
1,534 -
577 4,178 8,912 3,220 1,919
83
1,383 368
- (D)
2,827 1,761
3 262 124
178 822
2,057 (D)
191
18,799
294 (D)79
277 1,556
302 132
- 3,610
393
191 32
211 255 249
75 (D)63 20
318
(D)443
67 234
1,460
189 323
3 (D)
381
3 835 758
- 226
374 379 202
8 940
87
351 1,505
178 42
486 249
52 706
-
375 2,151 6,034 1,245
816
(D)501 (D)
- 1,524
1,300 1,504
3 242 124
178 772
1,514 (D)
191
--continued

206 2008 FRIS – HORTICULTURAL OPERATIONS DATA 2007 CENSUS OF AGRICULTURE USDA, National Agricultural Statistics Service
Table 9. Irrigated Horticultural Operations by Market Value of All Agricultural Products Sold: 2008 - Con.
[Totals may not add due to rounding. Excludes abnormal operations. For meaning of abbreviations and symbols, see introductory text]
$100,000 - $249,999
Under protection In the open Geographic area
Operations Square feet Square feet irrigated Operations Acres Acres irrigated
United States ....................................... Alabama .............................................. Alaska .................................................. Arizona ................................................ Arkansas .............................................. California ............................................. Colorado .............................................. Connecticut .......................................... Delaware ............................................. Florida .................................................. Georgia ................................................ Hawaii .................................................. Idaho .................................................... Illinois ................................................... Indiana ................................................. Iowa ..................................................... Kansas ................................................. Kentucky .............................................. Louisiana ............................................. Maine ................................................... Maryland .............................................. Massachusetts ..................................... Michigan .............................................. Minnesota ............................................ Mississippi ........................................... Missouri ............................................... Montana ............................................... Nebraska ............................................. Nevada ................................................ New Hampshire ................................... New Jersey .......................................... New Mexico ......................................... New York ............................................. North Carolina ..................................... North Dakota ....................................... Ohio ..................................................... Oklahoma ............................................ Oregon ................................................. Pennsylvania ....................................... Rhode Island ....................................... South Carolina ..................................... South Dakota ....................................... Tennessee ........................................... Texas ................................................... Utah ..................................................... Vermont ............................................... Virginia ................................................. Washington .......................................... West Virginia ....................................... Wisconsin ............................................ Wyoming .............................................. Water Resources Regions Region 01 New England ...................... Region 02 Mid-Atlantic ......................... Region 03 South Atlantic-Gulf ............. Region 04 Great Lakes ........................ Region 05 Ohio .................................... Region 06 Tennessee .......................... Region 07 Upper Mississippi ............... Region 08 Lower Mississippi ............... Region 09 Souris-Red-Rainy ............... Region 10 Missouri .............................. Region 11 Arkansas-White-Red .......... Region 12 Texas-Gulf .......................... Region 13 Rio Grande ......................... Region 14 Upper Colorado .................. Region 15 Lower Colorado .................. Region 16 Great Basin ........................ Region 17 Pacific Northwest ................ Region 18 California ............................ Region 19 Alaska ................................ Region 20 Hawaii ................................
3,851
52 12 29 17
215
56 59 30
234 38
129
42 167
84 42
38
105 25 63 53
87
210 98 19 52
22
5 -
34 122
6
164 120
9 151
34
159 298
38 28
16
106 144
15 38
60 62 26
223 15
294 598 445 438 410
127 409
47 6
143
116 124
5 15 34
10
274 215
12 129
111,668,352
2,705,400 94,116
397,300 325,800
9,829,150
1,071,110 1,430,136
955,920 20,354,430
699,800
4,415,300 653,100
3,520,064 2,186,364
558,240
425,240 2,601,556
594,480 877,160
1,732,900
1,491,716 5,805,796 1,825,265
396,000 862,596
147,692 270,000
- 267,750
6,033,698
86,400 4,173,950 3,548,851
252,000 6,836,188
472,000
3,026,202 5,693,308
556,420 821,300
119,264
2,421,792 4,143,472
682,500 369,168
730,698 779,912 587,010
3,561,282 278,556
4,727,870 16,463,738 27,641,798 14,237,110 8,964,416
2,914,895 7,157,295 1,072,080
90,000 2,840,692
1,797,696 3,522,272
60,000 227,110 847,300
232,500
4,533,014 9,829,150
94,116 4,415,300
108,844,757
2,700,600 94,116
397,300 325,800
9,272,523
1,048,382 1,429,296
955,920 20,230,806
594,800
4,023,496 639,100
3,520,064 2,165,964
558,240
425,240 2,555,428
594,480 825,200
1,732,900
1,491,716 5,642,076 1,825,265
396,000 854,316
147,692 270,000
- 249,750
6,033,198
69,120 4,155,550 3,548,851
252,000 6,732,476
472,000
2,954,802 5,327,840
542,420 478,300
110,816
2,421,792 4,011,472
680,000 357,168
711,618 752,200 587,010
3,401,798 277,856
4,631,070 16,365,690 27,065,374 13,928,722 8,581,176
2,914,895 7,050,079 1,072,080
90,000 2,808,816
1,789,416 3,390,272
60,000 209,830 847,300
230,000
4,419,902 9,272,523
94,116 4,023,496
3,211
85 4
28 13
273
58 32 24
378 64
76 26
106 69 47
31 47 34 40 23
47
118 74 24 36
13 16
1 21 88
8
132 123
- 93
31
176 184
26 21
19 67
119 14 13
65 57 31
128 8
179 434 671 243 257
78
293 29
6 116
96
112 10 24 28
15
267 273
4 76
63,484
1,767 (D)48
340 2,157
1,166
60 35
7,648 3,013
277
1,768 1,484 1,446
76
58 1,244 1,207
828 427
543
3,073 2,224
652 1,907
167
1,321 (D)62
2,049
128 1,491 2,225
- 500
791
3,121 1,686
490 744
731
3,190 5,224
(D)2
1,513
813 (D)
2,450 269
1,984 6,523
15,937 4,136 4,191
1,719 7,656 1,343
1 (D)
1,215 5,215
298 586
48
(D)5,864 2,157
(D)277
46,280
836 (D)48
340 1,724
1,077
60 35
6,839 2,637
267
1,673 1,368 1,218
(D)
58 464
1,087 186 357
258
1,953 1,718
517 1,674
167
1,018 (D)47
1,514
125 779
1,453 -
355
752 2,505
688 249 569
381
1,454 4,313
(D)2
851 813 (D)
960 269
801 3,658
12,670 2,627 2,364
(D)
5,441 1,103
1 2,809
1,175 4,304
298 526
48
(D)5,153 1,724
(D)267
--continued

2007 CENSUS OF AGRICULTURE 2008 FRIS – HORTICULTURAL OPERATIONS DATA 207 USDA, National Agricultural Statistics Service
Table 9. Irrigated Horticultural Operations by Market Value of All Agricultural Products Sold: 2008 - Con.
[Totals may not add due to rounding. Excludes abnormal operations. For meaning of abbreviations and symbols, see introductory text]
$250,000 - $499,999
Under protection In the open Geographic area
Operations Square feet Square feet irrigated Operations Acres Acres irrigated
United States ....................................... Alabama .............................................. Alaska ................................................. Arizona ................................................ Arkansas ............................................. California ............................................. Colorado .............................................. Connecticut ......................................... Delaware ............................................. Florida ................................................. Georgia ............................................... Hawaii ................................................. Idaho ................................................... Illinois .................................................. Indiana ................................................ Iowa .................................................... Kansas ................................................ Kentucky ............................................. Louisiana ............................................. Maine .................................................. Maryland ............................................. Massachusetts .................................... Michigan .............................................. Minnesota ............................................ Mississippi ........................................... Missouri ............................................... Montana .............................................. Nebraska ............................................. Nevada ................................................ New Hampshire ................................... New Jersey ......................................... New Mexico ......................................... New York ............................................. North Carolina ..................................... North Dakota ....................................... Ohio .................................................... Oklahoma ............................................ Oregon ................................................ Pennsylvania ....................................... Rhode Island ....................................... South Carolina .................................... South Dakota ...................................... Tennessee .......................................... Texas .................................................. Utah .................................................... Vermont ............................................... Virginia ................................................ Washington ......................................... West Virginia ....................................... Wisconsin ............................................ Wyoming ............................................. Water Resources Regions Region 01 New England ...................... Region 02 Mid-Atlantic ........................ Region 03 South Atlantic-Gulf ............. Region 04 Great Lakes ....................... Region 05 Ohio ................................... Region 06 Tennessee ......................... Region 07 Upper Mississippi ............... Region 08 Lower Mississippi ............... Region 09 Souris-Red-Rainy ............... Region 10 Missouri ............................. Region 11 Arkansas-White-Red .......... Region 12 Texas-Gulf ......................... Region 13 Rio Grande ........................ Region 14 Upper Colorado .................. Region 15 Lower Colorado .................. Region 16 Great Basin ........................ Region 17 Pacific Northwest ............... Region 18 California ............................ Region 19 Alaska ................................ Region 20 Hawaii ................................
1,999
52 4
10 6
212
27 37
9 123
25
46 10 52 30 17
24 34 26 36 29
91
147 30 30 31
12 25
- 37 88
7
92 74
- 66
16 77 82
- 10
4
41 27 19 37
58 22
5 51 11
218 322 284 260 103
50
139 58
- 87
29 27
- -
17
19 124 212
4 46
135,011,360
2,957,159 160,000 264,000 55,200
18,399,930
1,021,460 6,980,580
72,000 40,028,874 3,317,224
1,092,448
6,550 995,736 920,400 517,800
3,399,696 2,006,500
961,240 542,256 603,930
2,653,480 7,703,060
859,610 943,760 736,000
270,000 407,000
- 762,020
6,335,258
8,750,000 2,314,832 2,087,725
- 2,390,720
640,000
1,747,485 2,384,468
- 350,775
140,000
1,580,720 1,945,000
528,570 504,194
1,858,000
651,080 75,000
1,881,000 208,620
10,690,330 12,853,488 48,535,272 11,820,490 3,707,240
1,896,965 3,615,296 2,128,440
- 4,621,100
1,299,056 1,945,000
- -
9,014,000
528,570 2,703,735
18,399,930 160,000
1,092,448
122,384,618
2,957,159 160,000 264,000 55,200
14,636,203
950,660 2,711,700
63,000 39,035,224 2,974,312
1,092,448
6,550 875,736 884,400 517,800
3,399,696 2,006,500
961,240 542,256 551,220
2,609,480 7,678,060
859,610 847,510 722,168
270,000 385,955
- 742,020
6,167,258
7,000,000 2,257,332 2,087,725
- 2,390,720
640,000
1,599,485 1,789,032
- 350,775
140,000
1,580,720 1,945,000
528,570 486,194
1,858,000
651,080 75,000
1,881,000 196,620
6,339,450 11,982,842 47,198,710 11,747,490 3,707,240
1,896,965 3,481,464 2,032,190
- 4,588,055
1,228,256 1,945,000
- -
7,264,000
528,570 2,555,735
14,636,203 160,000
1,092,448
1,923
68 4
28 19
212
25 22
- 188
50
30 3
52 30 17
16 28 35 31 23
67 88 32 30 45
14 15
- 16 94
1
60 60
- 35
19
116 64
2 19
2
57 49 10 24
53 21
- 35 14
149 260 394 171 102
42
120 69
- 93
35 47
1 -
28
10 156 212
4 30
83,553
2,578 1
503 2,515 5,905
1,149
219 -
6,483 2,871
172 150
3,022 381
1,062
1,949 2,446
792 340
1,018
387 6,524
680 903
3,128
(D)825
- 12
4,155
(D)1,738 2,767
- 656
4,489 3,238 1,799
(D)2,059
(D)
6,928 4,143
(D)(D)
408 357
- 2,381
378
1,416 8,800
16,530 8,033 5,771
5,145 5,907 1,584
- (D)
9,608 3,303
(D)-
503
(D)3,950 5,905
1 172
55,162
2,221 1
478 1,995 4,554
1,042
59 -
5,264 2,238
172
90 1,306
266 1,017
949 636 736 128
1,012
364 4,062
647 662
1,418
(D)742
- 12
2,796
(D)1,114 1,358
- 221
2,617 2,457
432 (D)
1,957
(D)3,199 3,353
(D)(D)
243 211
- 866 378
1,014 5,432
12,810 4,868 2,081
(D)
2,983 1,327
- 3,737
6,679 2,513
(D)-
478
(D)2,962 4,554
1 172
--continued

208 2008 FRIS – HORTICULTURAL OPERATIONS DATA 2007 CENSUS OF AGRICULTURE USDA, National Agricultural Statistics Service
Table 9. Irrigated Horticultural Operations by Market Value of All Agricultural Products Sold: 2008 - Con.
[Totals may not add due to rounding. Excludes abnormal operations. For meaning of abbreviations and symbols, see introductory text]
$500,000 - $999,999
Under protection In the open Geographic area
Operations Square feet Square feet irrigated Operations Acres Acres irrigated
United States ....................................... Alabama .............................................. Alaska .................................................. Arizona ................................................ Arkansas .............................................. California ............................................. Colorado .............................................. Connecticut .......................................... Delaware ............................................. Florida .................................................. Georgia ................................................ Hawaii .................................................. Idaho .................................................... Illinois ................................................... Indiana ................................................. Iowa ..................................................... Kansas ................................................. Kentucky .............................................. Louisiana ............................................. Maine ................................................... Maryland .............................................. Massachusetts ..................................... Michigan .............................................. Minnesota ............................................ Mississippi ........................................... Missouri ............................................... Montana ............................................... Nebraska ............................................. Nevada ................................................ New Hampshire ................................... New Jersey .......................................... New Mexico ......................................... New York ............................................. North Carolina ..................................... North Dakota ....................................... Ohio ..................................................... Oklahoma ............................................ Oregon ................................................. Pennsylvania ....................................... Rhode Island ....................................... South Carolina ..................................... South Dakota ....................................... Tennessee ........................................... Texas ................................................... Utah ..................................................... Vermont ............................................... Virginia ................................................. Washington .......................................... West Virginia ....................................... Wisconsin ............................................ Wyoming .............................................. Water Resources Regions Region 01 New England ...................... Region 02 Mid-Atlantic ......................... Region 03 South Atlantic-Gulf ............. Region 04 Great Lakes ........................ Region 05 Ohio .................................... Region 06 Tennessee .......................... Region 07 Upper Mississippi ............... Region 08 Lower Mississippi ............... Region 09 Souris-Red-Rainy ............... Region 10 Missouri .............................. Region 11 Arkansas-White-Red .......... Region 12 Texas-Gulf .......................... Region 13 Rio Grande ......................... Region 14 Upper Colorado .................. Region 15 Lower Colorado .................. Region 16 Great Basin ........................ Region 17 Pacific Northwest ................ Region 18 California ............................ Region 19 Alaska ................................ Region 20 Hawaii ................................
1,588
14 4
24 -
144
19 27
- 141
11
12 10 25 36
1
7 31 44 18 32
25
132 36 11 12
6
18 -
26 42
6
74 57
9 96
8
92 73 17 15
4
26 74
5 13
33 18 10 46
4
119 249 249 205 138
8
89 47
9 58
26 74
6 2
24
5 115 149
4 12
152,299,283
568,154 72,000
4,364,200 -
11,372,998
1,360,300 1,212,750
- 43,322,120
324,432
2,513,120 262,000 645,560
1,534,680 (D)
238,000
2,921,500 1,705,552
739,500 2,378,685
682,000
14,427,910 2,344,500 2,487,360
696,000
240,000 492,000
- 667,600
6,938,550
(D)3,120,690 2,084,928
451,026 6,623,350
630,560
3,266,570 3,803,696
408,260 602,078
151,360
1,185,296 16,943,644 4,000,000
109,440
1,014,374 1,348,000
282,500 1,548,440
137,600
3,764,110 16,742,435 49,389,072 18,806,750 7,734,726
588,000
4,531,260 2,071,552
451,026 2,930,960
1,082,560
16,943,644 (D)(D)
4,364,200
4,000,000 4,774,570
11,474,998 72,000
2,513,120
149,504,903
568,154 72,000
4,364,200 -
11,235,704
1,360,300 1,211,750
- 41,939,040
324,432
2,513,120 262,000 645,560
1,534,680 (D)
238,000
2,911,132 1,705,552
739,500 2,287,235
682,000
13,914,802 2,344,500 2,487,360
696,000
192,000 492,000
- 667,600
6,938,550
(D) 3,090,690 2,084,928
451,026 6,523,600
630,560
3,225,770 3,738,776
408,260 591,578
151,360
1,114,160 16,880,644 4,000,000
109,440
834,800 1,348,000
282,500 1,528,040
137,600
3,763,110 16,376,491 47,995,492 18,273,242 7,624,608
568,800
4,531,260 2,019,616
451,026 2,852,960
1,082,560
16,880,644 (D) (D)
4,364,200
4,000,000 4,733,770
11,337,704 72,000
2,513,120
1,424
20 - 9 -
110
31 27
3 172
31
12 12 22 27
3
7 27 50 19 53
13 64 22 12 20
8
18 2
31 47
9
53 59
- 31
11
100 61 16 14
1
43 53
3 7
37 14 10 25
5
106 245 310 110
70
17 79 57
- 67
32 53
9 6
11
3 122 115
- 12
100,224
3,749 -
84 -
3,739
3,502 3,100 1,780 9,417 4,582
(D)
1,963 4,356 1,017
988
7 1,894 1,235
(D)2,702
10
3,875 3,064
756 869
(D)
726 (D)(D)
4,889
(D)3,158 2,578
- 805
2,978 6,417 1,793 1,077 2,124
(D)
4,551 7,189
374 126
1,139 1,204 1,020 2,311
(D)
4,582 12,752 23,805
6,905 6,143
(D)
9,302 3,285
- 4,266
4,060 7,189 1,470
400 258
420
9,676 3,746
- (D)
68,027
2,879 -
84 -
3,589
3,502 130
1,780 7,712 4,192
200
1,963 2,227
987 (D)
7
306 630 171
1,145
10 2,170
864 626 756
(D)
516 (D)60
3,141
(D)1,226 1,718
- 665
2,595 4,200
663 879
1,750
(D)2,673 6,278
374 7
1,019 1,204
130 463 (D)
1,249 7,736
19,477 2,731 2,019
908
4,340 2,134
- 3,838
3,677 6,278 1,306
400 258
420
7,459 3,597
- 200
--continued