2007/03/13- usec- staff pre-filed exhibit 52, license ... · i cid next level. close 8affectedcid...
TRANSCRIPT

LA-3605-0001
NRC STAFF EXHIBIT 52
License Application
for the American Centrifuge Plantin Piketon, Ohio
Revision 11__.. _ I - -{ Deleted: "
'-.
Docket No. 70-7004Information contained within
does not cootaio
Export Controlled InrormntioD
Reviewer: G. PeedDale: 08/30106
{ Deleted: March
I '
ftugust 2006 ' ... r

License Application/'Jr the American Centrifuge Plant R"'t'l\ion J 4
Table 9.2-1 American Centrifuge Plant Action Levels for Radionuclide Effluents
Weekly Sample Results
Required Actions b
Uranium • Technetium •
BEQ
BEQReview release data for previous six months for trends. andestimate probable impact over calendar year.Evaluate whether additional controls would significantlyreduce public exposure.10 x BEQ
80 xBEQDetermine whether increased releases are ongoing or aor
orsingle spike.2 x BEQ
16 x BEQInitiate investigation into cause(s) of increased releases.averaged over 6
averaged over 6Evaluate whether mitigative and/or corrective measures aremonths
monthsnecessary to reduce public dose.Implement mitigative and/or corrective measures asneeded.EPA Reportable
EPA RQcNotify Operations SupervisorQuantity" (RQ)
(10 Ci in 24Trace source of abnormal releases and establish control or(0.1 Ci in 24
hours)shutdown as needed.hours)
If releases cannot be mitigated within 24 hours. elevate tonext level.I Cid
8 CidClose affected discharge points until control of releases isre-established .• Uranium has an approximately 8-fold greater dose rate response than ""Tc over air dominated exposurepathways. Uranium dose response completely dominates 9"Tc over water dominated exposure pathways.n
Required actions for any level include required actions listed under lower emission levels., RQ does not include permitted emissions. The ACP is regulated under 40 CFR Part 61. Subpart H forrelease of airborne radionuclides from the entire reservation up to the equivalent of 10 mremlyear TEDE to the mostexposed member of the public.0
I Ci or 8 Ci in one weekly sample analysis.Note: The Operations Supervisor has the authority to allow a restart.
926
Licell.re Appliwlion(or the American Centrifuge Plant Revision 14
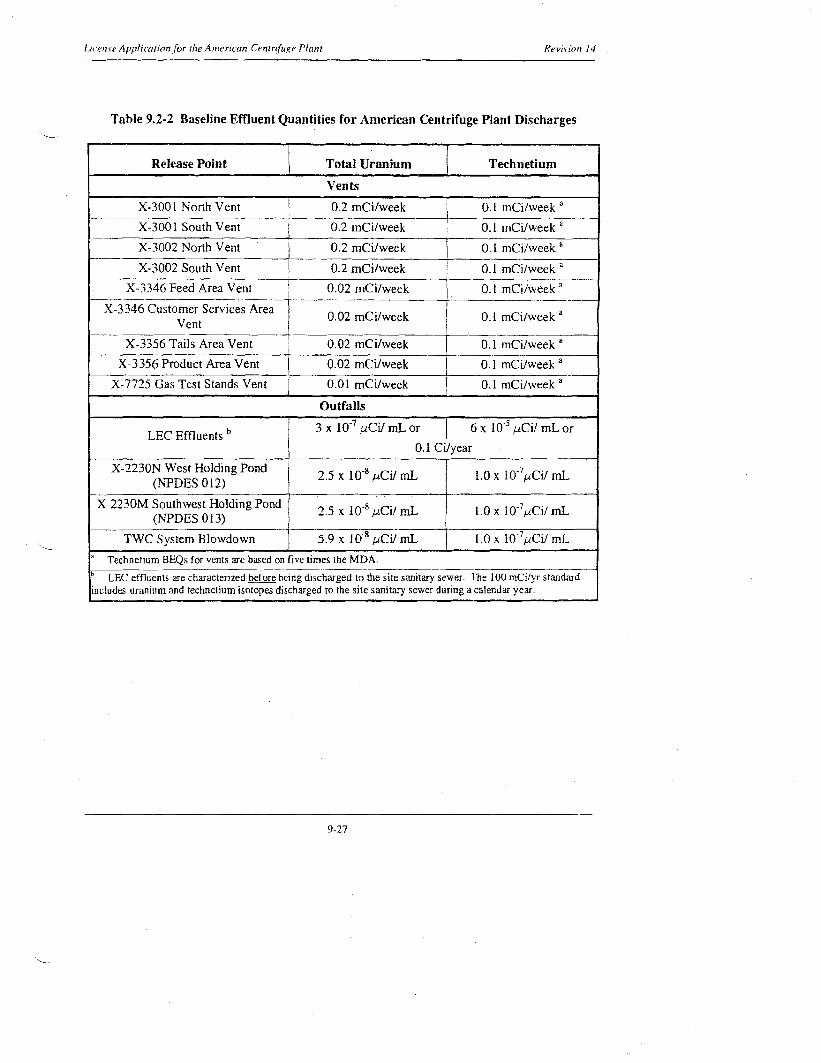
Table 9.2-2 Baseline Effluent Quantities for American Centrifuge Plant Discharges
Release Point Total UraniumTechnetium
VentsX-300 I North Vent
!0.2 mCi/weekI,0.1 mCi/week a--I
-~---t------
X-300l South Vent 0.2 mCi/week0.1 mCilweek a
X-3002 North Vent
0.2 mCi/week0.1 mCi/week R
X-3002 South Vent
0.2 mCi/week0.1 mCi/week a
X-3346 Feed Area Vent
I
0.02 mCi/week +0.1 mCi/week aI-~.--
X-3346 Customer Services Area 0.02 mCi/week0.1 mCilweek a
Vent ------------- 1----X-3356 Tails Area Vent
0.02 mCi/week0.1 mCi/week a
X-3356 Product Area Vent
0.02 mCi/week0.1 mCilweek a
X-7725 Gas Test Stands Vent
0.01 mCi/week\
0.1 mCi/week a
OutfallsLEC Effluents b
I3 X 10-7 jJ.CiI mL orI6 x 10.5 jJ.Ci/ mL or
0.1 CilyearX-2230N West Holding Pond2.5 x 10-8 jJ.CiI mL1.0 x 10-7jJ.Ci! mL
(NPDES 012)X-2230M Southwest Holding Pond
2.5 x 10'8 jJ.Ci! mL1.0 x W-7!lCi! mL(NPDES 013)
TWC System Blowdown
5.9 X 10⁻⁸ jJ.Ci! mL1.0 x 10-7jJ.Ci! mL"
Technetium BEQsfor vents are hased on five times the MDA.~. b LEC effluents are characterized hefore being discharged to the site sanitary sewer. The 100 mCi/yr standard
includes uranium and technetium isotopes discharged to the site sanitary sewer during a calendar year.
9-27

License Application jilT the American Celltrituge Plam
Table 9.2-3 Anticipated Gaseous Effluents
ReviIiotl 14
Discharge Point Total Uranium aTechnetiumjJ.Ci/mL b
mCilwkcjJ.Ci/mL bmCi/wkcX-3346 Feed and Customer
II 0I <0.04
Services Building (2 vents) I--.
L_____X-3001 and X-3002 Process
,I
I
<0.8 I0Buildings (4 vents)
I
X-3356 Product and Tails<3.2 x 10.151.2 X 10-16
1__ 0 _Withdrawal Building Vent ~.~~(2 vents) X-7725 Gas Test Stands Vent
<0.01" 0
1------'-=-- I 0.005XT-847 Glovebox Vent0.0004
Laboratory Hoods <1
0.17I0.035
10 CFR Part 20, App. B, Table3 x 10-12
------8 X 10⁻⁹I------2 II. Since uranium isotopes present at the ACP have the same discharge limit, uranium isotope activities are
combined into a Total Uranium activitv for simplify comparison to the Table 2 limits.o Anticipated concentrations are maximum ambient concentrations at the DOE reservation boundary due toemission sources and are based on emission estimates and atmospheric dispersion modeling. Anticipatedtechnetium concentration is based on no detectable releases from the X-7725 facility and X-3000 series buildings.cAnticipated discharges are measured at the vent and, by definition, are less than the Baseline Effluent Quantities.
Anticipated technetium discharges from the X-7725 facility and X-3000 series buildings are zero.a Bounding case for associated analytical services.
9-28

License Application/or the Amencan Centrifuge Plant
Table 9.2-4 Anticipated Liquid Effluents a
Revision 14
Discharge Point Total Uranium 0TechnetiumI-lCifrnL
I-lCifmLLEC Effluents
i <3 x 10· and <0.1 Ci/yri<2 x 10-' «MDA)
TWC System B1owdown
I<3 x 10⁻⁸I<2 x 10.8 «MDA)I
X-2230N West Holding Pondi
<l x 10-8 <2 x 10⁻⁸ «MDA)(NPDES Outfall 012) e
iIX-2230M Southwest Holding Pond I<1 x 10⁻⁸ <2 x 10⁻⁸ «MDA)(NPDES Outfall 013) e
iSanitary wastewater
I
<3 x 10⁻⁸ <2 x 10⁻⁸ «MDA)I(excluding LEC effluents) I,
North Cylinder Pad RunoffI<1 x 10⁻⁸ <2 x 10⁻⁸ «MDA)
10 CFR Part 20, App. B, Table 2
I
3 X 10'/ 6 x 10-'I10 CFR Part 20, App. B, Table 3
I3 x 10-0 6 x 10-·0
ACP contributions only. Combined effluents from other site operations remain the responsibility of theindi vidual operator." Since uranium isotopes present at the ACP have the same discharge limit, uranium isotope activities arecombined into a Total Uranium activity to simplify comparison to the Table 2 limits., ~ definition. anticipated activity discharges are less than the BEQ.o· LEC effluents are characterized prior to discharge. One Ci/yr limit applies to combined uranium and technetiumactivities .
. Anticipated concentrations are annual averages based un monthly grab samples from 1995 through 2000.
9-29

License Applicat;onfiJr the American Centrifuge Plant
Table 9.2-5 Environmental Baseline Activities/Concentrations1998·2002
Revision 14
Total UraniumTechnetiumGross AlphaGross Beta
fl,g1g
pCilgpCi/gpCi/g
Reservation (9 Sampling Locations) SoilNum. of Samples I
117 (0)I117 (93) 117(59)I117 (64)IAverage .+-2.8-+.<0.2 <8<14
--.---Mimmum I
0.6<0.1<28
Maximumi4.4 !1.5 2136I -.------- -'
Vegetation
Num.....2iSa~
116(113)116 (103)----------
<0.25<0.3
-~
Average----------
Minimum<0.04<0.1------------- -- ---------
Maximum 0.9I7.3I----- -----
Off Reservation (6 Sampling Locations) SoilNum. of Samples74 (0)74 (32)74 (38)74 (41)
~~r~~
2.9<0.2<7J-_.<14Minimum
0.7<0.1<2
I<8.-Maximum 4.63.81447
Vegetation--Num. of Samples i 73 (73)73 (61)----------
Average<0.24<0.3----------
Minimum<0.05<0.1-----.--_.-Maximum <0.343.3----------
The "number of samples" shows the total number of samples collected, including replicate and duplicate samplescollected for quality assurance (QA) purposes, followed by the number of samples that were lower than theMinimum Detectable Concentration in parentheses. QA sample locations for soil and vegetation are assignedindependently. so the number of samples in each group does not necessarily match.
9-30

License ApplicallolJ.fi" lilt' AmericalJ CelJlri(uge Plant
Table 9.2-5 Environmental Baseline Activities/Concentrations1998-2002
Revisio/l 14
Total UraniumTechnetiumGross AlphaGross Beta
IlglgpCilgpCilgpCilg
Remote (12 Sampling Locations)SoilNum. of Samples!
139 (0)I
139 (133) 139 (73)139 (77):Average ~~+3.0i<0.2
--t<7 =i=-<J£_-Minimum
0.7I<0.1 <3 <7
~imum
--I~..~----I 5.9 0.8I16 I 22
VegetationNum. of Samples I
137 (80)!137(128) -------------Average
<0.23<0.2----------
Minimum,0.08 <0.1----------
Maximum<0.28<0.5--------- -
Background (4 Sampling Locations) SoilNum. of Samples40 (0)40 (36)40 (17)40 (26)
Average ~3.5 <0.2<8<14
_.Minimum 1.7I<0.1 <5<8
MaximumI
6.8I0.5
1625
Vegetation--------Num. of Samples 40 (23)40 (37)----------
Average<0.24<0.2----------
Minimum<0.14<0.1----------
-- Maximum 0.280.5----------
The "number of samples" shows the total number of samples collected. including replicate and duplicate samplescollected for QA purposes. followed by the number of samples that were lower than the Minimum DetectableConcentration in parentheses. QA sample locations for soil and vegetation are assigned independently, so thenumber of samples in each grouD does not necessarilv match.
9-31

Liceme Application/fJr the American Centrifuge Plum
Table 9.2-6 Environmental Baseline Activities/Concentrations1998·2002
Revision 14
Total UraniumTechnetiumGross AlphaGross Beta
~gILpCifLpCilLpCifL
Surface WaterlUpstream Big Run CreekNum. of Samples I
60 (56)i60 (60) 60 (57)\
60 (39)Average
d.3i<15 <5d3Minimum
<0.1<6d<6Maximum
I23.5 <28<830
Surface Water/Downstream Bi Run CreekNum. of Samples 118 (68) .=t-!18 (116)118 (106)118 (82)-- <6
. --Average
<1.5 <15 <13Minimum
0.2I
<6 16IMaximum
23.2I<28I<140 33
Surface Water/Upstream Little Beaver CreekNum. of Samples
60 (59)60 (60)60 (56)60 (41)Average
<0.9<15<5<11Minimum
i<0.1 <6d<6Maximum
1.3I<28 <12<22Surface WaterlDownstream Little Beaver CreekNum. of Samples
321 (34)I322 (246) 322 (182)322(101)
3~era~.
d.7<16<6<15Minimum
I<0.6 <82<7Maximum
9.4434478
Surface WaterlUpstream Big Beaver CreekNum. of Samples60 (36)60 (58)60 (48)60 (25)
Average
d.2d6<5d4- <7 --Minimum 0.3<82I
Maximum5.8<283762
The "number of samples" shows the total number of samples collected. including replicate and duplicate samplescollected fur QA purpuses, followed by the number of samples that were lower than the Minimum DetectableConcentration in parentheses.
9·32

License ApplicatiofljiJr the American Cerztri{tlge Plam
Table 9.2-6 Environmental Baseline Activities/Concentrations1998 - 2002
Revision /4
Total UraniumTechnetiumGross AlphaGross Beta
J.!WL
pCi/L.pCiILpOlL
Surface Water/Downstream Bi~ Beaver CreekNum. of Samples
60 (50)i60 (58) 60(51)60 (36)Average
I<1.1I
<16 <6i<14i
Minimum<0.1<6<1<6
Maximum5.2<2872I108
Surface Water/Upstream Scioto RiverNum. of Samples
261 (8)261 (251)261 (213)261 (151)Average
i<1.9 <15<6<13.- Minimum <1.0<62<6Maximum
I32.6 <28<1340
Surface Water/Downstream Scioto RiverNum. of Samples I
261 (6)261 (254)261 (206)261 (156)Average
<1.8<16<6<13Minimum
<1.0<62<7Maximum
9.5<298634
Surface WaterlBackground CreeksNum. of Samples240 (214)240 (237)240 (223)240 (179)
Average
<1.0<16<4<11Minimum
,<0.1 <6<1<6
Maximum6.9114"1146
The "number of samples" shows the total number of samples collected, including replicate and duplicate samplescollected for QA purposes, followed by the number of samples that were lower than the Minimum DetectableConcentration in parentheses .• One sample from a background location was analyzed at 114 picocuries per liter (pCi/L) of technetium. a betaemitter, but only 12 pCilL of gross beta activity. The technetium activity is believed to be a case of crosscontamination. The next highest technetium activity at the background locations was 28 pCi/L.
9·33

Licell.le Appli(ari{Jll.tiJr the American Celllrituge Plant
Table 9.2-7 Environmental Baseline Activities/Concentrations1998 - 2002
Revision ]4
Total UraniumTechnetiumGross AlphaGross Beta
Ilg/gpCi/gpCi/gpCitg
SedimentlX-2230M Southwest Holding Pond Discharge~-,-CJ.!.~ a.!"!!B1es
10 (0)I
10 (6) 10 (4)10 (4)Averaoe
3.8<0.2<9<16~= 1.8<0.1<4<7IOlmum
Maximum6.2I0.3I18 <36
SedimentlX-2230N West Holding Pond DischargeNum. of Samples
13 (0)13 (4)13(4)13 (11)-"--- ...... 3.2<0.3I<7 <11AverageMinimum
2.3<0.1<3<7Maximum
4.90.610<17
SedimentlUpstream Little Beaver CreekNum. of Samples15 (0)15 (13)15 (6)15(11)
~ye~age_ ..
2.8<0.1<7I<13Minimum
1.5<0.1<4<7Maximum
5.70.21118
SedimentlX-23OJ-7 DischargeNum. of Samples
17 (0)17 (0)17 (7)17(4)Average
5.97.1<16<32--~Minimum 2.70.7<5<7Maximum
21.231.383170
SedimentIDownstream Little Beaver CreekNum. of Samples28 (0)I
28 (6) 28 (3)28 (9)
_A_v~r:.aKe_..
7.0<64.5<17<85--Minimum 1.8<0.1<5<10Maximum
35.1801a61924The "number of samples" shows the lotal number of samples collected. including replicate and duplicate samplescollected for QA purposes, followed by the number of samples that were lower than the Minimum DetectableConcentration in parentheses.
9-34

License Application for t/le American Centrifuge Plant
Table 9.2-7 Environmental Baseline Activities/Concentrations1998 - 2002
Revision /4
Total UraniumTechnetiumGross AlphaGross Beta
llWg
pCilgpCilgpCilg
Sediment/Upstream Bi~ Beaver CreekNum. of Samples
10 (0)I10 (2) 10 (4)10 (6)1-----.Average2.1<0.3<7<13
Minimum0.9<0.1<5<7
Maximum4.6,
0.7925
Sediment/Downstream Big Beaver CreekNum. of Samples10 (0)I10 (0)i10 (1) 10 (2)
Average
4.04.7<11<18Minimum
2.81.1<6<12Maximum
5.514.6I33 24
Sediment/Upstream Big Run CreekNum. of Samples I
11 (0)11 (8)11 (3)11 (8)
~.~erage +3.8I<0.2 <7<13Minimum
2.3<0.149Maximum
4.8I<0.2 13<17
Sediment/Downstream Big Run CreekNum. of Samples
29 (0)I29 (6) 29 (6)29 (18)Average
4.1<0.8<9<14Minimum
l.l<0.1<4<7Maximum
,5.9 2.73328
SedimentlUpstream Scioto RiverN urn. of Samples11 (0)11 (11)11 (7)11 (8)
Average
2.1<0.1<7<12--Minimum 0.9<0.1,
3<7
Maximum4.6<0.2<9<17
The "number of samples" shows the total number of samples collected, including replicate and duplicate sample.scollected for QA purposes, followed by the number of samples that were lower than the Minimum DetectableConcentration in parentheses.
9-35

License Application for the American Centrifuge Plam
Table 9.2-7 Environmental Baseline Activities/Concentrations1998 - 2002
Revision 14
Total UraniumTechnetiumGross AlphaGross Beta
u,gfgpCilgpCilgpCilg
SedimentJDownstream Scioto RiverNum. of Samples I
10 (0)10 (8),
10 (5) 10 (6)
Average
2.1<0.2<9<14
Minimum
1.4I<0.1 5<8-- -Maximum 4.4I0.4 1719
Sediment/Background CreeksNum. of Samples
40 (0)40 (37)40 (22)I40 (25)Average
i3.2 <0.2<6<13I Minimum
,1.3 <0.1<3<7, ,
Maximum6.82.71324
The "number of samples" shows the total number of samples collected, including replicate and duplicate samplescollected for QA purposes, followed by the number of samples that were lower than the Minimum DetectableConcentration in parentheses.-i'-in Fall 2002, duplicate samples taken at the RM8 sample point contained 689 and 801 pCilg of technetium. A-replicate sample taken at the same time and a few yards away contained only 13 pCi/g of technetium. The RM8sample taken the following spring contained only 13 pCi/g, which is consistent with previous samples.
Table 9.2-8 Environmental Baseline Radiation Levels1998-2002
Area of Readings AverageMinimumMaximum
Reservation (includes 518,737,862,906,10.5 J,1Rad/hr
6.4 J,lRad/hr17.9 IlRadlhr933, 1404A, A35,A36, and ,-\40)
I
X-746 Cylinder Yard70.5 J,1Rad/hr
60.1 /-lRad/hr82.3 IlRadlhr(includes 874)Boundary (includesA3, A8, A9, A12,
10.5 /-lRadfhr6.2/-lRad/hr22.6 IlRadlhrAl5, A23, A24, and
A29)Piketon (includes A6)
9.6 J,1Rad/hr7.4 /-lRad/h r13. 9 /-lRad/hrCamp Creek
I10.4 /-lRad/hr
7.8 )..lRad/hr14.9 IlRadlhr(includes A28) i
Note: Locations ACp· I. ACP·2. ACP-3, ACp·4. and ACP-5 are new monitoring locations that will be establishedas the ACP is budt.
9-36