2008 kontogeorgos&al
TRANSCRIPT
Available online at www.sciencedirect.com
Measurement 41 (2008) 251–258
www.elsevier.com/locate/measurement
Measuring solar radio bursts in 20–650 MHz
A. Kontogeorgos a,b,*, P. Tsitsipis a,b, C. Caroubalos a, X. Moussas a,P. Preka-Papadema a, A. Hilaris a, V. Petoussis a,b, J.-L. Bougeret c,
C.E. Alissandrakis d, G. Dumas c
a Department of Physics and Department of Informatics, University of Athens, GR-15783, Athens, Greeceb Department of Electronics, Technological Education Institute of Lamia, GR-35100, Lamia, Greece
c Observatoire de Paris, LESIA, CNRS UA 264, F-92195 Meudon Cedex, Franced Department of Physics, University of Ioannina, GR-45110 Ioannina, Greece
Received 4 January 2006; received in revised form 29 March 2006; accepted 9 November 2006Available online 21 November 2006
Abstract
The solar radiospectrograph of the University of Athens is installed at the Thermopylae Satellite TelecommunicationStation. The observations cover the frequency range from 20 to 650 MHz. The spectrograph has a 7-m moving parabolafeeding by a log-period antenna for 100–650 MHz and a stationary inverted V fat dipole antenna for 20–100 MHz. Tworeceivers are operating in parallel: a sweep frequency for the whole range (10 spectra/s, 630 channels/spectrum) and anacousto-optical receiver for the range 270–450 MHz (10 spectra/s, 128 channels/spectrum). The data acquisition systemconsists of two PCs (equipped with 12 bit, 225 ksamples/s DAC, one for every receiver). The daily operation is fully auto-mated: receiving universal time from a GPS, pointing the antenna to the Sun, initiating system calibration, starting andstopping the observations at preset times, data acquisition, and archiving on DVD. We can also control the whole systemthrough modem or Internet. The instrument can be used either by itself to study the onset and evolution of solar radiobursts and associated interplanetary phenomena or in conjunction with other instruments.� 2006 Elsevier Ltd. All rights reserved.
Keywords: Instrumentation; Solar radio astronomy; Solar radio bursts; Radiospectrograph
0263-2241/$ - see front matter � 2006 Elsevier Ltd. All rights reserved
doi:10.1016/j.measurement.2006.11.010
* Corresponding author. Tel.: +30 2231060181.E-mail addresses: [email protected] (A. Kontogeorgos),
[email protected] (P. Tsitsipis), [email protected] (C. Carou-balos), [email protected] (X. Moussas), [email protected] (P. Preka-Papadema), [email protected] (A. Hilaris),[email protected] (V. Petoussis), [email protected] (J.-L. Bou-geret), [email protected] (C.E. Alissandrakis), [email protected] (G. Dumas).
1. Introduction
Radio Spectrography of the solar corona, at deci-meter, meter and decameter wavelengths, providesbasic information on the origin and early evolutionof many phenomena that later extend and some ofthem reach the Earth. The ARTEMIS-IV (Appareilde Routine pour le Traitement et l’ EnregistrementMagnetique de l’ Information Spectral) solar radiospectrograph at Thermopylae is a complete system
.
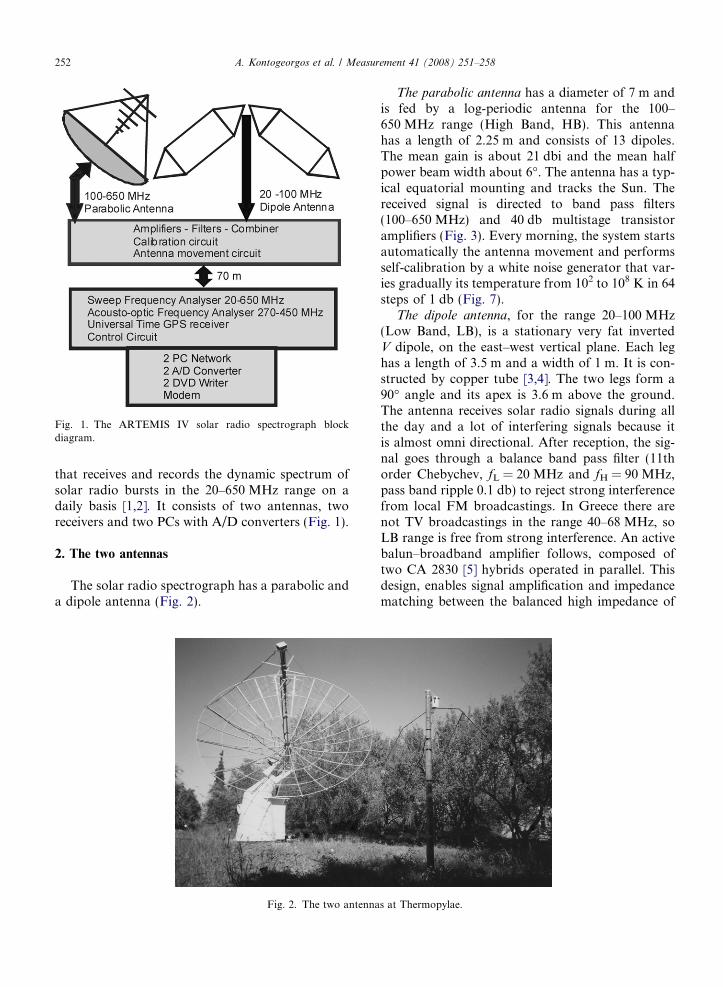
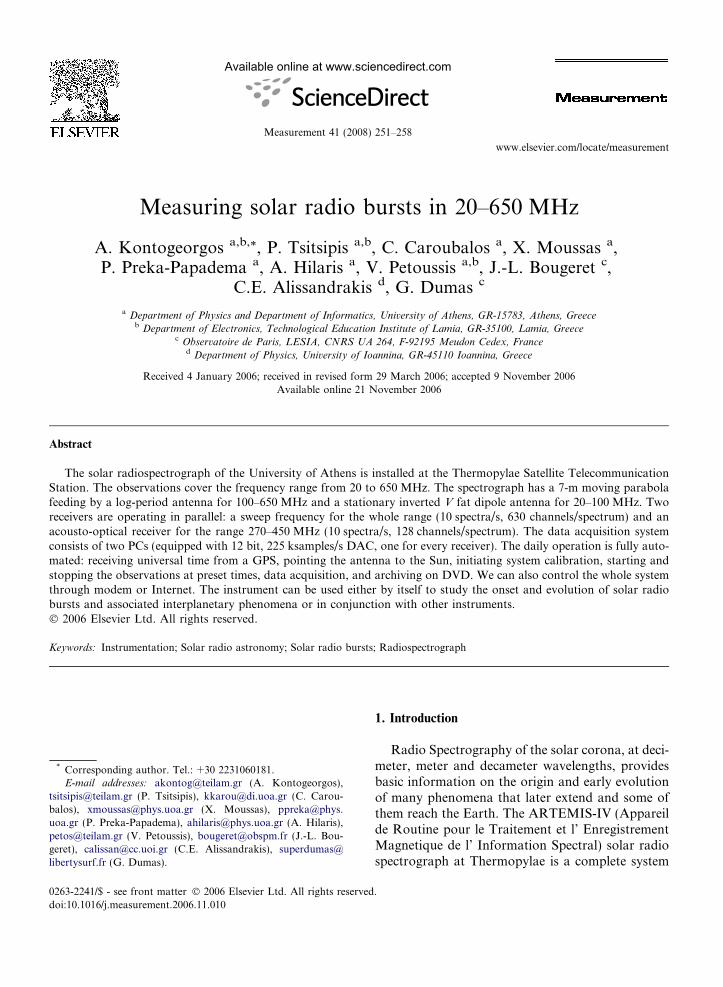
Fig. 1. The ARTEMIS IV solar radio spectrograph blockdiagram.
252 A. Kontogeorgos et al. / Measurement 41 (2008) 251–258
that receives and records the dynamic spectrum ofsolar radio bursts in the 20–650 MHz range on adaily basis [1,2]. It consists of two antennas, tworeceivers and two PCs with A/D converters (Fig. 1).
2. The two antennas
The solar radio spectrograph has a parabolic anda dipole antenna (Fig. 2).
Fig. 2. The two antenna
The parabolic antenna has a diameter of 7 m andis fed by a log-periodic antenna for the 100–650 MHz range (High Band, HB). This antennahas a length of 2.25 m and consists of 13 dipoles.The mean gain is about 21 dbi and the mean halfpower beam width about 6�. The antenna has a typ-ical equatorial mounting and tracks the Sun. Thereceived signal is directed to band pass filters(100–650 MHz) and 40 db multistage transistoramplifiers (Fig. 3). Every morning, the system startsautomatically the antenna movement and performsself-calibration by a white noise generator that var-ies gradually its temperature from 102 to 108 K in 64steps of 1 db (Fig. 7).
The dipole antenna, for the range 20–100 MHz(Low Band, LB), is a stationary very fat invertedV dipole, on the east–west vertical plane. Each leghas a length of 3.5 m and a width of 1 m. It is con-structed by copper tube [3,4]. The two legs form a90� angle and its apex is 3.6 m above the ground.The antenna receives solar radio signals during allthe day and a lot of interfering signals because itis almost omni directional. After reception, the sig-nal goes through a balance band pass filter (11thorder Chebychev, fL = 20 MHz and fH = 90 MHz,pass band ripple 0.1 db) to reject strong interferencefrom local FM broadcastings. In Greece there arenot TV broadcastings in the range 40–68 MHz, soLB range is free from strong interference. An activebalun–broadband amplifier follows, composed oftwo CA 2830 [5] hybrids operated in parallel. Thisdesign, enables signal amplification and impedancematching between the balanced high impedance of
s at Thermopylae.

Fig. 3. Block diagram of the two antennas and the cabin.
A. Kontogeorgos et al. / Measurement 41 (2008) 251–258 253
the dipole antenna and the unbalanced 50 Ohmtransmission line.
A combiner combines the signals from the twoantennas, and drives them to the control roomthrough a 50 Ohm, 70 m long, low loss transmissionline (Fig. 3).
3. The two receivers and data acquisition
The combined signal enters into the controlroom, through the transmission line, and it is
Fig. 4. Block diagram of
equally divided by a splitter in two paths (Fig. 3)and (Fig. 4).
First path (Fig. 4): It includes a classical sweepfrequency analyzer (Analyseur de Spectre Global,ASG) and a PC (ASG PC) equipped with 12-bit(4096 level) ADC card (Keithley KPCI 3100, [6]).The frequency analyser covers the whole range from20 to 650 MHz at 10 sweeps/s (or one spectrum in100 ms) with instantaneous bandwidth 1 MHz anddynamic range of 70 db.
A pulse from a timer on the ADC card triggersevery sweep (Fig. 5). The analogue output from
the control room.
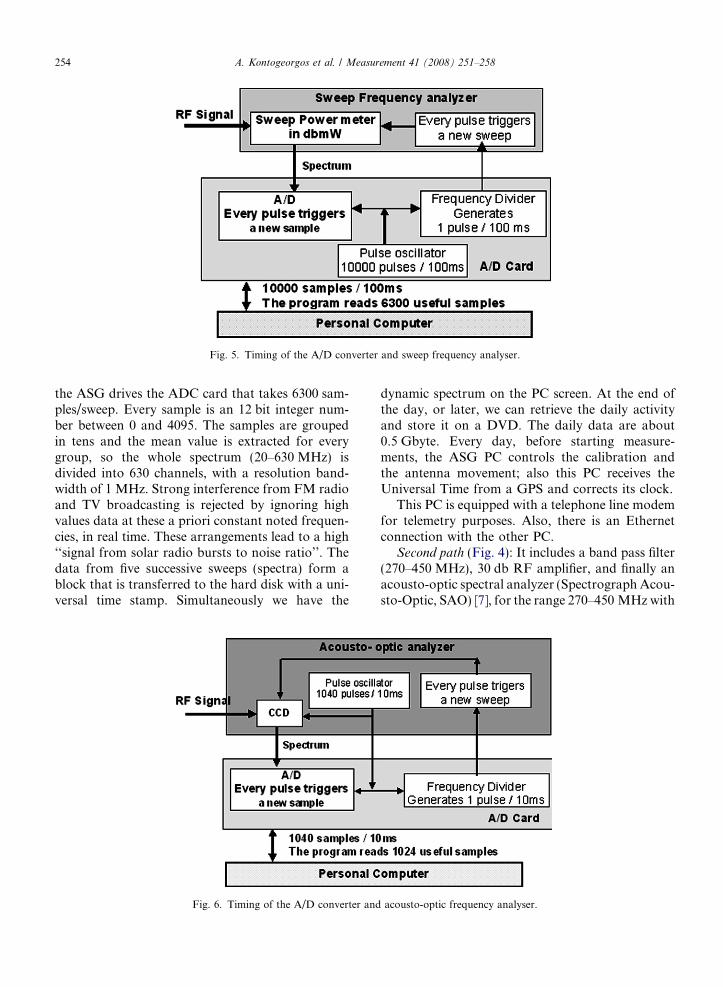
Fig. 5. Timing of the A/D converter and sweep frequency analyser.
254 A. Kontogeorgos et al. / Measurement 41 (2008) 251–258
the ASG drives the ADC card that takes 6300 sam-ples/sweep. Every sample is an 12 bit integer num-ber between 0 and 4095. The samples are groupedin tens and the mean value is extracted for everygroup, so the whole spectrum (20–630 MHz) isdivided into 630 channels, with a resolution band-width of 1 MHz. Strong interference from FM radioand TV broadcasting is rejected by ignoring highvalues data at these a priori constant noted frequen-cies, in real time. These arrangements lead to a high‘‘signal from solar radio bursts to noise ratio’’. Thedata from five successive sweeps (spectra) form ablock that is transferred to the hard disk with a uni-versal time stamp. Simultaneously we have the
Fig. 6. Timing of the A/D converter and
dynamic spectrum on the PC screen. At the end ofthe day, or later, we can retrieve the daily activityand store it on a DVD. The daily data are about0.5 Gbyte. Every day, before starting measure-ments, the ASG PC controls the calibration andthe antenna movement; also this PC receives theUniversal Time from a GPS and corrects its clock.
This PC is equipped with a telephone line modemfor telemetry purposes. Also, there is an Ethernetconnection with the other PC.
Second path (Fig. 4): It includes a band pass filter(270–450 MHz), 30 db RF amplifier, and finally anacousto-optic spectral analyzer (Spectrograph Acou-sto-Optic, SAO) [7], for the range 270–450 MHz with
acousto-optic frequency analyser.

A. Kontogeorgos et al. / Measurement 41 (2008) 251–258 255
25 db dynamic linear range, very good frequency res-olution of 200 kHz and very fast frame rate of 100 Hz(one frame or spectrum in 10 ms). There is also a PCequipped with 12-bit ADC card (Keithley KPCI3100, [6]). Every 10 ms the ADC takes 1024 samplesfrom the SAO analogue output (Fig. 6). Eight sam-ples together form a group and the mean value isextracted for every group, so the range 270–450 MHz is divided into 128 channels with a resolu-tion bandwidth 1.4 MHz. This arrangement leadsto a high ‘‘signal from solar radio bursts to noiseratio’’. The data from 50 successive sweeps (spectra)form a block that is transferred to the hard disk witha universal time stamp. Simultaneously we have the
Fig. 7. Dynamic spectrum from the ASG. The calibration signalis shown at the left. The circle marks a type III solar radio burst.Black or grey horizontal lines are strong interference from FMradio and TV broadcastings at constant frequencies. Grey scaleon the right is in arbitrary units.
Fig. 8. The influence of the moving median filtering on dynamic spectruconstant bandwidth 5. (c) Moving median filtering with constant bandw(e) Moving median filtering with variable bandwidth. Large bandwidthburst. Small bandwidth allows details in the solar radio burst but candivided in regions and we apply moving median filtering with variable650 MHz with bandwidth 2, 17 and 25 respectively.
dynamic spectrum on the PC screen. At the end ofthe day or later we can retrieve the daily activityand storage it on a DVD. The daily data are about1 Gbyte. The Universal Time is received every morn-ing from the other PC through the Ethernetconnection.
Fig. 7 shows an example of ASG dynamic spec-trum in grey scale (black for strong signals andwhite for weak). On the left we see the calibrationsignal from the noise generator, in the middle(inside the circle) a type III solar radio burst [10]and on the right the greyscale. Horizontal black orgrey lines indicate strong FM radio and TV interfer-ence at constant frequencies.
4. Calibration
Calibration is performed to derive the relation-ship between the flux density (W m�2 Hz�1, or SolarFlux Unit, 1SFU = 10�22 W m�2 Hz�1) that arrivesfrom the solar radio burst at the antenna site, andall possible data values (0-4095) for 630 channels,from 20 to 650 MHz with 1 MHz bandwidth. Itconsists of two steps, step one for the LB and steptwo for the HB.
Step one: We find the relationship between theflux density and all possible data values with theaid of technical specifications of the LB antenna,
m. (a) Initial dynamic spectrum. (b) Moving median filtering withidth 15. (d) Moving median filtering with constant bandwidth 25.rejects all the interference and a lot of details in the radio solar
not reject interference. Using variable bandwidth the spectrum isbandwidth as follows: region 20–80 MHz, 80–400 MHz and 400–
256 A. Kontogeorgos et al. / Measurement 41 (2008) 251–258
filters, amplifier, transmission line, ASG and ADCcard.
Step two: First, the antenna temperature is derivedfrom the recorded values of the calibration signal andthe known noise temperature of the noise generator.
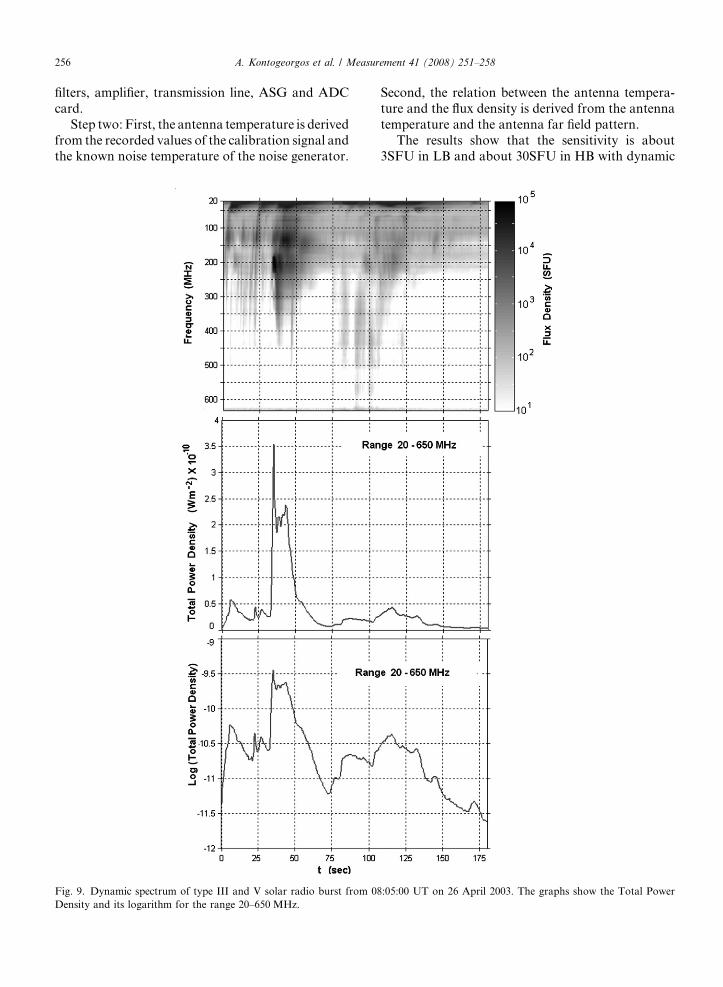
Fig. 9. Dynamic spectrum of type III and V solar radio burst from 0Density and its logarithm for the range 20–650 MHz.
Second, the relation between the antenna tempera-ture and the flux density is derived from the antennatemperature and the antenna far field pattern.
The results show that the sensitivity is about3SFU in LB and about 30SFU in HB with dynamic
8:05:00 UT on 26 April 2003. The graphs show the Total Power

A. Kontogeorgos et al. / Measurement 41 (2008) 251–258 257
range of 45 db. We can thus detect only solar radiobursts and no radio signal from the quite Sun thatproduces lower flux density.
Detecting the noise from the Galactic Center inLB, and finding values that are referred in bibliogra-phy [8] checks the method of calibration.
5. Data processing
Data processing involves filtering the signal toremove interference and finding the flux density of
Fig. 10a. Dynamic spectrum of a large solar event recorded by ASG frois in arbitrary units.
Fig. 10b. Detail of the Fig. 10a, shows the time differential dynamic speAscending and descending lines are produced by ascending and descen
Fig. 11a. Dynamic spectrum of the same large solar event recorded by Sthe right is in arbitrary units.
Fig. 11b. Detail of the Fig. 11a, shows the time differential dynamic speGrey scale on the right is in arbitrary units.
the dynamic spectrum and the power density(W m�2) for the whole range from 20 to 650 MHz.Filtering is achieved by using, for every spectrum,moving median filters with variable bandwidth,Fig. 8 shows an example. Using calibration valueswe derive the dynamic spectrum flux density inSFU and the total power density in W m�2 for thewhole range 20–650 MHz. An example is shown inFig. 9.
The time and frequency resolution of the instru-ment in conjunction with a low noise level permit
m 10:02:00 to 10:12:00 on 28 October 2003. Grey scale on the right
ctrum from 10:02:00 to 10:04:00, derived after special 2D filtering.ding electron beams in the solar corona.
AO from 10:02:00 to 10:10:00 on 28 October 2003. Grey scale on
ctrum from 10:02:00 to 10:04:00, derived after special 2D filtering.

258 A. Kontogeorgos et al. / Measurement 41 (2008) 251–258
the detection of fine structures [9]. Fig. 10a showsthe dynamic spectra of a 10 min large solar radioevent on 28/10/2004 recorded by ARTEMIS IVASG solar radio spectrograph. Grey scale on theright shows the signal intensity in arbitrary units.Fig. 10b is a 2 min small part of the above event,it shows the differential dynamic spectrum derivedafter special 2D filtering where we can distinguishfine structure which indicates ascending anddescending electron beams in the solar corona. Figs.11a and 11b shows the same event as recorded bySAO in the 270–450 MHz band where more detailsare distinguished in the frequency and time domain.
6. Conclusions and perspectives
We have designed and constructed a system, withtwo antennas and a frequency sweep radio spectro-graph, that observes solar radio bursts in the range20–650 MHz with time resolution 100 ms, frequencyresolution 1 MHz, sensitivity 3 SFU and 30 SFU inthe 20–100 MHz and 100–650 MHz range respec-tively. Using an acousto-optic radio spectrographin the range 270–450 MHz, time resolution is10 ms and frequency resolution is 1.4 MHz.
Future perspectives are the use of the instrumentfor routine observations of solar radio bursts, theconstruction of new dipole antennas perpendicularto the present so that we can make polarimetricmeasurements, as well as the extension of the SAOfrequency range.
Acknowledgements
This work was supported in part by the programPLATON N� 05341PJ for the French–Greek collab-
oration and the program EPEAEK of the GreekMinistry of Education and Religious Affairs andthe European Union in the framework of the re-search project Archimedes II: ‘‘Receiving and Pro-cessing the Signal from Solar Radio Bursts’’.
References
[1] C. Caroubalos, D. Maroulis, N. Patavalis, J.-L. Bougeret, G.Doumas, C. Perche, C. Alissandrakis, A. Hillaris, X.Moussas, P. Preka-Papadema, A. Kontogeorgos, P. Tsitsi-pis, G. Kanelakis, The new multichannel radiospectrograph,ARTEMIS-IV/HECATE of the University of Athens,Experimental Astronomy 11 (2001) 23–32.
[2] C. Caroubalos, A. Hillaris, C. Bouratzis, C. Alissandrakis, P.Preka-Papadema, J. Polygiannakis, P. Tsitsipis, A. Konto-georgos, X. Moussas, J.-L. Bougeret, G. Doumas, C. Perche,Solar type II and type IV radio bursts observed during 1998–2000 with the ARTEMIS IV radiospectrograph, Astronomyand Astrophysics 413 (2004).
[3] William C. Erickson, Professor at Utas University ofAustralia, private communication.
[4] <http://www.lofar.org>.[5] Motorola, RF Device Data Volume II and CA 2830 data
sheet, 1991.[6] Keithley KPCI 3100 ADC manual.[7] N. Berg, J. Pellegrino, Acousto-optic Signal Processing,
Marcel Dekker Inc., New York, 1996.[8] H. Cane, Spectra of the non-thermal radio radiation from
the galactic polar regions, MNRAS 189 (1979) 465.[9] P. Tsitsipis, A. Kontogeorgos, C. Caroubalos, X. Moussas,
C. Alissandrakis, A. Hillaris, P. Preka-Papadema, J. Polygi-annakis, J.-L. Bougeret, G. Doumas, C. Perche, ARTEMISIV radio observations of the 14 July 2000 large solar event,Solar Physics 204 (2001) 165–179.
[10] D. McLean, N. Labrum (Eds.), Solar Radiophysics, Cam-bridge University Press, Cambridge, 1985.