2009 cotton crop review
DESCRIPTION
2009 Cotton Crop Review. Dr. Chris Main Extension Cotton Specialist, University of Tennessee J.C. Banks, T. Barber, R. Boman, D. Boquet, C. Burmester, G. Collins, D. Dodds, S. Duncan, K. Edmisten, R. Hutmacher, M. Jones, D. Monks, G. Morgan, R. Norton, G. Stevens, J. Whitaker, D. Wright . - PowerPoint PPT PresentationTRANSCRIPT
Beltwide Prod. Conf.1/6/2010
2009 Cotton Crop Review
Dr. Chris MainExtension Cotton Specialist, University of Tennessee
J.C. Banks, T. Barber, R. Boman, D. Boquet, C. Burmester, G. Collins, D. Dodds, S. Duncan, K. Edmisten, R. Hutmacher, M. Jones, D. Monks, G. Morgan, R. Norton, G. Stevens, J. Whitaker, D. Wright

Beltwide Prod. Conf.1/6/2010
U.S. Cotton Production
2000 2001 2002 2003 2004 2005 2006 2007 2008 20094000
6000
8000
10000
12000
14000
16000
Planted Acres Harvested Acres
Acre
s x 1
000 -35%

Beltwide Prod. Conf.1/6/2010
U.S. Cotton Acres
Reduced >15%Reduced 1-14%
Increased >15%
No ChangeIncreased 1-14%
Change from 2008 - 2009

Beltwide Prod. Conf.1/6/2010
U.S. Cotton Production
20002001
20022003
20042005
20062007
20082009
400
500
600
700
800
900
626
694652
723
843 825 806864
803774
US Yield Average
Lbs/
ac
Beltwide Prod. Conf.1/6/2010
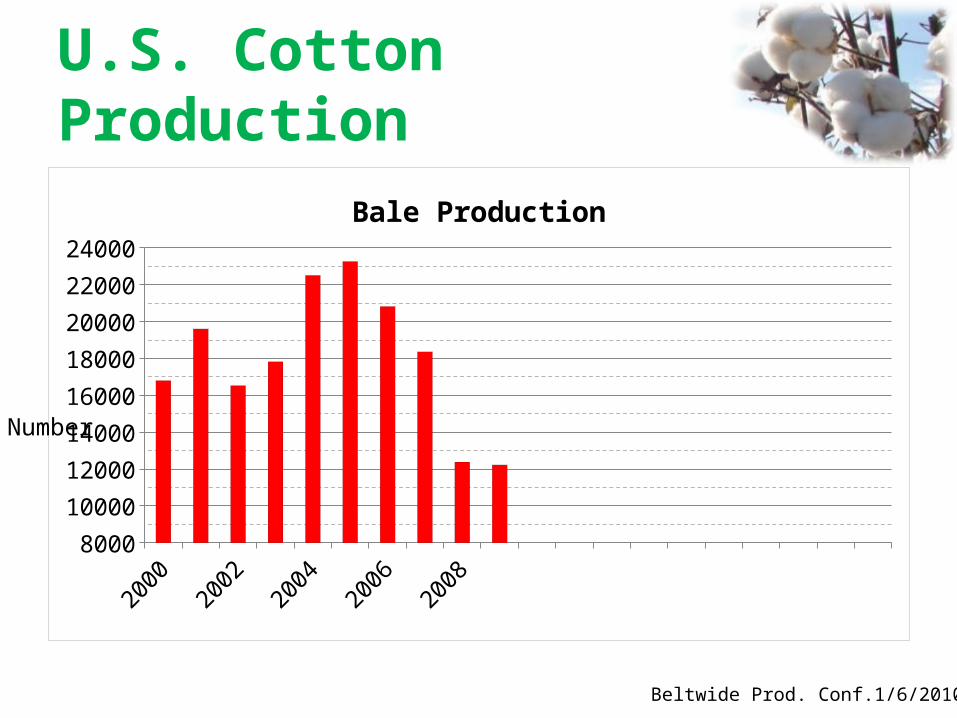
U.S. Cotton Production
20002001
20022003
20042005
20062007
20082009
8000
10000
12000
14000
16000
18000
20000
22000
24000
Bale Production
Num
ber

Beltwide Prod. Conf.1/6/2010
Outline
Region by RegionStatisticsGeneral observationsQuotes

Beltwide Prod. Conf.1/6/2010
Southeast65,000 acres
900 lb/ac
1,000,000 acres907 lb/ac
115,000 acres842 lb/ac
375,000 acres986 lb/ac
82,000 acres665 lb/ac
255,000 acres710 lb/ac

Beltwide Prod. Conf.1/6/2010
Pigweed still a problem
Late planting and poor harvest conditions renders top crop unharvestable in some areas
K deficiency and leaf-spot
Georgia
Beltwide Prod. Conf.1/6/2010
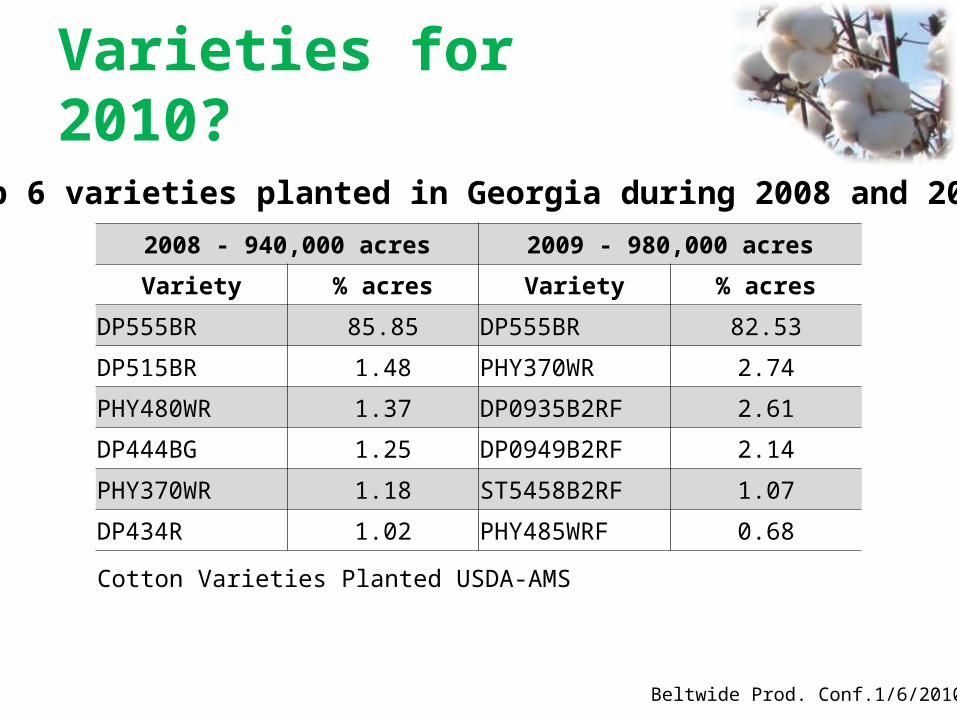
Varieties for 2010?
Cotton Varieties Planted USDA-AMS
Top 6 varieties planted in Georgia during 2008 and 20092008 - 940,000 acres 2009 - 980,000 acres
Variety % acres Variety % acres
DP555BR 85.85 DP555BR 82.53
DP515BR 1.48 PHY370WR 2.74
PHY480WR 1.37 DP0935B2RF 2.61
DP444BG 1.25 DP0949B2RF 2.14
PHY370WR 1.18 ST5458B2RF 1.07
DP434R 1.02 PHY485WRF 0.68

Beltwide Prod. Conf.1/6/2010
Alabama
“It rained a lot here, then it didn't, then it rained a lot. Oh yeah, it's still raining.”• Dale Monks

Beltwide Prod. Conf.1/6/2010
Florida
“We had 85,000 acres and that is expected to go up this coming year with higher prices. However, we are going to have to get out this years (2009) crop first.”• David Wright

Beltwide Prod. Conf.1/6/2010
Mid-South
275,000 acres949 lb/ac
295,000 acres758 lb/ac
300,000 acres891 lb/ac
230,000 acres704 lb/ac
520,000 acres826 lb/ac
Beltwide Prod. Conf.1/6/2010
Mid-South
Wet spring, late planted, reduced acresCooler and wetter than average summer• Reduced heat unit accumulationExtraordinary crop potential in SeptemberRain, rain go away…. (9/12-11/04)Earliness penalty, boll rot and hard lockLate planting penalty, immature bolls • Tom Barber, Gene Stevens, Darrin Dodds,

Beltwide Prod. Conf.1/6/2010
May 22, 2009

Beltwide Prod. Conf.1/6/2010

Beltwide Prod. Conf.1/6/2010

Beltwide Prod. Conf.1/6/2010

Beltwide Prod. Conf.1/6/2010

Beltwide Prod. Conf.1/6/2010

Beltwide Prod. Conf.1/6/2010

Beltwide Prod. Conf.1/6/2010
Arkansas Production (USDA Report)
1983
1984
1985
1986
1987
1988
1989
1990
1991
1992
1993
1994
1995
1996
1997
1998
1999
2000
2001
2002
2003
2004
2005
2006
2007
2008
2009
0
500
1000
1500
2000
2500Cotton (1000 bales)

Beltwide Prod. Conf.1/6/2010
Louisiana
Better than average crop in SeptemberEst. 1000 lb/ac, actual 700 lb/ac$81,000,000 in losses (wet harvest), underestimated230,000 ac is 23% of high in mid- 1990’sOnly 30 gins open in 2009• Don Boquet

Beltwide Prod. Conf.1/6/2010
Southwest
31,400acres936 lb/ac
5,000,000 acres650 lb/ac
200,000 acres837 lb/ac
36,000 acres720 lb/ac

Beltwide Prod. Conf.1/6/2010
Oklahoma
“Strong summer, but a weak finish”• J.C. Banks
• Planted late (dry winter)• Timely summer rains, lacked rain during
August in Southern areas• Immature bolls from cooler wetter fall (dry
land and irrigated)• Reduced fiber quality from weather

Beltwide Prod. Conf.1/6/2010
Texas (Plains)
Similar to Oklahoma“Cool September and early freezes in some areas have mic values declining and bark contamination trending up.”• Randy Boman

Beltwide Prod. Conf.1/6/2010
Dryland – PlainsGenerally Spotty Light Rains Across Most Dryland Areas

Beltwide Prod. Conf.1/6/2010
Center Pivot Irrigation - Plains

Beltwide Prod. Conf.1/6/2010
“Not bad for cotton that should not be here.”- R. Boman

Beltwide Prod. Conf.1/6/2010
Beltwide Prod. Conf.1/6/2010
Texas (South)
lack of precipitation for establishment and throughout the growing season;volunteer cotton management in the corn/cotton or sorghum/cotton rotations;harvest challenges due to prolonged wet weather at harvest time. • Gaylon Morgan

Beltwide Prod. Conf.1/6/2010
May 15, 2009
http://drought.unl.edu/DM/MONITOR.html
U.S. Drought Monitor

Beltwide Prod. Conf.1/6/2010
Texas Districts

Beltwide Prod. Conf.1/6/2010
TEXAS UPLAND COTTON DISTRICT ESTIMATES, 2008 AND 2009 1/
DistrictsPlanted Acres Harvested Acres Yield Per Acre Production2008 2009 2008 2009 2008 2009 2008 20091,000 acres 1,000 acres Pounds 1,000 bales
N. High Pl. 616.4 595.0 554.2 505.0 864.0 998.0 997.3 1,050.0S. High Pl. 2,648.5 2,685.0 1,350.1 2,025.0 683.0 676.0 1,920.6 2,850.0
N. Low Pl. 348.5 325.0 247.8 280.0 526.0 531.0 271.7 310.0S. Low Pl. 473.8 505.0 416.6 450.0 464.0 373.0 402.9 350.0Blacklands 89.7 60.0 89.1 59.0 491.0 488.0 91.1 60.0E. Plateau 178.4 175.0 122.0 160.0 605.0 405.0 153.8 135.0S. Central 61.8 50.0 52.7 30.0 640.0 480.0 70.3 30.0Coastal Bend 276.3 340.0 221.3 20.0 563.0 480.0 259.4 20.0
Upper Coast 119.4 90.0 117.5 85.0 696.0 452.0 170.3 80.0Lower Valley 97.8 75.0 21.4 30.0 413.0 640.0 18.4 40.0Other districts 89.4 100.0 57.3 56.0 789.0 643.0 94.2 75.0
STATE 5,000.0 5,000.0 3,250.0 3,700.0 657.0 649.0 4,450.0 5,000.0
1/ Preliminary, December, 2009.
Beltwide Prod. Conf.1/6/2010
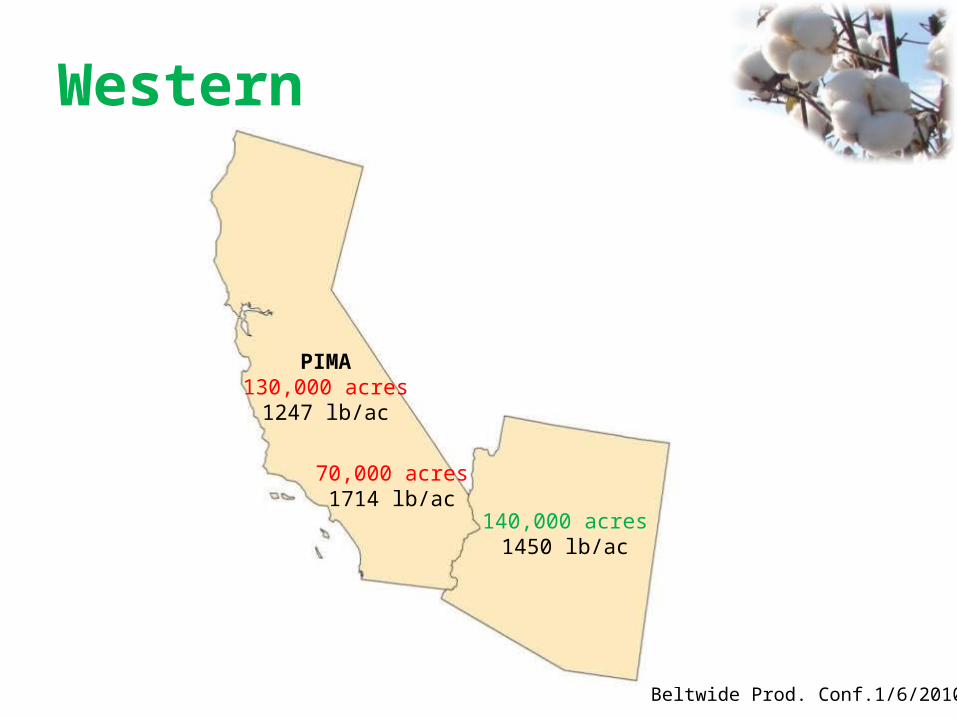
Western
70,000 acres1714 lb/ac
140,000 acres1450 lb/ac
PIMA130,000 acres
1247 lb/ac

Beltwide Prod. Conf.1/6/2010
Arizona
Intermittent weather patterns. Excellent planting conditions for majority of cropCooler than average June. Higher incidence of verticillium wilt particularly in the low desertHeat returned with a vengeance (July and August) much warmer and drier than averageHigher than average yields and good quality

Beltwide Prod. Conf.1/6/2010
Arizona
Nearing end of Pink Bollworm Eradication Program. Upland Cotton >95% Bt Cotton (>70% Bollgard II)Forage and dairy industry experiencing large reduction in forage crop plantings and intentions for 2010Likely to shift back to cotton for 2010. As much as 25% increase in cotton acreage for 2010• Randy Norton

Beltwide Prod. Conf.1/6/2010
California
Water issues continueBoth Pima (-19%) and upland (-40%) acres declined 2009Increase in acres expected 2010• Lower processing tomato prices• More Pima acreage due to RRFlex offering

Beltwide Prod. Conf.1/6/2010
2009 Cotton Marketce
nts/
lb
Dec Jan Feb Mar Apr May Jun Jul Aug Sep Oct Nov40
45
50
55
60
65
70
75
"A" Index Price

Beltwide Prod. Conf.1/6/2010
2010 Expectations
Optimism for increased acres • Strengthening cotton prices• Increasing world demand• World production lower in 2009Lower competing commodity prices• Corn, soybean and wheat • Forages in Arizona• Tomatoes in California

Beltwide Prod. Conf.1/6/2010