don ethridge. cotton quality crop of 1988 - texas · pdf filedon ethridge. cotton quality crop...
TRANSCRIPT

Don Ethridge.
COTTON QUALITY
CROP OF 1988
UNITED STATES DEPARTMENT OF AGRICULTURE
Agricultural Marketing Service Cotton Division
Memphis, Tennessee
Vol. 62, No. 7 July 1989
CONTENTS
Table Page
Introduction . . . . . . . . . . . . . . . . . . . . . . . . . . . . . . . . . 1
1. Grade and staple of upland cotton classed in the United States, 1988 crop . . 2
2. Grade and staple of upland cotton classed in the United States, 1987 crop . . 3
3. Percentage distribution of grade and staple for upland cotton classed through specified periods in the United States, 1988 crop .............. 4
4. Grade reductions by specified causes of upland cotton classed in the United
States, by states, 1988 crop . . . . . . . . . . . . . . . . . . . . . . . . . 5
5. Tenderability of upland cotton classed, by states, 1988 crop . . . . . . . . . 6
6. Tenderability of upland cotton classed in the United States, 1969-1988 crops 6
7. Percentage distribution of grade, staple, mike and fiber strength for upland
cotton classed, by states, 1988 crop . . . . . . . . . . . . . . . . . . . . . 7-20
8, Percentage distribution of grade and staple for upland cotton classed through
specified periods, by states, 1988 crop . . . . . . . . . . . . . . . . . . . 21-27
9. Percentage distribution of grade and staple for upland cotton classed by
classing offices, 1988 crop . . . . . . . . . . . . . . . . . . . . . . . . . 28-33
10. Percentage distribution of mike ranges for upland cotton classed through
specified periods, by states and United States, 1988 crop . . . . . . . . . . 34-37
11. Percentage distribution of mike ranges for upland cotton classed in the United States, by classing offices, 1988 crop ................38
12. Percentage distribution of fiber strength groupings for upland cotton classed through specified periods, by states and United States, 1988 crop ......39-42
13. Percentage distribution of fiber strength groupings for upland cotton classed
in the United States, by classing offices, 1988 crop . . . . . . . . . . . . . 43
14. Percentage distribution of the uniformity index for upland cotton classed,
by states and United States, 1988 crop . . . . . . . . . . . . . . . . . . . . 44
15. Grade and staple of American Pima cotton classed in the United States, 1988
crop..................................... 45
16. Percentage distribution of grade and staple for American Pima cotton classed
through specified periods, in the United States, 1988 crop . . . . . . . . . . 45
17. Percentage distribution of grade and staple for American Pima cotton classed,
by states, 1988 crop . . . . . . . . . . . . . . . . . . . . . . . . . . . . . 46
18. Percentage distribution of mike for American Pima cotton classed in the United States, by states, 1988 crop .....................47
UNITED STATES DEPARTMENT OF AGRICULTURE AGRICULTURAL MARKETING SERVICE
COTTON DIVISION, MARKET NEWS BRANCH 4841 SUMMER AVENUE - MEMPHIS. TN 38122
TELEPHONE 901-521-2931

COTTON QUALITY - UNITED STATES 1988 Crop
Grade. Grade 31 was the predominant grade of upland cotton classed from the 1988 crop. This grade accounted for 36 percent of classings, the largest proportion since 1958, and compares with 23 percent last year. Grade 41 was the predominant grade in 1987 comprising 30 percent of classings. Grades 31 and higher, at 43 percent, accounted for the largest percentage of classings since 1961 and compares with 27 percent a year earlier. Grades 41 and higher comprised 76 percent of classings. This was the largest percentage in these grades since 1958 and relates to 59 percent in 1987. All white grades made up 82 percent of classings, the largest proportion since 1958, and was up from 70 percent the previous year. Light Spotted grades made up 16 percent of the 1988 crop, the smallest percentage since 1958 when records were established, and compares with 25 percent last year. Spotted grades accounted for 1 percent, down from 3 percent a year ago. Below Grade, Tinged, Stained, and other colored grades made up 1 percent of classings, down from 2 percent last year.
Staple. The average staple length of upland cotton classed from the 1988 crop was 34.5 thirty-seconds inches, down slightly from 34.6 a year earlier. The predominant staple was shared between staples 35 and 36, each accounting for 25 percent of classings. Staple 35 was the predominant length last year accounting for 36 percent of classings and staple 36 comprised 24 percent. Staples 31 and shorter made up 9 percent of classings this season and 3 percent in 1987. Staples 32 and 33 made up 20 percent of the crop, the largest proportion since 1979, and was up from 16 percent last year. Staples 34 and 35, at 36 percent, comprised the smallest proportion since the crop of 1984, and compares with 55 percent in 1987. Staples 36 and longer made up 36 percent of classings, the largest percentage since 1984, compared with 27 percent a year earlier.
Mike. Cotton with mike 35-49 accounted for 87 percent of upland classings from the 1988 crop. This was the largest proportion in this range since 1982 and was up from 80 percent a year earlier. Cotton with mike 34 and lower comprised 10 percent, down from 17 percent in 1987. Cotton with mike of 50 and higher accounted for about 3 percent of the crop and was the smallest percentage since records began in 1965. Average mike was 41, the same as the previous year.
Strength. The average fiber strength of upland cotton classed from the 1988 crop was 25.8 grams per tex. This was the weakest average since 1985 and compares with 27.1 last year. Strengths in the 19 and lower range accounted for 1 percent of classings against less than 1 percent in 1987. Cotton with strengths of 20 to 23 grams per tex made up 17 percent, the largest proportion since 1985, and compares with 8 percent last year. Cotton with strengths of 24 to 27, at 57 percent, contained the largest proportion in this range since 1983 and was up from 51 percent a year ago. About 26 percent of classings had strengths in the 28 and higher range, up from 41 percent the previous year.
Uniformity. The uniformity index for upland cotton classed from the 1988 crop averaged 80.5. Uniformity in the 79 to 81 range, at 59 percent, made up the majority of classings. About 12 percent of classings had a uniformity index of 76 to 78 and about 1 percent of classings measured lower than 76. Uniformity in the 82 to 84 range was 28 percent and about 1 percent of classings measured above 84.
American Pima. The average grade of American Pima cotton classed from the 1988 crop was 3.3 against 3.5 in 1987. Grades 3 and higher made up 65 percent of classings, up from 58 percent last year. Grade 3 was the predominant grade both years, accounting for 57 percent and 48 percent in 1988 and 1987, respectively. The average staple length was 45.5 thirty-seconds inches against 45.6 a year ago. Staple 46 was the predominant length both years comprising 58 percent of classings this season and 80 percent in 1987. Average mike was 39 compared with 40 in 1987. The 1988 American Pima crop set a new record high, 17 percent above the previous record in 1987.
Ginnings of 1988-crop cotton in the United States totaled 14,984,537 running bales, according to the Bureau of the Census. This total includes 14,660,790 bales of upland and 323,747 bales of American Pima cotton. The number of active gins for the 1988 crop was 1,645 against 1,653 for 1987 and 1,662 for 1986.
July 7, 1989

Table 1. -- Grade and staple of upland cotton classed in the United States, 1988 crop
Staple
Grade : 26 and : : : : : : : : : : : : : 40 and : All staples :shorter: 28 : 29 : 30 : 31 : 32 : 33 : 34 35 : 36 : 37 : 38 : 39 :longer:
White: Bales Bales Bales Bales Bales Bales Bales Bales Bales Bales Bales Bales Bales Bales Bales Pct. 11 - 3 33 221 1,034 1,704 1,868 1,166 1,401 1,705 389 15 - - 9,540 0.1 21 121 787 5,244 249 925 92,281 155,092 160,754 83,466 94,022 341,268 135,112 2,343 77 2 1,095,494 7.6 30 - 10 83 306 1,163 1,616 1,572 980 733 3,776 4,378 172 17 2 14,807 0.1 31 463 3,930 22,371 106,552 366,397 574,117 589,111 462,049 835,587 1,347,458 800,127 21,219 1,383 218 5,130,992 35.5 40 108 968 4,965 19,364 56,358 86,965 41,874 28,037 46,241 55,967 58,615 2,660 186 22 382,339 2.6 41 373 2,843 13,302 56,350 185,560 286,852 315,459 508,499 1,581,563 1,117,790 313,858 19,305 1,570 226 4,4039 551 30.4 50 19 184 614 1,981 4,709 6,098 5,389 7,585 41,440 44,240 11,801 912 88 9 125,071 0.9 51 74 638 3,012 11,682 36,876 61,266 64,857 84,322 201,504 178,069 43,987 2,927 215 29 689,458 4.8 60 - - 2 10 17 22 35 118 421 574 129 7 - - 1,336 * 61 5 60 305 1,146 3,531 6,528 7,719 10,604 16,377 12,316 2,880 176 9 1 61,657 0.4 70 - - - 3 2 5 1 3 6 11 3 - - - 34 * 71 1 2 9 57 245 458 745 821 1,058 802 228 9 - - 4,434 *
Total 1,165 9,426 49,941 222,597 748,184 1,160,724 1,189,383 1,187,650 2,820,353 3,103,986 1,371,508 49,744 3,545 509 11,918,715 82-.4
Light Spotted: 12 - 1 18 41 118 182 151 79 27 11 5 - - - 633 * 22 13 376 1,696 4,775 11,165 13,659 10,712 5,463 4,454 4,892 1,130 51 2 1 58,390 0.4 32 141 2,023 9,508 29,936 72,806 90,470 80,941 91,148 166,190 121,684 40,947 4,018 755 156 710,723 4.9 42 198 2,343 8,973 26,281 60,501 80,088 91,452 171,544 408,113 248,812 59,207 5,531 862 541 1,164,445 8.1 52 82 892 3,826 10,584 20,138 27,145 33,740 56,749 104,017 71,874 16,991 1,380 113 103 347,636 2.4 62 10 126 531 1,705 3,034 4,631 7,940 15,961 17,657 9,090 1,978 194 19 6 62,883 0.4
Total 444 5,762 24,552 73,321 167,763 216,175 224,936 340,944 700,458 456,363 120,260 11,174 1,751 807 2,344,711 16.2
Spotted: 13 - - 1 8 28 22 21 18 19 24 26 1 - - 169 * 23 - 16 109 241 619 774 686 483 334 285 68 1 2 - 3,616 * 33 14 168 650 1,307 2,799 3,451 4,073 3,770 5,029 2,704 739 111 37 6 24,858 0.2 43 24 281 1,179 2,367 3,960 4,818 5,976 8,387 17,231 10,964 2,682 171 43 3 58,085 0.4 53 8 129 503 1,191 1,962 2,545 3,411 4,327 6,747 4,158 1,122 81 3 - 26,188 0.2 63 - 23 88 258 546 749 1,227 1,967 2,058 1,123 265 18 3 4 8,329 0.1
Total 46 617 2,531 5,372 9,914 ---,358 15,393__ 18,952 31,418 19,259 4,900 383 88 13 121,245 0.8
Tinged: 24 - - - 7 12 8 14 8 8 11 2 - - - 70 * 34 - 13 63 151 245 263 213 191 269 283 38 2 - 5 1,735 * 44 - 10 115 259 410 379 431 664 1,333 892 183 11 - 1 4,688 * 54 1 1 30 135 290 438 381 380 782 696 216 20 - - 3,370 *
Total 1 24 209 552 957 1,088 1,039 1,244 2,392 1,882 439 33 - 6 9,864 0.1
Stained: 25 - - 1 2 - 1 - 2 3 8 - - - - 17 * 35 - - - 6 13 5 8 15 29 13 3 - - 4 96 *
Total - - 1 8 13 6 8 17 32 21 3 - - 4 113 *
Light Gray: 16 - - - - 4 - 10 14 13 9 - - - - 50 * 26 - 6 36 101 272 639 2,399 11,178 17,609 5,059 750 54 - - 38,103 0.3
36 - 5 21 56 199 579 1,504 2,684 3,174 1,656 384 3 1 2 10,268 0.1 46 - - 5 27 64 155 486 588 572 1,456 166 2 - - 3,521 *
Total - 11 62 185 539 1,373 4,398 14,464 21,367 8,180 1,300 59 1 2 51,942 0.4
Gray: 17 - - - - - - I 9 1 - - - - - ii * 27 - - 2 2 9 21 50 65 89 48 9 - - 1 297 * 37 - - 1 3 22 75 128 108 174 79 50 1 3 7 652 * 47 - 1 3 13 31 35 86 65 81 110 24 - - - 451 *
Total - 1 6 18 62 131 266 248 345 238 83 1 3 8 1,411 *
Below Grade 1/ 5 45 220 804 1,410 1,961 2,461 3,150 2,484 1,431 474 27 6 13 14,491 0.1
All grades 1,661 15,874 77,517 302,839 928,842 1,393,817 1,437,884 1,566,6663,578,850 3,591,360 1,498,963 61,421 5,392 1,362 14,462,493 100.0
Pct. all grades * 0.1 0.5 2.1 6.4 9.6 9.9 10.8 24.7 24.8 10.4 0.4 * * 100.0
1/ Lower in grade than the lowest grades of the official standards. Average staple......................... 34.5 * Less than 0.05 percent. Percent tenderable..................... 60.5
Percent Average Rule Used (API)) 1.8
MITE: Totals may not add due to rounding. Percent grade reductions ............... 8.4
-2-

Table 2. -- Grad, and staple of upland cotton classed in the United States, 1987 crop
Staple
Grad. : 26 and : : : : : : : : : : : : : 40 and All Staples :shorter: 28 : 29 : 30 : 31 : 32 : 33 : 34 : 35 : 36 : 37 : 38 : 39 :long.r:
White: Bales Bales Bales Bales Bales Bales Bales Bales Bales Bales Bales Bales Bales Bales Bales Pct. 11 - - 2 2 17 115 168 389 1,842 2,702 358 10 1 - 5,606 * 21 13 42 264 1,236 5,803 17,485 40,294 51,280 189,353 260,185 23,656 2,776 129 6 592,526 4.2 30 - - 4 25 98 208 332 425 984 2,514 395 197 6 - 5,187 * 31 106 651 3,072 11,602 44,934 119,044 277,988 528,968 1,064,322 1,078,497 100,600 19,161 2,047 122 3,251,115 23.1 40 9 98 430 1,439 4,885 10,906 19,524 39,421 85,696 63,872 7,182 980 100 15 234,557 1.7 41 111 918 3,546 13,763 52,862 135,114 294,734 797,304 1,925,355 905,043 105,818 11,752 1,860 271 4,248,451 30.2 50 3 29 119 550 2,079 4,968 10,861 37,467 150,137 59,853 7,317 389 53 11 273,832 1.9 51 33 176 714 3,222 14,509 43,253 99,709 179,256 441,703 327,808 32,057 2,115 249 33 1,144,836 8.1 60 1 - 1 3 16 58 208 619 2,080 2,679 283 - - - 5,947 * 61 2 11 69 271 1,821 6,444 16,667 22,871 34,184 23,067 2,335 118 14 3 107,878 0.8 70 - - - - 1 - 2 14 24 8 - - - - 49 a 71 - - 3 16 126 572 1,363 2,659 3,721 1,453 107 5 - - 10,026 0.1
Total 279 1,924 8,224 32,129 127,152 338,167 761,850 1,660,675 3,899,396 2,727,681 280,106 37,507 4,460 462 9,880,011 70.2
Light Spotted:
12 - - 2 1 13 15 9 22 70 2 - - - 135 a 22 6 52 155 733 2,978 7,357 14,113 11,068 10,500 5,997 1,345 207 27 4 54,543 0.4 32 94 717 3,436 13,760 52,763 128,212 262,808 294,794 260,402 125,224 28,084 5,913 1,064 84 1,177,355 8.4 42 82 609 2,628 10,699 45,073 117,311 249,144 391,696 561,793 228,968 41,979 5,551 1,188 186 1,656,906 11.8 52 34 164 684 3,013 14,023 38,807 92,584 139,385 182,813 88,306 16,905 1,912 421 73 579,124 4.1 62 4 12 90 361 1,599 5,280 14,728 28,002 30,665 10,447 1,826 155 25 2 93,176 0.7
Total 220 1,556 6,993 28,568 116,437 296,960 633,392 864,953 1,046,195 459,011 90,141 13,737 2,724 349 3,561,239 25.3
Spotted: 13 - - I - 2 9 18 23 23 3 1 - - 80 * 23 - 2 102 384 1,103 1,884 2,923 2,027 2,148 1,770 239 10 - - 12,591 0.1 33 9 97 670 3,149 10,181 18,113 28,871 24,397 19,538 11,747 1,760 194 13 2 118,741 0.8 43 16 85 458 2,015 8,825 18,813 34,231 34,457 33,999 16,282 2,933 296 39 11 152,461 1.1 53 5 46 161 732 3,410 8,913 18,978 22,128 22,468 8,988 1,938 170 47 13 87,999 0.6 63 - 9 30 101 520 1,506 4,332 6,506 7,009 2,290 362 28 3 2 22,700 0.2
Total 34 239 1,421 6,382 24,039 49,231 89,344 89,533 85,184 41,099 7,236 699 103 29 394,572 2.8
Tinged: 24 - 1 2 11 46 61 34 26 20 18 1 1 - - 221 a 34 11 40 271 900 2,191 2,822 2,552 1,487 1,420 682 58 5 1 - 12,441 0.1 44 10 61 391 1,219 3,276 4,311 4,604 3,178 2,807 1,156 166 10 2 - 21,191 0.2 54 - 13 171 488 1,456 2,427 4,160 4,139 3,597 1,175 189 17 9 1 17,843 0.1
Total 22 115 834 2,619 6,970 9,621 11,350 8,829 7,843 3,032 414 34 12 1 51,696 0.4
Stained: 25 - - - 2 1 3 - 1 2 - - - - - 9 * 35 - 7 105 288 385 188 84 47 43 21 - 3 2 1 1,175 *
Total - 7 105 290 388 191 84 48 45 21 - 3 2 1 1,184 *
Light Gray:
16 - - - - - - - 4 6 2 2 - - - 14 e 26 4 - - 1 40 176 683 1,654 8,758 9,535 917 9 1 - 21,778 0.2 36 - - 1 9 33 65 261 3,285 46,945 48,457 1,278 5 - 12 100,352 0.7 46 I - - - 3 38 96 566 8,278 9,584 218 - - - 18,784 0.1
Total 5 - 1 10 76 279 1,040 5,508 63,988 67,578 2,415 14 1 12 140,928 1.0
Gray: 17 - - - - - - - 2 - - - - - - 2 * 27 1 - - - - 3 6 135 1,116 628 39 - - - 1,930 a
37 - - - - - 4 24 192 3,896 4,134 135 - - 1 8,386 0.1 47 - - - - - - - 3 7 15 234 1,194 1,041 45 - - - 2,540 * -
Total 1 - - - 3 14 47 563 6,206 5,803 219 - - 1 12,859 0.1
Below Grade 1/ 11 37 326 1,006 1,956 3,337 7,919 13,006 10,392 2,483 386 29 12 1 40,901 0.3
All grades 571 3,879 17,905 71,004 277,019 697,800 1,505,027 2,643,1155,119,2493,306,706 380,918 52,023 7,315 857 14,083,390 100.0
Pct. all grades * * 0.1 0.5 2.0 5.0 10.7 18.8 36.3 23.5 2.7 0.4 * * 100.0
I! Lower in grade than the lowest grades of the official standards. Average staple ............................. 34.6 * Less than 0.05 percent. Percent tenderable ......................... 61.0
Percent Average Rule Used (ARU) ............ 2.2 NOTE: Totals may not add due to rounding. Percent grade reductions ................... 9.3
- 3 -

Table 3. -- Percentage distribution of grade and staple for upland cotton classed through specified periods in the United States, 1988 crop
Through Grade end Staple
September 30 October 31 November 30 December 29
Grade White:
11 * * 0.1 0.1 21 6.1 5.8 6.3 7.4 30 0.1 0.1 0.1 0.1 31 41.7 33.8 34.0 35.0 40 3.9 2.3 2.4 2.7 41 29.5 37.5 34.1 31.3 50 0.8 1.1 1.1 0.9 51 3.5 4.0 4.8 4.8 60 * * * * 61 0.3 0.2 0.3 0.4 70 * * * * 71 * * * *
Total 85.9 84.8 83.2 82.7
Light Spotted: 12 * * * * 22 0.8 0.4 0.4 0.4 32 5.0 4.4 4.5 4.8 42 5.0 7.3 8.2 8.1 52 1.6 1.6 2.2 2.4 62 0.3 0.2 0.3 0.4
Total 12.7 13.9 15.6 - 16.1
Spotted: 13 * * * * 23 * * * 33 0.2 0.1 0.1 0.1 43 0.3 0.3 0.3 0.4 53 0.2 0.1 0.1 0.2 63 0.1 * * *
Total 0.8 0.5 0.5 0.7
Tinged: Total * * * *
Stained: All grades * * * *
Light Gray: All grades 0.4 0.4 0.4 0.4
Gray: All grades * * * *
Below Grade 1/ 0.1 * 0.1 0.1
All grades 100.0 100.0 100.0 100.0
STAPLE 26 & shorter * * * * 28 0.2 0.1 0.1 0.1 29 0.9 0.4 0.4 0.5 30 3.2 1.3 1.5 2.0 31 7.2 3.1 4.3 5.8 32 10.0 4.4 6.1 8.5 33 13.8 6.3 6.9 8.8 34 17.5 12.5 10.7 10.7 35 25.7 35.3 29.2 25.9 36 18.1 27.7 28.8 26.2 37 3.2 8.4 11.4 11.0 38 0.2 0.4 0.5 0.4 39 * * * * 40 & longer * * * *
All staples 100.0 100.0 100.0 100.0
Average staple 34.0 34.9 34.8 34.6
Classings 1,709,404 5,320,816 10,701,575 13,422,566
1/ Lower in grade than the lowest grades of the official standards. * Less than 0.05 percent.
NOTE: Totals may not add due to rounding.
Crop
0.1 7.6 0.1 35.5 2.6 30.4 0.9 4.8 *
0.4 * *
82.4
* 0.4 4.9 8.1 2.4 0.4
* *
0.2 0.4 0.2 0.1
0.8
0.4
*
0.1
100.0
* 0.1 0.5 2.1 6.4 9.6 9.9 10.8 24.7 24.8 10.4 0.4 * *
100.0
34.5
14,462,493
- 4 -

N CO ('4
I I I I I I
I I I I I
In I I I
I I to I In a
CD a v
(0 N N
' LO CD
0) (0 CD
Cr) CD 0)
' 0 19t
0) 0) 0)
0 .-. (0
CO (0 0)
0 Cr) 0)
--' N CO
0) LO
LI) - CO
0 '-4
N
I I I I I I I I I CO() I I (0 I
41 I I 0
I I
I to CD
I
- (0 - LI) Cr) UD CO
0 .-. U) CSJ
N I 0 I II
I I I
C I i I I I I
I L I I U) 0 CD (0
(0 - 0) CO
N 0)
CD Cr)
0) LI) -
N Kr
C-4 CD CO
C'J C'J
.- 0) N
0 0) LO
I It I (0 I U)
+ I I C) I CD (T) .-i I U) I
a' I U) LO 0 .- 0 CO - CO 0 0 I Cr) ' CO 0
0 0) .- .-i .-. N
If) C'J
- I WI--3I to
0 I (ft 0.F-I0) --4 I IU) I LVI,
o I ol'.I
4 I I I l
o I - I I (i) ' C\i (0 (0 'O C) I Cr) CD C'.J CO
C) I I - I a' ('4 0) '- LI) LI) CO Cr) ('4
IU)I ---I-- - Id QI
CDto
C0.I 01 l tool --I -LI-PI c. 0I OI....I
I I COlOI 0) I a' I U) I in CD 0) N CD 'J (r) '- o qqt çü C) Kr Co
00) I L I U) I a, 0 N CO N 0 (0 ' 0 N (0 N ('4 CD N
I I to I - 0) - CO CD - Cr) 0 (0 - N - CD CO N U) I a'l LV - .- - .' - .- .. - - - -
a' I 0 I (,D-- I CO (Y) (0 LI) () N C) 0 -- ('si 0) C') LI) - 0 tn U) I LV I I j-. ('4 '.3- (-4 Cr) II) -4 0
WI LI I m-fl(3l.--I omI I I 4I I I
D U) 41I (0 -4 - .- Cr) I I I I 0 . ('4 I I (0
('4 LI) cli
21 I DI- I C)I LV
I I lCD
U I I 0. I
U) I I I 0 N C) 0 0 0) Cr) Cr) (I) N (0 ('4 ('4
(0 Cr) Cr) C) - N (C) (0 II) ('4 Cr) LI) al CO If) - C) .-. (0 0 (0 (0
.. ... . .' - . - U) I I (UI to N 0 Cr) C) Cr) CO LI) '.3- LI) LI) 0 (-4 •
C I I I ID -i Cr) .--4 - Cr) LO
0 I I I (C) I I
4-' I I
C) I I I I I I I LV
I I U) -' Cr) Cr) '3- 0 0) 11) (0 II) .-. CD Cr) 0 0)
L C I a' ('4 - It) It) Cr) CO Cr) CO Cr) 0 Cr) (-4 -4 Kr I I (a 0 I - .-. - CD ('4 - U) (0 - -i Cr) I I0--) to '3-
I L I
to I IO I
L I ........
I I
I I I to m I C
I 4-' CL 0 0 0 LV I -- tO M. C) L L a'
U) C C •- -- -- to to to a' I Cl) I to to to L to m U) L )( (_) E L) U'
to I I C U) 0 -- -- m D a' 0 If
(0 0 C O tn - 0 5 _c a' U)
I - N LV --- L -- U) U) 4-' (0 4-' C to I CU •- - 0 D U) U) 3 L - D C X
LV a' 0 -- -- a' 0 0 a' a'
< < < C) (0 J Z z 0 (1) F- I-
- 5 -

Table 5. -- Tenderability of upland cotton classed, by states, 1988 crop
State : Tenderable 1/
Bales Pct. Alabama 203,376 56.7 Arizona 559,910 69.1 Arkansas 802,285 77.7 California 2,324,770 90.7 Georgia 216,355 58.5 Louisiana 753,458 78.4 Mississippi 1,317,900 74.9 Missouri 224,818 74.6 New Mexico 40,392 44.1 North Carolina 76,301 56.2 Oklahoma 92,909 32.5 South Carolina 76,456 56.0 Tennessee 377,088 64.7 Texas 1,658,000 32.8
Untenderable
Bales Pct. 155,411 43.3 250,285 30.9 229,975 22.3 238,944 9.3 153,249 41.5 207,316 21.6 442,519 25.1 76,483 25.4 51,260 55.9 59,460 43.8 193,311 67.5 59,976 44.0 205,689 35.3
3,390,301 67.2
1/ Tenderable with respect to grade, staple and mike in settlement of New York No. 2 futures contracts.
Table 6. -- Tenderabi I ity of upland cotton classed in the United States, 1969-1988 crops
Year : Tenderable 1/ Untenderable
Bales Pct. Bales Pet. 1969 5,511,908 55.9 4,348,322 44.1 1970 6,342,553 63.1 3,712,684 36.9 1971 5,638,379 55.6 4 9 495,040 44.4 1972 7,279,575 55.3 5,895,947 44.7 1973 8,367,010 66.8 4,165,891 33.2 1974 6,651,985 59.2 4,587,750 40.8 1975 4,503,214 55.6 3,594,338 44.4 1976 5,767,782 56.1 4,516,274 43.9 1977 8,853,834 63.7 5,055,287 36.3 1978 5,711,866 54.6 49 747,335 45.4 1979 6,996,723 49.4 7,168,941 50.6 1980 5,405,563 50.4 5,316,703 49.6 1981 6,361,006 42.2 8,711,848 57.8 1982 7,166,579 62.7 4,263,069 37.3 1983 3,864,764 52.1 3,548,570 47.9 1984 5,414,575 43.6 7,004,174 56.4 1985 7,252,955 56.5 5,584,133 43.5 1986 4,073,446 44.1 5,163,393 55.9 1987 8,588,694 61.0 5,494,696 39.0 1988 8,743,021 60.5 5,719,472 39.5
1/ 1969-1978 tenderable on New York No. 1 and No. 2 futures contracts; 1979-1981, New York No. 2; 1982, New York No. 2 and New Orleans; 1983-1984, New York No. 2; 1985, New York No. 2 and Chicago; and 1986-1988, New York No. 2.

Table 7. -- Alabama: Percentage distribution of grade, staple, mike and fiber strength for upland cotton classed, 1988 crop 1/
Staple Grade------------------------------------------------------------------------------------------: All
:26 and : : : : : : : : : : : : :4O and :staples shorter: 28 : 29 : 30 : 31 : 32 : 33 34 : 35 : 36 : 37 : 38 : 39 : longer
White: 11 21 - - - - * * 0.1 0.2 0.2 0.1 * - - - 0.6 30 - - - - - - 31 - - - - * 0.1 0.7 2.5 4.4 1.9 0.5 * - - 10.1 40 - - - - - * * 0.2 0.4 0.2 * e - - 0.9 41 * - - - * 0.5 2.9 10.7 16.0 8.9 2.7 0.2 * - 41.9 50 - - - - - * * 0.1 0.3 0.2 0.1 * - - 0.6 51 - - - - * 0.1 0.4 1.4 2.6 1.9 0.7 0.1 * - 7.1 60 - - - - - - - - - - - - - - 61 - - - - * * * 0.1 0.2 0.1 0.1 * - - 0.6 70 - - - - - - - - - - - - - - 71
Lt. Spotted: 12 - - - - - - - - - - - - - - - 22 - - - - * * * 0.1 0.1 * * - - - 0.2 32 - - - - * 0.2 0.7 2.3 3.0 1.3 0.3 * - - 7.8 42 - - -- - * 0.4 1.9 6.8 8.2 3.7 1.0 0.1 * * 22.1 52 - - - - * 0.1 0.3 1.1 1.7 1.0 0.3 * * - 4.6 62 - - - - * * * 0.1 0.2 0.1 * * * - 0.5
Spotted: 13 - - - - - 23 - - - - - 33 - - - - * * * 0.1 0.1 * * * - - 0.3 43 - - - - - * 0.1 0.4 0.4 0.2 * * - - 1.2 53 - - - - * * * 0.1 0.1 0.1 * * - - 0.4 63 - - - - - * * * * * * * - - 0.1
Tinged: 24 - - - - - 34 - - - - - 44 - - - - * * * * * * e * - - 0.1 54 - - - - - * * * * * * * - - 0.1
Stained: 25 - - - - - - - - - - - - - - - 35
Lt. Gray: 16 - - - - - - - - - - - - - - 26 - - - - * * 0.1 0.3 0.2 * * * - - 0.6 36 - - - - - * * * * * * - - - 0.1 46 - - - -
Gray: 17 - - - - - - - - - - - - - - - 27 - - - - - - - 37 - - - - - - 47 - - - - - - - - - - - - - - -
Below Grade 2/ - - - - - * * * * * * * - - 0.1
All grades * - - - * 1.4 7.4 26.8 38.3 19.8 5.8 0.4 * * 100.0
Mike : 26 and below : 27-29 : 30-32 : 33-34 : 35-49 : 50-52 :53 and above: Average mike
Percent 0.1 0.4 1.4 2.2 88.3 6.0 1.5 43
1/8" gage (grams per tax) Fiber :
strength : 17 and : : : : : : : : 32 and : Average
below : 18-19 : 20-21 : 22-23 : 24-25 : 26-27 : 28-29 : 30-31 : above : strength
Percent * 0.2 3.5 18.4 29.2 25.4 16.8 5.7 0.8 25.6
1/ Classings, 358,787 running bales. Average staple.................... 34.9 2/ Lower in grade than the lowest grades of the-official standards. Percent tenderabte ................ 56.7 * Less than 0.05 percent. Percent Average Rule Used (ARU) 1.2
Percent grade reductions.......... 8.8 NOTE: Totals may not add due to rounding.
-7-

Table i-a. -- Arizona: Percentage distribution of grade, staple, mike and fiber strength for upland cotton classed, crop 1988 1/
Staple Grade------------------------------------------------------------------------------------------: Al
26 and : : : : : : : : : : : : : 40 and : staples shorter: 28 : 29 : 30 : 31 : 32 : 33 : 34 : 35 : 36.: 37 : 38 : 39 : longer
Whi te: 11 - - - - - - * * 0.1 0.1 - * - - 0.2 21 * - - * - * * 0.4 4.0 7.7 - 0.1 * - 13.9 30 - - - - * - - * * 0.1 - * * - 0.1 31 * - - * * 0.1 0.2 1.9 13.8 22.4 4.5 0.3 * * 43.1 40 - - - - - * * * 0.1 0.1 0.1 * * - 0.3 41 - - - * * * 0.1 1.1 6.8 7.7 1.7 0.2 * * 17.5 50 - - - - - * * * 0.1 0.2 * * * - 0.3 51 - - - * * * * 0.2 0.5 0.4 0.1 * * * 1.2 60 - - - - - - * * * * - 61 - - - * * * * 0.1 0.1 * * - - - 0.3 70 - - - - - - - - - - - - - - - 71 - - - - - * * * * * *• - - - *
Lt. Spotted: 12 - - - - - - - - - - - - - - - 22 - - - * * * * * 0.2 0.4 0.1 * * - 0.7 32 - - * * * 0.1 0.1 0.4 3.2 5.5 1.6 0.1 * * 11.1 42 - - * * * * 0.1 0.5 1.8 2.3 0.7 0.1 * 0.1 5.8 52 * * - * * 0.1 0.2 0.8 0.7 0.3 0.1 * * * 2.2 62 * * - * * 0.1 0.3 0.9 0.4 0.1 * * * * 1.7
Spotted: 13 - - - - - - - - - - - - - - - 23 - - - - 33 - - - - * * * * * * * * - - 0.1 43 - - - * * * * * * * * * - - 0.1 53 - - * * * * * 0.1 * * * * * - 0.2 63 - * * * * * * 0.1 * * * - - - 0.2
Tinged: 24 - - - - - - - 34 - - - - - - - 44 - - - - - - 54 - - -
Stained: 25 - - - - - - - - - - - - - - - 35 - - - - - - - - - - - - - - -
Lt. Gray: 16 - - - - - - - - - - - - - - - 26 - - - - - * * 0.1 0.2 0.1 * * - - 0.4 36 - - - - * * * * 0.1 * * - - - 0.2 46 - - - -
Gray: 17 - - - - - - - - - - - - - - - 27 - - - - - - - 37 - - - - - - 47 - - - -
Below Grade 2/ * - * * * * 0.1 0.2 0.1 * * * * * 0.4
All grades * * * * 0.1 0.5 1.3 6.8 32.2 47.5 10.7 0.8 0.1 0.1 100.0
Mike : 26 and below : 27-29 : 30-32 : 33-34 : 35-49 : 50-52 :53 and above: Average mike
Percent 0.5 1.8 3.2 2.6 77.7 11.6 2.6 44
1/8 gage (grams per tex) Fiber : ----------------------------------------------------------------------------------------------------
strength : 17 and : : : : : : : : 32 and : Average below : 18-19 : 20-21 : 22-23 : 24-25 : 26-27 : 28-29 : 30-31 : above : strength
Percent 0.1 0.1 1.1 7.2 24.3 31.7 25.4 8.7 1.4 26.6
1/ Classings, 810,195 running bales. Average staple ................... 35.6 2/ Lower in grade than the lowest grades of the official standards. Percent tenderable ............... 69.1 * Less than 0.05 percent. Percent Average Rule Used (ARU) 0.3
Percent grade reductions ......... 5.0 NOTE: Totals may not add due to rounding.
- 8 -

Table 7-b. -- Arkansas: Percentage distribution of grade, staple, mike and fiber strength for upland cotton classed, 1988 crop 1/
Staple Grade------------------------------------------------------------------------------------------: All
26 and : : : : : : : : : : : : : 40 and : staples shorter: 28 : 29 : 30 : 31 : 32 : 33 : 34 : 35 : 36 : 37 : 38 : 39 : longer
White: 11 21 - - - - - - * * * * - - - - 0.1 30 31 - - - - * * 0.1 0.8 7.1 5.5 0.6 * * - 14.1 40 - - - - - * * 0.1 0.9 0.9 0.1 * * - 2.0 41 * - - - * * 0.2 2.6 23.7 23.1 3.4 0.1 * * 53.2 50 - - - - - * * 0.1 1.5 2.1 0.3 * * - 4.0 51 - - - - * * * 0.3 3.3 5.5 1.0 * * * 10.2 60 61 - - - - * * * * 0.2 0.3 0.1 * * - 0.6 70 - - - - - - - * * * - 71
Lt. Spotted: 12 - - - - - - - - - - - - - - - 22 32 - - - - * * * 0.2 1.2 0.6 0.1 * * - 2.1 42 * - - * * * * 0.5 4.0 3.8 0.7 * * - 9.0 52 - - - - * * * 0.1 1.1 1.4 0.3 * * - 3.0 62 - - - - * - * * 0.1 0.2 * * * - 0.4
Spotted: 13 - - - - - - - 23 - - - - - - - 33 - - - - - - * * 0.1 * * - - - 0.1 43 - - - - * * * * 0.4 0.3 * * - - 0.7 53 - - - - - * * * 0.1 0.1 * * - - 0.2 63 - - - - -
Tinged: 24 - - - - - - - 34 - - - - - - - 44 - - - - * - * * * * * - - - 0.1 54 - - - -
Stained: 25 35
Lt. Gray: 16 - - - - - - - - - - - - - - - 26 - - - - - - 36 - - - - - 46 - - - - -
Gray: 17 - - - - - - - - - - - - - - - 27 - - - - - - - - 37 - - - - - - - - 47 - - - - - -
Below Grade 2/ - - - -
All grades * - - * * * 0.4 4.7 43.9 44.0 6.7 0.2 * * 100.0
Mike : 26 and below : 27-29 : 30-32 : 33-34 : 35-49 : 50-52 :53 and above: Average mike
Percent 0.3 1.2 2.7 2.8 91.8 1.0 0.1 41
1/8 gage (grams per tax) Fiber :----------------------------------------------------------------------------------------------------
strength : 17 and : : : : : : : 32 and : Average
below : 18-19 : 20-21 : 22-23 : 24-25 : 26-27 : 28-29 : 30-31 : above : strength
Percent * 0.1 0.7 13.0 48.1 31.3 6.0 0.8 0.1 25.1
1/ Classings, 1,032,260 running bales. Average staple.................... 35.5 2/ Lower in grade than the lowest grades of the official standards. Percent tenderable ................ 77.7 * Less than 0.05 percent. Percent Average Rule Used (ARU) 0.8
Percent grade reductions.......... 3.9 NOTE: Totals may not add due to rounding.
-9--

Table 7-c. -- California: Percentage distribution of grade, staple, mike and fiber strength for upland cotton classed, 1988 crop 1/
Staple Grade ------------------------------------------------------------------------------------------ : All
26 and : : : : : : : : : : : : : 40 and : staples shorter: 28 : 29 : 30 : 31 : 32 : 33 : 34 : 35 : 36 37 38 : 39 : longer
White: 11 21 * - - * * * * * 0.7 10.2 - * * - 15.3 30 - - - - * - * * * 0.1 - * - * 0.3 31 - - - * * * * 0.1 1.7 33.1 27.2 0.3 * * 62.4 40 - - - - * * * * * 1.0 2.1 0.1 * * 3.2 41 - - - - * * * 0.1 0.7 4.7 5.9 0.2 * * 11.6 50 - - - - - - * * * 0.1 0.1 * * - 0.2 51 - - - * * * * 0.1 0.1 0.4 0.4 * * * 1.0 60 61 - - - * - * * * 0.1 * * * - 0.1 70 71
Lt. Spotted: 12 22 - - - - - - * * * * * * - 0.1 32 * - - * - * * * 0.2 1.3 0.7 * * - 2.2 42 - - - * * * * 0.1 0.4 0.9 0.7 * * * 2.1 52 - - - - * 0.1 0.2 0.2 0.1 * * - 0.6 62 - - - - * * * 0.1 * * * - - 0.1
Spotted: 13 - - - - - - - - 23 - - - - - - - - 33 - - - - * - - * * * * * * 0.1 43 - - - * * - * * * 0.1 * * - - 0.2 53 - - * * * * * * - - 0.1 63
Tinged: 24 - - - - 34 - - - - 44 - - - - 54 - - - -
Stained: 25 35
Lt. Gray: 16 - - - - - - 26 - - - - - - 36 - - - - 46 - - - - - - - * * 0.1 * - - 0.1
Gray: 17 - - - - - - - - - - - - - - - 27 - - - - - - - - 37 - - - - 47 - - - -
Below Grade 2/ - - - -
All grades * - - * * * 0.1 0.5 4.2 52.7 41.9 0.6 * * 100.0
Mike : 26 and below : 27-29 : 30-32 : 33-34 : 35-49 : 50-52 :53 and above: Average mike
Percent 0.1 0.5 1.5 2.4 94.9 0.6 0.1 41
1/8" gage (grams per tex) Fiber : ----------------------------------------------------------------------------------------------------
strength : 17 and : : : : : : : : 32 and : Average below : 18-19 : 20-21 : 22-23 : 24-25 : 26-27 : 28-29 : 30-31 : above : strength
Percent - * 0.1 0.6 2.1 13.1 40.0 32.5 11.6 29.2
1/ Classings, 2,563,714 running bales. Average staple................... 36.4 2/ Lower in grade than the lowest grades of the official standards. Percent tenderable ............... 90.7 * Less than 0.05 percent. Percent Average Rule Used (ARU) 0.3
Percent grade reductions ......... 2.3 NOTE: Totals may not add due to rounding.
- 10 -

Table 7-d. -- Georgia: Percentage distribution of grade, staple, mike and fiber strength for upland cotton classed, 1988 crop 1/
Staple Grade-------------------------------------------------------------------------------------------All
26 and : : : : : : : : : : : : : 40 and : staples shorter: 28 : 29 : 30 : 31 : 32 : 33 : 34 : 35 : 36 : 37 : 38 : 39 : longer
White: 11 - - - - - - - - - - - - - - - 21 - - - - - - 30 - - - - - - 31 - * - * * 0.1 0.5 1.8 3.3 2.4 0.9 0.1 * * 9.1 40 - - - - - * * * 0.1 0.2 0.1 * - * 0.4 41 - * * * 0.1 0.5 2.6 8.9 16.9 14.7 7.1 0.6 0.1 * 51.5 50 - - - - * * * 0.2 0.6 0.7 0.5 0.1 * - 2.0 51 - - * * * 0.1 0.5 1.6 3.1 3.2 1.9 0.2 * * 10.6 60 - - - - - - - * * * - - 61 - - - * * * 0.1 0.1 0.2 0.2 0.1 * * - 0.7 70 - 71 - - - * * * * * * * * * - - 0.1
Lt. Spotted: 12 - - - - - - - - - - - - - - - 22 - - - - - - 32 - * * * * 0.1 0.4 0.7 0.9 0.5 0.2 * * * 2.9 42 - * * * 0.1 0.6 1.6 3.4 4.3 2.9 1.3 0.2 * * 14.4 52 - - * * * 0.2 0.5 0.9 1.2 0.9 0.5 0.1 * * 4.3 62 - - - * * * 0.1 0.1 0.1 0.1 * * * - 0.5
Spotted: 13 - - - - - - - - - - - - - - - 23 - - - - - 33 - - - 43 - - * * * * 0.1 0.1 0.1 0.1 * * * - 0.4 53 - - - * * * 0.1 0.1 0.1 * * * * - 0.3 63 - - -
Tinged: 24 - - - - - - - - - - - - - - - 34 - - - - - - 44 - - - 54 - - -
Stained: 25 - - - - - - - - - - - - - - - 35
Lt. Gray: 16 - - - - - - - - - - - - - - - 26 - - - - * 0.1 0.2 0.5 0.7 0.4 0.1 * - - 2.0 36 - - - - * * * 0.1 0.1 * * * - - 0.2 46 - - - -
Gray: 17 - - - - - - - - - - - - - - - 27 - - - - - - 37 - - - - - - 47 - - - - - -
Below Grade 2/ - - - * * * * * * * * * * - 0.1
All grades - * * 0.1 0.4 1.8 6.8 18.7 31.9 26.3 12.7 1.2 0.1 * 100.0
Mike : 26 and below : 27-29 : 30-32 : 33-34 : 35-49 : 50-52 :53 and above: Average mike
Percent 0.6 1.2 2.4 2.9 82.5 8.3 2.2 43
1/8 gage (grams per tex) Fiber : ----------------------------------------------------------------------------------------------------
strength : 17 and : : : : : : : : 32 and : Average below : 18-19 : 20-21 : 22-23 : 24-25 : 26-27 : 28-29 : 30-31 : above : strength
Percent - 0.1 0.8 7.8 25.9 35.5 22.8 6.6 0.6 26.4
1/ Classings, 369,604 running bales. Average staple................... 35.2 2/ Lower in grade than the lowest grades of the official standards. Percent 'tenderable ............... 58.5 * Less than 0.05 percent. Percent Average Rule Used (ARU) 1.4
Percent grade reductions ......... 8.7 NOTE: Totals may not add due to rounding.

Table 7-e. -- Louisiana: Percentage distribution of grade, staple, mike and fiber strength for upland cotton classed, 1988 crop 1/
Staple Grade------------------------------------------------------------------------------------------: Al
:26 and : : : : : : : : : : : : : 40 and : staples shorter: 28 : 29 : 30 : 31 : 32 : 33 : 34 : 35 : 36 : 37 : 38 : 39 : longer
White: 11 21 - - - - - A A 0.1 0.3 0.1 - - - - 0.4 30 - - - - - - - 31 - - - - * A 0.2 3.2 13.4 6.4 0.4 * A - 23.6 40 - - - - A * * 0.1 0.4 0.3 A A - - 0.8 41 - - - A A A 0.4 6.6 29.5 16.2 1.4 * A - 54.1 50 - - - - - - A A 0.3 0.3 A * A - 0.7 51 - - - - * A 0.1 0.9 3.2 2.0 0.2 A * - 6.4 60 - - - - - - - A A * -
61 - - - - A A *0.1 0.2 0.1 * A - - 0.4 70 - - - - - - - * - - 71
Lt. Spotted: 12 - - - - - - - - - - - - - - - 22 - - - - - 32 - - - - A * * 0.4 0.9 0.3 A - - - 1.6 42 - - - A A A 0.1 1.5 4.2 2.3 0.2 * * - 8.3 52 - - - - * * 0.1 0.5 1.1 0.8 0.1 * A - 2.5 62 - - - - A * * 0.1 0.2 0.1 A * * - 0.4
Spotted: 13 - - - - - - 23 - - - - - - 33 - - - - A - * A A * A - - - 0.1 43 - - - - * A A * 0.1 * A * * - 0.2 53 - - - - - * * * * * * * - - 0.1 63 - - - - -
Tinged: 24 - - - - 34 - - - - 44 - - - - 54 - - - -
Stained: 25 35
Lt. Gray: 16 - - - - - 26 - - - - - * * * A A * - - - 0.1 36 - - - - 46 - - - -
Gray: 17 - - - - 27 - - - - 37 - - - - 47 - - - -
Below Grade 2/ - - - -
All grades - - - * * 0.1 1.0 13.6 53.8 29.0 2.5 0.1 * A 100.0
Mike : 26 and below : 27-29 : 30-32 : 33-34 : 35-49 : 50-52 :53 and above: Average mike
Percent 0.2 1.0 2.7 3.0 91.1 1.9 0.1 42
1/8 gage (grams per tex) Fiber :----------------------------------------------------------------------------------------------------
strength : 17 and : : : : : : : : 32 and : Average
below : 18-19 : 20-21 : 22-23 : 24-25 : 26-27 : 28-29 : 30-31 : above : strength
Percent A A 1.2 16.8 40.3 25.7 11.7 3.8 0.6 25.3
1/ Classings, 960,774 running bales. Average staple .................... 35.2 2/ Lower in grade than the lowest grades of the off i.cial standards. Percent tenderable ................ 78.4 A Less than 0.05 percent. Percent Average Rule Used (ARU) 0.3
Percent grade reductions.......... 5.5 NOTE: Totals may not add due to rounding.
- 12 -

Table 7-f. -- Mississippi: Percentage distribution of grade, staple, mike and fiber strength for upland cotton classed, 1988 crop 1/
Staple Grade:----------------------------------------------------------------------------------------: All
:26 and : : : : : : : : : : : : :40 and :staples shorter: 28 : 29 : 30 : 31 : 32 : 33 : 34 : 35 : 36 : 37 : 38 : 39 : longer
White: 11 - - - - - - - - - - - - - - - 21 * - - - * * * 0.1 0.2 * - * - - 0.3 30 - - - - - - * * * * - 31 - - - - * * 0.3 3.5 12.2 4.7 0.3 * - - 21.0 40 - - - - * * * 0.1 0.5 0.3 * * - - 0.9 41 - - - e * 0.1 0.6 6.5 28.5 15.2 1.4 0.1 * - 52.4 50 - - - - - * * * 0.4 0.3 * * - - 0.8 51 - - - - * * 0.1 0.9 3.0 1.9 0.2 * * - 6.2 60 - - - - - - - 61 - - - * A A * 0.2 0.3 0.1 * * - - 0.7 70 71
Lt. Spotted: 12 - - - - - - - - - - - - - - - 22 32 - - - - * * 0.1 0.7 1.3 0.4 * * - - 2.4 42 * - - - * * 0.2 1.8 5.6 2.5 0.2 * * * 10.3 52 * - - * * * 0.1 0.5 1.3 0.7 0.1 * * - 2.6 62 - - - - * * * 0.1 0.2 0.1 * * - - 0.5
Spotted: 13 - - - - 23 - - - - 33 - - - - - * * * * * * * - - 0.1 43 - - - - * * * 0.1 0.2 0.1 * * - - 0.3 53 - - - - - * * * 0.1 A A A - - 0.1 63 - - - -
Tinged: 24 - - - - - - - 34 - - - - - - - 44 - - - - 54 - - - -
Stained: 25 35
Lt. Gray: 16 - - - - - - - A - 26 - - - * * A A 0.4 0.6 0.1 * A - - 1.1 36 - - - A * A A * 0.1 A A - - A 0.1 46 - - -
Gray: 17 - - - - 27 - - - - - 37 - - - - - 47 - - - -
Below Grade 2/
All grades * - - * A 0.2 1.4 14.9 54.5 26.5 2.4 0.1 A A 100.0
Mike : 26 and below : 27-29 : 30-32 : 33-34 : 35-49 : 50-52 :53 and above: Average mike
Percent 0.3 1.0 2.7 4.2 91.1 0.6 A 40
1/8 gage (grams per tex) Fiber :----------------------------------------------------------------------------------------------------
strength : 17 and : : : : : : : : 32 and : Average
below : 18-19 : 20-21 : 22-23 : 24-25 : 26-27 : 28-29 : 30-31 : above : strength
Percent * A 1.0 17.4 49.5 26.9 4.7 0.4 A 24.8
1/ Classings, 1,760,419 running bales. Average staple.................... 35.1 2/ Lower in grade than the lowest grades of the g.fficial standards. Percent tenderable................ 74.9 A Less than 0.05 percent. Percent Average Rule Used (ARU) 0.5
Percent grade reductions.......... 4.9 NOTE: Totals may not add due to rounding.
- 13 -

Table 7-g. -- Missouri: Percentage distribution of grade, staple, mike and fiber strength for upland cotton classed, 1988 crop 1/
Staple Grade: --------------------------- - ------------------------------------------------------------- - All
:26 and : : : : : : : : : : : :4O and :staples
shorter: 28 : 29 : 30 : 31 : 32 : 33 : 34 : 35 : 36 : 37 38 : 39 : longer
Whi te: 11 - - - - - - - - - - - - - - - 21 - - - - - - 30 - - - - - - 31 - - - - * * 0.2 1.2 4.7 3.2 0.7 * - - 10.0 40 - - - - - * * * 0.2 0.2 * * - - 0.5 41 - - - - * * 0.5 4.3 28.2 21.4 3.6 0.2 * * 58.2 50 - - - - - * * 0.1 0.5 0.7 0.1 * - - 1.4 51 - - - - - * * 0.4 2.5 3.7 0.9 0.1 * * 7.5 60 - - - - - - - - * * * - 61 - - - - - - * * 0.1 0.2 0.1 A * - 0.4 70 - - - - - - - - - - - - - - - 71 - - - -
Lt. Spotted: 12 - - - - - - - - - - - - - - - 22 - - - - - - 32 - - - - * * * 0.3 1.3 0.8 0.2 * * - 2.7 42 - - - - * * 0.1 0.8 5.7 5.8 1.4 0.1 * - 14.0 52 - - - - - * * 0.1 1.0 1.6 0.5 0.1 * * 3.3 62 - - - - - - * * 0.1 0.2 * * A - 0.3
Spotted: 13 - - - - - - - - - - - - - - - 23 - - - - - - 33 - - - - A - A A A * * * - - 0.1 43 - - - - - A A * 0.2 0.2 0.1 * - - 0.6 53 - - - - - * A A 0.1 0.1 0.1 A - - 0.3 63 - - - - - A * * A A A * - - 0.1
Tinged: 24 - - - - - - - - - - - - - - - 34 - - - - - - - 44 - - - - - A A * * A A A - - 0.1 54 - - - - - - - * A A A A - - 0.1
Stained: 25
35 Lt. Gray:
16 - - - - - - A * - -
26 - - - - - * * 0.1 0.2 0.1 A A - - 0.3 36 - - - - - 46 - - - - -
Gray: 17 - - - - - - 27 - - - - - - 37 - - - - - - 47 - - - - - -
Below Grade 2/ - - - - - * A * A * A * - - 0.1
All grades - - - - A 0.1 0.9 7.3 45.0 38.3 7.8 0.5 A * 100.0
Mike : 26 and below : 27-29 : 30-32 : 33-34 : 35-49 : 50-52 :53 and above: Average mike
Percent 0.2 0.9 2.5 2.7 93.5 0.2 * 41
1/8" gage (grams per tex)
Fiber : strength : 17 and : : : : : : : : 32 and : Average
below : 18-19 : 20-21 : 22-23 : 24-25 : 26-27 : 28-29 : 30-31 : above : strength
Percent 0.1 A 0.4 8.3 43.6 39.5 7.6 0.5 A 25.4
1/ Classings, 301,301 running bales. Average staple.................... 35.5 2/ Lower in grade than the lowest grades of the official standards. Percent tenderable ................ 74.6 A Less than 0.05 percent. Percent Average Rule Used (ARU) 0.5
Percent grade reductions.......... 3.1 NOTE: Totals may not add due to rounding.
- 14 -

Table 7-h. -- New Mexico: Percentage distribution of grade, staple, mike and fiber strength for upland cotton classed, 1988 crop 1/
Staple Grade:-----------------------------------------------------------------------------------------: All
26 and : : : : : : : : : : : : 40 and : staples shorter: 28 : 29 : 30 : 31 : 32 : 33 : 34 : 35 : 36 : 37 : 38 : 39 : longer
White: 11 - - - - - * * * * * - * - - 0.2 21 - - * * 0.1 0.2 0.6 0.6 0.9 1.5 - 0.9 * - 7.3 30 - - - - * * - * * 0.1 - 0.1 * - 0.3 31 - * 0.1 0.6 1.4 1.6 2.1 2.1 4.5 8.2 15.8 8.0 1.1 0.1 45.5 40 - * * 0.1 0.3 0.3 0.1 0.1 0.1 0.2 0.8 0.8 0.2 * 3.0 41 - * * 0.2 1.3 1.7 1.5 1.3 1.9 2.7 6.8 5.6 1.0 0.1 24.1 50 - - - * * * * * * * 0.1 0.1 * * 0.4 51 - - * 0.1 0.3 0.5 0.4 0.2 0.3 0.3 0.4 0.2 * * 2.6 60 - - - - - - - * - - - - 61 - - - * * * * * * * * * - - 0.2 70 - - - - - - - - - - - - - - - 71 - -
L±. Spotted: 12 - - - - - - * - - - - 22 - - * * * * * * * * 0.1 * - - 0.2 32 - * 0.1 0.3 0.4 0.3 0.2 0.4 0.9 2.5 1.7 0.4 0.1 7.3 42 - * * 0.1 0.5 0.6 0.5 0.3 0.4 0.6 1.5 1.3 0.5 0.1 6.4 52 - * * 0.1 0.3 0.3 0.1 0.1 0.1 0.1 0.1 * * * 1.4 62 - - * * * * * * 0.1 * * * * - 0.2
Spotted: 13 - - - - 23 - - - - 33 - - - * 0.1 * * * * * * * - * 0.2 43 - - * * * * * * * * * * * * 0.1 53 - - * * * * * * * * * * * - 0.1 63 - -
Tinged: 24 - - - - - - - - - - - - - - - 34 - - - 44 - - 54 - -
Stained: 25 - - - - - - - - - - - - - - - 35 - - - - - - - - - - - - - - -
Lt. Gray: 16 - - - - - - - - - - - - - - 26 - - - - - - 36 - - - - - - 46 - - - - - -
Gray: 17 - - - - - - - - - - - - - - - 27 - - - - - - - - - - - - - - - 37 - - - - - - - - - - - - - - - 47 - - - - - - - - - - - - - - -
Below Grade 2/ - - - * * * * * 0.1 0.1 * - - - 0.3
All grades - * 0.1 1.2 4.8 5.9 5.7 5.1 9.0 14.9 30.9 18.8 3.2 0.3 100.0
Mike : 26 and below : 27-29 : 30-32 : 33-34 : 35-49 : 50-52 :53 and above: Average mike
Percent 2.1 7.2 17.8 17.4 55.4 * * 35
1/8" gage (grams per tex) Fiber :----------------------------------------------------------------------------------------------------
strength : 17 and : : : : : : : : 32 and : Average
below : 18-19 : 20-21 : 22-23 : 24-25 : 26-27 : 28-29 : 30-31 : above : strength
Percent * 0.2 1.1 5.9 13.2 20.9 27.7 20.9 10.1 27.9
1/ Classings, 91,652 running bales. Average staple .................... 35.9 2/ Lower in grade than the lowest grades of the,-official standards. Percent tenderable................ 44.1 * Less than 0.05 percent. Percent Average Rule Used (ARU) 1.0
Percent grade reductions.......... 9.8 NOTE: Totals may not add due to rounding.
- 15 -

Table 7-i. -- North Carolina: Percentage distribution of grade, staple, mike and fiber strength for upland cotton classed, 1988 crop 1/
Staple Grade:-----------------------------------------------------------------------------------------: All
:26 and : : : : : : : : : : : : : 40 and : staples shorter: 28 : 29 : 30 : 31 : 32 : 33 : 34 : 35 : 36 : 37 : 38 : 39 : longer
White: 11 - - - - - - - - - - - - - - - 21 30 - - - - - - - - - - - - - - - 31 - - - - - * 0.1 1.5 3.2 1.7 0.1 * - - 6.7 40 - - - - - * * 0.1 0.3 0.2 * - - - 0.6 41 - - - - * * 0.6 6.1 16.9 11.8 1.2 0.1 * * 36.7 50 - - - - * * 0.1 0.5 1.7 1.4 0.1 * * - 3.8 51 - - - - - * 0.2 2.0 5.5 5.2 0.6 * * * 13.5 60 - - - - - * * * 0.1 0.1 - - - - 0.2 61 - - - - - * * 0.2 0.7 0.7 0.1 - - * 1.7 70 - - - - - - - - - * - - 71 - - - - - - * * * * * - - - 0.1
Lt. Spotted: 12 - - - - - - - - - - - - - - - 22 - - - - - - - 32 - - - - * * 0.1 0.6 1.1 0.6 0.1 * - - 2.5 42 - - - - * 0.1 0.4 3.4 8.9 7.6 1.6 0.1 * * 22.0 52 * - - - * * 0.2 1.3 3.4 3.6 0.9 0.1 * - 9.6 62 - - - - - * * 0.2 0.5 0.4 0.1 * * - 1.2
Spotted: 13 - - - - - - - - - - - - - - - 23 - - - - - - - 33 - - - - - * * * 0.1 * * - - - 0.1 43 - - * - * * * 0.1 0.2 0.2 * * - - 0.6 53 - - - - - * * * 0.1 0.1 * * - - 0.2 63 - - - - - - * * * * * * - - 0.1
Tinged: 24 - - - - - - - - - - - - - - - 34 - - - - - - - 44 - - - - - - - 54 - - - - - - -
Stained: 25 - - - - - - - - - - - - - - - 35 - - - - - - - - -. - - - - - -
Lt. Gray: 16 - - - - - - - - - - - - - - - 26 - - - * * - * * * * - - - - 0.1 36 - - - 46 - - -
Gray: 17 - - - - - - - - - - - - - - - 27 - - - - - - - - - - - - - - - 37 - - - - - 47 - - - - -
Below Grade 2/ - - - - - - A A 0.1 0.1 * A - - 0.3
All grades * - A A A 0.2 1.9 16.2 42.8 33.7 4.9 0.4 * A 100.0
Mike : 26 and below : 27-29 : 30-32 : 33-34 : 35-49 : 50-52 :53 and above: Average mike
Percent 0.1 0.5 1.4 1.9 94.0 2.0 0.1 42
1/8 gage (grams per tax) Fiber :----------------------------------------------------------------------------------------------------
strength : 17 and : : : : : : : : 32 and : Average
below : 18-19 : 20-21 : 22-23 : 24-25 : 26-27 : 28-29 : 30-31 : above : strength
Percent * - 0.9 13.4 42.8 31.1 9.2 2.3 0.3 25.3
1/ Classings, 135,761 running bales. Average staple.................... 35.2 2/ Lower in grade than the lowest grades of the official standards. Percent tenderable ................ 56.2 A Less than 0.05 percent. Percent Average Rule Used (ARU) 4.5
Percent grade reductions.......... 11.0 NOTE: Totals may not add due to rounding.
- 16 -

Table l-j. -- Oklahoma: Percentage distribution of grade, staple, mike and fiber strength for upland cotton classed, 1988 crop 1/
Staple Grade ------------------------------------------------------------------------------------------ : All
26 and : : : : : : : : : : : : 40 and : staples shorter: 28 : 29 : 30 : 31 : 32 : 33 : 34 : 35 : 36 : 37 : 38 : 39 : longer
White: 11 21 - * * * * * * 0.1 0.3 0.7 - * * - 1.5 30 31 * * 0.1 0.4 0.9 1.3 1.2 1.2 2.4 4.4 3.6 0.4 * * 15.9 40 - - * * * 0.1 0.1 0.2 0.3 0.2 0.1 * - - 1.0 41 * 0.2 0.8 2.0 3.2 3.3 2.6 2.6 2.0 1.1 0.2 * - 18.0 50 * * * 0.2 0.4 0.6 0.3 0.2 0.1 * * - - 1.9 51 * * 0.2 0.6 1.6 2.9 3.4 2.1 1.1 0.6 0.1 * * - 12.6 60 - - - - * * * * - - - 61 * * * 0.1 0.3 0.6 0.7 0.4 0.1 * * - - - 2.4 70 - - - - - - - - - - - - - - - 71 * * * * * * 0.1 * * * - - - - 0.2
Lt. Spotted: 12 - - - - - - - - - - - - - - - 22 - * * * * * * * * * * - - - 0.1 32 * 0.1 0.4 1.2 2.1 2.3 1.6 0.7 0.2 0.2 0.4 0.2 * * 9.3 42 * 0.3 1.1 2.5 3.9 4.2 3.1 1.5 0.6 0.2 0.2 0.1 * * 17.8 52 * 0.2 0.7 1.8 2.6 2.8 2.2 1.2 0.5 0.1 * * - - 12.1 62 * * 0.1 0.4 0.5 0.5 0.4 0.2 0.1 * * * - - 2.3
Spotted: 13 - - - - - - - - - - - - - - - 23 33 - * * * 0.1 0.1 0.1 0.1 * * * * * * 0.4 43 * * 0.2 0.2 0.3 0.3 0.2 0.1 0.1 * * * * * 1.4 53 * * 0.1 0.2 0.3 0.3 0.3 0.1 * * * * - - 1.3 63 - * * * 0.1 0.1 0.1 * * * * - - - 0.3
Tinged: 24 34 44 - * * * * * * * * - * * - - 0.1 54 * - * * 0.1 0.1 0.1 * * - * - - - 0.3
Stained: 25 35
Lt. Gray: 16 - - - - - - - - - - - - - - - 26 - 36 - 46 -
Gray: 17 - - - - - - - - - - - - - - - 27 - - - - - 37 - - - - - - - - - - - - - - - 47 - - - - -
Below Grade 2/ * * * 0.2 0.3 0.3 0.2 0.1
All grades 0.1 0.7 3.2 8.5 15.2 19.5 17.6 11.0 8.5 8.7 5.9 0.9 0.1 * 100.0
Mike : 26 and below : 27-29 : 30-32 : 33-34 : 35-49 : 50-52 :53 and above: Average mike
Percent 0.4 0.7 1.7 2.4 85.0 7.6 2.3 43
1/8 gage (grams per tex) Fiber : ----------------------------------------------------------------------------------------------------
strength : 17 and : : : : : : : : 32 and : Average below : 18-19 : 20-21 : 22-23 : 24-25 : 26-27 : 28-29 : 30-31 : above : strength
Percent 0.4 1.6 7.3 22.7 31.5 18.3 8.7 5.8 3.8 25.0
1/ Classings, 286,564 running bales. Average staple .................... 32.9 2/ Lower in grade than the lowest grades of the-official standards. Percent tenderable ................ 32.5 * Less than 0.05 percent. Percent Average Rule Used (ARU) 7.5
Percent grade reductions .......... 18.8 NOTE: Totals may not add due to rounding.
- 17 -

Table 7-k. -- South Carolina: Percentage distribution of grade, staple, mike and fiber strength for upland cotton classed, 1988 crop 1/
Staple Grade : ----------------------------------------------------------------------------------------- : All
:26 and : : : : : : : : : : : : : 40 and : staples shorter: 28 : 29 : 30 : 31 : 32 : 33 : 34 : 35 : 36 : 37 : 38 : 39 : longer
White: 11 - - - - - - - - - - - - - - - 21 30 - - - - - - - - - - - - - - - 31 - - * * * 0.1 0.5 2.0 4.6 4.0 1.2 0.2 * * 12.6 40 - - - - * * * * 0.1 0.2 0.2 * * * 0.7 41 - - * * 0.1 0.5 1.7 5.7 13.4 12.8 5.0 0.9 0.1 0.1 40.3 50 - - - * * * * 0.1 0.3 0.3 0.2 0.1 * * 1.0 51 * - * * * 0.1 0.3 1.0 1.9 1.5 0.6 0.1 * * 5.6 60 - - - - - * - * * * - - 61 - - - - - * * 0.1 0.1 0.1 * * - - 0.3 70 - - - - - - - - - - - - - - - 71 - -
Lt. Spotted: 12 - - - - - - - - - - - - - - - 22 - - - - - - - 32 - - - * * * 0.1 0.7 1.5 1.3 0.6 0.1 * * 4.3 42 - - * * * 0.3 1.1 4.7 10.0 8.3 2.9 0.5 * * 27.8 52 - - - * * 0.1 0.3 1.1 2.1 1.6 0.5 0.1 * - 5.9 62 - * - - * * * 0.1 0.3 0.2 * * * - 0.7
Spotted: 13 - - - - - - - - - - - - - - - 23 - - - - - - - 33 - - - - - - 43 - - - - - * * * 0.1 * * * - - 0.2 53 - - - - * * * * * * * * - - 0.1 63 - - - - * * * * * * * - - - 0.1
Tinged: 24 - - - - - - - - - - - - - - - 34 - - - - - - - - - - - - - - - 44 - - - - - - - 54 - - - - - - -
Stained: 25 - - - - - - - - - - - - - - - 35 - - - - - - - - - - - - - - -
Lt. Gray: 16 - - - - - - - - - - - - - - - 26 - - - - * * * * 0.1 * * - - - 0.1 36 - - - - - * e * * * - - - - 0.1 46 - - - -
Gray: 17 - - - - - - - - - - - - - - - 27 - - - - - 37 - - - - - 47 - - - - - - - - - - - - - - -
Below Grade 2/ - - - - - - * * * * * - - - 0.1
All grades * * * * 0.2 1.1 4.2 15.7 34.7 30.4 11.4 1.9 0.3 0.1 100.0
Mike : 26 and below : 27-29 : 30-32 : 33-34 : 35-49 : 50-52 :53 and above: Average mike
Percent 0.3 0.9 2.3 3.0 91.5 1.7 0.2 41
1/8 gage (grams per tex) Fiber : ----------------------------------------------------------------------------------------------------
strength : 17 and : : : : : : : : 32 and : Average below : 18-19 : 20-21 : 22-23 : 24-25 : 26-27 : 28-29 : 30-31 : above : strength
Percent * 0.1 1.5 16.5 38.0 29.3 12.6 1.7 0.3 25.3
1/ Classings, 136,432 running bales. Average staple ........... ......... 35.3 2/ Lower in grade than the lowest grades of the official standards. Percent tenderable ................ 56.0 * Less than 0.05 percent. Percent Average Rule Used (ARU) 1.4
Percent grade reductions .......... 6.3 NOTE: Totals may not add due to rounding.
-18-

Table 7-I. -- Tennessee: Percentage distribution of grade, staple, mike and fiber strength for upland cotton classed, 1988 crop 1/
Staple Grade:-----------------------------------------------------------------------------------------: All
:Z6 and : : : : : : : : : : : : :40 and :staples :shorter: 28: 29: 30: 31: 32: 33: 34:35: 36: 37: 38: 39: longer :
White: 11 21 - - - - - - * * 0.1 * - - - - 0.2 30 - - - - - - - - - 31 - - - - * * 0.1 2.2 9.1 2.8 0.2 * - - 14.4 40 - - - - - - * * 0.3 0.2 * * - - 0.5 41 - - - - * * 0.1 3.3 22.3 8.0 0.4 * * * 34.3 50 - - - - - - * 0.1 0.7 0.4 * * - - 1.2 51 - - - - - * * 0.3 2.9 1.2 0.1 * * - 4.6 60 - - - - - - * * * * - 61 - - - - - - * * 0.1 0.1 * * - - 0.2 70 - - - - - - - - - 71
Lt. Spotted: 12 - - - - - - - - - - - - - - - 22 32 - - - - * * 0.2 2.9 8.6 1.9 0.1 * - - 13.6 42 * - - - - * 0.1 3.1 15.1 4.7 0.2 * * * 23.3 52 - - - - * * * 0.6 3.2 1.2 0.1 * - - 5.1 62 - - - - - * * 0.1 0.3 0.1 * * - - 0.5
Spotted: 13 - - - - - - 23 - - - - - - 33 - - - - - * * 0.1 0.2 * * - - - 0.3 43 - - - - - * * 0.2 0.6 0.2 * * - * 0.9 53 - - - - - * * 0.1 0.2 0.1 * * - - 0.4 63 - - - - - * * * 0.1 * * * - - 0.1
Tinged: 24 - - - - - - - - - - - - - - - 34 - - - - - 44 - - - - - 54 - - - - -
Stained: 25 - - - - - - - - - - - - - - - 35
Lt. Gray: 16 - - - - - 26 - - - - - * * * 0.1 * - - - - 0.1 36 - - - - - 46 - - - - -
Gray: 17 - - - - - - - - - - - - - - - 27 - - - - - - - 37 - - - - - - - - - - - - - - - 47 - - - - - - -
Below Grade 2/ - - - - * * * * * * * - - - 0.1
All grades * - - - * * 0.5 13.1 64.1 21.0 1.2 0.1 * * 100.0
Mike : 26 and below : 27-29 : 30-32 : 33-34 : 35-49 : 50-52 :53 and above: Average mike
Percent * 0.4 1.5 2.3 94.8 1.0 * 42
1/8 gage (grams per tex) Fiber :
strength : 17 and : : : : : : : : 32 and : Average
below : 18-19 : 20-21 : 22-23 : 24-25 : 26-27 : 28-29 : 30-31 : above : strength
Percent - * 1.2 20.8 50.2 24.1 3.5 0.2 * 24.7
1/ Classings, 582,777 running bales. Average staple.................... 35.1 2/ Lower in grade than the lowest grades of the official standards. Percent tenderable................ 64.7 * Less than 0.05 percent. Percent Average Rule Used (APU) 1.1
Percent grade reductions.......... 4.6 NOTE: Totals may not add due to rounding.
- 19 -

Table 7-rn. -- Texas: Percentage distribution of grade, staple, mike and fiber strength for upland cotton classed, 1988 crop 1/
Staple Grade:-----------------------------------------------------------------------------------------: All
26 and : : : : : : : : : : : : : 40 and : staples shorter: 28 : 29 : 30 : 31 : 32 : 33 : 34 : 35 : 36 : 37 : 38 : 39 : longer
Whi to: 11 - * * * * * * * * * * * - - 0.1 21 * * 0.1 0.5 1.8 3.1 3.2 1.5 0.7 0.2 0.1 * * * 11.2 30 - * * * * * * * * * * * * - 0.1 31 * 0.1 0.4 2.1 7.2 11.2 11.3 6.0 2.9 0.8 0.3 * * * 42.3 40 * * 0.1 0.4 1.1 1.3 0.8 0.5 0.3 0.1 * * * * 4.7 41 * 0.1 0.3 1.1 3.5 5.3 5.2 3.2 1.8 0.6 0.1 * * * 21.2 50 * * * * 0.1 0.1 0.1 * 0.1 * * * - - 0.4 51 * * 0.1 0.2 0.6 1.0 0.9 0.6 0.3 0.1 * * * * 3•9 60 61 * * * * 0.1 0.1 0.1 0.1 * * * * - - 0.3 70 71
Lt. Spotted: 12 22 * * * 0.1 0.2 0.3 0.2 0.1 * * * * - - 1.0 32 * * 0.2 0.5 1.3 1.6 1.4 0.7 0.4 0.1 * * * * 6.2 42 * * 0.1 0.4 1.0 1.2 1.2 0.8 0.5 0.1 * * * * 5.4 52 * * * 0.1 0.2 0.3 0.4 0.3 0.2 0.1 * * * - 1.7 62 * * * * * 0.1 0.1 * * * * - - 0.2
Spotted: 13 23 - * * * * * * * * * * - - - 0.1 33 * * * * 0.1 0.1 0.1 * * * * * - - 0.3 43 * * * * 0.1 0.1 0.1 0.1 * * * * - - 0.4 53 * * * * * * * * * * * * - - 0.2 63
Tinged: 24 - 34 - 44 - 54 -
Stained: 25 35
Lt. Gray: 16 - 26 - 36 - * * * * * * * * * * - - - 0.1 46 -
Gray: 17 27 37 47
Below Grade 2/ * * * * * * * * * * * * - - 0.1
All grades * 0.3 1.4 5.5 17.4 26.0 25.1 14.1 7.3 2.2 0.6 * * * 100.0
Mike : 26 and below : 27-29 : 30-32 : 33-34 : 35-49 : 50-52 :53 and above: Average mike
Percent 0.6 2.1 5.9 7.5 81.4 2.2 0.4 40
1/8" gage (grams per tex) Fiber : ----------------------------------------------------------------------------------------------------
strength : 17 and : : : : : : : : 32 and : Average below : 18-19 : 20-21 : 22-23 : 24-25 : 26-27 : 28-29 : 30-31 : above : strength
Percent 0.2 1.1 5.2 20.8 38.1 24.0 8.5 1.9 0.4 24.7
1/ Classings, 5,048,301 running bales. Average staple.................... 32.5 2/ Lower in grade than the lowest grades of the official standards. Percent tenderable ................ 32.8 * Less than 0.05 percent. Percent Average Rule Used (ARU) 3.6
Percent grade reductions .......... 14.8 NOTE: Totals may not add due to rounding.
- 20 -

Table 8. -- Percentage distribution of grade and staple for upland cotton classed through specified periods, by states, 1988 crop
ALABAMA ARIZONA
Grade : Period through : :: Period through and : -------------------------------------------: Crop : : ------------------------------------------ : Crop
Staple : Sept. 30 i Oct. 31 : Nov. 30 : Dec. 29 : :: Sept. 30 : Oct. 31 : Nov. 30 : Dec. 29
GRADE White:
11 - * * 2.4 0.6 0.2 0.2 0.2 21 5.1 1.3 0.7 0.7 0.6 :: 44.7 38.0 17.7 14.7 13.9 30 * * * * * :: 0.3 0.2 0.2 0.1 0.1 31 36.7 16.4 11.4 10.3 10.1 :: 39.2 46.8 44.3 43.7 43.1 40 3.6 1.2 1.0 0.9 0.9 :: 0.6 0.3 0.3 0.3 0.3 41 23.8 35.4 40.5 42.0 41.9 :: 4.9 2.6 15.0 17.7 17.5 50 0.3 0.6 0.7 0.6 0.6 :: - * 0.2 0.3 0.3 51 0.8 3.1 5.5 6.8 7.1 :: 0.1 0.2 0.7 1.1 1.2 60 - - - - - :: - - * * * 61 - 0.1 0.3 0.5 0.6 :: * * * 0.2 0.3 70 - - - - - :: - - - - - 71 - * * * * :: - - * * *
Total 70.1 58.1 60.1 61.8 61.8 92.2 88.7 78.6 78.3 76.9
Light Spotted: 12 - - - - - :: - - - - - 22 1.7 0.5 0.3 0.2 0.2 :: 0.4 1.0 0.8 0.7 0.7 32 16.9 12.4 8.8 7.9 7.8 :: 2.9 7.2 12.3 11.2 11.1 42 9.6 23.3 23.4 22.3 22.1 :: 2.2 1.8 5.6 5.7 5.8 52 0.5 3.0 4.3 4.5 4.6 :: 1.9 0.7 1.4 1.8 2.2 62 * 0.2 0.4 0.5 0.5 :: * 0.1 0.4 1.0 1.7
Total 28.7 39.4 37.2 35.4 35.2 :: 7.4 10.8 20.5 20.4 21.5
Spotted: 13 - 23 0.1 33 0.6 0.4 0.3 0.3 0.3 :: * * 0.1 0.1 0.1 43 0.4 1.1 1.1 1.2 1.2 :: 0.2 0.1 0.1 0.1 0.1 53 * 0.2 0.3 0.3 0.4 :: 0.1 0.1 0.1 0.1 0.2 63 * * 0.1 0.1 0.1 :: - * 0.1 0.1 0.2
Total 1.1 1.7 1.8 1.9 2.0 0.3 0.2 0.4 0.4 0.6
Tinged: 24 34 44 * * * * 0.1 54 * * * * 0.1
Total * * * * 0.2
Stained: All grades
Light Gray: All grades 0.1 0.9 0.7 0.7 0.7 :: * * 0.4 0.6 0.6
Gray: All grades
Below Grade 1/ * * * 0.1 :: * * 0.1 0.2 0.4
All grades 100.0 100.0 100.0 100.0 100.0 :: 100.0 100.0 100.0 100.0 100.0
Staple 26&shorter 28 29 30 31 * * * * * :: 0.1 0.1 32 1.1 1.2 1.4 1.5 1.4 :: 0.7 0.1 0.1 0.3 0.5 33 6.6 6.8 7.3 7.5 7.4 :: 1.7 0.4 0.5 1.0 1.3 34 27.4 26.7 26.9 26.9 26.8 :: 9.8 2.8 3.7 5.7 6.8 35 44.3 42.1 38.7 38.4 38.3 :: 36.1 25.0 27.0 30.7 32.2 36 16.8 18.7 19.5 19.6 19.8 :: 42.9 57.2 54.3 50.0 47.5 37 3.7 4.3 5.7 5.7 5.8 :: 8.7 13.6 13.3 11.4 10.7 38 0.1 0.2 0.4 0.4 0.4 :: * 0.8 0.9 0.7 0.8 39 - * * * - * * * 0.1 40 & longer - - * * * :: - 0.1 0.1 0.1
All staples 100.0 100.0 100.0 100.0 100.0 :: 100.0 100.0 100.0 100.0 100.0
Average staple 34.8 34.8 34.9 34.9 34.9 ;: 35.4 35.8 35.8 35.7 35.6
Clsssings 43,363 176,488 310,281 351,176 358,787 ;: 14,023 167,321 571,187 746,425 810,195 -
1/ Lower in grade than the lowest grades of the official standards. * Less than 0.05 percent.
- 21 -

Table 8. -- Continued
ARKANSAS CALIFORNIA
Grade : Period through : :: Period through and : ------------------------------------------- : Crop : : ------------------------------------------- : Crop
Staple : Sept. 30 : Oct. 31 : Nov. 30 : Dec. 29 : :: Sept. 30 : Oct. 31 : Nov. 30 : Dec. 29
GRADE White:
II - 4 * * :: * 0.1 * * 4
21 0.4 0.1 0.1 0.1 0.1 :: 25.7 18.9 14.1 15.3 15.3 30 * * * * * :: 0.1 0.6 0.3 0.3 0.3 31 10.8 20.9 14.7 14.3 14.1 :: 58.3 67.3 64.7 62.7 62.4 40 2.2 3.4 2.2 2.0 2.0 :: 2.7 2.3 3.2 3.3 3.2 41 47.3 56.8 55.3 53.6 53.2 :: 11.1 8.5 11.9 11.7 11.6 50 7.1 4.2 4.2 4.1 4.0 :: * 0.1 0.2 0.2 0.2 51 12.2 6.4 9.7 10.2 10.2 :: 0.4 0.3 0.9 1.0 1.0 60 0.1 61 0.4 0.1 0.4 0.6 0.6 :: * 0.1 1.0 1.0 70 71
Total 80.5 91.9 86.6 84.9 84.2 :: 98.3 98.1 95.4 95.5 95.0
Light Spotted: 12 22 * * * * * :: * * 0.1 0.1 0.1 32 2.7 1.6 1.9 2.0 2.1 :: 0.7 1.1 1.9 2.1 2.2 42 12.3 5.0 8.2 8.7 9.0 :: 0.5 0.6 1.8 2.0 2.1 52 3.7 1.0 2.5 2.9 3.0 :: 0.1 0.1 0.5 0.6 0.6 62 0.3 0.1 0.3 0.4 0.4 :: - * 0.1 0.1 0.1
Total 19.0 7.7 12.9 14.0 14.5 : 1.3 1.8 4.4 ----- .1
Spotted: 13 23 33 * * 0.1 0.1 0.1 :: * * * 0.1 0.1 43 0.2 0.1 0.3 0.6 0.7 :: * * 0.1 0.2 0.2 53 0.1 * 0.1 0.2 0.2 :: - * * 0.1 0.1 63 * * * * * :: - 4 * * *
Total 0.3 0.1 0.5 0.9 1.0 :: * 4 0.1 0.4 0.4
Tinged: 24 34 44 * * * 0.1 0.1 54 * * * * * :: - * * * *
Total * * * 0.1 0.1
Stained: All grades
Light Gray: All grades * * * * * :: 0.1 * * * 0.1
Gray: All grades
Below Grade 1/ 4 * 4 * * :: - * * * 4
All grades 100.0 100.0 100.0 100.0 100.0 :: 100.0 100.0 100.0 100.0 100.0
Staple 268shorter 28 29 30 31 32 0.1 33 1.2 0.5 0.4 0.4 0.4 :: - * * * 0.1 34 12.5 5.4 4.8 4.8 4.7 :: 0.1 0.1 0.3 0.4 0.5 35 59.0 44.3 43.3 43.8 43.9 :: 11.1 3.0 4.2 4.2 4.2 36 25.0 42.5 44.2 44.0 44.0 :: 64.5 52.5 53.1 52.3 52.7 37 2.1 7.0 6.9 6.8 6.7 :: 23.9 43.4 41.7 42.3 41.9 38 0.1 0.3 0.3 0.3 0.2 :: 0.3 1.1 0.7 0.6 0.6 39 40&longer
All staples 100.0 100.0 100.0 100.0 100.0 :: 100.0 100.0 100.0 100.0 100.0
Average staple 35.8 35.5 35.5 35.5 35.5 :: 38.1 36.4 36.4 36.4 36.4
Classings 81,571 554,069 961,077 1,020,906 1,032,260 :: 7,248 624,289 2,012,100 2,505,442 2,563,714
I! Lower in grade than the lowest grades of the official standards. * Less than 0.05 percent.
- 22 -

Table B. -- Continued
GEORGIA LOUISIANA
Grade : Period through : :: Period through and : ------------------------------------: Crop : : ------------------------------------------- : Crop
Staple : Sept. 30 : Oct. 31 : Nov. 30 : Dec. 29 : :: Sept. 30 : Oct. 31 : Nov. 30 Dec. 29
GRADE Whit,:
11 21 - * * e :: 1.4 0.6 0.5 0.4 0.4 30 - * 0.1 31 7.9 8.7 9.8 9.2 9.1 :: 42.3 30.3 24.1 23.7 23.6 40 0.1 0.2 0.4 0.4 0.4 :: 1.9 1.1 0.8 0.8 0.6 41 24.9 49.8 51.3 52.2 51.5 :: 46.3 55.5 54.7 54.2 54.1 50 0.1 1.5 2.3 2.1 2.0 :: 0.7 0.8 0.7 0.7 0.7 51 1.9 5.7 9.4 10.4 10.6 :: 2.2 4.9 6.2 6.4 6.4 60 - * * * a * * a + a 61 - 0.1 0.3 0.5 0.7 :: * 0.1 0.3 0.4 0.4 70 - - - a * - - * * * 71 - - * * 0.1 :: * * * * a
Total 34.9 66.0 73.6 74.8 74.4 :: 94.8 93.3 87.3 86.6 86.4
Light Spotted: 12 22 - 32 12.3 5.3 3.4 3.0 2.9 :: 1.5 1.3 1.6 1.6 1.6 42 40.6 21.6 15.6 14.6 14.4 :: 3.3 4.2 8.1 8.3 8.1 52 6.4 3.8 4.2 4.2 4.3 :: 0.4 0.9 2.3 2.5 2.5 62 0.1 0.2 0.2 0.3 0.5 :: a 0.1 0.3 0.4 0.4
Total 59.4 30.9 23.4 22.1 22.1 :: 5.2 6.5 12.3 12.8 12.6
Spotted: 13 23 - - 33 * 0.1 a * * :: * a 0.1 0.1 0.1 43 3.7 0.9 0.4 0.4 0.4 :: a 0.1 0.2 0.2 0.2 53 1.8 0.5 0.4 0.3 0.3 * * 0.1 0.1 0.1 63 * * a * * :: - * a * a
Total 5.3 1.5 0.8 0.7 0.7 :: * 0.1 0.4 0.4 0.4
Tinged: 24 34 - 44 0.1 54
Total 0.1 * * * *
Stained: All grader.
Light Grey: All grades 0.2 1.3 2.0 2.2 2.2 :: * 0.1 0.1 0.1 0.1
Gray: All grades
Below Grade 1/ * 0.1 * 0.1 0.1
All grades 100.0 100.0 100.0 100.0 100.0 ;: 100.0 100.0 100.0 100.0 100.0
Staple 26 & shorter 28 29 0.1 30 1.2 0.2 0.1 0.1 0.1 31 4.6 1.0 0.5 0.4 0.4
32 9.0 3.9 1.9 1.8 1.8 :: * * 0.1 0.1 0.1 33 18.6 12.5 6.8 6.8 6.8 :: 0.2 0.6 0.8 1.0 1.0 34 25.4 24.1 17.8 18.7 18.7 :: 5.4 10.5 13.0 13.6 13.6 35 23.8 30.3 31.1 31.8 31.9 :: 44.2 54.7 54.2 53.8 53.6 36 12.5 18.2 26.4 26.2 26.3 :: 44.6 31.5 29.3 29.0 29.0 37 4.3 8.2 13.8 12.8 12.7 :: 5.4 26 2.5 2.5 2.5 38 0.3 1.2 1.5 1.2 1.2 :: 0.2 0.1 0.1 0.1 0.1 39 0.2 0.2 0.2 0.1 0.1 40&longer * * * * * :: - * * * -
All staples 100.0 100.0 100.0 100.0 100.0 :; 100.0 100.0 100.0 100.0 100.0
Average staple 34.1 34.7 35.2 35.2 35.2 :: 35.5 35.3 35.2 35.2 35.2
Classinga 7,010 81,855 254,391 350,789 369,604 162,428 658,779 937,676 959,267 960,774
I! Lower in grade than the lowest grades of the official standards. a Lees than 0.05 percent.
- 23 -
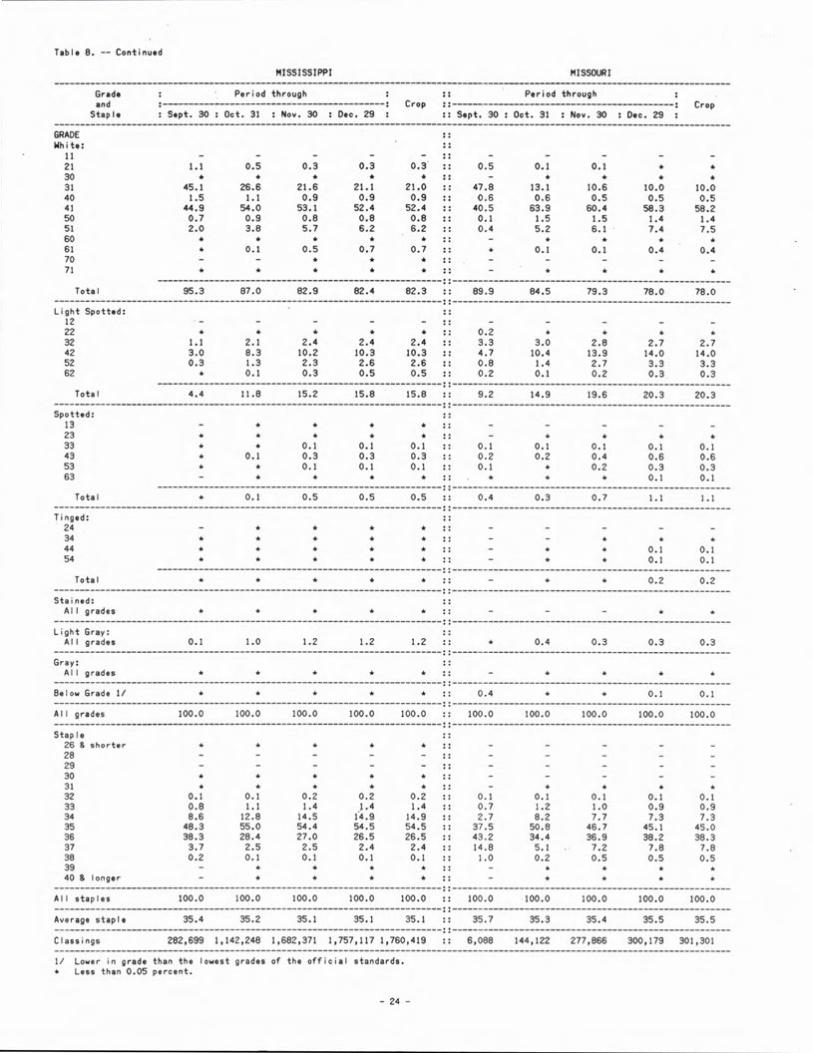
Table B. -- Continued
MISSISSIPPI MISSOURI
Grads : Period through : :: Period through and : ------------------------------- : Crop :: ------------------------------------------ : Crop
Staple : Sept. 30 : Oct. 31 : Nov. 30 : Dec. 29 : :: Sept. 30 : Oct. 31 : Nov. 30 : Dec. 29
GRADE White:
11 21 1.1 0.5 0.3 0.3 0.3 :: 0.5 0.1 0.1 30 * A A * * :: - * * * * 31 45.1 26.6 21.6 21.1 21.0 :: 47.8 13.1 10.6 10.0 10.0 40 1.5 1.1 0.9 0.9 0.9 40.6 0.6 0.5 0.5 0.5 41 44.9 54.0 53.1 52.4 52.4 :: 40.5 63.9 60.4 58.3 58.2 50 0.7 0.9 0.8 0.8 0.8 :: 0.1 1.5 1.5 1.4 1.4 51 2.0 3.8 5.7 6.2 6.2 :: 0.4 5.2 6.1 7.4 7.5 60 51 * 0.1 0.5 0.7 0.7 :: A 0.1 0.1 0.4 0.4 70 - - 71
Total 95.3 87.0 82.9 82.4 82.3 :: 89.9 84.5 79.3 78.0 78.0
Light Spotted: 12 - - - - - :: - - - - - 22 A * * * * :: 0.2 * * A * 32 1.1 2.1 2.4 2.4 2.4 :: 3.3 3.0 2.8 2.7 2.7 42 3.0 8.3 10.2 10.3 10.3 :: 4.7 10.4 13.9 14.0 14.0 52 0.3 1.3 2.3 2.6 2.6 :: 0.8 1.4 2.7 3.3 3.3 62 * 0.1 0.3 0.5 0.5 :: 0.2 0.1 0.2 0.3 0.3
Total 4.4 11.8 15.2 15.8 15.8 :: 9.2 14.9 19.6 20.3 20.3
Spotted: 13 23 33 A A 0.1 0.1 0.1 :: 0.1 0.1 0.1 0.1 0.1 43 * 0.1 0.3 0.3 0.3 :: 0.2 0.2 0.4 0.6 0.6 53 A A 0.1 0.1 0.1 :: 0.1 A 0.2 0.3 0.3 63 - * * A * :: A * A 0.1 0.1
Total * 0.1 0.5 0.5 0.5 :: 0.4 0.3 0.7 1.1 1.1
Tinged: 24 34 44 A * A A * - * 4 0.1 0.1 54 A * A * * - * * 0.1 0.1
Total * A * A A :: - * * 0.2 0.2
Stained: All grades
Light Gray: All grades 0.1 1.0 1.2 1.2 1.2 :: * 0.4 0.3 0.3 0.3
Gray: All grades
Below Grade 1/ * * * * A :: 0.4 * * 0.1 0.1
All grades 100.0 100.0 100.0 100.0 100.0 :: 100.0 100.0 100.0 100.0 100.0
Staple 26 shorter 28 29 30 31 32 0.1 0.1 0.2 0.2 0.2 :: 0.1 0.1 0.1 0.1 0.1 33 0.8 1.1 1.4 1.4 1.4 :: 0.7 1.2 1.0 0.9 0.9 34 8.6 12.8 14.5 14.9 14.9 :: 2.7 8.2 7.7 7.3 7.3 35 48.3 55.0 54.4 54.5 54.5 :: 37.5 50.8 46.7 45.1 45.0 36 38.3 28.4 27.0 26.5 26.5 :: 43.2 34.4 36.9 38.2 38.3 37 3.7 2.5 2.5 2.4 2.4 :: 14.8 5.1 7.2 7.8 7.8 38 0.2 0.1 0.1 0.1 0.1 :: 1.0 0.2 0.5 0.5 0.5 39 - 40 longer
All staples 100.0 100.0 100.0 100.0 100.0 :: 100.0 100.0 100.0 100.0 100.0
Average staple 35.4 35.2 35.1 35.1 35.1 :: 35.7 35.3 35.4 35.5 35.5
Classirigs 282,699 1,142,248 1,682,371 1,757,117 1,760,419 :: 6,088 144,122 277,866 300,179 301,301
1/ Lower in grade than the lowest grades of the official standards. * Less than 0.05 percent.
- 24 -

Table 8. -- Continued
NEW MEXICO NORTH CAROLINA
Grade : Period through : :: Peri.d through and :------------------------------- Cro- ----------------------------------------------: Crop
Staple : Sept. 30 : Oct. 31 : Nov. 30 : Dec. 29 : :: Sept. 30 : Oct. 3 : Nov. 30 : Dec. 29
GRADE Whit.:
11 - 0.5 0.2 0.2 0.2 21 - 11.6 8.3 7.8 7.3 :: - * * * * 30 - 0.6 0.4 0.3 0.3 :: - - - - - 31 - 47.5 48.7 47.4 45.5 :: - 15.4 8.3 6.8 6.7 40 - 2.2 3.0 2.9 3.0 : - 1.3 0.7 0.6 0.6 41 - 19.3 23.6 24.2 24.1 :: - 45.6 38.9 36.7 36.7 50 - 0.1 0.3 0.4 0.4 :: - 4.4 4.3 3.8 3.8 51 - 0.6 1.1 2.2 2.6 :: - 6.9 12.4 13.6 13.5 60 - - - - * :: - * 0.2 0.2 0.2 61 - - * 0.2 0.2 :: - 0.2 1.5 1.7 1.7 70 - - - - - :: - - * * * 71 - - * * * - * 0.1 0.1 0.1
Total - 82.4 85.6 85.6 83.6 - 73.8 66.4 63.5 63.3
Light Spotted: - 12 - - 22 - 0.2 0.2 0.2 0.2
32 - 11.4 8.2 7.3 7.3 :: - 2.4 2.4 2.5 2.5 42 - 5.6 5.5 5.8 6.4 :: - 18.5 21.5 21.9 22.0 52 - 0.3 0.3 0.8 1.4 :: - 4.8 7.9 9.6 9.6 62 - 0.1 0.2 :: - 0.2 0.8 1.2 1.2
Total - 17.5 14.2 14.2 15.5 - 25.9 32.6 35.2 35.3
Spotted: 13 - 23 - 33 - - * 0.1 0.2 :: - * 0.1 0.1 0.1 43 - 0.1 * 0.1 0.1 :: - 0.2 0.4 0.6 0.6
53 - - * * 0.1 :: - * 0.1 0.2 0.2
63 - - - * * •:: - * * 0.1 0.1
Total - 0.1 * 0.2 0.4 - 0.2 0.6 1.0 1.0
Tinged: 24 - 34 - 44 - 54 -
Total - * * * * :: - - + * *
Stained: All grades
Light Gray: All grades - * * * :: - * * 0.1 0.1
Gray: All grades
------------------------------------------------------ Below Grade 1/ - * 0.1 0.1 0.3 :; - * 0.2 0.3 0.3
All grades - 100.0 100.0 100.0 100.0 :; - 100.0 100.0 100.0 100.0
Staple 26 S shorter - 28 - 29 - * 0.1 011 0.1
30 - - 0.4 1.0 1.2
31 - - 1.8 3.5 4.8 :: - - * * * 32 - * 2.4 4.8 5.9 :: - 0.2 0.2 0.2 0.2
33 - 0.1 2.9 5.4 5.7 :: - 1.4 1.6 1.8 1.9
34 - 1.0 2.6 4.8 5.1 :: - 19.5 15.2 16.2 16.2
35 - 3.8 6.5 8.8 9.0 :: - 48.0 43.3 42.8 42.8
36 - 10.6 14.2 15.0 14.9 :: - 26.4 34.7 33.8 33.7
37 - 39.4 36.7 32.6 30.9 :: - 4.2 4.7 4.8 4.9
38 - 36.9 27.6 20.3 18.8 :: - 0.3 0.2 0.4 0.4
39 - 7.6 4.6 3.5 3.2 :: - 0.1 * * * 40 & longer - 0.5 0.3 0.3 0.3 --
All staples - 100.0 100.0 100.0 100.0 - 100.0 100.0 100.0 100.0
- Average staple - 37.3 -- 36.7 36.1 35.9 :; - 35.1 35.3 35.2 35.2
Classings 19 15,262 59,053 84,122 91,652 :: 71 26,213 102,438 133,825 135,761
1/ Lower in grade than the lowest grades of the official standard,. * Less than 0.05 percent.
- 25 -
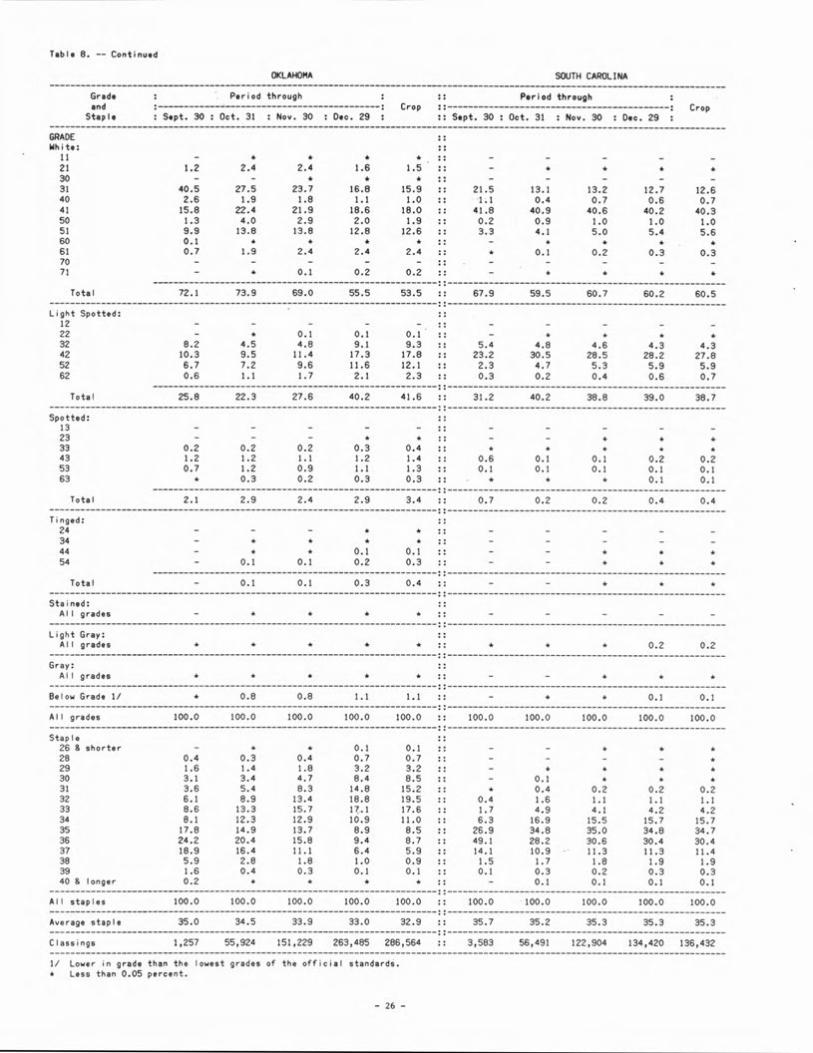
Table 8. -- Continued
OKLAHOMA SOUTH CAROLINA
Grad. : Period through : :: Period through and : ------------------------------------------- : Crop : : ------------------------------------------- : Crop
Staple : Sept. 30 : Oct. 31 : Nov. 30 : Dec. 29 : :: Sept. 30 : Oct. 31 : Nov. 30 : Dec. 29
GRADE White:
11 21 1.2 2.4 2.4 1.6 1.5 30 - - * * * 31 40.5 27.5 23.7 16.8 15.9 :: 21.5 13.1 13.2 12.7 12.6 40 2.6 1.9 1.8 1.1 1.0 :: 1.1 0.4 0.7 0.6 0.7 41 15.8 22.4 21.9 18.6 18.0 :: 41.8 40.9 40.6 40.2 40.3 50 1.3 4.0 2.9 2.0 1.9 :: 0.2 0.9 1.0 1.0 1.0 51 9.9 13.8 13.8 12.8 12.6 :: 3.3 4.1 5.0 5.4 5.6 60 0.1 61 0.7 1.9 2.4 2.4 2.4 :: * 0.1 0.2 0.3 0.3 70 - - - - - :: - - - - - 71 - 0.1 0.2 0.2
Total 72.1 73.9 69.0 55.5 53.5 :: 67.9 59.5 60.7 60.2 60.5
Light Spotted: 12 - - - - - 22 - * 0.1 0.1 0.1 32 8.2 4.5 4.8 9.1 9.3 :: 5.4 4.8 4.6 4.3 4.3 42 10.3 9.5 11.4 17.3 17.8 :: 23.2 30.5 28.5 28.2 27.8 52 6.7 7.2 9.6 11.6 12.1 :: 2.3 4.7 5.3 5.9 5.9 62 0.6 1.1 1.7 2.1 2.3 :: 0.3 0.2 0.4 0.6 0.7
Total - 25.8 22.3 27.6 40.2 41.6 31.2 40.2 38.8 39.0 38-.7
Spotted: 13 23 - - - 33 0.2 0.2 0.2 0.3 0.4 43 1.2 1.2 1.1 1.2 1.4 :: 0.6 0.1 0.1 0.2 0.2 53 0.7 1.2 0.9 1.1 1.3 :: 0.1 0.1 0.1 0.1 0.1 63 * 0.3 0.2 0.3 0.3 :: * * * 0.1 0.1
Total 2.1 2.9 2.4 2.9 3.4 :: 0.7 0.2 0.2 0.4 0.4
Tinged: 24 - 34 - 44 - * 0.1 0.1 54 - 0.1 0.1 0.2 0.3
Total - 0.1 0.1 0.3 0.4
Stained: All grades
Light Gray: All grades * * * * * :: * * * 0.2 0.2
Gray: All grades
Below Grade 1/ * 0.8 0.8 1.1 1.1 :: - * 0.1 0.1
All grades 100.0 100.0 100.0 100.0 100.0 :: 100.0 100.0 100.0 100.0 100.0
Staple 26 8 shorter - 4 * 0.1 0.1 28 0.4 0.3 0.4 0.7 0.7 29 1.6 1.4 1.8 3.2 3.2 30 3.1 3.4 4.7 8.4 8.5 :: - 0.1 * * * 31 3.6 5.4 8.3 14.8 15.2 :: 0.4 0.2 0.2 0.2 32 6.1 8.9 13.4 18.8 19.5 :: 0.4 1.6 1.1 1.1 1.1 33 8.6 13.3 15.7 iLl 17.6 :: 1.7 4.9 4.1 4.2 4.2 34 8.1 12.3 12.9 10.9 11.0 :: 6.3 16.9 15.5 15.7 15.7 35 17.8 14.9 13.7 8.9 8.5 :: 26.9 34.8 35.0 34.8 34.7 36 24.2 20.4 15.8 9.4 8.7 :: 49.1 28.2 30.6 30.4 30.4 37 18.9 16.4 11.1 6.4 5.9 :: 14.1 10.9 11.3 11.3 11.4 36 5.9 2.8 1.8 1.0 0.9 :: 1.5 1.7 1.8 1.9 1.9 39 1.6 0.4 0.3 0.1 0.1 :: 0.1 0.3 0.2 0.3 0.3 40 & longer 0.2 * * * * :: - 0.1 0.1 0.1 0.1
All staples 100.0 100.0 100.0 -- 100.0 100.0 :: 100.0 100.0 100.0 100.0 100.0
Average staple 35.0 34.5 33.9 33.0 32.9 :: 35.7 35.2 35.3 35.3 35.3
Classings 1,257 55,924 151,229 263,485 286,564 :: 3,583 56,491 122,904 134,420 136,432
1/ Lower in grade than the lowest grades of the official standards. * Less than 0.05 percent.
- 26 -

Table B. -- Continued
TENNESSEE TEXAS
Grad. : Period through : :: Period through and -------------------------------------------- : Crop : : -------------------------------------------- Crop
Staple : Sept. 30 : Oct. 31 : Nov. 30 : Dec. 29 : :: Sept. 30 : Oct. 31 : Nov. 30 : Dec. 29
GRADE White:
11 - - * * * 0.1 0.1 0.1 0.1 21 1.5 0.3 0.2 0.2 0.2 :: 8.3 8.3 9.8 11.4 11.2 30 * * * * :: 0.1 0.2 0.2 0.1 0.1 31 42.7 21.7 15.9 14.4 14.4 :: 41.6 39.5 40.0 41.8 42.3 40 2.6 0.9 0.6 0.6 0.5 : 4.8 4.7 5.0 5.0 4.7 41 17.7 33.3 35.6 34.3 34.3 :: 22.5 22.6 23.3 21.3 21.2 50 0.6 1.4 1.3 1.2 1.2 :: 0.7 0.7 0.7 0.5 0.4 51 0.6 2.8 3.9 4.6 4.6 :: 4.4 4.6 4.7 4.0 3.9 60 - * * * * 61 - 0.1 0.2 0.2 0.2 :: 0.5 0.5 0.5 0.4 0.3 70 - - - 71 -
Total 65.7 60.5 57.7 55.5 55.4 82.9 81.2 64.3 84.6 84.2
Light Spotted: 12 - - - 22 0.2 0.1 0.1 * * :: 1.3 1.4 1.2 1.0 1.0 32 21.4 18.2 14.7 13.7 13.6 :: 6.0 6.6 6.0 6.2 6.2 42 10.5 17.4 21.8 23.3 23.3 5.4 6.1 5.0 5.0 5.4 52 1.0 2.0 3.8 5.0 5.1 :: 2.2 2.4 1.8 1.6 1.7 62 * 0.1 0.4 0.5 0.5 :: 0.4 0.5 0.3 0.3 0.2
Total 33.1 37.8 40.8 42.5 42.5 15.3 17.0 14.3 14.1 14.5
Spotted: 13 23 * * * * * * 0.1 0.1 0.1 0.1 33 0.2 0.4 0.3 0.3 0.3 :: 0.2 0.3 0.2 0.2 0.3 43 0.7 0.7 0.7 0.9 0.9 :: 0.5 0.5 0.3 0.3 0.4 53 0.1 0.2 0.3 0.4 0.4 :: 0.3 0.2 0.2 0.1 0.2 63 * * 0.1 0.1 0.1 :: 0.1 0.1 0.1 * *
Total 1.0 1.3 1.4 1.7 1.7 :; 1.1 1.2 0.9 0.7 1.0
Tinged: 24 - 34 - 44 - * * * 0.1 * * * 54 -
Total - * * 4 :: 0.1 * * * *
Stained: All grades
Light Gray: All grades * 0.2 0.1 0.1 0.1 :: 0.5 0.4 0.2 0.1 0.1
Gray: All grades
Below Grade 1/ * * * 0.1 0.1 :: 0.1 0.1 0.1 0.1 0.1
All grades 100.0 100.0 100.0 100.0 100.0 :: 100.0 100.0 100.0 100.0 100.0
Staple 25 8 shorter - - * 4 * * * * * * 28 - - - - 0.3 0.3 0.3 0.3 0.3 29 - - - - :: 1.5 1.5 1.5 1.5 1.4 30 - - - - - :: 5.0 5.1 5.8 5.8 5.5 31 * * * * * :: 11.5 11.8 16.3 17.6 17.4 32 * * * * * :: 15.9 16.3 22.8 25.3 26.0 33 0.2 0.4 0.5 0.5 0.5 :: 21.4 20.8 22.9 24.2 25.1 34 6.0 11.1 12.9 13.1 13.1 :: 23.0 21.1 15.9 14.3 14.1 35 43.2 60.1 63.6 64.1 64.1 15.4 15.8 9.9 7.8 7.3 36 43.0 26.3 21.7 21.0 21.0 :: 4.7 5.8 3.5 2.5 2.2 37 6.6 1.9 1.2 1.2 1.2 :: 1.1 1.5 1.0 0.7 0.6 38 0.9 0.1 0.1 0.1 0.1 :: * 0.1 0.1 0.1 * 39 40 longer
All staples 100.0 100.0 100.0 100.0 100.0 100.0 100.0 100.0 100.0 100.0
Average staple 35.5 35.2 35.1 35.1 35.1 33.1 33.1 32.7 32.6 32.5
Classings 23,758 247,864 514,469 580,552 582,777 ;:1,076,286 1,366,988 2,725,621 4,211,372 5,048,301
1/ Lower in grade than the lowest grades of the official standards. * Less than 0.05 percent.
- 27 -

Table 9. -- Percentage distribution of grade and staple for upland cotton classed by classing offices, 1988 crop
CORPUS ABILENE ALTOS BAKERSFIELD BIRMINGHAM CHRIST!
Classing Grade and Staple : Texas :: Oklahoma : Texas : Office :: California :: Alabama 2/ :: Texas
Total 1/
GRADE White:
11 0.1 21 7.6 :: 1.5 0.4 1.0 :: 17.0 :: 0.6 :: 6.3 30 31 36.0 :: 15.9 18.1 16.9 :: 63.2 :: 9.5 :: 52.5 40 0.9 :: 1.0 4.3 2.4 :: 1.5 :: 0.9 :: 3.1 41 19.0 :: 18.0 27.1 21.9 :: 9.5 42.6 :: 22.0 50 0.2 :: 1.9 1.7 1.8 :: 0.1 :: 0.6 :: 0.5 51 4.1 :: 12.6 9.9 11.5 :: 0.8 :: 7.5 :: 4.7 60 61 0.3 :: 2.4 1.2 1.9 :: 0.2 :: 0.6 :: 0.5 70 - :: - - - 71 * :: 0.2 0.1 0.1
Total 68.2 :: 53.5 62.8 57.5 ;: 92.3 :; 62.3 :: 89.5
Light Spotted: 12 * :: - - - 22 1.3 :: 0.1 0.1 0.1 :: 0.1 :: 0.2 :: 0.1 32 14.8 :: 9.3 10.5 9.8 :: 3.3 :: 7.3 :: 3.6 42 11.0 :: 17.8 16.4 17.2 :: 2.6 :: 22.0 :: 3.4 52 3.0 :: 12.1 6.4 9.7 :: 0.7 :: 4.7 :: 1.3 62 0.3 :: 2.3 0.6 1.5 :: 0.1 :: 0.5 :: 0.3
Total 30.4 :; 41.6 34.0 30.3 :: 6.8 ;: 34.7 :: 8.7
Spotted: 13 23 0.1 33 0.5 :: 0.4 0.6 0.5 :: 0.1 :: 0.3 :: 0.3 43 0.4 :: 1.4 1.5 1.5 :: 0.2 :: 1.2 :: 0.5 53 0.2 :: 1.3 0.7 1.0 :: 0.1 :: 0.4 :: 0.2 63 * :: 0.3 0.1 0.2 :: * :: 0.1 :: 0.1
Total 1.2 :; 3.4 2.9 3.2 0.4 ;: 2.0 :1 - 1.1
Tinged: Total * :: 0.4 0.2 0.3 :: * :: 0.2 :: 0.1
Stained: All grades
Light Gray: All grades * * - * 01 0.7 :: 0.4
Gray: All grades
Below Grade 3/ * :: 1.2 0.1 0.7
All grades 100.0 :: 100.0 100.0 100.0 :: 100.0 :: 100.0 :: 100.0
STAPLE 26 & shorter * 0.1 * * * * 0.1 28 0.4 :: 0.7 0.4 0.6 :: - :: - :: 0.6 29 1.9 :: 3.2 2.4 2.9 :: - :: - :: 2.9 30 6.5 :: 8.5 9.6 9.0 :: :: - :: 10.7 31 18.0 :: 15.2 24.5 19.2 :: - :: :: 22.2 32 25.5 :: 19.5 32.9 25.3 :: * :: 1.5 :: 23.6 33 28.1 :: 17.6 20.0 18.6 :: * :: 7.5 :: 17.2 34 13.7 :: 11.0 7.1 9.3 :: 0.2 :: 26.5 :: 11.2 35 4.9 :: 8.5 2.2 5.8 :: 4.2 :: 38.1 :: 7.0 36 0.9 :: 8.7 0.7 5.2 :: 61.9 :: 20.1 :: 3.3 37 0.1 :: 5.9 0.1 3.4 :: 33.5 :: 5.9 :: 1.2 38 + :: 0.9 * 0.5 :: 0.2 :: 0.4 :: 0.1 39 * :: 0.1 - 0.1 408longer
All staples 100.0 :; 100.0 100.0 100.0 ;: 100.0 :: 100.0 :: 100.0
Average staple 32.4 ;: 32.9 31.9 32.5 36.3 ;: 34.9 32.3
1/ Includes Kansas. 2/ Includes Florida. 3/ Lower in grade than the lowest grades of the official standards. * Less than 0.05 percent.
- 28 -

Table 9. -- Continued
EL CENTRO EL PASO
Classing :: : : : Classing Grad. and Staple : Arizona : California : Office :: Arizona : New Mexico : Texas : Office
Total :: : : : Total
GRADE White:
11 1.0 0.1 0.4 :: 0.7 0.2 2.0 0.7 21 26.2 12.7 17.6 :: 16.0 8.0 41.3 16.3 30 0.1 * * :: 0.1 0.3 0.3 0.2 31 42.3 52.2 48.6 :: 47.1 48.7 43.8 47.3 40 0.2 1.0 0.7 :: 1.0 2.5 0.1 1.6 41 9.9 17.1 14.5 :: 12.8 23.4 3.7 16.6 50 * 0.1 0.1 :: 0.3 0.4 * 0.3 51 0.9 2.4 1.8 :: 0.7 1.6 0.3 1.1 60 61 0.1 0.1 0.1 :: 0.1 0.2 0.2 0.2 70 - - - - - - - 71 * * * :: 0.1 * * *
Total 80.7 85.7 83.8 :: 78.9 85.3 91.7 84.3
Light Spotted: 12 - * * :: - - * * 22 0.5 0.1 0.3 :: 1.1 0.2 1.1 0.6 32 7.0 5.4 6.0 :: 12.3 7.5 4.3 8.5 42 4.1 5.3 4.8 :: 4.9 5.6 1.3 4.6 52 3.2 2.2 2.6 :: 0.7 0.7 0.2 0.6 62 2.0 0.5 1.0 :: 0.7 0.2 0.1 0.3
Total 16.8 13.5 14.7 19.7 14.2 7.0 14.6
Spotted: 13
23 * * * :: 0.1 * 0.4 0.1 33 0.1 * * :: 0.3 0.1 0.1 0.1 43 0.3 0.1 0.2 :: 0.2 0.1 * 0.1 53 0.7 0.2 0.4 :: 0.1 * * 0.1 63 0.7 0.1 0.3 :: 0.2 * 0.3 0.1
Total 1.8 0.4 0.9 0.9 0.2 0.8 0.5
Tinged: Total
Stained: All grades
Light Gray: Al! grades 0.5 0.3 0.4 :: * * 0.2 *
Gray: All grades
Below Grade 1/ 0.2 * 0.1 :: 0.3 0.2 * 0.2
All grades 100.0 100.0 100.0 100.0 100.0 100.0 100.0
STAPLE 26 & shorter 28 29 * - * :: * * 0.1 * 30 0.1 * * :: 0.2 0.4 0.6 0.4 31 0.1 * 0.1 :: 0.4 0.9 2.8 1.1 32 0.7 0.1 0.3 :: 4.0 1.2 7.4 3.2 33 2.3 0.9 1.4 :: 3.9 3.1 16.5 5.7 34 8.9 6.7 7.5 :: 5.2 4.7 21.4 7.8
35 32.8 26.2 28.6 :: 14.3 10.2 30.4 15.0 36 45.1 47.0 46.3 :: 36.6 17.3 14.4 23.0 37 9.7 18.4 15.2 :: 26.3 36.0 5.6 27.7 38 0.3 0.7 0.6 :: 7.0 21.9 0.7 13.5
39 * * * :: 0.5 3.8 2.1 40 & longer - * :: 1.6 0.3
--
0.7
All staples 100.0 100.0 100.0 100.0 100.0 100.0 100.0
Average staple 35.5 35.8 35.7 36.0 36.5 34.4 36.0
1/ Lower in grade than the lowest grades of the official standards. * Less than 0.05 percent.
- 29 -

Table 9. -- Continued
FLORENCE FRESNO GREENWOOD HARLINGEN
Classing Grade and Staple : North : South : Office :: California :: Mississippi Texas
Carolina : Carolina : Total
GRADE White:
11 - - - :: 0.1 21 * * * 14.4 :: 0.4 :: 8.1 30 - - - :: 0.5 :: * :: 0.3 31 6.7 12.6 9.6 :: 62.8 :: 23.0 :: 36.6 40 0.6 0.7 0.6 :: 4.6 :: 0.9 :: 5.8 41 36.7 40.3 38.5 :: 12.5 :: 53.6 :: 24.4 50 3.8 1.0 2.4 :: 0.3 :: 0.7 :: 0.8 51 13.5 5.6 9.5 :: 1.0 :: 5.6 :: 4.8 60 0.2 * 0.1 61 1.7 0.3 1.0 :: 0.1 :: 0.7 :: 0.6 70 71 0.1 * 0.1 :: * :: * :: 0.1
Total 63.3 60.5 61.8 :: 96.3 :: 84.9 :: 81.5
Light Spotted: 12 22 * * * :: * :: * :: 0.8 32 2.5 4.3 3.4 :: 1.1 :: 2.2 :: 4.3 42 22.0 27.8 24.9 :: 1.4 :: 8.5 :: 6.3 52 9.6 5.9 7.7 :: 0.4 :: 2.0 :: 3.4 62 1.2 0.7 0.9 :: 0.1 :: 0.4 :: 0.7
Total 35.3 38.7 36.9 :; 3.0 13.1 ;: 15.5
Spotted: 13 23 33 0.1 * 0.1 :: 0.1 :: 0.1 :: 0.3 43 0.6 0.2 0.4 :: 0.2 :: 0.3 :: 0.7 53 0.2 0.1 0.2 :: 0.1 :: 0.1 :: 0.4 63 0.1 0.1 0.1 :: * :: * :: 0.2
Total 1.0 0.4 0.8 :: 0.4 :: 0.5 1.6
Tinged: Total * * * :: * :: * :: 0.1
Stained: All grades
Light Gray: All grades 0.1 0.2 0.1 :: * :: 1.3 :: 1.0
Gray: All grades * * * * * 0.1
Below Grade 1/ 0.3 0.1 0.2 :: * :: * :: 0.2
All grades 100.0 100.0 100.0 :: 100.0 :: 100.0 :: 100.0
STAPLE 26 & shorter 28 - * * :: - :: - :: 0.3 29 * * * :: - :: - :: 1.1 30 * * :: * :: * :: 2.1 31 * 0.2 0.1 :: * :: * :: 44 32 0.2 1.1 0.7 :: * :: 0.2 :: 9.2 33 1.9 4.2 3.0 :: * :: 1.5 :: 25.9 34 16.2 15.7 15.9 :: 0.1 :: 15.0 :: 33.4 35 42.8 34.7 38.8 :: 2.1 :: 53.9 :: 19.4 36 33.7 30.4 32.1 :: 46.8 :: 26.6 :: 3.7 37 4.9 11.4 8.1 :: 50.3 :: 2.6 :: 0.6 38 0.4 1.9 1.1 :: 0.9 :: 0.1 :: * 39 * 0.3 0.1 40 & longer * 0.1
All staples 100.0 100.0 100.0 :: 100.0 :: 100.0 :: 100.0
Average staple 35.2 35.3 35.3 36.5 35.1 ;: 33.6
1/ Lower in grade than the lowest grades of the official standards. * Less than 0.05 percent.
- 30 - 1

Table 9. -- Continued
HAYTI LAMESA -
Classing :: : : Classing Grade and Staple : Arkansas : Missouri : Office :: New Mexico : Texas : Office
Total :: : : Total
GRADE White:
11 - - :: 0.1 0.3 0.3 21 * * * :: 5.2 14.6 14.5 30 * * * :: * 0.2 0.2 31 7.0 10.0 8.4 :: 35.4 50.5 50.4 40 0.7 0.5 0.6 :: 9.3 2.8 2.8 41 54.8 58.2 56.4 :: 28.3 20.2 20.2 50 3.6 1.4 2.5 :: 0.5 0.1 0.1 51 13.2 7.5 10.5 :: 2.0 2.2 2.2 60 61 0.6 0.4 0.5 :: 0.1 0.1 0.1 70 * - * :: - - - 71
Total 79.9 78.0 78.9 :: 80.9 91.0 90.8
Light Spotted: 12 22 * * * :: 0.7 0.5 0.5 32 2.6 2.7 2.6 :: 6.2 3.7 3.8 42 11.9 14.0 12.9 :: 9.0 3.3 3.4 52 3.9 3.3 3.6 :: 0.4 0.7 0.7 62 0.4 0.3 0.4 :: * 0.1 0.1
Total 18.8 20.3 19.5 16.3 8.3 8.5
Spotted: 13 23 * * * :: 0.3 0.1 0.1 33 0.1 0.1 0.1 :: 1.3 0.3 0.3 43 0.5 0.6 0.6 :: 0.2 0.3 0.3 53 0.2 0.3 0.2 : * 0.1 0.1 63 * 0.1
Total 0.8 1.1 0.9 :: 1.8 0.8 0.8
Tinged: Total 0.2 0.2 0.2 :: 0.3 * *
Stained: All grades
Light Gray: All grades 0.1 0.3 0.2
Gray: All grades
Below Grade 1/ * * * :: 0.4 * *
All grades 100.0 100.0 100.0 :: 100.0 100.0 -----------------------------------------------------
100.0
STAPLE 26 & shorter 28 - - - :: 0.2 * * 29 - - - :: 0.9 0.2 0.2 30 - - - :: 7.0 1.7 1.7 31 * * ;: 30.5 11.0 11.2 32 0.1 * :: 29.9 23.9 24.0 33 0.3 0.9 0.6 :: 20.2 34.5 34.4 34 3.6 7.3 5.4 :: 8.9 16.7 16.6 35 33.5 45.0 39.0 :: 2.3 7.8 7.7 36 50.6 38.3 44.7 :: 0.2 2.6 2.5 37 11.5 7.8 9.8 :: - 1.4 1.4 38 0.5 0.5 0.5 :: - 0.2 0.2 39 40 & longer
All staples 100.0 100.0 100.0 100.0 100.0 100.0
Average staple 35.7 35.5 35.6 32.0 33.0 32.9
1/ Lower in grade than the lowest grades of the official standards. * Less than 0.05 percent.
- 31 -

Table 9. -- Continued
LITTLE ROCK LUBBOCK MACON
Classing Grade and Staple : Arkansas :: New Mexico Texas : Office :: Georgia
Total
GRADE White:
11 * :: - 0.1 0.1 21 0.1 :: 0.5 13.0 13.0 :: * 30 * :: - 0.2 0.2 * 31 18.1 :: 13.6 44.6 44.5 :: 9.1 40 2.8 :: 1.4 6.6 6.6 :: 0.4 41 52.5 :: 29.3 21.4 21.4 :: 51.5 50 4.3 :: 0.1 0.4 0.4 :: 2.0 51 8.5 :: 18.0 3.8 3.9 :: 10.6 60 61 0.6 :: 1.2 0.3 0.3 :: 0.7 70 71 * :: * * * :: 0.1
Total 86.9 :: 64.1 90.4 90.4 :: 74.4
Light Spotted: 12 22 * :1 0.1 0.9 0.9 :: * 32 1.6 :: 5.3 4.4 4.4 :: 2.9 42 7.3 :: 15.3 3.1 3.1 :: 14.4 52 2.4 :: 13.1 0.6 0.6 :: 4.3 62 0.4 :: 0.7 * * :: 0.5
Total 11.7 34.5 9.0 9.0 22.1
Spotted: 13 23 * :: 0.1 0.1 0.1 :: * 33 0.1 :: 0.2 0.2 0.2 :: * 43 0.8 :: 0.4 0.2 0.2 :: 0.4 53 0.2 :: 0.4 0.1 0.1 :: 0.3 63 * :: 0.1
Total 1.1 :: 1.2 0.6 0.6 :: 0.7
Tinged: Total 0.1 :: 0.1 * ::
Stained: All grades
Light Gray: All grades * :: - * :: 2.2
Gray: All grades
Below Grade 1/ * 0.1 * * 0.1
All grades 100.0 :: 100.0 100.0 100.0 :: 100.0
STAPLE 26 S shorter 28 - :: * 0.3 0.3 :: * 29 - :: 0.5 1.6 1.6 :: * 30 * :: 5.4 7.0 7.0 :: 0.1 31 * :: 25.2 23.3 23.3 :: 0.4 32 * :: 40.7 32.7 32.7 :: 1.6 33 0.5 :: 22.7 23.2 23.2 :: 6.8 34 5.4 :: 5.0 8.9 8.9 :: 18.7 35 49.6 :: 0.4 2.4 2.4 :: 31.9 36 39.9 :: * 0.4 0.4 :: 26.3 37 4.4 :: - 0.1 0.1 :: 12.7 38 0.1 :: - * * :: 1.2 39 :: - * * :: 0.1 40 & longer
All staples 100.0 100.0 100.0 100.0 100.0
Average staple 35.4 :: 32.0 32.1 32.1 :: 35.2
1/ Lower in grade than the lowest grades of the official standards. * Less than 0.05 percent.
- 32 -

Table 9. -- Continued
MEMPHIS PHOENIX RAYVILLE - WACO
: Classing Grade and Staple : Arkansas : Mississippi : Tennis... : Office :: Arizona :: Louisiana :: Texas
Total
GRADE Whit.:
11 - - * * :: 0.1 :: * :: 0.2 21 * * 0.2 0.1 :: 12.3 :: 0.4 :: 9.8 30 - - * *. :: 0.1 * * 31 9.1 4.8 14.4 11.9 42.9 :: 23.6 :: 33.2 40 0.7 0.2 0.5 0.5 :: 0.3 :: 0.8 :: 4.9 41 51.7 42.4 34.3 37.1 :: 18.7 :: 54.1 :: 19.5 50 2.8 1.6 1.2' 1.4 :: 0.4 :: 0.7 :: 0.7 51 11.9 11.2 4.6 6.5 :: 1.3 :: 6.4 :: 3.7 60 0.1 61 0.5 0.6 0.2 0.3 :: 0.3 :: 0.4 :: 0.5 70 - 71 * * * * :: * :: * :: 0.1
Total 76.8 60.8 55.4 57.8 76.4 ;: 86.4 72.6
Light Spotted: 12 - - - - :: - :: - :: 0.1 22 * * * * :: 0.7 :: * :: 3.0 32 4.4 4.5 13.6 11.0 :: 11.4 :: 1.6 :: 11.1 42 12.3 25.8 23.3 23.3 :: 6.0 :: 8.3 :: 8.4 52 4.1 7.0 5.1 5.5 :: 2.2 :: 2.5 :: 3.1 62 0.3 0.7 0.5 0.6 :: 1.8 :: 0.4 :: 0.8
Total 21.1 38.0 42.5 40.4 22.1 :: 12.8 26.5
Spotted: 13 23 * * * * :: * :: * :: 0.1 33 0.1 0.1 0.3 0.3 :: 0.1 :: 0.1 :: 0.2 43 0.6 0.4 0.9 0.8 :: 0.1 :: 0.2 :: 0.2 53 0.3 0.3 0.4 0.4 :: 0.1 :: 0.1 :: 0.1 63 * 0.1 0.1 0.1 :: 0.1 :: * :: 0.1
Total 1.0 0.9 1.7 1.6 :: 0.4 :: 0.4 :: 0.7
Tinged: Total 0.1
Stained: All grades
Light Gray: All grades 0.8 0.3 0.1 0.2 :: 0.7 :: 0.1 *
Gray: All grades
-------------- Below Grade 1/ * * * * :: 0.4 :: * 0.1
All grades 100.0 100.0 100.0 100.0 :: 100.0 :: 100.0 100.0
STAPLE 26 & shorter - 26 - - - - :: * :: - :: 0.1 29 - - - - :: * :: - :: 0.6 30 - - - - :: * :: * :: 3.4 31 - * * * :: * :: * :: 9.9 32 * 0.1 * 0.1 :: 0.2 :: 0.1 :: 16.4 33 * 0.9 0.5 0.6 :: 0.9 :: 1.0 :: 18.2 34 2.8 13.7 13.1 12.7 :: 6.6 :: 13.6 :: 18.9 35 37.3 59.2 64.1 61.6 :: 33.4 :: 53.8 :: 20.8 36 55.2 25.1 21.0 23.7 :: 48.6 :: 29.0 :: 9.8 37 4.7 1.0 1.2 1.3 :: 9.7 :: 2.5 :: 1.8 38 * 0.1 * :: 0.4 :: 0.1 :: * 39 - * * :: 0.1 408 longer
All staples 100.0 100.0 100.0 100.0 :: 100.0 :: 100.0 ::100.0
Average staple 35.6 35.1 35.1 35.1 :; 35.6 ;: 35.2 ;: 33.5
1/ Lower in grad, then the lowest grad,s of the official standards. + Less than 0.05 percent.

I G) I I C" I I fUW I I L I C'J C'J (V) CT) CT) v L() LO IT CT) ('J -i -. -. L() CJ
I ' v lqt At lw V lw V, t >E I
-c I I 0) I I l•I
o I I I L I I I
I I WI 4-' I I 0 > I (0 0) N (0 U) U) U) .-' U) CO U) C\J 4-1 4 44 C'J
I ICT)cO I • . • • . . • • . - I I L() m.0 I 00 .- -' - (T) CT) CT) CY'.i C-'J 0000 0 -' 000 0
U) I I I to I I I
I I I - I 00-I
I I
• .••' I I
01 I I cLI I C-J I o C) I I -U) I C'J CJ 0 0 cli N 0 v (0 ('.J ' 0 0 0 N U) 0) CL) (0 4-' I I I I • • • • 4.' 0) I I 0 I (T (0 ) (0 (0 't (r) C.J .-i - .- -i -1 0) - 00 0 o U) I I U) I 4-i ..i ..l 00)1 -il
I I I
I I I- C (UU)I I I -WI I I
0) I m I I - I N N (T) U) CT') 0) N C'J N U) 0) 0) 0 (0 U) CO C'-.J 0) 0) I I • • .4.. . . .
L (/) I I U) I C'.J C'J 0) 0 0) 0) 0) 0) 0) N (0 (1) C'J CsJ - U) (0 U) o I I CT) I 0)(7) (0 (0 U) (D N N N N (7)0)0)0) 0) (00)0)0) 0)
I I WI I I
(O+'I I I I 1.1
0) CI WI I cDI WI I C/) (0 I 0)1 I < < L -O I C I Cr) I WW(0CJ C-J Z N 0 N C'J (I) U') ' 0) - N U) Cr U) U) C'.J
c (01 I I < • • 0 Z<
• • 0.. a' CO I L I co I Cl) C-J -. -i C-.J CsJ N4 C. .-. .-. C"J • C.-J 00 CJ C'J C'-.J La. 0 -' C'J ('4 ('4 'IfI I U) I .- U) 0)1 I -J
0) I - I I < < I C)
CII I E I • I o+'I I I
WI I C I I ('4 I
C-1 >- I I Cl)
I NU') (0(T • - Cr) (0
10 10 I
I CJ -i U) U) N N . () 19 Cr
U) . U) . 0 I 000-4 .- 0 - ('4 (0 00 ('4 ('4 ('4 00.-i
-I I U) I .OWI I I
I I LOI I I
1.1 (ALl I I --WI I I
I Cl) I I I ("4 I 4 -' CJ V It 0) ("4 N ' U) 4 .'-' - ('4 ('.4 I " LO U) W0I I I I ••• • • ••• • ..• . ...
0) 0) I I N I 000 0 000 ' -. 0 - ' .i 000 0 CO--I I ('4 I
C•-I I I 0)01 I I 00), II L CL I I 0)0)1 I I
04 I I 3 I CT') -I ('4 V LO 4 -Ic (T) U) U) I I
I I I(DC -I • . •• • • I I I N 0) I 0 C;O 0 0 0 0 0 0 00 0
I I .01
0 I -
I I
I
0) I I
(0 I I 0 40 0) 0 -00) 0 - 00) 0-00) I (C') (0(Y) CJ Cl') (0 CC') ('4 U) U) U) ('.4 U) U) U) ('4
O L L. L L I --0 I 0) LL 0, LL 0) LL 0) LL I L L .0L0) W a) 0) .OLWO) I C I E 0) .0 0 0.
- .OLWW E 0) - - C- E 0) .0 - Cl. E 0) .0 .0 0.
I W.OEE 0 0)OEE 0 W.OEE 0 WOEE 0 I I 41 000 L +'OW0) L 41 000 L +'O(,O) L I I 0.4-' > 0 C..) C.. 4-' > C) U 0. -4-' > 0 C) 04+' > C) C) I I 0)000) 0,000) 0)000) 0)000) I I U) C) Z C) (1) 0 Iz C) (/) 0 Z C) U) C) Z C)
- 34 -

I 0) I ma,
I L - CD If) ' (Y) CT) (!) C'I CsJ C'J '-I 00 0 0 C\J - - - - - - - - - - - - - - - .-
I > E I
I I
I ('i
I I 0 > I CD 0 00 (T) C'J .4 .I -4 — 3 - 3 3 4 I 3 3 4 4 I ICOcol . • . . . . I I C'-J C'J C'.J 0000 0
I I I I
U) 10
I I I I I I I J
I •..... I
I I
I ("i I I I If) I (0 If) ('J U) CT) co C-J or) or) Cr) (0 LI) CD CD CD I CO CO ('J C'J I I I I • . . • - . . . . . . . . I I 0 I CD (Y) 00) U) C'-J C-J - -4 -. 0000 0 000 0 I I I I I I
I I I
I I I I
I I I
•..... I I I
0) I I - C'.i 0 (0 Li) U) N CT) N CJ 4 (J
. N -' N CJ U) U) U)
I U) I . .
(7) L"J U) (0) (-J
. . .
CD U) . .-. -
U) . . .
CO CD w CO CO I I
I I I
(0) I I
00 U) U) 00 U) 0)0)0)0) 0) (7)0)0)0) 0) (7)(3)0)0) 0)
I I
I (1 I
I I
on) I 0)1 I < Z a. Ck I C I CO I rn—s (0) (0) 0) U') 0) <CD CO U) 0 0 — LI) — C'J C'J D 0(7) (0) N N 1(0? I I CD.... . . . . . (/) . . . . . 0.... I L I CO I 00 0 C'J C'J U) 0 C'J (0) (0) (1) (0 CO ' (0) 0 CJ C'.J C'J I I CO I 0 I a'? I Lii ) (I) I-I CD 0 CD
II I I
• I I
I I I I
I C.J I
I I CO I -Ic C.J (0 0 "t ('4 CD LI) N N LI) U) N N 0 LI) I I I I
I I 0 I
. . . 00 ('4
. ('4
. . . 00 C'-JC'.J
. ('4
. . . . .4 -. ('4 ('4
. ('4
. . ('40 ('4 ('.1 ('4
I I I I I I I I
CO I I I I
I I I I I I
I I
0) I I I ('-4 I ('4 -I' '40) C'J ('4 CD 0 0 (0 0) 0 0 .-' 0) 0) 0) I I I I
I I N I
• . .
0 00 . . . .
000 . -
. . . . 000
. . . 0000 0
I I I I I I I I
('4 I
I I
I I I I I I I I
I 3?
CO CD 4 .--. ('4 ('4 4 -9 ('4 CO (T) I -Ic C-j ('.4 ('4 . . . . . . . .
a' I I ('4 (0 0) I 0 0 0 000 0 000 0 0 0 0
C I I I
C I .......... I o I I U I I
I 0-00) 0-00) 0-00) 0-00) I -c I CO CO (0) ('.4 CO CO CO (1.1 Cc) CO (0 Ni CO CO CO 64
I O I L L L L 0 I 0 I 0) LL 4 LL 0) LL 0)L L
I L LI .0L0)4) .OLW(1) .0L(DW I *2) C I E 0) -0 - o. E 0) .0-0 o. E 0) -0-0 0. E 0).0 .0 0.
0) I 0.+' I 0)-0EE 0 W.DEE 0 w -DEE 0 (P.DEE 0 - I I -P00)0) L 41 00) 0) L +'Oa)O) L -P00)0) L
I I 0. -P > 0 U 0. 4) > () U 0. -I-' > 0 U a-+- > 0 U (0 I I 0)000) 0)000) 0)000) 0)000)
I— I I Ct) 0 Z 0 (1) 0 Z 0 (1) 0 z 0 (1) 0 0
- 35 -

I a' 0) I
L - I I N CD U) It) I CJ (T) C'.J C.J ' Cr) U) (r) (T) 0) Cr) () (V) (Y) ' CT') v W - lKr
I > E I
I I
I I It 4 4 4 I 4 - .-. -i CT) If) 0) - Cr) CT) C"J C'.J CJ C'..J I IU)COI • • I I U) m I 00 0 000 C'J C'J 0000 0 I I I I I I I I
(Cl I
I I I I I I I
• I I
I LO I I I 4 4 4 I N — 0 0 C'.i 00 0 C"J CD U) v 0) 0) N
C'J C'J CJ N CJ Kr N N -i — I
I I I
U)
I I
I I I I I
• I I I
I C'J C'J N I N 0) CJ 0 N CD U) 0 0 (flY-i - 0 If)
I I It) I CD 'ci' CD U) CD U) Itr 'ci N 0 CD LI) U) 'ci- - C'-J I I I I
CT) I I
N CD U) U) 0)0)0) 0) 0)0)0)0) CO CD 0)0)0) 0)
I I I I
I I
I I 1 z -, z I a'l I U
I 0 x 0 I C I CT) I > I - '-i CD IT I CT-i CT) (7) 0) CD N CD U) ci 'ci C C. C) C') CD 0 Iral I I LTJ • • . . .. . . 2:... • . . I L I Cr) I C"J N N N C) -i <C'J C"J C'4 C"J CT-i U CD C'.i C'J CT-i CT)
I (T) .-'.-.-- I WI I X 2: II I hi I'- CD I'- I--I I Z II 1 0 0 I I I
I U)
I I I C'si I
I N C) CD CD I 'ci- U) Iq At N N U) U) N (D CT) C) C'-J C) I I I I
I I
0 I • .
N CT) N .
N • • . 00
. • . . . . . • CTJ C"J
I I I I
I I
Cr) I I I
- -
I I I I I
I I
C) I I I C"J I I CD 0 U') CT4 I 4 4 '4 U') Cr) C') U) CD N 0) .-. C".J CD 0) I I I I
I I
N I . • .
'4(0 .
N .
0 .
0 . . .
0000 •
0 .
0.000 0
I I I I
I I I
C'J I I I I
I I I I
I I
I I
31 I I 0 I I CT-i 0) It) — I 4 4 .-" — — C'J CJ (r) '4 -. 4 4 (",J C') I ICDC —I .. • . . . . . . I I N 0' I 00 -i 0 0 00 00 0 0 0 0 I I I I I I I I
I I I
U) Cr) (T) C'J L a L L
L a, a, E a,o,o o. a,oEE 0 -4-0Wa, L c+>o C) WO0 0)
00Or) U)U)U)C'J L CD LL - L w a, E W0-o Q WOEE 0 40WW L 0.+>O U (fl0ZC)
- 36 -

I (OW I
I E I
I I I I I WI I I I ICr) Col I ILI)m.0l I I (DI I I I I I
I I
I I
I I I 1 C'J I
U) I I I I I I I 0 I I I U) I I I I I I I I I I I I I I I I I 0) I I I I I I I I I U) I I I (Y) I
I I I I I I I I
I • I I
WI I I 0)1 10,1 I I CI (5) I 1(01 I I (LI (0 I I I CO I I WI I I-MI I I •- I I II I I
I I
I C'J I I I I I I I I I I 0 I I I (0 I I I I I I I I I I
I I I I I I I I 0) I I I C'J I
I I I I I N I I I C'J I I I I I I I I I I I I I I I I I I I 31 I I - oI I ((DC -I I IC\J(0WI I I .01 I I I I I I I I
-C I I 0 I O I0 I LL I
41
(') (T) (.J CsJ CJ 0000 0 0 - -1 .-i I I
0) 0) LI) LI) ' N LI) LO LI) LI)
0 cocc C (C) d
O M -so 0 a) N v (Y) (%J W (5) qw v - 444 4 C\i Cs4 C'J C4 C'.J CJ C'J ei C'J CJ I
U) CT) U) 0 N CT) 0) (r) I
a) 0) (0 a) Cr) .-i — — U) 00) N N I 0)0)0)(3) (3) NNU)0) a) 0)O)a)a) 0)
U) Id -
Id I- Id U) (r) (r) (0 CV) CV) (I) (DC'J N qw U) I- N N OCr) (0 U).... • .• . . (I).... • I U 00-4 ("J CV.J )< 0) 0) N N N (0(0 I z U 0 Z 1- Id I
LI) LI) (Øi N 0) 0) (Y)C'J 0) CD
000 '-4 (D(DU) LI) U) V C'.i CsJ (0 (V)
I -4c C-,J Ict '0- C'J (') (0 0 - 0) U) 0) C-'J Cr)
00 0 4 '-I .-1 (\J C'.i 000 4 I
1+' IC
4 4 -k It CJ (0 '0- (0 'i ' 4 C-J (0 '0- I 0) I 0
00 0 0 0 00 00 0 I L '0) 10.
0 0-00) 0-00) 0-00) I C (0(0(r) C'J (0(Y) (') C'J (Y)(0(V) C',J I a;
I_c L L L 1+' a) LL a, L L 0) LL I
OLWW 1W E 0) -0 .0 0. F 0) .0 0. F 0 .0 .C) 0. I U) 0).OFE 0 W.0EE 0 0) -OFF 0 Ia; +'OwW L 41 00W L +0wW L IJ 0. 4-' > 0 U 0. 4-' > 0 U 95. 4.) > 0 U I 0)000) 0000) 0)000
U) 0 Z C) U) 0 C) U) 0 z C) I 4
- 37 -

a; I I 0) I
U) I a; I a; l L I I 0Cfl-Cr) ~ I -- I '- a) CY) .- m I >E I 4-JI I U) I
I I •0 I I 0) I • •. I
I I I I I
C u I I — (0 4 LI) N- 4 CM I lCY)cOI . . .
I tn m t
I I C I I I I l•l
•0 I I I I I I
a, I I C-.J I U) I I
LO I a) Cr) 4 N - U) 4 0) Is, I I I I . . (0 I I 0 I 0 (0 LI) CO (0 -1 - I I LI) o I I I
I I I C I I I o I I • I .fJ I I I 00.1 I 0) I O 0 I I 't I Cr) 0 (0 a) 0 (Y) CT) N
L I I . . . . . . 0 0I I LI) I 0) to U) N CT) C I I (T) I a) U) a) (0 OD OD (0 0) mU)I I I —(01 I I 0.0)1 I
I WI I L I OU)I0)
0) II w I
a) I C Ia) I C-.J CT)It V (0 — o cdi i . . . . . .
U) - I - I CT) I LI) a) C'J C'J CT) — LI) C'-J W'.-I I (T) I Oi- Ia;I I C0II I m I--I I 1. 0) I I •It CI I al--I I I
4flI I C'J I -- U) I I CT) N- 00) E101 I I I • • .
I CT) C'J ' a) .4(D I (T) I
0 I I I I
C.OI I I 0 I I I
4-' I I I I I 0) I
.0 I I C.J I 0) (0 (0(00) N- I I I I
L • • • 4 . S S
I I N- I 4000 U) I I I
I I I I I • I
0) I I I 0) 31 41 I I v01 C I I (0 C — I CT) a) (1) (0 4 N- CsJ a, I IJ(0WI . . . . . 0 I I .0 I 0000 00 -1 0
I I I 01 I I I
I I
I I I I I --
I • I 0) I U)
I Ca, I I •-o I —E L
0) 0) •-.0 OL a,
— ms.. a - 4-I0u .0 I —Q I C IbC (n U) 0) I C_) I WWI-
4-1 -V L L 0 (0.- 0— - - I < CO CO C) LJ W U
— CDCJ U)UDN- C"J O)C'JC)r- 0000 0— CJ (0 0 a) -. C%J I
— I
CT) — ('.J LO 00C'.J (0 v(0-- U) CT) I LI) .i N- CT) 4 —CO C'-J a) N- (0 N- I 0) 0) OD C) 00 a) N- (0 0) N- a) N- CO I
LDCT)N- (O .-40)U)0) (000Cr) (0i C-,J 4 N- 4 N- CJ N- (.i '4 4 a) 03 I
N- 0) 10 N- C) - 0) LI) ucjcocj .-4C4(0 a)I
LI) 0 N- 0 0 ('40 ('4 (0(0 0 CX) a)
0 .iO -4 C'4 — a) .i 0
1+' I C I a)
.-4 ('4 — ('4 LI) ' 0) N- - It) ('-4 a) qt I 0
. . . . . . . . I L 0000 0000 0000 0 I a'
10.
U)I CD c
o 0C 0 ow C U)! 00) -Y WX — tin
03C (O(lyO ---- -0 1 U) CC---- W— OC .C-- 0) a, U) a; — 4-' a, 4-'.0 0 0. a > 0 a,a;L>. E -p -oo Eo>.o --I LL(0I0 io -- m wcmm C I
La.. W J _J ..i E E O Of I 4
00(7).- It CsJ0 .41
4444 .4 C.JU)CJ
U.)
odoc,j a)OC'J 01
-
- 38 -

I - I I W+' I I 0 0) I .-. N Cr) U) (L) 0) If) N. N (0 00 -. .-. - It (0 CJ Cr, cJ I 10 C I . . . • . . * •
0) I L 0) I In LI) LI) (T) (0 (0 (0 (0 LI) If) LI) LI) If) LI) 0) 0) 0) 0) I a)L I JC\JC'J C'J C!.JC'JCJC'J CsJ C.JC'JC'JN C'J N cq JC\i C'.J o I >4-' I L I <U) I
.4.4 I • I I I
I I 0 > I 4 CJ (0 a) a) In It N N qw C'J 4 ' -' — I N CT) C) (0 In I IC•.JCO I • . • . . • • . . . . . . 000 0 0 C'J - - - 0 00 0 C)
C) I I I
C I I 1.1
I o
I I Cl) I In 0 (.J In N 0 CJ N C!) N N (0 CO 0) a) 00 CT) 0) In
I • . . . . . • • • • • • • • • o C. I I 0 I 0 CsJ In In .- 0 0) 0) CO 0000 0 CT) CO ('J C'J C'J C) 0 I I CT) I -' CT) (') co CT) LI I I
001 I I C I •I • I COCOl I I
OD I (7) I (1-0) I - I C'J I 0) N 0 a) In 0 a) '- -. 0 C) - 0 0) CO N a) 0 D-II XI I I • • . . . . . . . . . . . . .
I 0' I 0) I CO a) (C) (0 C'J CT) N (0 In LI) In (0 (1) — -i 0 C) 0 C'J C'4 C'.J C'.J .-. (0 - (V) < 0(1)1 I I 4--WI LI I 4-4 0) ....... I (n(0I Q.I I 0)41 I N I C (I) I U) I C'-J I 0 (0 0 CT) (0 C') LI) (0 N- 0) V4 0 (0 (T) C) LI) *- N- IEI I I • .. . • ... . .. .. . ..
0. t) I (0 I (0 I co .-i In LI) In .J 0) .-i - .-.. (I) C) .- — -i (ON CT) C'J Cr) D 0) I L I ('J C ('4 C'4 ('4 ( ) CV) C!) ('4 ('4 CT) CT) (T ('4 - - -. 0+'I 0)1 I
DI OIl I (1) I (I) ('4 I <In (0 N- CX) ('4 <('4 (JD Or) CO Cl) <(011) -' (X) — U) ('4 - 0 - (MCIO)I I I • . . . • Z • • . . . (1).... • . . C (0 I I I <N CL) — C) C) C) (0 (-4 (-.4 CT) < Z In C) a)N a) CD 0 (--4 C-JC'J C'J 0) I = I (-.4 I CX) CT) CT) co ('4 ('4 N.J (') ('.1 (4 ('4 ('4 <LI) ' L. In OD I <
L+'I 0) It) I - I ('4 I It) V (0 0) 19t N C) If) - ('4 (.011) (r) 0 0 V, N- LO LI) (X) - 14I I I • . . . . . . . . . . . . . . • - >- I 0) I ('4 I (Y) COO a) a) (.0(C) N 0 C') C') (V) Cl) 000 0 4- - I C I (4 I CT) ('4 ('4 *4
I WI I
01)1 I COI 0 - I L I (4 I It) N 0) LI) In N- N I 0 a) N N- I --LI OIl I . . . . . . . . . . . . 4-'(D I I 0 I (D CT) (V) CT) ('-4 00 — -' 00 0 000 0 0I --I ('4 I ILl I
I I L0)I I I I I
('4 (4 ('4 ('4 C'J I I I . . . . . • . . 0) I I a) I 0000 0 0
. 00 0 000 0
0) U) I I 10 I I I
I I ......I C I I I U I I 31 C) I I 001 4444 4 I.-44 ' 1114 4 1111 L I INC -I 0) I I -t0W1 0 0 I
I I I I
.01 I I I I
• ..........
I 0-00) 0 - 00) 0 00) 0 O 0) C') (0 C) 4 CT) CV) C') ('4 (T) (0 CT) ('4 CO CT) (') ('4 - I I I I L L L L
0) I om LL 0) LL (D
LL 0) LL 4) a) .0L4) W .0LUW .0L4)0) - I L L I E 0) -D - 0. E 0) .o - 0. E 0) -0 - 0. E 0) 0 a- m I I WEE 0 0) -DEE 0 W.DEE 0 0)0E-E 0 I- I Q-4- I -(-'00)0 1. 4'OWW L -P00)0) L 4'OUW L I I 0.4-' > C) Ci 0.4-' > 0 Ci 0.4-' > C) (_) 0.4-' > () C) I I 0)000) 0)000) 0)000) 0)000) I I (1) 0 Z 0 (1) CD Z 0 () 0 Z C) (f) C) Z CD
- 39 -

LI)U(DCD (0 C'JC\JC'JC'J ('1
N C'JCO CO CO N co U) U) U) e.i IV v
U) w It v mt LO LDU)U) U sJC.JC.JC'J 0'4 C'JC\i('JN ('4 ('JCJC'JC'4 ('4
(D (0 CO
0 00 0
('4(0(0(0 (C' 4444 4
dodo 0
(r)(ØU) CD - U) U) U) CC' ('4
I'U, U,
.44(O(D CD
C'4 Cr) CO () (0 0000 0 ocd c;
C'JCflLflLt U) -1 U, N N - N N
CO0CD (.0
('4 (D0 CO - NNN r- 4 —iC.J(J ('4
-c I I 0) 4J I
I I La) I
>4' I I <U) I
I I WI
I ICJcOI I icrm-i I I
I I I
I I
I I I
$ I - CO
I I I
I I I 0 I I
I I CO I
I
I
I 0)
I
I I_..I IXI I I wI a) I
C'J I
I L I I I ..I
I N I I WI C'J I I El I I I m (0 I I LI ('4 I I CII I ..-I I I I 0)1
......
I (0DII
(1L)'4
I 11 I I CII I
I I I ( '4 I
Ia) I I
......... I I
(CO"J
I I
i-Cl I I4'I I I DII ('
I4 I
I CI ('.4 I I WI I L$ I I4I ...... I
WI I
I LI ('4 I I WI I I I-I 0 I I•-I ('.4 I ILLI I I
I ......
I I I
I I I C)
I I
I I I I
I I
U)I I I
I I I I ......
I I
0) I I 31 I I DOI
C I INC - roWI
-I I i
4' C I I I o I I I UI ..........
I I
• I I o n I
-4 I 0 I I LL I
a, I I - I I
I I
(0 CO CD LI) U, CD N C'.J N N U, U, 0 0) ('4 014 (T) U, LI)
C) N LI) LI) U, CD ('4 U, U) If) CsJL() CD N- (0 CD - C) 0) 0) cli CO (() CO CO 1 ('.4 C'4 ('4 ('4 ('4 ('4 ('.4 ('4 ('.4 (0 Nr (Y) CO CO
-4 a_ -4
Z CL <U) (7) ('4 ('4 0) <U, Cr) U) CO 9.0 -i (0 4 0) U, U, D -i 4 (7) N CX) • • • • • (7) . • • . • C) . . CD N (0 (0 U, Cl) 0) ('400 0 (1) U, -. C) C) C) (I) CO CO CO (0
Cr) CO ('4 C'J ('4 '-' U, U, -0- (f) It 10- Nr It C) U) -4
LU 0 (f) Z CD —4
00 C) 0) U) (7)— ('.4 (7) CC. ('4 N (C' It Kr v Cl) U, CO (0 0) .-' N N N (T) 0) N (0 CC. 0) N N .N N CD N (7) U) (7) 1-4 ('J
C) C) N CX) CX) Cr) ('4 ('. ':..i C)
-000 0 -' 4 '-' ' 00 — -. ('J 000 0
1444 4 I-44 4
00 0 0 0
1111 I 1444 4 I 4-4 4
0-0C) 0-4 00) 0-'0 C) COCOCO('J COCOCOC'4 (000COC'J L L L a) LL 0) LL 0) L L .0 La, a,
0) E W.0EE 0 W.OEE C W.OEE 0 4'04)4) L -4-'oWQ) L - I-'OWW L 0. 4' > C) (_) C). P > 0 C,. 4' > C? U 0)000) 0000 0)000,
Cl) C) Z C) CO C) z C) (() C) z C)
1-.-4 — 00
0—'OC) CO (7) CO ('4
L 0) LL E W.C'EE 0 4-'O(DO) L 0.+'>O U 0)000)
Mm

I I
I - I
I 0+' I I 0' 0' I I C-.J CD C) I CO CO (T) CV) .3 U) 0-s 0 I .3 C"J CV) (V) I to I . . . . . . . . . . . . . I a, I a a) N U) LI) U) It, (0 (4) (0 LI) LI) U) Lf) U") LI) 0 L Cl) C'J C..J C'J C".J IN CJ (%J C-'J C.J C'J C'J C-si CJ CsJ C ,J C'J I I
4c ul
I I - > I Co C'J N - I I Co CO CV) 0 CO - '-i a) I C'J C'.J CO CO I lC.Jzo . . . . . . . . . . . I I CO Co .D (0 U) 0 0 0 0 0 -. 0 N.3 CO 00 0 0
I
to
I I
I
•..... I
T) I I
I (0 - .-' . . . C) . I CV) C).3 (T) N- N (4) CO U) I U) N N N 0 I N. N C'J 0
. . . CO 'J C\I
. C'J
. . . CV) C'J 0 CD It) C'J .-i •- -. I
I I I I
(Y) I
I
(T) CJ CJ C'J - -4
I I I
I I I
(LI) - I I I 19t (r) Q N- I 0) CJ - C'.J CO N U) CV) N- I .3 0 11) CD txi I . . . . . . . . . . . . . .
I 0 I CO N 0 C) N C"-J 0) C) 0) 0 LI) CO 0) CO .3 C'J C'J C-.J I 4-4 I C'-i C'J CO ("J C'-J C'J - -. - I L I WI
0.1 I N I
I I C'.J I Cs,i C) .-' C) I (Y) CD C'J -. N LO 0) N (r) I C) N (V) (Y) . . .. . . . . . I (0 0 C\J C' -4 -4 II) a) C) a) a) U) a) 0) 0) C'J C'J Cl) (V) CO CO .- -i .-, .-i •-1 C'4 C'-i C'J C'J I 0I II Z Z I WI I Ci I 0) I LI) I '-4 0 m 0 I (0 I C-J >< I 0 ()) If) C-.J Or I C\i At CD a) 0 CO (C a) N If) I CJ U) '-.' C) 10)1 I U . . . .. . •
(.) (\J CVJ C'J J < - .- If) 0 .-s Ci (C CX) a) a) I C-'J .- '-.4 It .3- .3 .3 .J .-i C'J e- CT) CY) CT) cr) C') CO CDI I II U I- 0 • Z :D I I 0 0 z Ct) I -C I CsJ I -i 00 U) 0) I CO 0.3 .3 0 0) CTJ a) N I U) - N U) . . . . • •. . . . . . . I 0) I CJ 0 C'J.3 U) 0) .3 Cl) CV) CO (r) (0 -' C'J (0 N (C CD I C I C'j - - .-i - _•-1 .-s (NI (NI - - -' - I WI I LI l+'I ...... I WI I I I L I (Ni I I 4 CD (7) -' I I - C) 0) CC) CO CO - CO I .-i(Ø If) U) 10)1 . . . .. . . . . . I -0 I 0 I 00 — - 0 0 C) U) U) N N —. - - - I--I (NI I 1 LL- 1 I I I I
I I ......
I I I I I
C) I (NI (NI I I I I I N U) CO CD (0 I
I I I I
0) I I
• 00
. 0
. . • . (() - — —
. - 00 0
I I I I I
I ......I I 0 I I 31 I I ') 0 I I I -Ic -Ic -4c I I — .-' 4 N Li) .3.3 .3 I -Ic C I INC —I • . . .
00 .-. 0 00 0 C I I I o Cii ..........
I I 0-00) 0-00) 0-00) 0—'OC) I I I
I - CO CO co C'J CO CV) (V) (NI C') CO CV) C'J CO CO CO (NJ I VO) I L L L L ('4 I O I 0 LL 0) LL 0) LL 0) L L I •-0 I 0 LW W 0L0)(D L a) (D LW 0) L L I E w -o .o C, E 0 o .o o E 0) - 0. E W C - 0. WOEE 0 W.OEE 0 W.OEE 0 0)0EE 0 - I Q41 0wa, L -'owa, L 4-00)0) L +'OWO L I 0 4> C U 0. 4> > C L) 0. 4-' > 0 Ci a. 4-> > 0 (_) (U I I ()000) 0000) (D000) 0)000) I- I I (no 0 U) 0 C) (1) 0 z 0 (1) C) 0
- 41 -

I I -c I
I
I Y'- LflU)N N "- (DN N 0C0a)O) a) I cc c L 4) - ,- '- (V) C)) Cl; LI) LI) U) LI) I a, L I C'J C'J C'J C'.i C-J C'J C'J CsJ C'J CJ C-4 C'J C'J C.J C-SJ >4- I <U) I
I I I 1•1
I
4c 4c 4 C'JCO(DN LI) I I IC -'Jcot . . . . . . . . . . I I C)) (0 .0 I 0 0 00 0 0 C'J C'J C'J C'J I I I I I
(01 I I
I I l I I
I I
I I
Co I I '-4 C'-J C4 C'J N C-J U) 0 0) a) - Co 0) I I I I I
I 0 I
. 000 0 . .
0-4 - CJ - . .
0 (0 aD a) N I i
I I I I
Co I I I
I I
I I I
I I
•••••-I I
0) I
I I
I - N - U) U) 00 a) N U) U) U) 0) U) .4 I X I I I • a, I OD I .-. -' C.J C)) () Co ' CD a) (0 Co 0) - LI) U) I
I LI I I WI 'I I 0.1 I I I N I I I U) I I (0 0) ('.1 U) 00) (7) Co I El I I • • • . • • . • I (0 I CD I L1) 0 CsJ 'O CsJ Itt 0 Co ' (0 0 co Nr Nr I I L I C-.J I C-'J (J C'J C\J CJ .-. .-' CJ ('4 ('4 ('4 CJ ('4 ('4 I I 0)1 I II I (I)
I ......I Li I WI I ILl I- I 10)1 U) I Li < I
(/) LI) a) (0 - ('4 (l) Cr) 0 0) (0 .-. I- Co U) ('4 LI) 0 I 10)1 I I (/) • • . . . . . . . (I). • . • I I - I Li ('4 0 C' )< . ('4(0 N a) 0) (1) Co (N Co I
I C'J I Z If) U) If) LI) U) Li Co Co (0 (0 (0 C) (r) Cr) Co (0 Co IU)I I Z I- Li I'l I Li -
I I Z I -'I Co I I
('4 I Cx) Co CT) 0) X. CD 0) (0 a) 0) a) N 0) IT I . • . • I
0) Cr (N 0 .
04
Co 0 0 N C'4C'J (N Co Co ('4 ('4 ('.1 ('4
I WI I I LI I I
I (Al I I I I I L I
I (-4 I I ('4 (0 ('4 ('4 (0 LI) N N C-i (0 Co N U) U)
I I
I 0)1 I I • . . . • . . . . • . • • I 0 I Co N U) U) 0) (-"4 ('4 ('.4 I
ILI I I
I I
I
I I I
I I
......I I
0) I
I I
I I I CD cT) N ('4 . .
-' .
Co 0) LI) 114' . .
'0' I
I I 0) I (T) Co .1 -. ('4 000 •
0 I
I I I C
I I I o 0' I I 31 L
I I o 0 I I I I I I N- CD Co ('.4 ('4 '0- ('-1 C I INC -I • . • • • • 0.
00 0 0 0 0000 0 U) C I I I 0
o I I I L) I .......... I
I 0
I I 0-00) 0 .4 0 0) 0 '-4 0 0) I
C I I Co 'Y) (Y) ('4 Co CO CO ('4 Cr) (Y) Co (-'-4 I I I
• I I L L L 14-' (N I 0 I 0' LL a, LL
I ---0 1 .,OLa,a, LWa, OLa,W I U) L - I E 0' £ 0. E 0) 0 .0 0. E 0' -0 -0 0. I (A 0) I 0,.c I W-OEE 0 W.OEE 0 0).OEE 0 10'
— I 0- I -P00)0' L -P00) 0' L -POa,W L IJ 0. 4- 0 u C). 4-' > C) L) 0.4- > 0 L) I
(0 I I WOOW WOOW WOOW I (I) C' z C) (/) 0 Z 0 CI) 0 m 0 I 4
- 42 -
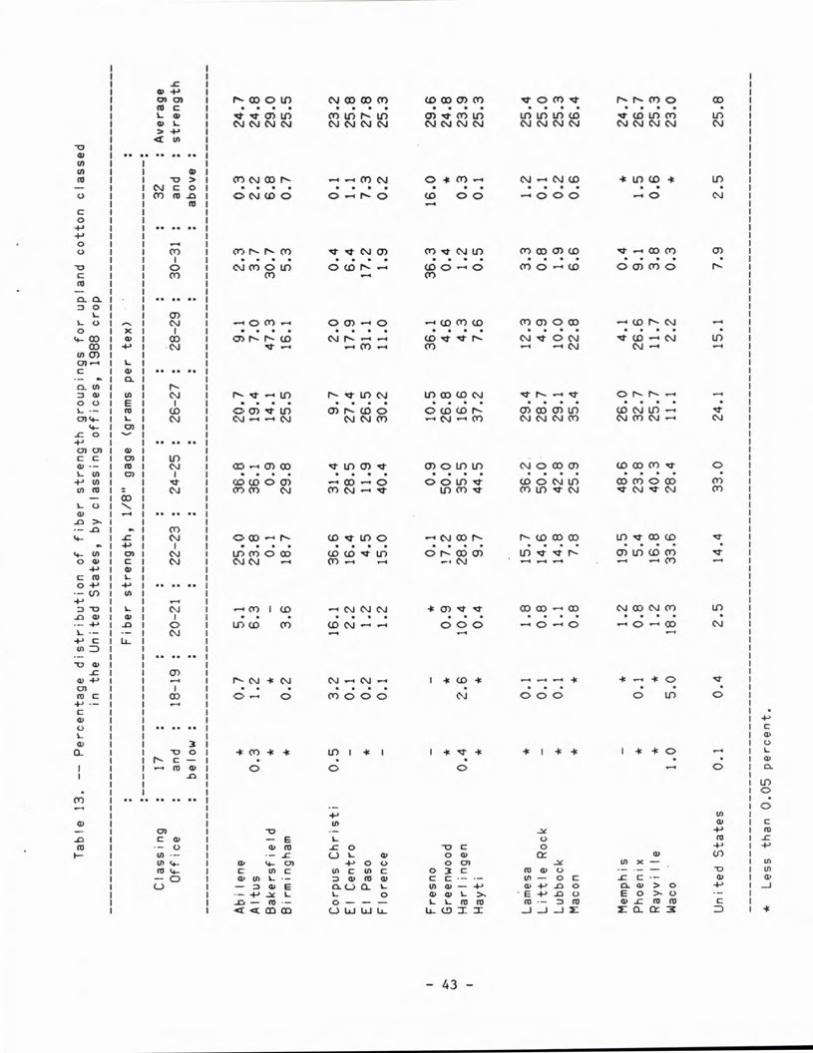
I - I I I I 0)0) I N OD U) CJ 0) 0) (0 CD U) Cr) Cr) xt 0 (V) .3-
mc I • • • L w I - C) U) CV) U) N if) C) - () LI) LA) U) LI) (0 () L I C'J ('-A C'J C.J C'J ('.1 ('-A ('.1 ('.1 Ccj C'-J ('.1 C'J ('J C'J ('J >-p <U) I
0) I., In I I In I I 01 0 i i - > (r) 0) s -' - c c'-j 0 4 CV) i.-. C-j '-4 c.-_j (0
— tC'JcoI • • 4
0 I I C') (0 D I 0 C'J CD 0 0 -i N 0 CD 00 .— 000 I ml
C I I o I I
4-' I I o I I I O I I CT) I Cr) N N (V) 14, ' ('.10) (V) 10 ('J U) Cr) CX) Cr) CD
I I I
I I
0 I ('.1(0 0 U) . .
0 CD N —' . . (0 0 - 0
. CV) 0
C I I CV) I (V) .-. (r) 0 i i
— I CL CL I I -I
OI I L-
L 0 I —. I (-.1 CD CO CD CT) C) 0 0) o lxi I I -. • • •
a, I 0) I C) N N CD ('A N — - CD cr Kt N ('A Kr 0 ('A U) I 4- I ('.1 I -. —i Cr) (V)
in 0)I I Q)4 I L I C 101
"I CLI I I
0) I U) I (N'A I N It .-. U) N 14t U) C'.J U) 0) CD ('4 ' N -
OOIEI I I . • . . . . • . • L I CO I CD N C) 06 (7) LI) 0)4.- I L I ('A I ('A -i -1 ('A C'J ('4 (V) .—. (-4 .-i ()) ('A ('A C'J CT)
4-. I 0)0)101 I ccl 0)1 to I - O - — I (0 I ('A 0)0) U) 0) - 0) 0 LI) LI) ('A 0 CX) 0) LU)I 0)1 I I . 4... 4... 4.
41 to I I I CD CD 0 C) (X) -. 0 0 0 U) ' CD 0 ('A U) U) 0 I = c-J I (r. C!) ('A CO ('A — - U) Co - Co U) -- ('A -10)1 I
L0I".I I O 141 ......I
I I CV) I
'-4- I -C I ('A I C U) —' N CD LI) 0 ('A CO N N CD 0) 0) -'14I I I . . . . .
('A •
LI () 00) U) .
N06 0) U) ' N 44o-
U) w I
0) I ('A I 'N ('A '-4 Cr) ('4
41 0)1 I Cmi LI I O+1+'i ...... •-CflI (Al 4-4 I I I
I (0 .-s ('A ('A ('4 4 (3) CX) 0) - CX) _OI WI I I • . . . . 4. • — 4-' I - I 0 I U) CD (T) CD ('A -' 000 0 0
C-NJ I %-
•- -I -
I ()I
I I I
I ......I
-UWI I -CI I 0) I
0) 4-' I I -I I N ('A 4 ('A ('A ('A I 4 CD . . .
to c I I CX) I 0 0 (T) 0 00 ('4 000 I I
C I I O I I L I I 0 I I 31
I I 00I 4(044 [1)141 I44 4144 I INC -I I i-IOQ)l 0 0 0 I I CI
O I I U) — I 0) I -- -
I c ow I -E L 0 o I -- -o I 0)0 co - c o I- I U) - — I - — C.) L a 0 0) QC
to 4.- I W 4 0) +' 00 0 0) (04.- I c inc incwc 03c ma,o
I — 0 I 0 U) L -- a, m a c c •— -- in — o c (_) I — a E 0. Li 11 L (A (D — 41 Ci) 41 0
I I — 4-' —Y L L 0 0) w L >. E 4-' -D 0 I I _c.-(o-- 0--- LL(O(D I <1 -cx U) U) I C) LLJ U U- U- (D E m -A -A -.1
NNCT)0 'CDU)CV) If) C\JcJc'JC'J (-'4
4LI)(04 LI) I
.40 ('4 I
C)
00) CV) 0 N
'CDNC'A -
—4
U) -I
CDCSJU)-. - I (4(0(44-4 ('A I
CDU)Co C DC00U) CO • C_-J - C'A Cr)
OUCDCO
(sJU)('J(r) U
('4
440 -ci-
0U) 0
440 I C-- to
IC. I0
U) I a, Ic
4-' I m (o i-c 4- 1+'
(Ax- I U) - 10)
la 4-'
EO>- O --- I 0) -C mm I
I 4
- 43 -

Table 14. -- Percentage distribution of the uniformity index for upland cotton classed, by states and United States, 1988 crop
Uniformity Index 1/ State :-------------------------
:72 & below: 73-75 : 76-78 : 79-81 : 82-84 : 85-87 : 88-90 :91 8 over : Average
Alabama * 5.4 79.6 14.9 * * - 80.3
Arizona 0.2 1.6 15.3 55.7 26.3 0.9 0.1 - 80.3
Arkansas 0.1 0.6 12.8 60.7 25.4 0.3 - - 80.3
California * 0.1 2.2 37.9 56.9 2.9 * - 81.8
Georgia - * 4.3 70.0 25.6 0.1 * - 80.7
Louisiana 0.1 0.4 11.2 57.3 30.6 0.5 * - 80.5
Mississippi 0.1 0.9 18.1 61.7 19.0 0.2 * - 80.0
Missouri * 0.6 15.0 63.4 20.6 0.3 - - 80.1
New Mexico 0.2 1.4 12.3 47.5 37.5 1.1 - - 80.7
N. Carolina 0.7 14.3 58.8 25.7 0.4 - - 80.3
Oklahoma * 0.2 10.7 71.6 17.3 0.2 * - 80.2
S. Carolina 2.1 22.4 57.7 17.4 0.4 - - 79.8
Tennessee * 0.6 18.0 65.9 15.4 0.1 - - 79.9
Texas * 0.5 13.3 66.5 19.4 0.3 * * 80.2
U.S. 0.5 11.7 59.4 27.6 0.8 * 80.5
1/ A measure of the relative uniformity of the length of fibers; if all fibers were the same length, uni- formity index would equal 100. * Less than 0.05 percent.
- 44 -

Table 15. -- Grade and staple of American Pima cotton classed in the United States, 1988 crop
Staple
Grade : 40 : : : : 48 : All staples and : 42 : 44 : 46 : and
shorter : : : : longer
Bales Bales Bales Bates Bales Bales Percent 01 - 1 333 659 29 1,022 0.3 02 - 67 9,890 14,639 638 25,234 7.9 03 1 1,643 70,775 95,847 13,934 182,200 57.0 04 1 1,804 13,384 65,872 12,547 93,608 29.3 05 4 386 2,959 7,656 642 11,647 3.6 06 12 461 2,450 1,393 22 4,338 1.4 07 40 361 1,159 216 2 1,778 0.6
All grades 58 4,723 100,950 186,282 27,814 319,829 100.0
Pct. Pet. Pct. Pct. Pet. Pet. All grades * 15 31.6 58.2 8.7 100.0
* Less than 0.05 percent. Average grade ......... 3.3 Average staple ........ 45.5
NOTE: Totals may not add due to rounding. Pct. grade reductions. 5.9
Table 16. --Percentage distribution of grade and staple for American Pima cotton classed through specified periods, in the United States, 1988 crop
Period through Grade and Staple :--------------------------------------------------: Crop
October 31 : November 30 : December 29
Grade: 01
1.4 02
30.0 03
56.9 04
10.3 05
1.3 06
0.1 07 *
All grades
100.0
Staple: 40 and shorter *
42
0.3 44
40.5 46
59.2 48 and longer
All staples 100.0
Classings 16,815
* Less than 0.05 percent.
0.5 0.3 0.3 10.6 8.0 7.9 62.4 60.9 57.0 23.6 27.0 29.3 2.6 3.0 3.6 0.3 0.5 1.4
0.1 0.2 0.6
100.0 100.0 100.0
* * * 0.2 0.6 1.5
38.8 33.8 31.6 55.5 57.2 58.2 5.4 8.4 8.7
100.0 100.0 100.0
131,885 230,521 319,829
- 45 -
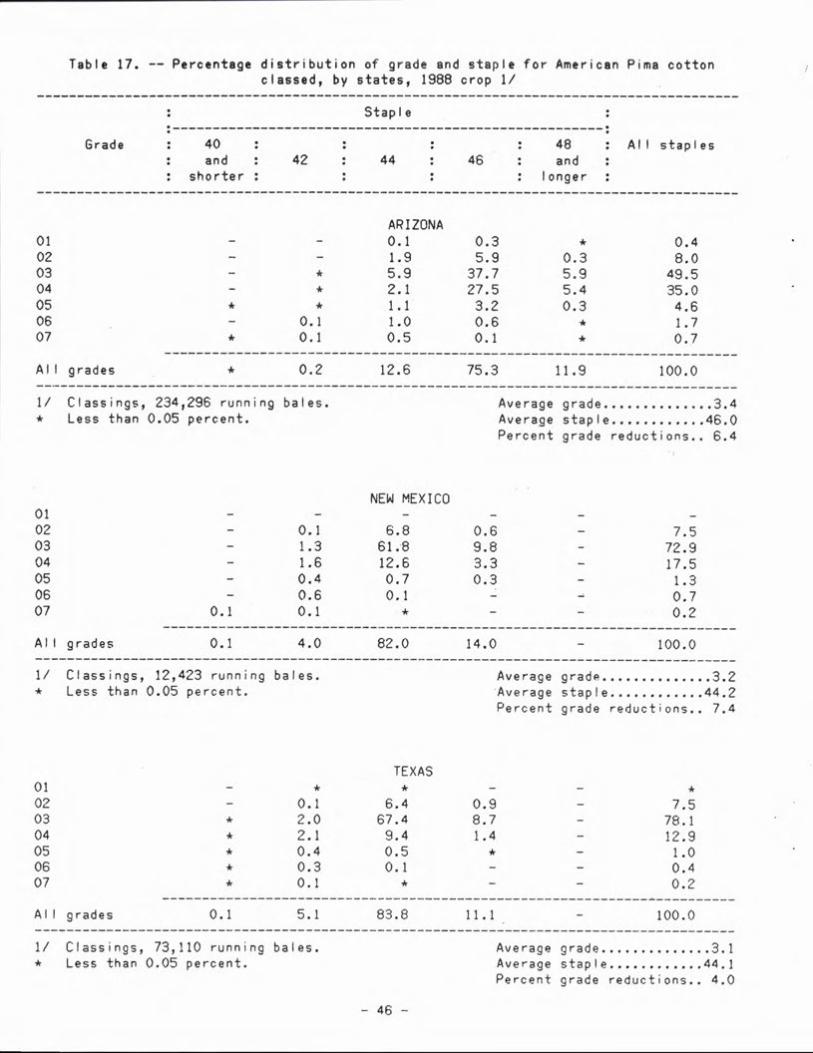
Table 17. -- Percentage distribution of grade and staple for American Pima cotton classed, by states, 1988 crop 1/
Staple
Grade : 40 : : : 48 : All staples and : 42 : 44 : 46 : and
shorter : : : longer
ARIZONA 01 - - 0.1 0.3 * 0.4 02 - - 1.9 5.9 0.3 8.0 03 - * 5.9 37.7 5.9 49.5 04 - * 2.1 27.5 5.4 35.0 05 * * 1.1 3.2 0.3 4.6 06 - 0.1 1.0 0.6 * 1.7 07 * 0.1 0.5 0.1 * 0.7
All grades * 0.2 12.6 75.3 11.9 100.0
1/ Classings, 234,296 running bates. Average grade .............. 3.4 * Less than 0.05 percent. Average staple ............46.0
Percent grade reductions.. 6.4
01 - - 02 - 0.1 03 - 1.3 04 - 1.6 05 - 0.4 06 - 0.6 07 0.1 0.1
All grades 0.1 4.0
1/ Classings, 12,423 running bales. * Less than 0.05 percent.
NEW MEXICO
6.8 0.6 - 7.5 61.8 9.8 - 72.9 12.6 3.3 17.5 0.7 0.3 - 1.3 0.1 - - 0.7
* - - 0.2
82.0 14.0 - 100.0
Average grade ..............3.2 Average staple ............44.2 Percent grade reductions.. 7.4
TEXAS 01 02 - 0.1 6.4 0.9 - 7.5 03 * 2.0 67.4 8.7 - 78.1 04 2.1 9.4 1.4 - 12.9 05 * 0.4 0.5 * - 1.0 06 * 0.3 0.1 - - 0.4 07 * 0.1 * - - 0.2
All grades 0.1 5.1 83.6 11.1 - 100.0
1/ Classings, 73,110 running bates. Average grade ..............3.1 * Less than 0.05 percent. Average staple ............44.1
Percent grade reductions.. 4.0
- 46 -

Table 18. -- Percentage distribution of mike for American Pima cotton classed in the United States, by states, 1988 crop
State
Readings : United States Arizona : New Mexico : Texas
26 and below * * * * 27 0.1 0.2 0.2 0.1 28 0.3 0.7 0.5 0.4 29 0.5 1.4 1.4 0.8 30 1.0 2.3 2.5 1.4
31 1.4 2.5 2.8 1.7 32 1.7 4.0 3.3 2.2 33 1.7 3.3 3.1 2.1 34 2.6 5.0 5.3 3.3 35 4.2 4.1 5.0 4.3
36 7.5 8.9 10.5 8.2 37 8.1 6.4 7.5 7.9 38 12.5 12.4 14.0 12.8 39 12.1 7.2 8.5 11.1 40 14.9 12.0 12.5 14.2
41 11.4 6.1 6.7 10.1 42 10.1 9.1 7.9 9.5 43 5.4 3.8 3.1 4.8 44 3.1 5.5 3.3 3.2 45 0.7 2.1 0.9 0.8
46 0.5 2.1 0.7 0.6 47 0.1 0.4 0.1 0.1 48 * 0.2 0.1 0.1 49 * * * * 50 and above
Average mike 39 38 38 39
* Less than 0.05 percent.
- 47 -