2010 state of metropolitan america
TRANSCRIPT

1
20
10
State of Metropolitan America ON THE FRONT
LINES OF
DEMOGRAPHIC
TRANSFORMATION


The brookingS inSTiTuTion MeTropoliTAn policy progrAM © 2010
State of Metropolitan America ON THE FRONT
LINES OF
DEMOGRAPHIC
TRANSFORMATION

$
conTenTS
2
ST
AT
e o
f M
eT
ro
po
liT
An
AM
er
icA
| C
ON
TE
NT
S
I. Population and Migration 36 n
William h. frey
II. Race and Ethnicity 50 n
William h. frey
III. Immigration 64 n
Audrey Singer
IV. Age 76 n
William h. frey
V. Households and Families 90 n
William h. frey
VI. Educational Attainment 104 n
Alan berube
VII. Work 118 n
howard Wial and Alec friedhoff
VIII. Income and Poverty 132 n
elizabeth kneebone and emily garr
IX. Commuting 144 n
emilia istrate, robert puentes,
and Adie Tomer
Policy Implications 156
Alan berube
Preface 3
About the Authors 4
Executive Summary 6
About the State of Metropolitan America 12
Overview 22

ST
AT
e o
f M
eT
ro
po
liT
An
AM
er
icA
| P
RE
FA
CE
prefAce
obscured by the current economic moment and the nation’s rightful preoccupation with recov-
ery, the united States stands poised at a moment of significant societal change.
over the last decade, America has passed a number of major demographic milestones. The
State of Metropolitan America shows how these “new realities” are redefining who we are,
where and with whom we live, and how we provide for our own welfare, as well as that of our
families and communities. And these new realities, most pronounced in the leading edge of the nation’s met-
ropolitan areas, are fundamental: the continued growth and outward expansion of our population; its ongoing
racial and ethnic diversification; the rapid aging on the horizon; our increasing but selective higher educational
attainment; and the intensified income polarization experienced by our workers and families.
These underlying realities are too large to ignore any longer. Specific policy responses designed to make the
most of America’s potential in the face of the nation’s relentless pace of change must be priorities for national,
metropolitan, and local actors alike in the coming decade. failure to recognize and address these challenges
will only further thwart the timeless American struggle to form a more perfect union.
by understanding the context and landscape of America’s metropolitan areas, we can begin to develop
smarter policies to increase more equitable opportunities for our nation.
The rockefeller foundation is proud to support this seminal report and the ongoing State of Metropolitan
America series at brookings, which will continue to chronicle the demographic shifts transforming America,
from the ground up. Support for this and other urban initiatives in the united States and around the world
affirms the foundation’s commitment to building more resilient cities and metropolitan regions.
We hope you find this report a useful lens on America’s future.
Judith Rodin
president
The rockefeller foundation
3

The brookings Metropolitan policy program thanks the following organiza-
tions and individuals whose efforts, insights, and support were critical to
the completion of this report.
AcknoWleDgMenTS
first and foremost, we thank the rockefeller
foundation for its generous financial and intellectual
support of this project. The foundation has provided
longstanding support for the Metropolitan policy
program’s most important and influential research
and policy work over the past decade, including
the blueprint for American prosperity and the
Metropolitan infrastructure initiative, for which we
are enormously grateful.
Jill Wilson at brookings provided day-to-day
management of all technical aspects of this report
and the accompanying State of Metropolitan America
website. She developed the report’s geographic
approach, orchestrated the analysis of data from the
2008 American community Survey (AcS) internal
files at the u.S. census bureau, managed design
and data for the website, and performed research
assistance for several of the chapters, especially
Immigration. This project would not have been pos-
sible without her tireless efforts.
cathy Sun of the university of Michigan played
a critical role in programming and preparing tabula-
tions for this report from the 2008 AcS internal
files at the u.S. census bureau. cathy also provided
programming and research assistance for several
chapters of the report authored by William frey.
David raglin of the American community Survey
office at the u.S. census bureau provided critical
support in developing a Joint project Agreement
between brookings and the census bureau, which
enabled our analysis of internal AcS data. David
also supplied much-needed, timely assistance to
brookings in navigating the data.
A 2009 roundtable with experts on metropolitan
demographics greatly informed the methodology
and scope of this report. participants included D’Vera
cohn (pew research center), John cromartie (uSDA
economic research Service), and Marc perry, David
Johnson, robert kominski, and Michael ratcliffe (u.S.
census bureau).
Several individuals at brookings contributed
data analysis for the State of Metropolitan America
website and individual chapters, including Jennifer
hinojosa, kelsey Merrick, benjamin orr, and chad
Shearer. in addition to co-authoring the Income and
Poverty chapter, emily garr provided data assistance
for the Race and Ethnicity and Households and
Families chapters. Dana Thomson, a consultant to
brookings, performed numerical checking and statis-
tical significance calculations for the website data.
partial support for William frey’s Race and
Ethnicity and Age chapters came from a national
institutes of health, nichD grant at the university
of Michigan.
David Jackson at brookings managed the difficult
task of editing the entire report with patience and
skill. Maria paul of Sese-paul Design artfully executed
the layout and design of the report.
bruce katz, Vice president and Director of the
Metropolitan policy program, provided invaluable
guidance and vision for this project. other brookings
staff members, including Jennifer bradley, Amy liu,
Mark Muro, and Julie Wagner made thoughtful and
insightful contributions along the way. ellen ochs
provided first-rate project management in the
home stretch.
finally, this was truly a team effort of the
Metropolitan policy program, led by the program’s
research director, Alan berube. The report’s main
research team—Alan berube, William frey, Audrey
Singer, and Jill Wilson—wishes to thank all the
authors and the supportive brookings staff that
contributed in many ways to this report.
4
ST
AT
e o
f M
eT
ro
po
liT
An
AM
er
icA
| A
CK
NO
WL
ED
GM
EN
TS

ST
AT
e o
f M
eT
ro
po
liT
An
AM
er
icA
| A
BO
UT
TH
E A
UT
HO
RS
All report authors are staff members at the
brookings Metropolitan policy program; full biogra-
phies are available at www.brookings.edu/metro
ALAN BERUBE (Educational Attainment, Policy
Implications) is a senior fellow and research director
at the program, where he coordinates the develop-
ment and implementation of the program’s research
agenda, and studies demographic and economic
change in metropolitan America and its implications
for policy. he joined brookings in 2001 after serving
as a policy advisor at the u.S. Treasury Department.
WILLIAM H. FREy (Population and Migration, Race
and Ethnicity, Age, Households and Families) is a
senior fellow and an internationally known demogra-
pher who specializes in issues involving urban popu-
lations, migration, immigration, race, aging, political
demographics, and the u.S. census. he has served on
the faculty of the university of Michigan’s institute
for Social research and population Studies center
for nearly three decades, and joined brookings
in 2003.
ALEC FRIEDHOFF (Work) is a research analyst
whose research focuses on how u.S. metropolitan
areas have fared following large-scale economic
shocks and how public policy, non-profit, and private
sector responses affect post-shock economic
trajectories. he is co-author of brookings’ quarterly
MetroMonitor, and joined the program in 2005.
EMILy GARR (Income and Poverty) is a senior
research assistant whose work focuses on the spatial
distribution of low-income work and workers in
metropolitan areas. She joined brookings in 2009
after working as a research assistant at the economic
policy institute.
EMILIA ISTRATE (Commuting) is a senior research
analyst who works on domestic and international
infrastructure finance, transportation, and energy,
within the field of metropolitan economic develop-
ment. prior to joining brookings in 2008, she
conducted research on regional economic develop-
ment at the School of public policy, george
Mason university.
ELIzABETH KNEEBONE (Income and Poverty) is
a senior research analyst whose work focuses on
urban and suburban poverty, metropolitan demo-
graphics, and tax policies for low-income workers and
communities. She joined brookings in 2006 after
serving as a research project manager at the illinois
facilities fund.
ROBERT PUENTES (Commuting) is a senior
fellow and director of the program’s Metropolitan
infrastructure initiative. his work focuses on the
broad array of policies and issues related to metro-
politan growth and development and is an expert on
transportation and infrastructure, urban planning,
growth management, suburban issues, and housing.
prior to joining brookings in 2000, he was direc-
tor of infrastructure programs at the intelligent
Transportation Society of America.
AUDREy SINGER (Immigration) is a senior fellow
whose areas of expertise include demography,
international migration, immigration policy, and
urban and metropolitan change, and has written
extensively on u.S. immigration trends. prior to
joining brookings in 2001, she was an associate in
the international Migration policy program at the
carnegie endowment for international peace.
ADIE TOMER (Commuting) is a research analyst
whose work focuses primarily on metropolitan trans-
portation and infrastructure issues, including multi-
modal travel trends and spatial analyses. he joined
brookings in 2008 after serving as senior analyst at
the new york county District Attorney’s office.
HOWARD WIAL (Work) is a fellow and economist
who specializes in regional economics, innovation
and productivity, and workforce issues. he oversees
the program’s Metropolitan economy initiative
and is the primary author of brookings’ quarterly
MetroMonitor. prior to joining brookings in 2004, he
served as research director for Afl-cio Working for
America institute and keystone research center.
JILL H. WILSON (Main Research Team) is a senior
research analyst whose work at the program focuses
on u.S. immigration and other demographic trends.
She joined brookings in 2003 from the Migration
policy institute, where she served as principal
researcher on a project to assist immigrant service
and advocacy organizations to make use of demo-
graphic data.
AbouT The AuThorS
5

execuTiVe SuMMAry
6

ST
AT
e o
f M
eT
ro
po
liT
An
AM
er
icA
| E
XE
CU
TIV
E S
UM
MA
Ry
The 2000s were a tumultuous decade for Americans. The oscillating state of the economy, which
careened from a mild recession to booming house prices and, finally, to the worst downturn since
the great Depression, complicates the task of summarizing what the decade meant for the future
of American society. nonetheless, the boom-bust economics of the 2000s did not repeal the structural forces
that continue to transform our population.
This report shows that our nation now faces five
“new realities” that are redefining who we are, where
and with whom we live, and how we provide for
our own welfare, as well as that of our families and
communities. in each of these five areas, the nation
reached critical milestones in the 2000s that make
those underlying realities too large to ignore any lon-
ger. And large metropolitan areas—the collections of
cities, suburbs, and rural areas that house two-thirds
of America’s population—lay squarely on the front
lines of those trends.
THE FIVE NEW REALITIES
Growth and Outward ExpansionThe nation’s population passed 300 million, and over
the course of the decade, the nation will have added
roughly 28 million people. our nation’s large metro
areas remain at the cutting edge of the nation’s
continued growth. between 2000 and 2009, they
grew by a combined 10.5 percent, versus 5.8 percent
growth in the rest of the country. but they continued
to spread out, too, as their less developed, outer
areas grew at more than three times the rate of their
cities and inner suburbs.
Population DiversificationThe united States population is today one-third non-
white, and those groups accounted for 83 percent
of national population growth from 2000 to 2008.
immigration continues to fuel our growth, too, and
now nearly one-quarter of u.S. children have at least
one immigrant parent. This coming-of-age genera-
tion, a little over 30 years from now, will stand on the
precipice of our transition to a majority non-white
nation. large metropolitan areas will get there first,
as their under-18 population had already reached
majority non-white status by 2008.
Aging of the PopulationTogether, u.S. baby boomers and seniors now number
more than 100 million. large metro areas are in some
ways aging faster than the rest of the nation, experi-
encing a 45 percent increase in their 55-to-64 year-
old population from 2000 to 2008. As a result, their
single-person households are growing more rapidly
as well, especially in suburban communities that were
not designed with these populations in mind.
7

Uneven Higher Educational AttainmentMore than one-third of u.S. adults held a post-
secondary degree in 2008, up from one-quarter in
1990, helping to propel our economic growth. but
younger adults, especially in large metro areas, are
not registering the same high levels of degree attain-
ment as their predecessors. Moreover, the African
American and hispanic groups projected to make
up a growing share of our future workforce now lag
their white and Asian counterparts in large metro
areas on bachelor’s degree attainment by more than
20 percentage points.
Income PolarizationThe typical American household saw its inflation-
adjusted income decline by more than $2,000
between 1999 and 2008—and probably even further
by 2009 when the economy hit bottom. low-wage
and middle-wage workers lost considerable ground,
but high-wage workers saw earnings rise. The num-
ber of people living below the poverty line increased
as well. large metro areas stood at the vanguard of
these troubling trends. by 2008 high-wage workers
in large metro areas out-earned their low-wage coun-
terparts by a ratio of more than five to one, and the
number of their residents living in poverty had risen
15 percent since 2000.
THE VARIABLE METRO MAPlarge metropolitan areas as a group are “ahead of
the curve” on the five new demographic and social
realities that America confronts. however, in some
ways, large metropolitan areas actually became
more different from one another in the 2000s, mak-
ing it even more important to understand American
society from the individualized perspectives of these
places. no longer easily grouped along traditional
regional lines, such as Sun belt versus Snow belt,
or east versus West, this “pulling apart” reinforces
a new seven-category typology of metropolitan
America:
• Next Frontier metro areas exceed national aver-
ages on population growth, diversity, and educa-
tional attainment. of these nine metro areas, eight
lie west of the Mississippi river (Washington, D.c. is
the exception)
• New Heartland metro areas are also fast growing,
highly educated locales, but have lower shares of
hispanic and Asian populations than the national
average. These 19 metro areas include many in the
“new South” where blacks are the dominant minor-
ity group, such as Atlanta and charlotte, as well as
largely white metro areas throughout the Midwest
and West, such as indianapolis and portland (or)
• Diverse Giant metro areas feature some of the
largest in the country, including the three most
populous (new york, los Angeles, and chicago),
as well as coastal anchors such as Miami and San
francisco. These nine regions post above-average
educational attainment and diversity, but below-
average population growth, owing in part to their
large sizes
• Border Growth metro areas are mostly located in
southern border states, and as such are marked by
a significant and growing presence of Mexican and
other latin American immigrants. only orlando
lies outside the main orbit of this group of 11 metro
areas, which stretches from east Texas, through
Arizona and nevada, and up california’s central
Valley
• Mid-Sized Magnet metro areas have experienced
high growth, but exhibit lower shares of hispanic
and Asian minorities, and lower levels of edu-
cational attainment. like many border growth ST
AT
e o
f M
eT
ro
po
liT
An
AM
er
icA
| E
XE
CU
TIV
E S
UM
MA
Ry
8

ST
AT
e o
f M
eT
ro
po
liT
An
AM
er
icA
| E
XE
CU
TIV
E S
UM
MA
Ry
centers, many of these 15 mid-sized, mostly
Southeastern locations got caught in the growth
spiral of the 2000s that ended abruptly with the
housing crash
• Skilled Anchors are slow-growing, less diverse
metro areas that boast higher-than-average levels
of educational attainment. of the 19 nationwide,
17 lie in the northeast and Midwest, including
large regions such as boston and philadelphia,
and smaller regions such as Akron and Worcester.
Many boast significant medical and educational
institutions
• Industrial Cores are in some ways the most
demographically disadvantaged of the metropoli-
tan types. These 18 metro areas are largely older
industrial centers of the northeast, Midwest, and
Southeast. Their populations are slower-growing,
less diverse, and less educated than national aver-
ages, and significantly older than the large metro-
politan average. These metro areas lost population
in the aggregate in the 2000s
Viewing metropolitan America through this lens
offers a more nuanced view of the country and its
variable challenges than conventional regional gen-
eralizations. yet, even as large metro areas “pulled
apart” demographically from one another in some
ways in the 2000s, they also “came together” at the
individual metropolitan scale so that suburbs and
cities grew more alike in many ways. cities gained
population at suburbs’ expense in the wake of the
housing crash; a majority of members all major
racial/ethnic groups now live in suburbs; and the sub-
urban poor population grew at roughly five times the
rate of the city poor population over the decade.
A NEW DECADE OF RECKONING, FROM THE MACRO TO THE METROSome commentators have begun to refer to the
2000s as “the lost decade,” largely on the basis
of the lack of job and economic growth nationally
during that time. but the decade was lost in another
sense, too; the nation lost time and opportunity to
respond to the challenges and prospects of its new
demographic realities.
We now stand on the precipice of a “decade of
reckoning.” Questions around how to support com-
munities with rapidly aging populations, how to meet
family and labor market needs through immigra-
tion, and how to help lower-paid workers support
themselves and their families simply cannot go
unaddressed for another decade without risking our
collective standard of living and the quality of our
democracy. Tackling these and other challenges will
require coherent, purposeful leadership in the com-
ing years.
national conversations tend to overlook the fact
that these new realities affect not only “macro” con-
ditions such as the federal budget and the u.S. labor
market. They are also experienced in places—mostly
in our nation’s largest metropolitan areas. Therefore,
a federal policy agenda must confront aspects of
particular concern for the metropolitan communities
on the front lines of these trends, including:
• Accommodating more efficient growth, by putting
a price on carbon to account for the external costs
of fossil fuel combustion, encouraging greater
coordination between housing and transportation
planning, and reducing the deductibility of mort-
gage interest to discourage over-consumption
of housing
9

• Integrating and incorporating diverse popula-
tions, through comprehensive immigration reform
that protects our borders and provides a fair path-
way to legal status, federal support for programs
and practices that facilitate immigrant incorpora-
tion, and a national office of new Americans to
elevate and coordinate makeshift local integration
efforts
• Enhancing community affordability and vital-
ity for seniors, including meeting rising demands
for affordable housing integrated with services,
protecting seniors’ home equity through enhanced
oversight of mortgage products, and requiring the
expenditure of federal transportation and housing
funds to take into account the specific needs of
older populations
• Accelerating higher educational attainment, by
continuing to focus on enhancing teacher quality
for students in need and promoting effective inter-
ventions in low-performing schools, and rewarding
and supporting institutions and students not just
for enrollment in higher education, but also persis-
tence toward and completion of degrees
• Reducing income inequality, by restoring and
growing the productive capacity of the nation’s
auto communities, pursuing enhanced labor
standards enforcement, and renewing/expanding
tax credits that support lower-income working
families like the earned income Tax credit and
child Tax credit
national policy makers have the unique obliga-
tion to address aspects of the five new realities that
affect all metropolitan areas, or are simply beyond
metropolitan areas’ own capacity to tackle. As this
report demonstrates, however, different challenges
assume varying levels of prominence in different
types of metropolitan areas. leaders at the state,
regional, and local levels must now more than ever
understand and respond purposefully to the demo-
graphic, social, and economic changes most affect-
ing their places.
• Border Growth and Mid-Sized Magnet metro
areas must seek greater economic balance in the
wake of the housing crash. Smart infrastructure
investments in these metro areas could promote
growth of alternative energy production and ST
AT
e o
f M
eT
ro
po
liT
An
AM
er
icA
| E
XE
CU
TIV
E S
UM
MA
Ry
10
National policy
makers have the
unique obliga-
tion to address
aspects of the
five new
realities that
affect all met-
ropolitan areas,
or are simply
beyond metro-
politan areas’
own capacity
to tackle.

ST
AT
e o
f M
eT
ro
po
liT
An
AM
er
icA
| E
XE
CU
TIV
E S
UM
MA
Ry
distribution, international travel and tourism, and
linkages with larger nearby centers of global com-
merce. Their leaders must also be fierce champions
for the continued viability of 2- and 4-year higher
education institutions, which offer the best hope
for ensuring that their large and growing young,
minority populations can share in the fruits of
future economic growth
• Diverse Giant and Next Frontier metro areas
should adopt the most innovative practices
for accelerating the civic and labor market inte-
gration of their larger immigrant and “second
generation” populations. They should also set
out “roadmaps” for addressing future local and
regional population needs in an environmentally
sustainable, fiscally efficient manner that
create and preserve affordable options for low-
and middle-income families
• New Heartland metro areas, with migration
rates likely to remain somewhat lower in the
near term, should focus on growing a more
educated pipeline of workers from within their
own borders. Attracting younger middle-class
families back to urban and inner-suburban public
school systems, and forging closer partnerships
between regional economic development and
university officials, could help build the next
middle class in these regions
• Skilled Anchor and Industrial Core metro areas,
while economically distinct, share certain demo-
graphic attributes and associated challenges.
Slowing the tide of decentralization by building
outward from anchor institutions and overhauling
urban land use, keeping older skilled workers con-
nected to labor market opportunities, and inte-
grating housing and social services for urban and
suburban senior populations should be priorities
for their leaders
finally, new demographic realities must be met
with new governance arrangements. especially
in light of the deep fiscal crisis facing states and
local governments, the lines between cities and
suburbs—and the long, fruitless history of battles
and mistrust between them—must be transcended, in
all types of metropolitan areas. local leaders must
forge regional solutions to newly shared regional
challenges, such as linking the supply and demand
sides of the labor market to benefit disadvantaged
workers. They must undertake greater collabora-
tion in the delivery of services, or outright combine
outdated, inefficient local government units such as
school districts. And they must act like metropolitan
areas in dealing with their states, consolidating their
influence on common issues that affect the well-
being of their populations.
CONCLUSIONThe pace of change and complexity of u.S. society
only seems to multiply with each passing decade.
now, as the nation and its major metropolitan areas
reach a series of critical demographic junctures,
forging a constructive path forward to the “next
society” is as much about helping communities
manage the velocity of that transformation as it
is about responding to its specific character. failure
to maximize shared responses to the inevitable
challenges of change, and common ownership of
the solutions, will only serve to sow the seeds of
intergenerational, interracial, and inter-ethnic
conflict. understanding—from the ground up—who
Americans are, and who they are becoming, is a
critical step toward building constructive bridges
before they become impassable divides. n
11


ABOUT THE STATE oF METRoPolITAN AMERICA
The State of Metropolitan America is a signature effort of the brookings Metropolitan policy
program that portrays the demographic and social trends shaping the nation’s essential economic
and societal units—its large metropolitan areas—and discusses what they imply for public policies
to secure prosperity for these places and their populations.
This report marks the inaugural edition of a
regular summary report in brookings’ State of
Metropolitan America series. it focuses on the major
demographic forces transforming the nation and
large metropolitan areas in the 2000s. in this sense,
it previews what we will learn from the results of the
2010 census, as well as supplements those results
in important ways. future editions of the annual
report will examine those results, probe more deeply
specific types of populations and geographies pro-
filed in this report, and update the analysis herein
as the country emerges from its deepest economic
recession in decades. brookings’ ongoing State of
Metropolitan America series will also feature regular
reports on key demographic topics, and their rel-
evance to the changing populations of our metropoli-
tan areas, cities, and suburbs.
THE TOPICSThis report is arranged topically, with nine chap-
ters that correspond to nine of the most important
subjects tracked by the census bureau in its annual
American community Survey (AcS; see below):
n Population and Migration follows the popula-
tion growth and decline of u.S. places over the
decade, and how the movement of people—from
next-door communities, from other parts of the
country, and from abroad—contributed to these
trends
n Race and Ethnicity analyzes the changing
racial (e.g., white, black, Asian) and ethnic (e.g.,
hispanic) composition of our population, includ-
ing the patterns of growth and decline in these
groups in different corners of the nation1
n Immigration focuses on America’s foreign-born
population, both citizens and non-citizens: their
growth, where they live, their characteristics,
and the growing demographic influence of their
children
n Age looks at the shifting balance between older
and younger Americans across the country,
especially as the baby boom generation—Ameri-
ca’s largest—approaches seniorhood
n Households and Families examines who makes
up the fundamental units of our society, how
their structures are changing over time, and
how they relate to the different racial/ethnic
and age profiles of America’s communities
n Educational Attainment profiles the educa-
tional status of adults (how much schooling
they have completed, their enrollment in higher
education), identifies differences by age and ST
AT
e o
f M
eT
ro
po
liT
An
AM
er
icA
| A
BO
UT
TH
E S
TA
TE
oF
ME
TR
oP
ol
ITA
N A
ME
RIC
A13

ST
AT
e o
f M
eT
ro
po
liT
An
AM
er
icA
| A
BO
UT
TH
E S
TA
TE
oF
ME
TR
oP
ol
ITA
N A
ME
RIC
A
race/ethnicity, and relates these to the underly-
ing economic features of regions
n Work analyzes two sets of indicators on the sta-
tus of America’s labor force: the wages earned
by differently compensated workers; and rates
of unemployment, which reflect the varying
degrees of economic pain experienced by dif-
ferent parts of the country
n Income and Poverty portrays trends in the
economic well-being of typical households, the
size of the “middle class,” and the location and
characteristics of America’s sizeable and grow-
ing poor population
n Commuting details how we get to work, how
those patterns have changed over time, and the
factors contributing to the sizeable differences
among communities in how workers undertake
those daily trips
each chapter is authored by one or more
brookings experts, each of whom has written widely
on the topic at hand (see “About the Authors”).
The chapters include the authors’ own analysis of
the most important and compelling trends over the
2000s at multiple levels of American geography
(described further below), accompanied by their
thoughts on what these trends mean for the future
of people, places, and public policy.2
THE DATAThe data on which the bulk of this and many other
reports in the State of Metropolitan America series
are based come from the u.S. census bureau’s
American community Survey (AcS) data. The AcS is
a nationwide survey that provides an ongoing demo-
graphic, social, and economic portrait of the country
and its communities, and the largest survey that the
census bureau administers other than the decen-
nial census. About 3 million households each year
receive and respond to the AcS, allowing the census
bureau to construct a detailed profile of states, met-
ropolitan areas, and larger cities on an annual basis.3
The latest AcS from which data are publicly available
is from 2008 (see inset “The State of Metropolitan
America and the great recession).
previously, many of the data now collected
through the AcS were collected via the decennial
census’ “long form.” The long form asked a sample
of census respondents more detailed questions than
the more common “short form,” on topics such as
their marital status, where they were born, their level
of education, and how much money they earned.
The 2010 census only features the short form, which
asks 10 basic questions regarding population, age,
race and ethnicity, relationships among members
of households, and homeownership. in essence, the
AcS has replaced the long form, and in doing so has
created a valuable opportunity to understand the
in-depth population dynamics affecting our coun-
try’s communities more than once every 10 years.
A further implication of this shift is that the 2010
census, while providing essential information for
research and policymaking, will not offer the same
sort of treasure trove of socio-economic data as its
predecessors.
A couple of further distinctions between the
AcS and the decennial census long form are worth
noting, in light of the fact that this report makes
many comparisons between AcS data from 2008
and decennial census data from 2000. first, the
sample of American households that receive the AcS
on an annual basis is considerably smaller than the
sample that received the census 2000 long form.
As a result, there is a greater degree of uncertainty
that the results from the AcS represent the true
14

characteristics of the underlying population than
is the case with census 2000 results. The smaller
the population of the geography in question (see
below), the greater that degree of uncertainty, or
“sampling error.” Where this report makes compari-
sons between results from census 2000 and the
2008 AcS, we only report the value of the change
over time if the margin of error for the reported AcS
estimate indicates that the change is statistically
significant.4
Second, the AcS surveys households on a
monthly basis, while census 2000 collected informa-
tion as of April 1 that year. one implication is that the
“reference period” for certain questions differs from
that in the decennial census. in particular, 2008 AcS
respondents reported income they received in the
previous 12 months, and the census bureau adjusted
those data for inflation to reflect an estimate for
their income in calendar year 2008. nevertheless,
those data capture the economic condition of house-
holds stretching from January of 2007 (12 months
prior to responses from January 2008 respondents)
to December of 2008 (the final month of data
collection for the 2008 AcS).5 in census 2000, by
contrast, all long-form respondents reported their
income for calendar year 1999.
THE STATE OF METROPOLITAN AMERICA AND THE GREAT RECESSIONThe bulk of analysis in this report covers popula-
tion characteristics in 2008, as well as trends
during the “2000s,” used to refer to the period
from 2000 to 2008.6 The 2008 American
community Survey (AcS), like the AcS in other
years, represents an aggregation of responses to
the survey from a sample of households in each
month of the year. The census bureau tabulates
and reports the results to reflect the average
profile of community populations across the
entire calendar year.
This is particularly relevant in the case of
2008, which marked the first year of the “great
recession,” by several measures the most
severe that the united States experienced in the
postwar period. The impact of the recession was
significant but relatively mild in the first half of
the year, but grew especially severe in the sec-
ond half of the year, particularly in September
through December.7 The data presented here
thus reflect national and metropolitan condi-
tions that span a portion of the great recession,
but do not capture its full impact, which was felt
most severely in 2009.
it seems likely that the more cyclical indica-
tors examined in this report through 2008, such
as income and poverty, wages, and even migra-
tion and commuting patterns, may look some-
what different in 2009. however, most topics
examined here, such as race and ethnicity, age,
household structure, and educational attainment
are more structural in nature, and will not look
significantly different during or after the great
recession than they did at its onset.
Most of the AcS data, and all of the decennial
census data, analyzed in this report and presented
at the State of Metropolitan America website (see
below) come from the tables and data files hosted
on the census bureau’s website, particularly its
American factfinder tool.8 for certain more compli-
cated topics and indicators, however, the State of
Metropolitan America benefited from special access
to the full 2008 AcS data file hosted at the census
bureau (stripped of individual identifiers). These sub-
jects, such as detailed educational attainment of the
population for different age groups, characteristics ST
AT
e o
f M
eT
ro
po
liT
An
AM
er
icA
| A
BO
UT
TH
E S
TA
TE
oF
ME
TR
oP
ol
ITA
N A
ME
RIC
A15
Most topics
examined here
are more
structural than
cyclical and
will not look
significantly
different due
to the Great
Recession.

ST
AT
e o
f M
eT
ro
po
liT
An
AM
er
icA
| A
BO
UT
TH
E S
TA
TE
oF
ME
TR
oP
ol
ITA
N A
ME
RIC
A
of the population in poverty, and commuting mode
for workers of different incomes, could only be exam-
ined for the places profiled in this report via this
special access.9
This report uses data from a couple of sources
in addition to the AcS and decennial census. The
most important of these is the census bureau’s
population estimates program.10 using data from the
last decennial census, more recent national surveys,
and administrative records at all levels of govern-
ment, the program produces annual estimates of
population, and its “components of change” (natural
increase, domestic migration, and immigration), for
all incorporated municipalities, counties, and states
nationwide. The program also estimates state and
county populations by age and race/ethnicity annual-
ly.11 These data provide the basis for much of our
analysis in the population and Migration, race and
ethnicity, and Age chapters.
THE GEOGRAPHy
Metropolitan AreasAs its name indicates, this report focuses primar-
ily on metropolitan areas, the geographic building
blocks of America’s economy and society. Why met-
ropolitan areas? unlike individual cities and towns, or
large political units like states, these are the places
within which most people—both here and abroad—live
their daily lives. Most Americans (84 percent) live
in metropolitan areas.12 Most of their workers (58
percent) commute to jobs within their metropolitan
area, but in a city or town different from the one in
which they live.13 Most metropolitan residents who
move (79 percent) choose another location in the
same metro area.14 We do our shopping in different
parts of metropolitan areas, get our media from met-
ro-wide newspapers and television stations, and root
for sports teams and visit cultural institutions that
service whole regions. We share natural resources
and infrastructure—air, water, roads, airports—at the
metropolitan scale. related businesses cluster and
share innovations and labor force expertise within
metro areas.15 in short, metropolitan areas represent
the critical geographic lens through which to under-
stand a changing American society.
Metropolitan areas as a statistical concept join cit-
ies and their suburbs together to represent local and
regional markets. in the united States, Metropolitan
Statistical Areas are defined by the u.S. office of
Management and budget (oMb) based on data gath-
ered by the census bureau. oMb locates these areas
around a densely populated core, typically a city, of
at least 50,000 people. counties that have strong
commuting ties to the core are then included in the
definition of the metropolitan area. oMb currently
identifies 366 metropolitan areas nationwide, with
populations ranging from 55,000 (carson city, nV)
to 19 million (new york-northern new Jersey-long
island, ny-nJ-pA).16
Within this group of metropolitan areas, the State
of Metropolitan America series concentrates the bulk
of its attention on the 100 largest, which in 2008
coincided almost exactly with those metro areas
having populations of at least 500,000.17 While there
is nothing especially magical about the half million-
person threshold, these metropolitan areas are fairly
recognizable places to most Americans. Moreover,
nearly all of their largest cities have populations of
at least 100,000. even more remarkably, these large
metro areas continue to slowly but steadily increase
their share of the nation’s population. At the turn
of the 20th century, 44 percent of Americans lived
in the counties that today make up the 100 largest
16

metro areas.18 by 2000 that share had risen to 65
percent, and by 2009 reached 66 percent.
Primary Cities and Suburbsin addition to tracking trends for large metropolitan
areas—individually and in the aggregate—the State
of Metropolitan America also looks inside these
places to differentiate their large cities and suburban
areas. oMb defines “principal cities” for metropoli-
tan areas, which include the largest city in each,
plus additional cities that meet specific population
size and employment requirements.19 Many principal
cities, while important destinations or residences
for local populations, do not accord with what most
Americans would regard to be a “city.” for instance,
the los Angeles-long beach-Santa Ana, cA metro
area—which is composed of los Angeles and
orange counties—contains 25 oMb-designated
principal cities.
The cities examined in this report—termed
“primary cities” to distinguish them from oMb’s
concept—include the first named city in each met-
ropolitan area (the largest), plus other incorporated
places in the metro area name with populations of
at least 100,000. because metro area names may
feature a maximum of three principal cities, no more
than 3 primary cities are designated for each metro
area. Across the 100 largest metro areas, then, a
total of 137 primary cities are identified.20 in refer-
encing some metro areas in tables and figures, the
report modifies oMb’s official titles to reflect only
those cities designated primary cities. for example, ST
AT
e o
f M
eT
ro
po
liT
An
AM
er
icA
| A
BO
UT
TH
E S
TA
TE
oF
ME
TR
oP
ol
ITA
N A
ME
RIC
A17
The Share of U.S. Population Living in the 100 Largest Metro Areas Continues to GrowShare of U.S. Residents Living in 100 Largest Metro Areas, 1900–2009
Note: Geographical definition of 100 largest metro areas held constant to 2007 boundaries over timeSource: Brookings analysis of "Population of Counties by Decennial Census: 1900 to 1990" (U.S. Census Bureau) and Population Estimates Program data
0
10
20
30
40
50
60
70
1900 1910 1920 1930 1940 1950 1960 1970 1980 1990 2000 2009
%
ST
AT
e o
f M
eT
ro
po
liT
An
AM
er
icA
| A
BO
UT
TH
E S
TA
TE
oF
ME
TR
oP
ol
ITA
N A
ME
RIC
A
the boston-cambridge-Quincy, MA-nh metro area is
referred to as the boston-cambridge, MA-nh metro
area, as Quincy has too small a population to be clas-
sified a primary city.21
for each metro area, “suburbs” or “suburban
areas” are designated as the remainder of the metro
area outside of primary cities. This is an admit-
tedly crude approach, though one consistent with
brookings’ longstanding demographic research
methodology. in several chapters, however, the State
of Metropolitan America goes a step further to ana-
lyze data for different types of suburbs. counties are
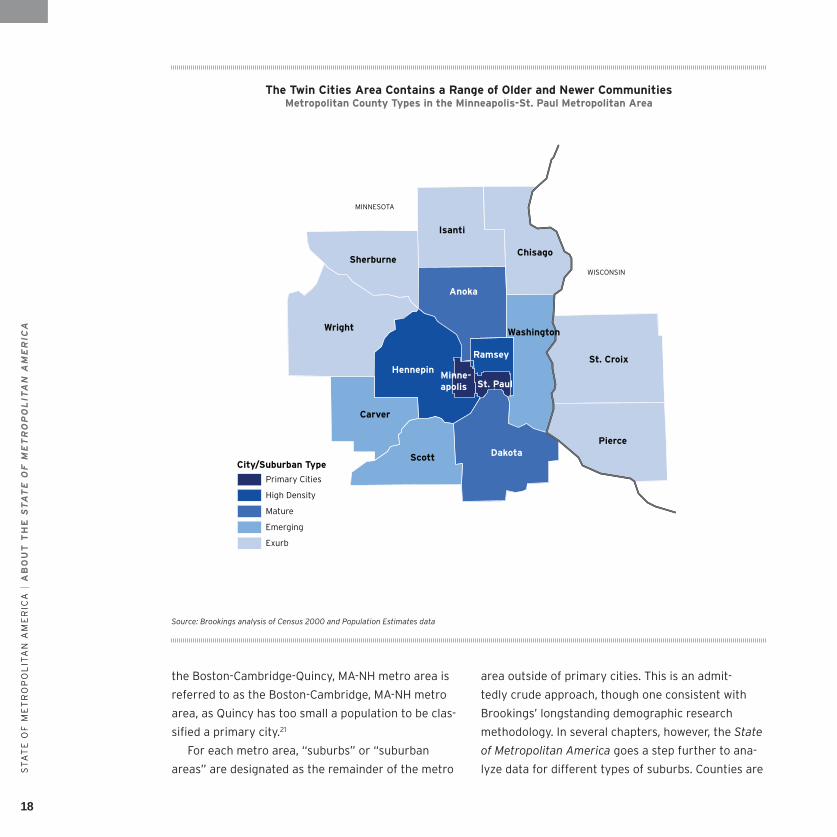
The Twin Cities Area Contains a Range of Older and Newer CommunitiesMetropolitan County Types in the Minneapolis-St. Paul Metropolitan Area
Source: Brookings analysis of Census 2000 and Population Estimates data
18
MINNESOTA
WISCONSIN
Isanti
ChisagoSherburne
Wright
Hennepin
Anoka
Ramsey
Washington
Minne-apolis St. Paul
DakotaScott
Carver
St. Croix
Pierce
City/Suburban Type
Primary Cities
High Density
Mature
Emerging
Exurb

classified based on their degree of “urbanization”—
that is, what share of its people live in more densely
populated areas—net of any primary cities they might
contain. beyond the cities themselves, metropolitan
counties are classified into four types of suburbs:
high-density, mature, emerging, and exurban.
how does this look in a typical metropolitan area?
in the Minneapolis-St. paul-bloomington, Mn-Wi
metro area, Minneapolis (population 383,000) and
St. paul (population 280,000) are designated pri-
mary cities, while bloomington (population 81,000)
is not. The remainder of the counties in which the
cities of Minneapolis and St. paul sit—hennepin and
ramsey—are labeled “high-density” suburbs, owing
to the large shares of their populations (over 95
percent in 2000) that live in densely populated com-
munities. high-density suburbs tend to be among
the first settled suburban areas outside of cities,
and elsewhere are often termed “older” or “inner”
suburbs. Two more Minnesota counties, Anoka and
Dakota, are labeled “mature suburbs,” with between
75 and 95 percent of their populations in urbanized
areas. Many such suburbs were developed largely
in the 1960s and 1970s. Three more Minnesota
counties—carver, Scott, and Washington—are termed
“emerging suburbs,” with between 25 percent and
75 percent of their populations in urbanized areas.
These tend to be among the fastest-growing commu-
nities in metropolitan areas, with significant develop-
ment in the 1980s and thereafter. finally, six more
sparsely settled counties (four in Minnesota, two in
Wisconsin) are labeled “exurbs,” areas that tend to
lie at the rural fringe of metropolitan areas.22
THE WEBSITEThe State of Metropolitan America also introduces
a dynamic, interactive website that allows users to
display, map, and download data for the nation’s 50
states (plus the District of columbia), 100 largest
metropolitan areas, and their cities and suburbs
on over 300 social, demographic, and economic
indicators. The website goes beyond the report by
providing more data, for more geographies, and for
more years (2000, 2006, 2007, and 2008, as well as
change since 2000), allowing users to make com-
parisons not presented in the report.
The website’s geographic profiles also provide a
detailed “snapshot” of key indicators from across
all nine of the report’s major subject areas, for each
of the 100 largest metro areas (including their cities
and suburbs) and the 50 states (plus the District
of columbia), which users can view dynamically or
download. in addition, subject profiles provide sum-
maries of each major subject area (e.g., population ST
AT
e o
f M
eT
ro
po
liT
An
AM
er
icA
| A
BO
UT
TH
E S
TA
TE
oF
ME
TR
oP
ol
ITA
N A
ME
RIC
A19
www.brookings.edu/metroamerica

ST
AT
e o
f M
eT
ro
po
liT
An
AM
er
icA
| A
BO
UT
TH
E S
TA
TE
oF
ME
TR
oP
ol
ITA
N A
ME
RIC
A
and migration, race and ethnicity, etc.) that users can
display or download.
This interactive website, accessible at www.
brookings.edu/metroamerica, facilitates readers’
continued exploration of the nation’s metropolitan
areas and the particular trends highlighted in
the report. n
ENDNOTES1. Many chapters include analysis for different race and
ethnic groups. in general, the terms “white,” “black” or
“African American,” “Asian,” and “other race” are used
to refer to non-hispanic members of these groups,
while “hispanics” or “latinos” (used interchangeably)
can be of any race. The term "non-white" refers to
groups other than non-hispanic whites. exceptions to
this approach are noted in the text.
2. The most notable AcS topic not addressed in this edi-
tion of the State of Metropolitan America is housing.
The AcS collects information from households on
subjects such as the age and layout of their homes,
ownership status, housing costs, and home values.
given the dramatic state of flux in the housing market
in 2008 and thereafter, results from the survey on
many of these topics may significantly lag current reali-
ties, especially in parts of the nation most affected by
foreclosures and declines in house prices. Although this
report does not include analysis on these housing sub-
jects, brookings does intend to return to the topic in a
future edition of the annual report, as well as examine
selected housing indicators as part of other forthcom-
ing reports in the State of Metropolitan America series.
3. The results of the annual AcS are tabulated as “one-
year estimates” and provide a statistically valid sample
for census-recognized geographies with populations
of at least 65,000. The census bureau also combines
multiple years of AcS results to yield statistically valid
samples for smaller geographies. The obama adminis-
tration’s fy 2011 budget contains a $44 million request
to increase the AcS sample to 2.5 percent of the popu-
lation, or 3.5 million households. FY 2011 Budget of the
U.S. Government Appendix, Department of commerce.
4. unless otherwise noted, comparisons between census
2000 and 2008 AcS results are tested for statistical
significance at the 90 percent confidence level.
5. This methodology has implications for the interpre-
tation of income data as reflecting the onset of the
great recession in late 2007 and early 2008. See inset
“The State of Metropolitan America and the great
recession” for further details.
6. The population and Migration chapter includes some
data from 2009 on metropolitan populations and
components of change, and the Work chapter includes
unemployment rate data from 2009.
7. nationwide, payroll employment declined 666,000
(0.5 percent) in the first 6 months of 2008, then
fell by 2,957,000 (2.2 percent) in the last 6 months of
the year.
8. http://factfinder.census.gov
9. brookings and the u.S. census bureau entered into a
Joint project Agreement in 2009 (Agreement number
75-2009-JpA-01) that permitted brookings to analyze
data from the 2008 American community Survey
(AcS). A brookings consultant with census bureau
Special Sworn Status analyzed microdata housed on
site at the census bureau in Suitland, MD, producing
special tabulations for topics and geographies that
could not be constructed using publicly-available data.
The bureau’s AcS office provided brookings with
access to the files and support in using them, and the
bureau’s Disclosure review board provided review and
approval of the tabulations that brookings produced.
10. in addition, the Work chapter uses data on metropoli-
tan unemployment rates from the bureau of labor
20

Statistics’ local Area unemployment Survey.
11. Although many of these same topics are tracked in the
AcS, the census bureau actually uses the population
estimates program data to establish the sampling
frame for the AcS, so that they represent a more
primary source of information about population and its
characteristics (and in the case of population counts,
more recent) than the AcS. That noted, data on race
and ethnicity and age for sub-county geographies (i.e.,
cities and suburbs) in this report come from the AcS,
as they are not available from the estimates program.
12. brookings analysis of census bureau population
estimates program data for 2009.
13. brookings analysis of American community Survey
data for 2008. reflects people living in places (e.g., cit-
ies and towns).
14. u.S. census bureau current population Survey, 2008
Annual Social and economic Supplement.
15. karen g. Mills, elisabeth b. reynolds, and Andrew
reamer, “clusters and competitiveness: A new federal
role for Stimulating regional economies” (Washington:
brookings institution, 2008).
16. Some of this description originally appeared in Alan
berube, MetroNation: How U.S. Metropolitan Areas
Fuel American Prosperity (Washington: brookings
institution, 2007).
17. in 2008, 101 metro areas had populations exceeding
500,000 (lancaster, pA had 504,000 residents).
18. All data for metropolitan areas in this report refer to
the metro areas as they were defined by oMb in 2007;
that is, we hold the county boundaries of metro areas
consistent across time.
19. for more on oMb/census methodologies for defining
metro areas and principal cities, see William h. frey
and others, “Tracking Metropolitan America into the
21st century: A field guide to the new Metropolitan
and Micropolitan Definitions” (Washington: brookings
institution, 2004).
20. five primary cities—bradenton, fl; greenville, Sc;
harrisburg, pA; portland, Me; and poughkeepsie,
ny—are the largest cities in their respective metro
areas but have populations under 65,000. As a result,
the census bureau does not report results from the
AcS for these cities in its one-year estimates due to
insufficient sample size. Topics for which this report
uses the 2008 AcS to analyze results for cities and
suburbs typically exclude these five metro areas
because of this data limitation.
21. The new york-northern new Jersey-long island,
ny-nJ-pA metro area is re-named “new york-newark,
ny-nJ-pA” to recognize newark’s role as a primary city
in northern new Jersey. Metro areas listed by their full
names, with brookings-designated primary cities identi-
fied, can be found on the website www.brookings.edu/
metroamerica.
22. While the Minneapolis-St. paul metro area has suburbs
of all different types based on this classification system,
many metropolitan areas have fewer, especially those
with a smaller number of large counties (such as in
new england and the West). Therefore, indicators and
trends by suburban type in this report are presented
for all large metro areas in the aggregate, rather than
for individual metro areas. for further description
of a similar typology, see robert e. lang, Thomas W.
Sanchez, and Alan berube, “The new Suburban politics:
A county-based Analysis of Metropolitan Voting
Trends Since 2000.” in ruy Teixeira, ed., Red, Blue, and
Purple America: The Future of Election Demographics
(Washington: brookings institution press, 2008).
ST
AT
e o
f M
eT
ro
po
liT
An
AM
er
icA
| A
BO
UT
TH
E S
TA
TE
oF
ME
TR
oP
ol
ITA
N A
ME
RIC
A21

oVerVieW

The 2000s were a tumultuous decade for Americans. The oscillating state of the economy,
which careened from a mild recession, to a historic boom in house prices, to the worst
downturn since the great Depression, complicates the task of summarizing what the decade
meant for the future of American society. The 2000s were less a coherent era than a series
of dramatically different economic epochs. Moreover, it is difficult to know whether, or how long, several of the
recession-induced trends we identify in this report—slowed migration, increased enrollment in higher educa-
tion, declining median wages and incomes, rising levels of poverty—might persist into the coming decade.
but even as the economy spun through a remark-
able series of astronomical highs and abysmal lows,
demographic and social trends that continue to
transform our population proceeded apace. if any-
thing, the decade accelerated America’s longer-term
approach toward a number of critical demographic
and social junctures. This report shows that our
nation now faces a series of “new realities” about
who we are, where and with whom we live, and how
we provide for our own welfare, as well as that of our
families and communities. These new realities relate
to: the continued growth and outward expansion of
our population; its ongoing racial and ethnic diversi-
fication; the “rapid” aging we are about to undergo;
our increasing but selective higher educational
attainment; and the intensified income polarization
experienced by our workers and families. in each
of these five areas, the nation reached important
milestones in the 2000s that make those underlying
realities too large to ignore any longer.
if these trends position the united States as a
whole at a demographic crossroads, then our large
metropolitan areas have already forged ahead.1
because of their size, and their historical and con-
temporary role in America’s economy and society,
our major cities and suburbs stand on the very
front lines of these dynamics. They are thus the
places where the nation is feeling the challenges
that accompany these new realities first, and where
the responses that will shape our next society must
ultimately be co-produced.
THE FIVE NEW REALITIES
Growth and Outward Expansionunlike many of its peers in the industrialized world,
the united States retained a robust rate of popula-
tion growth in the 2000s. The nation’s population
passed 300 million, and over the course of the
decade, the nation will have added roughly 28 million
people, about a 10 percent growth rate. The healthy
levels of fertility and immigration present in the
united States confirm that, despite economic tumult,
our population—and those around the globe—remains ST
AT
e o
f M
eT
ro
po
liT
An
AM
er
icA
| O
VE
RV
IEW
23

ST
AT
e o
f M
eT
ro
po
liT
An
AM
er
icA
| O
VE
RV
IEW
hopeful about the opportunities our society pro-
vides. indeed, our growth will ultimately provide a
demographic cushion that may help us cope better
with another new reality—supporting an increasingly
aging population (see below).
our nation’s large metro areas remain at the
cutting edge of the nation’s continued growth. As
Population and Migration shows, between 2000 and
2009, the 100 largest metropolitan areas grew by a
combined 10.5 percent, versus 5.8 percent growth in
the rest of the country, and by the end of the decade
housed two-thirds of all Americans. While, on net,
people move from large metro areas to other parts
of the country in the aggregate, these places gain
from births to their relatively younger populations,
and from the migrants they attract from abroad in
large numbers.
yet the 2000s, particularly the go-go years of the
housing bubble, fueled growth patterns in which the
outermost reaches of metropolitan areas expanded
at several times the rate of cities and core urban
communities. in the 100 largest metro areas, cities
and high-density suburban counties grew by a little
under 5 percent from 2000 to 2008, while less
developed, generally smaller counties grew at more
usage.3 indeed, while Commuting confirms that the
share of Americans getting to work via public transit
grew marginally for the first time in decades, it did so
against the backdrop of a society in which three out
of four commutes occurred alone, in a car.
The bursting of the housing bubble ushered in at
least a temporary retreat from the longer-run march
toward outer suburbia and lower-density metropoli-
tan areas in general, a pattern also chronicled in
Population and Migration. Whether a move toward
more environmentally sustainable modes of liv-
ing and transportation, in both cities and suburbs,
will persist into the 2010s will depend on a range
of factors. if recent history is any guide, public
policy tools—both national and local in scope—will be
needed to ensure that future development reflects
the full range of its economic and environmental
impacts on communities and society.
Population Diversificationin a country that recently elected its first African
American president, it can be easy to forget that not
so long ago, we were a considerably more racially
and ethnically homogeneous society than we are
today. in 1970, non-hispanic whites accounted for
roughly five in six Americans, a share that has
dropped to less than four in six today. immigrants
that year were less than 5 percent of u.S. population;
their share topped 12 percent in 2008. Today, our
nation’s population is one-third non-white (including
hispanics), and those groups are projected to reach
majority status by 2042.
immigration helps explain this transition toward
a more racially and ethnically diverse society. in the
2000s, immigration accounted for roughly one-
third of u.S. population growth. The majority of the
remainder came from a natural increase of native-
born racial and ethnic minorities. nearly a quarter of
than three times that rate.
by 2008, 40 percent of the
metropolitan population lived
in these spread-out areas.2
This pattern of growth poses
stark challenges for efforts
to reduce greenhouse gas
emissions. homes and cars
account for a significant por-
tion of u.S. carbon emissions,
and lower-density develop-
ment is associated with
higher energy and vehicle
24
309 millionU.S. population
40%Share of large metropolitan popula-tion living in lower-density counties
Growth and outward Expansion

all u.S. children in 2008 were the sons and daugh-
ters of at least one immigrant parent. This coming-
of-age generation, a little over 30 years from now, is
projected to stand on the precipice of our transition
to a non-white majority nation.
large metropolitan areas will get there first.
As Race and Ethnicity reveals, in 2008 these
areas contained 68 percent of the nation’s multi-
racial population, 74 percent of its blacks, 80 percent
of its hispanics, and 88 percent of its Asians.
roughly one in six of their residents was foreign-
born, a share exceeding that of the united States as
a whole during the last great wave of immigration
at the turn of the twentieth century. notably, the
under-18 population across the 100 largest metro-
politan areas reached majority non-white status
by 2008.
America’s largely successful history at integrat-
ing immigrants into its social fabric remains one of
its greatest economic and societal strengths. That
strength is being tested anew, however, both by
the large volume of immigration the country has
recently experienced, and by the socioeconomic
challenges that many of those immigrants and
their children face. This is especially pronounced in
the metropolitan communities that most of these
new Americans call home. Immigration shows that
some of these communities, especially suburbs,
experienced rapid immigrant growth over both the
1990s and 2000s. Meanwhile, the nation’s track
record with respect to helping African Americans
climb the socioeconomic ladder is mixed at best. yet
that group will remain a large and growing part of
an increasingly diverse workforce as well. it shares
some challenges with other minority groups, as well
as disadvantaged portions of the white population,
that metro areas on the front lines of this transition
will be unable to fully address on their own.
Aging of the Populationgiven the baby boomers’ outsized influence on
(among other things) our economy, our popular cul-
ture, and our politics, the move of the first members
of this cohort into seniorhood—scheduled to begin
in 2011—has not gone unnoticed. The demographic
impact will be monumental, a veritable “age tsu-
nami” compared to the smaller World War ii genera-
tion immediately preceding them. foreshadowing
this, the number of 55-to-64 year-olds nationwide
grew by nearly 50 percent from 2000 to 2010, as
detailed in Age, with an even larger number of
younger boomers (44 to 54 years old) looming in
their wake. Together, u.S. boomers and seniors now
number more than 100 million. Their impending
retirements have provoked much analysis on the
future of health care, our entitlement systems, the
labor market, and the stock market.
Attracting somewhat less attention have been
the questions of how and where aging will transform
America’s communities. once again, large metro
areas find themselves at the forefront of the trend.
They are in one sense aging faster than the nation as
a whole, experiencing a 45 percent increase in their
55-to-64 year-old population
from 2000 to 2008, versus
40 percent nationally. More
than one-third of their popu-
lations are now over the age
of 45. And Households and
Families reveals that metro
areas’ single-person house-
holds are growing more rap-
idly than the national average
as well. As noted below, these
increases are registering
largely in the suburban com-
munities that much of this ST
AT
e o
f M
eT
ro
po
liT
An
AM
er
icA
| O
VE
RV
IEW
25
1/3Non-white share of U.S. population
1/2Non-white share of under-18
population in large metro areas
Population Diversification

ST
AT
e o
f M
eT
ro
po
liT
An
AM
er
icA
| O
VE
RV
IEW
generation has always called home, but which were
not designed with the boomers of 2020 in mind.
Moreover, because they are the locus of both
America’s diversifying and aging populations, large
metro areas register a larger “cultural generation
gap.” Although more than 50 percent of their com-
bined child population is non-white, their over-65
population remains 75 percent white. Metropolitan
communities thus face particular challenges not
only in how to preserve a high quality of life for the
growing cadre of elderly who will age in place there,
but also in how to reconcile the distinct needs of that
population with very different next generations of
workers, homeowners, and voters.
Uneven Higher Educational AttainmentThe 2000s continued a trend that has made the
united States one of the most highly educated
nations in the world. More than one-third of u.S.
adults held a post-secondary degree in 2008, up
from one-quarter in 1990. These higher levels of edu-
cation have helped propel our economic growth, and
the quality of our higher educational institutions has
make up a growing share of our future workforce lag
their white and Asian counterparts dramatically on
post-secondary attainment.
large metro areas at once lead the nation in this
regard, while exemplifying even more strongly the
disparities that lie beneath. Their residents earn
four-year degrees at a much higher rate (31 per-
cent) than those living elsewhere (21 percent). but
35-to-44 year-olds in large metro areas post higher
degree attainment rates than their 25-to-34 year-
old counterparts. And the attainment disparities
between whites and Asians on the one hand, and
blacks and hispanics on the other are more pro-
nounced in large metro areas. by 2008, that racial/
ethnic gap in bachelor’s degree attainment had
passed 20 percentage points.
The issues that lay behind these trends are
numerous, and extend well beyond the purview of
the higher education sector alone. but with decent-
paying jobs in the u.S. labor market poised to
demand ever-greater levels of education and skills
from their workers, the economic and social future of
metropolitan areas may hinge on the ability of their
economic and social institutions to propel a younger,
more diverse population toward post-secondary
success.
Income PolarizationThe economically tumultuous 2000s were not kind
to the typical American household, which saw its
inflation-adjusted income decline by more than
$2,000 between 1999 and 2008—and probably
even further by 2009 when the economy hit bot-
tom. This will likely mark the first census decade in
recent u.S. history in which real median household
income declined. nor was the decade a good one
for Americans living at the economic margins; the
number of people living below the poverty line rose
attracted talented individuals
from all over the globe.
yet as Educational
Attainment demonstrates,
the trend that has recently
propelled growth in u.S.
educational attainment—each
generation “out-attaining”
the one before it—may be
faltering. enrollments are
rising, but rates of completion
appear to be stalling among
young adults. Moreover,
the African American and
hispanic groups projected to
26
117 millionPopulation of U.S. boomers and
seniors (age 45 and over)
38%Share of large metropolitan population age 45 and over
Aging of the Population

15 percent, and the u.S. poverty rate increased from
12.4 percent to 13.2 percent.
one could chalk these trends up to purely cyclical
forces, but this would overlook what appear to be
longer-run, structural changes that led to continued
polarization of wages and incomes over the decade.
Work details how low-wage workers lost considerable
ground in the 2000s, with hourly earnings declining
by 8 percent. Middle-wage workers suffered a wage
decline of more than 4 percent. At the top of the
distribution, however, high-wage workers saw hourly
earnings rise by more than 3 percent. not surpris-
ingly, these wage trends accompanied a further rela-
tive decline in the size of the middle class, building
on a trend from past decades.4
large metro areas stood at the vanguard of this
troubling trend, too. Their low-wage workers suffered
greater losses, and their high-wage workers made
greater gains, than the national average during the
2000s. by 2008 high-wage workers in large metro
areas out-earned their low-wage counterparts by a
ratio of more than five to one, reflecting an espe-
cially stark divide between the haves and have-nots
in metropolitan America. This holds by race/ethnicity,
too, with non-hispanic whites in large metro areas
out-earning their black and hispanic counterparts
by larger margins than in smaller communities.
And as explored below and in Income and Poverty,
large metro areas demonstrated household income
polarization of a different, equally important kind in
the 2000s—a regional “pulling apart” that pummeled
some corners of the nation even as it left others
relatively unscathed.
These trends called into question the sufficiency
of overall macroeconomic growth—and metropolitan
economic growth, too—for improving living standards
for most Americans. broadly shared prosperity is
important at both levels for the future of our society
and our democracy, and much more purposeful
public policies may be needed in the decade ahead
to ensure that the next round of economic growth
delivers on that goal.
NEW REALITIES VARy IN THEIR INTENSITy ACROSS METROPOLITAN AMERICAlarge metropolitan areas as a group are notewor-
thy for exhibiting a forward-leaning position across
the five new demographic and social realities that
America confronts. like any group with 100 distinct
members, however, variation abounds. in some ways,
large metropolitan areas actually became more dif-
ferent from one another in the 2000s. Still, much
can be gleaned about the present and future of large
metro areas from a basic demographic typology of
these areas, the results of which confound simple
35%Share of U.S. population age 25 and over with a post-secondary degree
21%Difference in bachelor’s degree attainment rate, whites/Asians
versus blacks/Hispanics in large metro areas
Uneven Higher Educational Attainment
regional ways of viewing the
country and its population.
Metropolitan DistinctivenessThe 100 largest metro areas
span a wide range of social,
demographic, and economic
experience. Across the nine
subject areas of this report,
enormous differences sepa-
rate the metropolitan areas
with the highest and lowest
rankings in 2008. The new
york metro area, for instance,
has nearly 40 times the
population of the Modesto
metro area. The non-white ST
AT
e o
f M
eT
ro
po
liT
An
AM
er
icA
| O
VE
RV
IEW
27

ST
AT
e o
f M
eT
ro
po
liT
An
AM
er
icA
| O
VE
RV
IEW
share of population in McAllen is roughly 16 times
that in portland (Me), and immigrants make up
nearly 20 times the share of population in Miami as
in youngstown. boomers and seniors are a majority
of the population in bradenton, but just one-fifth in
provo. And adults in the Washington, D.c. area are
more than three times as likely to hold a college
degree as those in the bakersfield area.
over the past decade, these major metropolitan
areas diverged on many aspects of the emerging
realities defining and challenging our society:
• on growth and outward expansion, the 2000s
brought hyper-growth in some parts of the Sun belt,
along with population decline in struggling parts of
the great lakes region. provo, raleigh, las Vegas,
and cape coral each had at least one-third more
people in 2008 than in 2000. Meanwhile, something
of a “lake effect” produced population losses in
Syracuse, rochester, buffalo, youngstown, cleveland,
and Toledo, along with the nearby metro areas of
Detroit, pittsburgh, and Scranton. even as many
declined in population, Midwestern metro areas
sprawled outwards, experiencing more than half of
of metro areas, they remained highly concentrated in
a handful of very large places. A majority of Asians,
and a near-majority of hispanics, lived in just 10 met-
ropolitan areas in 2008 (versus 25 percent of total
u.S. population), producing wide variation across
metro areas in the share of children who are “second
generation” Americans (from 4 percent in Jackson to
60 percent in los Angeles). Meanwhile, the number
of blacks shrank in Midwestern and coastal california
metro areas, and nearly one-fifth of black population
gains in the 100 largest metro areas occurred in the
Atlanta region
• on aging, already youthful metro areas such
as Austin and boise augmented that profile in the
2000s by adding large numbers of younger fami-
lies with children, both white and minority, and now
have relatively low shares of their populations
aged 45 and over. At the same time, rapidly aging
metro areas in the northeast and Midwest such as
youngstown and pittsburgh saw their numbers of
married-with-children households drop at alarm-
ing rates, and now the boomer/senior share of their
populations approaches half
• on higher educational attainment, the metro
areas with the most highly educated populations
essentially pulled farther away from the pack in the
2000s. boston, new york, and San francisco ranked
among the top gainers of college graduates over the
decade, while progress largely stalled in lower-attain-
ing metro areas such as chattanooga, el paso, and
Modesto. The degree attainment difference between
Washington, D.c. and bakersfield (#1 and #100,
respectively) grew from 26 percentage points in 1990
to 34 in 2008. This clustering of the highly educated
generally added to racial gaps in attainment within
metro areas; the white/black college degree gap, for
instance, grew considerably in “talent magnet” loca-
tions such as San Jose, Seattle, and Minneapolis
-$2,241Change in U.S. real median
household income, 1999 to 2008
5.25Ratio of high-wage worker to
low-wage worker hourly earnings, large metro areas
Income Polarizationtheir population gains in low-
density counties. by compari-
son, only 20 percent of popu-
lation gains in northeastern
metro areas, and 16 percent
in Western metro areas,
occurred in these farther-
flung locations
• on population diversifi-
cation, while America’s racial
and ethnic minorities and
immigrants continued to dis-
perse in the 2000s, reaching
significant thresholds of pop-
ulation in a growing number
28

• on income polarization, the recession that
began in 2001 never really ended throughout much
of the Midwest as its manufacturing base shed
jobs throughout the decade. All 19 of the region’s
large metro areas experienced an inflation-adjusted
decline in median household income in the 2000s,
averaging more than 8 percent across those
households. by contrast, incomes held steady in
northeastern metro areas, even rising modestly
in areas such as Albany, Allentown, and Worcester.
Meanwhile, metropolitan areas with among the
lowest wages and incomes at the beginning of the
decade, such as bakersfield, el paso, and Scranton,
suffered losses in the 2000s
The great recession that took hold during the last
two years of the decade may have, at least temporar-
ily, moderated some aspects of this growing regional
inequality. This is because migration fell significantly
due to crippled housing and labor markets. growth in
much of the Sun belt and the outer suburbs cooled
off, immigration slowed, and Americans everywhere
went back to college in higher numbers. yet these
shifts neither reversed the full extent of the “pulling
apart” that occurred across the 2000s, nor did
they necessarily “lock in” new patterns of regional
growth and change that will persist once economic
growth resumes.
A Demographic Typology of Metropolitan AmericaWhile each metropolitan area possesses a unique
social, demographic, and economic profile, the dis-
tinctions among these places on many of the “new
realities” are also apparent among different groups
of metro areas. These groups do not break neatly
along traditional regional lines, such as Sun belt
The Seven Types of Large Metropolitan Areas Are Distinct Along Several Demographic Dimensions
% Growth in % % %
Total Core Areas, Population Population Educational Wage Commuters
Number of Population 2000 Age 45 Foreign- inequality inequality Driving
Metro Type Metro Areas (millions) to 2008* and Over Born Ratio** Ratio*** Alone
Diverse giant 9 58 50 38 28 2.8 5.7 65
Skilled Anchor 19 31 n/a 41 9 2.1 4.6 77
next frontier 9 29 41 35 18 2.6 5.4 74
new heartland 19 28 44 36 9 2.0 4.7 79
industrial core 18 22 n/a 40 6 2.1 4.5 82
border growth 11 19 30 33 19 2.7 4.9 77
Mid-Sized Magnet 15 13 29 41 8 2.0 4.5 81
100-metro average 100 199 33 38 16 2.4 5.2 74
Low Medium High
Note: all metro type averages weighted by 2008 population; statistics are for 2008 unless otherwise noted * Share of metropolitan growth in primary cities and high-density suburbs ("n/a" indicates population loss in these areas)** Ratio of college degree attainment rate, whites/Asians versus blacks/Hispanics*** Ratio of hourly earnings, high-wage (90th percentile) workers versus low-wage (10th percentile) workersr
ST
AT
e o
f M
eT
ro
po
liT
An
AM
er
icA
| O
VE
RV
IEW
29

ST
AT
e o
f M
eT
ro
po
liT
An
AM
er
icA
| O
VE
RV
IEW
versus Snow belt, east and west of the Mississippi, or
even the four census regions (northeast, Midwest,
South, and West). What differentiates them are
simple metrics of population growth, population
diversity, and educational attainment, as compared
to national averages.5 grouped into seven categories,
the particular issues facing the nation’s 100 larg-
est metro areas become clearer, as do the places to
which individual metro areas might look for common
solutions.
• Next Frontier metro areas exceed national aver-
ages on population growth, diversity, and educational
attainment.6 of these nine metro areas, eight lie
west of the Mississippi river (Washington, D.c. is the
exception). They attracted immigrants, families, and
educated workers during the 2000s thanks to their
diversified economies (including government employ-
ment in several) and relatively mild climates. in some
ways the demographic success stories of the 2000s,
next frontier areas are generally younger, growing
more densely, and more transit-oriented than other
metro areas. one price of their success is their higher
levels of both educational and wage inequality
• New Heartland metro areas are also fast grow-
ing, highly educated locales, but have lower shares
of hispanic and Asian populations than the national
average.7 These 19 metro areas include many in the
“new South” where blacks are the dominant minor-
ity group, such as Atlanta, charlotte, and richmond,
as well as largely white metro areas throughout
the Midwest and West, such as indianapolis, kansas
city, and portland (or). The service-based econo-
mies of these metro areas attracted many middle-
class migrants, both white and black, during the
2000s. That diverse in-migration has given the new
heartland areas a more racially equitable educa-
tional profile than other metropolitan types
• Diverse Giants feature some of the largest
metro areas in the country, including the three larg-
est (new york, los Angeles, and chicago), as well as
coastal anchors such as Miami, San francisco, and
San Diego.8 These nine regions post above-average
educational attainment and diversity, but below-
average population growth, owing in part to their
large sizes. like the new frontier areas, they are
growing more densely, but exhibit wide educational
30
NEXT FRONTIERHigh growth
High diversityHigh educational attainment
NEW HEARTLANDHigh growth
Low diversityHigh educational attainment

and wage disparities. With more than one-quarter of
their residents born abroad, these areas are home to
sizeable populations of “second-generation” children
of immigrant parents9
• Border Growth metro areas are mostly located
in southwestern border states, and as such are
marked by a significant and growing presence of
Mexican and other latin American immigrants.10 only
orlando lies outside the main orbit of this group of 11,
which stretches from central Texas, through Arizona
and nevada, and up california’s central Valley.
Many of these metro areas are suffering “migration
whiplash,” as they built large swaths of single-family
housing for tens of thousands of newcomers through
mid-decade, only to see growth largely halt with the
bursting of the housing bubble. for those work-
ers and families that stayed, especially less-skilled
hispanics, the challenge now before these areas is
to diversify the local economy in ways that provide
sustainable growth opportunities well beyond the
housing sector
• Mid-Sized Magnet metro areas are similar
in their recent growth and educational profile to
border growth centers, but are distinguished by
lower shares of hispanic and Asian minorities.11
These 15 mostly mid-sized locations, largely in the
Southeast but with a couple of Western representa-
tives, lack some of the high-value industries that
characterize the new heartland. Similar to the
border growth centers, some got caught in the
growth spiral of the 2000s that ended abruptly with
MID-SIzED MAGNETHigh growth
Low diversityLow educational attainment
BORDER GROWTHHigh growth
High diversityLow educational attainment
ST
AT
e o
f M
eT
ro
po
liT
An
AM
er
icA
| O
VE
RV
IEW
31
These new demo-
graphic realities
do not break
neatly along
traditional
regional lines,
such as Sun Belt
versus Snow
Belt.
DIVERSE GIANTLow growth
High diversityHigh educational attainment

ST
AT
e o
f M
eT
ro
po
liT
An
AM
er
icA
| O
VE
RV
IEW
the housing crash—particularly boise and the six
florida metro areas. having attracted many boomers
and seniors over time, Mid-Sized Magnets contain
the oldest populations among the metropolitan
types, but have grown in a distended fashion that
has left them among the most car-dependent of the
seven groups
• Skilled Anchors are slow-growing, less diverse
metro areas that boast higher-than-average levels
of educational attainment.12 Seventeen (17) of the 19
lie in the northeast and Midwest, and include large
regions such as boston and philadelphia, as well
as smaller regions such as Akron and Worcester.
Many are former manufacturing and port centers
that some time ago made the difficult transition to
service-based economies, with significant represen-
tation of medical and higher educational institutions.
others like pittsburgh and St. louis still specialize
in non-auto-related manufacturing sectors that
remained relatively steady over the 2000s. These
characteristics have kept Skilled Anchors demo-
graphically more vibrant than other parts of the
north (see below), even as they post lower levels
of inequality than faster-growing locales. Still, all of
the modest recent growth across these areas has
occurred in lower-density suburbs
• Industrial Cores are in some ways the most
demographically disadvantaged of the metropoli-
tan types.13 These 18 metro areas are largely older
industrial centers of the northeast, Midwest, and
Southeast. Their populations are slower-growing,
less diverse, and less educated than national
averages, and significantly older than the large
metropolitan average. A remaining industrial base
combined with lack of diverse in-migration to these
metro areas has kept educational and wage inequali-
ties in check. but these metropolitan areas lost
population in the aggregate during the 2000s,
yet still saw growth in their outer suburbs, even as
their cities and high-density suburbs declined
in size.
Viewing metropolitan America through this lens
offers a more nuanced view of the country and
its variable challenges than conventional regional
generalizations. The South, for instance, counts at
least one member in each of the seven metropolitan
INDUSTRIAL CORELow growth
Low diversityLow educational attainment
SKILLED ANCHORLow growth
Low diversityHigh educational attainment
32

categories, as very different demographic desti-
nies confront Atlanta versus Augusta, or Miami
versus palm bay. Similarly, the notion of a unified
“rust belt” stretching across large portions of the
northeast and Midwest overlooks the important
factors that distinguish populations in rochester,
cleveland, indianapolis, and chicago from one
another. As explored further in Policy Implications,
these population distinctions dictate different pri-
orities for metropolitan leaders seeking to forge a
prosperous future for their communities.
CITIES AND SUBURBS SHARE MORE THAN EVER IN THE NEW REALITIESeven as large metro areas “pulled apart” demograph-
ically from one another in some ways in the 2000s,
they also “came together” at the individual metro-
politan scale. Several trends in the 2000s further
put to rest the old perceptions of cities as declining,
poor, minority places set amid young, white, wealthy
suburbs. As this report outlines, the decade brought
many cities and suburbs still closer together along a
series of social, demographic, and economic dimen-
sions. in this way, the five new realities are, more
than ever, metropolitan—rather than purely urban or
suburban—in scope. examples include:
Growth—notwithstanding the general outward
expansion of metropolitan areas over the full decade,
the period from 2006 to 2008 saw a retrenchment
of population toward cities and high-density subur-
ban counties as outer suburban housing markets
crashed. indeed, high-density suburbs are increas-
ingly similar to cities in their overall growth trajec-
tory and commuting patterns than mature and
outer suburbs
Population diversification—by 2008, a majority
of members of all major racial and ethnic groups in
metropolitan areas lived in suburbs, as did more than
half of all immigrants nationwide. At the same time,
the white population grew in many older cities where
it had previously declined, such as Atlanta, boston,
and Washington, D.c.
Aging —a growing share of elderly and smaller
households are found in suburbia, a trend that
will only accelerate as the boomers—more than
70 percent of whom live in suburbs—enter senior-
hood. Meanwhile, many Sun belt cities added
younger populations during the 2000s, slightly
narrowing the “married-with-children” household
gap between cities and suburbs
Educational attainment—the distinction between
city and suburban educational attainment remained
almost negligible, given the regional nature of labor
markets and the concentration of high-value jobs in
denser urban areas that lure highly educated work-
ers. Thirty-one (31) and 32 percent of city and subur-
ban adults, respectively, held bachelor’s degrees in
2008. The most highly educated communities were
in fact high-density suburbs that surround many cit-
ies, where 36 percent of adults held a college degree
Income—the income and poverty gaps between
cities and suburbs, while still wide, narrowed in the
2000s. As overall metropolitan median income fell,
the difference between city and suburban median
incomes declined by about $800. Meanwhile, the
poverty rate in cities rose marginally, but jumped a
full percentage point for suburbs, as their poor popu-
lation grew five times faster. A majority of metropoli-
tan poor now live in suburbs, and their income, labor
market, and educational profiles largely mirror those
of their city counterparts
The urban/suburban boundary, it should be noted,
blurs more easily in some types of metropolitan ST
AT
e o
f M
eT
ro
po
liT
An
AM
er
icA
| O
VE
RV
IEW
33

ST
AT
e o
f M
eT
ro
po
liT
An
AM
er
icA
| O
VE
RV
IEW
areas than others. for instance, in next frontier, new
heartland, Diverse giant, and border growth metro
areas, racial and ethnic minorities represent a 10 to
20 percent larger share of population in cities than
suburbs. but that gap ranges from 20 to 40 percent
in Mid-Sized Magnet, industrial core, and Skilled
Anchor metro areas. Similarly, the city/suburban
median household income difference is relatively
muted in border growth and Mid-Sized Magnet cen-
ters ($6,000 to $7,000), but a substantial $27,000 in
the Skilled Anchors.
nonetheless, most of these gaps, regardless of
metropolitan type, narrowed during the 2000s. And
where sizeable differences in population shares and
median characteristics prevail, the locus of the new
reality (e.g., immigrants, older population, the poor)
continues to shift in new, mostly suburban, direc-
tions. in an era of severe fiscal restraint and increas-
ingly shared demography, governance must begin to
transcend the parochial 18th-century administrative
borders that frustrate shared approaches to increas-
ingly shared challenges.
CONCLUSIONThe 2000s found large metropolitan areas on the
front lines of America’s demographic transformation.
Together, they confront a series of new realities more
intense than those buffeting the rest of the nation,
on measures of growth and diversification, aging,
and increasingly uneven outcomes in educational
attainment and income. Those realities—and the chal-
lenges they imply—are shared more than ever across
city and suburban lines. nevertheless, the diverse
economic and social histories of metropolitan areas
persist in their contemporary demographic profiles.
for each of seven types of large metro areas, a
distinct set of issues comes to the fore, some within
metro areas’ own capacities to tackle, but oth-
ers fundamentally beyond their reach. chronicling
the unprecedented demographic changes afoot in
America generally, and their specific metropolitan
manifestations, the State of Metropolitan America
brings these new realities into sharp focus as the
nation enters a new and undoubtedly challenging
decade. n
ENDNOTES1. See “About the State of Metropolitan America” for more
on the definition and importance of metropolitan areas.
2. These areas (counties and county remainders) were
defined as “lower-density” based on their having less
than 95 percent of their population living in urban-
ized areas in 2000. it is likely that based on population
growth patterns from 2000 to 2008, that some of these
areas would no longer qualify as “lower-density” based
on their contemporary settlement patterns. Still, their
share of metropolitan population rose from 39 percent
in 2000 to 42 percent in 2008. The results of the 2010
census will reveal changes over the decade in the rate of
population urbanization in u.S. counties.
3. Marilyn A. brown, frank Southworth, and Andrea
Sarzynski, “Shrinking the carbon footprint of
Metropolitan America” (Washington: brookings
institution, 2008).
4. Jason booza, Jackie cutsinger, and george galster,
“Where Did They go? The Decline of Middle-class
neighborhoods in Metropolitan America, 1970–2000”
(Washington: brookings institution, 2006).
5. Specifically, statistics for each metropolitan area were
compared to approximate national averages on three
indicators: (a) population growth from 2000 to 2008
(above or below 8 percent); (b) share of population
34

other than black and non-hispanic white (above or
below 22.5 percent); and (c) share of adults 25 years
and over with a bachelor’s degree (above or below 28
percent). This produced the seven groups of metro areas
described in the text.
6. next frontier metro areas include: Albuquerque, nM;
Austin, Tx; Dallas-fort Worth-Arlington, Tx; Denver-
Aurora, co; houston, Tx; Sacramento-roseville,
cA; Seattle-Tacoma-bellevue, WA; Tucson, AZ; and
Washington-Arlington-Alexandria, Dc-VA-MD-WV.
7. new heartland metro areas include: Atlanta, gA;
charleston, Sc; charlotte, nc-Sc; colorado Springs,
co; columbia, Sc; columbus, oh; Des Moines, iA;
indianapolis, in; kansas city, Mo-kS; knoxville, Tn;
Madison, Wi; Minneapolis-St. paul, Mn-Wi; nashville, Tn;
omaha, ne-iA; portland-Vancouver, or-WA; provo, uT;
raleigh-cary, nc; richmond, VA; and Salt lake city, uT.
8. Diverse giant metro areas include: chicago-naperville-
Joliet, il-in-Wi; honolulu, hi; los Angeles-long beach-
Santa Ana, cA; Miami-fort lauderdale-pompano beach,
fl; new york-newark, ny-nJ-pA; oxnard-Thousand
oaks-Ventura, cA; San Diego, cA; San francisco-
oakland-fremont, cA; and San Jose-Sunnyvale-
Santa clara, cA.
9. “Second generation” is used here to refer to children
of one or more foreign-born parents living in the
united States, and includes both foreign-born and
u.S.-born individuals under age 18. See immigration
for further details.
10. border growth metro areas include: bakersfield, cA;
el paso, Tx; fresno, cA; las Vegas, nV; McAllen, Tx;
Modesto, cA; orlando, fl; phoenix-Mesa-Scottsdale,
AZ; riverside-San bernardino, cA; San Antonio, Tx; and
Stockton, cA.
11. Mid-Sized Magnet metro areas include: Allentown,
pA-nJ; baton rouge, lA; boise, iD; bradenton, fl; cape
coral, fl; chattanooga, Tn; greensboro-high point, nc;
greenville, Sc; Jacksonville, fl; lakeland, fl; little rock,
Ar; ogden, uT; oklahoma city, ok; palm bay, fl; and
Tampa-St. petersburg-clearwater, fl.
12. Skilled Anchor metro areas include: Akron, oh;
Albany, ny; baltimore, MD; boston-cambridge, MA;
bridgeport-Stamford, cT; cincinnati, oh-ky-in; hartford,
cT; Jackson, MS; Milwaukee, Wi; new haven, cT;
philadelphia, pA-nJ-De-MD; pittsburgh, pA; portland,
Me; poughkeepsie, ny; rochester, ny; St. louis, Mo-il;
Springfield, MA; Syracuse, ny; and Worcester, MA.
13. industrial core metro areas include: Augusta-richmond
county, gA-Sc; birmingham, Al; buffalo, ny; cleveland,
oh; Dayton, oh; Detroit-Warren, Mi; grand rapids, Mi;
harrisburg, pA; louisville, ky-in; Memphis, Tn-MS-Ar;
new orleans, lA; providence, ri; Scranton, pA; Toledo,
oh; Tulsa, ok; Virginia beach-norfolk-newport news,
VA-nc; Wichita, kS; and youngstown, oh-pA.
ST
AT
e o
f M
eT
ro
po
liT
An
AM
er
icA
| O
VE
RV
IEW
35

36
I. populATion & MigrATion
B y T H E N U M B E R S
25million
Increase in population, United States, 2000 to 2009
11.9%Share of population chang-
ing residence, United States, 2007 to 2008 (postwar low)
+95,000 / -7,000
Net domestic migration, Riverside-San Bernardino
metro area, 2003 to 2004 / 2007 to 2008
67Number of primary cities
(out of 100) with population increases, 2000 to 2008
WILLIAM H. FREy

ST
AT
e o
f M
eT
ro
po
liT
An
AM
er
icA
| P
OP
UL
AT
ION
& M
IGR
AT
ION
37
OVERVIEW
n Population growth in the United States and its large metro areas was robust in the 2000s. The
housing crisis and ensuing deep recession, however, slowed migration considerably, so that the share of
Americans changing residence in 2007–2009 was lower than at any point in postwar history.
n The decade continued the broad shift of U.S. population toward the Sun Belt. Metropolitan areas gaining
the most population from 2000 to 2009 included several of the fastest growers from the 1990s, as well as
regions that boomed during the early part of the decade due to real estate development before the housing
market crashed.
n The 2000–2006 and 2006–2009 periods represent two distinct migration epochs for metropolitan
America. Migration magnets in florida, the intermountain West, and inland california during the first half of
the decade saw inflows plummet post-crash, while metro areas in Texas and the Southeast with more diversi-
fied economies held steady. large metro areas that had previously “exported” large numbers of residents to
other parts of the country saw out-migration slow considerably toward the end of the decade.
n Strong immigration throughout most of the 2000s cushioned populations in large metropolitan areas
experiencing domestic out-migration. Metropolitan new york, los Angeles, chicago, and San francisco lost
hundreds of thousands of domestic migrants across the decade, but experienced substantial counterbalanc-
ing inflows of international migrants.
n Two-thirds of primary cities in large metropolitan areas grew from 2000 to 2008. city growth spread
and accelerated between 2006 and 2008, as many core urban areas realized a “windfall” of residents due to
the impact of the housing slump on movement to the suburbs.
NATIONAL AND REGIONAL TRENDSpopulation growth remains an important barometer
of economic and societal well-being in America.
Though ours is an aging population—due to increas-
ing life expectancy and the outsized baby boom
generation about to reach seniorhood—healthy levels
of fertility and immigration in the united States have
combined to make it a fast-growing country among
its industrialized peers over the last few decades.
This story remained true in the 2000s. between
2000 and 2009, the country added roughly 25 mil-
lion people, an 8.8 percent increase (figure 1). This
was not quite as high as the growth rate in canada
over the same time period (10.4 percent), though the
united States added more than seven times the num-
ber of people as our northern neighbor. u.S. growth,
meanwhile, far outpaced that in the european union
(3.5 percent).1
Though ours is
an aging popu-
lation, healthy
levels of fertility
and immigration
in the United
States have com-
bined to make it
a fast-growing
country among
its industrialized
peers over the
last few decades.

ST
AT
e o
f M
eT
ro
po
liT
An
AM
er
icA
| P
OP
UL
AT
ION
& M
IGR
AT
ION
38
0.0%
2.0%
4.0%
6.0%
8.0%
10.0%
12.0%
14.0%
16.0%
18.0%
WestSouthNortheastMidwestNon-Metro AreasSmall Metro AreasLarge Metro AreasUnited States
0.0%
2.0%
4.0%
6.0%
8.0%
10.0%
12.0%
14.0%
16.0%
18.0%
20.0%Annual Migration Rate
2008-20092007-20082006-20072005-20062004-20052003-20042002-20032001-20022000-20011999-20001998-19991997-19981996-19971995-19961994-19951993-19941992-1993*1991-1992
The 2000s also saw faster growth in large u.S.
metropolitan areas than elsewhere in the country.
The combined population of the 100 largest metro
areas rose 10.5 percent through 2009, compared to
8.7 percent in smaller metro areas, and 2.7 percent
outside of metro areas. large metro areas together
accounted for over three-fourths of the nation’s
population increase during that period. Metro areas
with populations over 1 million grew at nearly exactly
the same overall rate as those with populations
between 500,000 and 1 million.
continuing the trend from past decades, u.S. pop-
ulation in the 2000s shifted from the northeast and
Midwest, toward the South and West. large metro
areas in the latter regions experienced much higher
growth rates than those in the former regions. The
particular metropolitan areas at either end of the
growth spectrum are detailed further below.
The 2000s, however, were a highly uneven decade.
beyond the population trends, the end of the decade
Figure 2. The U.S. Annual Migration Rate Reached a Postwar Low in the Late 2000sShare of Persons Changing Residence,
1991-1992 to 2008-2009
Source: Brookings analysis of Current Population Survey dataSource: Brookings analysis of U.S. Census Bureau Population Estimates Program data
brought about a historic decline in migration, driven
by a sequence of factors. first, the housing “bubble”
that arose during the middle part of the decade
popped, bringing an end to the rapid homebuilding
and easy mortgage credit that propped up migration
in previous years. Second, this precipitated a seri-
ous financial market crisis in September 2008 that
produced sharp reductions in credit availability. As a
result, potential buyers had difficulty obtaining mort-
gages, and potential sellers saw reductions in the val-
ues of their homes. Third, the financial crisis greatly
exacerbated the national recession that had begun
in December 2007, reducing job availability in most
regions of the country. This triple whammy made it
riskier for would-be homebuyers to find financing,
would-be sellers to receive good value for their home,
and potential long-distance movers to find employ-
ment in areas where jobs were previously plentiful.
These factors meant that by the end of the
2000s, America had reached a new low point in
Figure 1. Growth in Large Metro Areas, Especially Those in the South and West, Outpaced the National Growth
Rate in the 2000sPopulation Change by Geography Type, 2000 to 2009
Large Metro Areas by Region

ST
AT
e o
f M
eT
ro
po
liT
An
AM
er
icA
| P
OP
UL
AT
ION
& M
IGR
AT
ION
39
domestic migration.2 in 2007–2008, only 11.9 percent
of Americans changed residence, and this rose to
just 12.5 percent in 2008–2009. Together, these are
the lowest rates of annual mobility since the census
bureau began collecting migration statistics in
1947–1948 (figure 2).
long-distance, between-state migration declined
even more dramatically than within-county residen-
tial mobility. in fact, the 1.6 percent interstate migra-
tion rate in both 2007–2008 and 2008–2009 was
half the value exhibited in 1999–2000, and far lower
than the rate in the 1950s, when between 3 and 4
percent of the population moved across state lines
annually. Although short-distance moves are more
frequent, long-distance migration acts as an engine
of growth in many metropolitan areas as people seek
new job opportunities.
METROPOLITAN TRENDS
Population Trends Across the 2000sMetropolitan growth patterns across the 2000–2009
period, particularly the movement toward the
Sun belt, continued patterns evident in the 1990s.
During the earlier decade, the familiar postwar
population shifts from large northeastern and
Midwestern metro areas like new york, chicago,
and philadelphia, to growing Southern and Western
metro areas like Miami, Atlanta, los Angeles, Dallas,
and houston began to spread to a larger number of
areas in the interior West and the Southeast.3 While
the 10 fastest growing metro areas in the 1990s were
all located in the Sun belt (i.e., the South and West
regions), seven lay outside the traditional postwar
magnet states of florida, Texas and california. one
impetus for growth during this period was a high-
tech boom that manifested itself in several of these
new Sun belt growth magnets (raleigh, phoenix,
and boise) as well as in some traditional magnet
states (Austin).
The big gainers in the post-2000 decade do not
differ sharply from those in the 1990s (Table 1, right
panel). eight make the list for both decades, and
four of the top five gainers in the 2000s are located
outside the traditional magnet states. climbing
the list in the 2000s, however, were metro areas,
such as cape coral in florida, where booming real
estate development contributed more to recent
growth. The las Vegas and phoenix metro areas in
the intermountain West continued to occupy top
growth spots due to similar housing-led migration. of
course, the growth dynamics of these regions shifted
sharply in the latter part of the decade (see below).
Just as there were no dramatic shifts in the list
of fastest gainers between the 1990s and 2000s, the
list of slowest growing and declining metro areas
did not change significantly. in both periods, metro
areas in the nation’s manufacturing belt populate
the list. youngstown, buffalo, pittsburgh, Syracuse,
and Scranton registered population declines in both
periods. An additional five metro areas showed
population declines from 2000 to 2009, all of which
lay in the industrial northeast and Midwest, with the
exception of new orleans (resulting from out-migra-
tion due to hurricane katrina in 2005).
The division between growth in the Sun belt and
Snow belt continued to characterize the 30 most
populous metro areas during the 2000s (Map 1). The
two largest metropolitan areas, new york and los
Angeles, registered growth levels below 5 percent.
Among the seven additional metro areas with
populations exceeding 5 million, Atlanta, Dallas, and
houston increased their populations by more than
one-fifth. Among all 30 metro areas, las Vegas and
Metropolitan
growth pat-
terns across
the 2000–2009
period, particu-
larly the move-
ment toward
the Sun Belt,
continued
patterns evident
in the 1990s.

ST
AT
e o
f M
eT
ro
po
liT
An
AM
er
icA
| P
OP
UL
AT
ION
& M
IGR
AT
ION
40
Table 1. The Fastest and Slowest Growing Metro Areas in the 2000s Resemble Those From the 1990sHighest and Lowest Ranked Large Metro Areas by Population Growth, 1990 to 2000 and 2000 to 2009
1990 to 2000 2000 to 2009
Change to Population Change from Population
Rank 2000–2008 Metro Area Change (%) Rank 1990–2000 Metro Area Change (%)
Highest Growth Highest Growth
1 -2 las Vegas, nV 84.3 1 6 provo, uT 46.2
2 -2 Austin, Tx 48.6 2 2 raleigh-cary, nc 40.0
3 -6 McAllen, Tx 48.1 3 -2 las Vegas, nV 36.6
4 2 raleigh-cary, nc 46.6 4 -2 Austin, Tx 34.7
5 0 phoenix-Mesa-Scottsdale, AZ 45.8 5 0 phoenix-Mesa-Scottsdale, AZ 33.1
6 -2 boise city, iD 45.5 6 6 cape coral, fl 32.2
7 6 provo, uT 40.3 7 6 charlotte, nc-Sc 30.2
8 -2 Atlanta, gA 38.5 8 -2 boise city, iD 29.3
9 -3 orlando, fl 33.5 9 -6 McAllen, Tx 29.3
10 -17 Denver-Aurora, co 32.3 10 -2 Atlanta, gA 27.9
lowest Growth/Decline lowest Growth/Decline
91 -5 cleveland, oh 2.1 91 6 Syracuse, ny -0.6
92 8 Albany, ny 2.0 92 -4 rochester, ny -0.6
93 7 Springfield, MA 0.9 93 -11 Detroit-Warren, Mi -1.2
94 7 Toledo, oh 0.7 94 1 Dayton, oh -1.5
95 1 Dayton, oh 0.4 95 5 Scranton, pA -1.8
96 -1 pittsburgh, pA -1.6 96 -5 cleveland, oh -2.6
97 6 Syracuse, ny -1.8 97 -1 pittsburgh, pA -3.0
98 0 buffalo, ny -1.8 98 0 buffalo, ny -3.9
99 0 youngstown, oh-pA -1.9 99 0 youngstown, oh-pA -6.5
100 5 Scranton, pA -2.9 100 -13 new orleans, lA -9.5
Source: Brookings analysis of U.S. Census Bureau Population Estimates data
phoenix registered the fastest growth rates, each
exceeding 30 percent despite slowdowns post-2006.
Meanwhile, pittsburgh, cleveland, and Detroit all lost
population over the eight-year period.
Metropolitan Population Booms and Bustsin light of the sharp downturn in migration toward
the end of the 2000s, the broad patterns of
metropolitan growth from 2000 to 2009 described
above clearly camouflage what will be defined as
a tumultuous decade for population shifts among
metro areas. To get an overview of these boom-to-
bust impacts on metro areas, Table 2 contrasts the
fastest growing large metros from 2000 to 2006
with those from 2006 to 2009.
for several metro areas in california and florida
and the intermountain West the housing market

ST
AT
e o
f M
eT
ro
po
liT
An
AM
er
icA
| P
OP
UL
AT
ION
& M
IGR
AT
ION
41
Map 1. The Fastest-Growing Large Metro Areas in the 2000s Lay in the Sun Belt2000–2009 Growth Rate and 2009 Population Size, 30 Largest Metro Areas
crash also precipitated a migration crash. population
growth in cape coral, riverside, and orlando, along
with several other metro areas in california’s central
Valley (not shown), fell dramatically between 2000–
2006 and 2006–2009. las Vegas dropped out of
the top ten. other florida metro areas not near the
top of the list also experienced a substantial growth
slowdown as well between 2000–2006 and 2006–
2009, including bradenton (falling in growth rank
from 19th to 59th) and Tampa (from 28th to 60th).
The metro areas that either survived or moved up
in growth rank as the housing bubble popped and
the recession took root had less overheated housing
markets and more diversified economies. between
2006 and 2009, metro areas in Texas (Austin, Dallas,
San Antonio), the Southeast (raleigh, charlotte,
charleston, greenville), and parts of the interior West
(ogden, Denver) did as well or better in the rankings
than earlier in the decade.4
The list of metro areas experiencing the slowest
growth or population decline changed less dramati-
cally between these two periods. The fall of Detroit
reflects the impact of an accelerated decline in
the area’s important auto manufacturing industry.
upstate new york and ohio metro areas clearly felt
the impacts of industrial decline in both periods.
Size of circle is proportional to total population in 2009.
Source: Brookings analysis of U.S. Census Bureau Population Estimates Program data

ST
AT
e o
f M
eT
ro
po
liT
An
AM
er
icA
| P
OP
UL
AT
ION
& M
IGR
AT
ION
42
Reversal of Metropolitan Migration FortunesThe broad shift of American population from the
Snow belt toward the Sun belt was largely driven by
domestic migration. The sharp migration slowdown
toward the end of the 2000s began to turn this long-
standing dynamic on its head.
examining different regional groups of metro
areas puts this departure from the historical norm
in sharp relief (figure 3). florida, an epicenter of the
housing crash and ensuing foreclosure crisis, repre-
sents one side of the coin. orlando and Tampa each
added more than 50,000 residents from domestic
migration as recently as 2004–2005, but saw those
inflows plummet in recent years, turning negative
in orlando’s case by 2008–2009. cape coral also
Table 2. The Housing Market Collapse Shifted the Locus of U.S. Metropolitan GrowthHighest and Lowest Ranked Large Metro Areas by Population Growth, 2000 to 2006 and 2006 to 2009
2000 to 2006 2006 to 2009
Change to Change from
2006– Population 2000– Population
Rank 2009 Metro Area Change (%) Rank 2006 Metro Area Change (%)
Highest Growth Highest Growth
1 -1 provo, uT 29.3 1 99 new orleans, lA 20.5
2 -9 las Vegas, nV 27.6 2 -1 provo, uT 13.0
3 -45 cape coral, fl 27.5 3 1 raleigh-cary, nc 12.7
4 1 raleigh-cary, nc 24.2 4 4 Austin, Tx 11.5
5 -2 phoenix-Mesa-Scottsdale, AZ 23.4 5 7 charlotte, nc-Sc 10.2
6 -24 riverside-San bernardino-ontario, cA 21.1 6 5 McAllen, Tx 8.4
7 -6 boise city, iD 20.9 7 -2 phoenix-Mesa-Scottsdale, AZ 7.8
8 4 Austin, Tx 20.8 8 14 ogden, uT 7.6
9 -32 orlando, fl 20.7 9 7 Dallas-fort Worth-Arlington, Tx 7.5
10 -4 Atlanta, gA 19.6 10 14 San Antonio, Tx 7.2
lowest Growth/Decline lowest Growth/Decline
91 17 bridgeport-Stamford, cT -0.8 91 -32 Virginia beach-norfolk-newport news, VA-nc 0.1
92 2 Syracuse, ny -0.8 92 -2 Akron, oh 0.0
93 -5 Dayton, oh -0.9 93 -7 providence, ri-MA -0.2
94 6 rochester, ny -1.1 94 -12 Toledo, oh -0.2
95 -2 cleveland, oh -2.1 95 2 pittsburgh, pA -0.3
96 7 Scranton, pA -2.1 96 2 buffalo, ny -0.6
97 2 pittsburgh, pA -2.8 97 -2 cleveland, oh -0.7
98 2 buffalo, ny -3.2 98 -5 Dayton, oh -0.8
99 -1 youngstown, oh-pA -4.3 99 -10 Detroit-Warren, Mi -1.8
100 99 new orleans, lA -24.6 100 -1 youngstown, oh-pA -2.3
Source: Brookings analysis of U.S. Census Bureau Population Estimates data

ST
AT
e o
f M
eT
ro
po
liT
An
AM
er
icA
| P
OP
UL
AT
ION
& M
IGR
AT
ION
43
Figure 3. The Housing Market Crisis Disrupted Metropolitan Migration Across and Within RegionsNet Domestic Migration for Metro Areas by State/Region, 2000-2001 to 2008-2009
Source: Brookings analysis of U.S. Census Bureau Population Estimates data

ST
AT
e o
f M
eT
ro
po
liT
An
AM
er
icA
| P
OP
UL
AT
ION
& M
IGR
AT
ION
44
exhibited the migration gain to loss scenario. The
Miami metro area, which lost residents to migration
throughout the decade, suffered particularly steep
declines from 2006 to 2007.
large metro areas in Texas, including Dallas,
houston, and Austin, exhibit an entirely different pat-
tern. They experienced far greater net in-migration
in the latter years of the decade, at the same time
that the migration bubble popped in florida metro
areas.5 Those Texas areas did not experience the
same run-up in home prices and speculative mort-
gage lending seen throughout most of florida.6
coastal california metro areas display something
of a mirror-image migration pattern to their interior
West counterparts. The San francisco bay Area, San
Diego, and especially los Angeles saw increasing
out-migration through the middle part of the decade,
due in part to increasingly unaffordable home prices.
That trend moderated (along with home prices) over
the past few years, such that San francisco posted
small migration gains between 2007 and 2009. los
Angeles lost only about a third as many migrants in
2008–2009 as it did in 2005–2006. its net migra-
tion pattern roughly inverts that of the phoenix
metro area, the destination for many Angelenos in
the early to mid-2000s. las Vegas and riverside
also received many of their migrants from coastal
california during that earlier period but have since
seen those inflows turn to small outflows.
other areas of the country that experienced
significant migration outflows during the housing
bubble years also saw their trends turn less nega-
tive in the second half of the decade. The boston
and chicago metro areas shed increasing numbers
of migrants through the middle part of the decade,
but began to stanch the outflow by 2006. The
same held for the new york area; while net out-
migration reduced its population by fully 110,000 in
2008–2009, that was well below half the annual loss
it sustained in the middle of the decade.
pittsburgh posted its first net migration gain
in more than a decade, while rising outflows from
buffalo, cleveland, and providence moderated after
peaking mid-decade. The latter two metro areas have
among the weakest regional economies in the united
States today, however, and their migration fortunes
may slip once again as long-distance household
mobility begins to rise. yet for the present, their
migration patterns are mirror images of past years,
when they lost many residents to fast-growing areas
of the Sun belt.
Immigration as a Metropolitan Migration “Cushion”The recent downturn in domestic migration left a
slight imprint on international migration as well, with
the most recent inflows becoming noticeably less
than the average 1 million per year over the last 20
years. nonetheless, immigration remained an impor-
tant contributor to population gains in larger metro-
politan gateways throughout the 2000s, providing
a demographic “cushion” to bolster small gains or
losses from domestic migration.
Despite the continued spread of foreign-born
population across the nation, immigration remained
relatively concentrated in major gateway areas dur-
ing the 2000s. from 2000 to 2009, 21 percent of all
net immigrant gains occurred in the two largest met-
ropolitan magnets, new york and los Angeles (which
account for roughly 10 percent of u.S. population).
fully 46 percent of gains went to the eight largest
metro areas (Table 3).
Metropolitan new york and los Angeles each
withstood considerable domestic out-migration,
especially during the “bubble years” when many
of their residents were drawn to growing, more
Immigration
remained an
important
contributor to
population gains
in larger metro-
politan gateways
throughout
the 2000s.

ST
AT
e o
f M
eT
ro
po
liT
An
AM
er
icA
| P
OP
UL
AT
ION
& M
IGR
AT
ION
45
affordable destinations in the South and West.
During all of these years, international migration
gains served to counter domestic migration declines
in these areas. And as net domestic out-migration
fell rapidly from its mid-decade peak by 2007–2009,
immigration—while down from its own peak early in
the decade—held steady.
Similar patterns defined Miami, chicago,
Washington, D.c., and San francisco during this
period, though the latter two areas exhibited recent,
small domestic migration inflows to complement
their immigration gains. Dallas and houston showed
steadily declining, though positive and significant,
levels of migration from abroad. unlike those other
gateways, however, net domestic migration to these
metro areas remained mostly positive throughout,
and in recent years contributed more to these areas’
population gains than international migration.
Table 3. Immigration Cushioned Many of the Largest Metropolitan Gateway Populations from Domestic Out-Migration in the 2000s
International and Domestic Migration by Metropolitan Area and year, 2000-2001 to 2008-2009
2000-01 2001-02 2002-03 2003-04 2004-05 2005-06 2006-07 2007-08 2008-09 Total
New york international 159,787 147,104 125,082 110,156 113,065 114,870 103,640 100,643 100,669 1,075,016
Domestic -177,171 -207,348 -236,039 -247,541 -283,328 -288,260 -220,521 -150,259 -110,278 -1,920,745
Los Angeles international 116,487 108,487 93,158 83,517 87,057 86,426 78,155 75,265 75,062 803,614
Domestic -103,877 -109,081 -119,572 -140,643 -199,800 -243,722 -222,018 -118,909 -79,900 -1,337,522
Miami international 64,635 62,654 56,216 52,514 56,673 58,160 52,639 51,384 51,548 506,423
Domestic -3,576 -1,499 -20,179 -3,295 -10,086 -70,414 -93,453 -53,037 -29,321 -284,860
Chicago international 56,281 50,473 40,344 38,716 37,933 38,584 34,082 33,358 33,363 363,134
Domestic -55,024 -68,594 -72,392 -65,648 -77,413 -73,066 -52,317 -42,587 -40,389 -547,430
Dallas international 44,847 42,193 36,731 33,856 35,399 35,545 32,369 31,430 31,571 323,941
Domestic 48,668 13,847 -1,389 8,203 23,471 76,443 50,566 42,857 45,241 307,907
Washington, D.C. international 39,465 36,262 28,210 36,343 35,552 37,697 32,573 32,216 31,904 310,222
Domestic 15,978 1,377 -8,734 -14,785 -17,011 -51,414 -36,945 -17,430 18,189 -110,775
Houston international 40,294 37,990 33,099 30,221 31,686 31,707 28,779 27,876 27,996 289,648
Domestic 4,532 24,472 2,824 6,370 6,104 91,985 19,466 37,158 49,662 242,573
San Francisco international 36,691 34,296 29,622 26,852 27,983 27,867 25,264 24,367 24,376 257,318
Domestic -24,885 -78,931 -74,108 -64,631 -51,031 -44,753 -19,866 6,394 7,977 -343,834
Source: Brookings analysis of U.S. Census Bureau Population Estimates Program data

ST
AT
e o
f M
eT
ro
po
liT
An
AM
er
icA
| P
OP
UL
AT
ION
& M
IGR
AT
ION
46
CITy AND SUBURBAN TRENDSAs with the 1990s, the post-2000 period was largely
a good one for big city populations. Among the pri-
mary cities of the 100 large metros, 67 showed gains
from 2000 to 2008.7 As Table 4 shows, the fastest
growing primary cities tended to be located inside
some of the fastest growing metropolitan areas,
including many in the Southeast, Texas, interior
california and the intermountain West. likewise,
declining primary cities were located in metro areas
that experienced slow growth or decline, such as
youngstown, cleveland, buffalo, and pittsburgh.
These metro areas saw population losses in their
suburbs as well.
interestingly, the fastest growing suburbs in the
100 largest metro areas do not match up closely with
the fastest growing primary cities; eight of the 10 are
different. not on the list are the suburbs of the fast
Table 4. The Fastest Growing Cities in the 2000s Were in Different Metro Areas than the Fastest Growing SuburbsHighest and Lowest Ranked Primary Cities and Suburbs by Population Growth, 2000 to 2008
Primary Cities of Metro Area Suburbs of Metro Area
Population Change Population Change
Rank Metro Area 2000–2008 (%) Metro Area 2000–2008 (%)
Highest Growth Highest Growth
1 cape coral, fl 51.8 provo, uT 54.0
2 raleigh-cary, nc 34.7 phoenix-Mesa-Scottsdale, AZ 49.8
3 bakersfield, cA 31.0 Austin, Tx 48.7
4 Atlanta, gA 27.9 boise, iD 44.3
5 palm bay, fl 26.6 las Vegas, nV 43.9
6 McAllen, Tx 21.3 raleigh-cary, nc 35.9
7 charlotte, nc-Sc 20.6 colorado Springs, co 32.6
8 orlando, fl 19.3 charlotte, nc-Sc 31.7
9 Sacramento-roseville, cA 17.5 Tucson, AZ 30.9
10 Stockton, cA 17.4 Jacksonville, fl 29.7
lowest Growth/Decline lowest Growth/Decline
91 Syracuse, ny -5.5 rochester, ny 0.6
92 birmingham, Al -5.5 Syracuse, ny 0.4
93 rochester, ny -5.7 Detroit-Warren, Mi 0.1
94 Toledo, oh -6.4 Dayton, oh 0.0
95 Dayton, oh -7.0 cleveland, oh -1.0
96 pittsburgh, pA -7.1 new orleans, lA -1.2
97 buffalo, ny -7.3 Scranton, pA -1.4
98 cleveland, oh -9.0 pittsburgh, pA -2.6
99 youngstown, oh -10.8 buffalo, ny -2.7
100 new orleans, lA -35.5 youngstown, oh -5.3
Source: Brookings analysis of U.S. Census Bureau Population Estimates data

ST
AT
e o
f M
eT
ro
po
liT
An
AM
er
icA
| P
OP
UL
AT
ION
& M
IGR
AT
ION
47
Figure 4. A Burst Housing Bubble Provided a Population Lift to Cities and Slowed Growth in SuburbsPopulation Change by year, Selected Metro Areas, Primary Cities versus Suburbs, 2000-2001 to 2007-2008
Source: Brookings analysis of U.S. Census Bureau Population Estimates Program data

ST
AT
e o
f M
eT
ro
po
liT
An
AM
er
icA
| P
OP
UL
AT
ION
& M
IGR
AT
ION
48
growing cities of Atlanta and orlando. Suburbs that
grew considerably faster than their cities included
several in the interior West, such as provo, boise,
colorado Springs, and Tucson.
notably, the city population rebound that began
in the 1990s continued into the 2000s. figure 4
shows that growth of primary city populations of the
nation’s 100 metropolitan areas accelerated from
2006 to 2008, at the same time that suburban popu-
lation growth slowed. Some of this resurgence of
big cities is due to inherent strengths, such as broad
economic diversity at a time when smaller cities
and one-industry towns are vulnerable to economic
shocks. but much is attributable to a “windfall” of
residents attracted to and retained in cities, who
might—in the absence of the housing crisis and deep-
ening recession—have moved to the suburbs.
The effects of a burst housing bubble on big city
populations were evident nationwide. Among the
100 primary cities of large metropolitan areas, 73
grew faster in 2007–2008 than in 2004–2005. on
the pacific coast, San Diego, San Jose, oakland,
portland, and Seattle each exhibited its fastest
growth rate of the decade that year. growth rate
increases also appeared in large Midwestern primary
cities that are less steeped in manufacturing (par-
ticularly auto manufacturing), such as Minneapolis-St
paul. Some Southern cities that were less exposed to
the mortgage meltdown, such as raleigh, charlotte,
and Austin, showed high, though sometimes
Figure 5. Cities and Inner Suburbs Made Late-Decade Gains as Outer Suburban Growth SlowedAnnual Population Growth Rate by City/Suburban Type, 100 Largest Metro Areas, 2000-2001 to 2007-2008
Source: Brookings analysis of U.S. Census Bureau Population Estimates Program data

ST
AT
e o
f M
eT
ro
po
liT
An
AM
er
icA
| P
OP
UL
AT
ION
& M
IGR
AT
ION
49
decreasing, growth rates. Atlanta managed to con-
tinue its recent gains, even as foreclosures wracked
its outer suburbs. in this way, cities have benefited,
at least in the short term, from declines in American
mobility and the collapse of fast-developing subur-
ban housing markets.
in fact, both primary cities and inner, dense
suburbs achieved late decade growth upticks at the
expense of outer suburbs and exurbs (figure 5). The
latter areas rode the wave of strong housing bubble
related growth up through 2005–2006 only to come
crashing down in the subsequent two years.
LOOKING AHEADThe 2000s amounted to a tale of two epochs in met-
ropolitan population and migration trends. While the
first part of the decade resembled a continuation of
the 1990s shift from Snow belt to Sun belt, and rapid
growth of suburbia, the latter part upended those
trends. The dramatic impact of the housing boom
and bust, followed by a financial crisis and the deep-
est recession of the postwar era, have put the brakes
on migration in general, and on growth in many Sun
belt metro areas.
As a new decade dawns, questions about future
growth patterns across and within metropolitan
America abound. Will the downward growth trajecto-
ries of Sun belt metro areas continue? Will suburban
and exurban growth be permanently stunted? is the
recent growth “bounce” for northern and coastal
metropolitan areas and large primary cities simply a
short-term demographic windfall, or the beginning of
a longer-run transition to a new settlement pattern?
reliable answers to these questions await a
rebound in our economy and housing markets.
Meanwhile, the late decade lull in migration provides
While the first
part of the
decade resem-
bled a continua-
tion of the 1990s
shift from Snow
Belt to Sun Belt,
and rapid growth
of suburbia,
the latter part
upended those
trends.
an opportunity to re-think metropolitan growth
prospects in light of each area’s attributes and
assets, such as age, racial and ethnic composition,
educational attainment, and wage structure. As sub-
sequent chapters explore, metropolitan areas exhibit
great diversity on these and other dimensions, and
those differences may be growing more pronounced
over time. n
ENDNOTES1. Statistics canada; eurostat
2. William h. frey, “The great American Migration
Slowdown: regional and Metropolitan Dimensions”
(Washington: brookings institution, 2009).
3. William h. frey, “Metropolitan America in the new
century: Metropolitan and central city Demographic
Shifts Since 2000” (Washington: brookings institution,
2005).
4. new orleans’ number one ranking from 2006 to 2009
reflects the population rebound associated with the
return of residents displaced by hurricane katrina in
2005.
5. large gains in houston, and to a lesser extent Dallas,
in 2005–2006 reflect in part temporary gains from
louisianans displaced by the aftermath of hurricane
katrina.
6. Alan berube, howard Wial, and Alec friedhoff,
“MetroMonitor: Tracking recession and recovery in the
nation’s 100 largest Metropolitan Areas” (Washington:
brookings institution, 2009).
7. As of the publication date, the latest available popula-
tion data for cities from the census bureau’s population
estimates program were for the year ending July 2008
(versus July 2009 for counties and metro areas).

50
II. rAce & eThniciTy
WILLIAM H. FREy
B y T H E N U M B E R S
83%Non-white share of population growth,
United States, 2000 to 2008
2Rank of Atlanta among all
metro areas for black population, 2008
(surpassing Chicago)
17/31Metro areas (out of 100) with “majority minority”
total population / under-18 population, 2008
12Primary cities (out of 100)
with gains in share of population that is white,
2000 to 2008

ST
AT
e o
f M
eT
ro
po
liT
An
AM
er
icA
| R
AC
E &
ET
HN
ICIT
y51
OVERVIEW
n Racial and ethnic minorities accounted for 83 percent of U.S. population growth from 2000 to 2008.
The continued faster growth of hispanic, Asian, and black populations put the country as a whole on track
to reach “majority minority” status by 2042, and for children to reach that milestone by 2023. More than
three-quarters of racial and ethnic minorities today live in the nation’s 100 largest metro areas.
n A majority of Asians, and a near-majority of Hispanics, live in just 10 metropolitan areas. yet during
the 2000s a slow dispersal of these groups continued away from major immigrant gateway areas like los
Angeles, new york, and San francisco. fast-growing areas of the South like Dallas, houston, Atlanta, and
Washington, D.c. ranked among the largest gainers of Asian and hispanic population from 2000 to 2008.
n Metro areas in the Southeast and the Interior West, and a few in the Midwest, exhibited some of the
most rapid gains in Hispanic and Asian populations in the 2000s. During the latter part of the decade,
however, hispanic and Asian growth retrenched toward major gateways like los Angeles, chicago, and
Miami, as the housing market collapse and recession slowed the movement of these groups to places like
riverside, phoenix, and orlando.
n Blacks continue to move southward, as metro Atlanta surpassed metro Chicago for total black popu-
lation by 2008. Whites moved to many of these “new South” areas in large numbers as well during the
2000s, though their population shrank in large, coastal metro areas like los Angeles and new york that
continued to attract significant minority populations.
n For the first time, a majority of all racial/ethnic groups in large metro areas live in the suburbs. Deep
divides by race and ethnicity still separate cities and suburbs in metro areas like Detroit, but others like
los Angeles show much greater convergence between jurisdictions. in a handful of cities including Atlanta,
boston, and Washington, D.c., the share of population that is white increased during the 2000s.
NATIONAL TRENDSThe racial and ethnic profile of the united States
continued to evolve rapidly in the 2000s. its direc-
tion built on the trend of the 1990s, with non-white
minorities dominating national population growth.
This reflects the combined impact of continued
immigration, largely from latin America and Asia,
and higher fertility for minorities than for whites.
The latter factor has become increasingly important
as these groups gain a larger presence in u.S. soci-
ety; two-thirds of the decade’s hispanic population
growth was due to natural increase (more births than
deaths) rather than immigration.
Whites still account for a majority of u.S. popula-
tion at 66 percent (figure 1). however, this is down
from 76 percent in 1990. from 2000 to 2008, they
accounted for only 17 percent of national population
growth, and their total numbers increased by only
The racial and
ethnic profile
of the United
States continued
to evolve rapidly
in the 2000s. Its
direction built on
the trend of the
1990s, with non-
white minori-
ties dominating
national popula-
tion growth.

ST
AT
e o
f M
eT
ro
po
liT
An
AM
er
icA
| R
AC
E &
ET
HN
ICIT
y
52
2+ RacesAmerican IndianAsian
Hispanic
Black
White
2+ RacesAmerican IndianAsian
Hispanic
Black
White
2 percent. by contrast, the population of hispanics
during this period rose by 31 percent, Asians by 26
percent, and blacks by 8 percent. Additionally, people
of two or more races, while still a small share of total
u.S. population, represent a growing presence in u.S.
society.
With their increasing numbers and higher growth
rates, America’s racial and ethnic minority repre-
sentation is projected to increase substantially over
time. According to the census bureau’s most recent
estimates, the u.S. population will become minor-
ity white in the year 2042, at which time hispanics
would comprise 27 percent of the population, blacks
12 percent and Asians 7 percent.1 under this same
scenario, the nation’s under-18 population would
achieve the same status in 2023.
Despite these recent gains and long-term projec-
tions, the national growth of hispanics and Asians
especially tapered off toward the end of the decade,
due to the great recession and its impacts on immi-
gration. from 2000 to 2006, hispanic population
rose at an annual rate of 3.9 percent, which fell to
2.9 percent over the next two years. The drop-off in
the Asian growth rate was even more dramatic, from
4.3 percent in the 2000 –2006 period to 1.1 percent
thereafter.
Minority populations in the united States concen-
trate even more heavily in large metropolitan areas
than the overall population. in 2008, the 100 largest
metro areas contained 66 percent of total u.S. popu-
lation, but 77 percent of non-whites and hispanics.
This included 74 percent of blacks, 80 percent of
hispanics, and 88 percent of Asians.2 As described
below, a number of these large metro areas are
on the cutting edge of the nation’s transition to a
“majority minority” society.
METROPOLITAN TRENDS
Dispersal Amid Concentration of Hispanics and AsiansThe historical clustering of America’s immigrant
minorities resulted from the initial settlement of
these groups into a handful of “gateway” metro-
politan areas. friendship and family networks have
drawn them to these traditional ports of entry,
Figure 1. Non-Whites Accounted for the Bulk of U.S. Population Growth in the 2000s
Share of 2008 U.S. Population by Race/Ethnicity
Source: Brookings analysis of U.S. Census Bureau Population Estimates Program data
Share of 2000-2008 Population Change by Race/Ethnicity

ST
AT
e o
f M
eT
ro
po
liT
An
AM
er
icA
| R
AC
E &
ET
HN
ICIT
y53
even during times when labor market conditions
would suggest they move elsewhere. The past two
decades reflect a growing but incomplete dispersal
of hispanics and Asians from these gateways to the
country as a whole.3
As recently as the 1990 census, taken 25 years
after the 1965 immigration Act liberalized the entry
of more hispanics from latin America, the group
remained relatively geographically concentrated. At
that time, the 10 metropolitan areas with the largest
hispanic populations housed fully 55 percent of all
of u.S. hispanics, with the top two—los Angeles and
new york—accounting for nearly three in 10 nation-
wide. Since 1990, only phoenix—where the hispanic
population mushroomed—newly joined the top 10,
taking over the eighth spot from San francisco. Still,
Table 1. Hispanics and Asians Continued a Gradual Shift Away from Large Gateways in the 2000sLarge Metro Areas Ranked by Hispanic and Asian Population, 2008, and Change, 2000 to 2008
2008 Population 2000 to 2008 Growth
Hispanics
Change
from Population
Rank 1990 Metro Area Population Rank Metro Area Change
1 0 los Angeles-long beach-Santa Ana, cA 5,719,249 1 riverside–San bernardino–ontario, cA 635,298
2 0 new york-newark, ny-nJ-pA 4,111,527 2 Dallas-fort Worth-Arlington, Tx 596,917
3 0 Miami-fort lauderdale-pompano beach, fl 2,142,735 3 houston, Tx 574,059
4 1 houston, Tx 1,945,238 4 los Angeles-long beach-Santa Ana, cA 567,599
5 -1 chicago-naperville-Joliet, il-in-Wi 1,903,748 5 new york-newark, ny-nJ-pA 515,298
6 0 riverside-San bernardino-ontario, cA 1,879,350 6 phoenix-Mesa-Scottsdale, AZ 492,187
7 1 Dallas-fort Worth-Arlington, Tx 1,731,274 7 Miami-fort lauderdale-pompano beach, fl 421,573
8 4 phoenix-Mesa-Scottsdale, AZ 1,321,713 8 chicago-naperville-Joliet, il-in-Wi 395,647
9 -2 San Antonio, Tx 1,080,482 9 Atlanta, gA 245,299
10 0 San Diego, cA 926,926 10 Washington-Arlington-Alexandria, Dc-VA-MD-WV 225,638
Asians
1 0 los Angeles-long beach-Santa Ana, cA 1,782,387 1 new york-newark, ny-nJ-pA 355,698
2 0 new york-newark, ny-nJ-pA 1,777,325 2 los Angeles-long beach-Santa Ana, cA 205,292
3 0 San francisco-oakland-fremont, cA 960,769 3 San francisco-oakland-fremont, cA 130,925
4 1 San Jose-Sunnyvale-Santa clara, cA 550,527 4 Washington-Arlington-Alexandria, Dc-VA-MD-WV 119,481
5 1 chicago-naperville-Joliet, il-in-Wi 504,597 5 San Jose-Sunnyvale-Santa clara, cA 108,892
6 -2 honolulu, hi 471,090 6 chicago-naperville-Joliet, il-in-Wi 105,979
7 0 Washington-Arlington-Alexandria, Dc-VA-MD-WV 460,337 7 Dallas-fort Worth-Arlington, Tx 96,405
8 1 Seattle-Tacoma-bellevue, WA 368,449 8 houston, Tx 90,308
9 1 houston, Tx 326,301 9 Seattle-Tacoma-bellevue, WA 87,905
10 -2 San Diego, cA 311,343 10 riverside–San bernardino–ontario, cA 86,436
Source: Brookings analysis of U.S. Census Bureau Population Estimates data

ST
AT
e o
f M
eT
ro
po
liT
An
AM
er
icA
| R
AC
E &
ET
HN
ICIT
y
54
the pecking order of the top three has not budged in
the past two decades.
nonetheless, the largest hispanic settlement
areas are showing signs of losing their grip. The top
ten metro areas in 2008 housed nearly half (48 per-
cent) of all hispanics, but garnered only 40 percent
of the nation’s hispanic growth from 2000 to 2008.
The metropolitan areas gaining the most hispanics
during that period (Table 1, right panel) include two
outside the top 10. Washington, D.c.’s and Atlanta’s
strong employment opportunities during most of the
decade helped attract new hispanic immigrants and
longer-term residents from other parts of the united
States. riverside ranked first in total hispanic gains
from 2000 to 2008, owing in part to its attraction of
hispanics from nearby los Angeles. The Texas metro
areas of Dallas and houston follow riverside in regis-
tering the largest hispanic gains.
A shift away from southern california, toward
florida, also underlies these patterns. During the
1990s, los Angeles and new york led all metro
areas in both numbers of hispanics and total
hispanic population gains. but from 2000 to 2008,
los Angeles gained less than half as many hispanics
as it did during the 1990s (567,000 vs. 1.2 million).
Meanwhile, Tampa, orlando, and Jacksonville each
gained more hispanics in the first eight years of his
decade than they did throughout the 1990s. This
shift may have been temporary, however, given sharp
downturns in the housing market in some of these
newer destinations.
Asians concentrate even more heavily in tradi-
tional immigrant magnet areas than hispanics. The
same 10 metro areas that housed the most Asians
in 1990 remain on the list for 2008 (Table 1 bot-
tom left). Still, dispersal occurred, with the share of
total u.S. Asian population those areas represent
slipping from 61 percent in 1990 to 55 percent in
2008. The top three areas—los Angeles, new york,
and San francisco—still house one-third of all Asians
nationwide.
As with hispanics, the largest gateways have
garnered a lower share of recent Asian gains. They
drew less than half (44 percent) of Asian population
gains from 2000 to 2008, compared with 53 percent
in the 1990s. Dallas and riverside, two metro areas
not among those with the most Asians, ranked 7th
and 10th, respectively, among those gaining the most
Asians this past decade (Table 1, bottom right). The
jump in riverside’s rank, from 18th biggest gainer
during the 1990s to 10th from 2000 to 2008, reflects
a spillover effect from los Angeles also evident for
hispanics. A similar pattern in northern california
vaulted Stockton from 43rd on Asian gains in the
1990s to 26th from 2000 to 2008.
Hispanic and Asian Growth Centers of the 2000sThe metro areas experiencing the highest recent
growth rates for hispanics and Asians diverge from
those above that registered the highest numeric
gains. They provide a measure of where the newest
gains are taking place, often in places undergoing
significant in-migration.
The Southeast, especially florida, dominates
the list for fastest hispanic growth in the 2000s
(Table 2). cape coral rose in rank from number 11
in the 1990s to number one from 2000 to 2008,
and lakeland moved up 7 notches to number five.
The Midwestern metro areas of indianapolis and
columbus make the top 10 as well.
A large number of metropolitan areas crossed
significant thresholds for hispanic population—either
5 percent or 10 percent—over the past two decades
(Map 1). These metro areas began to spread to the
Southeast, intermountain West, and across new
The past two
decades reflect
a growing but
incomplete
dispersal of
Hispanics and
Asians from
major gateways
to the country as
a whole.

ST
AT
e o
f M
eT
ro
po
liT
An
AM
er
icA
| R
AC
E &
ET
HN
ICIT
y55
Table 2. Metro Areas in the Southeast and Interior West Had Fast-Growing Hispanic and Asian Populations in the 2000s
Highest Ranked Large Metro Areas by Hispanic and Asian Population Growth Rate, 2000 to 2008
Hispanics Asians
Change Change
from Population from Population
Rank 1990s Metro Area Change (%) Rank 1990s Metro Area Change (%)
1 10 cape coral, fl 142.1 1 0 las Vegas, nV 76.2
2 -1 charlotte, nc-Sc 117.6 2 4 phoenix-Mesa-Scottsdale, AZ 70.2
3 -1 raleigh-cary, nc 113.7 3 25 riverside-San bernardino-ontario, cA 58.8
4 0 nashville, Tn 105.7 4 -2 Atlanta, gA 58.0
5 7 lakeland, fl 102.3 5 -2 orlando, fl 57.4
6 0 indianapolis, in 99.5 6 1 indianapolis, in 55.7
7 2 provo, uT 94.1 7 -2 Tampa-St. petersburg-clearwater, fl 53.7
8 -3 Atlanta, gA 89.2 8 16 San Antonio, Tx 48.3
9 8 columbus, oh 86.0 9 3 columbus, oh 47.6
10 -7 greensboro-high point, nc 80.5 10 -6 Dallas-fort Worth-Arlington, Tx 47.2
Source: Brookings analysis of U.S. Census Bureau Population Estimates data
Map 1. Hispanics Represent a Significant Share of Population in an Increasing Number of Metro AreasPeriod in which Hispanic Population Share Crossed 5% / 10% Threshold, Large Metro Areas
Source: Brookings analysis of U.S. Census Bureau Population Estimates Program data

ST
AT
e o
f M
eT
ro
po
liT
An
AM
er
icA
| R
AC
E &
ET
HN
ICIT
y
56
england and eastern pennsylvania. in this respect,
new hispanic destinations coincide with recent
growth centers for overall u.S. population, such as
Atlanta, orlando, provo, and charlotte.
for the Asian population, further moves into the
interior West characterized growth patterns in the
2000s. las Vegas ranked first among large metro
areas for Asian growth rate from 2000 to 2008,
just as it did during the 1990s. Moving up notice-
ably to the second and third spots were phoenix and
riverside, the latter vaulting from 28th place in the
1990s. Several metropolitan areas in florida and
other parts of the South make the list as well, includ-
ing Atlanta, orlando, Tampa, San Antonio, and Dallas.
As with hispanics, indianapolis and columbus make
the list of fastest Asian gainers; their Midwestern
neighbors cincinnati and St louis climbed to 11th and
15th as well (not shown). because Asians comprise
a much smaller share of the u.S. population (4.5
percent) than hispanics (15.4 percent), there are
far fewer places with significant Asian populations.
nonetheless, there are signs of continued “spreading
out,” as Asians comprised at least 5 percent of popu-
lation in 22 of the nation’s 100 largest metro areas,
up from nine in 1990.
Late-Decade Hispanic RetrenchmentJust as the housing market collapse and ensuing
recession severely curtailed overall growth in many
of the nation’s real-estate driven migration magnets,
it also impacted dispersal among racial and ethnic
minorities. This was especially true for hispanics,
as labor market opportunities in fast-growing metro
areas in fields like construction and retail diminished
rapidly with the bursting of the housing bubble.
The “retrenchment” of hispanics toward tradi-
tional gateway areas is most vivid within california.
hispanic gains in metropolitan los Angeles qua-
drupled in 2007-2008 compared with just two years
earlier, at the same time that they halved in metro-
politan riverside. other traditional hispanic areas,
including chicago, new york, Miami, San francisco,
and San Diego, saw increased gains in 2007-2008,
at the same time that hispanic growth declined sig-
nificantly in places like phoenix, las Vegas, orlando,
and Atlanta. About half of the nation’s 100 largest
metro areas showed hispanic growth slowdowns that
year, mostly represented by non-traditional hispanic
areas. Jacksonville, provo, and las Vegas, compared
against los Angeles, demonstrate this trend (figure
2). until employment opportunities reappear in these
areas in significant number, the widespread spatial
assimilation of hispanics in some new destinations
may be on hold.
Figure 2. Hispanic Growth Retrenched Toward Traditional Gateway Areas After the Housing Crash
Change in Hispanic Population by year, Selected Metro Areas, 2000-2001 to 2007-2008
Source: Brookings analysis of U.S. Census Bureau Population Estimates Program data
0%
2%
4%
6%
8%
10%
12%
14%Los Angeles-Long Beach-Santa Ana, CA
Las Vegas, NV
Provo, UT
Jacksonville, FL
2007-20082006-20072005-20062004-20052003-20042002-20032001-20022000-2001

ST
AT
e o
f M
eT
ro
po
liT
An
AM
er
icA
| R
AC
E &
ET
HN
ICIT
y57
Continued Southward Shift of BlacksThe historic pattern of black settlement in the united
States can be measured more in centuries than in
decades. The most prominent shifts occurred during
much of the 20th century, with the “great Migration”
out of the South, first to cities in the northeast
and Midwest, and then to the West. Still, through
the 1960s, the South housed more than half of the
nation’s black population. in the early 1970s, African
Americans began to follow white population into the
South. Since then, and especially during the 1990s,
black movement to the South has become substan-
tial.4 it has occurred less in historic “old South”
states such as louisiana, Mississippi, and Alabama,
and more in “new South” growth centers such as
Texas, north carolina, georgia, and florida.
This trend expanded in the 2000s. The region’s
share of total u.S. black population continued to rise
from 54 percent in 1990 to 57 percent in 2008. The
South accounted for fully 75 percent of the nation’s
black population gains from 2000 to 2008, up from
65 percent in the 1990s. northern destinations for
blacks during the great Migration still figure promi-
nently among the metropolitan areas with the larg-
est black populations in 2008, as do several areas
in the South (Table 3, left panel). The biggest shift
occurred in metropolitan Atlanta, which rose rapidly
from seventh in 1990 to fourth in 2000, and in the
2000s surpassed chicago to house the second-larg-
est African American population in the united States.
in the process it more than doubled its black popula-
tion, overtaking the metropolitan area whose city
Martin luther king, Jr. once called the “birmingham
of the north.”
Atlanta also far surpassed other metropolitan
areas in its black population gain during the 2000s
(Table 3, right panel). its large middle-class black
population, along with its diversified and growing
Table 3. Black Population Continued to Head Southward in the 2000sLarge Metro Areas Ranked by Black Population, 2008, and Growth, 2000 to 2008
2008 Population 2000 to 2008 Growth
Population
2008 2000 1990 Metro Area Population Rank Metro Area Change
1 1 1 new york-newark, ny-nJ-pA 3,162,284 1 Atlanta, gA 445,578
2 4 7 Atlanta, gA 1,669,518 2 Dallas-fort Worth-Arlington, Tx 159,494
3 2 2 chicago-naperville-Joliet, il-in-Wi 1,667,376 3 houston, Tx 151,362
4 3 3 Washington-Arlington-Alexandria, Dc-VA-MD-WV 1,370,929 4 Washington-Arlington-Alexandria, Dc-VA-MD-WV 97,874
5 5 4 philadelphia, pA-nJ-De-MD 1,169,265 5 Miami-fort lauderdale-pompano beach, fl 95,876
6 8 8 Miami-fort lauderdale-pompano beach, fl 1,042,874 6 charlotte, nc-Sc 94,171
7 6 6 Detroit-Warren, Mi 1,008,171 7 orlando, fl 71,698
8 9 9 houston, Tx 942,101 8 phoenix-Mesa-Scottsdale, AZ 62,884
9 7 5 los Angeles-long beach-Santa Ana, cA 898,695 9 baltimore, MD 60,351
10 10 11 Dallas-fort Worth-Arlington, Tx 874,216 10 Tampa-St. petersburg -clearwater, fl 59,997
Source: Brookings analysis of U.S. Census Bureau Population Estimates data

ST
AT
e o
f M
eT
ro
po
liT
An
AM
er
icA
| R
AC
E &
ET
HN
ICIT
y
58
economy, provided a continued draw for African
Americans from across the country. nine of the
top 10 metro areas for black population gains from
2000 to 2008 are located in the South, including the
three “new South” areas of charlotte, orlando, and
Tampa. These regions are attracting more highly-
educated blacks, including those from northern
destinations. Washington, D.c., Atlanta, and Dallas
rank sixth, ninth, and 25th, respectively, on the share
of black adults with a bachelor’s degree, whereas
philadelphia and Detroit rank, respectively, 59th
and 79th.
White Gains and Lossescompared to hispanic, Asian, and black population,
white population distributes much more evenly
across the country. With lower fertility and minimal
growth through immigration, whites’ movement
among metropolitan areas effectively amounts to a
zero-sum game, reflecting domestic in- and out-
migration to a greater degree than for minorities.
consequently, metropolitan areas among the
nation’s 100 largest exhibited both significant gains
and losses of white population during the 2000s.
Those with the largest gains included metropoli-
tan areas in the South and West, such as phoenix,
Atlanta, Dallas, charlotte, and raleigh (Table 4, left
panel). While many of these areas also experienced
fast growth of hispanics and Asians in the 2000s
(Table 2), they contrast with traditional immigrant
magnets such as los Angeles, new york, and
chicago, where gains of those groups were greatest
over the decade (Table 1).
indeed, the list of metropolitan areas sustain-
ing the greatest white population losses over the
2000–2008 period contains many of these tradi-
tional immigrant magnets (Table 4, right panel). out-
migration in response to the high cost of housing
Table 4. White Population Losses in Coastal and Midwestern Metro Areas Counterbalanced Gains in the South and West
Large Metro Areas Ranked by White Population Gains and Losses, 2000 to 2008
Gains losses
Population Population
Rank Metro Area Change Rank Metro Area Change
1 phoenix-Mesa-Scottsdale, AZ 353,665 1 los Angeles-long beach-Santa Ana, cA -662,170
2 Atlanta, gA 285,981 2 new york-newark, ny-nJ-pA -490,380
3 Dallas-fort Worth-Arlington, Tx 214,150 3 San francisco-oakland-fremont, cA -106,025
4 Austin, Tx 164,567 4 San Jose-Sunnyvale-Santa clara, cA -106,017
5 charlotte, nc-Sc 157,566 5 philadelphia, pA-nJ-De-MD -100,147
6 raleigh–cary, nc 149,081 6 pittsburgh, pA -84,597
7 houston, Tx 145,071 7 San Diego, cA -72,769
8 portland-Vancouver, or-WA 133,127 8 riverside-San bernardino–ontario, cA -72,530
9 nashville, Tn 130,293 9 honolulu, hi -70,912
10 provo, uT 125,091 10 buffalo, ny -60,620
Source: Brookings analysis of U.S. Census Bureau Population Estimates data

ST
AT
e o
f M
eT
ro
po
liT
An
AM
er
icA
| R
AC
E &
ET
HN
ICIT
y59
through most of the decade in those expensive
coastal metro areas contributed to their losses.
in areas like pittsburgh, buffalo, cleveland, and
hartford that also lost significant white population,
economic stagnation and aging of the population
were more important factors. overall, more than
one-third (35) of the 100 largest metro areas lost
white population during this time.
Majority-Minority Metro AreasAs described above, America is on its way to becom-
ing a much more racially and ethnically diverse coun-
try, with whites expected to account for less than
half the population by 2042. but the historic cluster-
ing of immigrant and African American settlement,
and the continued growth of these populations, has
led numerous areas to become “majority minority”
already (figure 3). This is now the case for 17 metro
areas, up from 14 in 2000 and just five in 1990. The
Texas border metro areas of McAllen and el paso,
where more than four-fifths of the population is
hispanic, lead the list. Among metro areas with at
least 1 million people, los Angeles has the smallest
white population share at 33 percent. eight of the
17 are located in california, and another four are in
Texas. The new york metro area, which clocked in
at 50.7 percent white in 2008, will soon cross this
threshold as well, perhaps by this year’s decennial
census.
because the younger part of the population is
even more racially and ethnically diverse than adults
(see the Age chapter), fully 31 metro areas already
possess “majority minority” child populations (Map
2). They include all of the regions in figure 3, as well
Figure 3. Seventeen Large Metro Areas Have Majority-Minority PopulationsShare of Population by Race/Ethnicity, 2008
Source: Brookings analysis of U.S. Census Bureau Population Estimates Program dataNote: Metro area names are shortened
0% 20% 40% 60% 80% 100%
Other**Asian**HispanicBlack**White**
McAllen, TX
El Paso, TX
Honolulu, HI
Los Angeles, CA
Fresno, CA
San Antonio, TX
Miami, FL
San Jose, CA
Stockton, CA
Riverside, CA
Bakersfield, CA
Houston, TX
Albuquerque, NM
San Francisco, CA
Memphis, TN-MS-AR
Modesto, CA
Jackson, MS
America is on its
way to becom-
ing a much more
racially and eth-
nically diverse
country, with
whites expected
to account for
less than half
the population
by 2042.

ST
AT
e o
f M
eT
ro
po
liT
An
AM
er
icA
| R
AC
E &
ET
HN
ICIT
y
60
0
10
20
30
40
50
60
70
8020082000
BlacksHispanicsAsiansWhites
as many that have more of a “white” image overall
but a minority-dominated child population beneath
the surface, such as phoenix, las Vegas, Washington,
D.c., orlando, Atlanta, and chicago.
CITy AND SUBURBAN TRENDSfor much of the post-World War ii period, “white
flight” to the suburbs and concentrations of blacks
and immigrants in urban areas combined to create a
common perception of cities as having large minor-
ity presences, surrounded by largely white suburbs.
These patterns changed gradually as a consequence
of civil rights-era anti-discrimination legislation, the
rise of hispanic and Asian populations in suburbs,
Map 2. In 31 Large Metro Areas, A Majority of Children Are From Racial/Ethnic Minority GroupsLarge Metro Areas with Majority-Minority Child (Under 18) Populations, 2008
Figure 4. A Majority of All Racial/Ethnic Groups in Major Metro Areas Live in the Suburbs
Share of Population in Suburbs by Race/Ethnicity, Large Metro Areas, 2000 and 2008
Includes 93 of 100 metro areas for which data are availableSource: Brookings analysis of Census 2000 and 2008 American Community Survey data
Source: Brookings analysis of U.S. Census Bureau Population Estimates Program data

ST
AT
e o
f M
eT
ro
po
liT
An
AM
er
icA
| R
AC
E &
ET
HN
ICIT
y61
0
20
40
60
80
100
OtherAsianHispanicBlackWhite
SuburbsCitiesSuburbsCitiesSuburbsCitiesSuburbsCitiesSuburbsCities
and less segregated development patterns in newer
metropolitan areas.
While whites reside in the suburbs in larger num-
bers and shares than any minority group, the first
decade of the new century brought the united States
to a new benchmark. for the first time, more than
half of all racial and ethnic groups residing in large
metro areas live in the suburbs (figure 4). This was
the case already for Asians and hispanics in 2000,
and blacks crossed this threshold during the decade.
in 2000, 43 percent of blacks in major metro areas
lived in the suburbs, but that share increased rapidly
to more than 50 percent by 2008.
notably, this transformation occurred as the
total number of blacks living in suburbs rose from
2000 to 2008, but dropped in cities by a small
amount, and by a larger margin than for whites. new
orleans alone accounted for a significant part of this
difference; the aftermath of hurricane katrina con-
tributed to a significant reduction in the city’s black
population, and a less-severe decline in its white
population.5
because whites are far more likely to be subur-
ban residents than minorities, the racial and ethnic
composition of suburbs still tilts rather heavily
toward whites, though this too varies across metro-
politan areas. About two-thirds of all suburbanites
are white, compared to 43 percent in primary cities
(figure 5). At one extreme are slow-growing, black/
white metro areas like Detroit with a longstanding
pattern of racial and ethnic segregation. Today, more
than four-fifths of residents in Detroit’s suburbs are
white, compared to less than one-fifth of the city’s
population. At the other extreme is los Angeles,
whose prototypical “melting pot suburbs” are almost
as diverse as its city population. in between are fast
Figure 5. Metro Areas Vary Considerably in the Location of their Racial/Ethnic PopulationsShare of Population by Race/Ethnicity and Metropolitan Location, Selcted Metro Areas, 2008
*Includes 93 of 100 metro areas for which data are availableSource: Brookings analysis of Census 2000 and 2008 American Community Survey data
For the first time,
more than half
of all racial and
ethnic groups
residing in large
metro areas live
in the suburbs.

ST
AT
e o
f M
eT
ro
po
liT
An
AM
er
icA
| R
AC
E &
ET
HN
ICIT
y
62
growing destinations like Atlanta, whose suburbs are
still “whiter” than its city, but whose black popula-
tion has also increasingly suburbanized with declines
in segregation and growth of the black middle class.
in fact, Atlanta and a few other cities experienced
a somewhat new phenomenon in the 2000s—a gain
in the share of population that is white. in Atlanta,
whites increased from 32 percent of population in
2000 to 36 percent in 2008. Similar, though smaller,
increases occurred in new york, Washington D.c.,
San francisco, boston, and primary cities in another
seven of the nation’s 100 largest metro areas. What
some have termed a “demographic inversion” in
metro areas, with whites repopulating cities and
minorities moving out to the suburbs, is not yet a
widespread phenomenon, but bears watching in the
years and decades ahead as metro areas grow even
more diverse.6
Still, there are notable gradations within suburbia.
At the national level, exurbs and emerging outer
suburbs are predominantly white; mature suburbs
reflect more of the national race-ethnic profile;
and inner high-density suburbs are highly diverse
(figure 6).
LOOKING AHEADbeginning with the 1990s, and continuing into the
2000s, there has been a noticeable blurring of the
regional and city-suburban racial and ethnic divide.
At the regional level, much of this blurring owes to
the widespread dispersal of hispanics, both native-
and foreign-born, to new parts of the country where
employment opportunities lured them away from
traditional settlement areas. To a lesser extent,
Asians have also moved to many of the same areas.
And while blacks have dispersed to some degree,
Figure 6. Racial/Ethnic Diversity Decreases Father Away from the Urban Core in Metro AreasShare of Population by Race/Ethnicity and Metropolitan Community Type, 2008
Source: Brookings analysis of 2008 American Community Survey data
0
10
20
30
40
50
60
70
80
90
100
OtherAsianHispanicBlackWhite
ExurbsEmerging SuburbsMature SuburbsHigh Density SuburbsPrimary Cities

ST
AT
e o
f M
eT
ro
po
liT
An
AM
er
icA
| R
AC
E &
ET
HN
ICIT
y63
their major shift has been to the South, in a reversal
of the great Migration at the beginning of the 20th
century. Despite these dispersals, minorities still
concentrate unevenly across metropolitan America.
notwithstanding the growth of more majority-
minority metro areas, more than half of the 100 larg-
est are over 70 percent white, and whites comprise
more than 80 percent of population in more than
a quarter.
As the growth rates of hispanic and Asian popula-
tions continue to dwarf those of the nation’s aging
white population, more metropolitan areas will
undoubtedly show a reduced presence of whites,
suggested by the large and growing number of metro
areas with majority-minority child populations. yet
a truly nationwide integration of racial and ethnic
minorities still seems a long way off. The latter part
of the decade indicates that further dispersal of
hispanics into new destinations over the short run
may await significant improvement in underlying
labor market conditions. over the longer run, the
growth of second- and third-generation minority
groups that are more assimilated into the “main-
stream” labor market suggests that their movements
will increasingly mirror those of the overall popula-
tion. Still, the emerging “cultural generation gap”
between a largely minority, multiethnic child and
young adult population, and a primarily white elderly
and older baby boomer population, suggests that a
more gradual assimilation may take place.
finally, within metropolitan areas, the 2000s
indicate that the nation is well on its way toward
achieving greater city-suburban racial and ethnic
integration. This, too, is an uneven phenomenon
regionally, and the demographic similarities between
cities and suburbs in faster-growing metro areas of
the South and West exceed those in slower-growing
parts of the northeast and Midwest. Still, 20th-
century notions of who lives in cities and suburbs are
increasingly out of step with 21st century realities.
Tracking the further movement of these groups into
suburbia, and examining the underlying forces and
resulting outcomes, will be a clear priority for both
the public and private sectors for the foreseeable
future. n
ENDNOTES1. Among other assumptions, the census bureau’s projec-
tions assume immigration rises from about 1.3 million
people a year to 2 million a year over time.
2. regarding the American indian/Alaskan native popula-
tion, the 100 largest metro areas house 39 percent of
the nation’s 2.3 million members of this group. The
phoenix metro area leads all others as home to about
80,000, followed by Tulsa, Albuquerque, and oklahoma
city, each with more than 40,000. five other large
metro areas—new york, Seattle, los Angeles, Dallas and
Tucson—house more than 25,000. Tulsa leads all large
metros in the share of its residents who are American
indians/Alaska natives at 7 percent, followed by
Albuquerque at 5 percent and oklahoma city at under
4 percent.
3. William h. frey, “Diversity Spreads out: Metropolitan
Shifts in hispanic, Asian, and black populations Since
2000” (Washington: brookings institution, 2006).
4. William h. frey, “The new great Migration: black
Americans’ return to the South, 1965–2000”
(Washington: brookings institution, 2004).
5. William h. frey, Audrey Singer, and David park,
“resettling new orleans: The first full picture from the
census” (Washington: brookings institution, 2007).
6. Alan ehrenhalt, “Trading places: The Demographic
inversion of the American city.” The New Republic,
August 13, 2008.
Over the longer
run, the growth
of second- and
third-generation
minority groups
that are more
assimilated
into the “main-
stream” labor
market sug-
gests that their
movements will
increasingly
mirror those
of the overall
population.

64
III. iMMigrATion
B y T H E N U M B E R S
16%Share of population that is foreign born, 100 largest
metro areas, 2008
1.13Ratio of immigrants with college degrees to those
without high school diplomas, New york metro
area, 2008
60%Share of children with at least one immigrant
parent, Los Angeles metro area, 2008
63Metro areas (out of 95)
in which majority of foreign born live in
suburbs, 2008
AUDREy SINGER

ST
AT
e o
f M
eT
ro
po
liT
An
AM
er
icA
| I
MM
IGR
AT
ION
65
OVERVIEW
n About one in eight Americans in 2008 was an immigrant. This represented a dramatic rise from 1970,
when fewer than one in 20 Americans was foreign born, and reflects a tectonic shift in sources of u.S. immi-
gration away from europe and toward latin American and Asia in the late 20th century.
n Metropolitan areas in the Southeast gained immigrants at a faster rate than most other regions during
the 2000s. Many metro areas in the great plains, Texas, inland california and the Mountain West also had
above average growth. immigrant growth across all metropolitan areas was strong but down from the break-
neck pace of the 1990s, and appeared to subside further with the onset of the recession in 2008.
n High and low-skilled immigrants distribute unevenly across U.S. metro areas. immigrants with the
lowest levels of english language ability and educational attainment cluster in Texas, inland california, and
Sun belt markets that experienced fast growth during the decade’s housing boom. More highly-educated
immigrants populate former gateways like pittsburgh and baltimore, and high-tech economies like the San
francisco bay Area. Major metro areas in the Southeast, as well as established gateways like chicago and
new york, draw a mix of immigrants by skill level.
n The “second generation” represents a large share of the child population in several established met-
ropolitan gateways. in the los Angeles, Miami, and San francisco metro areas, more than half of children
have at least one foreign born parent or are themselves foreign born. The new york area has 1.8 million such
children, 44 percent of all children metro-wide.
n More than half of the foreign born live in large metropolitan suburbs, up from 44 percent in 1980. in
metropolitan areas with a more recent immigration history, such as Atlanta, las Vegas, and Washington,
D.c., immigrants account for a similar or higher share of suburban than city population. More than one in
three immigrants in large metro areas lives in the high-density suburbs that surround cities, and nearly one
in five lives in mature, mid-20th century suburbs.
NATIONAL TRENDShigh levels of immigration in the 2000s increased
the foreign-born population from 31 million to 38
million as of 2008. Despite that increase, the pace
of growth in this decade was slower than the rapid
immigrant population growth of the 1990s. The
steep downturn in the economy that began in late
2007 has had an impact on migration worldwide,
and immigration to the united States appeared to
have slowed by 2008. While some of these changes
in flows may be momentary, other changes signal
longer-term trends.
This chapter highlights immigrant settlement
trends, particularly in new destination areas and
suburbs. it also explores social, economic, and migra-
tion characteristics of the foreign born at various
The steep
downturn in the
economy that
began in late
2007 has had an
impact on migra-
tion worldwide,
and immigration
to the United
States appeared
to have slowed
by 2008.

ST
AT
e o
f M
eT
ro
po
liT
An
AM
er
icA
| I
MM
IGR
AT
ION
66
geographic levels. examining immigration trends in
metropolitan areas, and their cities and suburbs, is
helpful for understanding how places will weather
the current economic downturn, and how immigrants
may respond to changing labor demands once recov-
ery is underway.
As of 2008, 38 million immigrants lived in the
united States, or 12.5 percent of the population, a
rising share but still lower than in the early part of
the 20th century (figure 1). immigrant settlement
trends during the early part of the century largely
followed economic activity in cities and suburbs.
industrial and commercial growth in the northeast
and Midwest drew population, including immigrants,
in large numbers, until the great Depression stalled
immigration.
The middle of the twentieth century saw immigra-
tion to the united States wane as the supply of labor
from europe dwindled during that region’s rapid
recovery after World War ii. The nadir in absolute
terms coincided with the baby boom, yielding a
national population that was less than 5 percent for-
eign born in 1970. This period also marked the rapid
growth of the metropolitan Sun belt, when many
Americans were lured to warmer year-round climates
and open space, spreading from the Southwest
to the Southeast. by the end of the century and
continuing into the current decade, the South saw
burgeoning growth in its metropolitan areas, and
immigrant settlement has mirrored this recent trend.
u.S. immigration policy changed in 1965, with
the abolition of national origin quotas, and insti-
tuted a preference system for sponsored relatives
of American citizens and workers with certain skills.
coincident with these changes was the economic
growth and development of many latin American,
caribbean, and Asian nations, leading to substantial
out-migration from those world regions. in addition,
civil and political strife induced emigration from vari-
ous countries in those same regions beginning in the
1970s. by the end of the 1990s, outflows of students,
professionals, and refugees from Africa increased
dramatically, and in this decade, Africans are arriving
in the united States at a higher rate than immigrants
from any other world region.
These economic, political, and policy dynamics
induced a dramatic shift in the origin of America’s
immigrant population over time (figure 2). in 1970,
among the 9.6 million foreign-born u.S. residents,
fully 60 percent were from europe, largely a mani-
festation of earlier waves of immigration. At that
point, only 8 percent of the total were from Mexico,
and another 11 percent were from the rest of latin
America and the caribbean. nine percent came from
the countries of Asia, another 8 percent from other
north American countries (mostly canada), and less
than 1 percent from the African continent. by 2008,
the dramatic transformations in opportunities across
Figure 1. The Foreign-Born Share of U.S. Population Is Rising, but Still Below Levels from the Early 20th Century
Foreign-Born Population and Share of Population that is Foreign Born, United States, 1900–2008
Source: Brookings analysis of decennial census and 2008 American Community Survey data

ST
AT
e o
f M
eT
ro
po
liT
An
AM
er
icA
| I
MM
IGR
AT
ION
67
OtherNorth America
Africa
Europe
Asia
Other Latin American & Caribbean
Mexico
OtherNorth AmericaAfrica
Europe
Asia
Other Latin America & Caribbean
Mexico
the world are apparent in the composition of the
38 million u.S. foreign born: only 13 percent are
from europe; Mexican immigrants comprise fully
30 percent of the total with another 23 percent from
other latin American and caribbean countries;
27 percent are from Asia; Africans represent nearly
4 percent of the total; and only 2 percent are from
north America.
METROPOLITAN TRENDS
Location of the Foreign BornThe u.S. foreign-born population concentrates dis-
proportionately in large metropolitan areas. in 2008,
about 85 percent of u.S. immigrants lived in the 100
largest metro areas, compared to 66 percent of total
population. This proportion was down slightly from
87 percent in 1990, reflecting a greater spread of the
foreign-born population across the u.S. landscape
over time. The remainder in 2008 lived in smaller
metropolitan areas (10 percent) and micropolitan
and other non-metropolitan areas (5 percent). The
disproportionate share of immigrants living in large
metro areas gave those areas a considerably higher
foreign-born population share in 2008 (over 16 per-
cent) than the nation as a whole.
new york and los Angeles top the list of metro-
politan areas with the largest number of immigrants,
with 5.3 and 4.4 million, respectively, followed by
other well-established destination areas includ-
ing Miami and chicago (see Table 1, upper panel).
however, when metro areas are ranked by the
percentage of foreign born, nine of the top 10 are
in the Sun belt states, all with long-standing immi-
grant populations (Table 1, lower panel). Six are in
california (San Jose, los Angeles, San francisco,
Stockton, oxnard and San Diego); two lie along the
Texas border (McAllen and el paso); and Miami and
new york round out the top 10.
Among the 100 largest metropolitan areas, the
foreign born grew by 21.3 percent between 2000
and 2008. That equated to a robust annual growth
rate of roughly 2.4 percent, though it was down
from the swift 4.5 percent annual growth rate of the
1990s. Metropolitan areas in the Southeast gained
immigrants at a faster rate than most other regions
Figure 2. The Region of Origin for U.S. Immigrants Shifted Dramatically Over Time
Share of Foreign Born by Region of Birth, United States, 1970
Source: Brookings analysis of decennial census and 2008 American Community Survey data
Share of Foreign Born by Region of Birth, United States, 2008
As of 2008,
38 million
immigrants
lived in the
United States,
or 12.5 percent
of the population,
a rising share
but still lower
than in the
early part of the
20th century.

ST
AT
e o
f M
eT
ro
po
liT
An
AM
er
icA
| I
MM
IGR
AT
ION
68
during this decade (Map 1). Many metro areas in
the great plains, Texas, inland california, and the
Mountain West also had above-average growth.
conversely, metropolitan areas in the great lakes
and industrial northeast, and along the West coast
saw slower-than-average growth or no significant
change at all.
further, many metropolitan areas saw immigra-
tion slow considerably toward the end of the 2000s
as the economy entered recession. Among the 15
metro areas with the largest number of immigrants,
only four posted significant, positive growth in
their foreign-born populations between 2007 and
2008 (houston, Dallas, Atlanta, and Seattle). The
Table 1. Immigrants Are Greatest in Number and Population Share in Long-Established Gateway Metro Areas
Metro Areas Ranked by Foreign-Born Population and Population Share, 2008
largest Number of Immigrants
Rank Metro area Immigrants
1 new york-newark, ny-nJ-pA 5,328,033
2 los Angeles-long beach-Santa Ana, cA 4,374,583
3 Miami-fort lauderdale-pompano beach, fl 1,995,037
4 chicago-naperville-Joliet, il-in-Wi 1,689,617
5 San francisco-oakland-fremont, cA 1,258,324
6 houston, Tx 1,237,719
7 Dallas-fort Worth-Arlington, Tx 1,121,321
8 Washington-Arlington-Alexandria, Dc-VA-MD-WV 1,089,950
9 riverside-San bernardino-ontario, cA 894,527
10 boston-cambridge, MA-nh 731,960
All large metro areas 32,425,888
Highest Foreign-Born Population Share
Rank Metro Area % Foreign Born
1 Miami-fort lauderdale-pompano beach, fl 36.8
2 San Jose-Sunnyvale-Santa clara, cA 36.4
3 los Angeles-long beach-Santa Ana, cA 34.0
4 San francisco-oakland-fremont, cA 29.4
5 McAllen, Tx 29.2
6 new york-newark, ny-nJ-pA 28.0
7 el paso, Tx 27.3
8 Stockton, cA 22.8
9 oxnard-Thousand oaks-Ventura, cA 22.3
10 San Diego, cA 22.1
All large metro areas 16.3
Source: Brookings analysis of 2008 American Community Survey data

ST
AT
e o
f M
eT
ro
po
liT
An
AM
er
icA
| I
MM
IGR
AT
ION
69
remainder, mostly well-established destination areas,
saw either a significant decline (los Angeles and
phoenix) or no change (new york, Miami, chicago,
San francisco, Washington, riverside, boston, San
Diego, and San Jose). The deepening of the reces-
sion in late 2008 suggests that this stall in immigra-
tion may have spread further the following year.
Migration Characteristics immigrant tenure and whether they become natural-
ized citizens both have implications for immigrants
themselves, their families, and the communities in
which they live. in many newer destination areas,
residents worry that newcomers may overwhelm
schools, health care systems, and other local
services. These areas often lack the developed
infrastructure to assist immigrants and their fami-
lies in the integration process that long-standing
destination metropolitan areas facilitate.
Metropolitan areas with high proportions of
foreign-born newcomers, including even estab-
lished areas, are grappling with these challenges.
Several newer destinations such as las Vegas and
Washington, D.c. have seen large shares of their
residents arrive in the united States since 2000,
but traditional settlement areas in california, Texas,
and new york also continue to draw new immigrants
through networks of those already in place (Table 2).
rates of naturalization provide another measure
of the “rootedness” of immigrant populations (Table
2). The decision to become a u.S. citizen has ele-
ments of both practicality and emotion; however, the
bureaucratic process intentionally takes some time.
eligibility depends on five years of legal permanent
residence (three years if married to a u.S. citizen),
knowledge of u.S. history and civics, and a degree of
Map 1. Metro Areas in the Southeast Had the Highest Rates of Immigrant Growth in the 2000sPercent Change in the Foreign-Born Population, 2000–2008
Source: Brookings analysis of Census 2000 and 2008 American Community Survey data

ST
AT
e o
f M
eT
ro
po
liT
An
AM
er
icA
| I
MM
IGR
AT
ION
70
english language ability. As a result, naturalization
rates vary widely by country and region of origin
(including proximity to the united States), length of
time in the united States, socioeconomic character-
istics, and refugee status. nationwide in 2008, u.S.
citizens accounted for 60 percent of foreign-born
individuals from europe, 58 percent from Asia, and
31 percent from latin American and the caribbean.
At the metropolitan level, naturalization rates
vary considerably, and relate to the level and
recentness of immigration. The places with the
highest shares of naturalized citizens include older
industrial metro areas with very low levels of recent
immigration, such as youngstown, portland (Me),
pittsburgh, and Dayton. continuous gateways such
as San francisco and new york also claim at least
half of their foreign-born populations as u.S. citi-
zens. on the lower end of the scale are both newer
destination areas and those in which a majority of
immigrants hail from Mexico, the proximity of which
to the united States has led to lower naturalization
rates among that group; houston and las Vegas
exemplify such areas.
Human Capital CharacteristicsSome of the most contentious arguments around
immigration concern the role of immigrants in the
economy. how skilled are immigrants and where do
they fit into the labor market, both nationally and
locally? english language ability and educational
attainment provide two important markers of immi-
grants’ labor market prospects, and these indicators
vary widely across u.S. metropolitan areas.
on english language ability, several metro areas
along the Mexican border and in california’s central
Valley exhibit high levels of immigrants with limited
proficiency and large shares of households that are
“linguistically isolated” (where no members over the
Table 2. Both New and Established Immigrant Gateways Have Large Shares of Foreign-Born NewcomersMetropolitan Areas Ranked by Share of Total Population Arriving in United States Since 2000, and Percent Naturalized 2008
Highest Foreign-Born Newcomer Share lowest Foreign-Born Newcomer Share
% Population % Foreign- % Population % Foreign-
Arriving in U.S. Born Arriving in U.S. Born
Rank Metro Area Since 2000 Naturalized Rank Metro Area Since 2000 Naturalized
1 San Jose-Sunnyvale-Santa clara, cA 10.2 49.2 91 Scranton, pA 1.3 40.3
2 Miami-fort lauderdale-pompano beach, fl 10.2 48.4 92 Jackson, MS 1.1 33.1
3 McAllen, Tx 8.3 23.4 93 baton rouge, lA 1.1 39.5
4 los Angeles-long beach-Santa Ana, cA 7.4 44.8 94 Toledo, oh 1.1 49.2
5 San francisco-oakland-fremont, cA 7.4 54.3 95 Augusta-richmond county, gA-Sc 1.1 47.5
6 new york-newark, ny-nJ-pA 7.4 51.4 96 Dayton, oh 1.0 53.2
7 Washington-Arlington-Alexandria, Dc-VA-MD-WV 7.0 44.7 97 chattanooga, Tn-gA 1.0 38.8
8 houston, Tx 6.9 32.3 98 pittsburgh, pA 1.0 53.3
9 las Vegas, nV 6.7 36.9 99 portland, Me 0.7 54.1
10 bridgeport-Stamford, cT 6.5 41.0 100 youngstown, oh-pA 0.4 65.6
Source: Brookings analysis of 2008 American Community Survey data

ST
AT
e o
f M
eT
ro
po
liT
An
AM
er
icA
| I
MM
IGR
AT
ION
71
age of 14 speak english very well). in these metropol-
itan areas, foreign-born populations are dominated by
Spanish-speakers, and upwards of 60 percent of all
foreign-born residents age five and over are consid-
ered to be limited english proficient (Table 3). in the
border metro areas of McAllen and el paso, approxi-
mately one in five households is linguistically isolated.
like immigrants themselves on measures of
educational attainment (see Educational Attainment
chapter), metropolitan areas diverge in their immi-
grant skill profiles. yet distinctive regional patterns
are evident in how immigrants of varying educational
attainment distribute across metropolitan labor
markets.1
lower-skilled immigrants cluster in fast-growing
places, reflecting the changing needs of labor
markets there (Map 2). Metro areas throughout the
intermountain West, Texas, and up the i-35 corridor
in the great plains states have high shares of
immigrants lacking a high school diploma, reflect-
ing educational standards and expectations in their
largely latin American home countries. Many of
these immigrants responded to labor market needs
in (what was) the booming construction industry and
burgeoning service sector in these metro areas that
mushroomed before the housing market crash and
resulting deep recession set in.
immigrants with higher levels of educational
attainment are overrepresented in metropolitan
areas that no longer receive many immigrants,
where the foreign born that remain tend to be older,
long-term u.S. residents. These destinations are pri-
marily in metropolitan areas east of the Mississippi
river, including in the established immigrant gate-
ways in the northeast (filling niches in finance,
healthcare, and technology), in new destinations
Table 3. Immigrants in Border-State Metro Areas Exhibit the Lowest Levels of English Language AbilityMetro Areas Ranked by Share of Foreign Born Who are Limited-English Proficient, and Share of Households
that are Linguistically Isolated, 2008
% Limited English % Linguistically
Rank Metro Area Proficient Isolated Households
1 McAllen, Tx 70.5 22.8
2 bakersfield, cA 68.3 10.1
3 el paso, Tx 67.5 18.8
4 Modesto, cA 65.8 8.8
5 fresno, cA 65.1 10.4
6 Stockton, cA 62.3 10.3
7 los Angeles-long beach-Santa Ana, cA 62.2 14.8
8 Dallas-fort Worth-Arlington, Tx 61.9 8.4
9 houston, Tx 61.0 10.9
10 oxnard-Thousand oaks-Ventura, cA 60.0 8.0
All large metro areas 52.2 6.3
Source: Brookings analysis of 2008 American Community Survey dataNote: Linguistically isolated households are those where no members over the age of 14 report speaking English “very well.”

ST
AT
e o
f M
eT
ro
po
liT
An
AM
er
icA
| I
MM
IGR
AT
ION
72
in the Southeast (diverse economies attracting
higher-skilled, often “pioneer” immigrants), and in
the former industrial metro areas in the great lakes
region (older foreign-born cohorts that have aged in
place). Western coastal “tech” metro areas such as
Seattle, San francisco and San Jose also register as
high-skill.
Metropolitan areas with foreign-born populations
with more “balanced” skill levels, reflecting both
higher- and lower-skilled immigrants, run the gamut
of u.S. regions and settlement histories. They include
many newly emerging gateways in Southern states
such as nashville, charlotte, Atlanta, and orlando, as
well as some of the largest immigrant destinations
such as chicago, new york, and Miami.
Second Generationof growing interest and concern is how the children
of immigrants are faring in u.S. schools and the
labor market, given the variation in human capi-
tal and resources of their parents. The 16 million
children (under age 18) in the “second generation,”
as measured here can be either born abroad or in
the united States but live with at least one foreign-
born parent. They make up 23 percent of all chil-
dren in the united States and 29 percent across all
large metropolitan areas. in several metropolitan
areas, they represent more than half or nearly half
of all children (Table 4). new york and los Angeles
have the largest cohorts of second-generation
children, nearly two million each. not surprisingly,
Map 2. High- and Low-Skilled Immigrants Distribute Unevenly Across U.S. Metro AreasSkill Profile of the Foreign Born, 2008
Source: Brookings analysis of 2008 American Community Survey data and based on analysis by Hall et al, forthcoming; see Endnote 1Note: The immigrant skill profile reflects the ratio of bachelor's degree holders to those without high school diplomas among the foreign-born population. High connotes a ratio of 1.25 or greater; balanced connotes a ratio of 0.75 to 1.24; and low connotes a ratio below 0.75.

ST
AT
e o
f M
eT
ro
po
liT
An
AM
er
icA
| I
MM
IGR
AT
ION
73
other established immigrant gateways such as San
francisco and San Diego also figure among the top
10. of course, not all children of immigrants are in
disadvantaged households. however, a large second-
generation population undoubtedly has impacts on
schools, and at the local level may indicate segrega-
tion by limited language proficiency, poverty, and
race and ethnicity.2
CITy AND SUBURBAN TRENDS The growth and development of metropolitan areas
with extensive suburbs has led to an increasing pref-
erence among immigrants for a suburban residence.3
in 1980, 41 percent of u.S. immigrants lived in the pri-
mary cities of the top 100 metro areas. by 2008, that
share had decreased to 34 percent. now, a majority
of immigrants nationwide (51 percent) live in the
suburbs of large metropolitan areas, compared to
just 44 percent in 1980. These suburban immigrants
numbered 19.5 million in 2008.
Smaller metro areas (under 500,000 popula-
tion) and non-metropolitan areas have maintained
their shares of about ten percent and five percent,
respectively, of the nation’s immigrant population.
These steady proportions, however, mask the high
growth rates in these areas. in fact, between 1990
and 2008, the immigrant population grew fastest in
non-metro areas (183 percent), followed by smaller
metro areas (122 percent). in suburbs and cities,
by contrast, the immigrant population grew by 112
percent and 57 percent, respectively, over the same
period, though from a much larger base. individually,
some counties within metropolitan areas, as well
as some smaller metro areas and nonmetropolitan
Table 4. The "Second Generation" Represents Nearly Half or More of All Children in Several Metro AreasMetro Areas Ranked by Second Generation* Proportion of Children, 2008
Number of Share of All
Rank Metro Area Children Children (%)
1 San Jose-Sunnyvale-Santa clara, cA 258,910 61.0
2 los Angeles-long beach-Santa Ana, cA 1,865,272 59.6
3 McAllen, Tx 144,779 57.7
4 Miami-fort lauderdale-pompano beach, fl 619,993 54.3
5 el paso, Tx 110,638 51.5
6 San francisco-oakland-fremont, cA 436,136 49.6
7 Stockton, cA 82,206 45.1
8 riverside-San bernardino-ontario, cA 492,887 44.4
9 San Diego, cA 309,571 43.9
10 new york-newark, ny-nJ-pA 1,844,762 43.5
All large metro areas 13,642,110 29.0
Source: Brookings analysis of 2008 American Community Survey data* Children under age 18, born abroad or in the United States, living with at least one foreign-born parent

ST
AT
e o
f M
eT
ro
po
liT
An
AM
er
icA
| I
MM
IGR
AT
ION
74
counties experienced much faster growth, prompting
residents and officials to confront immigration for
the first time.4
The degree to which immigrants live in suburbs
within specific metropolitan areas follows their
individual settlement histories. immigrants still
compose a larger share of overall primary city (21
percent) than suburban (14 percent) population,
but they have suburbanized over time along with
the larger population. in 2008, 63 of the 95 largest
metro areas had a majority of their foreign born liv-
ing in suburbs. long-established gateways like new
york and San francisco have high shares of foreign-
born population overall, and their cities record even
higher shares than their suburbs (figure 3). in newer
gateways like Atlanta, las Vegas, portland (or), and
Washington, D.c., the foreign born are at least as
prevalent in suburbs as in cities, with new arrivals
often skipping the city altogether. A similar pattern
holds in former immigrant strongholds like buffalo,
cleveland, and Detroit, but owes more to the long-
Figure 3. Immigrants Comprise a Similar or Larger Share of Suburban than City Populations in Many Newer Destinations
Share of Population that is Foreign Born, Primary Cities vs. Suburbs, Selected Metro Areas, 2008
Source: Brookings analysis of 2008 American Community Survey data* Metro area names are abbreviated
Table 5. Immigrants Are Over-Represented in High-Density Suburbs As Well As CitiesTotal and Foreign-Born Population by Metropolitan Community Type, 2008
Foreign-Born Share of Large Metro Share of Large Metro
Total Foreign-Born Share of Areas' Total Areas' Foreign-Born
Population Population Population (%) Population (%) Population (%)
primary cities 61,828,840 12,943,625 20.9 31.0 39.9
high-Density Suburbs 54,184,145 11,507,510 21.2 27.2 35.5
Mature Suburbs 49,491,155 6,015,360 12.2 24.9 18.6
emerging Suburbs 23,638,770 1,598,070 6.8 11.9 4.9
exurbs 10,009,665 361,460 3.6 5.0 1.1
All large metro areas 199,152,575 32,426,025 16.3 100.0 100.0
Source: Brookings analysis of 2008 American Community Survey data

ST
AT
e o
f M
eT
ro
po
liT
An
AM
er
icA
| I
MM
IGR
AT
ION
75
run suburbanization of older foreign-born workers
and families in those metro areas than to settlement
patterns of newly arriving populations.
immigrants distribute unevenly across different
types of suburbs, too (Table 5). Across all major
metro areas in 2008, 40 percent of the foreign born
lived in primary cities, and 60 percent lived in sub-
urbs. The latter included 36 percent living in high-
density suburban counties, 19 percent in mature,
mid-20th century suburban counties, 5 percent in
emerging suburban counties, and just 1 percent in
the exurbs. As in cities, immigrants represent an
outsized share of population in high-density sub-
urbs; their population share in mature suburbs now
approaches the national average.
LOOKING AHEADTrends in immigration reveal an uneven portrait
of the foreign born across America’s metropolitan
areas. overall, immigration to the united States is
slowing, and some of the fastest-growing places have
seen drops in their foreign-born population. The
imprint of the recession also shows up in many of the
fastest-growing places of the past decade, now reel-
ing from the bursting of the housing bubble. These
metro areas, such as phoenix and las Vegas in the
intermountain West, saw many immigrant newcom-
ers join the once burgeoning construction sector and
associated industries only to witness a significant
outflow in the past year. other Sun belt metro areas—
such as Atlanta, Dallas, and charlotte, also relatively
new destinations—saw continued growth in immigra-
tion during the past year. because immigrants, par-
ticularly more recent ones, tend to be fairly mobile,
we expect to see some destination shifting as we
look ahead to an uneven economic recovery across
metropolitan areas.
in the next decade, certain trends that have taken
hold are likely to persist. We will see a continuing
spread of immigrants into newer destinations and
suburban areas, as immigrants seek opportunities
for housing, jobs, and quality of life. The skills dif-
ferentials across metro areas may also continue as
immigrants consolidate further in new destination
areas, bringing the next wave of immigrants and
highlighting the language and educational aspects of
immigrant integration.
The growth of immigrants in the suburbs under-
scores the need for jurisdictions across metropolitan
areas to work together to adequately and coherently
respond to changing demographic conditions. This
is especially the case for those areas that have well-
established, lower-skilled immigrant populations with
high shares of children. n
ENDNOTES1. ratio of high- to low-skill immigrants from Matthew hall,
Deborah roempke graefe, and gordon f. De Jong, “The
geography of immigrant Skills: educational profiles
of Metropolitan Destinations” (Washington: brookings
institution, forthcoming).
2. gary orfield and chungmei lee, “racial Transformation
and the changing nature of Segregation,” (cambridge,
MA: The civil rights project, 2006).
3. See Audrey Singer, Susan W. hardwick and caroline
b. brettell, Twenty-First Century Gateways: Immigrant
Incorporation in Suburban America (Washington:
brookings institution press, 2008).
4. See, e.g., Audrey Singer, Jill h. Wilson, and brooke
Derenzis, “immigrants, politics, and local response
in Suburban Washington” (Washington: brookings
institution, 2009).
Because immi-
grants, particu-
larly more recent
ones, tend to be
fairly mobile, we
expect to see
some destination
shifting as we
look ahead to an
uneven economic
recovery across
metropolitan
areas.