2011 annu a l repor t - south carolina general assembly · uncertainty and challenge for the energy...
TRANSCRIPT

2 0 1 1 A n n u A l R e p o R t
Tomorrow is Today

2011 annual report
2
TABLE OF CONTENTS
Chairman and CEO Letter 3
Corporate Statistics 6
Audit Committee Chairman’s Letter 8
Management’s Discussion and Analysis 9
Report of Independent Auditor 20
Combined Balance Sheets 22
Combined Statements of Revenues, Expenses and 24Changes in Net Assets
Combined Statements of Cash Flows 26
Notes 28
Leadership 60
Office Locations 65

2011 annual report
3
CHAIRMAN AND CEO LETTER
For a couple of years, Santee Cooper has forecast an era of
uncertainty and challenge for the energy industry, and 2011
has proven us right. That turbulent tomorrow is here. The
year brought historic doubt about the economy, regulatory
challenges and more. The good news is, we began preparing
for these challenges some time ago, and we are as ready as
we can be.
Financially, Santee Cooper remains on solid footing and
continues to maintain strong credit ratings. Refunding bond
sales in 2011 generated solid demand and allowed us to
restructure more than $440.7 million in
debt, saving $33.2 million over the life
of the bonds we refunded. We continue
to stress savings and cost controls that
benefit our customers, and have cut
or deferred $1.8 billion from our capital
budget from 2010 through 2012. Our
debt-to-equity ratio in 2011 was 73/27.
Even with our cost controls, Santee
Cooper is not sacrificing reliability of
power to our customers: Our reliability
results were excellent, with 99.99
percent reliability for distribution, 99.99
percent for transmission and 89.63
percent for generation availability.
Our retail customer growth remains
sluggish as the state continues to suffer
lingering effects of the Great Recession.
We ended the year with 164,647
residential and commercial customers, up less than 1 percent
from 2010. Energy sales decreased 2 percent.
Electric utilities must plan for the long term, of course, and
we are preparing for when the economy picks up steam. As
2011 ended, the Nuclear Regulatory Commission was in final
review of our application with SCE&G for a license to build
and operate two new nuclear units at V.C. Summer Nuclear
Station. The first of those new units is scheduled to come
online in about five years. Expanding our nuclear generation
is a critical part of Santee Cooper’s need to diversify our
generating portfolio to better manage fuel costs and meet new
and expected emissions regulations, and it will also guarantee
our continued ability to deliver low-cost and reliable electricity
for all of South Carolina’s tomorrows.
We completed a substantial upgrade to our transmission
system in Georgetown and Horry Counties, installing double-
circuit 115-kV lines and double-circuit 12-kV lines along the
right of way beside U.S. Highway 17 from Pawleys Island to
Garden City Beach. The upgrades increase reliability for our
customers and increase the system’s capacity there, so that
we can continue to serve that growing population base.
Santee Cooper made strategic organizational moves to better
align ourselves for upcoming challenges. Key among these
are new officer-level positions focused on the V.C. Summer
expansion, fuel acquisition and supply, and customer service.
Regulatory issues took center stage in 2011. The
Environmental Protection Agency approved a final Cross State
Air Pollution Rule earlier last year, and it has been stayed
pending a challenge in federal court. EPA also approved its
Mercury Air Toxic Standards (MATS) in December. We are
still analyzing this lengthy and complex rule to determine
what we must do to comply. Santee Cooper has an excellent

2011 annual report
4
environmental record and has led South Carolina in voluntarily
installing environment control technology on most of our
generation. That technology captures 93 percent of emissions
targeted by the MATS rule, or just shy of the MATS target
of 95 percent. MATS will require significant overhauls,
potentially costing hundreds of millions of dollars, for negligible
improvements.
As a continued demonstration of our environmental
stewardship, Santee Cooper continued to grow our energy-
efficiency program, Reduce The Use. In 2011, we announced
new business rebates for customized improvements for
commercial customers. Business Custom rebates let Santee
Cooper work one-on-one with commercial customers and
identify energy-saving solutions tailored to their specific needs.
On the renewable energy front, Santee Cooper celebrated
a key milestone in 2011: the 10th birthday of our Green
Power program, the first and still only program of its kind in
the state. During those 10 years, Santee Cooper generated
approximately 580,000 megawatt-hours of Green Power and
sold 163,559 MWhs of that to customers. Santee Cooper
increased our Green Power generation by bringing online
the Berkeley Green Power Generating Station and the Grand
Strand Solar Station. We also dedicated our 20th Green Power
Solar School, this one at Myrtle Beach Middle School.
Santee Cooper strives to provide exceptional customer
service, and we added features in 2011 that allow customers
even more flexibility in doing business with us. We launched
a mobile website in January, making it easy for customers
to access important information via smart phones and
other portable devices. In September, we added the Storm
Center, which lets customers see near real-time information
about outages on our system and repair efforts, and also
lets them report outages via smart phones or other Internet
connections. And as 2011 closed, we wrapped up a
successful pilot of “live chat” instant message technology,
which lets customers converse with our customer service
representatives via a link on our website. Live chat is now
fully operational and has proven a popular customer service
addition.
It is crucial that Santee Cooper be ready for whatever
tomorrow brings. We also want to prepare our customers.
Energy Matters is a new feature at www.santeecooper.com
with up-to-date information about regulatory activity, our
new nuclear power project, and other timely issues. We are
encouraging our customers to get plugged in by visiting this
page.
Santee Cooper is prepared today for a successful tomorrow,
for our customers, our employees and our state.
O.L. Thompson IIIChairman
Board of Directors
Lonnie N. CarterPresident and Chief Executive Officer

2011 annual report
5

2011 annual report
6
2011 2010 2009 2008 2007FINANCIAL (Thousands):Total Revenues & Income $1,923,828 $1,895,194 $1,702,513 $1,603,653 $1,494,467 Total Expenses & Interest Charges $1,778,892 $1,753,711 $1,616,943 $1,484,446 $1,391,844 Other $5,987 ($26,468) $3,883 ($22,048) ($1,478)Reinvested Earnings $150,923 $115,015 $89,453 $97,159 $101,145
OTHER FINANCIAL (Excluding Commercial Paper):Debt Service Coverage 1.61 1.58 1.45 1.67 1.75 Debt / Equity Ratio 73/27 74/26 73/27 72/28 69/31
STATISTICAL:Number of Customers (at Year-End)Retail Customers 164,647 163,601 162,981 162,657 161,317 Military and Large Industrial 29 30 30 31 31 Wholesale 4 4 4 4 4
------------- ------------- ------------- ------------- -------------Total Customers 164,680 163,635 163,015 162,692 161,352
Generation (GWh):Coal 20,048 21,889 20,869 21,189 22,811 Nuclear 2,469 2,828 2,282 2,385 2,826 Hydro 274 450 449 212 337 Natural Gas 3,819 2,906 2,173 1,188 1,097 Oil (2) 12 20 5 17 Landfill Gas 115 108 91 77 64
------------- ------------- ------------- ------------- -------------Total Generation 26,723 28,193 25,884 25,056 27,152
Purchases, Net Interchanges, etc. (GWh) 1,546 940 790 2,463 880
Wheeling, Interdepartmental, and Losses (717) (951) (861) (832) (811)------------- ------------- ------------- ------------- -------------
Total Energy Sales (GWh) 27,552 28,182 25,813 26,687 27,221
Summer Maximum Continuous Rating (MCR) Generating Capability (MW)
5,665 5,662 5,661 5,656 5,056
Territorial Peak Demand (MW) 5,676 5,743 5,590 5,650 5,563
CORPORATE STATISTICS
System Data 2011
Transmission system line miles: 4,990
Miles of distribution lines: 2,757
Number of transmission stations in operation on system: 103
Number of distribution substations: 51
Number of CEPCI Delivery Points (DPs): 498
(this total includes DPs for the 5 Upstate cooperatives served
through Duke Energy system)

2011 annual report
7
Source GWh
Coal 72.76% 20,048
Nuclear 8.96% 2,469
Oil -0.01% (2)
Hydro 0.99% 274
Natural Gas 13.86% 3,819
Other Renewables 0.42% 115
Purchases (net) 3.02% 829
Total Sales 100.00% 27,552
2011 GENERATION BY FUEL MIX
TOTAL SUMMER CAPABILITY (MCR) WITH FIRM PURCHASES
PEAK DEMAND
Year
Year
MW
sM
Ws
7000
5800
5700
5600
5500
5400
5300
5200
5100
5000
6000
5000
4000
3000
2000
1000
2007 2008
5,563
2007 2008
5,482
2009
6,082
2010
6,087
2011
6,126 6,284
2009
5,650
2010
5,590
2011
5,743
5,676

2011 annual report
8
AudIT COmmITTEE CHAIRmAN’S LETTER
The Audit Committee of the Board of Directors is comprised of independent directors Cecil E. Viverette, Chairman, William A.
Finn, and W. Leighton Lord III.
The committee receives regular reports from members of management and Internal Audit regarding their activities and
responsibilities.
The Audit Committee oversees Santee Cooper’s financial reporting, internal controls and audit process on behalf of the board of
directors.
Periodic financial statements and reports pertaining to operations and representations were received from management and
the internal auditors. In fulfilling its responsibilities, the committee also reviewed the overall scope and specific plans for the
respective audits by the internal auditors and the independent public accountants. The committee discussed the company’s
financial statements and the adequacy of its system of internal controls. The committee met with the independent public
accountants and with the General Auditor to discuss the results of the audit, the evaluation of Santee Cooper’s internal controls,
and the overall quality of Santee Cooper’s financial reporting.
Cecil E. Viverette
Chairman
2011 Audit Committee

2011 annual report
9
mANAGEmENT’S dISCuSSION ANd ANALySIS OVERVIEW OF FINANCIAL STATEMENTS
As management of South Carolina Pubic Service Authority (the Authority), we offer this narrative overview and analysis of the
financial activities of the Authority for the years ended December 31, 2011, 2010 and 2009. We encourage you to read this
information in conjunction with additional information furnished in the Authority’s audited financial statements that follow this
narrative.
Combined Balance Sheets
Assets and liabilities of proprietary funds are presented to distinguish between current and long-term assets and
liabilities.
Combined Statements of Revenues, Expenses and Changes in Net Assets
This statement provides the operating results of the Authority broken into the various categories of operating revenues
and expenses, non-operating revenues and expenses, as well as revenues from capital contributions.
Combined Statements of Cash Flows
Sources and uses of cash are classified using the direct method resulting from operating, non-capital financing, capital
and related financing or investing activities.
Notes to the Financial Statements
The notes are used to explain some of the information in the financial statements and provide more detailed data.
FINANCIAL CONDITION OVERVIEW
The Authority’s Combined Balance Sheets as of December 31, 2011, 2010 and 2009 are summarized as follows:
2011 2010 2009
(Thousands)
ASSETS
Plant - net $ 5,092,749 $ 4,873,428 $ 4,817,143
Current assets 1,733,008 1,555,883 1,304,374
Other noncurrent assets 838,531 990,822 895,931
Deferred debits 587,757 541,944 511,409
Total assets $ 8,252,045 $ 7,962,077 $ 7,528,857
LIABILITIES & NET ASSETS
Long-term debt - net $ 4,991,743 $ 4,755,108 $ 4,472,566
Current liabilities 902,419 981,495 940,785
Other noncurrent liabilities 468,152 468,010 454,543
Net assets 1,889,731 1,757,464 1,660,963
Total liabilities and net assets $ 8,252,045 $ 7,962,077 $ 7,528,857

2011 annual report
10
2011 Compared to 2010
ASSETS
• Net plant increased by $219.3 million. Additions minus retirements to utility plant and other physical property were $109.9
million in 2011. The capital additions at several generating facilities, along with transmission construction accounted for a
majority of the increase. Accumulated depreciation increased by $183.1 million. Construction work in progress showed a net
increase of approximately $292.5 million, which resulted primarily from additions of $241.0 million related to V.C. Summer Units
2 and 3. The majority of the remaining net capital additions of $51.5 was related to transmission plant.
• Current assets increased $177.1 million due primarily to increases in Unrestricted and Restricted investments, Receivables,
Materials and Fuel inventories, and Prepaid expenses and other current assets. These were partially offset by a reduction in
Unrestricted and Restricted cash and cash equivalents.
• Other noncurrent assets decreased $152.3 million primarily due to a decrease in Restricted cash and cash equivalents,
Investment in associated companies, and Regulatory assets-asset retirement obligation. Increases in Unrestricted cash and
cash equivalents, Unrestricted and Restricted investments, and Other debits and other noncurrent assets partially offset the
decreases.
• Deferred debits increased $45.8 million due mainly to increases in Costs to be recovered from future revenue regulatory asset
and Other deferred debits reduced by decreases in Unamortized debt expense.
LIABILITIES
• Long-term debt increased $236.6 million due to the net effect of the impact of 2011 bond issues and principal payments.
• Current liabilities decreased $79.1 million due to reductions in Current portion of long-term debt and Accounts payable partially
offset by increases in Commercial paper and Other current liabilities.
• Other noncurrent liabilities increased $142,000 due primarily to increases in Regulatory liabilities for asset retirement obligation
offset by decreases in Construction fund liabilities and Other deferred credits and noncurrent liabilities.
• Net assets increased $132.3 million due mainly to increases in Restricted for debt service, Restricted for other, and
Unrestricted net assets. This was reduced by a decrease in Invested in capital assets, net of related debt.
2010 Compared to 2009
ASSETS
• Net plant increased by $56.3 million. Additions minus retirements to utility plant were $124.9 million in 2010. The addition
of coal cars, Cross Unit 4, and distribution and transmission capital projects accounted for approximately 75 percent of the
increase. Accumulated depreciation increased by $155.4 million, of which almost $80.0 million was due to the depreciation
of the steam generation plant assets. The remaining increase resulted from the annual depreciation of the Authority’s other
system assets. Construction work in progress showed a net increase of approximately $86.8 million. This resulted primarily
from additions of $353.0 million related to V.C. Summer Units 2 and 3 less a transfer of $253.0 million related to the Pee Dee
Unit 1 cancellation.

2011 annual report
11
• Current assets increased $251.5 million due primarily to increases in Unrestricted cash and cash equivalents, Unrestricted and
Restricted investments, Receivables, Materials and Fuel inventories, and Prepaid expenses and other current assets. These
were offset by a reduction in Restricted cash and cash equivalents.
• Other noncurrent assets increased $94.9 million primarily due to increases in Unrestricted and Restricted cash and cash
equivalents, Unrestricted investments, and Regulatory assets. A decrease in Restricted investments reduced these increases.
• Deferred debits increased $30.5 million due mainly to increases in Other deferred debits offset by decreases in Unamortized
debt expense and the Costs to be recovered from future revenue regulatory asset.
LIABILITIES
• Long-term debt increased $282.5 million due to the net effect of principal payments and impact of 2010 bond issues.
• Current liabilities increased $40.7 million due to increases in Current portion of long-term debt and Accounts payable offset by
decreases in Commercial paper and Other current liabilities.
• Other noncurrent liabilities increased $13.5 million due primarily to increases in Regulatory liabilities for asset retirement
obligation and Other deferred credits and liabilities offset by a decrease in Construction fund liabilities.
• Net assets increased $96.5 million due mainly to increases in Restricted for debt service and Unrestricted net assets. These
were partially offset by decreases in Invested in capital assets, net of related debt and Restricted for other.
RESULTS OF OPERATIONS
The Authority’s Combined Statements of Revenues, Expense and Changes in Net Assets for years ended December 31, 2011,
2010 and 2009 are summarized as follows:
2011 2010 2009
(Thousands)
Operating revenues $ 1,914,689 $ 1,894,902 $ 1,702,001
Operating expenses 1,556,162 1,509,003 1,382,739
Operating income 358,527 385,899 319,262
Interest charges (222,730) (244,708) (234,204)
Costs to be recovered from future revenue 5,987 (26,468) 3,883
Other income 9,139 292 512
Transfers out (18,656) (18,514) (20,511)
Change in net assets $ 132,267 $ 96,501 $ 68,942
Ending net assets $ 1,889,731 $ 1,757,464 $ 1,660,963

2011 annual report
12
2011 Compared to 2010
OPERATING REVENUES
Operating revenues for 2011 increased $19.8 million or 1 percent over the prior year. This was due primarily to higher energy
and demand revenues which were partially offset by a 2 percent reduction in kWh sales. Energy sales for 2011 totaled 27.6
million megawatts compared to approximately 28.2 million for 2010. Decreases were seen across all categories except for the
industrial category.
60%
22%
18%
RETAIL INDUSTRIAL SALES FOR RESALE
2011 Revenue Sales of Electricity*by Customer Class
R O
2011 2010 2009
Revenue Sales of Electricity* (Thousands)
Retail $ 349,618 $ 355,992 $ 308,572
Industrial 415,309 376,247 346,318
Sales for Resale 1,129,444 1,142,582 1,028,192
Totals $ 1,894,371 $ 1,874,821 $ 1,683,082
*Excludes interdepartmental sales of $475 for 2011, $443 for 2010, and $386 for 2009.

2011 annual report
13
OPERATING ExPENSES
Operating expenses for 2011 reflected a net increase of $47.2 million or 3 percent compared to 2010. Fuel and purchased
power expenses accounted for approximately 65 percent of the current year’s electric operating expenses and increased
approximately 4 percent over last year. The Authority manages fuel costs with a combination of long-term and short-term
contracts, a fuel related risk hedging program and the blend of a variety of fuels (natural gas, oil, nuclear and coal). Compared to
2010, fuel and purchased power expense was $34.9 million higher due to increases in coal purchase prices, fuel transportation
costs and station outages. Other generation operating and maintenance costs increased by approximately $14.0 million and
related mainly to station outages.
FUEL AND PURCHASED POWER
OTHER GENERATION
TRANSMISSION
DISTRIBUTION
CUSTOMER AND SALES COSTS
ADMINISTRATIVE AND GENERAL
DEPRECIATION AND SUMS IN LIEU OF TAXES
2011 Electric Operating Expensesby Category
65%
12%
13%
6%1%
2%
1%
2011 2010 2009
Electric Operating Expenses (Thousands)
Fuel & Purchased Power $ 1,003,377 $ 968,464 $ 865,199
Other Generation 207,737 193,783 185,617
Transmission 30,989 29,370 29,713
Distribution 14,832 14,527 14,461
Customer & Sales Costs 20,176 21,177 20,860
Administrative & General 86,327 88,668 82,724
Depreciation & Sums in Lieu of Taxes 188,802 189,319 180,701
Totals $ 1,552,240 $ 1,505,308 $ 1,379,275

2011 annual report
14
NET BELOW-THE-LINE ITEMS
• Interest charges for 2011 were $22.0 million or 9 percent lower than 2010 primarily resulting from the reclassification of nuclear
construction interest for 2011.
• Costs to be recovered from future revenue decreased expenses by $32.5 million when compared to last year primarily due to
completion of a long term amortization in 2010 and revised debt service schedules.
• Other income increased $8.8 million mainly from interest subsidy accruals on Build America Bonds (BABs) issued in December
2010.
• Transfers out represents the dollars paid by the Authority to the State of South Carolina. There was an increase of $142,000
which resulted from higher projected revenues from the prior year.
2010 Compared to 2009
OPERATING REVENUES
Operating revenues for 2010 increased $192.9 million or 11 percent over the prior year. This was due primarily to a 9 percent
increase in kWh sales, the 2009 rate increase, and higher demand revenues. Energy sales for 2010 totaled 28.2 million
megawatts compared to approximately 25.8 million for 2009. Although megawatt sales increased in all customer categories, the
primary increase was in the sales for resale customer category.
OPERATING ExPENSES
Operating expenses for 2010 reflected a net increase of $126.3 million or 9 percent compared to 2009. Fuel and purchased
power expenses accounted for approximately 64 percent of the current year’s electric operating expenses and increased
approximately 12 percent. The Authority manages fuel costs with a combination of long-term and short-term contracts, a fuel
related risk hedging program and the blend of a variety of fuels (natural gas, oil, nuclear and coal). Compared to 2009, fuel and
purchased power expense was $103.3 million higher due to the 9 percent increase in kWh sales, higher coal purchase prices,
and additional station outages. Other generation operating and maintenance costs increased by approximately $8.2 million due
primarily to station outages and environmental expense. Depreciation expense showed an increase over last year of $9.8 million
due primarily to adjustments related to coal cars and paved roads.
NET BELOW-THE-LINE ITEMS
• Interest charges for 2010 were $10.5 million or 4 percent higher than 2009 resulting mainly from the 2009 and 2010 bond
activity.
• Costs to be recovered from future revenue increased expenses by $30.4 million when compared to last year primarily due to
the impact of a higher adjusted principal component compared to 2009.
• Other income decreased $220,000. This resulted primarily from lower interest income and the change in the fair value of
investments compared to 2009.
• Transfers out represents the dollars paid by the Authority to the State of South Carolina. There was a decrease of $2.0 million
below 2009 which resulted from a decrease in projected revenues from the prior year.

2011 annual report
15
CAPITAL IMPROVEMENT PROGRAM
The purpose of the capital improvement program is to continue to meet the energy and water needs of the Authority’s customers
with economical and reliable service. The Authority’s 2011 capital improvement program budgeted for years 2012 through 2014
in the amount of $2.5 billion is expected to be expended as follows:
2011 2010 2009
Budget 2012-14 Budget 2011-13 Budget 2010-12
Capital Improvement Expenditures (Thousands)
Cross Units 3 & 4 $ 0 $ 0 $ 9,000
Environmental Compliance 71,600 54,000 53,000
General Improvements to the System 627,100 586,000 670,000
Pee Dee Unit 1 0 14,000 21,000
Future Nuclear Units 1,844,600 1,654,000 1,376,000
Totals $ 2,543,300 $ 2,308,000 $ 2,129,000
The cost of the capital improvement program will be funded from revenues of the Authority which are set aside in the Capital
Improvement Fund, along with additional revenue obligations, commercial paper notes and other short-term obligations, as
determined by the Authority.
The Authority’s capital improvement program includes funds for two future nuclear units, general improvements to the Authority’s
system, and environmental compliance expenditures.
ECONOMIC FACTORS
The Authority continues to face significant economic and operating fiscal challenges. While some of these issues are unique to
the Authority, some of the major ones are affecting the utility industry on a national basis.
Power costs are rising primarily due to three factors beyond the Authority’s immediate control. These are the cost of fuel,
transportation of fuel, and environmental regulations. To combat rising fuel and transportation costs, the Authority continues to
negotiate for favorable pricing with our providers and to work with our customers to keep these costs down as much as possible
within the Authority’s control. Environmental issues are in the spotlight on a national level and continue to add to the cost of
power, impacting everyone in both the public and private sectors.
While currently in a tight credit market, the Authority is working to manage debt service costs to our customers while providing
financing for our share of ownership in two new 1,100 MW nuclear generating units. Due to the national recession and changing
financial markets, rating agencies are now reevaluating their criteria for analyzing and rating the public power sector.
To meet these issues, the Authority continues to look for new and innovative ways to lower or keep costs within a reasonable
budget, while partnering with our customers to recruit and retain industry and jobs in South Carolina.

2011 annual report
16
DEBT SERVICE COVERAGE
The Authority’s debt service coverage (excluding commercial paper) for years ended December 31, 2011, 2010, and 2009 is
shown below:Debt Service Coverage Ratio
Years
1.58
1.45
1.61
R O
1.35
2011 2010 2009
1.40
1.45
1.50
1.55
1.60
1.65
BOND RATINGS
Bond ratings assigned by the various agencies at December 31, 2011, 2010 and 2009 were as follows:
Agency / Lien Level 2011 2010 2009
Fitch Ratings
Revenue Bonds (1) Not Applicable Not Applicable AA
Revenue Obligations (2) AA AA AA
Commercial Paper F1+ F1+ F1+
Moody’s Investors Service, Inc.
Revenue Bonds (1) Not Applicable Not Applicable Aa2
Revenue Obligations Aa3 Aa2 Aa2
Commercial Paper P-1 P-1 P-1
Standard & Poor’s Rating Services
Revenue Bonds (1) Not Applicable Not Applicable AA-
Revenue Obligations AA- AA- AA-
Commercial Paper (3) A-1+ A-1+ A-1+
2011 Taxable Series A (LIBOR Index Bonds) SP-1+ Not Applicable Not Applicable
(1) The remaining bonds outstanding under this lien level were refunded in May 2009.(2) The Revenue Obligations rating was updated from AA to AA- by Fitch Ratings on January 10, 2012.(3) The Commercial Paper rating was updated from A-1+ to A-1 by Standard & Poor’s Rating Services on January 6, 2012.

2011 annual report
17
This page intentionally left blank

2011 annual report
18
Bond Market Transactions for Years 2011, 2010, and 2009
year 2011
Revenue Obligations: 2011 Series m1 - Current Interest Bearing Bonds (CIBS) Par Amount: $ 20,624,500 date Closed: May 13, 2011
Purpose: To finance a portion of the Authority’s ongoing capital program
Comments: Tax-exempt minibonds
Revenue Obligations: 2011 Series m1 - Capital Appreciation Bonds (CABS) Par Amount: $ 5,537,400 date Closed: May 13, 2011
Purpose: To finance a portion of the Authority’s ongoing capital program
Comments: Tax-exempt minibonds
Revenue Obligations: 2011 Series A - LIBOR Index Bonds Par Amount: $ 336,632,000 date Closed: June 23, 2011
Purpose: To refund the Revenue Obligations 2010 Taxable Series A bonds, to retire certain commercial paper notes of the Authority, and to fund a portion of the Authority’s ongoing capital program and miscellaneous improvements
Comments: Taxable bonds with variable interest rate set monthly based on the London Interbank Offered Rate (LIBOR) plus 38 - 70 basis points
Revenue Obligations: 2011 Refunding Series B Par Amount: $ 288,515,000 date Closed: September 1, 2011
Purpose: Refund a portion of the following: 2002 Refunding Series D and 2004 Series A
Comments: Gross savings of $23.8 million over the life of the bonds
Revenue Obligations: 2011 Refunding Series C Par Amount: $ 135,855,000 date Closed: October 11, 2011
Purpose: Refund a portion of the following: 2002 Series B and 2007 Series A
Comments: Gross savings of $9.4 million over the life of the bonds
Revenue Obligations: 2011 Series m2 - Current Interest Bearing Bonds (CIBS) Par Amount: $ 17,205,500 date Closed: November 8, 2011
Purpose: To finance a portion of the Authority’s ongoing capital program
Comments: Tax-exempt minibonds
Revenue Obligations: 2011 Series m2 - Capital Appreciation Bonds (CABS) Par Amount: $ 4,668,000 date Closed: November 8, 2011
Purpose: To finance a portion of the Authority’s ongoing capital program
Comments: Tax-exempt minibonds
Year 2010
Revenue Obligations: 2010 Series M1 - Current Interest Bearing Bonds (CIBS) Par Amount: $ 20,584,000 Date Closed: May 14, 2010
Purpose: To finance a portion of the Authority’s capital improvements
Comments: Tax-exempt minibonds
Revenue Obligations: 2010 Series M1 - Capital Appreciation Bonds (CABS) Par Amount: $ 7,140,600 Date Closed: May 14, 2010
Purpose: To finance a portion of the Authority’s capital improvements
Comments: Tax-exempt minibonds
Revenue Obligations: 2010 Series A - LIBOR Index Bonds Par Amount: $ 234,861,000 Date Closed: July 8, 2010
Purpose: To retire certain outstanding taxable commercial paper notes of the Authority
Comments: Taxable bonds with variable interest rate set monthly based on the London Interbank Offered Rate (LIBOR) plus 25 basis points
Revenue Obligations: 2010 Refunding Series B Par Amount: $ 231,060,000 Date Closed: November 10, 2010
Purpose: Refund a portion of the following: 2001 Series A, 2002 Series B, and 2002 Refunding Series D
Comments: Gross savings of $22.8 million over the life of the bonds
Revenue Obligations: 2010 Series M2 - Current Interest Bearing Bonds (CIBS) Par Amount: $ 12,161,000 Date Closed: November 18, 2010
Purpose: To finance a portion of the Authority’s capital improvements
Comments: Tax-exempt minibonds
Revenue Obligations: 2010 Series M2 - Capital Appreciation Bonds (CABS) Par Amount: $ 4,880,200 Date Closed: November 18, 2010
Purpose: To finance a portion of the Authority’s capital improvements
Comments: Tax-exempt minibonds
Revenue Obligations: 2010 Series C - (Build America Bonds) Par Amount: $360,000,000 Date Closed: December 21, 2010
Purpose: To finance a portion of the tax-exempt construction for V. C. Summer Units 2 and 3 - (The bond proceeds are taxable but will be used to pay tax-exempt expenditures)
Comments: Taxable bonds with an all-in true interest cost of 4.24 percent

2011 annual report
19
Bond Market Transactions for Years 2011, 2010, and 2009 (continued)Year 2009
Revenue Obligations: 2009 Refunding Series A Par Amount: $ 115,025,000 Date Closed: May 20, 2009
Purpose: Refund the following: 1997 Refunding Series A and 1998 Refunding Series B
Comments: Gross savings of $10.8 million over the life of the bonds
Revenue Obligations: 2009 Series B Par Amount: $ 164,130,000 Date Closed: May 20, 2009
Purpose: To finance a portion of the tax-exempt construction for Pee Dee Unit 1, V. C. Summer Units 2 and 3, ongoing transmission system construction / improvements and New Source Review environmental requirements
Comments: Tax-exempt bonds with an all-in true interest cost of 4.83 percent
Revenue Obligations: 2009 Series C Par Amount: $ 87,040,000 Date Closed: May 20, 2009
Purpose: To finance a portion of the taxable construction for Pee Dee Unit 1, V. C. Summer Units 2 and 3, and New Source Review environmental requirements
Comments: Taxable bonds with an all-in true interest cost of 6.10 percent
Revenue Obligations: 2009 Refunding Series D Par Amount: $ 39,725,000 Date Closed: November 5, 2009
Purpose: Refund the following: 1999 Series A
Comments: Gross savings of $2.3 million over the life of the bonds
Revenue Obligations: 2009 Series E Par Amount: $ 284,845,000 Date Closed: November 5, 2009
Purpose: To finance a portion of the tax-exempt construction for V. C. Summer Units 2 and 3, and extraordinary working capital expenses
Comments: Tax-exempt bonds with an all-in true interest cost of 4.21 percent
Revenue Obligations: 2009 Series F Par Amount: $ 100,000,000 Date Closed: November 5, 2009
Purpose: To finance a portion of the taxable construction for V. C. Summer Units 2 and 3
Comments: Taxable bonds with an all-in true interest cost of 5.82 percent

2011 annual report
20
REPORT OF INdEPENdENT AudITORS
Report of Independent Auditors
The Advisory Board and Board of Directors The South Carolina Public Service Authority Moncks Corner, South Carolina
We have audited the accompanying combined balance sheets of the South Carolina Public Service Authority (a component unit of the state of South Carolina) as of December 31, 2009 and 2008, and the related combined statements of revenues, and expenses and changes in net assets, and cash flows for each of the years then ended. These financial statements are the responsibility of the Authority's management. Our responsibility is to express an opinion on these financial statements based on our audits.
We conducted our audits in accordance with auditing standards generally accepted in the United States of America. Those standards require that we plan and perform the audit to obtain reasonable assurance about whether the financial statements are free of material misstatement. An audit includes consideration of internal control over financial reporting as a basis for designing audit procedures that are appropriate in the circumstances, but not for the purpose of expressing an opinion on the effectiveness of the Authority’s internal control over financial reporting. Accordingly, we express no such opinion. An audit also includes examining, on a test basis, evidence supporting the amounts and disclosures in the financial statements. An audit also includes assessing the accounting principles used and significant estimates made by management, as well as evaluating the overall financial statement presentation. We believe that our audits provide a reasonable basis for our opinion.
In our opinion, the financial statements referred to above present fairly, in all material respects, the financial position of the South Carolina Public Service Authority as of December 31, 2009 and 2008, and the changes in its net assets and its cash flows for each of the years then ended in conformity with accounting principles generally accepted in the United States of America.
The Management’s Discussion and Analysis section listed in the table of contents is not a required part of the basic financial statements but is supplementary information required by the Governmental Accounting Standards Board. We have applied certain limited procedures, which consisted principally of inquiries of management regarding the methods of measurement and presentation of the required supplementary information. However, we did not audit this information and express no opinion thereon.
Our audits were conducted for the purpose of forming an opinion on the basic financial statements taken as a whole. The other information included in the annual report is presented for purposes of additional analysis and is not a required part of the basic financial statements. Such information has not been subjected to the auditing procedures applied in our audits of the basic financial statements and, accordingly, we express no opinion on it.
CHERRY, BEKAERT & HOLLAND, L.L.P.
Raleigh, North Carolina February 25, 2010
The Advisory Board and Board of DirectorsThe South Carolina Public Service AuthorityMoncks Corner, South Carolina
We have audited the accompanying combined balance sheets of the South Carolina Public Service Authority (a component unit
of the state of South Carolina) as of December 31, 2011 and 2010, and the related combined statements of revenues, expenses
and changes in net assets, and cash flows for each of the years then ended. These financial statements are the responsibility of
the Authority’s management. Our responsibility is to express an opinion on these financial statements based on our audits.
We conducted our audits in accordance with auditing standards generally accepted in the United States of America. Those
standards require that we plan and perform the audit to obtain reasonable assurance about whether the financial statements are
free of material misstatement. An audit includes consideration of internal control over financial reporting as a basis for designing
audit procedures that are appropriate in the circumstances, but not for the purpose of expressing an opinion on the
effectiveness of the Authority’s internal control over financial reporting. Accordingly, we express no such opinion. An audit also
includes examining, on a test basis, evidence supporting the amounts and disclosures in the financial statements. An audit also
includes assessing the accounting principles used and significant estimates made by management, as well as evaluating the
overall financial statement presentation. We believe that our audits provide a reasonable basis for our opinion.
As discussed in Note 1, the financial statements present only the South Carolina Public Service Authority and do not purport to,
and do not, present fairly the financial position of the State of South Carolina, as of and for the years ended December 31, 2011
and 2010, and the changes in its financial position and its cash flows for the years then ended in conformity with accounting
principles generally accepted in the United States of America.
In our opinion, the financial statements referred to above present fairly, in all material respects, the financial position of the South
Carolina Public Service Authority as of December 31, 2011 and 2010, and the changes in its net assets and its cash flows for
each of the years then ended in conformity with accounting principles generally accepted in the United States of America.
The Management’s Discussion and Analysis section listed in the table of contents is not a required part of the basic financial
statements but is supplementary information required by the Governmental Accounting Standards Board. We have applied
certain limited procedures, which consisted principally of inquiries of management regarding the methods of measurement
and presentation of the required supplementary information. However, we did not audit this information and express no opinion
thereon.
Our audits were conducted for the purpose of forming an opinion on the basic financial statements taken as a whole. The
Chairman and CEO Letter, Corporate Statistics and Audit Committee Chairman’s Letter as listed in the table of contents of the
annual report are presented for purposes of additional analysis and are not a required part of the basic financial statements.
Such information has not been subjected to the auditing procedures applied in our audits of the basic financial statements and,
accordingly, we express no opinion on it.
CHERRY, BEKAERT & HOLLAND, L.L.P.
Raleigh, North Carolina
February 24, 2012

2011 annual report
21
This page intentionally left blank

2011 annual report
22
2011 2010
(Thousands)
ASSETS
Current assets
Unrestricted cash and cash equivalents $ 84,282 $ 125,308
Unrestricted investments 168,675 130,921
Restricted cash and cash equivalents 137,680 148,119
Restricted investments 171,452 109,340
Receivables, net of allowance for doubtful accounts of $1,380
and $1,510 at December 31, 2011 and 2010, repectively 208,610 200,978
Materials inventory 104,553 98,224
Fuel inventory
Fossil fuels 492,410 430,376
Nuclear fuel - net 83,235 57,456
Interest receivable 2,150 2,398
Prepaid expenses and other current assets 279,961 252,763
Total current assets 1,733,008 1,555,883
Noncurrent assets
Unrestricted cash and cash equivalents 10,374 2,057
Unrestricted investments 96,860 95,967
Restricted cash and cash equivalents 91,648 307,771
Restricted investments 391,199 341,009
Capital assets
Utility plant 6,724,937 6,614,682
Long lived assets - asset retirement cost 33,078 33,078
Accumulated depreciation (2,902,820) (2,719,756)
Total utility plant - net 3,855,195 3,928,004
Construction work in progress 1,230,771 938,254
Other physical property - net 6,783 7,170
Investment in associated companies 9,540 10,769
Regulatory asset - asset retirement obligation 173,984 179,307
Other noncurrent and regulatory assets 64,926 53,942
Deferred debits
Unamortized debt expenses 34,247 35,866
Costs to be recovered from future revenue 211,010 205,023
Other 342,500 301,055
Total noncurrent assets 6,519,037 6,406,194
Total assets $ 8,252,045 $ 7,962,077
The accompanying notes are an integral part of these combined financial statements.
Combined Balance Sheets South Carolina Public Service Authority
As of December 31, 2011 and 2010

2011 annual report
23
Combined Balance Sheets (continued) South Carolina Public Service Authority
As of December 31, 2011 and 2010
2011 2010
(Thousands)
LIABILITIES
Current liabilities
Current portion of long-term debt $ 158,024 $ 369,346
Accrued interest on long-term debt 115,735 113,134
Commercial paper 306,566 159,338
Accounts payable 231,785 266,519
Other current liabilities 90,309 73,158
Total current liabilities 902,419 981,495
Noncurrent liabilities
Construction liabilities 6,634 13,061
Asset retirement obligation liability 347,476 332,279
Total long-term debt (net of current portion) 5,002,926 4,785,274
Unamortized refunding and other costs (11,183) (30,166)
Long-term debt - net 4,991,743 4,755,108
Other deferred credits and noncurrent liabilities 114,042 122,670
Total noncurrent liabilities 5,459,895 5,223,118
Total liabilities 6,362,314 6,204,613
NET ASSETS
Invested in capital assets, net of related debt (202,568) (62,332)
Restricted for debt service 128,338 126,512
Restricted for other 206,764 152,528
Unrestricted 1,757,197 1,540,756
Total net assets 1,889,731 1,757,464
Total liabilities and net assets $ 8,252,045 $ 7,962,077

2011 annual report
24
Combined Statements of Revenues, Expenses and Changes in Net AssetsSouth Carolina Public Service Authority
Years Ended December 31, 2011 and 2010
2011 2010
(Thousands)
Operating revenues
Sale of electricity $ 1,894,371 $ 1,874,821
Sale of water 6,801 6,274
Other operating revenue 13,517 13,807
Total operating revenues 1,914,689 1,894,902
Operating expenses
Electric operating expenses
Production 102,205 95,061
Fuel 920,315 932,553
Purchased and interchanged power 83,062 35,911
Transmission 23,187 20,995
Distribution 10,372 9,649
Customer accounts 15,431 16,181
Sales 4,745 4,996
Administrative and general 82,504 85,023
Electric maintenance expense 121,617 115,620
Water operation expense 2,246 2,104
Water maintenance expense 550 535
Total operation and maintenance expenses 1,366,234 1,318,628
Depreciation and amortization 185,038 185,694
Sums in lieu of taxes 4,890 4,681
Total operating expenses 1,556,162 1,509,003
Operating income 358,527 385,899
Nonoperating revenues (expenses)
Interest and investment revenue 6,345 7,896
Net increase in the fair value of investments (2,868) (4,173)
Interest expense on long-term debt (214,063) (235,253)
Other interest expense (8,667) (9,455)
Costs to be recovered from future revenue 5,987 (26,468)
Other - net 5,662 (3,431)
Total nonoperating revenues (expenses) (207,604) (270,884)
Income before transfers 150,923 115,015
Capital contributions & transfers
Distribution to the State (18,656) (18,514)
Total capital contributions & transfers (18,656) (18,514)
Change in net assets 132,267 96,501
Total net assets-beginning 1,757,464 1,660,963
Total net assets-ending $ 1,889,731 $ 1,757,464
The accompanying notes are an integral part of these combined financial statements.

2011 annual report
25
This page intentionally left blank

2011 annual report
26
2011 2010
(Thousands)
Cash flows from operating activities
Receipts from customers $ 1,907,187 $ 1,846,960
Payments to non-fuel suppliers (471,788) (371,444)
Payments for fuel (912,313) (921,981)
Purchased power (79,657) (35,986)
Payments to employees (158,624) (155,364)
Other receipts (payments) - net 134,285 (280,052)
Net cash provided by operating activities 419,090 82,133
Cash flows from non-capital related financing activities
Distribution to the State of South Carolina (18,656) (18,514)
Net cash used in non-capital related financing activities (18,656) (18,514)
Cash flows from capital-related financing activities
Proceeds from sale of bonds 809,037 870,687
Net commercial paper issuance 147,228 (117,336)
Repayment and refunding of bonds (802,971) (357,070)
Interest paid on borrowings (246,407) (233,395)
Construction and betterments of utility plant (380,543) (220,141)
Debt premium 8,444 4,475
Other - net (47,269) (37,367)
Net cash used in capital-related financing activities (512,481) (90,147)
Cash flows from investing activities
Net (decrease) increase in investments (153,817) 88,891
Interest on investments 6,593 9,671
Net cash (used) provided by investing activities (147,224) 98,562
Net (decrease) increase in cash and cash equivalents (259,271) 72,034
Cash and cash equivalents-beginning 583,255 511,221
Cash and cash equivalents-ending $ 323,984 $ 583,255
The accompanying notes are an integral part of these combined financial statements.
Combined Statements of Cash Flows South Carolina Public Service Authority
Years Ended December 31, 2011 and 2010

2011 annual report
27
Combined Statements of Cash Flows (continued) South Carolina Public Service Authority
Years Ended December 31, 2011 and 2010
2011 2010
(Thousands)
Reconciliation of operating income to net cash provided by operating activities
Operating income $ 358,527 $ 385,899
Adjustments to reconcile operating income to net cash
provided by operating activities
Depreciation and amortization 205,536 203,627
Net power gains involving associated companies (19,934) (15,533)
Distributions from associated companies 17,659 12,006
Advances to associated companies (4) 26
Other income and expense 10,952 514
Changes in assets and liabilities
Accounts receivable - net (7,632) (47,580)
Inventories (68,363) (87,602)
Prepaid expenses (27,198) (208,664)
Other deferred debits (3,815) (59,161)
Accounts payable (55,007) 96,407
Other current liabilities 17,036 (183,727)
Other noncurrent liabilities (8,667) (14,079)
Net cash provided by operating activities $ 419,090 $ 82,133
Composition of cash and cash equivalents
Current
Unrestricted cash and cash equivalents $ 84,282 $ 125,308
Restricted cash and cash equivalents 137,680 148,119
Noncurrent
Unrestricted cash and cash equivalents 10,374 2,057
Restricted cash and cash equivalents 91,648 307,771
Cash and cash equivalents at the end of the year $ 323,984 $ 583,255

2011 annual report
28
NOTES
NOTE 1 - SUMMARY OF SIGNIFICANT ACCOUNTING POLICIES:
A - Reporting Entity - The South Carolina Public Service Authority (the Authority or Santee Cooper), a component unit of
the State of South Carolina, was created in 1934 by the State legislature. The Santee Cooper Board of Directors (Board) is
appointed by the Governor of South Carolina with the advice and consent of the Senate. The purpose of the Authority is to
provide electric power and wholesale water to the people of South Carolina. Capital projects are funded by bonds, commercial
paper, and internally generated funds. As authorized by State law, the Board sets rates charged to customers to pay debt
service and operating expenses and to provide funds required under bond covenants.
B - System of Accounts - The accounting records of the Authority are maintained on an accrual basis in accordance with
accounting principles generally accepted in the United States (GAAP) issued by the Governmental Accounting Standards Board
(GASB) applicable to governmental entities that use proprietary fund accounting and the Financial Accounting Standards Board
(FASB) that do not conflict with rules issued by the GASB. The Authority’s combined financial statements include the accounts
of the Lake Moultrie and Lake Marion Regional Water Systems after elimination of inter-company accounts and transactions.
The accounts are maintained substantially in accordance with the Uniform System of Accounts prescribed by the Federal
Energy Regulatory Commission (FERC) for the electric system and the National Association of Regulatory Utility Commissioners
(NARUC) for the water systems. The Authority also complies with policies and practices prescribed by its Board and practices
common in both industries. As the Board is authorized to set rates, the Authority has historically followed FASB ASC 980.
This standard provides for the reporting of assets and liabilities consistent with the economic effect of the rate structure. The
preparation of financial statements in conformity with accounting principles generally accepted in the United States requires
management to make estimates and assumptions that affect the reported amounts of assets and liabilities and disclosure of
contingent assets and liabilities at the date of the financial statements and the reported amounts of revenues and expenses
during the reporting period. Actual results may differ from those estimates.
C - Reclassifications - To achieve conformity and comparability, the Authority may reclassify certain amounts in prior year
financial statements where applicable.
During 2011, the Authority reviewed its fund assignments, which resulted in reclassifications between Unrestricted and Restricted
categories. For comparative purposes, calendar year 2010 has been restated accordingly.
D - Cash and Cash Equivalents - For purposes of the Combined Balance Sheets and Combined Statements of Cash
Flows, the Authority considers highly liquid investments with original maturities of ninety days or less and cash on deposit with
financial institutions as Restricted and Unrestricted cash and cash equivalents. “Restricted” refers to those funds limited by
law, regulations or Board action as to their allowable disbursement. “Unrestricted” refers to all other funds not meeting the
requirements of restricted.
E - Inventory - Material and fuel inventories are carried at weighted average costs. At the time of issuance or consumption, an
expense is recorded at the weighted average cost.
F - Utility Plant - Utility plant is recorded at cost, which includes materials, labor, overhead and interest capitalized during
construction. Interest is only capitalized when interest payments are funded through borrowings. There was no interest
capitalized in 2011 or 2010. Other interest expense is recovered currently through rates. The costs of maintenance, repairs,
and minor replacements are charged to appropriate operation and maintenance expense accounts. The costs of renewals
and betterments are capitalized. The original cost of utility plant retired and the cost of removal, less salvage, are charged to
accumulated depreciation.

2011 annual report
29
G - Depreciation - Depreciation is computed using composite rates on a straight-line basis over the estimated useful lives of
the various classes of the plant. Composite rates are applied to the net carrying basis of various classes of plant which includes
appropriate adjustments for cost of removal and salvage. The Authority periodically has depreciation studies performed by
independent parties to assist management in establishing appropriate composite depreciation rates.
Annual depreciation provisions, expressed as a percentage of average depreciable utility plant in service, were as follows:
years Ended december 31, 2011 2010
Annual Average Depreciation Percentages 2.8% 2.9%
Note: Depreciation expense includes amortization of property under capitalized leases.
H - Investment in Associated Companies - The Authority is a member of The Energy Authority (TEA). Approximate
ownership interests were as follows:
years Ended december 31, 2011 2010
Members Ownership (%)
City Utilities of Springfield (Missouri) 6.9 6.8
Cowlitz Public Utility District (Washington) 6.9 6.9
Gainsville Regional Utilities (Florida) 6.7 7.4
JEA (Florida) 19.9 21.1
MEAG Power (Georgia) 19.3 19.4
Nebraska Public Power District (Nebraska) 19.5 16.2
Santee Cooper (South Carolina) 20.8 22.2
Total 100.0 100.0
TEA markets wholesale power and coordinates the operation of the generation assets of its members to maximize the efficient
use of electrical energy resources, reduce operating costs and increase operating revenues of the members. TEA is expected
to accomplish the foregoing without impacting the safety and reliability of the electric system of each member. TEA does not
engage in the construction or ownership of generation or transmission assets. In addition, TEA assists members with fuel
hedging activities and acts as an agent in the execution of forward transactions. The Authority accounts for its investment in
TEA under the equity method of accounting.
All of TEA’s revenues and costs are allocated to the members. The following table summarizes the transactions applicable to the
Authority:
years Ended december 31, 2011 2010
(Thousands)
TEA Investment:
Balance as of January 1, $ 10,587 $ 9,519
Reduction to power costs and
increases in electric revenues 16,426 13,074
Less: Distributions from TEA 17,659 12,006
Balance as of December 31, $ 9,354 $ 10,587
Due To / Due From TEA:
Payable to $ 17,856 $ 29,100
Receivable from $ 1,008 $ 5,213

2011 annual report
30
The Authority’s exposure relating to TEA is limited to the Authority’s capital investment, any accounts receivable and trade
guarantees provided by the Authority. These guarantees are within the scope of FASB ASC 952. Upon the Authority making
any payments under its electric guarantee, it has certain contribution rights with the other members in order that payments
made under the TEA member guarantees would be equalized ratably, based upon each member’s equity ownership interest.
After such contributions have been affected, the Authority would only have recourse against TEA to recover amounts paid
under the guarantee. The term of this guarantee is generally indefinite, but the Authority has the ability to terminate its guarantee
obligations by providing advance notice to the beneficiaries thereof. Such termination of its guarantee obligations only applies to
TEA transactions not yet entered into at the time the termination takes effect. The Authority’s support of TEA’s trading activities
is limited based on the formula derived from the forward value of TEA’s trading positions at a point in time. The formula was
approved by the Authority’s Board. At December 31, 2011, the trade guarantees are an amount not to exceed $82.1 million.
The Authority is also a member of Colectric Partners (Colectric). Members and ownership interests were as follows:
years Ended december 31, 2011 2010
Members Ownership (%)
Florida Municipal Power Agency (Florida) N/A N/A
Gainesville Regional Utilities (Florida) N/A N/A
JEA (Florida) 25.0 25.0
MEAG Power (Georgia) 25.0 25.0
Nebraska Public Power District (Nebraska) 25.0 25.0
Orlando Utilities Commission (Florida) N/A N/A
Santee Cooper (South Carolina) 25.0 25.0
Total 100.0 100.0
Colectric provides public power utilities with key project and business management resources. Colectric also specializes in the
development, project management, operations and maintenance of public power utilities’ electric generation facilities and electric
system infrastructure. The members may elect to participate in Colectric initiatives based on individual utility needs.
Currently, the Authority participates in two of Colectric’s initiatives. The first involves managing the major gas turbine overhauls,
thereby promoting the sharing of spare parts and technical expertise. The second initiative is a strategic sourcing initiative,
intended to achieve major cost savings through volume purchasing leverage.
The Authority’s exposure relating to Colectric is limited to its capital investment, any accounts receivable and any
indemnifications related to agreements between Colectric and the Authority. These indemnifications are within the scope of
FASB ASC 952. The Authority’s initial investment in Colectric was $413,000. The balances in its member equity account at
December 31, 2011 and 2010 were approximately $186,000 and $182,000, respectively. Cumulative net direct cost since 2001
has been $3.3 million. Cumulative direct savings for this same period have been $19.7 million.
I - Bond Issuance Costs and Refunding Activity - Unamortized debt discount, premium, and expense are amortized to
income over the terms of the related debt issues. Gains or losses on refunded debt are amortized to income over the shorter of
the remaining life of the refunded debt or the life of the new debt.
J - Revenue Recognition and Fuel Costs - Substantially all wholesale and industrial revenues are billed and recorded
at the end of each month. Revenues for electricity delivered to retail customers but not billed are accrued monthly. Accrued
revenue for retail customers totaled $12.5 million in 2011 and $14.3 million in 2010.

2011 annual report
31
Fuel costs are reflected in operating expenses as fuel is consumed. Fuel expense for all customers is billed utilizing rates and
contracts, the majority of which include fuel adjustment provisions based on either the accrual costs for the previous month or
the actual weighted average costs for the previous three-month period.
K - Payment to the State - The Authority is operated for the benefit of the people of South Carolina (the State) and was
created by Act No. 887 of the Acts of the State of South Carolina for 1934 and acts supplemental thereto and amendatory
thereof (Code of Laws of South Carolina 1976, as amended – Sections 58-31-10 through 58-31-50) (the Act). Nothing in the
Act prohibits the Authority from paying to the State each year up to one percent of its projected operating revenues; as such
revenues would be determined on an accrual basis from the combined electric and water systems. The Authority recognizes the
distributions (shown as “Capital contributions & transfers – Distribution to the State” on the Combined Statements of Revenues,
Expenses and Changes in Net Assets) as a reduction to net assets when paid.
Payments made to the State totaled $18.7 million in 2011 and $18.5 million in 2010.

2011 annual report
32
L - Accounting for Derivative Instruments – In compliance with GASB 53, the annual changes in the fair value of effective
hedging derivative instruments are required to be deferred – reported as deferred inflows and deferred outflows on the balance
sheet. Deferral of changes in fair value generally lasts until the transaction involving the hedged item ends.
Natural gas, a core business commodity input for the Authority, has historically been hedged in an effort to mitigate gas cost risk
by reducing cost volatility and improving cost effectiveness. Unrealized gains and losses related to such activity are deferred in a
regulatory account and recognized in earnings as fuel costs are incurred in the production cycle.
A summary of the Authority’s derivative activity for years ended December 31, 2011 and 2010 is below:
Cash Flow Hedges and Summary of Activity
Years Ended December 31, 2011 2010
Classification (1) (Millions)
Fair Value
Natural Gas Regulatory Assets/Liabilities $ (54.8) $ (23.5)
Crude Oil Regulatory Assets/Liabilities 1.6 5.6
Heating Oil Regulatory Assets/Liabilities 1.5 0.0
Changes in Fair Value
Natural Gas Regulatory Assets/Liabilities $ (31.3) $ (3.1)
Crude Oil Regulatory Assets/Liabilities (4.0) (1.1)
Heating Oil Regulatory Assets/Liabilities 1.5 0.0
Recognized Net Gains (Losses)
Natural Gas Operating Expense-Fuel $ (13.7) $ (10.4)
Crude Oil Operating Expense-Fuel 4.2 4.1
Heating Oil Operating Expense-Fuel (1.0) 0.0
Realized But Not Recognized Net Gains (Losses)
Natural Gas Regulatory Assets/Liabilities $ (3.3) $ (2.7)
Crude Oil Regulatory Assets/Liabilities 0.5 0.7
Heating Oil Regulatory Assets/Liabilities (3.4) 0.0
Notional
MBTUs
Natural Gas 38,830 14,840
Barrels (000s)
Crude Oil 0 319
Gallons (000s)
Heating Oil 10,164 0
(1) The Authority records fair value transactions related to hedging under current and noncurrent sections of the Combined Balance Sheets.

2011 annual report
33
M - Retirement of Long-Lived Assets - The Authority follows the guidance of FASB ASC 410 in regards to
decommissioning of V.C. Summer Nuclear Station and closing of ash ponds. The requirements for both were recorded within
“Capital assets” on the accompanying balance sheets.
The asset retirement obligation (ARO) is adjusted each period for any liabilities incurred or settled during the period, accretion
expense and any revisions made to the estimated cash flows. The following table summarizes the Authority’s transactions:
years Ended december 31, 2011 2010
Nuclear Ash Ponds Total Nuclear Ash Ponds Total
(Millions)
Reconciliation of ARO Liability:
Balance as of January 1, $ 268.3 $ 64.0 $ 332.3 $ 257.0 $ 60.8 $ 317.8
Accretion expense 11.7 3.4 15.1 11.3 3.3 14.6
Balance as of December 31, $ 280.0 $ 67.4 $ 347.4 $ 268.3 $ 64.1 $ 332.4
Asset Retirement Cost (ARC): $ 22.7 $ 10.4 $ 33.1 $ 22.7 $ 10.4 $ 33.1
N - Review of New Accounting Standards
Statement No. GASB 59 Title: Financial Instruments Omnibus
Issue date: June 2010 Effective After: June 15, 2010
Comments: Statement did not have a material effect on the Authority’s financial position, overall cash flow, balances or results of operations.

2011 annual report
34
O - Issued But Not Yet Effective Pronouncements
Statement No. GASB 60 Title: Accounting and Financial Reporting for Service Concession Arrangements
Issue date: November 2010 Effective After: December 15, 2011
Comments: Statement is not expected to have a material effect on the Authority’s financial position, overall cash flow, balances or results of operations.
Statement No. GASB 61 Title: The Financial Reporting Entity: Omnibus-an amendment of GASB Statements No. 14 and No. 34
Issue date: November 2010 Effective After: June 15, 2012
Comments: Statement is not expected to have a material effect on the Authority’s financial position, overall cash flow, balances or results of operations.
Statement No. GASB 62 Title: Codification of Accounting and Financial Reporting Guidance Contained in Pre-November 30, 1989 FASB and AICPA Pronouncements
Issue date: december 2010 Effective After: December 15, 2011
Comments: Statement is not expected to have a material effect on the Authority’s financial position, overall cash flow, balances or results of operations.
Statement No. GASB 63 Title: Financial Reporting of deferred Outflows of Resources, deferred Inflows of Resources, and Net Position
Issue date: June 2011 Effective After: December 15, 2011
Comments: Statement is not expected to have a material effect on the Authority’s financial position, overall cash flow, balances or results of operations.
Statement No. GASB 64 Title: derivative Instruments: Application of Hedge Accounting Termination Provisions - an amendment of GASB Statement No. 53
Issue date: June 2011 Effective After: June 15, 2011
Comments: Statement is not expected to have a material effect on the Authority’s financial position, overall cash flow, balances or results of operations.
NOTE 2 – COSTS TO BE RECOVERED FROM FUTURE REVENUE:
The Authority’s electric and water rates are established based upon debt service and operating fund requirements. Depreciation
is not considered in the cost of service calculation used to design rates. In accordance with FASB ASC 980, the differences
between debt principal maturities (adjusted for the effects of premiums, discounts, expenses and amortization of deferred gains
and losses) and depreciation on debt financed assets are recognized as costs to be recovered from future revenue (CTBR). The
recovery of outstanding amounts recorded as CTBR will coincide with the repayment of the applicable outstanding debt. The
Authority’s summary of CTBR activity is recapped below:
years Ended december 31, 2011 2010
(Millions)
CTBR Regulatory Asset:
Balance as of December 31 $ 211.0 $ 205.0
CTBR Expense/(Reduction to Expense):
Net Expense for Year Ended December 31 $ (6.0) $ 26.5

2011 annual report
35
NOTE 3 – CAPITAL ASSETS:
Capital asset activity for the years ended December 31, 2011 and 2010 was as follows:
Beginning Balances Increases decreases Ending Balances
yEAR 2011
(Thousands)
utility Plant $ 6,614,682 $ 121,791 $ (11,536) $ 6,724,937
Long lived-assets retirement cost 33,078 0 0 33,078
Accumulated depreciation (2,719,756) (194,587) 11,523 (2,902,820)
Total utility plant-net 3,928,004 (72,796) (13) 3,855,195
Construction work in progress 938,254 414,407 (121,890) 1,230,771
Other physical property-net 7,170 96 (483) 6,783
Totals $ 4,873,428 $ 341,707 $ (122,386) $ 5,092,749
YEAR 2010
(Thousands)
Utility Plant $ 6,494,365 $ 154,814 $ (34,497) $ 6,614,682
Long lived-assets retirement cost 33,078 0 0 33,078
Accumulated depreciation (2,564,325) (189,928) 34,497 (2,719,756)
Total utility plant-net 3,963,118 (35,114) 0 3,928,004
Construction work in progress 851,442 248,522 (161,710) 938,254
Other physical property-net 2,583 4,587 0 7,170
Totals $ 4,817,143 $ 217,995 $ (161,710) $ 4,873,428
In 2010, the Authority’s Board cancelled the construction of the units planned for the Pee Dee site. As of December 31, 2011
and 2010, the related construction charges were reclassified from Construction work in progress to “Prepaid expenses and other
current assets” and “Deferred debts-other” on the Combined Balance Sheets. The Authority is confident certain assets are
marketable and can be sold. Currently, the Authority cannot determine how much will be recovered through the sale of assets
originally purchased for those units. The Authority’s Board has determined unrecovered costs associated with Pee Dee will be
recovered through customer rates. In addition, the Authority plans to apply the unspent bond proceeds for Pee Dee as well as
any proceeds received from the sale of certain Pee Dee assets to reduce borrowings on other capital projects.

2011 annual report
36
NOTE 4 – CASH AND INVESTMENTS HELD BY TRUSTEE:
Cash and investments as of December 31, 2011 and 2010 are classified in the accompanying financial statements as follows:
Combined Balance Sheets
years Ended december 31, 2011 2010
(Thousands)
Current assets
Unrestricted cash and cash equivalents $ 84,282 $ 125,308
Unrestricted investments 168,675 130,921
Restricted cash and cash equivalents 137,680 148,119
Restricted investments 171,452 109,340
Noncurrent assets
Unrestricted cash and cash equivalents 10,374 2,057
Unrestricted investments 96,860 95,967
Restricted cash and cash equivalents 91,648 307,771
Restricted investments 391,199 341,009
Total cash and investments $ 1,152,170 $ 1,260,492
Cash and investments as of December 31 consist of the following:
Cash/Deposits $ 121,102 $ 42,599
Investments 1,031,068 1,217,893
Total cash and investments $ 1,152,170 $ 1,260,492
Unexpended funds from the sale of bonds, debt service funds, other special funds cash and investments are held and
maintained by custodians and trustees. Their use is designated in accordance with applicable provisions of various bond
resolutions, lease agreements, and the Enabling Act included in the South Carolina Code of Laws (the Enabling Act).
The Authority’s investments are authorized by the Enabling Act, the Authority’s investment policy and the Revenue Obligation
Resolution. Authorized investment types include Federal Agency Securities, State of South Carolina General Obligation
Bonds, and U.S. Treasury Obligations, all of which are limited to a ten year maximum maturity in all portfolios, except the
Decommissioning Funds. Certificate of Deposits and Repurchase Agreements are also authorized with a maximum maturity of
one year.
All equity and debt securities are recorded at their fair value with gains and losses in fair value reflected as a component of non-
operating income in the Combined Statements of Revenues, Expenses and Changes in Net Assets.

2011 annual report
37
Following is a summary of the Authority’s investment activity:
years Ended december 31, 2011 2010
Total Portfolio (Billions)
Total Investments $ 1.0 $ 1.2
Purchases 37.9 43.2
Sales 38.1 43.2
Nuclear decommissioning Portfolios (1) (Millions)
Total Investments $ 186.7 $ 166.2
Purchases 772.4 1,000.0
Sales 771.2 1,000.0
Unrealized Holding Gains 27.4 15.3
(1) Realized and unrealized earnings are credited to the “Regulatory asset-Asset retirement obligation”.
Repurchase Agreements (2) (Millions)
Balance at December 31 $ 142.6 $ 410.1
(2) Securities underlying repurchase agreements must have a market value of at least 102 percent of the cost of the repurchase agreement and are delivered by broker/dealers to the Authority’s custodial agents.

2011 annual report
38
Common deposit and investment risks related to credit risk, custodial credit risk, concentration of credit risk, interest rate risk
and foreign currency risk are as follows:
Risk Type Exposure
Credit Risk - Risk that an issuer of an investment will not fulfill its obligation to the holder of the investments. Measured by the assignment of rating by a nationally recognized statistical rating organization.
As of December 31, 2011 and 2010, all of the agency securities held by the Authority were rated AAA by Fitch Ratings, Aaa by Moody’s Investors Service, Inc, and AA+ by Standard & Poor’s Rating Services.
Custodial Credit Risk-Investments - Risk that, in the event of the failure of the counterparty to a transaction, an entity will not be able to recover the value of its investment or collateral securities that are in the possession of another party.
As of December 31, 2011 and 2010, all of the Authority’s investment securities were held by the Trustee or Agent of the Authority and therefore there was no custodial risk for investment securities.
Custodial Credit Risk-deposits - Risk that, in the event of the failure of a depository financial institution, an entity will not be able to recover its deposits or will not be able to recover collateral securities that are in the possession of an outside party.
At December 31, 2011 and 2010, the Authority had exposure to custodial credit risk for deposits as follows:
depository Account Type
Bank Balance
years Ended december 31, 2011 2010
(Thousands)
Uninsured and collateral held by Bank’s agent not in Authority’s name $ 500 $ 750
Concentration of Credit Risk - The investment policy of the Authority contains no limitations on the amount that can be invested in any one issuer.
Investments in any one issuer (other than U. S. Treasury securities) that represent five percent or more of total Authority investments at December 31, 2011 and 2010 were as follows:
Security Type / Issuer Fair Value
2011 2010
Federal Agency Fixed Income Securities (Thousands)
Federal Home Loan Bank $ 368,948 $ 327,931
Federal National Mortgage Association 178,207 225,204
Federal Farm Credit Bank 118,138 75,336
Federal Home Loan Mortgage Corp 133,009 112,610
Interest Rate Risk - Risk that changes in market interest rates will adversely affect the fair value of an investment. Generally, the longer the maturity of an investment, the greater the sensitivity of its fair value to changes in market interest rates.
The Authority manages its exposure to interest rate risk by investing in securities that mature as necessary to provide the cash flow and liquidity needed for operations. The following table shows the distribution of the Authority’s investments by maturity at December 31, 2011 and 2010:
2011 2010
Investment Type:Fair Value
(Thousands)Weighted Average maturity (years)
Fair Value (Thousands)
Weighted Average Maturity (Years)
Certificates of Deposits $ 1,450 0.24 $ 1,800 0.24
Federal Agency Discount Notes 232,184 0.09 269,127 0.11
Federal Agency Securities 589,492 2.75 491,916 3.86
Repurchase Agreements 142,579 0.01 410,068 0.01
U.S. Treasury Notes and Strips 65,363 6.03 44,982 6.18
Total $ 1,031,068 $ 1,217,893
Portfolio Weighted Average Maturity 1.80 1.78
The Authority holds zero coupon bonds which are highly sensitive to interest rate fluctuations in both the Nuclear Decommissioning Trust and Nuclear Decommissioning Fund. Together these accounts hold $66.9 million par in U.S. Treasury Strips ranging in maturity from February 15, 2012 to May 15, 2039. They also hold $56.9 million par in government agency zero coupon securities (i.e. Resolution Corp, FNMA, FICO and REFCORP Securities) in the two portfolios ranging in maturity from November 15, 2014 to April 15, 2030. Zero coupon bonds or U.S. Treasury Strips are subject to wider swings in their market value than coupon bonds. These portfolios are structured to hold these securities to maturity or early redemption. The Authority has a buy and hold strategy for these portfolios. Based on the Authority’s current decommissioning assumptions, it is anticipated that no funds will be needed any earlier than 2043. The Authority has no other investments that are highly sensitive to interest rate fluctuations.
Foreign Currency Risk - Risk exists when there is a possibility that changes in exchange rates could adversely affect investment or deposit fair market value.
The Authority is not authorized to invest in foreign currency and therefore has no exposure.

2011 annual report
39
This page intentionally left blank

2011 annual report
40
NOTE 5 – LONG-TERM DEBT OUTSTANDING:
The Authority’s long-term debt at December 31, 2011 and 2010 consisted of the following:
2011 2010 Interest Rate(s) (1) Call Price (1)
(Thousands) (%) (%)
Capitalized Lease Obligations: (mature through 2014) $ 2,469 $3,914 5.00 N/A
Revenue Obligations: (mature through 2050)
1999 Taxable Series B 4,745 43,135 7.32-7.42 Non-callable
2001 Improvement Series A 2,565 2,565 5.00 Non-callable
2002 Refunding Series A 61,505 71,615 5.125-5.50 101
2002 Tax-exempt Series B 7,175 141,890 5.375 100
2002 Refunding Series D 200,635 215,425 5.00-5.25 100
2003 Refunding Series A 335,030 335,030 4.75-5.00 100
2004 Tax-exempt Series A 94,575 386,905 4.375-5.00 100
2004 Taxable Series B 12,220 14,970 4.17-4.52 P&I Plus Make-Whole Premium
2004 Series M - CIBS 19,049 19,140 4.25-4.90 100
2004 Series M - CABS 10,400 10,090 4.375-5.00 Accreted Value
2005 Refunding Series A 125,295 125,295 5.25-5.50 100
2005 Refunding Series B 240,995 251,250 5.00 100
2005 Refunding Series C 78,150 78,150 4.125-4.75 100
2005 Series M - CIBS 10,664 10,681 3.65-4.35 100
2005 Series M - CABS 5,547 5,341 4.00-4.35 Accreted Value
2006 Tax-exempt Series A 446,540 449,705 3.50-5.00 100
2006 Taxable Series B 83,250 96,250 4.95-5.05 P&I Plus Make-Whole Premium
2006 Series M - CIBS 7,074 7,113 3.75-4.20 100
2006 Series M - CABS 3,135 3,022 4.00-4.20 Accreted Value
2006 Refunding Series C 114,755 114,755 4.00-5.00 100
2007 Series A 311,350 324,535 4.00-5.00 100
2007 Refunding Series B 97,970 97,970 4.00-5.00 Non-callable
2008 Tax-exempt Series A 396,985 401,985 5.00-5.75 100
2008 Taxable Series B 260,000 260,000 6.808-8.368 P&I Plus Make-Whole Premium
2008 Series M - CIBS 18,710 18,732 3.00-4.80 100
2008 Series M - CABS 6,273 6,112 3.80-4.80 Accreted Value
2009 Tax-exempt Refunding Series A 101,750 112,410 2.00-5.00 100
2009 Tax-exempt Series B 163,220 164,130 4.00-5.25 100
2009 Taxable Series C 87,040 87,040 3.72-6.224 P&I Plus Make-Whole Premium
2009 Tax-exempt Refunding Series D 21,375 39,725 3.00-5.00 Non-callable
2009 Tax-exempt Series E 284,845 284,845 3.00-5.00 100
2009 Taxable Series F 100,000 100,000 5.74 P&I Plus Make-Whole Premium

2011 annual report
41
The Authority’s long-term debt at December 31, 2011 and 2010 consisted of the following (continued):
2011 2010 Interest Rate(s) (1) Call Price (2)
(Thousands) (%) (%)
2010 Series M1 - CIBS 20,569 20,584 1.35-4.30 100
2010 Series M1 - CABS 7,589 7,322 3.50-4.30 Accreted Value
2010 Taxable Series A (LIBOR Index Bonds) 0 234,861 N/A N/A
2010 Refunding Series B 231,060 231,060 3.00-5.00 100
2010 Series M2 - CIBS 12,153 12,161 1.60-3.875 100
2010 Series M2 - CABS 5,066 4,907 2.875-3.875 Accreted Value
2010 Series C (Build America Bonds) (3) 360,000 360,000 6.454 P&I Plus Make-Whole Premium
2011 Series M1 - CIBS 20,625 0 2.00-4.80 100
2011 Series M1 - CABS 5,694 0 3.50-4.80 Accreted Value
2011 Taxable Series A (LIBOR Index Bonds) 336,632 0 1 Month LIBOR plus 0.38-0.70
100
2011 Refunding Series B 288,515 0 4.00-5.00 Non-callable
2011 Refunding Series C 135,855 0 4.375-5.00 100
2011 Series M2 - CIBS 17,205 0 1.40-4.20 100
2011 Series M2 - CABS 4,696 0 2.70-4.20 Accreted Value
Total Revenue Obligations 5,158,481 5,150,706
Less: Current Portion - Long-term debt 158,024 369,346
Total Long-term debt - (Net of current portion) $ 5,002,926 $4,785,274
(1) Interest rates apply only to bonds remaining outstanding as of December 31, 2011.(2) Call Price may only apply to certain maturities outstanding at December 31, 2011.(3) These bonds were issued as “Build America Bonds” under the American Recovery and Reinvestment Act of 2009 and are eligible to receive an interest subsidy payment from the United States Department of Treasury in an amount equal to 35% of interest payable on the bonds.

2011 annual report
42
Long-term debt (LTd) activity for the years ended december 31, 2011 and 2010 was as follows:
Gross LTD Beginning Balances Increases Decreases
Gross LTD Ending Balances
Current Portion LTD
Net LTD Ending Balances
yEAR 2011
(Thousands)
Capitalized Lease Obligations $ 3,914 $ 0 $ (1,445) $ 2,469 $ 1,243 $ 1,226
Revenue Obligations 5,150,706 810,745 (802,970) 5,158,481 156,781 5,001,700
Totals $ 5,154,620 $ 810,745 $ (804,415) $ 5,160,950 $ 158,024 $ 5,002,926
YEAR 2010
(Thousands)
Capitalized Lease Obligations $ 5,599 $ 0 $ (1,685) $ 3,914 $ 1,444 $ 2,470
Revenue Obligations 4,635,833 871,944 (357,071) 5,150,706 367,902 4,782,804
Totals $ 4,641,432 $ 871,944 $ (358,756) $ 5,154,620 $ 369,346 $ 4,785,274
maturities and projected interest payments of long-term debt are as follows:
PRINCIPAL INTEREST
CapitalizedLease
ObligationsRevenue
ObligationsTotal
Principal
CapitalizedLease
ObligationsRevenue
Obligations (2)Total
Interest (2) TOTAL
Year Ending Decem-ber 31,
(Thousands)
2012 (1) $ 1,243 $ 148,259 $ 149,502 $ 100 $ 250,266 $ 250,366 $ 399,868
2013 (1) 982 324,681 325,663 41 242,291 242,332 567,995
2014 (1) 244 587,277 587,521 7 222,443 222,450 809,971
2015 0 227,420 227,420 0 202,908 202,908 430,328
2016 0 254,794 254,794 0 194,083 194,083 448,877
2017-2021 0 1,149,992 1,149,992 0 796,480 796,480 1,946,472
2022-2026 0 595,463 595,463 0 575,347 575,347 1,170,810
2027-2031 0 643,705 643,705 0 432,383 432,383 1,076,088
2032-2036 0 574,090 574,090 0 270,416 270,416 844,506
2037-2041 0 289,680 289,680 0 140,544 140,544 430,224
2042-2046 0 123,120 123,120 0 122,059 122,059 245,179
2047-2050 0 240,000 240,000 0 17,425 17,425 257,425
Total $ 2,469 $ 5,158,481 $ 5,160,950 $ 148 $ 3,466,645 $ 3,466,793 $ 8,627,743
(1) Years 2012 - 2014 interest includes projected interest for 2011 Taxable Series A (LIBOR Index Bonds).(2) Does not reflect impact of subsidy interest payments on 2010 Series C (Build America Bonds).
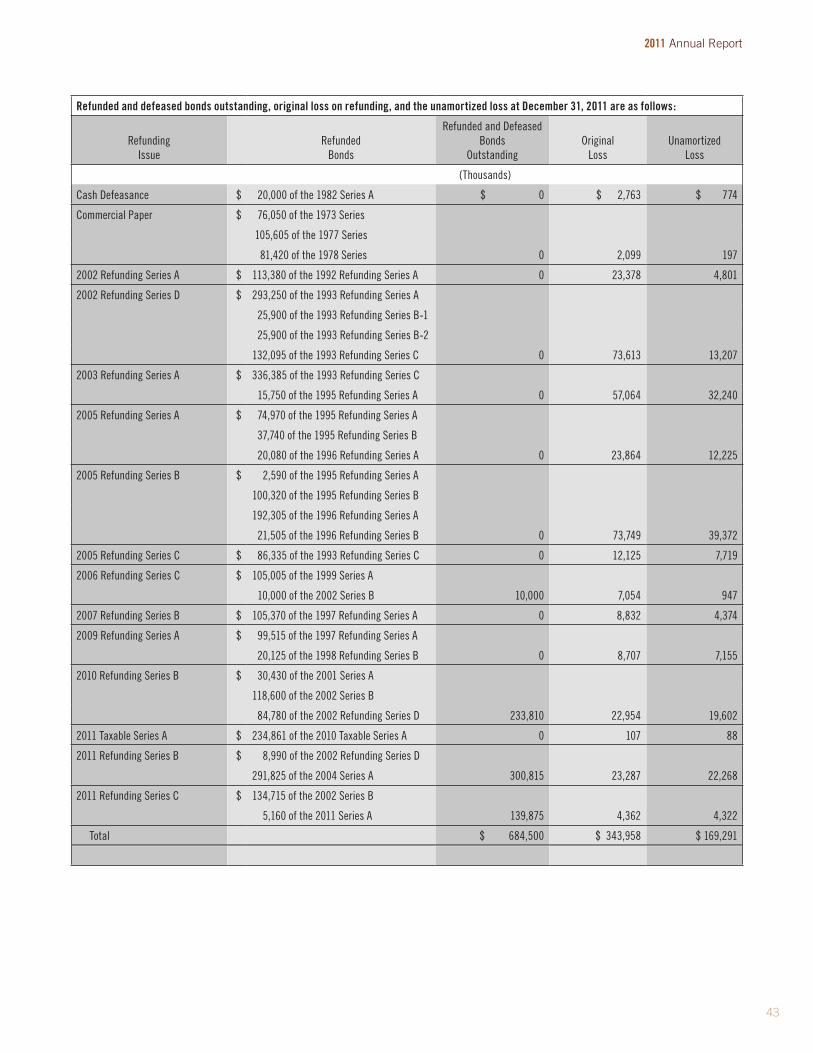
2011 annual report
43
Refunded and defeased bonds outstanding, original loss on refunding, and the unamortized loss at december 31, 2011 are as follows:
RefundingIssue
RefundedBonds
Refunded and Defeased Bonds
OutstandingOriginal
LossUnamortized
Loss
(Thousands)
Cash Defeasance $ 20,000 of the 1982 Series A $ 0 $ 2,763 $ 774
Commercial Paper $ 76,050 of the 1973 Series
105,605 of the 1977 Series
81,420 of the 1978 Series 0 2,099 197
2002 Refunding Series A $ 113,380 of the 1992 Refunding Series A 0 23,378 4,801
2002 Refunding Series D $ 293,250 of the 1993 Refunding Series A
25,900 of the 1993 Refunding Series B-1
25,900 of the 1993 Refunding Series B-2
132,095 of the 1993 Refunding Series C 0 73,613 13,207
2003 Refunding Series A $ 336,385 of the 1993 Refunding Series C
15,750 of the 1995 Refunding Series A 0 57,064 32,240
2005 Refunding Series A $ 74,970 of the 1995 Refunding Series A
37,740 of the 1995 Refunding Series B
20,080 of the 1996 Refunding Series A 0 23,864 12,225
2005 Refunding Series B $ 2,590 of the 1995 Refunding Series A
100,320 of the 1995 Refunding Series B
192,305 of the 1996 Refunding Series A
21,505 of the 1996 Refunding Series B 0 73,749 39,372
2005 Refunding Series C $ 86,335 of the 1993 Refunding Series C 0 12,125 7,719
2006 Refunding Series C $ 105,005 of the 1999 Series A
10,000 of the 2002 Series B 10,000 7,054 947
2007 Refunding Series B $ 105,370 of the 1997 Refunding Series A 0 8,832 4,374
2009 Refunding Series A $ 99,515 of the 1997 Refunding Series A
20,125 of the 1998 Refunding Series B 0 8,707 7,155
2010 Refunding Series B $ 30,430 of the 2001 Series A
118,600 of the 2002 Series B
84,780 of the 2002 Refunding Series D 233,810 22,954 19,602
2011 Taxable Series A $ 234,861 of the 2010 Taxable Series A 0 107 88
2011 Refunding Series B $ 8,990 of the 2002 Refunding Series D
291,825 of the 2004 Series A 300,815 23,287 22,268
2011 Refunding Series C $ 134,715 of the 2002 Series B
5,160 of the 2011 Series A 139,875 4,362 4,322
Total $ 684,500 $ 343,958 $ 169,291

2011 annual report
44
The fair value of the Authority’s debt is estimated based on quoted market prices for the same or similar issues or on the current
rates offered to the Authority for debt with the same remaining maturities. Based on the borrowing rates currently available
to the Authority for debt with similar terms and average maturities, the fair value of debt was $5.7 billion and $5.5 billion at
December 31, 2011 and 2010, respectively.
Bond market transactions for the year ended December 31, 2011 were as follows:
Revenue Obligations, 2011 Series m1 Par Amount: $26,161,900 date Authorized: may 1, 2011
Summary: - Issued Current Interest Bearing Bonds in $500 denominations and Capital Appreciation Bonds in $200 denominations
- Issued directly by the Authority to residents of the State, customers of the Authority, members of electric cooperatives
organized under the laws of the State, and electric customers of the City of Bamberg and City of Georgetown
- Interest rates range from 2.00 percent in 2016 to 4.80 percent in 2031
Revenue Obligations, 2011 Refunding Series B Par Amount: $288,515,000 date Authorized: Aug 19, 2011
Summary: - Reduced the Authority’s total debt service over the life of its bonds by approximately $23.8 million
- Resulted in an economic gain of approximately $22.6 million
- Issued Sep 1, 2011 at an aggregate all-in true interest cost of 2.27 percent
- Maturities are between Dec 1, 2013 and Dec 1, 2021
Revenue Obligations, 2011 Series C Par Amount: $135,855,000 date Authorized: Sep 14, 2011
Summary: - Reduced the Authority’s total debt service over the life of its bonds by approximately $9.4 million
- Resulted in an economic gain of approximately $7.7 million
- Issued Oct 11, 2011 at an aggregate all-in true interest cost of 4.63 percent
- Maturities are between Dec 1, 2033 and Dec 1, 2036
Revenue Obligations, 2011 Series m2 Par Amount: $21,873,500 date Authorized: Nov 1, 2011
Summary: - Issued Current Interest Bearing Bonds in $500 denominations and Capital Appreciation Bonds in $200 denominations
- Issued directly by the Authority to residents of the State, customers of the Authority, members of electric cooperatives
organized under the laws of the State, and electric customers of the City of Bamberg and City of Georgetown
- Interest rates range from 1.40 percent in 2016 to 4.20 percent in 2031

2011 annual report
45
As of December 31, 2011 and 2010, the Authority was in compliance with all debt covenants. The Authority’s bond indentures
provide for certain restrictions, the most significant of which are:
(1) the Authority covenants to establish rates sufficient to pay all debt service, required lease payments, capital
improvement fund requirements and all costs of operation and maintenance of the Authority’s electric and water
systems and all necessary repairs, replacements and renewals thereof; and
(2) the Authority is restricted from issuing additional parity bonds unless certain conditions are met.
All Authority debt (Electric and Water Systems) issued pursuant to the Revenue Obligation Resolution is payable solely from and
secured by a lien upon and pledge of the applicable Electric and Water Revenues of the Authority. Revenue Obligations are
senior to:
(1) payment of expenses for operating and maintaining the System; and
(2) payments for debt service on Capitalized Leases and payments made into the Capital Improvement Fund.
Bonds Outstanding Summary As of december 31, 2011
Outstanding Revenue Obligations $5.2 Billion
Estimated Remaining Interest Payments $3.5 Billion
Years of Issuance (Inclusive) Between 1999 and 2011
Year for Maturities (Inclusive) Between 2012 and 2050
Note: Proceeds from these bonds were/will be used to fund a portion of the Authority’s ongoing capital program or retire or refund certain outstanding debt of the Authority.
NOTE 6 – VARIABLE RATE DEBT:
The Board has authorized the issuance of variable rate debt not to exceed 20 percent of the aggregate Authority debt
outstanding (including commercial paper notes) as of the last day of the most recent fiscal year for which audited financial
statements of the Authority are available. The lien and pledge of Revenues securing variable rate debt issued as Revenue
Obligations is senior to that securing commercial paper notes.
On June 10, 2011, the Authority’s Board authorized the sale of approximately $336.6 million Revenue Obligations, 2011 Series A
(LIBOR Index Bonds) (2011A Bonds). The 2011A Bonds were issued June 23, 2011 and will bear interest from their delivery date
and will be payable on the first business day of each month. The 2011A Bonds will mature on December 3, 2012, July 1, 2013,
and June 2, 2014. The interest rate is variable and is set monthly based on the London Interbank Offered Rate (LIBOR) plus 38
basis points, 50 basis points, and 70 basis points, respectively.
Commercial paper is issued for valid corporate purposes with a term not to exceed 270 days. The information related to
commercial paper was as follows:
Years Ended December 31, 2011 2010
Commercial Paper Notes Outstanding (000’s) $ 306,566 $ 159,338
Effective interest rate (at December 31) 0.19% 0.30%
Average annual amount outstanding (000’s) $ 250,982 $ 251,916
Average maturity 62 days 69 Days
Average annual effective interest rate 0.24% 0.36%

2011 annual report
46
At December 31, 2011, the Authority had Revolving Credit Agreements with Wells Fargo Bank, N.A., J. P. Morgan Chase
Bank, N.A., and United States Bank, N.A. totaling $500.0 million. At December 31, 2010, the Authority had Revolving Credit
Agreements with Wells Fargo Bank, N.A. and J.P. Morgan Chase Bank, N.A. totaling $375.0 million. These agreements are used
to support the Authority’s issuance of commercial paper. There were no borrowings under the agreements during 2011 or 2010.
NOTE 7 - SUMMER NUCLEAR STATION:
The Authority and South Carolina Electric and Gas (SCE&G) are parties to a joint ownership agreement providing that the
Authority and SCE&G shall own Unit 1 at the Summer Nuclear Station with undivided interests of 33 1/3 percent and 66
2/3 percent, respectively. SCE&G is solely responsible for the design, construction, budgeting, management, operation,
maintenance and decommissioning of Unit 1 and the Authority is obligated to pay its ownership share of all costs relating
thereto. The Authority receives 33 1/3 percent of the net electricity generated. In 2004, the NRC granted a twenty-year extension
to the operating license for Unit 1, extending it to August 6, 2042.
Authority’s Share of V. C. Summer Station - unit 1
Years Ended December 31, 2011 2010
(Millions)
Plant Balances Before Depreciation $ 529.3 $ 529.4
Accumulated Depreciation 314.7 306.8
Share of Operation & Maintenance Expense 76.1 71.9
Nuclear fuel costs are being amortized based on energy expended using the unit-of-production method. Costs include a
component for estimated disposal expense of spent nuclear fuel. This amortization is included in fuel expense and recovered
through the Authority’s rates.
In 2002, SCE&G commenced a re-racking project of the on-site spent fuel pool. The new pool storage capability will permit full
core off-load through 2017. SCE&G has signed contracts with HOLTEC International, SHAW Group, and Westinghouse Electric
Company, Inc. (Westinghouse) to build a licensed Independent Spent Fuel Storage Installation (ISFSI) to commence receiving
fuel in 2015.
The Nuclear Regulatory Commission (NRC) requires a licensee of a nuclear reactor to provide minimum financial assurance of
its ability to decommission its nuclear facilities. In compliance with the applicable NRC regulations, the Authority established
an external trust fund and began making deposits into this fund in September 1990. In addition to providing for the minimum
requirements imposed by the NRC, the Authority makes deposits into an internal fund in the amount necessary to fund the
difference between a site-specific decommissioning study completed in 2006 and the NRC’s imposed minimum requirement.
Based on these estimates, the Authority’s one-third share of the estimated decommissioning costs of Unit 1 equals $178.9
million in 2006 dollars. As deposits are made, the Authority debits FERC account 532 - Maintenance of Nuclear Plant, an
amount equal to the deposits made to the internal and external trust funds. These costs are recovered through the Authority’s
rates. Based on current decommissioning cost estimates, these funds, which totaled approximately $186.7 million (adjusted
to market) at December 31, 2011, along with future deposits into both the external and internal decommissioning accounts and
investment earnings, are expected to provide sufficient funds for the Authority’s one-third share of the total decommissioning
costs.
The Authority and SCE&G plan to construct and operate two additional nuclear generating units (Summer 2 and Summer 3)
at V.C. Summer Nuclear Station and submitted an application for a combined Construction and Operating License (COL) for
the two new units to the NRC in March 2008. On May 22, 2008, the Authority’s Board authorized the Authority to execute

2011 annual report
47
a Limited Agency Agreement appointing SCE&G to act as the Authority’s agent in connection with the performance of an
Engineering, Procurement, and Construction (EPC) Agreement. On May 23, 2008, SCE&G, acting for itself and as agent for the
Authority, entered into an EPC Agreement with Westinghouse and Stone & Webster, Inc. for the engineering, procurement, and
construction of two 1100 MW nuclear generating units.
On October 20, 2011, the Authority and SCE&G entered into a Design and Construction Agreement. Among other things, the
Design and Construction Agreement allows either or both parties to withdraw from the project under certain circumstances.
Also on October 20, 2011, the Authority and SCE&G entered into an Operating and Decommissioning Agreement with respect
to the two units. Both the Design and Construction Agreement and the Operating and Decommissioning Agreement define the
conditions under which the Authority or SCE&G may convey an undivided ownership interest in the new units to a third party.
Together the Design and Construction Agreement and the Operating and Decommissioning Agreement provide for a 45 percent
ownership interest by the Authority in each of the two new units and replace the Amended and Restated Bridge Agreement
which had governed the relationship between the Authority and SCE&G. The Authority’s Board has authorized the Authority to
expend up to $1.9 billion through 2012 to fund the Authority’s share of the EPC Agreement and associated Owner’s Costs of the
project.
As part of its Capital Improvement Program, the Authority has evaluated its level of participation in the new units and due to
developments since initiation of the project, the Authority is taking actions necessary to reduce its 45 percent ownership interest.
Beginning in 2011, the Authority deferred the portion of interest expense representing the amount related to the assumed
ownership reduction.
The Authority expects to receive the COL in early 2012 and anticipates that the nuclear units will each take almost five years from
the date of the COL to construct and will go into service on a staggered basis.
NOTE 8 – LEASES:
The Authority has remaining capital lease contracts with Central Electric Power Cooperative, Inc. (Central), covering transmission
and various other facilities. The remaining lease terms range from one to three years. Quarterly lease payments are based on a
sum equal to the interest on and principal of Central’s indebtedness to the Rural Utilities Service for funds borrowed to construct
the above mentioned facilities. The Authority has options to purchase the leased properties at any time during the period of the
lease agreements for sums equal to Central’s indebtedness remaining outstanding on the properties at the time the options are
exercised or to return the properties at the termination of the lease. The Authority plans to exercise each and every option to
acquire ownership of such facilities prior to expiration of the leases.
Future minimum lease payments on Central leases at December 31, 2011 are as follows:
Year Ending December 31, (Thousands)
2012 $ 1,343
2013 1,023
2014 251
Total minimum lease payments 2,617
Less amounts representing interest 148
Principal payments $ 2,469

2011 annual report
48
Information related to property under capital leases and operating lease payments follows:
Years Ended December 31, 2011 2010
(Millions)
Property under Capital Leases:
Property Balances $ 20.5 $ 27.5
Accumulated Depreciation 17.7 25.8
Operating Lease Payments (1) 4.5 4.9
(1) Includes periodic leased coal car expenses which are initially reflected in fuel inventory and subsequently reported in fuel expense based on tons burned.
Expiration Terms of Current Coal Car Leases: July 2012
February 2014
maximum Amounts for Coal Car Leases: Year 2012 $ 1.3 Million
Year 2013 $ 445,200
Year 2014 $ 74,200
Hydro Electric Generating Facility Lease: - Automatically extended for five-year periods - May be terminated by either party by giving a two-year notice - Obligation is $600,000 per year plus operating expenses
NOTE 9 – CONTRACTS WITH ELECTRIC POWER COOPERATIVES:
Central is a generation and transmission cooperative that provides wholesale electric service to each of the 20 distribution
cooperatives which are members of Central. Power supply and transmission services are provided to Central in accordance
with a power system coordination and integration agreement (the Coordination Agreement). Under this agreement, the Authority
is the sole supplier of energy needs for Central, excluding energy Central receives from the Southeastern Power Administration
(SEPA), small amounts provided by Broad River Electric Cooperative’s ownership interest in a small run of the river hydroelectric
plant and small amounts purchased from others.
Central, under the terms of the Coordination Agreement, has the right to audit costs billed to them through the cost of service.
Any differences found as a result of this process are accrued if they are probable and estimable. To the extent that differences
arise, prospective adjustments are made to the cost of service and are reflected in operating revenues in the accompanying
Combined Statements of Revenues, Expenses and Changes in Net Assets. Such adjustments in 2011 and 2010 were not
material to the Authority’s overall operating revenue.
In September 2009, the Authority and Central entered into an agreement which, among other things, would permit Central to
purchase the electric power and energy requirements necessary to serve five of its member cooperatives located in the upper
part of the State that were formerly members of Saluda: Blue Ridge Electric Cooperative, Inc., Broad River Electric Cooperative,
Inc., Laurens Electric Cooperative, Inc., Little River Electric Cooperative, Inc. and York Electric Cooperative, Inc. (the Upstate
Load) from a supplier other than the Authority. Central has obtained all of the necessary regulatory approvals to transition the
Upstate Load to a new supplier. The Upstate Load will transition to the new supplier over a seven-year period beginning in
2013, and by 2019 will amount to approximately 1,000 MW. The agreement provides that neither party will exercise any right to
terminate the Central Agreement effective on or before December 31, 2030 and that the parties agree to negotiate in good faith
terms and conditions by which the rights of the Authority and Central to terminate the Central Agreement will be deferred beyond
2030.

2011 annual report
49
NOTE 10 - COMMITMENTS AND CONTINGENCIES:
Budget – The Authority’s three-year capital budget is as follows:
Years Ending December 31, 2012 2013 2014
(Millions)
Future Nuclear Units (1) $ 705.5 $ 744.8 $ 394.3
Environmental Compliance 7.7 21.6 42.2
General Improvements 219.3 202.5 205.4
Total Capital Budget (2) $ 932.5 $ 968.9 $ 641.9
(1) Total estimated project costs including transmission is $2,433.5 million assuming a reduced ownership share.
(2) Will be financed by internally generated funds, taxable and tax-exempt debt.
Purchase Commitments - The Authority has contracted for long-term coal purchases beyond December 31, 2011, which
include estimated outstanding minimum obligations. The disclosure of minimum obligations below (including market re-opener
contracts) is based on the Authority’s contract rates and represents management’s best estimate of future expenditures under
long-term arrangements.
Year Ending December 31,
With Re-openers (All Tons) (1)
Without Re-openers (Fixed Tons) (2)
(Thousands)
2012 $ 467,332 $ 467,332
2013 516,110 478,360
2014 328,944 238,640
2015 299,621 244,440
2016 105,080 105,080
2017 - 2025 209,380 209,380
Total $ 1,926,467 $ 1,743,232
(1) Includes tons which the Authority can elect not to take.
(2) Includes tons which the Authority must receive.

2011 annual report
50
The Authority has the following outstanding obligations under existing long-term purchased power contracts as of December 31,
2011:
Contracts with minimum Fixed Payment Obligations
Number of Contracts Delivery Beginning Remaining Term Obligations (Millions)
1 1985 23 Years $ 59.9
1 2011 3 Years 29.1
Contracts with Power Receipt and Payment Obligations (1) (2)
Number of Contracts Delivery Beginning Remaining Term Obligations (Millions)
1 2010 14 Years $ 271.5
1 2012 20 Years 19.4
1 2012 20 Years 20.8
1 2013 20 Years 621.3
1 2013 20 Years 266.0
3 2013 30 Years 788.4
(1) Payment required upon receipt of power. Assumes no change in indices or escalation.
(2) In January 2012, an additional contract was approved for a term of 29 years beginning in 2013 with an obligation amount totaling $461.1 million.
The Authority entered into agreements effective October 1, 2008 whereby New Horizon Electric Cooperative, Inc. assigned its
interests, rights, and obligations in contracts with Duke Energy Corporation and SCE&G for network integration transmission
service to the Authority. The agreements are for network transmission service for the Upstate Load as defined in NOTE
9 – CONTRACTS WITH ELECTRIC POWER COOPERATIVES. A payment schedule for these agreements shows that $10.6
million will be due in 2012, with remaining annual payments totaling $69.4 million through the end of the contract term in 2023.
However, a majority of the Upstate Load will transition to a new supplier as stated in the last paragraph of NOTE 9 and the
Authority’s obligation for transmission service for this load will decrease in approximately the same proportion. At the end of the
transition period, the Authority shall no longer be responsible for purchasing transmission service for the load served by the new
supplier.
CSx Transportation, Inc. (CSx) provides substantially all rail transportation service for the Authority’s coal-fired generating units.
The Authority also interchanges with some short line railroads via CSx for the movement of coal. In 2011, a new agreement was
signed with CSx with an effective date of January 1, 2011. This contract will continue to apply a price per ton of coal moved,
along with a mileage based fuel surcharge.
The Authority has commitments for nuclear fuel, nuclear fuel conversion, enrichment and fabrication contracts for Summer Units
1, 2, and 3. As of December 31, 2011, these contracts total approximately $750.0 million over the next 23 years. The enrichment
component of these commitments from 2012 through 2013 totaling $19.1 million is contingent upon the operating requirements
of the nuclear units.
In 2009, the Authority amended the Rainey Generating Station Long-Term Parts and Long-Term Service Contract with General
Electric International, Inc. (GEII). In lieu of exercising its option to terminate the Contract for convenience and to pursue non-
OEM parts and services, the Authority negotiated an amendment with reduced pricing for maintenance and fixed escalation.
The contract provides a contract performance manager (CPM), initial spare parts, parts and services for specified planned
maintenance outages, remote monitoring and diagnostics of the turbine generators, and combustion tuning for the gas turbines.

2011 annual report
51
The amended contract value is approximately $103.5 million, including escalation. The contract term extends through the
second major inspection for Rainey 1 (expected to be completed in 2024) and through the second hot gas path inspection for
Rainey 2A (expected to be completed in 2014) and for Rainey 2B (expected to be completed in 2017). The contract can be
terminated for convenience at the end of 2015. The Authority’s Board has approved recovery of contract expenditures on a
straight-line basis over the term of the contract.
Effective November 1, 2000, the Authority contracted with Transcontinental Gas Pipeline Corporation (TRANSCO) to supply gas
transportation needs for its Rainey Generating Station. This is a firm transportation contract covering a maximum of 80,000
decatherms per day for 15 years.
Risk Management - The Authority is exposed to various risks of loss related to torts; theft of, damage to, and destruction of
assets; business interruption; and errors and omissions. The Authority purchases commercial insurance to cover these risks,
subject to coverage limits and various exclusions. Settled claims resulting from these risks did not exceed commercial insurance
coverage in 2011. Policies are subject to deductibles ranging from $250 to $1.0 million, with the exception of named storm
losses which carry deductibles from $1.0 million up to $5.0 million. Also a $1.4 million general liability self-insured layer exists
between the Authority’s primary and excess liability policies. During 2011, there were minimal payments made for general liability
claims.
The Authority is self-insured for auto, dental, worker’s compensation, and environmental incidents that do not arise out of an
insured event. The Authority purchases commercial insurance, subject to coverage limits and various exclusions, to cover
automotive exposure in excess of $2.0 million per incident. Risk exposure for the dental plan is limited by plan provisions.
Estimated exposure for worker’s compensation is based on an annual actuarial study using loss and exposure information
valued as of June 30, 2011. There have been no third-party claims for environmental damages for 2011 or 2010.
Claims expenditures and liabilities are reported when it is probable that a loss has occurred and the amount of the loss can be
reasonably estimated. The amount of the self-insurance liabilities for auto, dental, worker’s compensation, and environmental
remediation is based on the best estimate available. Changes in the reported liability were as follows:
Year Ended December 31, 2011 2010
(Thousands)
Unpaid claims and claim expense at beginning of year $ 2,263 $ 1,753
Incurred claims and claim adjustment expenses:
Add: Provision for insured events of the current year 1,985 3,548
Less: Payments for current and prior years 2,636 3,038
Total unpaid claims and claim expenses at end of year $ 1,612 $ 2,263
The Authority pays insurance premiums to certain other State agencies to cover risks that may occur in normal operations.
The insurers promise to pay to, or on behalf of, the insured for covered economic losses sustained during the policy period
in accordance with insurance policy and benefit program limits. Several State funds accumulate assets, and the State itself
assumes all risks for the following:
(1) claims of covered employees for health benefits (Employee Insurance Program); not applicable for worker’s
compensation injuries; and
(2) claims of covered employees for basic long-term disability and group life insurance benefits (Employee Insurance
Program and Retirement System).

2011 annual report
52
Employees elect health coverage through the State’s self-insured plans. All other coverage listed above is through the applicable
State self-insured plan except that additional group life and long-term disability premiums are remitted to commercial carriers.
The Authority assumes the risk for claims of employees for unemployment compensation benefits and pays claims through the
State’s self-insured plan.
Nuclear Insurance - The maximum liability for public claims arising from any nuclear incident has been established at $12.5
billion by the Price-Anderson Indemnification Act. This $12.5 billion would be covered by nuclear liability insurance of $300.0
million per site, with potential retrospective assessments of up to $117.5 million per licensee for each nuclear incident occurring
at any reactor in the United States (payable at a rate not to exceed $17.5 million per incident, per year). Based on its one-third
interest in Summer Nuclear Station, the Authority could be responsible for the maximum assessment of $39.2 million, not to
exceed approximately $5.8 million per incident, per year. This amount is subject to further increases to reflect the effect of
(i) inflation, (ii) the licensing for operation of additional nuclear reactors, and (iii) any increase in the amount of commercial liability
insurance required to be maintained by the NRC.
Additionally, SCE&G and the Authority maintain, with Nuclear Electric Insurance Limited (NEIL), $500.0 million primary and $1.5
billion excess property and decontamination insurance to cover the costs of cleanup of the facility in the event of an accident.
SCE&G and the Authority also maintain accidental outage insurance to cover replacement power costs (within policy limits)
associated with an insured property loss. In addition to the premiums paid on these three policies, SCE&G and the Authority
could also be assessed a retrospective premium, not to exceed ten times the annual premium of each policy, in the event of
property damage to any nuclear generating facility covered by NEIL. Based on current annual premiums and the Authority’s one-
third interest, the Authority’s maximum retrospective premium would be approximately $2.8 million for the primary policy, $4.2
million for the excess policy, and $1.4 million for the accidental outage policy.
SCE&G and the Authority maintain builder’s risk insurance and marine cargo insurance for the Summer Units 2 & 3 construction.
The builder’s risk policy provides coverage of $2.75 billion, with deductibles ranging from $250,000 to $5.0 million. This policy
also carries a potential retrospective premium of approximately $42.0 million. Based on the Authority’s current 45 percent
ownership interest, the Authority’s maximum retrospective premium would be approximately $18.9 million. The marine cargo
policy provides coverage of $300.0 million, with deductibles ranging from $25,000 to $75,000.
The Authority is self-insured for any retrospective premium assessments, claims in excess of stated coverage, or cost increases
due to the purchase of replacement power associated with an uninsured event. Management does not expect any retrospective
assessments, claims in excess of stated coverage, or cost increases for any periods through December 31, 2011.
Clean Air Act - The Authority endeavors to ensure that its facilities comply with applicable environmental regulations and
standards.
In addition to the existing Clean Air Act (CAA) Federal Acid Rain Program, the EPA has promulgated and is implementing the
Clean Air Interstate Rule (CAIR) for SO2 and NOx emissions.
In place of the vacated federal Clean Air Mercury Rule (CAMR), South Carolina utilities and DHEC finalized a Memorandum of
Agreement (MOA) in which the Authority committed to install and certify mercury Continuous Emissions Monitoring Systems
(CEMS) at a set of agreed-upon coal-fired units, and collaborate with the South Carolina utilities and DHEC to provide support
for a state-wide assessment evaluating the mercury deposition resulting from coal-fired power plants in South Carolina. In 2009,
the mercury CEMS were installed at the specified Authority units and utilities began initial reporting. There are no cap and trade
or emissions limitations requirements per the MOA.
The CAIR replacement rule, the Cross State Air Pollution Rule (CSAPR), was finalized by EPA and scheduled to take effect
January 1, 2012; however it was stayed by the U.S. Court of Appeals for the District of Columbia on December 30, 2011. Utilities
are operating under CAIR in the interim.

2011 annual report
53
The Authority has been operating under a settlement agreement, called the Consent Decree, which became effective June
24, 2004. The settlement with EPA and DHEC was related to certain environmental issues associated with coal-fired units. It
involved the payment of a civil penalty, an agreement to perform certain environmentally beneficial projects, and capital costs
to achieve emissions reductions over the period ending 2013. The capital costs continue to be offset from a reduced need to
purchase emission credits.
Currently there are both legislative and regulatory efforts to reduce greenhouse gas emissions. The Authority continues to
review proposed greenhouse gas regulations to assess potential impacts to its operations. In 2010, EPA finalized the Prevention
of Significant Deterioration (PSD) Tailoring Rule for regulating greenhouse gases through the PSD permitting process under
the existing CAA. EPA issued Best Available Control Technology (BACT) Guidance in 2010 for use under the rule effective July
1, 2011. The Authority will continue to monitor both regulatory and legislative efforts to reduce greenhouse gas emissions to
assess potential impacts to its operations.
Through the maximum achievable control technology (MACT) regulatory process, the EPA has proposed the Utility MACT
regulations to reduce the emissions of mercury and other hazardous air pollutants (HAPs) from coal and oil-fired electric utility
steam boilers. As a part of EPA rule development, the Authority participated in the EPA’s mandatory Information Collection
Request (ICR) for mercury and other HAPs for its coal-fired and oil-fired units. The ICR required facility and fuel information
as well as stack testing at Cross, Winyah and Jefferies generating stations. The proposed MACT rule was released in March
2011 with a public notice comment period. The Authority submitted comments to the proposed rule. The final MACT was pre-
released by EPA December 16, 2011 as the Mercury and Air Toxics Rule (MATS); however it has not yet been published in the
Federal Register. The Authority is evaluating the potential impacts of compliance with MATS, as pre-released, to its coal and oil-
fired generating units.
Safe Drinking Water Act - The Authority continues to monitor regulatory issues impacting drinking water systems at the
Authority’s regional water systems, generating stations, substations, and other auxiliary facilities. DHEC has regulatory authority
of potable water systems in South Carolina under The State Primary Drinking Water Regulation, R.61-58; the Authority endeavors
to manage its potable water systems in compliance with R.61-58.
Clean Water Act - The Clean Water Act (CWA) prohibits the discharge of pollutants, including heat, from point sources
into waters of the United States, except as authorized in the National Pollutant Discharge Elimination System (NPDES) permit
program. DHEC has been delegated NPDES permitting authority by the EPA and administers the NPDES permit program for the
State.
Wastewater discharges from the generating stations and the regional water plants are governed by NPDES permits issued by
DHEC. Further, the storm-water from the generating stations must be managed in accordance with the State’s NPDES Industrial
General Permit for storm-water discharges. The Authority constantly strives to operate in compliance with these permits.
The CWA, under Section 316(b), also requires that cooling water intake structures reflect the best technology available for
minimizing adverse environmental impacts, such as the impingement of fish and shellfish on the intake structures and the
entrainment of eggs and larvae through cooling water systems. The EPA has proposed regulations for certain intake structures,
including those at many electric generating facilities. Since the regulations have not yet been finalized their full impact is not
known at this time. However, if the regulations are promulgated in their present form, significant intake changes may be
required, particularly at the older facilities.
The EPA also has regulations under the CWA relating to Spill Prevention Control and Counter-measures (SPCC). These
regulations require that applicable facilities, which include generating stations, substations, and auxiliary facilities, maintain SPCC
plans to meet certain standards. The Authority continually works to be in compliance with these regulations.

2011 annual report
54
Hazardous Substances and Wastes - Section 311 of the CWA imposes substantial penalties for spills of Federal EPA-
listed hazardous substances into water and for failure to report such spills. The Comprehensive Environmental Response,
Compensation, and Liability Act of 1980 (CERCLA) provides for the reporting requirements to cover the release of hazardous
substances into the environment. Additionally, the EPA regulations under the Toxic Substances Control Act (TSCA) impose
stringent requirements for labeling, handling, storing and disposing of polychlorinated biphenyls (PCBs) and associated
equipment.
Under the CERCLA and Superfund Amendments and Reauthorization Act (SARA), the Authority could be held responsible for
damages and remedial action at hazardous waste disposal facilities utilized by it, if such facilities become part of a Superfund
effort. Moreover, under SARA, the Authority must comply with a program of emergency planning and a “Community Right-To-
Know” program designed to inform the public about more routine chemical hazards present at the facilities. Both programs have
stringent enforcement provisions. The Authority endeavors to comply with the applicable provisions of TSCA, CERCLA and
SARA, but it is not possible to determine if some liability may be imposed in the future for past waste disposal or compliance
with new regulatory requirements.
In addition to handling hazardous substances, the Authority generates solid waste associated with the combustion of coal,
the vast majority of which is fly ash, bottom ash, gypsum and scrubber sludge. These wastes are presently exempt from
hazardous wastes regulation under the Resource Conservation and Recovery Act (RCRA). However, EPA has recently proposed
regulations that, if enacted, would add significant cost to the handling of these materials and possibly eliminate or greatly reduce
their reuse and recycling.
Pollution Remediation Obligations – The Authority follows GASB 49 which addresses standards for pollution (including
contamination) remediation obligations for activities such as site assessments and cleanups. GASB 49 does not include
standards for pollution remediation obligations that are addressed elsewhere. Examples of obligations addressed in other
standards include pollution prevention and control obligations for remediation activities required upon the retirement of an asset,
such as ash pond closure and post-closure care and nuclear power plant decommissioning.
The Authority had recorded $180,000 and $181,000 for pollution remediation liabilities for the years ended December 31, 2011
and 2010, respectively. The method used to estimate the liabilities consists of weighting a range of possible estimated job
cost amounts and calculating a weighted average cost. The weights and estimated costs are developed using professional
engineering judgment acquired through years of estimating and completing many pollution remediation projects. The Authority
foresees no cost recoveries at this time which would reduce the recorded estimated liabilities.
Homeland Security - The Department of Homeland Security (DHS) was established by the Homeland Security Act of 2002,
a portion of which relates to anti-terrorism standards at facilities which store or process chemicals. The Authority has been
proactive in conducting security assessments at its facilities and will continue to strive to comply with these evolving regulations.
Legal Matters - An action was instituted in the U.S. District Court, Charleston, South Carolina, by a number of landowners
located along the Santee River primarily in Williamsburg and Georgetown Counties, South Carolina. The plaintiffs contend,
through various causes of action, that the Authority is liable to them for damage to their real estate as a result of flooding that has
occurred since the Corps of Engineers’ (Corps) Cooper River Re-diversion Project was completed in 1985. A jury trial held in
1997 resulted in a verdict against the Authority on certain causes of action. The Authority entered into a settlement agreement
with the plaintiffs and has paid approximately $221.6 million, including interest, to the plaintiffs. On March 30, 2011 and August
8, 2011, the District Court entered orders requiring the Authority to pay approximately $10.4 million in costs and attorney fees
to the plaintiffs. The Authority has paid for these costs and attorney fees and the District Court entered its Final Order and
Judgment on August 23, 2011. The Authority submitted a claim seeking indemnification from the Corps on August 30, 2011.
The U. S. Army Contract Board of Appeals previously determined that the contract between the Corps and the Authority
requires that the Corps indemnify the Authority for certain claims arising out of the construction and operation of the project. No
estimate of the amount or timing of recovery from the Corps can be made at this time.

2011 annual report
55
The Authority is also a party in various other claims and lawsuits that arise in the conduct of its business. Although the results of
litigation cannot be predicted with certainty, in the opinion of management, the ultimate disposition of these matters will not have
material adverse effect on the financial position or results of operations of the Authority.
NOTE 11 – RETIREMENT PLAN
Substantially all Authority regular employees must participate in one of the components of the South Carolina Retirement System
(SCRS), a cost sharing, multiple-employer public employee retirement system, which was established by Section 9-1-20 of the
South Carolina Code of Laws.
The payroll for active employees covered by the SCRS was as follows:
Year Ended December 31, 2011 2010 2009
(Millions)
Payroll for Active Employees $ 124.4 $ 121.5 $ 122.0
Vested employees who retire at age 65 or with 28 years of service at any age are entitled to a retirement benefit, payable monthly
for life. The annual benefit amount is equal to 1.82 percent of their average final compensation times years of service. Benefits
fully vest on reaching five years of service. Reduced retirement benefits are payable as early as either age 60 with vested service
or age 55 with 25 years of service. The SCRS also provides death and disability benefits. Benefits are established by State
statute.
Effective January 1, 2001, Section 9-1-2210 of the South Carolina Code of Laws allowed SCRS employees eligible for service
retirement to participate in the Teacher and Employee Retention Incentive (TERI) Program. TERI participants may retire and begin
accumulating retirement benefits on a deferred basis without terminating employment for up to five years. Upon termination of
employment or at the end of the TERI period, whichever is earlier, participants will begin receiving monthly service retirement
benefits which include any cost of living adjustments granted during the TERI period. Because participants are considered
retired during the TERI period, they do not earn service credit or disability retirement benefits. Effective July 1, 2005, TERI
employees began “re-contributing” to the SCRS at the prevailing rate. However, no service credit is earned under the new
regulations. The group life insurance of one times annual salary was re-established for TERI participants.
Article x, Section 16 of the South Carolina Constitution requires that all State-operated retirement plans be funded on a sound
actuarial basis. Title 9 of the South Carolina Code of Laws (as amended) prescribes requirements relating to membership,
benefits and employee/employer contributions.
All employees are required by State statute to contribute to the SCRS at the prevailing rate (currently 6.50 percent). The
Authority contributed 9.24 percent of the total payroll for SCRS retirement through June 30, 2011. Effective July 1, 2011, the rate
increased to 9.385 percent. For 2011, the Authority also contributed an additional 0.15 percent of total payroll for group life. The
contribution requirements for the prior three years were as follows:
Years Ended December 31, 2011 2010 2009
(Millions)
From the Authority $ 11.7 $ 11.5 $ 11.6
From Employees 8.1 7.9 7.9
(1) The Authority made 100 percent of the required contributions for each of the three years.

2011 annual report
56
The SCRS issues a standalone financial report that includes all required supplementary information. The report may be obtained
by writing to: South Carolina Retirement System, P.O. Box 11960, Columbia, S.C. 29211.
Effective July 1, 2002, new employees have a choice of type of retirement plan in which to enroll. The State Optional Retirement
Plan (State ORP) which is a defined contribution plan is an alternative to the SCRS retirement plan which is a defined benefit
plan. The contribution amounts are the same, (6.50 percent employee cost and 9.385 percent employer cost) however, 5.0
percent of the employer amount is directed to the vendor chosen by the employee and the remaining 4.385 percent is to the
Retirement System. As of December 31, 2011, the Authority had 40 employees participating in the State ORP and consequently
the related payments are not material.
The Authority is the non-operating owner (one-third share) of SCE&G’s V.C. Summer Nuclear Station. As such, the Authority is
responsible for funding its share of pension requirements for the nuclear station personnel in accordance with FASB ASC 715.
Any earnings generated from the established pension plan are shared proportionately and used to reduce the allocated funding.
As of December 31, 2011 and 2010, the Authority had over-funded its share of the plan FASB ASC 715 requirements by $5.6
million and $6.8 million, respectively. This receivable however, is offset by a regulatory liability. The balances were approximately
$25.3 million and $19.9 million for the unfunded portion of pension benefits at December 31, 2011 and 2010, respectively.
Additional information may be obtained by reference to the SCANA Corporation Annual Report on Form 10K as filed with the
Securities Exchange Commission as of December 31, 2011.
The Authority also provides retirement benefits to certain employees designated by management and the Board under
supplemental executive retirement plans (SERP). Benefits are established and may be amended by management and the
Authority’s Board and includes retirement benefit payments for a specified number of years and death benefits. The cost of
these benefits is actuarially determined annually. Beginning in 2006, these plans were segregated into internal and external
funds. The qualified benefits are funded externally with the annual cost set aside in a trust administered by a third party. The
pre-2006 retiree benefits and the non-qualified benefits are funded internally with the annual cost set aside and managed by the
Authority. A summary of the Authority’s SERP activity is as follows:
Year Ended December 31, 2011 2010
(Millions)
Total Cost $ 1.0 $ 1.4
Accrued Liability 5.1 5.1
NOTE 12 – OTHER POSTEMPLOYMENT BENEFITS (OPEB):
Vacation / Sick Leave - During their first 10 years of service, full-time employees can earn up to 15 days of vacation leave
per year. After 11 years of service, employees earn an additional day of vacation leave for each year of service over 11 until they
reach the maximum of 25 days per year. Employees earn two hours per pay period, plus twenty additional hours at year-end for
sick leave.
Employees may accumulate up to 45 days of vacation leave and 180 days of sick leave. Upon termination, the Authority pays
employees for unused vacation leave at the pay rate then in effect. In addition, the Authority pays employees upon retirement 20
percent of their sick leave at the pay rate then in effect.
Plan Description - The Authority participates in an agent multiple-employer defined benefit healthcare plan whereby the
South Carolina Employee Insurance Program (EIP) provides certain health, dental and life insurance benefits for eligible retired
employees of the Authority. The retirement benefits available are defined by the EIP and substantially all of the Authority’s

2011 annual report
57
employees may become eligible for these benefits if they retire at any age with a minimum of 10 years of earned service or at age
60 with at least 20 years of service. Currently, approximately 667 retirees meet these requirements. For employees hired May
2, 2008 or thereafter, the number of years of earned service necessary to qualify for funded retiree insurance is 15 years for a
one-half contribution, and 25 years for a full contribution. The EIP may be contacted at: Employee Insurance Program, Financial
Services, PO Box 11661, Columbia, S.C. 29211-1661.
Funding Policy – Prior to 2010, the Authority used the unfunded pay-as-you-go option (or cash disbursement) method
pursuant to GASB 45 to record the net OPEB obligations. During 2010, the Authority established an irrevocable trust with
Synovus Trust Company and elected the funding policy method. This method of funding will result in decreasing contributions
over time whereby the more retirees, the lesser the disbursements as a percentage of employee payroll.
Annual OPEB Cost - The Authority’s annual OPEB cost, the annual required contribution of the employer (ARC), is an amount
actuarially determined in accordance with the parameters of GASB 45. The ARC represents a level of funding that, if paid on an
on-going basis, is projected to cover normal cost each year and amortize any unfunded actuarial liabilities (or funding excess)
over a period not to exceed 30 years. The Authority’s annual OPEB cost contributed for these benefits is equal to the actual
disbursements during the year for health care benefits for retired employees plus annual funding amounts for the trust. The
Authority’s annual OPEB costs (expense) for the current and prior years were as follows:
Year Ended December 31, 2011 2010
(Thousands)
Beginning Liability Balance $ 14,414 $ 19,855
Add: Annual OPEB Cost 9,841 8,858
Less: Annual OPEB Cost Contributed 12,396 14,299
Net OPEB Obligation $ 11,859 $ 14,414
Funded Status and Funding Progress - The funded status of the plan based on the latest actuarial study dated December
31, 2010 is as follows:
(Thousands)
Actuarial Accrued Liability (AAL) $ 131,076
Less: Actuarial Value of Plan Assets 11,132
Unfunded Actuarial Accrued Liability (UAAL) $ 119,944
Funded Ratio (Actuarial Value of Plan Assets / AAL) 8.49%
At December 31, 2011, the estimated value of the Plan Assets was $19.8 million creating an estimated funded ratio of 15.09
percent and an estimated unfunded liability of $111.3 million. Actuarial valuations of an ongoing plan involve estimates such as
mortality rates and potential rising health costs. The Unfunded Actuarial Accrued Liabilities were amortized as a level percent of
active member payroll over a period of 30 years, the maximum period allowed by GASB.

2011 annual report
58
Actuarial Methods and Assumptions – The Projected Unit Credit, Level Percent of Payroll actuarial cost method has been
used to calculate the GASB ARC for this valuation. Using the plan benefits, the present health premiums, and a set of actuarial
assumptions, the anticipated future payments are projected. The projected unit credit method then provides for a systematic
funding for these anticipated payments. The yearly ARC is computed to cover the cost of benefits being earned by covered
members as well as amortize a portion of the unfunded accrued liability. If experience is in accordance with the assumptions
used, the ARC will increase at approximately the same rate as active member payroll, and the ARC as a percentage of payroll will
remain basically level on a year to year basis. This is both an acceptable and reasonable cost method.
Required Supplementary Information - Schedule of Funding Progress
Actuarial Valuation Date
Actuarial Value of Assets (a)
Actuarial Accrued Liability (AAL) - Entry
Age (b)Unfunded AAL (UAAL)
(b) - (a) Funded Ratio (a / b)
(Thousands)
6/30/2006 $ 0 $ 137,543 $ 137,543 0.00%
6/30/2008 0 107,113 107,113 0.00%
12/31/2010 11,132 131,076 119,944 8.49%
V.C. Summer OPEB - The Authority is the non-operating owner (one-third share) of SCE&G’s V.C. Summer Nuclear Station.
As such the Authority is responsible for funding its share of other post-employment benefit costs for the station’s employees.
The Authority’s liability balances as of December 31, 2011 and 2010 were approximately $9.2 million and $8.9 million,
respectively.
At December 31, 2011 and 2010, respectively, regulatory asset and liability balances of approximately $2.3 million and $2.0
million were recorded for the unfunded portion of other post-employment benefit costs for V.C. Summer employees. Additional
information may be obtained by reference to the SCANA Corporation Annual Report on Form 10K as filed with the Securities
Exchange Commission as of December 31, 2011.
NOTE 13 - CREDIT RISK AND MAJOR CUSTOMERS:
Sales to two major customers for the years ended December 31, 2011 and 2010 were as follows:
Customer: 2011 2010
(Thousands)
Central (including Saluda) $ 1,089,000 $ 1,096,000
Alumax of South Carolina 189,000 176,000
No other customer accounted for more than 10 percent of the Authority’s sales for either of the years ended December 31, 2011
or 2010. The Authority maintains an allowance for uncollectible accounts based upon the expected collectability of all accounts
receivable. The allowance as of December 31, 2011 and 2010 was $1.4 million and $1.5 million, respectively.

2011 annual report
59
NOTE 14 – SUBSEQUENT EVENT(S):
We have evaluated subsequent events through February 24, 2012 in conjunction with the preparation of these financial
statements which is the date the financial statements were available to be issued. As of this date, the Authority had the following
to report:
On February 9, 2012, the Authority issued $99.4 million of Revenue Obligations, 2012 Refunding Series A Bonds. The bond
proceeds were used to refund a portion of both Revenue Obligations, 2003 Refunding Series A and 2004 Series A. This issue
resulted in a gross savings of $17.3 million over the life of the bonds.

2011 annual report
60
BOARd OF dIRECTORS
O.L. THOMPSON IIIChairmanAt-Large Mt. Pleasant, S.C.
President and CEO of O.L. Thompson
Construction Co., Inc., which includes
Thompson Trucking Co. Inc. and Wando
Concrete.
WILLIAM A. FINN*2nd Vice Chairman1st Congressional DistrictCharleston, S.C.
Chairman of AstenJohnsen, Inc., a specialty
textile company for the printing and papermaking
industries based in Charleston, S.C.
* The first vice chair position was vacant as of Dec. 31, 2011. In their January 2012 meeting, the directors elected William Finn 1st Vice Chairman.
KRISTOFER CLARK3rd Congressional District Easley, S.C.
Senior director of operations for The Cliffs
Management Service, LLC and owner of Pristine
Properties, LLC.

2011 annual report
61
J. CALHOUN LAND IV6th Congressional DistrictManning, S.C.
Partner in Land, Parker and Welch, a general
practice Manning law firm.
W. LEIGHTON LORD III2nd Congressional DistrictColumbia, S.C.
Partner in Nexsen Pruet law firm in Columbia.
PEGGY H. PINNELLBerkeley CountyMoncks Corner, S.C.
Owner of State Farm Insurance Agency,
Moncks Corner.

2011 annual report
62
DAVID F. SINGLETONHorry CountyMyrtle Beach, S.C.
President of Singleton Properties, Inc., real estate
investment and sales firm.
JAMES R. SANDERS JR.5th Congressional DistrictGaffney, S.C.
General partner of Sanders Properties, LLC, and
president of Development & Construction, LLC.
DAVID A. SPRINGSGeorgetown CountyMurrells Inlet, S.C.
Retired Consulting Engineer for electric coop-
eratives and municipal utilities with Southern
Engineering Company of Georgia.

2011 annual report
63
CECIL E. VIVERETTEAt-LargeHilton Head Island, S.C.
Retired President and CEO of Rappahannock
Electric Cooperative in Virginia.
BARRY D. WYNN*4th Congressional DistrictSpartanburg, S.C.
President of Colonial Trust Company, a private
trust company specializing in investment man-
agement and estate services.
*In their January 2012 meeting, the directors elected Barry Wynn 2nd Vice Chairman.

2011 annual report
64
ADVISORY BOARDNikki HaleyGovernor
Mark HammondSecretary of State
Alan WilsonAttorney General
Richard A. EckstromComptroller General
Curtis M. Loftis Jr.State Treasurer ExECUTIVE MANAGEMENTLonnie N. Carter President and Chief Executive OfficerBill McCall Jr. Executive Vice President and Chief Operating OfficerElaine G. Peterson Executive Vice President and Chief Financial OfficerJames E. Brogdon Jr. Executive Vice President and General CounselRennie M. Singletary III Executive Vice President of Corporate ServicesTerry L. Blackwell Senior Vice President, Power DeliveryL. Phil Pierce Senior Vice President, GenerationMarc R. Tye Senior Vice President, Customer Service
MANAGEMENTS. Thomas Abrams Vice President, Planning and Power SupplyJeffrey D. Armfield Vice President, Fuels Strategy and SupplyMichael C. Brown Vice President, Wholesale and Industrial ServicesWm. Glen Brown Vice President, Human Resource Management Michael R. Crosby Vice President, Nuclear Operations and Construction Glenda W. Gillette Vice President and ControllerThomas L. Kierspe Vice President, Property and Environmental Management Richard S. Kizer Vice President, Government and Community RelationsJ. Michael Poston Vice President, Retail OperationsSuzanne H. Ritter Vice President, Corporate Planning and TreasurerLaura G. Varn Vice President, Corporate CommunicationsPamela J. Williams Vice President, Administration and Corporate Secretary
AUDITORStephon Terrell Thompson

2011 annual report
65
OFFICE LOCATIONS
Carolina Forest Town Centre
3990 River Oaks Drive
Myrtle Beach, SC 29579
843-946-5950
843-903-1333 fax
Conway Office
100 Elm Street
Conway, SC 29526
843-248-5755
843-248-7315 fax
Loris Office
3701 Walnut Street
Loris, SC 29569
843-756-5541
843-756-7008 fax
Moncks Corner Office
Santee Cooper Headquarters
One Riverwood Drive
Moncks Corner, SC 29461
843-761-4060
843-761-4122 fax
Myrtle Beach Office
1703 Oak Street
Myrtle Beach, SC 29577
843-448-2411
843-626-1923 fax
Murrells Inlet/Garden City Office
900 Inlet Square Drive
Murrells Inlet, SC 29576
843-651-1598
843-651-7889 fax
North Myrtle Beach Office
1000 2nd Avenue N.
North Myrtle Beach, SC 29582
843-249-3505
843-249-6843 fax
Pawleys Island Office
126 Tiller Road
Pawleys Island, SC 29585
843-237-9222
843-237-8959 fax
St. Stephen Office
1172 Main Street
St. Stephen, SC 29479
843-567-3346
843-567-4709 fax
For more information, please contact:
Mollie Gore, Director of Publications
P.O. Box 2946101
Moncks Corner, SC 29461-2901
Phone: 843-761-7093
fax: 843-761-74122
[email protected] Cooper 2011 Annual Report
created by Corporate Communications.
Photographer—Jim Huff
Designer—Tom Galmarini
Editor—Mollie Gore
