2011 construction outlook breakfast. victorian economic update - melbourne construction outlook...
TRANSCRIPT

2011Construction Outlook
Breakfast

Victorian Economic Update - Melbourne Construction Outlook Breakfast
Kim Wells MP, Treasurer of Victoria
27July 2011

Strong population growth…
Source: Australian Bureau of Statistics
0
250
500
750
Total change in population 2000 to 2010
'000 Persons
Melbourne Sydney Brisbane Perth Adelaide

Victoria remains the national leader in terms of building approvals
Source: Australian Bureau of Statistics
10
20
30
40
Aug-95 Aug-97 Aug-99 Aug-01 Aug-03 Aug-05 Aug-07 Aug-09 Aug-11
per cent
0
2
4
6'000
Share of Aus total (LHS) Trend (RHS)

Also reflected in dwelling commencements
Source: Australian Bureau of Statistics
0
10
20
30
40
50
Jun-95 Jun-97 Jun-99 Jun-01 Jun-03 Jun-05 Jun-07 Jun-09 Jun-11
per cent
3
6
9
12
15
18'000
Share of Aus total (LHS) Number ('000, RHS)

Victoria’s strong home-building performance expected to continue
Source: HIA Economics, October 2011
0
10
20
30
40
50
60
2008-09 2009-10 2010-11 (e) 2011-12 (f) 2012-13 (f)
'000
Victoria NSW Queensland

House prices continue to be flat in recent quarters
Sources: Australian Bureau of Statistics, Real Estate Institute of Victoria and RP-Data-Rismark
All figures in per cent terms
ABS REIV RP-RISMARK
June 2010 2.9 8.5 0.4
September 2010 -1.8 0.9 1.0
December 2010 1.5 (revised) 6.9 0.8
March 2011 -1.6 (revised) -6.0 -1.8
June 2011 -0.1 5.4 -1.8

Recent volatility in the AUD has led it to fall slightly below parity
Source: Reserve Bank of Australia, as at 30 September 2011
0.4
0.6
0.8
1.0
1.2
Sep-01 Sep-03 Sep-05 Sep-07 Sep-09 Sep-11
AUD/USD month end

Victoria now has a much more robust and diversified economy and remains resilient
0
6
12
18
Manufacturing Finance & insurance Prof, scientific & tech Health care & socialassist
per cent of total gross value added
1994-95 2009-10
Source: Australian Bureau of Statistics

While the residential sector is flat, the non-residential sector is improving modestly
-40
-20
0
20
40
60
80
Jul-05 Jul-06 Jul-07 Jul-08 Jul-09 Jul-10 Jul-11
per cent
Housing finance commitments (excl. refinancing)* Commercial finance commitments*
*Year-on-year growth (3 month rolling sum) Source: Australian Bureau of Statistics

Victorian economic projections
All units in per cent
2009-10 2010-11 2011-12 2012-13 2013-14 2014-15
Actual Forecast Forecast Forecast Forecast Forecast
Real GSP 2.0 2.50 3.00 2.75 2.75 2.75
Employment 2.8 3.5* 1.75 1.75 1.75 1.75
Unemployment rate 5.5 5.1* 5.00 5.00 4.75 4.75
Consumer price index 2.1 3.3* 2.75 2.50 2.50 2.50
Wage price index** 2.8 3.8* 3.75 3.50 3.50 3.50
Population 1.8 1.70 1.50 1.50 1.50 1.50
2011-12 Budget projections
Source: Australian Bureau of Statistics, Department of Treasury and Finance
*Labour market, consumer price index and wage price index data are actual outcomes for 2010-11**Covers private and public sector wage rates. Incorporates nominal wage increases for labour of unchanged quality, plus some productivity improvements which cannot be fully measured

Housing Initiatives

Housing initiatives
Government action addressing housing affordability:• Land transfer duty for first home buyers was cut by 20 per cent on
1 July 2011• First Home Bonus and Regional Bonus extended until 30 June 2012• The pensioner and concession card holder stamp duty concession
threshold was increased from $440,000 to $750,000, and eligibility extended to holders of a Commonwealth Seniors Health Card
• Stamp duty exemption for young farmers purchasing their first farmland valued up to $300,000
These initiatives have already benefited approximately 3,200 Victorian families since taking effect on 1 July 2011.

Planning Reforms

Planning Reforms
Overarching Metropolitan Planning Strategy• New outcomes-based Metropolitan Planning Strategy to manage
Melbourne’s growth into the future
Streamlining Planning Processes• Ministerial Advisory Committee to review the Victorian planning
system and recommend improvements

Planning ReformsGrowth Areas• GAIC – deferment and works-in-kind • Provide development-ready land• Process for Logical Inclusions to the UGB
Urban Renewal• Established the Urban Renewal Authority to focus on strategic
development sites• Facilitating other key urban renewal projects

Victorian Economic Update - Melbourne Construction Outlook Breakfast
Kim Wells MP, Treasurer of Victoria
27July 2011


Overview & Analysis of the Australian
Construction IndustryRob Wild
Cordell Information CEO

PROJECTS IN PLANNING

Projects in Planning - National
Number of
projects
Value of
projects ($bn)
FY07/08 FY08/09 FY09/10 FY10/1110,000
12,000
14,000
16,000
18,000 16,327
15,037
13,126
16,679
FY07/08 FY08/09 FY09/10 FY10/11$200
$250
$300
$350
$400
$310$329 $337
$390

# of Projects in Planning - Construction Types – National
FY07/08 FY08/09 FY09/10 FY10/110
1,000
2,000
3,000
4,000
5,000
6,000
CIVIL ENGINE
COMMERCIAL
COMMUNITY
FLATS & UNITS
INDUSTRIAL
MINING
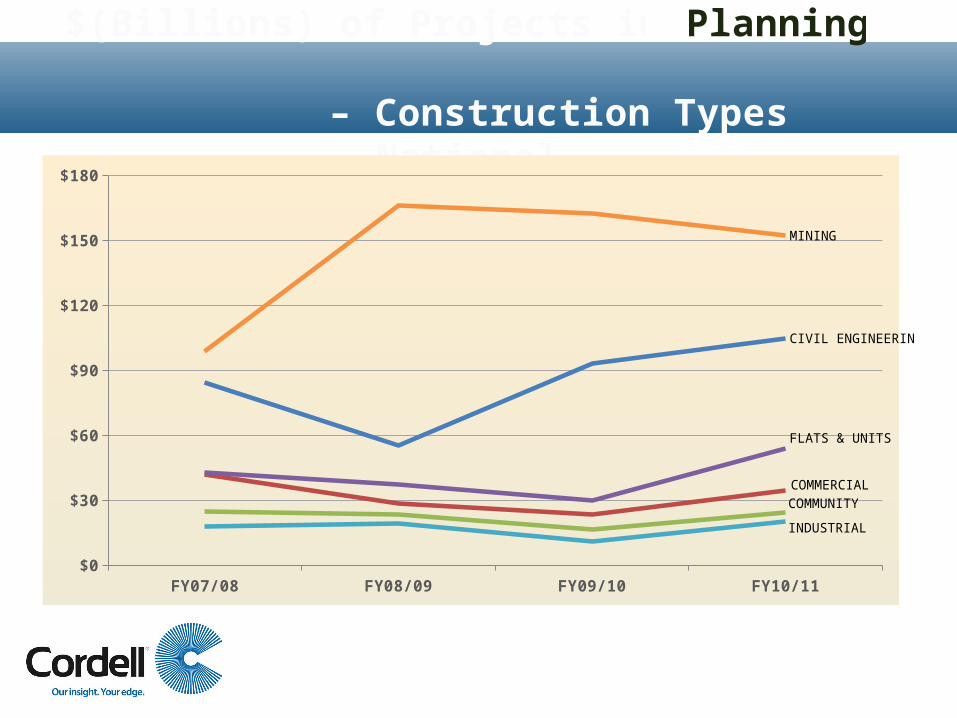
$(Billions) of Projects in Planning – Construction
Types – National
FY07/08 FY08/09 FY09/10 FY10/11$0
$30
$60
$90
$120
$150
$180
CIVIL ENGINEERIN
COMMERCIALCOMMUNITY
FLATS & UNITS
INDUSTRIAL
MINING

# of Projects in Planning - State
FY07/08 FY08/09 FY09/10 FY10/110
1,000
2,000
3,000
4,000
5,000
6,000
NSW
NT
QLD
SA
TAS
VIC
WA
PROJECTS IN CONSTRUCTION
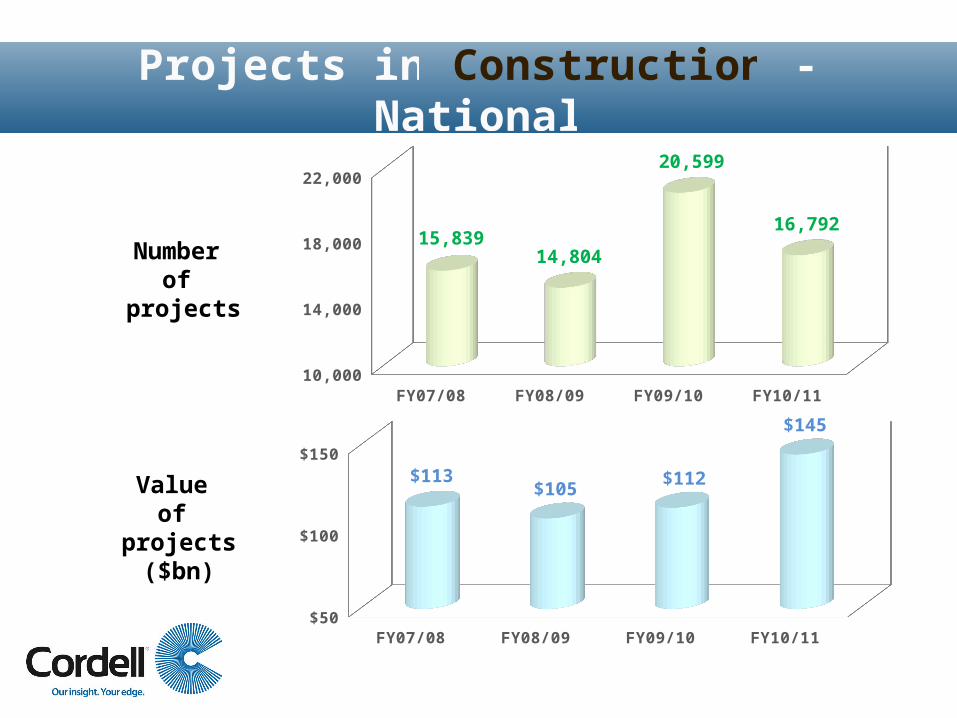
Projects in Construction - National
FY07/08 FY08/09 FY09/10 FY10/1110,000
14,000
18,000
22,000
15,83914,804
20,599
16,792
FY07/08 FY08/09 FY09/10 FY10/11$50
$100
$150
$113$105
$112
$145
Number of
projects
Value of
projects ($bn)

# of Projects in Construction – Construction Types – National
FY07/08 FY08/09 FY09/10 FY10/110
1,000
2,000
3,000
4,000
5,000
6,000
7,000
8,000
9,000
10,000
CIVIL ENGINE
COMMERCIAL
COMMUNITY
FLATS & UNITS
INDUSTRIAL
MINING

$(Billions) of Projects in Construction – Construction Types – National
FY07/08 FY08/09 FY09/10 FY10/11$0
$10
$20
$30
$40
$50
$60
$70
$80
CIVIL ENGINEERIN
COMMERCIAL
COMMUNITYFLATS & UNITS
INDUSTRIAL
MINING

# of Projects in Construction - State
FY07/08 FY08/09 FY09/10 FY10/110
1,000
2,000
3,000
4,000
5,000
6,000
7,000
NSW
NT
QLD
SA
TAS
VIC
WA
PROJECTS DEFERRED

Deferred Projects - National
FY07/08 FY08/09 FY09/10 FY10/110
3000
6000
2645
5042
37133261
Number of
projects
Value of
projects ($bn)
FY07/08 FY08/09 FY09/10 FY10/11$0
$50
$100
$37
$87
$54 $52

# of Deferred Projects – Construction Types - National
FY07/08 FY08/09 FY09/10 FY10/110
200
400
600
800
1,000
1,200
1,400
1,600
CIVIL ENGINE
COMMERCIAL
COMMUNITY
FLATS & UNITS
INDUSTRIAL
MINING

$(Billions) of Deferred Projects – Construction Types - National
FY07/08 FY08/09 FY09/10 FY10/11$0
$5
$10
$15
$20
$25
$30
$35
CIVIL ENGINEERING
COMMERCIAL
COMMUNITY
FLATS & UNITS
INDUSTRIAL
MINING

# of Deferred Projects- State
FY07/08 FY08/09 FY09/10 FY10/110
400
800
1,200
1,600
2,000
NSW
NT
QLD
SA
TAS
VIC
WA

PROJECTS ABANDONED

Abandoned Projects - National
FY07/08 FY08/09 FY09/10 FY10/111000
2000
3000
2061
2673 27502950
FY07/08 FY08/09 FY09/10 FY10/11$0
$30
$60
$16$19
$58
$26
Number of
projects
Value of
projects ($bn)

#of Abandoned Projects – Construction Types - National
FY07/08 FY08/09 FY09/10 FY10/110
200
400
600
800
1,000
1,200
CIVIL ENGINE
COMMERCIAL
COMMUNITY
FLATS & UNITS
INDUSTRIAL
MINING
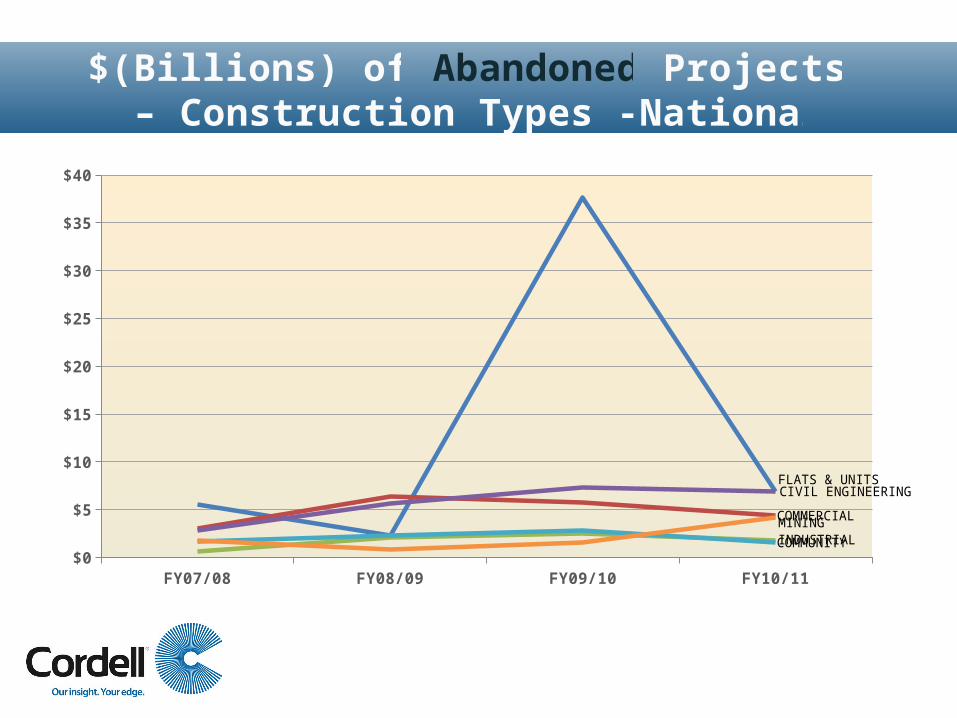
$(Billions) of Abandoned Projects – Construction Types -National
FY07/08 FY08/09 FY09/10 FY10/11$0
$5
$10
$15
$20
$25
$30
$35
$40
CIVIL ENGINEERING
COMMERCIAL
COMMUNITY
FLATS & UNITS
INDUSTRIALMINING

VICTORIA

VIC Planning – Construction Types by Financial Year
FY07/08
FY08/09
FY09/10
FY10/11
FY07/08
FY08/09
FY09/10
FY10/11
FY07/08
FY08/09
FY09/10
FY10/11
FY07/08
FY08/09
FY09/10
FY10/11
FY07/08
FY08/09
FY09/10
FY10/11
FY07/08
FY08/09
FY09/10
FY10/11
CIVIL ENGINEERING COMMERCIAL COMMUNITY FLATS & UNITS INDUSTRIAL MINING
0
500
1000
1500
2000
2500
$0
$5
$10
$15
$20
$25
$30
$35
$40
$45
Volume $ Value billions
PROJECTS OF NOTE: NEW
North East Link – $6bn; Regional Rail Link – $5.8bn EGate – $5bn; Moonee Valley Racecourse Dev – $1.25bn

VIC Construction - Construction Types by Financial Year
PROJECT OF NOTE ENTERING CONSTRUCTION STAGE:
Hudson at Upper West Side, Residential Development Stage 1 – $180m
FY07/0
8
FY08/0
9
FY09/1
0
FY10/1
1
FY07/0
8
FY08/0
9
FY09/1
0
FY10/1
1
FY07/0
8
FY08/0
9
FY09/1
0
FY10/1
1
FY07/0
8
FY08/0
9
FY09/1
0
FY10/1
1
FY07/0
8
FY08/0
9
FY09/1
0
FY10/1
1
FY07/0
8
FY08/0
9
FY09/1
0
FY10/1
1
CIVIL ENGINEER-ING
COMMERCIAL COMMUNITY FLATS & UNITS INDUSTRIAL MINING
0
200
400
600
800
1,000
1,200
1,400
1,600
1,800
2,000
$0
$1
$2
$3
$4
$5
$6
$7
$8
$9
Volume $ Value billions

VIC Deferred – Construction Types by Financial Year
PROJECTS OF NOTE DEFERRED:
The Point Estate Residential and Waterways Development – $330m Bourke Junction South East Stadium Precinct Docklands South
Tower – $300m
FY07/0
8
FY08/0
9
FY09/1
0
FY10/1
1
FY07/0
8
FY08/0
9
FY09/1
0
FY10/1
1
FY07/0
8
FY08/0
9
FY09/1
0
FY10/1
1
FY07/0
8
FY08/0
9
FY09/1
0
FY10/1
1
FY07/0
8
FY08/0
9
FY09/1
0
FY10/1
1
FY07/0
8
FY08/0
9
FY09/1
0
FY10/1
1
CIVIL ENGINEER-ING
COMMERCIAL COMMUNITY FLATS & UNITS INDUSTRIAL MINING
0
50
100
150
200
250
300
$0
$1
$2
$3
$4
Volume $ Value billions

VIC Abandoned - Construction Types by Financial Year
PROJECTS OF NOTE : ABANDONED
Monash Village Student Accommodation – $300m
FY07/0
8
FY08/0
9
FY09/1
0
FY10/1
1
FY07/0
8
FY08/0
9
FY09/1
0
FY10/1
1
FY07/0
8
FY08/0
9
FY09/1
0
FY10/1
1
FY07/0
8
FY08/0
9
FY09/1
0
FY10/1
1
FY07/0
8
FY08/0
9
FY09/1
0
FY10/1
1
FY07/0
8
FY08/0
9
FY09/1
0
FY10/1
1
CIVIL ENGINEER-ING
COMMERCIAL COMMUNITY FLATS & UNITS INDUSTRIAL MINING
0
50
100
150
200
250
300
350
400
$0
$1
$2
$3
Volume $ Value billions

Planning 20%
In summary for Australia – 10/11 v’s 09/10:
Construction 20%
Deferred 10%
Abandoned 55%
Overall, Vic looking pretty good!
The Housing 100For 2010/11
Graham WolfeHIA Chief Executive Association

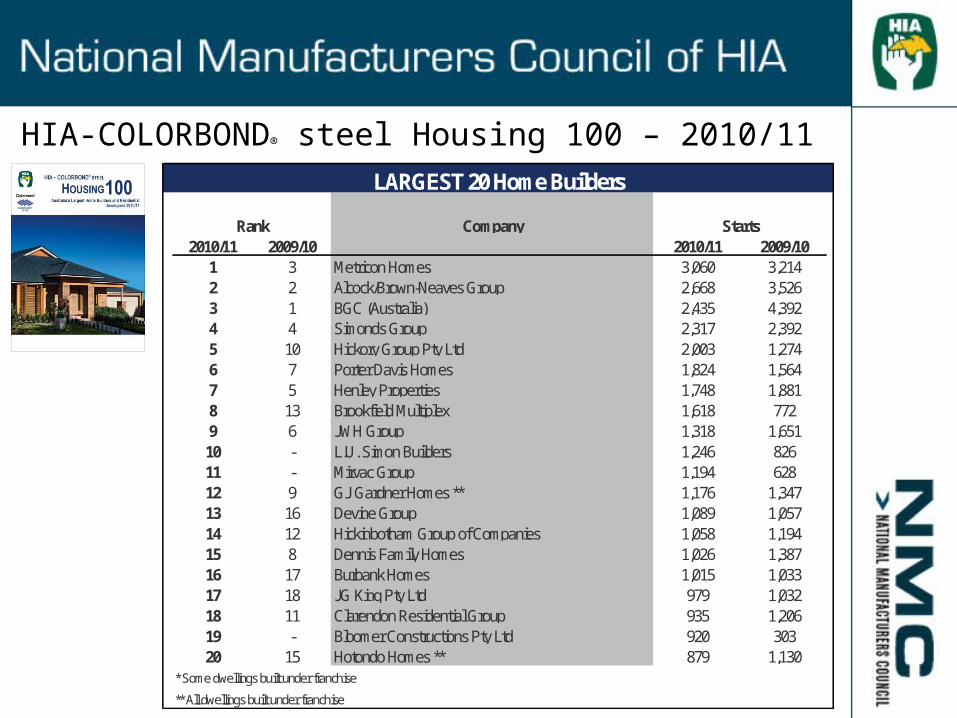
HIA-COLORBOND® steel Housing 100 – 2010/11
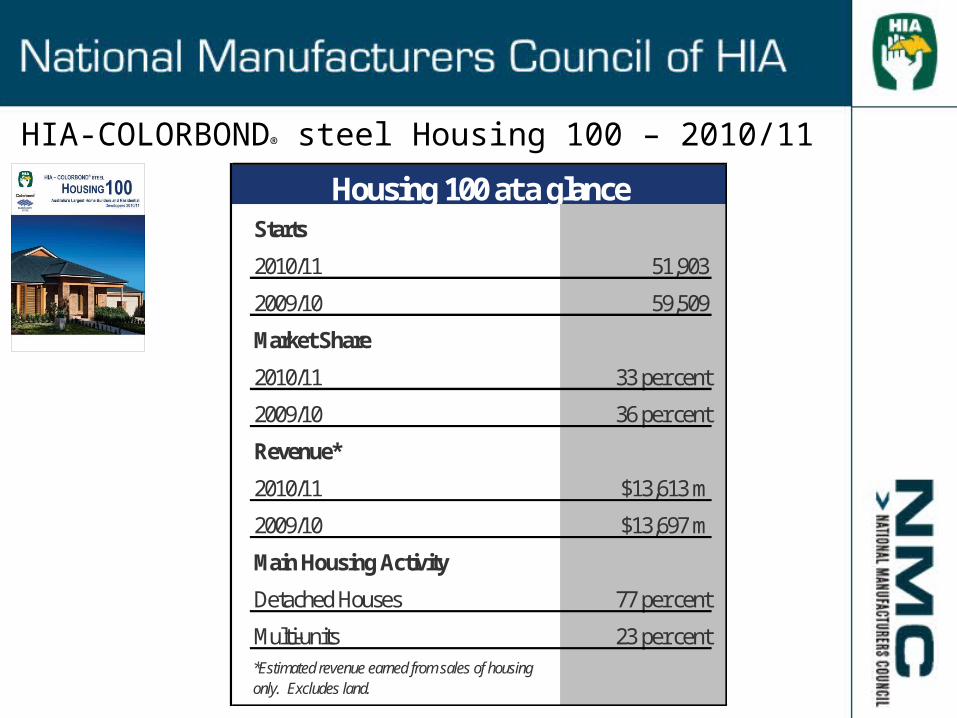
HIA-COLORBOND® steel Housing 100 – 2010/11
Starts
2010/11 51,903
2009/10 59,509
Market Share
2010/11 33 per cent
2009/10 36 per cent
Revenue*
2010/11 $13,613 m
2009/10 $13,697 m
Main Housing Activity
Detached Houses 77 per cent
Multi-units 23 per cent
Housing 100 at a glance
*Estimated revenue earned from sales of housing only. Excludes land.
HIA-COLORBOND® steel Housing 100 – 2010/11
Company2010/11 2009/10 2010/11 2009/10
1 3 Metricon Homes 3,060 3,2142 2 Alcock/Brown-Neaves Group 2,668 3,5263 1 BGC (Australia) 2,435 4,3924 4 Simonds Group 2,317 2,3925 10 Hickory Group Pty Ltd 2,003 1,2746 7 Porter Davis Homes 1,824 1,5647 5 Henley Properties 1,748 1,8818 13 Brookfield Multiplex 1,618 7729 6 JWH Group 1,318 1,65110 - L.U. Simon Builders 1,246 82611 - Mirvac Group 1,194 62812 9 GJ Gardner Homes ** 1,176 1,34713 16 Devine Group 1,089 1,05714 12 Hickinbotham Group of Companies 1,058 1,19415 8 Dennis Family Homes 1,026 1,38716 17 Burbank Homes 1,015 1,03317 18 JG King Pty Ltd 979 1,03218 11 Clarendon Residential Group 935 1,20619 - Bloomer Constructions Pty Ltd 920 30320 15 Hotondo Homes ** 879 1,130
* Some dwellings built under franchise
** All dwellings built under franchise
LARGEST 20 Home Builders
Rank Starts

HIA-COLORBOND® steel Housing 100 – 2010/11
Company2010/11 2009/10 No. %
8 13 Brookfield Multiplex 846 110%5 10 Hickory Group Pty Ltd 729 57%
19 50 Bloomer Constructions Pty Ltd 617 204%11 31 Mirvac Group 566 90%10 27 L.U. Simon Builders 420 51%23 41 Philip Usher Constructions 339 75%43 101 Chase Building Group Pty Ltd 265 408%6 7 Porter Davis Homes 260 17%
31 36 Redink Homes Pty Ltd / 101 Residential Pty Ltd 92 17%81 - Adelaide Designer Homes 78 433%34 39 Carlisle Homes Pty Ltd 68 14%38 46 Rivergum Homes 62 18%55 72 Rawdon Hill Constructions 58 36%62 91 Normus Urban Projects 54 52%
Biggest Movers in 2010/11Builders who increased their starts by 50 or more
Rank Increase in starts in 2010/11

HIA-COLORBOND® steel Housing 100 – 2010/11
Company2010/11 2009/10 2010/11 2009/10
1 3 Metricon Homes 3,060 3,2142 2 Alcock/Brown-Neaves Group 2,529 3,4273 1 BGC (Australia) 2,181 3,8364 4 Simonds Group 2,161 2,1915 7 Porter Davis Homes 1,824 1,5646 5 Henley Properties 1,748 1,8817 6 JWH Group 1,318 1,6518 9 GJ Gardner Homes ** 1,176 -9 10 Hickinbotham Group of Companies 1,058 1,19410 8 Dennis Family Homes 1,026 1,38711 15 Burbank Homes 866 98212 20 JG King Pty Ltd 844 91113 - McDonald Jones Homes 817 85514 17 Scott Park Homes 811 98115 11 Hotondo Homes ** 788 -16 19 Content Living 776 92817 13 Masterton 762 1,02218 14 Clarendon Residential Group 705 99019 - Tamawood * 661 45720 - Redink Homes Pty Ltd / 101 Residential Pty Ltd 643 551
* Some dwellings built under franchise
** All dwellings built under franchise
LARGEST 20 - Detached house builders
Rank Starts

HIA-COLORBOND® steel Housing 100 – 2010/11
28% 28% 28%
34% 35% 36%
41%37%
44%41% 41% 40%
38%40% 40%
36%
44%46%
42%
0%
5%
10%
15%
20%
25%
30%
35%
40%
45%
50%
92/93 93/94 94/95 95/96 96/97 97/98 98/99 99/00 00/01 01/02 02/03 03/04 04/05 05/06 06/07 07/08 08/09 09/10 10/11
Housing 100 Market Share - Houses Source: HIA Housing 100

HIA-COLORBOND® steel Housing 100 – 2010/11
Company2010/11 2009/10 2010/11 2009/10
1 1 Hickory Group Pty Ltd 2,003 1,2742 2 Brookfield Multiplex 1,618 3623 4 L.U. Simon Builders 1,246 8264 3 Meriton Apartments 741 1,1795 13 Bloomer Constructions Pty Ltd 720 2036 7 Philip Usher Constructions 708 3897 - Mirvac Group 633 08 - Devine Group 591 09 5 Pindan Pty Ltd 586 568
10 - Chase Building Group Pty Ltd 330 6511 6 BGC (Australia) 254 55612 11 Clarendon Residential Group 230 21613 - Australand 197 5014 12 Summit Homes Group 178 20615 14 Simonds Group 156 20116 - Burbank Homes 149 5117 17 Alcock/Brown-Neaves Group 139 9918 - McGrath Homes 136 019 16 JG King Pty Ltd 135 12120 15 Danmar Homes 132 131
* Some dwellings built under franchise
** All dwellings built under franchise
LARGEST 20 - Multi-unit builders
Rank Starts

HIA-COLORBOND® steel Housing 100 – 2010/11
Rank Company2010/11 2010/11 2009/10
1 Simonds Group 2,228 2,3762 Metricon Homes 2,153 2,3353 Hickory Group Pty Ltd 1,980 1,2264 Porter Davis Homes 1,824 1,5645 Brookfield Multiplex 1,446 3176 L.U. Simon Builders 1,246 8267 Henley Properties 1,092 1,1178 Dennis Family Homes 1,016 1,3299 Burbank Homes 1,015 1,033
10 JG King Pty Ltd 967 1,02211 Carlisle Homes Pty Ltd 560 49212 Mirvac Group 396 3813 Hotondo Homes ** 364 43414 GJ Gardner Homes ** 357 35515 WSH Group Pty Ltd 345 34416 Orbit Homes Group 330 36417 Alcock/Brown-Neaves Group 257 11218 Hamlan Homes 245 35719 Glenvill * 242 29220 Snowdon Developments 221 165
Total 18,284 16,098Largest 20 market share comparison 31%* Some dwellings built under franchise
** All dwellings built under franchise
VICTORIA - 2010/11 STARTS = 59,116Starts

HIA-COLORBOND® steel Housing 100 – 2010/11
Rank Company2010/11 2010/11 2009/10
1 McDonald Jones Homes 817 8552 Masterton 757 1,0223 Meriton Apartments 741 4534 Clarendon Residential Group 684 8455 Mirvac Group 658 4306 Eden Brae Homes 599 6217 Allworth Homes 448 5378 Metricon Homes 415 2409 GJ Gardner Homes 414 385
10 Hotondo Homes 269 33011 Perry Homes (Aust) 216 23012 Coral Homes 213 24313 Lily Homes 171 20114 Integrity New Homes Pty Ltd 158 12215 ProCorp Builders 146 016 Firstyle Homes Pty Ltd 124 11817 Montgomery Homes Pty Ltd 110 10618 Eagle Homes 85 13619 Alkira Homes 81 5520 Allam Homes 76 113
Total 7,182 7,042Largest 20 market share 24%* Some dwellings built under franchise
** All dwellings built under franchise
NEW SOUTH WALES - 2010/11 STARTS = 30,135Starts

HIA-COLORBOND® steel Housing 100 – 2010/11
Rank Company2010/11 2010/11 2009/10
1 Bloomer Constructions Pty Ltd 920 3002 Philip Usher Constructions 791 4523 Tamawood * 643 6364 Devine Group 602 2625 Henley Properties 516 6646 Metricon Homes 486 6397 Hallmark Homes 376 5398 Coral Homes * 356 6879 GJ Gardner Homes ** 348 483
10 Tribeca Homes Pty Ltd 249 30211 Ausbuild 247 28912 Palmlake Works 226 18613 Alliance Homes 190 30814 Brookfield Multiplex 172 015 Hayman Homes 149 28416 Orbit Homes Group 142 23817 Mirvac Group 140 018 Hotondo Homes ** 116 19619 Parkside Constructions 105 11120 Rivergum Homes 103 28
6,877 6,604Largest 20 market share comparison 26%* Some dwellings built under franchise
** All dwellings built under franchise
QUEENSLAND - 2010/11 STARTS = 26,443Starts

HIA-COLORBOND® steel Housing 100 – 2010/11
Rank Company2010/11 2010/11 2009/10
1 BGC (Australia) 2,435 4,3922 Alcock/Brown-Neaves Group 2,411 3,4143 JWH Group 1,318 1,6514 Scott Park Homes 811 9815 Summit Homes Group 786 9956 Content Living 776 9287 Pindan Pty Ltd 688 7698 Gemmill Homes 686 7219 Redink Homes Pty Ltd / 101 Residential Pty Ltd 643 551
10 The Ross North Group 345 48311 Danmar Homes 230 18812 Aveling Homes 200 18013 Peter Stannard Homes 184 20714 Home Australia 169 20515 Highbury Homes (WA) Pty Ltd 152 15016 McGrath Homes 136 017 Australand 133 12818 Meliador WA Pty Ltd 59 7819 Colin Wilkinson Developments P/L 52 11420 GJ Gardner Homes ** 40 41
Total 12,254 16,176Largest 20 market share comparison 59%* Some dwellings built under franchise
** All dwellings built under franchise
WESTERN AUSTRALIA - 2010/11 STARTS = 20,617Starts

HIA-COLORBOND® steel Housing 100 – 2010/11
Rank Company2010/11 2010/11 2009/10
1 Hickinbotham Group of Companies 1,058 1,1942 Devine Group 348 3953 Rivergum Homes 299 3124 Longridge Group 289 2915 Rossdale Homes 265 3936 McCracken Group 250 2537 Home Australia 231 2558 Normus Urban Projects 157 1039 Oakford Homes 154 204
10 Adelaide Designer Homes 96 1811 Eastern Building Group Pty Ltd 93 20012 Henley Properties 70 6713 Regent Homes (SA) PL 66 6514 Hotondo Homes ** 29 5115 Hickory Group Pty Ltd 23 4816 GJ Gardner Homes ** 16 57
Total 3,444 3,906Largest 15 market share comparison 32%* Some dwellings built under franchise
** All dwellings built under franchise
SOUTH AUSTRALIA - 2010/11 STARTS = 10,732Starts

HIA-COLORBOND® steel Housing 100 – 2010/11

2011Construction Outlook
Breakfast