2011: hysteresis of capillary pressure, resistivity index ...jgmaas.com/sca/2011/sca2011-14.pdf ·...
TRANSCRIPT

SCA2011-14 1/12
HYSTERESIS OF CAPILLARY PRESSURE, RESISTIVITY INDEX AND RELATIVE PERMEABILITY IN
CARBONATE ROCK TYPES
Moustafa R Dernaika1, M Z Kalam2, M Basioni2, A Dawoud2 and Svein M Skjæveland3 1Ingrain Inc., Abu Dhabi, 2ADCO, Abu Dhabi, and 3University of Stavanger, Norway
This paper was prepared for presentation at the International Symposium of the
Society of Core Analysts held in Austin, Texas, USA 18-21 September, 2011 ABSTRACT Experimental measurements of capillary pressure, resistivity index and relative permeability display hysteresis which manifests itself through the dependence of these properties on the saturation path and saturation history whenever fluid saturations undergo cyclic processes. At the pore scale level, hysteresis is typically influenced by contact angle hysteresis, trapping of one phase by another and wettability changes. A laboratory study was conducted to investigate hysteresis effects measured on reservoir core plugs for a major carbonate hydrocarbon reservoir in the Middle East. Representative core samples covering main reservoir rock types (RRT) were selected based on whole core and plug X-ray CT, NMR T2, high pressure mercury injection (MICP), porosity, permeability and Thin Section analyses. Primary drainage and imbibition capillary pressure and resistivity index (PcRI) were measured by the Porous Plate method using stock tank oil (STO) and simulated formation brine (SFB) at reservoir temperature and overburden conditions. Large hysteresis effects were obtained between primary drainage and imbibition for both Pc and RI curves. Low residual oil saturations (Sor) were measured at the end of forced imbibition indicating oil-wet to mixed-wet characteristics. Non-linear RI curves were found during imbibition which could not be described by conventional Archie equation. Water-oil relative permeability curves were measured on similar reservoir core samples by the steady state technique using live fluids at full reservoir conditions with in situ saturation monitoring. Hysteresis effects on both oil and water curves were observed between primary drainage and imbibition, and appear to be influenced by the sample rock type involved (i.e. wettability and pore structure). An improved understanding of the hysteresis phenomena in a cretaceous carbonate reservoir is proposed with a description of the mechanism involved at the pore scale level. This may have a significant impact on our understanding of hydrocarbon recovery, trapped fluid saturations and representation of appropriate two-phase and three-phase fluid displacements. INTRODUCTION Knowledge of hysteresis phenomena in porous media is necessary for the understanding of saturation distributions in complicated reservoir flow histories and in many EOR applications [1]. Fleury et al reported strong hysteresis in resistivity index (RI) between

SCA2011-14 2/12
primary drainage and imbibition which had large impact on log data calibration. The behavior was referred to the strong hysteresis in capillary pressure curves but detailed understanding or description of the mechanism involved was still lacking [2]. Masalmeh presented a conceptual hysteresis model which attributed hysteresis to three main factors: fluid trapping, contact angle hysteresis and wettability changes. The model explained most of the observed trends in capillary pressure (Pc) and relative permeability (Kr) hysteresis [3]. Schematic diagrams of the relative permeability hysteresis between primary drainage and imbibition on both oil and water curves are given for water wet and oil wet cases in Figure 1A and Figure 1B, respectively. We choose to present this Kr hysteresis model schematically due to the scarcity of such experimental curves and because it relates to our experimental data presented in this paper. Figure 1A and Figure 1B show respectively the Kr hysteresis trends for water wet and oil wet scenarios with brief explanations of the fluid flow mechanisms and sequence of invasion. For the water wet case both imbibition relative permeability to oil (Kro) and to water (Krw) are shifted to lower water saturations due to oil trapping which causes lower mobile oil saturation. This will cause the imbibition Kro to be lower than the primary drainage Kro curve, and will cause the imbibition Krw to be higher than the primary drainage Krw. However, oil trapping may hinder water flow and thus may lead to lower imbibition Krw than the primary drainage Krw. Hence, there will be two opposing effects on the imbibition Krw and, which in many cases can cause no major hysteresis in the Krw curve between primary drainage and imbibition in water wet systems. For the mixed oil wet case, imbibition will start displacing big oil wet pores and small water wet pores. Water will occupy more big pores during imbibition than during primary drainage, and this may lead to higher imbibition Krw than primary drainage Krw curve. Imbibition Kro will be lower than the primary drainage Kro since there will be fewer large pores occupied with oil. This is only a brief introduction to the relative permeability conceptual hysteresis model between primary drainage and imbibition. More details can be found in the published work of Masalmeh [3]. In this paper we present experimental hysteresis in capillary pressure, resistivity index and relative permeability between primary drainage and imbibition on different carbonate rock types. Strong hysteresis was found in resistivity index and capillary pressure curves. We suggest a pore-level scenario for the fluid flow and distribution to explain the resistivity index hysteresis. Relative permeability hysteresis showed different patterns for different rock types which could possibly be attributed to the complex relation between the effect of wettability and pore structure. DISPLACEMENT MECHANISMS In primary drainage, oil invasion occurs by piston like displacement. In imbibition, piston-like invasion and snap off mechanisms are possible. Snap-off occurs as a result of increased water content from the corners or by swelling of films in water wet pores. Water may invade the entire cross-section and cut off oil, resulting in trapped oil. Snap-off only occurs if piston-like invasion is topologically impossible since the capillary pressure for piston-like invasion is favourable compared to the capillary pressure for snap-off [4]. Snap-off can be more favourable over piston-like displacement in spontaneous imbibition if the pore is surrounded by several oil-filled throats, when

SCA2011-14 3/12
advancing contact angle is small and when the pore system is characterized by large aspect ratio. Hence, the type of pore-level displacement which occurs depends upon whether the process is drainage or imbibition, and the geometry of the pore space. HYSTERESIS Hysteresis refers to irreversibility or path dependence. For saturation-dependent rock properties such as capillary pressure, resistivity index and relative permeability, hysteresis manifests itself through the dependence of these properties on the saturation path and saturation history. Hysteresis is mainly caused by contact angle hysteresis, fluid trapping and wettability [1,3]. Contact angle hysteresis is the variation in contact angle with the direction of displacement. Water receding contact angle in drainage is always smaller than water advancing contact angle in imbibition. This hysteresis is usually attributed to non-equilibrium effects, contamination or heterogeneity of the surface due to either roughness or composition. Fluid trapping is a result of pore space geometry and is caused by instabilities in the fluid-fluid interface configurations. Such an instable configuration occurs if an advancing interface undergoes a decrease in curvature in a drainage process. The instable interface jumps very rapidly displacing wetting phase from the pore. These jumps are known as Haines jumps and are irreversible, and thus cause permanent hysteresis between drainage and imbibition [12]. Haines jumps have been shown to be pronounced with large aspect ratios which in turn have direct effect on hysteresis loops [13]. Wettability is the overall tendency of a reservoir rock to prefer one fluid over another [14]. It depends on rock pore size distribution and rock-fluid interactions. It is influenced by fluid composition, rock surface mineralogy, temperature, pressure and thickness of water films. Upon oil invasion by capillary action a thin film of water remains adsorbed on the pore surface and protects the solid from the oil. At a certain critical capillary pressure the water film ruptures and oil gets access to the surface. Stability of the water film depends on prevailing capillary pressure and disjoining pressure isotherm [15]. The disjoining pressure isotherm is dependent on the surface mineralogy, fluid composition and pore shape. When oil gets in contact with the surface wettability alteration occurs and the degree of alteration will depend on the fluid and surface compositions (i.e. rock-fluid interactions). The pore corners and crevices where water is still present remain water-wet. This leads to development of heterogeneous forms of wettability, where some parts of the rock surface are altered oil-wet, while other parts remain water-wet [16]. Wettability changes (i.e. absence of thin films) can give rise to considerable hysteresis in the oil-water contact angle [12]. Wettability alteration and contact angle hysteresis have their origins at the micro scale. Fluid trapping occurs at a bigger scale and is caused by pore morphology. Both wettability changes and hysteresis in contact angle largely affect the degree of trapping. EFFECT OF ROCK TYPE ON HYSTERESIS Dernaika et al [17] reported distinct hysteresis patterns between primary drainage and imbibition for capillary pressure and resistivity index curves obtained on different carbonate rock types. The distinct hysteresis trends were obtained on samples treated

SCA2011-14 4/12
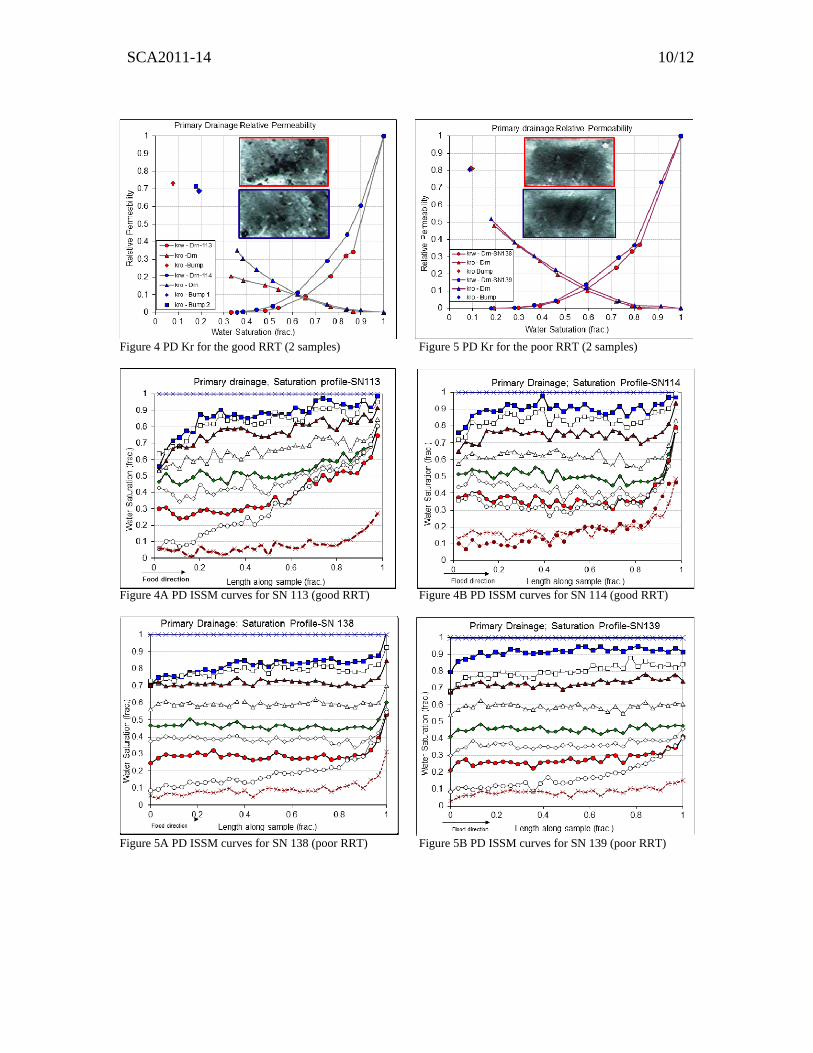
with same fluids and performed at the same experimental conditions. The different hysteresis was attributed to the combined effect of pore geometry and rock-fluid interactions. Jerauld and Salter [1] conducted a pore-level modeling study to understand the impact of pore structure on hysteresis behavior in relative permeability and capillary pressure in strongly-wetting systems at low capillary number. They found that the pore body to pore throat aspect ratio was the most important structural determinant of the hysteresis behavior. The pore size distribution was of secondary importance. These studies together with the underlying pore scale physics clearly demonstrate the role of rock type in yielding various displacement mechanisms causing different hysteresis trends in capillary pressure and relative permeability. EXPERIMENTAL MEASUREMENTS Representative (1.5” diameter) core samples were selected from a carbonate field based on whole core and plug X-ray CT, NMR T2, high pressure mercury injection (MICP), porosity, permeability and Thin Section analyses. Seven samples covering main RRT’s were selected for capillary pressure and resistivity index (PcRI) measurements and 4 samples from best and poor RRT’s were selected for steady state relative permeability (Kr). The best high permeability RRT samples were absent in the PcRI measurements (see figure 2). Helium (He) porosity of the selected samples ranged from 16% to 26% and the permeability varied from 0.63 mD to 46 mD (see Figure 2). Pore throat size distribution (PSD) curves of the selected samples are given in Figure 3. Primary drainage and imbibition experiments were performed to investigate hysteresis. The PcRI tests were conducted by the porous plate method at net overburden stress and reservoir temperature using dead crude oil and simulated formation brine. The Kr tests were performed at full reservoir conditions using live fluids with in-situ saturation monitoring (ISSM). All Kr samples underwent an aging period of 4 weeks at the end of primary drainage at full reservoir conditions without changing the experimental setup. EXPERIMENTAL RESULTS AND DISCUSSIONS Relative Permeability Figure 4 shows the primary drainage (PD) relative permeability to water (Krw) and to oil (Kro) for the two high perm samples with corresponding plug CT images. These two samples (#113 & #114) represent the good RRT in the reservoir. The curves show differences in the Kr behavior which could be attributed to the sample heterogeneity, and which may be inferred from the given CT images, poroperm data and PSD. Moreover, sample #113 shows more vuggy nature than sample #114. Sample #113 suffered from capillary end effect which caused the Kro curve to flatten at lower water saturation (Sw). A bump flood was designed to establish more uniform Sw and to reach representative initial water saturation (Swi). The bump floods for both samples and the saturation profiles were monitored through ISSM curves along the lengths of the samples (see Figure 4A and Figure 4B). Primary drainage Krw and Kro for the low perm samples are plotted in Figure 5 with corresponding CT images. Both samples (#138 & #139) represent the poor RRT in the reservoir and show exactly the same PD Kr characteristics. This is consistent with the given CT images, and the poroperm and PSD reported earlier

SCA2011-14 5/12
in Figure 2 and Figure 3 respectively. Their ISSM curves are given in Figure 5A and Figure 5B which show smoother curves as compared to the high permeability samples’. One can deduce from the PD Kr characteristics (i.e. Kr end points and Krw-Kro intersections) for both RRT’s that the samples have shown fairly water wet behavior [3]. Figure 6 and Figure 7 present the imbibition relative permeability for the good and the poor RRT’s, respectively. Figure 6A gives thin-section images for samples (#113 & 114) which provides more insight into the small variations within the heterogeneous good RRT samples. Figure 7A shows thin-section images for samples (#138 & 139) which confirms the similarities between the poor RRT samples. In Figure 6, sample #114 shows more oil wet Kr characteristics than sample #113 although both samples have similar mineralogy and underwent similar experimental conditions. For sample #114 the Krw-Kro intersection occurs at lower Sw and Krw end point at residual oil saturation Krw(Sor) increases to a higher level than Krw(Sor) from sample #113. We believe the variations in imbibition Kr curves are the result of the variations in drainage Kr and hence the variations in the sample properties. In fact, sample #113 would normally be expected to show more oil wet Kr characteristics since it reached lower Swi [5] but this is not the case. We believe the Kr curve is not only affected by wettability but also influenced by rock type (e.g. vugs and heterogeneity). Figure 7 depicts the imbibition Kr curves from the poor RRT samples. There is very close similarity between sample #138 and sample #139. The samples show less oil wet characteristics than the good RRT samples although they were treated in the same fluid pair and measured at the same experimental conditions. Before imbibition both samples were drained to low Swi and were aged for 4 weeks. So, are these samples really less oil wet than the good RRT samples? Such a conclusion may not be made and one should be careful when deducing wettability from macro property measurements. In addition to the effect of wettability different rock types should be recognized when judging the rock behavior. The good RRT sample #113 and #114 have mean pore throat radii at 2.5 microns and 1.5 microns respectively whereas the poor RRT samples have mean pore radius around 0.45 microns. Such differences in pore throat sizes, pore throat size distributions, mineralogy and possible differences in pore sizes and shapes between the different rock types can yield different wettability distributions and varying displacement mechanisms at the pore scale. It should also be mentioned here that the effect of wettability on the relative permeability end points is still subject for discussions, and the rules of thumb presented in several books [e.g. 10] are questioned by several researchers [e.g. 11], especially for mixed wettability systems. Relative Permeability Hysteresis Figure 8 plots the primary drainage and imbibition relative permeability data for sample #114 from the good RRT. Figure 9 plots the same type of data for sample #139 from the poor RRT. The other samples from the given RRT’s show similar hysteresis trends. Both of these figures represent relative permeability hysteresis which could be compared with the depicted hysteresis model in Figure 1A and Figure 1B. One can easily tell that the hysteresis model would classify the good RRT samples as oil wet and the poor RRT samples as water wet. Figure 10 and Figure 11 present the hysteresis trends in semi-log

SCA2011-14 6/12
axes to emphasize the strong experimental hysteresis measured in these RRT’s. For the good RRT samples the possible pore level scenario could be that all pores were converted to oil wet at the end of drainage (after aging). This will be later emphasized by spontaneous imbibition behavior from the Pc experiments. At the start of imbibition, water invades the biggest pores first giving rise to higher imbibition Krw than drainage Krw. In drainage water was moving in smaller pores at a given Sw. The flow mechanism in this imbibition process is mainly piston like displacement with less oil trapping [4]. This is also evidenced by the approach of the imbibition Krw to the drainage Krw curve (see semilog Figure 10). Imbibition Kro, on the other hand, moves downward as compared to drainage Kro since less oil is left in the big pores during imbibition [3]. This explanation of the oil wet case apparently does not apply to the poor RRT samples. For this RRT the possible scenario could be that fewer pores were converted to oil wet. Hence, oil trapping is pronounced during imbibition by possible snap off mechanism [4]. This oil trapping will cause lower mobile oil saturation and hence will shift both imbibition Kro and Krw to the left (see Figure 1A). At the same time the oil trapped in the middle of the pores may hinder water flow and thus may lower imbibition Krw below drainage Krw. So, imbibition Krw may have opposing factors in the hysteresis behavior. If the opposing factors are equal we may end up with no hysteresis in Krw [3]. This explanation is in line with earlier investigations which observed that in almost all capillary-dominated flows of strongly-wetting phases, the non-wetting phase Kr showed much more hysteresis than the wetting phase [1]. The experimental hysteresis results from our poor RRT samples may suggest that the oil trapping effect is the dominating factor and must be governed by the geometry of the pore space (e.g. aspect ratio). It is interesting to see only minor differences (in Figure 12) in the primary drainage relative permeability between sample #114 from the good RRT and sample #139 from the poor RRT. In the imbibition mode (in Figure 13) there is a profound difference in the relative permeability behavior between the same samples. This behavior could be attributed to the interaction effect between wettability and rock type (i.e. pore space) on the complex displacement mechanisms involved in the imbibition process. Capillary Pressure and Resistivity Index Experiments were performed by the porous plate method which allows for combined capillary pressure and resistivity index (PcRI) measurements. Figure 14 shows the primary drainage and imbibition capillary pressure curves for the samples whose poroperm data and PSD curves were given in figure 2 and figure 3, respectively. The samples spent over 12 months in the drainage cycle with crude oil at reservoir temperature. This experimental condition is expected to yield non-water wet state at the end of drainage, which was confirmed by the absence of spontaneous imbibition upon stepwise decrease of Pc level to zero. Forced imbibition curves went down to low residual oil saturations Sor (i.e. Sw ~ 0.8-0.9) which is another indication of mixed wet to oil wet condition where water can invade in piston like displacement mechanism and oil production is possible through oil films [6]. Figure 15 depicts one sample example for drainage and imbibition resistivity index data as a function of water saturation. Figure 16 and Figure 17 present all sample RI curves for drainage and imbibition respectively.

SCA2011-14 7/12
There is clear hysteresis in RI between drainage and imbibition cycles causing hysteresis in the calculated Archie saturation exponent “n” as well. Hysteresis in resistivity can be explained by a proposed water invasion mechanism at the pore level. At the end of drainage almost all invaded pores are oil wet (absence of spontaneous imbibition). Initial water saturation (Swi) accounts for bulk water in non-invaded small pores, bulk water in the surface grooves, nooks and crannies of the pore walls and small fraction of adsorbed water films which probably account for less than one saturation percent [1,7]. Electric conductivity is only possible through water present in the non-invaded pores and in pore wall grooves. Adsorbed water films must have been replaced by oil films as part of conversion to oil wetness during primary drainage [8]. Water in the pores and pore wall grooves may not totally participate in the electric conductivity unless it is all in hydraulic conductivity [9]. As imbibition starts with low negative Pc water invades biggest pores only. Capillary pressure is fixed at the low level until water invasion (i.e. oil production) ceases as part of the porous plate experimental design. Resistivity starts dropping as water invasion proceeds. Water at this stage does not invade all pores and thus water does not span the porous medium especially if the big pores are less in number and not well connected. The invading water may not come to a complete connectivity with the existing water at Swi. Hence, resistivity does not drop enough to equate the effect of increasing Sw in the Archie equation and hence saturation exponent “n” is higher than that of drainage at the same Sw. As water invades smaller pores at increasing negative Pc levels water starts connecting and an increasing drop in resistivity occurs until it approaches the drainage RI curve. This behavior is clearly seen (in all the samples) which suggests imbibition to take place through piston like displacement with less oil trapping. CONCLUSIONS AND OBSERVATIONS 1. High permeability good rock type samples showed more tendency towards oil wet
relative permeability behavior as compared to the poor rock type samples. This is also confirmed from previous wettability indices on similar RRT’s.
2. Primary drainage and imbibition relative permeability curves showed different hysteresis patterns on different rock type samples which could be attributed to the combined effect of wettability and pore geometry.
3. Strong hysteresis in “RI” and “n” was explained by a proposed fluid invasion behavior at the pore level, and was attributed to varying displacement mechanisms between primary drainage and imbibition. Conventional assumption of Archie behavior is therefore not always valid for such carbonate RRT’s.
4. Our results suggest significant impact on the estimations of ROS, and hence proper hysteresis measurements are important for better quantification of hydrocarbon recovery and trapped fluid saturations.
5. The experiments in this study show that hysteresis effects in general cannot be neglected, but for practical applications it may suffice to extend the measured data range by correlations, numerical network models and/or digital rock physics.

SCA2011-14 8/12
ACKNOWLEDGEMENTS The authors wish to acknowledge ADNOC and ADCO Management for permission to publish the results of this SCAL study entailed in this paper. The primary author is grateful to Ove Bjorn Wilson for his review and useful comments on the paper. REFERENCES 1. Jerauld, G. R., and S. J. Salter, Effect of pore-structure on hysteresis in relative
permeability and capillary pressure: Pore-level modeling, Transport in Porous Media, 5, 103-151, 1990
2. M Fleury, M. S. Efnik and M .Z. Kalam, “Evaluation Of Water saturation From Resistivity In A Carbonate Field”, SCA 2004 – 22, Abu Dhabi.
3. Masalmeh, S.K.: “Experimental Measurements of Capillary Pressure and Relative Permeability Hysteresis” SCA 2001-23 presented at the SCA 2001 conference, Edinburgh, September (2001)
4. Lenormand, R., C. Zarcone, and A. Sarr, Mechanisms of the Displacement of One Fluid by Another in a Network of Capillary Ducts, Journal of Fluid Mechanics, 135, 337-353, 1983
5. Jadhunandan, P. P., and N. R. Morrow, Effect of Wettability on Waterflood Recovery for Crude-Oil Brine Rock Systems, SPE Reservoir Engineering, 10, 40-46, 1995
6. Salathiel, R. A., Oil Recovery by Surface Films Drainage In Mixed-Wettability Rocks, Journal of Petroleum Technology, 25, 1216-1224, 1973
7. Morrow, N. R., Irreducible wetting-phase saturations in porous media, Chem. Eng. Sci. 25, 1799-1815, 1970
8. Kaminsky, R., and C. J. Radke, Asphaltenes, water films, and wettability reversal, SPE Journal, 2, 485-493, 1997
9. Gladkikh, M., and S. Bryant, Prediction of imbibition in unconsolidated granular materials, Journal of Colloid and Interface Science 288, 526–539, 2005
10. Honarpour, M., Koederitz, L., and Harvey, A.H., Relative Permeability of Petroleum Reservoirs, CRC Press Inc, Boca Raton, 1987.
11. Morrow, N.R., Wettability and Its Effect on Oil Recovery, JPT, 1476-84, Dec. 1990. 12. Melrose, J.C, Wettability as Related to Capillary Action in Porous Media, paper SPE
1085, SPEJ (1965), paper presented at SPE-AlChE Joint Symposium on Wetting and Capillarity in Fluid Displacement Processes, 1959.
13. Toledo, P.G., Scriven, L.E., and Davis, H.T., Pore-Space Statistics and Capillary Pressure Curves From Volume-Controlled Porosimetry, SPEFE (March 1994) 46-54.
14. Longeron, D., Hammervold, W.L., and Skjaeveland, S.M., Water-Oil Capillary Pressure and Wettability Measurements Using Micropore Membrane Technique, SCA 1994-26 presented at the SCA 1994 conference.
15. Hirasaki, G.J., Thermodynamics of Thin Films and Three-Phase Contact Regioins, Interfacial Phenomena in Oil Recovery, N.R. Morrow (ed.), Marcell Dekker, New York, 23-76, 1991
16. Kovscek, A.R., Wong, H., and Radke, C.J.: “A pore-level scenario for the development of mixed wettability in oil reservoirs,” Am. Inst. Chem. Eng. J. (1993) 39, No. 6, 1072–1085.

SCA2011-14 9/12
17. Dernaika, M., M.S. Efnik, M.S. Koronful, M.Al Mansoori, H. Hafez and M.Z. Kalam: “Case Study For Representative Water Saturation From Laboratory to Logs and the Effect of Pore Geometry on Capillarity” SCA2007-38 presented at the SCA 2007 conference, Calgary, Canada, September (2007)
End of drainageDuring imbibition, oil trapping causes lower mobile oil saturation
However, Oil trapping may hinder water flow and thus may lead to lower Krw
1
0
Kro
Krw
Kr
1Swi
Water Wet For water-wet porous medium
Figure 1A Schematic diagram for water wet Kr hysteresis based on conceptual model from reference [3]
For mixed-wet porous medium
Water wet pore
Oil wet poreOil wet pore
Water wet pore
Very small pore Small pore
Intermediate pore
Big pore
End of drainage
Start of Imbibition
Displaces big oil wet pores and small water wet pores
1
Sw0
Kro
Krw
Kr
1Swi
Oil Wet
Figure 1B Schematic diagram for oil wet Kr hysteresis based on conceptual model from reference [3]
Figure 2 Poroperm for PcRI and Kr samples Figure 3 Hg-derived PSD corresponding to figure 2
SCA2011-14 10/12
Figure 4 PD Kr for the good RRT (2 samples) Figure 5 PD Kr for the poor RRT (2 samples)
Figure 4A PD ISSM curves for SN 113 (good RRT) Figure 4B PD ISSM curves for SN 114 (good RRT)
Figure 5A PD ISSM curves for SN 138 (poor RRT) Figure 5B PD ISSM curves for SN 139 (poor RRT)

SCA2011-14 11/12
Figure 6 Imb Kr for the good RRT (2 samples) Figure 7 Imb Kr for the poor RRT (2 samples) SN-113 SN-114 SN-138 SN-139
Figure 6A Thin-sections for the good RRT plugs Figure 7A Thin-sections for the poor RRT plugs
Figure 8 Kr hysteresis in good RRT plug#114 Figure 9 Kr hysteresis in poor RRT plug #139 Green arrows indicate direction of hysteresis Green arrows indicate direction of hysteresis
Figure 10 Semilog representation of Figure 8 Figure 11 Semilog representation of Figure 9 Red and blue arrows indicate direction of Kr Red and blue arrows indicate direction of Kr

SCA2011-14 12/12
Figure 12 Comparison of drainage Kr between RRT’s Figure 13 Comparison of imbibition Kr between RRT’s
Figure 14 Drainage and imbibition Pc curves Figure 15 PD & Imb RI-Sw with “n”
Figure 16 Drainage RI curves with “n” Figure 17 Imbibition RI curves with “n”