2011 integrated resource plan - south carolina
TRANSCRIPT

2011
Integrated
Resource
Plan

1
Introduction
This document presents South Carolina Electric & Gas Company’s (“SCE&G” or
“Company”) Integrated Resource Plan (“IRP”) for meeting the energy needs of its customers
over the next fifteen years, 2011 through 2025. This document is filed with the Public Service
Commission of South Carolina (“Commission”) in accordance with S.C. Code Ann. §58-37-40
(1976, as amended) and Order No. 98-502 and also serves to satisfy the annual reporting
requirements of the Utility Facility Siting and Environmental Protection Act, S.C. Code Ann.
§58-33-430 (1976, as amended). The objective of the Company’s IRP is to develop a resource
plan that will provide reliable and economically priced energy to its customers.
I. The Load Forecast
Total territorial energy sales on the SCE&G system are expected to grow at an average
rate of 1.5% per year over the next 15 years, while firm territorial summer peak demand and
winter peak demand will increase at 1.7% and 1.8% per year, respectively, over this forecast
horizon. The table below contains these projected loads.
Summer Peak (MW)
Winter Peak (MW)
Energy Sales
(GWH)2011 4,726 4,501 22,9522012 4,807 4,554 23,1612013 4,894 4,643 23,5512014 4,989 4,708 23,9912015 5,062 4,810 24,0532016 5,138 4,910 24,3822017 5,220 5,005 24,7052018 5,291 5,097 24,9992019 5,362 5,174 25,2952020 5,439 5,292 25,4122021 5,536 5,399 26,0842022 5,641 5,504 26,5902023 5,748 5,607 27,0872024 5,852 5,713 27,5812025 5,959 5,814 28,103
2
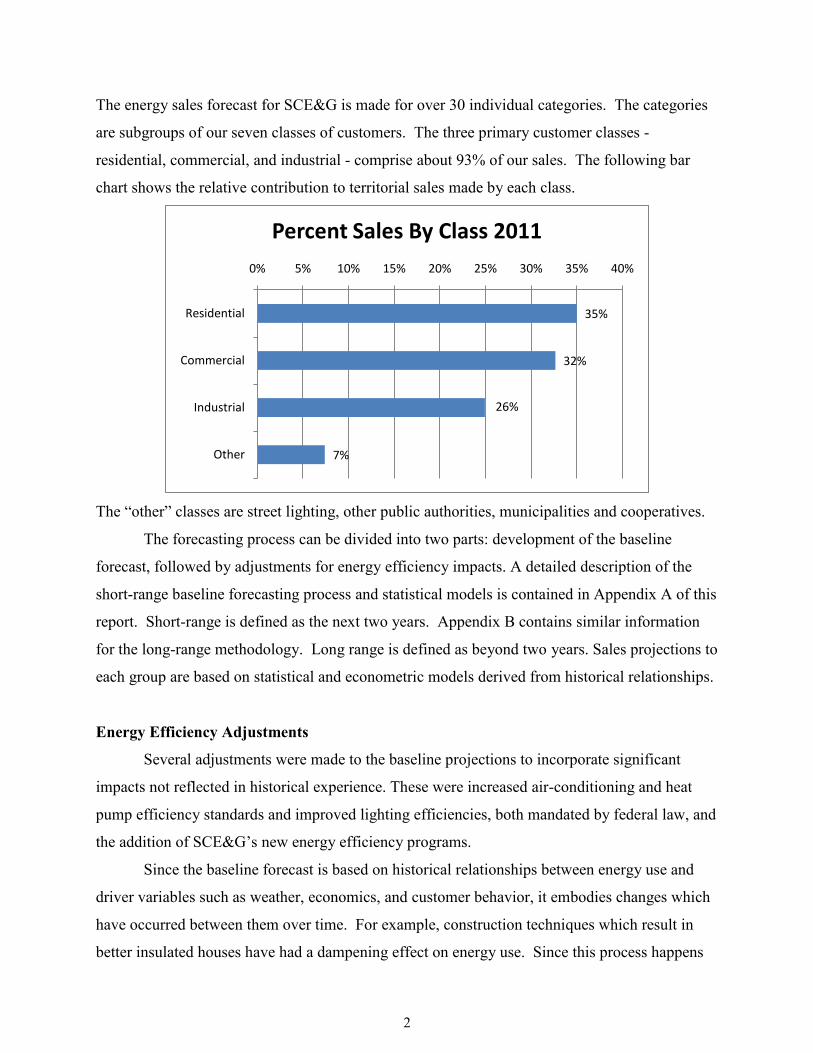
The energy sales forecast for SCE&G is made for over 30 individual categories. The categories
are subgroups of our seven classes of customers. The three primary customer classes -
residential, commercial, and industrial - comprise about 93% of our sales. The following bar
chart shows the relative contribution to territorial sales made by each class.
The “other” classes are street lighting, other public authorities, municipalities and cooperatives.
The forecasting process can be divided into two parts: development of the baseline
forecast, followed by adjustments for energy efficiency impacts. A detailed description of the
short-range baseline forecasting process and statistical models is contained in Appendix A of this
report. Short-range is defined as the next two years. Appendix B contains similar information
for the long-range methodology. Long range is defined as beyond two years. Sales projections to
each group are based on statistical and econometric models derived from historical relationships.
Energy Efficiency Adjustments
Several adjustments were made to the baseline projections to incorporate significant
impacts not reflected in historical experience. These were increased air-conditioning and heat
pump efficiency standards and improved lighting efficiencies, both mandated by federal law, and
the addition of SCE&G’s new energy efficiency programs.
Since the baseline forecast is based on historical relationships between energy use and
driver variables such as weather, economics, and customer behavior, it embodies changes which
have occurred between them over time. For example, construction techniques which result in
better insulated houses have had a dampening effect on energy use. Since this process happens
35%
32%
26%
7%
0% 5% 10% 15% 20% 25% 30% 35% 40%
Residential
Commercial
Industrial
Other
Percent Sales By Class 2011

3
with the addition of new houses and/or extensive home renovations, it occurs gradually. Over
time this factor and others are captured in the forecast methodology. However, when significant
events occur which will impact energy use but are not captured in the historical relationships,
they must be accounted for outside the traditional model structure.
The first adjustment relates to federal mandates for air-conditioning units and heat
pumps. In 2006, the minimum SEER (Seasonal Energy Efficiency Ratio) for newly
manufactured appliances was raised from 10 to 13, which means that cooling loads for a house
that replaced a 10 SEER unit with a 13 SEER unit would decrease by 30% assuming no change
in other factors. The last mandated change to efficiencies like this took place in 1992, when the
minimum SEER was raised from 8 to 10, a 25% increase in energy efficiency. Since then air-
conditioner and heat pump manufacturers introduced much higher-efficiency units, and models
are now available with SEERs up to 19. However, overall market production of heat pumps and
air-conditioners is concentrated at the lower end of the SEER mandate, so the new ruling
represented a significant change in energy use which would not be fully captured by statistical
forecasting techniques based on historical relationships. For this reason an adjustment to the
baseline was warranted.
A second reduction was made to the baseline energy projections beginning in 2012 for
savings related to lighting. Mandated federal efficiencies as a result of the Energy Independence
and Security Act of 2007 will take effect that year, and be phased in through 2014. Standard
incandescent light bulbs are inexpensive and provide good illumination, but they are extremely
inefficient. Compact fluorescent light bulbs (“CFLs”) have become increasingly popular over
the past several years as substitutes. They last much longer and generally use about one-fourth
the energy as that of standard light bulbs. However, CFLs are more expensive and still have
some unpopular lighting characteristics, so their large-scale use as a result of market forces was
not guaranteed. The new mandates will not force a complete switchover to CFLs, but they will
impose efficiency standards that can only be met by them or newly developed high-efficiency
incandescent light bulbs. Again, this shift in lighting represents a change in energy use which
was not present in the historic data.
The final adjustment to the baseline forecast was to account for SCE&G’s new set of
energy efficiency programs. These energy efficiency programs along with the others in
SCE&G’s existing DSM portfolio are discussed later in the IRP.
4
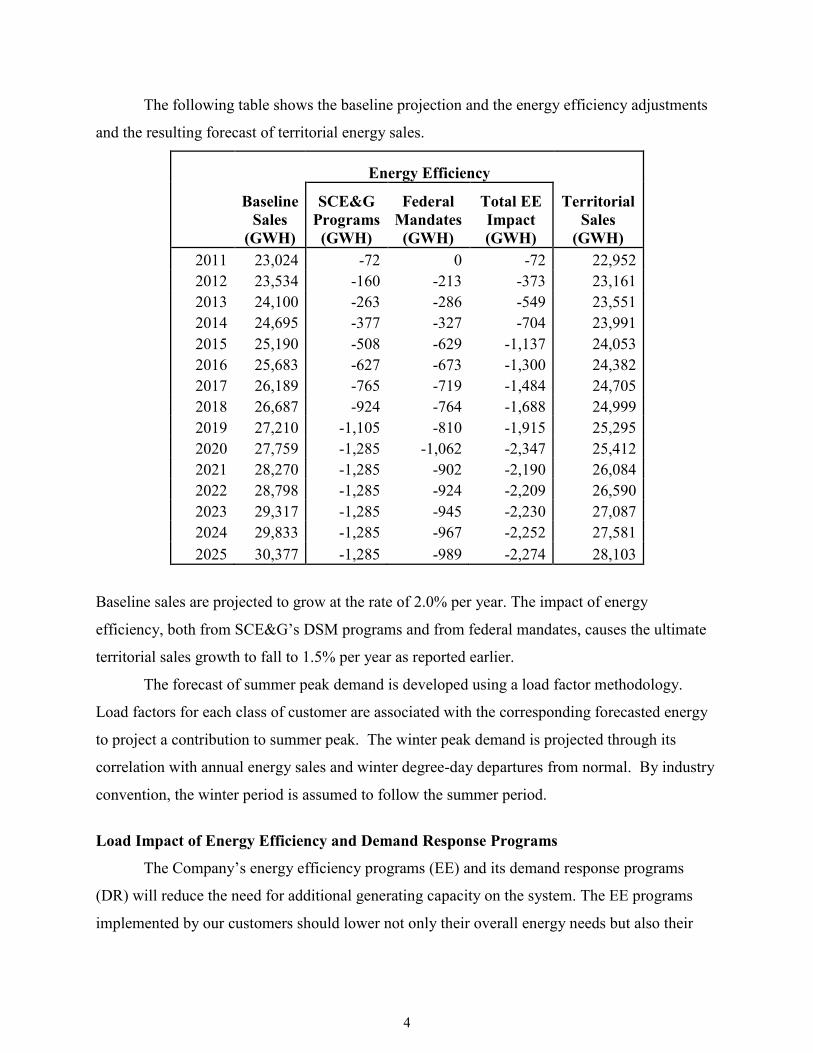
The following table shows the baseline projection and the energy efficiency adjustments
and the resulting forecast of territorial energy sales.
Energy Efficiency
Baseline Sales
(GWH)
SCE&G Programs (GWH)
Federal Mandates (GWH)
Total EE Impact (GWH)
Territorial Sales
(GWH) 2011 23,024 -72 0 -72 22,952 2012 23,534 -160 -213 -373 23,161 2013 24,100 -263 -286 -549 23,551 2014 24,695 -377 -327 -704 23,991 2015 25,190 -508 -629 -1,137 24,053 2016 25,683 -627 -673 -1,300 24,382 2017 26,189 -765 -719 -1,484 24,705 2018 26,687 -924 -764 -1,688 24,999 2019 27,210 -1,105 -810 -1,915 25,295 2020 27,759 -1,285 -1,062 -2,347 25,412 2021 28,270 -1,285 -902 -2,190 26,084 2022 28,798 -1,285 -924 -2,209 26,590 2023 29,317 -1,285 -945 -2,230 27,087 2024 29,833 -1,285 -967 -2,252 27,581 2025 30,377 -1,285 -989 -2,274 28,103
Baseline sales are projected to grow at the rate of 2.0% per year. The impact of energy
efficiency, both from SCE&G’s DSM programs and from federal mandates, causes the ultimate
territorial sales growth to fall to 1.5% per year as reported earlier.
The forecast of summer peak demand is developed using a load factor methodology.
Load factors for each class of customer are associated with the corresponding forecasted energy
to project a contribution to summer peak. The winter peak demand is projected through its
correlation with annual energy sales and winter degree-day departures from normal. By industry
convention, the winter period is assumed to follow the summer period.
Load Impact of Energy Efficiency and Demand Response Programs
The Company’s energy efficiency programs (EE) and its demand response programs
(DR) will reduce the need for additional generating capacity on the system. The EE programs
implemented by our customers should lower not only their overall energy needs but also their
5
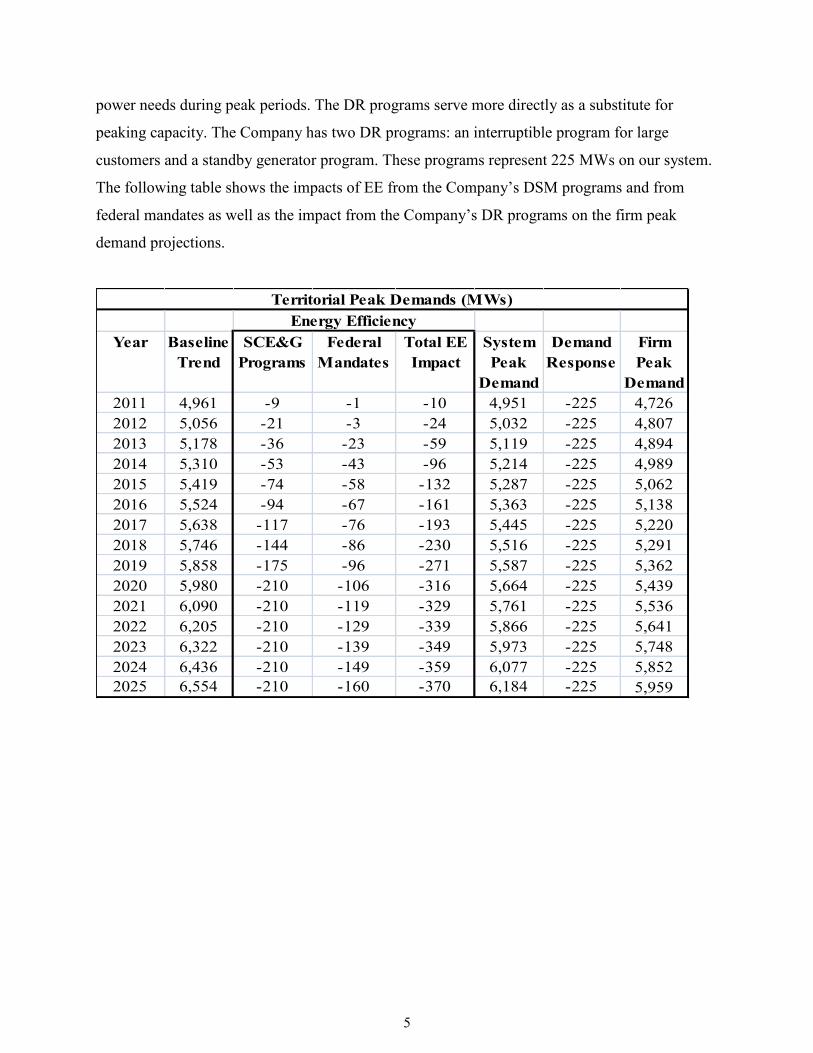
power needs during peak periods. The DR programs serve more directly as a substitute for
peaking capacity. The Company has two DR programs: an interruptible program for large
customers and a standby generator program. These programs represent 225 MWs on our system.
The following table shows the impacts of EE from the Company’s DSM programs and from
federal mandates as well as the impact from the Company’s DR programs on the firm peak
demand projections.
Year Baseline Trend
SCE&G Programs
Federal Mandates
Total EE Impact
System Peak
Demand
Demand Response
Firm Peak
Demand2011 4,961 -9 -1 -10 4,951 -225 4,7262012 5,056 -21 -3 -24 5,032 -225 4,8072013 5,178 -36 -23 -59 5,119 -225 4,8942014 5,310 -53 -43 -96 5,214 -225 4,9892015 5,419 -74 -58 -132 5,287 -225 5,0622016 5,524 -94 -67 -161 5,363 -225 5,1382017 5,638 -117 -76 -193 5,445 -225 5,2202018 5,746 -144 -86 -230 5,516 -225 5,2912019 5,858 -175 -96 -271 5,587 -225 5,3622020 5,980 -210 -106 -316 5,664 -225 5,4392021 6,090 -210 -119 -329 5,761 -225 5,5362022 6,205 -210 -129 -339 5,866 -225 5,6412023 6,322 -210 -139 -349 5,973 -225 5,7482024 6,436 -210 -149 -359 6,077 -225 5,8522025 6,554 -210 -160 -370 6,184 -225 5,959
Territorial Peak Demands (MWs)Energy Efficiency

6
II. Demand-Side Management at SCE&G
Demand-Side Management (DSM) can be broadly defined as the set of actions that can be taken
to influence the level and timing of the consumption of electricity. There are two common
subsets of Demand Side Management: Energy Efficiency and Load Management (also known as
Demand Response). Energy Efficiency typically includes actions designed to increase efficiency
by maintaining the same level of production or comfort, but using less energy input in an
economically efficient way. Load Management typically includes actions specifically designed
to encourage customers to reduce usage during peak times or shift that usage to other times.
Energy Efficiency
SCE&G’s Energy Efficiency programs include Customer Information Programs, Web-based
information, Energy Conservation and the newly offered Demand Side Management programs.
A description of each follows:
1. Customer Information Programs: SCE&G’s customer information programs fall under
two headings: the annual energy campaigns and web-based information initiatives. The
following is an overview of each.
Annual Energy Campaigns: In 2010, SCE&G continued to proactively educate its
customers and create awareness on issues related to energy efficiency and conservation.
a. Customer Outreach Marketing and Communications: Two residential surveys
were distributed in 2010 which provided SCE&G valuable insight on customer
perceptions about how the company communicates its energy efficiency programs
and services. These two vehicles included the annual Brand Health Study and Voice
of the Customer Panel. Customer feedback was evaluated thoroughly and
implemented as appropriate to ensure we are communicating in a consistent manner
that customers will understand.
b. Brand/Mass Advertising and Fall Energy Campaign: Brand advertising for 2010
featured members of the SCE&G Energy Team in a series of print advertising in The
State Newspaper and Aiken Standard, driving customers online to
www.sceg.com/energywise to learn more about SCE&G’s energy saving programs
and services. The company continued to air a series of 30-second educational

7
promotions on TV stations throughout its service territory to include targeted cable
channels and network TV in Columbia and Charleston during local news
programming. Radio continues to be included in the channel mix to ensure a fully
integrated approach to reaching customers with practical savings tips to help save
energy and money. Radio advertising directed customers to www.sceg.com for
additional information and resources.
A continuation of the ongoing brand/mass advertising efforts on energy efficiency
communications, SCE&G launched its annual Fall Energy Campaign in October
(Energy Awareness Month) providing customers with education and updates about
SCE&G’s special offers to include the free Home Energy Check-up. Also included
was a reminder about the final December 31st deadline for federal tax credits
available for qualified energy efficient home upgrades. Channels of communication
included major daily newspapers and their respective web sites for The State
Newspaper and Aiken Standard. Weekly publications included SC Black News, The
Charleston Chronicle, The Gullah Sentinel, The Carolina Panorama and The
Community Times. The call-to-action for all print advertising included a drive-to-web
for www.sceg.com/energywise. In addition to print, placement with TV and radio
continued throughout year-end to support ongoing communications about saving
energy and money.
c. South Carolina Appliance Rebate Program: In March 2010, SCE&G collaborated
alongside the South Carolina Energy Office, offering in-kind services to help educate
SCE&G residential customers about the South Carolina Energy Office Appliance
Rebate Program. The program, which offered SC residents access to federal funds
awarded to the State of South Carolina for approved, energy efficient appliance
upgrades, was promoted through SCE&G’s web site and blog, as well as through bill
inserts, bill messaging and print advertising. A designated vanity URL
(www.sceg.com/rebates) was developed to ensure updated information about the
program was available to customers with a direct link to the South Carolina Energy
Office web site for further details about the program.
d. SCE&G Business Offices (37 locations within service territory): Energy savings
promotions implemented in all Business Office locations, included posters and
distribution of “Top 10 Energy Savings Tips” via drive-through envelopes.

8
e. EnergyWise Newsletters (Print and new E-Newsletter): Provided energy
efficiency and conservation information for all customer classifications. The print
version of the newsletter is mailed twice annually, with 2010 editions being
distributed during the winter/spring and fall seasons. In addition, we continued to e-
mail the EnergyWise e-newsletter (based on customer demand/online requests for
energy savings information) to approximately 1300 residential customers in 2010.
f. SCE&G/EnergyWise Blog: SCE&G continued to promote its blog in 2010
(www.sceg.com/energywise) for customers to learn more about energy efficiency
programs/services offered by the company. Topics of interest have included a broad
range of energy efficiency messaging, seasonal in nature, and highlighting practical
savings tips about thermostats, water heaters, household appliances, insulation and air
filters, as well as information about SCE&G rebates/incentives and reminders about
the deadline for federal tax credits for approved home efficiency upgrades.
g. News Releases: Distributed to print and broadcast media throughout SCE&G’s
service territory on a variety of energy savings programs and services, seasonal
energy efficiency communications and the collaboration with the South Carolina
Energy Office regarding the Appliance Rebate Program offered through the federal
government stimulus funds.
h. Speakers Bureau: Representatives from SCE&G made presentations on energy
efficiency and conservation programs to several organizations in 2010 including
church groups, senior citizen and low-income housing communities, civic
organizations, builder groups and homeowner associations.
2. Web-Based Information and Services Programs: SCE&G’s online offerings can be
broken into four components: the Energy Analyzer tool, the online Energy Audit tool,
Customer Awareness Information and EnergyWise Blog/E-Newsletter. Altogether there were
more than 2.96 million visits to SCE&G’s website in 2010 and feedback has been positive.
Customers must be registered to use the interactive tools: Energy Analyzer and Energy
Audit. There are over 276,000 customers registered for this access. Following is a description
of these components:
a. Energy Analyzer: The Energy Analyzer, in use since 2004, is a 24 month bill
analysis tool. It uses complex analytics to identify a customer’s seasonal usages and
target the best ways to reduce demand. This Web-based tool allows customers to

9
access their current and historical consumption data and compare their energy usage
month-to-month and year-to-year -- noting trends, temperature impact and spikes in
their consumption. There were a little over 90,000 visits to the Energy Analyzer tool
in 2010.
b. Energy Audit: The Energy Audit tool leads customers through the process of
creating a complete inventory of their home’s insulation and appliance efficiency.
The tool allows customers to see the energy and financial savings of upgrades before
making an investment. There were 4,800 customers who used the Energy Audit tool
in 2010.
c. Customer Awareness Information: The SCE&G Web site supports all
communication efforts to promote energy savings tips through a section of the
website called “Save Energy & Money” and through the Energy Audit library.
Energy savings information includes how-to videos on insulation, thermostats and
door and windows. Information on the latest tax credits offered by the American
Recovery and Reinvestment Act of 2009 is also available, including links to help
customers explore and learn how they can take advantage of these credits. For
business customers, online information also includes: power quality technical
assistance, conversion assistance, new construction information, expert energy
assistance and more (2010 traffic greater than 60,000).
d. SCE&G EnergyWise Blog and E-Newsletter: SCE&G’s web-based information
and services included ongoing management of two tools/resources in 2010: the
Company’s blog on energy efficiency at www.sceg.com/energywise (2010 traffic was
2,300) and an EnergyWise e-newsletter to support customer demand for additional
information on ways to help them save energy. (3,400 e-newsletters in 2010).
3. Energy Conservation: Energy conservation is a term that has been used interchangeably
with energy efficiency. However, energy conservation has the connotation of using less
energy in order to save rather than using less energy to perform the same or better function
more efficiently. The following is an overview of each SCE&G energy conservation
offering:
a. Energy Saver / Conservation Rate: Rate 6 (Energy Saver / Conservation) rewards
homeowners and home builders who upgrade their existing homes or build their new
homes to a high level of energy efficiency with a reduced electric rate. This reduced
10
rate, combined with a significant reduction in energy usage, provides for considerable
savings for our customers. Participation in the program is very easy as the
requirements are prescriptive which is beneficial to all of our customers and trade
allies. Homes built to this standard have improved comfort levels and increased re-
sale value over homes built to the minimum building code standard which is also a
significant benefit to participants. Information on this program is available on our
website and by brochure.
b. Seasonal Rates: Many of our rates are designed with components that vary by
season. Energy provided in the peak usage season is charged a premium to encourage
conservation and efficient use.
c. In-Home Energy Consultation: This program continued through October 2010 and
was gradually phased out after the approval of the new Demand Side Management
programs. This free, in-home energy consultation was designed for residential
customers who wanted to be proactive in managing their energy consumption. An
Energy Services Representative would complete a walk-through of a customer’s
home inspecting windows & doors, caulking, weather stripping, insulation levels,
appliances, water heaters and HVAC, and assess the home's thermal efficiency.
Information about this program was provided on our website, through bill inserts, and
through numerous media outlets (newspaper, television, internet, radio, etc.).
d. Value Visit Program continued through October 2010 and was gradually phased out
after the new Demand Side Management programs were approved. The program was
designed to assist residential electric customers who are considering an investment in
upgrading their home's thermal efficiency.
4. Demand Side Management Programs: On July 15, 2010, SCE&G received an Order from
the Commission approving its portfolio of DSM programs. The portfolio included nine
programs, seven targeting SCE&G’s residential customer classes and two targeting
SCE&G’s commercial and industrial customer classes. A description of each program with
the customer friendly renaming, if applicable, follows:
a. Residential Home Energy Reports (previously Benchmarking) will provide
consumers with comparisons of their monthly energy consumption with benchmarks
showing average energy consumption by similarly situated energy users. The monthly
benchmarking information will be provided free of charge to customers who elect to

11
participate in the program. The full offering of this program will occur in the 2nd
quarter of 2011.
b. Residential Energy Information Display will provide customers with an in-home
display that shows information from the customer’s meter regarding a home’s current
energy use and cost, and the use and cost to date for the month. The displays will be
made available to customers at a discounted price. After review of the initial
implementation phase, the full offering of this program will occur in the 2nd quarter of
2011.
c. Residential Home Energy Check-up and Home Performance with ENERGY
STAR® encourages customers to have a specific assessment of the energy efficiency
of their homes performed. It will include two tiers of home energy review and
assessment.
i. Beginning in October 2010, the Home Energy Check-up program was
offered to customers. This visual checkup and “check-off” audit is performed
by SCE&G staff at the customer’s home. As a direct incentive for customers
to participate in the program, customers are offered an energy efficiency kit
containing simple measures, such as CFLs, water heater wraps and/or pipe
insulation. The Home Energy Check-up is provided free of charge to all
residential customers who elect to participate.
ii. The Home Performance with ENERGY STAR® program will go a step
further and provide a comprehensive audit with diagnostic testing of the
energy efficiency of the home by trained contractors. SCE&G will promote
these audits by independent providers and will subsidize the cost of the audit
and specific measures undertaken by customers based on the audit findings.
The full offering of this program will occur in the 1st quarter of 2011.
These two DSM programs, as listed above, replaced the previously listed Value
Visit and In-Home Energy Consultation programs.
d. Residential ENERGY STAR® Lighting program will provide residential customers
with incentives for purchasing and installing high-efficiency and ENERGY STAR®
qualified lighting. Beginning in the 1st quarter of 2011, all SCE&G customers will be
eligible to participate.

12
e. The Residential Heating & Cooling and Water Heating Equipment (previously
New High Efficiency HVAC and Water Heater) program will provide incentives for
high efficiency HVAC units and water heaters installed in new and existing homes.
The full offering of this program will occur in the 1st quarter of 2011.
f. The Residential Heating & Cooling Efficiency Improvements (previously named
Existing HVAC Efficiency) program will provide residential customers with
incentives for investing in efficiency tune-ups and other improvements to their
HVAC systems. The full offering of this program will occur in the 1st quarter of
2011.
g. Customers and builders willing to commit to overall high standards of energy
efficiency in new construction may receive incentives under the Residential
ENERGY STAR® New Homes program. This program will provide incentives
based on a comprehensive analysis of the energy efficiency of new homes reflecting
both the construction techniques used and the appliances installed. The full offering
of this program will occur in the 2nd quarter of 2011.
h. Beginning in October 2010, the Commercial and Industrial Prescriptive program
began providing lighting incentives to non-residential customers to invest in high-
efficiency lighting and fixtures. Beginning the 1st quarter of 2011, SCE&G will go
beyond these incentives to include energy efficient measures like high efficiency
motors and other equipment. To ensure simplicity, the program will involve a master
list of measures and incentive levels which will be easily accessible to commercial
and industrial customers on the website.
i. Commercial and Industrial Custom program will provide tailored incentives to
commercial and industrial customers based on the calculated efficiency benefits of
their particular energy efficiency plans or construction proposals. This program is
intended to apply to technologies and applications that are more complex and
customer-specific. All aspects of these commercial and industrial programs will apply
to both retrofit and new construction projects. The full offering of this program will
occur in the 1st quarter of 2011.
Load Management Programs
SCE&G’s load management programs have as their primary goal the reduction of the need for
additional generating capacity. There are four load management programs: Standby Generator

13
Program, Interruptible Load Program, Real Time Pricing Rate and the Time of Use Rates. A
description of each follows:
1. Standby Generator Program: The Standby Generator Program for retail customers
was revamped in 2009 to serve as a load management tool. General guidelines authorize
SCE&G to initiate a standby generator run request when reserve margins are stressed due
to a temporary reduction in system generating capability or high customer demand.
Through consumption avoidance, customers who own generators release capacity back to
SCE&G where it is then used to satisfy system demand. Qualifying customers (able to
defer a minimum of 200 kW) receive financial credits determined initially by recording
the customer’s demand during a load test. Future demand credits are based on what the
customer actually delivers when SCE&G requests them to run their generator(s). This
program allows customers to reduce their monthly operating costs, as well as earn a
return on their generating equipment investment. There is also a wholesale standby
generator program that is similar to the retail programs.
2. Interruptible Load Program: SCE&G has over 150 megawatts of interruptible
customer load under contract. Participating customers receive a discount on their
demand charges for shedding load when SCE&G is short of capacity.
3. Real Time Pricing (RTP) Rate: A number of customers receive power under our real
time pricing rate. During peak usage periods throughout the year when capacity is low in
the market, the RTP program sends a high price signal to participating customers which
encourages conservation and load shifting. Of course during low usage periods, prices
are lower.
4. Time of Use Rates: Our time of use rates contain higher charges during the peak usage
periods of the day and discounted charges during off-peak periods. This encourages
customers to conserve energy during peak periods and to shift energy consumption to off-
peak periods. All our customers have the option of a time of use rate.
14
III. Clean Energy at SCE&G
Clean energy includes energy efficiency and clean energy supply options like nuclear power,
hydro power, combined heat and power as well as renewable energy.
Existing Sources of Clean Energy
SCE&G is committed to generating more of its power from clean energy sources. This
commitment is reflected: in the amount of current and projected generation coming from clean
sources, in the certified renewable energy credits that the Company generates each year, in the
Company’s net metering programs and finally in the Company’s support for Palmetto Clean
Energy, Inc. Following is a discussion of each of these topics.
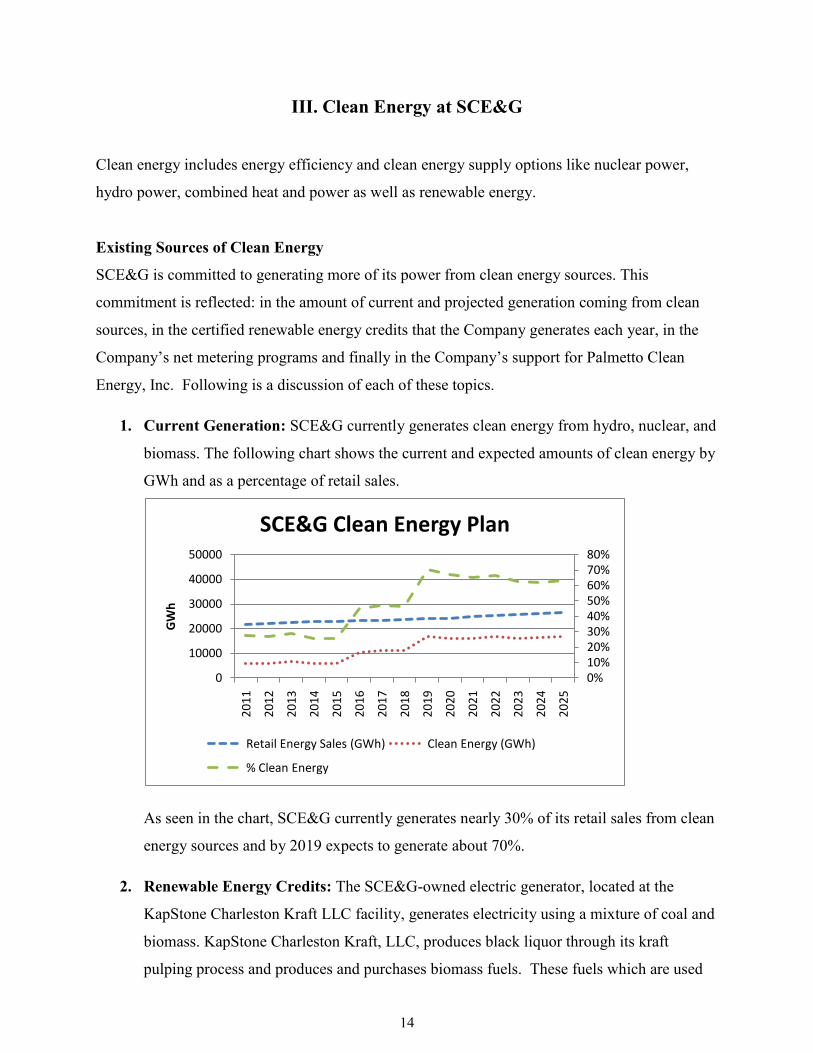
1. Current Generation: SCE&G currently generates clean energy from hydro, nuclear, and
biomass. The following chart shows the current and expected amounts of clean energy by
GWh and as a percentage of retail sales.
As seen in the chart, SCE&G currently generates nearly 30% of its retail sales from clean
energy sources and by 2019 expects to generate about 70%.
2. Renewable Energy Credits: The SCE&G-owned electric generator, located at the
KapStone Charleston Kraft LLC facility, generates electricity using a mixture of coal and
biomass. KapStone Charleston Kraft, LLC, produces black liquor through its kraft
pulping process and produces and purchases biomass fuels. These fuels which are used
0%10%20%30%40%50%60%70%80%
0
10000
20000
30000
40000
50000
20
11
20
12
20
13
20
14
20
15
20
16
20
17
20
18
20
19
20
20
20
21
20
22
20
23
20
24
20
25
GW
h
SCE&G Clean Energy Plan
Retail Energy Sales (GWh) Clean Energy (GWh)
% Clean Energy

15
to produce renewable energy and the electricity generated qualify for Renewable Energy
Certificates as approved by Green-e Energy, a leading national independent certification
and verification program for renewable energy administered by the Center for Resource
Solutions, a nonprofit Company based in San Francisco, CA. Over the last three years
we generated the following amounts of renewable energy from the Kapstone generator,
formerly known as the Cogen South generator:
Year MWH % of Retail Sales 2007 371,573 1.7% 2008 369,780 1.7% 2009 351,614 1.7% 2010 346,190 1.5%
3. Net Metering Rates and the PR-1 Rate: Protecting the environment includes
encouraging and helping our customers to take steps to do the same. Net metering
provides a way for residential and commercial customers interested in generating their
own renewable electricity to power their homes or businesses and sell the excess energy
back to SCE&G. For residential customers, the generator output capacity cannot exceed
the annual maximum household demand or 20KW, whichever is less. For
small commercial customers, the generator output capacity cannot exceed the annual
maximum demand of the business or 100KW, whichever is less. Under its PR-1 rate for
qualifying facilities, the Company will pay the qualifying customer for any power
generated and transmitted to the SCE&G system. The PR-1 rate reflects SCE&G’s
avoided costs.
4. Palmetto Clean Energy, Inc.: Palmetto Clean Energy, Inc. (“PaCE”) is a non-profit, tax
exempt organization formed by SCE&G, Duke Energy, Progress Energy, ORS and the
SC Energy Office for the purpose of subsidizing renewable power in South Carolina.
Customers make a tax deductible payment to PaCE and PaCE uses the funds collected to
pay renewable generators a supplemental fee for their power.
Future Clean Energy
SCE&G is participating in activities whose goal is to advance renewable technologies in the
future. Specifically the Company is involved with off-shore wind activities in the state, co-firing

16
with biomass fuels, studying smart grid opportunities and distribution automation. Following is a
discussion of each of these.
1. Off-Shore Wind Activities: SCE&G currently participates in the Regulatory Task Force
for Coastal Clean Energy. This task force was established with a 2008 grant from the
U.S. Department of Energy. The goal is to identify and overcome existing barriers for
coastal clean energy development for wind, wave and tidal energy projects in South
Carolina. Efforts include an offshore wind transmission study; a wind, wave & ocean
current study; and creation of a Regulatory Task Force. The mission of the Regulatory
Task Force is to foster a regulatory environment conducive to wind, wave and tidal
energy development in state waters. The Regulatory Task Force is comprised of state
and federal regulatory and resource protection agencies, universities, private industry and
utility companies.
2. Co-firing with Biomass: In 2010, SCE&G began a project to investigate and evaluate
the co-firing of biomass and other engineered waste products in our existing coal burning
facilities. The goal of the project is to determine the operational practicality as well as the
economic and fuel supply implications of co-firing in existing coal units. Co-firing of
biomass fuel in our existing units represents an opportunity to include additional
renewable fuels in our production mix without having to build new facilities or spend
significant capital on existing facilities.
The Company has purchased and set up mobile fuel handling equipment to
facilitate testing of different types of biomass and other waste materials at multiple
facilities. Tests were conducted at several locations in 2010 and the results are being
evaluated by Fossil Hydro to determine a future course of action.
3. New Renewable Projects: SCE&G has met with several companies that are considering
developing renewable facilities in South Carolina and wish to sell power to SCE&G
through a long term purchased power agreement. SCE&G evaluates all power proposals
to determine if the power is needed and can be supplied at a price that is competitive with
other supply alternatives. The Company is very interested in the renewable market sector
but the power has to be economical for our customers.
4. Smart Grid Activities: SCE&G currently has close to 10,000 electric meters that are not
supported by our “drive by” Automated Meter Reading (“AMR”) system. These meters
are predominately located on our medium to large commercial customers as well as our
17
smaller industrial customers and must be manually read each month. We are currently
planning to install SmartSync meters that will allow us to have full two way
communication with these meters. Installation will begin in March and continue through
July of 2012. We feel that this capability is particularly important to this class of
customer as it will allow real time outage notification and power quality monitoring as
well as making load profile data available to the customer enabling better management of
its energy consumption. This Advanced Metering Infrastructure (“AMI”) system could
also be selectively installed at other locations such as customer owned generation (net
metering) allowing real time access to the status of the generator. It would also enable
more sophisticated DSM offerings that may be attractive to a variety of customer classes.
5. Distribution Automation: SCE&G is continuing to expand the penetration of automated
Supervisory Control and Data Acquisition (“SCADA”) switching and other intelligent
devices throughout the system. We have over 600 SCADA switches and reclosers, most
of which can detect system outages and operate automatically to isolate sections of line
with problems thereby minimizing the number of affected customers. Some of these
isolating switches can communicate with each other to determine the optimal
configuration to restore service to as many customers as possible without operator
intervention. In order to more fully utilize the new technology being deployed, we are
researching Distribution Management Systems that would work in conjunction with our
Outage Management System (“OMS”) to better synthesize the information coming back
from our SCADA switches with other system operating information. Bringing this
information together will enable us to operate the system in a more reliable and efficient
manner.
Environmental Mitigation Activities
In March 2005, the United States Environmental Protection Agency (“EPA”) issued a
final rule known as the Clean Air Interstate Rule (“CAIR”). CAIR required that the District of
Columbia and twenty-eight states, including South Carolina, reduce sulfur dioxide (“SO2”) and
nitrogen oxide (“NOX”) emissions in order to attain mandated air quality levels. CAIR
established emission limits to be met in two phases beginning in 2009 and 2015 for NOX and
2010 and 2015 for SO2. In addition, the EPA required some states to enact a State
Implementation Plan designed to address air quality issues. The South Carolina State
18
Implementation Plan (the “Plan”) required, among other things, the reduction of SO2 emissions
from coal-fired generating facilities. The Plan also required a reduction in NOX emissions in the
months of May through September until 2009 when the CAIR limits would become effective.
CAIR and the Plan directly impacted SCE&G.
In order to reduce NOx emissions and to meet its compliance requirements, SCE&G
installed Selective Catalytic Reduction (“SCR”) equipment at its Cope Station in the fall of
2008. The SCR began full time operation on January 1, 2009 and has run well since that time. It
is capable of reducing NOX emissions at the Cope Station by approximately 90%. SCE&G is
also utilizing the existing SCRs at Williams and Wateree Station along with previously installed
low NOX burners at the other coal fired units to meet the CAIR requirements for NOX.
Additionally, SCE&G has installed flue gas desulfurization (“FGD”) equipment,
commonly known as wet scrubbers, at Wateree and Williams Station to reduce SO2 emissions.
The in-service date for Williams and Wateree Stations were February 25, 2010 and October 12,
2010, respectively. Scrubber performance tests at both stations met the SO2 designed removal
rate of 95%.
During 2010, we worked with a contractor to test a Chem-Mod fuel additive that was
expected to reduce SO2, NOX and mercury at Urquart 3, Canadys, and McMeekin units. Test
results through a third party indicate emissions reductions of more than 30% Mercury, more than
7% NOX, and a 2 – 3% SO2 reduction. SCE&G recently received a SCDHEC permit for on-
going use of Chem-Mod at McMeekin Station, and SCE&G is continuing to pursue applicable
permits at other stations.
Through recent testing, reduction in mercury is occurring as a result of the SCR and the
wet scrubber installations. SCE&G is currently quantifying the removal efficiency of mercury
through third party testing. Any reductions in emissions resulting from the use of the Chem-Mod
fuel additive will be a benefit to the environment of South Carolina.
19
Potential Future Legislation
SCE&G is monitoring potential legislation being considered at the national level and the state
level. Areas of particular activity involve CO2 emissions, renewable power standards, coal ash
and mercury. Below is a discussion of each.
1. CO2: On May 10, 2010 The EPA issued its Prevention of Significant Deterioration and
Title V Greenhouse Gas Tailoring Rule. EPA is tailoring the applicability criteria that
determine which stationary sources and modification projects become subject to
permitting requirements for greenhouse gas (GHG) emissions under the Prevention of
Significant Deterioration (PSD) and Title V programs of the Clean Air Act.
The first step requires that as of January 2, 2011, the applicable requirements of
PSD --- most notably, the best available control technology (“BACT”) requirement ---
will apply to projects that increase net GHG emissions by at least 75,000 tons per year
(“tpy”) carbon dioxide equivalent (“CO2e”), but only if the project also significantly
increases emissions of at least one non-GHG pollutant. For the Title V program, only
existing sources with, or new sources obtaining, Title V permits for non-GHG pollutants
will be required to address GHGs during this first step.
The second step of the Tailoring Rule, beginning on July 1, 2011, will phase in
additional large sources of GHG emissions. New sources as well as existing sources not
already subject to Title V that emit, or have the potential to emit, at least 100,000 tpy
CO2e will become subject to the PSD and Title V requirements. In addition, sources that
emit or have the potential to emit at least 100,000 tpy CO2e and that undertake a
modification that increases net emissions of GHGs by at least 75,000 tpy CO2e will also
be subject to PSD requirements. For both steps, we also note that if sources or
modifications exceed these CO2e-adjusted GHG triggers, they are not covered by
permitting requirements unless their GHG emissions also exceed the corresponding mass-
based triggers (i.e., unadjusted for CO2e.)
2. Renewable Power: SCE&G also continues to monitor the state and federal bills that, if
enacted, will mandate a federal or state renewable portfolio standard (“RPS”). One of the
primary purposes of an RPS is to increase the amount of clean energy produced in the
U.S. The bills proposed, but not passed, in 2010 required 15-20% of utilities’ retail sales
to come from renewable sources by year 2020. Qualified renewable sources include
wind, solar, geothermal, biomass, qualified hydro-power, and marine and hydrokinetic

20
renewable energy. The most viable renewable energy source in SC is woody biomass.
Off-shore wind energy and solar energy are available but are uneconomic today. SCE&G
will follow the development of these technologies and will include them in its resource
mix when appropriate.
3. Coal Ash: The Environmental Protection Agency (“EPA”) is currently considering
revisions to its regulation of coal ash. EPA has stated it is considering regulating coal
combustion residue as hazardous waste. If these new regulations were to come about,
utilities across the country, including SCE&G, will be faced with new financial and
permitting challenges to store or dispose of coal ash. This will also have a negative
impact on SCE&G’s current ash beneficial use program, thereby increasing disposal
costs.
4. Mercury: The Clean Air Act regulates 188 air toxics, also known as “hazardous air
pollutants.” Mercury is one of these air toxics. The Act directs EPA to establish
technology-based standards for certain sources that emit these air toxics. Those sources
also are required to obtain Clean Air Act operating permits and to comply with all
applicable emission standards. The law includes special provisions for dealing with air
toxics emitted from utilities, giving EPA the authority to regulate power plant mercury
emissions by establishing “performance standards” or “maximum achievable control
technology” (“MACT”), whichever the Agency deems most appropriate.

21
IV. Supply Side of the IRP
Existing Supply Resources
SCE&G owns and operates ten (10) coal-fired fossil fuel units (2,439 MW), eight (8)
combined cycle gas turbine/steam generator units (gas/oil fired, 1,330 MW), sixteen (16)
peaking turbine units (355 MW), four (4) hydroelectric generating plants (221 MW), and one
Pumped Storage Facility (576 MW). In addition, we receive an output of 90 MW from a
cogeneration facility. The total net non-nuclear summer generating capability rating of these
facilities is 5,011 MW. These ratings, which are updated at least on an annual basis, reflect the
expectation for the coming summer season. When SCE&G’s nuclear capacity (644 MW), a long
term capacity purchase (25 MW) and additional capacity (22 MW) provided through a contract
with the Southeastern Power Administration are added, SCE&G’s total supply capacity is 5,702
MW. This is summarized in the table on the following page.
The bar chart below shows the actual 2010 relative energy generation and the relative
capacity by fuel source. SCE&G typically generates the majority of its energy from coal and
nuclear fuel.
1.3%
23.1%
51.0%
21.2%
3.4%
1.0%
30.0%
44.0%
11.0%
14.0%
0.00% 10.00% 20.00% 30.00% 40.00% 50.00% 60.00%
Biomass
Gas
Coal
Nuclear
Hydro
Actual 2010 Resources
Capacity Energy

22
Existing Long Term Supply Resources
The following table shows the generating capacity that is available to SCE&G.
In-Service Summer Date (MW)
Coal-Fired Steam: Urquhart – Beech Island, SC 1953 95 McMeekin – Near Irmo, SC 1958 250 Canadys - Canadys, SC 1962 385 Wateree – Eastover, SC 1970 684 *Williams – Goose Creek, SC 1973 605 Cope - Cope, SC 1996 420 Kapstone – Charleston, SC 1999 90 Total Coal-Fired Steam Capacity 2,529 Nuclear: V. C. Summer - Parr, SC 1984 644 I. C. Turbines: Hardeeville, SC 1968 12 Urquhart – Beech Island, SC 1969 39 Coit – Columbia, SC 1969 28 Parr, SC 1970 60 Williams – Goose Creek, SC 1972 40 Hagood – Charleston, SC 1991 128 Urquhart No. 4 – Beech Island, SC 1999 48 Urquhart Combined Cycle – Beech Island, SC 2002 458 Jasper Combined Cycle – Jasper, SC 2004 872 Total I. C. Turbines Capacity 1,685 Hydro: Neal Shoals – Carlisle, SC 1905 2 Parr Shoals – Parr, SC 1914 7 Stevens Creek - Near Martinez, GA 1914 9 *Columbia Canal - Columbia, SC 1927 3 Saluda - Near Irmo, SC 1930 200 Fairfield Pumped Storage - Parr, SC 1978 576 Total Hydro Capacity 797 Other: Long-Term Purchases 25 SEPA 22 Grand Total: 5,702 * Williams Station is owned by GENCO, a wholly owned subsidiary of SCANA, and Columbia Canal is owned by the City of Columbia. This capacity is operated by SCE&G.

23
DSM From the Supply Side
SCE&G is able to achieve a DSM-like impact from the supply side using its Fairfield
Pumped Storage Plant. The Company uses off-peak energy to pump water uphill into the
Monticello Reservoir and then displaces on-peak generation by releasing the water and
generating power. This accomplishes the same goal as many DSM programs, namely, shifting
use to off-peak periods and lowering demands during high cost, on-peak periods. The following
graph shows the impact that Fairfield Pumped Storage had on a typical summer weekday.
In effect the Fairfield Pumped Storage Plant shaved about 340MWs from the daily peak times of
2:00pm through 6:00pm and moved about 3.1% of customer’s daily energy needs to the off peak.
Because of this valuable supply side capability, a similar capability on the demand side, such as a
time of use rate, would be less valuable on the SCE&G system than on many other utility
systems.
Planning Reserve Margin and Operating Reserves
The Company provides for the reliability of its electric service by maintaining an
adequate reserve margin of supply capacity. The appropriate level of reserve capacity for
SCE&G is in the range of 12 to 18 percent of its firm peak demand. This range of reserves will
allow SCE&G to have adequate daily operating reserves and to have reserves to cover two

24
primary sources of risk: supply risk and demand risk. Mitigation of these two types of risk is
discussed below.
Supply reserves are needed to balance the “supply risk” that some SCE&G generation
capacity may be forced out of service or its capacity reduced on any particular day because of
mechanical failures, wet coal problems, environmental limitations or other force
majeure/unforeseen events. The amount of capacity forced-out or down-rated will vary from day
to day. SCE&G’s reserve margin range is designed to cover most of these days as well as the
outage of any one of our generating units except the two largest: Summer Station and Williams
Station.
Another component of reserve margin is the demand reserve. This is needed to cover
“demand risk” related to unexpected increases in customer load above our peak demand forecast.
This can be the result of extreme weather conditions or other unexpected events.
The level of daily operating reserves required by the SCE&G system is dictated by
operating agreements with other VACAR companies. VACAR is the organization of utilities
serving customers in the Virginia-Carolinas region of the country who have entered into a
reserve sharing agreement. It is a sub-region of the SERC Reliability Corporation, a nonprofit
corporation responsible for promoting and improving the reliability of the bulk power
transmission system in much of the southeastern United States. VACAR has set the region’s
reserve need at 150% of the largest unit in the region. While it can vary by a few megawatts
each year, SCE&G’s pro-rata share of this capacity is always around 200 megawatts.
By maintaining a reserve margin in the 12 to 18 percent range, the Company addresses
the uncertainties related to load and to the availability of generation on its system. It also allows
the Company to meet its VACAR obligation. SCE&G will monitor its reserve margin policy in
light of the changing power markets and its system needs and will make changes to the policy as
warranted.
Nuclear Capacity and Its Advantages
On May 30, 2008, SCE&G filed an application with the Public Service Commission of
South Carolina requesting permission to construct and operate two nuclear units of 1,117 net
MWs each. A hearing was held in December 2008 under Docket No. 2008-196-E; and on
February 11, 2009, the Commission voted to approve the Company’s request. Subsequently the
Commission issued Order No. 2009-104(A). Both units will have the Westinghouse AP1000

25
design and use passive safety systems to enhance the safety of the units. The first unit is expected
to come online in 2016 and the second in 2019. SCE&G will own 55% of the units (614 MWs
each) while Santee Cooper will own 45%. SCE&G and Santee Cooper have an application
pending before the Nuclear Regulatory Commission (“NRC”) for a combined construction and
operating license (“COL”). The application was filed on March 31, 2008 and the COL is
expected to be issued in late 2011 or early 2012.
While volumes of information and testimony were analyzed in the regulatory process, the
need for baseload capacity, the benefits of increased fuel diversity and the increasingly stringent
environmental regulations were among the primary factors driving the Company to add nuclear
capacity. The last baseload unit added to the SCE&G system was Cope Station in 1996.
Immediately after its addition, the percentage of baseload capacity on the system was about 74%.
Currently it is only 56%. With the addition of these two nuclear units, the percentage of baseload
capacity will be about 62%. Regarding fuel diversity, the current mix of capacity is 11% nuclear,
44% coal and 30% natural gas. With the addition of this nuclear capacity, the mix will be 28%
nuclear, 33% coal and 26% natural gas. Finally, since nuclear power is a non-emitting resource,
the Company’s emissions of carbon dioxide, sulfur dioxide, nitrous oxide and mercury will be
greatly reduced from that of a resource plan without additional nuclear capacity.
Potential Retirement of Coal Plants
If our energy efficiency programs are as successful as planned and growth in energy sales
does not return to pre-recession levels, SCE&G will have the flexibility to evaluate its aging
coal-fired plants for potential opportunities to mothball, re-power or retire some of these
facilities. The primary motivation for this evaluation at this point is the age of these coal-fired
units and the potential cost of meeting new environmental regulations. SCE&G’s smaller coal-
fired units range in age from 43 to 58 years as of 2010. By the end of our 15 year planning
horizon, the Company anticipates the need for significant capital investment in one or more of
these units. However, since the load continues to grow and with it the need for additional
capacity, the Company is also considering the option to mothball a unit for a few years and then
refurbish and perhaps re-power it with natural gas. These are all economic questions that the
Company will analyze in the coming years. Fortunately the Company’s resource plan and its
portfolio of energy efficiency programs provide flexibility and time to study these options and

26
maximize the economic value to our customers. Hopefully it will also provide time for some of
the current uncertainty regarding environmental regulations to be resolved.
Scenario Planning and Risk
There is considerable uncertainty associated with planning for the future. Two principle sources
of uncertainty are the economy and the state of federal environmental regulations. The economy
has been officially out of recession since June 2009, but growth has been slow and seems only
now to be reaching its normal long term growth rate of 3% or so. Regarding federal regulations,
the Environmental Protection Administration (EPA) has issued a number of regulations that will
have a significant effect on the electric utility business. Some members of Congress are trying to
stop or at least postpone implementation of these regulations so that Congress has time to
introduce alternative legislation and also to provide more recovery time for the weak economic
recovery. SCE&G believes that its resource plan, anchored by the addition of two new nuclear
plants and its new portfolio of energy efficiency measures, represents a very robust plan
providing flexibility under many different future scenarios.
Because the future is so uncertain, it is a worthwhile exercise to consider alternative
assumptions that might form various future conditions. Three future scenarios are considered
below: a greener scenario, a higher growth scenario and a base case, business-as-usual scenario.
A Greener Scenario: The EPA was created on May 2, 1971 to implement the various
requirements included in the Clean Air Act of 1970. Ever since then the utility industry has been
adjusting its plans to comply with an ever increasing array of environmental regulations. Clearly
every reasonable scenario of the future should contain environmental regulations and mandates;
it is just a question of degree in severity and implementation timeline. As discussed earlier the
EPA has issued its “Tailoring Rule” which brings utilities’ green house gas emissions, in
particular, CO2, under Clean Air Act regulations. The rules are not finalized and it is unclear
what the best available control technology (“BACT”) will be but carbon capture and
sequestration (“CCS”) is a likely candidate not only for new coal plants but at some point for
existing coal plants as well. Since burning natural gas results in CO2 emissions as well, it seems
only logical that these same rules for coal generation will apply to natural gas-fired generation at
some point in the future, at least to combined cycle plants. Based on currently proposed EPA
regulations, existing coal plants may require very costly retrofit equipment. For example,
depending on the final mercury rules, more investment may be required. A wet scrubber in

27
combination with an SCR can remove most of the mercury from the flue gas but this may not
meet new guidelines. Also closed loop cooling may be required as part of the EPA’s recent
316(b) regulations dealing with impingement of marine life. If these and other regulations are
implemented, the result will be the forced retirement of much coal capacity in the country.
Naturally this capacity will need to be replaced along with the additional capacity planned to
meet load growth. This should result in higher power prices going forward. A greener future is
also likely to have a renewable portfolio standard (“RPS”) or at least a clean energy standard
along with an option or requirement to use energy efficiency as part of the resource plan. A clean
energy standard seems to be gaining favor over an RPS because it would be less harmful to the
economy and much more equitable regionally, particularly in the southeast where the potential
for wind and solar power is limited. When facing a “Greener Scenario” in which environmental
regulations continue on their present trajectory or ratchet up, SCE&G believes that having two
nuclear plants in its resource expansion plan makes a lot of sense
About Shale Gas: Shale Gas promises to be a boon for the natural gas industry, potentially
providing large volumes of gas at low prices. SCE&G certainly hopes that this potential is
realized because SCE&G is in a good position to take advantage of this boon since currently
30% of its capacity is fired by natural gas. However the natural gas business is particularly
uncertain. Only a few years ago imported LNG was the much heralded new source of gas that
would meet the market’s demand. Who knows how this business will change in the next few
years. The EPA has designated CO2 as an air pollutant. If this attitude persists, it does not seem
reasonable to expect an unencumbered development of shale gas. Even if relatively low gas
prices survive regulatory impacts, a requirement that carbon capture and sequestration be added
to gas-fired generation will increase the cost of building and operating such a plant, making the
economics very challenging. Today energy is an international business. The economics of supply
and demand in the world market is likely to put upward pressure on the price of gas in the United
States. Already there are reports of at least two companies seeking a license to export LNG gas.
It does not seem reasonable to expect the price of natural gas to trade at several multiples of that
in the US, at least not for any length of time. Entrepreneurs will act to increase their profits and
close the gap. A risk-averse utility trying to protect its customers from fuel price variability will
develop a resource portfolio that is balanced by several types of fuels. This is the approach being
taken by SCE&G.

28
A High Growth Scenario: SCE&G must consider the prospect of a higher growth scenario. It is
possible that the economy might rebound quickly to pre-recession levels. The combination of
pent-up demand, good governmental policies and the international market could spur growth in
the country. Additionally South Carolina might expand even faster than other states if industry,
whether domestic or international, locates in the state and population migration increases either
for new jobs or retirements. If the demand for energy in its service territory grows faster than
expected, SCE&G plans to meet the increased demand with capacity purchases until the first
new nuclear unit is online. The capacity should be available for purchase but clearly
environmental regulations that force the early retirement of coal plants will limit purchase
options. This is a short term problem that SCE&G will have to manage if it comes to fruition but
regardless, in the longer term, the need for the new nuclear units would only be greater in a high
growth scenario.
Some New Technologies: Like all utilities, SCE&G tries to keep abreast of any new
technologies that might have a significant impact on the electric business. Here are a few to
consider:
Electric Vehicles: As battery technology improves and economies of scale reduce their
purchase price there may be an electric vehicle in every household which would create a
significant load on the system. Utilities are expecting that time of use rates will force
most of the charging load to occur off-peak and thereby lessen the need for additional
generating capacity. However, there will still be a need for energy and utilities will need
more base load generation, such as a nuclear plant would provide, to meet that need.
SmartGrid and Home Area Networks: SmartGrid and smart meters will allow two-way
communication between the utility and the customer. An important goal of this
technology is to provide the customer with current information creating a greater
awareness of his energy consumption and increasing his willingness to participate in
programs to lower and alter his consumption. In combination with a Home Area
Network and smart appliances, there is the possibility of making a customer’s
conservation efforts automatic by cycling or shutting off appliances during high cost
periods with an in-home computer system receiving price information over the smart
grid. Ultimately this technology should tend to flatten the system load curve and require
more reliance on base load generation.

29
The Base Case Scenario: SCE&G’s base case resource plan assumes a return to the normal long
term rate of economic growth and a moderation in environmental regulations. Specifically
SCE&G assumes that it will not be forced to retire any coal plants in the next few years but
instead will have the flexibility to retire plants, if it makes sense to do so, over a longer time
frame. The forecast does not reflect an impact from electric vehicles or from the SmartGrid. It
assumes that there will be a cost to CO2 emissions but these will be moderate. The plan assumes
that there will not be a renewable power standard mandated at either the national or state level.
The plan allows for the implementation of a clean energy standard but with a resource plan
anchored by the addition of two nuclear plants such a standard is easily met. The forecast
assumes that customers participate in our portfolio of energy efficiency programs and that these
programs are effective in reducing load and energy growth on the system.
Risk Analysis: Because of the many unknown factors described in the scenarios above and
because of other factors described below, the Company feels that the level of uncertainty about
the future is particularly acute at the present time. Following are a few more sources of
uncertainty directly affecting the load forecast that should be considered.
1. The nation and SCE&G’s service territory are still recovering from a very deep recession.
It is unclear among economists and others whether the recovery from the recession will
be quick and robust or more prolonged taking perhaps several years to return to pre-
recession levels.
2. Electric (and gas) customers throughout the country have implemented conservation
measures to reduce their energy consumption and associated bills largely in response to
economic conditions but also in response to a national consciousness of the issue. It is
unclear whether this will be a short-lived phenomenon or one that will become a more
permanent aspect of customer behavior.
3. The federal government is channeling large sums of money to state and local
governments to stimulate energy efficiency programs. The impact of the resulting
programs is difficult to quantify.
4. SCE&G is implementing a new set of energy efficiency programs among its customer
base providing information and monetary incentives to encourage customers to
implement energy efficiency and conservation measures. The effectiveness of these
programs depends on customer acceptance which is difficult to predict. The energy

30
impacts in the short run and the persistence of these impacts in the long run provide a
source of significant uncertainty.
5. In 1978 the National Energy Act was signed into U.S. law and began more than 30 years
of programs and regulations to increase energy efficiency in the country. While these
efforts have raised awareness and encouraged or mandated energy efficiency, the need
for power nevertheless continued to grow. Based on this experience, SCE&G looks to the
future with uncertainty when it considers the proliferation of electronic devices such as
large screen TVs and electronic billboards and the possible development of a large
market for electric vehicles.
Due to the uncertainty described above and that highlighted by consideration of possible
future scenarios, it is particularly important to develop a range of possible forecast outcomes. By
developing a resource plan to meet a base, high and low forecast, the Company will highlight
future risks and can better plan to meet the energy needs of its customers. When generating
forecast scenarios, it is important to determine a reasonable methodology to derive alternative
energy and peak demand growth patterns. A scenario based on an unreasonably high or low
forecast would not be useful. The approach chosen is to review the historic record of SCE&G’s
energy sales, by class, over the past forty years, and then establish “high” and “low” growth rates
from that sample. This offers several advantages. First, determination of growth rates by class
should give a better estimate of territorial sales since the estimate is based on a higher level of
detail. For example, residential growth percentages were developed by examination of customer
growth and average use changes over time. Secondly, the future growth prospects of the major
customer classes will vary, and it is possible to explicitly capture the impact of the different
growth rates on total sales. Finally, a review of historic data allows one to see the major events
which have occurred in the past and their impact on SCE&G’s electric sales, and then to
incorporate those patterns into the growth scenarios.

31
The nearby table shows the
15-year annual compound growth
rate in sales that result from the
base forecasting methodology for
major customer classes. The “base”
growth rate is compared to the
“high load” scenario and the “low
load” scenario. The table also shows
the historical growth in sales to
these customer classes for the pre-recession period 1990-2005. The high load scenario also
assumes that the impact of energy efficiency will be 75% of that reflected in the base forecast
while for the low load scenario, it was assumed that the energy efficiency impact of SCE&G’s
new energy efficiency programs would be 25% more effective. If SCE&G’s service territory
recovers from the recession quickly and growth returns to more normal levels as experienced
historically, then the high load scenario may be more reflective of SCE&G’s future load growth.
On the other hand, if the recovery from the recession is slow with long lasting effects, then the
low load scenario may be a better representation of future growth.
The following table compares the territorial firm peak demand forecast under the low,
base and high scenarios.
Year Low Scenario
Delta Base Scenario
Delta High Scenario2011 4,726 0 4,726 0 4,726
2012 4,807 0 4,807 0 4,8072013 4,678 -216 4,894 207 5,1012014 4,720 -269 4,989 247 5,2362015 4,750 -312 5,062 299 5,3612016 4,781 -357 5,138 350 5,4882017 4,815 -405 5,220 399 5,6192018 4,840 -451 5,291 452 5,7432019 4,862 -500 5,362 509 5,8712020 4,887 -552 5,439 572 6,0112021 4,942 -594 5,536 621 6,1572022 5,004 -637 5,641 664 6,3052023 5,070 -678 5,748 708 6,4562024 5,133 -719 5,852 753 6,6052025 5,198 -761 5,959 802 6,761
Firm Peak Demand Scenarios (MWs)
Assumptions For High and Low Scenarios
15-Year Projection of Annual
Growth
Base
Forecast
High Load
Scenario
Low Load
Scenario
Pre-Recession
History
Residential 2.0% 2.7% 1.2% 2.7% Commercial 2.3% 2.8% 1.8% 3.2% Industrial 1.3% 2.3% 0.5% 2.6%
Municipal 1.4% 2.2% 0.6% 4.0%

32
If SCE&G’s territory recovers quickly from the current recession and growth comparable to pre-
recession experience resumes, then the firm peak demand on the system will be more like that of
the high scenario, adding as much as 801 MWs to the demand in 2025. On the other hand if the
recovery is slow and protracted and SCE&G losses a large part of its wholesale business, then
the peak demand is likely to be as much as 762 MWs less than its base plan.
Projected Loads and Resources
SCE&G’s resource plan for the next 15 years is shown in the table labeled “SCE&G
Forecast Loads and Resources – 2011 IRP – BASE Load Scenario” on a following page. The
resource plan shows the need for additional capacity and identifies, at least, on a preliminary
basis whether the need is for peaking/intermediate capacity or base load capacity.
On line 11 the resource plan shows a decrease in capacity of 90 MWs in 2016 and 210
MWs in 2019. These represent the possible retirement of coal units.
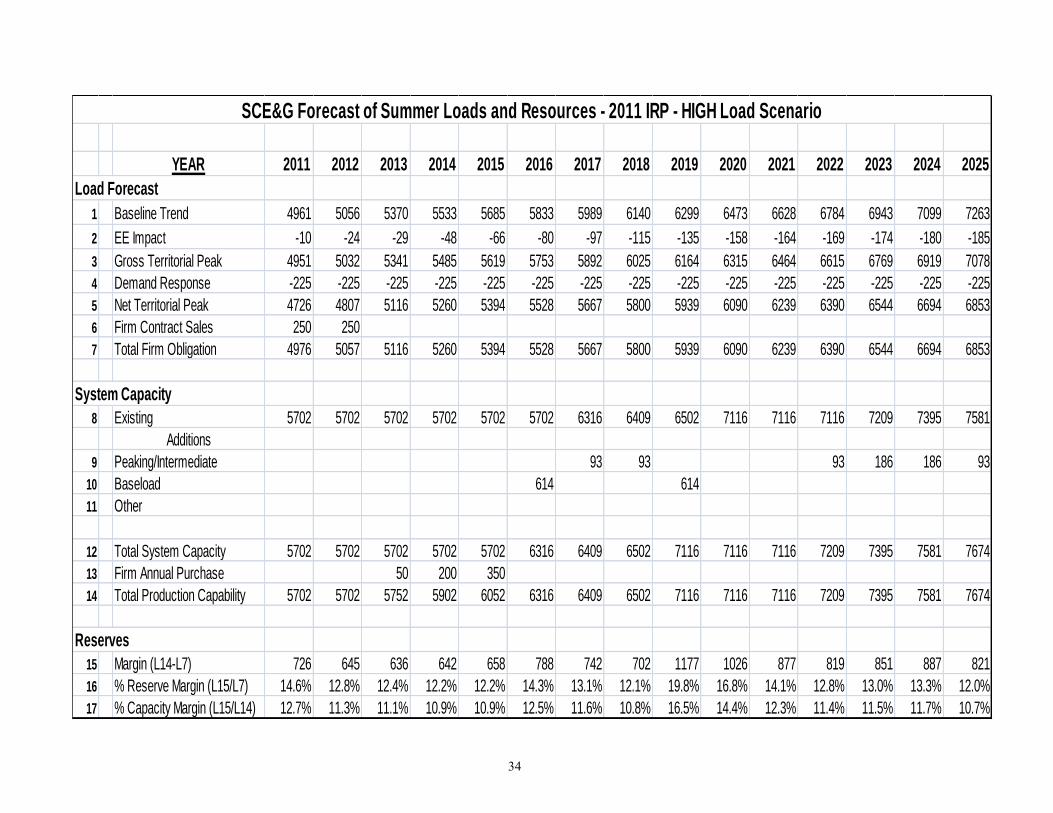
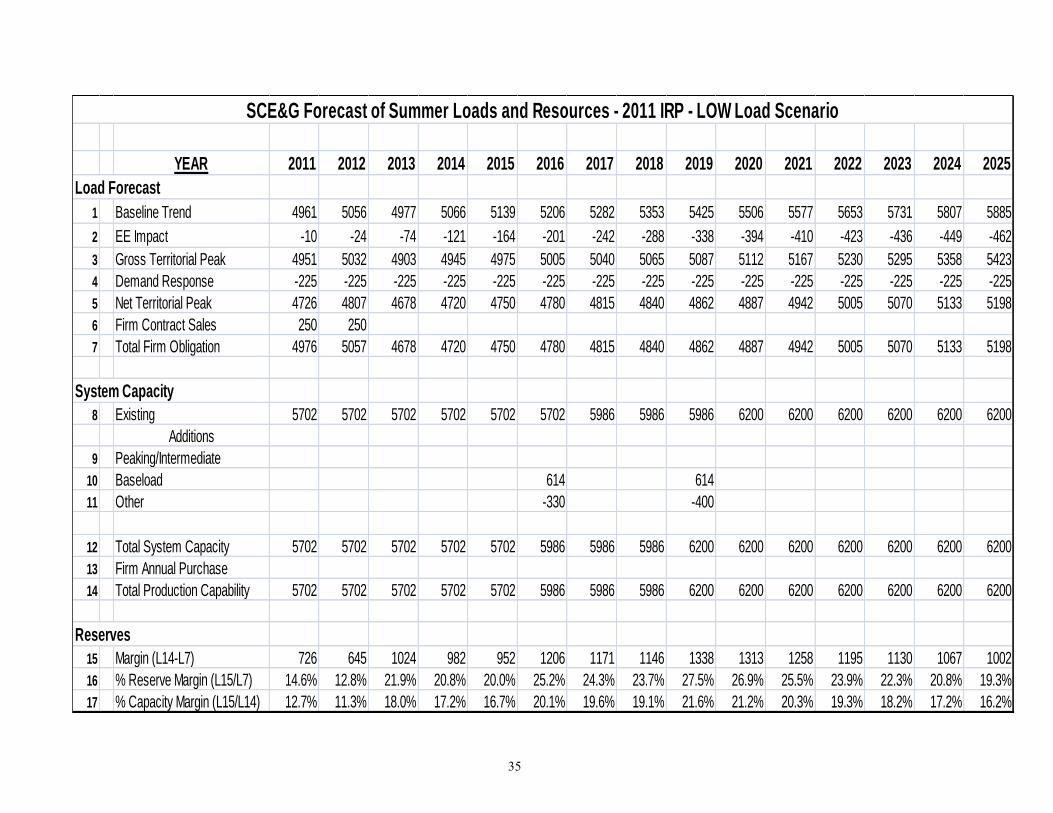
Two additional resource plans are shown in the following pages: one for the high load
growth scenario and one for the low load scenario.
The Company believes that its supply plan, summarized in the following table, will be as
benign to the environment as possible because of the Company’s continuing efforts to utilize
state-of-the-art emission reduction technology in compliance with state and federal laws and
regulations. The supply plan will also help SCE&G keep its cost of energy service at a minimum
since the generating units being added are competitive with alternatives in the market.

33
YEAR 2011 2012 2013 2014 2015 2016 2017 2018 2019 2020 2021 2022 2023 2024 2025
Load Forecast
1 Baseline Trend 4961 5056 5178 5310 5419 5524 5638 5746 5858 5980 6090 6205 6322 6436 6554
2 EE Impact -10 -24 -59 -96 -132 -161 -193 -230 -271 -316 -329 -339 -349 -359 -370
3 Gross Territorial Peak 4951 5032 5119 5214 5287 5363 5445 5516 5587 5664 5761 5866 5973 6077 6184
4 Demand Response -225 -225 -225 -225 -225 -225 -225 -225 -225 -225 -225 -225 -225 -225 -225
5 Net Territorial Peak 4726 4807 4894 4989 5062 5138 5220 5291 5362 5439 5536 5641 5748 5852 5959
6 Firm Contract Sales 250 250
7 Total Firm Obligation 4976 5057 4894 4989 5062 5138 5220 5291 5362 5439 5536 5641 5748 5852 5959
System Capacity
8 Existing 5702 5702 5702 5702 5702 5702 6226 6226 6226 6630 6630 6630 6630 6630 6630
Additions
9 Peaking/Intermediate 93
10 Baseload 614 614
11 Other -90 -210
12 Total System Capacity 5702 5702 5702 5702 5702 6226 6226 6226 6630 6630 6630 6630 6630 6630 6723
13 Firm Annual Purchase
14 Total Production Capability 5702 5702 5702 5702 5702 6226 6226 6226 6630 6630 6630 6630 6630 6630 6723
Reserves
15 Margin (L14-L7) 726 645 808 713 640 1088 1006 935 1268 1191 1094 989 882 778 764
16 % Reserve Margin (L15/L7) 14.6% 12.8% 16.5% 14.3% 12.6% 21.2% 19.3% 17.7% 23.6% 21.9% 19.8% 17.5% 15.3% 13.3% 12.8%
17 % Capacity Margin (L15/L14) 12.7% 11.3% 14.2% 12.5% 11.2% 17.5% 16.2% 15.0% 19.1% 18.0% 16.5% 14.9% 13.3% 11.7% 11.4%
SCE&G Forecast of Summer Loads and Resources - 2011 IRP - BASE Load Scenario
34
YEAR 2011 2012 2013 2014 2015 2016 2017 2018 2019 2020 2021 2022 2023 2024 2025
Load Forecast
1 Baseline Trend 4961 5056 5370 5533 5685 5833 5989 6140 6299 6473 6628 6784 6943 7099 7263
2 EE Impact -10 -24 -29 -48 -66 -80 -97 -115 -135 -158 -164 -169 -174 -180 -185
3 Gross Territorial Peak 4951 5032 5341 5485 5619 5753 5892 6025 6164 6315 6464 6615 6769 6919 7078
4 Demand Response -225 -225 -225 -225 -225 -225 -225 -225 -225 -225 -225 -225 -225 -225 -225
5 Net Territorial Peak 4726 4807 5116 5260 5394 5528 5667 5800 5939 6090 6239 6390 6544 6694 6853
6 Firm Contract Sales 250 250
7 Total Firm Obligation 4976 5057 5116 5260 5394 5528 5667 5800 5939 6090 6239 6390 6544 6694 6853
System Capacity
8 Existing 5702 5702 5702 5702 5702 5702 6316 6409 6502 7116 7116 7116 7209 7395 7581
Additions
9 Peaking/Intermediate 93 93 93 186 186 93
10 Baseload 614 614
11 Other
12 Total System Capacity 5702 5702 5702 5702 5702 6316 6409 6502 7116 7116 7116 7209 7395 7581 7674
13 Firm Annual Purchase 50 200 350
14 Total Production Capability 5702 5702 5752 5902 6052 6316 6409 6502 7116 7116 7116 7209 7395 7581 7674
Reserves
15 Margin (L14-L7) 726 645 636 642 658 788 742 702 1177 1026 877 819 851 887 821
16 % Reserve Margin (L15/L7) 14.6% 12.8% 12.4% 12.2% 12.2% 14.3% 13.1% 12.1% 19.8% 16.8% 14.1% 12.8% 13.0% 13.3% 12.0%
17 % Capacity Margin (L15/L14) 12.7% 11.3% 11.1% 10.9% 10.9% 12.5% 11.6% 10.8% 16.5% 14.4% 12.3% 11.4% 11.5% 11.7% 10.7%
SCE&G Forecast of Summer Loads and Resources - 2011 IRP - HIGH Load Scenario
35
YEAR 2011 2012 2013 2014 2015 2016 2017 2018 2019 2020 2021 2022 2023 2024 2025
Load Forecast
1 Baseline Trend 4961 5056 4977 5066 5139 5206 5282 5353 5425 5506 5577 5653 5731 5807 5885
2 EE Impact -10 -24 -74 -121 -164 -201 -242 -288 -338 -394 -410 -423 -436 -449 -462
3 Gross Territorial Peak 4951 5032 4903 4945 4975 5005 5040 5065 5087 5112 5167 5230 5295 5358 5423
4 Demand Response -225 -225 -225 -225 -225 -225 -225 -225 -225 -225 -225 -225 -225 -225 -225
5 Net Territorial Peak 4726 4807 4678 4720 4750 4780 4815 4840 4862 4887 4942 5005 5070 5133 5198
6 Firm Contract Sales 250 250
7 Total Firm Obligation 4976 5057 4678 4720 4750 4780 4815 4840 4862 4887 4942 5005 5070 5133 5198
System Capacity
8 Existing 5702 5702 5702 5702 5702 5702 5986 5986 5986 6200 6200 6200 6200 6200 6200
Additions
9 Peaking/Intermediate
10 Baseload 614 614
11 Other -330 -400
12 Total System Capacity 5702 5702 5702 5702 5702 5986 5986 5986 6200 6200 6200 6200 6200 6200 6200
13 Firm Annual Purchase
14 Total Production Capability 5702 5702 5702 5702 5702 5986 5986 5986 6200 6200 6200 6200 6200 6200 6200
Reserves
15 Margin (L14-L7) 726 645 1024 982 952 1206 1171 1146 1338 1313 1258 1195 1130 1067 1002
16 % Reserve Margin (L15/L7) 14.6% 12.8% 21.9% 20.8% 20.0% 25.2% 24.3% 23.7% 27.5% 26.9% 25.5% 23.9% 22.3% 20.8% 19.3%
17 % Capacity Margin (L15/L14) 12.7% 11.3% 18.0% 17.2% 16.7% 20.1% 19.6% 19.1% 21.6% 21.2% 20.3% 19.3% 18.2% 17.2% 16.2%
SCE&G Forecast of Summer Loads and Resources - 2011 IRP - LOW Load Scenario

36
V. Transmission System Assessment and Planning
SCE&G's transmission planning practices develop and coordinate a program that provides
for timely modifications to the SCE&G transmission system to ensure a reliable and economical
delivery of power. This program includes the determination of the current capability of the
electrical network and a ten-year schedule of future additions and modifications to the system.
These additions and modifications are required to support customer growth, provide emergency
assistance and maintain economic opportunities for our customers while meeting SCE&G and
industry transmission performance standards.
SCE&G has an ongoing process to determine the current and future performance level of
the SCE&G transmission system. Numerous internal studies are undertaken that address the
service needs of our customers. These needs include: 1) distributed load growth of existing
residential, commercial, industrial, and wholesale customers, 2) new residential, commercial,
industrial, and wholesale customers and 3) customers who use only transmission services on the
SCE&G system.
SCE&G has developed and adheres to a set of internal Long Range Planning Criteria
which can be summarized as follows:
The requirements of the SCE&G “LONG RANGE PLANNING CRITERIA” will be satisfied if the system is designed so that during any of the following contingencies, only short-time overloads, low voltages and local loss of load will occur and that after appropriate switching and re-dispatching, all non-radial load can be served with reasonable voltages and that lines and transformers are operating within acceptable limits. a. Loss of any bus and associated facilities operating at a voltage level of 115kV or above b. Loss of any line operating at a voltage level of 115kV or above c. Loss of entire generating capability in any one plant d. Loss of all circuits on a common structure e. Loss of any transmission transformer f. Loss of any generating unit simultaneous with the loss of a single transmission line
Outages more severe are considered acceptable if they will not cause equipment damage or result in uncontrolled cascading outside the local area.
Furthermore, SCE&G subscribes to the set of mandatory Electric Reliability Organization
(ERO), also known as the North American Electric Reliability Corporation (NERC), Reliability
Standards for Transmission Planning, as approved by the NERC Board of Trustees and the FERC.

37
SCE&G assesses and designs its transmission system to be compliant with the requirements as set
forth in these standards. A copy of the NERC Reliability Standards is available at the NERC
website http://www.nerc.com/.
The SCE&G transmission system is interconnected with Progress Energy – Carolinas,
Duke Energy, South Carolina Public Service Authority (“Santee Cooper”), Georgia Power
(“Southern Company”) and the Southeastern Electric Power Administration (“SEPA”) systems.
Because of these interconnections with neighboring systems, system conditions on other systems
can affect the capabilities of the SCE&G transmission system and also system conditions on the
SCE&G transmission system can affect other systems. SCE&G participates with other
transmission owners throughout the southeast to develop current and future power flow and
stability models of the integrated transmission grid for the NERC Eastern Interconnection. All
participants’ models are merged together to produce current and future models of the integrated
electrical network. Using these models, SCE&G evaluates its current and future transmission
system for compliance with the SCE&G Long Range Planning Criteria and the NERC Reliability
Standards.
To ensure the reliability of the SCE&G transmission system while considering conditions
on other systems and to assess the reliability of the integrated transmission grid, SCE&G
participates in assessment studies with neighboring transmission owners in South Carolina,
North Carolina and Georgia. Also, SCE&G on a periodic and ongoing basis participates with
other transmission owners throughout the southeast to assess the reliability of the southeastern
integrated transmission grid for the long-term horizon (up to 10 years) and for upcoming
seasonal (summer and winter) system conditions.
The following is a list of joint studies with neighboring transmission owners completed
over the past year:
1. 2010 January OASIS Study 2. 2010 April OASIS Study 3. 2010 July OASIS Study 4. 2010 October OASIS Study 5. SERC NTSG Reliability 2010 Summer Study 6. SERC NTSG Reliability 2010/2011 Winter Study 7. SERC LTSG 2016 Summer Future Year Study 8. VACAR 2015 Summer Study 9. SERC East/RFC 2010 Summer Study 10. SERC East/RFC 2010/2011 Winter Study
38
where the acronyms used above have the following reference:
OASIS - Open Access Same-time Information System SERC- SERC Reliability Corporation NTSG – Near Term Study Group of SERC LTSG – Long Term Study Group of SERC VACAR – Virginia-Carolinas area RFC – Reliability First Corporation
These activities, as discussed above, provide for a reliable and cost effective transmission
system for SCE&G customers.
FERC Order 890 – Attachment K (Transmission Planning) On March 15, 2007, the Federal Energy Regulatory Commission (“FERC”) published in
the Federal Register a final rule reforming the 1996 open-access transmission regulatory
framework rules in Orders No. 888 and 889. This final rule, called FERC Order No. 890, was
adopted by FERC on February 15, 2007 and is designed to “prevent undue discrimination and
preference in transmission service.” Among other requirements, this order requires transmission
providers to establish an open, transparent and coordinated transmission planning process that
includes FERC jurisdictional stakeholder involvement. SCE&G and Santee Cooper have jointly
established the South Carolina Regional Transmission Planning (“SCRTP”) process to meet the
requirements of FERC Order No. 890. Documentation of this process was filed with the FERC
on December 7, 2007 in the form of Attachment K to the SCE&G Open Access Transmission
Tariff (“OATT”). Numerous SCRTP stakeholder meetings have occurred and activities
associated with this process can be reviewed and followed at the SCRTP website
(www.scrtp.com).
Eastern Interconnection Planning Collaborative (EIPC)
The Eastern Interconnection Planning Collaborative (“EIPC”) was initiated by a coalition
of regional Planning Authorities. These Planning Authorities are entities listed on the NERC
compliance registry as Planning Authorities and represent the entire Eastern Interconnection.
The EIPC was founded to be a broad-based, transparent collaborative process among all
interested stakeholders:
- State and Federal policy makers

39
- Consumer and environmental interests
- Transmission Planning Authorities
- Market participants generating, transmitting or consuming electricity within the
Eastern Interconnection
The EIPC will provide a grass-roots approach which builds upon the regional expansion
plans developed each year by regional stakeholders in collaboration with their respective NERC
Planning Authorities. This approach will provide coordinated interregional analysis for the entire
Eastern Interconnection guided by the consensus input of an open and transparent stakeholder
process.
The EIPC represents a first-of-its-kind effort, to involve Planning Authorities in the
Eastern Interconnection to model the impact on the grid of various policy options determined to
be of interest by state, provincial and federal policy makers and other stakeholders. This work
will build upon, rather than replace, the current local and regional transmission planning
processes developed by the Planning Authorities and associated regional stakeholder groups
within the entire Eastern Interconnection. Those processes will be informed by the EIPC
analysis efforts including the interconnection-wide review of the existing regional plans and
development of transmission options associated with the various policy options.

Appendix A
A-1
Short Range Methodology
This section presents the development of the short-range electric sales forecasts for the
Company. Two years of monthly forecasts for electric customers, average usage, and total usage
were developed according to Company class and rate structures, with industrial customers
further classified into SIC (Standard Industrial Classification) codes. Residential customers were
classified by housing type (single family, multi-family, and mobile homes), rate, and by a
statistical estimate of weather sensitivity. For each forecasting group, the number of customers
and either total usage or average usage was estimated for each month of the forecast period.
The short-range methodologies used to develop these models were determined primarily
by available data, both historical and forecast. Monthly sales data by class and rate are generally
available historically. Daily heating and cooling degree data for Columbia and Charleston are
also available historically, and were projected using a 15-year average of the daily values.
Industrial production indices are also available by SIC on a quarterly basis, and can be
transformed to a monthly series. Therefore, sales, weather, industrial production indices, and
time dependent variables were used in the short range forecast. In general, the forecast groups
fall into two classifications, weather sensitive and non-weather sensitive. For the weather
sensitive classes, regression analysis was the methodology used, while for the non-weather
sensitive classes regression analysis or time series models based on the autoregressive integrated
moving average (ARIMA) approach of Box-Jenkins were used.
The short range forecast developed from these methodologies was also adjusted for DSM
programs, new industrial loads, terminated contracts, or economic factors as discussed in Section
3.

A-2
Regression Models
Regression analysis is a method of developing an equation which relates one variable,
such as usage, to one or more other variables which help explain fluctuations and trends in the
first. This method is mathematically constructed so that the resulting combination of explanatory
variables produces the smallest squared error between the historic actual values and those
estimated by the regression. The output of the regression analysis provides an equation for the
variable being explained. Several statistics which indicate the success of the regression analysis
fit are shown for each model. Several of these indicators are R2, Root Mean Squared Error,
Durbin-Watson Statistic, F-Statistic, and the T-Statistics of the Coefficient. PROC REG of SAS1
was used to estimate all regression models. PROC AUTOREG of SAS was used if significant
autocorrelation, as indicated by the Durbin-Watson statistic, was present in the model.
Two variables were used extensively in developing weather sensitive average use
models: heating degree days (HDD) and cooling degree days (CDD). The values for HDD and
CDD are the average of the values for Charleston and Columbia. The base for HDD was 60o and
for CDD was 75o. In order to account for cycle billing, the degree day values for each day were
weighted by the number of billing cycles which included that day for the current month's billing.
The daily weighted degree day values were summed to obtain monthly degree day values.
Billing sales for a calendar month may actually reflect consumption that occurred in the previous
month based on weather conditions in that period and also consumption occurring in the current
month. Therefore, this method should more accurately reflect the impact of weather variations
on the consumption data.
The development of average use models began with plots of the HDD and CDD data
versus average use by month. This process led to the grouping of months with similar average
use patterns. Summer and winter groups were chosen, with the summer models including the

A-3
months of May through October, and the winter models including the months of November
through April. For each of the groups, an average use model was developed. Total usage
models were developed with a similar methodology for the municipal and cooperative
customers. For these customers, HDD and CDD were weighted based on Cycle 20 distributions.
This is the last reading date for bills in any given month, and is generally used for larger
customers.
Simple plots of average use over time revealed significant changes in average use for
some customer groups. Three types of variables were used to measure the effect of time on
average use:
1. Number of months since a base period;
2. Dummy variable indicating before or after a specific point in time; and,
3. Dummy variable for a specific month or months.
Some models revealed a decreasing trend in average use, which is consistent with
conservation efforts and improvements in energy efficiency. However, other models showed an
increasing average use over time. This could be the result of larger houses, increasing appliance
saturations, lower real electricity prices, and/or higher real incomes.
ARIMA Models
Autoregressive integrated moving average (ARIMA) procedures were used in developing
the short range forecasts. For various class/rate groups, they were used to develop customer
estimates, average use estimates, or total use estimates.
ARIMA procedures were developed for the analysis of time series data, i.e., sets of
observations generated sequentially in time. This Box-Jenkins approach is based on the
assumption that the behavior of a time series is due to one or more identifiable influences. This
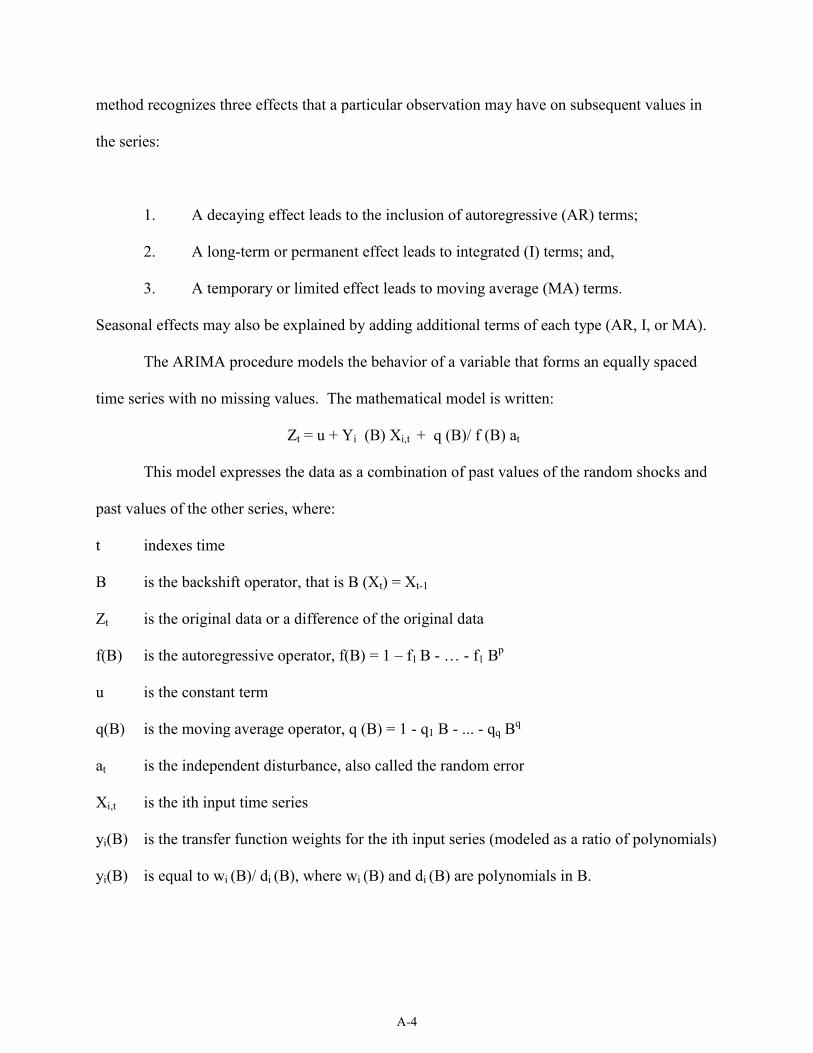
A-4
method recognizes three effects that a particular observation may have on subsequent values in
the series:
1. A decaying effect leads to the inclusion of autoregressive (AR) terms;
2. A long-term or permanent effect leads to integrated (I) terms; and,
3. A temporary or limited effect leads to moving average (MA) terms.
Seasonal effects may also be explained by adding additional terms of each type (AR, I, or MA).
The ARIMA procedure models the behavior of a variable that forms an equally spaced
time series with no missing values. The mathematical model is written:
Zt = u + Yi (B) Xi,t + q (B)/ f (B) at
This model expresses the data as a combination of past values of the random shocks and
past values of the other series, where:
t indexes time
B is the backshift operator, that is B (Xt) = Xt-1
Zt is the original data or a difference of the original data
f(B) is the autoregressive operator, f(B) = 1 – f1 B - … - f1 Bp
u is the constant term
q(B) is the moving average operator, q (B) = 1 - q1 B - ... - qq Bq
at is the independent disturbance, also called the random error
Xi,t is the ith input time series
yi(B) is the transfer function weights for the ith input series (modeled as a ratio of polynomials)
yi(B) is equal to wi (B)/ di (B), where wi (B) and di (B) are polynomials in B.
A-5
The Box-Jenkins approach is most noted for its three-step iterative process of
identification, estimation, and diagnostic checking to determine the order of a time series. The
autocorrelation and partial autocorrelation functions are used to identify a tentative model for
univariate time series. This tentative model is estimated. After the tentative model has been
fitted to the data, various checks are performed to see if the model is appropriate. These checks
involve analysis of the residual series created by the estimation process and often lead to
refinements in the tentative model. The iterative process is repeated until a satisfactory model is
found.
Many computer packages perform this iterative analysis. PROC ARIMA of (SAS/ETS)2
was used in developing the ARIMA models contained herein. The attractiveness of ARIMA
models comes from data requirements. ARIMA models utilize data about past energy use or
customers to forecast future energy use or customers. Past history on energy use and customers
serves as a proxy for all the measures of factors underlying energy use and customers when other
variables were not available. Univariate ARIMA models were used to forecast average use or
total usage when weather-related variables did not significantly affect energy use or alternative
independent explanatory variables were not available.
Footnotes
1. SAS Institute, Inc., SAS/STATtm Guide for Personal Computers, Version 6 Edition. Cary, NC: SAS Institute, Inc., 1987.
2. SAS Institute, Inc., SAS/ETS User's Guide, Version 6, First Edition. Cary, NC: SAS
Institute, Inc., 1988.
A-6
Electric Sales Assumptions
For short-term forecasting, over 30 forecasting groups were defined using the Company's
customer class and rate structures. Industrial (Class 30) Rate 23 was further divided using SIC
codes. In addition, twenty-nine large industrial customers were individually projected. The
residential class was disaggregated into several sub-groups, starting first with rate. Next, a
regression analysis was done to separate customers into two categories, “more weather-sensitive”
and “less weather sensitive”. Generally speaking, the former group is associated with electric
space heating, and the latter those without electric space heating. Finally, these categories were
divided by housing type (single family, multi-family, and mobile homes). Each municipal and
cooperative account represents a forecasting group and was also individually forecast.
Discussions were held with Industrial Marketing and Economic Development representatives
within the Company regarding prospects for industrial expansions or new customers, and
adjustments made to customer, rate, or account projections where appropriate. Table 1 contains
the definition for each group and Table 2 identifies the methodology used and the values
forecasted by forecasting groups.
The forecast for Company Use is based on historic trends and adjusted for Summer
nuclear plant outages. Unaccounted energy, which is the difference between generation and
sales and represents for the most part system losses, is usually about 4.3% of total territorial
sales. The monthly allocations for unaccounted for were based on a regression model using
normal total degree-days for the calendar month and total degree-days weighted by cycle billing.
Adding Company use and unaccounted energy to monthly territorial sales produces electric
generation requirements.
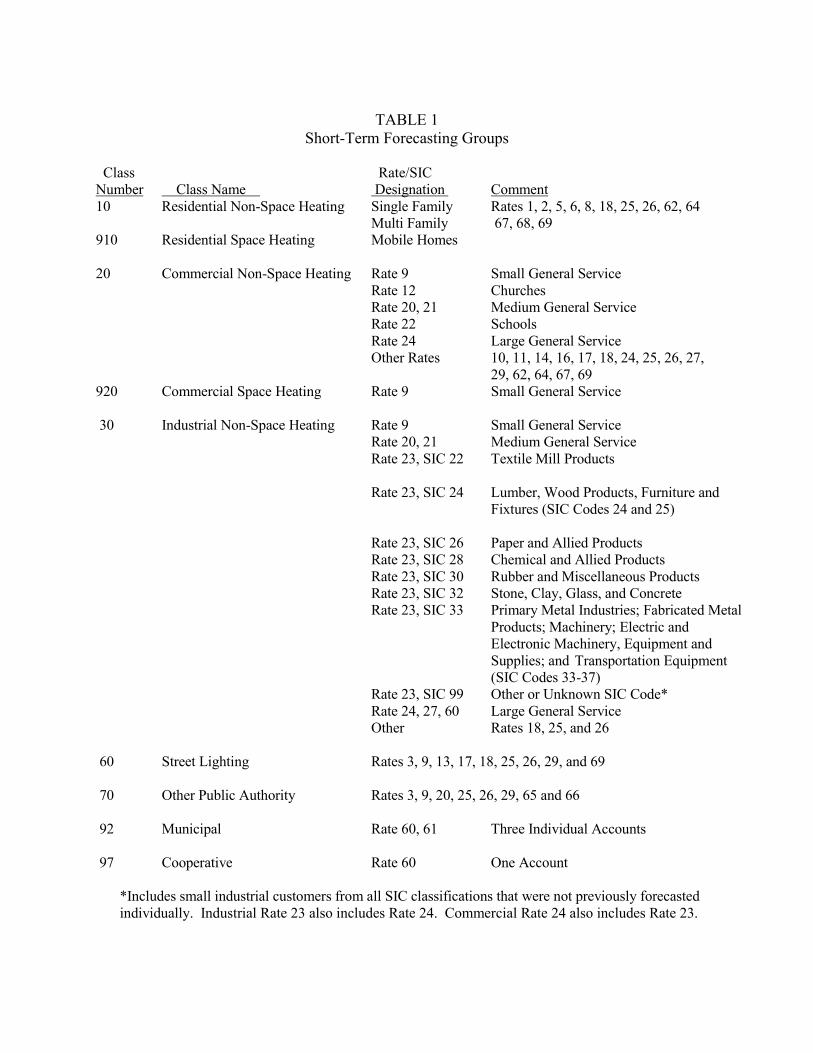
TABLE 1 Short-Term Forecasting Groups
Class Rate/SIC Number Class Name Designation Comment 10 Residential Non-Space Heating Single Family Rates 1, 2, 5, 6, 8, 18, 25, 26, 62, 64 Multi Family 67, 68, 69 910 Residential Space Heating Mobile Homes 20 Commercial Non-Space Heating Rate 9 Small General Service Rate 12 Churches Rate 20, 21 Medium General Service Rate 22 Schools Rate 24 Large General Service Other Rates 10, 11, 14, 16, 17, 18, 24, 25, 26, 27, 29, 62, 64, 67, 69 920 Commercial Space Heating Rate 9 Small General Service 30 Industrial Non-Space Heating Rate 9 Small General Service Rate 20, 21 Medium General Service Rate 23, SIC 22 Textile Mill Products Rate 23, SIC 24 Lumber, Wood Products, Furniture and Fixtures (SIC Codes 24 and 25) Rate 23, SIC 26 Paper and Allied Products Rate 23, SIC 28 Chemical and Allied Products Rate 23, SIC 30 Rubber and Miscellaneous Products Rate 23, SIC 32 Stone, Clay, Glass, and Concrete Rate 23, SIC 33 Primary Metal Industries; Fabricated Metal Products; Machinery; Electric and Electronic Machinery, Equipment and Supplies; and Transportation Equipment (SIC Codes 33-37) Rate 23, SIC 99 Other or Unknown SIC Code* Rate 24, 27, 60 Large General Service Other Rates 18, 25, and 26 60 Street Lighting Rates 3, 9, 13, 17, 18, 25, 26, 29, and 69 70 Other Public Authority Rates 3, 9, 20, 25, 26, 29, 65 and 66 92 Municipal Rate 60, 61 Three Individual Accounts 97 Cooperative Rate 60 One Account
*Includes small industrial customers from all SIC classifications that were not previously forecasted individually. Industrial Rate 23 also includes Rate 24. Commercial Rate 24 also includes Rate 23.

TABLE 2
Summary of Methodologies Used To Produce The Short Range Forecast
Value Forecasted Methodology Forecasting Groups Average Use Regression Class 10, All Groups Class 910, All Groups Class 20, Rates 9, 12, 20, 22, 24, 99 Class 920, Rate 9 Class 70, Rate 3 Total Usage ARIMA/ Class 30, Rates 9, 20, 99, and 23, Regression for SIC = 91 and 99 Class 930, Rate 9 Class 60 Class 70, Rates 65, 66 Regression Class 92, All Accounts Class 97, All Accounts Customers ARIMA Class 10, All Groups Class 910, All Groups Class 20, All Rates Class 920, Rate 9
Class 30, All Rates Except 60, 99, and 23 for SIC = 22, 24, 26, 28, 30, 32, 33, and 91 Class 930, Rate 9 Class 60 Class 70, Rate 3

Appendix B

B-1
Long Range Sales Forecast
Electric Sales Forecast
This section presents the development of the long-range electric sales forecast for the
Company. The long-range electric sales forecast was developed for seven classes of service:
residential, commercial, industrial, street lighting, other public authorities, municipal and
cooperatives. These classes were disaggregated into appropriate subgroups where data was
available and there were notable differences in the data patterns. The residential, commercial, and
industrial classes are considered the major classes of service and account for over 90% of total
territorial sales. A customer forecast was developed for each major class of service. For the
residential class, forecasts were also produced for those customers with electric space heating and
for those without electric space heating. They were further disaggregated into housing types of
single family, multi-family and mobile homes. In addition, two residential classes and residential
street lighting were evaluated separately. These subgroups were chosen based on available data and
differences in the average usage levels and/or data patterns. The industrial class was disaggregated
into two digit SIC code classification for the large general service customers, while smaller
industrial customers were grouped into an "other" category. These subgroups were chosen to
account for the differences in the industrial mix in the service territory. With the exception of the
residential group, the forecast for sales was estimated based on total usage in that class of service.
The number of residential customers and average usage per customer were estimated separately and
total sales were calculated as a product of the two.
The forecast for each class of service was developed utilizing an econometric approach.
The structure of the econometric model was based upon the relationship between the variable to be
forecasted and the economic environment, weather, conservation, and/or price.
B-2
Forecast Methodology Development of the models for long-term forecasting was econometric in approach and used
the technique of regression analysis. Regression analysis is a method of developing an equation,
which relates one variable, such as sales or customers, to one or more other variables that are
statistically correlated with the first, such as weather, personal income or population growth.
Generally, the goal is to find the combination of explanatory variables producing the smallest error
between the historic actual values and those estimated by the regression. The output of the
regression analysis provides an equation for the variable being explained. In the equation, the
variable being explained equals the sum of the explanatory variables each multiplied by an
estimated coefficient. Various statistics, which indicate the success of the regression analysis fit,
were used to evaluate each model. The indicators were R2, mean squared Error of the Regression,
Durbin-Watson Statistic and the T-Statistics of the Coefficient. PROC REG and PROC
AUTOREG of SAS were used to estimate all regression models. PROC REG was used for
preliminary model specification, elimination of insignificant variables, and also for the final model
specifications. Model development also included residual analysis for incorporating dummy
variables and an analysis of how well the models fit the historical data, plus checks for any
statistical problems such as autocorrelation or multicollinearity. PROC AUTOREG was used if
autocorrelation was present as indicated by the Durbin-Watson statistic.
Prior to developing the long-range models, certain design decisions were made:
The multiplicative or double log model form was chosen. This form allows forecasting
based on growth rates, since elasticities with respect to each explanatory variable are given
directly by their respective regression coefficients. Elasticity explains the responsiveness of
changes in one variable (e.g. sales) to changes in any other variable (e.g. price). Thus, the
elasticity coefficient can be applied to the forecasted growth rate of the explanatory variable

B-3
to obtain a forecasted growth rate for a dependent variable. These forecasted growth rates
were then applied to the last year of the short range forecast to obtain the forecast level for
customers or sales for the long range forecast. This is a constant elasticity model, therefore,
it is important to evaluate the reasonableness of the model coefficients.
One way to incorporate conservation effects on electricity is through real prices, or time
trend variables. Models selected for the major classes would include these variables, if they
were statistically significant.
The remaining variables to be included in the models for the major classes would come
from four categories:
1. Demographic variables - Population.
2. Measures of economic well-being or activity: real personal income, real per capita
income, employment variables, and industrial production indices.
3. Weather variables - average summer/winter temperature or heating and cooling degree-
days.
4. Variables identified through residual analysis or knowledge of political changes, major
economics events, etc. (e.g., gas price spike in 2005 and recession versus non-recession
years).
Standard statistical procedures (all possible regressions, stepwise regression) were used to
obtain preliminary specifications for the models. Model parameters were then estimated using
historical data and competitive models were evaluated on the basis of:
Residual analysis and traditional "goodness of fit" measures to determine how well these
models fit the historical data and whether there were any statistical problems such as
autocorrelation or multicollinearity.
An examination of the model results for the most recently completed full year.

B-4
An analysis of the reasonableness of the long-term trend generated by the models. The
major criteria here was the presence of any obvious problems, such as the forecasts
exceeding all rational expectations based on historical trends and current industry
expectations.
An analysis of the reasonableness of the elasticity coefficient for each explanatory variable.
Over the years a host of studies have been conducted on various elasticities relating to
electricity sales. Therefore, one check was to see if the estimated coefficients from
Company models were in-line with others. As a result of the evaluative procedure, final
models were obtained for each class.
The drivers for the long-range electric forecast included the following variables.
Service Area Population
Service Area Real Per Capita Income
Service Area Real Personal Income
State Industrial Production Indices
Real Price of Electricity
Average Summer Temperature
Average Winter Temperature
Heating Degree Days
Cooling Degree Days
The service area data included Richland, Lexington, Berkeley, Dorchester, Charleston,
Aiken and Beaufort counties, which account for the vast majority of total territorial electric sales.
Service area historic data and projections were used for all classes with the exception of the
industrial class. Industrial productions indices were only available on a statewide basis, so
forecasting relationships were developed using that data. Since industry patterns are generally

B-5
based on regional and national economic patterns, this linking of Company industrial sales to a
larger geographic index was appropriate.
Economic Assumptions
In order to generate the electric sales forecast, forecasts must be available for the
independent variables. The forecasts for the economic and demographic variables were obtained
from Global Insight, Inc. and the forecasts for the price and weather variables were based on
historical data. The trend projection developed by Global Insight is characterized by slow, steady
growth, representing the mean of all possible paths that the economy could follow if subject to no
major disruptions, such as substantial oil price shocks, untoward swings in policy, or excessively
rapid increases in demand.
Average summer temperature or CDD (Average of June, July, and August temperature) and
average winter temperature or HDD (Average of December (previous year), January and February
temperature) were assumed to be equal to the normal values used in the short range forecast.
Peak Demand Forecast
This section describes the procedures used to create the long-range summer and winter peak
demand forecasts. It also describes the methodology used to forecast monthly peak demands.
Development of summer peak demands will be discussed initially, followed by the construction of
winter peaks.
Summer Peak Demand
The forecast of summer peak demands was developed with a load factor methodology. This
methodology may be characterized as a building-block approach because class, rate, and some
individual customer peaks are separately determined and then summed to derive the territorial peak.
Briefly, the following steps were used to develop the summer peak demand projections.
Load factors for selected classes and rates were first calculated from historical data and then used to

B-6
estimate peak demands from the projected energy consumption among these categories. Next,
planning peaks were determined for a number of large industrial customers. The demands of these
customers were forecasted individually. Summing these class, rate, and individual customer
demands provided the forecast of summer territorial peak demand. Next, savings identified from
SCE&G’s demand-side management programs were removed. Finally, the incremental reductions
in demand resulting from the Company's standby generator and interruptible programs were
subtracted from the peak demand forecast. This calculation gave the firm summer territorial peak
demand, which was used for planning purposes.
Load Factor Development As mentioned above, load factors are required to calculate KW demands from KWH energy.
This can be seen from the following equation, which shows the relationship between annual load
factors, energy, and demand:
Load Factor = Energy/(Demand x 8760) The load factor is thus seen to be a ratio of total energy consumption relative to what it
might have been if the customer had maintained demand at its peak level throughout the year. The
value of a load factor will usually range between 0 and 1, with lower values indicating more
variation in a customer's consumption patterns, as typified by residential users with relatively large
space-conditioning loads. Conversely, higher values result from more level demand patterns
throughout the year, such as those seen in the industrial sector.
Rearrangement of the above equation makes it possible to calculate peak demand, given
energy and a corresponding load factor. This form of the equation is used to project peak demand
herein. The question then becomes one of determining an appropriate load factor to apply to
projected energy sales.

B-7
The load factors used for the peak demand forecast were not based on one-hour coincident
peaks. Instead, it was determined that use of a 4-hour average class peak was more appropriate for
forecasting purposes. This was true for two primary reasons. First, analysis of territorial peaks
showed that all of the summer peaks had occurred between the hours of 2 and 6 PM. However, the
distribution of these peaks between those four hours was fairly evenly spread. It was thus
concluded that while the annual peak would occur during the 4-hour band, it would not be possible
to say with a high degree of confidence during which hour it would happen.
Second, the coincident peak demand of the residential and commercial classes depended on
the hour of the peak's occurrence. This was due to the former tending to increase over the 4-hour
band, while the latter declined. Thus, load factors based on peaks occurring at, say, 2 PM, would be
quite different from those developed for a 5 PM peak. It should also be noted that the class
contribution to peak is quite stable for groups other than residential and commercial. This means
that the 4-hour average class demand, for say, municipals, was within 2% of the 1-hour coincident
peak. Consequently, since the hourly probability of occurrence was roughly equal for peak demand,
it was decided that a 4-hour average demand was most appropriate for forecasting purposes.
The effect of system line losses were embedded into the class load factors so they could be
applied directly to customer level sales and produce generation level demands. This was a
convenient way of incorporating line losses into the peak demand projections.

B-8
Energy Projections
For those categories whose peak demand was to be projected from KWH sales, the next
requirement was a forecast of applicable sales on an annual basis. These projections were utilized
in the peak demand forecast construction. In addition, street light sales were excluded from forecast
sales levels when required, since there is no contribution to peak demand from this type of sale.
Combining load factors and energy sales resulted in a preliminary, or unadjusted peak
demand forecast by class and/or rate. The large industrial customers whose peak demands were
developed separately were also added to this forecast.
Derivation of the planning peak required that the impact of demand reduction programs be
subtracted from the unadjusted peak demand forecast. This is true because the capacity expansion
plan is sized to meet the firm peak demand, which includes the reductions attributable to such
programs.
Winter Peak Demand
To project winter peaks actual winter peak demands were correlated with three primary
explanatory variables, total territorial energy, customers, and weather during the day of the winter
peak's occurrence. Other dummy variables were also tested for inclusion in the model to account
for unusual events, such as recessions or extremely cold winters, but the final model utilized the two
variables named above.
The logic behind the choice of these variables as determinants of winter peak demand is
straightforward. Over time, growth in total territorial load is correlated with economic growth and
activity in SCE&G's service area, and as such may be used as a proxy variable for those economic
factors, which cause winter peak demand to change. It should be noted that the winter peak for any
given year by industry convention is defined as occurring after the summer peak for that year. The
winter period for each year is December of that year, along with January and February of the

B-9
following year. For example, the winter peak in 1968 of 962 MW occurred on December 11, 1968,
while the winter peak for 1969 of 1,126 MW took place on January 8, 1970. In addition to
economic factors, weather also causes winter peak demand to fluctuate, so the impact of this
element was measured by two variables: the average of heating degree days (HDD) experienced on
the winter peak day in Columbia and Charleston and the minimum temperature on the peak day.
The presence of a weather variable reduces the bias which would exist in the other explanatory
variables' coefficients if weather were excluded from the regression model, given that the weather
variable should be included. When the actual forecast of winter peak demand was calculated, the
normal value of heating degree-days over the sample period was used. Although the ratio of winter
to summer peak demands fluctuated over the sample period, it did show an increase over time. A
primary cause for this increasing ratio was growth in the number of electric space heating
customers. Due to the introduction and rapid acceptance of heat pumps over the past three decades,
space-heating residential customers increased from less than 5,000 in 1965 to almost 217,000 in
2004, a 10.2% annual growth rate. However, this growth slowed dramatically in the 1990’s, so the
expectation is that the ratio of summer to winter peaks will change slowly in the future.