2011 report carlsbad environmental monitoring & research center
DESCRIPTION
2011 ReportCarlsbad Environmental Monitoring & Research CenterThis report is mostly lies and undermines the severity of the chemical toxicity of each radio nuclide. People in tokyo where breathing 15 to 10 hot particles a day the month of april 2011 while people in organ USA were breathing 10 to 5 hot particles a day from Fukushima. Many will die In north america from Fukushima this report states otherwise. Interesting to see the levels they do show revile how fast the toxic plume went around the northern hemisphere.TRANSCRIPT

2011 Report Carlsbad Environmental Monitoring
& Research Center
1400 University Drive Carlsbad, NM 88220
(575) 887-2759 www.cemrc.org


Executive Summary
EXECUTIVE SUMMARY
The Carlsbad Environmental Monitoring and Research Center (CEMRC) has
measured the levels of radiological and non-radiological constituents in samples of the
exhaust air, ambient air, and water collected at and in the vicinity of the U.S. DOE’s Waste
Isolation Pilot Plant (WIPP) during calendar year 2011. The WIPP facility became
operational in March 26, 1999 for the disposal of transuranic waste, and the WIPP received
its first mixed waste shipments on September 9, 2000.
The CEMRC has compared these levels to those measured in the pre-operational
phase, prior to receipt of waste. Based on these analyses, the CEMRC concludes that:
a) Levels of the measured radiological and non-radiological constituents in the
environment around WIPP during calendar year 2011 are not different from the
preoperational baseline levels.
b) The measured levels are similar to those measured by other organizations, where
direct comparisons can be made.
c) Trace amounts of radionuclides (131
I, 134
Cs, and 137
Cs) from the Fukushima
nuclear power plant incident were detected in the station A and ambient air
samples collected during March-April 2011. However, it is important to note that
all of the radiation levels detected across the United States, including Carlsbad,
due to the Fukushima nuclear power plant accident have been very low, well
below any level of public or environmental concern.
d) No measurable radiation dose to the public resulted from WIPP-related operations
during calendar year 2011, relative to the estimated baseline dose.
Lastly, I would like to acknowledge the following individuals who contributed heavily to the
creation of this report: Ms. Sally Ballard, Ms. Adrienne Chancellor, Dr. Anuj Kumar, Mr.
Jim Monk, Dr. Ila Pillalamarri, Dr. Punam Thakur, and Ms. Melinda Wilson.
Respectfully submitted,
Russell Hardy
Director, Carlsbad Environmental Monitoring & Research Center


Table of Contents
Carlsbad Environmental Monitoring & Research Center 2011 Report i
Table of Contents
List of Tables ............................................................................................................................ ii
List of Figures ............................................................................................................................v
Acronyms and Abbreviations ....................................................................................................x
Introduction ................................................................................................................................1
Overview ....................................................................................................................................3
Chapter 1 WIPP Exhaust Air Monitoring....................................................................... 1-1
Chapter 2 Monitoring Drinking Water From Selected Sources ..................................... 2-1
Chapter 3 Whole Body and Lung In Vivo Measurement of Occurrence of
Radionuclides ................................................................................................. 3-1
Chapter 4 Analysis of Volatile Organic Compounds, Hydrogen and Methane ............. 4-1
Chapter 5 Ambient Aerosol Studies for the WIPP-EM .................................................. 5-1
Chapter 6 Impact of Fukushima Nuclear Power Plant Accident .................................... 6-1
Chapter 7 An External Review of the CEMRC Quality Assurance Plan ....................... 7-1
Appendices A: Brief History of CEMRP ......................................................................... A-1
B: Recent Publications .................................................................................. A-3
C: Performance Tests and Audits ................................................................. A-4
D: Radiochemical Equations....................................................................... A-22
References ..................................................................................................................... A-26

List of Tables
ii Carlsbad Environmental Monitoring & Research Center 2011 Report
List of Tables
Table 0.1. WIPP-EM Sampling Schedule ........................................................................................................... 4
Table 0.2. Radioactive Nuclides and Non-Radioactive Analytes Monitored at WIPP ........................................ 6
Table 1.1. Total Air Flow Volume and Mass Loading Recorded in Monthly Composite
Filters in 2011 ................................................................................................................................ 1-11
Table 1.2. Summary Statistics for Mass Loading and Gross Alpha Analyses of Station A Filters ................ 1-13
Table 1.3. Summary Statistics for Mass Loading and Gross Beta Analyses of Station A Filters .................. 1-14
Table 1.4. Summary Statistics for Aerosol Mass Loadings on Station A (µg/m3 per filter) .......................... 1-14
Table 1.5. Summary Statistics of Maximum Gross Alpha and Beta Activities and the Corresponding
Mass Loading on Station A Filters from 1998-2011 ..................................................................... 1-18
Table 1.6. Radionuclides concentrations in Monthly Composite Samples Collected from Station A............ 1-19
Table 1.7. Activities greater than MDC and Uncertainty (2σ) measured by CEMRC during
period 1999-2011 .......................................................................................................................... 1-26
Table 1.8. Activities greater than MDC and Uncertainty (2σ) measured by WTS during
period 1999-2011 .......................................................................................................................... 1-27
Table 1.9. Historical Minimum, Maximum, and Average Concentrations of 238
Pu (Bq/m3)
measured in Station A ................................................................................................................... 1-27
Table 1.10. Historical Minimum, Maximum, and Average Concentrations of 239+240
Pu (Bq/m3)
measured in Station A ................................................................................................................... 1-28
Table 1.11. Historical Minimum, Maximum, and Average Concentrations of 241
Am (Bq/m3)
measured in Station A ................................................................................................................... 1-28
Table 1.12. 234
U/238
U Activity Ratios in Station A Composites in 2011 .......................................................... 1-29
Table 1.13. Minimum, Maximum, and Average Radionuclide Concentrations (Bq/m3) in Station A
Composites in 2011 ....................................................................................................................... 1-30
Table 2.1. Drinking Water Parameters, Methods, and Detection Levels used to Analyze
Samples from all Locations ............................................................................................................. 2-6
Table 2.2. Basic Information about Drinking Water Contaminants from the EPA .......................................... 2-7
Table 2.3. Radionuclide Activity Concentrations in Drinking Water in 2011 ................................................. 2-8
Table 2.4. Comparison of Activity Concentration Ratios of 234
U/238
U and 235
U/238
U in Water
Samples Collected Near the WIPP Site with Other Countries ...................................................... 2-12
Table 2.5. Historical Activity Concentrations of 234
U, 235
U and 238
U (Bq/L) measured in
Carlsbad Drinking Water ............................................................................................................... 2-12
Table 2.6. Historical Activity Concentrations of 234
U, 235
U and 238
U (Bq/L) measured in
Double Eagle Drinking Water ....................................................................................................... 2-13

List of Tables
Carlsbad Environmental Monitoring & Research Center 2011 Report iii
Table 2.7. Historical Activity Concentrations of 234
U, 235
U and 238
U (Bq/L) measured in Hobbs
Drinking Water .............................................................................................................................. 2-13
Table 2.8. Historical Activity Concentrations of 234
U, 235
U and 238
U (Bq/L) measured in Otis
Drinking Water .............................................................................................................................. 2-14
Table 2.9. Historical Activity Concentrations of 234
U, 235
U and 238
U (Bq/L) measured in Loving
Drinking Water .............................................................................................................................. 2-14
Table 2.10. Measured Concentration of Selected Inorganic Analytes in Carlsbad Drinking Water
from 1998 to 2011 ........................................................................................................................ 2-19
Table 2.11. Measured Concentration of Selected Inorganic Analytes in Double Eagle Drinking
Water from 1998 to 2011 ............................................................................................................. 2-20
Table 2.12. Measured Concentration of Selected Inorganic Analytes in Hobbs Drinking Water
from 1998 to 2011 ........................................................................................................................ 2-21
Table 2.13. Measured Concentration of Selected Inorganic Analytes in Loving Drinking Water
from 1998 to 2011 ......................................................................................................................... 2-22
Table 2.14. Measured Concentration of Selected Inorganic Analytes in Otis Drinking Water
from 1998 to 2011 ......................................................................................................................... 2-23
Table 2.15. Measured Concentration of Selected Inorganic Analytes in Malaga Drinking Water
from 1998 to 2011 ......................................................................................................................... 2-24
Table 3.1. Demographic Characteristics of the "Lie Down and Be Counted" Population Sample
through December 31, 2011 ............................................................................................................ 3-7
Table 3.2. Minimum Detectable Activities ...................................................................................................... 3-8
Table 3.3. "Lie Down and Be Counted" Results through December 31, 2011 ............................................... 3-11
Table 4.1. CEMRC Procedures for Confirmatory Volatile Organic Compounds Monitoring Program .......... 4-5
Table 4.2. Compounds of Interest for WIPP Confirmatory Volatile Organic Compounds
Monitoring Program ........................................................................................................................ 4-5
Table 4.3. Additional Requested Compounds for WIPP Confirmatory Volatile Organic Compounds
Monitoring Program ........................................................................................................................ 4-6
Table 5.1. Aerosol Sampling Status for the WIPP-EM .................................................................................... 5-7
Table 5.2. Summary Statistics for Aerosol Mass Loadings and Actinide Activities in High Volume
Aerosol Samples Around WIPP Site ............................................................................................... 5-8
Table 5.3. Minimum, Maximum, and Average Radionuclide Concentrations (Bq/m3) in Aerosol Filters
at On Site Station .......................................................................................................................... 5-24
Table 5.4. Minimum, Maximum, and Average Radionuclide Concentrations (Bq/m3) in Aerosol Filters
at Near Field Station ...................................................................................................................... 5-27
Table 5.5. Minimum, Maximum, and Average Radionuclide Concentrations (Bq/m3) in Aerosol Filters
at Cactus Flats Station ................................................................................................................... 5-30

List of Tables
iv Carlsbad Environmental Monitoring & Research Center 2011 Report
Table 6.1. Fukushima Daiichi Units ................................................................................................................. 6-3
Table 6.2. Properties of Radionuclides Detected following the Fukushima Nuclear Accident
outside Japan ................................................................................................................................... 6-6
Table 6.3. Analytical techniques used and typical minimum detectable activities ........................................... 6-6
Table 6.4. Concentration of Airborne Fission Products (Bq/m3) Measured In the vicinity
of the WIPP Site .............................................................................................................................. 6-6
Table C.1. Blind Check Study for Internal Dosimetry Department 2010/2011 by the Oak Ridge
National Laboratory (ORNL) Inter-comparison Studies In-vivo Program ..................................... A-6
Table C.2. Quality Assurance/Quality Control for Internal Dosimetry 2011 Audits ....................................... A-9
Table C.3. Radiochemistry MAPEP 2011 Intercomparison Results .............................................................. A-11
Table C.4. Example of the Daily Performance Tests for ICP-MS ................................................................. A-18
Table C.5. Participation in NIST Radiochemistry Intercomparison Program ................................................ A-19
Table D.1. % Chemical Recovery of Tracers in FAS Samples ...................................................................... A-23
Table D.2. % Chemical Recovery of Tracers in Drinking Water Samples .................................................... A-23
Table D.3. % Chemical Recovery of Tracers in Ambient Aerosol Samples .................................................. A-23

List of Figures
Carlsbad Environmental Monitoring & Research Center 2011 Report v
List of Figures
Figure 0.1. CEMRC Organizational Chart........................................................................................................ 14
Figure 1.1. Fixed Air Samplers at Station A .................................................................................................... 1-3
Figure 1.2. Number of FAS Filters Collected from Station A ......................................................................... 1-3
Figure 1.3. Flow Diagram Showing the Handling and Analysis of FAS Filters .............................................. 1-4
Figure 1.4. Gross Alpha Activity Densities measured in Station A Filters .................................................... 1-11
Figure 1.5. Gross Alpha Activity Concentrations measured in Station A Filters .......................................... 1-12
Figure 1.6. Gross Beta Activity Densities measured in Station A Filters ...................................................... 1-12
Figure 1.7. Gross Beta Activity Concentrations measured in Station A Filters ............................................. 1-12
Figure 1.8. Aerosol Mass Loadings on Station A Filters from 1998-2011 .................................................... 1-15
Figure 1.9. Average Mass Loadings on Station A Filters from 1998-2011 ................................................... 1-15
Figure 1.10. Weekly Average Gross Alpha Activity measured in Station A Filters in 2011 ........................... 1-16
Figure 1.11. Weekly Average Gross Beta Activity measured in Station A Filters in 2011 ............................. 1-16
Figure 1.12. Monthly Average Gross Alpha Activity measured in Station A Filters in 2011 ......................... 1-17
Figure 1.13. Monthly Average Gross Beta Activity measured in Station A Filters in 2011 ............................ 1-17
Figure 1.14. Average Annual Gross Alpha and Beta Activity Concentrations in Station A filters ................. 1-18
Figure 1.15. 239+240Pu Concentrations in Station A composites in 2011 ..................................................... 1-22
Figure 1.16. 238Pu Concentrations in Station A Composites in 2011 ............................................................. 1-23
Figure 1.17. 241Am Concentrations in Station A composites in 2011 ............................................................ 1-23
Figure 1.18. 137Cs Concentrations in Station A Composites in 2011 ............................................................. 1-24
Figure 1.19. 134Cs Concentrations in Station A Composite in 2011 .............................................................. 1-24
Figure 1.20. 60Co Concentrations in Station A Composite in 2011 ................................................................ 1-25
Figure 1.21. Annual Average Activity Concentrations of 239+240Pu and 241Am in WIPP Exhaust Air
from 1998-2011 ........................................................................................................................... 1-25
Figure 1.22. Annual Average Activity Concentrations of 239+240Pu and 238Pu in WIPP Exhaust Air
from 1998-2011 ........................................................................................................................... 1-26
Figure 1.23. Concentrations of Al in WIPP Exhaust Air from 1998 through 2011 ......................................... 1-31
Figure 1.24. Concentrations of Mg in WIPP Exhaust Air from 1998 through 2011 ....................................... 1-31
Figure 1.25. Concentrations of Cd in WIPP Exhaust Air from 1998 through 2011 ........................................ 1-32
Figure 1.26. Concentrations of Pb in WIPP Exhaust Air from 1998 through 2011 ......................................... 1-32
Figure 1.27. Concentrations of Th in WIPP Exhaust Air from 1998 through 2011 ......................................... 1-33

List of Figures
vi Carlsbad Environmental Monitoring & Research Center 2011 Report
Figure 1.28. Concentrations of U in WIPP Exhaust Air from 1998 through 2011 .......................................... 1-33
Figure 1.29. Monthly Average Concentrations of Al for 2011 ........................................................................ 1-34
Figure 1.30. Monthly Average Concentrations of Mg for 2011 ...................................................................... 1-34
Figure 1.31. Monthly Average Concentrations of Cd for 2011 ....................................................................... 1-35
Figure 1.32. Monthly Average Concentrations of Pb for 2011 ........................................................................ 1-35
Figure 1.33. Monthly Average Concentrations of Th for 2011 ........................................................................ 1-36
Figure 1.34. Monthly Average Concentrations of U for 2011 ......................................................................... 1-36
Figure 2.1. Average 234U, 235U, and 238U concentrations (Bq/L) in Regional Drinking Water ................ 2-10
Figure 2.2. Total Uranium Concentrations in Bq/L in Regional Drinking Water Collected in 2011 ............. 2-10
Figure 2.3. Average 234U/238U Activity Ratio in Regional Drinking Water from 1998 to 2011 ................ 2-11
Figure 2.4. 239+240Pu in Carlsbad Drinking Water from 1998-2011........................................................... 2-15
Figure 2.5. 238Pu in Carlsbad Drinking Water from 1998-2011 ................................................................... 2-15
Figure 2.6. 241Am in Carlsbad Drinking Water from 1998-2011 ................................................................. 2-16
Figure 2.7. 239+240Pu in Hobbs Drinking Water from 1998-2011 .............................................................. 2-16
Figure 2.8. 238Pu in Hobbs Drinking Water from 1998-2011 ...................................................................... 2-17
Figure 2.9. 239+240Pu in Double Eagle Drinking Water from 1998-2011 ................................................... 2-17
Figure 2.10. 239+240Pu in Loving Drinking Water from 1998-2011 ............................................................. 2-18
Figure 2.11. 241Am in Otis Drinking Water from 1998-2011 ........................................................................ 2-18
Figure 2.12. Concentrations (μg/L) of Select Inorganic Analytes Measured in Carlsbad Drinking Water
From 1998 to 2011 ...................................................................................................................... 2-25
Figure 2.13. Concentrations (μg/L) of Select Inorganic Analytes Measured Near the WIPP site
(Double Eagle) from 1998 to 2011 .............................................................................................. 2-26
Figure 2.14. Concentrations (μg/L) of Select Inorganic Analytes Measured in Loving Drinking Water
from 1998 to 2011 ....................................................................................................................... 2-27
Figure 2.15. Concentrations (μg/L) of Select Inorganic Analytes Measured In Hobbs Drinking Water
from 1998 to 2011 ....................................................................................................................... 2-28
Figure 2.16. Concentrations (μg/L) of Select Inorganic Analytes Measured in Otis Drinking Water
from 1998 to 2011 ....................................................................................................................... 2-29
Figure 2.17. Select Analytes with Measured Concentrations >MDC in 2011 Drinking Water ....................... 2-30
Figure 2.18. Concentrations of Common Salts in 2011 Drinking Water ......................................................... 2-30
Figure 3.1. Number of LDBC voluntary participants (total and by gender) counted during the
period 1997 –2011 ......................................................................................................................... 3-2

List of Figures
Carlsbad Environmental Monitoring & Research Center 2011 Report vii
Figure 3.2. Percentage of voluntary participants with detectable 40K and 137Cs activities
through December 2011 ................................................................................................................ 3-4
Figure 3.3. Percentage of voluntary participants with detectable 137Cs activity through December 2011 ..... 3-5
Figure 3.4. Minimum, average, and maximum 40K activity for participants, separated by gender,
through December 2011 ................................................................................................................ 3-5
Figure 3.5. Minimum, average, and maximum 137Cs activity for participants, separated by gender,
through December 2011 ................................................................................................................ 3-6
Figure 4.1. Percent Recovery of Carbon Tetrachloride in LCS ....................................................................... 4-6
Figure 4.2. Relative Percent Deviation (RPD) between LCS and LCS-Duplicate for Carbon Tetrachloride
(RPD range: 25%) ......................................................................................................................... 4-7
Figure 4.3. Percent Recovery of Hydrogen in LCS ......................................................................................... 4-7
Figure 4.4. Relative Percent Deviation (RPD) between LCS and LCS-Duplicate for Hydrogen
(RPD range: 25%) ......................................................................................................................... 4-8
Figure 5.1. WIPP-EM Ambient Aerosol Sampling Locations ......................................................................... 5-6
Figure 5.2. High Volume Air sampler for TSP Monitoring around the WIPP Site ......................................... 5-6
Figure 5.3. Aerosol Sampling Filter Holder .................................................................................................... 5-7
Figure 5.4. High Volume Ambient Aerosol 239+240Pu Activity Concentrations ........................................ 5-10
Figure 5.5. High Volume Ambient Aerosol 239+240Pu Activity Densities .................................................. 5-10
Figure 5.6. High Volume Ambient Aerosol 241Am Activity Concentrations ............................................... 5-11
Figure 5.7. High Volume Ambient Aerosol 241Am Activity Densities ........................................................ 5-11
Figure 5.8. Correlation between 239+240Pu and 241Am Activity Concentrations in Aerosol Samples
Collected from Cactus Flats Stations ........................................................................................... 5-12
Figure 5.9. Correlation between 241Am and 239+240Pu Activity Concentrations in Aerosol Samples
Collected from Near Field Stations ............................................................................................. 5-12
Figure 5.10. Correlation between 241Am and 239+240Pu Activity Concentrations in Aerosol Samples
Collected from On Site Stations .................................................................................................. 5-13
Figure 5.11. Average High Volume Ambient Aerosol 239+240Pu Activity in the Vicinity of
WIPP Site .................................................................................................................................... 5-13
Figure 5.12. Average High Volume Ambient Aerosol 241Am Activity Concentrations in the Vicinity
of the WIPP Site .......................................................................................................................... 5-14
Figure 5.13. Average High Volume Ambient Aerosol 238Pu Activity Concentrations in the vicinity of the
WIPP Site .................................................................................................................................... 5-14
Figure 5.14. Average High Volume Ambient Aerosol Mass Loading and 239+240Pu Activity Density at
On Site Station ............................................................................................................................. 5-15
List of Figures
viii Carlsbad Environmental Monitoring & Research Center 2011 Report
Figure 5.15. Average High Volume Ambient Aerosol Mass Loading and 239+240Pu Activity Density
at Near Field Station .................................................................................................................... 5-15
Figure 5.16. Average High Volume Ambient Aerosol Mass Loading and 239+240Pu Activity Density
at Cactus Flats Station ................................................................................................................. 5-16
Figure 5.17. Average Ambient Aerosol Mass Loading in Aerosol Air Filters Near the WIPP Site ................ 5-16
Figure 5.18. 239+240Pu Concentrations in Aerosol Filters Collected in 2011 ................................................ 5-17
Figure 5.19. 238Pu Concentrations in Aerosol Filters Collected in 2011 ........................................................ 5-18
Figure 5.20. 241Am Concentrations in Aerosol Filters Collected in 2011 ...................................................... 5-19
Figure 5.21. 137Cs Concentrations in Aerosol Filters Collected in 2011 ........................................................ 5-20
Figure 5.22. 137Cs Concentrations in Aerosol Filters Collected in 2011 ........................................................ 5-21
Figure 5.23. 60Co Concentrations in Aerosol Filters Collected in 2011 ......................................................... 5-22
Figure 5.24. 40K Concentrations in Aerosol Filters Collected in 2011 ........................................................... 5-23
Figure 6.1. Nuclear Power Plant Sites in Japan Affected by the Great East Japan Earthquake ....................... 6-4
Figure 6.2. Layout of the Fukushima Daiichi NPP site ................................................................................... 6-4
Figure 6.3. BWR rector at Fukushima Daiichi NPP ........................................................................................ 6-5
Figure 6.4. Concentration of Airborne Cesium and Iodine (mBq/m3) Measured Between
March 15, 2011 –May 27, 2011 ..................................................................................................... 6-7
Figure 6.5. Concentration of Airborne Cesium and Iodine (mBq/m3) Measured in Berkeley, CA .................. 6-7
Figure 6.6. Concentration of Airborne I-131(mBq/m3) Measured in Pacific Islands ...................................... 6-8
Figure 6.7. Concentration of Airborne I-131(mBq/m3) Measured in Alaska ................................................... 6-8
Figure 6.8. Concentration of Airborne I-131(mBq/m3) Measured in west coast of the United States ............. 6-9
Figure 6.9. Concentration of Airborne I-131(mBq/m3) Measured in East coast of the United States ............. 6-9
Figure 6.10. Concentration of Airborne I-131(mBq/m3) Measured in Canada ................................................ 6-10
Figure 6.11. Concentration of Airborne I-131(mBq/m3) Measured in western and central Europe ................ 6-10
Figure 6.12. Concentration of Airborne I-131(mBq/m3) Measured in western and central Europe ................ 6-11
Figure 6.13. Concentration of Airborne I-131(mBq/m3) Measured in southern Europe .................................. 6-11
Figure 6.14. Concentration of Airborne I-131(mBq/m3) Measured in South Korea ........................................ 6-12
Figure 6.15. Concentration of Airborne I-131(mBq/m3) Measured in Hongkong ........................................... 6-12
Figure 6.16. Concentration of Airborne I-131, Cs-134 and Cs-137 (mBq/m3) Measured in Dalat, Vietnam .. 6-13
Figure 6.17. Concentration of Airborne I-131, Cs-134, and Cs-137 (mBq/m3) Measured
in Manila, Philippines .................................................................................................................. 6-13

List of Figures
Carlsbad Environmental Monitoring & Research Center 2011 Report ix
Figure 6.18. Concentration of Airborne I-131, Cs-134, and Cs-137 (mBq/m3) Measured
in Beijing, China .......................................................................................................................... 6-14
Figure 6.19. Concentration of Airborne I-131, Cs-134, and Cs-137 (mBq/m3) Measured
in Shanghai, China ...................................................................................................................... 6-14
Figure 6.20. Concentration of Airborne I-131 ( Bq/m3) Measured by CTBTO monitoring stations
around the world .......................................................................................................................... 6-15
Figure 6.21. Concentration of Airborne Cs-134 ( Bq/m3) Measured by CTBTO monitoring stations
around the world .......................................................................................................................... 6-16
Figure C.1. Comparison of Results for Ten Internal Dosimetry Laboratories in the U.S. During 2011
by the ORNL Intercomparison Studies In-vivo Program ............................................................. A-8
Figure C.2. Blind Check 2011 Environmental Chemistry Inorganic Analyses ............................................. A-10
Figure D.1. Sixty Minutes Alpha Ambient Background Count for the PIC-MPC 9604 Gross Alpha and
Beta Counter ............................................................................................................................... A-24
Figure D.2. Sixty Minutes Beta Ambient Background Count for PIC-MPC 9604 Gross Alpha and
Beta Counter ............................................................................................................................... A-24
Figure D.3. Control Chart of Daily Alpha Efficiency of the PIC-MPC 9604 Gross Alpha and
Beta Counter ............................................................................................................................... A-25
Figure D.4. Control Chart of Daily Beta Efficiency of the PIC-MPS 9604 Gross Alpha and
Beta Counter ............................................................................................................................... A-25

Acronyms and Abbreviations
x Carlsbad Environmental Monitoring & Research Center 2011 Report
Acronyms and Abbreviations
Bq MicroBecquerel
m Micrometer
Ag Silver
Al Aluminum
Am Americium
ANSI American National Standards Institute
As Arsenic
ASTM American Society for Testing and Materials
Ba Barium
Be Beryllium
Bq Becquerel
C Centigrade
Ca Calcium
CAM Continuous Air Monitor
CCP Central Characterization Project
Cd Cadmium
Ce Cerium
CEMRC Carlsbad Environmental Monitoring & Research Center
CEMRP Carlsbad Environmental Monitoring & Research Program
CFR Code of Federal Regulations
CH Contact-handled
Ci Curie
cm Centimeter
Cm Curium
Co Cobalt
Cr Chromium
CRM Certified Reference Materials
Cs Cesium
Cu Copper
DL Detection Limit
DOE U.S. Department of Energy
DOE/CBFO U.S. Department of Energy/Carlsbad Field Office
DOELAP U.S. Department of Energy Laboratory Accreditation Program
EEG Environmental Evaluation Group
EC Environmental Chemistry
EM Environmental Monitoring
EPA U.S. Environmental Protection Agency
Er Erbium
ERA Environmental Research Associates
Eu Europium
F Fluoride
FAS Fixed Air Samples
Fe Iron
FP Field Programs
FWHM Full-Width, Half-Maximum
g Gram
GC/MS Gas Chromatograph/Mass Spectrometer
Gd Gadolinium
Ge Germanium
Acronyms and Abbreviations
Carlsbad Environmental Monitoring & Research Center 2011 Report xi
GPS Global Positioning Satellite
HCl Hydrochloric acid
HClO4 Perchloric acid
HEPA High Efficiency Particulate Air
HF Hydrofluoric acid
Hg Mercury
HNO3 Nitric acid
H2O2 Hydrogen Peroxide
HPGe High Purity Germanium
hr Hour
HSG Headspace Gas
I Iodine
IC Ion Chromatography
ICP-MS Inductively Coupled Plasma-Mass Spectrometry
ID Internal Dosimetry
IM Information Management
ISO International Organization for Standardization
IUPAC International Union of Pure and Applied Chemistry
K Potassium
km Kilometer
L Liter
La Lanthanum
LaF3 Lanthanum Fluoride
LANL Los Alamos National Labs
lb Pound
LDBC "Lie Down and Be Counted"
LCS Laboratory Control Samples
LFB Laboratory Fortified Blank
LFM Laboratory Fortified Matrix
Li Lithium
LRB Laboratory Reagent Blanks
m Meter
MAPEP Mixed-Analyte Performance Evaluation Program
mb Millibar
MBL Mobile Bioassay Laboratory
mBq MilliBecquerel
MDC Minimum Detectable Concentration
MDL Method Detection Limit
Mg Magnesium
min Minute
mL Milliliter
mm Millimeter
Mn Manganese
Mo Molybdenum
M&O Management and Operations
MTRU Mixed Transuranic
Na Sodium
NaOH Sodium Hydroxide
NCR Nonconformance
Nd Neodymium
Ni Nickel
NIST National Institute of Standards and Technology
Acronyms and Abbreviations
xii Carlsbad Environmental Monitoring & Research Center 2011 Report
nm Nanometer
NMED New Mexico Environment Department
NMSU New Mexico State University
Np Neptunium
NRE Non-Routine Event
NRIP National Radiochemistry Intercomparison Program
OC Organic Chemistry
ORNL Oak Ridge National Laboratory
Pa Protactinium
Pb Lead
pH Scale Indicating Acidity or Alkalinity of a Substance
Ppbv Parts per Billion Volume
Pu Plutonium
QA Quality Assurance
QAP Quality Assurance Program
QAPD Quality Assurance Program Document
QC Quality Control
RC Radiochemistry
RCRA Resource Conservation and Recovery Act
RH Remote-Handled
Ru Ruthenium
SAB Science Advisory Board
Sb Antimony
Sc Scandium
SD Standard Deviation
Se Selenium
SE Standard Error
sec Second
SNL Sandia National Labs
Sr Strontium
T1/2 Half-Life
TCD Thermal Conductivity Detector
Th Thorium
Ti Titanium
Tl Thallium
TRU Transuranic
TSP Total Suspended Particulates
U Uranium
V Vanadium
VOC Volatile Organic Compound
WERC Waste-management Education & Research Consortium
WHB Waste Handling Building
WIPP Waste Isolation Pilot Plant
WIPP-EM Waste Isolation Pilot Plant Environmental Monitoring
WRES Washington Regulatory and Environmental Services
WTS Washington TRU Solutions
XO Experimental Operations
Y Yttrium

Introduction
Carlsbad Environmental Monitoring & Research Center 2011 Report 1
INTRODUCTION
The Waste Isolation Pilot Plant (WIPP), a U.S. Department of Energy (DOE) facility,
is an underground repository located in the remote Chihuahuan desert of southeastern New
Mexico near Carlsbad. The facility is designed to dispose of transuranic (TRU) wastes that
were generated from research and the production of nuclear weapons at various DOE sites in
the U.S. The WIPP facilities consist of above ground buildings and underground mined
areas. The underground portion of the WIPP is located 665 meters (2,150 feet) below the
surface and is divided in two main areas. The northern part, the experimental operations
(XO) area, is a research area and is open to the scientific community, while the much larger
southern part comprises the Waste Disposal Area. As shown in Figure 1, the WIPP repository
has eight panels, each consisting of seven waste disposal rooms that measure approximately
300 feet (91 meters) long and 33 feet (10 meters) wide. Seven of the planned panels have
been excavated; and the first five have been filled with waste, closed, and sealed from
ventilation air. Waste disposal is currently in progress in the sixth panel. Generally, three
panels are in operation with one already filled with waste and closed (closure mode); the
second panel already excavated with waste disposal in progress (waste disposal mode); and
the third panel ready for mining (mining mode). Currently, panel 5 is in closure mode, Panel
6 is in waste mode and Panel 7 is in mining mode.
Figure 1. WIPP layout
Two types of TRU wastes are currently stored in the WIPP repository: (1) mixed transuranic
waste (MTRU) and (2) non-mixed waste that contain only radioactive elements, mostly plutonium.
The TRU waste is subdivided into contact-handled (CH) and remote-handled (RH) waste on the basis
of the dose equivalent rate at the surface of the waste container. If the dose is < 200 mrem/h (2
mSv/h), the waste is categorized as CH-TRU waste; otherwise, the categorization is RH-TRU waste.
Contact-handled waste (CH TRU Waste) and contact-handled mixed waste (CH TRU mixed waste)
do not need additional shielding beyond the waste container. As a result, workers can unload, handle

Introduction
2 Carlsbad Environmental Monitoring & Research Center 2011 Report
and repack CH waste by touching the waste container directly. Remote-handled waste (RH TRU
waste) and remote-handled mixed waste (RH TRU mixed waste) emit higher levels of radiation
(surface dose rate from 2mSv/h to 10mSv/h); therefore, remote handling is used as a precaution to
ensure worker safety.
Both types of mixed waste contain radioactive and hazardous materials, whereas, non-mixed
waste contains only radioactive waste with negligible hazardous characteristics. The first shipment of
TRU waste, CH-TRU waste from Los Alamos National Laboratory, arrived at the WIPP on March
26th, 1999 and was disposed underground on the same day. Since opening in March 1999, more than
82,000 cubic meters of legacy TRU waste have been removed from temporary locations around the
nation and shipped to WIPP for permanent disposal. Although the waste stored at WIPP contains
numerous hazardous and/or radioactive materials, the radionuclides of greatest concern in the WIPP
are 239+240
Pu and 241
Am, which account for more than 99% of the total radioactivity for most of the
10,000 year regulatory period.
The major objective of the CEMRC monitoring program is to evaluate present, future and
sometimes past behavior of radionuclides in the vicinity of the WIPP. The program also has the
capabilities to detect radionuclides as quickly as possible in case of accidental releases from within
the repository or at the site during waste handling operations. The air, drinking water, surface water,
soil, and local population around the WIPP facility as well as air entering and exiting the WIPP
underground are analyzed at CEMRC as part of a routine environmental monitoring program.
CEMRC has been monitoring the concentration of plutonium (Pu) and americium (Am) in the area
around the WIPP sites for many years as isotopes of these elements are the major radioactive
constituents in the TRU waste. The source of Pu and Am in and around the WIPP site prior to arrival
of the TRU waste at the site can be attributed to: nuclear weapons testing that occurred between the
1950s to1980s, controlled releases from the operation of nuclear power plants and nuclear
reprocessing facilities, and nuclear accidents. It has been reported that about 15 pBq of 239+240
Pu and
0.3 pBq of 238
Pu have been globally released into the atmosphere from weapons testing and nuclear
power-related incidents, whereas 1.3 pBq of 238
Pu was injected into the upper atmosphere from
satellite burn-up upon reentry. The Gnome test site, located about 8.8 km southwest of the WIPP site,
is also a potential source of radionuclides. At this site a 3.3 kiloton yield nuclear underground
detonation was conducted in 1961 as part of the Plowshare Program of the Atomic Energy
Commission. The site was decontaminated in 1968-1969 and again in 1978. Despite these clean-up
efforts, elevated levels of 137
Cs and plutonium have been detected in some of the surface soil samples
collected at the Gnome site. These contaminated soils are a potential source of contamination for
environmental samples being collected to monitor for potential release of radionuclides from the
WIPP and to maintain the integrity of the WIPP project. Therefore, knowledge of the levels and
behavior of actinides in the WIPP environment is necessary to assess the radiological and ecological
effects of radiation on workers and the general public that live and work around the WIPP site.
In this report, samples collected and analyzed during calendar year 2011 are presented.
Results from this program are accessible to the public through this report and the CEMRC website
and are used for evaluating the long-term history of these radionuclides to better assess the impact of
WIPP (if any) on the local environment. CEMRC believes this aspect of its mission is important since
the public needs to know what is truly happening in the environment and what effect, if any, WIPP
activities has on their lives and health. Lastly, this type of information is important for assessing the
impact of the WIPP on the local environment for public acceptance of this and future waste disposal
projects.
Overview
Carlsbad Environmental Monitoring & Research Center 2011 Report 3
OVERVIEW OF THE CEMRC MONITORING PROGRAM
The Carlsbad Environmental Monitoring and Research Center (CEMRC), has
performed as an independent, academic-based monitoring facility for the WIPP since 1993.
The program was developed in conjunction with the Department of Energy, WIPP
management and operations contractor (M&O), state and local government, and regional
citizens to monitor the environment in and around the WIPP facility for below background
levels of radionuclides and other contaminants of interest to the regional community. The
goal is to provide an independent environmental and human health monitoring program to
assure area residents that there is no release of radiological contaminates as the result of
WIPP-related activities. As defined in the original grant, the project was implemented during
the WIPP pre-disposal phase, and is now continuing throughout the operational (disposal)
phase. The CEMRC’s WIPP environmental monitoring (WIPP-EM) project is organized and
carried out independent of direct oversight by DOE. Further, the project does not provide
data to any regulatory body to meet the compliance demonstration requirements applicable to
the WIPP. Instead, analytical results and interpretations from the WIPP-EM program are
published by CEMRC, in the form of an annual report, to inform the citizens of Carlsbad and
the surrounding area that there is no evidence of increases in radiological contaminants that
can be attributed to releases from the WIPP. The success of such a monitoring program is
important in terms of boosting public confidence and enhancing public acceptance; where a
locality’s “not in my-backyard” attitude could hinder the siting of a nuclear waste repository
anywhere in the world.
A detailed description of the CEMRC’s WIPP-EM concepts, sampling design, and
baseline studies has been presented in previous CEMRC annual reports which are available
at the CEMRC website (www.cemrc.org). The following is a summary of the calendar year
2011 activities for the major environmental mediums in the WIPP EM program. It is
important to note that the first shipment of TRU nuclear waste was received at the WIPP
facility on March 26, 1999; the first mixed waste shipment was received on September 9,
2000; and the first shipment of higher-activity waste (called remote handled or RH waste)
was received in the first part of 2007. The results summarized in this report cover samples
collected through December 2011.
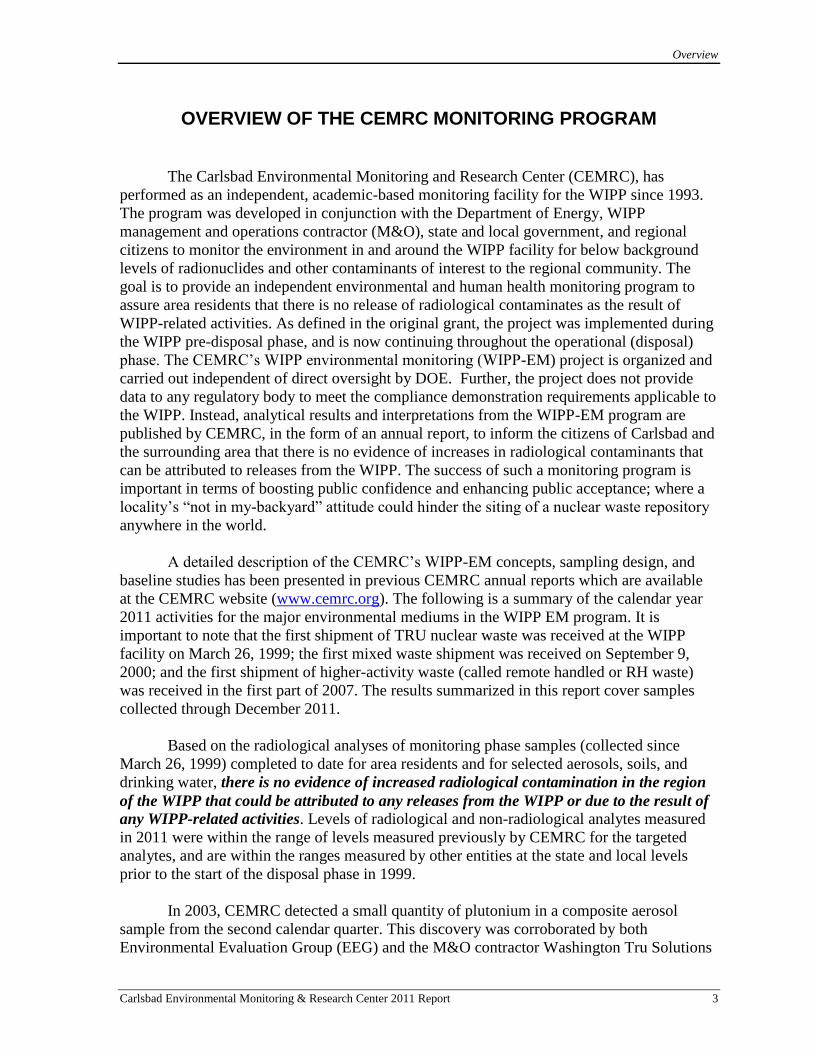
Based on the radiological analyses of monitoring phase samples (collected since
March 26, 1999) completed to date for area residents and for selected aerosols, soils, and
drinking water, there is no evidence of increased radiological contamination in the region
of the WIPP that could be attributed to any releases from the WIPP or due to the result of
any WIPP-related activities. Levels of radiological and non-radiological analytes measured
in 2011 were within the range of levels measured previously by CEMRC for the targeted
analytes, and are within the ranges measured by other entities at the state and local levels
prior to the start of the disposal phase in 1999.
In 2003, CEMRC detected a small quantity of plutonium in a composite aerosol
sample from the second calendar quarter. This discovery was corroborated by both
Environmental Evaluation Group (EEG) and the M&O contractor Washington Tru Solutions

Overview
4 Carlsbad Environmental Monitoring & Research Center 2011 Report
(WTS) through the analyses of samples that were independently collected and analyzed. The
activity level of the plutonium was extremely low and well within historic background levels,
but highlighted the ability of the CEMRC’s WIPP-EM program to detect radionuclides of
interest at any level above the minimum detectable concentration (MDC). Further, CEMRC
reported in 2007 a small quantity of plutonium in composite aerosol samples from the first
and third quarters. However, further analysis showed that these detections resulted from
minor contamination during the gross alpha/beta measurements on filters which has since
been corrected. Therefore, no plutonium was detected in 2007 above MDC. However, in
2008, 2009, and 2010, CEMRC again detected a small quantity of plutonium in composite
aerosol samples from the first, second, and third quarters respectively all of which were
similar to the 2003 detection. The CEMRC detections in 2008, 2009, and 2010 were
corroborated by WTS’s monitoring activities as well.
The challenges faced by CEMRC during 2011 has been to restructure and optimize
the WIPP-EM activities in order to maintain a long-term environmental monitoring program
that will contribute to maintaining the public’s confidence with respect to the safe operation
of the WIPP, to identify missing elements in our understanding of the WIPP environment
that are not addressed by the ongoing and proposed long-term monitoring studies, and to
initiate research programs to compliment these activities. The sampling schedule for the
years 2011-2015 are shown in Table 0.1.
Table 0.1. WIPP-EM Sampling Schedule (Aerosol sampling includes: Station A, Station B, and Ambient Air)
2011 2012 2013 2014 2015
1st
Qtr Aerosol Aerosol
Aerosol &
Drinking
Water
Aerosol
Aerosol,
Surface Water,
and Sediment
2nd
Qtr Aerosol
Aerosol,
Surface Water
and Sediment
Aerosol Aerosol
Aerosol &
Drinking
Water
3rd
Qtr
Aerosol &
Drinking
Water
Aerosol
Aerosol,
Surface Water
and Sediment
Aerosol &
Drinking Water Aerosol
4th
Qtr Aerosol
Aerosol,
Drinking Water,
and Soil
Aerosol Aerosol & Soil Aerosol
The scheduling and management of sample analyses collected in the WIPP-EM
project are based on (1) priorities for providing information to the public, (2) relative risks of
human exposure to contaminants among the various media sampled, (3) need for data
validation and verification prior to release, (4) time constraints resulting from sample
preparation and analysis procedures, (5) staff turnover resulting from the difficulty in
attracting and retaining qualified staff in Carlsbad, (6) fluctuations in funding, and (7) time
and resource coordination between and among the other entities in the facility.

Overview
Carlsbad Environmental Monitoring & Research Center 2011 Report 5
Since the WIPP-EM program began, CEMRC has reduced the frequency of sampling
of the various media and has reduced the number of target analytes primarily as the result of
a decrease in resources over time. Additionally, the justification for this reduction was based
on the fact that, to date, there has been no evidence for any perturbation to drinking water,
soils, surface water or sediments caused by the WIPP-related activities. Going forward,
studies of airborne particulate matter (aerosols) will continue to be a major focus of the
CEMRC’s environmental monitoring efforts since, in the event that radiological or non-
radiological contaminants are released from the WIPP or in the event of a nuclear accident
like Fukushima, such contaminants could be rapidly dispersed through the atmosphere and
spread throughout the environment. Likewise, monitoring of the public through the Lie
Down and Be Counted (LDBC) program is of the utmost importance as humans are the most
important target regardless of the transmission vector for contaminants.
Additionally, past public surveys indicated that air monitoring and direct monitoring
of people (whole body counting), followed by monitoring of drinking water, were the areas
of greatest public interest. While it is highly unlikely that any radiological impacts from the
WIPP will be detected through analyses of media other than air and people, CEMRC has
determined that there is value in continued monitoring of soils, water (drinking water and
surface water) and sediments in some form and frequency. Thus, a program has been
implemented, that will be revised annually with input from various stakeholders, in which
certain media other than air, people, and drinking water are sampled each year on a rotating
basis (see Table 0.1). In 2011, that media was intended to be surface water, and sediments.
Unfortunately, the collection of surface water and sediments did not materialize in 2011 due
to recurring problems with the CEMRC’s boat, a vital piece of equipment needed for this
activity. The boat issues have since been resolved; therefore, the collection of surface water
and sediment samples are expected to resume in the future.
The continuation of the WIPP-EM and new WIPP-related projects reflect the Center’s
commitment to ensuring that the public, the WIPP workers, and the environment are
protected from exposure to contaminants. It is likely that additional adjustments to the WIPP-
EM program will be needed as the Center’s capabilities continue to evolve and as new
WIPP-related entities and contractors move in new directions.
The sampling media for the 2011 environmental monitoring program included
airborne particulates (both FAS and ambient air), drinking water, and human whole body.
These samples were analyzed for radionuclides, including natural uranium (233/234
U, 235
U, and 238
U); potassium, 40
K; transuranic actinides expected to be present in the waste stream
(plutonium 238
Pu, 239+240
Pu, and americium 241
Am), and major fission products (cesium, 137
Cs
and cobalt, 60
Co). In addition, the CEMRC also analyzed Station A (FAS filters) and
drinking water samples for non-radiological constituents. Environmental levels of these
radionuclides and inorganics could provide corroborating information on which to base
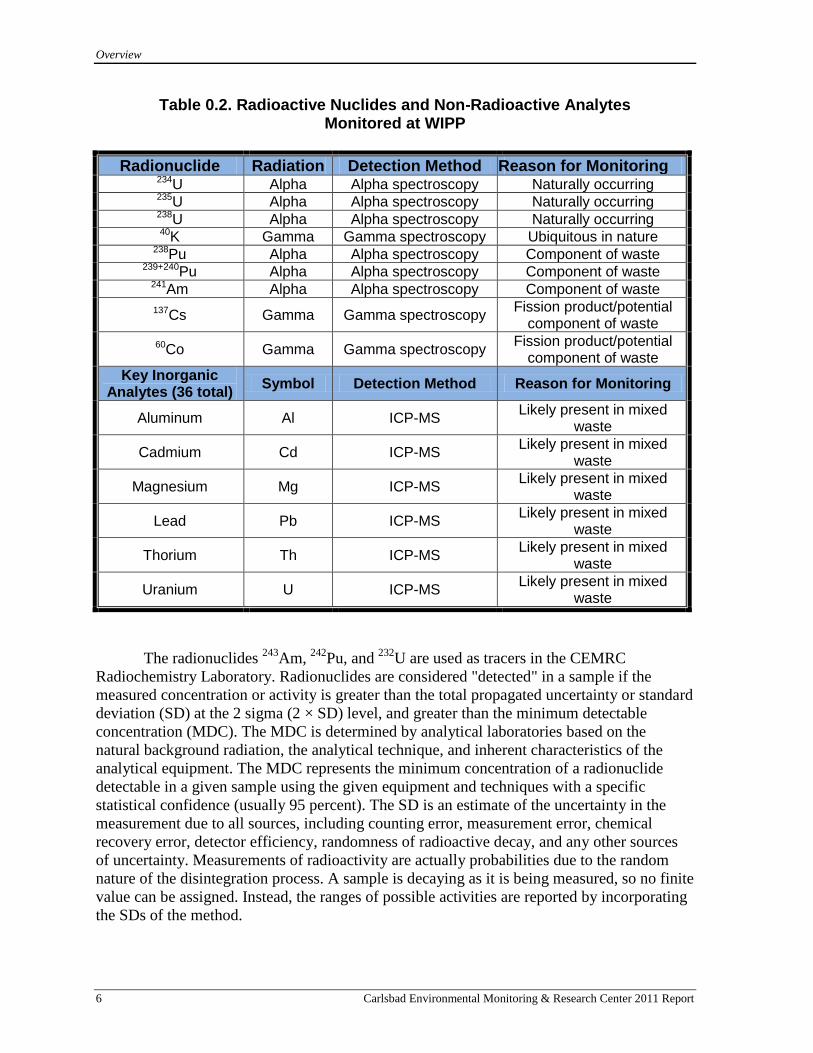
conclusions regarding releases from WIPP facility operations. Table 0.2 summarizes the list
of target radionuclides and inorganic constituents along with their type of radiation method
of detection and reason for monitoring at the WIPP site.
Overview
6 Carlsbad Environmental Monitoring & Research Center 2011 Report
Table 0.2. Radioactive Nuclides and Non-Radioactive Analytes Monitored at WIPP
Radionuclide Radiation Detection Method Reason for Monitoring 234U Alpha Alpha spectroscopy Naturally occurring 235U Alpha Alpha spectroscopy Naturally occurring 238U Alpha Alpha spectroscopy Naturally occurring 40K Gamma Gamma spectroscopy Ubiquitous in nature
238Pu Alpha Alpha spectroscopy Component of waste 239+240Pu Alpha Alpha spectroscopy Component of waste
241Am Alpha Alpha spectroscopy Component of waste
137Cs Gamma Gamma spectroscopy Fission product/potential
component of waste
60Co Gamma Gamma spectroscopy Fission product/potential
component of waste
Key Inorganic Analytes (36 total)
Symbol Detection Method Reason for Monitoring
Aluminum Al ICP-MS Likely present in mixed
waste
Cadmium Cd ICP-MS Likely present in mixed
waste
Magnesium Mg ICP-MS Likely present in mixed
waste
Lead Pb ICP-MS Likely present in mixed
waste
Thorium Th ICP-MS Likely present in mixed
waste
Uranium U ICP-MS Likely present in mixed
waste
The radionuclides 243
Am, 242
Pu, and 232
U are used as tracers in the CEMRC
Radiochemistry Laboratory. Radionuclides are considered "detected" in a sample if the
measured concentration or activity is greater than the total propagated uncertainty or standard
deviation (SD) at the 2 sigma (2 × SD) level, and greater than the minimum detectable
concentration (MDC). The MDC is determined by analytical laboratories based on the
natural background radiation, the analytical technique, and inherent characteristics of the
analytical equipment. The MDC represents the minimum concentration of a radionuclide
detectable in a given sample using the given equipment and techniques with a specific
statistical confidence (usually 95 percent). The SD is an estimate of the uncertainty in the
measurement due to all sources, including counting error, measurement error, chemical
recovery error, detector efficiency, randomness of radioactive decay, and any other sources
of uncertainty. Measurements of radioactivity are actually probabilities due to the random
nature of the disintegration process. A sample is decaying as it is being measured, so no finite
value can be assigned. Instead, the ranges of possible activities are reported by incorporating
the SDs of the method.
Overview
Carlsbad Environmental Monitoring & Research Center 2011 Report 7
Aerosols
Aerosol particle sampling is conducted at five locations (listed below) with samplers
operating continuously at each location. The locations include a port inside the WIPP exhaust
shaft (Station A), a point inside the WIPP exhaust but after the filtration system (Station B), a
site approximately 0.1 km northwest (downwind) of the WIPP exhaust shaft (On Site
station), a site approximately 1 km northwest (downwind) of the WIPP (Near Field station),
and a site approximately 19 km southeast (upwind) of the WIPP (Cactus Flats station). In
November 2006, CEMRC began collecting samples at Station B; however, these filters are
not currently being analyzed. Depending upon discussions with stakeholders, these samples
may be included for analysis in the future once procedures have been developed, tested, and
implemented. Results from the analysis of the aerosol samples for 2011 are reported in
chapter 1 of this report.
Soils
During 2011, no soil samples were collected or analyzed but as can be seen in Table
0.1, are currently slated to be part of the sampling/analysis schedule for 2012.
Surface Water and Sediments
As mentioned previously, recurring issues with the CEMRC boat prevented the
collection of surface water and sediment samples in 2011. However, these media are
currently scheduled to be collected for analysis in 2012 as well.
Drinking Water
The WIPP-EM studies of ground water focus on the major drinking water supplies
used by communities in the WIPP region because these are often perceived by the public as a
potential route for contaminants to reach humans. During 2011, drinking water samples were
collected in the month of July from Carlsbad (Sheep Draw and Double Eagle), Loving,
Malaga, Otis, and Hobbs. Results from the analysis of the samples from these well fields for
2011 are reported in chapter 2 of this report.
Human Population
The Lie Down and Be Counted (LDBC) project serves as a component of the WIPP-
EM program that directly addresses the general concern about personal exposure to
contaminants shared by residents who live near DOE sites. As in other aspects of the WIPP
EM program, in vivo bioassay testing was used to establish a baseline profile of internally-
deposited radionuclides in a sample of local residents before disposal phase operations
began, and has continued into the disposal phase to the present. The sampling design includes
solicitation of volunteers from all segments of the community, with sample sizes sufficient to
meet or exceed a 15% range in margin of error for comparisons between major population
ethnicity and gender categories as identified in the 1990 census. Radiobioassays of the
original volunteer cohort have been ongoing since July 1999. New volunteers will continue
to be recruited each year to establish new study cohorts and replace volunteer attrition. It has

Overview
8 Carlsbad Environmental Monitoring & Research Center 2011 Report
been difficult to attract new volunteers and to bring back previous volunteers for recounts.
Previous fear or concern appears to have waned in the region as WIPP operations continue to
proceed with no serious incidents and as the number of citizen volunteers for the LDBC
continue to decline from previous years. Results of the LDBC project through December
2011 are reported in chapter 3 of this report.
Radiochemical and Activity Units
The primary unit of activity, or radioactivity, used in this report is the becquerel (Bq)
which is equal to one disintegration of a nucleus per second. This disintegration gives rise to
the ejection of a particle or ray of ionizing radiation, either an alpha, beta, neutron, or
gamma. Sometimes the unit Curie (Ci) is used and is equal to 3.7 x 10¹⁰
Bq.
QUALITY ASSURANCE
The CEMRC is subject to the policies, procedures and guidelines adopted by New
Mexico State University (NMSU), as well as by state and federal laws and regulations that
govern the operation of the University and radiological facilities. The management of
CEMRC is committed to conducting a well-defined quality assurance program, incorporating
good professional practice and focusing on the quality of its testing and calibration processes
in research and service to its sponsors. CEMRC technical programmatic areas in 2011
included: Environmental Chemistry (EC), Organic Chemistry (OC), Radiochemistry (RC),
Field Programs (FP), Information Management (IM) and Internal Dosimetry (ID). The
development and implementation of an independent health and environmental monitoring
program has been CEMRC’s primary activity since its establishment in 1991.
Project Reporting Requirements
Since its inception, CEMRC’s WIPP-EM program has been conducted as a scientific
investigation, meaning that these activities are conducted without any compliance,
regulatory, or oversight responsibilities. As such, there are no specific requirements for
reporting data other than the adoption of good scientific practices. An example of reporting
decisions made by CEMRC for this program is whether to correct or not to correct data for
blanks. The decision to subtract blanks from the monitoring data was made by the senior staff
in the mid-1990s because the consensus opinion was that this procedure provided the best
means for determining the analytes’ true concentrations, i.e. bias-free estimates of the values.
The practice of correcting environmental data for blanks is well established, as described by
the International Union of Pure and Applied Chemistry (IUPAC) and the International
Organization for Standardization (ISO). See also
http://epa.gov/waterscience/methods/det/faca/mtg20051208/blank.html
Quality Assurance Program
Beginning in early 2002, a significant effort was devoted to refining CEMRC’s
quality system to meet applicable requirements of the U.S. DOE Carlsbad Field Office’s
(DOE/CBFO) Quality Assurance Program Document (QAPD, CAO-94-1012). This effort
was in response to the DOE/CBFO’s request for a change in CEMRC’s direction to allow it

Overview
Carlsbad Environmental Monitoring & Research Center 2011 Report 9
to become more closely aligned with scientific and analytical activities seen by DOE/CBFO
to support the safe and efficient operation of WIPP. As a result, CEMRC produced a center-
wide Quality Assurance Plan (QAP), CP-QAP-004, which was subsequently submitted to
and approved by DOE/CBFO.
Internal audits were performed during 2011 on the following programmatic areas:
Environmental Chemistry, Field Programs, Information Management, Internal Dosimetry,
Organic Chemistry, and Document Control. A summary of 2011 audits is reported in
Appendix C.
Quality Assurance/ Quality Control for Organic Chemistry
The following audits were conducted on the Organic Chemistry group: A WTS
quality assurance (QA) audit was conducted in June 2011 as part of the routine yearly audits
for VOCs Confirmatory Monitoring Program including VOC, Hydrogen and Methane
sample analysis, and canister cleaning and certification services. The program and process
established and implemented by the Organic Chemistry group passed the audit successfully
without any findings.
Additionally, a CEMRC internal audit was also conducted on the OC group in July
2011 in compliance with the Center’s QAP. This audit concluded that the OC group
continues to operate an effective and responsive program.
Lastly, independent quality assurance samples, true values not known at the time of
analysis, were also obtained from an outside source (Wibby Environmental, a Phenomenex
Company) in 2011 to verify the performance of the instrumentation and the proficiency of
the analyst. The OC group passed the study successfully for all target VOCs. Moreover,
analysts were able to identify all other non-target analytes present in the sample.
Quality Assurance/Quality Control for Radioanalyses
Routine quality assurance/quality control activities conducted for radio-analyses
include tracking and verification of analytical instrument performance, the use of American
Chemical Society certified reagents, the use of National Institute of Standards and
Technology (NIST) traceable radionuclide solutions, and verification testing of radionuclide
concentrations for tracers not purchased directly from NIST or Eckert & Ziegler Analytics.
When making laboratory solutions, volumes and lot numbers of stock chemicals are
recorded. Prior to weighing radionuclide tracers and samples, the balance being used is
checked using NIST traceable weights.
Control checks were performed on all counting instrumentation each work day or
prior to the counting of a new sample. The type of instrument and methods used for
performance checks were as follows:
For the Protean 9604 gas-flow α/β proportional counter used to measure the gross
alpha/beta on FAS filters, efficiency control charting was performed using 239
Pu and 90
Sr
check sources and checks were made to ensure that α/β cross-talk was within limits.

Overview
10 Carlsbad Environmental Monitoring & Research Center 2011 Report
Additionally, sixty-minute background counts were recorded daily and 20-hour FAS filter
blank counts were recorded every two weeks. Lastly, two blanks per week for the FAS
program were counted for 20 hours and were used as a background history for calculating
results.
For the high purity germanium (HPGe) detector systems, routine background
determinations were made by counting blank samples and the data was used to blank correct
the sample concentrations.
For the Oxford Oasis alpha spectrometer, efficiency, resolution and centroid control
charting was performed using 148
Gd and 244
Cm check sources on a regular basis. Before each
sample count, pulser checks were performed to ensure acceptable detector resolution and
centroid position. Blanks counted for 5 days were used as a background history for
calculating results.
The radiochemical equations used for the calculation of minimum detection
concentration (MDC), standard deviation (SD) are described in Appendix D. The accuracy of
the radiochemical analyses was evaluated by analyzing calibration standards, method blanks
(tracer blank), and laboratory control samples (LCSs or blank spikes). LCSs are QC samples
that check whether the analysis procedure is in control or not. Analysis of LCSs containing
the isotopes of interest was performed on a minimum 10% basis (one per every batch of ten
or fewer samples). LCS results for each isotope were tracked on a running basis using control
charts. All radiological LCS results fell within the acceptable ranges, indicating good
accuracy.
Laboratory procedural and instrument accuracy was also verified through
participation in the DOE Mixed-Analyte Performance Evaluation Program (MAPEP) and
National Institute of Standards and Technology - Radiochemistry Intercomparison Program
(NIST-NRIP) interlaboratory comparison programs. Under these programs, CEMRC
analyzed blind check samples with the analysis results compared against official results
measured by the MAPEP and NRIP laboratories. Performance was established by percent
bias, calculated as shown in Tables E.1 – E.3. During 2010-2011, CEMRC’s radiochemistry
program analyzed MAPEP air filter, water, and soil; MAPEP gross alpha/beta for air filters
and water; and NIST-NRIP glass fiber filter, acidified water and soil samples. Isotopes of
interest in these performance evaluation programs were 233/234
U, 238
U, 238
Pu, 239+240
Pu, 241
Am
and some gamma radionuclides. The analyses were performed using CEMRC’s actinide
separation procedures and were treated as a regular sample set to test normal performance.
CEMRC’s results were consistently close to the known value. Results from the MAPEP and
NIST-NRIP proficiency tests are presented in Appendices D. Only two analysis results, 241
Am in MAPEP radiological filter (RdF25) matrix and gross beta activity on filter (GrF25),
did not meet the accuracy acceptance criteria. Based on the number of A (Acceptable) ratings
earned by CEMRC for the analysis of performance evaluation samples, the laboratory
provided accurate and reliable radionuclide analysis data for the WIPP environmental
samples.

Overview
Carlsbad Environmental Monitoring & Research Center 2011 Report 11
Quality Assurance/Quality Control for Environmental Chemistry Inorganic Analyses
The analytical methods employed for inorganic analyses in the environmental
chemistry program at CEMRC are based, when applicable, on various standard procedures
such as EPA 200.8 and EPA 6020. For some matrix/analyte combinations, appropriate
external standard procedures do not exist, and for those cases, specialized procedures have
been developed to meet the needs of the WIPP-EM program and other research projects.
Additionally, a CEMRC internal audit was conducted on the EC group in February 2011 in
compliance with the Center’s QAP. The exit report for the audit maintained that the EC
group continues to operate an effective and responsive program. However, because several
years had lapsed since the EC group had last been audited; the EC group did receive several
findings and observations, a majority of which consisted of documentation-related concerns.
Additionally, while many of the findings and observations were corrected during the course
of the audit, all findings and observations have since been corrected or addressed, and
therefore, the EC group is operating more efficiently as a result of this process.
Calibration checks are performed on all EC balances using NIST traceable weights
prior to each use. All pipettes used for quantitative transfer of samples are checked for
calibration monthly. All instrumentation is calibrated prior to each sample analysis. All
labware not already purchased as “metal free” are acid-cleaned in-house and all reagents
used for calibration, sample dilution, and analysis are either purchased as certified trace-
metal grade or distilled in-house using a sub-boiling quartz distillation apparatus.
For all environmental chemistry analyses, QC samples are analyzed with each sample
batch as an indicator of the reliability of the data produced. The types, frequencies of
analysis, and limits for these QC samples have been established in a set of standard operating
procedures. Calibration checks are run at the start of each sample analyses and periodically
throughout the sample run. Other QC samples checks include, but are not limited to,
Laboratory Reagent Blanks (LRBs), Laboratory Fortified Blanks (LFBs), duplicates, and
Laboratory Fortified Matrix samples (LFMs). In cases where duplicate aliquots from the
original sample were not feasible (such as FAS filters), separate aliquots of the sample
extract were analyzed for the duplicate and LFM analyses. All samples and standards for
elemental analysis are spiked with an internal standard to determine sensitivity and
malfunction during analysis.
Method detection limit (MDL) is determined annually for each analyte as per EC
procedures as outlined in 40 Code of Federal Regulations (CFR) Part 136, Appendix B.
Independent quality assurance samples are obtained and analyzed to verify the
performance of the instrumentation and the proficiency of the analyst. Annually, blind
samples (obtained from an outside source, with true values not known at the time of analysis)
are analyzed. However, since blind samples are usually diluted many times, the instrument is
not optimized for any one or group of elements, and the instrument measures such a large
number of analytes at one time at or near their MDLs, several analytes often exceed the
acceptable range by several percent. Elements commonly falling into this category include
aluminum, beryllium, cobalt, and iron, which increases the overall uncertainty of the
Overview
12 Carlsbad Environmental Monitoring & Research Center 2011 Report
analyses. Examples of results from a blind sample (from the Environmental Resource
Associates [ERA] WatRTM
Supply Proficiency Testing Study) for 2011 (the time period in
which the 2011 samples were analyzed) are given in Figure D.2 and Table D.4 gives an
example of the daily performance tests for ICP-MS.
Quality Assurance/Quality Control for Field Sampling
For the collection of most WIPP-EM samples, no external standard procedures are
considered completely appropriate for the objectives of the studies. In these cases,
customized plans are developed and documented. After the activity is completed, the plan is
revised to reflect any departures from the original plan, and documented to file. For most
environmental media, the sampling plans combine selected standard procedures with specific
adaptations to address scientific objectives of interest. For example, procedures for collection
and preservation of samples for compliance with the Safe Drinking Water Act requirements
are applied to the collection of drinking water and surface water samples, but the locations of
sample collection are selected on the basis of other criteria. Likewise, high-volume air
samplers are operated to meet an EPA standard of 1.13 m3min
-1, but the frequency of filter
replacement is based on optimal loading for radioanalysis.
Logbooks are maintained by technical staff in field operations to record locations and
other specifics of sample collection, as well as data on instrument identification,
performance, calibration and maintenance. Data generated from field sampling equipment are
error-checked by using routine cross checks, control charts and graphical summaries. Most
data collected in written form are also entered in electronic files with electronic copies being
crosschecked against the original data forms on a routine basis. All electronic files are
backed up daily and paper documents are digitized and backed up monthly.
Calibration and maintenance of equipment and analytical instruments are carried out
on predetermined schedules coinciding with manufacturer’s specifications or modified to
special project needs. Calibrations are either carried out by equipment vendors or by CEMRC
personnel using certified calibration standards.
Quality Assurance/Quality Control for Internal Dosimetry
The in vivo bioassay program at CEMRC participates in the Department of Energy’s
In Vivo Laboratory Accreditation Program (DOELAP) via the WIPP, and is currently
accredited as a service laboratory to perform the following direct bioassays:
Transuranic elements via low energy X-ray in lungs
241
Am in lungs
234
Th in lungs
235
U in lungs
Fission and activation products in lungs including 54
Mn, 58
Co, 60
Co and 144
Ce
Fission and activation products in total body including 134
Cs and 137
Cs
Under DOELAP, the in vivo bioassay program is subject to the performance and
quality assurance requirements specified in Department of Energy Laboratory Accreditation

Overview
Carlsbad Environmental Monitoring & Research Center 2011 Report 13
Program for Radiobioassay (DOE-STD-1112-98) and Performance Criteria for
Radiobioassay (ANSI-N13.30). A DOELAP testing cycle was completed in 2009-2010 that
included counting phantoms representative of each of the categories listed above. The next
testing cycle is scheduled for 2013/2014.
To evaluate system performance, quality control data were routinely collected
throughout the year in order to verify that the lung and whole body counting system was
operating as it was at the time the system was calibrated. Quality control parameters that
track both overall system performance and individual detector performance were measured.
Quality control parameters tracked to evaluate individual detector performance, included:
Net peak area, peak centroid and peak resolution, commonly referred to as full-width,
half-maximum (FWHM) across the energy range of the spectrum,
Detector background
Quality control parameters tracked to assess overall system performance included:
Mean-weighted activity of a standard source
Summed detector background
In addition, calibration verification counts were routinely performed using NIST-
traceable standards and phantoms.
Additionally, the Internal Dosimetry program also participated in an intercomparison
study program for whole body counting administered by Oak Ridge National Laboratory
(ORNL). Under this program, bottle phantoms containing unknown amounts of 137
Cs, 60
Co, 57
Co, 88
Y and 133
Ba were sent to CEMRC quarterly. The phantoms were counted on the lung
and whole body counting system and the measured activities were reported back to ORNL
and compared against the known activities. Table D.1 shows an example of results for the
last three quarters of 2010 and the first three quarters of 2011. For all years since CEMRC
began participating in the ORNL program, CEMRC has consistently out-performed all other
laboratories in this area.
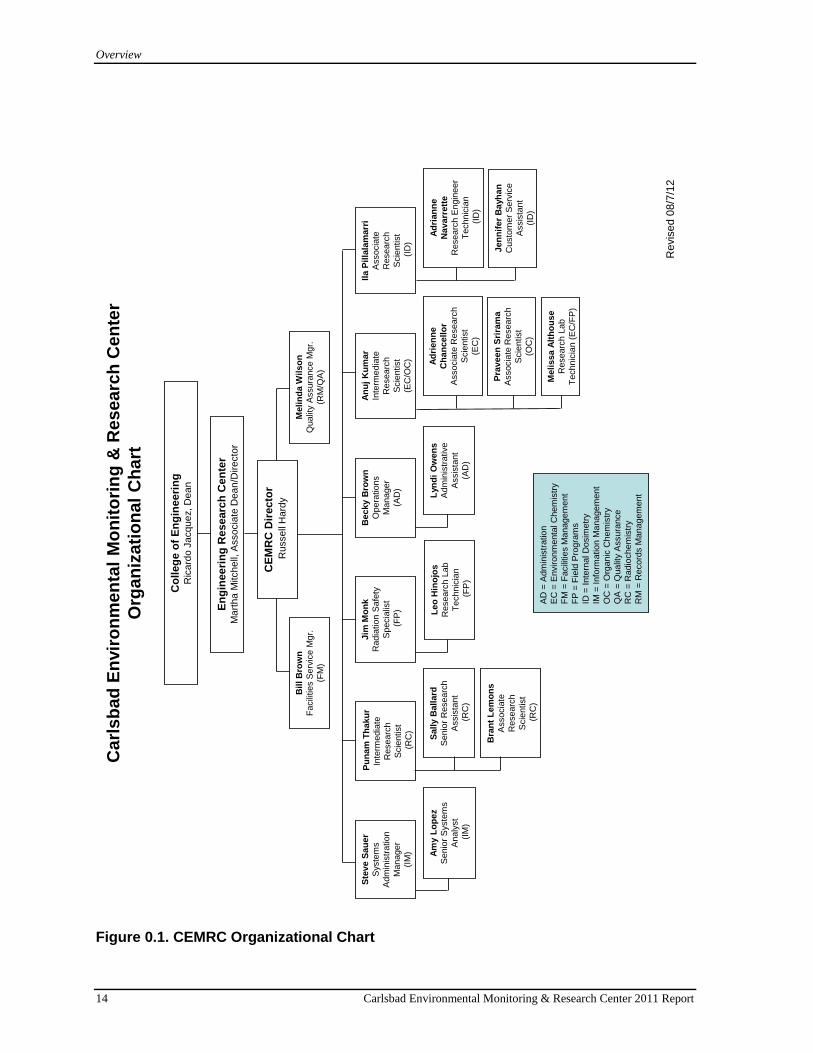
Overview
14 Carlsbad Environmental Monitoring & Research Center 2011 Report
Ca
rls
ba
d E
nvir
on
me
nta
l M
on
ito
rin
g &
Re
se
arc
h C
en
ter
Org
an
iza
tio
nal
Ch
art
AD
= A
dm
inis
tration
EC
= E
nvironm
enta
l C
hem
istr
y
FM
= F
acili
ties M
anagem
ent
FP
= F
ield
Pro
gra
ms
ID =
Inte
rnal D
osim
etr
y
IM =
Info
rmation M
anagem
ent
OC
= O
rganic
Chem
istr
y
QA
= Q
ualit
y A
ssura
nce
RC
= R
adio
chem
istr
y
RM
= R
ecord
s M
anagem
ent
Bil
l B
row
n
Facili
ties S
erv
ice M
gr.
(FM
)
Ste
ve S
au
er
Syste
ms
Adm
inis
tration
Manager
(IM
)
Becky B
row
n
Opera
tions
Manager
(AD
)
Lyn
di
Ow
en
s
Adm
inis
trative
Assis
tant
(AD
)
Jim
Mo
nk
Radia
tion S
afe
ty
Specia
list
(FP
)
Sall
y B
all
ard
Senio
r R
esearc
h
Assis
tant
(RC
)
Am
y L
op
ez
Senio
r S
yste
ms
Analy
st
(IM
)
Revis
ed 0
8/7
/12
Bra
nt
Lem
on
s
Associa
te
Researc
h
Scie
ntist
(RC
)
Pu
nam
Th
aku
r
Inte
rmedia
te
Researc
h
Scie
ntist
(RC
)
Meli
nd
a W
ilso
n
Qualit
y A
ssura
nce M
gr.
(RM
/QA
)
Leo
Hin
ojo
s
Researc
h L
ab
Technic
ian
(FP
)
An
uj
Ku
mar
Inte
rmedia
te
Researc
h
Scie
ntist
(EC
/OC
)
Meli
ssa A
lth
ou
se
Researc
h L
ab
Technic
ian (
EC
/FP
)
Pra
veen
Sri
ram
a
Associa
te R
esearc
h
Scie
ntist
(OC
)
CE
MR
C D
irecto
r
Ru
sse
ll H
ard
y
En
gin
eeri
ng
Researc
h C
en
ter
Ma
rth
a M
itch
ell,
Asso
cia
te D
ea
n/D
ire
cto
r
Co
lleg
e o
f E
ng
ineeri
ng
Ric
ard
o J
acq
ue
z, D
ea
n
Ad
rien
ne
Ch
an
cell
or
Associa
te R
esearc
h
Scie
ntist
(EC
)
Ila P
illa
lam
arr
i
Associa
te
Researc
h
Scie
ntist
(ID
)
Ad
rian
ne
Navarr
ett
e
Researc
h E
ngin
eer
Technic
ian
(ID
)
Jen
nif
er
Bayh
an
Custo
mer
Serv
ice
Assis
tant
(ID
)
Figure 0.1. CEMRC Organizational Chart
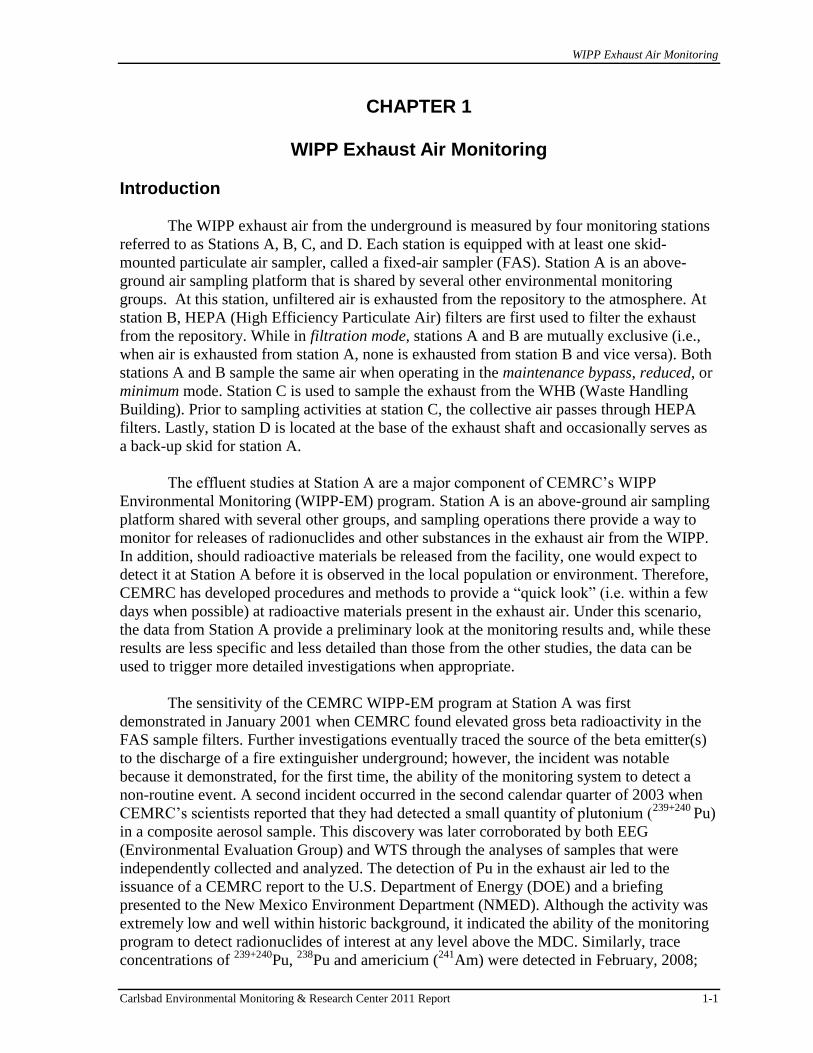
WIPP Exhaust Air Monitoring
Carlsbad Environmental Monitoring & Research Center 2011 Report 1-1
CHAPTER 1
WIPP Exhaust Air Monitoring
Introduction
The WIPP exhaust air from the underground is measured by four monitoring stations
referred to as Stations A, B, C, and D. Each station is equipped with at least one skid-
mounted particulate air sampler, called a fixed-air sampler (FAS). Station A is an above-
ground air sampling platform that is shared by several other environmental monitoring
groups. At this station, unfiltered air is exhausted from the repository to the atmosphere. At
station B, HEPA (High Efficiency Particulate Air) filters are first used to filter the exhaust
from the repository. While in filtration mode, stations A and B are mutually exclusive (i.e.,
when air is exhausted from station A, none is exhausted from station B and vice versa). Both
stations A and B sample the same air when operating in the maintenance bypass, reduced, or
minimum mode. Station C is used to sample the exhaust from the WHB (Waste Handling
Building). Prior to sampling activities at station C, the collective air passes through HEPA
filters. Lastly, station D is located at the base of the exhaust shaft and occasionally serves as
a back-up skid for station A.
The effluent studies at Station A are a major component of CEMRC’s WIPP
Environmental Monitoring (WIPP-EM) program. Station A is an above-ground air sampling
platform shared with several other groups, and sampling operations there provide a way to
monitor for releases of radionuclides and other substances in the exhaust air from the WIPP.
In addition, should radioactive materials be released from the facility, one would expect to
detect it at Station A before it is observed in the local population or environment. Therefore,
CEMRC has developed procedures and methods to provide a “quick look” (i.e. within a few
days when possible) at radioactive materials present in the exhaust air. Under this scenario,
the data from Station A provide a preliminary look at the monitoring results and, while these
results are less specific and less detailed than those from the other studies, the data can be
used to trigger more detailed investigations when appropriate.
The sensitivity of the CEMRC WIPP-EM program at Station A was first
demonstrated in January 2001 when CEMRC found elevated gross beta radioactivity in the
FAS sample filters. Further investigations eventually traced the source of the beta emitter(s)
to the discharge of a fire extinguisher underground; however, the incident was notable
because it demonstrated, for the first time, the ability of the monitoring system to detect a
non-routine event. A second incident occurred in the second calendar quarter of 2003 when
CEMRC’s scientists reported that they had detected a small quantity of plutonium (239+240
Pu)
in a composite aerosol sample. This discovery was later corroborated by both EEG
(Environmental Evaluation Group) and WTS through the analyses of samples that were
independently collected and analyzed. The detection of Pu in the exhaust air led to the
issuance of a CEMRC report to the U.S. Department of Energy (DOE) and a briefing
presented to the New Mexico Environment Department (NMED). Although the activity was
extremely low and well within historic background, it indicated the ability of the monitoring
program to detect radionuclides of interest at any level above the MDC. Similarly, trace
concentrations of 239+240
Pu, 238
Pu and americium (241
Am) were detected in February, 2008;

WIPP Exhaust Air Monitoring
1-2 Carlsbad Environmental Monitoring & Research Center 2011 Report
April, 2009; and July, 2010 composite samples by CEMRC scientists. These detections were
also corroborated by both WTS and NMED as well. As both 238
Pu and 239+240
Pu were
detected above MDC, the activity ratios between 238
Pu to 239+240
Pu were calculated in order to
understand the source of these radionuclides in the WIPP exhaust air samples. The mean 238
Pu to 239+240
Pu activity ratio of 0.025±0.004 observed in these samples are consistent with
the source being largely related to global fallout. Within global fallout, atmospheric nuclear
tests have been the major source of radiological contamination to date in the environment.
Approximately 6 tons of 239
Pu were introduced into the environment from more than 500
atmospheric weapon tests conducted between 1945 and 1980 (Vincent et al., 1997). This
fallout was distributed globally at an approximately 3:1 ratio between the northern
hemisphere and the southern hemisphere. Additionally, local and regional contaminations of
plutonium in the environment have resulted from nuclear accidents such as Chernobyl and
Fukushima. These events resulted in the release of substantial quantities of radioactive
contaminants into the global environment. Currently, 238
Pu, 239
Pu, and 240
Pu isotopes can be
measured as traces in environmental samples with a 238
Pu to 239+240
Pu activity ratio of 0.03 at
mean latitudes of 40o-50
o N (UNSCEAR, 1982).
Sample Collection
CEMRC commenced sampling of the WIPP exhaust air at Station A on December 12,
1998. Detailed descriptions of the sampling and analytical methods have been included in
prior CEMRC Annual Reports which are available on the CEMRC website www.cemrc.org .
In brief, the WIPP air samples for stations A, B, and D are collected on 3. m pore size,
mm diameter Versapor® membrane filters with the use of a shrouded probe, commonly
referred to as a fixed air sampler or FAS. The volume of air sampled at each location varies
depending on the sampling location and configuration.
There are actually three shrouded-probe aerosol samplers at Station A (Figure 1.1);
these are located on three separate sampling skids referred to as A1, A2 and A3. The
airstream sampled by each skid is split among three legs such that three concurrent samples
can be collected from each skid. The airflow through the FAS is approximately 170
liters/minute (6.0 cubic feet per minute, cfm). The samples at Station A are typically
collected daily except for weekends with weekend samples running from Friday to Monday
so that continuous coverage is maintained. Occasionally, however, more than one sample per
day is collected if the flow rate on any of the sampler legs drops below 1.8 cfm. Under this
scenario, a low-flow alarm on the sampler is activated and the filters are changed. In 2011, a
total of 444 filters were collected from Station A. The number of filters collected each year
from station A is shown in Figure 1.2.

WIPP Exhaust Air Monitoring
Carlsbad Environmental Monitoring & Research Center 2011 Report 1-3
Figure 1.1. Fixed Air Samplers at Station A
Figure 1.2. Number of FAS Filters Collected from Station A

WIPP Exhaust Air Monitoring
1-4 Carlsbad Environmental Monitoring & Research Center 2011 Report
After the 2003 Pu detection, CEMRC implemented an additional FAS filter, called
the Trip Blank, which is a blank filter that accompanies the sample filter throughout the
whole process, including transportation to and from the WIPP site as well as being placed on
the collector for approximately 15 seconds before being removed and placed in a sealed
container. Unlike the laboratory and reagent blanks, the Trip Blank can reflect sampling
errors or field contamination that is independent of laboratory procedures and reagents.
Figure 1.3. Flow Diagram Showing the Handling and Analysis of FAS Filters
Sample Preparation and Analysis
All analyses of the FAS filters are performed according to the methods detailed in the
CEMRC document-controlled, standard operating procedures. A simplified scheme of the
sample preparation process is shown in Figure 1.3.
Once the samples are collected from the field and returned to the laboratory, the
individual filters are desiccated for two days to ensure that any moisture on the filters are
evaporated and to ensure a complete decay of daughter products of 222
Rn. Once dried, the
filters are then weighed to determine mass loadings. Following the desiccating and weighing
process, the filters are counted for gross alpha/beta activities using a low-background gas
proportional counter (LB4100 Canberra, and more recently starting in April 2006, a Protean
MPC9604). The use of such a counter is described in an American National Standards
Institute Publication (ANSI 1997). The gas proportional counter can operate in two modes:
(1) alpha then beta and (2) alpha/beta (ANSI 1997). Mode (1) is more useful, as it allows
simultaneous detection. In this case, the detector operates at the - plateau, while alpha and
beta particles can be distinguished by either pulse height or pulse shape or both (Currie and
Lindstrom 1973; Wink et al. 1993). The main interference is from crosstalk or spillover in
the case of pulse height or pulse shape, respectively. While gross screening analyses are not

WIPP Exhaust Air Monitoring
Carlsbad Environmental Monitoring & Research Center 2011 Report 1-5
as accurate nor as precise as more detailed radiochemical separations, they are intended to
provide rapid information associated with a particular action level with minimal chemical
preparation. Additionally, these types of analyses are not intended to give “absolute” activity
measurements, but rather “order-of magnitude”. Therefore, its main advantages are relatively
low costs and simplicity (Semkow et al., 2004).
In preparation for gross alpha/beta counting, the filter is centered on a stainless steel
planchet. The standard planchets for the alpha and beta were prepared from certified
solutions of 239
Pu and 90
Sr/90
Y obtained from Analytics, Inc. (Atlanta, GA, USA). The
planchet is counted on a low-background gas proportional counter for 1,200 minutes. The
sample detectors are gas flow window type counters with an ultra-thin window. The counting
gas was P-10, which is a mixture of 90% argon and 10% methane. The operating voltage on
the detector was selected as 1,450V. All samples flow at a pressure slightly exceeding
atmospheric. The window consists of 80 g/cm Mylar foil with a tint of evaporated Au. The
small size of the detector and the guard ensure a very low background in this system, ~0.5
and ~0.04 counts per minute for beta and alpha respectively. Daily performance checks are
done using calibration sources, 239
Pu for alpha and 90
Sr/90
Y for beta, for efficiency control
charting (2 warning and 3 limits) and ensuring that alpha/beta cross-talk are within limits
(≤ 0% α into beta and ≤ 0.1% beta into alpha ). Sixty-minute background counts are also
recorded daily (count must be within the mean background ±3 ) by counting an empty
planchet. The self-absorption curve was obtained individually for alpha and beta and used for
all sample counts. The mean counting efficiencies for the system are found to be around 25%
for alpha and 40% for beta.
Since the levels of radioactivity encountered in environmental samples are typically
low, a long counting time is often necessary. The detection limit, i.e., minimum detectable
concentration (MDC), is calculated from a combination of instrument calibration parameters
(efficiency, attenuation factor, background and background counting time) and sample
parameters (residual mass, volume and sample counting time). The levels not detected or less
than MDC occur when the activity concentration is less than calculated uncertainty.
The gross alpha and beta activities are expressed in the following two ways. First, the
activity concentration is calculated as the activity per unit volume of air sampled (Bq/m3).
Second, activity density is calculated as the activity per unit aerosol mass collected (Bq/g).
The flow volume (per cubic meter) and the mass loading (mg) on the monthly composite
samples are listed in Table 1.1.
Samples for actinide and inorganic analyses are prepared by using microwave acid
digestion in a CEM MARS™ Xpress™ microwave unit according to CEMRC procedures. .
Individual FAS filters are placed in separate Teflon vessels and digested at 195’C using an
acid matrix consisting of nitric acid, hydrochloric acid, and hydrofluoric acid. A blank filter
and Certified Reference Material (CRM) filter are also digested in the same manner for QC-
purposes. All acids used in the digestions are concentrated and purified either by using a
Milestone Inc. sub-boiling quartz distillation apparatus or purchased as “trace metal” grade.
After digestion, the FAS filter solutions are then combined into weekly composites and a
small aliquot of each weekly composite is removed for inorganic analysis by inductively-
coupled Plasma Mass Spectrometry (ICP-MS).

WIPP Exhaust Air Monitoring
1-6 Carlsbad Environmental Monitoring & Research Center 2011 Report
The weekly composites are then combined into monthly composite samples for the
determination of actinide and gamma measurements. The detection and measurement of
gamma radionuclides on filter samples are carried out using a low-background, HPGe co-
axial detector with a count time of 48 hours. Only one half of the composite sample is
normally used for the determination of the actinide activities and the remaining aliquot is
archived. The composite sample is evaporated to dryness, and the residue is digested in
perchloric acid (HClO4) to destroy the black residue, which consists mostly of diesel exhaust
particulates. The actinides are then separated as a group by co-precipitation on iron III oxide
(Fe(OH)3). Pu is separated on an anion exchange, AG1-X8 in 8M nitric acid (HNO3) and
purified on a second anion exchange column in 8M hydrochloric acid (HCl). Am and
uranium (U) are separated on TRU extraction chromatography column followed by
purification of U on an anion exchange column. The samples are then micro-co-precipitated
with a neodymium carrier (Nd-carrier) and counted on an alpha spectrometer for 5 days.
The primary purpose of the WIPP-EM plan, including the studies at Station A, has
been to compare pre- vs. post-disposal conditions. The WIPP received its first radioactive
waste shipments on March 26, 1999. This is considered to be the cut-off date separating the
pre-disposal phase from the post-disposal, or operational phase. The first shipment of mixed
waste arrived at the WIPP on September 9, 2000. Data for samples collected prior to this
date compose a pre-mixed waste baseline for the elemental data, while those collected
afterwards are considered operational. In Figures 1.4 through 1.8 and Figures 1.22 through
1.27 discussed in the Radiological and Non-Radiological sections below, data points are
distinguished by color for the pre-operational and operational monitoring.
RADIOLOGICAL MONITORING RESULTS
Gross Alpha and Beta Activities and Aerosol Mass Loadings
The gross alpha and beta activities in the samples collected prior to the receipt of the
first waste shipment represent the pre-disposal background, and the bulk of the activity in
those samples results from naturally occurring radioactive materials, specifically radon
daughters. Summary statistics for mass loading and gross alpha/beta are given in Tables 1.2,
1.3, and 1.4. Additionally, as shown in Table 1.2, the pre-operational gross alpha activity
densities and concentrations were both low compared with the annual mean values for the
first five years of operation, but have gone back up above the pre-operational levels during
2007-2011. Gross alpha activities exhibit clear seasonal variability with peaks occurring in
the winter (Figures 1.4 and 1.5). An especially pronounced annual cycle in alpha activity
concentrations, with high values in December and January and low values mid-year was seen
in 2004 to 2005 and again in 2007 to 2008. In 2011, activities appear to have gone back up to
pre-operational levels and an overall slightly increasing trend can be seen over the years from
2003 to 2011.
Similar seasonal trends in gross beta data can be seen in Figures 1.6 and 1.7. The
pronounced annual cycle in beta activity concentrations, with high values in December and
January and low values mid-year are seen through all the operational monitoring period from
2000 through 2011. The beta activity concentration of 58.4 mBq/m3 observed in 2001 (Table
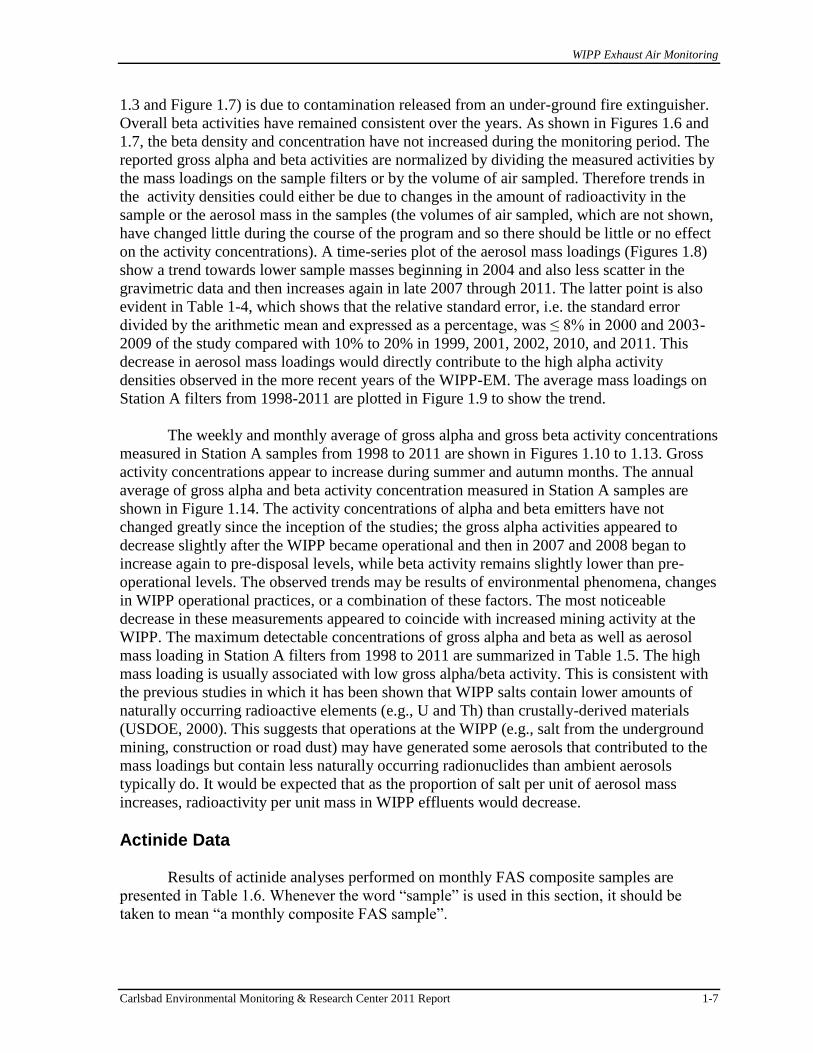
WIPP Exhaust Air Monitoring
Carlsbad Environmental Monitoring & Research Center 2011 Report 1-7
1.3 and Figure 1.7) is due to contamination released from an under-ground fire extinguisher.
Overall beta activities have remained consistent over the years. As shown in Figures 1.6 and
1.7, the beta density and concentration have not increased during the monitoring period. The
reported gross alpha and beta activities are normalized by dividing the measured activities by
the mass loadings on the sample filters or by the volume of air sampled. Therefore trends in
the activity densities could either be due to changes in the amount of radioactivity in the
sample or the aerosol mass in the samples (the volumes of air sampled, which are not shown,
have changed little during the course of the program and so there should be little or no effect
on the activity concentrations). A time-series plot of the aerosol mass loadings (Figures 1.8)
show a trend towards lower sample masses beginning in 2004 and also less scatter in the
gravimetric data and then increases again in late 2007 through 2011. The latter point is also
evident in Table 1-4, which shows that the relative standard error, i.e. the standard error
divided by the arithmetic mean and expressed as a percentage, was ≤ 8% in 2000 and 2003-
2009 of the study compared with 10% to 20% in 1999, 2001, 2002, 2010, and 2011. This
decrease in aerosol mass loadings would directly contribute to the high alpha activity
densities observed in the more recent years of the WIPP-EM. The average mass loadings on
Station A filters from 1998-2011 are plotted in Figure 1.9 to show the trend.
The weekly and monthly average of gross alpha and gross beta activity concentrations
measured in Station A samples from 1998 to 2011 are shown in Figures 1.10 to 1.13. Gross
activity concentrations appear to increase during summer and autumn months. The annual
average of gross alpha and beta activity concentration measured in Station A samples are
shown in Figure 1.14. The activity concentrations of alpha and beta emitters have not
changed greatly since the inception of the studies; the gross alpha activities appeared to
decrease slightly after the WIPP became operational and then in 2007 and 2008 began to
increase again to pre-disposal levels, while beta activity remains slightly lower than pre-
operational levels. The observed trends may be results of environmental phenomena, changes
in WIPP operational practices, or a combination of these factors. The most noticeable
decrease in these measurements appeared to coincide with increased mining activity at the
WIPP. The maximum detectable concentrations of gross alpha and beta as well as aerosol
mass loading in Station A filters from 1998 to 2011 are summarized in Table 1.5. The high
mass loading is usually associated with low gross alpha/beta activity. This is consistent with
the previous studies in which it has been shown that WIPP salts contain lower amounts of
naturally occurring radioactive elements (e.g., U and Th) than crustally-derived materials
(USDOE, 2000). This suggests that operations at the WIPP (e.g., salt from the underground
mining, construction or road dust) may have generated some aerosols that contributed to the
mass loadings but contain less naturally occurring radionuclides than ambient aerosols
typically do. It would be expected that as the proportion of salt per unit of aerosol mass
increases, radioactivity per unit mass in WIPP effluents would decrease.
Actinide Data
Results of actinide analyses performed on monthly FAS composite samples are
presented in Table 1.6. Whenever the word “sample” is used in this section, it should be
taken to mean “a monthly composite FAS sample”.

WIPP Exhaust Air Monitoring
1-8 Carlsbad Environmental Monitoring & Research Center 2011 Report
No detectable concentrations of 238
Pu, 239+240
Pu or 241
Am were detected in any of the
2011 samples. However, a trace amount of cesium (134
Cs) and (137
Cs) was detected in the
March monthly composite samples due to the Fukushima NPP accident in Japan. For more
information on this event, see chapter 7 of this report. To confirm the detection of cesium
isotopes in the March primary monthly composite sample, the March backup monthly
composite sample was also analyzed. The re-analysis of the backup samples also showed a
detection of 134
Cs and 137
Cs. It is important to note that prior to this instance, CEMRC has
not detected isotopes of cesium in any of the composite samples since the monitoring
operations began in 1998. Therefore, the detection of Fukushima radionuclides further
highlight the sensitivity of the CEMRC analysis and help assure local community
constituents that no amount of radionuclide can go undetected by the CEMRC
monitoring stations.
The activity concentrations of 239+240
Pu, 238
Pu, 241
Am, 134
Cs, 137
Cs, and cobalt (60
Co)
measured in the 2011 monthly composite samples are illustrated in Figures 1.15 to 1.20. As
shown in Figures 1.18 and 1.19, the activities of the 137
Cs and 134
Cs isotopes were above
detection limits for the month of March, 2011. The time series of the 239+240
Pu and 241
Am and 239+240
Pu and 238
Pu activity concentrations in the WIPP exhaust air from the period from 1998
to 2011 are shown in Figures 1.21 and 1.22, respectively. An analysis of historical
operational data indicates occasional detections of trace amount of 239+240
Pu, 238
Pu, 241
Am
and 137
Cs in the exhaust air release from the WIPP. From 2000 until 2011, only ten
measurements can be declared as a detection of a radionuclide. These measurements are
listed in Table 1.7. For comparison, the values detected above detection limits by WTS are
listed in Table 1.8. The consistency between the CEMRC and WTS data further reflects high
quality and sensitivity of CEMRC’s monitoring results. However, it should be noted that
these activities were extremely low and well below the action level of 37 Bq/m3 that triggers
the Continuous Air Monitors (CAMs) that are distributed throughout the WIPP. The
historical average radionuclide concentrations data of 239+240
Pu, 238
Pu, 241
Am measured by
CEMRC from 2000-2011 are summarized in Tables 1.9 to 1.11.
The naturally occurring isotopes of U were detected in all monthly FAS composites
in 2011. The average 234
U/238
U activity ratio of 1.66±0.22 in the WIPP underground air
samples indicates the presence of natural U (Table 1.12). 234
U results were similar to those of 238
U for activity concentration and density, indicating secular equilibrium between the two
isotopes. These results are consistent with those reported in previous CEMRC, reports.
With the exception of occasional detections from 40
K, no detectable gamma-emitting
radio-nuclides were observed during the monitoring period 2011. The minimum, maximum,
and average concentrations of radionuclides for the 2011 FAS composite samples are
summarized in Table 1.13.
NON-RADIOLOGICAL MONITORING RESULTS
Elemental analyses by Inductively Coupled Plasma-Mass Spectrometry (ICP-MS) are
conducted on weekly composites of the filters. As mentioned previously, individual FAS
filters were digested using a mixture of strong acids in a CEM MARS™ Xpress™

WIPP Exhaust Air Monitoring
Carlsbad Environmental Monitoring & Research Center 2011 Report 1-9
microwave digestion unit. Blank filters and Certified Reference Material (CRM) filters were
also digested in the same manner for QC purposes. All acids used were concentrated and
purified either by using a Milestone Inc. sub-boiling quartz distillation apparatus or
purchased as “trace-metal” grade.
Weekly composites were then prepared from the digestates of the individual filters
and analyzed for a wide-range of elements. A low-resolution Perkin Elmer Elan 6100 ICP-
MS was used for the analysis which has a peak resolution of <0.71amu for the mass range
reported. The mass calibration value is within 0.1amu of the published true values for the
mass range reported. The system was configured with a gem-tipTM
cross-flow nebulizer and
a Scott spray chamber. All samples were analyzed using a nickel sampler and skimmer
cones. Triplicate readings were performed on each digestate, with the average result
reported.
The ICP-MS analyses used at CEMRC can provide data for up to ~35 elements in
FAS filters, but in practice the concentrations of some elements, including, but not limited to,
As, Be, Cd, Er, Eu, Sc, Se, Sm, Tl and V are often below detectable or quantifiable levels. A
second set of elements (notably Ag, Li, and Sn) often have variable concentrations in the
blank filters which makes their quantification difficult.
Only the following metals will be reported herein: aluminum (Al), cadmium (Cd),
magnesium (Mg), lead (Pb), thorium (Th), and uranium (U). Al is of particular interest
because of the correlation between the Al concentrations in ambient aerosols and the
activities of 239+240
Pu and 241
Am (Arimoto, et al. 2002, 2005, and 2006). Windblown dust is
the main source of Al and many other elements (Fe, Mg, Mn, Sc, and the rare earth elements)
It is also the main source of naturally occurring radionuclides, including U, and fallout
radionuclides such as Pu and Am. Kirchner, et al. (2002) has also discussed relationships
between Al and various radionuclides, both artificial and naturally occurring, in soils. Several
potentially toxic elements (i.e., cadmium (Cd), lead (Pb), Th, and U) which are components
of the WIPP mixed waste were already present in measurable amounts in the WIPP aerosol
effluent prior to the receipt of mixed waste.
According to the Environmental Protection Agency (EPA), Pb is found naturally in
the environment as well as in manufactured products. The major sources of lead emissions
have historically been from fuels in on-road motor vehicles (such as cars and trucks) and
industrial sources. The major sources of lead emissions to the air today are from ore and
metals processing and piston-engine aircraft operating on leaded aviation gasoline. The EPA
primary standard (established limits to protect the public health, including the health of
"sensitive" populations such as asthmatics, children, and the elderly) for lead in ambient air is
0.15 μg/m3 averaged over a rolling 3-month average (US EPA 2012).
Prior studies at Station A have shown that concentrations of hazardous metals and
various trace elements can be highly variable over time; this was true even in the samples
collected prior to WIPP receiving the mixed waste in September 2000. However, there is no
evidence of a long-term increase in the concentrations of any of these elements that can
be linked to the WIPP operations.

WIPP Exhaust Air Monitoring
1-10 Carlsbad Environmental Monitoring & Research Center 2011 Report
Time-series plots of the selected trace elemental data from 1998 to the present are
exhibited in Figures 1.23 through 1.28. Some data is missing from the elemental data plots
because of a sample holding time issue in the fourth quarter of 2004. Furthermore, the data
presented in these plots only reflect concentrations above MDC. The MDCs are re-calculated
annually, and vary slightly from year to year. The concentrations of Cd, Th, and U regularly
hover right around the MDC and in 2009, concentrations for these elements never exceeded
the MDC.
During the fourth quarter of 2010 with carry-over into the first quarter of 2011 there
was an increase in the mining activity at the WIPP due to additional disposal panel mining as
well as mining in the experimental operations (XO) area. The increase in metal
concentrations as a result of the increased mining activity for January 2011 could also be
augmented by the fact that the winter weather has been noticeably dryer and windier than in
recent history.
Additionally, in October 2011, there was an inadvertent release of the fire suppression
material, FORAY® in the underground at the WIPP. The affected FAS filter was digested
and analyzed separately from the other October 2011 filters to avoid any potential for
contaminating the other filters. The results are included along with the 2011 average monthly
concentrations for the selected elements shown in Figures 1.29 through 1.34. The material,
FORAY®, contains small amounts of Attapulgite Clay (a salt containing Mg, Al, and
silicate) in the range of 5-7% by weight so the slightly higher concentrations for these
elements compared to the average concentrations for October are expected. While slightly
higher concentrations than the monthly October 2011 average were observed for Th and U,
they do not exceed pre-operational levels. Additionally, the radiochemical analyses discussed
earlier in this chapter confirms that the concentrations of radioactive isotopes for Th and U
were well below environmental levels.

WIPP Exhaust Air Monitoring
Carlsbad Environmental Monitoring & Research Center 2011 Report 1-11
Table 1.1. Total Air Flow Volume and Mass Loading Recorded in Monthly Composite Filters in 2011
Month SID Air Flow volume (m3) Mass Loading (mg)
January 26179 1355.50 1957.29 February 26181 2156.76 509.93
March 26183 2508.77 219.66 March (BU) 27363 1699.21 146.91
April 26185 2390.93 275.83 May 26187 2331.46 277.33 June 26189 2420.25 263.02
June (BU) 27283 2428.54 230.74 July 26191 2460.13 269.82
August 26193 2511.41 181.63 September 26195 2205.54 42.41
October 26197 2430.14 65.26 November 26199 2446.71 143.23 December 26201 2604.79 183.93
BU= Back-up filter
Figure 1.4. Gross Alpha Activity Densities measured in Station A Filters

WIPP Exhaust Air Monitoring
1-12 Carlsbad Environmental Monitoring & Research Center 2011 Report
Figure 1.5. Gross Alpha Activity Concentrations measured in Station A Filters
Figure 1.6. Gross Beta Activity Densities measured in Station A Filters

WIPP Exhaust Air Monitoring
Carlsbad Environmental Monitoring & Research Center 2011 Report 1-13
Figure 1.7. Gross Beta Activity Concentrations measured in Station A Filters
Table 1.2. Summary Statistics for Mass Loading and Gross Alpha Analyses of Station A Filters
Activity Density (Bq/g) Activity Concentration (mBq/m3)
Group N % <MDC Mean SE Max % <MDC Mean SE Max
Pre-Disposal 70 0% 3.6 0.59 36.7 0% 0.315 0.031 1.49
1999* 185 1% 1.9 0.33 61.4 1% 0.110 0.005 0.37
2000 465 67% 1.0 0.07 3.8 67% 0.112 0.005 0.39
2001 428 65% 1.3 0.12 9.6 65% 0.082 0.004 0.42
2002 382 33% 1.0 0.13 21.5 34% 0.081 0.002 0.26
2003 345 35% 2.1 0.61 135.4 35% 0.104 0.005 0.40
2004 370 17% 2.4 0.18 26.6 17% 0.144 0.008 1.29
2005 361 4% 5.6 1.07 327.8 4% 0.223 0.006 0.71
2006 264 3% 3.1 0.21 35.4 3% 0.166 0.007 1.43
2007 378 0% 9.1 1.3 421.2 0% 0.444 0.014 1.44
2008 431 1% 10.1 1.20 345.1 1% 0.455 0.011 1.53
2009 433 4% 7.1 0.35 63.5 4% 0.357 0.008 1.03
2010 471 6% 4.6 1.74 815.0 6% 0.199 0.009 3.37
2011 443 7% 5.2 0.49 89.9 7% 0.218 0.007 1.00
N = Number of samples SE = Standard Error
MDC = Minimum Detectable Concentration Max = Maximum observed value
Mean = Arithmetic mean *From 26 March to 31 December 1999

WIPP Exhaust Air Monitoring
1-14 Carlsbad Environmental Monitoring & Research Center 2011 Report
Table 1.3. Summary Statistics for Mass Loading and Gross Beta analyses of Station A Filters
Activity Density (Bq/g) Activity Concentration (mBq/m3)
Group N % <MDC Mean SE Max % <MDC Mean SE Max
Pre-Disposal 70 0% 14.0 1.90 120 0% 1.14 0.09 4.94
1999* 189 0% 20.0 2.20 350 0% 0.99 0.03 3.25
2000 461 6% 7.7 0.54 76 6% 0.98 0.02 2.73
2001 429 3% 12.0 1.00 190 3% 1.14 0.16 58.41
2002 382 2% 12.0 0.99 200 2% 0.90 0.02 1.97
2003 345 1% 20.0 6.30 2100 1% 0.79 0.02 4.77
2004 369 4% 16.0 1.50 460 4% 0.81 0.02 4.85
2005 361 1% 20.0 3.90 1300 1% 0.78 0.02 2.07
2006 324 1% 9.8 0.57 93 1% 0.61 0.02 2.10
2007 378 2% 11.3 1.89 616 2% 0.50 0.02 1.88
2008 431 3% 12.6 1.53 438 3% 0.52 0.01 2.25
2009 433 6% 11.3 0.64 114 6% 0.56 0.04 15.84
2010 471 3% 20.7 10.2 4780 3% 0.65 0.03 4.41
2011 443 7% 13.9 1.33 241 7% 0.55 0.02 3.87
N = Number of samples SE = Standard Error
MDC = Minimum Detectable Concentration Max = Maximum observed value
Mean = Arithmetic mean *From 26 March to 31 December 1999
Table 1.4. Summary Statistics for Aerosol Mass Loadings on Station A (µg/m3 per filter)
Group N Mean SE RSE (%)
Pre-Disposal 70 125.0 12.2 9.8
1999* 189 171.2 17.1 10.0
2000 461 396.5 20.7 5.2
2001 429 285.4 29.4 10.3
2002 382 274.7 55.5 20.2
2003 345 204.3 12.7 6.2
2004 369 95.7 6.0 6.3
2005 361 90.2 3.9 4.3
2006 324 84.8 3.0 3.5
2007 378 125.2 10.2 8.1
2008 431 143.5 11.2 7.8
2009 433 100.2 6.0 6.0
2010 471 385.5 70.5 18.3
2011 443 176.0 24.5 14.0
N = Number of samples; Mean = Arithmetic mean
SE = Standard Error
RSE = Relative Standard Error in percentage (Standard error divided by Mean)
From 26 March to 31 December 1999
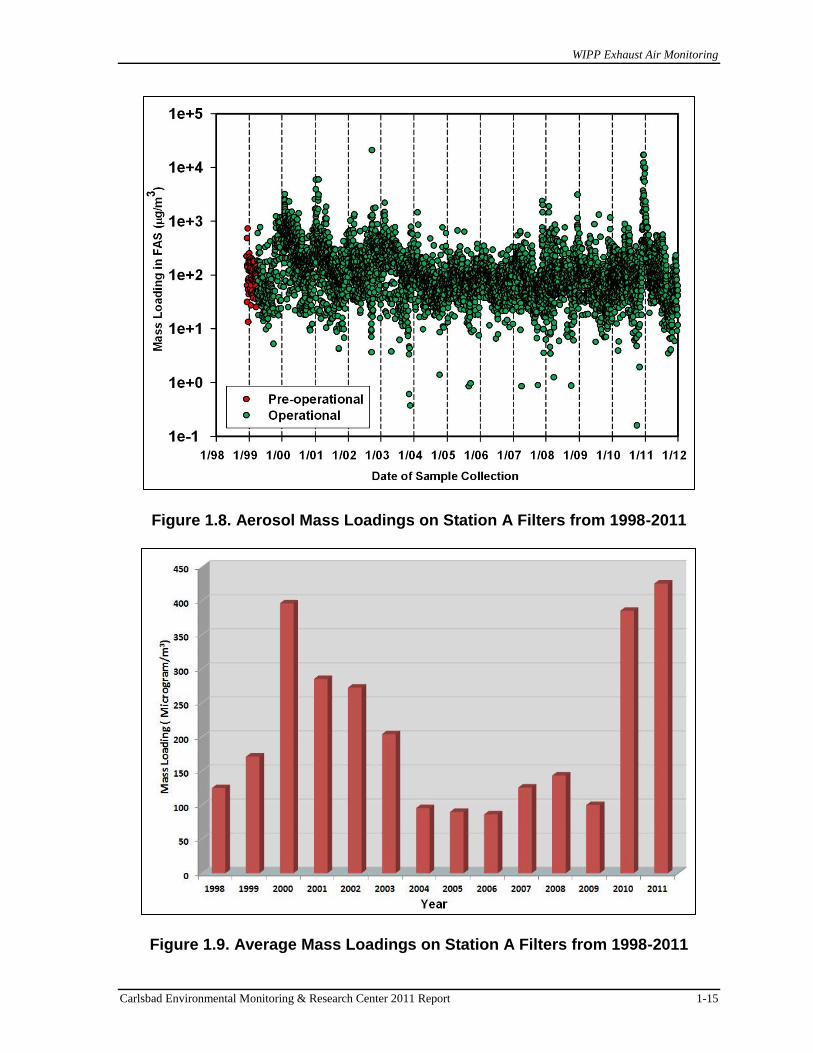
WIPP Exhaust Air Monitoring
Carlsbad Environmental Monitoring & Research Center 2011 Report 1-15
Figure 1.8. Aerosol Mass Loadings on Station A Filters from 1998-2011
Figure 1.9. Average Mass Loadings on Station A Filters from 1998-2011
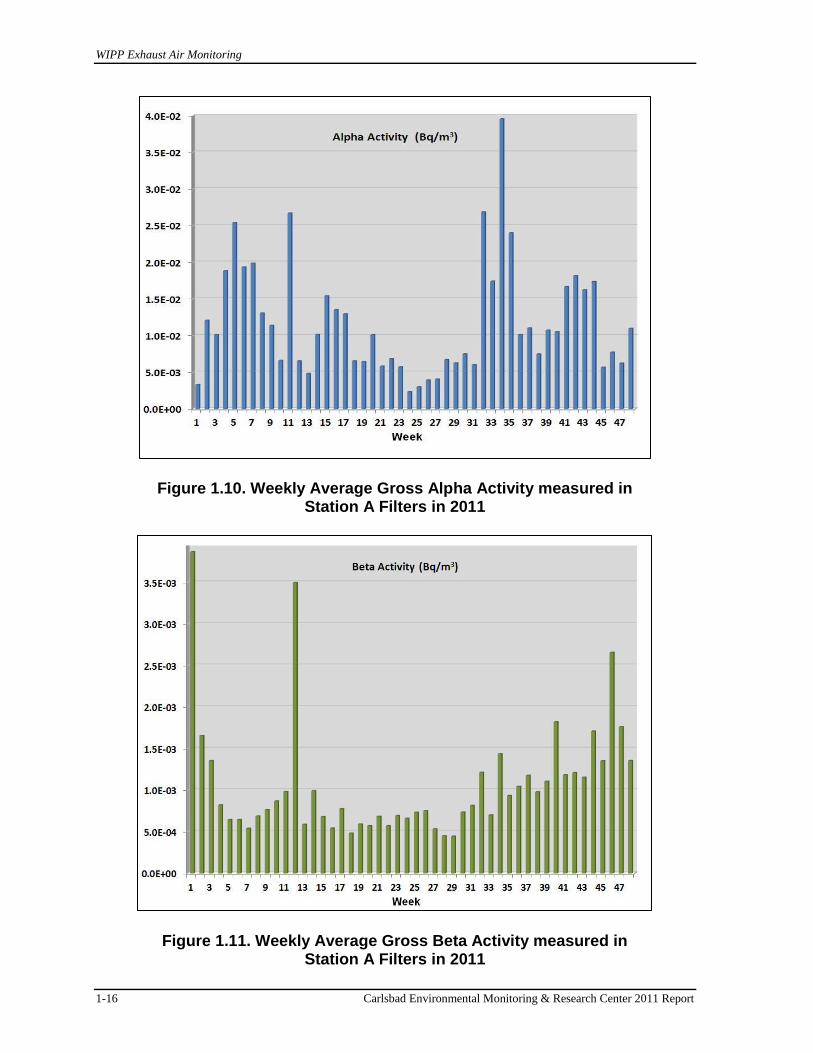
WIPP Exhaust Air Monitoring
1-16 Carlsbad Environmental Monitoring & Research Center 2011 Report
Figure 1.10. Weekly Average Gross Alpha Activity measured in Station A Filters in 2011
Figure 1.11. Weekly Average Gross Beta Activity measured in Station A Filters in 2011

WIPP Exhaust Air Monitoring
Carlsbad Environmental Monitoring & Research Center 2011 Report 1-17
Figure 1.12. Monthly Average Gross Alpha Activity measured in
Station A Filters in 2011
Figure 1.13. Monthly Average Gross Beta Activity measured in
Station A Filters in 2011

WIPP Exhaust Air Monitoring
1-18 Carlsbad Environmental Monitoring & Research Center 2011 Report
Figure 1.14. Average Annual Gross Alpha and Beta Activity
Concentrations in Station A filters
Table 1.5. Summary Statistics of Maximum Gross Alpha and Beta Activities and the Corresponding Mass Loading on Station A Filters from 1998-2011
Year
Max. mass
loading (mg)
Alpha activity
Bq
Beta activity
Bq
Max. alpha activity, Bq
Mass Loading
(mg)
Max. beta activity, Bq
Mass loading
(mg)
1998 26.23 0.036 0.124 0.181 4.94 0.606 4.94
1999 87.66 0.008 0.042 0.067 7.84 0.430 7.98
2000 87.94 0.014 0.073 0.065 24.77 0.759 12.90
2001 307.51 0.016 0.237 0.030 19.32 0.491 3.21
2002 148.85 0.000 0.025 0.029 17.95 0.500 17.95
2003 92.68 0.013 0.156 0.035 69.20 0.248 10.82
2004 79.02 0.041 0.116 0.083 8.45 0.260 8.90
2005 31.73 0.021 0.068 0.106 19.93 0.355 19.93
2006 79.44 0.021 0.057 0.122 4.65 0.282 2.08
2007 76.46 0.037 0.048 0.125 4.22 0.162 4.22
2008 121.58 0.018 0.035 0.161 5.42 0.213 5.42
2009 32.52 0.034 0.036 0.085 10.56 0.301 24.91
2010 321.2 0.0003 0.032 0.188 302.1 0.197 89.5
2011 79.0 0.049 0.115 0.049 79.0 0.310 6.27

WIPP Exhaust Air Monitoring
Carlsbad Environmental Monitoring & Research Center 2011 Report 1-19
Table 1.6. Radionuclides concentrations in Monthly Composite Samples Collected from Station A
Activity Concentration (Bq/m3) Activity Density (Bq/g)
Radionuclide Activity SD MDC Activity SD MDC
January 2011 241
Am 5.35E-08 4.46E-08 1.24E-07 3.70E-05 3.09E-05 8.60E-05 238
Pu 8.17E-08 5.89E-08 1.96E-07 5.66E-05 4.08E-05 1.36E-04 239+240
Pu 1.63E-07 6.93E-08 1.96E-07 1.13E-04 4.80E-05 1.36E-04 234
U 2.90E-06 3.24E-07 3.13E-07 2.01E-03 2.24E-04 2.17E-04 235
U 2.09E-07 1.39E-07 4.51E-07 1.45E-04 9.62E-05 3.12E-04 238
U 2.43E-06 2.97E-07 3.13E-07 1.68E-03 2.05E-04 2.17E-04 134
Cs -4.53E-05 2.46E-05 8.24E-05 -3.14E-02 1.71E-02 5.71E-02 137
Cs
-8.89E-06 3.45E-05 1.15E-04 -6.16E-03 2.39E-02 7.94E-02 60
Co -5.43E-06 3.39E-05 1.13E-04 -3.76E-03 2.35E-02 7.81E-02 40
K 2.56E-04 3.48E-04 1.15E-03 1.77E-01 2.41E-01 7.97E-01
February 2011 241
Am -1.13E-08 1.74E-08 7.70E-08 -4.79E-05 7.36E-05 3.26E-04 238
Pu 0.00E+00 4.97E-08 2.18E-07 0.00E+00 2.10E-04 9.23E-04 239+240
Pu 7.27E-08 3.85E-08 1.07E-07 3.07E-04 1.63E-04 4.52E-04 234
U 5.10E-07 1.70E-07 4.80E-07 2.16E-03 7.20E-04 2.03E-03 235
U 1.26E-07 9.19E-08 3.05E-07 5.32E-04 3.89E-04 1.29E-03 238
U 3.17E-07 1.40E-07 4.19E-07 1.34E-03 5.92E-04 1.77E-03 134
Cs -1.00E-04 1.69E-05 5.69E-05 -4.23E-01 7.13E-02 2.41E-01 137
Cs
-5.19E-06 2.19E-05 7.29E-05 -2.20E-02 9.28E-02 3.08E-01 60
Co 2.55E-06 2.09E-05 6.96E-05 1.08E-02 8.86E-02 2.94E-01 40
K 1.65E-04 2.12E-04 7.00E-04 6.98E-01 8.95E-01 2.96E+00
March 2011 241
Am -6.05E-09 2.67E-08 1.11E-07 -6.91E-05 3.05E-04 1.27E-03 238
Pu 4.97E-08 3.93E-08 1.34E-07 5.68E-04 4.49E-04 1.53E-03 239+240
Pu 3.73E-08 4.48E-08 1.63E-07 4.26E-04 5.12E-04 1.86E-03 234
U 4.89E-07 7.21E-08 1.01E-07 5.58E-03 8.23E-04 1.16E-03 235
U 2.39E-08 2.39E-08 8.79E-08 2.73E-04 2.73E-04 1.00E-03 238
U 2.81E-07 5.48E-08 8.69E-08 3.21E-03 6.26E-04 9.92E-04 134
Cs 1.48E-04 1.47E-05 4.48E-05 1.71E+00 1.70E-01 5.18E-01 137
Cs
1.09E-04 1.96E-05 6.26E-05 1.24E+00 2.24E-01 7.15E-01 137
Cs (BU) 1.70E-04 1.31E-05 4.04E-05 1.96E+00 1.51E-01 4.67E-01 60
Co -4.44E-06 1.80E-05 5.99E-05 -5.07E-02 2.05E-01 6.84E-01 40
K -8.37E-05 1.79E-04 5.97E-04 -9.56E-01 2.04E+00 6.82E+00
April 2011 241
Am 1.93E-09 3.08E-08 1.17E-07 1.67E-05 2.67E-04 1.01E-03 238
Pu 6.66E-08 3.54E-08 1.06E-07 5.78E-04 3.07E-04 9.16E-04 239+240
Pu 1.03E-07 4.43E-08 1.26E-07 8.95E-04 3.84E-04 1.09E-03 234
U 6.22E-07 8.71E-08 1.54E-07 5.39E-03 7.55E-04 1.33E-03 235
U 6.99E-08 4.13E-08 1.29E-07 6.06E-04 3.58E-04 1.12E-03 238
U 4.60E-07 7.49E-08 1.36E-07 3.99E-03 6.49E-04 1.18E-03 134
Cs -8.89E-06 1.05E-05 3.53E-05 -7.71E-02 9.10E-02 3.06E-01 137
Cs
5.79E-06 2.39E-05 7.95E-05 5.02E-02 2.07E-01 6.89E-01 60
Co 1.77E-05 2.24E-05 7.44E-05 1.53E-01 1.94E-01 6.45E-01 40
K -5.00E-04 2.49E-04 8.47E-04 -4.34E+00 2.16E+00 7.34E+00
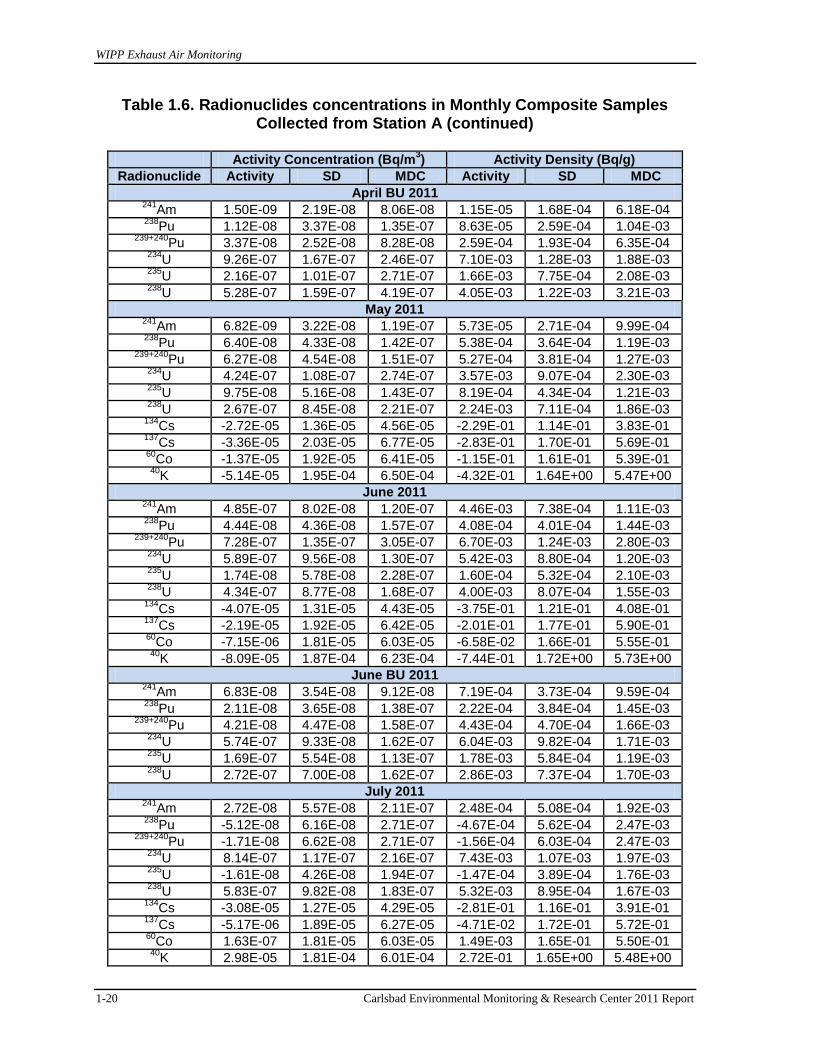
WIPP Exhaust Air Monitoring
1-20 Carlsbad Environmental Monitoring & Research Center 2011 Report
Table 1.6. Radionuclides concentrations in Monthly Composite Samples Collected from Station A (continued)
Activity Concentration (Bq/m
3) Activity Density (Bq/g)
Radionuclide Activity SD MDC Activity SD MDC
April BU 2011 241
Am 1.50E-09 2.19E-08 8.06E-08 1.15E-05 1.68E-04 6.18E-04 238
Pu 1.12E-08 3.37E-08 1.35E-07 8.63E-05 2.59E-04 1.04E-03 239+240
Pu 3.37E-08 2.52E-08 8.28E-08 2.59E-04 1.93E-04 6.35E-04 234
U 9.26E-07 1.67E-07 2.46E-07 7.10E-03 1.28E-03 1.88E-03 235
U 2.16E-07 1.01E-07 2.71E-07 1.66E-03 7.75E-04 2.08E-03 238
U 5.28E-07 1.59E-07 4.19E-07 4.05E-03 1.22E-03 3.21E-03
May 2011 241
Am 6.82E-09 3.22E-08 1.19E-07 5.73E-05 2.71E-04 9.99E-04 238
Pu 6.40E-08 4.33E-08 1.42E-07 5.38E-04 3.64E-04 1.19E-03 239+240
Pu 6.27E-08 4.54E-08 1.51E-07 5.27E-04 3.81E-04 1.27E-03 234
U 4.24E-07 1.08E-07 2.74E-07 3.57E-03 9.07E-04 2.30E-03 235
U 9.75E-08 5.16E-08 1.43E-07 8.19E-04 4.34E-04 1.21E-03 238
U 2.67E-07 8.45E-08 2.21E-07 2.24E-03 7.11E-04 1.86E-03 134
Cs -2.72E-05 1.36E-05 4.56E-05 -2.29E-01 1.14E-01 3.83E-01 137
Cs
-3.36E-05 2.03E-05 6.77E-05 -2.83E-01 1.70E-01 5.69E-01 60
Co -1.37E-05 1.92E-05 6.41E-05 -1.15E-01 1.61E-01 5.39E-01 40
K -5.14E-05 1.95E-04 6.50E-04 -4.32E-01 1.64E+00 5.47E+00
June 2011 241
Am 4.85E-07 8.02E-08 1.20E-07 4.46E-03 7.38E-04 1.11E-03 238
Pu 4.44E-08 4.36E-08 1.57E-07 4.08E-04 4.01E-04 1.44E-03 239+240
Pu 7.28E-07 1.35E-07 3.05E-07 6.70E-03 1.24E-03 2.80E-03 234
U 5.89E-07 9.56E-08 1.30E-07 5.42E-03 8.80E-04 1.20E-03 235
U 1.74E-08 5.78E-08 2.28E-07 1.60E-04 5.32E-04 2.10E-03 238
U 4.34E-07 8.77E-08 1.68E-07 4.00E-03 8.07E-04 1.55E-03 134
Cs -4.07E-05 1.31E-05 4.43E-05 -3.75E-01 1.21E-01 4.08E-01 137
Cs
-2.19E-05 1.92E-05 6.42E-05 -2.01E-01 1.77E-01 5.90E-01 60
Co -7.15E-06 1.81E-05 6.03E-05 -6.58E-02 1.66E-01 5.55E-01 40
K -8.09E-05 1.87E-04 6.23E-04 -7.44E-01 1.72E+00 5.73E+00
June BU 2011 241
Am
6.83E-08 3.54E-08 9.12E-08 7.19E-04 3.73E-04 9.59E-04 238
Pu 2.11E-08 3.65E-08 1.38E-07 2.22E-04 3.84E-04 1.45E-03 239+240
Pu 4.21E-08 4.47E-08 1.58E-07 4.43E-04 4.70E-04 1.66E-03 234
U 5.74E-07 9.33E-08 1.62E-07 6.04E-03 9.82E-04 1.71E-03 235
U 1.69E-07 5.54E-08 1.13E-07 1.78E-03 5.84E-04 1.19E-03 238
U 2.72E-07 7.00E-08 1.62E-07 2.86E-03 7.37E-04 1.70E-03
July 2011 241
Am
2.72E-08 5.57E-08 2.11E-07 2.48E-04 5.08E-04 1.92E-03 238
Pu -5.12E-08 6.16E-08 2.71E-07 -4.67E-04 5.62E-04 2.47E-03 239+240
Pu -1.71E-08 6.62E-08 2.71E-07 -1.56E-04 6.03E-04 2.47E-03 234
U 8.14E-07 1.17E-07 2.16E-07 7.43E-03 1.07E-03 1.97E-03 235
U -1.61E-08 4.26E-08 1.94E-07 -1.47E-04 3.89E-04 1.76E-03 238
U 5.83E-07 9.82E-08 1.83E-07 5.32E-03 8.95E-04 1.67E-03 134
Cs -3.08E-05 1.27E-05 4.29E-05 -2.81E-01 1.16E-01 3.91E-01 137
Cs
-5.17E-06 1.89E-05 6.27E-05 -4.71E-02 1.72E-01 5.72E-01 60
Co 1.63E-07 1.81E-05 6.03E-05 1.49E-03 1.65E-01 5.50E-01 40
K 2.98E-05 1.81E-04 6.01E-04 2.72E-01 1.65E+00 5.48E+00
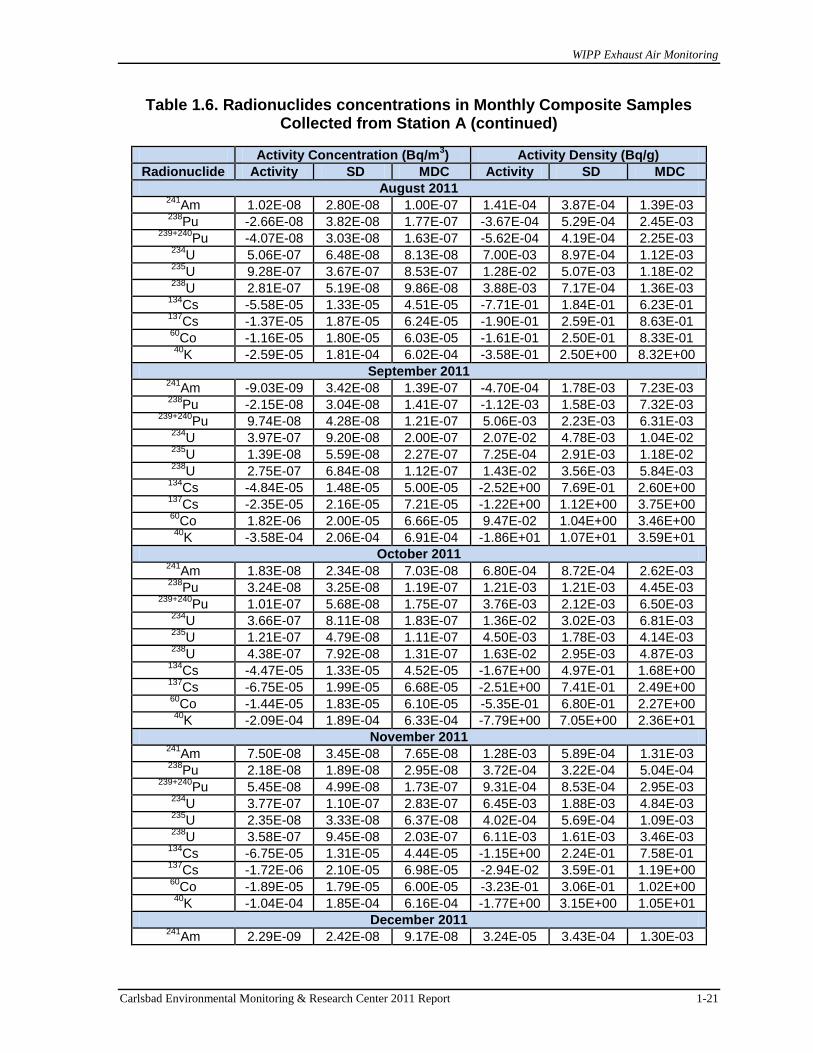
WIPP Exhaust Air Monitoring
Carlsbad Environmental Monitoring & Research Center 2011 Report 1-21
Table 1.6. Radionuclides concentrations in Monthly Composite Samples Collected from Station A (continued)
Activity Concentration (Bq/m3) Activity Density (Bq/g)
Radionuclide Activity SD MDC Activity SD MDC
August 2011 241
Am 1.02E-08 2.80E-08 1.00E-07 1.41E-04 3.87E-04 1.39E-03 238
Pu -2.66E-08 3.82E-08 1.77E-07 -3.67E-04 5.29E-04 2.45E-03 239+240
Pu -4.07E-08 3.03E-08 1.63E-07 -5.62E-04 4.19E-04 2.25E-03 234
U 5.06E-07 6.48E-08 8.13E-08 7.00E-03 8.97E-04 1.12E-03 235
U 9.28E-07 3.67E-07 8.53E-07 1.28E-02 5.07E-03 1.18E-02 238
U 2.81E-07 5.19E-08 9.86E-08 3.88E-03 7.17E-04 1.36E-03 134
Cs -5.58E-05 1.33E-05 4.51E-05 -7.71E-01 1.84E-01 6.23E-01 137
Cs
-1.37E-05 1.87E-05 6.24E-05 -1.90E-01 2.59E-01 8.63E-01 60
Co -1.16E-05 1.80E-05 6.03E-05 -1.61E-01 2.50E-01 8.33E-01 40
K -2.59E-05 1.81E-04 6.02E-04 -3.58E-01 2.50E+00 8.32E+00
September 2011 241
Am
-9.03E-09 3.42E-08 1.39E-07 -4.70E-04 1.78E-03 7.23E-03 238
Pu -2.15E-08 3.04E-08 1.41E-07 -1.12E-03 1.58E-03 7.32E-03 239+240
Pu 9.74E-08 4.28E-08 1.21E-07 5.06E-03 2.23E-03 6.31E-03 234
U 3.97E-07 9.20E-08 2.00E-07 2.07E-02 4.78E-03 1.04E-02 235
U 1.39E-08 5.59E-08 2.27E-07 7.25E-04 2.91E-03 1.18E-02 238
U 2.75E-07 6.84E-08 1.12E-07 1.43E-02 3.56E-03 5.84E-03 134
Cs -4.84E-05 1.48E-05 5.00E-05 -2.52E+00 7.69E-01 2.60E+00 137
Cs
-2.35E-05 2.16E-05 7.21E-05 -1.22E+00 1.12E+00 3.75E+00 60
Co 1.82E-06 2.00E-05 6.66E-05 9.47E-02 1.04E+00 3.46E+00 40
K -3.58E-04 2.06E-04 6.91E-04 -1.86E+01 1.07E+01 3.59E+01
October 2011 241
Am 1.83E-08 2.34E-08 7.03E-08 6.80E-04 8.72E-04 2.62E-03 238
Pu 3.24E-08 3.25E-08 1.19E-07 1.21E-03 1.21E-03 4.45E-03 239+240
Pu 1.01E-07 5.68E-08 1.75E-07 3.76E-03 2.12E-03 6.50E-03 234
U 3.66E-07 8.11E-08 1.83E-07 1.36E-02 3.02E-03 6.81E-03 235
U 1.21E-07 4.79E-08 1.11E-07 4.50E-03 1.78E-03 4.14E-03 238
U 4.38E-07 7.92E-08 1.31E-07 1.63E-02 2.95E-03 4.87E-03 134
Cs -4.47E-05 1.33E-05 4.52E-05 -1.67E+00 4.97E-01 1.68E+00 137
Cs
-6.75E-05 1.99E-05 6.68E-05 -2.51E+00 7.41E-01 2.49E+00 60
Co -1.44E-05 1.83E-05 6.10E-05 -5.35E-01 6.80E-01 2.27E+00 40
K -2.09E-04 1.89E-04 6.33E-04 -7.79E+00 7.05E+00 2.36E+01
November 2011 241
Am 7.50E-08 3.45E-08 7.65E-08 1.28E-03 5.89E-04 1.31E-03 238
Pu 2.18E-08 1.89E-08 2.95E-08 3.72E-04 3.22E-04 5.04E-04 239+240
Pu 5.45E-08 4.99E-08 1.73E-07 9.31E-04 8.53E-04 2.95E-03 234
U 3.77E-07 1.10E-07 2.83E-07 6.45E-03 1.88E-03 4.84E-03 235
U 2.35E-08 3.33E-08 6.37E-08 4.02E-04 5.69E-04 1.09E-03 238
U 3.58E-07 9.45E-08 2.03E-07 6.11E-03 1.61E-03 3.46E-03 134
Cs -6.75E-05 1.31E-05 4.44E-05 -1.15E+00 2.24E-01 7.58E-01 137
Cs
-1.72E-06 2.10E-05 6.98E-05 -2.94E-02 3.59E-01 1.19E+00 60
Co -1.89E-05 1.79E-05 6.00E-05 -3.23E-01 3.06E-01 1.02E+00 40
K -1.04E-04 1.85E-04 6.16E-04 -1.77E+00 3.15E+00 1.05E+01
December 2011 241
Am 2.29E-09 2.42E-08 9.17E-08 3.24E-05 3.43E-04 1.30E-03
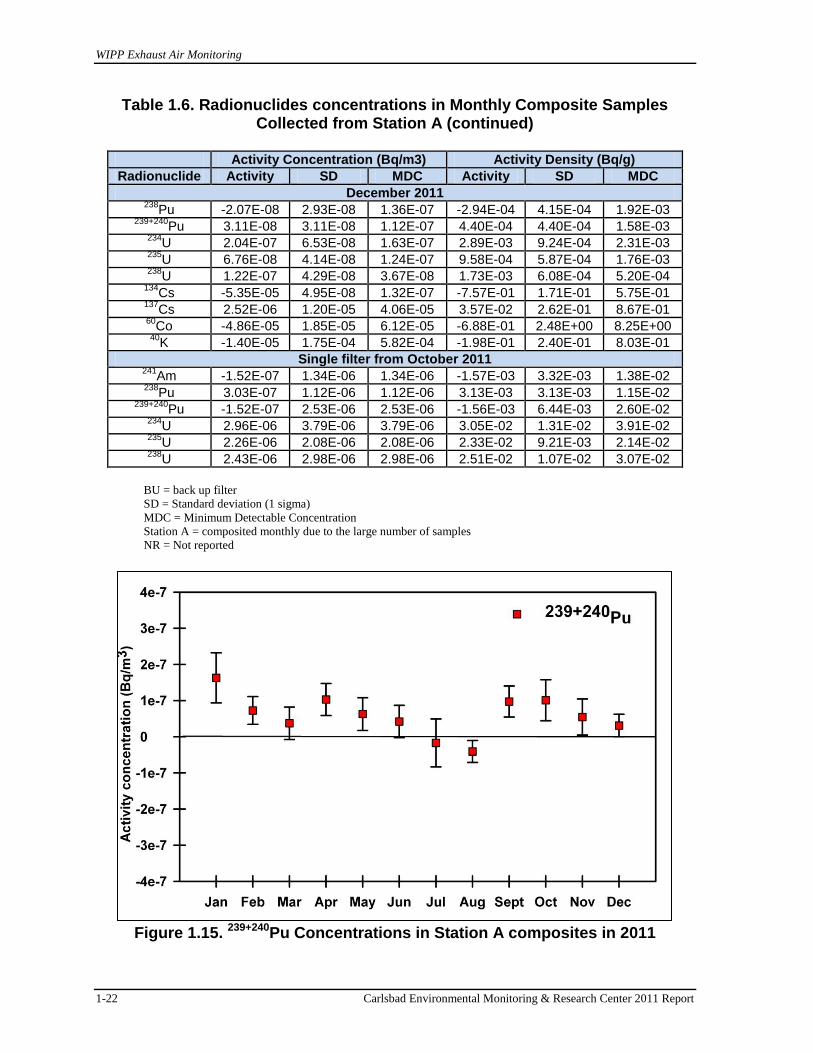
WIPP Exhaust Air Monitoring
1-22 Carlsbad Environmental Monitoring & Research Center 2011 Report
Table 1.6. Radionuclides concentrations in Monthly Composite Samples Collected from Station A (continued)
Activity Concentration (Bq/m3) Activity Density (Bq/g)
Radionuclide Activity SD MDC Activity SD MDC
December 2011 238
Pu -2.07E-08 2.93E-08 1.36E-07 -2.94E-04 4.15E-04 1.92E-03 239+240
Pu 3.11E-08 3.11E-08 1.12E-07 4.40E-04 4.40E-04 1.58E-03 234
U 2.04E-07 6.53E-08 1.63E-07 2.89E-03 9.24E-04 2.31E-03 235
U 6.76E-08 4.14E-08 1.24E-07 9.58E-04 5.87E-04 1.76E-03 238
U 1.22E-07 4.29E-08 3.67E-08 1.73E-03 6.08E-04 5.20E-04 134
Cs -5.35E-05 4.95E-08 1.32E-07 -7.57E-01 1.71E-01 5.75E-01 137
Cs
2.52E-06 1.20E-05 4.06E-05 3.57E-02 2.62E-01 8.67E-01 60
Co -4.86E-05 1.85E-05 6.12E-05 -6.88E-01 2.48E+00 8.25E+00 40
K -1.40E-05 1.75E-04 5.82E-04 -1.98E-01 2.40E-01 8.03E-01
Single filter from October 2011 241
Am
-1.52E-07 1.34E-06 1.34E-06 -1.57E-03 3.32E-03 1.38E-02 238
Pu 3.03E-07 1.12E-06 1.12E-06 3.13E-03 3.13E-03 1.15E-02 239+240
Pu -1.52E-07 2.53E-06 2.53E-06 -1.56E-03 6.44E-03 2.60E-02 234
U 2.96E-06 3.79E-06 3.79E-06 3.05E-02 1.31E-02 3.91E-02 235
U 2.26E-06 2.08E-06 2.08E-06 2.33E-02 9.21E-03 2.14E-02 238
U 2.43E-06 2.98E-06 2.98E-06 2.51E-02 1.07E-02 3.07E-02
BU = back up filter
SD = Standard deviation (1 sigma)
MDC = Minimum Detectable Concentration
Station A = composited monthly due to the large number of samples
NR = Not reported
Figure 1.15. 239+240Pu Concentrations in Station A composites in 2011

WIPP Exhaust Air Monitoring
Carlsbad Environmental Monitoring & Research Center 2011 Report 1-23
Figure 1.16. 238Pu Concentrations in Station A Composites in 2011
Figure 1.17. 241Am Concentrations in Station A composites in 2011

WIPP Exhaust Air Monitoring
1-24 Carlsbad Environmental Monitoring & Research Center 2011 Report
Figure 1.18. 137Cs Concentrations in Station A Composites in 2011
Figure 1.19. 134Cs Concentrations in Station A Composite in 2011
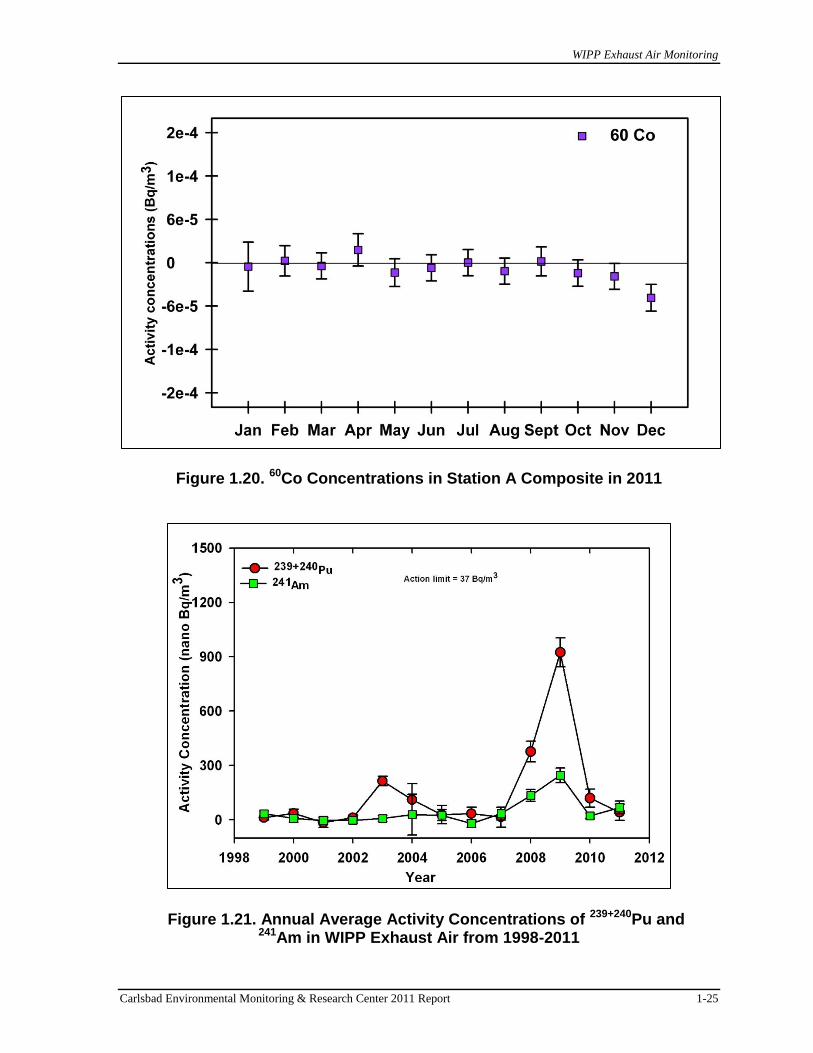
WIPP Exhaust Air Monitoring
Carlsbad Environmental Monitoring & Research Center 2011 Report 1-25
Figure 1.20. 60Co Concentrations in Station A Composite in 2011
Figure 1.21. Annual Average Activity Concentrations of 239+240Pu and
241Am in WIPP Exhaust Air from 1998-2011

WIPP Exhaust Air Monitoring
1-26 Carlsbad Environmental Monitoring & Research Center 2011 Report
Figure 1.22. Annual Average Activity Concentrations of 239+240Pu and 238Pu in
WIPP Exhaust Air from 1998-2011
Table 1.7. Activities greater than MDC and Uncertainty (2σ) measured by CEMRC during period 1999-2011
Year Month Radionuclides Activity (Bq) Uncertanity (2σ) MDC
2003 Mar-Jun 239+240Pu 4.76E-03 8.02E-04 2.63E-04
2005 April 241Am 2.72E-04 1.99E-04 2.65E-04
2008 Feb 241Am 6.20E-03 7.92E-04 1.79E-04
2008 Feb 238Pu 7.02E-04 3.52E-04 2.87E-04
2008 Feb 239+240Pu 1.78E-02 2.06E-03 2.87E-04
2009 April 241Am 3.53E-03 1.19E-03 3.03E-04
2009 April 238Pu 4.89E-04 2.24E-04 6.61E-05
2009 April 239+240Pu 2.13E-02 1.72E-03 6.61E-05
2010 July 239+240Pu 2.72E-03 9.04E-04 9.29E-04
2010 July 241Am 4.09E-04 2.48E-04 2.95E-04

WIPP Exhaust Air Monitoring
Carlsbad Environmental Monitoring & Research Center 2011 Report 1-27
Table 1.8. Activities greater than MDC and Uncertainty (2σ) measured by WTS during period 1999-2011
Year Month Radionuclides Activity (Bq) Uncertanity (2σ) MDC
2001 Oct 241Am 1.86E-03 1.41E-03 1.52E-03
2003 Jan 241Am 6.85E-04 5.70E-04 3.09E-04
2003 Sep 241Am 4.96E-04 4.51E-04 2.69E-04
2007 Sep 239+240Pu 1.71E-03 9.99E-04 4.40E-04
2008 Feb 241Am 4.00E-03 2.53E-03 1.97E-03
2008 Feb 239+240Pu 2.20E-02 5.17E-03 1.60E-03
2009* April 241Am 4.26E-03 1.85E-03 3.23E-03
2009* April 239+240Pu 1.96E-02 4.00E-03 1.83E-03
2010 July 239+240Pu 1.88E-03 1.15E-03 5.00E-04
* Re-analyzed resulting in no detection
Table 1.9. Historical Minimum, Maximum, and Average Concentrations of 238Pu (Bq/m3) measured in Station A
Year Minimum Maximum Average
2000 -3.62E-08 5.35E-09 -1.23E-08
2001 -2.68E-08 1.08E-08 -8.20E-09
2002 -8.22E-09 2.01E-08 6.47E-09
2003 -2.90E-11 8.00E-09 4.26E-09
2004 9.89E-08 2.76E-07 1.70E-07
2005 -5.94E-08 6.01E-08 4.52E-09
2006 -3.57E-08 7.81E-08 1.87E-08
2007 -6.96E-08 6.83E-08 8.97E-09
2008 -8.62E-08 1.50E-07 1.20E-08
2009 -1.42E-08 2.33E-07 4.07E-08
2010 -6.05E-08 7.19E-08 6.65E-09
2011 -5.12E-08 8.17E-08 1.78E-08

WIPP Exhaust Air Monitoring
1-28 Carlsbad Environmental Monitoring & Research Center 2011 Report
Table 1.10. Historical Minimum, Maximum, and Average Concentrations of
239+240Pu (Bq/m3) measured in Station A
Year Minimum Maximum Average
2000 2.24E-08 5.86E-08 3.67E-08
2001 -3.34E-08 1.06E-08 -8.83E-09
2002 8.10E-09 1.76E-08 1.23E-08
2003 -7.99E-09 6.39E-07 1.58E-07
2004 3.65E-09 1.25E-07 6.45E-08
2005 -3.82E-08 1.41E-07 3.69E-08
2006 -5.05E-08 1.67E-07 5.82E-08
2007 -2.79E-07 1.09E-07 1.73E-08
2008 8.44E-09 3.81E-06 3.77E-07
2009 -3.48E-08 1.01E-05 9.24E-07
2010 -1.77E-08 1.03E-06 1.28E-07
2011 -4.07E-08 1.63E-07 6.04E-08
Table 1.11. Historical Minimum, Maximum, and Average Concentrations of 241Am (Bq/m3) measured in Station A
Year Minimum Maximum Average
2000 -1.51E-08 3.17E-08 8.02E-09
2001 -1.70E-08 1.36E-08 -3.5E-09
2002 -2.16E-08 1.35E-09 -6.1E-09
2003 -4.73E-09 1.98E-08 7.72E-09
2004 -9.96E-09 5.12E-08 2.66E-08
2005 -1.94E-08 1.13E-07 3.35E-08
2006 -2.20E-08 7.07E-08 2.84E-08
2007 -2.05E-08 1.08E-07 2.97E-08
2008 -3.72E-08 1.32E-06 1.34E-07
2009 -1.61E-08 1.68E-06 1.88E-07
2010 -4.82E-08 1.54E-07 1.66E-08
2011 -1.13E-08 7.50E-08 1.54E-08
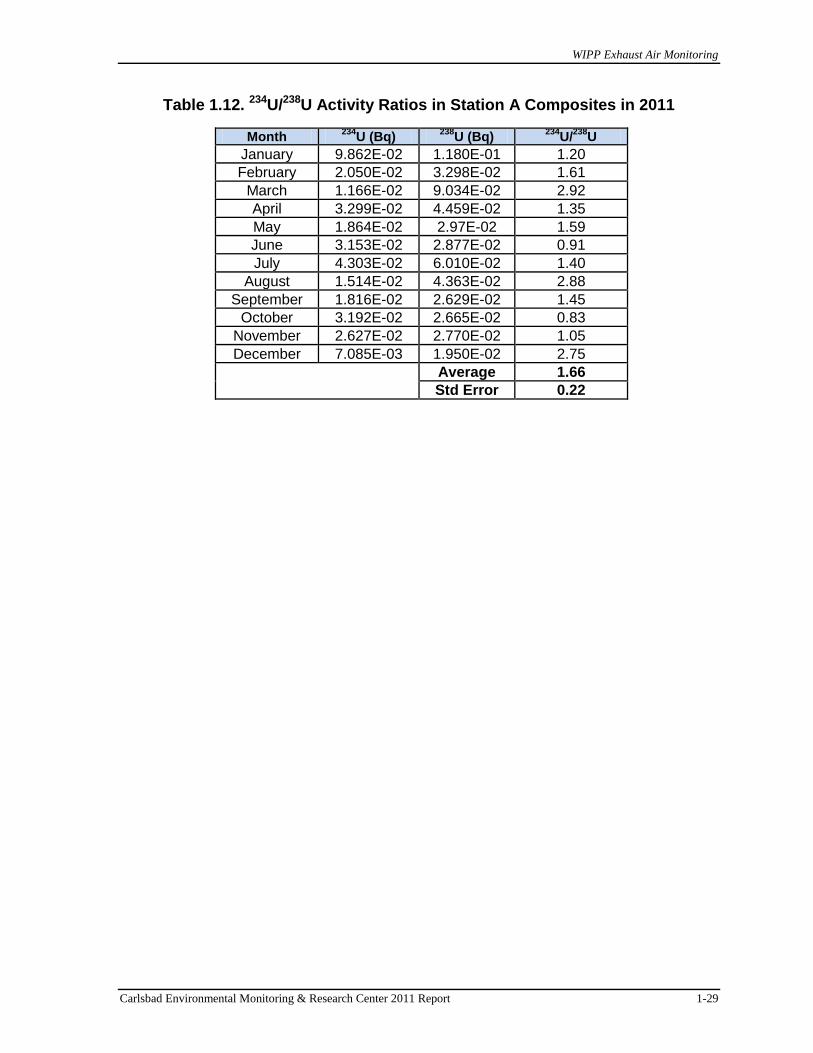
WIPP Exhaust Air Monitoring
Carlsbad Environmental Monitoring & Research Center 2011 Report 1-29
Table 1.12. 234U/238U Activity Ratios in Station A Composites in 2011
Month 234
U (Bq) 238
U (Bq) 234
U/238
U
January 9.862E-02 1.180E-01 1.20
February 2.050E-02 3.298E-02 1.61
March 1.166E-02 9.034E-02 2.92
April 3.299E-02 4.459E-02 1.35
May 1.864E-02 2.97E-02 1.59
June 3.153E-02 2.877E-02 0.91
July 4.303E-02 6.010E-02 1.40
August 1.514E-02 4.363E-02 2.88
September 1.816E-02 2.629E-02 1.45
October 3.192E-02 2.665E-02 0.83
November 2.627E-02 2.770E-02 1.05
December 7.085E-03 1.950E-02 2.75
Average 1.66
Std Error 0.22

WIPP Exhaust Air Monitoring
1-30 Carlsbad Environmental Monitoring & Research Center 2011 Report
Table 1.13. Minimum, Maximum, and Average Radionuclide Concentrations (Bq/m3) in Station A Composites in 2011
Activity Concentration (Bq/m3)
Radionuclides Conc. SD MDC
241Am
Minimum -1.13E-08 1.74E-08 7.03E-08
Maximum 7.50E-08 5.57E-08 2.11E-07
Average 1.98E-08 3.23E-08 1.11E-07
238Pu
Minimum -5.12E-08 1.89E-08 2.95E-08
Maximum 8.17E-08 6.16E-08 2.71E-07
Average 1.81E-08 3.95E-08 1.51E-07
239+240Pu
Minimum -4.07E-08 3.03E-08 1.07E-07
Maximum 1.63E-07 6.93E-08 2.71E-07
Average 5.89E-08 4.70E-08 1.60E-07
234U
Minimum 2.04E-07 6.48E-08 8.13E-08
Maximum 2.90E-06 3.24E-07 4.80E-07
Average 7.02E-07 1.20E-07 2.17E-07
235U
Minimum -1.61E-08 2.39E-08 6.37E-08
Maximum 9.28E-07 3.67E-07 8.53E-07
Average 1.46E-07 8.42E-08 2.45E-07
238U
Minimum 1.22E-07 4.29E-08 3.67E-08
Maximum 2.43E-06 2.97E-07 4.19E-07
Average 5.21E-07 1.03E-07 1.94E-07
137Cs
Minimum -6.75E-05 1.20E-05 4.06E-05
Maximum 1.09E-04 3.45E-05 1.15E-04
Average -5.34E-06 2.10E-05 6.97E-05
134Cs
Minimum -1.00E-04 4.95E-08 1.32E-07
Maximum 1.48E-04 2.46E-05 8.24E-05
Average -3.13E-05 1.34E-05 4.47E-05
60Co
Minimum -4.86E-05 1.79E-05 5.99E-05
Maximum 1.77E-05 3.39E-05 1.13E-04
Average -8.50E-06 2.03E-05 6.75E-05
40K
Minimum -5.00E-04 1.75E-04 5.82E-04
Maximum 2.56E-04 3.48E-04 1.15E-03
Average -8.13E-05 2.07E-04 6.91E-04

WIPP Exhaust Air Monitoring
Carlsbad Environmental Monitoring & Research Center 2011 Report 1-31
Figure 1.23. Concentrations of Al in WIPP Exhaust Air from 1998 - 2011
Figure 1.24. Concentrations of Mg in WIPP Exhaust Air from 1998 - 2011
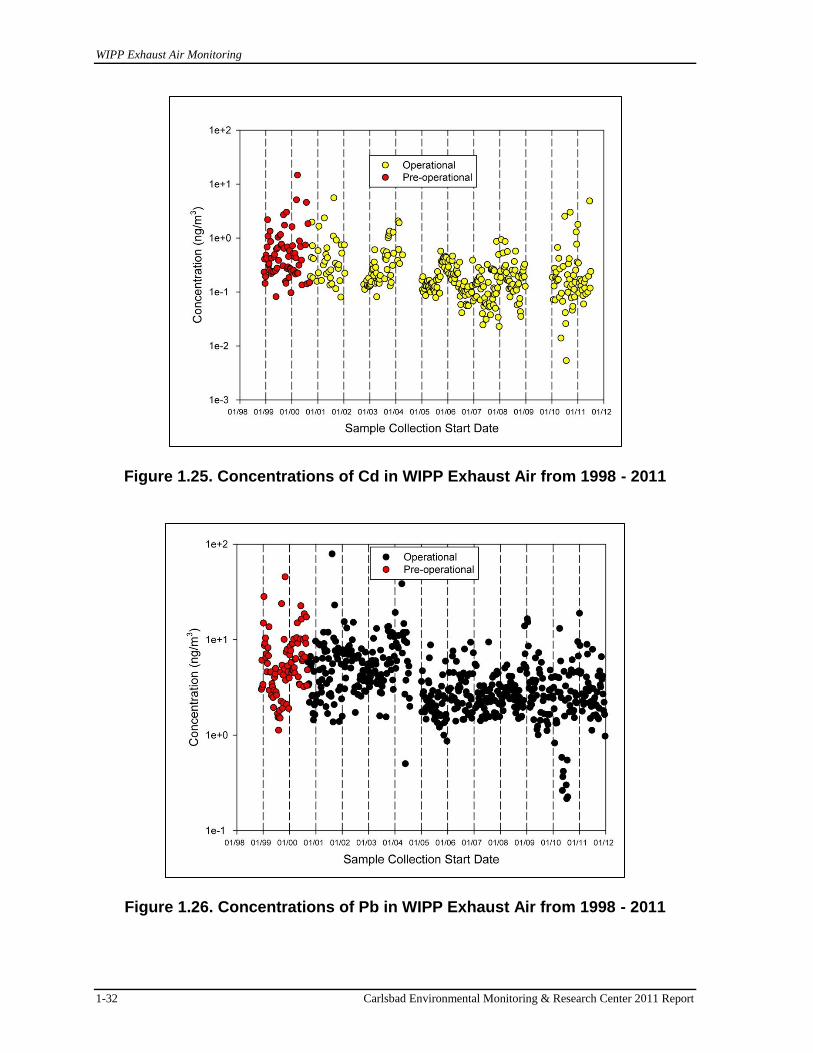
WIPP Exhaust Air Monitoring
1-32 Carlsbad Environmental Monitoring & Research Center 2011 Report
Figure 1.25. Concentrations of Cd in WIPP Exhaust Air from 1998 - 2011
Figure 1.26. Concentrations of Pb in WIPP Exhaust Air from 1998 - 2011

WIPP Exhaust Air Monitoring
Carlsbad Environmental Monitoring & Research Center 2011 Report 1-33
Figure 1.27. Concentrations of Th in WIPP Exhaust Air from 1998 - 2011
Figure 1.28. Concentrations of U in WIPP Exhaust Air from 1998 - 2011

WIPP Exhaust Air Monitoring
1-34 Carlsbad Environmental Monitoring & Research Center 2011 Report
Figure 1.29. Monthly Average Concentrations of Al for 2011
Figure 1.30. Monthly Average Concentrations of Mg for 2011
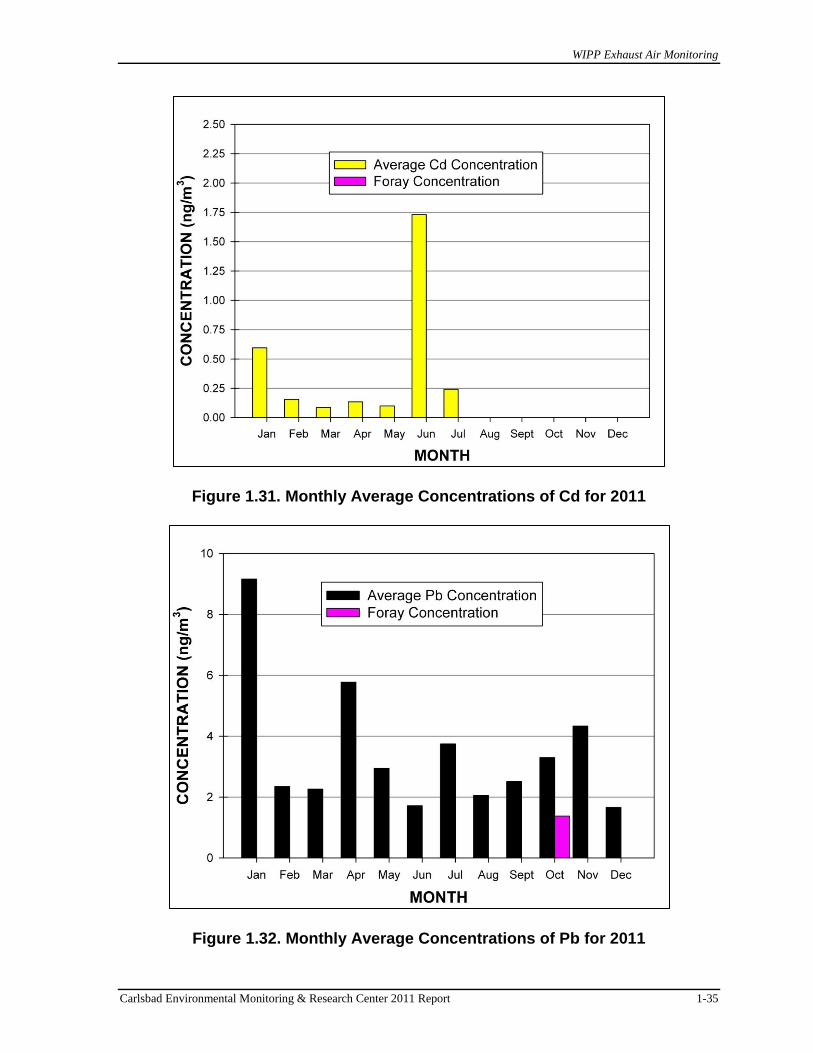
WIPP Exhaust Air Monitoring
Carlsbad Environmental Monitoring & Research Center 2011 Report 1-35
Figure 1.31. Monthly Average Concentrations of Cd for 2011
Figure 1.32. Monthly Average Concentrations of Pb for 2011

WIPP Exhaust Air Monitoring
1-36 Carlsbad Environmental Monitoring & Research Center 2011 Report
Figure 1.33. Monthly Average Concentrations of Th for 2011
Figure 1.34. Monthly Average Concentrations of U for 2011

Monitoring Drinking Water from Selected Sources
Carlsbad Environmental Monitoring & Research Center 2011 Report 2-1
CHAPTER 2
Monitoring Drinking Water from Selected Sources Introduction
Routine testing of public drinking water supplies helps to assure the public that health
and environmental standards are met and seeks to identify any changes in water quality
which might have a negative impact on public health and the environment. During 2011,
water samples were collected for CEMRC environmental monitoring studies from six
drinking water sources in the region of the WIPP including the community water supplies of
Carlsbad, Loving, Otis, Hobbs, and Malaga. The drinking water wells in the vicinity of the
WIPP provide water primarily for livestock, industrial usage by oil and gas production
operations, and monitoring studies conducted by various groups.
Aquifers in the region surrounding the WIPP include Dewey Lake, Culebra-Magenta,
Ogallala, Dockum, Pecos River alluvium, and Capitan Reef. The main Carlsbad water supply
is the Sheep Draw well field whose primary source is the Capitan Reef aquifer. The Hobbs
and WIPP (Double Eagle) water supplies are drawn from the Ogallala aquifer, while the
Loving, Malaga, and Otis supply wells are drawn from deposits that are hydraulically linked
to the flow of the Pecos River. The source for a private well sampling site is a well seven
miles southwest of the WIPP. This water is drawn from the Culebra aquifer, however, this
sampling site has been dry since before 2001.
CEMRC began collecting drinking water samples for radiochemical analyses in 1997
and inorganic analyses on drinking water samples commenced in 1998. The results for the
five drinking water sources from Carlsbad, Loving, Otis, Hobbs, and WIPP (Double Eagle)
have been reported annually since 2001. Drinking water samples were not collected during
2004 and 2006. In addition, this is the first year that drinking water has been sampled from
the site in Malaga. Summaries of methods, data, and results from previous samplings were
reported in earlier CEMRC reports and can be found on the CEMRC website
(www.cemrc.org). Present results as well as the results of previous analyses of drinking water
were consistent for each source across sampling periods, and were below levels specified
under the Safe Drinking Water Act.
Analyses reported herein for are for 2011 drinking water samples. These samples
were analyzed for radionuclides including alpha and gamma emitting radionuclides of
interest to the WIPP. In addition, inorganic studies were performed separately and include
elemental analysis as well as analysis for mercury. The 2011 monitoring results show no
increase in the levels of radionuclides or inorganics that could be attributed to WIPP-
related activities.
Sampling, Sample Preparation, and Measurements
All drinking water samples were processed according to CEMRC protocols for the
collection, handling, and preservation of drinking water. The following samples were taken
from each sampling location: (1) 8L for gamma and alpha analyses, (2) 1L for elemental
Monitoring Drinking Water from Selected Sources
2-2 Carlsbad Environmental Monitoring & Research Center 2011 Report
analyses, (3) 1L for anion tests, and (4) 500mL for mercury analysis. None of the samples
were filtered before analysis. Current methods used for the various analyses are summarized
in Table 2.1. Basic information about contaminants in drinking water is listed in Table 2.2
(US-EPA, 2012).
For radioactive analyses, two aliquots were taken from each 8L sample: (a) 3L for
gamma analyses and (b) 1L for alpha analyses. Both aliquots were acidified to approximately
pH = 2 with nitric acid upon collection to avoid losses through microbial activity and
adsorption onto the vessel walls. The first aliquot was transferred to 3L Marinelli beakers for
the measurement of the gamma-emitting radionuclides potassium (40
K), cobalt (60
Co), and
cesium (137
Cs), by gamma spectroscopy using a high purity germanium (HPGe) detector.
Before collecting the measurements, the gamma system was calibrated for energy and
efficiency to enable both qualitative and quantitative analysis of the water samples. The
energy and efficiency calibrations were carried out using a mixed standards material from
Eckert and Ziegler, Analytics (GA) in the energy range between 60 to 2000keV for a 3L
Marinelli geometry. The counting time for each sample was 48 hours.
The second, 1L aliquot, was used for alpha analysis of uranium (U) and transuranic
radionuclides. Tracers consisting of uranium, americium, and plutonium (232
U, 243
Am, and 242
Pu) were added and the samples were digested using concentrated nitric and hydrochloric
acid. The samples were then heated to dryness and wet-ashed using concentrated nitric and
perchloric acid. Next, the samples were heated to dryness again in preparation for isotopic
separation. The separation process began with co-precipitation of the target isotopes and
corresponding tracers with an iron carrier followed by ion exchange and chromatographic
separations of the individual radionuclides. Finally, the separated radionuclides were micro-
precipitated using lanthanum fluoride (LaF3) and deposited onto planchets for counting
uranium/transuranics by alpha spectroscopy.
For elemental analysis, the 1L samples were preserved in a 1% nitric acid solution
during sample collection. Samples from Otis, Malaga, and Hobbs were diluted using a
similar nitric acid matrix prior to analysis by ICP-MS due to the elevated calcium (Ca) and
sodium (Na) levels in these samples. All other 1L samples were analyzed directly. For
Mercury analysis, the 500mL samples were preserved with a bromomonochloride solution
and analyzed directly by ICP-MS. For each type of inorganic analyses, aliquots were blank-
corrected after the application of dilution factors. As per CEMRC procedure, only
concentrations above laboratory MDC values are reported.
As per CEMRC procedure, each 1L sample used for anion analysis was refrigerated
immediately upon arrival and analyzed within 48 hours of collection. No preservatives were
added to the samples used for anion analysis. At this time the results of the anion analyses are
not currently being reported. However, anion analysis has continued to be performed on all
collected drinking water samples as per the CEMRC procedure.

Monitoring Drinking Water from Selected Sources
Carlsbad Environmental Monitoring & Research Center 2011 Report 2-3
RADIOLOGICAL MONITORING RESULTS
Table 2-3 shows the activity concentrations for radionuclides of 234
U, 235
U, and 238
U; 238
Pu, 239+240
Pu; 241
Am; 137
Cs; 60
Co; and 40
K in regional drinking water samples from 2011.
The alpha radionuclides, 238
Pu, 239+240
Pu, and 241
Am have not been detected in any of the
drinking water samples above the MDC since monitoring commenced in 1997. The federal
and state action level for gross alpha emitters, which includes isotopes of Pu and U, is
15pCi/L (0.56Bq/L). This level is over 10,000 times the MDCs used at CEMRC.
Isotopes of naturally occurring uranium were detected in all the drinking water
samples in 2011 as shown in Table 2-3. Natural uranium is a mixture of three alpha-emitting
isotopes (234
U, 235
U, and 238
U). They have long half-lives, t1/2, that allow them to be
transported to water supplies. The 238
U isotope has a t1/2 of 4.5× 10⁹ years (99.285% natural
abundance), 235
U has a t1/2 of 7.04 × 10⁸ years (0.71% natural abundance), and
234U with a t1/2
of 2.24× 10⁵ years (0.0053% natural abundance; Neghabian et al, 1991). Thus, natural
abundances of isotopes and the half-lives give 12.2, 0.6, and 12.2mBq/ g of natural uranium
for 238
U, 235
U, and 234
U respectively, or 25mBq/ g in total (Hess et al, 1985). Combined,
these isotopes of uranium are found in the earth’s crust with a natural abundance of 4 ×10⁻⁴
%
(Hursh et al, 1973); in rocks and minerals such as granite, metamorphic rocks lignite,
monazite sand; phosphate deposits as well as in uranium minerals such as uraninite, carnotite
and pitchblende. It is also present as a trace element in coal, peat, asphalt and in some
phosphate fertilizers at a level of about 100 g/g or 2.5Bq/g (Hess et al, 1985). All these
sources can come in contact with water which influences the amount of natural uranium
present in our drinking water. The natural level of uranium in water can also be enhanced due
to human activity. For example, the increased concentration of natural radionuclides in water
can be caused by the intensive use of phosphate fertilizers in agriculture. Phosphate fertilizers
contain uranium which can leach from the soil to nearby rivers and lakes (Fleischer, 1980;
UNSCEAR, 1982).
Measured values for the drinking water samples collected around the WIPP site
during 2011 ranged between 10.9-239mBq/L for 238
U, 1.22-39.0mBq/L for 235
U, and 25.3-
154mBq/L for 234
U. The average activity concentrations of 234
U, 235
U, and 238
U in drinking
water from the five sources are presented in Figure 2.1. These uranium concentrations are
well below the reference concentration level for radiological protection, i.e. 3.0Bq/L. They
are also below the EPA Action level of 0.56 Bq/L and within the range expected in waters
from this region. The greatest variations appear in the amounts of 235
U. The low
concentration of 235
U in the water samples is consistent with the lower concentration of 235
U
in the natural environment as compared to the concentrations of 234
U and 238
U. The highest
activity concentrations were found in Otis water. Figure 2.2 shows the total uranium
concentration at each location.
It has been reported that the activity of natural water from 234
U is higher than that of 238
U. The 234
U/238
U activity ratio usually ranges between 1.0 and 3.0 (Cherdynstev et al,
1971; Gilkeson et al, 1982). According to the most recent reports, the fixed mass ratio and
fixed activity ratios are still used for reporting the activity of natural uranium. The isotopic
composition of natural uranium activities are 48.9, 2.2, and 48.9 %, respectively (IAEA,
1989). In radiochemical equilibrium, natural activity ratios are typically unity for 234
U/238
U
Monitoring Drinking Water from Selected Sources
2-4 Carlsbad Environmental Monitoring & Research Center 2011 Report
and 0.045 for 235
U/238
U (Pimple et al, 1992). However, many studies looking at 238
U and 234
U
in natural bodies of water indicate that these isotopes do not occur in equilibrium and that,
with a few exceptions, waters typically contain more 234
U than 238
U (Cothern et al, 1983;
Skwarzec et al, 2002). Higher activity of 234
U in water is the result of the 234
U atom
displacement from the crystal lattice. The recoil atom, 234
U, is liable to be oxidized to the
hexavalent stage and can be leached into the water phase more easily than its parent nuclide 238
U. The oxidation of U(IV) to U(VI) is an important step in leaching, because compounds
containing U(VI) have a higher solubility due to the formation of strong complexes between
uranyl and carbonate ions (UNSCEAR, 1977). All U(IV) compounds of uranium are
practically insoluble.
The average activity ratio of 235
U and 238
U in the water samples collected around the
WIPP site ranged from 0.036-0.072 (Average = 0.054) which is close to the value 0.045 for
uranium reported in nature. The 235
U/238
U ratio in environmental samples differing from the
natural ratio results from anthropogenic nuclear activities. Figure 2.3 shows the average 234
U/238
U ratios. The results of the activity ratios in this study compared very well with data
observed in other countries as shown in Table 2.4. The calculated 234
U/238
U activity ratio
varies between 2.33 to 2.96 which means that two isotopes are not in radioactive equilibrium.
The historical activity concentrations of 234
U, 235
U and 238
U measured at well sites in the
region of the WIPP site are summarized in Tables 2.5 to 2.9. The historical concentrations of
transuranic elements like Plutonium and Americium, (238
Pu, 239+240
Pu, and 241
Am) are shown
in Figures 2.4 through 2.11.
It is important to note that after more than ten years of monitoring, isotopes of 238
Pu, 239+240
Pu, and 241
Am have never been detected above MDC in any of the samples collected
from well sites around the WIPP site. However, the levels of uranium detected in regional
drinking water are very low and the activity ratio indicates its presence in drinking water is
most likely from natural sources. For most people in the world, the intake of uranium through
food is around 1 g/day. The worldwide average of dietary uranium is estimated at 1.3 g/day
from which the portion from drinking water is 0.2 g/day (UNSCEAR, 2001). Thus drinking
water is not usually the main source of ingested uranium.
NON-RADIOLOGICAL MONITORING RESULTS
The CEMRC analyzes samples from the six regional drinking water sources for over
30 different inorganic elements. The results are summarized in Tables 2.10 through 2.15.
MDC values are determined annually and are reported as described in the current CEMRC
procedure. The results exhibited in these Tables are not used in assessing regulatory
compliance. However, the CEMRC results for drinking water from the Carlsbad (Sheep
Draw) and WIPP (Double Eagle) locations agree well with measurements for the same
elements published by the City of Carlsbad (City of Carlsbad Municipal Water System,
2011).
The 2011 inorganic drinking water measurements exhibit a high level of consistency
with past results providing a useful characterization of each source. Figures 2.12 through
2.16 compare the history of select inorganic analytes measured in drinking water collected

Monitoring Drinking Water from Selected Sources
Carlsbad Environmental Monitoring & Research Center 2011 Report 2-5
from the surrounding area of WIPP including Carlsbad (Sheep Draw), WIPP (Double Eagle),
Loving, Hobbs, and Otis. Only the selected inorganics (listed in Table 2.2) which have been
detected regularly above MDCs are shown in these figures. Historical comparisons show that
differences of a factor of two or three between one set of successive years is common, as it is
for all natural water systems. Additionally, there has been no noticeable increase in the
inorganic levels found in the regional drinking water after the WIPP site started accepting
mixed waste in August of 2000. It should be noted that drinking water sampling did not take
place during the 2004 and 2006 years due to a change in sampling frequency.
Minerals are a natural part of all water sources. The amount of inorganic materials in
drinking water is determined primarily by local geology and topography, but it can be
influenced by urban storm water runoff, industrial or domestic wastewater discharges, oil and
gas production, mining, and/or farming, etc. The city of Andrews, TX, has naturally
occurring levels of Arsenic and Fluoride in their drinking water (City of Andrews, 2011).
The drinking water from this part of TX is supplied from the Ogallala and Dockum
formations which are also accessed by the WIPP (Double Eagle) and Hobbs communities.
Indeed the concentrations of Arsenic measured at the Double Eagle and Hobbs sites are
higher than the drinking water for other sampling locations around the WIPP site (most of
which have concentrations below MDC) as shown in Figure 2.17. However, the levels
determined for Double Eagle and Hobbs are still below the EPA limit of 10μg/L (0.01mg/L)
for Arsenic as listed in Table 2.2. Figure 2.17 also includes comparisons of selected analytes
which were measured above the corresponding MDC.
The WIPP site is located in the Delaware Basin of New Mexico, the second largest
region of the greater Permian Basin. This 600-meter deep salt basin was formed during the
Permian Era approximately 250 million years ago when an ancient Sea once covering the
area evaporated and left behind a nearly impermeable layer of salt. Over time this salt layer
was covered by 300 meters of soil and rock (Kerr, 1999; Weeks, 2011). The Permian Basin is
now a major source of potassium salts (potash), which are mined from bedded deposits of
sylvite and langbeinite (Alto, 1965). Sylvite is potassium chloride (KCl) in its natural mineral
form while langbeinite is a potassium magnesium sulfate mineral (K2Mg2(SO4)3).
Langbeinite ore occurs in evaporated marine deposits in association with carnallite, halite
and sylvite (Mereiter, 1979; NBS Mono 1968; Palache, 1951;). Therefore, it is to be expected
that through leaching and other natural processes, the water in this region should contain
significant quantities of potassium (K), magnesium (Mg) and, of course, sodium (Na). Figure
2.18 summarizes the concentrations of common salts measured in the areas surrounding the
WIPP site. Currently there are no EPA regulations for salts like K, Mg, and Na in drinking
water.
The highest concentration of the measured metals found in the drinking water of this
area is Calcium (Ca) for each of the sites sampled around the WIPP (Figure 2.18). This is
likely due to the natural limestone deposits found along the edge of the Delaware Basin
which once existed as the Capitan Reef during the Permian Era. Limestone is a sedimentary
rock composed largely of the minerals calcite and aragonite, which are different crystal forms
of calcium carbonate (CaCO3). Limestone leaching creates the stalactites and stalagmites
found in the infamous Carlsbad Caverns, located approximately 18 miles southwest of
Carlsbad, NM and a likely source of Calcium (Ca) in the drinking water in the area.
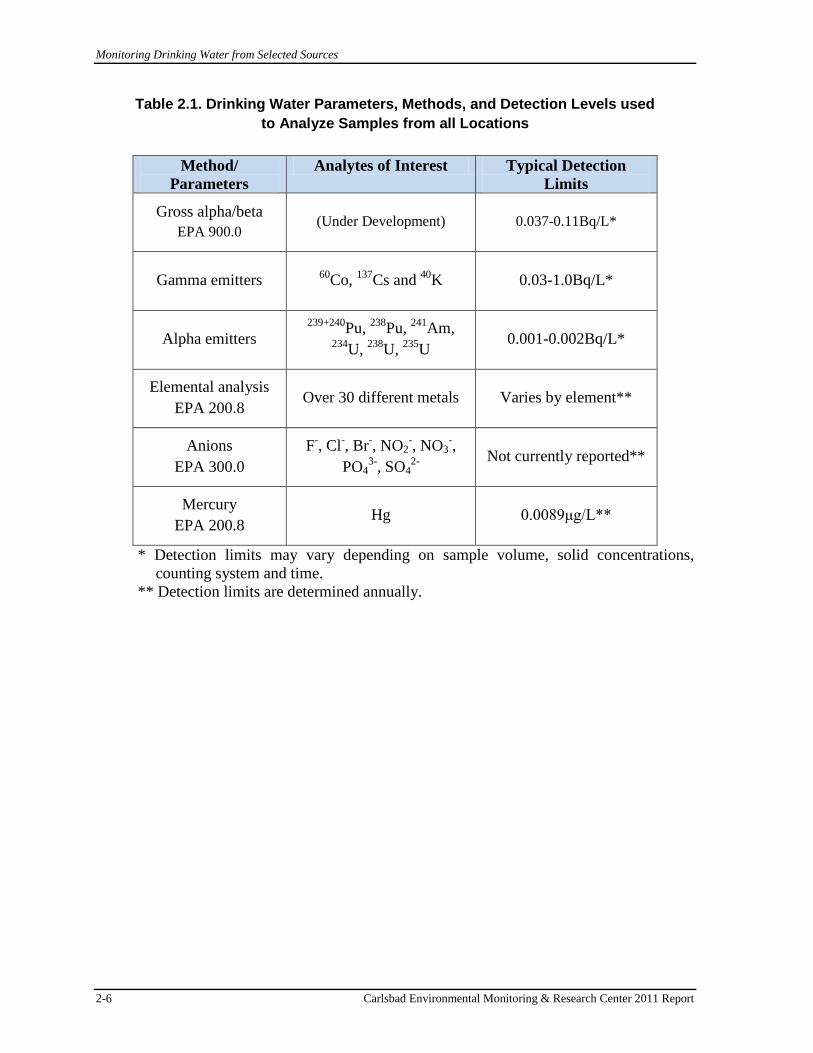
Monitoring Drinking Water from Selected Sources
2-6 Carlsbad Environmental Monitoring & Research Center 2011 Report
Table 2.1. Drinking Water Parameters, Methods, and Detection Levels used
to Analyze Samples from all Locations
Method/
Parameters
Analytes of Interest Typical Detection
Limits
Gross alpha/beta
EPA 900.0 (Under Development) 0.037-0.11Bq/L*
Gamma emitters 60
Co, 137
Cs and 40
K
0.03-1.0Bq/L*
Alpha emitters 239+240
Pu, 238
Pu, 241
Am, 234
U, 238
U, 235
U 0.001-0.002Bq/L*
Elemental analysis
EPA 200.8 Over 30 different metals Varies by element**
Anions
EPA 300.0
F-, Cl
-, Br
-, NO2
-, NO3
-,
PO43-
, SO42-
Not currently reported**
Mercury
EPA 200.8 Hg 0.0089μg/L**
* Detection limits may vary depending on sample volume, solid concentrations,
counting system and time.
** Detection limits are determined annually.
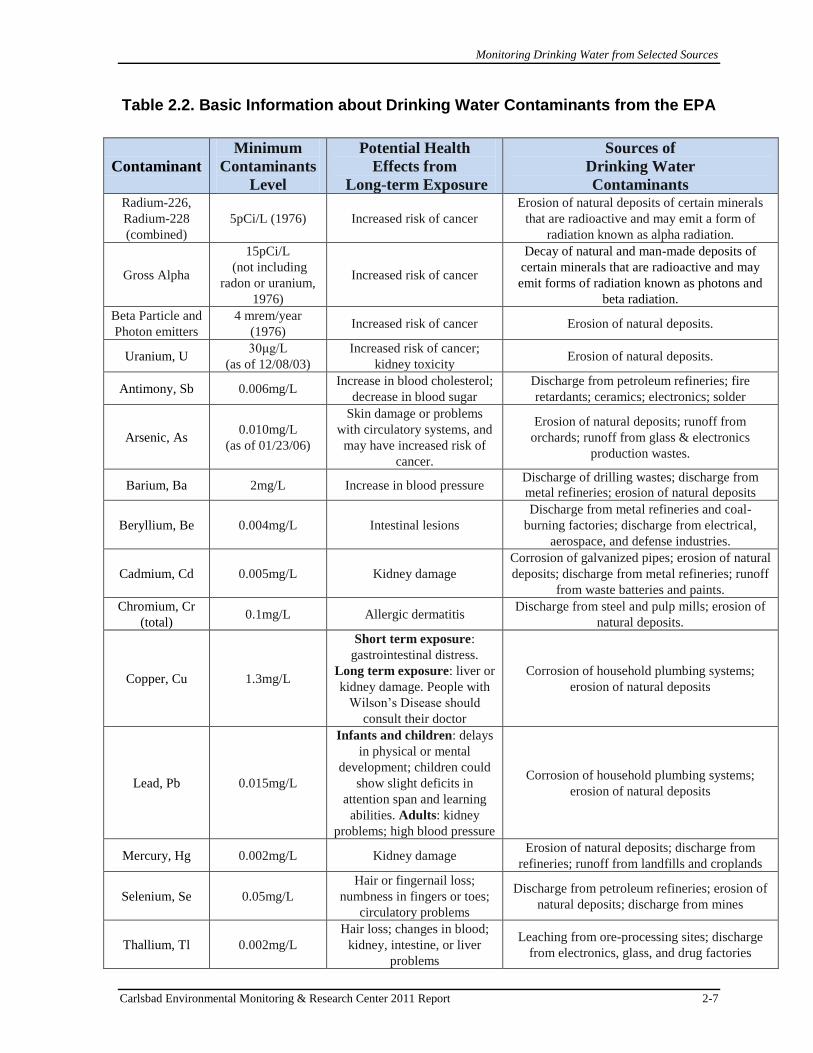
Monitoring Drinking Water from Selected Sources
Carlsbad Environmental Monitoring & Research Center 2011 Report 2-7
Table 2.2. Basic Information about Drinking Water Contaminants from the EPA
Contaminant
Minimum
Contaminants
Level
Potential Health
Effects from
Long-term Exposure
Sources of
Drinking Water
Contaminants Radium-226,
Radium-228
(combined)
5pCi/L (1976) Increased risk of cancer
Erosion of natural deposits of certain minerals
that are radioactive and may emit a form of
radiation known as alpha radiation.
Gross Alpha
15pCi/L
(not including
radon or uranium,
1976)
Increased risk of cancer
Decay of natural and man-made deposits of
certain minerals that are radioactive and may
emit forms of radiation known as photons and
beta radiation.
Beta Particle and
Photon emitters
4 mrem/year
(1976) Increased risk of cancer Erosion of natural deposits.
Uranium, U 30μg/L
(as of 12/08/03)
Increased risk of cancer;
kidney toxicity Erosion of natural deposits.
Antimony, Sb 0.006mg/L Increase in blood cholesterol;
decrease in blood sugar
Discharge from petroleum refineries; fire
retardants; ceramics; electronics; solder
Arsenic, As 0.010mg/L
(as of 01/23/06)
Skin damage or problems
with circulatory systems, and
may have increased risk of
cancer.
Erosion of natural deposits; runoff from
orchards; runoff from glass & electronics
production wastes.
Barium, Ba 2mg/L Increase in blood pressure Discharge of drilling wastes; discharge from
metal refineries; erosion of natural deposits
Beryllium, Be 0.004mg/L Intestinal lesions
Discharge from metal refineries and coal-
burning factories; discharge from electrical,
aerospace, and defense industries.
Cadmium, Cd 0.005mg/L Kidney damage
Corrosion of galvanized pipes; erosion of natural
deposits; discharge from metal refineries; runoff
from waste batteries and paints.
Chromium, Cr
(total) 0.1mg/L Allergic dermatitis
Discharge from steel and pulp mills; erosion of
natural deposits.
Copper, Cu 1.3mg/L
Short term exposure:
gastrointestinal distress.
Long term exposure: liver or
kidney damage. People with
Wilson’s Disease should
consult their doctor
Corrosion of household plumbing systems;
erosion of natural deposits
Lead, Pb 0.015mg/L
Infants and children: delays
in physical or mental
development; children could
show slight deficits in
attention span and learning
abilities. Adults: kidney
problems; high blood pressure
Corrosion of household plumbing systems;
erosion of natural deposits
Mercury, Hg 0.002mg/L Kidney damage Erosion of natural deposits; discharge from
refineries; runoff from landfills and croplands
Selenium, Se 0.05mg/L
Hair or fingernail loss;
numbness in fingers or toes;
circulatory problems
Discharge from petroleum refineries; erosion of
natural deposits; discharge from mines
Thallium, Tl 0.002mg/L
Hair loss; changes in blood;
kidney, intestine, or liver
problems
Leaching from ore-processing sites; discharge
from electronics, glass, and drug factories

Monitoring Drinking Water from Selected Sources
2-8 Carlsbad Environmental Monitoring & Research Center 2011 Report
Table 2.3. Radionuclide Activity Concentrations in Drinking Water in 2011
Location/sample
collection date
Radionuclide Activitya
Bq/L
SDb
(Bq/L)
MDCc
(Bq/L)
Carlsbad
07/11/2011
239+240Pu 0.00E+00 1.05E-05 4.60E-05
238Pu 0.00E+00 1.21E-05 5.14E-05
241Am 2.05E-05 1.66E-05 5.30E-05
234U 2.83E-02 7.13E-04 8.42E-05
235U 7.83E-03 8.27E-04 7.49E-04
238U 1.09E-02 3.40E-04 7.81E-05
137Cs 8.63E-03 3.66E-02 1.21E-01
40K
1.34E-01 3.58E-01 1.19E+00
60Co
7.93E-03 1.70E-02 7.88E-02
Hobbs
07/13/2011
239+240Pu 3.18E-06 9.79E-06 4.14E-05
238Pu -4.27E-06 1.13E-05 5.13E-05
241Am 3.50E-07 9.24E-06 3.50E-05
234U 1.04E-01 3.01E-03 2.65E-04
235U 2.60E-03 2.44E-04 2.59E-04
238U 4.50E-02 1.45E-03 2.64E-04
137Cs 4.99E-03 3.65E-02 1.21E-01
40K
1.19E-02 3.62E-01 1.20E+00
60Co
-9.76E-03 1.76E-02 8.25E-02
Double Eagle
07/13/2011
239+240Pu 1.30E-05 1.30E-05 4.67E-05
238Pu -8.62E-06 1.37E-05 6.12E-05
241Am -8.38E-06 1.15E-05 5.05E-05
234U 4.80E-02 8.52E-04 7.26E-05
235U 1.12E-03 8.45E-05 5.57E-05
238U 1.86E-02 4.06E-04 8.75E-05
137Cs 4.80E-02 8.52E-04 7.26E-05
40K
1.12E-03 8.45E-05 5.57E-05
60Co
1.86E-02 4.06E-04 8.75E-05
Otis
07/11/2011
239+240Pu 2.93E-05 1.49E-05 4.34E-05
238Pu 1.76E-05 1.39E-05 4.75E-05
241Am 5.13E-06 1.10E-05 3.84E-05
234U 1.54E-01 2.77E-03 1.45E-04
235U 1.19E-02 6.48E-04 2.94E-04
238U 2.39E-01 4.85E-03 5.81E-04
137Cs -1.45E-02 3.66E-02 1.22E-01
40K
6.90E-01 3.52E-01 1.15E+00
60Co
-7.77E-03 1.70E-02 7.97E-02
* Values are overestimated because of poor separation. a Activity concentration as defined in CEMRC Report 1997 b SD = Standard Deviation as defined in CEMRC Report 1997 c MDC = Minimum Detectable Concentration as defined in CEMRC Report 1997

Monitoring Drinking Water from Selected Sources
Carlsbad Environmental Monitoring & Research Center 2011 Report 2-9
Table 2.3. Radionuclide Activity Concentrations in Drinking Water in 2011
(continued)
Location/sample
collection date
Radionuclide Activitya
Bq/L
SDb
(Bq/L)
MDCc
(Bq/L)
Loving
07/11/2011
239+240Pu 3.00E-05 1.29E-05 3.16E-05
238Pu 6.90E-06 1.08E-05 4.25E-05
241Am -1.86E-05 9.63E-06 5.04E-05
234U 7.64E-02 1.12E-03 4.14E-05
235U 2.04E-02* 1.29E-03 5.66E-04
238U 2.57E-02 4.56E-04 7.22E-05
137Cs -1.21E-03 3.66E-02 1.21E-01
40K
2.53E-01 3.65E-01 1.21E+00
60Co
-7.79E-03 1.72E-02 8.02E-02
Loving (DUP)
07/11/2011
239+240Pu 1.35E-05 1.35E-05 4.83E-05
238Pu 8.91E-06 1.27E-05 4.83E-05
241Am 5.52E-06 1.12E-05 3.93E-05
234U 7.50E-02 1.53E-03 1.13E-04
235U 3.90E-02* 2.62E-03 1.49E-03
238U 1.09E-01 2.72E-03 7.57E-04
137Cs -7.35E-03 3.65E-02 1.21E-01
40K
4.05E-01 3.58E-01 1.18E+00
60Co
4.70E-02 1.63E-02 7.37E-02
Malaga 07/12/2011
239+240Pu 8.75E-06 1.64E-05 6.17E-05
238Pu -2.51E-06 1.55E-05 6.40E-05
241Am 8.77E-06 1.27E-05 4.32E-05
234U 1.38E-01 2.92E-03 9.02E-05
235U 2.56E-03 1.75E-04 1.47E-04
238U 5.34E-02 1.25E-03 1.33E-04
137Cs -3.32E-02 3.68E-02 1.22E-01
40K
4.38E-01 3.51E-01 1.16E+00
60Co
8.62E-03 1.76E-02 8.01E-02
* Values are overestimated because of poor separation. a Activity concentration as defined in CEMRC Report 1997 b SD = Standard Deviation as defined in CEMRC Report 1997 c MDC = Minimum Detectable Concentration as defined in CEMRC Report 1997
Dup = duplicate

Monitoring Drinking Water from Selected Sources
2-10 Carlsbad Environmental Monitoring & Research Center 2011 Report
Figure 2.1. Average 234U, 235U, and 238U concentrations (Bq/L) in Regional Drinking Water
Figure 2.2. Total Uranium Concentrations in Bq/L in Regional Drinking Water Collected in 2011

Monitoring Drinking Water from Selected Sources
Carlsbad Environmental Monitoring & Research Center 2011 Report 2-11
Figure 2.3. Average 234U/238U Activity Ratio in Regional Drinking Water from 1998 - 2011

Monitoring Drinking Water from Selected Sources
2-12 Carlsbad Environmental Monitoring & Research Center 2011 Report
Table 2.4. Comparison of Activity Concentration Ratios of 234U/238U and 235U/238U in Water Samples Collected Near the WIPP Site with Other Countries
Source of water
sample
Type of water 234
U/238
U 235
U/238
U Reference
Carlsbad Drinking water 2.56 0.072 Present work
Double Eagle Drinking water 2.46 0.060 Present work
Hobbs Drinking water 2.33 0.058 Present work
Otis Drinking water 2.58 0.050 Present work
Loving Drinking water 2.96 0.036 Present work
Malaga Drinking water 2.58 0.048 Present work
UK Water 1.0-3.0 - Gilkeson et al.
Poland Mineral water 0.82-1.12 - Nguyen et al.
India Sea water 1.11-1.14 0.045-0.047 Joshi et al.
Ghana, Obuasi Ground water 1.07-1.44 0.042-0.045 Awudu et al.
Ghana, Obuasi Surface water 1.06-1.76 0.044-0.045 Awudu et al.
Ghana, Obuasi Tap water 1.06-1.73 0.044-0.045 Awudu et al.
INL, Idaho Ground water 1.5-3.1 - Roback et al.
Tunisia Mineral water 1.16-2.46 - Gharbi et al.
Table 2.5. Historical Activity Concentrations of 234U, 235U and 238U (Bq/L)
measured in Carlsbad Drinking Water
Year 234
U 235
U 238
U
1998 3.34E-02 7.52E-04 1.35E-02
1999 2.94E-02 6.99E-04 1.14E-02
2000 2.81E-02 8.12E-04 1.08E-02
2001 3.15E-02 9.68E-04 1.21E-02
2002 3.02E-02 7.97E-04 1.26E-02
2003 2.90E-02 5.52E-04 1.05E-02
2005 2.75E-02 1.54E-03 1.11E-02
2007 NR NR NR
2008 7.73E-02 3.09E-03 3.18E-02
2009 2.48E-02 3.57E-04 9.24E-03
2010 2.99E-02 5.64E-04 1.17E-02
2011 2.83E-02 7.83E-03 1.09E-02
NR = not reported
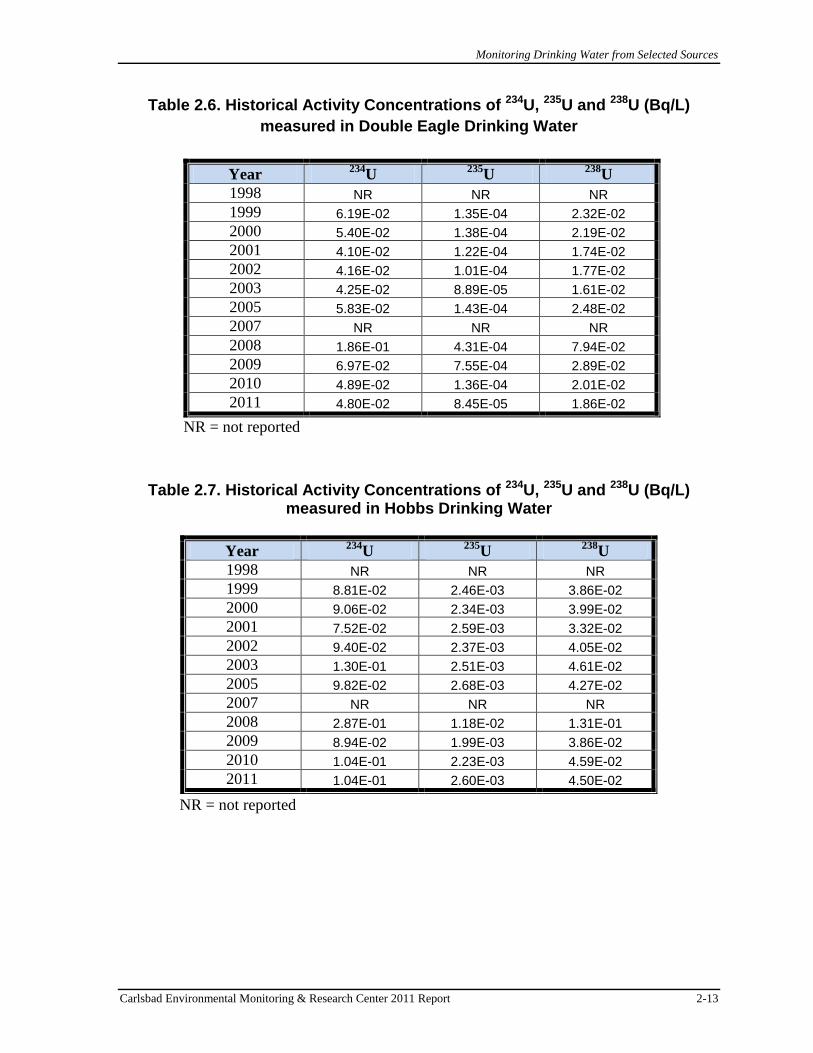
Monitoring Drinking Water from Selected Sources
Carlsbad Environmental Monitoring & Research Center 2011 Report 2-13
Table 2.6. Historical Activity Concentrations of 234U, 235U and 238U (Bq/L)
measured in Double Eagle Drinking Water
Year 234
U 235
U 238
U
1998 NR NR NR
1999 6.19E-02 1.35E-04 2.32E-02
2000 5.40E-02 1.38E-04 2.19E-02
2001 4.10E-02 1.22E-04 1.74E-02
2002 4.16E-02 1.01E-04 1.77E-02
2003 4.25E-02 8.89E-05 1.61E-02
2005 5.83E-02 1.43E-04 2.48E-02
2007 NR NR NR
2008 1.86E-01 4.31E-04 7.94E-02
2009 6.97E-02 7.55E-04 2.89E-02
2010 4.89E-02 1.36E-04 2.01E-02
2011 4.80E-02 8.45E-05 1.86E-02
NR = not reported
Table 2.7. Historical Activity Concentrations of 234U, 235U and 238U (Bq/L) measured in Hobbs Drinking Water
NR = not reported
Year 234
U 235
U 238
U
1998 NR NR NR
1999 8.81E-02 2.46E-03 3.86E-02
2000 9.06E-02 2.34E-03 3.99E-02
2001 7.52E-02 2.59E-03 3.32E-02
2002 9.40E-02 2.37E-03 4.05E-02
2003 1.30E-01 2.51E-03 4.61E-02
2005 9.82E-02 2.68E-03 4.27E-02
2007 NR NR NR
2008 2.87E-01 1.18E-02 1.31E-01
2009 8.94E-02 1.99E-03 3.86E-02
2010 1.04E-01 2.23E-03 4.59E-02
2011 1.04E-01 2.60E-03 4.50E-02

Monitoring Drinking Water from Selected Sources
2-14 Carlsbad Environmental Monitoring & Research Center 2011 Report
Table 2.8. Historical Activity Concentrations of 234U, 235U and 238U (Bq/L)
measured in Otis Drinking Water
Year 234
U 235
U 238
U
1998 1.29E-01 2.73E-03 4.67E-02
1999 1.50E-01 2.85E-03 5.30E-02
2000 1.44E-01 2.97E-03 5.16E-02
2001 1.62E-01 3.30E-03 6.01E-02
2002 1.47E-01 3.34E-03 5.34E-02
2003 1.34E-01 2.56E-03 4.81E-02
2005 1.17E-01 2.60E-03 4.36E-02
2007 NR NR NR
2008 3.89E-01 1.35E-02 1.53E-01
2009 1.47E-01 3.80E-03 5.35E-02
2010 1.54E-01 2.66E-03 5.41E-02
2011 1.54E-01 1.19E-02 2.39E-01
NR = not reported
Table 2.9. Historical Activity Concentrations of 234U, 235U and 238U (Bq/L) measured in Loving Drinking Water
Year 234
U 235
U 238
U
1998 NR NR NR
1999 8.15E-02 1.66E-03 2.63E-02
2000 8.38E-02 1.63E-03 2.59E-02
2001 8.05E-02 1.61E-03 2.48E-02
2002 8.82E-02 1.63E-03 2.83E-02
2003 7.91E-02 1.35E-03 2.40E-02
2005 8.13E-02 1.42E-03 2.64E-02
2007 NR NR NR
2008 2.56E-01 5.15E-03 7.71E-02
2009 7.42E-02 1.26E-03 2.22E-02
2010 8.00E-02 1.20E-03 2.49E-02
2011 7.50E-02 3.90E-02 2.57E-02
NR = not reported

Monitoring Drinking Water from Selected Sources
Carlsbad Environmental Monitoring & Research Center 2011 Report 2-15
Figure 2.4. 239+240Pu in Carlsbad Drinking Water from 1998-2011
Figure 2.5. 238Pu in Carlsbad Drinking Water from 1998-2011
EPA action level for all alpha emitters is 15pCi/L (0.56 Bq/L)

Monitoring Drinking Water from Selected Sources
2-16 Carlsbad Environmental Monitoring & Research Center 2011 Report
Figure 2.6. 241Am in Carlsbad Drinking Water from 1998-2011
EPA action level for all alpha emitters is 15pCi/L (0.56 Bq/L)
Figure 2.7. 239+240Pu in Hobbs Drinking Water from 1998-2011
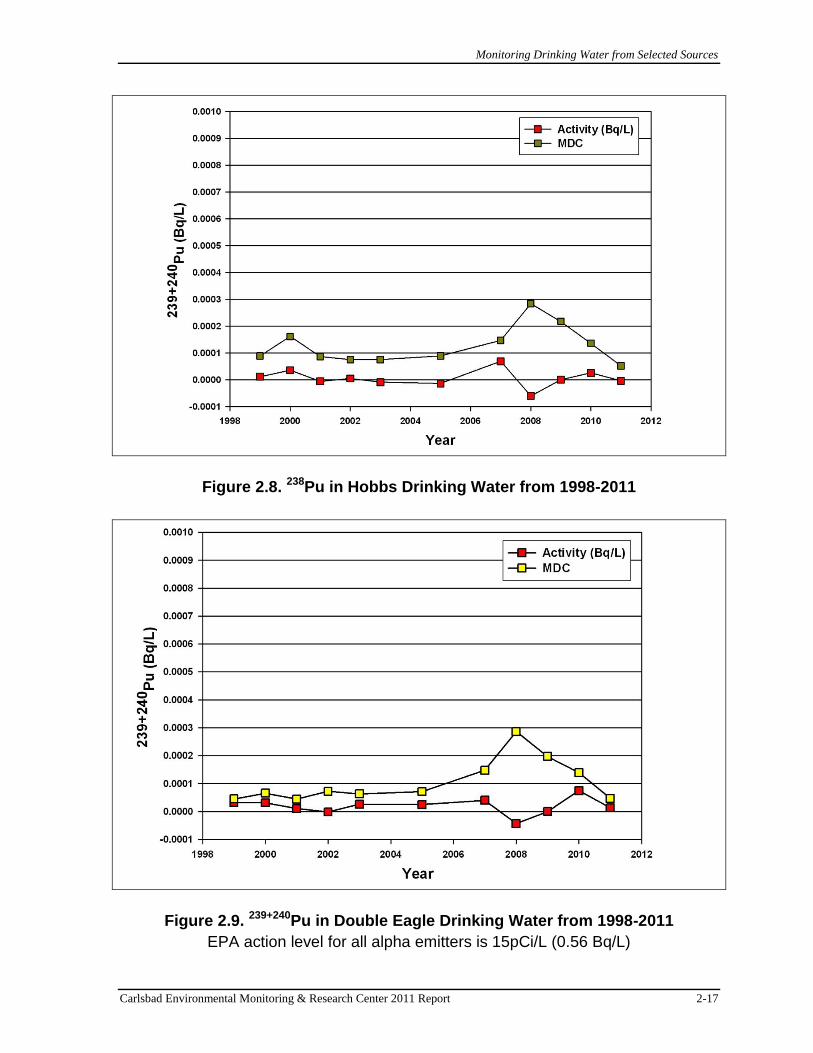
Monitoring Drinking Water from Selected Sources
Carlsbad Environmental Monitoring & Research Center 2011 Report 2-17
Figure 2.8. 238Pu in Hobbs Drinking Water from 1998-2011
Figure 2.9. 239+240Pu in Double Eagle Drinking Water from 1998-2011
EPA action level for all alpha emitters is 15pCi/L (0.56 Bq/L)

Monitoring Drinking Water from Selected Sources
2-18 Carlsbad Environmental Monitoring & Research Center 2011 Report
Figure 2.10. 239+240Pu in Loving Drinking Water from 1998-2011
Figure 2.11. 241Am in Otis Drinking Water from 1998-2011

Monitoring Drinking Water from Selected Sources
Carlsbad Environmental Monitoring & Research Center 2011 Report 2-19
Table 2.10. Measured Concentration of Selected Inorganic Analytes in Carlsbad Drinking Water from 1998 - 2011
Carlsbad 1998-2010 2011
EL1 N2 NDET2 Min3 Max3
MDC4
(µg/L)
Blank Conc.
(µg/L)
Sample Conc.
(µg/L)5
Ag 9 1 1.75E-02 1.75E-02 3.10E-03 3.85E-03 <MDC
Al 11 4 2.34E+00 4.11E+01 9.80E-01 2.24E-01 1.83E+00
As 11 8 2.94E-01 1.42E+00 1.30E+00 5.57E-01 <MDC
B 3 3 2.89E+01 4.44E+01 N/A N/A N/A
Ba 9 9 6.64E+01 8.19E+01 3.20E-02 3.72E-03 7.26E+01
Be 9 N/A N/A N/A 5.00E-02 -2.82E-02 <MDC
Ca 5 5 6.54E+04 7.26E+04 3.17E+02 -3.39E+01 5.90E+04
Cd 9 N/A N/A N/A 2.80E-01 -1.82E-01 <MDC
Ce 9 2 8.31E-03 3.42E-02 8.10E-03 7.40E-05 <MDC
Co 11 7 8.80E-02 3.41E-01 4.50E-03 -1.99E-04 1.04E-01
Cr 11 8 1.24E+00 6.96E+00 1.60E-01 5.29E-02 2.11E+00
Cu 11 9 1.30E+00 1.67E+01 5.80E-01 5.56E-03 5.21E+00
Dy 10 N/A N/A N/A 1.70E-03 8.35E-04 3.56E-03
Er 10 1 3.38E-03 3.38E-03 3.20E-03 1.63E-04 3.32E-03
Eu 9 5 1.35E-02 2.42E-02 3.10E-03 9.45E-04 1.90E-02
Fe 7 3 7.10E-01 2.24E+02 1.01E+01 5.19E+00 2.02E+02
Ga 1 1 3.25E+00 3.25E+00 N/A N/A N/A
Gd 8 N/A N/A N/A 2.40E-03 1.20E-03 3.80E-03
Hg 3 N/A N/A N/A 8.90E-03 1.04E-02 <MDC
K 9 9 1.04E+03 3.56E+03 1.62E+01 1.75E+01 1.32E+03
La 9 4 8.45E-03 4.42E-02 3.90E-03 9.23E-04 5.81E-03
Li 7 7 5.14E+00 7.87E+00 4.90E-02 3.58E-02 8.86E+00
Mg 8 8 3.14E+04 3.47E+04 7.30E+00 4.93E-02 2.73E+04
Mn 11 7 5.50E-02 2.04E+00 1.20E-01 4.44E-03 2.58E-01
Mo 9 8 7.03E-01 1.22E+00 N/A N/A N/A
Na 10 10 8.16E+03 9.94E+04 3.57E+01 2.67E-01 2.03E+04
Nd 10 N/A N/A N/A 8.40E-03 6.85E-04 <MDC
Ni 11 9 1.01E+00 3.14E+00 1.20E-01 -1.26E-03 2.69E+00
P 3 2 1.61E+01 2.29E+01 6.30E+00 -2.05E+00 1.87E+01
Pb 10 7 1.68E-01 1.44E+00 1.20E-01 1.41E-04 2.63E-01
Pr 10 N/A N/A N/A 2.30E-03 2.10E-04 3.72E-03
Sb 10 4 3.00E-02 1.99E-01 1.30E-02 1.15E-02 3.66E-02
Sc 8 7 1.32E+00 3.03E+00 N/A N/A N/A
Se 8 6 -8.83E-02 1.22E+00 4.10E+00 1.73E+00 <MDC
Si 6 6 5.31E+03 6.87E+03 7.10E+00 -4.69E+00 6.51E+03
Sr 10 10 2.61E+02 4.59E+02 1.30E+00 2.94E-03 3.60E+02
Th 8 1 1.76E-02 1.76E-02 3.20E-03 1.42E-03 6.32E-03
Tl 9 9 8.97E-02 1.62E-01 2.50E-03 -4.84E-04 1.13E-01
U 10 10 8.21E-01 1.05E+00 2.20E-03 1.69E-04 9.23E-01
V 11 11 3.54E+00 5.80E+00 1.20E-01 1.96E-02 4.86E+00
Zn 11 10 2.13E+00 1.52E+01 1.60E+00 -9.85E-04 6.94E+00
1El = Element analyzed; 2N = Total number of samples analyzed; Ndet = number of samples with detectable (above MDC) values; 3Min = the lowest value measured above MDC; Max = the highest value measured; 4MDC = Minimum detectable concentration; 5Concentrations below the MDC are reported as <MDC;
N/A = Not Applicable
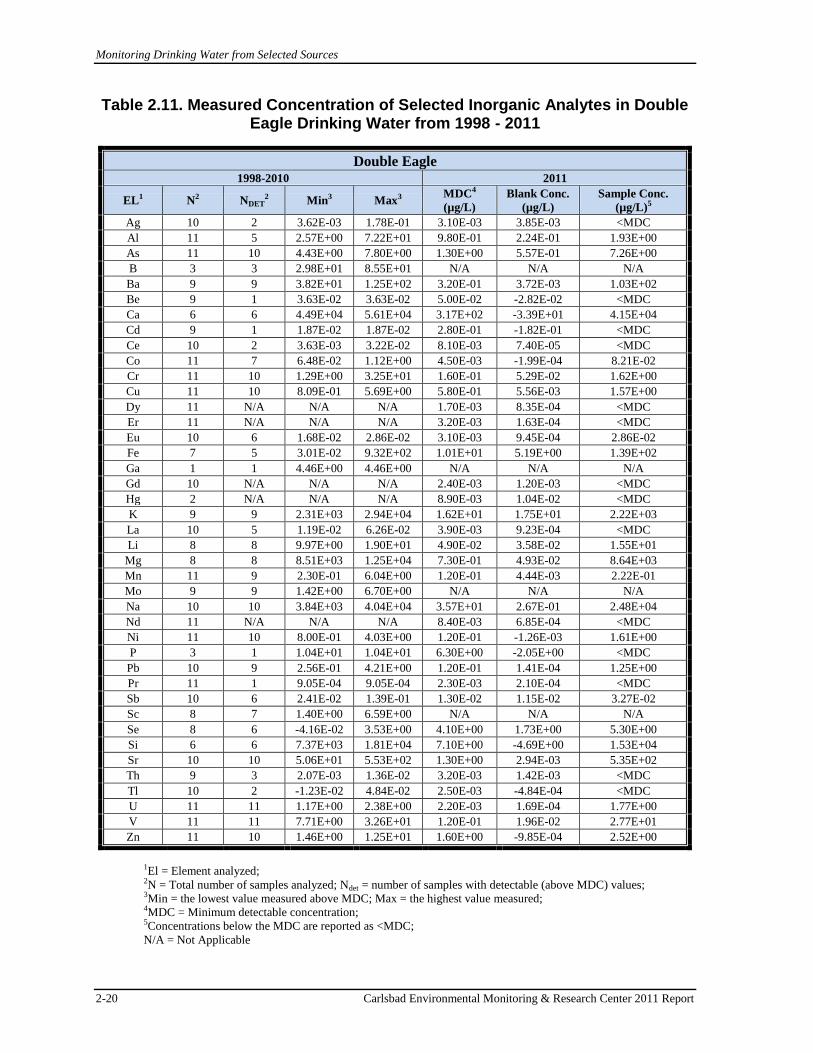
Monitoring Drinking Water from Selected Sources
2-20 Carlsbad Environmental Monitoring & Research Center 2011 Report
Table 2.11. Measured Concentration of Selected Inorganic Analytes in Double Eagle Drinking Water from 1998 - 2011
Double Eagle 1998-2010 2011
EL1 N2 NDET2 Min3 Max3
MDC4
(µg/L)
Blank Conc.
(µg/L)
Sample Conc.
(µg/L)5
Ag 10 2 3.62E-03 1.78E-01 3.10E-03 3.85E-03 <MDC
Al 11 5 2.57E+00 7.22E+01 9.80E-01 2.24E-01 1.93E+00
As 11 10 4.43E+00 7.80E+00 1.30E+00 5.57E-01 7.26E+00
B 3 3 2.98E+01 8.55E+01 N/A N/A N/A
Ba 9 9 3.82E+01 1.25E+02 3.20E-01 3.72E-03 1.03E+02
Be 9 1 3.63E-02 3.63E-02 5.00E-02 -2.82E-02 <MDC
Ca 6 6 4.49E+04 5.61E+04 3.17E+02 -3.39E+01 4.15E+04
Cd 9 1 1.87E-02 1.87E-02 2.80E-01 -1.82E-01 <MDC
Ce 10 2 3.63E-03 3.22E-02 8.10E-03 7.40E-05 <MDC
Co 11 7 6.48E-02 1.12E+00 4.50E-03 -1.99E-04 8.21E-02
Cr 11 10 1.29E+00 3.25E+01 1.60E-01 5.29E-02 1.62E+00
Cu 11 10 8.09E-01 5.69E+00 5.80E-01 5.56E-03 1.57E+00
Dy 11 N/A N/A N/A 1.70E-03 8.35E-04 <MDC
Er 11 N/A N/A N/A 3.20E-03 1.63E-04 <MDC
Eu 10 6 1.68E-02 2.86E-02 3.10E-03 9.45E-04 2.86E-02
Fe 7 5 3.01E-02 9.32E+02 1.01E+01 5.19E+00 1.39E+02
Ga 1 1 4.46E+00 4.46E+00 N/A N/A N/A
Gd 10 N/A N/A N/A 2.40E-03 1.20E-03 <MDC
Hg 2 N/A N/A N/A 8.90E-03 1.04E-02 <MDC
K 9 9 2.31E+03 2.94E+04 1.62E+01 1.75E+01 2.22E+03
La 10 5 1.19E-02 6.26E-02 3.90E-03 9.23E-04 <MDC
Li 8 8 9.97E+00 1.90E+01 4.90E-02 3.58E-02 1.55E+01
Mg 8 8 8.51E+03 1.25E+04 7.30E-01 4.93E-02 8.64E+03
Mn 11 9 2.30E-01 6.04E+00 1.20E-01 4.44E-03 2.22E-01
Mo 9 9 1.42E+00 6.70E+00 N/A N/A N/A
Na 10 10 3.84E+03 4.04E+04 3.57E+01 2.67E-01 2.48E+04
Nd 11 N/A N/A N/A 8.40E-03 6.85E-04 <MDC
Ni 11 10 8.00E-01 4.03E+00 1.20E-01 -1.26E-03 1.61E+00
P 3 1 1.04E+01 1.04E+01 6.30E+00 -2.05E+00 <MDC
Pb 10 9 2.56E-01 4.21E+00 1.20E-01 1.41E-04 1.25E+00
Pr 11 1 9.05E-04 9.05E-04 2.30E-03 2.10E-04 <MDC
Sb 10 6 2.41E-02 1.39E-01 1.30E-02 1.15E-02 3.27E-02
Sc 8 7 1.40E+00 6.59E+00 N/A N/A N/A
Se 8 6 -4.16E-02 3.53E+00 4.10E+00 1.73E+00 5.30E+00
Si 6 6 7.37E+03 1.81E+04 7.10E+00 -4.69E+00 1.53E+04
Sr 10 10 5.06E+01 5.53E+02 1.30E+00 2.94E-03 5.35E+02
Th 9 3 2.07E-03 1.36E-02 3.20E-03 1.42E-03 <MDC
Tl 10 2 -1.23E-02 4.84E-02 2.50E-03 -4.84E-04 <MDC
U 11 11 1.17E+00 2.38E+00 2.20E-03 1.69E-04 1.77E+00
V 11 11 7.71E+00 3.26E+01 1.20E-01 1.96E-02 2.77E+01
Zn 11 10 1.46E+00 1.25E+01 1.60E+00 -9.85E-04 2.52E+00
1El = Element analyzed; 2N = Total number of samples analyzed; Ndet = number of samples with detectable (above MDC) values; 3Min = the lowest value measured above MDC; Max = the highest value measured; 4MDC = Minimum detectable concentration; 5Concentrations below the MDC are reported as <MDC;
N/A = Not Applicable

Monitoring Drinking Water from Selected Sources
Carlsbad Environmental Monitoring & Research Center 2011 Report 2-21
Table 2.12. Measured Concentration of Selected Inorganic Analytes in Hobbs Drinking Water from 1998 - 2011
Hobbs 1998-2010 2011
EL1 N2 NDET2 Min3 Max3
MDC4
(µg/L)
Blank Conc.
(µg/L)
Sample Conc.
(µg/L)5
Ag 10 2 3.86E-03 1.04E-01 6.20E-03 3.85E-03 <MDC
Al 11 8 3.03E+00 1.14E+02 1.96E+00 2.24E-01 5.48E+00
As 11 10 4.51E+00 7.37E+00 2.60E+00 5.57E-01 8.56E+00
B 3 3 1.41E+02 1.97E+02 N/A N/A N/A
Ba 9 9 5.83E+01 6.52E+01 6.40E-02 3.72E-03 6.79E+01
Be 9 1 5.39E-02 5.39E-02 1.00E-01 -2.82E-02 <MDC
Ca 6 6 7.79E+04 9.20E+04 3.17E+03 -3.39E+01 7.63E+04
Cd 9 N/A N/A N/A 5.60E-01 -1.82E-01 <MDC
Ce 10 6 5.10E-03 3.56E-02 1.62E-02 7.40E-05 1.68E-02
Co 11 8 9.78E-02 3.61E-01 9.00E-03 -1.99E-04 1.93E-01
Cr 11 10 6.44E-01 1.13E+01 3.20E-01 5.29E-02 1.48E+00
Cu 11 10 1.06E+00 6.93E+00 1.16E+00 5.56E-03 3.05E+00
Dy 11 1 4.18E-03 4.18E-03 3.40E-03 8.35E-04 <MDC
Er 11 N/A N/A N/A 6.40E-03 1.63E-04 <MDC
Eu 10 6 1.31E-02 1.97E-02 6.20E-03 9.45E-04 1.68E-02
Fe 7 5 3.64E+01 4.44E+02 2.02E+01 5.19E+00 2.58E+02
Ga 1 1 2.56E+00 2.56E+00 N/A N/A N/A
Gd 10 N/A N/A N/A 4.80E-03 1.20E-03 <MDC
Hg 2 N/A N/A N/A 8.90E-03 1.04E-02 <MDC
K 9 9 2.32E+03 2.52E+04 3.24E+01 1.75E+01 2.11E+03
La 10 5 1.25E-02 5.01E-02 7.80E-03 9.23E-04 <MDC
Li 8 8 2.65E+01 3.18E+01 9.80E-02 3.58E-02 3.21E+01
Mg 8 8 1.92E+04 2.67E+04 7.30E+01 4.93E-02 1.90E+04
Mn 11 10 3.79E-01 3.62E+00 2.40E-01 4.44E-03 1.63E+00
Mo 9 9 2.46E+00 3.31E+00 N/A N/A N/A
Na 10 10 4.97E+03 5.80E+04 3.57E+02 2.67E-01 3.98E+04
Nd 11 3 3.01E-03 1.28E-02 1.68E-02 6.85E-04 <MDC
Ni 11 11 1.08E+00 4.78E+00 2.40E-01 -1.26E-03 3.15E+00
P 3 2 2.44E+01 2.53E+01 1.26E+01 -2.05E+00 1.76E+01
Pb 10 8 9.44E-02 1.19E+00 2.40E-01 1.41E-04 7.43E-01
Pr 11 1 1.57E-03 1.57E-03 4.60E-03 2.10E-04 <MDC
Sb 10 6 3.88E-02 7.02E-02 2.60E-02 1.15E-02 7.78E-02
Sc 8 8 3.06E+00 1.05E+01 N/A N/A N/A
Se 8 6 -1.70E-01 6.23E+00 8.20E+00 1.73E+00 1.23E+01
Si 6 6 2.41E+04 2.86E+04 1.42E+01 -4.69E+00 2.42E+04
Sr 10 10 7.89E+01 1.06E+03 1.30E+01 2.94E-03 1.10E+03
Th 9 2 2.29E-03 4.56E-03 6.40E-03 1.42E-03 <MDC
Tl 9 3 9.45E-03 2.31E-02 5.00E-03 -4.84E-04 <MDC
U 11 11 2.90E+00 3.98E+00 4.40E-03 1.69E-04 4.30E+00
V 11 11 3.11E+01 3.71E+01 2.40E-01 1.96E-02 3.46E+01
Zn 11 9 8.44E-01 4.37E+00 3.20E+00 -9.85E-04 <MDC
1El = Element analyzed; 2N = Total number of samples analyzed; Ndet = number of samples with detectable (above MDC) values; 3Min = the lowest value measured above MDC; Max = the highest value measured; 4MDC = Minimum detectable concentration; 5Concentrations below the MDC are reported as <MDC;
N/A = Not Applicable

Monitoring Drinking Water from Selected Sources
2-22 Carlsbad Environmental Monitoring & Research Center 2011 Report
Table 2.13. Measured Concentration of Selected Inorganic Analytes in Loving Drinking Water from 1998 - 2011
Loving 1998-2010 2011
EL1 N2 NDET2 Min3 Max3
MDC4
(µg/L)
Blank Conc.
(µg/L)
Sample Conc.
(µg/L)5
Ag 11 4 2.55E-03 2.17E-01 3.10E-03 3.85E-03 <MDC
Al 11 6 3.76E+00 3.76E+02 9.80E-01 2.24E-01 1.43E+00
As 11 8 7.82E-01 2.34E+00 1.30E+00 5.57E-01 2.01E+00
B 3 3 7.55E+01 1.12E+02 N/A N/A N/A
Ba 9 9 2.86E+01 3.47E+01 3.20E-02 3.72E-03 3.36E+01
Be 9 1 9.35E-02 9.35E-02 5.00E-02 -2.82E-02 <MDC
Ca 6 6 6.71E+04 1.00E+05 3.17E+02 -3.39E+01 7.04E+04
Cd 9 N/A N/A N/A 2.80E-01 -1.82E-01 <MDC
Ce 10 3 9.74E-04 2.53E-01 8.10E-03 7.40E-05 <MDC
Co 11 8 1.02E-01 4.04E-01 4.50E-03 -1.99E-04 1.19E-01
Cr 11 9 1.12E+00 7.44E+00 1.60E-01 5.29E-02 2.42E+00
Cu 11 9 1.80E+00 5.59E+00 5.80E-01 5.56E-03 1.20E+00
Dy 11 N/A N/A N/A 1.70E-03 8.35E-04 <MDC
Er 11 N/A N/A N/A 3.20E-03 1.63E-04 <MDC
Eu 10 6 7.00E-03 1.01E-02 3.10E-03 9.45E-04 9.91E-03
Fe 7 4 3.60E+00 2.57E+02 1.01E+01 5.19E+00 2.18E+02
Ga 1 1 1.26E+00 1.26E+00 N/A N/A N/A
Gd 10 2 2.15E-03 1.04E-02 2.40E-03 1.20E-03 <MDC
Hg 2 N/A N/A N/A 8.90E-03 1.04E-02 <MDC
K 9 9 1.85E+03 1.98E+04 1.62E+01 1.75E+01 1.69E+03
La 10 4 6.66E-03 2.22E-02 3.90E-03 9.23E-04 <MDC
Li 8 8 1.66E+01 1.96E+01 4.90E-02 3.58E-02 2.03E+01
Mg 8 8 3.05E+04 4.21E+04 7.30E+00 4.93E-02 3.02E+04
Mn 11 8 1.43E-02 1.77E+00 1.20E-01 4.44E-03 <MDC
Mo 9 8 1.28E+00 1.81E+00 N/A N/A N/A
Na 10 10 2.33E+03 2.82E+04 3.57E+01 2.67E-01 2.12E+04
Nd 11 1 3.37E-03 3.37E-03 8.40E-03 6.85E-04 <MDC
Ni 11 10 1.19E+00 3.38E+00 1.20E-01 -1.26E-03 2.87E+00
P 3 2 2.53E+01 3.37E+01 6.30E+00 -2.05E+00 2.46E+01
Pb 10 7 1.73E-01 1.67E+00 1.20E-01 1.41E-04 <MDC
Pr 11 N/A N/A N/A 2.30E-03 2.10E-04 <MDC
Sb 10 5 3.51E-02 1.84E-01 1.30E-02 1.15E-02 3.78E-02
Sc 8 7 1.91E+00 4.72E+00 N/A N/A N/A
Se 8 6 -2.89E+00 1.51E+00 4.10E+00 1.73E+00 <MDC
Si 6 6 8.54E+03 1.09E+04 7.10E+00 -4.69E+00 9.23E+03
Sr 10 10 7.60E+01 9.37E+02 1.30E+00 2.94E-03 7.85E+02
Th 9 2 5.69E-03 7.38E-03 3.20E-03 1.42E-03 <MDC
Tl 10 2 2.24E-03 4.32E-02 2.50E-03 -4.84E-04 <MDC
U 11 11 1.98E+00 2.30E+00 2.20E-03 1.69E-04 2.16E+00
V 11 11 1.11E+01 1.44E+01 1.20E-01 1.96E-02 1.34E+01
Zn 11 10 4.13E+00 2.01E+01 1.60E+00 -9.85E-04 8.60E+00
1El = Element analyzed; 2N = Total number of samples analyzed; Ndet = number of samples with detectable (above MDC) values; 3Min = the lowest value measured above MDC; Max = the highest value measured; 4MDC = Minimum detectable concentration; 5Concentrations below the MDC are reported as <MDC;
N/A = Not Applicable

Monitoring Drinking Water from Selected Sources
Carlsbad Environmental Monitoring & Research Center 2011 Report 2-23
Table 2.14. Measured Concentration of Selected Inorganic Analytes in Otis Drinking Water from 1998 - 2011
Otis 1998-2010 2011
EL1 N2 NDET2 Min3 Max3
MDC4
(µg/L)
Blank Conc.
(µg/L)
Sample Conc.
(µg/L)5
Ag 9 1 2.63E-02 2.63E-02 1.55E-02 3.85E-03 <MDC
Al 11 3 5.74E+00 1.06E+03 4.90E+00 2.24E-01 <MDC
As 11 8 6.53E-01 5.72E+00 6.50E+00 5.57E-01 <MDC
B 3 3 1.46E+02 2.39E+02 N/A N/A N/A
Ba 9 8 1.35E+01 1.75E+01 1.60E-01 3.72E-03 1.75E+01
Be 9 N/A N/A N/A 2.50E-01 -2.82E-02 <MDC
Ca 5 5 2.42E+05 3.83E+05 3.17E+03 -3.39E+01 2.43E+05
Cd 9 N/A N/A N/A 1.40E+00 -1.82E-01 <MDC
Ce 9 1 2.75E-02 2.75E-02 4.05E-02 7.40E-05 <MDC
Co 11 8 1.31E-01 9.51E-01 2.25E-02 -1.99E-04 4.56E-01
Cr 11 9 8.76E-01 6.67E+00 8.00E-01 5.29E-02 2.34E+00
Cu 11 9 2.43E+00 6.02E+00 2.90E+00 5.56E-03 4.37E+00
Dy 10 1 3.39E-03 3.39E-03 8.50E-03 8.35E-04 <MDC
Er 10 N/A N/A N/A 1.60E-02 1.63E-04 <MDC
Eu 9 3 3.42E-03 9.48E-03 1.55E-02 9.45E-04 <MDC
Fe 7 6 2.87E+00 1.02E+03 5.05E+01 5.19E+00 8.34E+02
Ga 1 1 6.54E-01 6.54E-01 N/A N/A N/A
Gd 9 N/A N/A N/A 1.20E-02 1.20E-03 <MDC
Hg 2 N/A N/A N/A 8.90E-03 1.04E-02 <MDC
K 9 9 2.74E+03 4.01E+03 8.10E+01 1.75E+01 2.85E+03
La 9 2 3.36E-03 6.30E-03 1.95E-02 9.23E-04 <MDC
Li 7 7 3.74E+01 6.79E+01 2.45E-01 3.58E-02 4.41E+01
Mg 8 8 5.16E+04 1.08E+05 7.30E+01 4.93E-02 8.10E+04
Mn 11 5 1.78E-01 2.32E+00 6.00E-01 4.44E-03 <MDC
Mo 9 8 2.25E+00 3.13E+00 N/A N/A N/A
Na 10 10 1.16E+03 1.97E+05 3.57E+02 2.67E-01 1.14E+05
Nd 10 3 4.80E-03 3.97E-02 4.20E-02 6.85E-04 <MDC
Ni 11 9 2.45E+00 1.11E+01 6.00E-01 -1.26E-03 1.03E+01
P 3 3 4.54E+01 1.32E+02 3.15E+01 -2.05E+00 8.64E+01
Pb 9 5 1.08E-01 5.04E-01 6.00E-01 1.41E-04 <MDC
Pr 10 N/A N/A N/A 1.15E-02 2.10E-04 <MDC
Sb 9 5 3.50E-02 4.10E-01 6.50E-02 1.15E-02 9.83E-02
Sc 8 6 2.57E+00 5.35E+00 N/A N/A N/A
Se 8 6 -2.43E-02 1.19E+00 2.05E+01 1.73E+00 <MDC
Si 6 6 9.83E+03 1.39E+04 3.55E+01 -4.69E+00 9.30E+03
Sr 10 10 3.31E+01 4.62E+03 1.30E+01 2.94E-03 3.60E+03
Th 8 2 1.19E-03 2.67E-02 1.60E-02 1.42E-03 <MDC
Tl 9 1 -6.30E-03 -6.30E-03 1.25E-02 -4.84E-04 <MDC
U 10 10 3.73E+00 5.88E+00 1.10E-02 1.69E-04 5.07E+00
V 11 10 1.05E+01 1.29E+01 6.00E-01 1.96E-02 1.10E+01
Zn 11 8 1.54E+00 1.64E+01 8.00E+00 -9.85E-04 9.15E+00
1El = Element analyzed; 2N = Total number of samples analyzed; Ndet = number of samples with detectable (above MDC) values; 3Min = the lowest value measured above MDC; Max = the highest value measured; 4MDC = Minimum detectable concentration; 5Concentrations below the MDC are reported as <MDC;
N/A = Not Applicable

Monitoring Drinking Water from Selected Sources
2-24 Carlsbad Environmental Monitoring & Research Center 2011 Report
Table 2.15. Measured Concentration of Selected Inorganic Analytes in Malaga Drinking Water from 1998 - 2011
Malaga 1998-2010 2011
EL1 N2 NDET2 Min3 Max3
MDC4
(µg/L)
Blank Conc.
(µg/L)
Sample Conc.
(µg/L)5
Ag N/A N/A N/A N/A 1.55E-02 3.85E-03 <MDC
Al N/A N/A N/A N/A 4.90E+00 2.24E-01 <MDC
As N/A N/A N/A N/A 6.50E+00 5.57E-01 <MDC
B N/A N/A N/A N/A N/A N/A N/A
Ba N/A N/A N/A N/A 1.60E-01 3.72E-03 1.66E+01
Be N/A N/A N/A N/A 2.50E-01 -2.82E-02 <MDC
Ca N/A N/A N/A N/A 3.17E+03 -3.39E+01 2.41E+05
Cd N/A N/A N/A N/A 1.40E+00 -1.82E-01 <MDC
Ce N/A N/A N/A N/A 4.05E-02 7.40E-05 <MDC
Co N/A N/A N/A N/A 2.25E-02 -1.99E-04 8.57E-01
Cr N/A N/A N/A N/A 8.00E-01 5.29E-02 1.95E+00
Cu N/A N/A N/A N/A 2.90E+00 5.56E-03 3.66E+00
Dy N/A N/A N/A N/A 8.50E-03 8.35E-04 <MDC
Er N/A N/A N/A N/A 1.60E-02 1.63E-04 <MDC
Eu N/A N/A N/A N/A 1.55E-02 9.45E-04 <MDC
Fe N/A N/A N/A N/A 5.05E+01 5.19E+00 8.94E+02
Ga N/A N/A N/A N/A N/A N/A N/A
Gd N/A N/A N/A N/A 1.20E-02 1.20E-03 <MDC
Hg N/A N/A N/A N/A 8.90E-03 1.04E-02 <MDC
K N/A N/A N/A N/A 8.10E+01 1.75E+01 2.57E+03
La N/A N/A N/A N/A 1.95E-02 9.23E-04 <MDC
Li N/A N/A N/A N/A 2.45E-01 3.58E-02 4.39E+01
Mg N/A N/A N/A N/A 7.30E+01 4.93E-02 6.98E+04
Mn N/A N/A N/A N/A 6.00E-01 4.44E-03 <MDC
Mo N/A N/A N/A N/A N/A N/A N/A
Na N/A N/A N/A N/A 3.57E+02 2.67E-01 7.53E+04
Nd N/A N/A N/A N/A 4.20E-02 6.85E-04 <MDC
Ni N/A N/A N/A N/A 6.00E-01 -1.26E-03 1.04E+01
P N/A N/A N/A N/A 3.15E+01 -2.05E+00 5.64E+01
Pb N/A N/A N/A N/A 6.00E-01 1.41E-04 <MDC
Pr N/A N/A N/A N/A 1.15E-02 2.10E-04 <MDC
Sb N/A N/A N/A N/A 6.50E-02 1.15E-02 <MDC
Sc N/A N/A N/A N/A N/A N/A N/A
Se N/A N/A N/A N/A 2.05E+01 1.73E+00 <MDC
Si N/A N/A N/A N/A 3.55E+01 -4.69E+00 9.12E+03
Sr N/A N/A N/A N/A 1.30E+01 2.94E-03 3.80E+03
Th N/A N/A N/A N/A 1.60E-02 1.42E-03 <MDC
Tl N/A N/A N/A N/A 1.25E-02 -4.84E-04 <MDC
U N/A N/A N/A N/A 1.10E-02 1.69E-04 5.38E+00
V N/A N/A N/A N/A 6.00E-01 1.96E-02 8.70E+00
Zn N/A N/A N/A N/A 8.00E+00 -9.85E-04 1.52E+01
1El = Element analyzed; 2N = Total number of samples analyzed; Ndet = number of samples with detectable (above MDC) values; 3Min = the lowest value measured above MDC; Max = the highest value measured; 4MDC = Minimum detectable concentration; 5Concentrations below the MDC are reported as <MDC;
N/A = Not Applicable
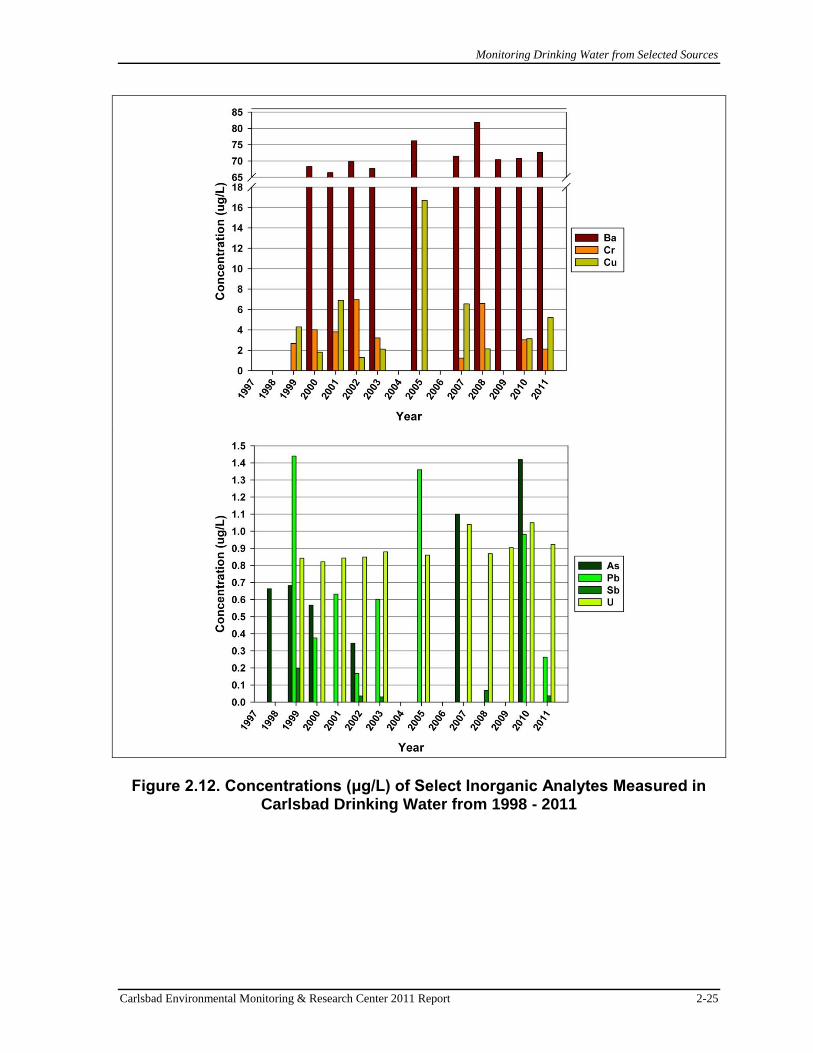
Monitoring Drinking Water from Selected Sources
Carlsbad Environmental Monitoring & Research Center 2011 Report 2-25
Figure 2.12. Concentrations (μg/L) of Select Inorganic Analytes Measured in
Carlsbad Drinking Water from 1998 - 2011

Monitoring Drinking Water from Selected Sources
2-26 Carlsbad Environmental Monitoring & Research Center 2011 Report
Figure 2.13. Concentrations (μg/L) of Select Inorganic Analytes Measured Near the WIPP site (Double Eagle) from 1998 - 2011

Monitoring Drinking Water from Selected Sources
Carlsbad Environmental Monitoring & Research Center 2011 Report 2-27
Figure 2.14. Concentrations (μg/L) of Select Inorganic Analytes Measured in Loving Drinking Water from 1998 - 2011

Monitoring Drinking Water from Selected Sources
2-28 Carlsbad Environmental Monitoring & Research Center 2011 Report
Figure 2.15. Concentrations (μg/L) of Select Inorganic Analytes Measured in Hobbs Drinking Water from 1998 - 2011

Monitoring Drinking Water from Selected Sources
Carlsbad Environmental Monitoring & Research Center 2011 Report 2-29
Figure 2.16. Concentrations (μg/L) of Select Inorganic Analytes Measured in Otis Drinking Water from 1998 - 2011

Monitoring Drinking Water from Selected Sources
2-30 Carlsbad Environmental Monitoring & Research Center 2011 Report
Figure 2.17. Select Analytes with Measured Concentrations >MDC in 2011 Drinking Water
Figure 2.18. Concentrations of Common Salts in 2011 Drinking Water
Whole Body and Lung In Vivo Measurement of Occurrence of Radionuclides
Carlsbad Environmental Monitoring & Research Center 2011 Report 3-1
CHAPTER 3
Whole Body and Lung In Vivo Measurement of Occurrence of Radionuclides in Residents of
Carlsbad, New Mexico, and the Surrounding Area
Introduction
Citizen volunteers from the Carlsbad, New Mexico and the surrounding area were
monitored for internally deposited radionuclides through a project entitled "Lie Down and Be
Counted" (LDBC). This project is provided as an outreach service to the public and to
support education about naturally occurring and man-made radioactivity present in people,
especially those who live within a 100-mile radius of the WIPP. The data collected prior to
the opening of the WIPP facility (March 26, 1999) serve as a baseline for comparisons with
periodic follow-up measurements that are slated to continue throughout the approximate
35-year operational phase of the WIPP. It is important to note that these data represent an
interim summary (through December 31, 2011) of an ongoing study.
Participating in the LDBC consists of having a lung and whole body count.
Volunteers are recruited through presentations to local community groups and businesses.
The entire measurement process takes approximately one hour. A detailed description of the
measurement protocol, analysis and instrument detection limits is provided in the Carlsbad
Environmental Monitoring and Research Center (CEMRC) 1998 Report. In addition, the
status of the project and results are available on the CEMRC website (www.cemrc.org).
The CEMRC LDBC program is accredited through the Department of Energy
Laboratory Accreditation Program (DOELAP) which maintains the competency of dosimetry
measurement laboratories through performance evaluation test measurements, calibration
inter-comparisons, and site assessments, to assure that the performance of personnel
performing dosimetry and radiobioassay measurements meet the standards of Title 10, Code
of Federal Regulations, Part 835, “Occupational Radiation Protection,” and related
requirements and guidance. The CEMRC Internal Dosimetry (ID) lung and whole body
counting laboratory has been DOELAP accredited since 1999.
Bioassay Results
As of December 31, 2011, 986 individuals had participated in the LDBC project. At
the time the WIPP opened, 3661 individuals had been measured using the in vivo protocol.
This group of 366 measurements constitutes the pre-operational baseline to which subsequent
“operational phase” results are compared. Counts performed after the opening of the WIPP
are considered to be a part of the operational monitoring phase of the WIPP environmental
monitoring program. Figure 3.1 shows the number of male, female and total voluntary
participants counted, by year, during the period 7/21/1997 to 12/31/2011.
1 This number was previously reported at 367 but that number included one test that was not part of the subject population.

Whole Body and Lung In Vivo Measurement of Occurrence of Radionuclides
3-2 Carlsbad Environmental Monitoring & Research Center 2011 Report
While not part of the LDBC program, CEMRC has also performed over 3,495 counts
on radiation-trained workers in the region including WIPP; Waste Control Specialists (WCS)
of Andrews, Texas; and the Nuclear Enrichment Facility (NEF) of Eunice, New Mexico.
Figure 3.1. Number of LDBC voluntary participants (total and by gender) counted during the period 1997 – 2011
Demographic characteristics (Table 3.1) of the current LDBC cohort are statistically
2
unchanged from those reported in previous CEMRC reports, and are generally consistent
with those reported in the 2010 census for citizens living in Carlsbad. The largest deviation
between the LDBC cohort and 2010 census is under-sampling of Latinos. In addition, it is
important to note that if the presence of a radionuclide is dependent on a subclass of interest
(gender, ethnicity, etc.) valid population estimates can still be made by correcting for the
proportion of under- or over-sampling for the particular subclass.
Baseline monitoring includes only the initial count of individuals made prior to
March 26, 1999. Seven people were recounted during the baseline interval but these data are
not reported in order to remain consistent with previous reports. Operational monitoring
includes the counting of new individuals and the recounting of previously measured
participants. Based on the data reported herein, there is no evidence of an increase in the
frequency of detection of internally-deposited radionuclides for citizens living within
the vicinity of the WIPP since the WIPP began receipt of radioactive waste.
2 The statistics reported for the bioassay program assume that the individuals participating are a random sample of the
population. Given that the bioassay program relies on voluntary participation, randomness of the sample cannot be assured and, as is discussed later, sampling appears to be biased by ethnicity.
0
50
100
150
200
250
300
350
400
Total Male Female
Nu
mb
er
of
volu
nta
ry A 7/21/1997 to 3/26/1999 WIPP Pre-Operational period
B 3/27/1999 to 12/31/1999
Whole Body and Lung In Vivo Measurement of Occurrence of Radionuclides
Carlsbad Environmental Monitoring & Research Center 2011 Report 3-3
As discussed in detail in the CEMRC 1998 Report and elsewhere (Webb and
Kirchner, 2000), the criterion, LC, was used to evaluate whether a result exceeds background,
and the use of this criterion will result in a statistically inherent 5% false-positive error rate
per pair-wise comparison (5% of all measurements will be determined to be positive when
there is no activity present in the person). The radionuclides being investigated and their
minimum detectable activities are listed in Table 3.2 for years 2009/2010, 2010/2011 and
2011/2012, which coincide with the current DOELAP three-year accreditation period. For
the baseline measurements (N = 366), the percentage of results greater than LC were
consistent with a 5% random false-positive error rate, at the 95% confidence level (1 to 9%),
for all radionuclides except 232
Th via the decay of 212
Pb, 235
U/226
Ra, 60
Co, 137
Cs, 40
K, 54
Mn,
and 232
Th via the decay of 228
Ac (Table 3.2). As discussed in detail in the 1998 report, five of
these [232
Th via 212
Pb, 60
Co, 40
K, 54
Mn (228
Ac interference) and 232
Th (via 228
Ac)] are part of
the shielded room background and positive detection is expected at low frequency. 40
K is a
naturally occurring isotope of an essential biological element, so detection in all individuals
is expected. 137
Cs and 235
U / 226
Ra are not components of the shielded room background and
were observed at frequencies greater than the 95% confidence interval for the false positive
error rate (discussed in more detail below).
For the operational monitoring counts (Table 3.3, N = 912), the percentage of results
greater than LC were consistent with baseline at a 95% confidence level (margin of error),
except for 60
Co and 232
Th (via 228
Ac). For these radionuclides, the percentage of results
greater than LC decreased relative to the baseline. This would be expected for 60
Co, since the
radionuclide has a relatively short half life (5.2 years), and the content within the shield has
decreased via decay by approximately 80% since the baseline phase of monitoring. The
differences in 232
Th (via 228
Ac) results between the baseline and operational monitoring phase
were also observed in 2001 and 2002 and are likely due to the replacement of aluminum
(tends to contain Th and U) in some of the detector cryostat components with those
manufactured from low radiation background steel.
40
K results were positive for all participants through December 2011 and ranged from
925 to 5559 Bq per person with an overall average ( Std. Err.) of 2481 ( 23) Bq per person.
Such results are expected since K is an essential biological element contained primarily in
muscle. 40
K, the radioactive isotope, is the theoretical constant fraction of all naturally
occurring K. 40
K average value ( Std. Err.), was 3065 ( 27) Bq per person for males, which
was significantly greater (p < 0.0001) than that of females, which was 1902 ( 18) Bq per
person. This result was expected since; in general, males tend to have larger body sizes and
greater muscle content than females.
Detectable 137
Cs is present in 22 % (20.8% to 23.1% with 95% confidence level for
baseline and operational monitoring counts through December 2011) of citizens living in the
Carlsbad area. These results are in the same range with findings previously reported in
CEMRC reports and elsewhere (Webb and Kirchner, 2000). Detectable 137
Cs body burdens
ranged from 4.9 to 77.5 Bq per person with an overall average (+ Std. Err.) of 10.2 (+ 0.3) Bq
per person. The average 137
Cs body burden (+ Std. Err.), was 11.0 (+ 0.7) Bq for males per
person, which was greater (p = 0.002) than that of females, which was 8.7 (+ 0.3) Bq per
person. Reports such as CEMRC Reports; Webb and Kirchner, 2000; provide initial
correlation studies of detectable 137
Cs with parameters like age, ethnicity, European travel,

Whole Body and Lung In Vivo Measurement of Occurrence of Radionuclides
3-4 Carlsbad Environmental Monitoring & Research Center 2011 Report
gender, consumption of wild game, nuclear medical treatments, radiation work history, and
smoking. A follow-up analysis of 15 years of data is in progress to determine if any
relationships between any of these factors are related to higher activities of 137
Cs.
40
K and 137
Cs results of LDBC voluntary participants through December 2011 are
shown in figures 3.2 – 3.5.
Figure 3.2. Percentage of voluntary participants with detectable 40K and 137Cs activities through December 2011
0
20
40
60
80
100
K-40 CS-137
Pe
rce
nta
ge o
f p
arti
cip
ants
w
ith
de
tect
able
act
ivit
y

Whole Body and Lung In Vivo Measurement of Occurrence of Radionuclides
Carlsbad Environmental Monitoring & Research Center 2011 Report 3-5
Figure 3.3. Percentage of voluntary participants with detectable 137Cs activity through December 2011 (This figure displays the total percentage of participants with 137Cs activity and the percentage of participants with 137Cs activity by gender).
Figure 3.4. Minimum, average, and maximum 40K activity for participants, separated by gender, through December 2011
0
5
10
15
20
25
30
Total Male Female
Pe
rce
nta
ge o
f p
arti
cip
ants
w
ith
de
tect
able
CS-
13
7

Whole Body and Lung In Vivo Measurement of Occurrence of Radionuclides
3-6 Carlsbad Environmental Monitoring & Research Center 2011 Report
Figure 3.5. Minimum, average, and maximum 137Cs activity for participants, separated by gender, through December 2011
As reported in previous CEMRC reports, the percentage of results greater than LC for
235U/
226Ra (11 %) are significantly higher than the distribution-free confidence interval for a
5 % random false-positive error rate. These data are not nearly as compelling as those for 137
Cs, but the large sample size of the current cohort tends to support the observed pattern.
Although 235
U and 226
Ra cannot be differentiated via gamma spectroscopy, it is likely the
signal is the result of 226
Ra because the natural abundance of 226
Ra is much greater than that
of 235
U. This shows the necessity of further research and procedural set up to enhance the
detection capability.
These results, particularly with no significant variation in the percentage of public
participants with detectable levels of plutonium, suggest that there have been no observable
effects from WIPP.
0
10
20
30
40
50
60
70
80
Male Female Male Female Male Female
Cs-137 Bq/person for participants through December 2011
Bq
/pe
rso
n
Minimum Average Maximum Maximum

Whole Body and Lung In Vivo Measurement of Occurrence of Radionuclides
Carlsbad Environmental Monitoring & Research Center 2011 Report 3-7
Table 3.1. Demographic Characteristics of the "Lie Down and Be Counted" Population Sample through December 31, 2011
Characteristic 2011 Sample Groupa
(margin of error)
bCensus,
2010
New Mexico
cCensus,
2010
US
Gender Male 46.5% (44.9 to 48.0%) 49.4% 49.1%
Female 53.5% (52.0 to 55.1%) 50.6 % 50.9%
Ethnicity Latino 20.2% (18.9 to 21.4%) 46.3 % 16.3 %
Non-Latino 79.8% (78.6 to 81.1%) 53.7 % 83.7%
Age 65 years or over 26.1% (24.7 to 27.4%) 19.6 % 13.0%
Currently or previously classified as a radiation worker
7.6% (6.8 to 8.4%) dNA
dNA
Consumption of wild game within 3 months prior to count
20.7% (19.4 to 22.0%) NA NA
Medical treatment other than X-rays using radionuclides
7.5% (6.7 to 8.3%) NA NA
European travel within 2 years prior to the count
4.2% (3.6 to 4.8%) NA NA
Current smoker 15.8% (14.7 to 16.9%) NA NA
a The margin of error represents the 95% confidence interval of the observed proportion; under complete replication of this experiment, one would expect the confidence interval to include the true population proportion 95% of the time if the sample was representative of the true population. b
http://2010.census.gov/2010census/popmap/ipmtext.php?fl=35 US Census 2010, New Mexico State. c http://www.census.gov/prod/cen2010/briefs/c2010br-03.pdf US Census 2010, US.
d NA = not available.
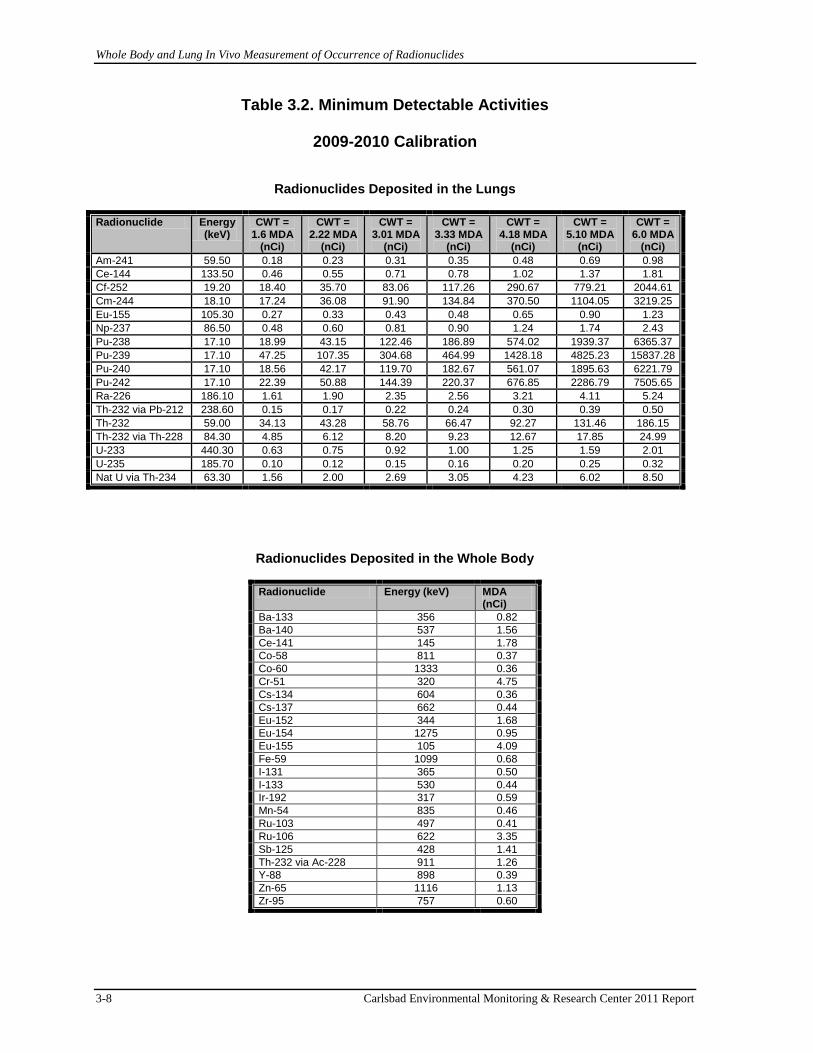
Whole Body and Lung In Vivo Measurement of Occurrence of Radionuclides
3-8 Carlsbad Environmental Monitoring & Research Center 2011 Report
Table 3.2. Minimum Detectable Activities
2009-2010 Calibration
Radionuclides Deposited in the Lungs
Radionuclide Energy (keV)
CWT = 1.6 MDA
(nCi)
CWT = 2.22 MDA
(nCi)
CWT = 3.01 MDA
(nCi)
CWT = 3.33 MDA
(nCi)
CWT = 4.18 MDA
(nCi)
CWT = 5.10 MDA
(nCi)
CWT = 6.0 MDA
(nCi)
Am-241 59.50 0.18 0.23 0.31 0.35 0.48 0.69 0.98
Ce-144 133.50 0.46 0.55 0.71 0.78 1.02 1.37 1.81
Cf-252 19.20 18.40 35.70 83.06 117.26 290.67 779.21 2044.61
Cm-244 18.10 17.24 36.08 91.90 134.84 370.50 1104.05 3219.25
Eu-155 105.30 0.27 0.33 0.43 0.48 0.65 0.90 1.23
Np-237 86.50 0.48 0.60 0.81 0.90 1.24 1.74 2.43
Pu-238 17.10 18.99 43.15 122.46 186.89 574.02 1939.37 6365.37
Pu-239 17.10 47.25 107.35 304.68 464.99 1428.18 4825.23 15837.28
Pu-240 17.10 18.56 42.17 119.70 182.67 561.07 1895.63 6221.79
Pu-242 17.10 22.39 50.88 144.39 220.37 676.85 2286.79 7505.65
Ra-226 186.10 1.61 1.90 2.35 2.56 3.21 4.11 5.24
Th-232 via Pb-212 238.60 0.15 0.17 0.22 0.24 0.30 0.39 0.50
Th-232 59.00 34.13 43.28 58.76 66.47 92.27 131.46 186.15
Th-232 via Th-228 84.30 4.85 6.12 8.20 9.23 12.67 17.85 24.99
U-233 440.30 0.63 0.75 0.92 1.00 1.25 1.59 2.01
U-235 185.70 0.10 0.12 0.15 0.16 0.20 0.25 0.32
Nat U via Th-234 63.30 1.56 2.00 2.69 3.05 4.23 6.02 8.50
Radionuclides Deposited in the Whole Body
Radionuclide Energy (keV) MDA (nCi)
Ba-133 356 0.82
Ba-140 537 1.56
Ce-141 145 1.78
Co-58 811 0.37
Co-60 1333 0.36
Cr-51 320 4.75
Cs-134 604 0.36
Cs-137 662 0.44
Eu-152 344 1.68
Eu-154 1275 0.95
Eu-155 105 4.09
Fe-59 1099 0.68
I-131 365 0.50
I-133 530 0.44
Ir-192 317 0.59
Mn-54 835 0.46
Ru-103 497 0.41
Ru-106 622 3.35
Sb-125 428 1.41
Th-232 via Ac-228 911 1.26
Y-88 898 0.39
Zn-65 1116 1.13
Zr-95 757 0.60

Whole Body and Lung In Vivo Measurement of Occurrence of Radionuclides
Carlsbad Environmental Monitoring & Research Center 2011 Report 3-9
Table 3.2. Minimum Detectable Activities (continued)
2010-2011 Calibration
Radionuclides Deposited in the Lungs
Radionuclide Energy (keV)
CWT = 1.6 MDA
(nCi)
CWT = 2.22 MDA
(nCi)
CWT = 3.01 MDA
(nCi)
CWT = 3.33 MDA
(nCi)
CWT = 4.18 MDA
(nCi)
CWT = 5.10 MDA
(nCi)
CWT = 6.0 MDA
(nCi)
Am-241 59.50 0.18 0.23 0.31 0.35 0.48 0.67 0.93
Ce-144 133.50 0.47 0.57 0.72 0.79 1.01 1.33 1.74
Cf-252 19.20 17.98 35.53 84.73 120.80 307.52 847.33 2286.97
Cm-244 18.10 16.81 35.78 93.35 137.65 387.66 1185.62 3546.51
Eu-155 105.30 0.28 0.34 0.44 0.48 0.64 0.86 1.16
Np-237 86.50 0.49 0.61 0.80 0.90 1.20 1.66 2.26
Pu-238 17.10 18.46 42.54 123.50 189.02 594.43 2045.16 6876.17
Pu-239 17.10 45.94 105.85 307.28 470.28 1478.98 5088.44 17108.17
Pu-240 17.10 18.05 41.59 120.72 184.75 581.03 1999.03 6721.07
Pu-242 17.10 21.77 50.17 145.63 222.88 700.92 2411.53 8107.95
Ra-226 186.10 1.65 1.94 2.37 2.57 3.21 4.07 5.14
Th-232 via Pb-212 238.60 0.15 0.17 0.21 0.23 0.29 0.38 0.48
Th-232 59.00 34.41 43.09 57.62 64.83 88.56 124.16 172.65
Th-232 via Th-228 84.30 4.88 6.09 7.98 8.92 11.99 16.48 22.54
U-233 440.30 0.65 0.75 0.91 0.98 1.21 1.51 1.88
U-235 185.70 0.10 0.12 0.15 0.16 0.20 0.25 0.32
Nat U via Th-234 63.30 1.64 2.04 2.72 3.06 4.17 5.82 8.08
Radionuclides Deposited in the Whole Body
Radionuclide Energy (keV) MDA (nCi)
Ba-133 356 0.79
Ba-140 537 1.53
Ce-141 145 1.70
Co-58 811 0.37
Co-60 1333 0.36
Cr-51 320 4.56
Cs-134 604 0.36
Cs-137 662 0.42
Eu-152 344 1.63
Eu-154 1275 0.95
Eu-155 105 3.92
Fe-59 1099 0.67
I-131 365 0.48
I-133 530 0.43
Ir-192 317 0.56
Mn-54 835 0.45
Ru-103 497 0.40
Ru-106 622 3.34
Sb-125 428 1.37
Th-232 via Ac-228 911 1.25
Y-88 898 0.38
Zn-65 1116 1.12
Zr-95 757 0.59

Whole Body and Lung In Vivo Measurement of Occurrence of Radionuclides
3-10 Carlsbad Environmental Monitoring & Research Center 2011 Report
Table 3-2. Minimum Detectable Activities (continued)
2011-2012 Calibration
Radionuclides Deposited in the Lungs
Radionuclide Energy (keV)
CWT = 1.6 MDA
(nCi)
CWT = 2.22 MDA
(nCi)
CWT = 3.01 MDA
(nCi)
CWT = 3.33 MDA
(nCi)
CWT = 4.18 MDA
(nCi)
CWT = 5.10 MDA
(nCi)
CWT = 6.0 MDA
(nCi)
Am-241 59.50 0.17 0.22 0.30 0.34 0.46 0.64 0.89
Ce-144 133.50 0.49 0.57 0.72 0.79 1.02 1.34 1.76
Cf-252 19.20 19.09 34.70 84.51 121.18 315.90 891.15 2454.73
Cm-244 18.10 17.16 35.01 93.70 139.72 402.23 1264.15 3875.50
Eu-155 105.30 0.26 0.33 0.43 0.48 0.63 0.85 1.15
Np-237 86.50 0.45 0.59 0.78 0.87 1.16 1.60 2.19
Pu-238 17.10 17.52 41.27 121.80 190.25 611.99 2179.54 7529.31
Pu-239 17.10 43.60 102.69 303.04 473.35 1522.65 5422.77 18733.21
Pu-240 17.10 17.13 40.34 119.05 185.96 598.18 2130.37 7359.48
Pu-242 17.10 20.66 48.67 143.62 224.33 721.62 2569.98 8878.10
Ra-226 186.10 1.81 1.94 2.40 2.61 3.26 4.16 5.28
Th-232 via Pb-212 238.60 0.15 0.17 0.21 0.23 0.29 0.37 0.48
Th-232 59.00 31.88 41.97 55.90 62.88 85.81 120.21 166.78
Th-232 via Th-228 84.30 4.43 5.87 7.67 8.61 11.57 15.92 21.77
U-233 440.30 0.65 0.76 0.92 0.99 1.23 1.53 1.91
U-235 185.70 0.11 0.12 0.15 0.16 0.20 0.26 0.33
Nat U via Th-234 63.30 1.49 1.99 2.65 2.97 4.04 5.64 7.80
Radionuclides Deposited in the Whole Body
Radionuclide Energy (keV) MDA (nCi) Ba-133 356 0.80
Ba-140 537 1.55
Ce-141 145 1.70
Co-58 811 0.37
Co-60 1333 0.36
Cr-51 320 4.61
Cs-134 604 0.36
Cs-137 662 0.43
Eu-152 344 1.66
Eu-154 1275 0.97
Eu-155 105 3.84
Fe-59 1099 0.68
I-131 365 0.49
I-133 530 0.43
Ir-192 317 0.56
Mn-54 835 0.46
Ru-103 497 0.41
Ru-106 622 3.36
Sb-125 428 1.38
Th-232 via Ac-228 911 1.29
Y-88 898 0.38
Zn-65 1116 1.13
Zr-95 757 0.60
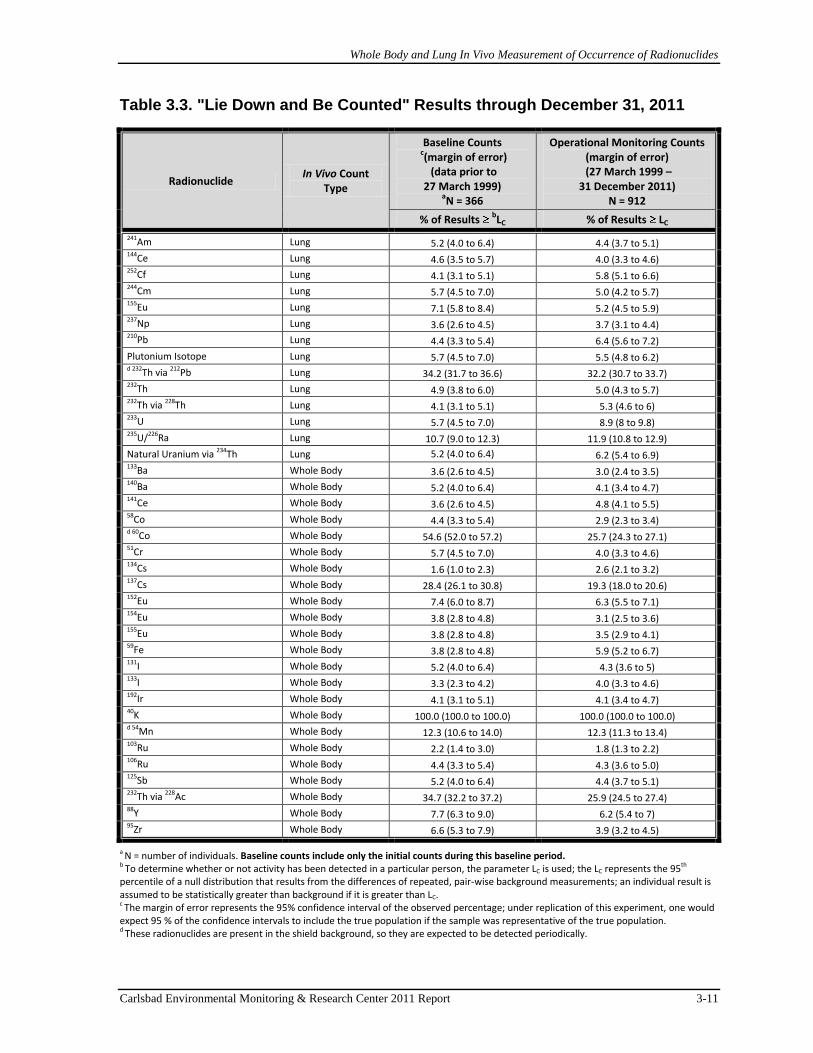
Whole Body and Lung In Vivo Measurement of Occurrence of Radionuclides
Carlsbad Environmental Monitoring & Research Center 2011 Report 3-11
Table 3.3. "Lie Down and Be Counted" Results through December 31, 2011
Radionuclide In Vivo Count
Type
Baseline Counts c(margin of error) (data prior to
27 March 1999) aN = 366
Operational Monitoring Counts (margin of error)
(27 March 1999 – 31 December 2011)
N = 912
% of Results bLC % of Results LC
241Am Lung 5.2 (4.0 to 6.4) 4.4 (3.7 to 5.1) 144Ce Lung 4.6 (3.5 to 5.7) 4.0 (3.3 to 4.6) 252Cf Lung 4.1 (3.1 to 5.1) 5.8 (5.1 to 6.6) 244Cm Lung 5.7 (4.5 to 7.0) 5.0 (4.2 to 5.7) 155Eu Lung 7.1 (5.8 to 8.4) 5.2 (4.5 to 5.9) 237Np Lung 3.6 (2.6 to 4.5) 3.7 (3.1 to 4.4) 210Pb Lung 4.4 (3.3 to 5.4) 6.4 (5.6 to 7.2)
Plutonium Isotope Lung 5.7 (4.5 to 7.0) 5.5 (4.8 to 6.2) d 232Th via 212Pb Lung 34.2 (31.7 to 36.6) 32.2 (30.7 to 33.7) 232Th Lung 4.9 (3.8 to 6.0) 5.0 (4.3 to 5.7) 232Th via 228Th Lung 4.1 (3.1 to 5.1) 5.3 (4.6 to 6) 233U Lung 5.7 (4.5 to 7.0) 8.9 (8 to 9.8) 235U/226Ra Lung 10.7 (9.0 to 12.3) 11.9 (10.8 to 12.9)
Natural Uranium via 234Th Lung 5.2 (4.0 to 6.4) 6.2 (5.4 to 6.9) 133Ba Whole Body 3.6 (2.6 to 4.5) 3.0 (2.4 to 3.5) 140Ba Whole Body 5.2 (4.0 to 6.4) 4.1 (3.4 to 4.7) 141Ce Whole Body 3.6 (2.6 to 4.5) 4.8 (4.1 to 5.5) 58Co Whole Body 4.4 (3.3 to 5.4) 2.9 (2.3 to 3.4) d 60Co Whole Body 54.6 (52.0 to 57.2) 25.7 (24.3 to 27.1) 51Cr Whole Body 5.7 (4.5 to 7.0) 4.0 (3.3 to 4.6) 134Cs Whole Body 1.6 (1.0 to 2.3) 2.6 (2.1 to 3.2) 137Cs Whole Body 28.4 (26.1 to 30.8) 19.3 (18.0 to 20.6) 152Eu Whole Body 7.4 (6.0 to 8.7) 6.3 (5.5 to 7.1) 154Eu Whole Body 3.8 (2.8 to 4.8) 3.1 (2.5 to 3.6) 155Eu Whole Body 3.8 (2.8 to 4.8) 3.5 (2.9 to 4.1) 59Fe Whole Body 3.8 (2.8 to 4.8) 5.9 (5.2 to 6.7) 131I Whole Body 5.2 (4.0 to 6.4) 4.3 (3.6 to 5) 133I Whole Body 3.3 (2.3 to 4.2) 4.0 (3.3 to 4.6) 192Ir Whole Body 4.1 (3.1 to 5.1) 4.1 (3.4 to 4.7) 40K Whole Body 100.0 (100.0 to 100.0) 100.0 (100.0 to 100.0) d 54Mn Whole Body 12.3 (10.6 to 14.0) 12.3 (11.3 to 13.4) 103Ru Whole Body 2.2 (1.4 to 3.0) 1.8 (1.3 to 2.2) 106Ru Whole Body 4.4 (3.3 to 5.4) 4.3 (3.6 to 5.0) 125Sb Whole Body 5.2 (4.0 to 6.4) 4.4 (3.7 to 5.1) 232Th via 228Ac Whole Body 34.7 (32.2 to 37.2) 25.9 (24.5 to 27.4) 88Y Whole Body 7.7 (6.3 to 9.0) 6.2 (5.4 to 7) 95Zr Whole Body 6.6 (5.3 to 7.9) 3.9 (3.2 to 4.5)
a N = number of individuals. Baseline counts include only the initial counts during this baseline period. b To determine whether or not activity has been detected in a particular person, the parameter LC is used; the LC represents the 95th percentile of a null distribution that results from the differences of repeated, pair-wise background measurements; an individual result is assumed to be statistically greater than background if it is greater than LC. c The margin of error represents the 95% confidence interval of the observed percentage; under replication of this experiment, one would expect 95 % of the confidence intervals to include the true population if the sample was representative of the true population. d These radionuclides are present in the shield background, so they are expected to be detected periodically.

Analysis of Volatile Organic Compounds, Hydrogen and Methane
Carlsbad Environmental Monitoring & Research Center 2011 Report 4-1
CHAPTER 4
Analysis of Volatile Organic Compounds, Hydrogen and Methane Introduction
The WIPP Hazardous Waste Facility Permit, issued by the New Mexico Environment
Department (NMED) under the Resource Conservation and Recovery Act (RCRA),
mandates the monitoring of nine volatile organic compounds (VOCs) in ambient air in the
WIPP underground to assure that their respective concentrations of concern are not exceeded.
Additional compounds consistently detected in ambient air samples in the underground may
be added to the list of compounds of interest. The current lists of compounds of interest and
additional requested compounds are presented in Tables 4.2 and 4.3 respectively.
VOC monitoring is conducted in accordance with the “Volatile Organic Compound
Confirmatory Monitoring Plan”, prepared by the WIPP management and operations
contractor, Washington TRU Solutions (WTS). Under this plan, Washington Regulatory and
Environmental Services (WRES) personnel collect ambient air samples in six liter passivated
canisters and deliver for analysis to CEMRC in weekly batches.
CEMRC first began analysis of samples for the Confirmatory VOCs Monitoring Plan
in April 2004. The program was established and successfully audited by the WTS quality
assurance (QA) group prior to acceptance of actual samples and has since been audited at
yearly intervals. Initially, CEMRC had one 6890/5973 Hewlett Packard (now Agilent) gas
chromatograph/mass spectrometer (GC/MS) which had previously been used by Los Alamos
National Laboratory (LANL). Later, CEMRC purchased an Entech 7100 Preconcentrator for
use as the sample concentration and introduction system, and an Entech 3100 Canister
Cleaning System for cleaning and evacuation of canisters after analysis.
VOCs Project Expansion
The original VOCs laboratory was set up in room 149 in the science laboratory wing
at CEMRC and only included the equipment necessary for Confirmatory VOCs analysis. In
late 2003, the Department of Energy (DOE) requested that CEMRC expand its capabilities in
order to prepare for the analysis of headspace gas (HSG) samples collected from waste drums
required under the WIPP Permit. In preparation for this expansion of scope, CEMRC
purchased an HSG analysis system consisting of a 6890/5973N Agilent GC/MS with a loop
injection system and three Entech 7032 Autosamplers installed in series. Also included in
this purchase was an Entech 3100A oven-based canister cleaning system, an Entech 4600
Dynamic Diluter for automatic preparation of VOCs calibration standards, and fifty 400 mL
Silonite-coated mini-canisters with Nupro valves and attached pressure gauges.
After a few months of VOCs confirmatory analyses, it became critical to expand the
laboratory to accommodate the addition of a backup analysis system. This shortcoming was
noted by auditors for the next two years. CEMRC purchased a backup Preconcentrator to
minimize system downtime; however, there was no available space in which to set up the
backup GC/MS instrument.
Analysis of Volatile Organic Compounds, Hydrogen and Methane
4-2 Carlsbad Environmental Monitoring & Research Center 2011 Report
With the addition of headspace gas analysis project in July 2005, it was decided to
move the VOCs Confirmatory Analysis and Headspace Gas Analysis programs from the EC
group into the newly created Organic Chemistry (OC) Group. The primary management
focus for the EC group was research oriented, whereas the functions of the OC group were
regulatory in nature and required different QA/QC measures and documentation.
Analyses were originally conducted by manually changing the sample attached to the
preconcentrator for each sample. Due to the need to maximize efficiency, an Entech 7016
canister autosampler was obtained in June 2005. This autosampler allowed for up to sixteen
samples to be run in sequence with minimal operator supervision.
Funding was obtained in mid-2005 through a DOE baseline change request to
remodel the old CEMRC garage into a functional GC/MS Laboratory. The design for the
remodel was completed in late 2005, and construction began in January 2006. Construction
was completed in April 2006 and the OC Group moved into the new laboratory.
Around this time, a backup Agilent 6890/5973 GC/MS system was transferred to
CEMRC by the Central Characterization Project (CCP) for use in headspace gas analysis. A
backup autosampler for HSG analysis was also purchased by CEMRC. Shortly thereafter a
new Agilent 6890/5975 GC/MS was obtained with a portion of the lab setup funding to be
used as a backup analysis system for the Confirmatory VOCs Monitoring.
The Volatile Organic Compound Monitoring program expanded from 353 samples in
2005 to 430 samples in 2006. Analysis of closed room samples for VOCs, hydrogen, and
methane began in 2007 as well and continues to the present. In 2007, 2008, 2009, and 2010,
CEMRC analyzed a total of 749, 608, 571, and 711 samples for VOCs and 182, 254, 339,
and 441 samples, respectively, for hydrogen and methane. In 2011, CEMRC analyzed a total
of 615 samples for VOCs and 398 samples for hydrogen and methane.
Although CEMRC performed well on the DOE audit for the headspace gas analysis
project, a decision was made not to submit these samples for analysis at CEMRC. However,
some equipment obtained for this project is currently being used for analysis of closed room
samples for VOCs and percent levels of hydrogen and methane
Methods for Volatile Organic Compound Monitoring
Confirmatory VOCs Monitoring requires method detection limits at low parts per
billion volume (ppbv) range. This type of analysis requires preconcentration of a given
volume of ambient air into a much smaller volume prior to introduction into the GC column.
In order to maintain performance of the mass analyzer, most of the water vapor and carbon
dioxide present in the air sample must be removed prior to analysis. The Entech 7100
Preconcentrator performs these tasks automatically by transferring the sample through three
consecutive cryogenic traps at different controlled temperatures. This results in very low
detection limits unattainable without cryogenic preconcentration.
Stock cylinders of certified Calibration Standard and Laboratory Control Sample
gases are purchased from a reputable supplier, and then diluted to working concentrations

Analysis of Volatile Organic Compounds, Hydrogen and Methane
Carlsbad Environmental Monitoring & Research Center 2011 Report 4-3
with Ultra-High Purity (UHP) Nitrogen using the Entech 4600 Dynamic Diluter. Canisters
are cleaned after sample analysis using the Entech 3100 Canister Cleaning system, which
consists of a computerized control module with vacuum pumps and an oven containing a
passivated manifold with fittings for connection of canisters. The control software initiates
the cleaning of canisters by heating coupled with multiple pressurization/evacuation cycles.
A blank sample is analyzed from each cleaning batch as a control to assure proper cleaning
has been achieved.
For 2011, analyses for Volatile Organic Compound Monitoring were conducted under
procedures using concepts of EPA Method TO-15 “Determination of Volatile Organic
Compounds (VOCs) in Air Collected in Specially–Prepared Canisters and Analyzed by Gas
Chromatography/Mass Spectrometry” (GC/MS; 1999).
Special quality assurance requirements for these activities were detailed in the
“Quality Assurance Project Plan for Volatile Organic Compound Monitoring”, prepared by
WTS. CEMRC personnel wrote procedures for this project under the CEMRC Quality
Assurance Plan, which were verified, validated, and placed in the CEMRC Document
Control Program. Procedures were composed to include QA requirements from EPA Method
TO-15 and all WIPP documents relevant to the Confirmatory Monitoring Program. See Table
4.1 for a list of CEMRC Procedures for Confirmatory Monitoring.
In November 2006, a WIPP permit modification incorporated an expansion of
sampling in the Volatile Organic Compounds Monitoring Program. Originally, the samples
were collected from only two stations in the WIPP underground (VOC-A and VOC-B). The
permit change required sampling from closed rooms within the current panel until the entire
panel is full. Therefore, the WIPP Hazardous Waste Facility permit now refers to both
Repository VOCs Monitoring and Disposal Room Monitoring.
Table 4.2 summarizes the nine permit-specified target compounds and their required
reporting limits for different types of samples. In early 2011, nine other compounds were
requested to be included in the list of target analytes as “Additional Requested Analytes”.
‘m-Xylene’ & ‘p-Xylene’ co-elute together as a single compound so they are reported as
‘p,m-Xylene’. Table 4.3 lists the additional analytes and their required reporting limits.
Methods for Hydrogen and Methane Analysis
The analysis of hydrogen and methane in closed room samples began in August 2007.
Under the analysis scheme used at CEMRC, sample canisters would be pressurized to twice
atmospheric pressure (if not already received at above atmospheric pressure) by the addition
of ultra high purity nitrogen, and then simultaneously analyzed for hydrogen and methane by
a GC/Thermal Conductivity Detector (TCD) and screened for VOCs by GC/MS. The
sampling system incorporates three autosamplers in series to allow for the analysis of two
complete batches of six 6L samples per run. Samples from the autosamplers pass through
heated transfer lines into two injection loops attached to an automated valve for simultaneous
injection into the GC. The VOC screening results are used to determine pre-analysis dilutions
required for analysis by Method TO-15. The hydrogen and methane analysis results are
reported in separate data packages from the VOCs results.

Analysis of Volatile Organic Compounds, Hydrogen and Methane
4-4 Carlsbad Environmental Monitoring & Research Center 2011 Report
Laboratory Precision Laboratory Control Sample (LCS) and LCS-Duplicate are analyzed at a rate of once
per batch, or once each ten samples, whichever is applicable, to verify instrument calibration
and quantitative analytical accuracy. LCS is a standard that contains compounds of interest
which has been prepared from a different source than that used to prepare the calibration
standard. An LCS is the same as a spiked blank or blank spike. The LCS % recovery must
be within ± 40% for all target and additional requested compounds. The relative percentage
deviation (RPD) must be 25% or less for all target and additional requested compounds. The
Laboratory achieved the precision limit for all the target compounds. Figures 4.1-4.4 show an
example of laboratory precision through LCS % recovery and RPD for one of the target VOC
analytes (Carbon Tetrachloride) and Hydrogen.
Results and Discussion
The OC lab analyzed a total of 1,013 samples in 2011. All of the samples were
analyzed and reported in a timely manner under an extensive quality assurance (QA) / quality
control (QC) program. The 1,013 samples consisted of 615 samples for VOCs measurement
(571 routine air samples, 44 blank and recovery gas samples) and 398 samples for hydrogen
and methane analysis. All of these samples achieved more than 99% completeness. Blank
and recovery gas samples were collected by Shaw Environmental and were part of the
sampler cleaning and certification program. The blank and recovery samples were analyzed
in expedited turnaround batches (7 calendar days) at various times throughout the years.
In addition, the OC lab also received a number of canisters and passivated sampling
kits (sample trains) for cleaning and certification at various times throughout the year. All of
the canisters and sample trains were cleaned and certified with appropriate QA/QC in place.
Batch reports for VOCs results were submitted in hardcopy in the EPA Contract
Laboratory Program format. An electronic report in the client’s specified format was also
provided for each batch. Hardcopy and electronic reports for hydrogen and methane analyses
were submitted in the formats specified by the client. Lastly, copies of batch reports and all
QA records associated with these analyses were maintained according to the CEMRC records
management policies, detailed in the QAP.
Summary Statements
Because of the proprietary nature of the VOC data, none are reported in this report.
However, the success of the VOCs Monitoring Program and the successful HSG Program
audit demonstrate CEMRC’s ability to initiate new programs to successfully perform
regulatory monitoring tasks in accordance with specific QA/QC requirements. At the time
both programs were proposed, CEMRC did not have qualified staff with experience in
similar programs. As a result, the existing staff gained knowledge and skills necessary to
perform these tasks appropriately in order to pass strict audit criteria.
CEMRC presently has the capability to analyze over 2,000 VOC and hydrogen/
methane samples per year and is seeking additional contracts to fully utilize the lab’s
capabilities.
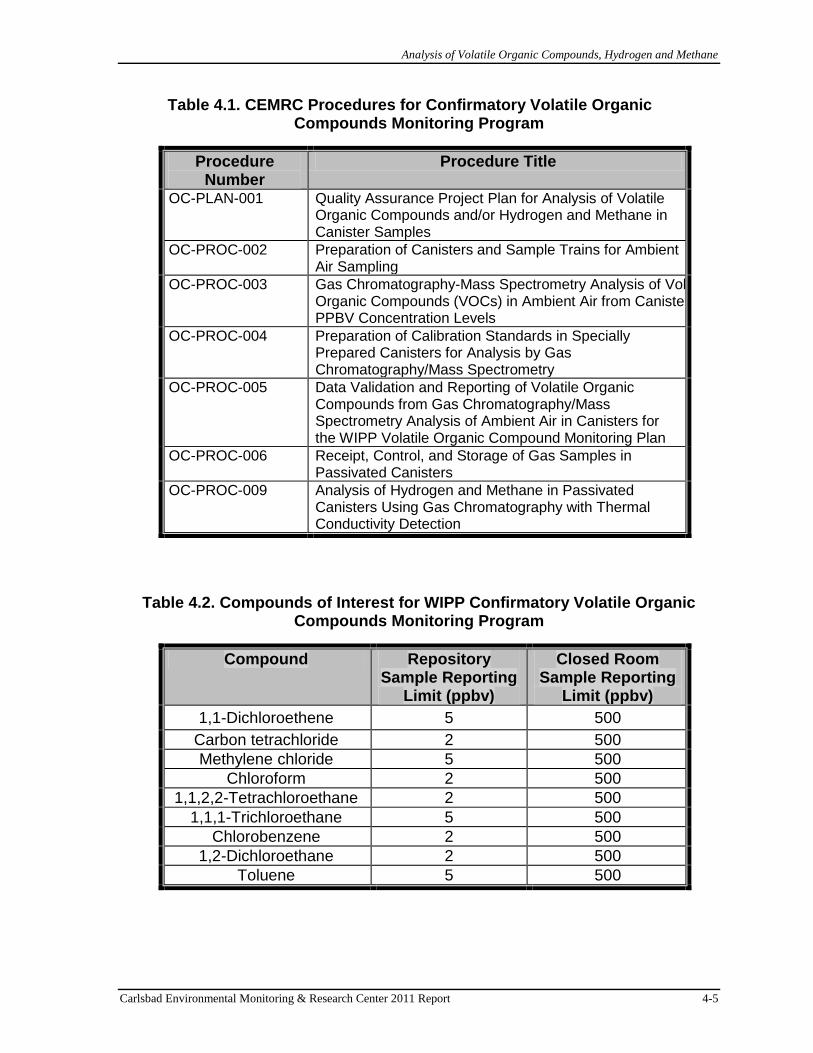
Analysis of Volatile Organic Compounds, Hydrogen and Methane
Carlsbad Environmental Monitoring & Research Center 2011 Report 4-5
Table 4.1. CEMRC Procedures for Confirmatory Volatile Organic Compounds Monitoring Program
Procedure Number
Procedure Title
OC-PLAN-001 Quality Assurance Project Plan for Analysis of Volatile Organic Compounds and/or Hydrogen and Methane in Canister Samples
OC-PROC-002 Preparation of Canisters and Sample Trains for Ambient Air Sampling
OC-PROC-003 Gas Chromatography-Mass Spectrometry Analysis of Volatile Organic Compounds (VOCs) in Ambient Air from Canisters at PPBV Concentration Levels
OC-PROC-004 Preparation of Calibration Standards in Specially Prepared Canisters for Analysis by Gas Chromatography/Mass Spectrometry
OC-PROC-005 Data Validation and Reporting of Volatile Organic Compounds from Gas Chromatography/Mass Spectrometry Analysis of Ambient Air in Canisters for the WIPP Volatile Organic Compound Monitoring Plan
OC-PROC-006 Receipt, Control, and Storage of Gas Samples in Passivated Canisters
OC-PROC-009 Analysis of Hydrogen and Methane in Passivated Canisters Using Gas Chromatography with Thermal Conductivity Detection
Table 4.2. Compounds of Interest for WIPP Confirmatory Volatile Organic Compounds Monitoring Program
Compound Repository Sample Reporting
Limit (ppbv)
Closed Room Sample Reporting
Limit (ppbv)
1,1-Dichloroethene 5 500
Carbon tetrachloride 2 500
Methylene chloride 5 500
Chloroform 2 500
1,1,2,2-Tetrachloroethane 2 500
1,1,1-Trichloroethane 5 500
Chlorobenzene 2 500
1,2-Dichloroethane 2 500
Toluene 5 500

Analysis of Volatile Organic Compounds, Hydrogen and Methane
4-6 Carlsbad Environmental Monitoring & Research Center 2011 Report
Table 4.3. Additional Requested Compounds for WIPP Confirmatory Volatile Organic Compounds Monitoring Program
Compound Repository Sample
Reporting Limit (ppbv)
Closed Room Sample
Reporting Limit (ppbv)
Benzene 2 500
Trichloroethylene 2 500
Tetrachloroethylene 5 500
Chloromethane 2 500
trans-1,2-Dichloroethylene 2 500
1,2,4-Trimethylbenzene 2 500
p,m-Xylene 5 500
Trichloromonofluoromethane 2 500
Figure 4.1. Percent Recovery of Carbon Tetrachloride in LCS (Recovery range: 60-140%)
60
80
100
120
140
28-Dec 8-Mar 17-May 26-Jul 4-Oct 13-Dec
Year 2011
% R
ec
ov
ery
%R LCS
Linear (%R LCS)

Analysis of Volatile Organic Compounds, Hydrogen and Methane
Carlsbad Environmental Monitoring & Research Center 2011 Report 4-7
Figure 4.2. Relative Percent Deviation (RPD) between LCS and LCS-Duplicate for Carbon Tetrachloride
(RPD range: 25%)
Figure 4.3. Percent Recovery of Hydrogen in LCS (Recovery range: 60-140%)
0.0
5.0
10.0
15.0
20.0
25.0
28-Dec 16-Feb 7-Apr 27-May 16-Jul 4-Sep 24-Oct 13-Dec
Year 2011
RP
D
RPD Linear (RPD)
60
80
100
120
140
28-Dec 16-Mar 3-Jun 20-Aug 7-Nov 25-Jan
Year 2011
% R
ec
ov
ery
%R LCS Linear (%R LCS)
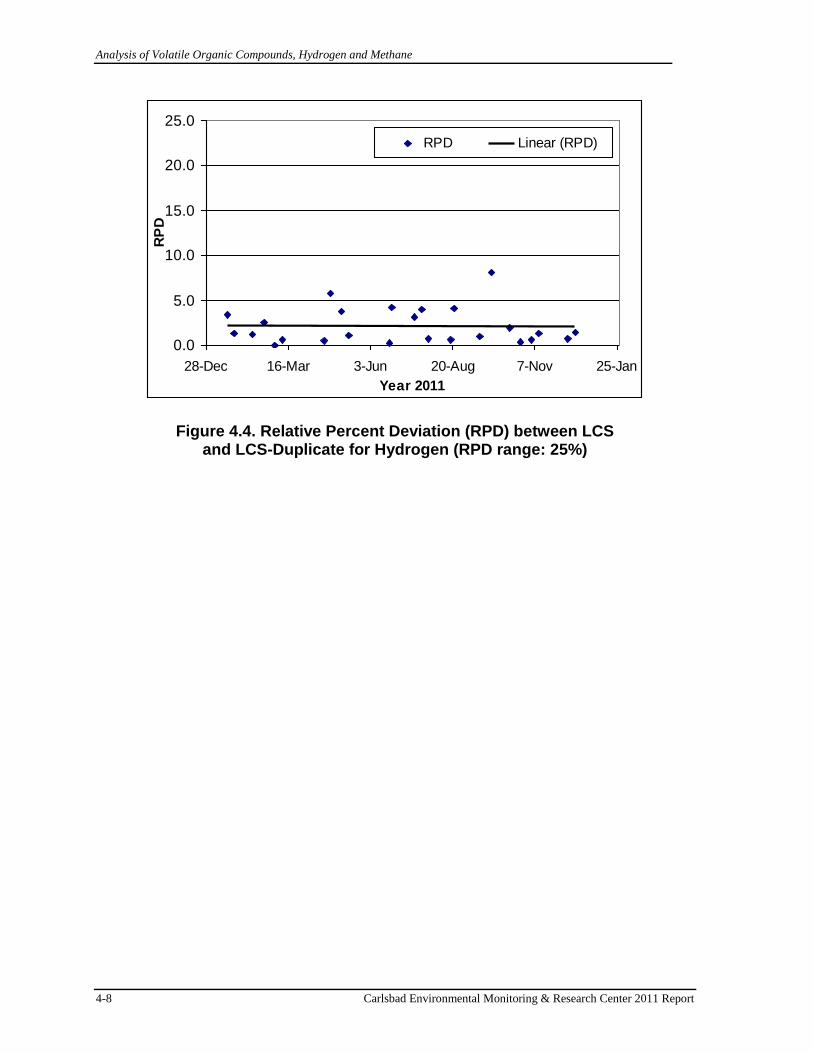
Analysis of Volatile Organic Compounds, Hydrogen and Methane
4-8 Carlsbad Environmental Monitoring & Research Center 2011 Report
Figure 4.4. Relative Percent Deviation (RPD) between LCS and LCS-Duplicate for Hydrogen (RPD range: 25%)
0.0
5.0
10.0
15.0
20.0
25.0
28-Dec 16-Mar 3-Jun 20-Aug 7-Nov 25-Jan
Year 2011
RP
DRPD Linear (RPD)
Ambient Aerosol Studies for the WIPP-EM
Carlsbad Environmental Monitoring & Research Center 2011 Report 5-1
CHAPTER 5
Ambient Aerosol Studies for the WIPP-EM
Introduction
The CEMRC ambient aerosol monitoring studies focus on both man-made and
naturally-occurring radionuclides, with special emphasis given to plutonium (Pu) and
americium (Am) as isotopes of these elements are the major radioactive constituents in the
TRU waste stored at the WIPP. In fact, the vast majority of radionuclides within TRU waste
are 239
Pu, 240
Pu and 241
Am, which account for more than 99% of the total radioactivity for
most of the 10,000-year regulatory period. In this context, the variation in concentrations of
these two radionuclides in the WIPP environment is important not only because they are the
main component of the WIPP wastes, but also because of their global background activity.
Atmospheric nuclear tests have been the major source of radiological contamination to date
in the global environment. Approximately 6 tons of 239
Pu were introduced into the
environment from more than 500 atmospheric weapon tests conducted between 1945 and
1980. Fallout was distributed globally at an approximately 3:1 ratio between the northern
hemisphere and the southern hemisphere (UNSCEAR 2000).
The main objective of the aerosol studies presented here and for the WIPP
Environmental Monitoring (WIPP-EM) Program in general, has been to determine whether
the nuclear waste handling and storage operations at the WIPP have released radionuclides
into the environment around the WIPP. Summaries of the WIPP-EM aerosol studies have
been included in prior CEMRC Annual Reports since 1997, and two articles specifically
based on the WIPP-EM aerosol research program have been published in peer-reviewed
journals (Arimoto et al. 2002 and 2005).
Currently, 238
Pu, 239
Pu and 240
Pu isotopes can be measured as traces in environmental
samples with a 238
Pu/239+240
Pu activity ratio of 0.03 at mean latitudes of 40o-50
o N tracing
their global origin (UNSCEAR, 2000). At present, almost all plutonium being introduced
into the atmosphere can be found in the surface soil. As a result, plutonium can migrate
vertically at various rates depending on meteorological conditions, physiochemical properties
of soil, and human activity. It can also be taken up by plants or be re-suspended into the air
with eroded soil particles. The importance of resuspension in recycling radionuclides from
the soil back into the atmosphere has been pointed out in many publications (Rosner et al.,
1997; Pavlotskaya et al., 1994; Arimoto et al., 2005; Sehmel, 1987).
Additionally, in the Carlsbad area, where WIPP is located, there is a potential local
source of anthropogenic radioactivity from an underground nuclear test conducted during the
Plowshare project. One particular test occurred in 1961 at the Gnome site, about 8.8 km
southwest of the WIPP site, when an underground test of a 3.3-kiloton 239
Pu device vented
radioactive materials to the surface (USAEC, 1973). Clean-up efforts at this site have been
carried out in several campaigns since that time, and the surface contamination is now well
below any risk-based action levels. However, 137
Cs and plutonium have been detected in
some samples of surface soils at the Gnome site (Kenney 1995). These contaminated soils
are of practical concern because they are a potential source of contamination for

Ambient Aerosol Studies for the WIPP-EM
5-2 Carlsbad Environmental Monitoring & Research Center 2011 Report
environmental samples being collected to monitor potential release of radionuclides from the
WIPP. Consequently, it is very important to understand factors controlling the distribution of
contaminants in the WIPP area.
An important finding of the earlier studies was that the activity of Pu and the
concentration of Al in aerosols were correlated and this was driven by the resuspension of
dust particles contaminated with radioactive fallout from past nuclear weapons tests. Similar
results were found for Am and Al. Related studies of soils collected on and near the WIPP
site have shown that correlations exist among Al and both naturally-occurring and bomb-
derived radionuclides including 239+240
Pu (Kirchner et al., 2002).
Here we briefly review the methods used for the ambient aerosol studies and then
summarize some recent results, highlighting the continuing efforts to evaluate potential
releases from the WIPP. In addition to the environmental aerosol studies, aerosol particles
also have been and continue to be collected using a fixed air sampler (FAS) in the WIPP
exhaust shaft. Results of the FAS studies are presented in Chapter 1 of this report.
METHODS
Ambient Air Sampling Stations
Ambient aerosols are collected using high volume samplers, commonly referred to as
“hivols,”, which have a flow rate of ~1.13 m3
min-1
and are located at three (3) sites in and
around the WIPP facility. The sites were selected on the basis of the most probable scenario
for radioactivity release if there is an accident during the operation of the WIPP. In
establishing these sites, it was recognized that there was no ideal “control” location from
which to collect samples, that is, a site far enough from the WIPP to ensure complete
isolation from aerosol releases while adequately replicating key ecological features, aerosol
composition, soil topology, biota and weather conditions, etc. One particular site, the cactus
flats station, was used as a reference location because it represents a reasonable compromise
based on these considerations. The locations of the three (3) air sampling stations are
depicted in Figure 5.1. The high volume sampler utilized for ambient aerosol monitoring,
filter holder and the type of filter used to collect total suspended particles (TSP) are shown in
Figures 5.2 and 5.3.
The three (3) hivol stations are designated as follows:
Station #106 (On Site Station): located in a primarily downwind position
about 0.1 km northwest of the WIPP exhaust shaft.
Station #107 (Near Field Station): located about 1 km northwest of the WIPP
site.
Station # 108 (Cactus Flats Station): located about 19 km southeast (upwind)
of the WIPP site.
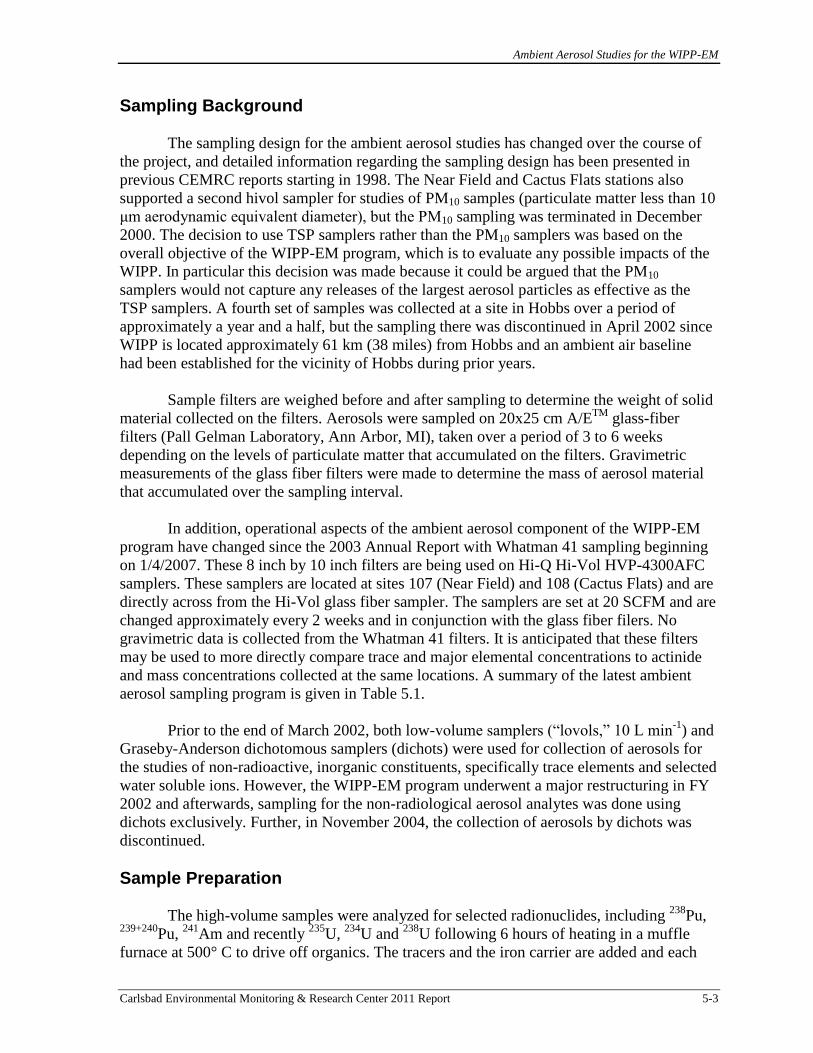
Ambient Aerosol Studies for the WIPP-EM
Carlsbad Environmental Monitoring & Research Center 2011 Report 5-3
Sampling Background
The sampling design for the ambient aerosol studies has changed over the course of
the project, and detailed information regarding the sampling design has been presented in
previous CEMRC reports starting in 1998. The Near Field and Cactus Flats stations also
supported a second hivol sampler for studies of PM10 samples (particulate matter less than 10
μm aerodynamic equivalent diameter), but the PM10 sampling was terminated in December
2000. The decision to use TSP samplers rather than the PM10 samplers was based on the
overall objective of the WIPP-EM program, which is to evaluate any possible impacts of the
WIPP. In particular this decision was made because it could be argued that the PM10
samplers would not capture any releases of the largest aerosol particles as effective as the
TSP samplers. A fourth set of samples was collected at a site in Hobbs over a period of
approximately a year and a half, but the sampling there was discontinued in April 2002 since
WIPP is located approximately 61 km (38 miles) from Hobbs and an ambient air baseline
had been established for the vicinity of Hobbs during prior years.
Sample filters are weighed before and after sampling to determine the weight of solid
material collected on the filters. Aerosols were sampled on 20x25 cm A/ETM
glass-fiber
filters (Pall Gelman Laboratory, Ann Arbor, MI), taken over a period of 3 to 6 weeks
depending on the levels of particulate matter that accumulated on the filters. Gravimetric
measurements of the glass fiber filters were made to determine the mass of aerosol material
that accumulated over the sampling interval.
In addition, operational aspects of the ambient aerosol component of the WIPP-EM
program have changed since the 2003 Annual Report with Whatman 41 sampling beginning
on 1/4/2007. These 8 inch by 10 inch filters are being used on Hi-Q Hi-Vol HVP-4300AFC
samplers. These samplers are located at sites 107 (Near Field) and 108 (Cactus Flats) and are
directly across from the Hi-Vol glass fiber sampler. The samplers are set at 20 SCFM and are
changed approximately every 2 weeks and in conjunction with the glass fiber filers. No
gravimetric data is collected from the Whatman 41 filters. It is anticipated that these filters
may be used to more directly compare trace and major elemental concentrations to actinide
and mass concentrations collected at the same locations. A summary of the latest ambient
aerosol sampling program is given in Table 5.1.
Prior to the end of March 2002, both low-volume samplers (“lovols,” 10 L min-1
) and
Graseby-Anderson dichotomous samplers (dichots) were used for collection of aerosols for
the studies of non-radioactive, inorganic constituents, specifically trace elements and selected
water soluble ions. However, the WIPP-EM program underwent a major restructuring in FY
2002 and afterwards, sampling for the non-radiological aerosol analytes was done using
dichots exclusively. Further, in November 2004, the collection of aerosols by dichots was
discontinued.
Sample Preparation
The high-volume samples were analyzed for selected radionuclides, including 238
Pu, 239+240
Pu, 241
Am and recently 235
U, 234
U and 238
U following 6 hours of heating in a muffle
furnace at 500° C to drive off organics. The tracers and the iron carrier are added and each

Ambient Aerosol Studies for the WIPP-EM
5-4 Carlsbad Environmental Monitoring & Research Center 2011 Report
filter is treated with HF+HNO3 up to the complete decomposition of silica. Then each filter is
digested with a strong acid mixture of HCl+HF+HClO4. Subsequently, the actinides are
separated as a group by co-precipitation on Fe(OH)3. Pu isotopes are separated and purified
using a two -column anion exchange resin (AG1-X8, Bio-Rad, 100-200 mesh), while TRU
chromatography columns are used for the separation of Am. The samples are then micro-co-
precipitated using a Nd-carrier, deposited onto filters, mounted on planchettes, and counted
by Oxford Oasis alpha spectroscopy for five days. Gamma-emitting nuclides in the air filters
are measured by Gamma spectrometry for 48 hours. Additionally, a known amount of tracer
(242
Pu, 243
Am or 232
U) is added to determine the actinide recovery in each sample. Typical
chemical recoveries are in the range of “40-80%” for Pu and of “90-105%” for Am. For
counting times of 72,000 min, the detection limits of 239+240
Pu, 238
Pu and 241
Am are 2.6x10⁻⁹
,
3.9x10⁻⁹
and 3.1x10⁻⁹
Bq/m3, respectively.
Data Reporting
The activities of the actinides in the air samples are reported as activity concentration
(Bq/m3) and activity density (Bq/g). Activity concentration is calculated as the activity of
radionuclides detected in bequerels (Bq) divided by the volume of air in cubic meters, while
activity density is calculated as the nuclides activity divided by the aerosol mass in grams
collected on the filter.
RESULTS AND DISCUSSION
Average air concentrations of actinides in the aerosol samples during the period from
1998 to 2011 are summarized in Table 5.2. The average air concentrations of actinides after
WIPP became operational are not statistically different than those measured prior to waste
disposal operations. During most years studied, the peak 239+240
Pu activities generally occur
in the March to June timeframe, which is when strong and gusty winds in the area frequently
give rise to blowing dust. Some samples taken at Cactus Flats (station 108) in 1999 and 2000,
at On Site (station 106) in 2004, and at Near field (station 107) in 2008 exhibited slightly
higher 239+240
Pu activity concentrations as well as densities (Figure 5.4 and 5.5) than
surrounding data points. The observed seasonality in Pu activity concentration is attributed to
the resuspension of contaminated soil dust plus the local precipitation to some extent. Studies
conducted prior to the end of the atmospheric weapons testing showed that Pu activities
varied seasonally, being highest in spring and summer because of the springtime enhanced
transportation of radioactive aerosols from the stratosphere to troposphere. However, with
the cessation of nuclear weapons tests and considering the fact that the residence time of Pu
in the atmosphere is on the order of a year, the stratospheric deposition of radionuclides,
including Pu, is no longer a dominant factor for the Pu concentration in air. Additionally, the
Chernobyl nuclear power plant accident that occurred in April 1986 did not bring significant
amounts of Pu to this area. Therefore, resuspension is assumed to be the main source of Pu in
the aerosol samples around the WIPP.
Methods for determining the activity of 241
Am were developed by the CEMRC
radiochemistry group in 2001. Most notably, strong springtime peaks in 241
Am activity
concentrations were evident in the samples from 2001 through 2002 and 2004 through 2011.

Ambient Aerosol Studies for the WIPP-EM
Carlsbad Environmental Monitoring & Research Center 2011 Report 5-5
A time series plot for 241
Am activity concentrations and densities are presented in (Figure 5.6
and 5.7). The activity concentrations of 241
Am in the high-volume samples closely tracked
those of 239+240
Pu. As a result, a strong correlation exists between 241
Am and 239+240
Pu activity
concentrations (R2 = 0.69, 0.71 and 0.69, respectively, for On Site, Near Field and Cactus
Flats stations) even though neither 239
Pu nor 240
Pu are immediate progeny of 241
Am (Figures
5.8 - 5.10).
The seasonal fluctuation for 238
Pu is not as pronounced as for 239+240
Pu and 241
Am.
The 239+240
Pu and 241
Am are frequently detected, whereas 238
Pu is detected infrequently in
aerosol filters, presumably because 238
Pu is not primarily from weapons fallout, but instead
was released by the burn-up of nuclear satellites such as SNAP-9A (Hardy, 1973)
The average activity concentration (activity per unit volume air sampled) for 239+240
Pu
ranges from 5.5-18.3 nBq/m3
at On Site, 4.9-19.4 nBq/m3
at Near Field, 2.3-20.3 nBq/m3 at
Cactus Flat. For 241
Am the average activity concentrations ranged from 1.9-5.4 nBq/m3 for
On Site station, 1.4-5.2 nBq/m3 for Near Field and 1.7-7.7 nBq/m
3 for Cactus Flats.
However, the 241
Am concentrations were consistently lower than those of 239+240
Pu. The
average 239+240
Pu, 241
Am, and 238
Pu concentrations in these three stations are shown in
Figures (5.11-5.13). In 2011, the average 239+240
Pu, 241
Am and 238
Pu activity concentrations in
aerosol filters were measured below the pre-operational level. The average 239+240
Pu activity
density (activity per unit mass aerosol collected) ranges from 0.26-0.41 mBq/g at On Site,
0.26-0.77 mBq/g at Near Field, 0.23-0.59 mBq/g at Cactus Flats (Figures 5.14-5.16) while
that of 241
Am ranged from 0.08-0.16 mBq/g for On Site, 0.06-0.23 mBq/g for Near Field and
0.10-0.38 mBq/g for Cactus Flats.
The plutonium activity concentration and density are usually higher in Cactus Flats
samples with the activity following the order: Cactus Flat>Near Field>On Site. In contrast to
actinide data, the aerosol mass loadings follows the trend: On Site (37.3±17.0 μg/m3)>
Cactus Flat (29.2±14.3 μg/m3) > Near Field (27.1±12.3 μg/m
3). As a result, the aerosol mass
loadings at On Site were generally the highest of the three stations with comparable data sets
(Table 5.2 and Figure 5.17). This data shows that the aerosol mass loadings at all stations
tend to track one another remarkably well, but that during several extended periods, most
noticeably January 1999 to July 2000 and July 2001 to January 2002, the mass loadings at
On Site were consistently higher than at the other sites.
As a consequence of the similar 239+240
Pu activity concentrations at all stations and the
higher mass loadings at On Site, the activity densities at On Site tended to be lower than the
Cactus Flats or Near Field stations (Table 5.2). The combination of 239+240
Pu and gravimetric
data suggest that activities at the WIPP may in fact generate detectable levels of aerosol
particles, but those particles actually contain less 239+240
Pu than typical ambient aerosols.
These are probably particles generated by construction dust or the mining of salt from
underground operations.
The concentrations of 239+240
Pu, 238
Pu, 241
Am, 137
Cs, 134
Cs, 60
Co and 40
K measured in
ambient aerosol samples collected during 2011 are presented in Figures 5.18 - 5.24. The
minimum, maximum, and average concentrations of radionuclides for all sampling locations
combined are reported in Tables 5.3, 5.4 and 5.5. As can be seen in the tables, 238
Pu, 239+240
Pu, and 241
Am were detected in some samples. Additionally, concentrations of 40
K
Ambient Aerosol Studies for the WIPP-EM
5-6 Carlsbad Environmental Monitoring & Research Center 2011 Report
were detected in most of the samples. 40
K is ubiquitous in the earth’s crust and thus would be
expected to show up in environmental air samples. However, there was no significant
difference in the concentrations of 40
K among locations. Lastly, 137
Cs and 60
Co were not
detected in any of the samples.
SUMMARY STATEMENTS
The results presented here demonstrate that actinide concentrations have not changed
significantly since the WIPP began receiving waste. The detections of 137
Cs and 134
Cs in the
samples collected during March -April, 2011 are attributed to the Fukushima Nuclear
accident in Japan and not from the WIPP related operations. For more information on the
Fukushima accident, see chapter 7 of this report.
Figure 5.1. WIPP-EM Ambient Aerosol Sampling Locations
Figure 5.2. High Volume Air sampler for TSP Monitoring around the WIPP Site

Ambient Aerosol Studies for the WIPP-EM
Carlsbad Environmental Monitoring & Research Center 2011 Report 5-7
Figure 5.3. Aerosol Sampling Filter Holder Filter Type Used: 8×10 inches Glass Fiber
Table 5.1. Aerosol Sampling Status for the WIPP-EM
Site aSampler Analyses Frequency Comments
Station A (Exhaust Shaft)
PM10-Shrouded Probe
Mass, Gross Alpha and Beta Activities, Trace Elements, Gamma Emitters, Actinides
Daily Monthly
Composites
Station B (Post Filtration)
Gross Alpha and Beta
Activities, Actinides Weekly
Monthly Composites
Cactus Flats Near Field
On Site
TSP-HI VOL Glass Fiber Filter
Mass & Radionuclides bVariable Continuous
cTSP-HI VOL Whatman 41Filter
Elemental Variable Continuous
aSampler types are as follows: PM10-Shrouded Probe = particles greater than 10 µm diameter (50% cut-size)
TSP-HI VOL = High Volume Total Suspended Particles. bSamples are changed when the flow drops to 90% of original for the 2-stage pumps. cTSP-HI VOL Whatman 41 Filters are collected at Cactus Flats and Near Field.
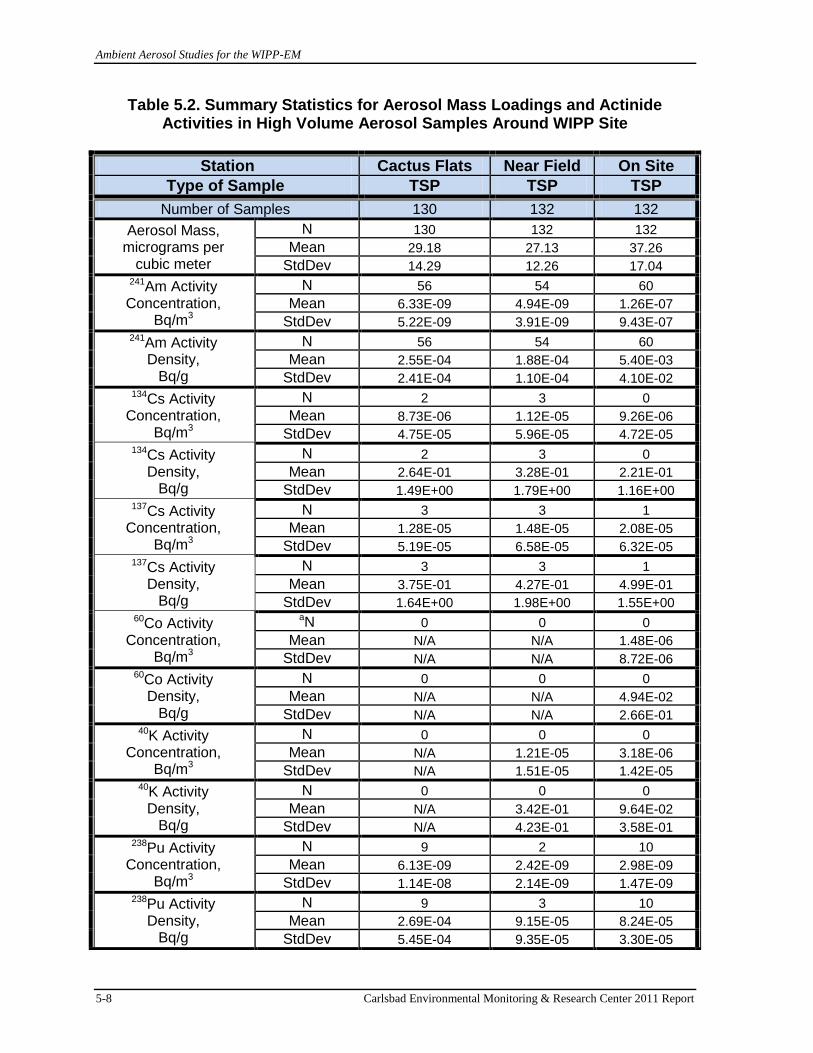
Ambient Aerosol Studies for the WIPP-EM
5-8 Carlsbad Environmental Monitoring & Research Center 2011 Report
Table 5.2. Summary Statistics for Aerosol Mass Loadings and Actinide Activities in High Volume Aerosol Samples Around WIPP Site
Station Cactus Flats Near Field On Site
Type of Sample TSP TSP TSP
Number of Samples 130 132 132
Aerosol Mass, micrograms per
cubic meter
N 130 132 132
Mean 29.18 27.13 37.26
StdDev 14.29 12.26 17.04 241Am Activity Concentration,
Bq/m3
N 56 54 60
Mean 6.33E-09 4.94E-09 1.26E-07
StdDev 5.22E-09 3.91E-09 9.43E-07 241Am Activity
Density, Bq/g
N 56 54 60
Mean 2.55E-04 1.88E-04 5.40E-03
StdDev 2.41E-04 1.10E-04 4.10E-02 134Cs Activity
Concentration, Bq/m3
N 2 3 0
Mean 8.73E-06 1.12E-05 9.26E-06
StdDev 4.75E-05 5.96E-05 4.72E-05 134Cs Activity
Density, Bq/g
N 2 3 0
Mean 2.64E-01 3.28E-01 2.21E-01
StdDev 1.49E+00 1.79E+00 1.16E+00 137Cs Activity
Concentration, Bq/m3
N 3 3 1
Mean 1.28E-05 1.48E-05 2.08E-05
StdDev 5.19E-05 6.58E-05 6.32E-05 137Cs Activity
Density, Bq/g
N 3 3 1
Mean 3.75E-01 4.27E-01 4.99E-01
StdDev 1.64E+00 1.98E+00 1.55E+00 60Co Activity
Concentration, Bq/m3
aN 0 0 0
Mean N/A N/A 1.48E-06
StdDev N/A N/A 8.72E-06 60Co Activity
Density, Bq/g
N 0 0 0
Mean N/A N/A 4.94E-02
StdDev N/A N/A 2.66E-01 40K Activity
Concentration, Bq/m3
N 0 0 0
Mean N/A 1.21E-05 3.18E-06
StdDev N/A 1.51E-05 1.42E-05 40K Activity
Density, Bq/g
N 0 0 0
Mean N/A 3.42E-01 9.64E-02
StdDev N/A 4.23E-01 3.58E-01 238Pu Activity
Concentration, Bq/m3
N 9 2 10
Mean 6.13E-09 2.42E-09 2.98E-09
StdDev 1.14E-08 2.14E-09 1.47E-09 238Pu Activity
Density, Bq/g
N 9 3 10
Mean 2.69E-04 9.15E-05 8.24E-05
StdDev 5.45E-04 9.35E-05 3.30E-05

Ambient Aerosol Studies for the WIPP-EM
Carlsbad Environmental Monitoring & Research Center 2011 Report 5-9
Table 5.2. Summary Statistics for Aerosol Mass Loadings and Actinide Activities in High Volume Aerosol Samples Around WIPP Site (continued)
Station Cactus Flats Near Field On Site
Type of Sample TSP TSP TSP
Number of Samples 130 132 132 239+240Pu Activity Concentration,
Bq/m3
N 91 109 106
Mean 1.61E-08 1.39E-08 1.36E-08
StdDev 1.31E-08 9.88E-09 8.81E-09 239+240Pu Activity
Density, Bq/g
N 91 110 108
Mean 5.35E-04 5.18E-04 3.63E-04
StdDev 2.15E-04 2.37E-04 1.90E-04 234U Activity
Concentration, Bq/m3
N 31 31 29
Mean 2.78E-06 2.89E-06 3.04E-06
StdDev 1.16E-06 1.37E-06 1.38E-06 234U Activity
Density, Bq/g
N 31 31 29
Mean 7.87E-02 8.07E-02 6.63E-02
StdDev 2.34E-02 2.39E-02 2.21E-02 235U Activity
Concentration, Bq/m3
N 31 31 29
Mean 1.53E-07 1.83E-07 1.67E-07
StdDev 8.17E-08 1.78E-07 8.47E-08 235U Activity
Density, Bq/g
N 31 31 29
Mean 4.20E-03 4.82E-03 3.66E-03
StdDev 1.41E-03 3.77E-03 1.56E-03 238U Activity
Concentration, Bq/m3
N 31 31 29
Mean 2.68E-06 2.78E-06 2.98E-06
StdDev 1.13E-06 1.31E-06 1.30E-06 238U Activity
Density, Bq/g
N 31 31 29
Mean 7.59E-02 7.77E-02 6.50E-02
StdDev 2.16E-02 2.30E-02 2.07E-02
aN stands for number of samples with masses or activities above detection limits.

Ambient Aerosol Studies for the WIPP-EM
5-10 Carlsbad Environmental Monitoring & Research Center 2011 Report
Figure 5.4. High Volume Ambient Aerosol 239+240Pu Activity Concentrations
Figure 5.5. High Volume Ambient Aerosol 239+240Pu Activity Densities
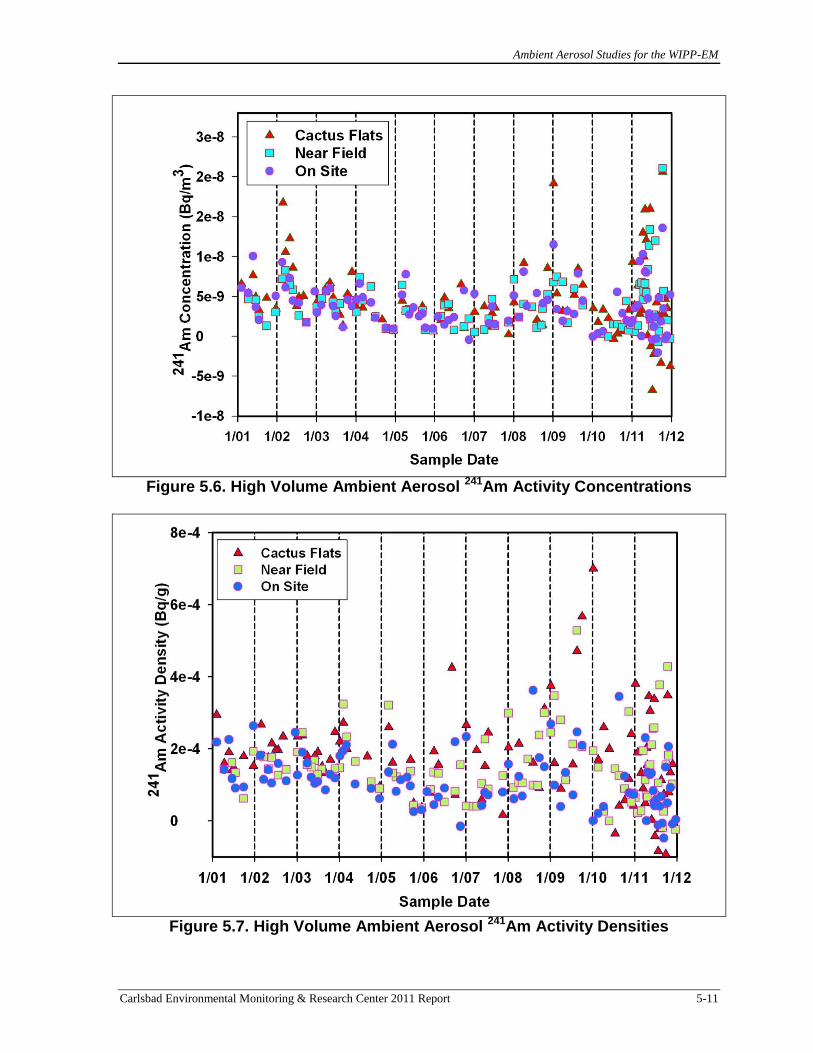
Ambient Aerosol Studies for the WIPP-EM
Carlsbad Environmental Monitoring & Research Center 2011 Report 5-11
Figure 5.6. High Volume Ambient Aerosol 241Am Activity Concentrations
Figure 5.7. High Volume Ambient Aerosol 241Am Activity Densities
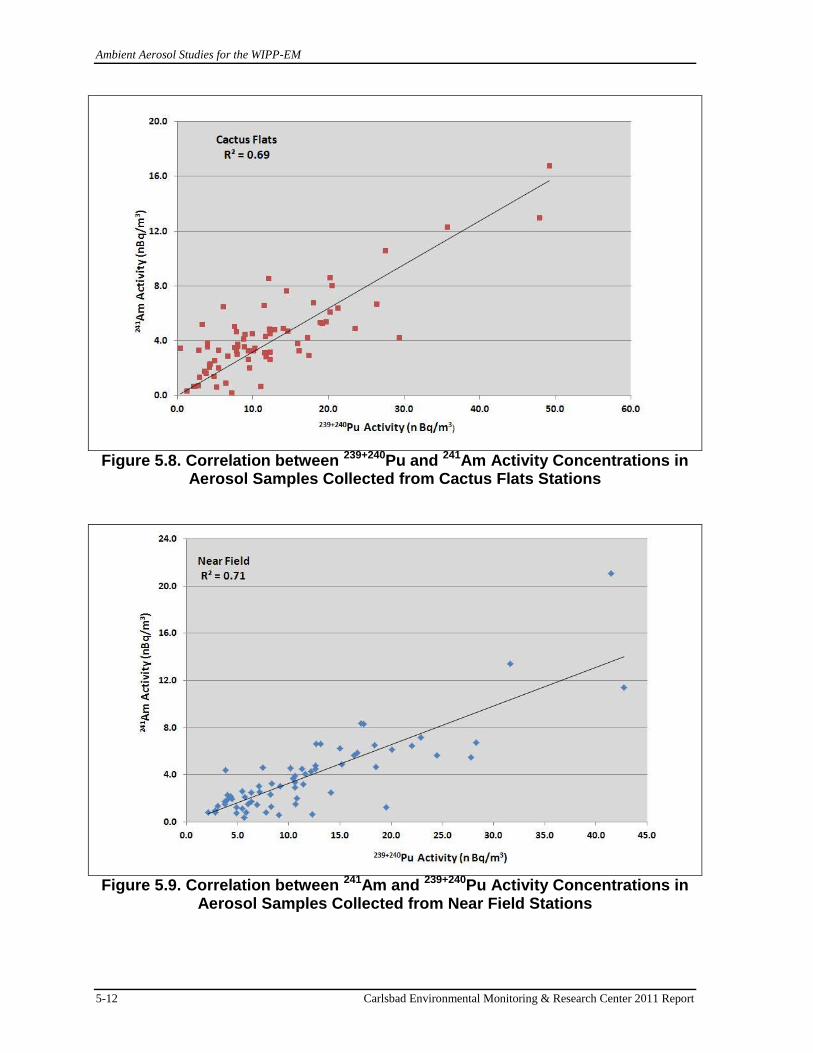
Ambient Aerosol Studies for the WIPP-EM
5-12 Carlsbad Environmental Monitoring & Research Center 2011 Report
Figure 5.8. Correlation between 239+240Pu and 241Am Activity Concentrations in
Aerosol Samples Collected from Cactus Flats Stations
Figure 5.9. Correlation between 241Am and 239+240Pu Activity Concentrations in
Aerosol Samples Collected from Near Field Stations

Ambient Aerosol Studies for the WIPP-EM
Carlsbad Environmental Monitoring & Research Center 2011 Report 5-13
Figure 5.10. Correlation between 241Am and 239+240Pu Activity Concentrations in
Aerosol Samples Collected from On Site Stations
Figure 5.11. Average High Volume Ambient Aerosol 239+240Pu Activity in the
Vicinity of WIPP Site
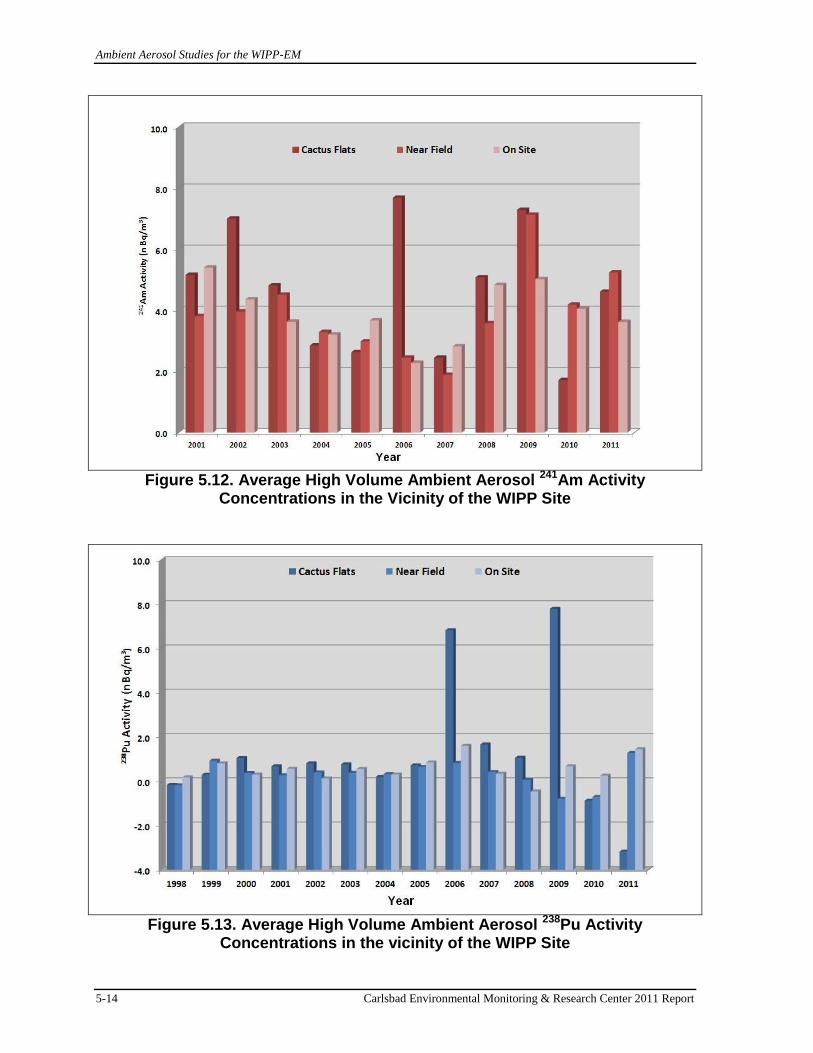
Ambient Aerosol Studies for the WIPP-EM
5-14 Carlsbad Environmental Monitoring & Research Center 2011 Report
Figure 5.12. Average High Volume Ambient Aerosol 241Am Activity
Concentrations in the Vicinity of the WIPP Site
Figure 5.13. Average High Volume Ambient Aerosol 238Pu Activity
Concentrations in the vicinity of the WIPP Site
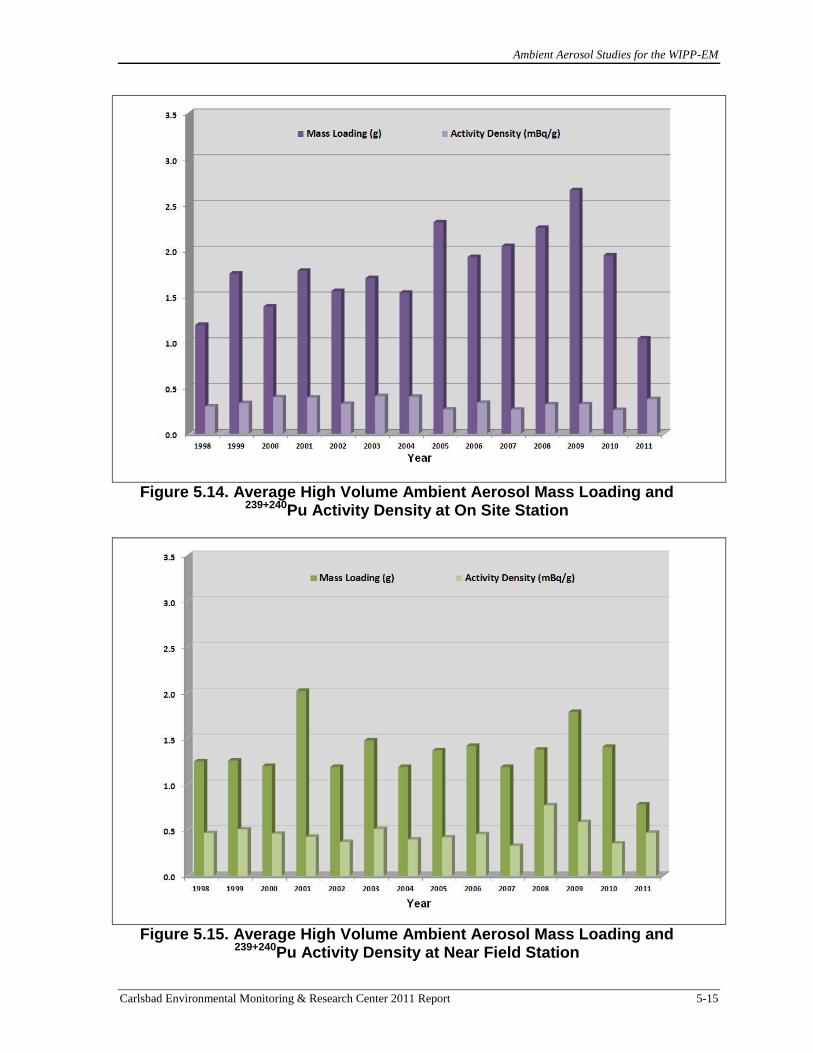
Ambient Aerosol Studies for the WIPP-EM
Carlsbad Environmental Monitoring & Research Center 2011 Report 5-15
Figure 5.14. Average High Volume Ambient Aerosol Mass Loading and
239+240Pu Activity Density at On Site Station
Figure 5.15. Average High Volume Ambient Aerosol Mass Loading and
239+240Pu Activity Density at Near Field Station
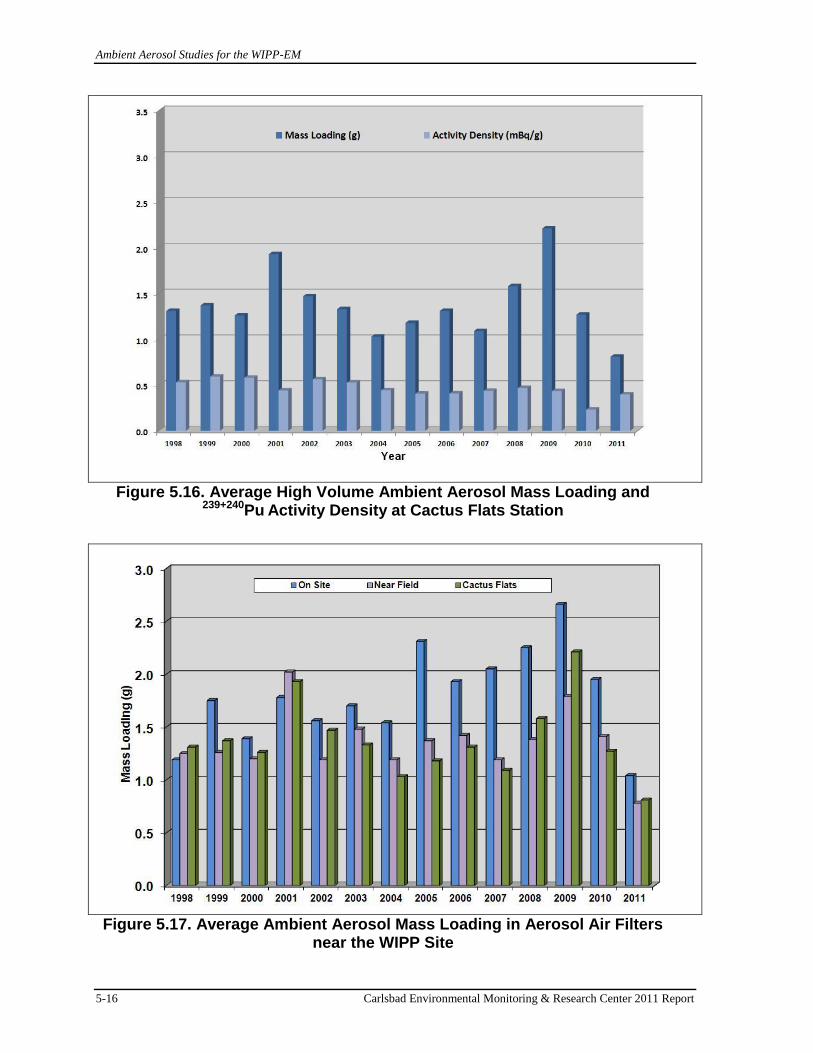
Ambient Aerosol Studies for the WIPP-EM
5-16 Carlsbad Environmental Monitoring & Research Center 2011 Report
Figure 5.16. Average High Volume Ambient Aerosol Mass Loading and
239+240Pu Activity Density at Cactus Flats Station
Figure 5.17. Average Ambient Aerosol Mass Loading in Aerosol Air Filters
near the WIPP Site
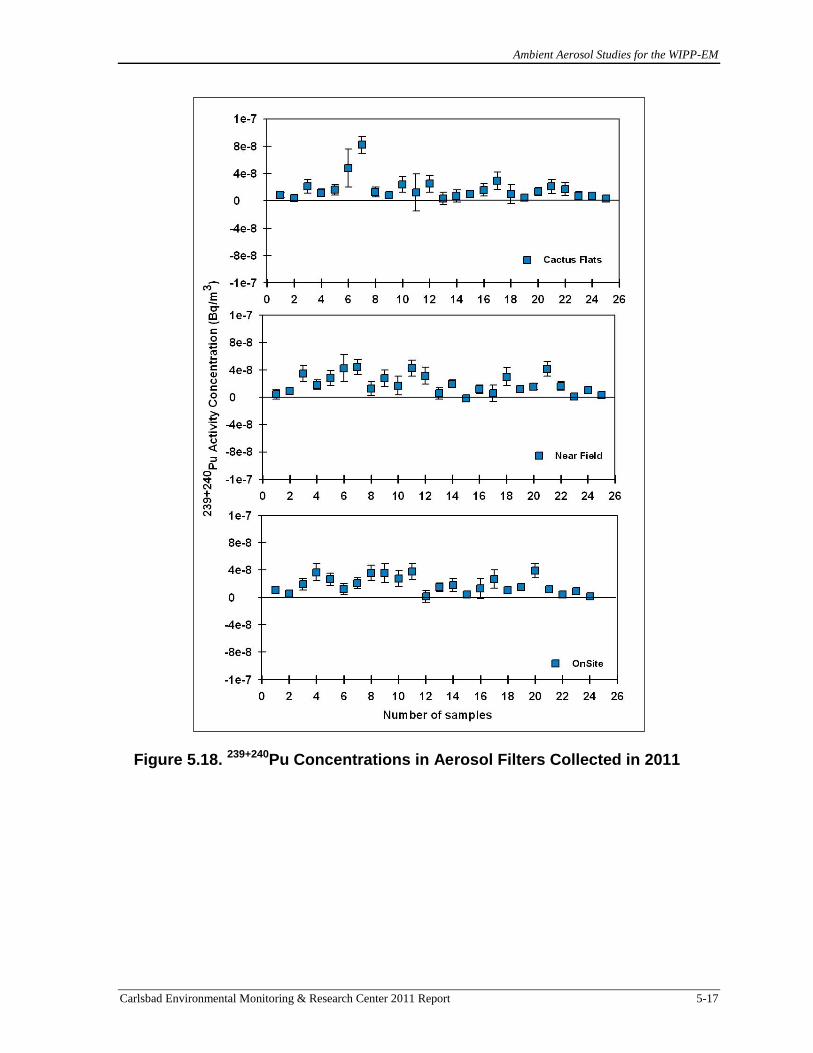
Ambient Aerosol Studies for the WIPP-EM
Carlsbad Environmental Monitoring & Research Center 2011 Report 5-17
Figure 5.18. 239+240Pu Concentrations in Aerosol Filters Collected in 2011

Ambient Aerosol Studies for the WIPP-EM
5-18 Carlsbad Environmental Monitoring & Research Center 2011 Report
Figure 5.19. 238Pu Concentrations in Aerosol Filters Collected in 2011

Ambient Aerosol Studies for the WIPP-EM
Carlsbad Environmental Monitoring & Research Center 2011 Report 5-19
Figure 5.20. 241Am Concentrations in Aerosol Filters Collected in 2011

Ambient Aerosol Studies for the WIPP-EM
5-20 Carlsbad Environmental Monitoring & Research Center 2011 Report
Figure 5.21. 137Cs Concentrations in Aerosol Filters Collected in 2011
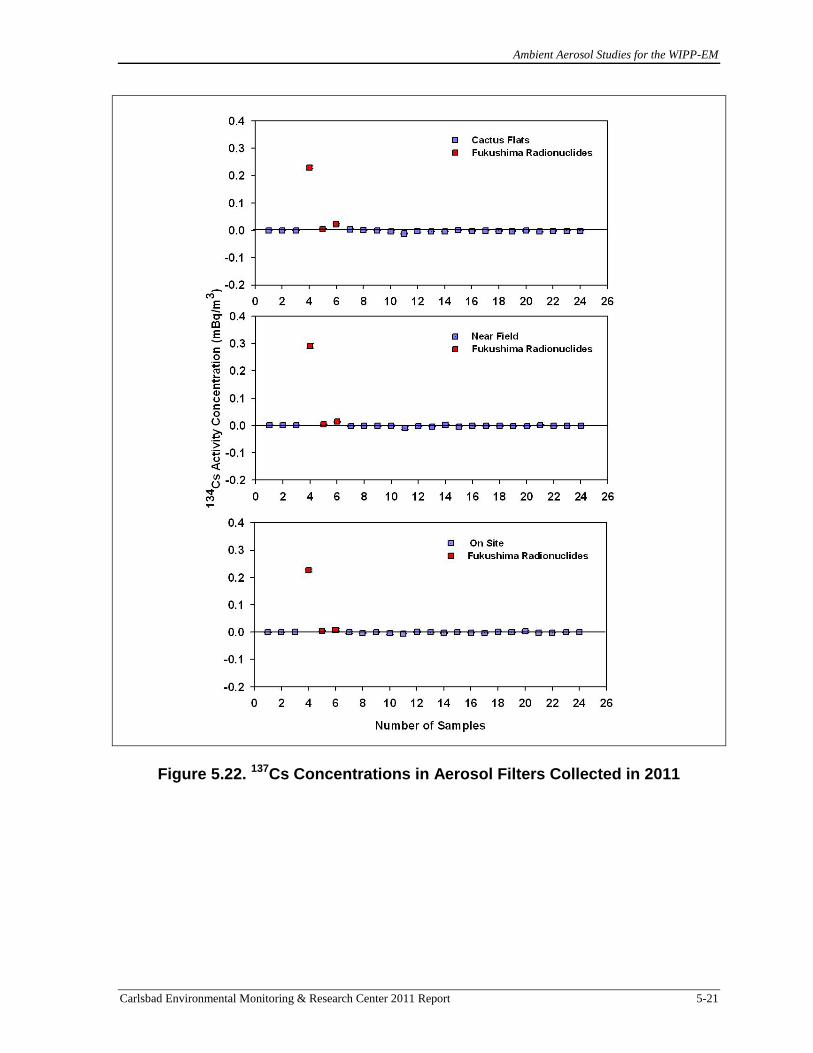
Ambient Aerosol Studies for the WIPP-EM
Carlsbad Environmental Monitoring & Research Center 2011 Report 5-21
Figure 5.22. 137Cs Concentrations in Aerosol Filters Collected in 2011

Ambient Aerosol Studies for the WIPP-EM
5-22 Carlsbad Environmental Monitoring & Research Center 2011 Report
Figure 5.23. 60Co Concentrations in Aerosol Filters Collected in 2011

Ambient Aerosol Studies for the WIPP-EM
Carlsbad Environmental Monitoring & Research Center 2011 Report 5-23
Figure 5.24. 40K Concentrations in Aerosol Filters Collected in 2011

Ambient Aerosol Studies for the WIPP-EM
5-24 Carlsbad Environmental Monitoring & Research Center 2011 Report
Table 5.3. Minimum, Maximum, and Average Radionuclide Concentrations (Bq/m3) in Aerosol Filters at On Site Station
Radionuclide Concentration SD MDC
2007
241Am
Minimum 1.51E-09 4.97E-10 9.83E-10
Maximum 5.33E-09 3.78E-09 1.44E-08
Average 2.82E-09 1.88E-09 5.41E-09
238Pu
Minimum -1.44E-09 4.00E-10 1.86E-09
Maximum 3.74E-09 2.54E-09 1.08E-08
Average 3.44E-10 1.33E-09 5.24E-09
239+240Pu
Minimum 4.32E-09 1.22E-09 2.15E-09
Maximum 2.40E-08 4.57E-09 9.44E-09
Average 9.23E-09 2.21E-09 4.32E-09
137Cs
Minimum -1.09E-07 2.00E-07 6.64E-07
Maximum 7.33E-07 5.44E-07 1.80E-06
Average 2.34E-07 3.63E-07 1.20E-06
60Co
Minimum -1.02E-06 1.93E-07 6.56E-07
Maximum 1.77E-06 2.96E-06 9.90E-06
Average 2.40E-08 5.98E-07 2.00E-06
40K
Minimum 4.19E-06 1.39E-06 3.73E-06
Maximum 3.65E-05 4.09E-06 1.32E-05
Average 1.56E-05 2.79E-06 8.68E-06
2008
241Am
Minimum 2.41E-09 7.48E-10 4.90E-10
Maximum 8.11E-09 1.77E-09 3.47E-09
Average 4.79E-09 1.29E-09 2.19E-09
238Pu
Minimum -9.09E-09 9.80E-10 1.14E-09
Maximum 2.52E-09 4.44E-09 2.37E-08
Average -4.61E-10 1.88E-09 8.12E-09
239+240Pu
Minimum 3.31E-09 1.72E-09 1.01E-09
Maximum 2.54E-08 5.42E-09 1.68E-08
Average 1.16E-08 2.88E-09 6.35E-09
137Cs
Minimum -2.93E-07 2.08E-07 6.89E-07
Maximum 5.22E-07 1.35E-06 4.49E-06
Average 1.51E-07 4.12E-07 1.37E-06
60Co
Minimum -1.51E-06 2.05E-07 7.03E-07
Maximum 2.54E-06 9.25E-07 3.17E-06
Average 3.03E-08 3.51E-07 1.18E-06
40K
Minimum -4.21E-06 1.95E-06 5.51E-06
Maximum 5.95E-05 6.82E-06 1.99E-05
Average 1.12E-05 2.84E-06 8.94E-06
2009
241Am
Minimum 1.92E-09 7.36E-10 4.87E-10
Maximum 1.15E-08 1.91E-09 5.29E-09
Average 5.02E-09 1.20E-09 1.77E-09
238Pu
Minimum -2.55E-09 1.25E-09 1.45E-09
Maximum 3.94E-09 2.30E-09 1.09E-08
Average 6.73E-10 1.55E-09 5.77E-09
239+240Pu
Minimum 7.81E-09 2.34E-09 4.12E-09
Maximum 1.95E-08 4.41E-09 1.16E-08
Average 1.30E-08 3.21E-09 6.86E-09

Ambient Aerosol Studies for the WIPP-EM
Carlsbad Environmental Monitoring & Research Center 2011 Report 5-25
Table 5.3. Minimum, Maximum, and Average Radionuclide Concentrations (Bq/m3) in Aerosol Filters at On Site Station (continued)
Radionuclide Concentration SD MDC
2009
137Cs
Minimum -4.66E-07 1.20E-07 4.01E-07
Maximum 6.38E-08 5.04E-07 1.67E-06
Average -2.17E-07 2.75E-07 9.18E-07
60Co
Minimum -7.19E-07 9.52E-08 3.16E-07
Maximum 3.10E-06 1.10E-06 3.73E-06
Average 3.07E-07 3.56E-07 1.18E-06
40K
Minimum 6.19E-07 1.26E-06 4.19E-06
Maximum 3.12E-05 3.10E-06 9.80E-06
Average 9.37E-06 2.33E-06 7.39E-06
2010
241Am
Minimum -2.83E-12 4.75E-10 4.16E-10
Maximum 5.58E-09 1.93E-09 6.13E-09
Average 1.87E-09 1.07E-09 2.81E-09
238Pu
Minimum -4.09E-09 7.34E-10 2.54E-09
Maximum 2.42E-09 5.04E-09 2.27E-08
Average 2.50E-10 2.01E-09 8.01E-09
239+240Pu
Minimum 5.66E-10 7.81E-10 2.94E-09
Maximum 1.20E-08 6.73E-09 2.12E-08
Average 5.48E-09 2.57E-09 7.68E-09
234U
Minimum 3.82E-07 1.24E-08 2.02E-09
Maximum 1.46E-06 4.11E-08 1.36E-08
Average 8.70E-07 2.71E-08 6.87E-09
235U
Minimum 1.54E-08 1.95E-09 1.71E-09
Maximum 5.39E-08 7.12E-09 9.07E-09
Average 3.74E-08 4.97E-09 5.21E-09
238U
Minimum 3.62E-07 1.19E-08 2.46E-09
Maximum 1.27E-06 3.73E-08 9.64E-09
Average 8.06E-07 2.57E-08 5.71E-09
137Cs
Minimum -1.11E-06 2.38E-07 7.82E-07
Maximum 1.08E-06 1.27E-06 4.24E-06
Average 6.17E-08 5.91E-07 1.97E-06
60Co
Minimum -3.32E-06 2.82E-07 9.26E-07
Maximum 2.48E-06 1.28E-06 4.29E-06
Average 1.62E-07 6.37E-07 2.13E-06
40K
Minimum 1.06E-05 2.95E-06 9.47E-06
Maximum 7.39E-05 1.22E-05 3.72E-05
Average 2.63E-05 6.16E-06 1.95E-05
2011
241Am
Minimum -2.04E-09 1.75E-09 3.13E-09
Maximum 1.36E-08 7.51E-09 2.63E-08
Average 3.62E-09 3.81E-09 1.12E-08
238Pu
Minimum -1.19E-08 1.87E-09 5.99E-09
Maximum 1.46E-08 1.41E-08 5.48E-08
Average 1.44E-09 5.96E-09 2.40E-08
239+240Pu
Minimum 1.37E-09 2.45E-09 5.38E-09
Maximum 3.92E-08 1.44E-08 5.24E-08
Average 1.83E-08 8.14E-09 2.26E-08
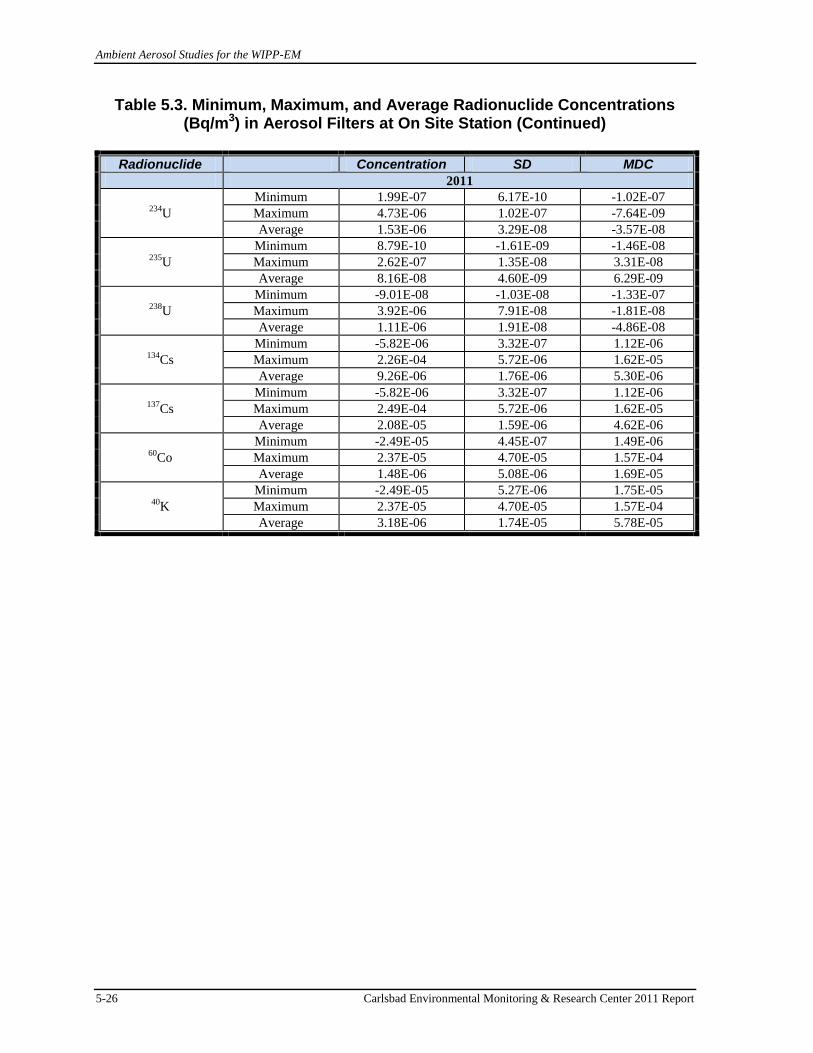
Ambient Aerosol Studies for the WIPP-EM
5-26 Carlsbad Environmental Monitoring & Research Center 2011 Report
Table 5.3. Minimum, Maximum, and Average Radionuclide Concentrations (Bq/m3) in Aerosol Filters at On Site Station (Continued)
Radionuclide Concentration SD MDC
2011
234U
Minimum 1.99E-07 6.17E-10 -1.02E-07
Maximum 4.73E-06 1.02E-07 -7.64E-09
Average 1.53E-06 3.29E-08 -3.57E-08
235U
Minimum 8.79E-10 -1.61E-09 -1.46E-08
Maximum 2.62E-07 1.35E-08 3.31E-08
Average 8.16E-08 4.60E-09 6.29E-09
238U
Minimum -9.01E-08 -1.03E-08 -1.33E-07
Maximum 3.92E-06 7.91E-08 -1.81E-08
Average 1.11E-06 1.91E-08 -4.86E-08
134Cs
Minimum -5.82E-06 3.32E-07 1.12E-06
Maximum 2.26E-04 5.72E-06 1.62E-05
Average 9.26E-06 1.76E-06 5.30E-06
137Cs
Minimum -5.82E-06 3.32E-07 1.12E-06
Maximum 2.49E-04 5.72E-06 1.62E-05
Average 2.08E-05 1.59E-06 4.62E-06
60Co
Minimum -2.49E-05 4.45E-07 1.49E-06
Maximum 2.37E-05 4.70E-05 1.57E-04
Average 1.48E-06 5.08E-06 1.69E-05
40K
Minimum -2.49E-05 5.27E-06 1.75E-05
Maximum 2.37E-05 4.70E-05 1.57E-04
Average 3.18E-06 1.74E-05 5.78E-05

Ambient Aerosol Studies for the WIPP-EM
Carlsbad Environmental Monitoring & Research Center 2011 Report 5-27
Table 5.4. Minimum, Maximum, and Average Radionuclide Concentrations (Bq/m3) in Aerosol Filters at Near Field Station
Radionuclide Concentration SD MDC
2007
241Am
Minimum 5.32E-10 3.63E-10 4.94E-10
Maximum 4.65E-09 1.37E-09 2.89E-09
Average 1.89E-09 7.65E-10 1.55E-09
238Pu
Minimum -4.35E-09 4.31E-10 8.78E-10
Maximum 2.07E-09 5.33E-09 2.61E-08
Average 4.16E-10 1.94E-09 7.92E-09
239+240Pu
Minimum -3.82E-09 9.78E-10 9.43E-10
Maximum 1.12E-08 6.06E-09 2.80E-08
Average 4.89E-09 2.59E-09 8.01E-09
137Cs
Minimum -1.66E-07 2.00E-07 6.58E-07
Maximum 5.46E-07 5.28E-07 1.74E-06
Average 1.61E-07 3.67E-07 1.21E-06
60Co
Minimum -6.34E-07 1.84E-07 6.10E-07
Maximum 1.11E-06 5.71E-07 1.90E-06
Average 1.52E-07 3.29E-07 1.10E-06
40K
Minimum 2.82E-06 1.48E-06 3.83E-06
Maximum 3.81E-05 4.06E-06 1.35E-05
Average 1.85E-05 2.56E-06 7.71E-06
2008
241Am
Minimum 1.08E-09 5.80E-10 1.29E-09
Maximum 7.16E-09 2.34E-09 5.52E-09
Average 3.58E-09 1.30E-09 2.50E-09
238Pu
Minimum -3.57E-09 1.06E-09 4.35E-09
Maximum 2.65E-09 2.00E-09 1.14E-08
Average 5.98E-11 1.59E-09 7.30E-09
239+240Pu
Minimum 6.25E-09 2.02E-09 2.00E-09
Maximum 4.90E-08 5.87E-09 8.32E-09
Average 1.85E-08 3.31E-09 5.21E-09
137Cs
Minimum -3.88E-07 1.99E-07 6.60E-07
Maximum 7.26E-07 1.32E-06 4.39E-06
Average 6.44E-08 4.78E-07 1.58E-06
60Co
Minimum -4.38E-07 2.12E-07 7.25E-07
Maximum 1.12E-06 9.17E-07 3.03E-06
Average 1.99E-07 3.89E-07 1.30E-06
40K
Minimum 3.33E-07 1.73E-06 4.77E-06
Maximum 5.83E-05 7.00E-06 2.07E-05
Average 2.14E-05 2.92E-06 8.73E-06
2009
241Am
Minimum 1.71E-09 6.83E-10 7.95E-10
Maximum 7.48E-09 2.21E-09 5.30E-09
Average 5.45E-09 1.32E-09 2.36E-09
238Pu
Minimum -1.94E-09 1.17E-09 4.91E-09
Maximum 1.86E-10 4.95E-09 2.04E-08
Average -7.99E-10 2.46E-09 1.09E-08
239+240Pu
Minimum 9.97E-09 2.39E-09 3.97E-09
Maximum 2.18E-08 5.89E-09 1.03E-08
Average 1.44E-08 3.82E-09 7.37E-09 137
Cs Minimum -5.50E-07 1.22E-07 4.07E-07
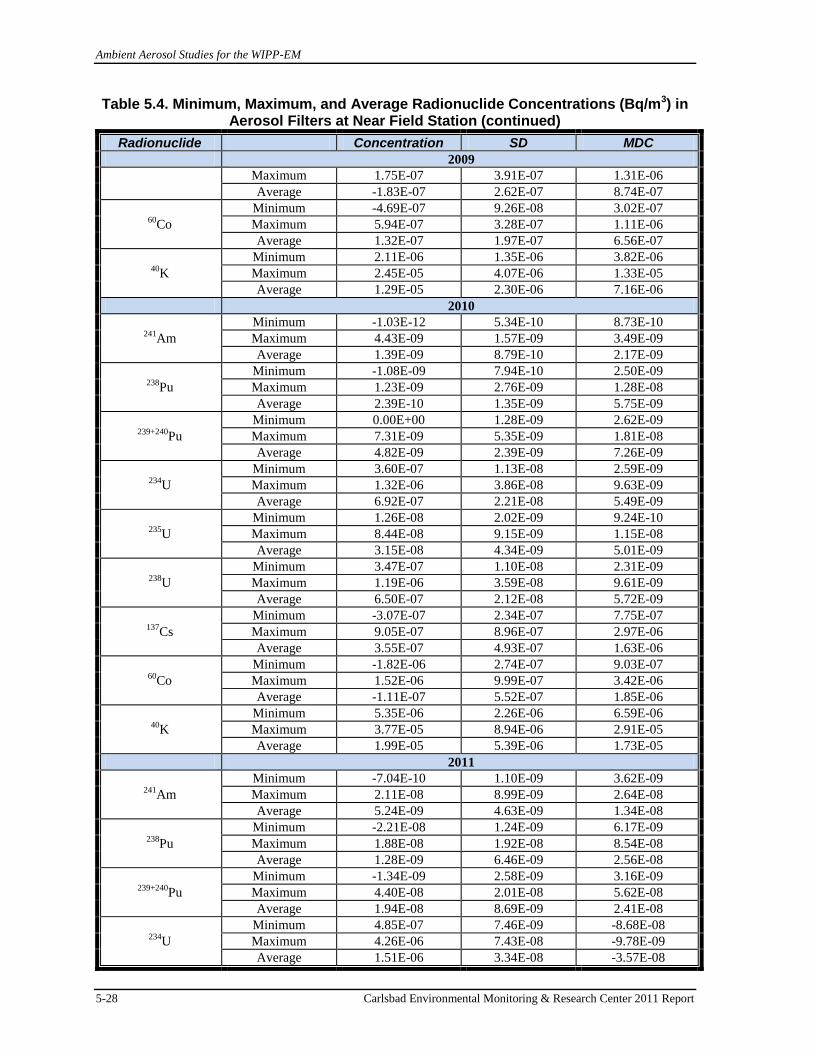
Ambient Aerosol Studies for the WIPP-EM
5-28 Carlsbad Environmental Monitoring & Research Center 2011 Report
Table 5.4. Minimum, Maximum, and Average Radionuclide Concentrations (Bq/m3) in Aerosol Filters at Near Field Station (continued)
Radionuclide Concentration SD MDC
2009
Maximum 1.75E-07 3.91E-07 1.31E-06
Average -1.83E-07 2.62E-07 8.74E-07
60Co
Minimum -4.69E-07 9.26E-08 3.02E-07
Maximum 5.94E-07 3.28E-07 1.11E-06
Average 1.32E-07 1.97E-07 6.56E-07
40K
Minimum 2.11E-06 1.35E-06 3.82E-06
Maximum 2.45E-05 4.07E-06 1.33E-05
Average 1.29E-05 2.30E-06 7.16E-06
2010
241Am
Minimum -1.03E-12 5.34E-10 8.73E-10
Maximum 4.43E-09 1.57E-09 3.49E-09
Average 1.39E-09 8.79E-10 2.17E-09
238Pu
Minimum -1.08E-09 7.94E-10 2.50E-09
Maximum 1.23E-09 2.76E-09 1.28E-08
Average 2.39E-10 1.35E-09 5.75E-09
239+240Pu
Minimum 0.00E+00 1.28E-09 2.62E-09
Maximum 7.31E-09 5.35E-09 1.81E-08
Average 4.82E-09 2.39E-09 7.26E-09
234U
Minimum 3.60E-07 1.13E-08 2.59E-09
Maximum 1.32E-06 3.86E-08 9.63E-09
Average 6.92E-07 2.21E-08 5.49E-09
235U
Minimum 1.26E-08 2.02E-09 9.24E-10
Maximum 8.44E-08 9.15E-09 1.15E-08
Average 3.15E-08 4.34E-09 5.01E-09
238U
Minimum 3.47E-07 1.10E-08 2.31E-09
Maximum 1.19E-06 3.59E-08 9.61E-09
Average 6.50E-07 2.12E-08 5.72E-09
137Cs
Minimum -3.07E-07 2.34E-07 7.75E-07
Maximum 9.05E-07 8.96E-07 2.97E-06
Average 3.55E-07 4.93E-07 1.63E-06
60Co
Minimum -1.82E-06 2.74E-07 9.03E-07
Maximum 1.52E-06 9.99E-07 3.42E-06
Average -1.11E-07 5.52E-07 1.85E-06
40K
Minimum 5.35E-06 2.26E-06 6.59E-06
Maximum 3.77E-05 8.94E-06 2.91E-05
Average 1.99E-05 5.39E-06 1.73E-05
2011
241Am
Minimum -7.04E-10 1.10E-09 3.62E-09
Maximum 2.11E-08 8.99E-09 2.64E-08
Average 5.24E-09 4.63E-09 1.34E-08
238Pu
Minimum -2.21E-08 1.24E-09 6.17E-09
Maximum 1.88E-08 1.92E-08 8.54E-08
Average 1.28E-09 6.46E-09 2.56E-08
239+240Pu
Minimum -1.34E-09 2.58E-09 3.16E-09
Maximum 4.40E-08 2.01E-08 5.62E-08
Average 1.94E-08 8.69E-09 2.41E-08
234U
Minimum 4.85E-07 7.46E-09 -8.68E-08
Maximum 4.26E-06 7.43E-08 -9.78E-09
Average 1.51E-06 3.34E-08 -3.57E-08
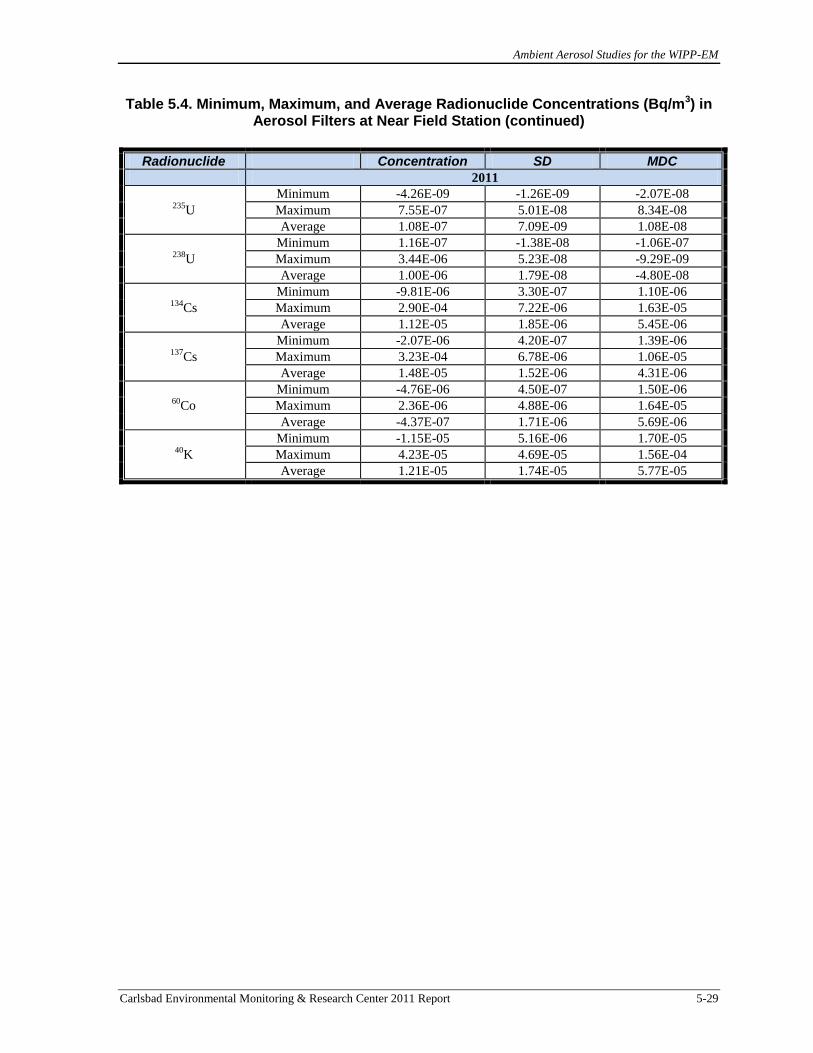
Ambient Aerosol Studies for the WIPP-EM
Carlsbad Environmental Monitoring & Research Center 2011 Report 5-29
Table 5.4. Minimum, Maximum, and Average Radionuclide Concentrations (Bq/m3) in Aerosol Filters at Near Field Station (continued)
Radionuclide Concentration SD MDC
2011
235U
Minimum -4.26E-09 -1.26E-09 -2.07E-08
Maximum 7.55E-07 5.01E-08 8.34E-08
Average 1.08E-07 7.09E-09 1.08E-08
238U
Minimum 1.16E-07 -1.38E-08 -1.06E-07
Maximum 3.44E-06 5.23E-08 -9.29E-09
Average 1.00E-06 1.79E-08 -4.80E-08
134Cs
Minimum -9.81E-06 3.30E-07 1.10E-06
Maximum 2.90E-04 7.22E-06 1.63E-05
Average 1.12E-05 1.85E-06 5.45E-06
137Cs
Minimum -2.07E-06 4.20E-07 1.39E-06
Maximum 3.23E-04 6.78E-06 1.06E-05
Average 1.48E-05 1.52E-06 4.31E-06
60Co
Minimum -4.76E-06 4.50E-07 1.50E-06
Maximum 2.36E-06 4.88E-06 1.64E-05
Average -4.37E-07 1.71E-06 5.69E-06
40K
Minimum -1.15E-05 5.16E-06 1.70E-05
Maximum 4.23E-05 4.69E-05 1.56E-04
Average 1.21E-05 1.74E-05 5.77E-05

Ambient Aerosol Studies for the WIPP-EM
5-30 Carlsbad Environmental Monitoring & Research Center 2011 Report
Table 5.5. Minimum, Maximum, and Average Radionuclide Concentrations (Bq/m3) in Aerosol Filters at Cactus Flats Station
Radionuclide Concentration SD MDC
2007
241Am
Minimum 2.28E-10 7.19E-10 1.42E-09
Maximum 3.76E-09 3.01E-09 1.03E-08
Average 2.45E-09 1.24E-09 3.56E-09
238Pu
Minimum -2.31E-09 5.94E-10 1.95E-09
Maximum 7.51E-09 5.46E-09 1.94E-08
Average 1.09E-09 2.13E-09 7.58E-09
239+240Pu
Minimum 3.91E-09 1.48E-09 2.61E-09
Maximum 9.93E-09 9.04E-09 3.27E-08
Average 7.11E-09 3.44E-09 1.05E-08
137Cs
Minimum -2.00E-07 1.96E-07 6.50E-07
Maximum 5.43E-07 6.08E-07 2.01E-06
Average 1.50E-07 3.58E-07 1.18E-06
60Co
Minimum -2.24E-06 1.77E-07 5.88E-07
Maximum 8.94E-07 3.40E-06 1.14E-05
Average -3.00E-07 6.29E-07 2.11E-06
40K
Minimum -1.36E-07 1.41E-06 3.91E-06
Maximum 2.18E-05 4.28E-06 1.42E-05
Average 6.85E-06 2.95E-06 9.58E-06
2008
241Am
Minimum 1.39E-09 6.27E-10 1.45E-09
Maximum 9.20E-09 1.90E-09 2.74E-09
Average 5.08E-09 1.24E-09 2.01E-09
238Pu
Minimum -2.47E-09 7.38E-10 6.56E-10
Maximum 2.63E-09 4.28E-09 1.86E-08
Average 1.06E-09 1.80E-09 6.38E-09
239+240Pu
Minimum 1.53E-09 1.35E-09 6.56E-10
Maximum 2.13E-08 3.97E-09 7.25E-09
Average 1.11E-08 2.57E-09 4.39E-09
137Cs
Minimum -4.64E-07 2.05E-07 6.70E-07
Maximum 6.79E-07 1.36E-06 4.52E-06
Average 2.38E-07 4.42E-07 1.46E-06
60Co
Minimum -5.16E-07 1.72E-07 5.72E-07
Maximum 2.36E-06 9.54E-07 3.11E-06
Average 2.89E-07 3.49E-07 1.16E-06
40K
Minimum -4.92E-06 1.77E-06 4.87E-06
Maximum 7.16E-05 6.74E-06 1.88E-05
Average 1.85E-05 2.89E-06 8.76E-06
2009
241Am
Minimum 3.17E-09 7.50E-10 1.27E-09
Maximum 1.92E-08 2.39E-09 4.99E-09
Average 7.43E-09 1.57E-09 2.40E-09
238Pu
Minimum -1.71E-09 1.08E-09 4.31E-09
Maximum 3.78E-09 3.58E-09 1.56E-08
Average 7.79E-10 1.92E-09 7.52E-09
239+240Pu
Minimum 3.20E-09 1.92E-09 3.33E-09
Maximum 3.88E-08 5.08E-09 1.44E-08
Average 1.69E-08 3.33E-09 6.74E-09 137
Cs Minimum -1.83E-07 1.20E-07 4.00E-07

Ambient Aerosol Studies for the WIPP-EM
Carlsbad Environmental Monitoring & Research Center 2011 Report 5-31
Table 5.5. Minimum, Maximum, and Average Radionuclide Concentrations (Bq/m3) in Aerosol Filters at Cactus Flats Station (continued)
Radionuclide Concentration SD MDC
2009
Maximum 2.95E-07 4.10E-07 1.36E-06
Average 2.75E-08 2.59E-07 8.60E-07
60Co
Minimum -5.01E-07 9.29E-08 3.00E-07
Maximum 6.36E-07 3.50E-07 1.18E-06
Average 1.88E-07 2.01E-07 6.66E-07
40K
Minimum -1.50E-06 1.29E-06 4.32E-06
Maximum 2.25E-05 4.23E-06 1.38E-05
Average 1.03E-05 2.47E-06 7.85E-06
2010
241Am
Minimum -3.46E-10 5.88E-10 1.54E-09
Maximum 3.50E-09 1.56E-09 5.31E-09
Average 1.72E-09 1.14E-09 3.30E-09
238Pu
Minimum -2.68E-09 8.27E-10 3.43E-09
Maximum 1.24E-09 1.97E-09 9.54E-09
Average -8.79E-10 1.29E-09 6.08E-09
239+240Pu
Minimum 3.79E-10 1.11E-09 3.78E-09
Maximum 5.44E-09 3.41E-09 1.11E-08
Average 2.89E-09 1.88E-09 6.11E-09
234U
Minimum 2.67E-07 9.57E-09 2.37E-09
Maximum 1.13E-06 3.40E-08 8.27E-09
Average 6.13E-07 1.99E-08 5.21E-09
235U
Minimum 7.85E-09 1.59E-09 2.36E-09
Maximum 5.41E-08 6.50E-09 1.05E-08
Average 2.73E-08 3.99E-09 5.59E-09
238U
Minimum 2.52E-07 9.24E-09 2.36E-09
Maximum 1.02E-06 3.15E-08 7.92E-09
Average 5.69E-07 1.89E-08 5.21E-09
137Cs
Minimum -2.83E-07 2.35E-07 7.80E-07
Maximum 4.59E-07 7.16E-07 2.38E-06
Average 1.18E-07 3.84E-07 1.27E-06
60Co
Minimum -7.00E-07 2.74E-07 9.05E-07
Maximum 1.07E-06 8.54E-07 2.83E-06
Average 1.87E-07 4.43E-07 1.47E-06
40K
Minimum -4.60E-07 2.39E-06 6.77E-06
Maximum 3.32E-05 8.82E-06 2.91E-05
Average 1.01E-05 4.46E-06 1.45E-05
2011
241Am
Minimum -6.76E-09 1.78E-09 4.41E-09
Maximum 2.06E-08 8.57E-09 3.44E-08
Average 4.61E-09 4.77E-09 1.51E-08
238Pu
Minimum -4.15E-08 1.65E-09 2.98E-09
Maximum 3.12E-08 2.21E-08 1.18E-07
Average -3.18E-09 7.12E-09 3.14E-08
239+240Pu
Minimum 3.70E-09 2.33E-09 4.56E-09
Maximum 8.21E-08 2.77E-08 1.06E-07
Average 1.71E-08 9.26E-09 2.91E-08

Ambient Aerosol Studies for the WIPP-EM
5-32 Carlsbad Environmental Monitoring & Research Center 2011 Report
Table 5.5. Minimum, Maximum, and Average Radionuclide Concentrations (Bq/m3) in Aerosol Filters at Cactus Flats Station (continued)
Radionuclide Concentration SD MDC
2011
234U
Minimum 4.44E-07 6.75E-09 -8.42E-08
Maximum 3.30E-06 1.06E-07 -1.48E-08
Average 1.42E-06 3.28E-08 -3.72E-08
235U
Minimum -7.74E-09 -3.02E-09 -6.94E-09
Maximum 2.60E-07 1.67E-08 4.41E-08
Average 7.41E-08 4.31E-09 6.58E-09
238U
Minimum -1.43E-07 -1.18E-08 -1.17E-07
Maximum 2.97E-06 7.98E-08 -4.72E-09
Average 9.35E-07 1.76E-08 -4.62E-08
134Cs
Minimum -1.18E-05 3.69E-07 1.26E-06
Maximum 2.30E-04 5.79E-06 1.33E-05
Average 8.73E-06 1.81E-06 5.46E-06
137Cs
Minimum -9.00E-07 4.27E-07 1.41E-06
Maximum 2.55E-04 5.42E-06 8.91E-06
Average 1.28E-05 1.50E-06 4.36E-06
60Co
Minimum -3.67E-06 4.54E-07 1.52E-06
Maximum 6.90E-06 3.82E-06 1.27E-05
Average -2.30E-07 1.73E-06 5.77E-06
40K
Minimum -3.83E-05 5.52E-06 1.84E-05
Maximum 4.66E-05 3.87E-05 1.30E-04
Average -4.48E-07 1.80E-05 6.01E-05
Impact of Fukushima Nuclear Power Plant Accident
Carlsbad Environmental Monitoring & Research Center 2011 Report 6-1
CHAPTER 6
Impact of Fukushima Nuclear Power Plant Accident Introduction
On March 11, 2011 a massive 9.0 earthquake and ensuing tsunami struck the northern
coast of Honshu-island, Japan and severely damaged the electric system of the Fukushima-
Daiichi Nuclear Power Plant (NPP; Figure 6.1). The structural damage to the plant disabled
the reactor’s cooling system resulting in hydrogen explosions on March 12 and 14 in the Unit
1 and 3 reactors, respectively. On March 15 other explosions occurred in the Unit 4 reactor
building and the Unit 2 reactor. Subsequent fires and possible partial core meltdowns
released radioactive fission products into the atmosphere. The atmospheric release from the
crippled Fukushima NPP started on March 12, 2011 with a maximum release phase from
March 14 to 17. The radioactivity released was dominated by volatile fission products
including isotopes of the noble gases xenon (133
Xe) and krypton (85Kr), iodine (131I, 132I),
cesium (134Cs, 136Cs, 137Cs), and tellurium (132Te). The non-volatile radionuclides such
as isotopes of strontium and plutonium are believed to have remained largely inside the
reactor although there is evidence of a release of plutonium into the environment (Zheng et
al, 2012). Although the Japanese Government and the Tokyo Electric Power Company
(TEPCO) adopted a series of measures, the accident gradually became a level 7 nuclear event
on the INES (International Nuclear Event Scale) due to high radiation released in the first
few days. The release from the Fukushima Daiichi NPP was significant, but due to the transit
time and significant dilution of the radioactivity in the atmosphere as the contaminated air
mass was transported across the across the Pacific toward the North American and European
continents, the levels of radioactivity measured were extremely small and not of concern
from a public health point of view.
First commissioned in 1971, the Fukushima-Daiichi NPP consists of six boiling water
reactors (BWR) or units operated by TEPCO (Table 6.1 and Figure 6.2). When operational, it
provided a total of 4.7 gigawatts of electrical power making this facility one of the 15 largest
nuclear power installations in the world. At the time of the quake, 3 of the units (reactors 1-3)
were operating while the other 3 (reactors 4-6) were in a state of cold shutdown for periodic
maintenance [8]. The reactors 1-3 shut down automatically after the earthquake, and
emergency generators came online to stabilize electronic controls and coolant systems.
Although the Fukushima-Daiichi NPP was designed to withstand waves of up to 5.7 meters,
the flooding and destruction that resulted from 14 meter waves as a result of the earthquake
induced tsunami disabled emergency generators required to cool the reactors. As a result, the
cooling system stopped working triggering the severe chain reaction of accidents at the
Fukushima-Daiichi NPP. The high temperature turned most of the internal coolant water into
steam, which in turn exposed the fuel rods to air. In order to avoid a total meltdown of the
fuel rods, operators of the plants tried to inject coolant water from external sources (first sea
water and later fresh water). Unfortunately, the injected coolant water turned into stream and
further increased the pressure inside the reactor vessels. Operators had to vent radioactive
gases into the air in an attempt to reduce mounting pressure inside the reactor vessels which
resulted in hydrogen gas explosions and a release of radioactivity into the environment.
Coolant water that did not escape the vessel, in the form of steam, accumulated at the bottom

Impact of Fukushima Nuclear Power Plant Accident
6-2 Carlsbad Environmental Monitoring & Research Center 2011 Report
of the reactors. These radioactive waters either leaked or were discharged into the Pacific
Ocean. Despite these attempts, the fuel rods in units 1, 2 and 3 were reported to have
experienced serious damage and possible total meltdown (TEPCO 2011; CNN 2011).
Background
Japan is one of the world’s top consumers of nuclear energy. The country’s 17
nuclear plants, boasting 55 reactors in total, provided about 30 % of the country’s total
electricity needs. With virtually no natural resources, Japan has considered nuclear power as
an alternative to oil and other fossil fuels since the 1960s. The reactors at Fukushima date
back to the 1960s and are of a design known as boiling water reactors (BWR; Figure 6.3). A
controlled nuclear reaction produced by fuel rods containing pellets of enriched uranium
creates heat used to make steam that turns turbines in order to produce electricity. The flow
of water into and out of the plant serves to cool the reactors. Given its geographic location,
the planning for earthquakes and tsunamis is highly developed in Japan; however, the 9.0
earthquake and the giant waves that followed it overwhelmed the reactors' safety systems. As
a result, in addition to power being disrupted by the earthquake in the area surrounding the
Fukushima-Daiichi NPP, the waves from the earthquake-induced tsunami poured over the
sea wall surrounding the plant thereby disabling the power plant’s back-up diesel generators.
In response to the Japanese nuclear incident, the CEMRC accelerated and increased
sampling frequency and analysis of airborne constituents in and around the WIPP site to
confirm that there were no harmful levels of radiation reaching the U.S. from Japan and to
better inform the public about any level of radiation detected. This report covers the first
three months of air radiation monitoring following the Fukushima nuclear disaster in 2011
and is intended to inform a wider public about the exact time and nature of the arrival of
fission products to the Carlsbad area. CEMRC recorded the first arrival of airborne fission
products 131I, 132Te, 134Cs and 137Cs in Carlsbad, NM, USA in the air filter which was
exposed from March 14-April 01, 2011. A description of the radioactive nuclides emitted by
the Fukushima NPP, their half-lives, and the analytical techniques used to detect them are
listed in Tables 6.2 and 6.3 respectively. Additionally, the concentrations of radioactivity
detected in the Carlsbad, NM region are listed in Table 6.4 and Figure 6.4. Lastly, Figures
6.2 through 6.21 show the concentrations of radioactivity detected at various places around
the world from the Fukushima NPP accident.
From a public health standpoint, the isotopes of 131I and 137Cs are of most interest
because if high concentrations of 131I are inhaled or ingested, the radioactive iodine can
concentrate in the thyroid and thereby increase the risk for cancer in that organ. Additionally,
cesium is chemically similar to potassium and will behave like potassium in the body;
therefore, inhalation or ingestion of high concentrations of radioactive cesium can build up in
multiple locations throughout the body, leading to an increased risk of various cancers. It is
important to note that all of the radiation levels detected by CEMRC have been very low,
well below any level of public health concern. CEMRC saw decreasing radiation levels
during April and May, 2011. Since May 2011, sample analyses have predominantly shown
no detections of radionuclides associated with the Japanese nuclear incident. The activity of
131I measured was at least a factor of ~1,500 below the limit given by the Environmental
Protection Agency (EPA) of 3.7 Bq/m3.

Impact of Fukushima Nuclear Power Plant Accident
Carlsbad Environmental Monitoring & Research Center 2011 Report 6-3
The average dose received by the public from nuclear power is 0.0002 millisievert per
year (mSv/yr), which is of the order of 10,000 times smaller than the total yearly dose
received by the public from background radiation. Naturally occurring background radiation
is the main source of exposure for most people, and provides some perspective on radiation
exposure from nuclear energy. The average dose received from background radiation is
around 2.4 mSv/yr, which can vary depending on the geology and altitude where people live,
ranging between 1 and 10 mSv/yr, but can be more than 50 mSv/yr. The highest known level
of background radiation affecting a substantial population is in Kerala and Madras states in
India where some 140,000 people receive doses averaging over 15 mSv/yr from gamma
radiation, in addition to a similar dose from radon. Comparable levels occur in Brazil and
Sudan, with average exposures up to about 40 mSv/yr to many people. Several places are
known in Iran, India, and Europe where natural background radiation gives an annual dose of
more than 50 mSv and up to 260 mSv (at Ramsar in Iran). Lifetime doses from natural
radiation range up to several thousand mSv. However, there is no evidence of increased
cancers or other health problems arising from these abnormally-high natural levels.
Radiation protection standards assume that any dose of radiation, no matter how
small, involves a possible risk to human health. However, available scientific evidence does
not indicate any cancer risk or immediate effects at doses below 100 mSv a year. At low
levels of exposure, the body's natural repair mechanisms seem to be adequate to repair
radiation damage to cells soon after it occurs.
Table 6.1. Fukushima Daiichi Units
Unit Number Type First criticality Electric power
1 BWR-3 October 10, 1970 460 MW
2 BWR-4 May 10, 1973 784 MW
3 BWR-4 September 6, 1974 784 MW
4 BWR-4 January 28, 1978 784 MW
5 BWR-4 August 26, 1977 784 MW
6 BWR-5 March 9, 1979 1,100 MW

Impact of Fukushima Nuclear Power Plant Accident
6-4 Carlsbad Environmental Monitoring & Research Center 2011 Report
Source: IAEA (2011)
Figure 6.1. Nuclear Power Plant Sites in Japan Affected by the Great East Japan Earthquake
Source: Google Earth
Figure 6.2. Layout of the Fukushima Daiichi NPP site
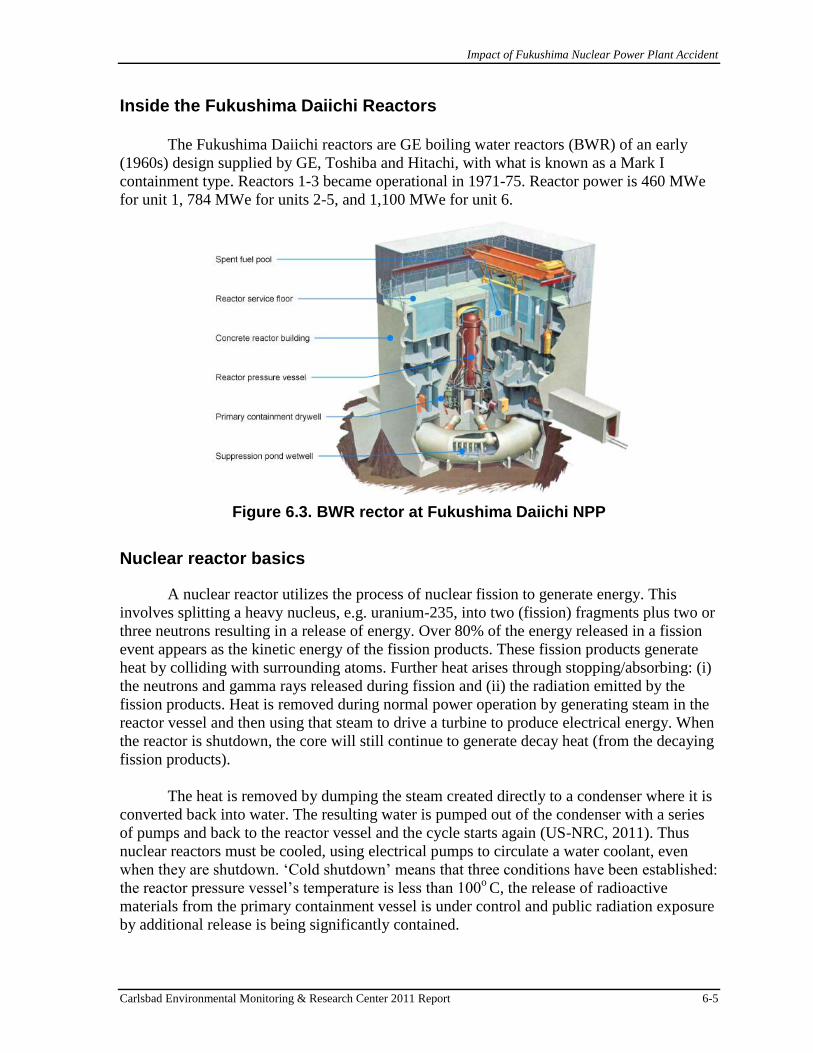
Impact of Fukushima Nuclear Power Plant Accident
Carlsbad Environmental Monitoring & Research Center 2011 Report 6-5
Inside the Fukushima Daiichi Reactors
The Fukushima Daiichi reactors are GE boiling water reactors (BWR) of an early
(1960s) design supplied by GE, Toshiba and Hitachi, with what is known as a Mark I
containment type. Reactors 1-3 became operational in 1971-75. Reactor power is 460 MWe
for unit 1, 784 MWe for units 2-5, and 1,100 MWe for unit 6.
Figure 6.3. BWR rector at Fukushima Daiichi NPP
Nuclear reactor basics
A nuclear reactor utilizes the process of nuclear fission to generate energy. This
involves splitting a heavy nucleus, e.g. uranium-235, into two (fission) fragments plus two or
three neutrons resulting in a release of energy. Over 80% of the energy released in a fission
event appears as the kinetic energy of the fission products. These fission products generate
heat by colliding with surrounding atoms. Further heat arises through stopping/absorbing: (i)
the neutrons and gamma rays released during fission and (ii) the radiation emitted by the
fission products. Heat is removed during normal power operation by generating steam in the
reactor vessel and then using that steam to drive a turbine to produce electrical energy. When
the reactor is shutdown, the core will still continue to generate decay heat (from the decaying
fission products).
The heat is removed by dumping the steam created directly to a condenser where it is
converted back into water. The resulting water is pumped out of the condenser with a series
of pumps and back to the reactor vessel and the cycle starts again (US-NRC, 2011). Thus
nuclear reactors must be cooled, using electrical pumps to circulate a water coolant, even
when they are shutdown. ‘Cold shutdown’ means that three conditions have been established:
the reactor pressure vessel’s temperature is less than 100o C, the release of radioactive
materials from the primary containment vessel is under control and public radiation exposure
by additional release is being significantly contained.

Impact of Fukushima Nuclear Power Plant Accident
6-6 Carlsbad Environmental Monitoring & Research Center 2011 Report
Table 6.2. Properties of Radionuclides Detected following the Fukushima Nuclear Accident outside Japan
Radionuclide Half-lives Comments
Te-132 3.2 days Short-lived volatile fission product
I-131 8.02 days Short-lived volatile fission product
La-140 1.68 days Decay product of Ba-140
I-132 2.3 hours Decay product of Te-132
Cs-134 2.07 years long-lived volatile fission product
Cs-136 13.1 days Short-lived volatile fission product
Cs-137 30.2 years long-lived volatile fission product
Xe-133 5.24 days Noble gas
Table 6.3. Analytical techniques used and typical minimum
detectable activities Measurements Samplers type Analytical
techniques
Typical MDC
24 hour count
Gamma emitters High volume air filter HPGe detector 1-7×10⁻⁶
Bq/m3
Gamma emitters Low volume air filter HPGe detector 1.5×10⁻⁵
Bq/m3
Iodine -131 (gas) Activated charcoal filter HPGe detector 1×10⁻³
Bq/m3
La-140 High volume air filter HPGe detector 2-20× Bq/m3
Xe-133* Noble gas sampler HPGe detector 200×10-6
Bq/m3
Gamma emitters Milk HPGe detector 0.3Bq/L
Gamma emitters Rain water HPGe detector 1 Bq/L
Table 6.4. Concentration of Airborne Fission Products (Bq/m3) Measured In the vicinity of the WIPP Site (Air Samples Employing a Glass Fiber Filter)
Station Sampling Period I-131 Te-132 Cs-134 Cs-137
Cactus Flats 03/14-04/01/2011 2.23E-03 1.98E-04 2.76E-04 2.99E-04
04/01-04/13/2011 2.29E-04 ND 6.54E-06 1.07E-05
04/13-04/20/2011 2.04E-04 ND 1.29E-05 2.03E-05
04/20-05/02/2011 2.39E-05 ND ND ND
05/02-05/13/2011 ND ND ND ND
05/13-05/27/2011 ND ND ND ND
Near Field 03/14-04/01/2011 3.85E-03 2.37E-04 3.79E-04 4.55E-04
04/01-04/13/2011 2.24E-04 ND 7.00E-06 8.59E-06
04/13-04/20/2011 1.96E-04 ND 1.80E-05 2.05E-05
04/20-05/02/2011 2.74E-05 ND ND ND
05/02-05/13/2011 ND ND ND ND
05/13-05/27/2011 ND ND ND ND
Onsite 03/14-04/01/2011 2.31E-03 1.59E-04 2.87E-04 3.22E-04
04/01-04/13/2011 1.97E-04 ND 5.24E-06 9.87E-06
04/13-04/20/2011 1.70E-04 ND 1.26E-05 1.62E-05
04/20-05/02/2011 - - - -
05/02-05/13/2011 ND ND ND ND
05/13-05/27/2011 ND ND ND ND
ND = No Detect

Impact of Fukushima Nuclear Power Plant Accident
Carlsbad Environmental Monitoring & Research Center 2011 Report 6-7
Fukushima Radionuclides in North American Continent
Figure 6.4. Concentration of Airborne Cesium and Iodine (mBq/m3) Measured Between March 15, 2011 – May 27, 2011
Figure 6.5. Concentration of Airborne Cesium and Iodine (mBq/m3) Measured in Berkeley, CA

Impact of Fukushima Nuclear Power Plant Accident
6-8 Carlsbad Environmental Monitoring & Research Center 2011 Report
Figure 6.6. Concentration of Airborne I-131(mBq/m3) Measured in Pacific Islands
Figure 6.7. Concentration of Airborne I-131(mBq/m3) Measured in Alaska
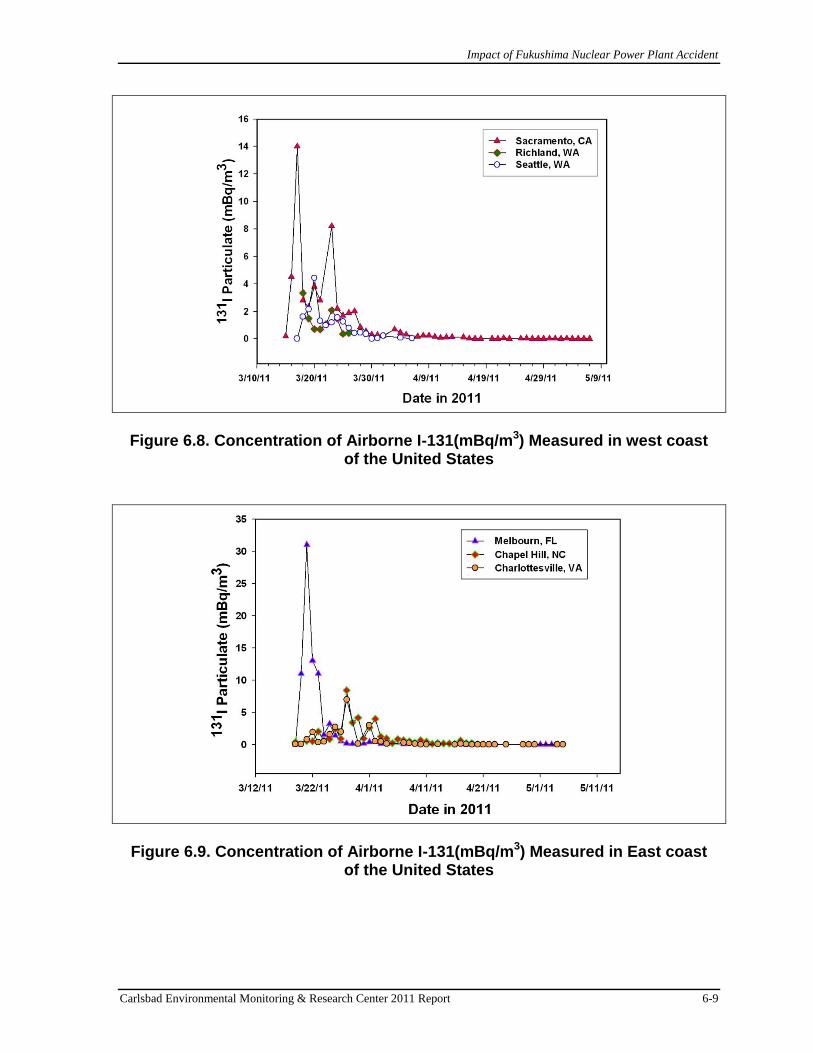
Impact of Fukushima Nuclear Power Plant Accident
Carlsbad Environmental Monitoring & Research Center 2011 Report 6-9
Figure 6.8. Concentration of Airborne I-131(mBq/m3) Measured in west coast of the United States
Figure 6.9. Concentration of Airborne I-131(mBq/m3) Measured in East coast of the United States
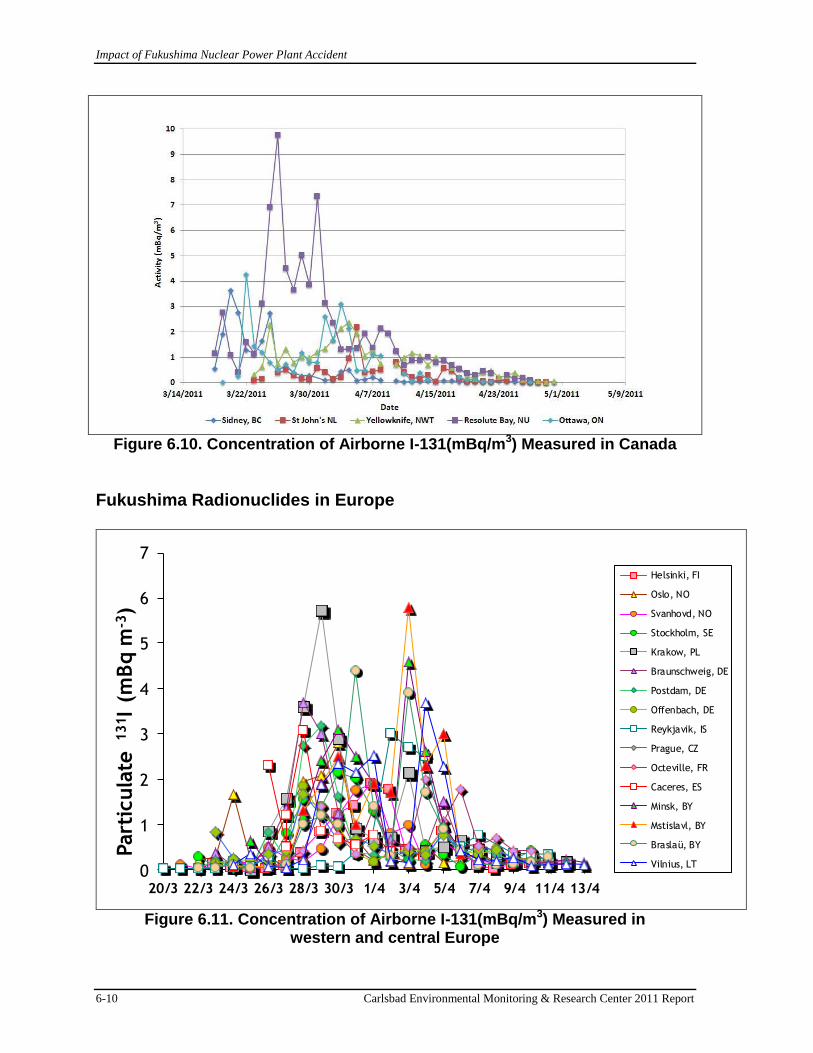
Impact of Fukushima Nuclear Power Plant Accident
6-10 Carlsbad Environmental Monitoring & Research Center 2011 Report
Figure 6.10. Concentration of Airborne I-131(mBq/m3) Measured in Canada
Fukushima Radionuclides in Europe
0
1
2
3
4
5
6
7
20/3 22/3 24/3 26/3 28/3 30/3 1/4 3/4 5/4 7/4 9/4 11/4 13/4
Part
icula
te
131I
(mB
q m
-3)
Helsinki, FI
Oslo, NO
Svanhovd, NO
Stockholm, SE
Krakow, PL
Braunschweig, DE
Postdam, DE
Offenbach, DE
Reykjavik, IS
Prague, CZ
Octeville, FR
Caceres, ES
Minsk, BY
Mstislavl, BY
Braslaü, BY
Vilnius, LT
Figure 6.11. Concentration of Airborne I-131(mBq/m3) Measured in western and central Europe

Impact of Fukushima Nuclear Power Plant Accident
Carlsbad Environmental Monitoring & Research Center 2011 Report 6-11
Figure 6.12. Concentration of Airborne I-131(mBq/m3) Measured in western and central Europe
Figure 6.13. Concentration of Airborne I-131(mBq/m3) Measured in southern Europe

Impact of Fukushima Nuclear Power Plant Accident
6-12 Carlsbad Environmental Monitoring & Research Center 2011 Report
Fukushima Radionuclides in Asia
Figure 6.14. Concentration of Airborne I-131(mBq/m3) Measured in South Korea
Figure 6.15. Concentration of Airborne I-131(mBq/m3) Measured in Hongkong
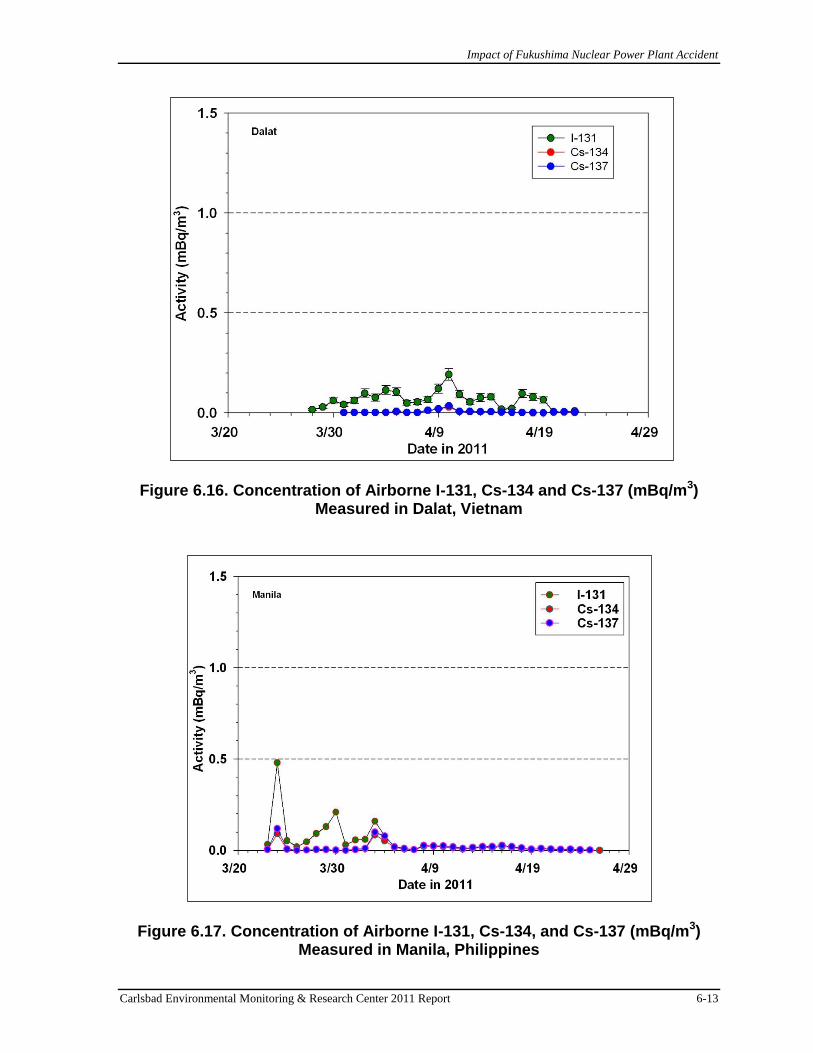
Impact of Fukushima Nuclear Power Plant Accident
Carlsbad Environmental Monitoring & Research Center 2011 Report 6-13
Figure 6.16. Concentration of Airborne I-131, Cs-134 and Cs-137 (mBq/m3) Measured in Dalat, Vietnam
Figure 6.17. Concentration of Airborne I-131, Cs-134, and Cs-137 (mBq/m3) Measured in Manila, Philippines

Impact of Fukushima Nuclear Power Plant Accident
6-14 Carlsbad Environmental Monitoring & Research Center 2011 Report
Figure 6.18. Concentration of Airborne I-131, Cs-134, and Cs-137 (mBq/m3) Measured in Beijing, China
Figure 6.19. Concentration of Airborne I-131, Cs-134, and Cs-137 (mBq/m3) Measured in Shanghai, China

Impact of Fukushima Nuclear Power Plant Accident
Carlsbad Environmental Monitoring & Research Center 2011 Report 6-15
Figure 6.20. Concentration of Airborne I-131 ( Bq/m3) Measured by CTBTO monitoring stations around the world
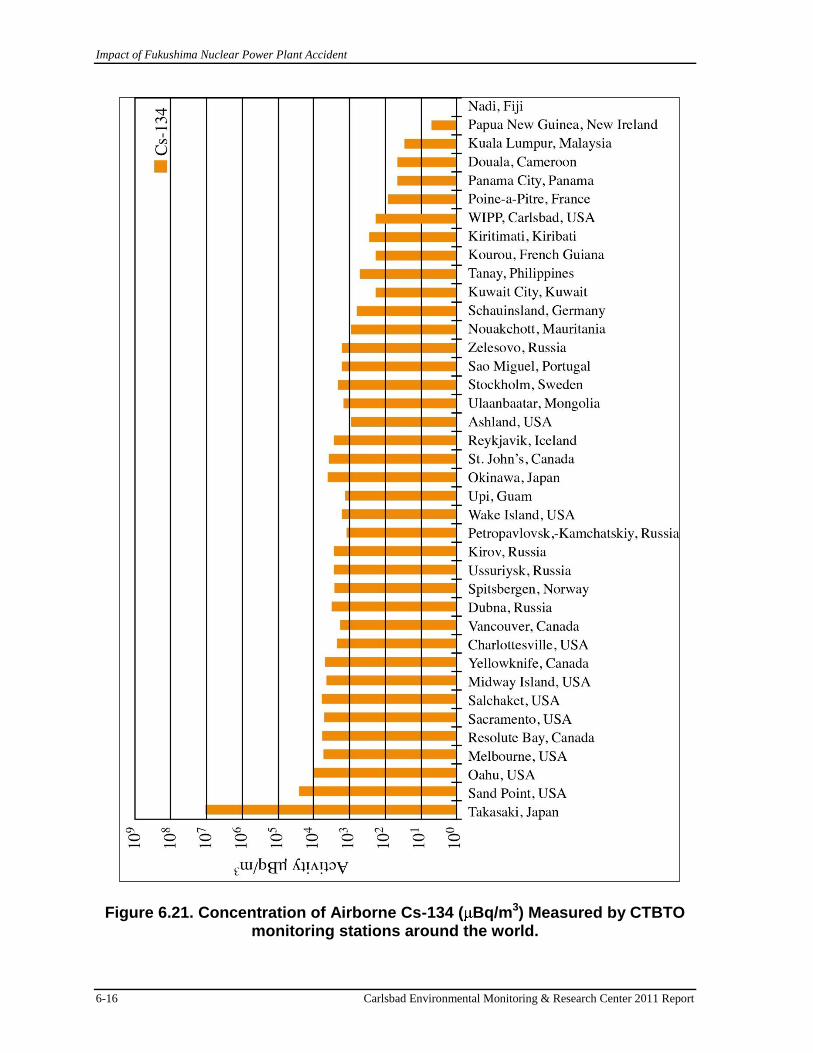
Impact of Fukushima Nuclear Power Plant Accident
6-16 Carlsbad Environmental Monitoring & Research Center 2011 Report
Figure 6.21. Concentration of Airborne Cs-134 ( Bq/m3) Measured by CTBTO monitoring stations around the world.

Impact of Fukushima Nuclear Power Plant Accident
Carlsbad Environmental Monitoring & Research Center 2011 Report 6-17
Conclusion
This chapter provides an overview of the radionuclides measured across the northern
hemisphere. Air monitoring across the northern hemisphere was increased following the first
reports of atmospheric releases from the Fukushima-Daiichi NPP. It is important to note that
all of the radiation levels detected outside Japan have been very low, well below any level of
public and environmental concern. As of April 13, 2011 the average level of radioactivity
picked up by the stations worldwide continued to decline, which is also due to the relatively
short half-lives of 131
I (8 days) and 133
Xe (5.2 days). While the Fukushima radionuclides were
detectable in the Northern hemisphere as far as China and the Philippines, countries outside
Japan received very little deposition of radionuclides from the accident.


An External Review of the CEMRC Quality Assurance Plan
Carlsbad Environmental Monitoring & Research Center 2011 Report 7-1
CHAPTER 7
An External Review of the CEMRC Quality Assurance Plan
Introduction
At the request of Interim Director Dr. George Mulholland, personnel from the Sandia
National Laboratories (SNL) Carlsbad Office conducted a high-level external review of the
governing quality assurance (QA) controlled documents for the Carlsbad Environmental
Monitoring and Research Center (CEMRC) during the month of August, 2011.
The primary purpose of the review was to compare the CEMRC Quality Assurance
Plan (QAP) and the CEMRC QA program procedures against the governing Washington
TRU Solutions Quality Assurance Program (WP 13-1). In addition, SNL representatives also
conducted a brief review of the technical program procedures for the Environmental
Chemistry (EC), Organic Chemistry (OC), Radiochemistry (RC), Field Programs (FP),
Informatics and Modeling (IM), and Internal Dosimetry (ID) functional areas to ensure that
they met CEMRC QAP requirements for implementing procedures. Lastly, SNL
representatives conducted a site visit of CEMRC laboratory areas, inspected records and
controlled documents, and interviewed staff members in accordance with the review.
Results
The SNL review concluded that the CEMRC Quality Assurance Program adequately
addressed the requirements of WP 13-1 Washington TRU Solutions LLC Quality Assurance
Program Description. In addition, it was determined that the elements addressed in the
CEMRC Quality Assurance Plan (CP-QAP-004) were satisfactorily implemented and
effective. Lastly, SNL representatives stated that all CEMRC department managers were
very knowledgeable of the work being conducted and were very conscientious of CEMRC
QA requirements including applicable QA records produced during audit activities.
Recommendations and Observations
Observation 1: SNL reviewers stated that there is a contradiction between CP-PROC-012
(Nonconformances and Non-Routine Events) which states that a trend analysis will be
performed annually and WP-13 which states that a trend analysis will be performed semi-
annually.
Following a conversation with CEMRC personnel, this contradiction will not be addressed as
CEMRC personnel believe that an annual trend analysis of nonconformances or non-routine
events is sufficient given the low number of NCRs/NREs issued on an annual basis.
Recommendation 1: For procedures RC-PROC-001 (Calibration, Operation, &
Maintenance of Canberra Intrinsic-Germanium Coaxial Gamma Spectrometers and
Intrinsic-Germanium Well Gamma Spectrometers) section 3.2 (Liquid Sample Calibration)
and RC-PROC-008 (Calibration, Operation, And Maintenance of a Canberra Oasis Alpha
Spectrometer Using ORTEC Alphavision Software) section 3.3.13(Detector Background
Determination), SNL reviewers stated that the procedure and acceptance criteria were not
adequately defined.
An External Review of the CEMRC Quality Assurance Plan
7-2 Carlsbad Environmental Monitoring & Research Center 2011 Report
CEMRC personnel stated that they will review and revise the procedures during their next
regularly scheduled review cycle.
Recommendation 2: SNL reviewers stated that procedure RC-PROC-009 (Calculating Alpha
Spectroscopy Analysis Results) did not contain a safety section per the requirements of CP-
QAP-004.
CEMRC personnel stated that they will review and revise the procedure during its next
regularly scheduled review cycle.
Recommendation 3: SNL reviewers stated that procedure RC-PROC-027 (Determination of
Americium and Plutonium in 10-gram Sample of Soil) did not contain an appendices or QA
section per the requirements of CP-QAP-004.
CEMRC personnel stated that they will review and revise the procedure during its next
regularly scheduled review cycle.
All other observations and recommendations made by SNL personnel were corrected during the course of the review.

Appendices
Carlsbad Environmental Monitoring & Research Center 2011 Report A-1
APPENDICES
APPENDIX A: BRIEF HISTORY OF CARLSBAD ENVIRONMENTAL MONITORING AND RESEARCH PROGRAM
The Carlsbad Environmental Monitoring & Research Center (CEMRC) was created
in 1991 as a division of the Waste-management Education & Research Consortium (WERC),
in the College of Engineering at New Mexico State University (NMSU). The CEMRC was
conceived as a result of inquiries to WERC by concerned citizens of the Carlsbad region,
acting as a grassroots coalition who recognized the need for high-quality, independent, health
and environmental assessment data. Many individuals and organizations supported the
CEMRC’s formation including the residents of Carlsbad, NM, and the surrounding region;
NMSU; the Carlsbad Department of Development; the New Mexico Congressional
Delegation; the New Mexico Radioactive and Hazardous Materials Committee;
Westinghouse Electric Corporation; and the U.S. Department of Energy (DOE). The
CEMRC was established with a financial assistance grant entitled “Carlsbad Environmental
Monitoring and Research Program” (CEMRP) from the DOE to NMSU. The CEMRP was
initially funded for $27 million over a seven-year period (1991–1998). Subsequently, the
grant was increased to almost $33 million to support operations of the program until 2008.
Dr. Rohinton (Ron) K. Bhada served as Project Director for the CEMRP during 1991-
1999. Dr. Donald J. Fingleton served as Director of the CEMRC during 1991-1996. In 1996,
Dr. Marsha Conley became Director of Operations and in 1997, Director. Dr. Conley was
named CEMRP Project Director in 1999. In July 2001, Dr. Conley retired and Dr. George
Hidy acted as an interim director until February 2002, when Mr. Joel Webb was appointed
Director of CEMRC. In September 2003, Dr. Deborah Moir became acting interim director
during the search for a new permanent director. At the same time, the CEMRP grant ended,
the environmental monitoring program stopped, and Washington TRU Solutions (WTS) and
Los Alamos National Labs (LANL) provided operating funds to CEMRC in exchange for
radiochemistry collaborations under contract at CEMRC which included residence of their
staff in office and laboratory space at CEMRC. In September 2004, Dr. James Conca was
appointed Director of CEMRC. In FY2005 the CEMRP grant was reinstated at about half the
annual funding level ($1.2M). The grant funding was increased in 2007 to $1.84M and WTS
funding was increased to accommodate new VOC analyses. In 2008, the Louisiana Energy
Service’s (LES) Nuclear Enrichment Facility (NEF) in Eunice began developing a program
with CEMRC. Dr. James Conca served as Director of the CEMRC until August 2010. In
September 2010, Dr. George Mulholland became interim director of CEMRC until January
2012. In January 2012, Mr. Russell Hardy was named as the Director or CEMRC and still
holds the Director position as of December 2012.
Temporary office accommodations for the CEMRC initially were provided at the
NMSU-Carlsbad campus beginning in 1991. In 1992, the CEMRC moved to a leased facility
at 800 West Pierce in Carlsbad, which served as a basis for operations through December
1996. Flatow Moore Bryan Shaffer McCabe Architects (Albuquerque, New Mexico) and
Research Facilities Design (San Diego, California) were selected in 1991 to design the
CEMRC’s permanent facility. In December of 1993, DOE Secretary Hazel O’Leary made a
commitment to provide approximately $7 million in additional funding to support debt

Appendices
A-2 Carlsbad Environmental Monitoring & Research Center 2011 Report
service for construction of the new facility. In 1994, the NMSU Board of Regents approved
the sale of New Mexico State University Research Corporation Lease Revenue bonds to
secure construction money. Construction of the Phase I facility began in August 1995 and
was completed in December 1996. The facility is located adjacent to the NMSU-Carlsbad
campus, on 22 acres of land donated to NMSU by then New Mexico State Representative
Robert S. Light (D-55th District). On March 23, 1997, the Phase I facility was named the
Joanna and Robert Light Hall.
In addition to work associated with the design and construction of buildings for the
CEMRC, a variety of other developmental projects were undertaken to support the
CEMRC’s scientific activities. In 1993, design began for the Mobile Bioassay Laboratory
(MBL) that would complement the facilities planned for the new CEMRC building.
Construction of the MBL began in 1994, and the unit was completed and delivered to
Carlsbad in 1996. A Radioactive Material License was submitted to the New Mexico
Environment Department, and the license was issued in 1996. The MBL was loaned to the
DOE Rocky Flats site in Colorado during 2003-2005 to assist in decommissioning of that site
which was successfully completed in 2005 with the unit returning to CEMRC. In 2005,
funding was obtained by CEMRC from the City of Carlsbad, partially matched by CEMRC,
to undertake a major redesign of the radiochemistry laboratory space and to build an actinide
chemistry laboratory for use by LANL and CEMRC staff to carry out experiments with Pu, U
and Np, primarily with the focus of confirming previous WIPP-related performance
assessments with respect to actinide elements in brine under repository conditions. The
renovation was completed in 2006. Subsequently, other laboratory improvements occurred in
2006 such as the building of a new volatile organic compound (VOC) laboratory and the
replacement of most of the ventilation system. These improvements were jointly funded by
DOE, WTS and CEMRC. Additionally, a new sector-field mass spectrometry laboratory for
uranium analysis was completed at CEMRC in 2008. Lastly, replacement of major portions
of the facility began in 2008 and will continue to 2012, including replacement of the roof,
major detectors, the phone system, upgrade of the electrical system and ventilation system,
and upgrade of the Radioactive Materials License to accommodate higher activity levels.
In 1999, CEMRC was separated from WERC and became a division reporting
directly to the Dean of Engineering at NMSU. In July 2006, the College of Engineering at
NMSU combined the units CEMRC, WERC and SWTDI under the new Institute for Energy
and the Environment (IEE), managed by Dr. Abbas Ghassemi. In 2011, CEMRC, WERC,
and SWTDI were reorganized within the College of Engineering and now each report to the
Associate Dean for Engineering Research, Dr. Martha Mitchell.

Appendices
Carlsbad Environmental Monitoring & Research Center 2011 Report A-3
APPENDIX B: RECENT PUBLICATIONS
Author Title Publisher/Conference
P. Thakur, S. Ballard, J. L.
Conca
Sequential isotopic determination of
plutonium, thorium, americium and
uranium in the air filter and drinking
water samples around the WIPP site.
Journal of Radioanalytical & Nuclear
Chemistry, vol. 287, p. 311-321, 2011
P. Thakur, J. L. Conca, G.
R. Choppin
Complexation studies of
Cm(III),Am(III), and Eu(III) with
linear and cyclic carboxylates and
polyaminocarboxylates.
J. Coordination Chemistry, vol. 64, p.
3214–3236, 2011.
P. Thakur, Y. Xiong, M.
Borkowski, G. R. Choppin
Improved Thermodynamic Model for
Interaction of EDTA with Trivalent
Actinides and Lanthanide
Geochim Cosmochim Acta
(under review)
P. Thakur, J.L. Conca and
G.R. Choppin, C. J. Dodge
and A. J. Francis
Complexation Thermodynamics and
Structural Studies of Trivalent
Actinide and Lanthanide complexes
with DTPA, MS-325 and HMDTPA,
Radiochim Acta (In Press)
Kumar, A. VOC emissions and ozone formation
from spraying solvent-based
pesticides.
2nd world Congress on Analytical and
Bioanalytical Techniques, San
Francisco, CA, December 16-17, 2011.
(Conference Presentation)
Appendices
A-4 Carlsbad Environmental Monitoring & Research Center 2011 Report
APPENDIX C: PERFORMANCE TESTS AND AUDITS
Below are summaries of external and internal audits, and results for three performance tests;
one for Whole Body Dosimetry (Table C.1, Table C.2, and Figure C.1), one for
Environmental Chemistry Inorganic analysis (Figure C.2), and two for radiochemical
analyses (Tables C.3 and C.5). Table C.4 shows two examples of the daily performance tests
for ICP-MS. In addition, daily QA/QC checks using NIST-traceable must show acceptable
within 5% before work can begin (Table D.4).
Table C.3 shows MAPEP results for three matrices; soil, water, and air filters. Specific
selected analytes are tested each year and may be different for each matrix and between
years. A value in the Result column means that analyte was tested Ref Values are the
nominally correct answer and the Acceptance Range gives the range of values that are
acceptable. Only two analysis results, which were for 241
Am in the filter matrix and gross
beat activity in filter, did not meet the acceptance criteria.
Table C.5 shows NIST results for filters, water and soil. All NIST bias results met the
acceptance criteria for all radionuclides of interest at the WIPP site. Overall, the difference
from the NIST values observed for the test nuclides are ≤ 10%.

Appendices
Carlsbad Environmental Monitoring & Research Center 2011 Report A-5
CEMRC MANAGEMENT ASSESSMENT QUALITY ASSURANCE REPORT
January 1, 2011 – December 31, 2011
This report serves as a periodic review of the Quality Assurance Program at the Carlsbad
Environmental Monitoring & Research Center (CEMRC). The purpose of this report is to
meet the requirement of the CEMRC Quality Assurance Plan (QAP) for an annual
management assessment. This report summarizes procedural development, vendor
qualification, external audits, internal assessments and nonconformance/non-routine events
for January 1, 2011 through December 31, 2011.
Currently, there are 70 active procedures under the CEMRC Controlled Document Program.
These procedures are scheduled for review every two years. Thirty-four vendors are
currently qualified.
An external audit was conducted during the past year on two CEMRC programmatic areas:
Organic Chemistry and Internal Dosimetry. In June 2011, Washington TRU Solutions
(WTS) audited the Volatile Organic Compound Monitoring Program (Organic Chemistry)
and the In-Vivo Radiobioassay Program (Internal Dosimetry). The audit led to
recertification of each program with no findings and two observations. From this quality
assurance perspective both programs continue to demonstrate sound performance.
In addition to the WTS audits cited above, internal audits or surveillances were conducted on
nine CEMRC programmatic areas in 2011. Eleven non-routine events (NREs) and two
nonconformances (NCRs) were recorded for most recent assessment. All NREs have been
closed with the exception of one (NRE 113011RB43), which is to be closed when the WBC
detector 10 is repaired and returned from Canberra. Both NCRs have been closed. As with
the previous annual assessment, none of the incidents involved implementation of a center-
wide procedure. It should also be noted that NREs and NCRs, per se, do not necessarily
indicate a weakness in any particular programmatic area, but rather may reflect a more robust
corrective action program, which benefits Center activities.
In conclusion, the Quality Assurance Program at CEMRC continues to be effectively
implemented as demonstrated by the recertification of Center programs and the absence of
any serious conditions encountered during internal audits. CEMRC continues to be
challenged by limited resources and turnover in personnel, which emphasizes the need for
effective planning and execution of QA duties. It is the goal of the current QA Manager to
fulfill this need.

Appendices
A-6 Carlsbad Environmental Monitoring & Research Center 2011 Report
Table C.1. Blind Check Study for Internal Dosimetry Department 2010/2011 by the Oak Ridge National Laboratory (ORNL) Inter-comparison Studies
In-vivo Program
Inter-comparison Studies In-vivo Program Report Carlsbad Environmental Monitoring & Research Center
2nd Quarter Calendar Year 2010
Set G
ISOTOPE SPIKE ACTIVITY
As of 02/25/10 +/- 2 sigma (nCi)
REPORTED ACTIVITY As of 02/25/10
+/- 2 sigma (nCi)
% RELATIVE
BIAS
Cs-137 96.92 +/ - 4.85 98.27 +/- 4.91 1.4
Co-60 325.24 +/- 16.26 328.17 +/- 16.41 0.90
Co-57 109.99 +/- 5.50 109.89 +/- 5.49 - 0.09
Y-88 70.08 +/- 3.50 70.13 +/- 3.51 0.07
Ba-133 369.97 +/- 18.50 370.10 +/- 18.51 0.04
3rd Quarter Calendar Year 2010
Set I
ISOTOPE SPIKE ACTIVITY
As of 02/25/10 +/- 2 sigma (nCi)
REPORTED ACTIVITY As of 02/25/10
+/- 2 sigma (nCi)
% RELATIVE
BIAS
Cs-137 141.4 +/- 7.1 144.11 +/- 7.21 1.9
Co-60 216.1 +/- 10.8 217.85 +/- 10.89 0.8
Co-57 75.7 +/- 3.8 75.46 +/- 3.77 - 0.3
Y-88 60.2 +/- 3.0 60.07 +/- 3.00 - 0.2
Ba-133 269.7 +/- 13.5 273.60 +/- 13.68 1.4
4th Quarter Calendar Year 2010
Set A
ISOTOPE SPIKE ACTIVITY
As of 02/25/10 +/- 2 sigma (nCi)
REPORTED ACTIVITY As of 02/25/10
+/- 2 sigma (nCi)
% RELATIVE
BIAS
Cs-137 180.0 +/- 9.0 182.23 +/- 9.11 1.2
Co-60 151.2 +/- 7.6 152.77 +/- 7.64 1.0
Co-57 88.7 +/- 4.4 90.64 +/- 4.53 2.2
Y-88 50.2 +/- 2.5 50.05 +/- 2.50 - 0.3
Ba-133 175.9 +/- 8.8 180.57 +/- 9.03 2.7
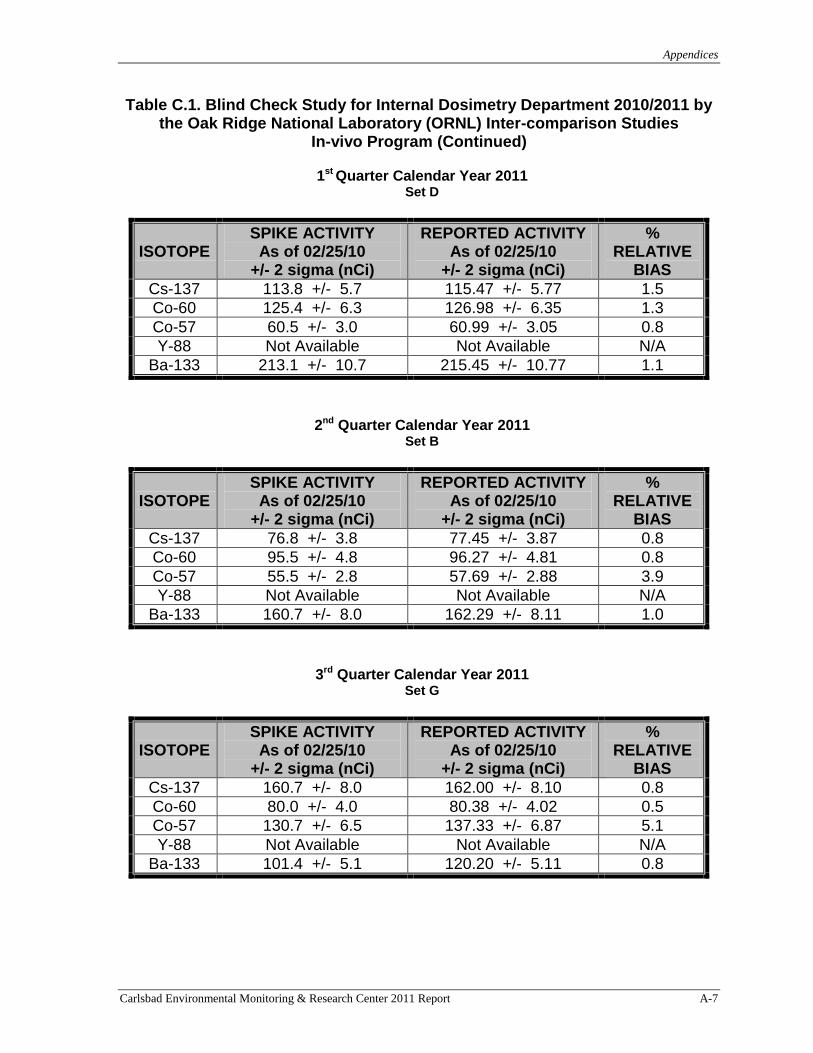
Appendices
Carlsbad Environmental Monitoring & Research Center 2011 Report A-7
Table C.1. Blind Check Study for Internal Dosimetry Department 2010/2011 by the Oak Ridge National Laboratory (ORNL) Inter-comparison Studies
In-vivo Program (Continued)
1st Quarter Calendar Year 2011 Set D
ISOTOPE SPIKE ACTIVITY
As of 02/25/10 +/- 2 sigma (nCi)
REPORTED ACTIVITY As of 02/25/10
+/- 2 sigma (nCi)
% RELATIVE
BIAS
Cs-137 113.8 +/- 5.7 115.47 +/- 5.77 1.5
Co-60 125.4 +/- 6.3 126.98 +/- 6.35 1.3
Co-57 60.5 +/- 3.0 60.99 +/- 3.05 0.8
Y-88 Not Available Not Available N/A
Ba-133 213.1 +/- 10.7 215.45 +/- 10.77 1.1
2nd Quarter Calendar Year 2011
Set B
ISOTOPE SPIKE ACTIVITY
As of 02/25/10 +/- 2 sigma (nCi)
REPORTED ACTIVITY As of 02/25/10
+/- 2 sigma (nCi)
% RELATIVE
BIAS
Cs-137 76.8 +/- 3.8 77.45 +/- 3.87 0.8
Co-60 95.5 +/- 4.8 96.27 +/- 4.81 0.8
Co-57 55.5 +/- 2.8 57.69 +/- 2.88 3.9
Y-88 Not Available Not Available N/A
Ba-133 160.7 +/- 8.0 162.29 +/- 8.11 1.0
3rd Quarter Calendar Year 2011
Set G
ISOTOPE SPIKE ACTIVITY
As of 02/25/10 +/- 2 sigma (nCi)
REPORTED ACTIVITY As of 02/25/10
+/- 2 sigma (nCi)
% RELATIVE
BIAS
Cs-137 160.7 +/- 8.0 162.00 +/- 8.10 0.8
Co-60 80.0 +/- 4.0 80.38 +/- 4.02 0.5
Co-57 130.7 +/- 6.5 137.33 +/- 6.87 5.1
Y-88 Not Available Not Available N/A
Ba-133 101.4 +/- 5.1 120.20 +/- 5.11 0.8

Appendices
A-8 Carlsbad Environmental Monitoring & Research Center 2011 Report
Figure C.1. Comparison of Results for Ten Internal Dosimetry Laboratories in the U.S. During 2011 by the ORNL Intercomparison Studies In-vivo Program
CEMRC is Lab L. For all years that CEMRC has participated in the ORNL program, CEMRC has consistently performed better than all other labs in this area.

Appendices
Carlsbad Environmental Monitoring & Research Center 2011 Report A-9
Table C.2. Quality Assurance/Quality Control for Internal Dosimetry 2011 Audits
Agency Date Conclusion Reason
Oak Ridge National
Laboratory, Inter-comparison Studies Program
Quarterly Pass External
QC
WTS May 7, 2011 – May 9, 2011
No findings
2 observations Pass
Annual
Sandia National Laboratories
August 2011 - March
2012
No observations Satisfactory Performance
External Review

Appendices
A-10 Carlsbad Environmental Monitoring & Research Center 2011 Report
Figure C.2. Blind Check 2011 Environmental Chemistry Inorganic Analyses

Appendices
Carlsbad Environmental Monitoring & Research Center 2011 Report A-11
Table C.3. Radiochemistry MAPEP 2011 Intercomparison Results The full MAPEP reports are available at http://www.inl.gov/resl/mapep/
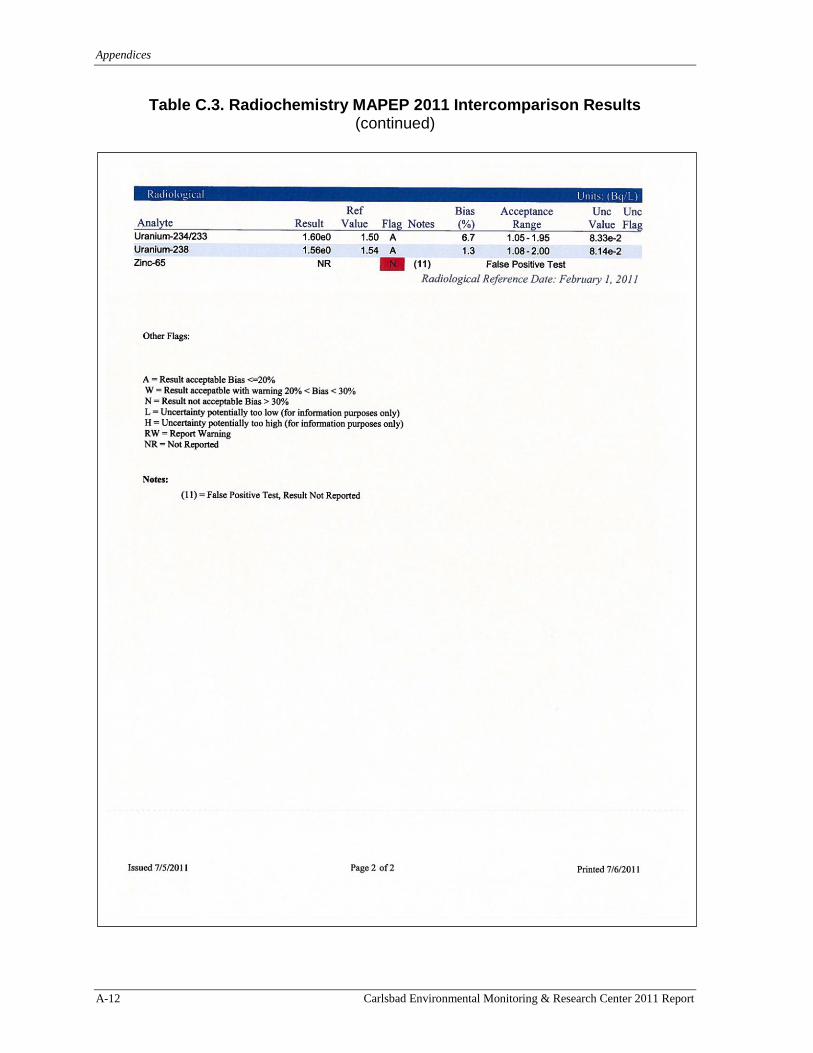
Appendices
A-12 Carlsbad Environmental Monitoring & Research Center 2011 Report
Table C.3. Radiochemistry MAPEP 2011 Intercomparison Results (continued)

Appendices
Carlsbad Environmental Monitoring & Research Center 2011 Report A-13
Table C.3. Radiochemistry MAPEP 2011 Intercomparison Results (continued)

Appendices
A-14 Carlsbad Environmental Monitoring & Research Center 2011 Report
Table C.3. Radiochemistry MAPEP 2011 Intercomparison Results (continued)

Appendices
Carlsbad Environmental Monitoring & Research Center 2011 Report A-15
Table C.3. Radiochemistry MAPEP 2011 Intercomparison Results (continued)
Appendices
A-16 Carlsbad Environmental Monitoring & Research Center 2011 Report
Table C.3. Radiochemistry MAPEP 2011 Intercomparison Results (continued)
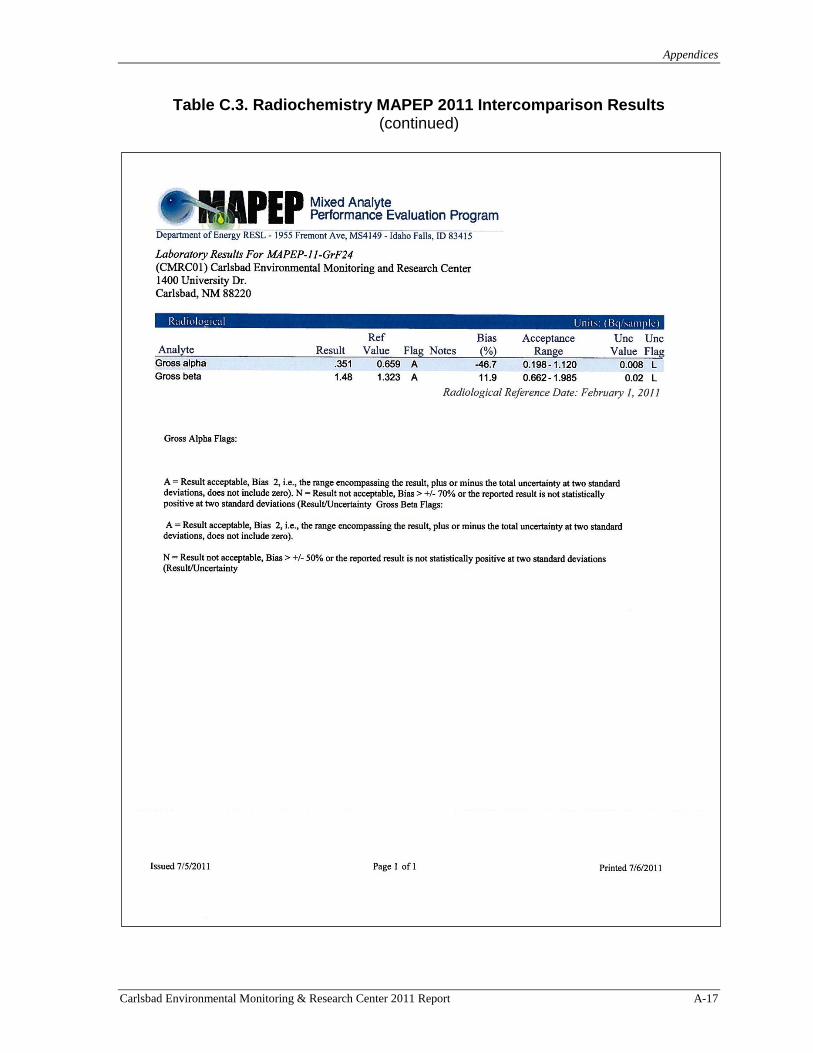
Appendices
Carlsbad Environmental Monitoring & Research Center 2011 Report A-17
Table C.3. Radiochemistry MAPEP 2011 Intercomparison Results (continued)

Appendices
A-18 Carlsbad Environmental Monitoring & Research Center 2011 Report
Table C.4. Example of the Daily Performance Tests for ICP-MS Sample Daily Performance Data of the Elan 6100 ICP-MS for April-May 2011
Acceptable Ranges 04/11/2011 04/19/2011
Criteria for Net
Intensity Mean of 5
replicate readings
Required
Relative
Standard
Deviation (%)
Measured
Intensity
Mean
Relative
Standard
Deviation
Performance
Evaluation
Measured
Mean
Intensity
Relative
Standard
Deviation
Performance
Evaluation
Be >1,000 0.0 - 5.0% 4,280.6 0.8 Acceptable 4,245.4 1.3 Acceptable
Mg >18,000 0.0 - 5.0% 46,140.6 0.8 Acceptable 53,327.6 2.2 Acceptable
In >120,000 0.0 - 5.0% 423,919.1 2.0 Acceptable 508,895.4 1.4 Acceptable
Pb >60,000 0.0 - 5.0% 221,326.1 2.0 Acceptable 259,494.6 1.1 Acceptable
Ba <900,000 0.0 - 5.0% 351,480.0 2.6 Acceptable 393,169.6 1.1 Acceptable
Ba++ ≤ 10.0% N/A 1.4% N/A Acceptable 1.9% N/A Acceptable
Ce <900,000 0.0 - 5.0% 450,526.5 1.5 Acceptable 499,283.6 1.2 Acceptable
CeO ≤ 5.0% N/A 2.3% N/A Acceptable 2.6% N/A Acceptable
Bkgd ≤ 25.0 N/A 9.2 N/A Acceptable 7.6 N/A Acceptable
Acceptable Ranges 05/05/2011 05/26/2011
Criteria for Net
Intensity Mean of 5
replicate readings
Required
Relative
Standard
Deviation (%)
Measured
Intensity
Mean
Relative
Standard
Deviation
Performance
Evaluation
Measured
Mean
Intensity
Relative
Standard
Deviation
Performance
Evaluation
Be >1,000 0.0 - 5.0% 3,910.7 1.6 Acceptable 5,219.8 1.0 Acceptable
Mg >18,000 0.0 - 5.0% 56,279.1 1.4 Acceptable 66,657.8 1.4 Acceptable
In >120,000 0.0 - 5.0% 564,532.0 1.9 Acceptable 600,156.1 1.3 Acceptable
Pb >60,000 0.0 - 5.0% 293,780.5 1.4 Acceptable 290,668.6 1.1 Acceptable
Ba <900,000 0.0 - 5.0% 491,111.4 0.7 Acceptable 463,212.3 1.2 Acceptable
Ba++ ≤ 10.0% N/A 1.6% N/A Acceptable 1.7% N/A Acceptable
Ce <900,000 0.0 - 5.0% 644,538.0 0.9 Acceptable 592,542.6 0.9 Acceptable
CeO ≤ 5.0% N/A 2.4% N/A Acceptable 2.6% N/A Acceptable
Bkgd ≤ 25.0 N/A 9.2 N/A Acceptable 6.4 N/A Acceptable
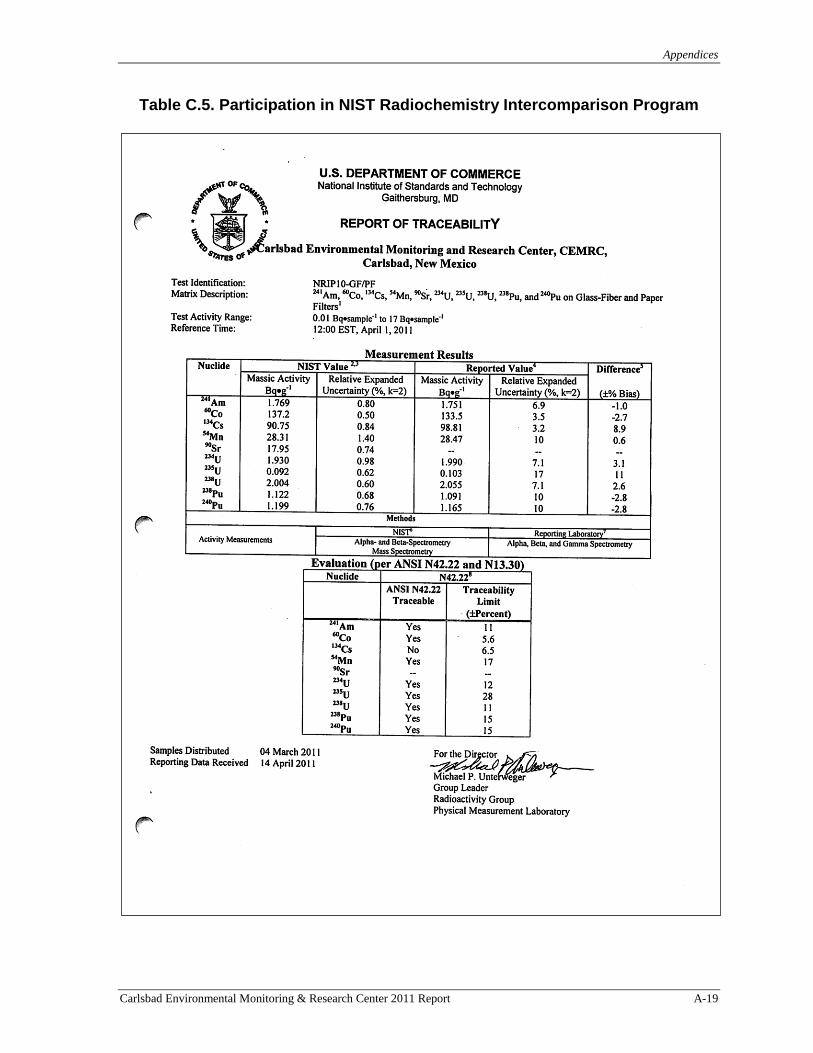
Appendices
Carlsbad Environmental Monitoring & Research Center 2011 Report A-19
Table C.5. Participation in NIST Radiochemistry Intercomparison Program

Appendices
A-20 Carlsbad Environmental Monitoring & Research Center 2011 Report
Table C.5. Participation in NIST Radiochemistry Intercomparison Program (continued)

Appendices
Carlsbad Environmental Monitoring & Research Center 2011 Report A-21
Table C.5. Participation in NIST Radiochemistry Intercomparison Program (continued)
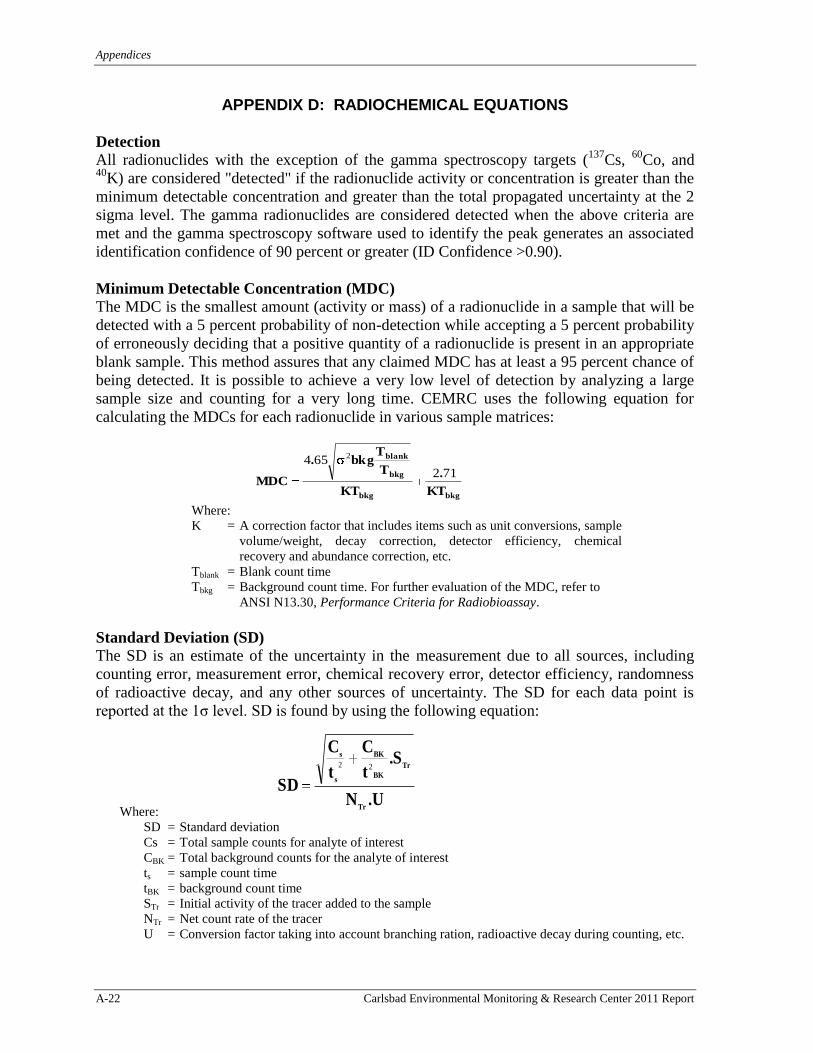
Appendices
A-22 Carlsbad Environmental Monitoring & Research Center 2011 Report
APPENDIX D: RADIOCHEMICAL EQUATIONS
Detection
All radionuclides with the exception of the gamma spectroscopy targets (137
Cs, 60
Co, and 40
K) are considered "detected" if the radionuclide activity or concentration is greater than the
minimum detectable concentration and greater than the total propagated uncertainty at the 2
sigma level. The gamma radionuclides are considered detected when the above criteria are
met and the gamma spectroscopy software used to identify the peak generates an associated
identification confidence of 90 percent or greater (ID Confidence >0.90).
Minimum Detectable Concentration (MDC)
The MDC is the smallest amount (activity or mass) of a radionuclide in a sample that will be
detected with a 5 percent probability of non-detection while accepting a 5 percent probability
of erroneously deciding that a positive quantity of a radionuclide is present in an appropriate
blank sample. This method assures that any claimed MDC has at least a 95 percent chance of
being detected. It is possible to achieve a very low level of detection by analyzing a large
sample size and counting for a very long time. CEMRC uses the following equation for
calculating the MDCs for each radionuclide in various sample matrices:
Where:
K = A correction factor that includes items such as unit conversions, sample
volume/weight, decay correction, detector efficiency, chemical
recovery and abundance correction, etc.
Tblank = Blank count time
Tbkg = Background count time. For further evaluation of the MDC, refer to
ANSI N13.30, Performance Criteria for Radiobioassay.
Standard Deviation (SD)
The SD is an estimate of the uncertainty in the measurement due to all sources, including
counting error, measurement error, chemical recovery error, detector efficiency, randomness
of radioactive decay, and any other sources of uncertainty. The SD for each data point is
reported at the 1σ level. SD is found by using the following equation:
Where:
SD = Standard deviation
Cs = Total sample counts for analyte of interest
CBK = Total background counts for the analyte of interest
ts = sample count time
tBK = background count time
STr = Initial activity of the tracer added to the sample
NTr = Net count rate of the tracer
U = Conversion factor taking into account branching ration, radioactive decay during counting, etc.
bkgbkg
bkg
blank
KT
.
KT
T
Tbkg.
MDC712
654 2
U.N
S.t
C
t
C
SDTr
Tr
BK
BK
s
s
22
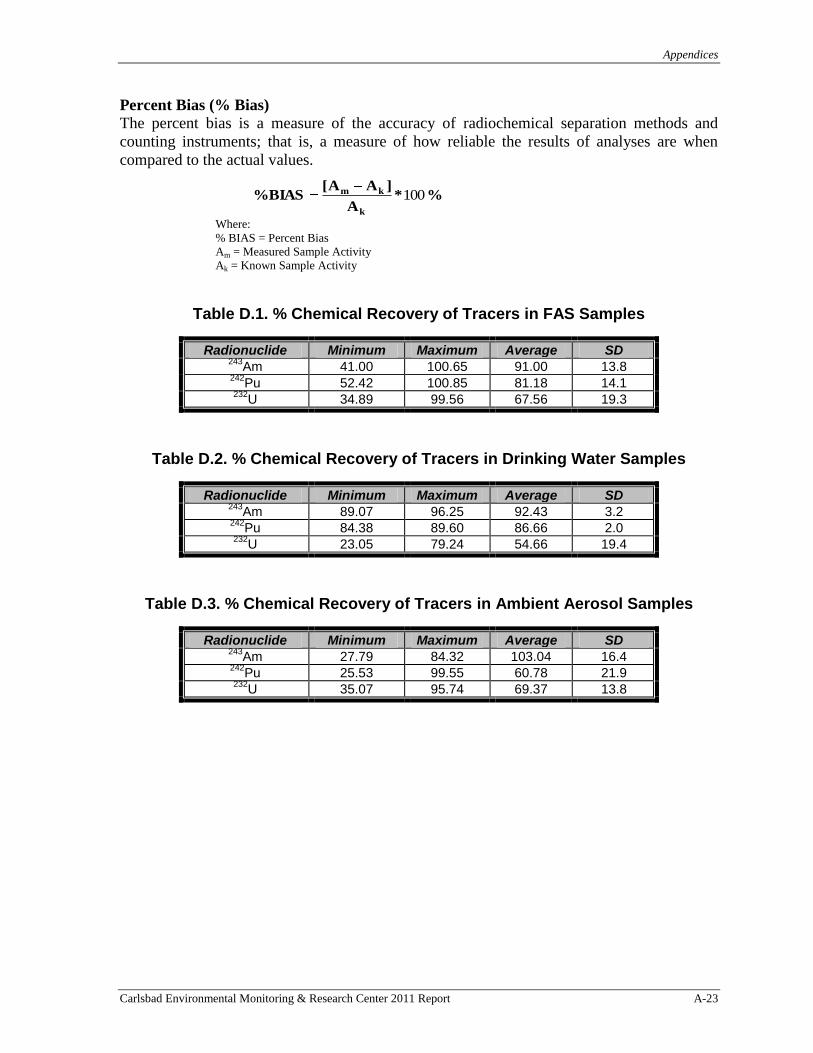
Appendices
Carlsbad Environmental Monitoring & Research Center 2011 Report A-23
Percent Bias (% Bias)
The percent bias is a measure of the accuracy of radiochemical separation methods and
counting instruments; that is, a measure of how reliable the results of analyses are when
compared to the actual values.
Where:
% BIAS = Percent Bias
Am = Measured Sample Activity
Ak = Known Sample Activity
Table D.1. % Chemical Recovery of Tracers in FAS Samples
Radionuclide Minimum Maximum Average SD 243
Am 41.00 100.65 91.00 13.8 242
Pu 52.42 100.85 81.18 14.1 232
U 34.89 99.56 67.56 19.3
Table D.2. % Chemical Recovery of Tracers in Drinking Water Samples
Radionuclide Minimum Maximum Average SD 243
Am 89.07 96.25 92.43 3.2 242
Pu 84.38 89.60 86.66 2.0 232
U 23.05 79.24 54.66 19.4
Table D.3. % Chemical Recovery of Tracers in Ambient Aerosol Samples
Radionuclide Minimum Maximum Average SD 243
Am 27.79 84.32 103.04 16.4 242
Pu 25.53 99.55 60.78 21.9 232
U 35.07 95.74 69.37 13.8
%*A
]AA[BIAS%
k
km 100
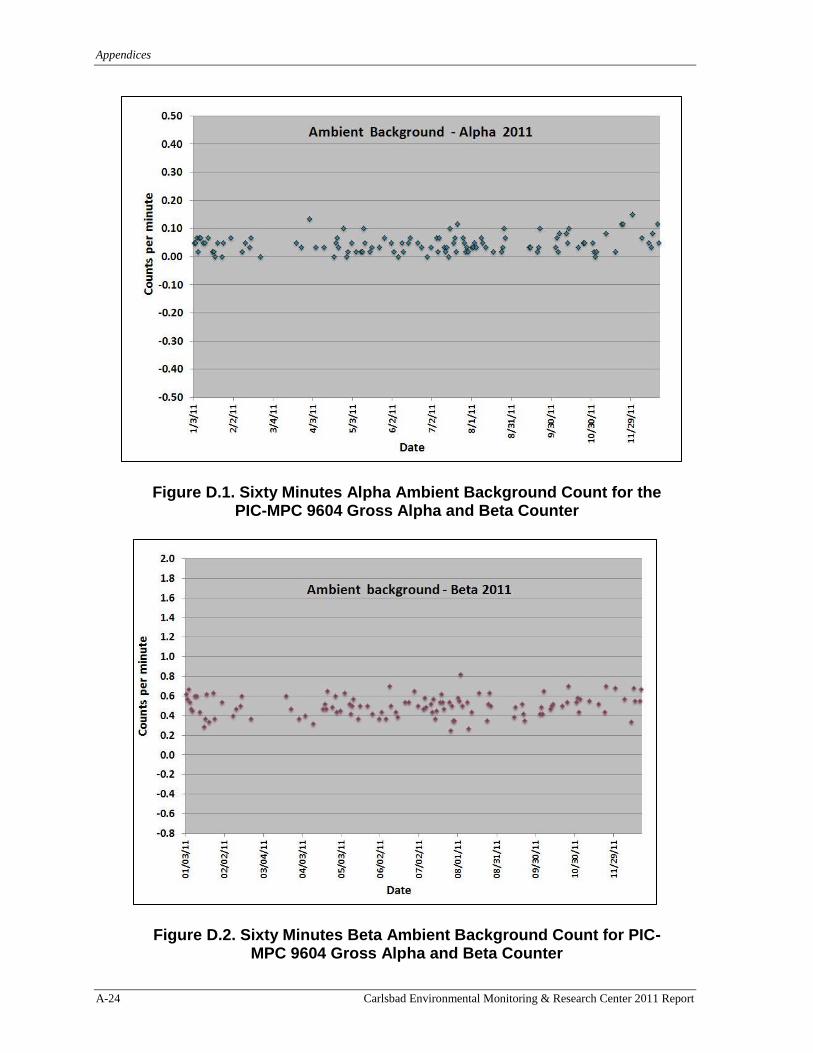
Appendices
A-24 Carlsbad Environmental Monitoring & Research Center 2011 Report
Figure D.1. Sixty Minutes Alpha Ambient Background Count for the PIC-MPC 9604 Gross Alpha and Beta Counter
Figure D.2. Sixty Minutes Beta Ambient Background Count for PIC-MPC 9604 Gross Alpha and Beta Counter

Appendices
Carlsbad Environmental Monitoring & Research Center 2011 Report A-25
Figure D.3. Control Chart of Daily Alpha Efficiency of the PIC-
MPC 9604 Gross Alpha and Beta Counter
Figure D.4. Control Chart of Daily Beta Efficiency of the PIC-MPC 9604 Gross Alpha and Beta Counter

Appendices
A-26 Carlsbad Environmental Monitoring & Research Center 2011 Report
REFERENCES
Alto, B.R., R.S. Fulton (1965) "Salines" and "The potash Industry" in Mineral and Water
Resources of New Mexico, New Mexico Bureau of Mines and Mineral Resources,
Bulletin 87, p.299-309.
American National Standards Institute. Calibration and usage of alpha /beta proportional
counters. New York: IEEE; N42.25; 1997.
Arimoto, R., T. Kirchner, J. Webb, M. Conley, B. Stewart, D. Schoep, and M. Walthall.
2002. 239,240
Pu and inorganic substances in aerosols from the vicinity of the Waste
Isolation Pilot Plant: The importance of resuspension. Health Physics, 83:456.
Arimoto, R and the Effluent Monitoring Improvement Group, In situ probe occlusion tests at
the Waste Isolation Pilot Plant, Abstract TAM-A.9, Book of Abstracts, 51st Annual
Meeting of the Health Physics Society, Providence, RI, 2006.
Arimoto, R., B. Stewart, H. Khaing, and D. P. Tatro. Biogeochemical recycling on aerosol
particles. Eos Trans. AGU, 87(52), Fall Meet. Suppl., Abstract A53A-0175, 2006.
Arimoto, R., J. B. Webb, and M. C. Conley. 2005. Radioactive contamination of atmospheric
dust over southeastern New Mexico, Atmospheric Environment, 39, 4745-4754.
Cherdynstev, V.V. (1971) Uranium-234. Program for scientific translations Ltd. Keter Press,
Jerusalem, p 234.
City of Andrews, (2011), Working For You - 2011 Water Quality Report, PWS ID#:
TX0020001,
http://www.cityofandrews.org/docs/Annual_Report_Drinking_Water_2011.pdf
City of Carlsbad Municipal Water System, (2011), 2011 Annual Consumer Report on the
Quality of Your Drinking Water,
http://www.cityofcarlsbadnm.com/CCR%202011.pdf
CNN, 2011: Traces of radiation from Japanese nuclear plant surface in California.
http://edition.cnn.com/2011/US/03/18/nuclear.concerns.
Cothern, C.R., Lappenbusch, W.L., (1983) Occurrence of uranium in drinking water in the
US. Health Phys 45:89–99.
CTBTO, 2011. Fukushima-related Measurements by CTBTO. Comprehensive Nuclear-
Test-Ban Treaty Organization, Preparatory Commission. https://www2.ctbto.org
Currie, L.A., Lindstrom, R.M., (1973). The NBS Measurement System for Natural Argon-37
In: Noble Gases Proceedings of the US EPA Symposium, CONF-730915,
Washington, DC: US Government Printing Office, 694-527/8:40-57.

Appendices
Carlsbad Environmental Monitoring & Research Center 2011 Report A-27
Fleischer, R.L. (1980) Isotopic disequilibrium of uranium: alpha-recoil damage and
preferential solution effects. Science 207, 979–981.
Gharbi, F., Baccouche, S., Abdelli, W., Samaali, M., Oueslati, M., Trabelsi, (2010) J.
Environ. Radioactivity 101, 589-590.
Gilkeson, R.H., Coward, J.B. (1982) A preliminary report on U-238 series disequilibrium in
ground water of the Cambriam-Ordovician aquifer system of Northeastern Illinois. In:
Perry EC, Montgomery CW (eds) Isotope studies of hydrologic processes. Northern
Illinois University Press, Dekalb, IL, pp 109–118
Hardy, E. P., Krey, P. W., Volchok, H. L., 1973. Global inventory and distribution of fallout
plutonium. Nature, 241, 444-445.
Hess, C.T., Michel, J., Norton, T.R., Prichard, H.M., Coniglio (1985) The occurrence of
radioactivity in public water supplies in the United States. Health Phys 48:563–586.
Hursh, J.B., Spoor, N.L. (1973) In: Hodge HC, Standard JS, Hursh JV (eds) Uranium,
plutonium, transplutonic elements. Springer-Verlag, New York.
IAEA (1989) In situ leaching of uranium: technical, environmental and economic aspects,
IAEA-TECDOC-492. IAEA, Vienna, p 172.
Joshi, U., Zingde, D. (1988) Uranium series disequilibrium in the coastal surface sediments
and sea water of the Arabian Sea. J. Radioanal. Nucl. Chem., 120, 275–280.
Kenney, J.W., Downes, P.S., Gray, D.H., Ballard, S.C., 1995. Radionuclide baseline in soil
near project Gnome and the Waste Isolation Pilot Plant, Environmental Evaluation
Group, EEG-58.
Kerr, Richard A. (1999) “For Radioactive Waste from Weapons, a Home at Last,” Science,
283.5408.
Kirchner, T.B., Webb, J.L., Webb, S.B., Arimoto, R., Schoep, D. Stewart, B.D., Variability
in background levels of surface soil radionuclides in the vicinity of the Waste
Isolation Pilot Plant.J. Environ. Radioactivity, 60, 275-272 (2002).
Mereiter, K. (1979) Refinement of the Crystal Structure of Langbeinite, K2Mg2(SO4)3. Neues
Jahrb. Mineral., Monatsh., 182–188.
Neghabian, A.R., Becker, H.J., Baran, A., Binzel H.W (1991) “Verwendung von
wiederaufgearbeitetem Uran und von abgereichertem Uran” DerBundesminister fur
Umwelt, Naturschutz und Reaktorsicherheit Schriftenreihe Reaktorsicherheit und
Strahlenschutz, BMU-1992-332, Novemebr 1991, 186S.

Appendices
A-28 Carlsbad Environmental Monitoring & Research Center 2011 Report
Nguyen, D.C., Barbara, M (2009) Natural radioactivity in bottled natural spring, mineral and
therapeutic waters in Poland. J. Radioanal. Nucl. Chem., 279, 121–129.
Orloff, K.G., Mistry, K., Charp, P., Metcalf, S., Marino, R., Shelly, T., Melaro, E.,
Donnohoe, A.M., Jones, R.L., (2004). Human exposure to uranium in ground water.
Environ. Res. 94, 319-326.
Palache, C., H. Berman, and C. Frondel (1951) Dana’s System of Mineralogy, (7th edition),
v. II, 434-435.
Pavlotskaya, F.I. Goryachenkva, T.A., Yemel’yanov, V.V., Kazinskaya, Ye. I., Barsukova,
K.V., Myasoyedov, B.F., 1994. Modes of occurrence of plutonium in hot particles,
Geochemistry International 31, 62-69.
Pimple, M., Yoo, B., Yordanova, L. (1992) Optimization of a radioanalytical procedure for
the determination of uranium isotopes in environmental samples. J. Radioanal. Nucl.
Chem. Articles 161, 437–441.
Roback, R.C., Johnson, T. M., McLing, T., Murrell, M.T., Luo, S., T.L. Ku., (2001) Uranium
isotopic evidence for groundwater chemical evolution and flow patterns in the eastern
Snake River Plain aquifer, Idaho GSA Bulletin, 113, 1133-1141.
Rosner, G., Hotzl, H., Winkler, R., 1997. Long term behavior of plutonium in air and
deposition and the role of resuspension in a semi-rural environment in Germany. Sci.
Total Environ. 196, 255-261.
Sehmel, G.A., 1987. Transuranic resuspension. In Pinter JE, III, Alberts J.J., McLeod,
K.W.R.G. Schreckhise, (eds.) Environmental research on actinide elements.
Washington, DC: Office of Science and Technical Information; CONF-841142, 157-
192.
Semkow, T.M., Bari, A., Parekh, P.P., Haines, D.K., Gao, H., Bolden, A.N., Dahms, K.S.,
Scarpitta, Thern, R.E., Velazquez, S. Appl. Radiat. Isot. 60, 879.
Skwarzec, B.; Boryło, A., Strumin´ska, D. (2002) 234
U and 238
U isotopes in water and
sediments of the southern Baltic, J Environ. Radioact., 61, 345–363.
Tokyo Electric Power Company TEPCO, 2011 http://www.tepco.co.jp/en/press/corp-
com/release/11031225-e.-html, access: 13 May 2011.
UNSCEAR (1977). Sources and effects of ionizing radiation. United Nations, New York.
UNSCEAR, (1982). Ionizing radiation: Sources and biological effects United Nations
Scientific Committee on the Effects of Atomic Radiation New York: United Nations;
1982.
Appendices
Carlsbad Environmental Monitoring & Research Center 2011 Report A-29
UNSCEAR, (2000). Ionizing radiation: Sources and biological effects United Nations
Scientific Committee on the Effects of Atomic Radiation New York: United Nations.
UNSCEAR (2001). Ionizing radiation: sources and biological effects. United Nations, New
York.
USAEC. 1973. Gnome/Coach site disposal options. U.S. Atomic Energy Commission NVO
131. Las Vegas, NV.
U.S. EPA: United State Environmental Protection Agency (2000) Office of water,
radionuclides in drinking water.
U.S. EPA: United State Environmental Protection Agency (2012), Drinking Water
Contaminants.
U.S. EPA: Environmental Protection Agency, National Ambient Air Quality Standards,
2012, http://www.epa.gov/air/criteria.html.
U.S. DOE, 2000. The Next Generation Underground Observatory of the Universe, U.S. DOE
Workshop, Carlsbad, NM, June 12-14.
Vincent, C., Vallon, M., Pinglot, J.F., Funk, M., Reynaud, L., (1997). Snow accumulation
and ice flow at Dome Du Gouter (4300 m), Mont Blanc, French Alps, J. Glaciol. 43,
513-521.
Webb, J.L. and T. Kirchner. 2000. An evaluation of in vivo sensitivity via public monitoring.
Radiation Protection Dosimetry, 89 (3-4):183-191.
Weeks, Jennifer (2011) “Nuclear Waste Buried for the Ages in New Mexico Desert”, CO
Researcher 21.4, page 84-85.
Wink, R., Anselmann, P.; Dorflinger, D.; Hampel, W.; Heusser, G.; Kirsten, T.; Mogel, P.,
Pernicka, E.; Plaga, R., Schlosser, C., 1993. The miniaturized proportional counter
HD2(FE)/(Si) for the GALLEX solar neutrino experiment. Nucl. Instr. Meth. Phys.
Res.A329:541-550.
Zheng J., Tagami, K., Watanabe1, Y., Uchida1, S., Aono1, T., Ishii1,N.,
Yoshida, S., Kubota, Y., Fuma, S., Ihara, S., Isotopic evidence of plutonium release
into the environment from the Fukushima DNPP accident Nat. Sci. Rep 2, 304-308
(2012). (1968) NBS Mono. 25, 40–41.