carlsbad environmental monitoring & research center ... · •26,000 ft22 facility in carlsbad,...
TRANSCRIPT
Carlsbad Environmental Monitoring & Research Center* (CEMRC) WIPP-Environmental Monitoring Program
*A unit of the NMSU College of Engineering*A unit of the NMSU College of Engineering
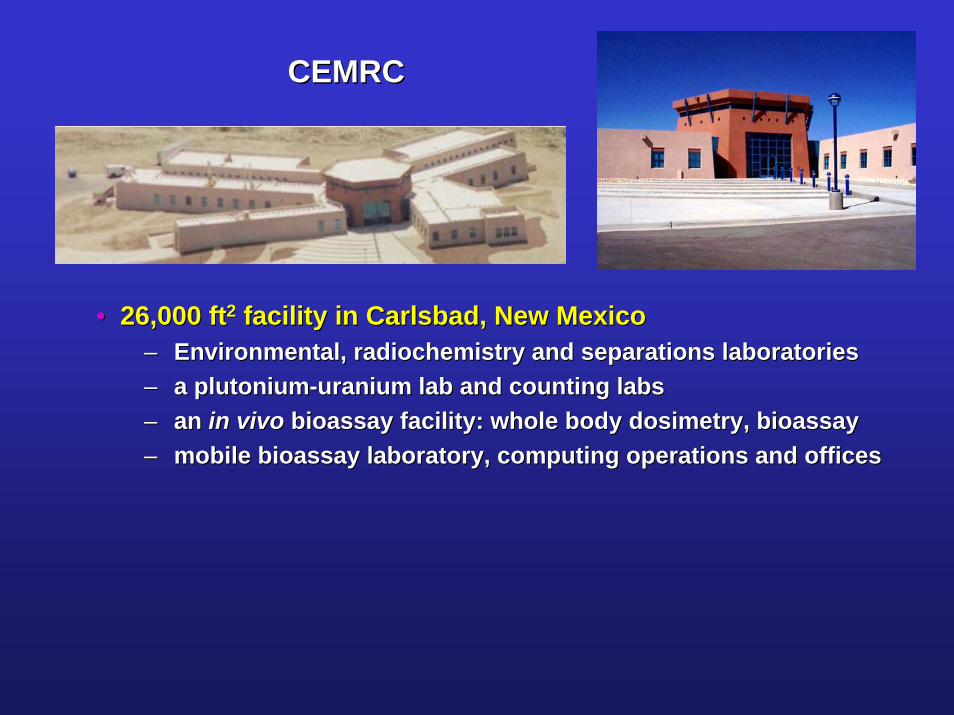
•• 26,00026,000 ftft22 facility in Carlsbad, New Mexicofacility in Carlsbad, New Mexico–– Environmental, radiochemistry and separations laboratoriesEnvironmental, radiochemistry and separations laboratories–– a plutoniuma plutonium--uranium lab and counting labsuranium lab and counting labs–– an an in vivoin vivo bioassay facility: whole body dosimetry, bioassaybioassay facility: whole body dosimetry, bioassay–– mobile bioassay laboratory, computing operations and officesmobile bioassay laboratory, computing operations and offices
CEMRCCEMRC
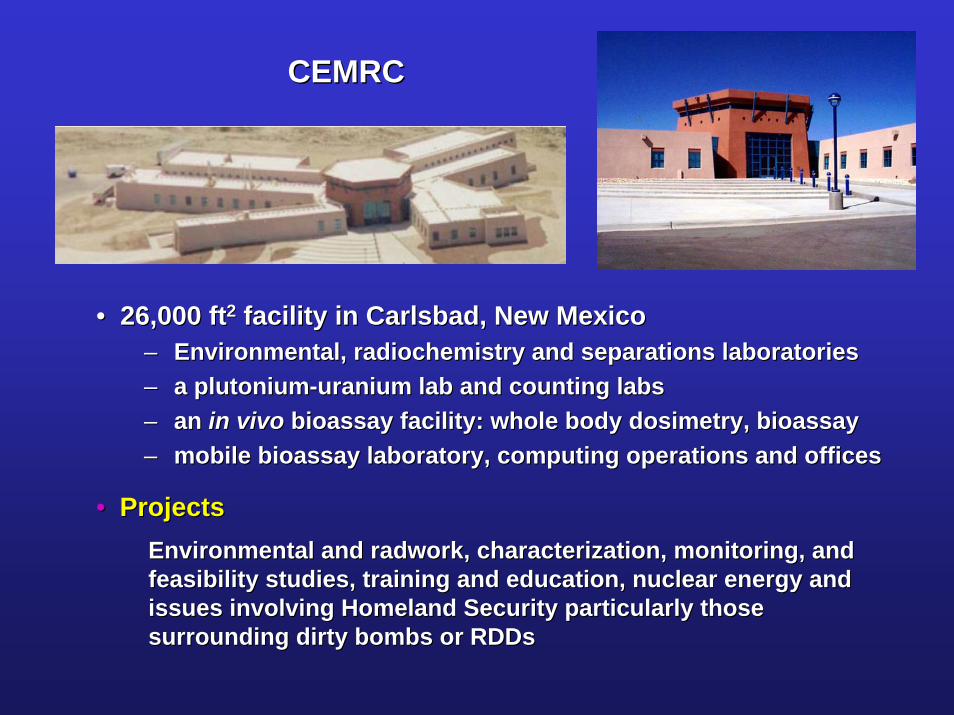
•• ProjectsProjectsEnvironmental and Environmental and radworkradwork, characterization, monitoring, and , characterization, monitoring, and feasibility studies, training and education, nuclear energy and feasibility studies, training and education, nuclear energy and issues involving Homeland Security particularly those issues involving Homeland Security particularly those surrounding dirty bombs or surrounding dirty bombs or RDDsRDDs
Mission of CEMRCMission of CEMRC• To implement an independent health and
environmental monitoring program in the vicinity of the DOE WIPP site
Mission of CEMRCMission of CEMRC• To implement an independent health and
environmental monitoring program in the vicinity of the DOE WIPP site
• To be a center of excellence which will anticipate and respond to emerging health and environmental needs for the public, the DOE and homeland security
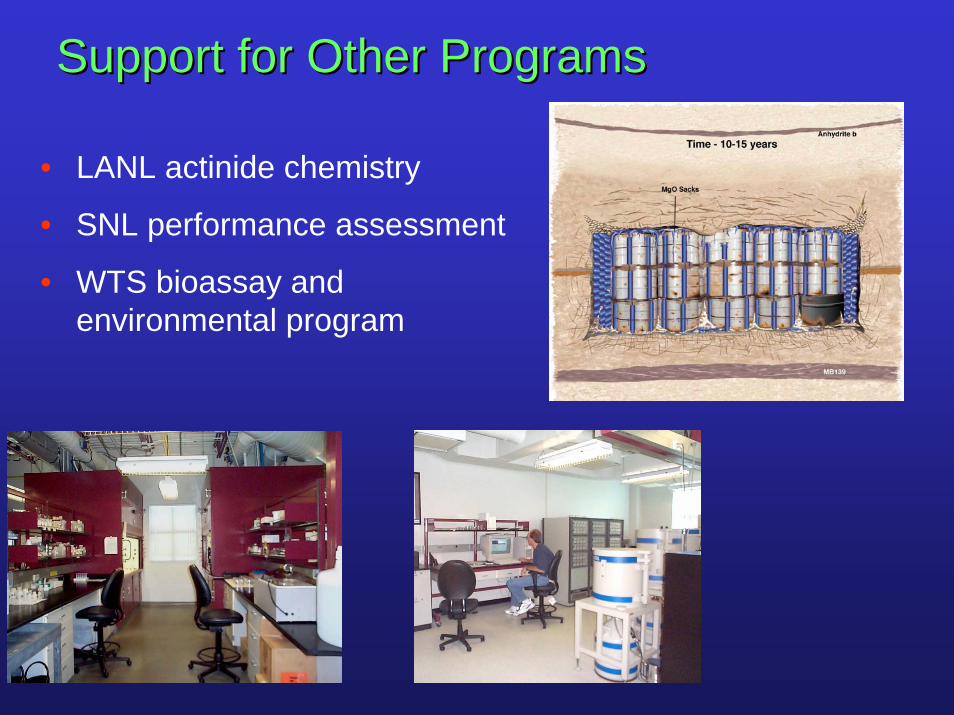
Support for Other ProgramsSupport for Other Programs
• LANL actinide chemistry
• SNL performance assessment
• WTS bioassay and environmental program
Volatile Organic Compound (VOC) AnalysisVolatile Organic Compound (VOC) Analysis
(1) WIPP Confirmatory VOC Monitoring Program(1) WIPP Confirmatory VOC Monitoring Program
•• CEMRC on WTS Qualified Suppliers List (QSL)CEMRC on WTS Qualified Suppliers List (QSL)
•• Analysis of routine (21Analysis of routine (21--day) and rush (2day) and rush (2--day) samples day) samples Detection of Detection of VOCsVOCs at ppb concentrationsat ppb concentrations
•• Nine analytes of interestNine analytes of interest
Methods developed for the analyses of gas samples Methods developed for the analyses of gas samples for two projects:for two projects:
(2) Headspace gas in TRU waste drums (2) Headspace gas in TRU waste drums
Methods developed for the analyses of gas samples Methods developed for the analyses of gas samples for two projects:for two projects:
Volatile Organic Compound (VOC) AnalysisVolatile Organic Compound (VOC) Analysis
• Analysis of hydrogen, methane and VOCs (ppm levels) in headspace gas samples to comply with WIPP WAP
• 29 analytes of interest
• WTS performed audit of CEMRC program, response to audit submitted February 2005
• Possible participation in DOE Performance Demonstration Program
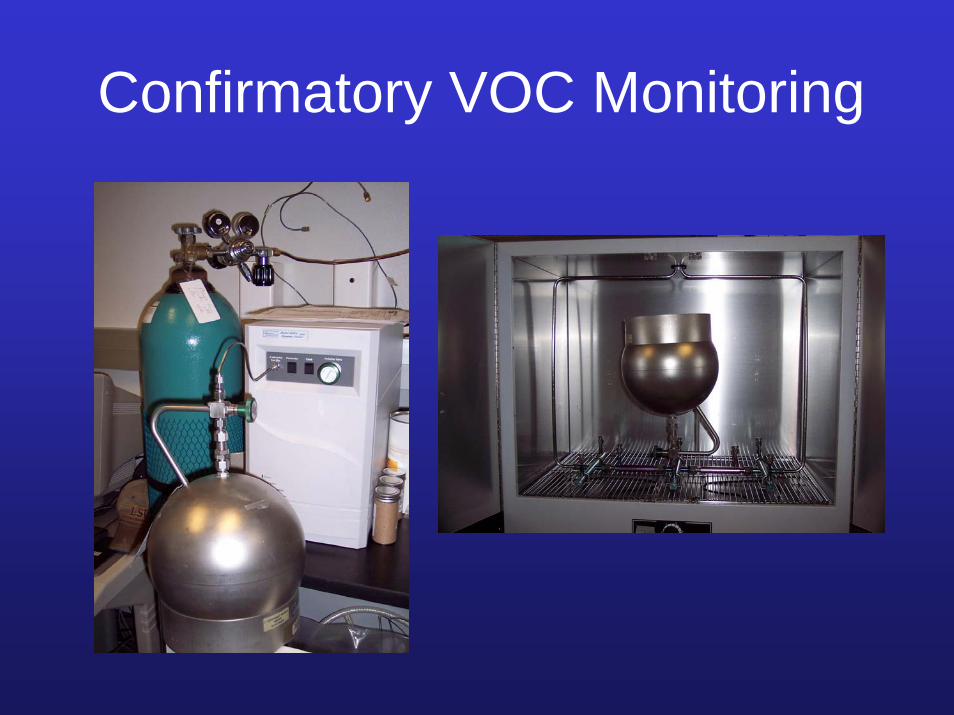
Confirmatory VOC Monitoring
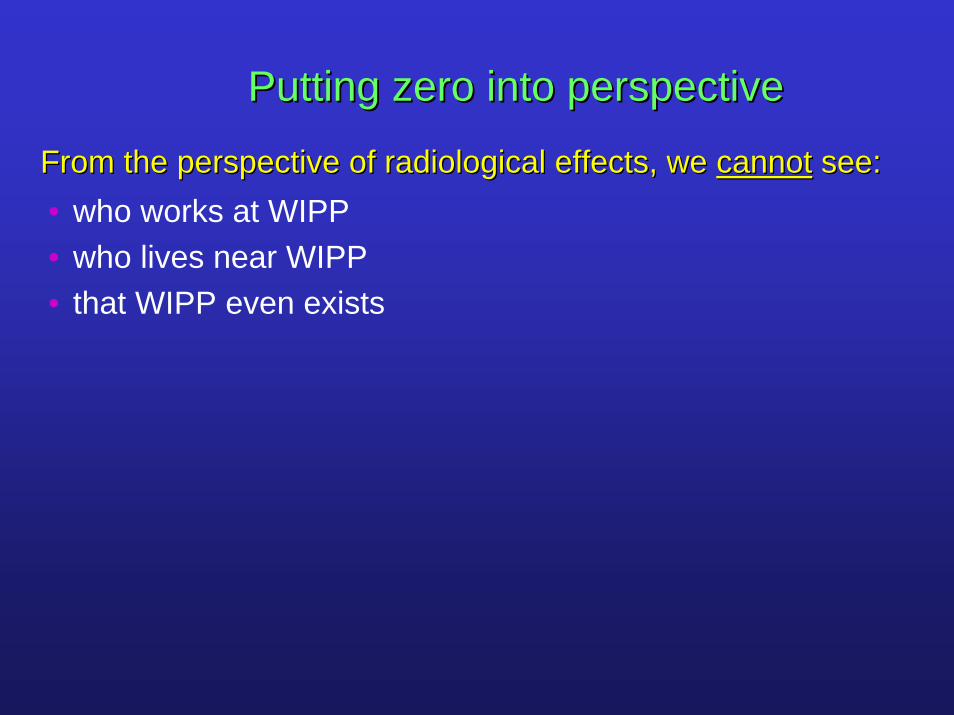
From the perspective of radiological effects, we From the perspective of radiological effects, we cannotcannot see:see:• who works at WIPP• who lives near WIPP• that WIPP even exists
Putting zero into perspectivePutting zero into perspective
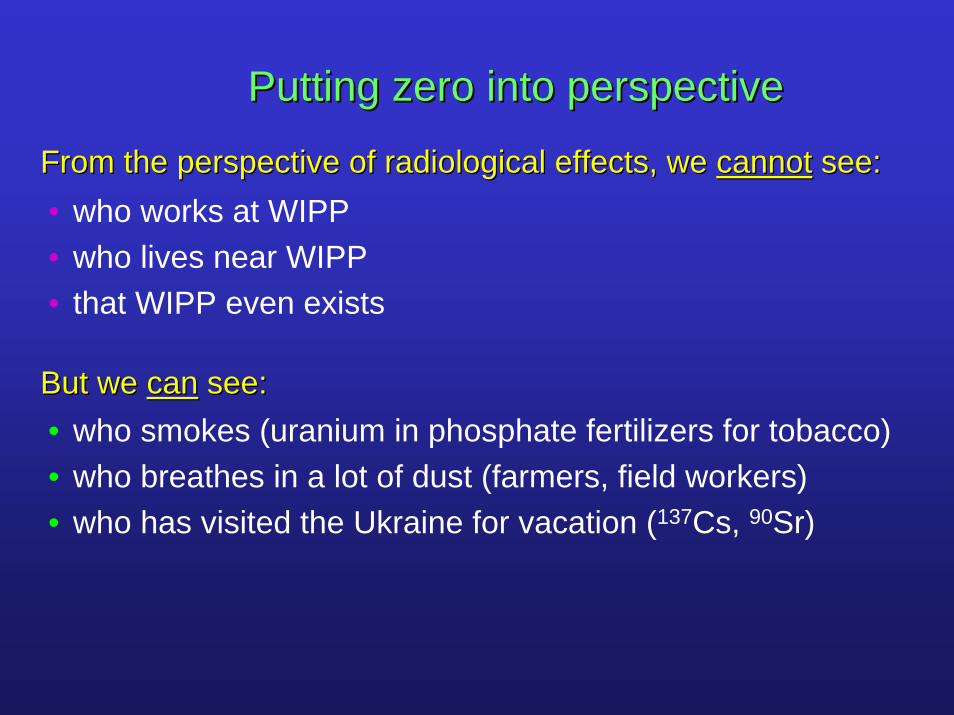
From the perspective of radiological effects, we From the perspective of radiological effects, we cannotcannot see:see:• who works at WIPP• who lives near WIPP• that WIPP even exists
But we But we cancan see:see:• who smokes (uranium in phosphate fertilizers for tobacco)• who breathes in a lot of dust (farmers, field workers)• who has visited the Ukraine for vacation (137Cs, 90Sr)
Putting zero into perspectivePutting zero into perspective
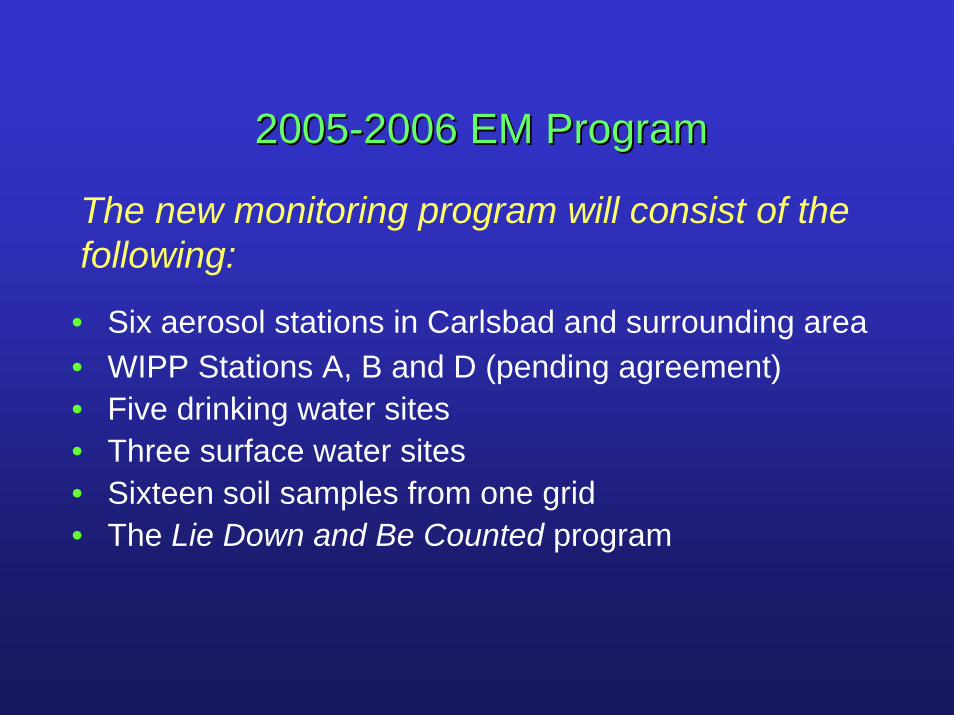
• Six aerosol stations in Carlsbad and surrounding area• WIPP Stations A, B and D (pending agreement)• Five drinking water sites• Three surface water sites• Sixteen soil samples from one grid• The Lie Down and Be Counted program
20052005--2006 EM Program2006 EM Program
The new monitoring program will consist of the following:
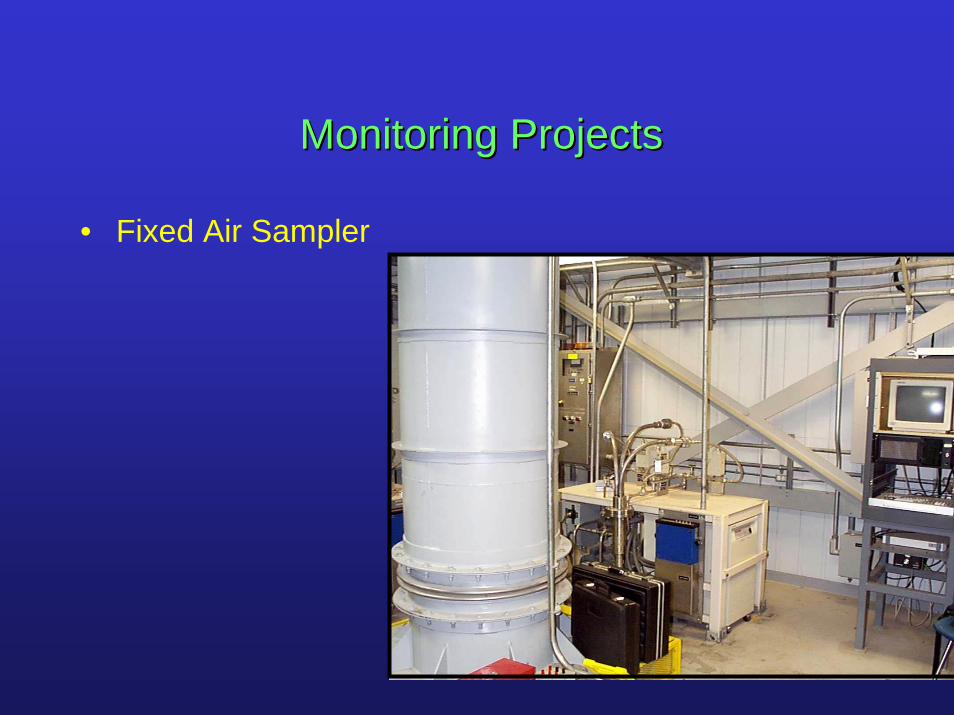
• Fixed Air Sampler
Monitoring ProjectsMonitoring Projects
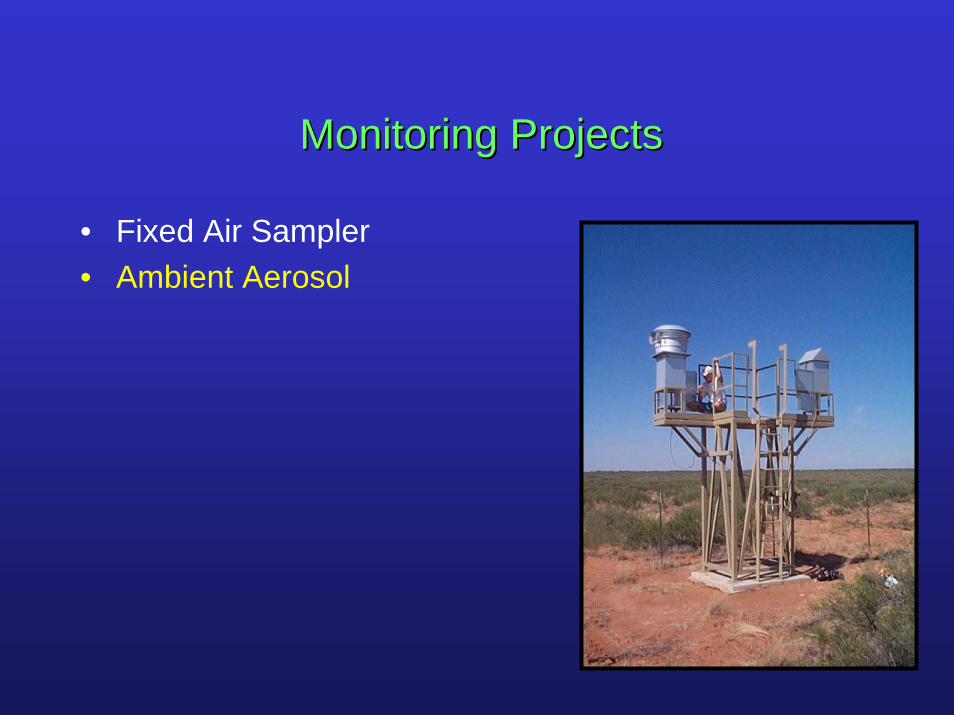
• Fixed Air Sampler• Ambient Aerosol
Monitoring ProjectsMonitoring Projects
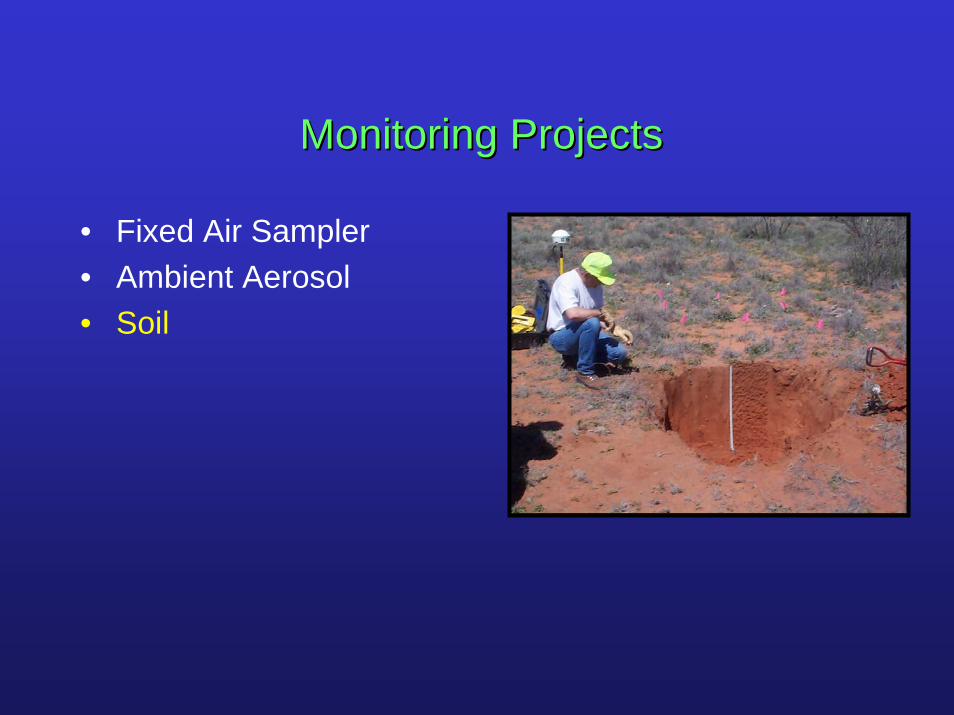
• Fixed Air Sampler• Ambient Aerosol• Soil
Monitoring ProjectsMonitoring Projects
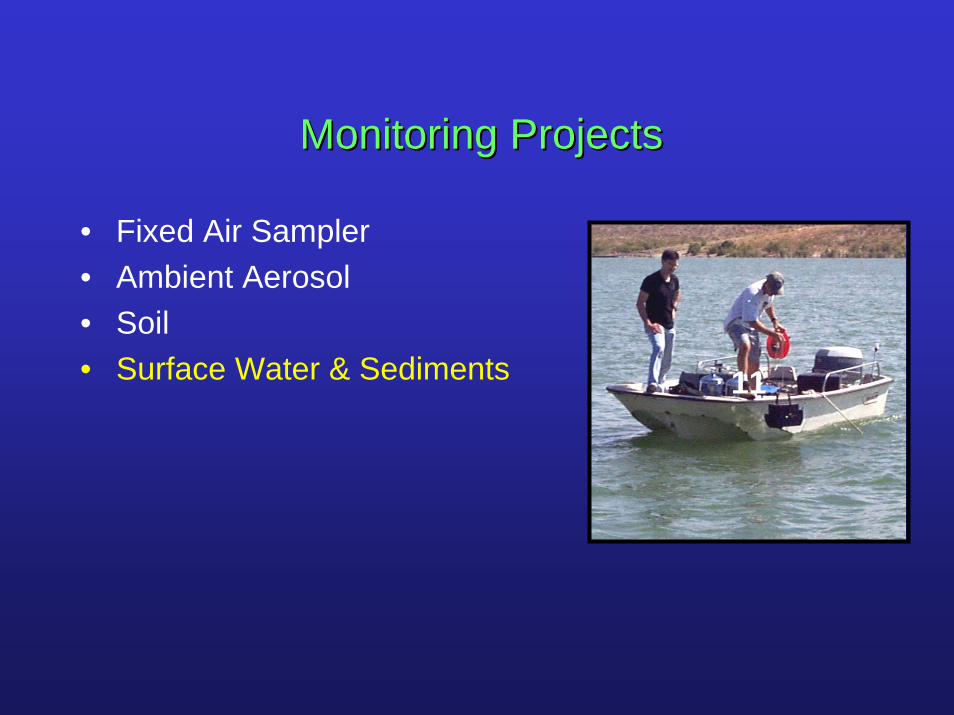
• Fixed Air Sampler• Ambient Aerosol• Soil• Surface Water & Sediments 11
Monitoring ProjectsMonitoring Projects
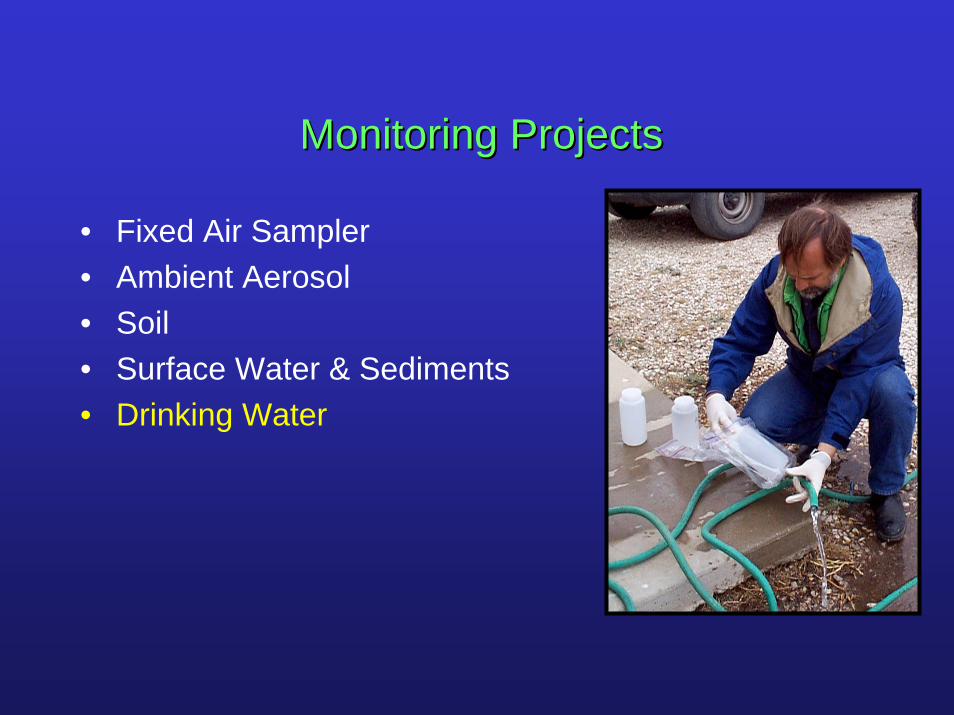
• Fixed Air Sampler• Ambient Aerosol• Soil• Surface Water & Sediments• Drinking Water
Monitoring ProjectsMonitoring Projects
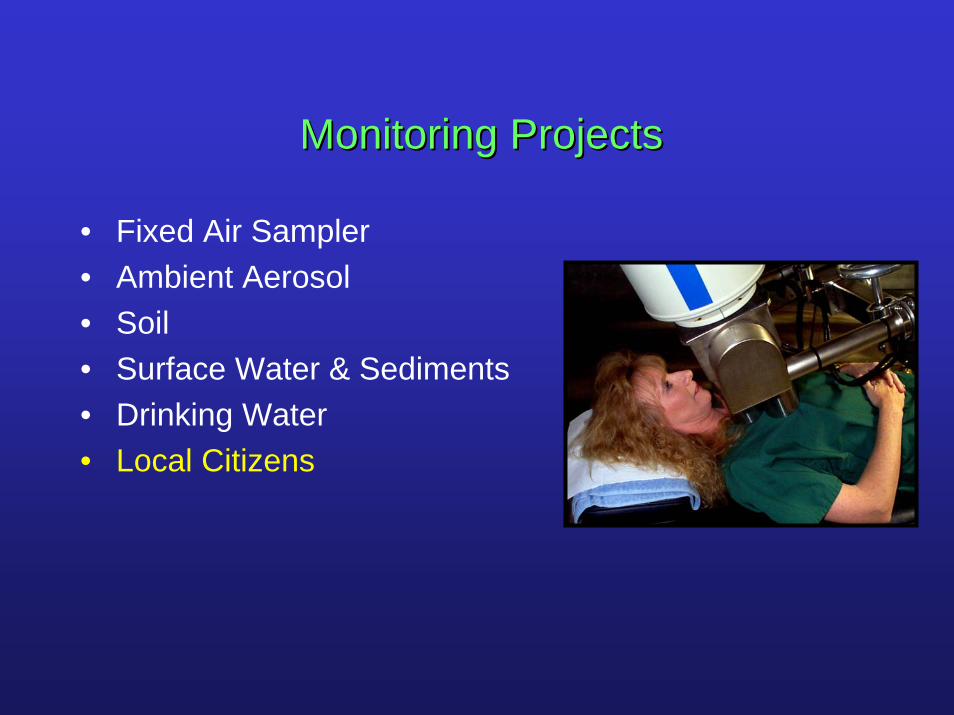
• Fixed Air Sampler• Ambient Aerosol• Soil• Surface Water & Sediments• Drinking Water• Local Citizens
Monitoring ProjectsMonitoring Projects
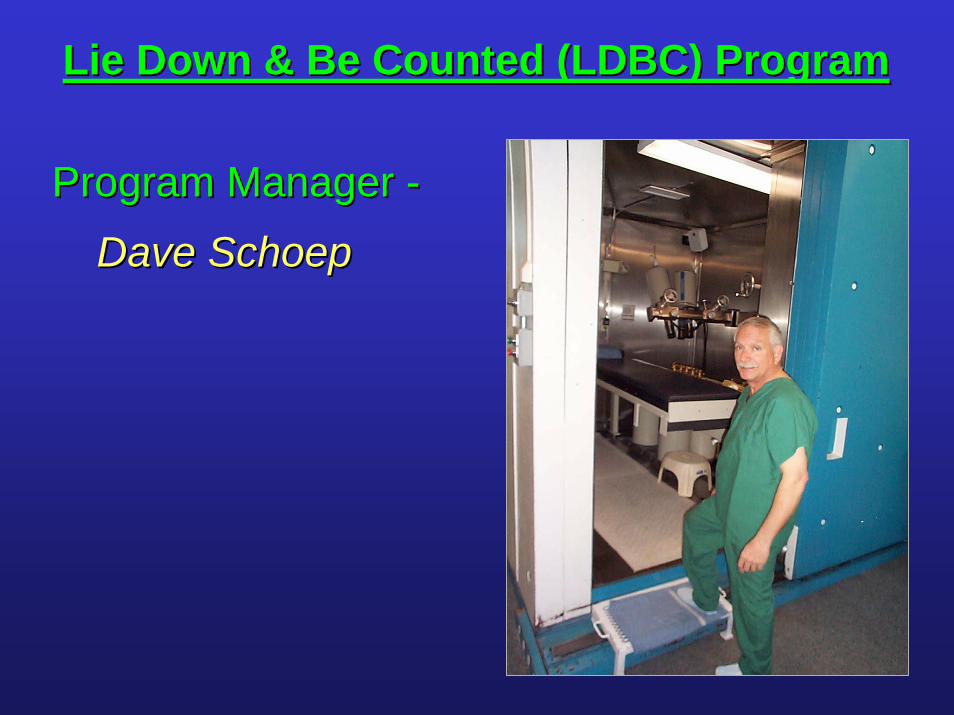
Lie Down & Be Counted (LDBC) ProgramLie Down & Be Counted (LDBC) Program
Program Manager Program Manager --
Dave Dave SchoepSchoep
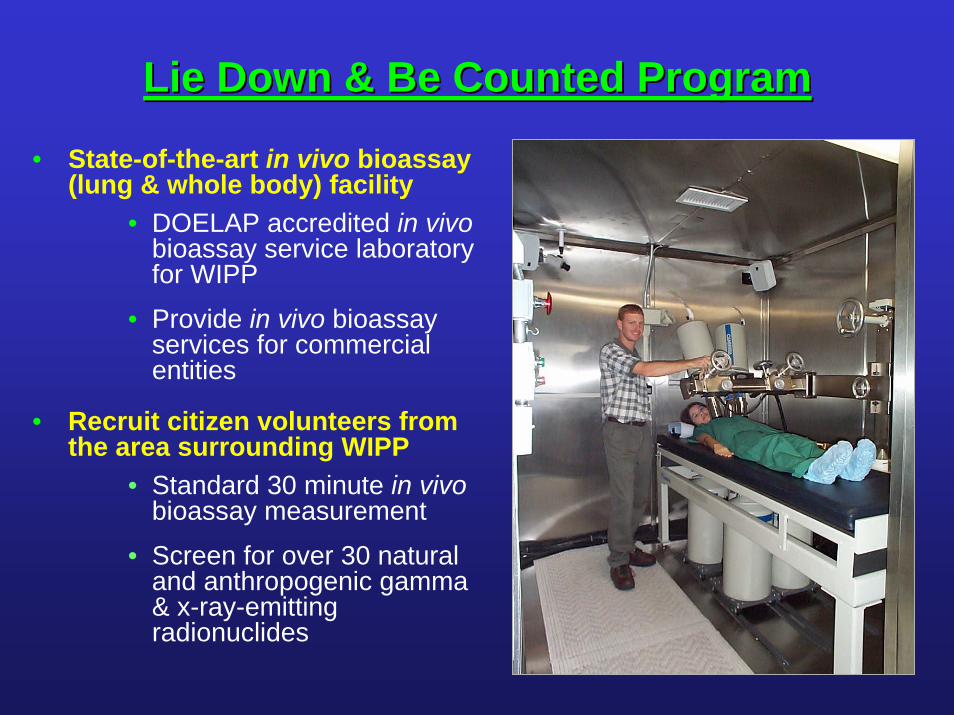
Lie Down & Be Counted ProgramLie Down & Be Counted Program
• State-of-the-art in vivo bioassay (lung & whole body) facility
• DOELAP accredited in vivobioassay service laboratory for WIPP
• Provide in vivo bioassay services for commercial entities
• Recruit citizen volunteers from the area surrounding WIPP
• Standard 30 minute in vivobioassay measurement
• Screen for over 30 natural and anthropogenic gamma & x-ray-emitting radionuclides
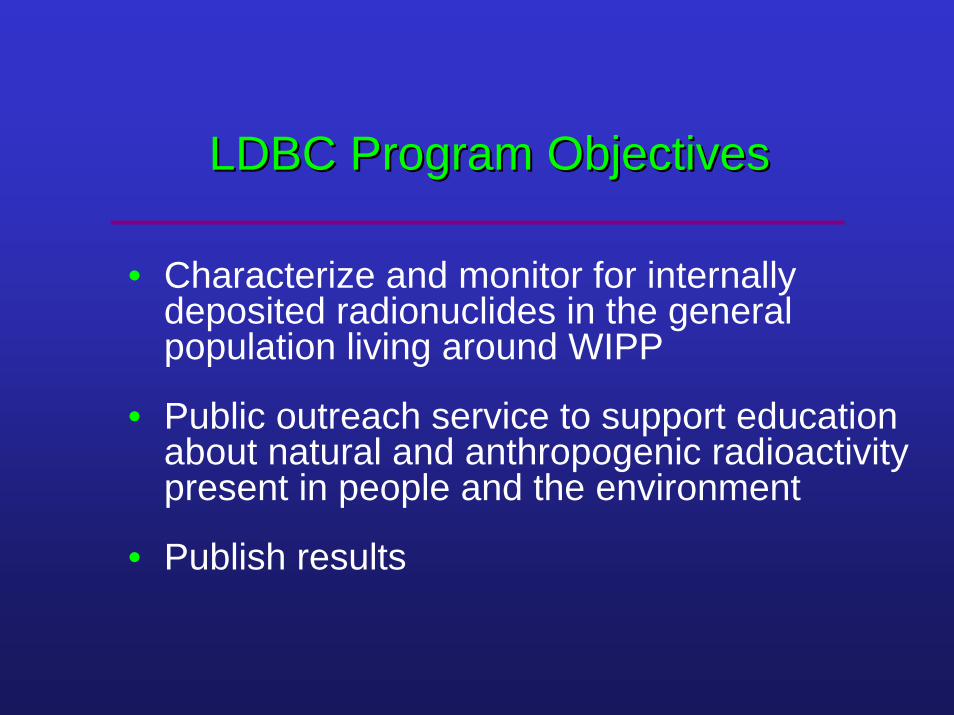
• Characterize and monitor for internally deposited radionuclides in the general population living around WIPP
• Public outreach service to support education about natural and anthropogenic radioactivity present in people and the environment
• Publish results
LDBC Program ObjectivesLDBC Program Objectives
Lie Down & Be Counted ProgramLie Down & Be Counted Program
• Unique data on prevalence and natural variability of radionuclides in the general adult population
Lie Down & Be Counted ProgramLie Down & Be Counted Program
• Unique data on prevalence and natural variability of radionuclides in the general adult population
• WIPP pre-operational and operational data comparisons
Lie Down & Be Counted ProgramLie Down & Be Counted Program
• Unique data on prevalence and natural variability of radionuclides in the general adult population
• WIPP pre-operational and operational data comparisons
• Evaluate the methods and uncertainties associated with in vivo bioassay measurements
Lie Down & Be Counted ProgramLie Down & Be Counted Program• ~700 individuals recruited since July 1997
40 new volunteers since monitoring program resumed in FY05
Lie Down & Be Counted ProgramLie Down & Be Counted Program• ~700 individuals recruited since July 1997
40 new volunteers since monitoring program resumed in FY05
• Over 930 total counts performed, including recounts
Lie Down & Be Counted ProgramLie Down & Be Counted Program• ~700 individuals recruited since July 1997
40 new volunteers since monitoring program resumed in FY05
• Over 930 total counts performed, including recounts
• 367 volunteers counted prior to WIPP receiving waste; these serve as a “baseline”
As of October 1, 2003, operational monitoring results for all radionuclides were consistent with the baseline results.
No evidence of a change in the frequency of detection since WIPP began receipt of radioactive waste.
• Cs-137 detected in over 20% of individuals

Lie Down & Be Counted ProgramLie Down & Be Counted Program
Long Term Goals:
• Recruit 50 - 75 new individuals / year
• Recount individuals at least every 2 years
• Expand the region boundaries for recruiting new volunteers
• Refine & enhance education / outreach program
• Provide scientifically credible measurements of potential contaminant releases from the WIPP
• Provide data management and make data easily accessible to the public
• Publish results (peer reviewed)
WIPPWIPP--EM ObjectivesEM Objectives
Program Managers Program Managers --
Rich ArimotoRich Arimoto -- AerosolsAerosolsBarry StewartBarry Stewart -- RadiochemistryRadiochemistryTom KirchnerTom Kirchner -- Soils & data managementSoils & data management
• Understand the WIPP environment
• Detect releases below compliance levels
• Evaluate potential sources of exposure
• Measure pathways of public concern
Monitoring GoalsMonitoring Goals
CEMRC Studies at Station ACEMRC Studies at Station A
Sampling commenced 12 December 1998Sampling commenced 12 December 1998•
Three aerosol samplers (shroudedThree aerosol samplers (shrouded--probes, FAS) probes, FAS) •
AirAir--stream split among groups, flow ~2 stream split among groups, flow ~2 cfmcfm eacheach•
Daily (~24 hr) samples, except weekends Daily (~24 hr) samples, except weekends (48 hr samples)(48 hr samples)
•
Changes in CEMRC FAS Program Changes in CEMRC FAS Program (July 2004)(July 2004)
Compositing procedure for daily samples changed Compositing procedure for daily samples changed (quarterly to monthly)(quarterly to monthly)
•
Alpha (actinide) count times changed (5 Alpha (actinide) count times changed (5 →→ 1 d)•
Data base modificationsData base modifications•
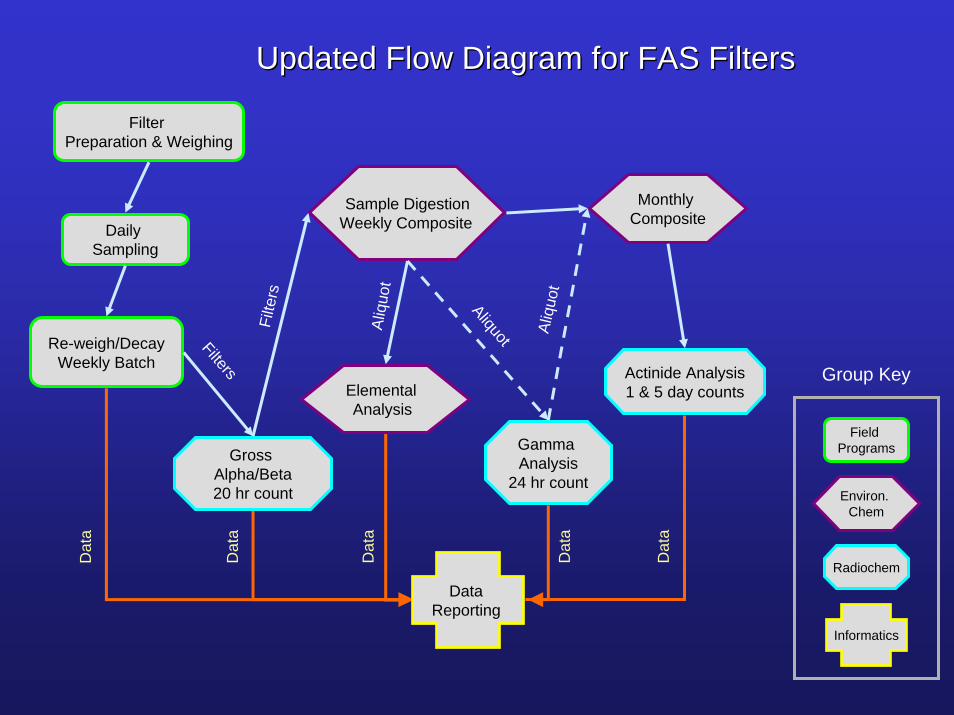
Updated Flow Diagram for FAS FiltersUpdated Flow Diagram for FAS Filters
Filter Preparation & Weighing
Daily Sampling
Re-weigh/DecayWeekly Batch
Gross Alpha/Beta20 hr count
Actinide Analysis1 & 5 day counts
Gamma Analysis
24 hr count
Sample DigestionWeekly Composite
Elemental Analysis
Monthly Composite
Field Programs
Environ. Chem
Radiochem
Filters
Aliq
uot
Aliquot
Dat
a
Dat
a
Dat
a
Dat
a
Filte
rs
Aliq
uot
Dat
a
Group Key
Data Reporting
Informatics
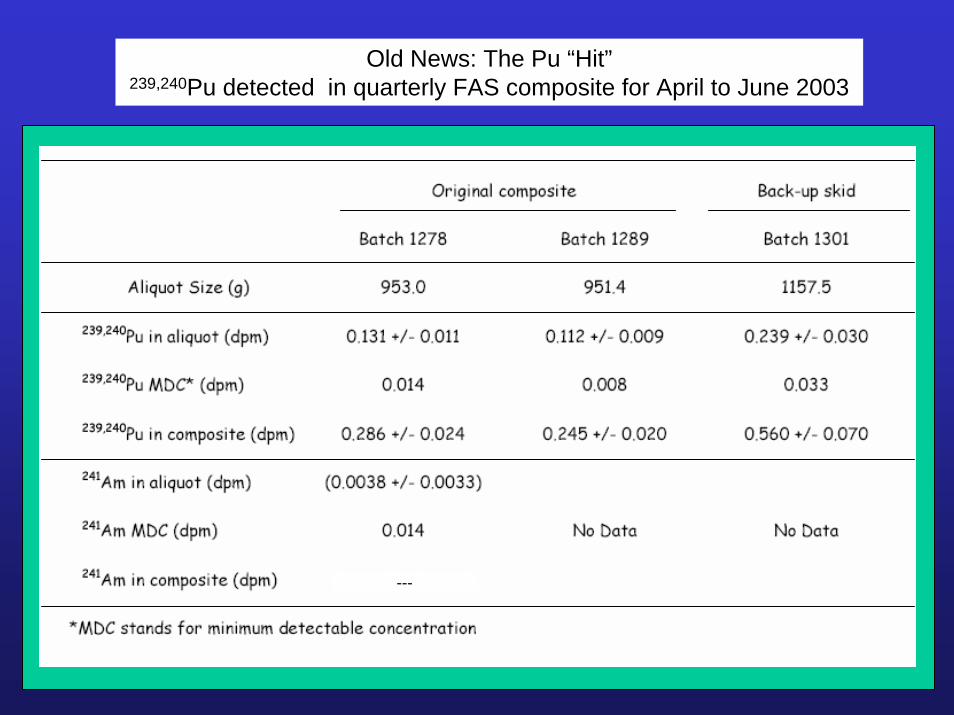
Old News: The Pu “Hit”239,240Pu detected in quarterly FAS composite for April to June 2003
---
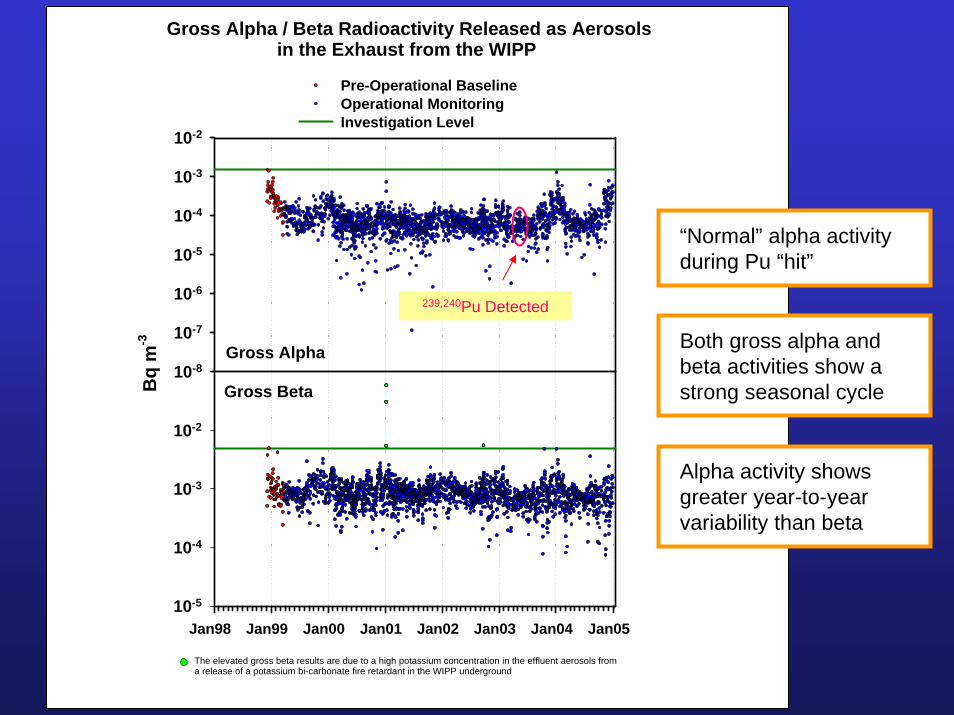
Gross Alpha / Beta Radioactivity Released as Aerosolsin the Exhaust from the WIPP
Bq
m-3
10-8
10-7
10-6
10-5
10-4
10-3
10-2
Pre-Operational BaselineOperational MonitoringInvestigation Level
Gross Alpha
Jan98 Jan99 Jan00 Jan01 Jan02 Jan03 Jan04 Jan05 10-5
10-4
10-3
10-2
Gross Beta
The elevated gross beta results are due to a high potassium concentration in the effluent aerosols froma release of a potassium bi-carbonate fire retardant in the WIPP underground
Both gross alpha and beta activities show a strong seasonal cycle
Alpha activity shows greater year-to-year variability than beta
239,240Pu Detected
“Normal” alpha activity during Pu “hit”
Con
cent
ratio
n, n
g m
-3
101
102
103
104
105
106
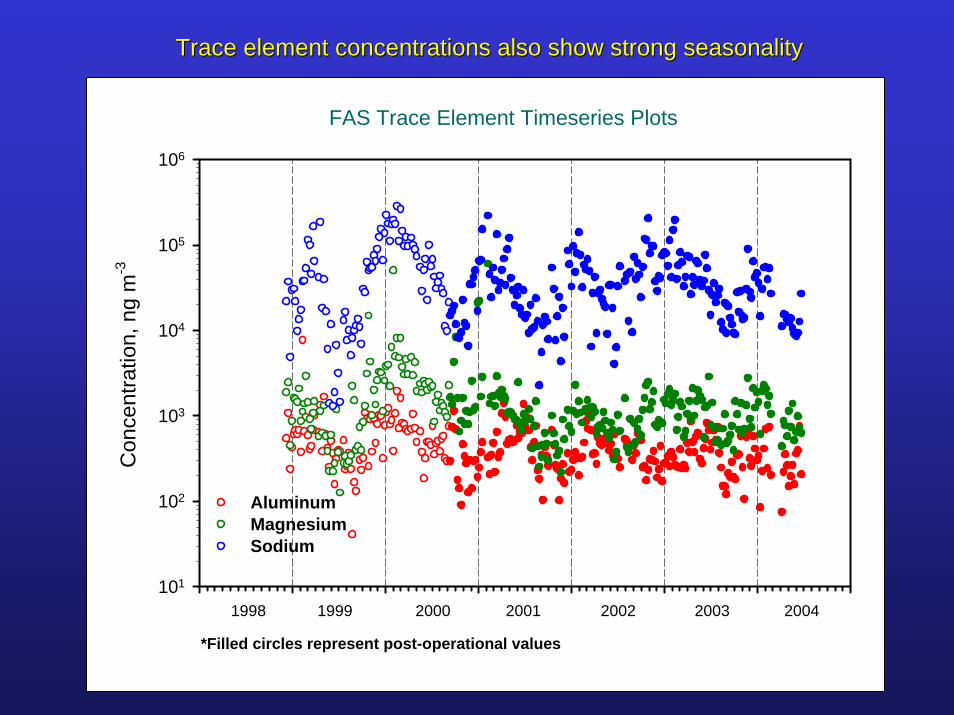
AluminumMagnesiumSodium
*Filled circles represent post-operational values
1998 1999 2000 2001 2002 2003 2004
FAS Trace Element Timeseries Plots
Trace element concentrations also show strong seasonalityTrace element concentrations also show strong seasonality
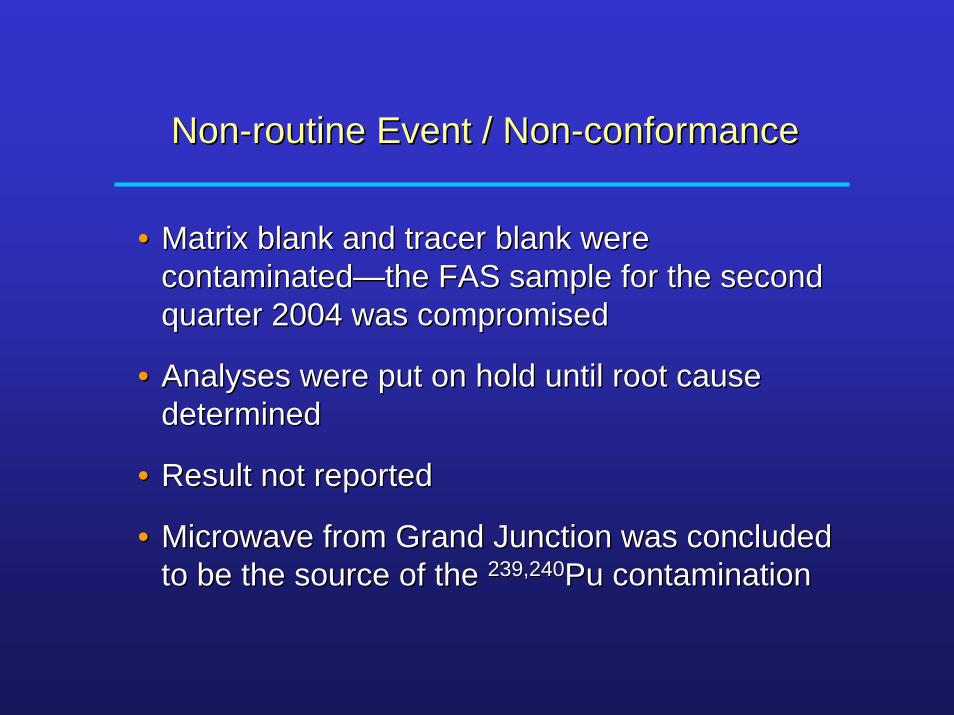
NonNon--routine Event / Nonroutine Event / Non--conformanceconformance
•• Matrix blank and tracer blank were Matrix blank and tracer blank were contaminatedcontaminated——the FAS sample for the second the FAS sample for the second quarter 2004 was compromisedquarter 2004 was compromised
•• Analyses were put on hold until root cause Analyses were put on hold until root cause determineddetermined
•• Result not reportedResult not reported
•• Microwave from Grand Junction was concluded Microwave from Grand Junction was concluded to be the source of the to be the source of the 239,240239,240Pu Pu contaminationcontamination
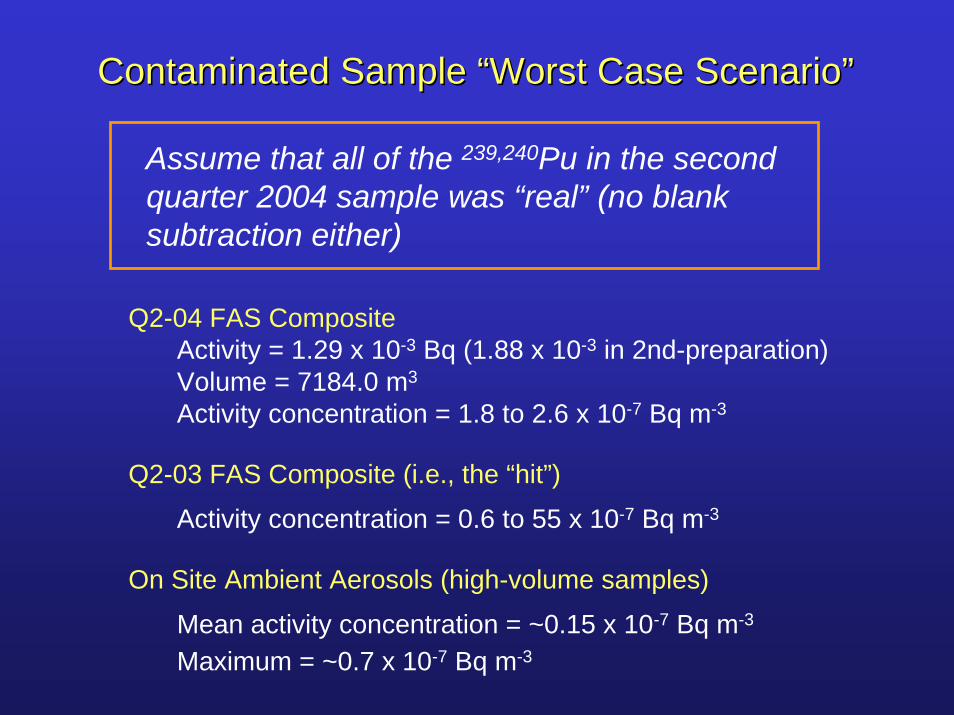
Contaminated Sample Contaminated Sample ““Worst Case ScenarioWorst Case Scenario””
Assume that all of the 239,240Pu in the second quarter 2004 sample was “real” (no blank subtraction either)
Q2-04 FAS CompositeActivity = 1.29 x 10⁻³ Bq (1.88 x 10⁻³ in 2nd-preparation)Volume = 7184.0 m3
Activity concentration = 1.8 to 2.6 x 10⁻⁷ Bq m-3
Q2-03 FAS Composite (i.e., the “hit”)
Activity concentration = 0.6 to 55 x 10-7 Bq m-3
On Site Ambient Aerosols (high-volume samples)
Mean activity concentration = ~0.15 x 10⁻⁷ Bq m-3
Maximum = ~0.7 x 10⁻⁷ Bq m-3
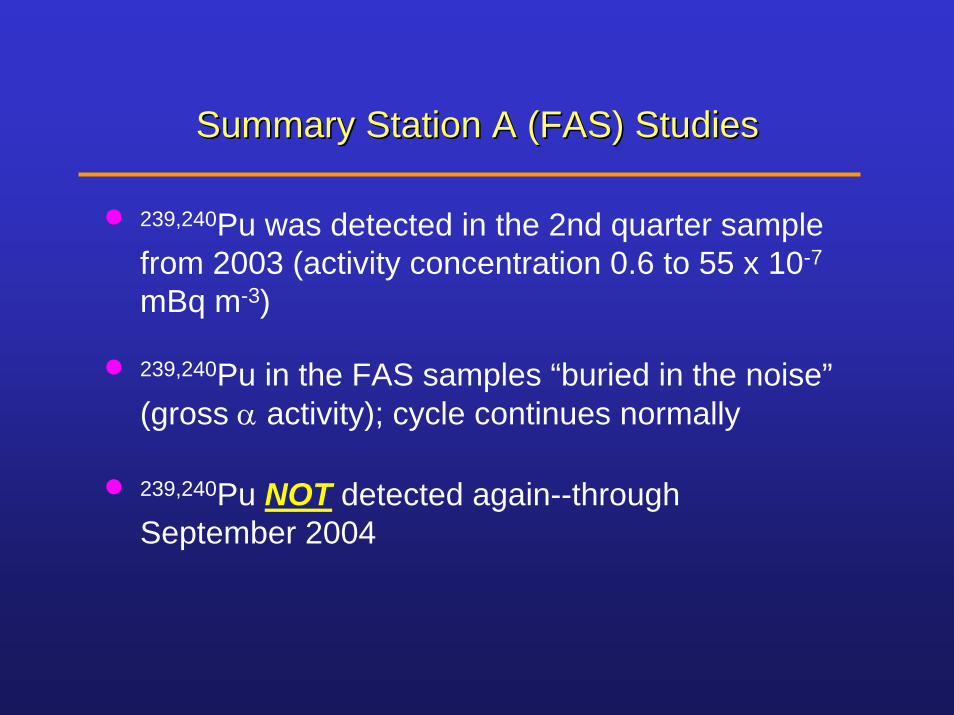
Summary Station A (FAS) StudiesSummary Station A (FAS) Studies
• 239,240Pu in the FAS samples “buried in the noise”(gross α activity); cycle continues normally
• 239,240Pu NOT detected again--through September 2004
• 239,240Pu was detected in the 2nd quarter sample from 2003 (activity concentration 0.6 to 55 x 10-7
mBq m-3)
Station A Technical Tasks FY05Station A Technical Tasks FY05
(1) In Situ Probe Occlusion Test
Attachments 4 & 5, CEMRC SOW 2005
(2) Teflon® Coated Probe Test
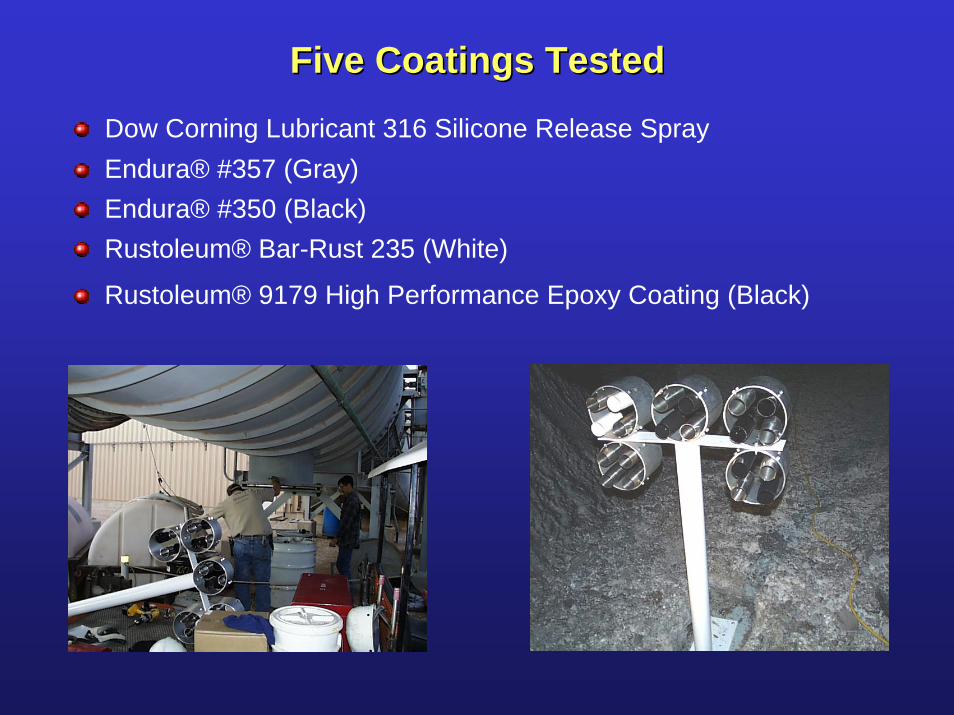
Dow Corning Lubricant 316 Silicone Release SprayEndura® #357 (Gray)Endura® #350 (Black)Rustoleum® Bar-Rust 235 (White)
Rustoleum® 9179 High Performance Epoxy Coating (Black)
Five Coatings TestedFive Coatings Tested
Ambient Aerosol Studies
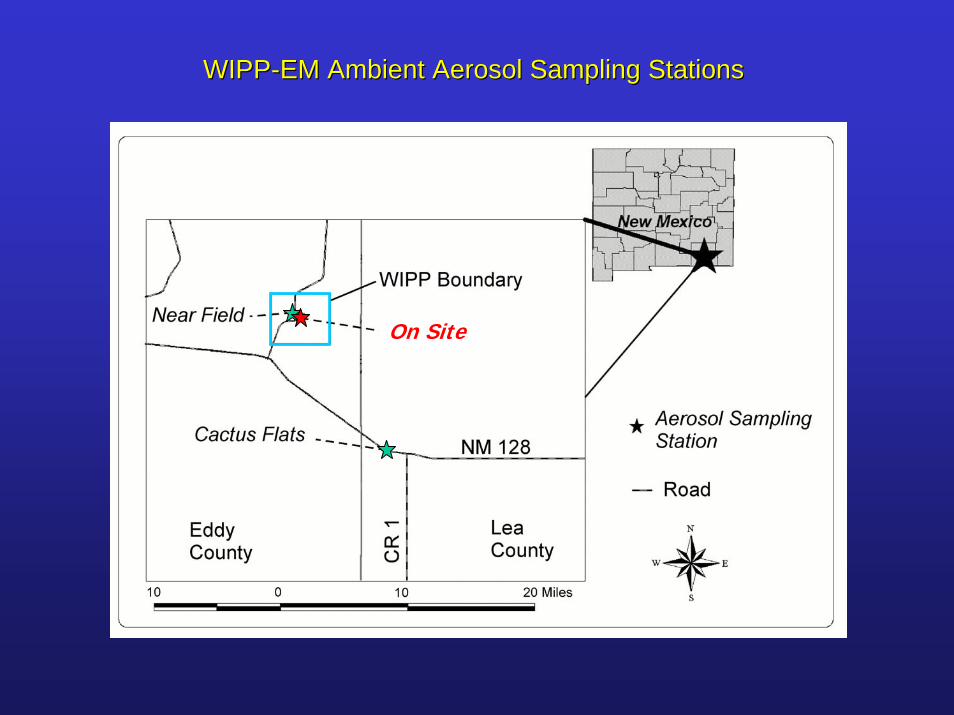
WIPPWIPP--EM Ambient Aerosol Sampling StationsEM Ambient Aerosol Sampling Stations
On Site
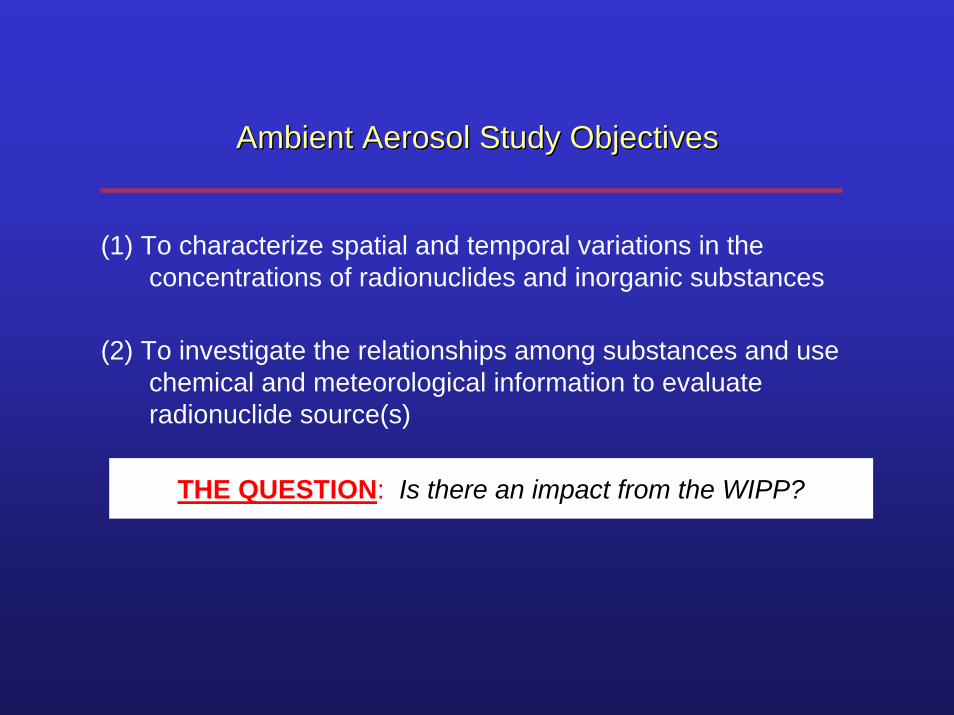
(1) To characterize spatial and temporal variations in the concentrations of radionuclides and inorganic substances
Ambient Aerosol Study ObjectivesAmbient Aerosol Study Objectives
THE QUESTION: Is there an impact from the WIPP?
(2) To investigate the relationships among substances and use chemical and meteorological information to evaluate radionuclide source(s)
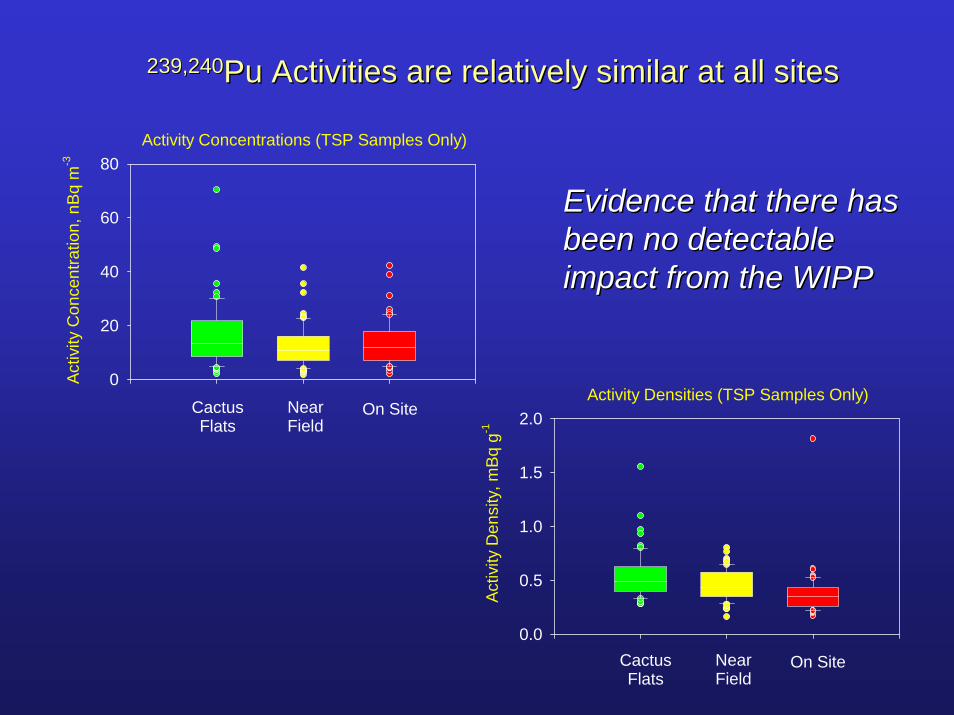
Activity Concentrations (TSP Samples Only)
Activ
ity C
once
ntra
tion,
nBq
m-3
0
20
40
60
80
CactusFlats
NearField
On SiteActivity Densities (TSP Samples Only)
Activ
ity D
ensi
ty, m
Bq g
-1
0.0
0.5
1.0
1.5
2.0
CactusFlats
NearField
On Site
239,240239,240Pu ActivitiesPu Activities are relatively similar at all sitesare relatively similar at all sites
Evidence that there has Evidence that there has been no detectable been no detectable impact from the WIPPimpact from the WIPP
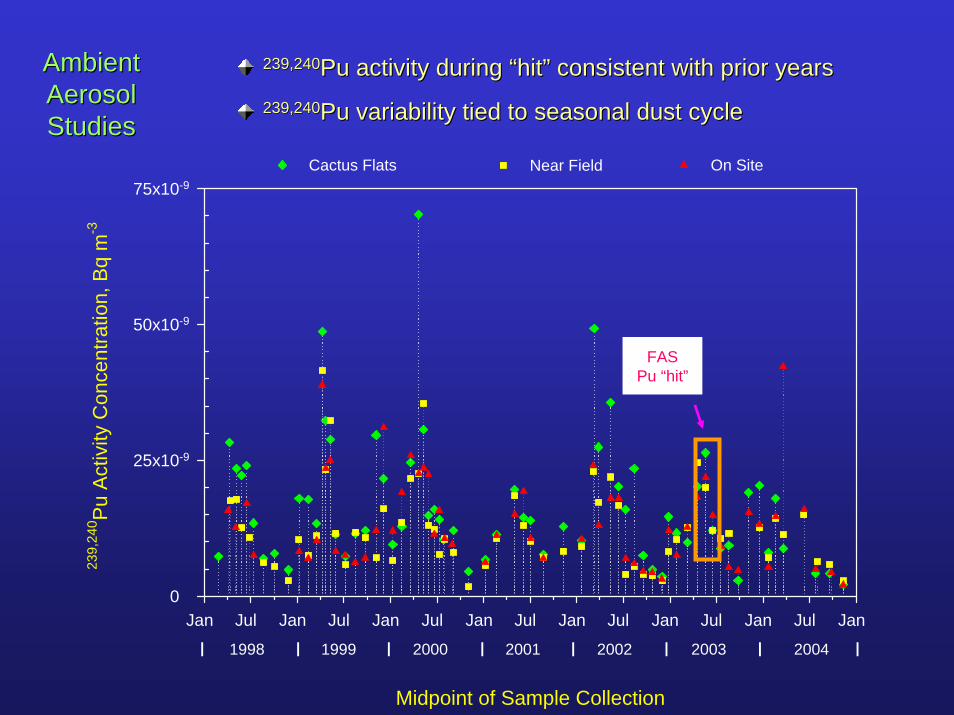
Midpoint of Sample Collection
Jan Jul Jan Jul Jan Jul Jan Jul Jan Jul Jan Jul Jan Jul Jan
239,
240 P
u A
ctiv
ity C
once
ntra
tion,
Bq
m-3
0
25x10-9
50x10-9
75x10-9
1998 1999 2000 2001 2002 2003 2004I I I I I I I I
Cactus Flats Near Field On Site
FAS Pu “hit”
239,240239,240Pu activity during Pu activity during ““hithit”” consistent with prior yearsconsistent with prior yearsAmbient Ambient Aerosol Aerosol StudiesStudies
239,240239,240Pu variability tied to seasonal dust cyclePu variability tied to seasonal dust cycle
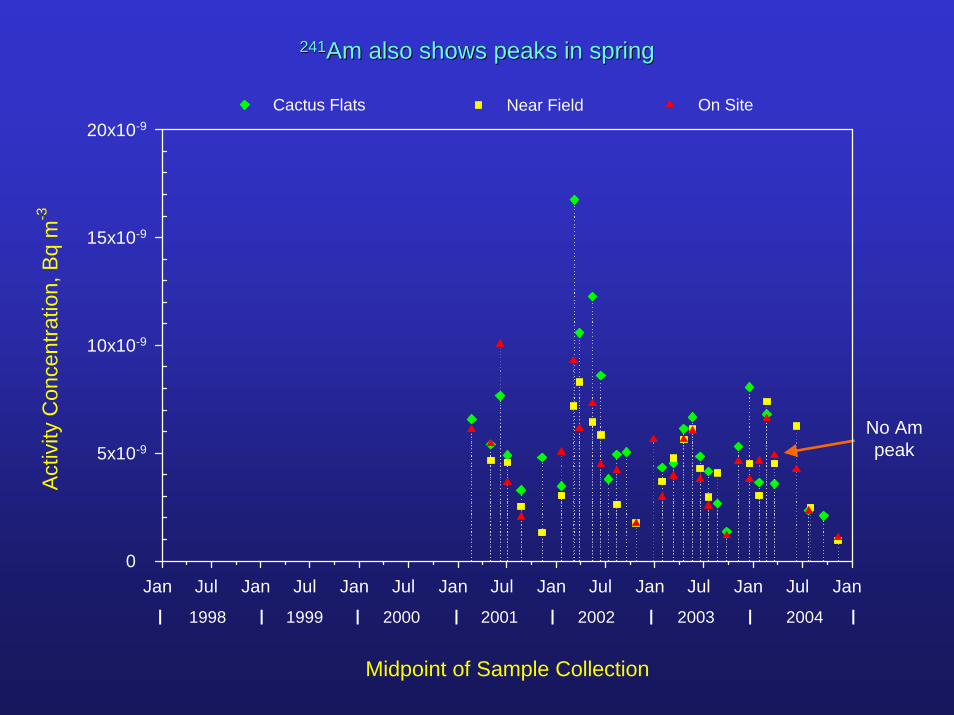
241241Am also shows peaks in springAm also shows peaks in spring
No Am peak
Midpoint of Sample Collection
Jan Jul Jan Jul Jan Jul Jan Jul Jan Jul Jan Jul Jan Jul Jan
Activ
ity C
once
ntra
tion,
Bq
m-3
0
5x10⁻⁹
10x10-9
15x10-9
20x10-9
1998 1999 2000 2001 2002 2003 2004I I I I I I I I
Cactus Flats Near Field On Site
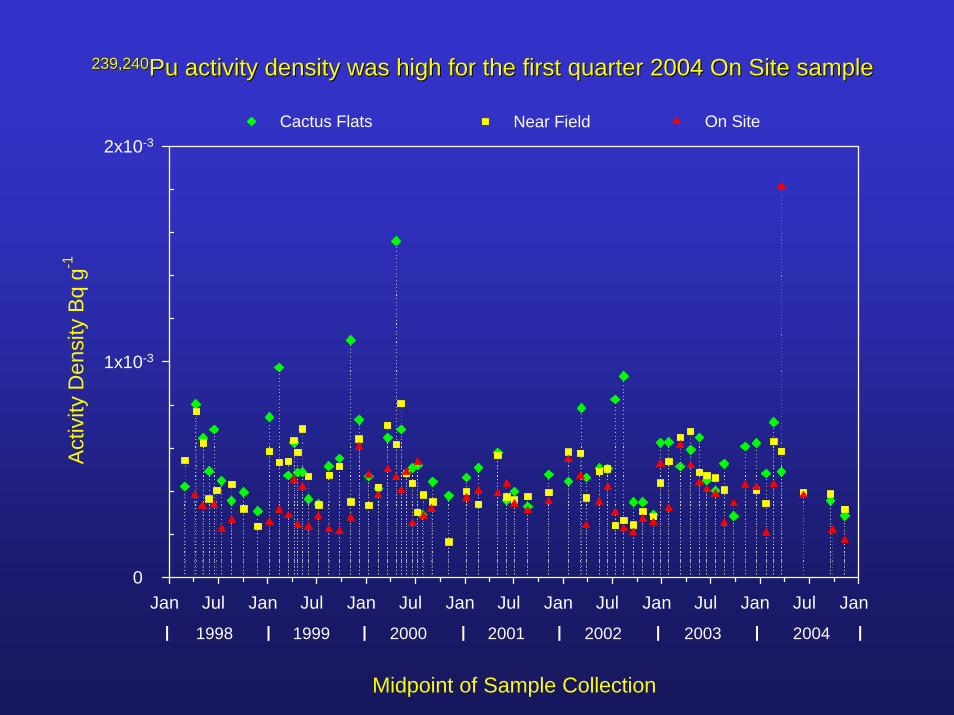
239,240239,240Pu activity density was high for the first quarter 2004 On Site Pu activity density was high for the first quarter 2004 On Site samplesample
Midpoint of Sample Collection
Jan Jul Jan Jul Jan Jul Jan Jul Jan Jul Jan Jul Jan Jul Jan
Act
ivity
Den
sity
Bq
g-1
0
1x10⁻³
2x10⁻³
1998 1999 2000 2001 2002 2003 2004I I I I I I I I
Cactus Flats Near Field On Site
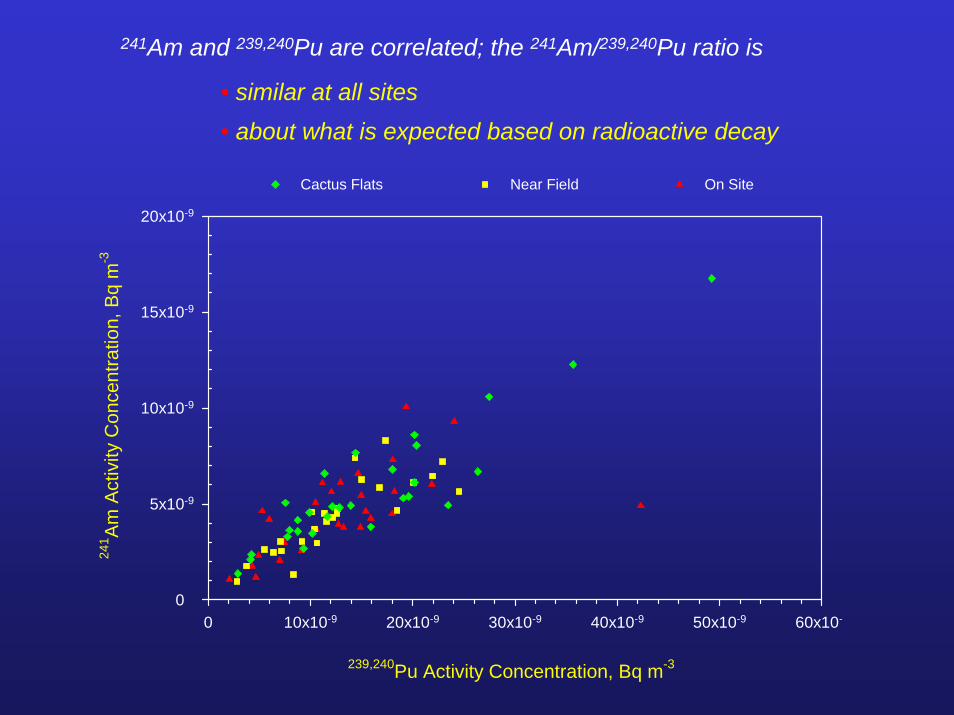
241Am and 239,240Pu are correlated; the 241Am/239,240Pu ratio is
• similar at all sites• about what is expected based on radioactive decay
239,240Pu Activity Concentration, Bq m-3
0 10x10-9 20x10-9 30x10-9 40x10-9 50x10-9 60x10-
241 A
m A
ctiv
ity C
once
ntra
tion,
Bq
m-3
0
5x10⁻⁹
10x10-9
15x10-9
20x10-9
On SiteNear FieldCactus Flats
Conclusions
239,240Pu and 241Am in ambient aerosols are associated with resuspended mineral dust—paper submitted to Atmospheric Environment
239,240Pu in ambient aerosols is consistent with prior results, i.e., no evidence of any releases from the WIPP

Other Studies
The identification and quantification of The identification and quantification of GnomeGnome--derived radionuclides in WIPP derived radionuclides in WIPP
Environmental SamplesEnvironmental Samples
Soil Erosion Field Study
Attachment 3, CEMRC SOW 2005
Activity vs. Particle-Size Study
Radiochemical Fingerprint Study
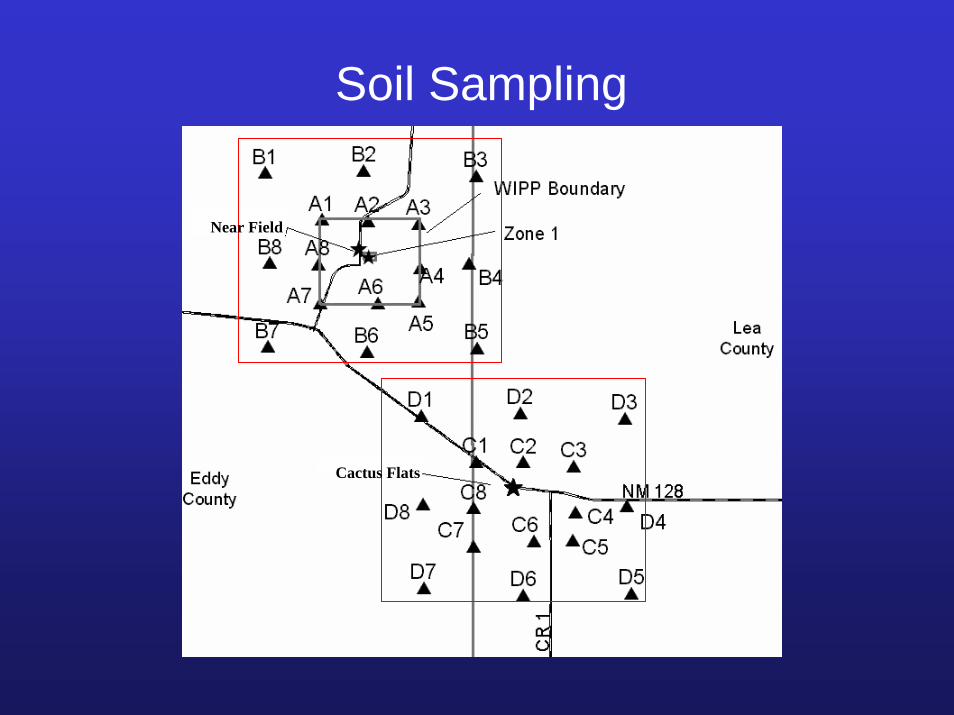
Soil Sampling
Cactus Flats
Near Field
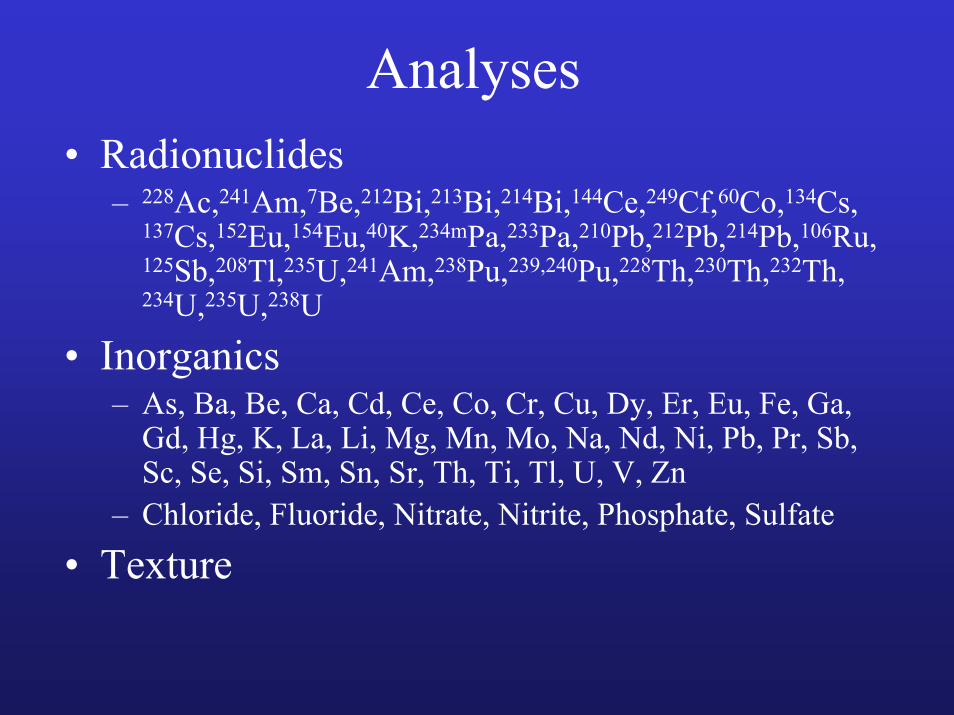
Analyses• Radionuclides
– 228Ac,241Am,7Be,212Bi,213Bi,214Bi,144Ce,249Cf,60Co,134Cs, 137Cs,152Eu,154Eu,40K,234mPa,233Pa,210Pb,212Pb,214Pb,106Ru, 125Sb,208Tl,235U,241Am,238Pu,239,240Pu,228Th,230Th,232Th, 234U,235U,238U
• Inorganics– As, Ba, Be, Ca, Cd, Ce, Co, Cr, Cu, Dy, Er, Eu, Fe, Ga,
Gd, Hg, K, La, Li, Mg, Mn, Mo, Na, Nd, Ni, Pb, Pr, Sb, Sc, Se, Si, Sm, Sn, Sr, Th, Ti, Tl, U, V, Zn
– Chloride, Fluoride, Nitrate, Nitrite, Phosphate, Sulfate
• Texture
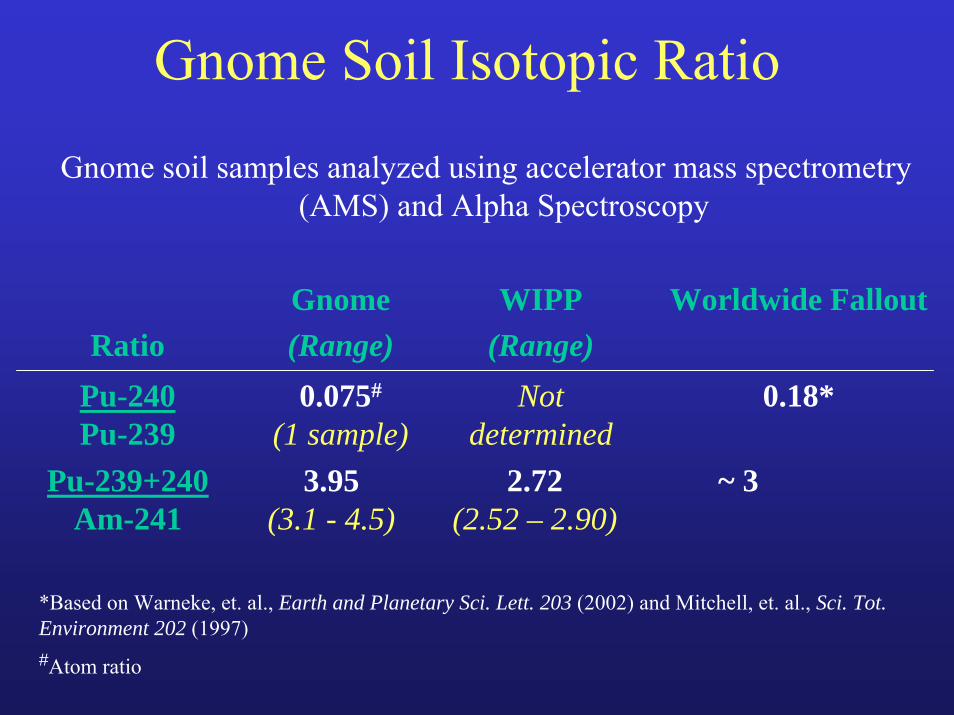
Gnome Soil Isotopic Ratio
Gnome soil samples analyzed using accelerator mass spectrometry (AMS) and Alpha Spectroscopy
RatioGnome(Range)
WIPP(Range)
Worldwide Fallout
Pu-240Pu-239
0.075#
(1 sample)Not
determined0.18*
*Based on Warneke, et. al., Earth and Planetary Sci. Lett. 203 (2002) and Mitchell, et. al., Sci. Tot. Environment 202 (1997)#Atom ratio
Pu-239+240Am-241
3.95(3.1 - 4.5)
2.72(2.52 – 2.90)
~ 3
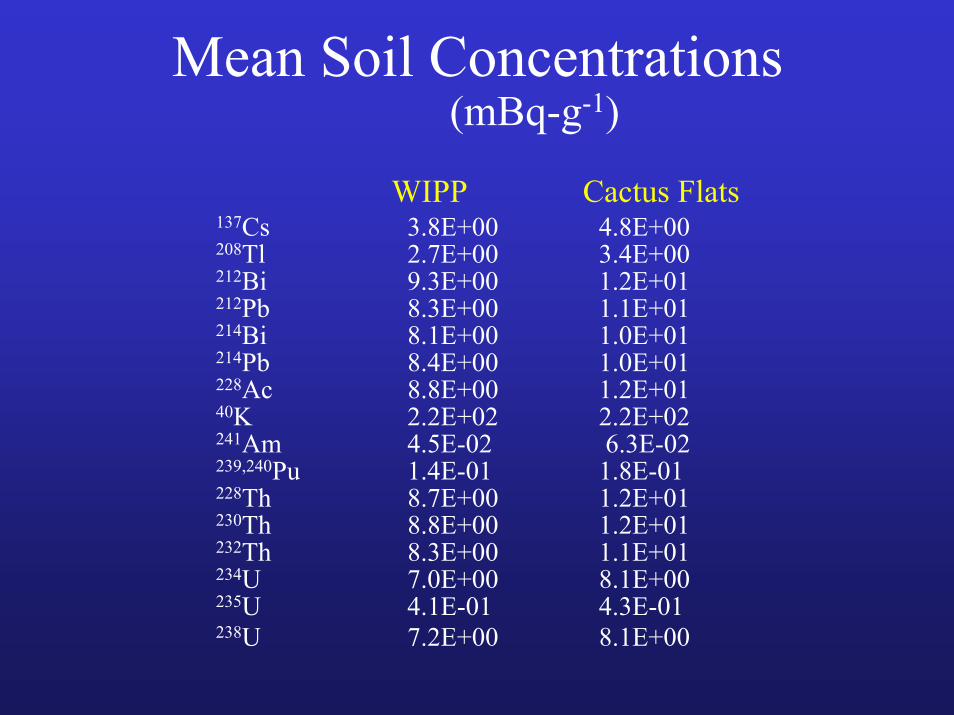
(mBq-g-1)Mean Soil Concentrations
137Cs 3.8E+00 4.8E+00208Tl 2.7E+00 3.4E+00212Bi 9.3E+00 1.2E+01212Pb 8.3E+00 1.1E+01214Bi 8.1E+00 1.0E+01214Pb 8.4E+00 1.0E+01228Ac 8.8E+00 1.2E+0140K 2.2E+02 2.2E+02241Am 4.5E-02 6.3E-02239,240Pu 1.4E-01 1.8E-01228Th 8.7E+00 1.2E+01230Th 8.8E+00 1.2E+01232Th 8.3E+00 1.1E+01234U 7.0E+00 8.1E+00235U 4.1E-01 4.3E-01238U 7.2E+00 8.1E+00
WIPP Cactus Flats
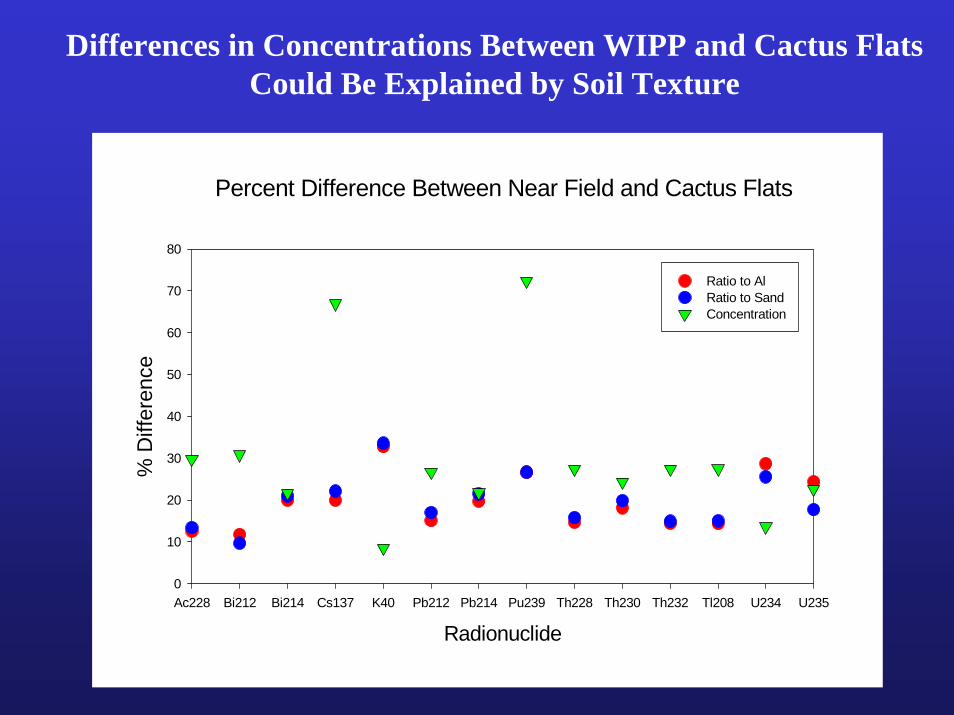
Percent Difference Between Near Field and Cactus Flats
RadionuclideAc228 Bi212 Bi214 Cs137 K40 Pb212 Pb214 Pu239 Th228 Th230 Th232 Tl208 U234 U235
% D
iffer
ence
0
10
20
30
40
50
60
70
80
Ratio to AlRatio to Sand Concentration
Differences in Concentrations Between WIPP and Cactus Flats Could Be Explained by Soil Texture
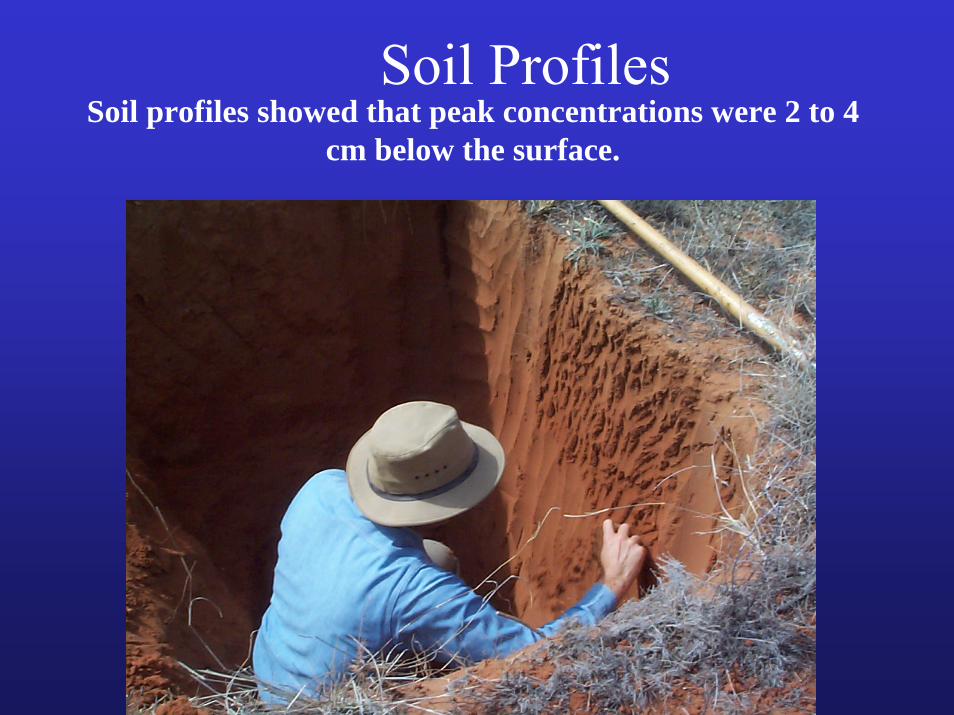
Soil ProfilesSoil profiles showed that peak concentrations were 2 to 4
cm below the surface.
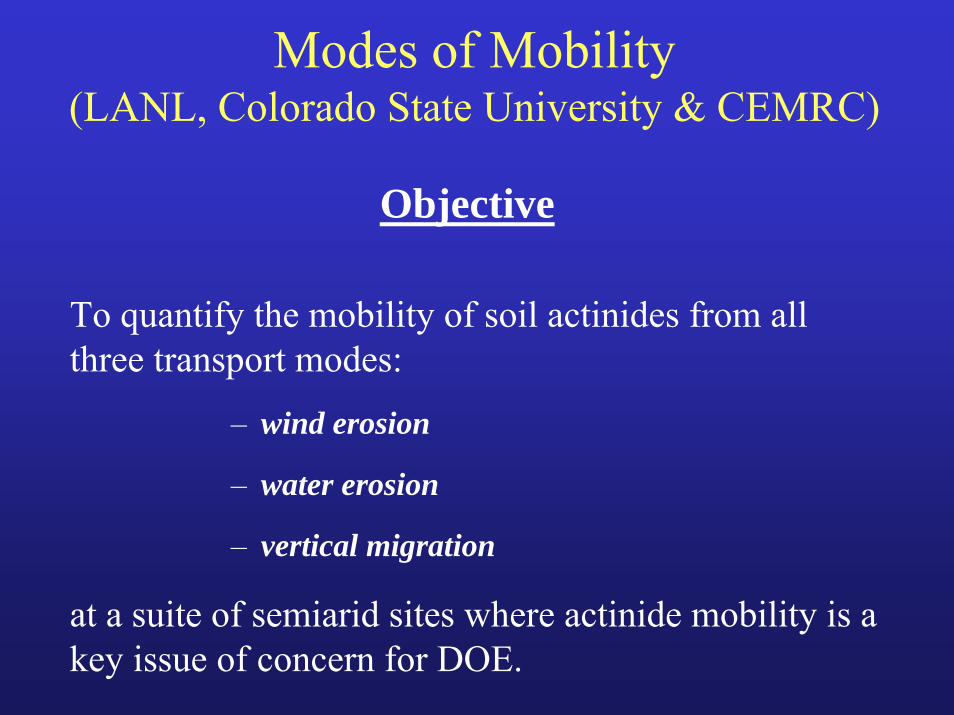
Modes of Mobility(LANL, Colorado State University & CEMRC)
Objective
To quantify the mobility of soil actinides from all three transport modes:
– wind erosion
– water erosion
– vertical migration
at a suite of semiarid sites where actinide mobility is a key issue of concern for DOE.
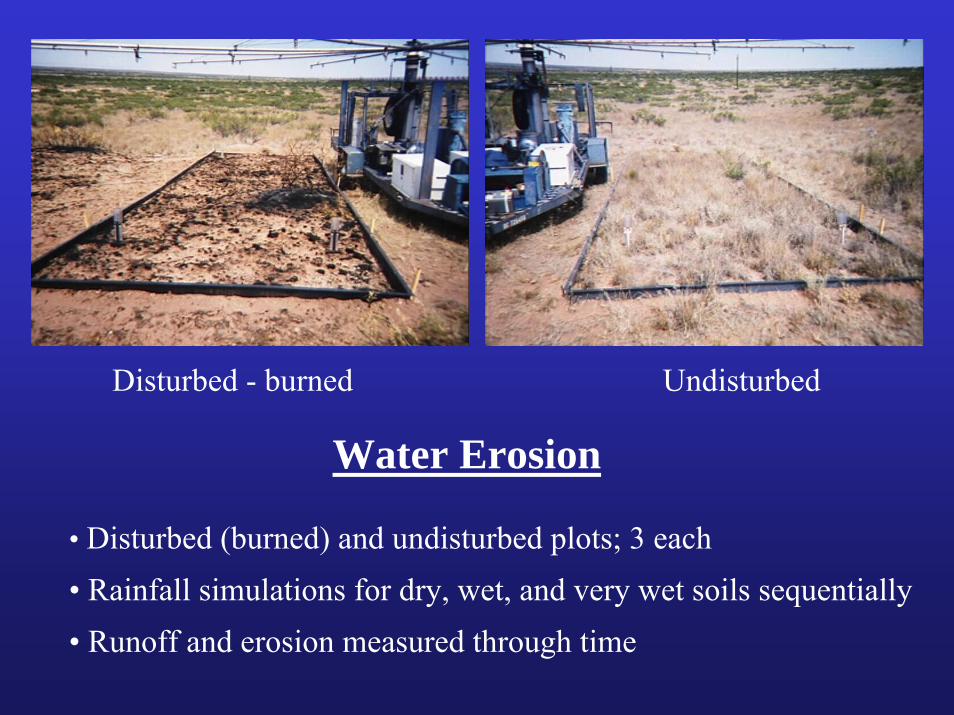
Water Erosion
Disturbed - burned Undisturbed
• Disturbed (burned) and undisturbed plots; 3 each• Rainfall simulations for dry, wet, and very wet soils sequentially• Runoff and erosion measured through time
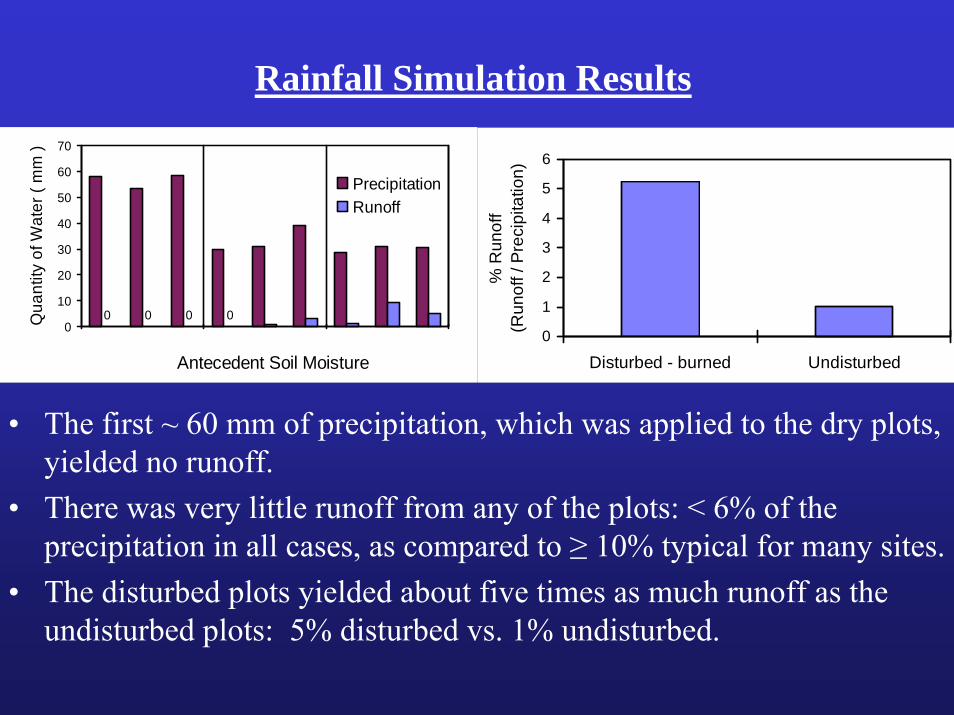
Rainfall Simulation Results
• The first ~ 60 mm of precipitation, which was applied to the dry plots, yielded no runoff.
• There was very little runoff from any of the plots: < 6% of the precipitation in all cases, as compared to ≥ 10% typical for many sites.
• The disturbed plots yielded about five times as much runoff as the undisturbed plots: 5% disturbed vs. 1% undisturbed.
Dry Wet Very Wet 0
1
2
3
4
5
6
Disturbed - burned Undisturbed
% R
unof
f (R
unof
f / P
reci
pita
tion)
0 0 0 00
10
20
30
40
50
60
70
Antecedent Soil Moisture
Qua
ntity
of W
ater
( m
m )
PrecipitationRunoff
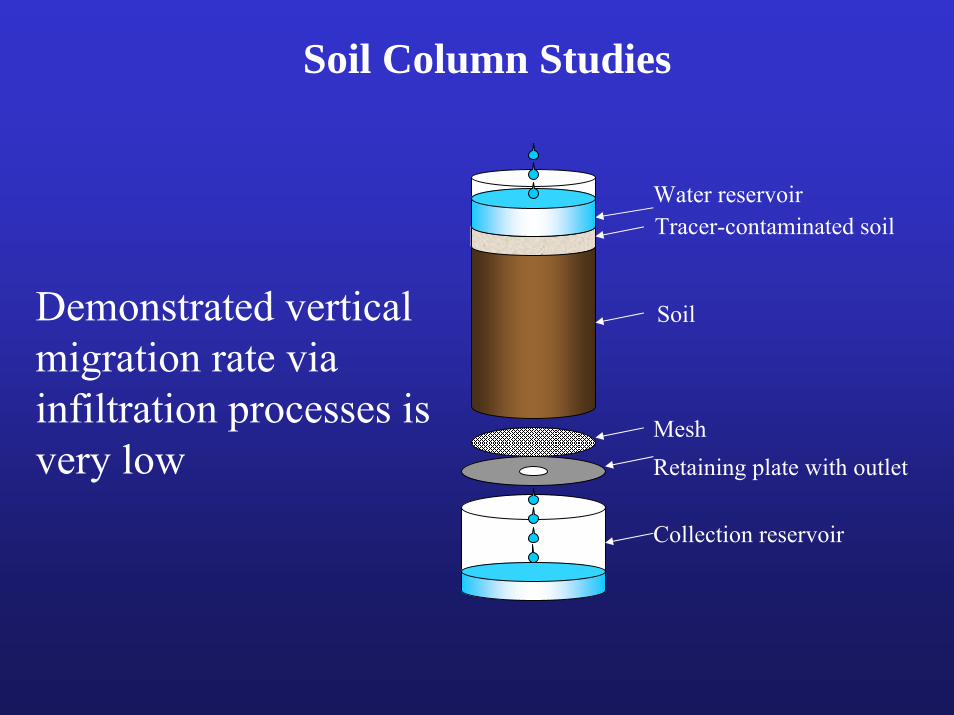
Water reservoirTracer-contaminated soil
Mesh
Collection reservoir
Retaining plate with outlet
Demonstrated vertical migration rate via infiltration processes is very low
Soil
Soil Column Studies
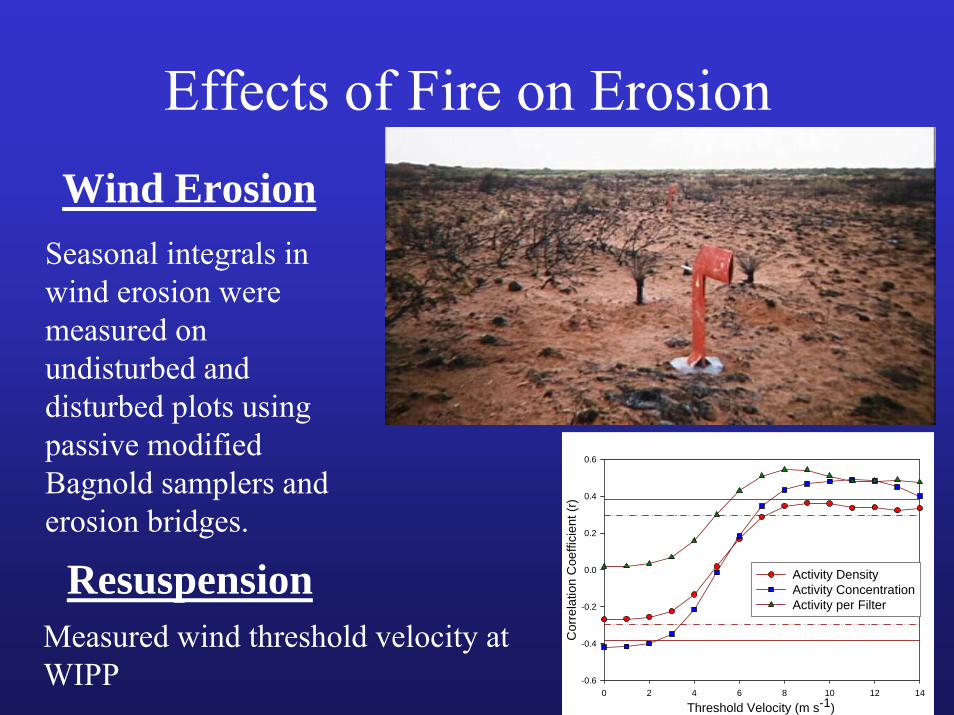
Effects of Fire on ErosionWind Erosion
Seasonal integrals in wind erosion were measured on undisturbed and disturbed plots using passive modified Bagnold samplers and erosion bridges.
Measured wind threshold velocity at WIPP
Resuspension
Threshold Velocity (m s-1)0 2 4 6 8 10 12 14
Cor
rela
tion
Coe
ffici
ent (
r)
-0.6
-0.4
-0.2
0.0
0.2
0.4
0.6
Activity DensityActivity ConcentrationActivity per Filter
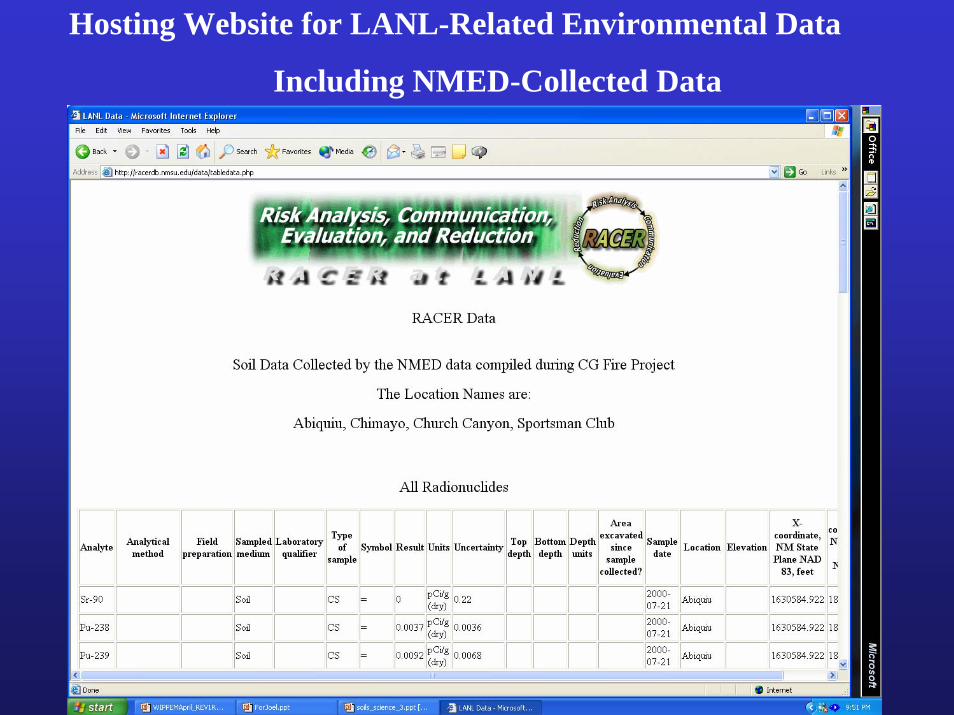
Hosting Website for LANL-Related Environmental Data
Including NMED-Collected Data