2011 sat report - public schools of north carolina
TRANSCRIPT

THE NORTH CAROLINA2011 SAT REPORTThe URL for the complete report:http://www.ncpublicschools.org/accountability/reporting/sat/2011
PUBLIC SCHOOLS OF NORTH CAROLINA September 2011State Board of Education | Department of Public InstructionAccountability Services Division

STATE BOARD OF EDUCATIONThe guiding mission of the North Carolina State Board of Education is that every public school student will graduate from high school, globally competitive for work and postsecondary education and prepared for life in the 21st Century.
NC DEPARTMENT OF PUBLIC INSTRUCTIONJune St. Clair Atkinson, Ed.D., State Superintendent301 N. Wilmington Street :: Raleigh, North Carolina 27601-2825
In compliance with federal law, NC Public Schools administers all state-operated educational programs, employment activities and admissions without discrimination because of race, religion, national or ethnic origin, color, age, military service, disability, or gender, except where exemption is appropriate and allowed by law.
Inquiries or complaints regarding discrimination issues should be directed to:Dr. Rebecca Garland, Chief Academic Officer :: Academic Services and Instructional Support6368 Mail Service Center, Raleigh, NC 27699-6368 :: Telephone: (919) 807-3200 :: Fax: (919) 807-4065 Visit us on the Web :: www.ncpublicschools.org
WILLIAM C. HARRISONChairman :: Fayetteville
WAYNE MCDEVITTVice Chair :: Asheville
WALTER DALTONLieutenant Governor :: Rutherfordton
JANET COWELLState Treasurer :: Raleigh
JEAN W. WOOLARDPlymouth
REGINALD KENANRose Hill
KEVIN D. HOWELLRaleigh
SHIRLEY E. HARRISTroy
CHRISTINE J. GREENEHigh Point
JOHN A. TATE IIICharlotte
ROBERT “TOM” SPEEDBoone
MELISSA E. BARTLETTRoxboro
PATRICIA N. WILLOUGHBYRaleigh
M0910

The North Carolina SAT Report • 2011 i
Table of Contents
Page List of Tables ..................................................................................................................................ii List of Figures ...........................................................................................................................iii-iv A Note on the Use of Aggregate SAT Data ....................................................................................v Background Evolution of the SAT .............................................................................................................1-3 Factors Influencing Score Fluctuations .................................................................................4-5 Validity of the SAT for Predicting First-Year College Grade Point Average (FYGPA)…………………………………………………………………………….5 Differential Validity and Prediction of the SAT………………………………………………6 Scope and Limitations ...............................................................................................................7 Overall Performance (Public and Private Schools) ...................................................................8-11 Critical Reading and Mathematics Scores .........................................................................12-13
Gender ...............................................................................................................................11-15 Race/Ethnicity ...................................................................................................................16-18 Race/Ethnicity by Gender ..................................................................................................18-21 Family Income ...................................................................................................................21-23 Grade Point Average (GPA) ..............................................................................................23-25
North Carolina and the University of North Carolina System ................................................26-27 North Carolina’s School Systems and Schools .......................................................................28-29 Public Schools..........................................................................................................................30-31 References ...............................................................................................................................32-33 Appendices ...................................................................................................................................34
North Carolina and the Nation .........................................................................................35-42 Performance of the 115 Public School Systems, Charter Schools, North Carolina School of the Arts, and North Carolina School of Science and Mathematics ..............................................................................................................43-49 Distribution of North Carolina’s Public School Systems by Mean Total SAT Score…….....50 Performance of the Fifty States ........................................................................................51-55
Source: Derived from data provided by the College Board. Copyright © 2010-2011 The College Board. www.collegeboard.com
The North Carolina SAT Report • 2011 ii
List of Tables
Table Page
1 Percentages of Schools Nationally Whose Mean SAT Reasoning Test Scores Rose or Fell, 2010-2011 …………………..………………………………………5
2 Mean Critical Reading and Mathematics SAT Scores for North Carolina
and the Nation by Gender, 2001-2011 ..............................................................................15
3 Mean SAT Scores for North Carolina and the United States, 1972-2011 ........................36
4 Frequency Distribution of Critical Reading, Mathematics, and Writing SAT Scores for North Carolina’s Public School Students, 2010-2011 ............................37
5 Mean Total SAT Scores (CR + M) by Student Profile Characteristics,
2010-2011 .........................................................................................................................41
6 Mean Total SAT Scores (CR + M) for the United States and North Carolina by Student Profile Characteristics, 2007-2011 ...................................................42
7 SAT Performance by Students in North Carolina’s Public School Systems
and Schools, 2009-2011 ..............................................................................................43-49
8 Distribution of North Carolina’s Public School Systems by Mean Total SAT Scores (Critical Reading + Mathematics), 2010-2011 .............................................44
9 Mean Critical Reading (CR), Mathematics (M), Writing (W), M + CR,
and M + CR + W Scores and Percent Tested by State, 2010-2011 ..................................53 10 Change in Mean Total SAT Scores [Critical Reading (CR) + Mathematics (M)]
by State, 1991-2011 ..........................................................................................................54
11 Public and Non-Public Schools: Mean SAT Reasoning TestTM, Critical
Reading, Mathematics, and Writing Scores by State, with Changes for 2011, 2010, and 2001 ........................................................................................................55
12 Public Schools: Mean SAT Reasoning TestTM, Critical Reading, Mathematics,
and Writing Scores by State, with Changes for 2011, 2010, and 2001 ............................56

The North Carolina SAT Report • 2011 iii
List of Figures
Figure Page
1 Mean Total SAT Scores (Critical Reading + Mathematics) for the United States, the Southeast Region, and North Carolina, 2001-2011 ……………….…………10 2 Average Yearly SAT Score Gains for North Carolina and the United
States, 1989-2011...............................................................................................................11
3 Mean SAT Critical Reading Scores for North Carolina and the Nation, 2001-2011 .........................................................................................................................12
4 Mean SAT Mathematics Scores for North Carolina and the Nation, 2001-2011 .........................................................................................................................13
5 Mean Total SAT Scores (Critical Reading + Mathematics) for the United States and North Carolina by Gender, 2001-2011.............................................................14
6 Mean Total SAT Scores (Critical Reading + Mathematics) for North
Carolina by Race/Ethnicity, 2001-2011 ............................................................................17
7 Mean Total SAT Scores (Critical Reading + Mathematics) for North Carolina and the United States by Race/Ethnicity, 2010-2011 .........................................18 8 Mean SAT Scores in Critical Reading for North Carolina’s
Racial/Ethnic Groups by Gender, 2010-2011 ...................................................................19
9 Mean SAT Scores in Mathematics for North Carolina’s Racial/Ethnic Groups by Gender, 2010-2011 ..........................................................................................20
10 Mean SAT Scores in Writing for North Carolina’s Racial/Ethnic Groups by Gender, 2010-2011 ..........................................................................................21 11 Mean Total SAT Scores (Critical Reading + Mathematics) for Students in North Carolina and the Nation by Family Income, 2010-2011 ....................................22 12 Mean Total SAT Scores (Critical Reading + Mathematics) for North Carolina by Family Income and Racial/Ethnic Group, 2010-2011 .................................................23 13 Mean Total SAT Scores (Critical Reading + Mathematics) and Self-Reported Grade Point Average for Public School Students in North Carolina, 2010-2011.............24
14 Mean Total SAT Scores (Critical Reading + Mathematics) and Grade Point Averages (GPA) for North Carolina’s Public School Male and Female Students, 2010-2011.......................................................................................25

The North Carolina SAT Report • 2011 iv
Figure Page 15 The 25th, 50th, and 75th Percentiles of SAT Total Scores
(Critical Reading + Mathematics) for National College-Bound Seniors (2011), North Carolina’s College-Bound Seniors (2011), Entering Freshmen at Institutions of the University of North Carolina System, and Selected Private Universities (Fall 2010). ..................................................................27
16 Scatter Plot of Mean Total SAT Scores (Critical Reading + Mathematics) by Percent of Students Tested for All States, 2010-2011 .................................................28
17 Scatter Plot of Mean Total SAT Scores (Critical Reading + Mathematics) by Percent of Students Tested for North Carolina Public High Schools, 2010-2011 ...........................................................................................................29
18 Mean Total SAT Scores (Critical Reading + Mathematics) for Public
School Students in North Carolina and the Nation, 2001-2011.........................................30
19 Distribution of SAT Critical Reading Scores for North Carolina’s Public Schools, 2010-2011 ...............................................................................................38
20 Distribution of SAT Mathematics Scores for North Carolina’s Public Schools, 2010-2011 ...............................................................................................39 21 Distribution of SAT Writing Scores for North Carolina’s Public Schools, 2010-2011............................................................................................................40

The North Carolina SAT Report • 2011 v
A Note on the Use of Aggregate SAT Data∗
As measures of developed critical reading, mathematical and writing abilities important for success in college, SAT scores are useful in making decisions about individual students and assessing their academic preparation. Because of the increasing public interest in educational accountability, aggregate test data continue to be widely publicized and analyzed. Aggregate scores can be considered one indicator of educational quality when used in conjunction with a careful examination of other conditions that affect the educational enterprise.
However, it is important to note that many College Board tests are taken only by particular groups of self-selected students. Therefore, aggregate results of their performance on these tests usually do not reflect the educational attainment of all students in a school, district, or state.
Useful comparisons of students’ performance are possible only if all students take the same test. Average SAT scores are not appropriate for state comparisons because the percentage of SAT takers varies widely among states. In some states, a very small percentage of the college-bound seniors take the SAT. Typically, in a state with a very small percentage of the college-bound population taking the SAT, these students have strong academic backgrounds and are applicants to the nation’s most selective colleges and scholarship programs. Therefore, it is expected that the SAT critical reading, mathematics and writing averages reported for these states will be higher than the national averages. In states where a greater proportion of students with a wide range of academic backgrounds take the SAT, the scores are closer to the national averages. ________________________ ∗ Excerpted from SAT Trends: Background on the SAT Takers in the Class of 2011. Copyright 2011 by the College Entrance Examination Board. All rights reserved.

The North Carolina SAT Report • 2011 1
Background
Evolution of the SAT
The SAT is a curriculum-based test used by educators to assess how well students are prepared for post-secondary college and career opportunities. Typically, students take the test during their junior and senior years to assess their ability to reason, to solve problems, and to gauge the knowledge and skills they develop in their high school course work (College Board, 2011). For nearly a century, the SAT has been used by college admissions officers as one of the tools for determining a student’s potential for succeeding in college. In addition to SAT scores, high school transcripts, high school grades, course selection, etc. are used. Since course content and grading standards may vary widely among high schools, the SAT provides colleges and universities an objective measure, which is uniform across all schools. Unlike the initial administration of the SAT in the late 1920’s when SAT takers were a few thousand mainly white male students, the College-Bound Seniors population was more diverse in 2011. The 1,647,123 public and private college-bound students who took the SAT in 2011 were heterogeneous in composition. Notably, 1) larger numbers of traditionally under-represented minorities were included; 2) female test-takers outnumbered men; 3) one in four test-takers spoke languages other than English; 4) larger numbers of first-generation college applicants were included; 5) greater than 80 percent of all test-takers were from public schools; and 6) seventy-five percent of test-takers required financial aid (College Board, 2011).
Fifty percent of the nation’s 3,280,185 million (WICHE, 2008) public and nonpublic high school college-bound students took the SAT in 2011, compared with 67 percent of the 92,077 (WICHE, 2008) public and nonpublic high school college-bound seniors in North Carolina. By comparison, 42 percent of the nation’s projected 2,990,159 million public school college-bound seniors took the test in 2011, compared with 64 percent of North Carolina’s projected 84,401 college-bound seniors.
Since its initial development in 1926, the SAT has undergone changes in an effort to align its content with evolving curricula and instructional practices in high schools and colleges (College Board, 2004). Below is a brief chronology of the major changes that have occurred since the test’s original inception:
1994
o Critical reading questions were given more emphasis. o Longer reading passages were added. o Non-multiple choice questions in mathematics were introduced. o Calculators were allowed for the first time. o Antonyms were eliminated.
1995
o The Educational Testing Service (ETS) changed the test’s name from the Scholastic Aptitude Test to the Scholastic Assessment Test. ETS aimed to retain the original acronym, while dispelling the numerous objections to the test being called an ‘aptitude’ test.

The North Carolina SAT Report • 2011 2
o The SAT’s scale was re-centered due to increased diversity of the college-bound senior population. The original SAT verbal and mathematics scales derived their universal meaning from a 1941 reference group of slightly more than 10,000 test takers, which was less heterogeneous than the college-bound senior population in 1990. Re-centering the SAT scales resulted in two major changes: (1) The average scores for both the SAT I critical reading and mathematics tests were re-established at 500 – the midpoint of the 200-800 scale; and (2) critical reading and mathematics scales were aligned so that critical reading and mathematics scores could be compared directly. Prior to re-centering, critical reading and mathematics scores could be compared only by looking at percentiles.
2005
o In an effort to better align the SAT’s content with contemporary curricula and practices in high schools and colleges, a new test was administered.
o The Verbal test was renamed “Critical Reading.” o Shorter reading passages were added to existing long reading passages. o Analogies were eliminated. o The mathematics section was revised to increase alignment with curricula and admissions
expectations. o Quantitative comparisons were eliminated. o Content from third-year college-preparatory mathematics was added. o A writing section was added to help colleges make better admissions and placement decisions
and to reinforce the importance of writing in a student’s education. The writing test included multiple-choice items, grammar usage questions, and a written essay.
Current SAT The maximum total score on the current SAT is 2400 (800 points for each of its three subsections: critical reading, mathematics, and writing). To compare current SAT total scores with total scores prior to 2006, the sum of the critical reading and mathematics subsections are used. The critical reading section (formerly called verbal) focuses on reading and gauges students’ ability to draw inferences, to synthesize information, to differentiate between main and supporting ideas, and to understand vocabulary from context. The mathematics section requires students to apply numerical concepts to solve problems and to use data literacy skills to interpret tables, charts, and graphs. The writing section determines students’ ability to communicate ideas clearly and effectively, to improve writing through revision and editing, to recognize and identify sentence-level errors, to understand grammatical elements and structures, and to improve coherence of ideas within and among paragraphs.

The North Carolina SAT Report • 2011 3
The following table is a summary of the nine subsections included on the current test:
Section Content Number of Questions
Reading 70 minutes (two 25-minute subsections and one 20-minute subsection)
Extended Reasoning Literal Comprehension Vocabulary in Context Sentence Completions
Total
36-40
4-6
4-6
19
67 Mathematics
70 minutes (two 25-minute subsections and one 20-minute subsection)
Number and Operations Algebra and Functions Geometry and Measurement Data Analysis, Statistics and Probability
Total
11-14
19-22
14-16
5-8
54 Writing
60 minutes (one 25-minute essay, one 25-minute multiple- choice subsection, and one 10-minute multiple-choice subsection)
Essay Improving Sentences Identifying Sentence Errors Improving Paragraphs
Total
1
25
18 6
50 Source: The College Board. “About the SAT“. Educator’s Handbook for the SAT and the SAT Subject Tests, 2011-12.
An additional 25-minute section, sometimes referred to as the “equating” or variable subsection does count toward the final score, and is designed to equate scores on newer editions of the SAT with scores on older editions and to test new questions for future editions. which may be critical reading, mathematics, or writing multiple-choice, makes the total testing time for the current SAT three hours and 45 minutes, compared to three hours for the previous version. This section, The format of the three-hour and forty-five minute current version of the SAT bears little resemblance to the original test, which took about 97 minutes to complete (Lawrence et al., 2002).

The North Carolina SAT Report • 2011 4
Factors Influencing Score Fluctuations
For the sixth consecutive year, total average SAT scores for North Carolina and the nation are lower than they were prior to the inception of the current SAT, which was revised in March 2005. The Critical Reading and Mathematics sections of the current SAT were revamped, and a mandatory Writing section was incorporated. Specific reasons for decreases in SAT scores over the past six years have not been firmly established. However, three of the more common explanations are as follows:
1) Change in Test-Taking Patterns: Five years ago, Gaston Caperton, President of the College Board, suggested that the addition of Writing to the SAT might have indirectly influenced the recent decline in SAT scores when he stated: “When a new test is introduced, students usually vary their test-taking behavior in a variety of ways and this affects scores” (The College Board, 2006). Historically, students who take the SAT a second time increase their combined score by 30 points. In 2006, fewer students took the SAT a second time which, according to the College Board, contributed to a score decline of seven points across the Critical Reading and Mathematics sections of the SAT. In 2006, the nation’s Critical Reading score declined from 508 to 503 and its Mathematics score declined from 520 to 518 for a net decrease of seven points. North Carolina’s Critical Reading score declined by four points, while its Mathematics score increased by two points -- a net decrease of two points. The decrease in SAT repeat test taking after the addition of the mandatory Writing section might be attributed to the increase in cost from $28.50 to $41.50
2) Increased Testing Time: Although there has been speculation that the 45-minute increase in testing time has adversely affected student performance, the College Board contends that its research shows otherwise. In its analyses, the College Board reported no differences in either the number of items correct or the number of items omitted for sections that appeared early in the test and for sections that appeared later in the test.
3) Most Changes in SAT Scores Are Not Unusual. Table 1 shows the percentage of schools in the nation whose mean SAT scores rose or fell in 2010-2011. SAT score changes in low-volume schools (50-99 SAT takers) tend to be larger than in medium-volume (100-299 SAT takers) and high-volume (300+) schools. For example, 60 percent of low-volume schools (50-99 SAT takers) had SAT mathematics scores rise or fall by 10 or more points, compared with 31 percent of high-volume schools (300+ test-takers). Similarly, nearly 50 percent of all schools in the nation with 50 or more SAT takers had critical reading, mathematics, and writing scores that increased or decreased by 10 points in 2011 from the previous year.

The North Carolina SAT Report • 2011 5
Table 1. Percentage of Schools Nationally Whose Mean SAT Reasoning Test Scores Rose or Fell, 2010-2011
50-99 100-299 300+10 59% 44% 31% 48%20 27% 13% 6% 18%30 11% 3% 2% 6%40 4% 1% 1% 2%50 2% 0% 1% 1%10 60% 46% 31% 49%20 28% 14% 6% 18%30 11% 4% 2% 6%40 4% 1% 1% 2%50 2% 0% 1% 1%10 58% 46% 33% 49%20 27% 13% 7% 18%30 11% 3% 2% 6%40 3% 1% 1% 2%50 1% 0% 0% 1%
Percentage of all schools with 50+ test-takers with this much score change
Critical Reading
Mathematics
Writing
Scores rose or fell at least this
many points
Percentage of schools with this much score change, by
number of test-takers
Source: The College Board. (September, 2011). SAT Trends: Background on the SAT Takers in the Class of 2011. P. 13. New York: Author. When interpreting SAT score changes from year to year, the following points should be kept in mind:
o Changes in SAT scores from year-to-year are not unusual. o Low-volume schools tend to have larger changes in critical reading, mathematics, and writing
scores than medium-volume and high-volume schools. o The larger the test-taking population, the smaller SAT score changes tend to be.
Validity of the SAT for Predicting First-Year College Grade point Average (FYGPA)
The College Board’s research shows that changes incorporated in the current SAT did not substantially change how well the test predicts first-year college performance (Kobrin, Patterson, Shaw, Mattern, and Barbuti, 2008).
o Of the three SAT subsections, the writing section is the most highly predictive of first-year college performance.
o The best combination of predictors of first-year grade point average (FYGPA) is high school grade point average (HSGPA) and SAT scores.

The North Carolina SAT Report • 2011 6
Differential Validity and Prediction of the SAT
The College Board’s research found similar patterns of differential validity and prediction by gender, race/ethnicity, and best language subgroups on the revised SAT as previous research found on earlier versions of the SAT (Mattern, Patterson, Shaw, Kobrin, and Barbuti, 2008).
For differential validity:
o The individual sections of the SAT and the combination of sections better predict first-year grade point average (FYGPA) for females than for males.
o High school grade point average is also more predictive of FYGPA for females than for males. o Individual SAT sections are more predictive of FYGPA for white students than under-
represented students. o High school grade point average is also more predictive of FYGPA for white students than for
underrepresented students. o The combination of the three sections of the SAT is more predictive of FYGPA for white
students than all students, except American Indian students. (The sample size for American Indians was very small.)
o Individual sections of the SAT as well as the combination of all three sections better predict FYGPA for students whose best language is English.
o High school grade point average is more predictive of FYGPA for students whose first language is English than for students whose first language is other than English.
For differential prediction:
o The individual sections of the SAT as well as the combination of all three sections under predict first year grade point average (FYGPA) for females and over predict FYGPA for males.
o High school grade point average (HSGPA) as well as the combination of high school grade point average and SAT score, under predict FYGPA for females, while over predicting that of males.
o FYGPAs of American Indian, African American, and Hispanic students are over predicted by all measures and combination of measures, with African Americans over predicted most.
o HSGPA results in the most differential prediction for most racial/ethnic groups; the combination of SAT and HSGPA results in the least differential prediction.
o Individual sections of the SAT as well as the combination of all three sections accurately predict FYGPA, while students whose best language is not English are under predicted by critical reading and writing and are accurately predicted by mathematics.
o For students whose best language is English and another language, the individual SAT sections as well as the combination of all three sections over predict FYGPA.

The North Carolina SAT Report • 2011 7
Scope and Limitations In addition to being reliable indicators of students’ preparation for college, aggregate SAT scores for a series of years can reveal trends in the academic preparation of students who take the test. Thus, this report includes SAT results for North Carolina’s students in 2011 and trend scores for recent years, where possible.
Rankings or residual rankings are not used in this report in compliance with the College Board’s Guidelines on the Uses of College Board Test Scores and Related Data and with professional standards for educational and psychological testing. The guidelines caution against the use of SAT scores in aggregate form as a single measure to rank or rate states, educational institutions, school systems, schools, or teachers. A Note on the Use of Aggregate SAT Data on page v provides details for why such uses are inappropriate.
“Relationships between test scores and other factors such as educational background, gender, race/ethnic background, parental education, and household income are complex and interdependent. These factors do not directly affect test performance; rather, they are associated with educational experiences both on tests such as the SAT Reasoning Test and in schoolwork” (College Board, 2008).
In this report, two types of total scores are indicated: Critical Reading+Mathematics (CR+M) and Critical Reading+Mathematics+Writing (CR+M+W). The CR+M total score is used for comparisons to historical SAT total scores prior to March 2005; the CR+M+W total score permits the inclusion of Writing in SAT total scores after March 2005.
This report presents SAT results for students scheduled to graduate in 2011 and represents students’ most recent scores, regardless of when they took the test. Some results in this report reflect public and non-public school students in North Carolina and the United States, while others reflect only public school students. Distinctions between these types of results are indicated accordingly.
Special Notice
When reviewing 2011 SAT trend data, unadjusted scores for previous years may be marginally lower than those reported in fall 2010 due to the College Board’s change in reporting conventions (SAT Trends, 2010). Prior to 2010, SAT trend data were reported for all students who took the test in high school through March of their senior year (when most students were expected to have taken the test). However, the College Board observed in 2010 that a significant segment of students were taking the test for the first time in May or June of their senior year, which it felt compelled to report. The SAT national release date was changed in 2010 from late August to mid-September to facilitate the inclusion of senior test-takers through May and June in the reporting cohort. As such, 2010 was used as the transition year and data were gathered for both cohorts: March and June, although only scores for students taking the test through March were reported in fall 2010 for comparability with previous year’s trend data. In the 2011 Trend Report and the State Integrated Summaries, statewide and national scores for the June cohort were published for both 2010 and 2011. In this report, statewide trend data published for 2010 that included the June cohort are referred to as “adjusted scores.” Trend data for schools and systems from 2007 to 2010 will be released at a later date.
The North Carolina SAT Report • 2011 8
Overall Performance (Public and Private Schools)
Note: The 2010 mean total SAT scores included in this report are marginally lower than those reported in the fall of 2010 because they have been adjusted to make them compatible with 2011 scores. For a fuller explanation, see the Special Notice in the Scope and Limitations section above.
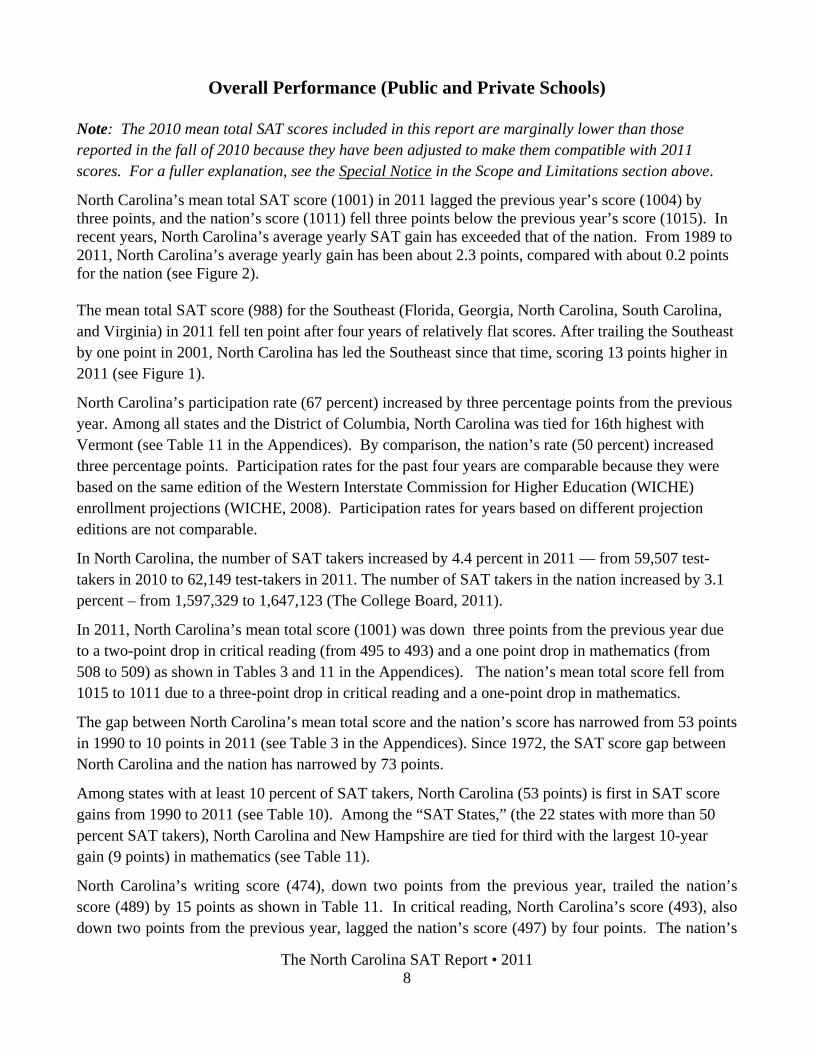
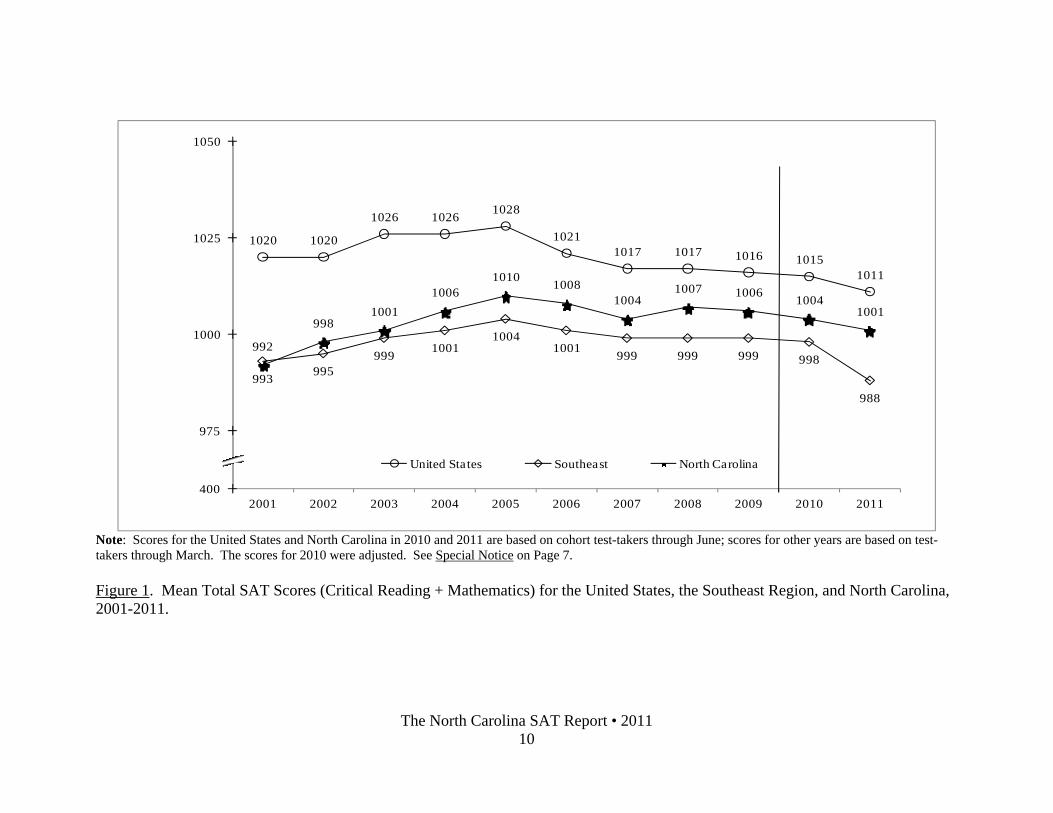
North Carolina’s mean total SAT score (1001) in 2011 lagged the previous year’s score (1004) by three points, and the nation’s score (1011) fell three points below the previous year’s score (1015). In recent years, North Carolina’s average yearly SAT gain has exceeded that of the nation. From 1989 to 2011, North Carolina’s average yearly gain has been about 2.3 points, compared with about 0.2 points for the nation (see Figure 2). The mean total SAT score (988) for the Southeast (Florida, Georgia, North Carolina, South Carolina, and Virginia) in 2011 fell ten point after four years of relatively flat scores. After trailing the Southeast by one point in 2001, North Carolina has led the Southeast since that time, scoring 13 points higher in 2011 (see Figure 1).
North Carolina’s participation rate (67 percent) increased by three percentage points from the previous year. Among all states and the District of Columbia, North Carolina was tied for 16th highest with Vermont (see Table 11 in the Appendices). By comparison, the nation’s rate (50 percent) increased three percentage points. Participation rates for the past four years are comparable because they were based on the same edition of the Western Interstate Commission for Higher Education (WICHE) enrollment projections (WICHE, 2008). Participation rates for years based on different projection editions are not comparable.
In North Carolina, the number of SAT takers increased by 4.4 percent in 2011 — from 59,507 test-takers in 2010 to 62,149 test-takers in 2011. The number of SAT takers in the nation increased by 3.1 percent – from 1,597,329 to 1,647,123 (The College Board, 2011).
In 2011, North Carolina’s mean total score (1001) was down three points from the previous year due to a two-point drop in critical reading (from 495 to 493) and a one point drop in mathematics (from 508 to 509) as shown in Tables 3 and 11 in the Appendices). The nation’s mean total score fell from 1015 to 1011 due to a three-point drop in critical reading and a one-point drop in mathematics.
The gap between North Carolina’s mean total score and the nation’s score has narrowed from 53 points in 1990 to 10 points in 2011 (see Table 3 in the Appendices). Since 1972, the SAT score gap between North Carolina and the nation has narrowed by 73 points.
Among states with at least 10 percent of SAT takers, North Carolina (53 points) is first in SAT score gains from 1990 to 2011 (see Table 10). Among the “SAT States,” (the 22 states with more than 50 percent SAT takers), North Carolina and New Hampshire are tied for third with the largest 10-year gain (9 points) in mathematics (see Table 11).
North Carolina’s writing score (474), down two points from the previous year, trailed the nation’s score (489) by 15 points as shown in Table 11. In critical reading, North Carolina’s score (493), also down two points from the previous year, lagged the nation’s score (497) by four points. The nation’s
The North Carolina SAT Report • 2011 9
mathematics score (514) led North Carolina’s score (508) by six points. North Carolina’s grand total score (Critical Reading+Mathematics+Writing) was 1475, compared with 1500 for the nation (Table 9).
The North Carolina SAT Report • 2011 10
1020 1020
1026 1026 1028
10211017 1017 1016 1015
1011
993 995999 1001
10041001 999 999 999 998
988
992
9981001
10061010 1008
10041007 1006 1004
1001
400
975
1000
1025
1050
2001 2002 2003 2004 2005 2006 2007 2008 2009 2010 2011
United States Southeast North Carolina
Note: Scores for the United States and North Carolina in 2010 and 2011 are based on cohort test-takers through June; scores for other years are based on test-takers through March. The scores for 2010 were adjusted. See Special Notice on Page 7. Figure 1. Mean Total SAT Scores (Critical Reading + Mathematics) for the United States, the Southeast Region, and North Carolina, 2001-2011.

The North Carolina SAT Report • 2011 11
-5
54
9
3
0
6
6
2
4 4
2
4
6
3
54
-2
-4
3
-1 -2
-3
0
-5
-2
2 2
0
7
3 3
1
-1
3
10
6
0
2
-7
-4
0
-1-1
-4
-10
-8
-6
-4
-2
0
2
4
6
8
10
1989 1990 1991 1992 1993 1994 1995 1996 1997 1998 1999 2000 2001 2002 2003 2004 2005 2006 2007 2008 2009 2010 2011
North CarolinaUnited States
Mea
n G
ain
Note: Scores for 2010 and 2011 are based on cohort test-takers through June; scores for other years are based on test-takers through March. The scores for 2010 were adjusted. See Special Notice on Page 7. Figure 2. Average Yearly SAT Score Gains for North Carolina and the United States, 1989-2011.

The North Carolina SAT Report • 2011 12
Critical Reading and Mathematics Scores
In previous years, North Carolina’s critical reading and mathematics SAT scores have lagged the nation’s scores, but the gaps have narrowed continually over the last decade. The gap in mathematics has closed more rapidly over the last decade (see Figures 3 and 4).
• North Carolina’s critical reading score (493) fell two points in 2011, while the nation’s score (497) dropped three points.
• The gap between North Carolina’s critical reading score and the nation’s score is four points (see Figure 3).
506504
507 508 508
503 502 502 501 500
497
493 493495
499 499
495 495 496 495 495493
200
485
505
525
2001 2002 2003 2004 2005 2006 2007 2008 2009 2010 2011
Critical Reading (U.S.) Critical Reading (N.C.)
Mean Critical Reading Score
Note: Scores for 2010 and 2011 are based on cohort test-takers through June; scores for other years are based on test-takers through March. The scores for 2010 were adjusted. See Special Notice on Page 7. Figure 3. Mean SAT Critical Reading Scores for North Carolina and the Nation, 2001-2011. In mathematics, North Carolina has gained substantially on the nation from 2001 to 2011.
• North Carolina’s score (508) was just six points lower than the nation’s score (514) in 2011, compared with six points in 2010 (see Figure 4).
• The mathematics scores for North Carolina and the nation are down from the previous year.

The North Carolina SAT Report • 2011 13
514516
519 518520
518515 515 515 515 514
499
505 506 507
511513
509511 511
509 508
200
485
505
525
2001 2002 2003 2004 2005 2006 2007 2008 2009 2010 2011
Critical Mathematics (U.S.) Critical Mathematics (N.C.)
Mean Mathematics
Score
Note: Scores for 2010 and 2011 are based on cohort test-takers through June; scores for other years are based on test-takers through March. The scores for 2010 were adjusted. See Special Notice on Page 7. Figure 4. Mean SAT Mathematics Scores for North Carolina and the Nation, 2001-2011.
Gender
Figure 5 shows mean total SAT scores for the United States and North Carolina by gender from 2001 to 2011. In past years, males in North Carolina and the United States have scored higher on the SAT than females, although females earn higher grades in high school and college (Vars and Bowen, 1998).
• The gap between mean total SAT scores for North Carolina’s males and females was 33 points in 2011, five points wider than it was the previous year.
• The gap between total mean SAT scores for the nation’s males and females was 36 points in 2011, two points narrower than the previous year.

The North Carolina SAT Report • 2011 14
1042 1041
1049 1049 1051
10411037 1037 1037 1035
1031
1012 1014
10211025
10301026
1023 1025 10261020 1020
1000 10021006 1005
10091004
1001 1000997 997 995
976
984 985989
995 994990 992 991 992
987
400
950
975
1000
1025
1050
1075
2001 2002 2003 2004 2005 2006 2007 2008 2009 2010 2011
United States Males North Carolina MalesUnited States Females North Carolina Females
Mean TotalSAT Score
Note: Scores for 2010 and 2011 are based on cohort test-takers through June; scores for other years are based on test-takers through March. The scores for 2010 were adjusted. See Special Notice on Page 7. Figure 5. Mean Total SAT Scores (Critical Reading + Mathematics) for the United States and North Carolina by Gender, 2001-2011.
While the gaps between total mean SAT scores for males and females in North Carolina and between males and female scores in the nation have not changed appreciably from 2001 to 2011, North Carolina’s males and females have narrowed the gap on their national counterparts (see Figure 5).
• The gap between the scores of North Carolina’s males and the nation’s males was 11 points in 2011, compared with 15 points the previous year.
• The gap between the scores of North Carolina’s females and the nation’s females was eight points in 2011, compared with only five points the previous year.
Table 2 displays mean critical reading and mathematics scores for males and females in North Carolina and the nation. Males have scored higher than females on the mathematics portion of the SAT since its inception in the early 1920’s (Wilder and Powell, 1989). However, only over the past three decades have males begun to consistently score higher than females in critical reading, although the differences are smaller than in mathematics.
• The average gap between male and female mathematics scores in North Carolina from 2001 to 2011 has been 29.0 points, compared with 34.3 points for the nation.
• The average gap between North Carolina’s male and female critical reading scores over the same period has been 4.4 points, about one point less than the average gap for the nation.

The North Carolina SAT Report • 2011 15
Table 2. Mean Critical Reading and Mathematics SAT Scores for North Carolina and the Nation by Gender, 2001-2011.
Year M F Gap1 M F Gap2 M F Gap1 M F Gap2
2001 497 490 7.0 509 502 7.0 515 486 29.0 533 498 35.02002 494 492 2.0 507 502 5.0 520 492 28.0 534 500 34.02003 499 492 7.0 512 503 9.0 522 493 29.0 537 503 34.02004 502 496 6.0 512 504 8.0 523 493 30.0 537 501 36.02005 503 497 6.0 513 505 8.0 527 498 29.0 538 504 34.02006 497 494 3.0 505 502 3.0 529 500 29.0 536 502 34.02007 497 494 3.0 504 502 2.0 526 496 30.0 533 499 34.02008 498 494 4.0 504 500 4.0 527 498 29.0 533 500 33.02009 498 493 5.0 503 498 5.0 528 498 30.0 534 499 35.02010 496 495 1.0 502 498 4.0 524 497 27.0 533 499 34.02011 497 491 6.0 500 495 5.0 523 496 27.0 531 500 31.0Mean 498 493 4.4 507 502 5.5 524 495 29.0 535 501 34.3
1North Carolina's mean score for males (M) minus North Carolina's mean score for females (F).2Nation's mean score for males (M) minus nation's mean score for females (F).
SAT Critical Reading SAT MathematicsNorth Carolina Nation North Carolina Nation
Note: Scores for 2010 and 2011 are based on cohort test-takers through June; scores for other years are based on test-takers through March. The scores for 2010 were adjusted. See Special Notice on Page 7.

The North Carolina SAT Report • 2011 16
Race/Ethnicity
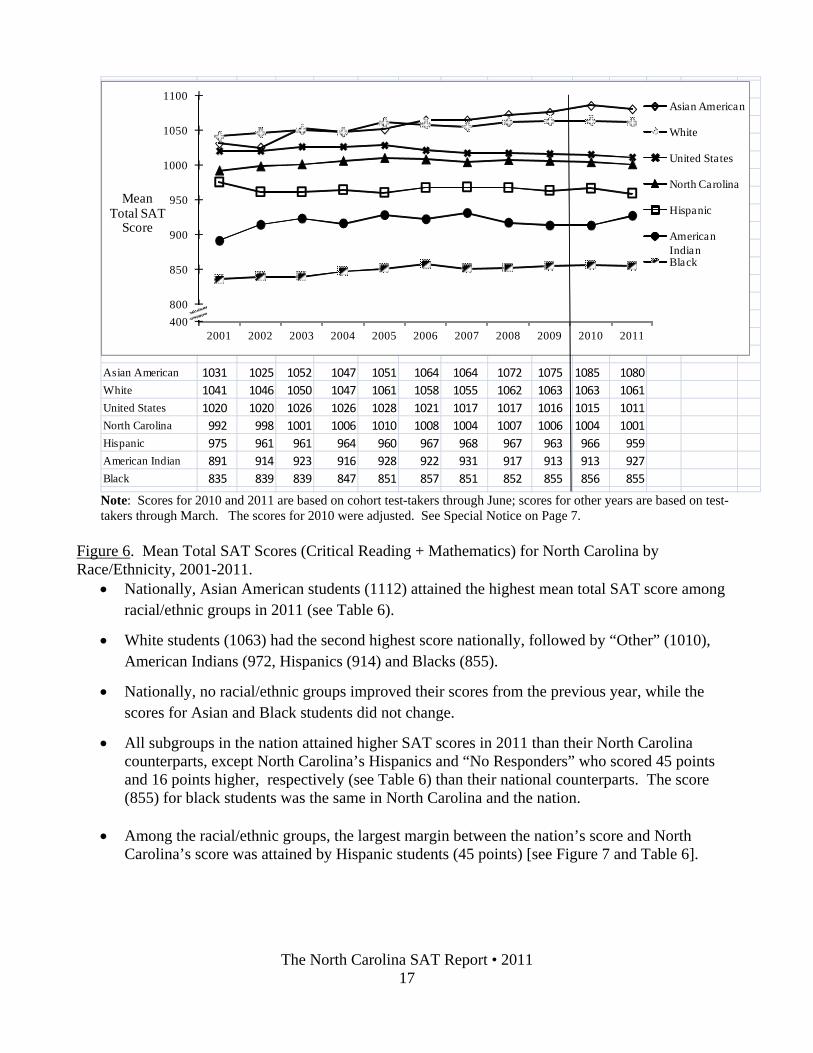
Historically, White and Asian American students have attained higher SAT scores than other racial/ethnic groups in North Carolina, while Hispanics, American Indians, and Blacks have scored lower. Figure 6 shows mean total SAT scores for North Carolina by race/ethnicity from 2001 to 2011, and Table 6 shows the performance of racial/ethnic groups, and “Other”, and “No Response” categories from 2007 to 2011.
• In 2011, the only racial/ethnic group that improved scores from the previous year was American Indians; all other racial/ethnic groups scored lower (see Figure 6 and Table 6).
• For the sixth consecutive year since 2006, Asians (1080) scored higher than other racial/ethnic groups, followed by Whites (1061), Hispanics (959), American Indians (927), and Black students (855) [see Figure 6].
• North Carolina’s Asian students (1080) and White students (1061) were the only racial/ethnic groups to exceed the United States average (1011) in 2011 (Figure 6).
• Among racial/ethnic groups in North Carolina in 2011, “Other” students (11.7%), Asian students (9.5%) and Hispanic students (8.5%) had the largest increase in test-takers from the previous year, followed by Black students (5.8%), White students (3.1%), and American Indians (-2.0%) (The College Board, 2011).
• In 2011, Hispanic students and “No Response” students were the only racial/ethnic groups to score higher than their national counterparts, with Hispanics 45 points higher and the “No Response” group 16 points higher (see Table 6).
• North Carolina’s Black students have historically scored lower on the SAT than other racial/ethnic groups.
• In 2011, Black students scored 855, one point lower than the previous year’s score. This score was 225 points lower than the score for Asian students (1080), 206 points lower than the score for White students (1061), 104 points lower than the score for Hispanic students (959), and 72 points lower than the score for American Indian students (927) (see Tables 5 and 6).
The North Carolina SAT Report • 2011 17
Asian American 1031 1025 1052 1047 1051 1064 1064 1072 1075 1085 1080White 1041 1046 1050 1047 1061 1058 1055 1062 1063 1063 1061United States 1020 1020 1026 1026 1028 1021 1017 1017 1016 1015 1011North Carolina 992 998 1001 1006 1010 1008 1004 1007 1006 1004 1001Hispanic 975 961 961 964 960 967 968 967 963 966 959American Indian 891 914 923 916 928 922 931 917 913 913 927Black 835 839 839 847 851 857 851 852 855 856 855
400800
850
900
950
1000
1050
1100
2001 2002 2003 2004 2005 2006 2007 2008 2009 2010 2011
Asian American
White
United States
North Carolina
Hispanic
American IndianBlack
Mean Total SAT
Score
Note: Scores for 2010 and 2011 are based on cohort test-takers through June; scores for other years are based on test-takers through March. The scores for 2010 were adjusted. See Special Notice on Page 7.
Figure 6. Mean Total SAT Scores (Critical Reading + Mathematics) for North Carolina by Race/Ethnicity, 2001-2011.
• Nationally, Asian American students (1112) attained the highest mean total SAT score among racial/ethnic groups in 2011 (see Table 6).
• White students (1063) had the second highest score nationally, followed by “Other” (1010), American Indians (972, Hispanics (914) and Blacks (855).
• Nationally, no racial/ethnic groups improved their scores from the previous year, while the scores for Asian and Black students did not change.
• All subgroups in the nation attained higher SAT scores in 2011 than their North Carolina counterparts, except North Carolina’s Hispanics and “No Responders” who scored 45 points and 16 points higher, respectively (see Table 6) than their national counterparts. The score (855) for black students was the same in North Carolina and the nation.
• Among the racial/ethnic groups, the largest margin between the nation’s score and North Carolina’s score was attained by Hispanic students (45 points) [see Figure 7 and Table 6].

The North Carolina SAT Report • 2011 18
-45 pts
-32 pts
0 pts
45 pts
-2 pts
-18 pts
400
800
850
900
950
1000
1050
1100
1150
American Indian Asian American Black Hispanic White Other
United StatesNorth Carolina
Figure 7. Mean Total SAT Scores (Critical Reading + Mathematics) for North Carolina and the United States by Race/Ethnicity, 2010-2011. Race/Ethnicity by Gender Figure 8 shows mean SAT critical reading scores by race/ethnicity and gender in 2011.
• American Indian females and Black females were the only subgroups scoring higher than their male counterparts.
• American Indian females (456) scored five points higher than American Indian males (451) and black females (423) scored four points higher than black males (419).
• Black males and females scored notably lower than other subgroups in critical reading. • The average difference between male and female performances in critical reading across
racial/ethnic groups was six points.

The North Carolina SAT Report • 2011 19
451
516
419
475
527
493486
456
504
423
472
521
489480
400
425
450
475
500
525
550
A. Indian Asian Black Hispanic White Other No Response
Male Female
Mean SAT Score
Critical Reading
Figure 8. Mean SAT Scores in Critical Reading for North Carolina’s Racial/Ethnic Groups by Gender, 2010-2011. Figure 9 shows mean SAT mathematics scores by race/ethnicity and gender in 2011.
• Males had higher mathematics scores than females across all subgroups (see Figure 9). • The smallest differences in gender were observed among Black students, with males (440)
scoring 10 points higher than females (430). • Asian males and females scored notably higher in mathematics than other subgroups. • Mathematics scores for Black male and female students were notably lower than those of other
subgroups. • The mean difference between male and female performances in mathematics across
racial/ethnic groups was about 25 points.
The North Carolina SAT Report • 2011 20
485
584
440
499
553
519
494
464
558
430
476
523
488
462
400
425
450
475
500
525
550
575
600
A. Indian Asian Black Hispanic White Other No Response
Male Female
Mean SAT Score
Mathematics
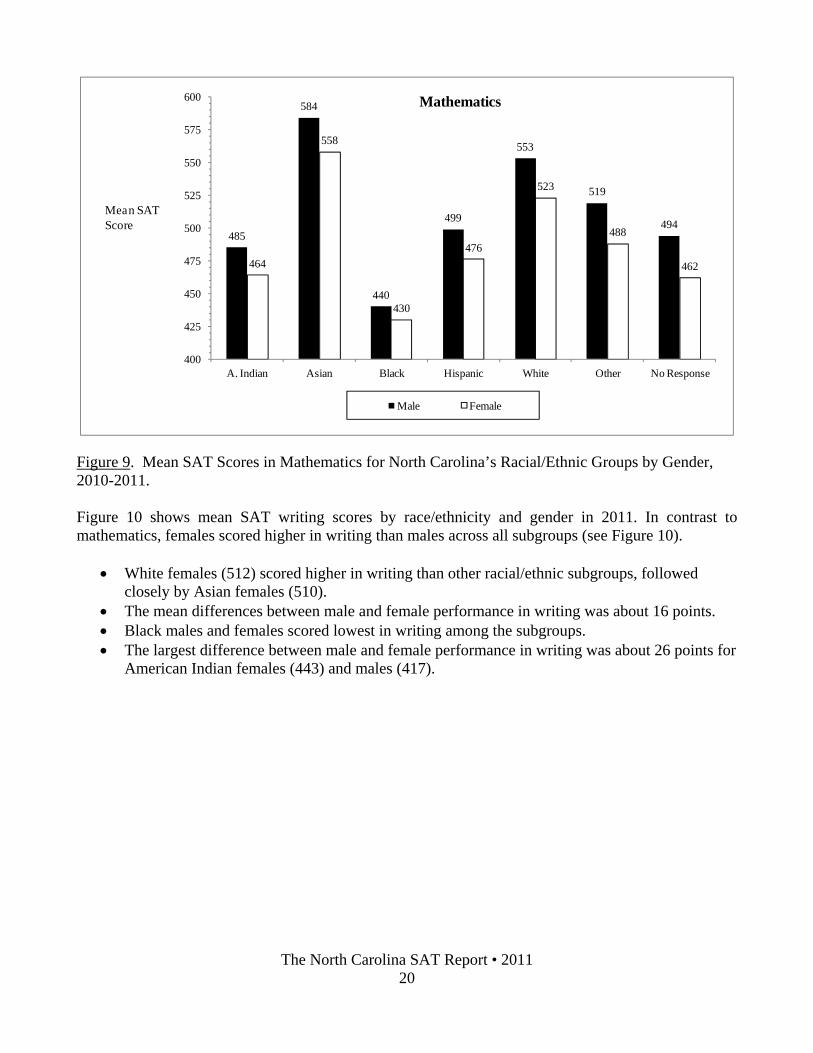
Figure 9. Mean SAT Scores in Mathematics for North Carolina’s Racial/Ethnic Groups by Gender, 2010-2011. Figure 10 shows mean SAT writing scores by race/ethnicity and gender in 2011. In contrast to mathematics, females scored higher in writing than males across all subgroups (see Figure 10).
• White females (512) scored higher in writing than other racial/ethnic subgroups, followed
closely by Asian females (510). • The mean differences between male and female performance in writing was about 16 points. • Black males and females scored lowest in writing among the subgroups. • The largest difference between male and female performance in writing was about 26 points for
American Indian females (443) and males (417).

The North Carolina SAT Report • 2011 21
417
498
394
445
494463 455443
510
413
459
512477 463
0
100
200
300
400
500
600
A. Indian Asian Black Hispanic White Other No Response
Male Female
Mean SAT Score
Writing
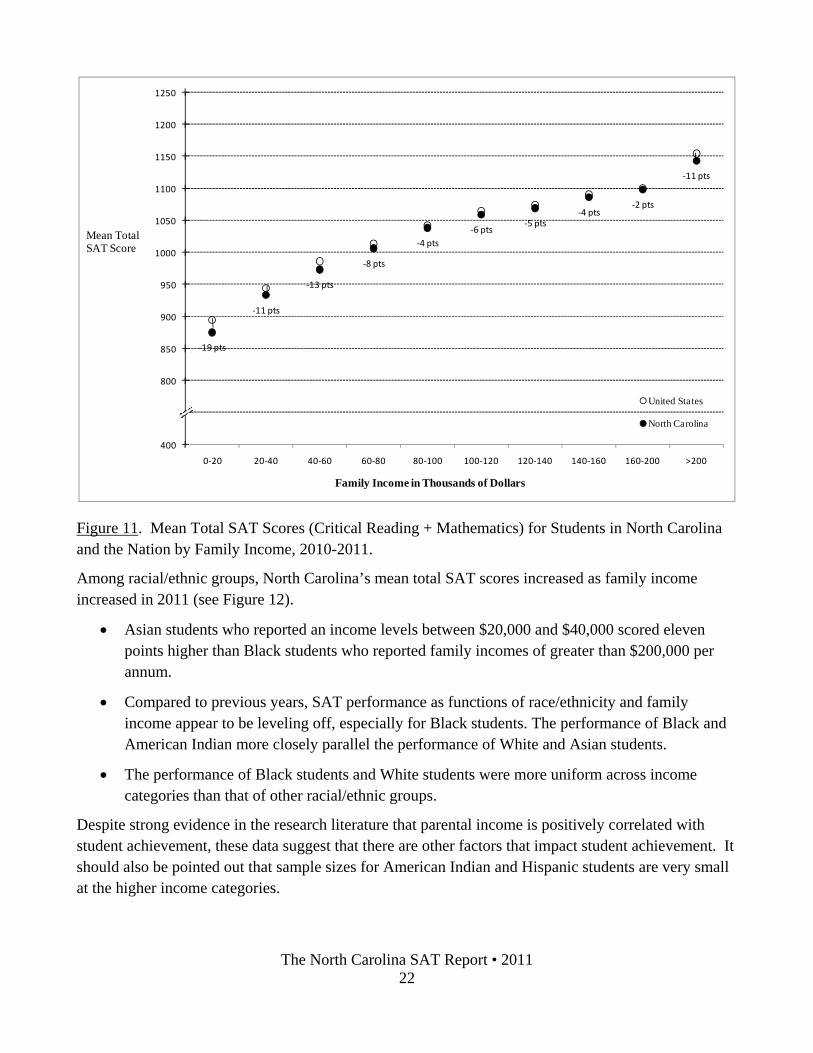
Figure 10. Mean SAT Scores in Writing for North Carolina’s Racial/Ethnic Groups by Gender, 2010-2011. Family Income Figure 11 shows mean total SAT scores by family income for North Carolina and the nation in 2010-2011. For the majority of income categories reported by the College Board, differences in scores for North Carolina and the nation were similar.
• The nation’s students outscored North Carolina’s students across all family income categories,
with the largest difference (19 points) in the less than $20,000 category. • At the upper income categories between $60,000 and $200,000, students in the nation
outscored students in North Carolina on the average by about five points • As family income increased, mean total SAT scores increased in North Carolina and the nation. • The largest disparity between students’ scores in the nation and students’ scores in North
Carolina was observed at the extreme income categories: 19 points at the less than $20,000 category and 11 points at the greater than $200,000 category.
The North Carolina SAT Report • 2011 22
‐19 pts
‐11 pts
‐13 pts
‐8 pts
‐4 pts‐6 pts
‐5 pts‐4 pts
‐2 pts
‐11 pts
400
800
850
900
950
1000
1050
1100
1150
1200
1250
0‐20 20‐40 40‐60 60‐80 80‐100 100‐120 120‐140 140‐160 160‐200 >200
United States
North Carolina
Mean Total SAT Score
Family Income in Thousands of Dollars
Figure 11. Mean Total SAT Scores (Critical Reading + Mathematics) for Students in North Carolina and the Nation by Family Income, 2010-2011.
Among racial/ethnic groups, North Carolina’s mean total SAT scores increased as family income increased in 2011 (see Figure 12).
• Asian students who reported an income levels between $20,000 and $40,000 scored eleven points higher than Black students who reported family incomes of greater than $200,000 per annum.
• Compared to previous years, SAT performance as functions of race/ethnicity and family income appear to be leveling off, especially for Black students. The performance of Black and American Indian more closely parallel the performance of White and Asian students.
• The performance of Black students and White students were more uniform across income categories than that of other racial/ethnic groups.
Despite strong evidence in the research literature that parental income is positively correlated with student achievement, these data suggest that there are other factors that impact student achievement. It should also be pointed out that sample sizes for American Indian and Hispanic students are very small at the higher income categories.

The North Carolina SAT Report • 2011 23
Asian American 923 1015 1069 1102 1144 1149 1138 1212 1234 1291
White 979 1003 1016 1033 1056 1077 1080 1097 1106 1138
Hispanic 896 942 984 1008 1042 1062 1060 1043 1101 1082
American Indian 903 904 919 950 905 965 990 1025 1010 1052
Black 815 849 870 891 908 916 952 943 959 1004
400
700
750
800
850
900
950
1000
1050
1100
1150
1200
1250
1300
< 20 20-40 40-60 60-80 80-100 100-120 120-140 140-160 160-200 >200
Asian American White Hispanic American Indian Black
Mean Total SAT Score
Family Income in Thousands of Dollars
Figure 12. Mean Total SAT Scores (Critical Reading + Mathematics) for North Carolina by Family Income and Racial/Ethnic Group, 2010-2011.
Grade Point Average (GPA) Figure 13 shows mean total SAT scores by grade point average and racial/ethnic group for public school students in 2011.
• As self-reported GPA increased, the SAT score gap between white and black students increased from 168 points in the “E” range to 194 points in the “A” range.
• The relationship between GPA and SAT scores was linear for all racial/ethnic, especially in the GPA range from “C” to “A”. This trend supports the research finding that high school GPA and SAT scores are the best predictors of first-year college performance.
• Scores in the “E” range suggested a curvilinear relationship between mean total SAT score and income, with scores in the “E” range being higher than scores in the “D” and “C” ranges.
• Generally, as grade point average increased, mean total SAT scores increased.

The North Carolina SAT Report • 2011 24
Asian American 955 823 871 954 1144White 1054 986 911 981 1114Hispanic 1065 837 836 906 1025American Indian * 945 806 885 994Black 787 745 768 837 950
400600650700750800850900950
100010501100115012001250
E D C B A
Asian AmericanWhiteHispanicAmerican IndianBlack
Mean Total SAT Score
Grade Point Average (GPA)
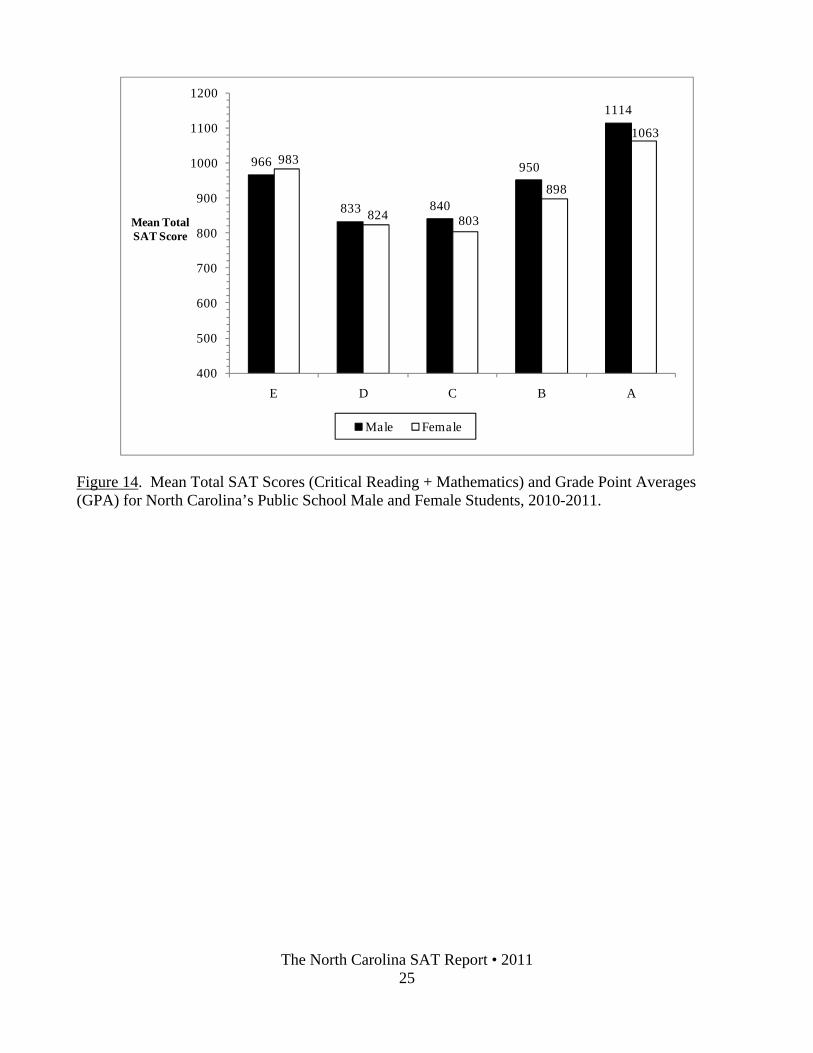
Figure 13. Mean Total SAT Scores (Critical Reading + Mathematics) and Self-Reported Grade Point Average for Public School Racial/Ethnic Groups in North Carolina, 2010-2011. Research has shown that a composite of SAT scores and high school GPA together predict first-year college grades. The ‘predictive validity’ is approximately 0.61 (The College Board, 2008). Hence, one would expect SAT scores and high school grades to be strongly associated. Figure 14 shows mean total SAT scores and self-reported grade point averages for male and female public school students in North Carolina in 2011.
• Male students with higher GPAs attained higher SAT scores than their female counterparts. • At the “A”, “B”, and “C” levels, males outscored females by 51 points, 52 points, and 37
points, respectively. • At the “E” level, females scored higher than males by 17 points. • Males and females who reported “E” grade point averages scored over 100 points higher than
males and females who reported “C” and “D” grade point averages. This finding raises suspicion about self-reported student data.
The North Carolina SAT Report • 2011 25
966
833 840
950
1114
983
824 803
898
1063
400
500
600
700
800
900
1000
1100
1200
E D C B A
Male Female
Mean Total SAT Score
Figure 14. Mean Total SAT Scores (Critical Reading + Mathematics) and Grade Point Averages (GPA) for North Carolina’s Public School Male and Female Students, 2010-2011.

The North Carolina SAT Report • 2011 26
North Carolina and the University of North Carolina System
Historically, mean total SAT scores for freshmen entering the University of North Carolina System each year have been higher than those for North Carolina’s graduating seniors (The University of North Carolina, 2011).
The mean total SAT score (1001) for North Carolina’s college-bound seniors in 2011 was 84 points lower than the score (1085) for freshmen entering the University of North Carolina system in 2010. [SAT scores for the University of North Carolina System in 2011 were not available for inclusion in this report.] The average total SAT score for freshmen entering the University of North Carolina System from 2000 to 2010 has been 1078, while the average for North Carolina’s graduating seniors (1003) has been 75 points lower during the same period. This trend suggests that many of North Carolina’s students who do not perform well on the SAT do not enter the University of North Carolina System. These students may elect other post-secondary options, which might include colleges and universities with lower SAT requirements, community college, military service, or full-time employment.
Schools within the University of North Carolina System serve a wide variety of student abilities as reflected in the mean total SAT scores of their entering freshmen. In 2010, mean total scores ranged from 841 at Elizabeth City State University to 1304 at the University of North Carolina at Chapel Hill (The University of North Carolina, 2010).
Figure 15 shows the range of mean total SAT scores between the 25th and 75th percentiles of North Carolina’s college-bound seniors, the nation’s college-bound seniors, entering freshmen at the University of North Carolina system institutions, and other selected institutions (Harvard and Howard Universities). All UNC System scores are based on 2010 results; scores for Harvard ad Howard Universities are based on 2009 results due to the unavailability of more recent scores. The bands in the figure show the range in which the middle half of the students scored — 25 percent of students scored at or below the lower end of the band and 25 percent scored at or above the upper end of the band.
The figure also shows that each of the University of North Carolina system institutions serves some students who score in the middle 50 percent of college-bound seniors in North Carolina and the nation. Duke, Wake Forest, the University of North Carolina and Harvard Universities are more likely to serve students who score in the top 25 percent of 2011 college-bound seniors in North Carolina and the nation and less likely to serve students who score in the lower 50 percent. On the other hand, Howard University, recognized as one of the elite Historically Black Colleges and Universities (HBCUs), is unique in that it serves a diverse range of student abilities and might serve students in the upper 75 percent of 2011 college-bound seniors in North Carolina and the nation. Howard University is the only HBCU that might serve students in the top quartile of North Carolina’s college-bound seniors (see Figure 15).

The North Carolina SAT Report • 2011 27
Note: The 25th and 75th percentiles for Howard and Harvard University’s entering freshmen are based on 2009 data. Source: The College Board (2011) Student Achievement Report 2010-11 - North Carolina Schools. Atlanta: Southern Regional Office. The University of North Carolina (2011). Averages and Quartiles of SAT Scores of Entering Freshmen in the University of North Carolina, Fall 2010. Statistical Abstract of Higher Education in North Carolina, 2010-2011. Figure 15. The 25th, 50th, and 75th Percentiles of SAT Total Scores (Critical Reading + Mathematics) for National College-Bound Seniors (2011), North Carolina’s College-Bound Seniors (2011), Entering Freshmen at Institutions of the University of North Carolina System, and Selected Private Universities (Fall 2010).

The North Carolina SAT Report • 2011 28
North Carolina’s School Systems and Schools
Among states, the higher the percentage of students taking the SAT (participation rate), the lower the average SAT scores (The College Board, 2009). While this is true for states (see Figure 16) where there is a -0.88 correlation between mean total SAT scores and participation rates, the opposite association is observed for public schools in North Carolina (see Figure 17). In 2011, the Pearson correlation between the percent of students taking the SAT and the mean total SAT score for public schools was 0.37. These correlations suggest that participation rate is a lesser factor in predicting SAT scores for public school systems and public schools in North Carolina than for states.
In view of the above correlations, schools and school systems in North Carolina should exercise caution when attributing decreases or increases in mean SAT scores to changes in participation rate. Interpretations of fluctuations in SAT scores at a particular school or system or between schools and systems should take into account that SAT scores are influenced by multiple factors. Among such factors are course-taking patterns, curriculum content, course standards, parental education, and family income. It is also important to recognize that about 50% of all schools and school systems in the nation have changes in their mean critical reading or math SAT scores of plus or minus 10 points from year to year (see Table 1).
400
900
950
1000
1050
1100
1150
1200
1250
1300
0 10 20 30 40 50 60 70 80 90 100
United StatesNorth CarolinaSoutheast
Mean TotalSAT Score
x - Represents a StateCorrelation = -0.88
Figure 16. Scatter Plot of Mean Total SAT Scores (Critical Reading + Mathematics) by Percent of Students Tested for all States, 2010-2011.
Table 7 provides the critical reading scores, mathematics scores, writing scores, participation rates, Sub-Total Scores, and Grand Total Scores for each public school system and school in North Carolina for 2011. The traditional three-year trend is not being provided at this time for school systems and schools. Trend data will be provided after the College Board releases the adjusted data for past cohort years, which includes all students who tested through June. See the Special Notice in the Scope and

The North Carolina SAT Report • 2011 29
Limitations section at the bottom of Page 7 for a fuller explanation. The link for the Excel version of Table 7 is: http://www.ncpublicschools.org/accountability/reporting/sat.
400
600
650
700
750
800
850
900
950
1000
1050
1100
1150
1200
1250
1300
1350
0 10 20 30 40 50 60 70 80 90 100
Percent Tested
X - Represents a SchoolCorrelation = 0.37
Figure 17. Scatter Plot of Mean Total SAT Scores (Critical Reading + Mathematics) by Percent of Students Tested for North Carolina Public High Schools, 2010-2011

The North Carolina SAT Report • 2011 30
Public Schools
Mean total SAT scores for North Carolina’s public schools have lagged those of public schools in the nation (see Figure 18). However, in recent years, North Carolina’s public schools have been improving at a faster rate than those in the nation.
• In 2011, North Carolina had 54,492 public school test-takers, a 10.0 percent increase from the previous year.
• With scores of 489 in critical reading and 507 in mathematics in 2011, North Carolina’s public school score (1996) fell six points from the previous year.
• The nation’s mean total SAT score (1000) decreased seven points from the previous year, with 494 in critical reading and 506 in mathematics (see Table 12 in the Appendices).
• The number of public school SAT takers in the nation (1,267,239) increased by 10.9 percent from the previous year (The College Board, 2011).
989994
9991003
1008 1006999
1003 1003 1002996
1012 1013 1016 1017 10201014
1007 1007 1006 10071000
400
950
975
1000
1025
1050
2001 2002 2003 2004 2005 2006 2007 2008 2009 2010 2011
North Carolina United States
Mean Total SAT Score
Note: Scores for 2010 and 2011 are based on cohort test-takers through June; scores for other years are based on test-takers through March. These are adjusted scores from the College Board. See Page 7 for Special Notes
Figure 18. Mean Total SAT Scores (Critical Reading + Mathematics) for Public School Students in North Carolina and the Nation, 2001-2011.
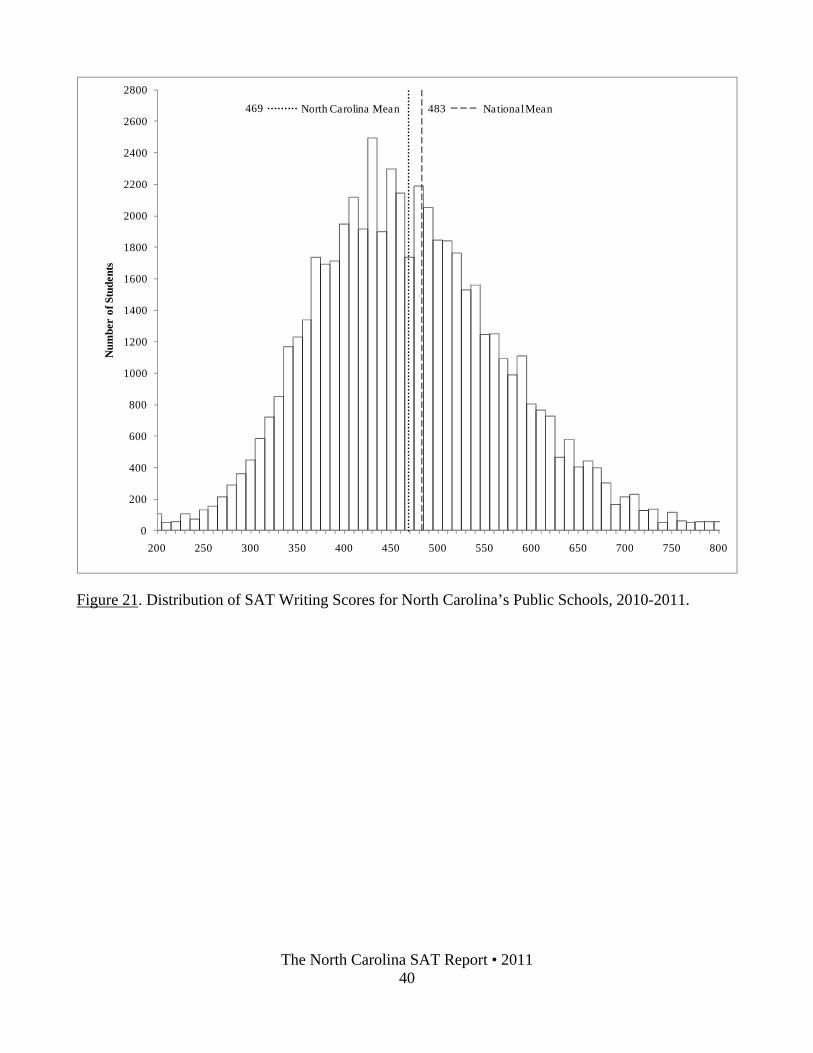
• The mean writing score for public school students in North Carolina was 469, down three points from the previous year’s score (472).
• Nationally, the writing score (483) for public school students in 2011 decreased three points from the previous year’s [see Table 12 in the Appendices].

The North Carolina SAT Report • 2011 31
Figures 19, 20 and 21 in the Appendices show the distribution of critical reading, mathematics, and writing SAT scores, respectively, for North Carolina’s public schools by number of students. The scores for all three portions of the SAT approximate a normal distribution.

The North Carolina SAT Report • 2011 32
References
Crouse, J. and Trusheim, D. (1988). The Case Against the SAT. Chicago: University of Chicago Press, 1988.
Doermann, H. (1971). “Lack of Money: A Barrier to Higher Education.” Barriers to Higher
Education. New York: College Entrance Examination Board. 130-147.
Doran, N. J. (2002, Spring). Recentering and realigning the SAT score distributions: how and why. Journal of Educational Measurement, 39, 59-84.
Kobrin, J. L., Patterson, B. F., Shaw, E. J. Mattern, K. D., and Barbuti, S. M. (2008) Validity of the SAT for Predicting First-Year College Grade Point Average (College Board Report No. 2008-5), New York: The College Board.
Lawrence, I., Rigol, G., Essen, T., and Jackson, C. (2002). A Historical Perspective on the SAT 1926- 2001. Res. Report. New York: College Entrance Examination Board, 7, 1-13. Leman, N. (2000). The census of one ability. The Big Test: The Secret History of the American
Meritocracy. New York: Farrar, Straus and Giroux, 81-95.
Mattern, K. D., Patterson, B. F., Shaw, E. J., Kobrin, J. L., & Barbuti, S. M. (2008) Differential Validity and Prediction of the SAT (College Board Report No. 2008-4), New York: The College Board.
Morse, R. J. and Flanigan, S. (2010) “Ranking the Schools,” U. S. News and World Report, 84-124.
North Carolina Department of Public Instruction. (1990). North Carolina Scholastic Aptitude Test Results. Raleigh: Author.
The University of North Carolina. (2011, July). Statistical abstract of higher education in North Carolina, 2010-2011 (Research Report 1-00). Chapel Hill, NC: Author.
The College Board. (2011, September). SAT Trends Background on the SAT Takers in the Class of 2011. P. 13. New York: Author.
The College Board (2011) Student Achievement Report 2010-11 - North Carolina Schools. Atlanta: Southern Regional Office.
The College Board. (2011). North Carolina State Summary Report 2010-2011. Atlanta: Southern Regional Office.
The College Board. (2011). Electronic File for the 2011 North Carolina State Data. Princeton, N. J.
The College Board. (2011) State Integrated Summary 2010-2011. North Carolina All-Schools. Atlanta: Southern Regional Office.
The College Board. (2011). Educator’s Handbook for the SAT and the SAT Subject Tests 2011-12. New York, NY.
The North Carolina SAT Report • 2011 33
Vars, F. E. and Bowen, W. G. (1998). Scholastic aptitude test scores, race, and academic performance in selective colleges and universities. In Christopher Jencks and Meredith Phillips, Eds. The Black-White Test Score Gap. Washington, D. C.: Brookings Institution Press, 1998, pp. 457-479.
Western Interstate Commission for Higher Education (WICHE). Knocking at the College Door: Projections of High School Graduates by State, Income, and Race/Ethnicity, March 2008.
Wilder, G. Z. and Powell, K. (1989). Sex Differences in Test Performance: A Survey of the Literature. New York: College Board Report, 89-3, 1-50.

The North Carolina SAT Report • 2011 34
Appendices

The North Carolina SAT Report • 2011 35
North Carolina and the Nation

The North Carolina SAT Report • 2011 36
Table 3. Mean SAT Scores for North Carolina and the United States, 1972-2011
United States (US) North Carolina (NC)
YearCritical Reading Mathematics Total
Critical Reading Mathematics Total US-NC Gap1
2011 497 514 1011 493 508 1001 102010 500 515 1015 495 509 1004 112009 501 515 1016 495 511 1006 102008 502 515 1017 496 511 1007 102007 502 515 1017 495 509 1004 132006 503 518 1021 495 513 1008 132005 508 520 1028 499 511 1010 182004 508 518 1026 499 507 1006 202003 507 519 1026 495 506 1001 252002 504 516 1020 493 505 998 222001 506 514 1020 493 499 992 282000 505 514 1019 492 496 988 311999 505 511 1016 493 493 986 301998 505 512 1017 490 492 982 351997 505 511 1016 490 488 978 381996 505 508 1013 490 486 976 371995 504 506 1010 488 482 970 401994 499 504 1003 482 482 964 391993 500 503 1003 483 481 964 391992 500 501 1001 482 479 961 401991 499 500 999 478 474 952 471990 500 501 1001 478 470 948 531989 504 502 1006 474 469 943 631988 505 501 1006 478 470 948 581987 507 501 1008 477 468 945 631986 509 500 1009 477 465 942 671985 509 500 1009 476 464 940 691984 504 497 1001 473 461 934 671983 503 494 997 472 460 932 651982 504 493 997 474 460 934 631981 502 492 994 469 456 925 691980 502 492 994 471 458 929 651979 505 493 998 471 455 926 721978 507 494 1001 468 453 921 801977 507 496 1003 472 454 926 771976 509 497 1006 474 452 926 801975 512 498 1010 477 457 934 761974 521 505 1026 488 466 954 721973 523 506 1029 487 468 955 741972 530 509 1039 489 467 956 83
1Gap = United States mean total SAT score minus North Carolina's mean total score.
Note: The numbers for 2010 and 2011 are based on cohort test-takers through June; the numbers for other years are based on test-takers through March. The scores for 2010 were adjusted. See Special Notice on Page 7.

The North Carolina SAT Report • 2011 37
Table 4. Frequency Distribution of Critical Reading, Mathematics, and Writing SAT Scores for North Carolina’s Public School Students, 2010-2011
Score
Percentile PercentileNumber Rank Number Rank
800 150 0.28 99 175 0.32 99 58 0.11 99790 52 0.10 99 8 0.01 99 54 0.10 99780 38 0.07 99 58 0.11 99 58 0.11 99770 58 0.11 99 141 0.26 99 53 0.10 99760 40 0.07 99 111 0.20 99 62 0.11 99750 144 0.27 99 142 0.26 99 117 0.22 99740 228 0.42 99 158 0.29 99 53 0.10 99730 108 0.20 99 161 0.30 98 136 0.25 99720 263 0.48 98 183 0.34 98 129 0.24 99710 198 0.36 98 334 0.62 98 233 0.43 98700 318 0.59 97 424 0.78 97 213 0.39 98690 418 0.77 97 473 0.87 96 167 0.31 98680 501 0.92 96 556 1.02 95 300 0.55 97670 616 1.14 95 631 1.16 94 399 0.74 97660 413 0.76 94 724 1.33 93 441 0.81 96650 539 0.99 93 809 1.49 91 408 0.75 95640 638 1.18 92 870 1.60 90 579 1.07 94630 733 1.35 91 952 1.75 88 464 0.86 93620 1158 2.13 89 1019 1.88 86 726 1.34 92610 776 1.43 87 1756 3.24 84 765 1.41 91600 1414 2.61 85 1229 2.26 81 804 1.48 89590 1068 1.97 83 1188 2.19 79 1108 2.04 88580 1325 2.44 81 1486 2.74 76 988 1.82 86570 1196 2.20 78 1534 2.83 74 1093 2.01 84560 1636 3.01 76 2063 3.80 70 1249 2.30 82550 1403 2.59 73 1537 2.83 67 1247 2.30 79540 1844 3.40 70 1978 3.64 64 1560 2.87 77530 1976 3.64 66 1708 3.15 60 1530 2.82 74520 1494 2.75 63 2297 4.23 57 1765 3.25 71510 2064 3.80 60 1846 3.40 53 1839 3.39 67500 2080 3.83 56 1826 3.36 49 1844 3.40 64490 1719 3.17 53 2700 4.98 45 2054 3.78 60480 1978 3.64 49 1912 3.52 41 2188 4.03 57470 2621 4.83 45 1691 3.12 38 1736 3.20 53460 1544 2.85 41 2613 4.81 34 2143 3.95 49450 2248 4.14 38 1683 3.10 30 2295 4.23 45440 2153 3.97 34 1691 3.12 27 1897 3.50 41430 1801 3.32 30 1705 3.14 23 2496 4.60 37420 1886 3.48 26 1844 3.40 20 1915 3.53 33410 1846 3.40 23 1631 3.01 17 2116 3.90 30400 1650 3.04 20 1327 2.45 14 1950 3.59 26390 1462 2.69 17 1065 1.96 12 1712 3.15 22380 1480 2.73 14 1032 1.90 10 1691 3.12 19370 1247 2.30 12 892 1.64 8 1738 3.20 16360 1035 1.91 10 833 1.53 7 1339 2.47 13350 1000 1.84 8 725 1.34 5 1230 2.27 11340 738 1.36 6 514 0.95 4 1167 2.15 9330 605 1.11 5 326 0.60 3 854 1.57 7320 452 0.83 4 379 0.70 3 723 1.33 5310 416 0.77 3 327 0.60 2 587 1.08 4300 273 0.50 3 251 0.46 2 451 0.83 3290 244 0.45 2 165 0.30 1 363 0.67 3280 243 0.45 2 110 0.20 1 293 0.54 2270 126 0.23 1 109 0.20 1 213 0.39 1260 139 0.26 1 74 0.14 1 156 0.29 1250 100 0.18 1 50 0.09 1 132 0.24 1240 95 0.18 1 72 0.13 1 73 0.13 1230 26 0.05 1 30 0.06 1 104 0.19 1220 54 0.10 1 45 0.08 1 55 0.10 1210 18 0.03 1 21 0.04 1 50 0.09 1200 180 0.33 1 74 0.14 1 105 0.19 1
54,268 100.00 54,268 99.97 54,268 99.99
Note: Due to rounding, the percentages may not add up to exactly 100.
Number PercentRankPercent PercentPercentile
Writing (Mean = 469)Critical Reading (Mean = 489) Mathematics (Mean = 507)

The North Carolina SAT Report • 2011 38
489 494
0
200
400
600
800
1000
1200
1400
1600
1800
2000
2200
2400
2600
2800
3000
200 250 300 350 400 450 500 550 600 650 700 750 800
Num
ber
of S
tude
nts
North Carolina Mean National Mean
Figure 19. Distribution of SAT Critical Reading Scores for North Carolina’s Public Schools, 2010-2011.

The North Carolina SAT Report • 2011 39
506 507
0
200
400
600
800
1000
1200
1400
1600
1800
2000
2200
2400
2600
2800
3000
200 250 300 350 400 450 500 550 600 650 700 750 800
Num
ber
of S
tude
nts
National Mean North Carolina Mean
Figure 20. Distribution of SAT Mathematics Scores for North Carolina’s Public Schools, 2010-2011.
The North Carolina SAT Report • 2011 40
469 483
0
200
400
600
800
1000
1200
1400
1600
1800
2000
2200
2400
2600
2800
200 250 300 350 400 450 500 550 600 650 700 750 800
Num
ber
of S
tude
nts
North Carolina Mean National Mean
Figure 21. Distribution of SAT Writing Scores for North Carolina’s Public Schools, 2010-2011.

The North Carolina SAT Report • 2011 41
Table 5. Mean Total SAT Scores (CR + M) by Student Profile Characteristics, 2010-2011
North Carolina N Mean % N Mean %
All Students 1,647,123 1011 100 62,149 1001 100 -10
Gender Male 770,605 1031 47 28,397 1020 46 -11 Female 876,518 995 53 33,752 987 54 -8
Race/Ethnicity American Indian 9,244 972 1 696 927 1 -45 Asian American 183,853 1112 11 2,486 1080 4 -32 Black 215,816 855 13 15,166 855 24 0 Hispanic 252,703 914 16 3,261 959 6 45 White 865,660 1063 53 37,991 1061 61 -2 Other 58,699 1010 4 1,647 992 3 -18 No Response 61,148 944 4 902 960 1 16
Parent Education Level No high school diploma 87,093 870 6 1,791 885 3 15 High school diploma 457,917 939 31 18,799 927 32 -12 Associate's degree 126,518 969 8 7,379 955 12 -14 Bachelor's degree 460,019 1060 31 19,468 1043 33 -17 Graduate degree 367,654 1133 25 12,018 1115 20 -18Family Income (in $) $0 - $20,000 120,671 894 13 4,573 875 12 -19 $20,000 - $40,000 153,379 944 16 7,011 933 18 -11 $40,000-60,000 139,567 986 15 6,621 973 17 -13 $60,000-$80,000 129,406 1014 14 5,809 1006 15 -8 $80,000-$100,000 112,809 1042 12 4,643 1038 12 -4 $100,000-$120,000 96,829 1065 10 3,580 1059 9 -6 $120,000-$140,000 49,771 1074 5 1,771 1069 5 -5 $140,000-$160,000 37,800 1090 4 1,304 1086 3 -4 $160,000-$200,000 44,345 1100 5 1,348 1098 3 -2 More than $200,000 67,117 1154 7 1,898 1143 5 -11 No Response 695,429 1011 23,591 1009 -2
Highest Level of Math Achieved1
Calculus 329,020 1176 25 11,155 1163 21 -13 Pre-calculus 379,930 1048 29 16,082 1042 30 -6 T rigonometry 166,029 968 12 3,154 953 6 -15 Algebra II 372,676 903 28 21,121 912 39 9 Algebra I 57,632 816 4 1,517 795 3 -21 AP/Honors Courses 482,572 1151 36 27,654 1095 -56
H S Grade Point Average A+ (97-100) 93,834 1216 6 4,164 1186 7 -30 A (93-96) 294,277 1143 19 14,884 1109 25 -34 A- (90-92) 293,369 1076 19 11,878 1031 20 -45 B (80-89) 681,181 949 45 23,087 928 39 -21 C (70-79) 156,377 837 10 4,937 825 8 -12 D or below (<70) 7,455 834 0 160 853 0 19 No Response 120,630 969 3,039 954 -15
High School Class Rank2
Highest Tenth 246,839 1181 35 10,623 1166 31 -15 Second Tenth 189,678 1045 27 9,184 1046 27 1 Second Fifth 129,814 980 18 6,705 978 19 -2 Final Three Fifths 145,441 886 20 7,950 881 23 -5 No Response 935,351 985 27,687 963 -22
Note: Due to rounding, some numbers might not sum to 100%. All values in this table are based upon the number of SAT2The College Board collapsed "High School Class Rank" from six categories to four in 2006.
DifferenceUnited States
Reasoning Test test-takers and self-reported student responses.
1In this report, Total Years of Study in Six Academic Subjects data has been replaced by Highest Level of Mathematics Achieved.

The North Carolina SAT Report • 2011 42
Table 6. Mean Total SAT Scores (CR + M) for the United States and North Carolina by Student Profile Characteristics, 2010-2011
US NC Diff. US NC Diff.
All Students 1015 1004 -11 1011 1001 -10
Gender Male 1035 1020 -15 1031 1020 -11 Female 997 992 -5 995 987 -8 No Response *** *** *** *** *** ***
Race/Ethnicity American Indian 974 913 -61 972 927 -45 Asian American 1112 1085 -27 1112 1080 -32 Black 855 856 1 855 855 0 Hispanic 916 966 50 914 959 45 White 1064 1063 -1 1063 1061 -2 Other 1015 1006 -9 1010 992 -18 No Response 955 965 10 944 960 16
Parent Education Level No high school diploma * * * 870 885 15 High school diploma * * * 939 927 -12 Associate's degree * * * 969 955 -14 Bachelor's degree * * * 1060 1043 -17 Graduate degree * * * 1133 1115 -18
Family Income (in U.S . $)1 $0 - $20,000 * * * 894 875 -19 $20,000 - $40,000 * * * 944 933 -11 $40,000-60,000 * * * 986 973 -13 $60,000-$80,000 * * * 1014 1006 -8 $80,000-$100,000 * * * 1042 1038 -4 $100,000-$120,000 * * * 1065 1059 -6 $120,000-$140,000 * * * 1074 1069 -5 $140,000-$160,000 * * * 1090 1086 -4 $160,000-$200,000 * * * 1100 1098 -2 More than $200,000 * * * 1154 1143 -11 No Response * * * 1011 1009 -2
Highest Level of Math Achieved2 Caculus * * * 1176 1163 -13 Pre-calculus * * * 1048 1042 -6 Trigonometry * * * 968 953 -15 Algebra II * * * 903 912 9 Algebra I * * * 816 795 -21 AP/Honors Courses * * * 1151 1095 -56
H S Grade Point Average A+ (97-100) * * * 1216 1186 -30 A (93-96) * * * 1143 1109 -34 A- (90-92) * * * 1076 1031 -45 B (80-89) * * * 949 928 -21 C (70-79) * * * 837 825 -12 D or below (<70) * * * 834 853 19 No Response * * * 969 954 -15
High School Class Rank Top Tenth * * * 1181 1166 -15 Second Tenth * * * 1045 1046 1 Second Fifth * * * 980 978 -2 Final Three Fifths * * * 886 881 -5 No Response * * * 985 963 -22
Note: Due to rounding, numbers might not add up to 100%; Data for years
2010 2011
previous to 2010 are not comparable.

The North Carolina SAT Report • 2011 43
Performance of the 115 Public School Systems, Charter Schools, North Carolina School of the Arts, and North Carolina School of Science and Mathematic
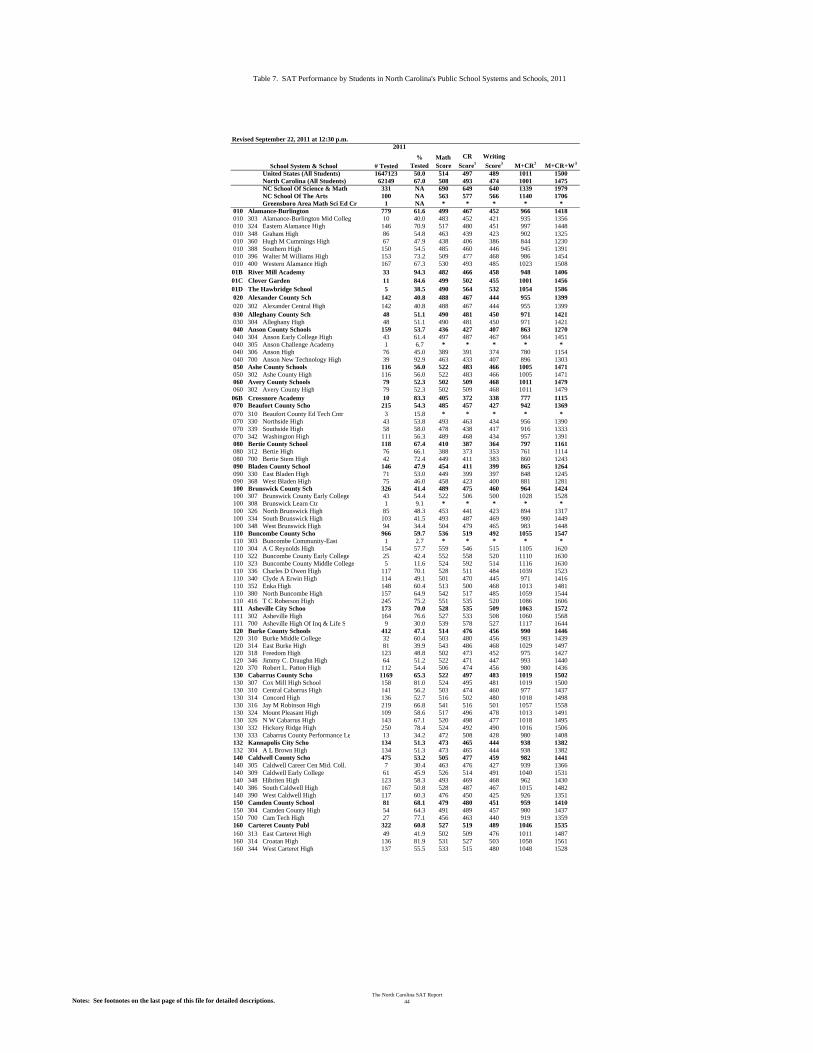
Table 7. SAT Performance by Students in North Carolina's Public School Systems and Schools, 2011
2011
# Tested%
TestedMath Score
CR Score1
Writing Score3 M+CR2 M+CR+W3
United States (All Students) 1647123 50.0 514 497 489 1011 1500 North Carolina (All Students) 62149 67.0 508 493 474 1001 1475
NC School Of Science & Math 331 NA 690 649 640 1339 1979 NC School Of The Arts 100 NA 563 577 566 1140 1706 Greensboro Area Math Sci Ed Cr 1 NA * * * * *
010 779 61.6 499 467 452 966 1418010 303 Alamance-Burlington Mid Colleg 10 40.0 483 452 421 935 1356010 324 Eastern Alamance High 146 70.9 517 480 451 997 1448010 348 Graham High 86 54.8 463 439 423 902 1325010 360 Hugh M Cummings High 67 47.9 438 406 386 844 1230010 388 Southern High 150 54.5 485 460 446 945 1391010 396 Walter M Williams High 153 73.2 509 477 468 986 1454010 400 Western Alamance High 167 67.3 530 493 485 1023 150801B 33 94.3 482 466 458 948 140601C 11 84.6 499 502 455 1001 145601D 5 38.5 490 564 532 1054 1586020 142 40.8 488 467 444 955 1399020 302 Alexander Central High 142 40.8 488 467 444 955 1399030 48 51.1 490 481 450 971 1421030 304 Alleghany High 48 51.1 490 481 450 971 1421040 159 53.7 436 427 407 863 1270040 304 Anson Early College High 43 61.4 497 487 467 984 1451040 305 Anson Challenge Academy 1 6.7 * * * * *040 306 Anson High 76 45.0 389 391 374 780 1154040 700 Anson New Technology High 39 92.9 463 433 407 896 1303050 116 56.0 522 483 466 1005 1471050 302 Ashe County High 116 56.0 522 483 466 1005 1471060 79 52.3 502 509 468 1011 1479060 302 Avery County High 79 52.3 502 509 468 1011 147906B 10 83.3 405 372 338 777 1115070 215 54.3 485 457 427 942 1369070 310 Beaufort County Ed Tech Cntr 3 15.8 * * * * *070 330 Northside High 43 53.8 493 463 434 956 1390070 339 Southside High 58 58.0 478 438 417 916 1333070 342 Washington High 111 56.3 489 468 434 957 1391080 118 67.4 410 387 364 797 1161080 312 Bertie High 76 66.1 388 373 353 761 1114080 700 Bertie Stem High 42 72.4 449 411 383 860 1243090 146 47.9 454 411 399 865 1264090 330 East Bladen High 71 53.0 449 399 397 848 1245090 368 West Bladen High 75 46.0 458 423 400 881 1281100 326 41.4 489 475 460 964 1424100 307 Brunswick County Early College 43 54.4 522 506 500 1028 1528100 308 Brunswick Learn Ctr 1 9.1 * * * * *100 326 North Brunswick High 85 48.3 453 441 423 894 1317100 334 South Brunswick High 103 41.5 493 487 469 980 1449100 348 West Brunswick High 94 34.4 504 479 465 983 1448110 966 59.7 536 519 492 1055 1547110 303 Buncombe Community-East 1 2.7 * * * * *110 304 A C Reynolds High 154 57.7 559 546 515 1105 1620110 322 Buncombe County Early College 25 42.4 552 558 520 1110 1630110 323 Buncombe County Middle College 5 11.6 524 592 514 1116 1630110 336 Charles D Owen High 117 70.1 528 511 484 1039 1523110 340 Clyde A Erwin High 114 49.1 501 470 445 971 1416110 352 Enka High 148 60.4 513 500 468 1013 1481110 380 North Buncombe High 157 64.9 542 517 485 1059 1544110 416 T C Roberson High 245 75.2 551 535 520 1086 1606111 173 70.0 528 535 509 1063 1572111 302 Asheville High 164 76.6 527 533 508 1060 1568111 700 Asheville High Of Inq & Life S 9 30.0 539 578 527 1117 1644120 412 47.1 514 476 456 990 1446120 310 Burke Middle College 32 60.4 503 480 456 983 1439120 314 East Burke High 81 39.9 543 486 468 1029 1497120 318 Freedom High 123 48.8 502 473 452 975 1427120 346 Jimmy C. Draughn High 64 51.2 522 471 447 993 1440120 370 Robert L. Patton High 112 54.4 506 474 456 980 1436130 1169 65.3 522 497 483 1019 1502130 307 Cox Mill High School 158 81.0 524 495 481 1019 1500130 310 Central Cabarrus High 141 56.2 503 474 460 977 1437130 314 Concord High 136 52.7 516 502 480 1018 1498130 316 Jay M Robinson High 219 66.8 541 516 501 1057 1558130 324 Mount Pleasant High 109 58.6 517 496 478 1013 1491130 326 N W Cabarrus High 143 67.1 520 498 477 1018 1495130 332 Hickory Ridge High 250 78.4 524 492 490 1016 1506130 333 Cabarrus County Performance Le 13 34.2 472 508 428 980 1408132 134 51.3 473 465 444 938 1382132 304 A L Brown High 134 51.3 473 465 444 938 1382140 475 53.2 505 477 459 982 1441140 305 Caldwell Career Cen Mid. Coll. 7 30.4 463 476 427 939 1366140 309 Caldwell Early College 61 45.9 526 514 491 1040 1531140 348 Hibriten High 123 58.3 493 469 468 962 1430140 386 South Caldwell High 167 50.8 528 487 467 1015 1482140 390 West Caldwell High 117 60.3 476 450 425 926 1351150 81 68.1 479 480 451 959 1410150 304 Camden County High 54 64.3 491 489 457 980 1437150 700 Cam Tech High 27 77.1 456 463 440 919 1359160 322 60.8 527 519 489 1046 1535160 313 East Carteret High 49 41.9 502 509 476 1011 1487160 314 Croatan High 136 81.9 531 527 503 1058 1561160 344 West Carteret High 137 55.5 533 515 480 1048 1528
Bladen County School
Bertie County School
Beaufort County Scho
Carteret County Publ
Camden County School
Caldwell County Scho
Kannapolis City Scho
Cabarrus County Scho
Burke County Schools
Asheville City Schoo
Buncombe County Scho
Brunswick County Sch
Revised September 22, 2011 at 12:30 p.m.
Alamance-Burlington
School System & School
River Mill Academy Clover Garden The Hawbridge School
Crossnore Academy
Alexander County Sch
Alleghany County Sch
Anson County Schools
Ashe County Schools
Avery County Schools
Notes: See footnotes on the last page of this file for detailed descriptions.The North Carolina SAT Report
44

Table 7. SAT Performance by Students in North Carolina's Public School Systems and Schools, 2011
2011
# Tested%
TestedMath Score
CR Score1
Writing Score3 M+CR2 M+CR+W3
United States (All Students) 1647123 50.0 514 497 489 1011 1500 North Carolina (All Students) 62149 67.0 508 493 474 1001 1475
Revised September 22, 2011 at 12:30 p.m.
School System & School
16A 1 4.5 * * * * *170 91 56.5 452 437 424 889 1313170 316 Bartlett Yancey High 91 56.5 452 437 424 889 1313180 651 56.5 518 490 461 1008 1469180 308 Bandys High 107 61.1 526 500 466 1026 1492180 320 Bunker Hill High 89 47.3 496 458 425 954 1379180 325 Catawba Valley Early Coll Hi 72 75.8 517 505 477 1022 1499180 340 Fred T Foard High 133 54.3 525 488 461 1013 1474180 348 Maiden High 89 48.6 501 455 436 956 1392180 376 Saint Stephens High 161 61.9 530 514 484 1044 1528181 156 71.2 536 514 501 1050 1551181 318 Catawba Valley High 1 50.0 * * * * *181 322 Hickory High 155 71.4 536 514 501 1050 1551182 129 62.3 502 477 459 979 1438182 316 Newton-Conover High 114 64.4 505 473 456 978 1434182 700 Newton-Conover Health/Sci 15 100.0 477 510 480 987 1467190 279 67.4 494 478 461 972 1433190 310 Sage 1 16.7 * * * * *190 316 Chatham Central High 61 65.6 483 448 426 931 1357190 336 Jordan Matthews High 89 59.3 479 461 443 940 1383190 342 Northwood High 128 77.6 511 505 490 1016 150619B 36 85.7 556 584 556 1140 1696200 137 57.3 484 484 463 968 1431200 308 Andrews High 43 72.9 456 445 428 901 1329200 314 Hiwassee Dam High 18 43.9 527 523 481 1050 1531200 322 Mountain Youth School 1 10.0 * * * * *200 328 Murphy High 61 56.5 482 487 470 969 1439200 350 Tri-County Early College High 14 66.7 532 541 524 1073 1597210 89 66.4 457 439 429 896 1325210 312 John A Holmes High 89 66.4 457 439 429 896 1325220 53 59.6 524 494 492 1018 1510220 310 Hayesville High 53 59.6 524 494 492 1018 1510230 589 58.6 500 470 451 970 1421230 312 Burns High 145 64.7 492 462 444 954 1398230 324 Crest Senior High 139 50.9 508 476 456 984 1440230 350 Kings Mountain High 127 44.1 535 496 474 1031 1505230 361 Shelby High 178 86.0 474 453 438 927 1365240 167 45.3 467 440 427 907 1334240 334 East Columbus High 48 45.3 466 421 411 887 1298240 371 South Columbus High 47 40.2 476 446 447 922 1369240 373 Southeastern Early College 23 45.1 490 491 470 981 1451240 380 West Columbus High 49 53.8 449 430 405 879 1284241 78 60.0 468 444 439 912 1351241 316 Whiteville High 78 61.9 468 444 439 912 1351250 436 42.8 507 489 452 996 1448250 314 Craven Early College High 21 27.3 499 494 442 993 1435250 340 Havelock High 109 44.0 513 496 454 1009 1463250 356 New Bern High 233 53.1 504 485 456 989 1445250 372 West Craven High 73 28.6 508 487 439 995 1434260 1803 55.9 476 469 445 945 1390260 318 Jack Britt High 241 62.4 517 502 476 1019 1495260 322 Douglas Byrd High 134 53.0 441 426 395 867 1262260 325 Cape Fear High 154 55.0 498 480 456 978 1434260 354 Cross Creek Early College 45 93.8 478 480 442 958 1400260 357 Gray's Creek High 143 52.0 473 474 437 947 1384260 359 E E Smith High 109 53.2 445 422 409 867 1276260 388 Massey Hill Classic Sch 69 77.5 471 507 460 978 1438260 408 Pine Forest High 173 53.9 474 471 440 945 1385260 411 Reid Ross Classical School 56 87.5 480 497 469 977 1446260 424 Seventy-First High 141 44.6 438 439 423 877 1300260 427 South View High 172 50.9 470 469 444 939 1383260 446 Terry Sanford High 201 67.0 522 503 493 1025 1518260 455 Westover High 130 55.6 421 415 404 836 1240260 700 Howard Health 35 92.1 460 454 442 914 1356270 153 62.4 511 494 466 1005 1471270 306 Currituck County High 153 62.4 511 494 466 1005 1471280 269 80.3 520 500 475 1020 1495280 304 Cape Hatteras Secondary 27 64.3 534 527 495 1061 1556280 316 Manteo High 73 76.8 513 477 443 990 1433280 330 First Flight High 169 88.0 520 506 486 1026 1512290 668 53.4 510 488 463 998 1461290 308 Central Davidson High 100 50.8 493 473 443 966 1409290 314 Davidson Co Ext Day 3 10.7 * * * * *290 315 Davidson Early College 25 92.6 562 560 521 1122 1643290 324 East Davidson High 108 54.3 500 468 458 968 1426290 336 Ledford Senior High 135 58.2 512 501 481 1013 1494290 348 North Davidson Sr High 206 64.8 521 495 460 1016 1476290 365 South Davidson High 22 25.9 476 462 456 938 1394290 388 West Davidson High 69 47.3 505 476 452 981 1433291 83 55.0 454 445 421 899 1320291 336 Lexington Sr High 83 56.1 454 445 421 899 1320292 95 74.8 441 425 405 866 1271292 324 Thomasville High 95 74.8 441 425 405 866 1271300 199 53.2 523 508 481 1031 1512300 312 Davie High 170 50.6 523 508 478 1031 1509300 314 Davie County Early College Hig 29 76.3 523 508 497 1031 1528
Hickory City Schools
Catawba County Schoo
Cleveland County Sch
Clay County Schools
Edenton-Chowan Schoo
Cherokee County Scho
Chatham County Schoo
Newton Conover City
Dare County Schools
Currituck County Sch
Cumberland County Sc
Craven County School
Whiteville City Scho
Columbus County Scho
Davie County Schools
Thomasville City Sch
Lexington City Schoo
Davidson County Scho
Caswell County Schoo Cape Lookout Marine
Woods Charter
Notes: See footnotes on the last page of this file for detailed descriptions.The North Carolina SAT Report
45
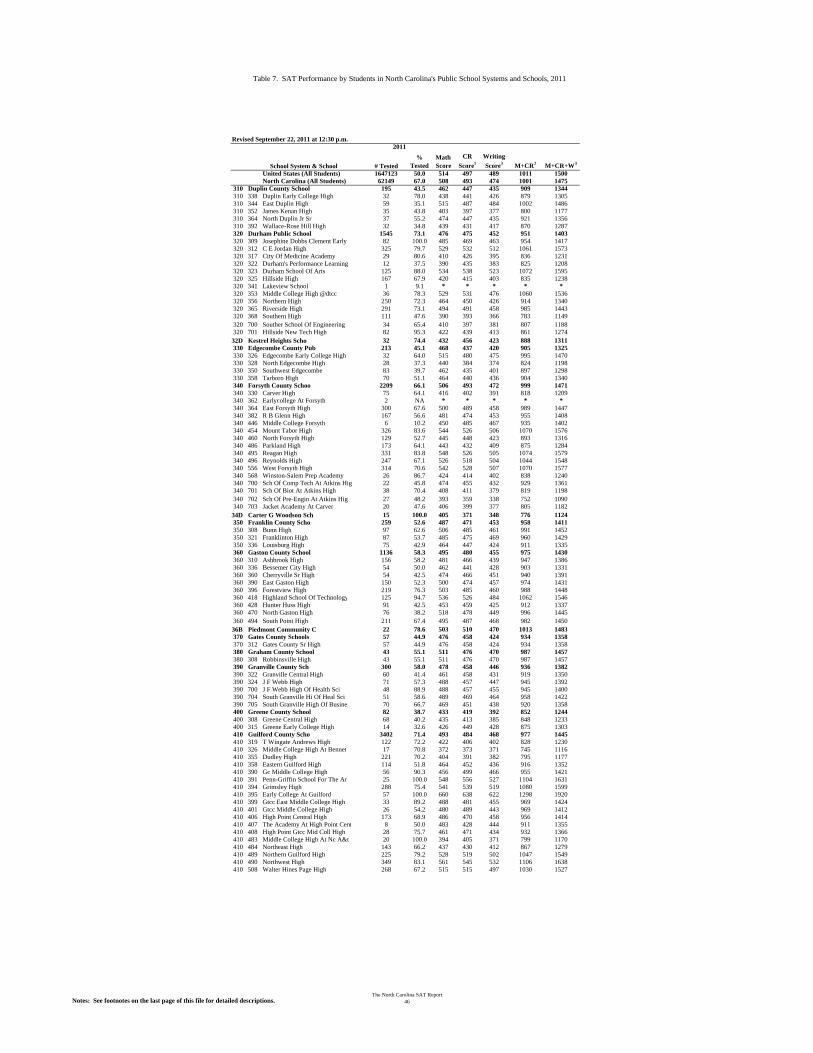
Table 7. SAT Performance by Students in North Carolina's Public School Systems and Schools, 2011
2011
# Tested%
TestedMath Score
CR Score1
Writing Score3 M+CR2 M+CR+W3
United States (All Students) 1647123 50.0 514 497 489 1011 1500 North Carolina (All Students) 62149 67.0 508 493 474 1001 1475
Revised September 22, 2011 at 12:30 p.m.
School System & School
310 195 43.5 462 447 435 909 1344310 338 Duplin Early College High 32 78.0 438 441 426 879 1305310 344 East Duplin High 59 35.1 515 487 484 1002 1486310 352 James Kenan High 35 43.8 403 397 377 800 1177310 364 North Duplin Jr Sr 37 55.2 474 447 435 921 1356310 392 Wallace-Rose Hill High 32 34.8 439 431 417 870 1287320 1545 73.1 476 475 452 951 1403320 309 Josephine Dobbs Clement Early 82 100.0 485 469 463 954 1417320 312 C E Jordan High 325 79.7 529 532 512 1061 1573320 317 City Of Medicine Academy 29 80.6 410 426 395 836 1231320 322 Durham's Performance Learning 12 37.5 390 435 383 825 1208320 323 Durham School Of Arts 125 88.0 534 538 523 1072 1595320 325 Hillside High 167 67.9 420 415 403 835 1238320 341 Lakeview School 1 9.1 * * * * *320 353 Middle College High @dtcc 36 78.3 529 531 476 1060 1536320 356 Northern High 250 72.3 464 450 426 914 1340320 365 Riverside High 291 73.1 494 491 458 985 1443320 368 Southern High 111 47.6 390 393 366 783 1149320 700 Souther School Of Engineering 34 65.4 410 397 381 807 1188320 701 Hillside New Tech High 82 95.3 422 439 413 861 127432D 32 74.4 432 456 423 888 1311330 213 45.1 468 437 420 905 1325330 326 Edgecombe Early College High 32 64.0 515 480 475 995 1470330 328 North Edgecombe High 28 37.3 440 384 374 824 1198330 350 Southwest Edgecombe 83 39.7 462 435 401 897 1298330 358 Tarboro High 70 51.1 464 440 436 904 1340340 2209 66.1 506 493 472 999 1471340 330 Carver High 75 64.1 416 402 391 818 1209340 362 Earlycollege At Forsyth 2 NA * * * * *340 364 East Forsyth High 300 67.6 500 489 458 989 1447340 382 R B Glenn High 167 56.6 481 474 453 955 1408340 446 Middle College Forsyth 6 10.2 450 485 467 935 1402340 454 Mount Tabor High 326 83.6 544 526 506 1070 1576340 460 North Forsyth High 129 52.7 445 448 423 893 1316340 486 Parkland High 173 64.1 443 432 409 875 1284340 495 Reagan High 331 83.8 548 526 505 1074 1579340 496 Reynolds High 247 67.1 526 518 504 1044 1548340 556 West Forsyth High 314 70.6 542 528 507 1070 1577340 568 Winston-Salem Prep Academy 26 86.7 424 414 402 838 1240340 700 Sch Of Comp Tech At Atkins Hig 22 45.8 474 455 432 929 1361340 701 Sch Of Biot At Atkins High 38 70.4 408 411 379 819 1198340 702 Sch Of Pre-Engin At Atkins Hig 27 48.2 393 359 338 752 1090340 703 Jacket Academy At Carver 20 47.6 406 399 377 805 118234D 15 100.0 405 371 348 776 1124350 259 52.6 487 471 453 958 1411350 308 Bunn High 97 62.6 506 485 461 991 1452350 321 Franklinton High 87 53.7 485 475 469 960 1429350 336 Louisburg High 75 42.9 464 447 424 911 1335360 1136 58.3 495 480 455 975 1430360 310 Ashbrook High 156 58.2 481 466 439 947 1386360 336 Bessemer City High 54 50.0 462 441 428 903 1331360 360 Cherryville Sr High 54 42.5 474 466 451 940 1391360 390 East Gaston High 150 52.3 500 474 457 974 1431360 396 Forestview High 219 76.3 503 485 460 988 1448360 418 Highland School Of Technology 125 94.7 536 526 484 1062 1546360 428 Hunter Huss High 91 42.5 453 459 425 912 1337360 470 North Gaston High 76 38.2 518 478 449 996 1445360 494 South Point High 211 67.4 495 487 468 982 145036B 22 78.6 503 510 470 1013 1483370 57 44.9 476 458 424 934 1358370 312 Gates County Sr High 57 44.9 476 458 424 934 1358380 43 55.1 511 476 470 987 1457380 308 Robbinsville High 43 55.1 511 476 470 987 1457390 300 58.0 478 458 446 936 1382390 322 Granville Central High 60 41.4 461 458 431 919 1350390 324 J F Webb High 71 57.3 488 457 447 945 1392390 700 J F Webb High Of Health Sci 48 88.9 488 457 455 945 1400390 704 South Granville Hi Of Heal Sci 51 58.6 489 469 464 958 1422390 705 South Granville High Of Busine 70 66.7 469 451 438 920 1358400 82 38.7 433 419 392 852 1244400 308 Greene Central High 68 40.2 435 413 385 848 1233400 315 Greene Early College High 14 32.6 426 449 428 875 1303410 3402 71.4 493 484 468 977 1445410 319 T Wingate Andrews High 122 72.2 422 406 402 828 1230410 326 Middle College High At Bennet 17 70.8 372 373 371 745 1116410 355 Dudley High 221 70.2 404 391 382 795 1177410 358 Eastern Guilford High 114 51.8 464 452 436 916 1352410 390 Gc Middle College High 56 90.3 456 499 466 955 1421410 391 Penn-Griffin School For The Ar 25 100.0 548 556 527 1104 1631410 394 Grimsley High 288 75.4 541 539 519 1080 1599410 395 Early College At Guilford 57 100.0 660 638 622 1298 1920410 399 Gtcc East Middle College High 33 89.2 488 481 455 969 1424410 401 Gtcc Middle College High 26 54.2 480 489 443 969 1412410 406 High Point Central High 173 68.9 486 470 458 956 1414410 407 The Academy At High Point Cent 8 50.0 483 428 444 911 1355410 408 High Point Gtcc Mid Coll High 28 75.7 461 471 434 932 1366410 483 Middle College High At Nc A&t 20 100.0 394 405 371 799 1170410 484 Northeast High 143 66.2 437 430 412 867 1279410 489 Northern Guilford High 225 79.2 528 519 502 1047 1549410 490 Northwest High 349 83.1 561 545 532 1106 1638410 508 Walter Hines Page High 268 67.2 515 515 497 1030 1527
Durham Public School
Duplin County School
Graham County School
Gates County Schools
Gaston County School
Franklin County Scho
Forsyth County Schoo
Edgecombe County Pub
Guilford County Scho
Greene County School
Granville County Sch
Kestrel Heights Scho
Carter G Woodson Sch
Piedmont Community C
Notes: See footnotes on the last page of this file for detailed descriptions.The North Carolina SAT Report
46

Table 7. SAT Performance by Students in North Carolina's Public School Systems and Schools, 2011
2011
# Tested%
TestedMath Score
CR Score1
Writing Score3 M+CR2 M+CR+W3
United States (All Students) 1647123 50.0 514 497 489 1011 1500 North Carolina (All Students) 62149 67.0 508 493 474 1001 1475
Revised September 22, 2011 at 12:30 p.m.
School System & School
410 529 Lucy Ragsdale High 230 78.8 510 492 469 1002 1471410 544 Ben L Smith High 144 56.5 409 398 378 807 1185410 545 Smith Academy 59 96.7 452 440 413 892 1305410 547 Southeast High 206 73.6 478 474 456 952 1408410 556 Southern High 129 58.4 463 448 432 911 1343410 562 Southwest High 214 69.7 494 480 468 974 1442410 589 P J Weaver Ed Center 46 92.0 538 555 530 1093 1623410 595 Western High 201 74.7 500 494 485 994 1479420 124 44.3 399 390 386 789 1175420 346 Northwest High 73 43.5 416 393 394 809 1203420 358 Southeast Halifax High 51 45.5 375 386 375 761 1136421 119 61.3 464 465 450 929 1379421 316 Roanoke Rapids High 119 61.3 464 465 450 929 1379422 58 81.7 392 341 338 733 1071422 700 Weldon Science Technology Engi 58 81.7 392 341 338 733 1071430 584 53.8 472 461 440 933 1373430 345 Harnett County Alternative 1 9.1 * * * * *430 346 Harnett Central High 154 56.4 484 476 452 960 1412430 371 Overhills High 152 50.8 455 462 442 917 1359430 378 Triton High 162 58.3 474 447 433 921 1354430 384 Western Harnett High 115 51.3 477 461 433 938 1371440 236 44.2 535 511 494 1046 1540440 326 Central Haywood High 1 1.9 * * * * *440 346 Haywood Early College 10 20.8 509 542 486 1051 1537440 378 Pisgah High 93 46.3 512 480 471 992 1463440 390 Tuscola High 132 56.7 553 530 510 1083 1593450 451 55.2 522 518 492 1040 1532450 316 East Henderson High 102 50.7 519 509 482 1028 1510450 334 Hendersonville High 119 70.0 531 531 498 1062 1560450 341 North Henderson High 95 51.9 499 503 487 1002 1489450 352 West Henderson High 135 54.7 534 524 498 1058 1556460 142 58.0 412 393 377 805 1182460 320 Hertford County High 141 63.5 412 392 377 804 1181460 340 Student Development Center 1 4.3 * * * * *470 182 41.6 451 441 425 892 1317470 312 Hoke County High 152 42.6 440 431 415 871 1286470 443 Sandhoke Early College High 30 44.8 509 492 476 1001 1477480 24 53.3 458 453 425 911 1336480 307 Mattamuskeet High 17 47.2 429 417 393 846 1239480 316 Ocracoke 7 77.8 529 540 503 1069 1572490 847 60.4 524 502 480 1026 1506490 320 Collab Col Of Tech & Leadershi 34 54.0 491 523 513 1014 1527490 335 Lake Norman High 374 89.5 550 528 505 1078 1583490 346 North Iredell High 123 45.9 527 494 473 1021 1494490 354 Statesville High 120 56.3 500 489 465 989 1454490 362 South Iredell High 109 53.7 485 459 434 944 1378490 380 West Iredell High 87 43.5 506 466 446 972 1418491 278 70.6 506 483 468 989 1457491 312 Mooresville Sr High 278 70.6 506 483 468 989 145749E 32 100.0 550 532 513 1082 1595500 98 47.1 513 495 472 1008 1480500 302 Blue Ridge Virtual Early Colle 6 37.5 480 435 435 915 1350500 323 Jackson County Early College 3 16.7 * * * * *500 340 Smoky Mountain High 89 57.8 517 498 475 1015 1490510 867 49.8 517 492 470 1009 1479510 324 Clayton High 257 60.5 520 494 477 1014 1491510 357 Johnston Middle College 20 35.1 536 548 508 1084 1592510 367 Johnston County Early College 2 * * * * * *510 368 North Johnston High 65 42.2 522 464 458 986 1444510 376 Princeton High 43 40.6 530 511 481 1041 1522510 399 Smithfield-Selma High 137 44.1 483 475 452 958 1410510 402 South Johnston High 73 30.3 528 495 473 1023 1496510 406 West Johnston High 270 60.9 523 497 470 1020 1490520 59 64.8 467 439 420 906 1326520 320 Jones Senior High 59 64.8 467 439 420 906 1326530 313 56.2 497 476 448 973 1421530 335 Lee Early College 33 39.8 507 505 475 1012 1487530 336 Lee County Sr High 148 59.4 501 480 451 981 1432530 343 Southern Lee Hgih 132 61.4 490 465 437 955 1392540 270 42.9 468 444 420 912 1332540 315 Kinston High 98 50.3 438 404 394 842 1236540 317 Lenoir County Early College Hi 11 28.2 455 463 409 918 1327540 324 North Lenoir High 102 48.3 472 452 419 924 1343540 336 South Lenoir High 59 36.6 515 494 469 1009 1478550 449 58.7 513 478 456 991 1447550 320 East Lincoln High 102 56.4 520 481 457 1001 1458550 332 Lincolnton High 93 47.4 489 475 450 964 1414550 344 North Lincoln High 152 71.7 532 492 478 1024 1502550 368 West Lincoln High 102 58.6 498 458 428 956 138455A 51 98.1 497 502 475 999 1474560 151 57.2 505 494 464 999 1463560 320 Franklin High 116 60.1 493 484 454 977 1431560 324 Highlands School 16 57.1 542 511 479 1053 1532560 329 Macon County Early College Hig 13 50.0 537 564 515 1101 1616560 332 Nantahala School 6 75.0 558 498 495 1056 1551570 58 39.2 510 498 461 1008 1469570 318 Madison High 58 39.5 510 498 461 1008 1469580 101 46.8 474 441 418 915 1333580 344 Roanoke High 37 39.4 465 420 404 885 1289580 368 Williamston High 64 52.5 479 453 426 932 1358590 170 42.8 495 477 460 972 1432590 328 Mcdowell Early College 25 53.2 482 488 462 970 1432590 330 Mcdowell High 145 41.4 497 475 460 972 1432
Mcdowell County Scho
Martin County School
Henderson County Sch
Haywood County Schoo
Harnett County Schoo
Lincoln Charter Scho
Mooresville City Sch
Iredell-Statesville
Hyde County Schools
Madison County Schoo
Macon County Schools
Lincoln County Schoo
Lenoir County Public
Lee County Schools
Jones County Schools
Johnston County Scho
Weldon City Schools
Roanoke Rapids City
Halifax County Schoo
Jackson County Schoo
Hoke County Schools
Hertford County Scho
Pine Lake Preparator
Notes: See footnotes on the last page of this file for detailed descriptions.The North Carolina SAT Report
47

Table 7. SAT Performance by Students in North Carolina's Public School Systems and Schools, 2011
2011
# Tested%
TestedMath Score
CR Score1
Writing Score3 M+CR2 M+CR+W3
United States (All Students) 1647123 50.0 514 497 489 1011 1500 North Carolina (All Students) 62149 67.0 508 493 474 1001 1475
Revised September 22, 2011 at 12:30 p.m.
School System & School
600 5240 68.5 507 495 480 1002 1482600 302 Ardrey Kell High 404 90.0 564 539 534 1103 1637600 334 Cato Middle College High 58 100.0 525 504 486 1029 1515600 361 David W. Butler High 386 68.3 528 507 492 1035 1527600 364 Mary G. Davis Military & Globa 14 100.0 450 439 416 889 1305600 376 E E Waddell High 61 39.4 435 424 403 859 1262600 377 East Mecklenburg High 254 68.8 507 492 476 999 1475600 386 Hawthorne High/Taps 22 30.6 353 381 360 734 1094600 405 Harding Univ High 177 82.7 477 461 442 938 1380600 415 Hopewell High 360 68.2 499 490 473 989 1462600 426 Independence High 251 51.0 456 445 436 901 1337600 439 Turning Point Academy 2 10.5 * * * * *600 445 Mallard Creek High 367 81.0 488 484 475 972 1447600 466 Myers Park High 507 87.9 571 561 540 1132 1672600 480 North Mecklenburg High 390 81.9 537 524 512 1061 1573600 482 Northwest High 116 84.1 477 517 493 994 1487600 496 Phillip O Berry High 208 75.1 461 456 440 917 1357600 498 Performance Learning Center 12 23.5 528 583 553 1111 1664600 508 Providence High 443 95.9 582 561 550 1143 1693600 535 South Mecklenburg High 298 76.2 525 513 496 1038 1534600 576 West Charlotte High 164 50.9 426 420 397 846 1243600 579 West Mecklenburg High 176 53.0 437 425 408 862 1270600 592 Zebulon B. Vance High 205 52.6 441 433 416 874 1290600 690 Math & Science High At Garinge 34 50.0 420 396 380 816 1196600 691 Leadership & Pub Ser High At G 25 37.3 366 372 364 738 1102600 692 Finance School At Garinger 25 35.2 416 383 357 799 1156600 693 Renaissance School At Olympic 46 63.0 468 474 444 942 1386600 695 Int Studies & Global Economics 51 63.0 447 443 418 890 1308600 696 Int Business & Communication S 53 59.6 431 410 408 841 1249600 697 Biotechnology, Health, & Pub A 68 85.0 475 460 430 935 1365600 698 New Technology High At Garinge 38 50.7 439 416 398 855 1253600 699 Int Studies School Of Garinger 25 37.9 437 408 412 845 125760C 13 28.9 320 328 320 648 96860D 106 99.1 530 521 506 1051 155760G 50 82.0 516 511 497 1027 152460H 15 22.4 353 352 347 705 1052610 79 62.2 485 494 447 979 1426610 334 Mitchell High 79 62.2 485 494 447 979 1426620 110 43.3 446 418 417 864 1281620 316 East Montgomery High 56 52.3 417 418 401 835 1236620 340 West Montgomery High 54 47.8 477 419 434 896 1330630 468 58.4 521 504 481 1025 1506630 332 North Moore High 58 49.6 490 455 429 945 1374630 336 Pinecrest High 294 68.2 530 518 497 1048 1545630 360 Union Pines High 116 46.4 512 495 468 1007 1475640 577 51.9 485 460 438 945 1383640 346 Nash Central High 126 50.2 470 447 418 917 1335640 347 Nrm Early College High 48 81.4 466 470 446 936 1382640 350 Northern Nash High 165 55.9 487 468 442 955 1397640 361 Rocky Mount High 134 55.4 493 456 444 949 1393640 364 Southern Nash Sr High 104 40.0 499 464 442 963 140564A 32 68.1 447 460 411 907 1318650 1013 65.8 524 506 483 1030 1513650 326 Emsley A Laney High 214 59.0 494 481 466 975 1441650 327 Eugene Ashley High 188 61.6 523 512 486 1035 1521650 340 Isaac Bear Middle College High 50 86.2 559 548 514 1107 1621650 342 John T Hoggard High 314 76.0 555 527 504 1082 1586650 352 New Hanover High 232 71.2 506 491 464 997 1461650 355 Mary S. Moseley Perf Learning 3 12.5 * * * * *650 394 Wilmington Early College High 12 35.3 472 488 448 960 1408660 124 79.5 403 374 370 777 1147660 336 Northampton High-East 63 69.2 409 375 380 784 1164660 700 Northampton County High Schoo 61 98.4 396 373 360 769 112966A670 785 61.3 497 479 454 976 1430670 320 Dixon High 73 54.1 483 480 459 963 1422670 324 Jacksonville High 154 77.0 501 485 457 986 1443670 333 Northside High School 100 52.6 464 457 432 921 1353670 340 Richlands High 100 54.9 513 489 459 1002 1461670 344 Southwest High 88 62.4 471 458 433 929 1362670 352 Swansboro High 100 54.9 530 504 475 1034 1509670 364 White Oak High 170 68.0 505 478 459 983 1442680 313 74.0 523 520 498 1043 1541680 310 Cedar Ridge Hs 159 82.0 533 528 516 1061 1577680 332 Orange Senior High 154 67.5 513 511 480 1024 1504681 714 85.9 596 586 568 1182 1750681 305 Carbaro High School 154 77.4 576 585 572 1161 1733681 308 Chapel Hill High 251 88.7 597 580 560 1177 1737681 314 East Chapel Hill High 306 91.3 607 593 574 1200 1774681 338 Phoenix Academy High 3 23.1 * * * * *68N 1 2.3 * * * * *690 41 43.2 526 494 454 1020 1474690 320 Pamlico County High 41 43.2 526 494 454 1020 1474700 233 58.0 464 456 432 920 1352700 317 Northeastern High 142 66.0 463 458 434 921 1355700 319 Pasquotank County High 91 50.6 466 454 428 920 1348710 318 54.1 489 480 456 969 1425710 321 Heide Trask High 42 33.1 461 446 413 907 1320710 326 Pender High 91 61.1 459 437 418 896 1314
Nash-Rocky Mount Sch
Moore County Schools
Montgomery County Sc
Mitchell County Scho
New Hanover County S
Northampton County S
Crossroads Charter H
Rocky Mount Preparat
Pace Academy
Kennedy Charter Lake Norman Charter
Pender County School
Charlotte-Mecklenbur
Elizabeth City-Pasqu
Pamlico County Schoo
Chapel Hill-Carrboro
Orange County School
Onslow County School
Queen's Grant Commun
Gaston Prep Academy4
Notes: See footnotes on the last page of this file for detailed descriptions.The North Carolina SAT Report
48

Table 7. SAT Performance by Students in North Carolina's Public School Systems and Schools, 2011
2011
# Tested%
TestedMath Score
CR Score1
Writing Score3 M+CR2 M+CR+W3
United States (All Students) 1647123 50.0 514 497 489 1011 1500 North Carolina (All Students) 62149 67.0 508 493 474 1001 1475
Revised September 22, 2011 at 12:30 p.m.
School System & School
710 327 Pender Early College High 32 45.7 467 498 477 965 1442710 342 Topsail High 153 63.2 519 511 485 1030 1515720 68 54.0 494 452 435 946 1381720 316 Perquimans Co High 68 54.0 494 452 435 946 1381730 166 55.1 476 463 437 939 1376730 352 Person High 166 55.1 476 463 437 939 1376740 806 62.3 506 484 460 990 1450740 309 Ayden-Grifton High 48 44.4 451 444 415 895 1310740 333 D H Conley High 187 70.6 525 499 470 1024 1494740 344 Farmville Central High 83 50.3 492 463 437 955 1392740 366 J H Rose High 221 70.4 548 529 512 1077 1589740 374 North Pitt High 81 45.3 437 421 397 858 1255740 388 South Central High 186 71.0 488 463 437 951 1388750 105 62.1 508 487 459 995 1454750 317 Polk Co. Virtual Early College 9 69.2 449 448 433 897 1330750 318 Polk County High 96 61.5 513 491 461 1004 1465760 548 49.9 504 478 459 982 1441760 318 Eastern Randolph High 73 49.3 485 451 432 936 1368760 339 Providence Grove High 91 58.3 516 487 461 1003 1464760 348 Randleman High 82 49.4 497 487 463 984 1447760 354 Randolph Early College High 54 63.5 516 504 487 1020 1507760 358 Southwestern High 97 41.5 509 487 461 996 1457760 380 Trinity High 78 51.7 501 461 459 962 1421760 388 Wheatmore High 73 46.2 505 472 457 977 1434761 190 78.8 479 461 444 940 1384761 304 Asheboro High 190 78.8 479 461 444 940 1384770 162 33.5 452 437 421 889 1310770 348 Richmond Senior High 157 37.8 449 434 419 883 1302770 349 Richmond Early College High 5 16.7 558 518 470 1076 1546780 536 37.9 450 419 405 869 1274780 325 Fairmont High 57 47.9 435 408 401 843 1244780 342 Lumberton Senior High 195 42.6 454 437 423 891 1314780 385 Robeson County Early College 25 39.1 495 471 449 966 1415780 391 Red Springs High 46 31.1 415 387 384 802 1186780 401 Saint Pauls High 36 21.4 470 426 402 896 1298780 402 South Robeson High 41 38.3 410 371 349 781 1130780 420 Purnell Swett High 136 38.9 459 411 398 870 1268790 431 55.2 487 471 456 958 1414790 314 Dalton Mcmichael High 107 56.6 487 475 461 962 1423790 354 John M Morehead High 112 56.6 481 469 460 950 1410790 366 Reidsville High 87 50.3 464 442 423 906 1329790 378 Rockingham Co High 125 57.6 508 489 472 997 1469800 676 51.9 495 474 453 969 1422800 340 East Rowan High 135 46.9 514 494 465 1008 1473800 361 Jesse C. Carson High 139 51.7 483 466 445 949 1394800 376 North Rowan High 59 50.0 480 448 442 928 1370800 394 Rowan County Early College 1 * * * * * *800 396 Salisbury High 120 63.5 513 491 476 1004 1480800 400 South Rowan High 87 45.8 507 475 462 982 1444800 408 West Rowan High 135 56.7 471 455 428 926 1354810 285 51.7 481 467 452 948 1400810 324 Chase High 67 42.9 471 451 435 922 1357810 340 East Rutherford High 102 75.0 460 443 434 903 1337810 384 R S Central 88 47.8 496 489 472 985 1457810 385 Rutherford County Early Col Hi 27 75.0 535 527 508 1062 1570810 386 Rutherford Opportunity Center 1 2.6 * * * * *81A 56 100.0 535 533 509 1068 1577820 241 49.1 469 449 430 918 1348820 324 Sampson Early College High 42 51.9 487 477 438 964 1402820 348 Hobbton High 45 43.7 467 452 438 919 1357820 349 Lakewood High 36 44.4 439 428 404 867 1271820 352 Midway High 59 49.6 489 454 432 943 1375820 388 Union High 59 55.1 458 436 434 894 1328821 86 52.8 477 463 456 940 1396821 308 Clinton High 86 52.8 477 463 456 940 1396830 202 63.9 458 429 418 887 1305830 316 East Laurinburg Alternative 1 7.7 * * * * *830 348 Scotland Early College High 12 54.5 489 468 449 957 1406830 700 Scotland High Of Health Sci 58 77.3 445 416 421 861 1282830 702 Scotland High Sch Of Visual & 43 62.3 444 437 413 881 1294830 704 Scotland High School Of Leader 50 66.7 443 408 402 851 1253830 705 Scotland High School Of Math 38 61.3 504 455 431 959 1390840 339 57.0 495 465 442 960 1402840 302 Albemarle High 80 74.1 448 425 409 873 1282840 332 North Stanly High 77 54.2 484 457 435 941 1376840 356 South Stanly High 35 42.7 538 494 446 1032 1478840 361 Stanly Early College High Scho 39 84.8 494 471 450 965 1415840 368 West Stanly High 108 51.7 524 490 468 1014 148284B 66 100.0 552 564 545 1116 1661850 213 48.5 499 477 453 976 1429850 332 N Stokes Mid/High 48 50.5 493 475 441 968 1409850 352 South Stokes High 65 49.6 499 472 453 971 1424850 358 West Stokes High 100 47.8 501 482 459 983 1442860 224 40.3 516 486 465 1002 1467860 316 East Surry High 68 51.9 530 495 469 1025 1494860 336 North Surry High 71 38.8 508 469 456 977 1433860 352 Surry Central High 58 42.6 512 473 444 985 1429860 354 Surry Early College Hs Design 27 25.5 510 537 520 1047 1567861 58 69.9 521 507 478 1028 1506861 308 Elkin High 58 69.9 521 507 478 1028 1506862 58 54.7 527 487 473 1014 1487862 312 Mount Airy High 58 54.7 527 487 473 1014 1487870 46 40.4 473 487 461 960 1421870 314 Swain County High 46 41.4 473 487 461 960 1421880 141 61.8 516 502 469 1018 1487880 308 Brevard High 106 72.1 525 511 475 1036 1511880 328 Rosman Middle/High 35 53.8 489 476 449 965 1414890 15 45.5 443 423 396 866 1262890 304 Columbia High 15 45.5 443 423 396 866 1262
Polk County Schools
Tyrrell County Schoo
Transylvania County
Swain County Schools
Mount Airy City Scho
Elkin City Schools
Pitt County Schools
Person County School
Perquimans County Sc
Rockingham County Sc
Public Schools Of Ro
Richmond County Scho
Asheboro City School
Randolph County Scho
Surry County Schools
Stokes County School
Stanly County School
Scotland County Scho
Clinton City Schools
Sampson County Schoo
Rutherford County Sc
Rowan-Salisbury Scho
Thomas Jefferson Cla
Gray Stone Day
Notes: See footnotes on the last page of this file for detailed descriptions.The North Carolina SAT Report
49
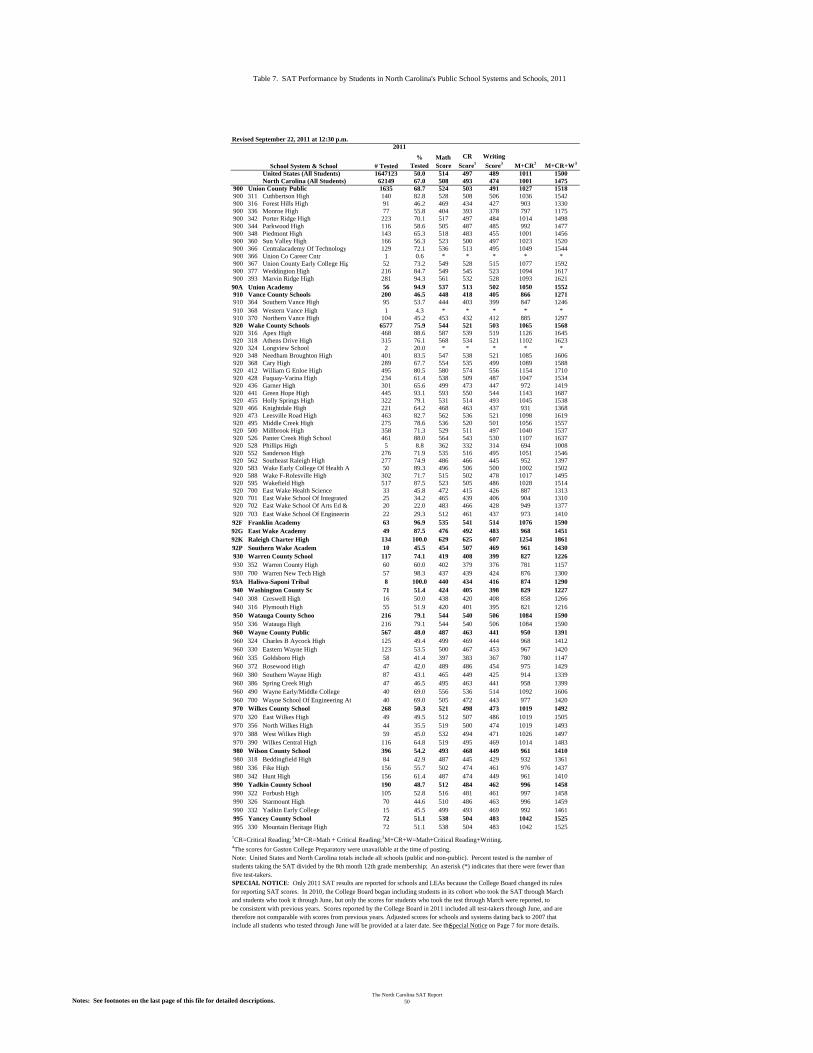
Table 7. SAT Performance by Students in North Carolina's Public School Systems and Schools, 2011
2011
# Tested%
TestedMath Score
CR Score1
Writing Score3 M+CR2 M+CR+W3
United States (All Students) 1647123 50.0 514 497 489 1011 1500 North Carolina (All Students) 62149 67.0 508 493 474 1001 1475
Revised September 22, 2011 at 12:30 p.m.
School System & School
900 1635 68.7 524 503 491 1027 1518900 311 Cuthbertson High 140 82.8 528 508 506 1036 1542900 316 Forest Hills High 91 46.2 469 434 427 903 1330900 336 Monroe High 77 55.8 404 393 378 797 1175900 342 Porter Ridge High 223 70.1 517 497 484 1014 1498900 344 Parkwood High 116 58.6 505 487 485 992 1477900 348 Piedmont High 143 65.3 518 483 455 1001 1456900 360 Sun Valley High 166 56.3 523 500 497 1023 1520900 366 Centralacademy Of Technology 129 72.1 536 513 495 1049 1544900 366 Union Co Career Cntr 1 0.6 * * * * *900 367 Union County Early College Hig 52 73.2 549 528 515 1077 1592900 377 Weddington High 216 84.7 549 545 523 1094 1617900 393 Marvin Ridge High 281 94.3 561 532 528 1093 162190A 56 94.9 537 513 502 1050 1552910 200 46.5 448 418 405 866 1271910 364 Southern Vance High 95 53.7 444 403 399 847 1246910 368 Western Vance High 1 4.3 * * * * *910 370 Northern Vance High 104 45.2 453 432 412 885 1297920 6577 75.9 544 521 503 1065 1568920 316 Apex High 468 88.6 587 539 519 1126 1645920 318 Athens Drive High 315 76.1 568 534 521 1102 1623920 324 Longview School 2 20.0 * * * * *920 348 Needham Broughton High 401 83.5 547 538 521 1085 1606920 368 Cary High 289 67.7 554 535 499 1089 1588920 412 William G Enloe High 495 80.5 580 574 556 1154 1710920 428 Fuquay-Varina High 234 61.4 538 509 487 1047 1534920 436 Garner High 301 65.6 499 473 447 972 1419920 441 Green Hope High 445 93.1 593 550 544 1143 1687920 455 Holly Springs High 322 79.1 531 514 493 1045 1538920 466 Knightdale High 221 64.2 468 463 437 931 1368920 473 Leesville Road High 463 82.7 562 536 521 1098 1619920 495 Middle Creek High 275 78.6 536 520 501 1056 1557920 500 Millbrook High 358 71.3 529 511 497 1040 1537920 526 Panter Creek High School 461 88.0 564 543 530 1107 1637920 528 Phillips High 5 8.8 362 332 314 694 1008920 552 Sanderson High 276 71.9 535 516 495 1051 1546920 562 Southeast Raleigh High 277 74.9 486 466 445 952 1397920 583 Wake Early College Of Health A 50 89.3 496 506 500 1002 1502920 588 Wake F-Rolesville High 302 71.7 515 502 478 1017 1495920 595 Wakefield High 517 87.5 523 505 486 1028 1514920 700 East Wake Health Science 33 45.8 472 415 426 887 1313920 701 East Wake School Of Integrated 25 34.2 465 439 406 904 1310920 702 East Wake School Of Arts Ed & 20 22.0 483 466 428 949 1377920 703 East Wake School Of Engineerin 22 29.3 512 461 437 973 141092F 63 96.9 535 541 514 1076 159092G 49 87.5 476 492 483 968 145192K 134 100.0 629 625 607 1254 186192P 10 45.5 454 507 469 961 1430930 117 74.1 419 408 399 827 1226930 352 Warren County High 60 60.0 402 379 376 781 1157930 700 Warren New Tech High 57 98.3 437 439 424 876 130093A 8 100.0 440 434 416 874 1290940 71 51.4 424 405 398 829 1227940 308 Creswell High 16 50.0 438 420 408 858 1266940 316 Plymouth High 55 51.9 420 401 395 821 1216950 216 79.1 544 540 506 1084 1590950 336 Watauga High 216 79.1 544 540 506 1084 1590960 567 48.0 487 463 441 950 1391960 324 Charles B Aycock High 125 49.4 499 469 444 968 1412960 330 Eastern Wayne High 123 53.5 500 467 453 967 1420960 335 Goldsboro High 58 41.4 397 383 367 780 1147960 372 Rosewood High 47 42.0 489 486 454 975 1429960 380 Southern Wayne High 87 43.1 465 449 425 914 1339960 386 Spring Creek High 47 46.5 495 463 441 958 1399960 490 Wayne Early/Middle College 40 69.0 556 536 514 1092 1606960 700 Wayne School Of Engineering At 40 69.0 505 472 443 977 1420970 268 50.3 521 498 473 1019 1492970 320 East Wilkes High 49 49.5 512 507 486 1019 1505970 356 North Wilkes High 44 35.5 519 500 474 1019 1493970 388 West Wilkes High 59 45.0 532 494 471 1026 1497970 390 Wilkes Central High 116 64.8 519 495 469 1014 1483980 396 54.2 493 468 449 961 1410980 318 Beddingfield High 84 42.9 487 445 429 932 1361980 336 Fike High 156 55.7 502 474 461 976 1437980 342 Hunt High 156 61.4 487 474 449 961 1410990 190 48.7 512 484 462 996 1458990 322 Forbush High 105 52.8 516 481 461 997 1458990 326 Starmount High 70 44.6 510 486 463 996 1459990 332 Yadkin Early College 15 45.5 499 493 469 992 1461995 72 51.1 538 504 483 1042 1525995 330 Mountain Heritage High 72 51.1 538 504 483 1042 1525
1CR=Critical Reading; 2M+CR=Math + Critical Reading; 3M+CR+W=Math+Critical Reading+Writing. 4The scores for Gaston College Preparatory were unavailable at the time of posting. Note: United States and North Carolina totals include all schools (public and non-public). Percent tested is the number of students taking the SAT divided by the 8th month 12th grade membership; An asterisk (*) indicates that there were fewer thanfive test-takers.SPECIAL NOTICE: Only 2011 SAT results are reported for schools and LEAs because the College Board changed its rules for reporting SAT scores. In 2010, the College Board began including students in its cohort who took the SAT through March and students who took it through June, but only the scores for students who took the test through March were reported, to be consistent with previous years. Scores reported by the College Board in 2011 included all test-takers through June, and are therefore not comparable with scores from previous years. Adjusted scores for schools and systems dating back to 2007 that include all students who tested through June will be provided at a later date. See the Special Notice on Page 7 for more details.
Wilkes County School
Wayne County Public
Watauga County Schoo
Washington County Sc
Warren County School
Franklin Academy East Wake Academy Raleigh Charter High Southern Wake Academ
Haliwa-Saponi Tribal
Wake County Schools
Vance County Schools
Union County Public
Yancey County School
Yadkin County School
Wilson County School
Union Academy
Notes: See footnotes on the last page of this file for detailed descriptions.The North Carolina SAT Report
50

The North Carolina SAT Report • 2011 51
Table 8. Distribution of North Carolina's Public School Systems by Mean Total SAT Scores (Critical Reading + Mathematics), 2010-2011
Score School System1340 NC School Of Science & Math...1260 Raleigh Charter High...1190 Chapel Hill-Carrboro...1140 NC School Of The Arts, Woods Charter...1120 Gray Stone Day...1090 Pine Lake Preparator, Watauga County School1080 Franklin Academy1070 Asheville City Schoo, Thomas Jefferson Cla, Wake County Schools1060 Buncombe County Scho, Lake Norman Charter, The Hawbridge School1050 Carteret County Publ, Haywood County Schoo, Hickory City Schools, Orange County School,
Union Academy, Yancey County School1040 Davie County Schools, Henderson County Sch1030 Elkin City Schools, Iredell-Statesville, Moore County Schools, New Hanover County S, Queen's Grant Commun,
Union County Public2011 United States 1020 Avery County Schools, Cabarrus County Scho, Clay County Schools, Dare County Schools, Mount Airy City Scho,
(1011) Pamlico County Schoo, Piedmont Community C, Transylvania County, Wilkes County School2011 North Carolina 1010 Ashe County Schools, Catawba County Schoo, Charlotte-Mecklenbur, Clover Garden, Currituck County Sch,
(1001) Jackson County Schoo, Johnston County Scho, Madison County Schoo, Surry County Schools2011 Southeast 1000 Craven County School, Davidson County Scho, Forsyth County Schoo, Lincoln Charter Scho,
(988) Lincoln County Schoo, Macon County Schools, Polk County Schools, Yadkin County School990 Burke County Schools, Caldwell County Scho, Graham County School, Mooresville City Sch,
Pitt County Schools, Randolph County Scho980 Alleghany County Sch, Chatham County Schoo, Gaston County School, Guilford County Scho,
Lee County Schools, Mcdowell County Scho, Mitchell County Scho, Newton Conover City, Onslow County School970 Brunswick County Sch, Cherokee County Scho, Cleveland County Sch, East Wake Academy, Pender County School,
Rowan-Salisbury Scho, Southern Wake Academ, Wilson County School960 Alexander County Sch, Camden County School, Durham Public School, Franklin County Scho,
Rockingham County Sc, Stanly County School, Swain County Schools950 Beaufort County Scho, Cumberland County Sc, Nash-Rocky Mount Sch, Perquimans County Sc,
River Mill Academy, Rutherford County Sc, Wayne County Public940 Asheboro City School, Clinton City Schools, Gates County Schools, Granville County Sch,
Harnett County Schoo, Kannapolis City Scho, Person County School930 Roanoke Rapids City920 Elizabeth City-Pasqu, Hyde County Schools, Lenoir County Public, Martin County School, Sampson County Schoo,
Whiteville City Scho910 Columbus County Scho, Duplin County School, Edgecombe County Pub, Jones County Schools,
Rocky Mount Preparat900 Edenton-Chowan Schoo, Hoke County Schools, Lexington City Schoo890 Caswell County Schoo, Kestrel Heights Scho, Richmond County Scho, Scotland County Scho880 Haliwa-Saponi Tribal870 Anson County Schools, Bladen County School, Montgomery County Sc, Public Schools Of Robeson,
Thomasville City Sch, Tyrrell County Schoo, Vance County Schools860 Greene County School...830 Warren County School, Washington County Sc...810 Hertford County Scho800 Bertie County School790 Halifax County Schoo780 Carter G Woodson Sch, Crossnore Academy, Northampton County S...740 Weldon City Schools...710 Crossroads Charter H...650 Kennedy Charter*** Cape Lookout Marine, Greensboro Area Math Sci Ed Cr, Pace Academy
United States, North Carolina, and Southeast total scores include both public and non-public schools.

The North Carolina SAT Report • 2011 52
Performance of the Fifty States

The North Carolina SAT Report • 2011 53
Table 9. Mean Critical Reading (CR), Mathematics (M), Writing (W), CR + M, and CR + M + W Scores and Percent Tested by State, 2010-2011
StatePercent Tested1
Critical Reading
(CR) Mean Mathematics
(M) Mean
Writing (W)
Mean CR+MCR+M+
WAlabama 8% 546 541 536 1087 1623Alaska 52% 515 511 487 1026 1513Arizona 28% 517 523 499 1040 1539Arkansas 5% 568 570 554 1138 1692California 53% 499 515 499 1014 1513Colorado 19% 570 573 556 1143 1699Connecticut 87% 509 513 513 1022 1535Delaware 74% 489 490 476 979 1455District of Columbia 79% 469 457 459 926 1385Florida 64% 487 489 471 976 1447Georgia 80% 485 487 473 972 1445Hawaii 64% 479 500 469 979 1448Idaho 20% 542 539 517 1081 1598Illinois 5% 599 617 591 1216 1807Indiana 68% 493 501 475 994 1469Iowa 3% 596 606 575 1202 1777Kansas 7% 580 591 563 1171 1734Kentucky 6% 576 572 563 1148 1711Louisiana 8% 555 550 546 1105 1651Maine 93% 469 469 453 938 1391Maryland 74% 499 502 491 1001 1492Massachusetts 89% 513 527 509 1040 1549Michigan 5% 583 604 573 1187 1760Minnesota 7% 593 608 577 1201 1778Mississippi 4% 564 543 553 1107 1660Missouri 5% 592 593 579 1185 1764Montana 26% 539 537 516 1076 1592Nebraska 5% 585 591 569 1176 1745Nevada 47% 494 496 470 990 1460New Hampshire 77% 523 525 511 1048 1559New Jersey 78% 495 516 497 1011 1508New Mexico 12% 548 541 529 1089 1618New York 89% 485 499 476 984 1460North Carolina 67% 493 508 474 1001 1475North Dakota 3% 586 612 561 1198 1759Ohio 21% 539 545 522 1084 1606Oklahoma 6% 571 565 547 1136 1683Oregon 56% 520 521 499 1041 1540Pennsylvania 73% 493 501 479 994 1473Rhode Island 68% 495 493 489 988 1477South Carolina 70% 482 490 464 972 1436South Dakota 4% 584 591 562 1175 1737Tennessee 10% 575 568 567 1143 1710Texas 58% 479 502 465 981 1446Utah 6% 563 559 545 1122 1667Vermont 67% 515 518 505 1033 1538Virginia 71% 512 509 495 1021 1516Washington 57% 523 529 508 1052 1560West Virginia 17% 514 501 497 1015 1512Wisconsin 5% 590 602 575 1192 1767Wyoming 5% 572 569 551 1141 1692United States 50% 497 514 489 1011 15001The percent of high school graduates tested is based upon the recently revised projection of high school graduates in 2011 by the Western Interstate Commission for Higher Education (WICHE), and the number of students in the class of 2011 who took the SAT Reasoning Test in each state. Updated projections make it inappropriate to compare percentages for any given year with those of other years. SOURCE: "Knocking at the College Door: Projections of High School Graduates by State and Race/Ethnicity, 1992-2022," Western Interstate Commission for Higher Education (WICHE), March 2008.

The North Carolina SAT Report • 2011 54
Table 10. Change in Mean Total SAT Scores [Critical Reading (CR) + Mathematics (M)] by State, 1990-2011
Percent Tested1 CR+M CR+M
Change from
State 2011 1990 2011 1990 to 2011
Alabama 8% 1079 1087 8Alaska 52% 1015 1026 11Arizona 28% 1041 1040 -1Arkansas 5% 1077 1138 61California 53% 1002 1014 12Colorado 19% 1067 1143 76Connecticut 87% 1002 1022 20Delaware 74% 1006 979 -27District of Columbia 79% 950 926 -24Florida 64% 988 976 -12Georgia 80% 951 972 21Hawaii 64% 985 979 -6Idaho 20% 1066 1081 15Illinois 5% 1089 1216 127Indiana 68% 972 994 22Iowa 3% 1172 1202 30Kansas 7% 1129 1171 42Kentucky 6% 1089 1148 59Louisiana 8% 1088 1105 17Maine 93% 991 938 -53Maryland 74% 1008 1001 -7Massachusetts 89% 1001 1040 39Michigan 5% 1063 1187 124Minnesota 7% 1110 1201 91Mississippi 4% 1090 1107 17Missouri 5% 1089 1185 96Montana 26% 1082 1076 -6Nebraska 5% 1121 1176 55Nevada 47% 1022 990 -32New Hampshire 77% 1028 1048 20New Jersey 78% 993 1011 18New Mexico 12% 1100 1089 -11New York 89% 985 984 -1North Carolina 67% 948 1001 53North Dakota 3% 1157 1198 41Ohio 21% 1048 1084 36Oklahoma 6% 1095 1136 41Oregon 56% 1024 1041 17Pennsylvania 73% 987 994 7Rhode Island 68% 986 988 2South Carolina 70% 942 972 30South Dakota 4% 1150 1175 25Tennessee 10% 1102 1143 41Texas 58% 979 981 2Utah 6% 1121 1122 1Vermont 67% 1000 1033 33Virginia 71% 997 1021 24Washington 57% 1024 1052 28West Virginia 17% 1034 1015 -19Wisconsin 5% 1111 1192 81Wyoming 5% 1072 1141 69United States 50% 1001 1011 10
1The percent of high school graduates tested is based upon the recently revised projection of high school graduates in 2008 by the Western Interstate Commission for Higher Education (WICHE), and the number of students in the class of 2008 who took the SAT Reasoning Test in each state. Updated projections make it inappropriate to compare percentages for any given year with those of other years. CR = Critical Reading; M = Math SOURCE: "Knocking at the College Door: Projections of High School Graduates by State and Race/Ethnicity1992-2022," Western Interstate Commission for Higher Education (WICHE), March 2008.

The North Carolina SAT Report • 2011 55
Table 11. Public and Non-Public Schools: Mean SAT Reasoning TestTM Critical Reading, Mathematics, and Writing Scores by State, with Changes for 2011, 2010, and 2001.
STATE
Partici- pation Rate
20111
Critical Reading Mean Math Mean
Writing Mean
Critical Reading Mean
Math Mean
Writing Mean
Critical Reading Mean
Math Mean
Writing Mean
Critical Reading Mean
Math Mean
Critical Reading
Math Mean
Maine 93% 469 469 453 468 467 454 1 2 -1 506 500 -37 -31Massachusetts 89% 513 527 509 512 526 509 1 1 0 511 515 2 12New York 89% 485 499 476 483 498 477 2 1 -1 495 505 -10 -6Connecticut 87% 509 513 513 509 513 512 0 0 1 509 510 0 3Georgia 80% 485 487 473 488 489 474 -3 -2 -1 491 489 -6 -2District of Columbia2 79% 469 457 459 472 462 464 -3 -5 -5 482 474 -13 -17New Jersey 78% 495 516 497 495 514 497 0 2 0 499 513 -4 3New Hampshire 77% 523 525 511 520 523 510 3 2 1 520 516 3 9Delaware 74% 489 490 476 492 494 480 -3 -4 -4 501 499 -12 -9Maryland 74% 499 502 491 500 505 493 -1 -3 -2 508 510 -9 -8Pennsylvania 73% 493 501 479 491 500 479 2 1 0 500 499 -7 2Virginia 71% 512 509 495 511 511 496 1 -2 -1 510 501 2 8South Carolina 70% 482 490 464 483 494 466 -1 -4 -2 486 488 -4 2Indiana 68% 493 501 475 493 503 476 0 -2 -1 499 501 -6 0Rhode Island 68% 495 493 489 494 494 488 1 -1 1 501 499 -6 -6North Carolina 67% 493 508 474 495 509 476 -2 -1 -2 493 499 0 9Vermont 67% 515 518 505 518 520 505 -3 -2 0 511 506 4 12Florida 64% 487 489 471 495 496 478 -8 -7 -7 498 499 -11 -10Hawaii 64% 479 500 469 482 504 470 -3 -4 -1 486 515 -7 -15Texas 58% 479 502 465 483 504 472 -4 -2 -7 493 499 -14 3Washington 57% 523 529 508 524 531 507 -1 -2 1 527 527 -4 2Oregon 56% 520 521 499 522 523 498 -2 -2 1 526 526 -6 -5California 53% 499 515 499 501 516 500 -2 -1 -1 498 517 1 -2Alaska 52% 515 511 487 516 513 489 -1 -2 -2 514 510 1 1Nevada 47% 494 496 470 494 499 471 0 -3 -1 509 515 -15 -19Arizona 28% 517 523 499 518 524 498 -1 -1 1 523 525 -6 -2Montana 26% 539 537 516 537 537 515 2 0 1 539 539 0 -2Ohio 21% 539 545 522 538 547 522 1 -2 0 534 539 5 6Idaho 20% 542 539 517 542 540 517 0 -1 0 543 542 -1 -3Colorado 19% 570 573 556 567 572 554 3 1 2 539 542 31 31West Virginia 17% 514 501 497 513 504 498 1 -3 -1 527 512 -13 -11New Mexico 12% 548 541 529 551 547 532 -3 -6 -3 551 542 -3 -1Tennessee 10% 575 568 567 574 570 564 1 -2 3 562 553 13 15Alabama 8% 546 541 536 556 550 543 -10 -9 -7 559 554 -13 -13Louisiana 8% 555 550 546 554 548 545 1 2 1 564 562 -9 -12Kansas 7% 580 591 563 589 595 567 -9 -4 -4 577 580 3 11Minnesota 7% 593 608 577 593 606 578 0 2 -1 580 589 13 19Kentucky 6% 576 572 563 575 574 562 1 -2 1 550 550 26 22Oklahoma 6% 571 565 547 567 566 544 4 -1 3 567 561 4 4Utah 6% 563 559 545 565 557 544 -2 2 1 575 570 -12 -11Arkansas 5% 568 570 554 564 564 550 4 6 4 562 550 6 20Illinois 5% 599 617 591 585 600 577 14 17 14 576 589 23 28Michigan 5% 583 604 573 583 603 574 0 1 -1 561 572 22 32Missouri 5% 592 593 579 593 595 580 -1 -2 -1 577 577 15 16Nebraska 5% 585 591 569 583 592 568 2 -1 1 562 568 23 23Wisconsin 5% 590 602 575 593 603 578 -3 -1 -3 584 596 6 6Wyoming 5% 572 569 551 568 565 543 4 4 8 547 545 25 24Mississippi 4% 564 543 553 564 547 550 0 -4 3 566 551 -2 -8South Dakota 4% 584 591 562 591 601 566 -7 -10 -4 577 582 7 9Iowa 3% 596 606 575 600 611 580 -4 -5 -5 593 603 3 3North Dakota 3% 586 612 561 578 593 556 8 19 5 592 599 -6 13United States 50% 497 514 489 500 515 491 -3 -1 -2 506 514 -9 01Based on projections of high school graduates in 2008 as published in "Knocking at the College Door: Projections of High School Graduates by State and Race/Ethnicity, 1992-2022," Western Interstate Commission for Higher Education (WICHE), March 2009 and the number of students in the class of 2009 who took the SAT Reasoning Test in each state.Note: The College Board strongly discourages the comparison or ranking of states on the basis of SAT scores alone .SOURCE: The College Board. (2011, September). SAT Trends Background on the SAT Takers in the Class of 2011 . P. 13. New York: Author.
Ten-Year Change2010 One-Year Change 20012011

The North Carolina SAT Report • 2011 56
Table 12. Public Schools: Mean SAT Reasoning TestTM Critical Reading, Mathematics, and Writing Scores by State, with Changes for 2011, 2010, and 2007.
STATE
Partici- pation Rate
20111
Critical Reading Mean Math Mean
Writing Mean
Critical Reading Mean
Math Mean
Writing Mean
Critical Reading Mean
Math Mean
Writing
Mean
Critical Reading Mean
Math Mean
Critical Reading
Math Mean
Maine 100% 465 462 448 464 460 448 1 2 0 460 461 5 4New York 85% 480 497 470 482 500 474 -2 -3 -4 485 485 -5 -5Massachusetts 84% 505 521 500 508 523 504 -3 -2 -4 505 499 0 6Connecticut 81% 502 505 506 504 509 508 -2 -4 -2 500 500 2 2Georgia 74% 481 483 467 483 486 470 -2 -3 -3 487 487 -6 -6New Jersey 74% 492 516 494 495 518 497 -3 -2 -3 490 484 2 8New Hampshire 73% 514 516 502 513 518 502 1 -2 0 510 510 4 4Delaware 69% 471 475 455 476 480 461 -5 -5 -6 478 477 -7 -6Maryland 69% 492 497 483 494 501 487 -2 -4 -4 490 491 2 1Pennsylvania 68% 490 500 475 490 501 477 0 -1 -2 488 487 2 3Indiana 67% 489 499 471 490 501 472 -1 -2 -1 491 493 -2 -4Virginia 67% 509 507 492 510 511 494 -1 -4 -2 506 509 3 0Vermont 65% 516 517 505 522 522 508 -6 -5 -3 515 516 1 0North Carolina 64% 489 507 469 493 509 472 -4 -2 -3 490 506 -1 3South Carolina 64% 479 489 459 481 495 463 -2 -6 -4 484 486 -5 -7Rhode Island 64% 482 482 474 484 487 477 -2 -5 -3 483 489 -1 -7Florida 62% 483 486 466 492 495 474 -9 -9 -8 491 489 -8 -6Texas 54% 475 500 461 480 502 468 -5 -2 -7 485 477 -10 -2Hawaii 52% 454 474 441 460 478 442 -6 -4 -1 458 458 -4 -4Washington 51% 521 527 505 522 530 505 -1 -3 0 522 521 -1 0Oregon 50% 516 520 494 519 521 494 -3 -1 0 518 519 -2 -3California 48% 494 513 494 500 519 499 -6 -6 -5 492 493 2 1Alaska 46% 516 514 488 518 517 492 -2 -3 -4 516 517 0 -1Nevada 43% 493 495 468 493 499 470 0 -4 -2 497 501 -4 -8District of Columbia 41% 415 404 401 414 405 401 1 -1 0 414 409 1 6Arizona 24% 515 523 496 516 525 497 -1 -2 -1 515 516 0 -1Montana 23% 539 540 515 537 541 516 2 -1 -1 538 545 1 -6Idaho 18% 542 541 517 543 542 517 -1 -1 0 538 539 4 3Ohio 16% 535 545 516 536 549 517 -1 -4 -1 530 530 5 5Colorado 16% 574 580 560 574 581 560 0 -1 0 562 562 12 12West Virginia 15% 511 499 494 514 506 498 -3 -7 -4 512 516 -1 -5New Mexico 9% 535 530 514 541 536 518 -6 -6 -4 541 539 -6 -4Alabama 7% 539 538 530 548 547 536 -9 -9 -6 558 556 -19 -17Kansas 6% 590 598 569 602 603 578 -12 -5 -9 586 586 4 4Minnesota 5% 601 610 578 603 612 585 -2 -2 -7 595 594 6 7Tennessee 5% 577 570 565 574 572 562 3 -2 3 571 576 6 1Louisiana 5% 545 543 528 546 543 531 -1 0 -3 565 566 -20 -21Wyoming 5% 575 575 555 572 566 545 3 9 10 562 570 13 5Kentucky 4% 578 580 563 576 583 562 2 -3 1 562 563 16 15Illinois 4% 608 633 598 589 611 581 19 22 17 602 601 6 7Utah 4% 585 580 565 587 578 565 -2 2 0 584 589 1 -4Oklahoma 4% 568 560 541 566 567 541 2 -7 0 571 572 -3 -4Michigan 4% 583 608 572 584 609 575 -1 -1 -3 561 552 22 31Nebraska 4% 582 590 565 580 593 563 2 -3 2 574 572 8 10Arkansas 4% 568 573 553 568 568 552 0 5 1 577 564 -9 4Wisconsin 4% 595 606 577 605 613 588 -10 -7 -11 592 593 3 2South Dakota 3% 590 594 565 598 603 572 -8 -9 -7 589 597 1 -7Iowa 3% 602 612 581 614 624 594 -12 -12 -13 610 608 -8 -6Mississippi 3% 549 529 540 551 534 539 -2 -5 1 564 560 -15 -11Missouri 3% 592 592 573 589 592 571 3 0 2 591 593 1 -1North Dakota 3% 593 620 570 582 598 560 11 22 10 581 566 12 27United States 42% 494 506 483 497 510 486 -3 -4 -3 501 514 -7 -81Based on projections of high school graduates in 2008 as published in "Knocking at the College Door: Projections of High School Graduates by State and Race/Ethn1992-2022," Western Interstate Commission for Higher Education (WICHE), March 2008 and the number of students in the class of 2008 who took the SAT Reasoning Test in each state.Note: The College Board strongly discourages the comparison or ranking of states on the basis of SAT scores alone .SOURCE: The College Board. (2011, September) SAT Trends: Background on the SAT Takers in the Class of 2011 . New York, New York.
Five-Year Change2010 One-Year Change 20072011