2011 sonoma county hispanic demographic trends report
TRANSCRIPT
Hispanic Demographic Trends Report 2011S O N O M AC O U N T Y
2011 Hispanic Demographic Report
Board of Directors
Pam Chanter, Chair, Joe Orlando, Vice Chair, Libby Harvey Fitzgerald, Melanie Bagby, Mark Inman, Lina Kachiu, Peter O’Brien, Michael Tomasini, Marcos Surez, John Webley
July 2011
The Sonoma County Economic Development Board (EDB) is pleased to present the 2011 Hispanic Demographic Trends Report. This report includes demographic and workforce statistics at the local, state and national levels. The EDB would like to acknowledge the assistance of the Sonoma County Hispanic Chamber of Commerce in updating this report.
Over the last 20 years a demographic shift has taken place in Sonoma County. The region has become increasingly diverse due in part to the rapid growth of the Hispanic population. This demographic shift is not restricted to the County; it has occurred across California and in many parts of the United States. According to the US Census, Sonoma County’s Hispanic population was at 120,241, making up over 24.4 percent of the county’s inhabitants in 2010. The California Department of Finance project the Hispanic population to become the ethnic majority (51%) by 2050.
The 2011 Hispanic Demographic Trends was created to help government, non-profits, businesses, and educational institutions develop plans that will address the future challenges and opportunities with changing demographics.
The EDB expects to continue to pursue projects and reports related to the Hispanic community. Thank you for your continued interest in the EDB’s research. As always, if you have any questions, please feelfree to contact us at (707) 565-7170.
Sincerely,
Ben StoneExecutive Director

Demographic Shift
Sonoma County is experiencing a demographic shift that will continue to shape the composition of the region. Over the past 20 years the reported Hispanic population has increased by nearly 200 percent. In 1990, the County had a
population of 388,222; less than 11 percent were Hispanic.
By 2010, the population had grown to 483,897, of which 120,241, or 24.4 percent, were Hispanic. The white population remains the majority with nearly 66 percent of the
population. People of Asian descent make up nearly five
percent of the population with 23,359 individuals, and African Americans make up 1.6 percent of the population with 7,897 individuals.
Sonoma County is projected to become more diverse in the coming decades. The Hispanic population is expected to continue to grow substantially. By the year 2038, forecasts predict that Hispanics will become the largest ethnic group in the County; they are expected to become the ethnic majority with 385,807 individuals making up 51 percent of the population by 2050.
This major demographic shift offers opportunities and challenges for business, government, education, and community-based organizations. By understanding the unique opportunities and challenges presented by the growing Hispanic population, Sonoma County will be better prepared to meet opportunities as they are presented.
Source: California Department of Finance (www.dof.ca.gov)
Sonoma County Demographic Breakdown by Race, 2010
Native American
Black
Multirace
Asian
Hispanic
White
66.0%
24.4%
4.7%
2.2%1.6% 1.0%
Population Growth Sonoma County and the Hispanic Population, 2010
0
100,000
200,000
300,000
400,000
500,000
Hispanic Population Total Population 1970 1980 1990 2000 2010
Source: 1970-1980 Bay Area Census, 1990-2000 Decennial Census, 2009 American Community Survey. State of California, Department of Finance.
204,885
388,222
483,878
24.4%4.0%
10.6%
www.sonomaedb.org
2
Projected Population Growth Sonoma County 2010-2050
100,000
200,000
300,000
400,000
500,000
600,000
700,000
800,000
Hispanic Population Total Population 2010 2020 2030 2040 2050
761,177
50.7%
Source: California Department of Finance (www.dof.ca.gov)
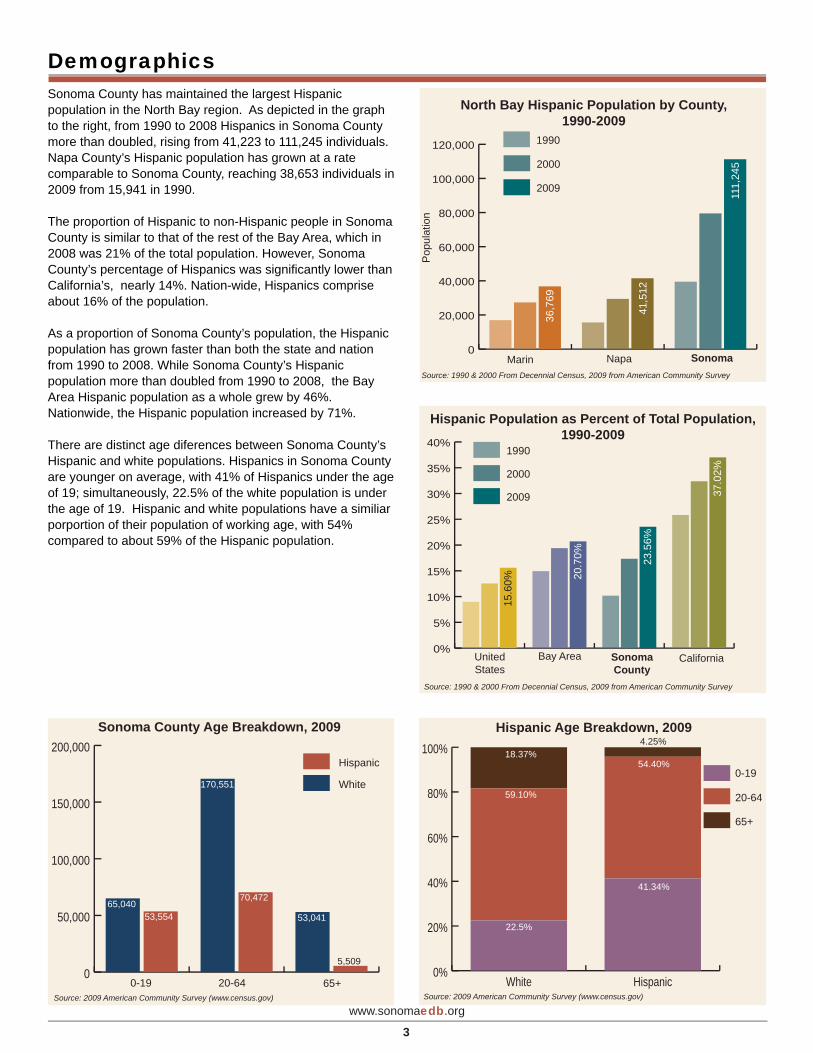
Demographics Sonoma County has maintained the largest Hispanic population in the North Bay region. As depicted in the graph to the right, from 1990 to 2008 Hispanics in Sonoma County more than doubled, rising from 41,223 to 111,245 individuals. Napa County’s Hispanic population has grown at a rate comparable to Sonoma County, reaching 38,653 individuals in 2009 from 15,941 in 1990.
The proportion of Hispanic to non-Hispanic people in Sonoma County is similar to that of the rest of the Bay Area, which in 2008 was 21% of the total population. However, Sonoma County’s percentage of Hispanics was significantly lower than California’s, nearly 14%. Nation-wide, Hispanics comprise about 16% of the population.
As a proportion of Sonoma County’s population, the Hispanic population has grown faster than both the state and nation from 1990 to 2008. While Sonoma County’s Hispanic population more than doubled from 1990 to 2008, the Bay Area Hispanic population as a whole grew by 46%. Nationwide, the Hispanic population increased by 71%.
There are distinct age diferences between Sonoma County’s Hispanic and white populations. Hispanics in Sonoma County are younger on average, with 41% of Hispanics under the age of 19; simultaneously, 22.5% of the white population is under the age of 19. Hispanic and white populations have a similiar porportion of their population of working age, with 54% compared to about 59% of the Hispanic population.
North Bay Hispanic Population by County,1990-2009
0
20,000
40,000
60,000
80,000
100,000
120,000
Marin Napa Sonoma Source: 1990 & 2000 From Decennial Census, 2009 from American Community Survey
2009
2000
1990
Pop
ulat
ion
111,
245
41,5
12
36,7
69
Hispanic Population as Percent of Total Population,1990-2009
0%
5%
10%
15%
20%
25%
30%
35%
40%
2009
2000
1990
Sonoma County
Bay Area California United States
Source: 1990 & 2000 From Decennial Census, 2009 from American Community Survey
20.7
0%
37.0
2%
23.5
6%
15.6
0%
Sonoma County Age Breakdown, 2009
0
50,000
100,000
150,000
200,000Hispanic
White
Source: 2009 American Community Survey (www.census.gov)
0-19 20-64 65+
53,041
170,551
65,04053,554
70,472
5,509
Source: 2009 American Community Survey (www.census.gov)
Hispanic Age Breakdown, 2009
65+
20-64
0-19
0%
20%
40%
60%
80%
100%
HispanicWhite
22.5%
59.10%
18.37%
41.34%
54.40%
4.25%
www.sonomaedb.org
3
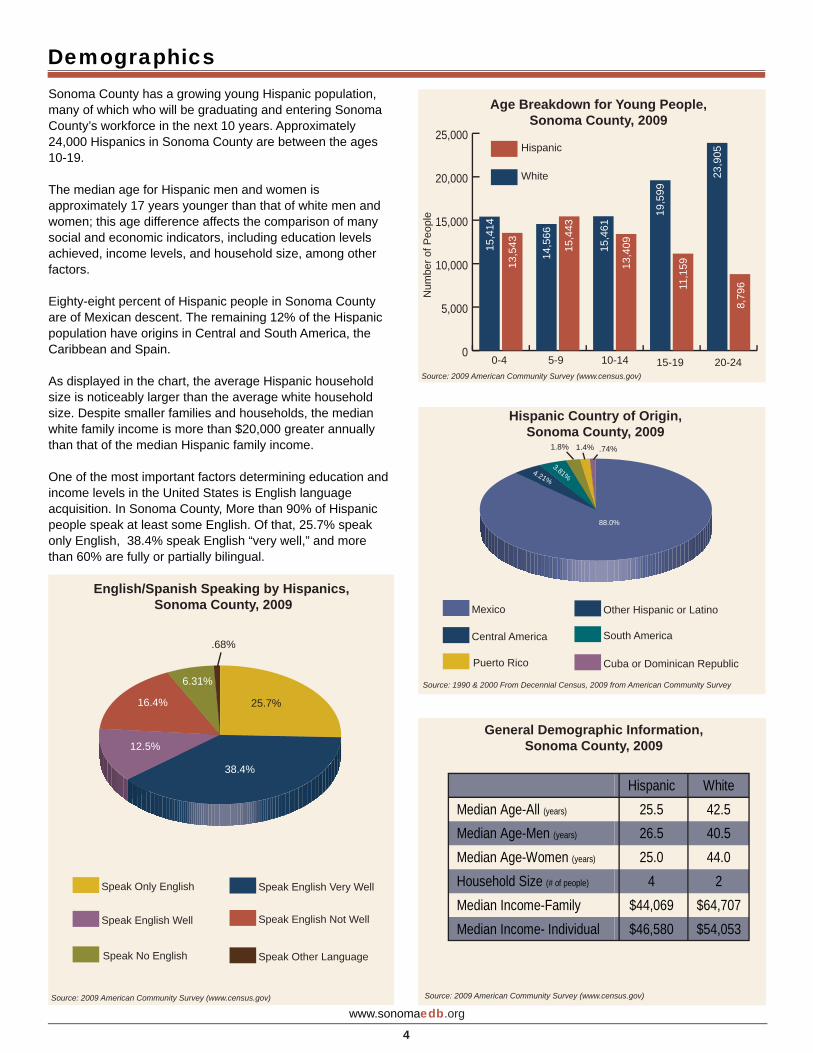
Demographics Sonoma County has a growing young Hispanic population, many of which who will be graduating and entering Sonoma County’s workforce in the next 10 years. Approximately 24,000 Hispanics in Sonoma County are between the ages 10-19.
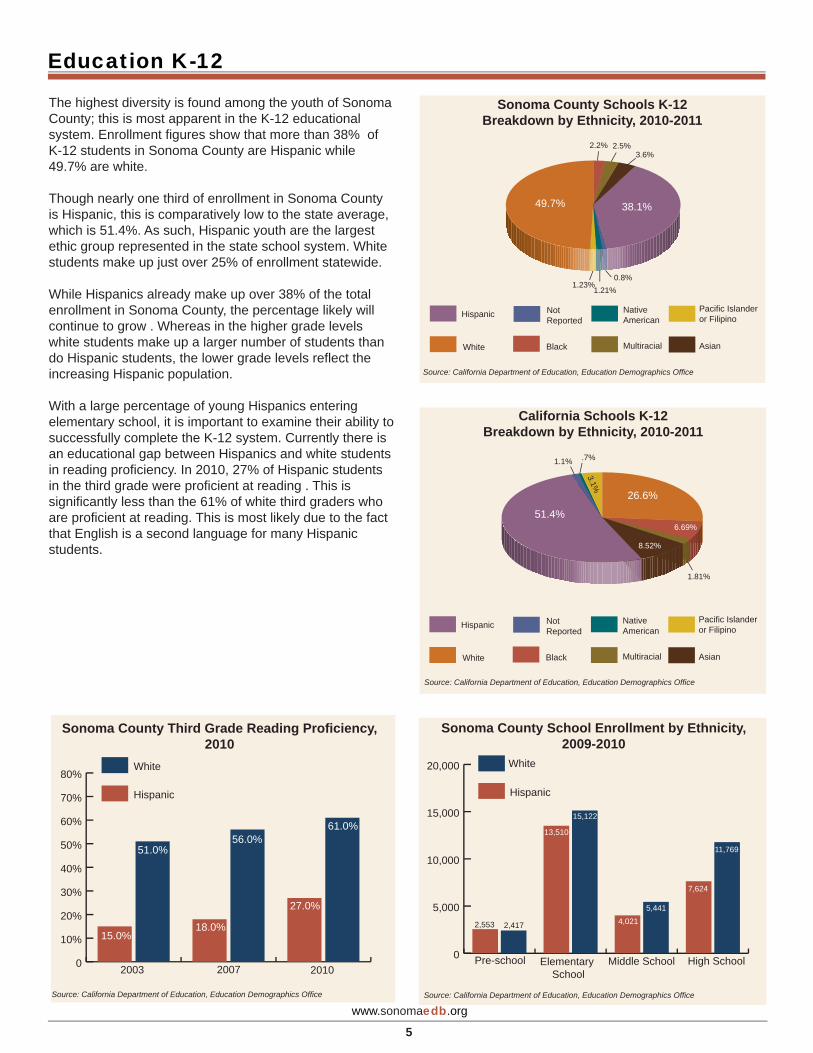
The median age for Hispanic men and women is approximately 17 years younger than that of white men and women; this age difference affects the comparison of many social and economic indicators, including education levels achieved, income levels, and household size, among other factors. Eighty-eight percent of Hispanic people in Sonoma County are of Mexican descent. The remaining 12% of the Hispanic population have origins in Central and South America, the Caribbean and Spain.
As displayed in the chart, the average Hispanic household size is noticeably larger than the average white household size. Despite smaller families and households, the median white family income is more than $20,000 greater annually than that of the median Hispanic family income.
One of the most important factors determining education and income levels in the United States is English language acquisition. In Sonoma County, More than 90% of Hispanic people speak at least some English. Of that, 25.7% speak only English, 38.4% speak English “very well,” and more than 60% are fully or partially bilingual.
Source: 2009 American Community Survey (www.census.gov)
Speak Other Language Speak No English
Speak English Well Speak English Not Well
Speak Only English Speak English Very Well
25.7%
38.4%
12.5%
16.4%
6.31%
.68%
English/Spanish Speaking by Hispanics, Sonoma County, 2009
Source: 2009 American Community Survey (www.census.gov)
Age Breakdown for Young People,Sonoma County, 2009
0
5,000
10,000
15,000
20,000
25,000
0-4 5-9 10-14 15-19 20-24
Hispanic
White
Num
ber o
f Peo
ple
15,4
14
13,5
43
14,5
66
15,4
43
15,4
61
13,4
09
19,5
99
11,1
59
23,9
05
8,79
6
Hispanic Country of Origin, Sonoma County, 2009
Source: 1990 & 2000 From Decennial Census, 2009 from American Community Survey
.74%1.4%
3.81%
88.0%
4.21%
1.8%
Cuba or Dominican Republic Puerto Rico
Central America South America
Mexico Other Hispanic or Latino
General Demographic Information, Sonoma County, 2009
Hispanic White Median Age-All (years) 25.5 42.5Median Age-Men (years) 26.5 40.5 Median Age-Women (years) 25.0 44.0 Household Size (# of people) 4 2 Median Income-Family $44,069 $64,707 Median Income- Individual $46,580 $54,053
Source: 2009 American Community Survey (www.census.gov)
www.sonomaedb.org
4
Education K-12
The highest diversity is found among the youth of Sonoma County; this is most apparent in the K-12 educational system. Enrollment figures show that more than 38% of K-12 students in Sonoma County are Hispanic while 49.7% are white.
Though nearly one third of enrollment in Sonoma County is Hispanic, this is comparatively low to the state average, which is 51.4%. As such, Hispanic youth are the largest ethic group represented in the state school system. White students make up just over 25% of enrollment statewide.
While Hispanics already make up over 38% of the total enrollment in Sonoma County, the percentage likely will continue to grow . Whereas in the higher grade levels white students make up a larger number of students than do Hispanic students, the lower grade levels reflect the increasing Hispanic population.
With a large percentage of young Hispanics entering elementary school, it is important to examine their ability to successfully complete the K-12 system. Currently there is an educational gap between Hispanics and white students in reading proficiency. In 2010, 27% of Hispanic students in the third grade were proficient at reading . This is significantly less than the 61% of white third graders who are proficient at reading. This is most likely due to the fact that English is a second language for many Hispanic students.
Sonoma County Schools K-12 Breakdown by Ethnicity, 2010-2011
Hispanic
White
Native American
Multiracial
Pacific Islander or Filipino
Asian
49.7%
1.23%1.21%
0.8%
3.6%
38.1%
Source: California Department of Education, Education Demographics Office
2.5%2.2%
Not Reported
Black
Source: California Department of Education, Education Demographics Office
California Schools K-12 Breakdown by Ethnicity, 2010-2011
Hispanic
White
Native American
Multiracial
Pacific Islander or Filipino
Asian
51.4%
1.81%
8.52%
6.69%
.7%
26.6%
1.1%
3.1%
Not Reported
Black
Sonoma County Third Grade Reading Proficiency, 2010
0
10%
20%
30%
40%
50%
60%
70%
80%White
Hispanic
2003 2007 2010
Source: California Department of Education, Education Demographics Office
51.0%
15.0%18.0%
56.0%
27.0%
61.0%
Sonoma County School Enrollment by Ethnicity, 2009-2010
0
5,000
10,000
15,000
20,000
Hispanic
White
Pre-school Elementary School
Middle School High School
Source: California Department of Education, Education Demographics Office
2,4172,553
13,510
15,122
5,441
4,021
11,769
7,624
www.sonomaedb.org
5

K-12 Education
Graduation rates among Sonoma County Hispanic high school students continue to increase, despite higher drop-out rates than most of their non-Hispanic peers. In 2006, 64% of Sonoma County high school graduates were white and nearly 24.8% were Hispanic. In 2008, 74% of Sonoma County grade 12 students graduated, and 79% of the graduates went to college in the fall. Of those, 79% went to community colleges and 20 percent to four-year colleges.
In Sonoma County, about 13% of Hispanic graduates completed the necessary criteria to continue with four-year university program; this is nearly half of the 26% of Hispanic graduates achieving the same standards across the state. Comparatively, 33% of white graduates in Sonoma County completed the needed criteria to enter a four-year university, which is similar to the 41% of white graduates across the state.
Whereas obtaining skilled employment or earning a high income is not solely contingent upon completion of a four-year university degree, lacking a high school diploma can be a major barrier to obtaining a steady, well-paying job. In Sonoma County, Hispanic, Native American, and African American students have higher dropout rates than their white and Asian peers; 26% of Hispanic students drop out between grades 9-12. Statewide, Hispanics drop out at a rate of 22%. Sonoma County’s rising Hispanic drop out rate presents a considerable challenge to the economic viability of the Hispanic community. As Hispanics make up a growing proportion of primary and secondary school enrollment, employers will increasingly value those who obtain their high school diploma and pursue higher levels of academic achievement.
Sonoma County High School Graduates Breakdown by Ethnicity, 2008-2009
64.4%24.8%
3.8%2.1%1.6%
1.0%
American Indian
Black
Multirace
Asian
Hispanic
White
Source: California Employment Development Department (www.edd.ca.gov)
Graduates with UC/CSU Required Courses, 2008-2009
Source: California Employment Development Department (www.edd.ca.gov)
Ameri
can
India
n
Asia
n
P
acific
I
sland
er
F
ilipino
Black
White
Other
Total
California
Sonoma County
0%
10%
20%
30%
40%
50%
60%
Hisp
anic
26%
33%
25%
24%
20%
19%
18%
13%
30%
40%
Source: U.S. Census Bureau, 2009 (www.census.gov)
Sonoma County Hispanic Dropout Rates, 2004-2009
10%
20%
30%
40%
50%
2004 2005 2006 2007 2008 2009
26.5%
Source: California Employment Development Department (www.edd.ca.gov)
Sonoma County Dropout by Ethnicity, 2008-2009
0% 10% 20% 30% 40%
California
Sonoma
Native American
Black
Hispanic
Asian
White
Other 9.10%
13.4%
26.5%
31.6%
31.7%
13.9%
www.sonomaedb.org
6
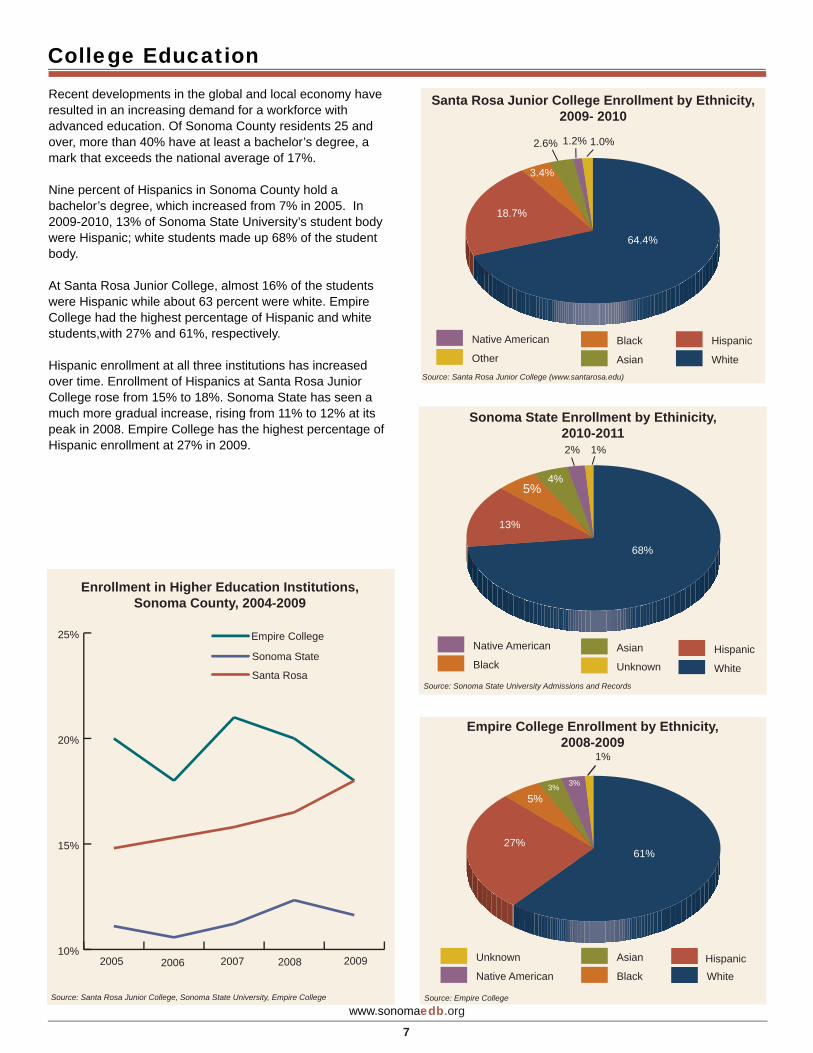
College Education Recent developments in the global and local economy have resulted in an increasing demand for a workforce with advanced education. Of Sonoma County residents 25 and over, more than 40% have at least a bachelor’s degree, a mark that exceeds the national average of 17%.
Nine percent of Hispanics in Sonoma County hold a bachelor’s degree, which increased from 7% in 2005. In 2009-2010, 13% of Sonoma State University’s student body were Hispanic; white students made up 68% of the student body.
At Santa Rosa Junior College, almost 16% of the students were Hispanic while about 63 percent were white. Empire College had the highest percentage of Hispanic and white students,with 27% and 61%, respectively.
Hispanic enrollment at all three institutions has increased over time. Enrollment of Hispanics at Santa Rosa Junior College rose from 15% to 18%. Sonoma State has seen a much more gradual increase, rising from 11% to 12% at its peak in 2008. Empire College has the highest percentage of Hispanic enrollment at 27% in 2009.
10%
15%
20%
25% Empire College
Sonoma State
Santa Rosa
Enrollment in Higher Education Institutions, Sonoma County, 2004-2009
2005 2006 2007 2008 2009
Source: Santa Rosa Junior College, Sonoma State University, Empire College
64.4%
18.7%
3.4%
2.6% 1.2% 1.0%
Santa Rosa Junior College Enrollment by Ethnicity, 2009- 2010
Native American
Other Black
Asian
Hispanic
White Source: Santa Rosa Junior College (www.santarosa.edu)
Sonoma State Enrollment by Ethinicity, 2010-2011
Native American
BlackAsian
UnknownHispanic
White
68%
13%
4%
2% 1%
5%
Source: Sonoma State University Admissions and Records
Empire College Enrollment by Ethnicity, 2008-2009
Unknown
Native American
Asian
BlackHispanic White
61%27%
5%3% 3%
1%
Source: Empire College
www.sonomaedb.org
7
Housing
www.sonomaedb.org
8
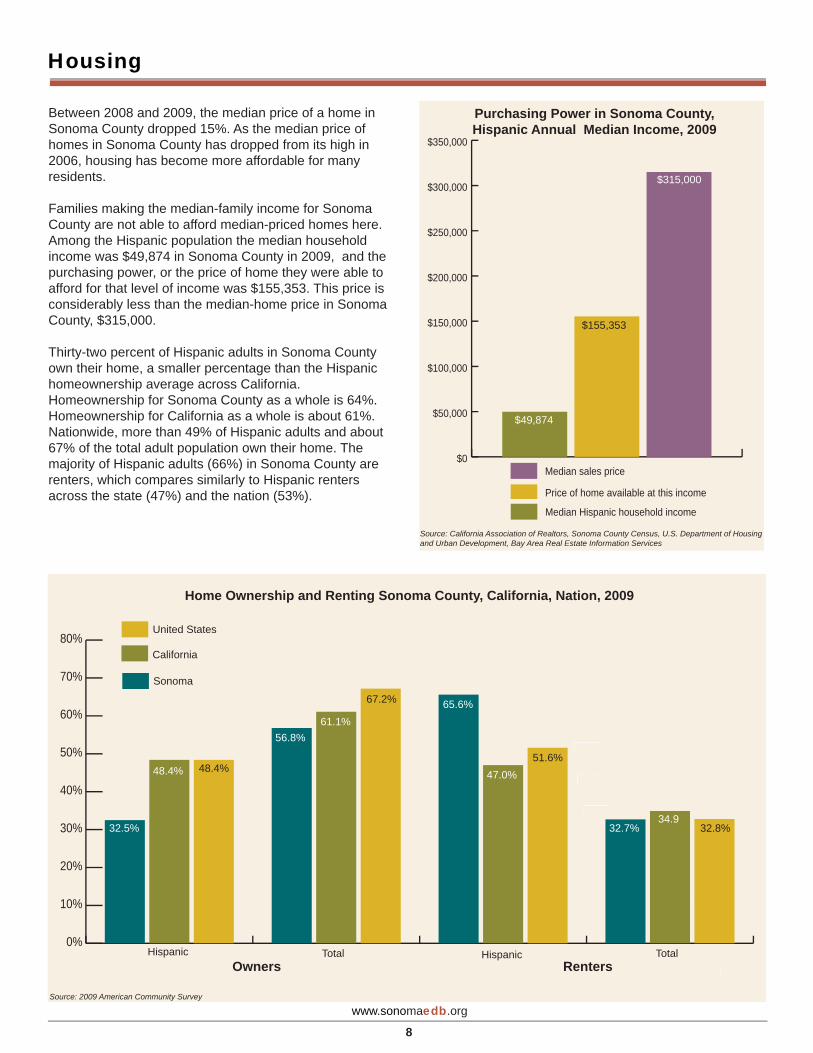
Between 2008 and 2009, the median price of a home in Sonoma County dropped 15%. As the median price of homes in Sonoma County has dropped from its high in 2006, housing has become more affordable for many residents.
Families making the median-family income for Sonoma County are not able to afford median-priced homes here. Among the Hispanic population the median household income was $49,874 in Sonoma County in 2009, and the purchasing power, or the price of home they were able to afford for that level of income was $155,353. This price is considerably less than the median-home price in Sonoma County, $315,000.
Thirty-two percent of Hispanic adults in Sonoma County own their home, a smaller percentage than the Hispanic homeownership average across California. Homeownership for Sonoma County as a whole is 64%. Homeownership for California as a whole is about 61%. Nationwide, more than 49% of Hispanic adults and about 67% of the total adult population own their home. The majority of Hispanic adults (66%) in Sonoma County are renters, which compares similarly to Hispanic renters across the state (47%) and the nation (53%).
Purchasing Power in Sonoma County,Hispanic Annual Median Income, 2009
$0
$50,000
$100,000
$150,000
$200,000
$250,000
$300,000
$350,000
Median sales price
Price of home available at this income
Median Hispanic household income
$49,874
$155,353
$315,000
Source: California Association of Realtors, Sonoma County Census, U.S. Department of Housing and Urban Development, Bay Area Real Estate Information Services
1,530
1,640
1,800
3,210
4,200
4,350
4,430
5,950
1,530
1,640
1,800
3,210
4,200
4,350
4,430
5,950
Home Ownership and Renting Sonoma County, California, Nation, 2009
0%
10%
20%
30%
40%
50%
60%
70%
80%United States
California
Sonoma
Hispanic Total Hispanic Total
Source: 2009 American Community Survey
Owners Renters
32.5%
48.4% 48.4%
56.8%61.1%
67.2% 65.6%
47.0%51.6%
32.7% 32.8%34.9
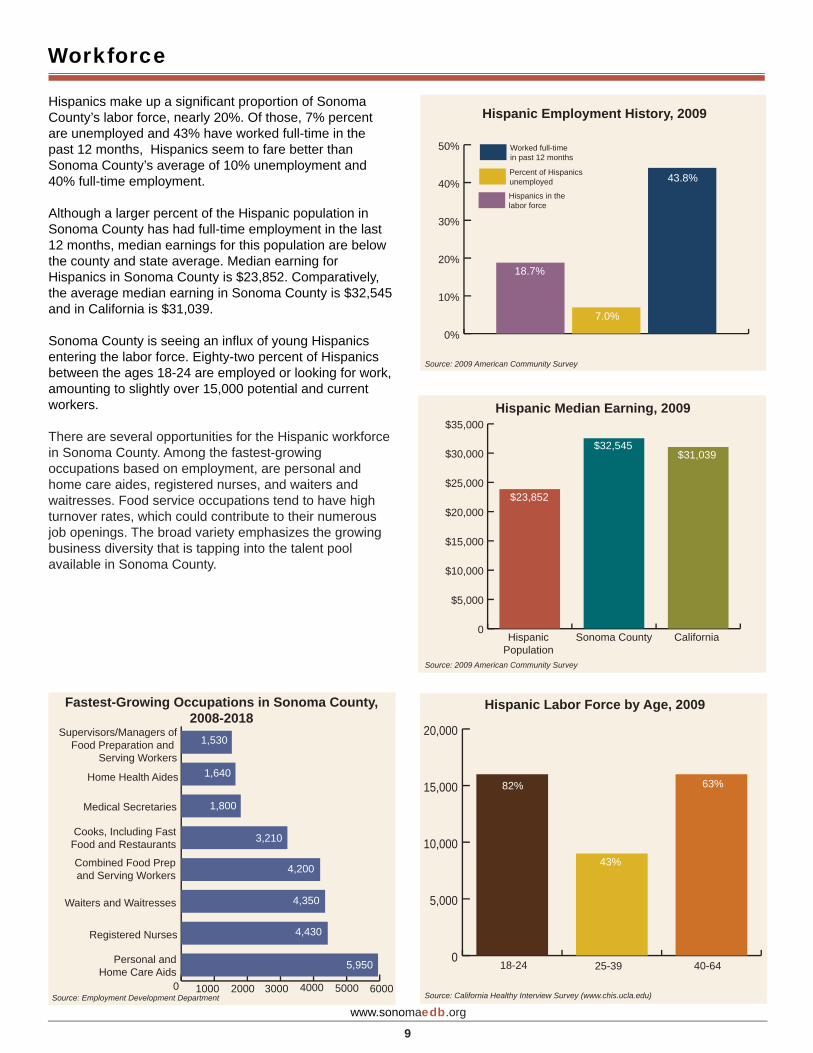
Workforce
Hispanics make up a significant proportion of Sonoma County’s labor force, nearly 20%. Of those, 7% percent are unemployed and 43% have worked full-time in the past 12 months, Hispanics seem to fare better than Sonoma County’s average of 10% unemployment and 40% full-time employment.
Although a larger percent of the Hispanic population in Sonoma County has had full-time employment in the last 12 months, median earnings for this population are below the county and state average. Median earning for Hispanics in Sonoma County is $23,852. Comparatively, the average median earning in Sonoma County is $32,545 and in California is $31,039.
Sonoma County is seeing an influx of young Hispanics entering the labor force. Eighty-two percent of Hispanics between the ages 18-24 are employed or looking for work, amounting to slightly over 15,000 potential and current workers.
There are several opportunities for the Hispanic workforce in Sonoma County. Among the fastest-growing occupations based on employment, are personal and home care aides, registered nurses, and waiters and waitresses. Food service occupations tend to have high turnover rates, which could contribute to their numerous job openings. The broad variety emphasizes the growing business diversity that is tapping into the talent pool available in Sonoma County.
Fastest-Growing Occupations in Sonoma County, 2008-2018
0 1000 2000 3000 4000 5000 6000
Supervisors/Managers ofFood Preparation and
Serving Workers
Cooks, Including Fast Food and Restaurants
Home Health Aides
Medical Secretaries
Combined Food Prepand Serving Workers
Waiters and Waitresses
Registered Nurses
Personal andHome Care Aids
1,530
1,640
1,800
3,210
4,200
4,350
4,430
5,950
Source: Employment Development Department
64.4%
Source: 2009 American Community Survey
0%
10%
20%
30%
40%
50% Worked full-time in past 12 months
Percent of Hispanics unemployed
Hispanics in the labor force
18.7%
7.0%
43.8%
Hispanic Employment History, 2009
Hispanic Median Earning, 2009
68%13%
0
$5,000
$10,000
$15,000
$20,000
$25,000
$30,000
$35,000
California Sonoma CountyHispanicPopulation
$23,852
$31,039$32,545
Source: 2009 American Community Survey
www.sonomaedb.org
9
0
5,000
10,000
15,000
20,000
Hispanic Labor Force by Age, 2009
82%
43%
63%
18-24 25-39 40-64
Source: California Healthy Interview Survey (www.chis.ucla.edu)
ds andMethodology and Sources
Macro Drivers
Methodology
The 2011 Hispanic Demographic Trends Report is a product of the Sonoma County Economic Development Board (EDB).
According to the Census Bureau, Hispanics or Latinos are those people who classify their origin (ancestry) as Mexican, Mexican American, Chicano, Puerto Rican, Cuban, Argentinean, Colombian, Costa Rican, Dominican, Ecuadoran, Guatemalan, Hondu-
ran, Nicaraguan, Peruvian, Salvadoran, from other Spanish-speaking countries of the Caribbean or Central or South America, or
from Spain. The data used by the Economic Development Board is reflective of this definition.
This report offers composite representations of raw data and cite respective source data sets on demographic trends occurring i s Sonoma County. For more information, please see the listed sources. Interested readers are encouraged to contact data source agencies or organizations for further research or visit our website www.sonomaedb.org. Readers are also invited to suggest improvements for future reports by calling (707) 565-7170 or emailing [email protected].
SourcesThis report includes data from various agencies. Below is a list of those agencies and companies:
Bay Area Real Estate Information Services, Inc. California Association of Realtors California Department of Education California Department of Finance California Employment Development Department Empire CollegeMoody’s Analytics Santa Rosa Junior CollegeSonoma State UniversitySonoma County Economic Development Board UCLA California Health Interview SurveyUnited States Bureau of the CensusUnited States Bureau of Labor Statistics
Acknowledgements: The 2011 Hispanic Demographic Trends Report was compiled, analyzed, and edited by Economic Development Board project coordinator, Loren Lopez. A special thanks to the Hispanic Chamber of Commerce for its assistance in developing this report.
www.sonomaedb.org
10