2012. the collapse of the soviet union and the ... · pdf filethe collapse of the soviet union...
TRANSCRIPT

THE COLLAPSE OF THE SOVIET UNION AND THEPRODUCTIVITY OF AMERICAN MATHEMATICIANS*
George J. BorjasKirk B. Doran
It has been difficult to open up the black box of knowledge production.We use unique international data on the publications, citations, and affiliationsof mathematicians to examine the impact of a large, post-1992 influx of Sovietmathematicians on the productivity of their U.S. counterparts. We find a nega-tive productivity effect on those mathematicians whose research overlappedwith that of the Soviets. We also document an increased mobility rate (tolower quality institutions and out of active publishing) and a reduced likelihoodof producing ‘‘home run’’ papers. Although the total product of the preexistingAmerican mathematicians shrank, the Soviet contribution to American math-ematics filled in the gap. However, there is no evidence that the Soviets greatlyincreased the size of the ‘‘mathematics pie.’’ Finally, we find that there aresignificant international differences in the productivity effects of the collapseof the Soviet Union, and these international differences can be explained byboth differences in the size of the emigre flow into the various countries and inhow connected each country is to the global market for mathematical publica-tions. JEL Codes: O31, J61.
I. Introduction
Many economists believe that knowledge production is cen-tral to long-term economic growth. Nevertheless, it has been dif-ficult to document the factors that enter the production functionof knowledge. The difficulty arises for many reasons. For ex-ample, knowledge production is both social and reciprocal(Lucas 2009), in that the ideas of one researcher influence andare in turn influenced by the ideas of others. Similarly, basic
*We are grateful to Graeme Fairweather, Patrick Ion, Erol Ozil, and NormRichert from the American Mathematical Society for extensive collaboration andsupport in preparing the data. This project profited from the excellent program-ming of Andrew Stellman of Stellman and Greene Consulting. We have benefitedfrom comments made by a large number of economists and mathematicians,including Ran Abramitzky, Orley Ashenfelter, Pierre Azoulay, Robert Barro,Witold Biedrzycki, Brent Doran, Charles Doran, David Ellwood, William Evans,Henry Farber, Richard Freeman, John Friedman, Joshua Goodman, DanielHamermesh, Arthur Jaffe, Lawrence Katz, Petra Moser, Michael Rothschild,Lawrence Shepp, Fabian Waldinger, Bruce Weinberg, Heidi Williams, numerousseminar participants, and three referees. The authors are grateful to the UpjohnInstitute, the Kauffman Foundation, and the Sloan Foundation for their financialassistance.
! The Author(s) 2012. Published by Oxford University Press, on behalf of President andFellows of Harvard College. All rights reserved. For Permissions, please email: [email protected] Quarterly Journal of Economics (2012), 1143–1203. doi:10.1093/qje/qjs015.Advance Access publication on April 13, 2012.
1143
at Harvard U
niversity on August 21, 2012
http://qje.oxfordjournals.org/D
ownloaded from

knowledge production can be difficult to observe and measure atthe individual level, so we do not have a well-developed set offacts that can help guide our thinking on a theoretical framework.Finally, we do not understand why knowledge in some fields pro-gresses at a remarkable rate in a short-lived burst, yet stagnatesfor decades in other areas.1
Despite these difficulties, there are clearly countless possibi-lities for spillovers when producing knowledge: the knowledgeproduced by one researcher is both an output and an input intoanother researcher’s production function. As Isaac Newton said,‘‘If I have seen further it is by standing on the shoulders ofgiants.’’
Even if the ideas of a highly qualified single worker spill overto other workers with whom he or she interacts, the overall effectof the interaction can still be deleterious to the productivity ofother workers. In particular, in a world with constraints on thefunding and dissemination of ideas (e.g., a limit on the number offaculty slots, or, more abstractly, a limit on the attention span ofthe potential audience), large and sudden increases in the popu-lation of knowledge producers can result in diminishing marginalproductivity for a preexisting worker. For example, a young aca-demic might appreciate the hiring of a new illustrious colleaguein, say, mathematics because it may improve his own ideas. Atthe same time, the young academic realizes that in a world withlimited funding and limited research opportunities, his own ser-vices and research now become relatively less important to hisdepartment and the field in general.
A number of recent empirical studies have attempted toquantify the net impact of the presence of a highly skilledworker on the ideas and output of other workers. For example,Waldinger (2010) examines the productivity of the doctoral stu-dents who were left behind when superstar scientists leftGermany during the Nazi era. He finds that these students suf-fered in the absence of their highly skilled mentors. In more
1. Jones (2005, 1107) succinctly summarizes the difficulties: ‘‘While we havemade much progress in understanding economic growth in a world where ideas areimportant, there remain many open, interesting research questions. The first is,‘What is the shape of the idea production function?’ How do ideas getproduced? . . . The current research practice of modeling the idea production func-tion as a stable Cobb-Douglas combination of research and the existing stock ofideas is elegant, but at this point we have little reason to believe that it is correct.’’See also Romer (1986, 1990), Lucas (1988), and Jones and Romer (2010).
QUARTERLY JOURNAL OF ECONOMICS1144
at Harvard U
niversity on August 21, 2012
http://qje.oxfordjournals.org/D
ownloaded from
recent work, however, Waldinger (2012) finds that the colleaguesleft behind in Germany did not experience a loss in productivitywhen the superstars left. Finally, Azoulay, Zivin, and Wang(2010) document the decreased output suffered by the coauthorsof superstar scientists after the superstars die. They find that thecoauthors become much less productive when the superstar is nolonger able to collaborate. In concluding, they note: ‘‘Although wemeasure the impact of losing a star collaborator, a full accountingof knowledge spillovers would require information on the benefitsthat accrued to the field while the star was alive. We can think ofno experiment, natural or otherwise, that would encapsulate thiscounterfactual’’ (Azoulay, Zivin, and Wang 2010, 580).2
This article attempts to measure the productivity effects ofthe entry of highly skilled scientists in a context where we canobserve the counterfactual of no entry. In particular, we examinethe impact of the influx of renowned Soviet mathematicians intothe global mathematics community. In the period between theestablishment and fall of communism, Soviet mathematics de-veloped in an insular fashion and along very different specializa-tions than North American mathematics. As a result, somemathematicians experienced few potential insights from Sovietmathematics after the collapse of the Soviet Union, whereas otherfields experienced a flood of new mathematicians, theorems, andideas.
We have constructed a data set that contains information onthe authorship of every paper published in mathematics over thepast 70 years.3 These data allow us to document the location,affiliation, and complete publication and citation records of math-ematicians who were active in the Soviet Union and around theworld for the past few decades.
2. Related research on knowledge production includes Furman et al. (2005)and Hunt and Gauthier-Loiselle (2010), and especially Kerr and Lincoln (2010).
3. Mathematical research plays a fundamental role in technological progress.In fact, recent applications of modern academic research papers in mathematicsand related fields (such as theoretical computer science and mathematical physics)to our broader economy are so numerous and diverse that it is impossible to char-acterize them briefly. For a few examples, consider the Rivest-Shamir-Adlemanalgorithm that forms the backbone of Internet encryption; the Reed-Solomonerror correction that makes possible compact discs, deep-space communication,error-free bar codes, and DSL television; and Claude Shannon’s informationtheory, which has been applied everywhere from gambling and investing, to bio-informatics and music, and even to the discovery of new oil fields with seismic oilexploration.
PRODUCTIVITY OF AMERICAN MATHEMATICIANS 1145
at Harvard U
niversity on August 21, 2012
http://qje.oxfordjournals.org/D
ownloaded from

Prior to the collapse of the Soviet Union, there was little col-laboration and only infrequent exchanges between Soviet andWestern mathematicians. In fact, every written communicationwith an American mathematician was opened and read by Sovietauthorities, and special permission was required to publish out-side the Soviet Union. In some eras of the cold war, Soviet viola-tors could be imprisoned (Polyak 2002). After the collapse of theSoviet Union, over 1,000 Soviet mathematicians migrated toother countries, with a large fraction settling in the UnitedStates. In addition, the mathematicians who remained in theSoviet Union became part of the globalized publications marketin mathematics.4
Our empirical analysis demonstrates that the Americanmathematicians whose research programs most overlappedwith that of the Soviets experienced a reduction in productivityafter the entry of Soviet emigres into the U.S. mathematicsmarket. This effect is observed at both tails of the quality distri-bution of mathematicians. First, the likelihood of a competingmathematician producing a ‘‘home run’’ paper fell significantly.Similarly, marginal mathematicians became much more likely tomove to lower quality institutions and exit knowledge productionaltogether. We also find evidence that the students of the Sovietemigres had higher lifetime productivity than other studentsfrom the same institution who had nonemigre advisors.However, this gain was more than offset by the productivityloss suffered by students who had American advisors withSoviet-like research programs.
On aggregate, based on the pre-1992 age-output profile ofAmerican mathematicians, we find that the actual output ofmathematicians with a Soviet-like research program is farbelow what one would have expected. Even though there was anet loss in total output for American mathematicians, this losswas approximately made up by the published output of the Sovietemigres in the United States.
Our analysis also directly confronts a related issue in theknowledge production literature. Knowledge producers interactin both a job market (i.e., the market for selling human capital)and in a publications market (i.e., the market for selling codified
4. Abramitzky and Sin (2011) provide a novel analysis of how the collapse ofSoviet communism led to a diffusion of knowledge to and from the West and theformer Soviet Union.
QUARTERLY JOURNAL OF ECONOMICS1146
at Harvard U
niversity on August 21, 2012
http://qje.oxfordjournals.org/D
ownloaded from

knowledge, such as journal articles). The collapse of the SovietUnion provides a unique opportunity to empirically examine therelative importance of each market for determining the net prod-uctivity effect on knowledge producers.
After all, the collapse of the Soviet Union induced manySoviet mathematicians to move to some countries but not toothers, creating competitive pressures in some job markets butnot in others. At the same time, the market for journal space hassome segments that are country-specific and other segments thatcross over geographic boundaries. As a result, mathematicians incountries that did not physically receive many Soviet emigresmay have experienced competition in the journal market,whereas mathematicians in other countries did not experienceincreased competition in either market. The international differ-ences in the post-1992 productivity of mathematicians revealsthat competitive pressures in both the job market and in themarket for codified knowledge are important determinants ofproductivity and of crowd-out effects.
II. Historical Context
After the establishment of the Soviet Union in 1922, Sovietmathematics entered a long period of development independentfrom mathematics in the West. To varying degrees between 1922and 1992, the Soviet government instituted strict controls onwhich scientists could communicate with Western peers, on theparameters of scientific travel, on the acceptable outlets for pub-lication, and on access to Western materials.5 Just as speakers of
5. Polyak (2002, 2) gives a firsthand account of the life of mathematiciansbehind the iron curtain. Polyak writes: ‘‘ ‘The iron curtain’ was not only a metaphor,it was a real obstacle to international contacts . . . . When Professor Ya.Z. Tsypkinreceived a letter in the late 1940s from an American reader of his paper, he wassummoned by the KGB and underwent a long investigation there, tottering at theedge of arrest . . . . Another source of difficulties for researchers was the mania forsecrecy . . . Nobody was allowed to publish any paper without special permissionconfirming that the publication does not contradict numerous security restrictions.All letters abroad (as well as letters from abroad) were opened and inspected.Everybody must have special permission, and a full text of the talk had to beapproved if you were going to an international conference. And working in a clas-sified institution (which was the case for many experts in mathematical program-ming), complicated the situation drastically. . . . The situation in the 1940s tomid-1950s was the worst. Malevolent intent by the authorities could lead a re-searcher to the GULAG. The period 1955–1970 was the least oppressive,
PRODUCTIVITY OF AMERICAN MATHEMATICIANS 1147
at Harvard U
niversity on August 21, 2012
http://qje.oxfordjournals.org/D
ownloaded from
one language, when separated geographically for many gener-ations, eventually develop separate and different dialectsthrough natural changes over time, so Western and Easternmathematicians, separated by Stalinist and cold war political in-stitutions, developed under different influences to the point ofachieving very different specializations across the fields ofmathematics.
An important event that cemented the isolation of Sovietmathematicians was the Luzin affair. In 1936, Nikolai Luzin, amathematician at Moscow State University and a member of theUSSR Academy of Sciences, became the target of a political cam-paign. The allegations included not only the usual charge of pro-moting anti-Soviet propaganda but also the specific accusationthat Luzin saved his main academic results for publications inforeign outlets. Although Stalin eventually spared Luzin’s life,the impact on Soviet mathematics was swift and dramatic: ‘‘Themain visible consequence of the Luzin affair was that, from thisprecise moment, Soviet mathematicians began to publish almostexclusively in Soviet journals and in Russian.’’6
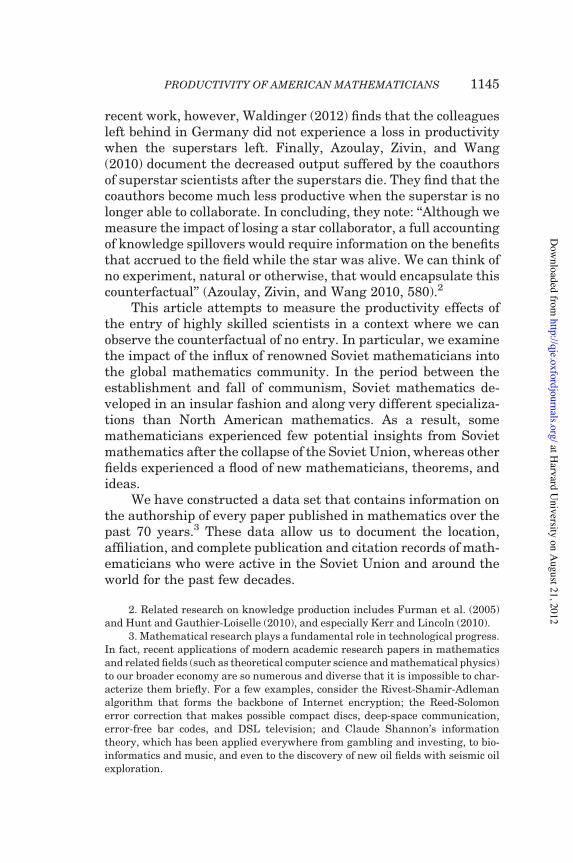
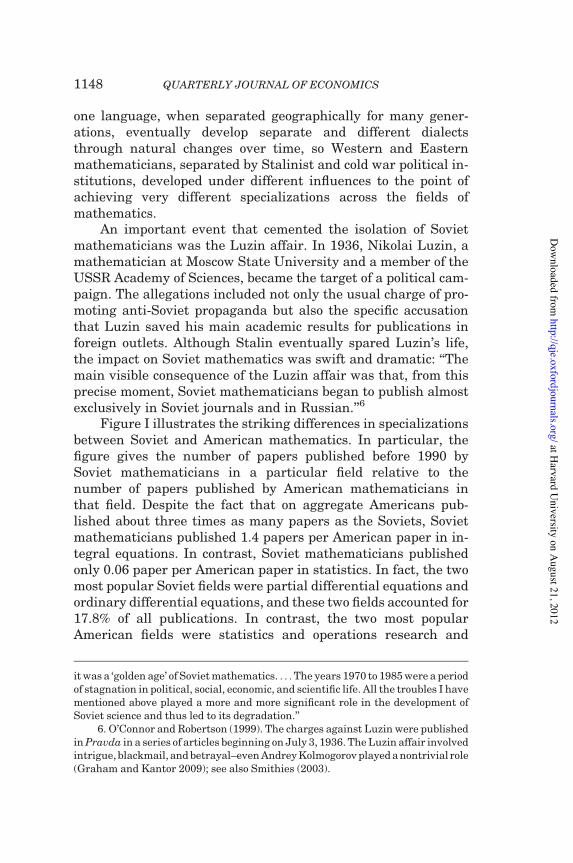
Figure I illustrates the striking differences in specializationsbetween Soviet and American mathematics. In particular, thefigure gives the number of papers published before 1990 bySoviet mathematicians in a particular field relative to thenumber of papers published by American mathematicians inthat field. Despite the fact that on aggregate Americans pub-lished about three times as many papers as the Soviets, Sovietmathematicians published 1.4 papers per American paper in in-tegral equations. In contrast, Soviet mathematicians publishedonly 0.06 paper per American paper in statistics. In fact, the twomost popular Soviet fields were partial differential equations andordinary differential equations, and these two fields accounted for17.8% of all publications. In contrast, the two most popularAmerican fields were statistics and operations research and
it was a ‘golden age’ of Soviet mathematics. . . . The years 1970 to 1985 were a periodof stagnation in political, social, economic, and scientific life. All the troubles I havementioned above played a more and more significant role in the development ofSoviet science and thus led to its degradation.’’
6. O’Connor and Robertson (1999). The charges against Luzin were publishedin Pravda in a series of articles beginning on July 3, 1936. The Luzin affair involvedintrigue, blackmail, and betrayal–even Andrey Kolmogorov played a nontrivial role(Graham and Kantor 2009); see also Smithies (2003).
QUARTERLY JOURNAL OF ECONOMICS1148
at Harvard U
niversity on August 21, 2012
http://qje.oxfordjournals.org/D
ownloaded from
mathematical programming, and these two fields accounted for15.6% of all American publications.7
The primary influences behind the development of bothSoviet and Western mathematics were history dependence and,to a lesser extent, state funding. In the Soviet Union, for example,the mathematical genius Andrey Kolmogorov developed
FIGURE I
Ratio of Soviet Papers to American Papers, by Field, 1984–1989
The paper counts are obtained directly from the Web-based AMSMathematical Reviews database (MathSciNet) and consist of all papers pub-lished by mathematicians affiliated with Soviet or American institutionsbetween 1984 and 1989.
7. The third most popular field, quantum theory, was the same in both coun-tries, accounting for 6.8% and 5.9% of publications in the Soviet Union and UnitedStates, respectively. The fourth and fifth most popular fields in the Soviet Unionwere probability theory and stochastic processes (6.1%) and global analysis, ana-lysis on manifolds (4.8%). The respective fields in the United States were computerscience (4.5%) and numerical analysis (4.3%).
PRODUCTIVITY OF AMERICAN MATHEMATICIANS 1149
at Harvard U
niversity on August 21, 2012
http://qje.oxfordjournals.org/D
ownloaded from

important results in the area of probability and stochastic pro-cesses beginning in the 1930s. In a scenario common throughoutSoviet mathematical history, he established a ‘‘school’’ at MoscowState University, attracting some of the best young minds overthe next four decades, such as the teenage prodigy VladimirArnold in the 1950s. Arnold himself quickly solved Hilbert’sfamous ‘‘Thirteenth Problem’’ and initiated the field of symplectictopology. The large amount of Soviet work in these areas even inthe 1980s can be seen in Figure I under the subject headings‘‘Mechanics of particles and systems,’’ ‘‘Global analysis, analysison manifolds,’’ and ‘‘Ordinary differential equations.’’ Becausethe United States did not have the unique Kolmogorov-Arnoldcombination, the amount of work done by American mathemat-icians in these subfields was far less than would have been ex-pected given the size and breadth of the American mathematicscommunity.
FIGURE I
Continued.
QUARTERLY JOURNAL OF ECONOMICS1150
at Harvard U
niversity on August 21, 2012
http://qje.oxfordjournals.org/D
ownloaded from

In the United States, however, researchers like John Milnorat Princeton University and Raoul Bott at Harvard Universitydeveloped key ideas in the topology of manifolds in the 1950s.Their students and collaborators produced an enviable body ofresearch in manifolds and cell complexes, which, because of thelack of a similar chance originator in their country, was neverreplicated in the Soviet Union.8
Finally, Soviet funding was limited (in comparison to theUnited States) in fields requiring experiments or equipment(Howe 1990). Figure I also demonstrates that as late as the1980s, this resulted in a large discrepancy between Americanand Soviet specialization in computer science and related fields.9
We exploit the fact that Soviet and American mathemat-icians did not choose their specializations in the 1970s and1980s in the belief that they would soon have an opportunity tocoauthor papers, compete for pages in the same journals, andapply for jobs at the same universities. The consensus amongboth Soviet and American experts almost immediately beforethe collapse of communism was that the political system of theexisting Soviet state was not ripe for a sudden change. WalterLaqueur (1996, 65) describes how in the Soviet Union itself,‘‘most believed the system was so strong that it would neveressentially change. Others, more optimistic, thought thatchange was perhaps possible over a long period–decades, ormore likely, generations.’’ In the West, Laqueur (1996, 99) reportsthat Sovietologists were taken by surprise: ‘‘The U.S. government(like most others) had enormously overrated Soviet economic per-formance. . . . According to a study published as late as 1988 by awell-known Western economist specializing in the Soviet Union,Soviet citizens enjoyed ‘massive economic security’ . . . the
8. Algebraic geometry, a field of relative U.S. excellence, provides anotherexample of the persistence of history dependence. The Summary Report of thePanel on Soviet Mathematics (Lefschetz 1961, IV-2) explains: ‘‘in no part of math-ematics is the Soviet Union weaker than in algebraic geometry. No significantcontributions have ever . . . come from there.’’ This was not only true in 1961, butas Figure I demonstrates, it remained true in the 1980s.
9. Personal communication with Lawrence Shepp, who during a long career atBell Labs was in contact with some Soviet mathematicians as early as 1964, sug-gests that the fact that Soviet mathematicians avoided the most popular U.S. field(statistics) had little to do with funding. Specializing in statistics was politicallydangerous in the Soviet Union, as it would require a great deal of massaging ofsensitive data.
PRODUCTIVITY OF AMERICAN MATHEMATICIANS 1151
at Harvard U
niversity on August 21, 2012
http://qje.oxfordjournals.org/D
ownloaded from

consensus was that the Soviet Union was not on the verge ofeconomic bankruptcy and political disintegration.’’
Thus, the divergent interests and capabilities of Soviet andAmerican mathematics that had emerged in earlier decades werenot likely to have been modified in the 1980s by any serious beliefthat the Soviet isolation would soon end. As Figure II shows, thenegligible pre-1990 rate of coauthorship between mathematiciansreporting Soviet research addresses and mathematicians report-ing U.S. addresses does not engender the hope that the number ofsuch collaborations would suddenly explode.
Around 1990, as the political situation changed in the SovietUnion, a large number of Soviet mathematicians began to comeinto regular contact with Western mathematicians through visitsand immigration. According to American mathematicians whowitnessed this sudden increase in contact opportunities, theeffect on U.S. mathematics was immediate. In 1990, the NewYork Times reported (Kolata 1990):
American scientists say they have benefited im-mensely from the [recent] Soviet visitors. . . . PersiDiaconis, a mathematician at Harvard, said: ‘‘It’sbeen fantastic. You just have a totally fresh set of
FIGURE II
Trend in Coauthorship Rate between Soviet and American Mathematicians
The denominator of this fraction is the number of papers published eachyear where at least one author reports an American affiliation. The numeratoris the number of such papers in which one other author also reports a Sovietaffiliation.
QUARTERLY JOURNAL OF ECONOMICS1152
at Harvard U
niversity on August 21, 2012
http://qje.oxfordjournals.org/D
ownloaded from

insights and results.’’ Dr. Diaconis said he recentlyasked [Soviet mathematician] Dr. Reshetikhin forhelp with a problem that had stumped him for20 years. ‘‘I had asked everyone in America who hadany chance of knowing’’ how to solve a problem. . . . Noone could help. But . . . Soviet scientists had done a lotof work on such problems. ‘‘It was a whole new worldI had access to,’’ Dr. Diaconis said. ‘‘Together, we’ll beable to solve the problem.’’
Inevitably, the American mathematical community alsoexperienced increased competition in hiring.10 The AmericanMathematical Society’s 1991–1992 Academic Hiring Survey re-ports that ‘‘Citizens of Eastern European countries and theformer Soviet Union accounted for 13% of all newly-hired facultyand 15% of the tenured and tenure-eligible new hires’’ (McClure1992, 311). The report also identifies ‘‘increased numbers ofhighly qualified recent U.S. immigrants seeking employment inacademia’’ as a leading cause of the unprecedented 12% un-employment rate of new American mathematics Ph.Ds. in 1991(McClure 1992, 312).11 Figure III illustrates the employmenttrends of newly minted doctorates from North American institu-tions. It is evident that there was a dramatic increase in theunemployment rate (as well as a dramatic decrease in the prob-ability of obtaining a position in research universities) at thesame time the Soviet influx was occurring.12
It is clear that the ability to communicate and collaborate ona one-to-one basis (and especially emigrate) increased greatlyafter the collapse of the Soviet Union. As Diaconis discovered,ideas and knowledge became much easier to share. The eco-nomics of innovation literature distinguishes between twobroad types of knowledge: codified knowledge and tacit know-ledge. Codified mathematical knowledge is recorded in journal
10. For example, Soviet mathematician Nicolai Reshetikhin not only helpedDiaconis with his puzzle but also accepted a job as a visiting and assistant professorat Harvard University from 1989 through 1991.
11. At the same time that the unemployment rate of newly minted mathem-aticians was rising rapidly in the early 1990s, the economy-wide unemploymentrate for college graduates was falling from 3.2% to 2.2% between 1992 and 1996.
12. The exodus of key scientific personnel from the former Soviet Union to theWest led George Soros to establish a program that provided research funds to sci-entists who chose to remain; see Ganguli (2010) for an analysis of the impact of thisprogram on career choices.
PRODUCTIVITY OF AMERICAN MATHEMATICIANS 1153
at Harvard U
niversity on August 21, 2012
http://qje.oxfordjournals.org/D
ownloaded from

articles and books, whereas tacit knowledge is part of the unco-dified human capital of mathematical practitioners.13
Both codified and tacit mathematical knowledge were costlyto share during the Soviet era, even though translations of Sovietpapers in academic journals were often available.14 Moreover,
FIGURE III
Employment Trends for New Mathematics Doctorates Granted by NorthAmerican Institutions
Source: Data compiled by the authors from American Mathematical Society(various issues).
13. ‘‘Typically, new knowledge and expertise have a broad tacit dimension,meaning that they are neither articulated nor codified. Tacit knowledge resides inpeople, institutions, or routines’’ (Foray 2004, 17–18).
14. The National Science Foundation, North American scientific societies, andprivate businesses had begun translating Soviet scientific journals from Russianinto English as far back as 1949 (O’Dette 1957). It would seem, therefore, that thecollapse of the Soviet Union represents but a trivial change in the cost of obtainingaccess to the specific type of codified knowledge contained in journal articles. Butthe citations results described below suggest that Americans may not have read asmuch Soviet work as would be expected, and history records famous examples ofAmerican unfamiliarity with important Soviet journal articles that were availableduring the cold war: ‘‘Even when high-quality translations are readily available,the information can still be lost if they are not read. . . . In January 1962, theNational Aeronautics and Space Administration announced that Explorer XII, asatellite launched in August 1961, had discovered a new radiation belt with an‘unexpected boundary’ at 40,000 miles from the earth. In fact, the same belt wasdiscovered by Soviet rockets in 1959 and this was reported in translations
QUARTERLY JOURNAL OF ECONOMICS1154
at Harvard U
niversity on August 21, 2012
http://qje.oxfordjournals.org/D
ownloaded from

some of the codified knowledge remained untranslated. Sovietscientists often published their best work in books: ‘‘TheRussians are prolific producers of books . . . and the consensus ofexperts is that the best Russian authors reserve some of their bestwork for books which often constitute first publication of import-ant research information’’ (O’Dette 1957, 581). Even thoughmathematics books contained some of the most importantSoviet results, Abramitzky and Sin (2011) report that the trans-lation rate of hard-science Eastern bloc books into English wasextremely low. After the collapse of the Soviet Union, tacit math-ematical knowledge and an easy introduction to the codifiedknowledge were as close as a phone call, an unobstructed corres-pondence, or even a knock on the office next door.15
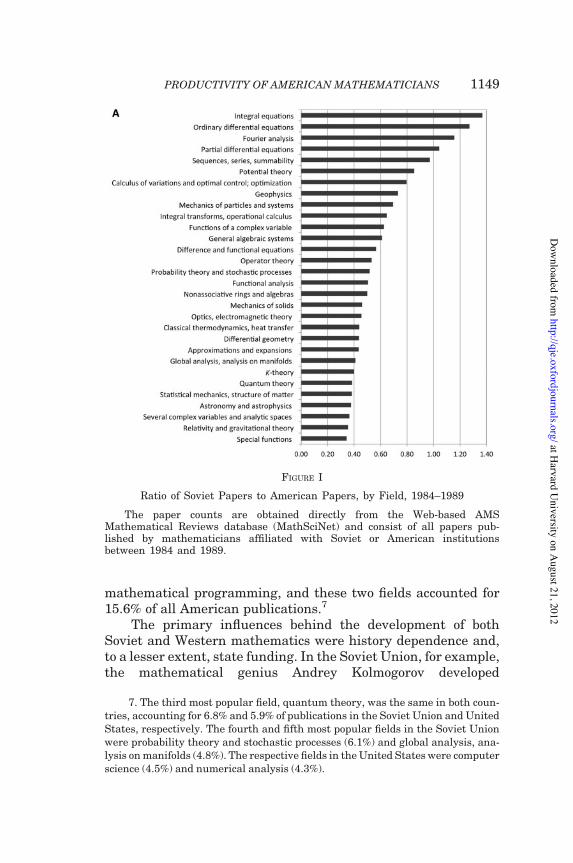
Evidence of this knowledge shock is apparent in the citationtrends of American mathematicians to Soviet and American art-icles. Figures IVA and IVB show the number of citations thatAmerican mathematicians made to other American papersduring the period, as well as the citations Americans made toSoviet papers (defined as those published by an author usinga Soviet affiliation).16 Both before and after the collapse of theSoviet Union, most American mathematicians exhibit ‘‘homebias,’’ preferring to cite results in other American papers.Considering that the total number of American papers was onlythree times that of the Soviet Union, this home bias is extreme.
of Soviet Physics Dolkady in 1960 and Soviet Astronomy AJ in 1961’’ (Tybulewicz1970, 55–56).
15. The inadequacy of the international phone infrastructure during theSoviet era is legendary, making scientific collaboration harder, but undoubtedlymaking the KGB’s job of hampering such collaboration easier: ‘‘The internationaltelephone transit center in Moscow . . . has a capacity of 1,500 circuits. . . . This ex-change has tohandle all the international calls fromthe RSFSR [Russian Republic],as well as calls in transit from the other republics and from a number of EasternEuropean and other socialist countries. Since it allows a maximum of around 800outgoing calls at any one time, it constitutes a major bottleneck in communicationsbetween the USSR and the rest of the world. Moreover, most circuits are dedicatedto links with Eastern European and other socialist countries; there are, for exampleonly 40 circuits for calls to the United Kingdom, 25 to France and 16 to the UnitedStates’’ (IMF et al. 1991, 128). See also Ganley (1996, 19).
16. Because an author’s geographic location is only rarely available before1978, we construct the statistic as follows. The numerator is the number of citationsto American (or Soviet) papers written between 1978 and year t made by Americanpapers written between 1978 and t. The denominator is the total number of cit-ations to papers with a valid research address written between 1978 and t made byAmerican papers written during that time.
PRODUCTIVITY OF AMERICAN MATHEMATICIANS 1155
at Harvard U
niversity on August 21, 2012
http://qje.oxfordjournals.org/D
ownloaded from
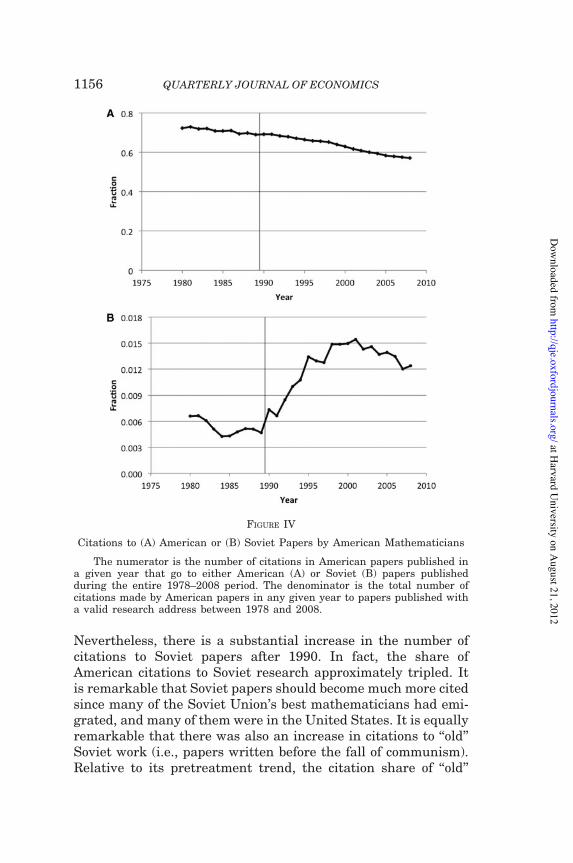
Nevertheless, there is a substantial increase in the number ofcitations to Soviet papers after 1990. In fact, the share ofAmerican citations to Soviet research approximately tripled. Itis remarkable that Soviet papers should become much more citedsince many of the Soviet Union’s best mathematicians had emi-grated, and many of them were in the United States. It is equallyremarkable that there was also an increase in citations to ‘‘old’’Soviet work (i.e., papers written before the fall of communism).Relative to its pretreatment trend, the citation share of ‘‘old’’
FIGURE IV
Citations to (A) American or (B) Soviet Papers by American Mathematicians
The numerator is the number of citations in American papers published ina given year that go to either American (A) or Soviet (B) papers publishedduring the entire 1978–2008 period. The denominator is the total number ofcitations made by American papers in any given year to papers published witha valid research address between 1978 and 2008.
QUARTERLY JOURNAL OF ECONOMICS1156
at Harvard U
niversity on August 21, 2012
http://qje.oxfordjournals.org/D
ownloaded from

Soviet papers out of the citations to all papers became 40% higherafter the fall.17
In sum, the collapse of the Soviet Union was associated witha decrease in the cost of accessing both codified and tacit know-ledge, and the resulting diaspora of Soviet mathematicians after1992 led to both a mathematical labor supply shock and a math-ematical knowledge shock in many countries.
III. Data and Summary Statistics
Our data are drawn from three distinct, related sources. TheSupplementary Data Appendix gives a more detailed descriptionof the data sets and the construction of the samples.
First, the American Mathematical Society (AMS) provided uswith a database that reports the number of papers published byevery mathematician by field and year.18 In addition to the infor-mation on the number of papers, the AMS data report the math-ematician’s institutional affiliation at the time the paper waspublished, as well as the location of the affiliation. The AMS,however, only began to collect the affiliation information on asystematic basis around 1984, so affiliation and location are nottypically available for earlier papers. The AMS database also con-tains information on the number of citations received by thepapers, but the AMS citation data are incomplete. In particular,it only counts citations in a limited number of journals (whichinclude the most important journals in mathematics) and onlyreports the post-2000 citations received by a paper (regardlessof when the paper was published).
The AMS database has two features that make it invaluablefor the type of empirical analysis that we conduct in this article.
17. To calculate the frequency of citations made by American papers topre-1990 Soviet papers, we calculated the following fraction: the denominator iscitations made by American papers published each year to any papers with identi-fiable research addresses written between 1978 and 1989; the numerator is thenumber of such citations to papers that had at least one author in the SovietUnion. We then estimated a simple regression of the log citation share on year,year squared, and a post-1990 indicator variable. The model’s fit is improved sub-stantially by the inclusion of the post-1990 dummy variable, and its coefficientimplies a 40% increase in American attention to pre-1990 Soviet work after thecollapse of the Soviet Union.
18. The AMS file provided to us contains information for all mathematicianswho have published at least one paper since 1939.
PRODUCTIVITY OF AMERICAN MATHEMATICIANS 1157
at Harvard U
niversity on August 21, 2012
http://qje.oxfordjournals.org/D
ownloaded from

First, the AMS devotes significant resources to ensure that everyperson who has ever published in mathematics is assigned aunique numerical ID that allows him or her to be distinctly iden-tified from other mathematicians who may share the samename.19 Second, the editors of Mathematical Reviews assigneach publication in mathematics to one of the many fields thatmake up the study of mathematics. The AMS provided us withthe author-year-field information at the two-digit field level, iden-tifying publications by each mathematician in each of 63 differentfields. In short, the AMS data gives us a complete history of amathematician’s publications, affiliations (since around 1984)and fields.
Our second data source is the Thomson Reuters Institute forScientific Information (ISI) Web of Science archive. This archiverecords the titles, publication source, author names, references,and citations of millions of articles from thousands of journalsworldwide. For many articles, the database reports researchand reprint addresses for each author (and the location informa-tion is systematically available since around 1978). Most import-ant, the ISI database contains complete citation information foreach article in a primary set of over 7,000 journals, selected toinclude all of the most important journals in each field. Articles inmarginal journals also appear in the database if they either citean article in the primary database or are cited by such an article.
We purchased the records of all 1.2 million articles in theprimary ISI Web of Science database between 1970 and 2009for the following categories: mathematics, applied mathematics,interdisciplinary applications of mathematics, mathematicalphysics, and statistics and probability. We also purchased therecords of the additional 4.4 million articles that either are refer-enced by these main articles or cite these main articles. The AMSthen gave us permission to conduct a paper-by-paper match of ourISI database with the AMS internal archives. We obtained882,088 matches out of the 1,753,148 journal articles in the
19. As an example of this precision, we learned from personal communicationwith Victor Kac of MIT that after he defected from the Soviet Union in 1977, he hadto publish his work with his Soviet advisor (who remained in the Soviet Union)under the Italian pseudonyms Gatti and Viniberghi, because otherwise the paperwould need special permission from the authorities to be published abroad. Despitethe difference in names betweenGatti andKac, theAMS database correctly lists thearticle under the unique author identifier for Victor Kac.
QUARTERLY JOURNAL OF ECONOMICS1158
at Harvard U
niversity on August 21, 2012
http://qje.oxfordjournals.org/D
ownloaded from

AMS database for the relevant period, just slightly over a 50%match rate.
The AMS/ISI databases provide two alternative measures ofcitation counts for mathematicians. Neither measure is perfect.The AMS citation data is limited in scope; it canvasses only aselect number of journals and only includes the post-2000 cit-ations made to mathematical papers. The ISI citation data hasa much broader scope (many more journals) and counts all cit-ations to a paper (not just those made after 2000). However, ISIcitation counts are the result of an imperfect matching processthat may be missing a sizable number of mathematicians andpapers.20 In fact, the matching process is particularly problem-atic for foreign countries, where the spelling of authors’ namescreates matching difficulties (particularly in the Soviet Union).Not surprisingly, the match rate for papers written between 1984and 1989 by an author using an American affiliation is 59%,whereas the respective match rate for papers written for authorsusing a Soviet affiliation is 16%. Our empirical evidence is robustto the citation measure we use. Nevertheless, we generally usethe ISI citations data when we examine the productivity ofAmerican mathematicians and use the AMS data when wemake international comparisons.
Finally, the Mathematics Genealogy Project (MGP) gave usaccess to their entire archives. The MGP provides detailed infor-mation on doctoral degrees awarded in mathematics since thefourteenth century. The record for each degree contains thename of the mathematician, the name of the advisor, the title ofthe dissertation, and the name and location of the institutiongranting the doctoral degree.
The MGP data, of course, allow a detailed construction of thegenealogical tree in the development of mathematics because itcan completely link any given mathematician to all his or herintellectual ancestors and descendants. Equally important, theAMS and MGP have worked jointly to ensure that the uniqueauthor ID developed by the AMS can identify mathematiciansin the MGP database. By using this unique identifier, we then
20. There is a steady increase in the match rate over time, from about 40% forjournal articles published in the late 1970s to around 75% for articles publishedafter 2002. We are able to match over 90% of the papers for the most prolific math-ematicians during the period, suggesting that some of the missing articles are inmarginal journals not covered by the ISI database. As a result, the citation-weighted count of the number of missing articles is likely to be low.
PRODUCTIVITY OF AMERICAN MATHEMATICIANS 1159
at Harvard U
niversity on August 21, 2012
http://qje.oxfordjournals.org/D
ownloaded from

matched every advisor and student in the MGP data to their pub-lication histories in the AMS data (and to their citations history inthe ISI).
We use these data to construct samples of ‘‘active’’ Americanmathematicians and Soviet emigres. The population of mathem-aticians who were active prior to the collapse of the Soviet Unionis given by the sample of persons who published at least one paperbetween 1970 and 1989.21 We use the AMS or ISI data to estab-lish the location of the affiliations associated with the variouspublications in the mathematician’s history. A ‘‘predominantly’’American mathematician is someone who used an American af-filiation more than half the time in the pre-1990 period.22 If theAMS/ISI data do not contain any usable information on the math-ematician’s affiliations, we use the MGP data to determine thecountry where the mathematician received his or her doctoraldegree. Prior to 1978, over 85% of mathematicians who receivedtheir doctoral degrees from an American institution were eitherU.S. citizens or permanent residents. Moreover, 65.3% of thesmall group of doctoral recipients who were temporary residentsstated that they intended to stay in the United States.23 Hence,we supplement the sample of predominantly American mathem-aticians by also including persons who, in the absence of anyspecific affiliation information between 1978 and 1989, receivedtheir doctoral degree from an American institution between 1960and 1978.
The definition of the universe of Soviet mathematicians fol-lows analogously. We first use the AMS or ISI data to determine ifthe mathematician reports a Soviet affiliation. We classifyanyone who used a Soviet affiliation at least half the time priorto 1989 as a ‘‘Soviet mathematician.’’ In the absence of any affili-ation data, we again supplement the sample by including all themathematicians who received their doctoral degree from a Sovietinstitution between 1960 and 1989. From this universe, we thendefine the subsample of Soviet emigres as the group whose modal
21. In addition, we restrict the sample to mathematicians whose first publica-tion appeared in print in or after 1940.
22. More precisely, the mathematician used an American affiliation in morethan half of the papers published prior to 1990.
23. These statistics are calculated using the National Science FoundationSurvey of Earned Doctorates, an annual survey that contains demographic infor-mation for the recipient of every doctoral degree awarded in the United States since1957.
QUARTERLY JOURNAL OF ECONOMICS1160
at Harvard U
niversity on August 21, 2012
http://qje.oxfordjournals.org/D
ownloaded from
affiliation after 1992 was in a country outside the geographicboundaries of the former Soviet Union.24
These definitions yield a preexisting population of 29,392 pre-dominantly American mathematicians and 12,224 Soviet math-ematicians. We also estimate that 1,051 of these Sovietmathematicians emigrated after the collapse of the SovietUnion, with 336 of the emigres moving to the United States.
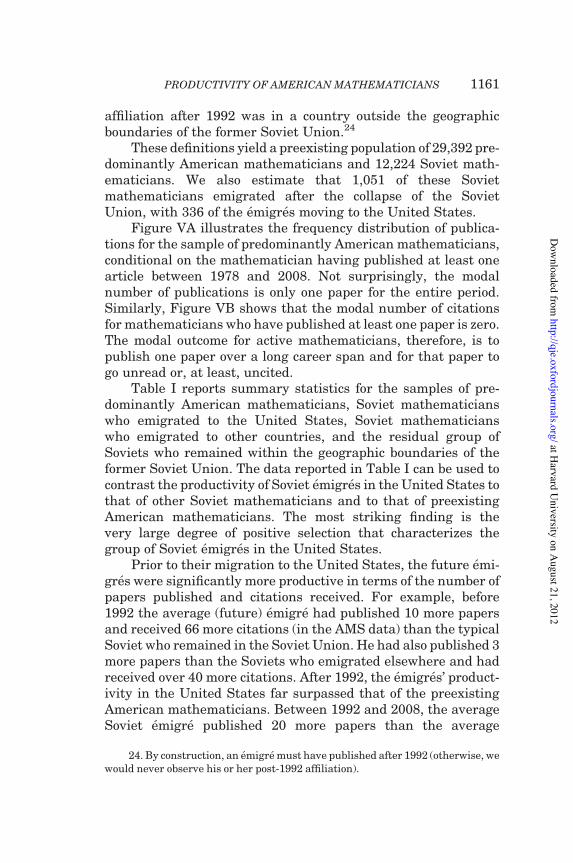
Figure VA illustrates the frequency distribution of publica-tions for the sample of predominantly American mathematicians,conditional on the mathematician having published at least onearticle between 1978 and 2008. Not surprisingly, the modalnumber of publications is only one paper for the entire period.Similarly, Figure VB shows that the modal number of citationsfor mathematicians who have published at least one paper is zero.The modal outcome for active mathematicians, therefore, is topublish one paper over a long career span and for that paper togo unread or, at least, uncited.
Table I reports summary statistics for the samples of pre-dominantly American mathematicians, Soviet mathematicianswho emigrated to the United States, Soviet mathematicianswho emigrated to other countries, and the residual group ofSoviets who remained within the geographic boundaries of theformer Soviet Union. The data reported in Table I can be used tocontrast the productivity of Soviet emigres in the United States tothat of other Soviet mathematicians and to that of preexistingAmerican mathematicians. The most striking finding is thevery large degree of positive selection that characterizes thegroup of Soviet emigres in the United States.
Prior to their migration to the United States, the future emi-gres were significantly more productive in terms of the number ofpapers published and citations received. For example, before1992 the average (future) emigre had published 10 more papersand received 66 more citations (in the AMS data) than the typicalSoviet who remained in the Soviet Union. He had also published 3more papers than the Soviets who emigrated elsewhere and hadreceived over 40 more citations. After 1992, the emigres’ product-ivity in the United States far surpassed that of the preexistingAmerican mathematicians. Between 1992 and 2008, the averageSoviet emigre published 20 more papers than the average
24. By construction, an emigre must have published after 1992 (otherwise, wewould never observe his or her post-1992 affiliation).
PRODUCTIVITY OF AMERICAN MATHEMATICIANS 1161
at Harvard U
niversity on August 21, 2012
http://qje.oxfordjournals.org/D
ownloaded from
American, and those papers received 143 more citations. In short,the Soviet emigres originated in the upper tail of the skill distri-bution of mathematicians in the Soviet Union and quickly movedinto the upper tail of the skill distribution in the American math-ematics community.
Table I also documents that the Soviet emigres differ inother dimensions. Consider, for example, the breadth of a
FIGURE V
Frequency Distribution of Output for American Mathematicians
The sample consists of mathematicians who were predominantly affiliatedwith an American institution before 1990 and who published at least one paperbetween 1978 and 2008. The maximum number of papers is 801, and the max-imum number of (ISI) citations is 31,962.
QUARTERLY JOURNAL OF ECONOMICS1162
at Harvard U
niversity on August 21, 2012
http://qje.oxfordjournals.org/D
ownloaded from

mathematician’s interests, as defined by the number of fields inwhich the mathematician has published over his or her career.The median number of fields of publication for both the Americanmathematicians and the Soviet mathematicians who remained inthe Soviet Union is 2.0. In contrast, the median number of fieldsfor Soviet emigres in the United States is 5.5. It is very unusualfor a mathematician to publish in more than five distinct fields,
TABLE I
SUMMARY STATISTICS FOR SAMPLES OF AMERICAN AND SOVIET MATHEMATICIANS
Variable
Group of mathematicians
Americans
Sovietemigresto U.S.
Sovietemigreselsewhere
All otherSoviets
Number of mathematicians 29,392 336 715 11,173Papers published, 1978–1991
Mean papers per mathematician 6.7 17.8 14.6 8.1Median papers 3.0 13.0 10.0 5.0Maximum number of papers 232.0 104.0 152.0 180.0
Papers published, 1992–2008Mean papers per mathematician 6.8 27.2 28.8 7.6Median papers 1.0 21.0 22.0 1.0Maximum number of papers 768.0 128.0 317.0 311.0
Citations, AMS, 1978–1991Mean citations per mathematician 29.1 74.6 32.8 8.6Median citations 1.0 10.0 6.0 0.0Maximum number of citations 5550.0 1276.0 1441.0 2928.0
Citations, AMS, 1992–2008Mean citations per mathematician 33.6 177.4 110.3 13.4Median citations 0.0 62.0 37.0 0.0Maximum number of citations 3404.0 1709.0 1988.0 1287.0
Citations, ISI, 1978–1991Mean citations per mathematician 110.2 185.1 79.8 25.3Median citations 20.0 25.5 11.0 3.0Maximum number of citations 20,274.0 7232.0 3040.0 3054.0
Citations, ISI, 1992–2008Mean citations per mathematician 52.1 209.0 156.2 27.3Median citations 0.0 88.5 60.0 0.0Maximum number of citations 11,688.0 3371.0 4442.0 1258.0
Median number of fields 2.0 5.5 5.0 2.0Percent first published after 1980 45.2 40.5 46.7 48.8
Notes: The sample consists of ‘‘active’’ mathematicians who published at least one paper between 1970and 1989. An American mathematician is someone who was predominantly affiliated with an Americaninstitution prior to 1989, and a Soviet mathematician is someone who was predominantly affiliated with aSoviet institution prior to 1989. The post-1992 modal affiliation of a Soviet emigre is located outside thegeographic boundaries of the former Soviet Union.
PRODUCTIVITY OF AMERICAN MATHEMATICIANS 1163
at Harvard U
niversity on August 21, 2012
http://qje.oxfordjournals.org/D
ownloaded from

and only a small (and select) group of American mathematiciansdo it.25
The Soviet emigres in the United States are also somewhatolder. Nearly 40% of the emigres received their degree after 1980.In contrast, 45% to 50% of American and other Soviet mathem-aticians received their degree after 1980.
Finally, Figure VI illustrates how the entry of the emigresinto the American mathematics community affected the supply ofpreexisting mathematicians in different fields differently. The‘‘supply shock’’ is calculated separately for two different types offields: Soviet-style and American-style fields. Soviet-style fields
FIGURE VI
Fraction of Publications Published by Soviet Emigres, by Type of Field
The U.S.-style fields consist of the bottom 10 fields in Figure I (those withthe highest ratios of pre-influx American papers to pre-influx Soviet papers),whereas the Soviet-style fields consist of the top 10 fields in Figure I (thosewith the lowest ratios). The denominator of the share of output is the numberof papers in the given subfields published in the United States by mathemat-icians who were never affiliated with a Soviet institution. The numerator isthe number of papers in the given subfield published in the United States bymathematicians who were active before 1990 and had a former Sovietaffiliation.
25. American mathematicians who publish in many fields are far more prolificthan those who specialize in a small number of fields. On average, mathematicianswho published in only one or two fields published a total of 6.1 papers between 1978and 2008. The average total number of papers for mathematicians who published inat least 10 fields is 92.2.
QUARTERLY JOURNAL OF ECONOMICS1164
at Harvard U
niversity on August 21, 2012
http://qje.oxfordjournals.org/D
ownloaded from

are the 10 most relatively popular fields in the Soviet Union (i.e.,the 10 fields at the top of Figure I), whereas American-style fieldsare the 10 most relatively popular fields in the United States (i.e.,the 10 fields at the bottom of Figure I). We then estimated theoutput share of Soviet papers in each of these categories byyear.26
Figure VI shows that the supply shock, as defined by thefraction of total papers published by Soviet emigres, was verylarge for the fields emphasized by preshock Soviet mathemat-icians and was very small for the fields that were dominated byAmerican mathematicians. The fraction of papers published inthe United States by Soviet emigres in ‘‘Soviet-style’’ fields rosefrom a negligible fraction before 1992 to about 12%. In contrast,the fraction of papers published by the Soviet emigres in‘‘American-style’’ fields was below 4.0% throughout thepost-1992 period. In sum, not all American mathematicianswere equally affected by the Soviet influx, and this differentialshock provides the strategy for identifying the productivityimpact of the collapse of the Soviet Union on Americanmathematics.
IV. Measuring the Productivity Impact
We now examine the extent to which ‘‘field overlap’’ betweenSoviet and American mathematicians altered the productivity ofthe latter after the emigres arrived.
There are many channels through which such productivityeffects can arise. The flood of new ideas and theorems could per-haps have spawned a new golden age as the preexisting Americanmathematicians digested and incorporated the new knowledgeinto their research agendas. At the same time, however, the
26. Specifically, the denominator of each fraction is the number of papers in thegiven subfields published in the United States by authors who were active before1990 but never had a Soviet affiliation. The numerator of each fraction is thenumber of papers in the given subfield published in the United States by authorswho were active before 1990 and had a former Soviet affiliation. A small group of‘‘defector’’ Soviets arrived before 1990, mostly in the late 1970s to early 1980s. Thisgroup was only about one-tenth the size of the group of that arrived after the col-lapse of the Soviet Union. Figure VI includes the paper-weighted impact of thesedefectors during their time in the United States, confirming that thepaper-weighted size of the influx of Soviet emigres after the fall of communismwas far greater than that of the prior arrivals of defectors.
PRODUCTIVITY OF AMERICAN MATHEMATICIANS 1165
at Harvard U
niversity on August 21, 2012
http://qje.oxfordjournals.org/D
ownloaded from

total number of mathematics faculty jobs, as well as the fractionof resources that deans and administrators allocate amongthe various subfields of mathematics, is likely constrained andrelatively inelastic. The sudden presence of experienced andhighly productive Soviet emigres who may compete for jobswith newly minted doctorates would then almost certainly havea ‘‘crowd-out’’ effect on the paid research jobs that Americanmathematicians would have otherwise filled.27
The identification strategy is built on comparing differentgroups of American mathematicians with each other over time:those who had worked on problems where the Soviets could offerassistance and/or competition, versus those who had worked onproblems the Soviets knew little about. To quantify the degree ofexposure, we calculate an index reflecting the field ‘‘overlap’’ be-tween the pre-1990 publication record of each American mathem-atician and that of the Soviets.
We use three alternative indices to demonstrate the robust-ness of our empirical findings. The first index is simply a correl-ation coefficient calculated for each American mathematician inour data. Let aij be the share of papers that mathematician ipublished in field j, and let sj be the share of all Soviet paperspublished in field j before the collapse of the Soviet Union.28 Ourfirst index is simply the correlation coefficient ri between thesetwo vectors.
A second index measures the ‘‘intensity’’ of the overlappingresearch interests. In particular, let Sj be the total number ofpapers written in field j in the Soviet Union. If we calculate thedot product between the vector S and the vector of shares aij foreach American mathematician, the resulting number gives the‘‘effective’’ number of Soviet papers that the typical American
27. There are other sources of scarcity that can create crowd-out effects, suchas the limited attention span of field leaders. There are insurmountable constraintson how much new knowledge a scientist can absorb, so that the location of the‘‘marginal’’ article that gets ignored moves upward in the distribution of publica-tions after the influx of Soviet mathematicians. Reasonably good articles that wouldotherwise have generated some attention will then remain unread and uncited.
28. The share aij is calculated using all papers published by a particular math-ematician between 1960 and 1989; this calculation uses the database the AMSprovided to us. The Soviet share sj is obtained directly from MathSciNet (anonline database maintained by the AMS) and contains papers published between1984 and 1989. As already noted, the AMS began to collect systematic informationon the country of publication only around 1984 (although a few pre-1984 papersreport the affiliation of the author).
QUARTERLY JOURNAL OF ECONOMICS1166
at Harvard U
niversity on August 21, 2012
http://qje.oxfordjournals.org/D
ownloaded from

mathematician would have written, weighted by Soviet prefer-ence. To construct an index that lies between 0 and 1, we dividethe dot product by the number of papers published in the mostpopulated Soviet field. Hence the ‘‘index of intensity’’ is given by:
Ii !
Pj
aijSj
max"Sj#:"1#
Note that this index will be equal to 0 when the American math-ematician publishes in fields where Soviets have never publishedand is equal to 1 when the American mathematician publishesexclusively in the field where the Soviets have done the mostwork.
Finally, we employ the commonly used ‘‘index of similarity’’(Cutler and Glaeser 1997) defined by:
Di ! 1 $ 12
X
j
aij $ sij
!! !!:"2#
The index of similarity equals 1 when there is a perfect overlap inthe relative field distributions between American mathematiciani and the Soviet research program, and 0 when there is totaldissimilarity.29
Table II reports the value of the overlap indices for the mostproductive American mathematicians, with the ranking deter-mined by the number of papers published between 1960 and1989. There is a great deal of dispersion in the various indiceseven among these superstars. The correlation coefficient, for in-stance, ranges from 0 to 0.6, whereas the index of similarityranges from 0.07 to 0.41.
To estimate the net impact of the Soviet influx on the mar-ginal product, yi(t), of American mathematician i in year t, con-sider the regression model:
yi"t# ! !i % !t % Xi"t#" % #"T & Indexi# % "i"t#,"3#
where fi is a vector of individual fixed effects; ft is a vector of yearfixed effects; X is a vector of standardizing variables that includethe mathematician’s years of work experience introduced as a
29. If the complement of the index of similarity (or 1 – D) were calculated for thepooled group of American mathematicians, its value would give the fraction ofAmerican mathematicians who must move across fields to ensure that Americanmathematicians have the same field distribution as the Soviets.
PRODUCTIVITY OF AMERICAN MATHEMATICIANS 1167
at Harvard U
niversity on August 21, 2012
http://qje.oxfordjournals.org/D
ownloaded from

quartic polynomial; T is a dummy variable indicating if the yearfor the particular observation is 1992 or later; and Index is one ofthe three alternative overlap indices defined earlier.30 The stand-ard errors are clustered at the individual level.
We use two alternative dependent variables in the analysis:the number of papers mathematician i published in a particularyear, and the total number of ISI citations received by the paperspublished in that year.31 It is worth noting that the citations dataare truncated because a paper may continue to be cited into thefuture (and some important papers may not have been recognized
TABLE II
AMERICAN MATHEMATICIANS WITH THE LARGEST NUMBER OF PUBLICATIONS, 1960–1989
MathematicianNumberof papers
Correlationcoefficient
Index ofintensity
Index ofsimilarity
Frank Harary 416 –0.039 0.101 0.096Pranab Kumar Sen 318 0.035 0.199 0.090Richard Ernest Bellman 317 0.420 0.339 0.410Ciprian Foias 299 0.295 0.414 0.291Avner Friedman 290 0.629 0.633 0.411Robert E. Kalaba 241 0.272 0.306 0.308Peter C. Fishburn 232 0.157 0.302 0.126Bang-Yen Chen 220 0.009 0.164 0.070Barry Simon 217 0.537 0.580 0.325V. Lakshmikantham 215 0.467 0.633 0.310
Notes: The correlation coefficient, index of intensity, and index of similarity measure each mathem-atician’s research overlap with the Soviet research program for papers published between 1960 and 1989.See the text for the definition of the various indices.
30. Of course, the regression does not include either the value of the overlapindex or the post-1992 indicator variable. The individual fixed effects subsume theperson-specific overlap index, and the period fixed effects subsume the post-1992indicator. The mathematician’s years of work experience is defined as years elapsedsince the mathematician’s first publication. The regressions only include those ob-servations where a mathematician has at most 60 years of potential workexperience.
31. Our treatment of coauthored papers is as follows. Regardless of how manyauthors are responsible for a single paper, each author is given full credit when wecount a mathematician’s number of papers and citations. This approach is requiredby the nature of the AMS data. In particular, we have counts of papers by year, field,and author, and these counts do not allow us to identify all the authors of anyspecific paper. The only exception to this method of treating coauthorships is theconstruction of Figure I (and the baseline field distribution of Soviet mathematicalresearch used in the calculation of the overlap indices), where we obtained the totalnumber of papers by field directly from MathSciNet.
QUARTERLY JOURNAL OF ECONOMICS1168
at Harvard U
niversity on August 21, 2012
http://qje.oxfordjournals.org/D
ownloaded from

by the end of our sample period).32 Note, however, that the inclu-sion of year fixed effects in equation (3) helps control for thisproblem.
The identification strategy used by the regression model in(3) can be easily described. We are examining how the researchoutput of mathematician i changed after 1992, when Soviet andAmerican mathematicians began to interact both physically andintellectually. The coefficient y measures whether the marginalproduct of mathematicians who had pursued a Soviet-style re-search agenda changed after 1992, when the Soviet ideas beganto be disseminated to a wider audience in the United States andSoviet mathematicians began to publish their ideas in the samejournals and compete for jobs in the same institutions asAmerican mathematicians. If the externalities arising from theentry of the highly skilled Soviets specializing in a relativelysmall set of mathematical fields are weak or nonexistent, wewould expect that the American ‘‘intellectual competitors’’ ofthe Soviets would become less productive as a result of theinflux and the coefficient y would be negative.
The control group in our empirical exercise consists ofAmerican mathematicians who prior to 1990 did not specializein the fields dominated by the Soviets. This control group not onlyexperienced a smaller Soviet influx post-1992 (see Figure VI), italso did not gain directly from the influx of new ideas.Specifically, the exposure to Soviet ideas was unlikely to beuseful to American mathematicians working in U.S.-dominatedfields: out of all the references cited by articles in the top 10 U.S.dominated fields, only 5% of these references are to articles inSoviet-dominated fields. Therefore, there is little evidence of com-plementarities across the intellectually distant fields pursued bySoviet and American mathematicians.
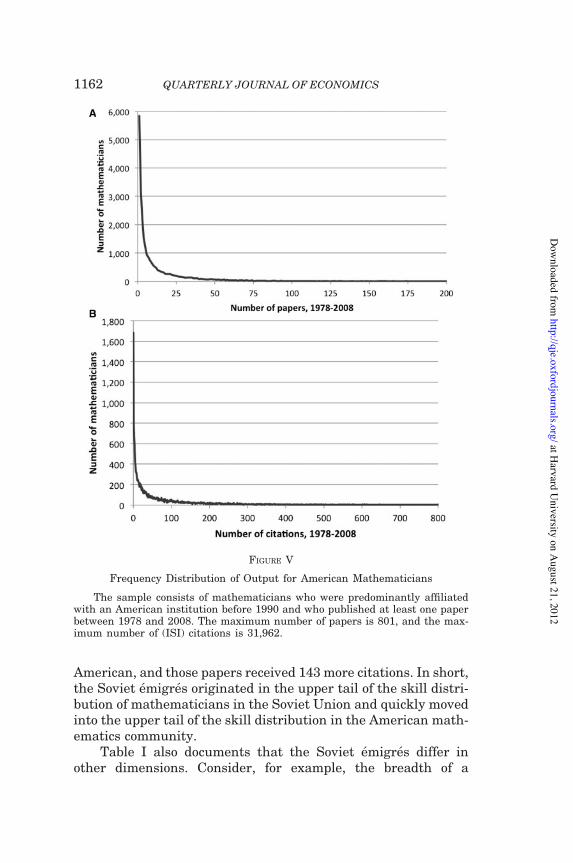
Table III reports the estimates of the coefficient y obtainedfrom a variety of different regression specifications. In addition tothe two dependent variables and three measures of the overlapindex, we estimated the regression on two alternative samples ofAmerican mathematicians: the sample of predominantlyAmerican mathematicians defined earlier, as well as a sampleof ‘‘exclusively’’ American mathematicians. The sample of exclu-sively American mathematicians is the subset of predominantly
32. The total number of citations received by a paper published in year t ismeasured as of calendar year 2009.
PRODUCTIVITY OF AMERICAN MATHEMATICIANS 1169
at Harvard U
niversity on August 21, 2012
http://qje.oxfordjournals.org/D
ownloaded from
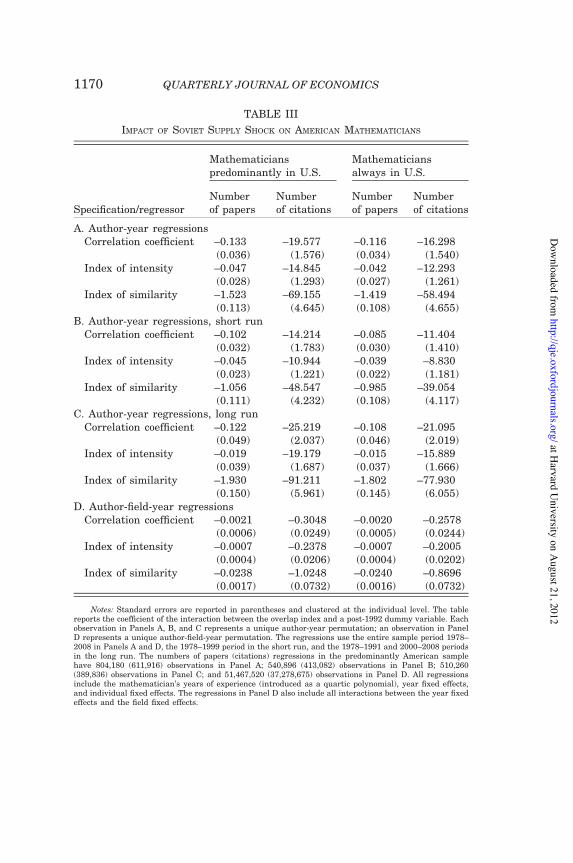
TABLE III
IMPACT OF SOVIET SUPPLY SHOCK ON AMERICAN MATHEMATICIANS
Specification/regressor
Mathematicianspredominantly in U.S.
Mathematiciansalways in U.S.
Numberof papers
Numberof citations
Numberof papers
Numberof citations
A. Author-year regressionsCorrelation coefficient –0.133 –19.577 –0.116 –16.298
(0.036) (1.576) (0.034) (1.540)Index of intensity –0.047 –14.845 –0.042 –12.293
(0.028) (1.293) (0.027) (1.261)Index of similarity –1.523 –69.155 –1.419 –58.494
(0.113) (4.645) (0.108) (4.655)B. Author-year regressions, short run
Correlation coefficient –0.102 –14.214 –0.085 –11.404(0.032) (1.783) (0.030) (1.410)
Index of intensity –0.045 –10.944 –0.039 –8.830(0.023) (1.221) (0.022) (1.181)
Index of similarity –1.056 –48.547 –0.985 –39.054(0.111) (4.232) (0.108) (4.117)
C. Author-year regressions, long runCorrelation coefficient –0.122 –25.219 –0.108 –21.095
(0.049) (2.037) (0.046) (2.019)Index of intensity –0.019 –19.179 –0.015 –15.889
(0.039) (1.687) (0.037) (1.666)Index of similarity –1.930 –91.211 –1.802 –77.930
(0.150) (5.961) (0.145) (6.055)D. Author-field-year regressions
Correlation coefficient –0.0021 –0.3048 –0.0020 –0.2578(0.0006) (0.0249) (0.0005) (0.0244)
Index of intensity –0.0007 –0.2378 –0.0007 –0.2005(0.0004) (0.0206) (0.0004) (0.0202)
Index of similarity –0.0238 –1.0248 –0.0240 –0.8696(0.0017) (0.0732) (0.0016) (0.0732)
Notes: Standard errors are reported in parentheses and clustered at the individual level. The tablereports the coefficient of the interaction between the overlap index and a post-1992 dummy variable. Eachobservation in Panels A, B, and C represents a unique author-year permutation; an observation in PanelD represents a unique author-field-year permutation. The regressions use the entire sample period 1978–2008 in Panels A and D, the 1978–1999 period in the short run, and the 1978–1991 and 2000–2008 periodsin the long run. The numbers of papers (citations) regressions in the predominantly American samplehave 804,180 (611,916) observations in Panel A; 540,896 (413,082) observations in Panel B; 510,260(389,836) observations in Panel C; and 51,467,520 (37,278,675) observations in Panel D. All regressionsinclude the mathematician’s years of experience (introduced as a quartic polynomial), year fixed effects,and individual fixed effects. The regressions in Panel D also include all interactions between the year fixedeffects and the field fixed effects.
QUARTERLY JOURNAL OF ECONOMICS1170
at Harvard U
niversity on August 21, 2012
http://qje.oxfordjournals.org/D
ownloaded from

American mathematicians who were always affiliated with anAmerican institution before 1990.33 It is important to note (andis obvious from biographies of the superstars listed in Table II)that either definition of an American mathematician includeslarge numbers of foreign-born persons. These foreign-born math-ematicians may have either migrated to the United States afterpublishing some initial work abroad or first arrived in the UnitedStates as foreign students and stayed in the country after receiv-ing the doctorate.
Regardless of the various specification changes, the resultsreported in Panel A of Table III are robust. In particular, all of theoverlap indices have a strong negative impact on the post-1992productivity of American mathematicians. It is instructive to givea numerical example to emphasize that the quantitative impacton the number of publications is numerically important. In termsof the correlation coefficient, for instance, an increase from r= 0to r= 1 (so that the pre-1990 field distribution shifts from onewhere the American mathematician’s work is uncorrelated withthat of the Soviets to one where the mathematician’s researchinterests perfectly overlap) reduces the number of publicationsin any particular year by 0.13. The regression, therefore, predictsthat the average American’s productivity fell by 2.2 papers (or0.13& 17) over the 1992–2008 period. As Table I shows, the aver-age American mathematician published 6.8 papers during theperiod, so that the Soviet supply shock reduced productivity byaround a third.
It is easy to demonstrate graphically the impact of the supplyshock on the productivity of American mathematicians with over-lapping research agendas. Suppose we classify mathematicianswhose index of similarity is in the upper quartile of the distribu-tion as ‘‘highly exposed,’’ whereas the group in the bottom quar-tile has low exposure. As shown in Figure VIIA, the raw trends inthe average number of papers published by the average mathem-atician in each of these two groups are revealing. Prior to 1990,the highly exposed group had a slight upward trend, while theleast exposed group had a slight downward trend. After 1990,however, there is a precipitous (absolute and relative) decline inthe publication rate of the group whose research agenda overlapsmost with the Soviets. The trends in the adjusted number of
33. There are 27,663 persons in the sample of exclusively Americanmathematicians.
PRODUCTIVITY OF AMERICAN MATHEMATICIANS 1171
at Harvard U
niversity on August 21, 2012
http://qje.oxfordjournals.org/D
ownloaded from
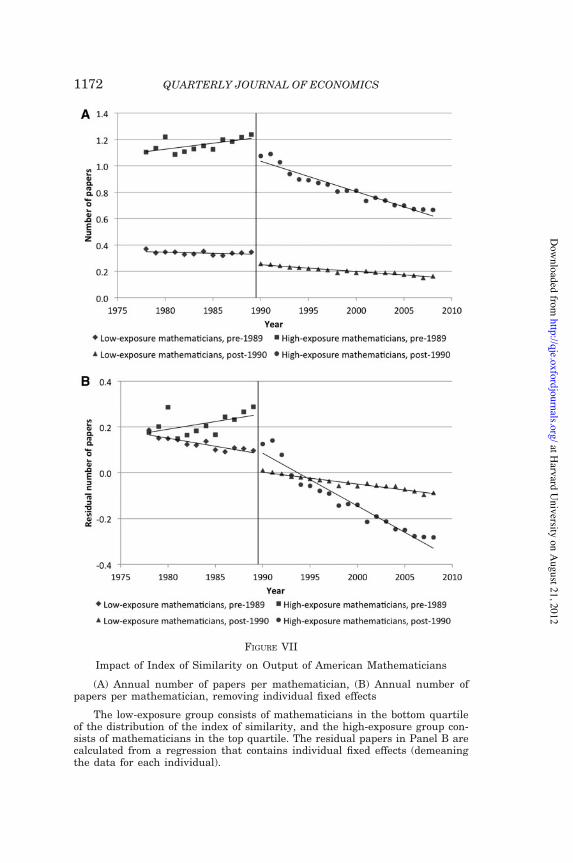
FIGURE VII
Impact of Index of Similarity on Output of American Mathematicians
(A) Annual number of papers per mathematician, (B) Annual number ofpapers per mathematician, removing individual fixed effects
The low-exposure group consists of mathematicians in the bottom quartileof the distribution of the index of similarity, and the high-exposure group con-sists of mathematicians in the top quartile. The residual papers in Panel B arecalculated from a regression that contains individual fixed effects (demeaningthe data for each individual).
QUARTERLY JOURNAL OF ECONOMICS1172
at Harvard U
niversity on August 21, 2012
http://qje.oxfordjournals.org/D
ownloaded from

papers (after removing individual fixed effects) shown inFigure VIIB reveal a continuation of previous trends for theleast exposed mathematicians and a striking reversal of trendsfor the highly exposed mathematicians.
Table III also reports the estimates of the coefficient y whenthe dependent variable is the ISI number of citations (or roughlythe number of publications weighted by quality).34 The evidencedocuments a large decline in the number of citations written byAmerican mathematicians whose research interests greatly over-lap with those of the Soviets. In other words, not only are thecompeting mathematicians producing fewer papers, but thework they produce is of lower quality in the sense that it gener-ates many fewer citations. A one-unit shift in the correlation co-efficient would reduce the number by about 20 citations per year.
The next two panels of Table III address the question ofwhether these effects persist in the long run. In Panel B, we re-strict the analysis to the years 1978–1999, so that the regressionsmeasure the short-run productivity effect, and Panel C only in-cludes the years 1978–1989 and 2000–2008, so that the product-ivity impact is measured roughly 10–15 years after the Sovietinflux occurred. The perhaps surprising finding in the table isthat, if anything, the long-run effects are larger than theshort-run effects (although the difference is sometimes not stat-istically significant). It is typically very difficult for academics toreenter the publications market once they have taken some yearsoff from successful active research. In academia, the short run isthe long run.35
A potential problem with these regression results is thatalthough they include year fixed effects to net out any trends in
34. We also estimated the regressions using the AMS count of citations as thedependent variable. As with the ISI data, all of the interaction coefficients arenegative and significant regardless of the measure of overlap used.
35. In the long run, we would have expected resources to be moved to theaffected fields. It is unclear, however, that such adjustments took place. In fact,federal obligations to universities and colleges for research in mathematicsdeclined slightly (in real dollars) during the 1990s; see U.S. National ScienceFoundation (2004, table 1a). Anecdotal evidence also suggests that it was difficultto obtain additional resources for hiring Soviet mathematicians. Personal commu-nication with Arthur Jaffe provides one such example. Jaffe was chair of theHarvard mathematics department at the time and jointly with HarvardPresident Derek Bok contacted 54 foundations requesting financial assistance tofund the transition of Soviet mathematicians into the American mathematics com-munity. All of the funding requests were denied.
PRODUCTIVITY OF AMERICAN MATHEMATICIANS 1173
at Harvard U
niversity on August 21, 2012
http://qje.oxfordjournals.org/D
ownloaded from
total output in the mathematics discipline, there may befield-specific time trends that may be spuriously correlated withthe Soviet influx. For instance, Soviet-style fields may haveexperienced a differential response in funding or intellectual at-tention after the cold war (though we have found no evidence forthis in our historical research). To determine if the results aresensitive to the inclusion of arbitrary field-specific trends, wereestimated the model with a full set of field-year fixed effectsin a sample constructed so that a particular observation repre-sents an author-field-year cell. In other words, our data now con-sist of the publication history of each American mathematician ineach of the 63 fields in mathematics for each year in our sampleperiod. Of course, many of the values in the dependent variable inthis regression will be 0 simply because few mathematicians pub-lish anything at all in a particular year, and fewer still publish apaper in more than one field.
The generalized regression model is given by:
yij"t# !!i % !j % !t % "!j & !t# % Xi"t#"% #"T & Indexi# % "ij"t#,
"4#
where yij(t) is a measure of the marginal product of mathemat-ician i in field j at time t; fj is a vector of field fixed effects; and(fj&ft) represents all possible interactions between the field andyear fixed effects.
The bottom panel of Table III summarizes the regression re-sults. It is evident that the coefficient y remains negative andsignificant even after controlling for the field-year fixed effects,regardless of the overlap index used. The numerical magnitude ofthe coefficient is smaller than that of the analogous coefficientreported in Panel A, but this is simply a mechanical effect becausethe total impact on publications is divided among the 63 fieldsthat make up the mathematics discipline. Once we scale the co-efficient properly (by multiplying by 63), the regression coeffi-cients reported in Panel D are, in fact, remarkably similar tothose in Panel A. The regression results, therefore, indicatethat arbitrarily complicated field-specific trends do not accountfor the post-1992 break in the evolution of publications for math-ematicians whose research interests greatly overlapped with thatof the Soviet emigres.
Although Table III describes how the collapse of theSoviet Union affected the mean productivity of American
QUARTERLY JOURNAL OF ECONOMICS1174
at Harvard U
niversity on August 21, 2012
http://qje.oxfordjournals.org/D
ownloaded from
mathematicians, it is of interest to measure the impact at ex-treme points in the quality distribution of the preexisting work-force. Consider initially the impact of the Soviet influx at the topof the quality distribution. Although the mean American math-ematician was negatively affected, those losses could perhapsbe more than offset by an increase in the likelihood that topAmerican mathematicians produced more ‘‘home runs.’’ Wedefine a home run as a paper that is in the top tail of the distri-bution of citations among all papers published in a particularyear.36 To assess the sensitivity of the results, we use three alter-native definitions of the number of home runs: the number ofpapers that the mathematician has published in any given yearthat lie above the 90th, the 95th, or the 99th lifetime citationpercentile for papers published that year. Because the signalvalue of citations received by recent publications is very weak(i.e., the papers have not been out long enough to be cited), werestrict the analysis to papers published between 1978 and 2005,a period in which we can reasonably distinguish between homeruns and run-of-the-mill papers.
By construction, a home run is a very rare event. After all,the modal number of publications for an active mathematician inany given year is 0. As is common in the literature that examinesthese types of rare publication events, we use a Poisson regres-sion model to examine how the collapse of the Soviet Union af-fected the number of home runs published by Americanmathematicians. The Poisson model can be interpreted as a re-gression where the dependent variable is the expected value ofthe number of rare events attained by a particular observation.In particular, let:
E'log Hit( ! !i % Xit$% %T % "it,"5#
where Hit is the number of home runs achieved by mathematiciani in year t; !i is an individual-specific fixed effect; and Xit is avector of covariates, again including the mathematician’s years
36. To estimate the number of home runs published by mathematician i in yeart, we first calculated the total number of (worldwide) lifetime citations received byeach article in the ISI database that had been successfully matched to the AMSdatabase. We used these lifetime citation totals to calculate the 90th percentile,95th percentile, and 99th percentile thresholds of the citations distribution forpapers published in each year. We then used the matched AMS/ISI database tocount the number of papers that a particular mathematician published each yearthat exceed these threshold percentiles.
PRODUCTIVITY OF AMERICAN MATHEMATICIANS 1175
at Harvard U
niversity on August 21, 2012
http://qje.oxfordjournals.org/D
ownloaded from
of work experience (introduced as a quartic polynomial). Toclearly illustrate the source of the additional (or fewer) homeruns hit by American mathematicians after the collapse of theSoviet Union, we estimated the Poisson regression separatelyfor three different groups: the group of least exposed mathemat-icians (below the 25th percentile in the distribution of the respect-ive measure of the index of overlap); the group of most exposedmathematicians (above the 75th percentile), and the residual‘‘middle’’ group. The coefficient of interest is the parameter d,which measures the post-1992 break in the home runs trend forthe various groups of American mathematicians.
The first three columns of Table IV report the coefficient ofthe post-1992 indicator variable for the various specifications. It isevident that the expected number of home runs written by math-ematicians who most overlapped with the Soviets declined dramat-ically after 1992. For example, consider the coefficients estimatedwhen the mathematicians are classified according to their place-ment in the distribution of the correlation coefficient. If we define ahome run as a paper above the 95th percentile of citations, thecoefficient for the most exposed group is $0.204 (0.032), indicatingthat a mathematician in this group experienced a 20.4% decline inthe expected number of annual home runs hit after 1992. In con-trast, the coefficient for the least exposed group is 0.058 (0.066),suggesting that the least exposed mathematicians had just aboutas many home runs before and after the collapse of the SovietUnion. In fact, all the regression models predict an absolute (andnumerically large) decline in the number of home runs publishedby the most exposed mathematicians. In contrast, the leastexposed mathematicians usually did not experience a change inthe number of home runs (although the positive coefficient is sig-nificant when using the index of similarity).
Of course, it is possible that the ‘‘average’’ adverse impact ofthe Soviet influx on the number of home runs masks a potentiallyimportant gain within a small subgroup of American mathemat-icians. Elite institutions hired many of the emigres. These emi-gres began to coauthor with their American colleagues (assuggested by Figure II). In fact, 666 preexisting American math-ematicians (or 2.8%) coauthored with a Soviet emigre at somepoint after 1992.37 However, the coauthorship rate was 5.7%
37. The incidence of coauthorship can only be estimated in the matched AMS/ISI database. A highly exposed mathematician is someone who is in the top quartile
QUARTERLY JOURNAL OF ECONOMICS1176
at Harvard U
niversity on August 21, 2012
http://qje.oxfordjournals.org/D
ownloaded from

TABLE IV
IMPACT OF SOVIET SUPPLY SHOCK ON NUMBER OF ‘‘HOME RUNS’’ (CONDITIONAL FIXED
EFFECTS POISSON MODEL)
Sample
Number of papers withcitations above xth percentile:
By coauthorship status(95th percentile)
90th 95th 99th
Coauthoredwithemigre
Did notcoauthor
Correlation coefficient in:Bottom quartile 0.058 –0.055 0.211 0.005 –0.055
(0.066) (0.097) (0.237) (0.279) (0.103)Middle 50% 0.012 0.029 0.120 0.058 0.021
(0.032) (0.044) (0.090) (0.144) (0.046)Top quartile –0.204 –0.160 –0.121 0.014 –0.215
(0.032) (0.043) (0.087) (0.091) (0.049)Index of intensity in:
Bottom quartile 0.089 –0.025 0.127 0.022 –0.025(0.068) (0.101) (0.260) (0.286) (0.108)
Middle 50% –0.043 –0.025 0.112 0.040 –0.036(0.031) (0.042) (0.086) (0.131) (0.044)
Top quartile –0.166 –0.123 –0.115 0.019 –0.169(0.034) (0.045) (0.090) (0.095) (0.051)
Index of similarity in:Bottom quartile 0.331 0.366 0.402 –0.190 0.393
(0.069) (0.095) (0.198) (0.507) (0.096)Middle 50% 0.011 –0.020 –0.004 –0.096 –0.024
(0.037) (0.050) (0.106) (0.162) (0.053)Top quartile –0.158 –0.122 0.016 0.072 –0.180
(0.029) (0.039) (0.079) (0.085) (0.044)
Notes: Standard errors reported in parentheses. The sample consists of predominantly Americanmathematicians. An observation consists of an author-year pair for each year between 1978 and 2005.The dependent variable is the number of ‘‘home runs,’’ defined as the number of papers written in thatyear that have received a sufficiently high number of citations to place them in the top 90th, 95th, or 99thpercentile for papers published that year. The regression includes a post-1992 dummy variable, years ofexperience (introduced as a quartic), and individual fixed effects. The coefficient reported in the table isthat of the post-1992 dummy variable. Each coefficient in the table is drawn from a separate Poissonregression estimated in the respective sample. The regressions in the last two columns reestimate the95th percentile regressions separately on the samples of American mathematicians who either coauthoredor did not coauthor with a Soviet emigre at any point after 1992. The number of observations for the(bottom, middle, top) groups are (142,563, 292,446, 156,996) in Panel A, (136,590, 303,751, 151,664) inPanel B, and (128,617, 289,149, 174,239) in Panel C.
of the distribution of the index of similarity. The institutions were ranked accordingto the total number of papers published between 1984 and 2008 by all mathemat-icians affiliated with the institution.
PRODUCTIVITY OF AMERICAN MATHEMATICIANS 1177
at Harvard U
niversity on August 21, 2012
http://qje.oxfordjournals.org/D
ownloaded from

among highly exposed American mathematicians and rose fur-ther to 8.0% among the highly exposed mathematicians affiliatedwith the top 25 institutions.
To determine if the high rate of coauthorship among highlyexposed American mathematicians led to an increase in thenumber of home runs hit by these Americans, we reestimatedthe regression in equation (5) separately by coauthorshipstatus. The estimated coefficients are reported in the last twocolumns of Table IV.38 There is an important difference in theimpact between the Americans who coauthored with the emigresand those who did not. In particular, the evidence clearly showsthat coauthoring with a Soviet emigre entirely attenuates thenegative impact of the Soviet influx on the number of homeruns written by highly exposed American mathematicians.Nevertheless, there is no evidence of any increase in thenumber of home runs hit by American mathematicians evenwithin the small subset of highly exposed coauthors.
It is equally important to measure the productivity impact atthe other end of the quality distribution and examine what hap-pened to the ‘‘marginally active’’ American mathematician. Inparticular, we examine the probability that an American math-ematician remains active (i.e., publishing) in the profession after1992. We constructed a variable indicating if the mathematicianhas ‘‘retired’’ by setting it equal to 0 in every year prior to the lastyear in which we observe a publication for mathematician i. Wethen omit all postretirement observations for the particularmathematician (in other words, we exclude the years after thepublication of a mathematician’s last article). We used this formof survival data to estimate Cox proportional models where thedependent variable is the instantaneous probability ofretirement:
log &i"Zi, '# ! log &0"'# % Zi$% ","6#
where &i(Zi, t) is the hazard for individual i with covariates Zi atexperience t; and &0(t) is the baseline hazard for workers at thatlevel of experience. The covariates in the vector Z include the
38. Although the coauthorship evidence reported in Table IV uses the 95thpercentile threshold to define a home run, the qualitative results are similar for theother thresholds. Note that coauthorship status is not randomly assigned acrossmathematicians, so that the coefficients, though suggestive, do not necessarilyprove a causal relationship.
QUARTERLY JOURNAL OF ECONOMICS1178
at Harvard U
niversity on August 21, 2012
http://qje.oxfordjournals.org/D
ownloaded from

mathematician’s overlap index, the post-1992 indicator variable,and the interaction between these two variables. The top row ofTable V reports the coefficient of this interaction variable esti-mated separately for the three alternative measures of the over-lap index.
The overlap index has a positive and significant impact onthe instantaneous retirement probability after 1992, and theimplied numerical effect is large. Consider, for example, the co-efficient estimated when we use the correlation coefficient. Theregressions imply that a mathematician whose prior researchwas perfectly correlated with that of the Soviets had roughly a50% (given by e+ 0.41) increase in the instantaneous probability ofretirement relative to the probability of a mathematician whosework was uncorrelated with the Soviet research program. It iseasier to get a sense of the quantitative effect by examining thesurvival functions implied by the estimated Cox proportional haz-ards. Figures VIIIA and VIIIB illustrate the survival functionsfor high- and low-exposure mathematicians, both before and after1992.39 The probability of survival declined precipitously for
TABLE V
IMPACT OF SOVIET SUPPLY SHOCK ON PROBABILITY OF ‘‘RETIREMENT’’ FROM PUBLISHING
(COX PROPORTIONAL HAZARD MODELS)
Sample
Measure of overlap
Correlationcoefficient
Index ofintensity
Index ofsimilarity
All preexisting mathematicians 0.410 0.230 5.571(0.090) (0.084) (0.298)
Less than 10 years of experience 1.099 0.653 10.340(0.229) (0.176) (0.962)
10–19 years of experience 0.166 0.299 0.232(0.192) (0.175) (0.645)
At least 20 years of experience 0.099 0.101 1.433(0.181) (0.183) (0.491)
Notes: Standard errors are reported in parentheses and are clustered at the individual level. Thesample consists of predominantly American mathematicians. Each observation in the data represents anindividual-year of experience record, beginning in 1978 until the year of the individual’s last observedpublication. The regression model includes a post-1992 dummy variable, the mathematician’s overlapindex, and the interaction between the overlap index and the post-1992 indicator (which is the coefficientreported in the table). The sample sizes (by row) are 446,720 observations, 151,012 observations, 143,442observations, and 152,267 observations.
39. The low- and high-exposure groups are defined by the bottom and topquartiles of the distribution of the index of similarity.
PRODUCTIVITY OF AMERICAN MATHEMATICIANS 1179
at Harvard U
niversity on August 21, 2012
http://qje.oxfordjournals.org/D
ownloaded from

FIGURE VIII
Survival Functions for American Mathematicians, by Level of Exposure
(A) Low-exposure mathematicians, (B) High-exposure mathematicians
The survival curve is calculated from the hazard function specification re-ported in column (3), first row, of Table IV. A low (high) exposure mathemat-ician is the typical mathematician in the bottom (top) quartile of thedistribution of the index of similarity.
QUARTERLY JOURNAL OF ECONOMICS1180
at Harvard U
niversity on August 21, 2012
http://qje.oxfordjournals.org/D
ownloaded from

high-exposure mathematicians after 1992 (both relatively andabsolutely).
The shape of the survival functions, in fact, suggests that theeffect seems largest for mathematicians at early points in theircareer. We reestimated the hazard regressions separately onmathematicians classified by years of experience. The remainingrows of Table V show that the adverse impact of an overlappingresearch agenda with the Soviets is far larger in the sample ofyounger (and likely untenured) mathematicians. In other words,the Soviet supply shock had a particularly detrimental effect onthe long-run career prospects of young (and untenured) mathem-aticians, greatly increasing their probability of retiring from theproduction of mathematical output.40
Although some American mathematicians stopped pub-lishing altogether after the collapse of the Soviet Union, othersremained active but were encouraged to move to different insti-tutions. We create a variable for each mathematician indicating ifthe modal institution in the post-1992 period (after the Sovietinflux) was different from the last institutional affiliationobserved prior to 1990.41 By construction, our sample consistsof mathematicians whose last reported affiliation prior to 1990and whose modal affiliation post-1992 were located in the UnitedStates. We then estimated linear probability models that examinethe separation probability of a mathematician, including controlsfor differences in individual and institutional quality. In particu-lar, we hold constant the log number of papers the mathematicianpublished prior to 1990, the log number of papers published bymathematicians affiliated with the pre-1990 institution, and themathematician’s years of work experience.
The regression model uses two variables to capture theimpact of the Soviet influx. The first is the overlap index thatdescribes the pre-1990 overlap in research interests betweenthe particular American mathematician and the Soviet researchprogram. The second is a dummy variable indicating whether theinstitution employing the mathematician just before the shock
40. The regression obviously cannot distinguish between the possibility thatthe mathematician stopped writing publishable articles or was simply unable tofind an outlet for his or her research in the face of increasing competition by thehighly productive Soviet mathematicians.
41. The construction of the sample requires that the mathematician publishedboth before and after 1992 and that there is a valid affiliation code in both periods.
PRODUCTIVITY OF AMERICAN MATHEMATICIANS 1181
at Harvard U
niversity on August 21, 2012
http://qje.oxfordjournals.org/D
ownloaded from
was, in fact, subsequently ‘‘exposed’’ to Soviet emigres (i.e., if theinstitution hired a Soviet emigre at some point after 1992).
The top panel of Table VI reports the regression coeffi-cients.42 The separation rate is strongly related to both geo-graphic and intellectual proximity. In particular, the separationrate rises by about 5 percentage points if the mathematician’s lastaffiliation before 1990 ended up hiring a Soviet emigre.43
Similarly, regardless of how the overlap index is measured,there is a strong positive correlation between the index and theseparation rate. An increase in the correlation coefficient from 0to 1 increases the separation rate by 17 percentage points.44 Putdifferently, holding geographic exposure constant, the Americanmathematicians with the most Soviet-like research agendas sud-denly found themselves in volatile jobs and ended up moving toother institutions at dramatically higher rates.
The bottom two panels of the table replicate the mobilityanalysis for the samples of ‘‘untenured’’ and ‘‘tenured’’ mathem-aticians. Notably, the separation rate of younger faculty is muchmore sensitive to direct exposure to the Soviet influx. In particu-lar, the probability of moving increases by about 10% for a youngmathematician who was employed in an institution that eventu-ally hired a Soviet emigre, but is unaffected for an older math-ematician. Similarly, the impact of the overlap index is at least
42. Although we do not report the coefficients of the other variables in theregression, they mirror findings in the labor economics literature. The higher thequality of the mathematician (as measured by the number of pre-1990 publica-tions), the lower the separation rate. This finding is analogous to the negative cor-relation between the probability of job separation and a worker’s wage. In addition,the separation rate is lower for older mathematicians and higher for mathemat-icians initially employed by high-quality institutions.
43. There may be reverse causality in the correlation between the separationrate and whether the institution eventually hired a Soviet emigre. Perhaps theinstitution only hired emigres after an American mathematician failed to maketenure. Although this interpretation can explain the correlation, it is importantto note that the failed assistant professors were young and inexperienced, whereasthe Soviet emigres were more senior, and many had already had distinguishedcareers.
44. We also estimated separation regressions that included a vector of fixedeffects for the pre-1990 institution. Although the impact of geographic exposure canno longer be identified, the coefficient of the overlap index remains negative andsignificant. In the regression that uses the correlation coefficient, for instance, thecoefficient is 0.123 (0.025), so that the degree of research overlap with the incomingSoviets determined which mathematician within a particular institution was mostlikely to leave.
QUARTERLY JOURNAL OF ECONOMICS1182
at Harvard U
niversity on August 21, 2012
http://qje.oxfordjournals.org/D
ownloaded from

twice as large in the untenured sample, regardless of how theindex is measured.
The mobility regressions raise a number of interesting ques-tions. Most important: Where did the displaced mathematiciansgo? We calculated a measure of change in institutional quality byadding the total number of papers published by all mathemat-icians affiliated with a particular institution throughout theentire 1984–2008 period. Because we can identify the last insti-tution employing the mathematician prior to the supply shock aswell as the modal institution employing him or her after theinflux, we can construct a measure of the change in institutionalquality for movers. Let N0 be the number of papers published by
TABLE VI
IMPACT OF SOVIET SUPPLY SHOCK ON INSTITUTIONAL MOBILITY
Sample/regressor
Measure of overlap/dependent variable
Correlationcoefficient
Index ofintensity
Index ofsimilarity
Moved !Quality Moved !Quality Moved !Quality
A. All mathematiciansInstitution hired emigre 0.046 –2.382 0.046 –2.383 0.047 –2.385
(0.013) (0.122) (0.013) (0.122) (0.013) (0.122)Overlap index 0.172 –0.415 0.158 –0.282 0.321 –1.329
(0.025) (0.308) (0.022) (0.252) (0.066) (0.997)B. First published after 1980
Institution hired emigre 0.098 –2.408 0.098 –2.411 0.099 –2.407(0.020) (0.158) (0.020) (0.158) (0.020) (0.158)
Overlap index 0.216 –0.618 0.157 –0.394 0.676 –2.606(0.040) (0.373) (0.031) (0.285) (0.151) (1.499)
C. First published before 1980Institution hired emigre 0.001 –2.274 0.001 –2.277 0.001 –2.272
(0.015) (0.188) (0.015) (0.189) (0.015) (0.189)Overlap index 0.100 0.225 0.099 0.356 0.218 –0.180
(0.029) (0.538) (0.029) (0.540) (0.069) (1.345)
Notes: Robust standard errors are reported in parentheses. The sample consists of predominantlyAmerican mathematicians whose last observed affiliation before 1990 and the modal post-1992 observationwere both in the United States. The dependent variable in the ‘‘moved’’ regressions is a dummy variableset to unity if the mathematician’s last observed affiliation before 1990 is different from the post-1992modal affiliation, and the dependent variable in the ‘‘change in quality’’ regressions is the difference(among movers) in the log number of papers published by these two institutions. The ‘‘moved’’ regressionshave 13,137 observations in Panel A, 6,513 observations in Panel B, and 6,624 observations in Panel C.The ‘‘change in quality’’ regressions have 4,029 observations in Panel A, 3,021 observations in Panel B,and 1,008 observations in Panel C. All regressions hold constant the log number of papers published bythe mathematician between 1978 and 1990 and the mathematician’s years of work experience; the‘‘moved’’ regressions also include the log number of papers published by the pre-1990 institution.
PRODUCTIVITY OF AMERICAN MATHEMATICIANS 1183
at Harvard U
niversity on August 21, 2012
http://qje.oxfordjournals.org/D
ownloaded from

the institution employing the mathematician before 1990, and N1
be the number of papers published by the institution employinghim or her after the influx. Our measure of the change in insti-tutional quality is defined by log N1=N0" #.
Table VI shows that this change in institutional quality isrelated to both geographic and intellectual proximity, with bothvariables having strong negative effects. The impact of geo-graphic proximity is particularly large. Conditional on moving,an American mathematician initially employed by one of the in-stitutions that ended up hiring Soviet emigres moved to an insti-tution that had published 91% fewer papers during the period.45
Finally, up to this point our analysis has used papers andcitations to measure a mathematician’s marginal product.Academic mathematicians also produce students, and the col-lapse of the Soviet Union may have had beneficial or harmfuleffects on the quality of the students produced by American in-stitutions. Most obviously, hiring highly skilled Soviet mathem-aticians should presumably lead to higher quality students. Atthe same time, the Soviet influx had an adverse effect on theproductivity of mathematicians who had previously doneSoviet-style research, and this adverse impact could be trans-mitted ‘‘intergenerationally’’ to their students.46
Despite the endogenous sorting of advisors and students, it isof interest to examine how the quality of the students was af-fected by the ‘‘Soviet-ness’’ of the advisor: either because the ad-visor was a Soviet emigre or because the advisor was an Americandoing Soviet-style research.47 As already noted, the MGP datalinks each new mathematician to his or her advisor. The AMS/ISI data further allow us to calculate the average annual number
45. Although the numerical magnitude of this effect seems implausible, it isconsistent with the raw data. The total mathematical output produced by institu-tions falls precipitously once we move from the top-ranked institutions to eventhose ranked 200th in our index of quality. Mathematicians affiliated with thetop institutions (e.g., MIT or the University of California, Berkeley) publishedover 8,000 papers during the period. Mathematicians associated with institutionsaround the 200th rank published only around 350 papers.
46. One could also argue that the most affected American mathematicians(whose publishable product declined after 1992) had more time for student advisingand could perhaps produce higher quality students.
47. The sorting of advisors and students is not random. Great mathematicianswill likely attract great students, and/or great mathematicians can be more select-ive in choosing students from the pool of potential advisees.
QUARTERLY JOURNAL OF ECONOMICS1184
at Harvard U
niversity on August 21, 2012
http://qje.oxfordjournals.org/D
ownloaded from
of papers and citations produced by each student between theyear the degree was awarded and 2011.
The data consist of a single observation for each student ob-taining a doctoral degree from an American institution between1978 and 2008 and who had either a Soviet or a predominantlyAmerican advisor. We estimated a model linking the student’s(future) annual productivity to variables characterizing theSoviet-ness of the advisor: a dummy variable indicating if theadvisor is a Soviet emigre, the value of the overlap index if theadvisor is a predominantly American mathematician, and aninteraction between the advisor’s overlap index and a dummyvariable indicating if the student received the doctoral degreeafter 1992.48 This interaction variable captures the differentialimpact on student productivity of having an American advisorwho was most affected by the post-1992 Soviet influx.
Column (1) of Table VII reports the coefficients of the Sovietemigre indicator and the overlap interaction when we use thestudent’s annual number of papers and ISI citations as the de-pendent variables. The results are striking. The presence of aSoviet advisor has a strong positive effect on both papers andcitations, leading to about 0.2 to 0.3 more papers and 0.5 to 1.0more citations per year (depending on the measure of the overlapindex).
At the same time, however, the Soviet-ness of the student’sAmerican advisor has a mirror-image negative impact on the stu-dent’s productivity. To easily interpret the numerical magnitudeof this effect, suppose again the overlap index is measured by thecorrelation coefficient. The student of an American advisor with acorrelation coefficient equal to 1 publishes 0.4 fewer papers andproduces 7.0 fewer citations per year than the student of anAmerican advisor with a correlation coefficient of 0.
The construction of the data allows us to introduce both in-stitution and advisor fixed effects, so we can measure productiv-ity effects that net out the influence of institution and advisorquality. The remaining columns of the table introduce thesefixed effects. The impact of having a Soviet advisor remainsstrong even after we include institution fixed effects in the regres-sion. Of course, we cannot estimate the Soviet advisor coefficientif the regression also includes advisor fixed effects. Nevertheless,it is worth noting that the American advisor’s overlap index often
48. The regression also includes a set of year fixed effects.
PRODUCTIVITY OF AMERICAN MATHEMATICIANS 1185
at Harvard U
niversity on August 21, 2012
http://qje.oxfordjournals.org/D
ownloaded from

plays a differential role before and after 1992 even after we in-clude advisor fixed effects. The inclusion of the advisor fixed effectallows us to measure how the Soviet-ness of an American advisoraffected the productivity of this particular advisor’s students overtime. The interaction coefficient is negative (and significant usingtwo of the measures of the overlap index). In short, the evidencesuggests that the students of a specific Soviet-like advisor weredirectly and adversely affected by the Soviet influx.
It is easy to manipulate the estimated coefficients to get aback-of-the-envelope measure of the impact of the Soviet influx onthe average productivity of students produced by American insti-tutions. For example, about 3.0% of students had a Soviet advisorafter 1992. Those select students were able to generate around
TABLE VII
IMPACT OF SOVIET SUPPLY SHOCK ON PRODUCTIVITY OF STUDENTS (DEPENDENT
VARIABLE =STUDENT’S ANNUAL NUMBER OF PAPERS OR CITATIONS)
Index/variable
Papers Citations (ISI)
(1) (2) (3) (1) (2) (3)
Correlation coefficientSoviet advisor 0.225 0.232 – 0.557 0.693 –
(0.040) (0.041) (0.211) (0.223)Advisor’s index&T –0.425 –0.386 –0.178 –6.936 –6.482 –3.808
(0.092) (0.091) (0.106) (1.124) (1.127) (1.445)Index of intensity
Soviet advisor 0.256 0.265 – 1.147 1.309 –(0.041) (0.042) (0.225) (0.236)
Advisor’s index&T –0.508 –0.465 –0.236 –9.036 –8.495 –5.429(0.095) (0.095) (0.106) (1.346) (1.349) (1.576)
Index of similaritySoviet advisor 0.295 0.296 – 0.875 0.877 –
(0.041) (0.042) (0.223) (0.235)Advisor’s index&T –0.408 –0.369 –0.129 –5.529 –5.143 –1.302
(0.187) (0.182) (0.242) (1.944) (1.976) (3.073)Institution fixed effects No Yes Yes No Yes YesAdvisor’s fixed effects No No Yes No No Yes
Notes: Robust standard errors are reported in parentheses. The dependent variable is the averageannual number of papers published or (ISI) citations received between the time the student obtained hisdoctoral degree and 2011. The sample consists of students who received doctoral degrees from Americaninstitutions between 1978 and 2008, and whose advisor was either a predominantly American preexistingmathematician or a Soviet emigre. The papers regressions have 20,822 observations, and the citationsregressions have 20,743 observations. The ‘‘Soviet Advisor’’ variable is a dummy variable set to unity if theadvisor is a Soviet emigre; the ‘‘Advisor index’’ variable is the American’s advisor’s value of the overlapindex (set to 0 if the advisor is a Soviet emigre); and T is a dummy variable set to unity for the post-1992period. All regressions include the value of the advisor’s overlap index (if American) and a set of fixedeffects indicating the calendar year of receiving the doctoral degree.
QUARTERLY JOURNAL OF ECONOMICS1186
at Harvard U
niversity on August 21, 2012
http://qje.oxfordjournals.org/D
ownloaded from

0.007 more papers per year (or 0.03&+0.23) as a result of theSoviet influx. The other 97% of students, however, had anon-Soviet advisor, and the average advisor’s correlation coeffi-cient was .09. The predicted decline in the number of papersproduced due to the intergenerational transmission of less mar-ketable skills is around 0.038 papers (or 0.97& 0.09&–0.43). Thenet effect, therefore, seems to be negative.
V. Aggregate Effects
We shift the focus from estimating individual-level product-ivity effects to calculating aggregate effects. In particular,we wish to determine if the total number of papers publishedby the cohort of preexisting American mathematicians increasedor decreased as a result of the Soviet influx. Equally important,did the size of the American ‘‘mathematics pie’’ expand orcontract after we take account of the contribution of Sovietemigres?
Suppose we divide the preexisting American mathematiciansinto three categories: those with a pre-1990 research agenda thatwas highly correlated with that of the Soviets, those with anagenda that was almost uncorrelated, and everyone else. Asbefore, we use the 25th and 75th percentile of the distributionof the index of similarity to calculate the thresholds that definethe groups.
For our first prediction exercise, we estimated separate re-gression models that trace out the mathematician’s age-productprofile for each group. Specifically, we estimated a regression ofthe number of papers published by a particular mathematician ina given calendar year on years of experience (introduced as aquartic polynomial) and on a vector of individual fixed effects.Notably, we only used data from 1970 through 1991 to estimatethis regression model. We then used the regressions to predict thepost-1992 output of each mathematician. To ensure that our pre-dictions are not extrapolating into the far-off future, we conductthis ‘‘short-run’’ prediction exercise for the years 1992–1999.49
49. Because the regression will be used to predict outcomes about a decade outof sample, we use a longer span of the pre-1992 data to get a more precisely esti-mated age-productivity profile for mathematicians in each group. The regressionsare then used to predict annual papers published in 1992–1999 for mathematicians
PRODUCTIVITY OF AMERICAN MATHEMATICIANS 1187
at Harvard U
niversity on August 21, 2012
http://qje.oxfordjournals.org/D
ownloaded from

We then added the total number of predicted publications acrossyears and across all mathematicians in each group. The top panelof Table VIII reports the predicted total number of papers (peryear) and contrasts these predictions with the actual output ofthe preexisting mathematicians.
Not surprisingly, the exercise reveals dramatic differencesin how well the pre-1992 productivity history predicts thepost-1992 output. Consider, for instance, the group of mathemat-icians in the bottom quartile of the distribution of the correlationcoefficient (i.e., those whose work least overlapped with that ofthe Soviets). Based solely on the path of the pre-1992 age-productprofile, we would expect these mathematicians to publish901 papers between 1992 and 1999. In fact, this group published1,253 papers. Therefore, the regression model underpredictsthe number of publications for mathematicians whose work wasuncorrelated with that of the Soviets (and the gap betweenthe prediction and the actual output is statistically significant).However, our prediction is much further off the mark for math-ematicians who are in the top quartile of the distribution ofthe index of similarity. Their pre-1992 publications historypredicts that they would publish 5,062 papers annually be-tween 1992 and 1999. In fact, they only published 4,015papers, a ‘‘loss’’ of over 1,000 papers. This difference is highlysignificant.
If we add up the total number of predicted and actualpapers across the three groups, our exercise overpredicts theactual output by about 600 papers (or 6.8%), a statistically sig-nificant difference. However, Table VIII also reports that Sovietemigres published 371 papers in the United States annually be-tween 1992 and 1999. Once we take into account the Soviet con-tribution, our prediction exercise closely tracks what actuallyhappened: The pre-1990 publication history of the preexistingAmerican workforce would suggest a total of 9,482 papers pub-lished annually between 1992 and 1999. There were, in fact,9,245 publications, and this small difference is not statisticallysignificant.
An alternative prediction exercise would use the data avail-able over the entire 1978–2008 period to reestimate the basic
who either did not publish at all after 1992 (so that we do not know their location), orwhose publication record reveals that they were affiliated with American institu-tions during the period.
QUARTERLY JOURNAL OF ECONOMICS1188
at Harvard U
niversity on August 21, 2012
http://qje.oxfordjournals.org/D
ownloaded from

regression model in equation (3). We can then use this regressionto conduct a counterfactual exercise that predicts the number ofpapers for each mathematician in each year between 1992 and2008 if the Soviet influx had never occurred. We model this coun-terfactual world as one in which the index of similarity would not
TABLE VIII
PREDICTING ANNUAL OUTPUT OF AMERICAN MATHEMATICIANS
American mathematicians
Sovietemigres Total
Mostexposed
Middle50%
Leastexposed
AllAmericans
Number of papers, short-run predictionActual 4015.0 3606.6 1253.3 8874.9 370.6 9245.5
Predicted 5062.0 3519.2 900.6 9481.8 – 9481.8
Difference –1047.0 87.4 352.7 –606.9 – –235.9(121.2) (126.5) (72.1) (189.5) (189.5)
Long-run prediction:Number of papers
Actual 3350.6 3013.1 1035.3 7398.9 432.5 7831.4
Predicted 3879.9 2910.3 757.4 7547.5 – 7547.5
Difference –529.3 102.8 277.9 –148.6 – 283.9(76.3) (119.0) (88.0) (166.5) (166.5)
Number of citationsActual 19,355.5 13,372.8 3939.2 36,667.5 2944.8 39,612.3
Predicted 22,088.5 13,191.7 2914.3 38,194.5 – 38,194.5
Difference –2733.0 181.1 1024.9 –1527.0 – 1417.8(1083.2) (1693.2) (1239.9) (2361.7) (2361.7)
Notes: The standard errors reported in parentheses give the forecast error of the predicted number ofpapers or citations, adjusted for the correlation across observations for the same individual. The sampleconsists of persons who were always affiliated with an American institution prior to 1990. The predictednumber of papers in the short run is based on a regression estimated separately in each of the threesamples of mathematicians ranked according to their placement in the distribution of the coefficient ofsimilarity. The unit of observation is an author-year; the regression uses observations between 1970 and1991; and the regressors include a quartic in experience and individual fixed effects. We then use thisregression to predict each mathematician’s output in each year between 1992 and 1999, and the tablereports the sum of these predictions. The long-run predictions are based on the specification estimatedover the entire sample period 1978–2008 and reported in Panel A of Table III (using the index of simi-larity). This regression is then used to predict a mathematician’s output in each year between 1992 and2008 assuming that no Soviet influx occurred (so the index of similarity plays no differential role beforeand after 1992). The predictions are then summed within each of the three exposure groups. The counts ofpapers and citations of Soviet emigres only include the post-1992 papers published and citations receivedwhile the emigre was affiliated an American institution.
PRODUCTIVITY OF AMERICAN MATHEMATICIANS 1189
at Harvard U
niversity on August 21, 2012
http://qje.oxfordjournals.org/D
ownloaded from
play a differential role in determining the mathematician’s prod-uct before and after 1992.50
We again aggregated the predicted and actual number ofpapers for the three groups of mathematicians, and these aggre-gate predictions are reported in the middle panel of Table VIII. Aswith the short-run exercise, we tend to slightly underpredict theperformance of American mathematicians who did not overlapwith the Soviet research agenda. In contrast, we tend to over-predict by a larger amount (529 papers) the output of mathemat-icians who were most Soviet-like in their research. Thisprediction exercise suggests that there should have been a totalof 7,548 papers published annually in the post-1992 period. Infact, there were 7,831 annual papers after we include the Sovietcontribution. The Soviets, therefore, slightly increased the size ofthe mathematics pie (by 284 papers annually), but the increase isnot statistically significant.
The crucial lesson from these prediction exercises is that thetotal product of the preexisting American mathematics commu-nity contracted as a result of the Soviet influx, and the Sovietcontribution to American mathematics filled in the gap.Notably, there is no evidence that the Soviets greatly increasedthe size of the pie.51 The papers that are missing from theAmerican portfolio are those that would have been written bythe most Soviet-like Americans, but never were.
The nature of the academic market can help us understandhow this situation may arise. First, the AMS’s Annual Surveysreport surprisingly small changes from year to year in the totalnumber of mathematicians working in U.S. research institutionsduring our sample period.52 With the total number of researchjobs unresponsive to the opportunities created by the Soviet
50. Specifically, the prediction uses the model estimated in equation (3) andsets the interaction of the post-1992 dummy variable with the index of similarityequal to 0.
51. We also checked this prediction by considering whether the predicted de-cline in the publication of home runs suggested by Table IV is made up by the homeruns produced by Soviet emigres in America. That exercise also suggests that some,and possibly all, of the lost American home runs were made up by the Soviets.
52. For instance, between the 1990–1991 and 1994–1995 academic years, thetotal employment of doctoral full-time faculty in mathematics departments ofPh.D.-granting institutions increased from 6,008 to 6,147. The number of suchfaculty at the 82 institutions with a Conference Board of Associated ResearchCouncils Rank of I or II (i.e., those institutions that produce the bulk of the bestresearch) actually decreased from 3,740 to 3,613. It is also interesting that during
QUARTERLY JOURNAL OF ECONOMICS1190
at Harvard U
niversity on August 21, 2012
http://qje.oxfordjournals.org/D
ownloaded from

influx, the entry of experienced Soviet mathematicians had par-ticularly adverse effects on untenured and/or marginal mathem-atics faculty. As we have shown, some of those faculty moved tolower ranked institutions and some of them moved out of theacademic market altogether. Regardless of their final placement,many of these mathematicians found it increasingly difficult to dothe type of research that leads to publishable output, either be-cause of an increased teaching load, fewer networking possibili-ties, or because the responsibilities of a job as a ‘‘quant’’ on WallStreet limits the kind of effort required to develop publishablematerial.
Although we do not find any convincing evidence that therewas a substantial increase in the aggregate output of either thepreexisting American workforce or of that community combinedwith the Soviet emigres, it is still possible that the ‘‘quality’’ ofAmerican mathematics improved in a broader sense. Put simply,if journal editors maximize the visibility of their journals, thenthe quality of papers published in the United States by Sovietemigres must have been at least as high as that of papers theyreplaced.
We examine this implication by predicting the aggregatenumber of citations that American mathematicians should haveproduced after 1992 and determining if any drop in the totalnumber of citations is more than made up by citations to paperswritten by Soviet emigres after their arrival in the UnitedStates.53 As the bottom panel in Table VIII demonstrates, therewas a sizable drop in the total number of citations produced byAmerican mathematicians, but the increased number of citationsproduced by the Soviet emigres more than compensated for thedrop–although the net increase is not significant.54 In sum, the
this time period total employment in statistics departments also declined slightly,from 1,123 to 1,099.
53. The prediction exercise uses the AMS counts of citations because the ISIseverely undercounts citations by Soviet mathematicians.
54. It may also be the case that mathematical work is now more often citedoutside mathematics. For example, experimental physicists may be using newlyavailable Soviet work on quantum theory in their research. It is certainly thecase that American papers outside mathematics cite mathematical papers.Measuring these citations is difficult, because the AMS data defines mathematicsso broadly that it includes applied mathematics, theoretical computer science, the-oretical physics, mathematical biology, and theoretical economics. We proxy non-mathematical citations of mathematical work by citations made by ISI papers
PRODUCTIVITY OF AMERICAN MATHEMATICIANS 1191
at Harvard U
niversity on August 21, 2012
http://qje.oxfordjournals.org/D
ownloaded from

evidence allows for a plausible (though weak) case that theAmerican mathematics market succeeded in replacing someproofs that would otherwise have been proven with a somewhatlarger number of slightly more interesting theorems.
It is problematic to conclude that there was a (small) netbenefit to American mathematics because the counterfactual isdifficult to observe. In mathematics (unlike in much of, say, eco-nomics), a result–that is, a proof–that is true is true for all time.This suggests that there is an opportunity cost to slightly lessinteresting proofs never being published to make way for slightlymore interesting ones; the less interesting proof could have been afoundation for a more important proof in the future. A completeevaluation of costs and benefits, therefore, would need to comparethe long-run value of the proofs that were proven by the Sovietemigres with the proofs that would have been proven by the dis-placed American mathematicians, many of whom were relativelyyoung and perhaps at their peak mathematical efficiency.
VI. International Differences
The evidence reported in the previous sections documentsthat American mathematicians whose research agenda mostoverlapped with that of the Soviets suffered a loss in productivityafter the collapse of the Soviet Union. However, the regressionsdo not directly link the decline in productivity to the physicalpresence of Soviet emigres in the United States.
As in studies of the labor market impact of immigration, itcan plausibly be argued that some (if not all) of the impact wouldhave been observed because of the increased globalization of themathematics marketplace after 1992, regardless of how manyemigres the United States actually admitted. After all, the mosthighly substitutable American mathematicians could havebecome less productive simply because the Soviets (regardless
which were not matched to AMS papers to ISI papers which were matched to AMSpapers. Using this proxy, we observe 256,000 such citations in 1978, and thisnumber rose to 1.8 million by 2007. However, citations to Soviet mathematicalresearch are quite rare throughout the entire period. These citations accountedfor 0.03% of the total in 1978 and 0.07% in 2007. It seems implausible, therefore,that Soviet mathematical research could have formed the basis for large improve-ments in American nonmathematical fields.
QUARTERLY JOURNAL OF ECONOMICS1192
at Harvard U
niversity on August 21, 2012
http://qje.oxfordjournals.org/D
ownloaded from
of where they were located) were free to compete for journalspace, financial grants, and other types of academic recognition.
In an important sense, a mathematician in any country out-side the former Soviet Union is competing with the Soviet emi-gres in two distinct markets. The first is a market defined alonggeographic lines, such as the national job market, where thepresence of the emigres may reduce labor market opportunities(Borjas 2003). The second is a market defined in the realmof ideas, where a mathematician is now competing with Soviets(both the emigres and the ones left behind) doing the sametype of research and who will be competing for journal spaceand for the rewards that come with increased academicrecognition.55
Our data can shed light on the relative importance of compe-tition in ‘‘bodies’’ versus ‘‘ideas.’’ In particular, the collapse of theSoviet Union led to a moderately sized diaspora of Soviet math-ematicians to many countries, not just the United States. To pro-vide a precise definition of the preexisting mathematics workforcein each country, we restrict the analysis to the years between1984 and 2008. A mathematician is allocated to a specific countryif at least half the papers published between 1984 and 1989 usedan affiliation in that country. Table IX lists the 26 countries thathad a preexisting mathematical community of at least 500 activemathematicians prior to the collapse of the Soviet Union. The top10 countries in this list have at least 2,000 active mathematiciansand account for 72.2% of all papers written (outside the SovietUnion) between 1984 and 1989, and these papers received 79.8%of all citations. The 26 countries in Table IX account for 89.3% ofall papers written, and those papers received 93.2% of allcitations.
We estimate that there are 1,051 mathematicians who pub-lished predominantly in the Soviet Union between 1978 and 1989or who received their doctoral degree from a Soviet institutionbetween 1960 and 1989, yet whose modal affiliation in thepost-1992 period was outside the bloc of countries formerlyknown as the Soviet Union. Of these Soviet mathematicians,336 (or 32.0%) ended up in the United States. Other countries,
55. Kaiser (2012) presents a fascinating analysis of how journals respond tochanges in the number of knowledge producers in the market for ideas.
PRODUCTIVITY OF AMERICAN MATHEMATICIANS 1193
at Harvard U
niversity on August 21, 2012
http://qje.oxfordjournals.org/D
ownloaded from

TA
BL
EIX
TH
ED
IAS
PO
RA
OF
SO
VIE
TM
AT
HE
MA
TIC
IAN
SA
FT
ER
TH
EC
OL
LA
PS
EO
FT
HE
SO
VIE
TU
NIO
N
Cou
ntr
yF
irst
-sta
geco
effi
cien
tN
um
ber
ofm
ath
emat
icia
ns
Nu
mbe
rof
emig
res
Imm
igra
nt
shar
e(%
)Q
ual
ity-
adju
sted
shar
e(%
)C
onn
ecti
vity
ind
ex
Un
ited
Sta
tes
–1.4
52**
22,4
4933
61.
502.
650.
199
Ch
ina
0.85
3*65
630
0.00
0.00
0.12
9G
erm
any
–0.4
6262
2366
1.06
1.68
0.13
1Ja
pan
0.19
048
487
0.14
0.47
0.12
6F
ran
ce–0
.915
**41
1472
1.75
3.05
0.12
9U
nit
edK
ingd
om–0
.982
**38
0478
2.05
2.82
0.12
6It
aly
–0.5
77**
3364
120.
362.
190.
123
Can
ada
–1.0
40**
3155
361.
141.
270.
166
Ind
ia–1
.299
**30
988
0.26
0.48
0.12
9P
olan
d–0
.530
*23
1033
1.43
1.56
0.10
6S
pai
n1.
902*
*16
147
0.43
0.20
0.13
3N
eth
erla
nd
s–1
.748
**13
747
0.51
0.06
0.14
3A
ust
rali
a0.
459
1178
221.
871.
640.
139
Isra
el–0
.803
1014
122
12.0
310
.33
0.16
9R
oman
ia–0
.177
1012
30.
300.
390.
103
Cze
chos
lova
kia
–0.4
3593
34
0.43
3.09
0.09
4B
razi
l0.
132
822
161.
951.
520.
145
Bu
lgar
ia–0
.108
808
40.
500.
160.
133
Sw
itze
rlan
d–0
.942
*66
14
0.61
0.10
0.13
0B
elgi
um
–1.4
01*
655
192.
901.
220.
091
Hu
nga
ry–2
.954
**65
45
0.76
0.53
0.11
7T
aiw
an–2
.043
590
10.
171.
710.
155
Yu
gosl
avia
–0.6
1254
32
0.37
0.00
0.11
9G
reec
e–1
.540
539
10.
190.
250.
141
Au
stri
a–0
.387
520
50.
960.
230.
128
Sw
eden
–1.4
97**
513
265.
0716
.61
0.13
5
Not
es:
An
‘‘act
ive’
’mat
hem
atic
ian
pu
blis
hed
atle
ast
one
pap
erin
the
per
iod
betw
een
1984
and
1989
.T
he
acti
vem
ath
emat
icia
ns
are
then
allo
cate
dto
the
cou
ntr
yof
thei
rm
odal
affi
liat
ion
du
rin
gth
isp
erio
d.
Th
efi
rst-
stag
eco
effi
cien
tis
the
coef
fici
ent
ofth
ein
tera
ctio
nbe
twee
nth
ein
dex
ofsi
mil
arit
yan
dth
ep
ost-
1992
du
mm
yva
riab
le,
esti
mat
edse
par
atel
yin
each
cou
ntr
y;an
*in
dic
ates
that
the
coef
fici
ent
isbe
twee
n1.
50an
d1.
99ti
mes
the
size
ofth
ecl
ust
ered
stan
dar
der
ror,
and
**in
dic
ates
that
itis
atle
ast
twic
eth
esi
zeof
the
stan
dar
der
ror.
Th
ed
esti
nat
ion
cou
ntr
yfo
rth
eS
ovie
tem
igre
sis
the
mod
alco
un
try
ofaf
fili
atio
nbe
twee
n19
92an
d20
08.
Th
e‘‘i
mm
igra
nt
shar
e’’
isth
era
tio
ofth
en
um
ber
ofem
igre
sin
each
cou
ntr
yto
the
nu
mbe
rof
acti
vem
ath
emat
icia
ns.
Th
e‘‘q
ual
ity-
adju
sted
shar
e’’is
the
rati
oof
the
tota
ln
um
ber
ofci
tati
ons
rece
ived
byth
eem
igre
sin
1984
–198
9to
the
tota
ln
um
ber
ofci
tati
ons
pro
du
ced
byth
eco
un
try’
sm
ath
emat
icia
ns
inth
atp
erio
d.
Th
eco
nn
ecti
vity
ind
exm
easu
res
the
pu
blic
atio
nli
nk
betw
een
mat
hem
atic
ian
sin
ap
arti
cula
rco
un
try
and
oth
erco
un
trie
s;se
eth
ete
xtfo
ra
defi
nit
ion
.
QUARTERLY JOURNAL OF ECONOMICS1194
at Harvard U
niversity on August 21, 2012
http://qje.oxfordjournals.org/D
ownloaded from

such as Israel or Germany, also received large numbers of Sovietemigres (122 in Israel and 66 in Germany). At the same time,other countries with a thriving mathematical community werebarely affected by the migration: China did not receive anySoviet emigres, Japan received seven, and India eight.
Table IX also reports the immigrant share, defined as theratio (in percent) of the number of emigres to the number of pre-existing mathematicians. Not surprisingly, there is a great deal ofvariation in the relative size of the supply shock across the 26countries, ranging from a maximum of 12.0% in Israel, to 5.1% inSweden, 1.9% in Australia, and a minimum of 0.0% in China.
There are, of course, quality differences across both the pre-existing mathematicians in different countries and across theemigres who chose to settle in different countries. A conceptuallybetter measure of the supply shock would adjust for these qualitydifferences. We calculated the percent increase in the number ofcitations due to the Soviet influx in each country. We define thequality-adjusted immigrant share as the ratio (in percent) of the1984–1989 (AMS) citations received by the emigres who eventu-ally moved to country i to the citations received by the mathem-aticians in that country over the same period. Notably, althoughthe quality-adjusted measure of the supply shock differs sub-stantially from the traditional immigrant share, it is below3% for almost all the countries. The two outliers are Israel andSweden, where the Soviet emigres increased the effective supplyof mathematicians by 10.3% and 16.6%, respectively.
We estimated the basic regression model first presented inequation (3) separately for each of the 26 different countries. Thegeneric regression model is given by:
yic"t# ! !i % !t % Xi"t#"c % #c"T & Indexi# % "i"t#,"7#
where yic(t) is the number of papers written by mathematician i,in year t, in country c. We estimated equation (7) using each of thethree alternative overlap indices.
The first column of Table IX reports the estimate of the coef-ficient #c (from the specification that uses the index of similarity).There is a lot of dispersion in the estimated coefficient: $1.45(0.13) in the United States, $0.53 (0.34) in Poland, 0.85 (0.53)in China, and $0.80 (0.66) in Israel. To illustrate thecross-country variation in the measured impact of the collapseof the Soviet Union, Figure IXA shows the scatter diagram relat-ing the estimate of #c to the quality-adjusted immigrant share for
PRODUCTIVITY OF AMERICAN MATHEMATICIANS 1195
at Harvard U
niversity on August 21, 2012
http://qje.oxfordjournals.org/D
ownloaded from
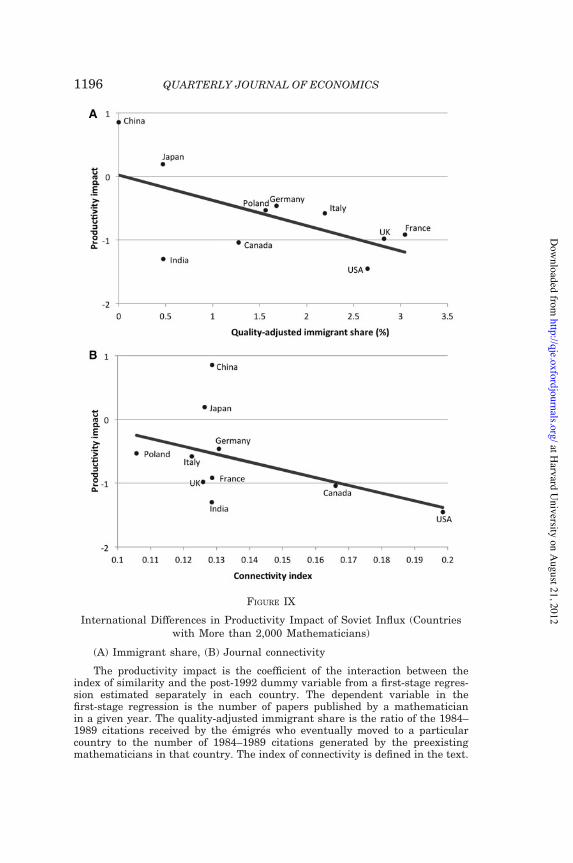
FIGURE IX
International Differences in Productivity Impact of Soviet Influx (Countrieswith More than 2,000 Mathematicians)
(A) Immigrant share, (B) Journal connectivity
The productivity impact is the coefficient of the interaction between theindex of similarity and the post-1992 dummy variable from a first-stage regres-sion estimated separately in each country. The dependent variable in thefirst-stage regression is the number of papers published by a mathematicianin a given year. The quality-adjusted immigrant share is the ratio of the 1984–1989 citations received by the emigres who eventually moved to a particularcountry to the number of 1984–1989 citations generated by the preexistingmathematicians in that country. The index of connectivity is defined in the text.
QUARTERLY JOURNAL OF ECONOMICS1196
at Harvard U
niversity on August 21, 2012
http://qje.oxfordjournals.org/D
ownloaded from
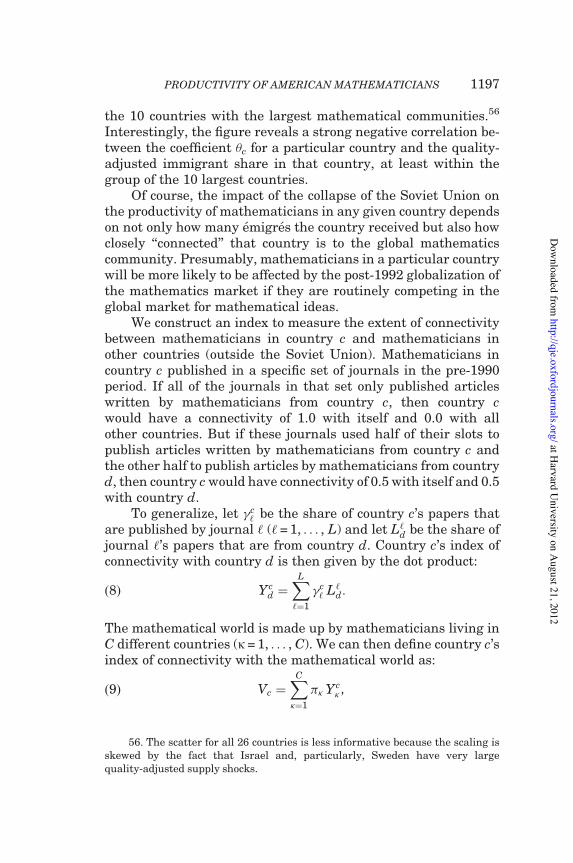
the 10 countries with the largest mathematical communities.56
Interestingly, the figure reveals a strong negative correlation be-tween the coefficient #c for a particular country and the quality-adjusted immigrant share in that country, at least within thegroup of the 10 largest countries.
Of course, the impact of the collapse of the Soviet Union onthe productivity of mathematicians in any given country dependson not only how many emigres the country received but also howclosely ‘‘connected’’ that country is to the global mathematicscommunity. Presumably, mathematicians in a particular countrywill be more likely to be affected by the post-1992 globalization ofthe mathematics market if they are routinely competing in theglobal market for mathematical ideas.
We construct an index to measure the extent of connectivitybetween mathematicians in country c and mathematicians inother countries (outside the Soviet Union). Mathematicians incountry c published in a specific set of journals in the pre-1990period. If all of the journals in that set only published articleswritten by mathematicians from country c, then country cwould have a connectivity of 1.0 with itself and 0.0 with allother countries. But if these journals used half of their slots topublish articles written by mathematicians from country c andthe other half to publish articles by mathematicians from countryd, then country c would have connectivity of 0.5 with itself and 0.5with country d.
To generalize, let "c‘ be the share of country c’s papers that
are published by journal ‘ (‘= 1, . . . , L) and let L‘d be the share ofjournal ‘’s papers that are from country d. Country c’s index ofconnectivity with country d is then given by the dot product:
Ycd !
XL
‘!1
"c‘ L‘d:"8#
The mathematical world is made up by mathematicians living inC different countries (k= 1, . . . , C). We can then define country c’sindex of connectivity with the mathematical world as:
Vc !XC
(!1
)( Yc( ,"9#
56. The scatter for all 26 countries is less informative because the scaling isskewed by the fact that Israel and, particularly, Sweden have very largequality-adjusted supply shocks.
PRODUCTIVITY OF AMERICAN MATHEMATICIANS 1197
at Harvard U
niversity on August 21, 2012
http://qje.oxfordjournals.org/D
ownloaded from
where pk is the share of the world’s population of mathematiciansresiding in country k.
We calculated the index defined in equation (9) for each coun-try.57 The estimated indices are reported in the last column ofTable IX. Note that there is substantial dispersion in the indexof connectivity: It is relatively large for the United States andCanada, but small for such countries as Belgium, Poland, andRomania. Figure IXB illustrates the relation between the coun-try-specific coefficient #c and the index of connectivity. Thereseems to be a negative relation between these variables, at leastamong the countries with the largest mathematical communities.
TABLE X
DETERMINANTS OF INTERNATIONAL DIFFERENCES IN IMPACT OF SOVIET SUPPLY SHOCK
Sample/variables
Measure of overlap index used infirst-stage regression
Correlationcoefficient
Index ofintensity
Index ofsimilarity
Ten largest countries:Immigrant share (%) –0.076 –0.041 –0.382
(0.029) (0.022) (0.130)Connectivity index –2.431 –1.812 –8.259
(0.633) (0.537) (10.188)R2 0.806 0.744 0.814
All 26 countries:Immigrant share (%) –0.013 –0.009 –0.062
(0.007) (0.005) (0.037)Connectivity index –2.609 –1.620 –10.553
(0.603) (0.517) (10.672)R2 0.230 0.167 0.374
Notes: Robust standard errors in parentheses. The dependent variable is the coefficient of the inter-action between the index of overlap and the post-1992 dummy variable from the first-stage regressionestimated separately in each country. The regressions in the top panel use the sample of 10 countrieswhere there are at least 2,000 active mathematicians, whereas the regressions in the bottom panel use the26 countries with at least 500 active mathematicians. The regressions are weighted by the inverse of thesampling variance of the dependent variable. The ‘‘immigrant share’’ is quality-adjusted, giving the ratioof the number of AMS citations received in 1984–1989 by Soviet emigres who eventually moved to countryi to the total number of citations received by mathematicians in country i over the same period. Theconnectivity index measures the publication link between mathematicians in a particular country andother countries; see the text for a definition.
57. The data used to calculate the index of connectivity is the full ISI listing ofall publications in mathematics and related fields between 1978 and 1989. Notethat these ISI data have not yet been matched with the AMS database, so missingpapers due to matching difficulties are not a problem.
QUARTERLY JOURNAL OF ECONOMICS1198
at Harvard U
niversity on August 21, 2012
http://qje.oxfordjournals.org/D
ownloaded from

We wish to examine the extent to which the productivityimpact of the collapse of the Soviet Union on competingWestern mathematicians (as measured by #c) is related to boththe physical shock of emigres and the increased competition inthe global market for ideas. We estimated a second-stage regres-sion model of the form:
#c ! *0 % *1pc % *2Vc % uc,"10#
where pc is the quality-adjusted immigrant share, and Vc is theindex of connectivity. The regression is weighted by the inverse ofthe sampling variance of the dependent variable.
We estimated two alternative specifications of equation (10)to ensure that the results are not driven by outlying observations.In particular, we estimated the regression using both the group ofthe 10 largest countries, as well as the entire group of 26 coun-tries listed in Table IX. Regardless of the specification used,Table X shows that international differences in the productivityimpact of the collapse of the Soviet Union are strongly and nega-tively related to both geographic and idea competition. In otherwords, the adverse effect of the collapse of the Soviet Union oncompeting mathematicians in other countries was larger in coun-tries that had a large influx of Soviet emigres and in countrieswhere the mathematicians traditionally compete in the world-wide market for journal space.
It is also interesting to note that the explanatory power of thesecond-stage regressions is quite high; the R2 is around 0.8 in theregression that uses the 10 countries with the largest mathemat-ics communities, and between 0.2 to 0.4 in the full set of countries.It seems that a great deal of the international variation in theproductivity impact of the collapse of the Soviet Union can beexplained by a simple model that stresses the competition intro-duced by both additional bodies and additional theorems.
VII. Summary
Knowledge production is a central ingredient in any discus-sion of long-term economic growth. It is widely recognized thathuman capital spillovers play a fundamental role in the know-ledge production function: the knowledge produced by oneresearcher is both an output and an input into another research-er’s production function. Not surprisingly, there is a consensus
PRODUCTIVITY OF AMERICAN MATHEMATICIANS 1199
at Harvard U
niversity on August 21, 2012
http://qje.oxfordjournals.org/D
ownloaded from

among policy makers that increases in the supply of a highlyskilled workforce will increase the productivity of thepreexisting workforce, and lead to a substantial increase innational wealth.
This article examines the impact of the influx of renownedSoviet mathematicians into the American (and global) mathem-atics community after the collapse of the Soviet Union. In theperiod between the establishment and fall of communism,Soviet mathematics developed in an insular fashion and alongdifferent specializations than American mathematics. After thecollapse of the Soviet Union, over 1,000 Soviet mathematicians(nearly a tenth of the preexisting workforce) migrated to othercountries, with about 30% settling in the United States. As aresult, some fields in the American mathematics communityexperienced a flood of new mathematicians, theorems, andideas, whereas other fields received few Soviet mathematiciansand gained few potential insights.
We constructed a data set that contains information on theauthorship, subject, and affiliation of all papers published inmathematics over the past 70 years. These data allow us to docu-ment the location, affiliation, and complete publication and cit-ation records of mathematicians who were active in either theSoviet Union or the United States for the past few decades.
Our empirical analysis unambiguously documents that thetypical American mathematician whose research agenda mostoverlapped with that of the Soviets suffered a reduction in prod-uctivity after the collapse of the Soviet Union. Based solely on thepre-1992 age-output profile of American mathematicians, we findthat the actual post-1992 output of mathematicians whose workmost overlapped with that of the Soviets (and hence could havebenefited more from the influx of Soviet ideas) is far below whatwould have been expected. The data also reveal that theseAmerican mathematicians became much more likely to switchinstitutions, that the switch entailed a move to a lower qualityinstitution, that many of these American mathematicians ceasedpublishing relatively early in their career, and that they becamemuch less likely to publish a home run after the arrival of theSoviet emigres. Although total output declined for the preexistinggroup of American mathematicians, the gap was filled in by thecontributions of Soviet emigres. There is no evidence, however, ofa substantial increase in the size of the American mathematicspie as a result of the Soviet influx.
QUARTERLY JOURNAL OF ECONOMICS1200
at Harvard U
niversity on August 21, 2012
http://qje.oxfordjournals.org/D
ownloaded from

We also examined how the collapse of the Soviet Union–and the subsequent diaspora of Soviet mathematicians acrossmany countries–differentially affected the productivity of thepreexisting mathematicians in different countries. It turns outthat both competition in the local job market (generated byan increase in the number of mathematicians competing for arelatively fixed number of research jobs) and competition inthe international journals market (generated by the fact thatmany mathematicians compete for space in the same limitedset of journals regardless of where they reside) help deter-mine the productivity impact of the collapse of the SovietUnion. The productivity of the mathematicians whosepre-1990 work most overlapped with that of the Sovietsdeclined most when the country received a relatively largenumber of Soviet emigres and when that country wasstrongly interconnected in the journals market with othercountries.
Our empirical evidence does not support the conjecturethat the Soviet influx generated substantial positive external-ities for the preexisting mathematics workforce. We do notbelieve this finding arises because American mathematiciansdid not gain new ideas from the Soviet influx. Instead, weinterpret the evidence as suggesting that there may be sur-prisingly resilient constraints that can counteract these gains.We have shown that some of these constraints exist in the jobmarket and some of the constraints exist in the market fortheorems.
There may even be additional constraints that are more fun-damental in knowledge production. New research can only beassimilated into the existing body of knowledge if prominent re-searchers at the frontier of a field allocate their limited time andeffort to do so. As a result, even in a world with nonrival ideas,scarcity of resources and diminishing marginal productivity maycome into play.
HARVARD UNIVERSITY AND NATIONAL BUREAU OF ECONOMIC RESEARCH,UNIVERSITY OF NOTRE DAME
Supplementary Material
An Online Appendix for the article can be found on QJEonline (qje.oxfordjournals.org).
PRODUCTIVITY OF AMERICAN MATHEMATICIANS 1201
at Harvard U
niversity on August 21, 2012
http://qje.oxfordjournals.org/D
ownloaded from

References
Abramitzky, Ran, and Isabelle Sin, ‘‘Book Translations as Idea Flows: The Effectsof the Collapse of Communism on the Diffusion of Knowledge,’’ StanfordUniversity Working Paper, 2011.
American Mathematical Society, ‘‘Academic Recruitment and Hiring Report,’’AMS Notices, various issues.
Azoulay, Pierre, Joshua S. Graff Zivin, and Jialan Wang, ‘‘Superstar Extinction,’’Quarterly Journal of Economics, 125 (2010), 549–589.
Borjas, George J., ‘‘The Labor Demand Curve Is Downward Sloping: Reexaminingthe Impact of Immigration on the Labor Market,’’ Quarterly Journal ofEconomics, 118 (2003), 1335–1374.
Cutler, David, and Edward L. Glaeser, ‘‘Are Ghettos Good or Bad?’’ QuarterlyJournal of Economics, 112 (1997), 827–872.
Foray, Dominique. Economics of Knowledge. (Cambridge, MA: MIT Press, 2004).Furman, Jeff, Margaret Kyle, Iain Cockburn, and Rebecca Henderson,
‘‘Knowledge Spillovers, Geographic Location and the Productivity ofPharmaceutical Research,’’ Annales d’Economie et de Statistique, 79/80(2005), 167–190.
Ganley, Gladys D., Unglued Empire: The Soviet Experience with CommunicationsTechnologies. (New York: Praeger, 1996).
Ganguli, Ina, ‘‘Saving Soviet Science: The Impact of Grants When GovernmentR&D Funding Disappears,’’ unpublished manuscript, Harvard University,2010.
Graham, Loren, and Jean-Michel Kantor, Naming Infinity: A True Story ofReligious Mysticism and Mathematical Creativity. (Cambridge, MA:Harvard University Press, 2009).
Howe, Marvine, ‘‘For Emigre Scientists, Job Hunting Is Difficult,’’ New YorkTimes, August 12, 1990.
Hunt, Jennifer, and Marjolaine Gauthier-Loiselle, ‘‘How Much Does ImmigrationBoost Innovation?’’ American Economic Journal: Macroeconomics, 2 (2010),31–56.
International Monetary Fund et al., A Study of the Soviet Economy. vol.3(Washington, DC: IMF, 1991).
Jones, Charles I., ‘‘Growth and Ideas,’’ Handbook of Economic Growth, 1 (2005),1063–1111.
Jones, Charles I., and Paul M. Romer, ‘‘The New Kaldor Facts: Ideas, Institutions,Population, and Human Capital,’’ American Economic Journal:Macroeconomics, 2 (2010), 224–245.
Kaiser, David, ‘‘Booms, Busts, and the World of Ideas: Enrollment Pressures andthe Challenge of Specialization,’’ Osiris (2012), forthcoming.
Kerr, William R., and William F. Lincoln, ‘‘The Supply Side of Innovation: H-1BVisa Reforms and U.S. Ethnic Invention,’’ Journal of Labor Economics, 28(2010), 473–508.
Kolata, Gina, ‘‘Soviet Scientists Flock to U.S., Acting as Tonic for Colleges,’’ NewYork Times, May 8, 1990.
Laqueur, Walter. The Dream That Failed: Reflections on the Soviet Union. (NewYork: Oxford University Press, 1996).
Lefschetz, Solomon, ‘‘Topology,’’ In Summary Report of the Panel on SovietMathematics, ed. LaSalle, Joseph P.,’’ (Baltimore: Research Institute forAdvanced Study, 1961).
Lucas, Robert E., ‘‘On the Mechanics of Economic Development,’’ Journal ofMonetary Economics, 22 (1988), 3–42.
–––, ‘‘Ideas and Growth,’’ Economica, 76 (2009), 1–19.McClure, Donald, ‘‘AMS Task Force on Employment Report to the Mathematical
Community Part I: Academic Hiring Survey, 1991–1992,’’ AMS Notices, 39(1992), 754–758.
O’Connor, J. J., and E. F. Robertson, ‘‘Biography of Nikolai Nikolaevich Luzin,’’MacTutor History of Mathematics Archive, University of St. Andrews,Scotland, 1999. http://www-history.mcs.st-and.ac.uk.
O’Dette, Ralph E., ‘‘Russian Translation,’’ Science, 125 (1957), 579–585.
QUARTERLY JOURNAL OF ECONOMICS1202
at Harvard U
niversity on August 21, 2012
http://qje.oxfordjournals.org/D
ownloaded from

Polyak, B. T., ‘‘History of Mathematical Programming in the USSR: Analyzing thePhenomenon,’’ Mathematical Programming, 91 (2002), 401–416.
Romer, Paul M., ‘‘Increasing Returns and Long-Run Growth,’’ Journal of PoliticalEconomy, 94 (1986), 1002–1037.
–––, ‘‘Endogenous Technological Change,’’ Journal of Political Economy, 98(1990), S71–S102.
Smithies, F., ‘‘The 1936 Luzin Affair: Review of Delo akademika NikolayaNikolaevicha Luzina [The Case of Academician Nikolai NikolaevichLuzin],’’ MacTutor History of Mathematics Archive, University of St.Andrews, Scotland, 2003. http://www-history.mcs.st-and.ac.uk.
Tybulewicz, A., ‘‘Cover-to-Cover Translations of Soviet Technical Journals,’’ AslibProceedings, 22 (1970), 55–62.
U.S. National Science Foundation. Federal Funds for Research and Development:Fiscal Years 1973–2003. (Washington, DC: Division of Science ResourcesStatistics, 2004).
Waldinger, Fabian, ‘‘Quality Matters: The Expulsion of Professors and theConsequences for Ph.D. Student Outcomes in Nazi Germany,’’ Journal ofPolitical Economy, 118 (2010), 787–831.
–––, ‘‘Peer Effects in Science–Evidence from the Dismissal of Scientists in NaziGermany,’’ Review of Economic Studies (2012), forthcoming.
PRODUCTIVITY OF AMERICAN MATHEMATICIANS 1203
at Harvard U
niversity on August 21, 2012
http://qje.oxfordjournals.org/D
ownloaded from
This page intentionally left blank
at Harvard U
niversity on August 21, 2012
http://qje.oxfordjournals.org/D
ownloaded from