2012 westerville survey report (5.10.12)
TRANSCRIPT

City of Westerville Resident Survey
Report of Findings
May 10, 2012
Submitted by:
Strategic Research Group 995 Goodale Blvd. Columbus, OH 43212 Voice: (614) 220-8860 Fax: (614) 220-8845 Toll Free Number: (800) 341-3660 Website: www.strategicresearchgroup.com
2
City of Westerville Resident Survey Results
Table of Contents
Table of Contents ....................................................................................................................... 2
Table of Figures and Tables ....................................................................................................... 3
Executive Summary ................................................................................................................... 5
Overview and Methodology ........................................................................................................ 7
Report Findings .......................................................................................................................... 9
1. General Perceptions of Westerville ..................................................................................... 9
2. Community Priorities .........................................................................................................16
3. Safety ................................................................................................................................21
4. Parks & Recreation Facilities .............................................................................................24
5. Parks Services ..................................................................................................................25
6. Recreation Services ..........................................................................................................27
7. Planning & Development Services .....................................................................................28
8. Public Works Services .......................................................................................................29
9. Utility Services ...................................................................................................................30
10. Communications/Citizen Input Issues ..............................................................................31
Television...........................................................................................................................32
Website Usage ..................................................................................................................36
11. Current Events/Strategic Planning ...................................................................................40
12. Demographic Information ................................................................................................52
13. Summary of Group Difference Results ............................................................................56
14. Summary of Comparisons between 2009 and 2012 Survey Results ................................58
Appendix A: Percentage and Number Response for Item Results Presented as Means ...........59
Appendix B: Westerville Zones .................................................................................................66

3
Table of Figures and Tables
Table 1.1. What two words best describe Westerville? ............................................................... 9
Table 1.2. What do you like LEAST about living in Westerville? ................................................10
Figure 1.1. Westerville offers a good mix of commercial, office, and residential land uses. .......10
Figure 1.2. Westerville offers a good variety of housing choices in terms of pricing and selection.
.................................................................................................................................................10
Figure 1.3. Westerville does a good job of managing housing growth. ......................................11
Figure 1.4. Westerville does a good job of managing retail and business growth. .....................11
Figure 1.5. The City of Westerville promotes a business friendly environment to foster economic
development. ............................................................................................................................12
Figure 1.6. The City of Westerville should give tax breaks and other financial incentives to
employers to bring new businesses into the City. ......................................................................12
Figure 1.7. Westerville’s overall traffic flow on main streets is at least as good as traffic flow on
main streets in other Central Ohio suburbs. ..............................................................................13
Figure 1.8. Traffic flows on Westerville’s main arteries have improved in the last three years. ..13
Figure 1.9. The quality of Westerville’s infrastructure has improved in the last three years. ......14
Figure 1.10. I believe the City of Westerville does a good job of promoting recycling and
conservation. ............................................................................................................................14
Figure 1.11. Mean Ratings for Departments and Staff ...............................................................15
Figure 2.1. I pay a lot of attention to City-related issues (not including Westerville School District
or library issues). .......................................................................................................................16
Figure 2.2. Please indicate how important each is to you when thinking about why you live in
Westerville. ...............................................................................................................................17
Table 2.1. Of the following potential issues, which is the MOST IMPORTANT issue for the City
of Westerville? ..........................................................................................................................18
Table 2.2. Which of the following issues facing the Westerville community is MOST
IMPORTANT? ...........................................................................................................................19
Figure 2.3. It is important for all local government agencies, community leaders, and civic
organizations to work together to tell a consistent story about the City of Westerville................20
Figure 3.1. Mean Ratings for Personal Safety ...........................................................................21
Figure 3.2. Which of the following is the MOST IMPORTANT issue for Police Services? ..........22
Figure 3.3. Mean Ratings for Public Safety Services .................................................................23
Figure 4.1. Mean Ratings for Parks & Recreation Facilities .......................................................24
Figure 4.2. Mean Ratings for Parks & Recreation Facilities (new items)....................................25
Figure 5.1. Mean Ratings for Park Services ..............................................................................26
Figure 6.1. Mean Ratings for Recreation Services ....................................................................27
Figure 7.1. Mean Ratings for Planning & Development Services ..............................................28
Figure 8.1. Mean Ratings for Public Works Services .................................................................29
Figure 9.1. Mean Rating for Utility Services ..............................................................................30
Table 10.1. What information source do you find MOST USEFUL/SECOND MOST USEFUL in
staying informed of City related issues? ....................................................................................31
Figure 10.1. What type of television programming access/service does your household have? 32
Figure 10.2. In the past two years, have you watched City of Westerville programming on the
public service access channel (Ch. 3 or WOCC-TV)? ...............................................................33
Figure 10.3. How frequently do you watch City of Westerville TV programs? ............................34

4
Figure 10.4. Perceived Level of Quality of City of Westerville TV Programming ........................34
Table 10.2. What type of programming would you be MOST INTERESTED/SECOND MOST
INTERESTED in watching on public service channels like WOCC-TV? ....................................35
Figure 10.5. How often do you visit the Westerville website? ....................................................36
Figure 10.6. The Westerville Web site is visually interesting. ....................................................37
Figure 10.7. The Westerville Web site (www.westerville.org) is easy to navigate to the
information I want. .....................................................................................................................37
Figure 10.8. The Westerville website provides useful information. ............................................38
Figure 10.9. If the City provided the capability of paying your City utility bills on the City Website
would you choose to use this option? ........................................................................................38
Table 10.3. Information or Services that Would Make Respondents Use the Westerville Website
More Often ................................................................................................................................39
Figure 11.1. Mean Ratings for Perceived Importance of Each Issue in Light of an Aging
Population .................................................................................................................................40
Table 11.1. What should the community be doing to attract and retain young professionals? ...41
Figure 11.2. While the nation recovers from the economic downturn, how important are the
following issues for the City in terms of financial stewardship? ..................................................42
Figure 11.3. How important is each of the following electronic services or resources to you? ...43
Figure 11.4. Willingness to watch at least 30 minutes of City developed and produced monthly
television programming .............................................................................................................44
Figure 11.5. How important do you think it is that the City purchase, develop and preserve
available land for parks and open spaces? ...............................................................................45
Figure 11.6. How important is maintaining a vibrant Uptown district? ........................................46
Figure 11.7. Visited Uptown Westerville in the past 12 months .................................................46
Figure 11.8. Reasons for visiting Uptown Westerville in the past 12 months .............................47
Figure 11.9. How concerned are you about crime in Westerville? .............................................48
Figure 11.10. Have you noticed the road and aesthetic improvements made along the S. State
St. corridor? ..............................................................................................................................49
Figure 11.11. How important do you think the revitalization of the S. State St. corridor is to the
long-term health and vitality of the City?....................................................................................49
Table 11.2. What are areas of opportunity for Westerville? .......................................................50
Table 11.3. What areas of concern, if unaddressed, would diminish the quality of life in
Westerville in the future? ...........................................................................................................51
Figure 12.1. What is your gender? ............................................................................................52
Figure 12.2. What is your age? (Breakout Variable) ..................................................................52
Figure 12.3. How many children under the age of 18 live at your residence? ............................52
Figure 12.4. How many adults 18 or older live at your residence?.............................................52
Figure 12.5. Marital Status ........................................................................................................53
Figure 12.6. Race .....................................................................................................................53
Figure 12.7. How long lived in Westerville? (Breakout Variable) ...............................................53
Figure 12.8. Do you rent or own your home? (Breakout Variable) .............................................53
Figure 12.9. What is the last grade of school that you completed? ...........................................54
Figure 12.10. Which of the following best describes your household income? ..........................54
Table 12.1. In which community does the primary and secondary wage earner of your
household work? .......................................................................................................................55
5
Executive Summary
The 2012 City of Westerville Resident Survey is the third survey of community residents
commissioned by the City in recent years. The Resident Survey seeks to evaluate residents’
perception of city government, municipal services, community services, the City’s economic
status, and other aspects of community life. The 2012 survey retains many of the same items as
the 2005 and 2009 survey, but also includes new questions intended to capture current issues
and pressing needs.
The 2012 survey was accessible to residents online between February 21 and March 23, 2012,
for a total of 33 days; residents were invited to take the survey and were provided an access
passcode via postcard. In total, 837 residents completed the survey.
As in previous years, residents’ perceptions of Westerville, its government, and the various
services and facilities it offers are quite positive overall. One clear sign of this sentiment is the
overwhelming number of positive responses residents gave when asked to describe Westerville
in their own words. Most commonly, residents describe Westerville as “friendly” or some
variation thereof. “Family,” or variations such as “family-friendly” and “family-oriented” were
mentioned second most often, and “safe” was the third most often mentioned word.
Along similar lines, when presented a list of potential reasons why they live in Westerville and
asked to indicate how important each is to them (a new survey item for 2012), respondents
gave “overall safety of the community” the highest rating by a wide margin, followed by “the
family-friendly nature of the City.”
Just as in 2009, “Fiscal management and responsibility” was chosen as the most important
issue for the City of Westerville by a wide margin. With regard to personal concerns for citizens,
“routine patrol of residential areas” was most often identified as the most important issue,
followed by “maintaining emergency response times,” also mirroring 2009 responses.
Residents continue to be satisfied issues related to land use, availability and pricing of housing,
and management of economic growth. Further, 69 percent of respondents agree or strongly
agree that the quality of Westerville’s infrastructure has improved in the last three years
(another item new to the survey). However, traffic issues (including lack of public transportation)
are a persisting concern; when asked an open-ended question about what they like least about
living in Westerville, traffic was cited most often. Additionally, only 42 percent of residents
agreed or strongly agreed that traffic flows on Westerville’s main arteries have improved in the
last three years, compared to 50 percent in 2009. However, there is some good news: the
majority of residents (68 percent) agrees or strongly agrees that Westerville traffic flows on main
streets are at least as good as other Columbus suburbs.
The fairly high levels of perceived safety expressed in previous years, whether in one’s own
home or neighborhood in the day or night, remain high in 2012. As would be expected,
residents’ perceived safety is a bit lower in City parks, bikeways, and leisure paths than in their
own homes or neighborhoods; however, perceived levels of safety in these locations still equate
to ratings of “safe.” Also of note, there has been a significant increase in the score for perceived
safety inside one’s home between 2009 and 2012.

6
Along similar lines, the relatively high levels of satisfaction with a range of City services and
facilities expressed in previous years have largely held steady, although there have been a few
changes between 2009 and 2012. For example, with regard to public safety services, there was
a significant decrease between 2009 and 2012 in the ratings for fire prevention and inspection
and fire safety and education. Conversely, ratings in 2012 were significantly higher than those in
2009 for police community outreach services. Additionally, there was a significant decline in
ratings from 2009 to 2012 for three parks services: soccer fields, baseball/softball parks, and
bikeways/leisure paths. However, the ratings in 2012 are still higher than those from 2005. One
particularly notable difference in 2012 was the high rating given to the Highlands Park Aquatic
Center (referred to as the “Pool at Highlands Park” in the 2005 and 2009 surveys), likely a
reflection of recent renovations and improvements.
The 2012 survey included a new section which solicits residents’ opinions on various issues
pertaining to the current status of the City of Westerville as well as future opportunities, and is
intended to assist City leaders in strategic planning efforts. Respondents believe that, as the
community demographics shift toward an older population, “emergency services” is the most
important issue as well as “convenient access to healthcare” and “convenient access to
shopping and business services.” They place strong importance on maintaining a vibrant
Uptown district and tend to think that the City should purchase, develop and preserve available
land for parks and open spaces. They see improving traffic (e.g., flow) and parking availability
as the key areas of opportunity for Westerville, in addition to attracting new or different
businesses to the area as well as affordable housing. Looking forward, they see crime as a vital
area of concern that, if unaddressed, would diminish the quality of life in Westerville in the
future, as well as traffic issues, and high taxes/increasing costs.

7
Overview and Methodology
In order to better serve its constituents the City of Westerville commissions a public opinion
survey of its residents on a regular basis. Strategic Research Group (SRG) has conducted this
survey in 2005, 2009, and again in 2012.
The 2012 web-based survey was available to residents between February 21 and March 23,
2012, for a field period of 33 days. A postcard was sent to all Westerville households with
instructions on how to access the survey and a unique identifier to be used as a passcode for
accessing the survey. The Westerville City Manager’s Office also placed an ad in the
Westerville News & Public Opinion newspaper several days before the survey period began,
and again during the third week of the survey field period.
A total of 865 Westerville residents responded to the survey. However, the final respondent pool
was limited to those who had answered at least 50 percent of the items. Twenty-eight residents
did not meet this threshold, resulting in a final number of 837 respondents. This is lower than
the respondent pool of 1,324 for 2009; however, the survey field period in 2012 was 15 days
shorter than in 2009. Also, a reminder postcard was sent to residents in 2009 but not in 2012.
The report is split into several sections that can be categorized into four overall themes:
• The first three sections deal with the residents’ overall opinions of Westerville and its city leaders and departments, as well as residents’ perceptions about the issues facing the City, particularly with regard to safety.
• Sections 4-9 present the residents’ responses to questions regarding city services and facilities, including parks and recreation, planning and development, public works, and utility services.
• Section 10, “Communication/Citizen Input Issues,” looks at use of and opinions regarding the various information services that Westerville residents may use to gain information about their city.
• Section 11, “Current Events/Strategic Planning,” is a new section in 2012 that assesses residents’ opinions on various issues pertaining to the current status of the City of Westerville as well as future opportunities.
• Section 12 presents the respondents’ demographic characteristics, which lends insight and context when interpreting the findings.
In each section, survey results are presented either as percentages or means (i.e., averages).
Means can range from 1.00-4.00, and higher means always indicate a positive sentiment. In
instances when mean findings are presented, percentage responses are provided in Appendix
A.
Along with the 2012 survey results, results from 2005 and 2009 are presented where
appropriate and any significant differences in responses between 2009 and 2012 are cited.
8
In addition to computing basic frequencies and descriptive statistics for each of the questions,
SRG also ran appropriate statistical tests (e.g., chi-square, Analysis of Variance (ANOVA), and
t-tests) to determine if the respondents’ answers differed as a function of the following
demographic variables:
• Years of residence in Westerville, coded into the following five categories: 1) one year or
less, 2) 2-5 years, 3) 6-10 years, 4) 11-25 years, and 5) 26 years or more.
• Respondent age, coded into five categories: 1) 18-40, 2) 41-50, 3) 51-60, 4) 61-70, and
5) 71 or older.1
• Whether the respondent owns or rents his or her home. For 2012, the option “Other” was
also provided; however, only three respondents chose this option.
• Zone 1-4, which indicates the municipal zones that were provided by the city (see
Appendix B for a map of the zone areas).
The frequency distributions for these four breakout variables are provided in Section 12, along
with the other demographic information that was collected from respondents.
Only those differences for each item that were found to be statistically significant at the p < .05
level with a 95 percent confidence interval are reported under the heading “Group Differences”
in a section. The term “statistically significant” implies that the group differences are highly
unlikely to be obtained as a result of chance or sampling error.
1 When reviewing response differences by age groups, please keep in mind that the term “younger” is
relative to others who participated in the survey and not the general language use of “young.”

9
Report Findings
1. General Perceptions of Westerville
This section provides the findings to a number of questions soliciting residents’ opinions on a
number of general aspects of Westerville, such as commercial and residential land use, growth
management, economic development, infrastructure, traffic, and City staff.
Residents were also given the opportunity to provide open-ended responses to a couple of
questions regarding their overall perceptions of Westerville. First, residents were asked, “What
two words best describe Westerville?” Of the 837 survey respondents, 765 provided a response
(not including “non-responses” such as “don’t know” or “can’t think of anything”). Responses
were reviewed and coded into categorical themes based largely on those created for the 2009
survey report and modified somewhat to reflect new trends. Table 1.1 provides the categories
as well as the percentage of respondents whose response fell into each category. Please note
that, because up to two responses were coded for each respondent, the total percentage will
exceed 100.
The trends in 2012 closely mirror those from 2009. First, the most common word used to
describe Westerville was “friendly” or a very similar word such as “caring,” “helpful,” or
“welcome.” “Family,” or variations such as “family-friendly” and “family-oriented” were mentioned
second most often, and “safe” was the third most often mentioned word. Notably, with the
exception of “high taxes/expensive,” all of the categories reflect a positive sentiment toward
Westerville. Although there were some negative responses given, they were too few in number
to be coded into a categorical theme.
Table 1.1. What two words best describe Westerville?
Categorical Response Percent Categorical Response Percent
Friendly/caring/helpful/welcome 25.6% High taxes/expensive 4.3%
Family/family friendly/family oriented 19.7% Active/fun/vibrant/busy 4.1%
Safe 16.6% Pleasant/charming/relaxed/easy 3.3%
Nice/nice place (to live) 12.3% Comfortable 2.4%
Quiet/small town/hometown/homey/
peaceful/quaint 7.5% Good management/good services 2.2%
Convenient 6.3% Community 2.0%
Clean 4.8% Beautiful/appealing 1.8%
Parks/bikeways/outdoors 4.6% Diverse 1.3%
Additionally, respondents were asked a second open-ended response question, “What do you
like least about living in Westerville?” Of the 837 survey respondents, 701 provided a response
(excluding a small number of “non-responses” as well as 37 who indicated that they like
everything about Westerville). The responses were reviewed and coded into categorical
themes, again using the categories created for the 2009 survey as a guide. As seen in Table
1.2, traffic issues were cited most often by a pretty wide margin, with city taxes, property taxes,

10
community development issues (e.g., vacant lots/buildings; lack of adequate restaurants,
entertainment, and retail options, etc.), and school levies also being mentioned by at least 10
percent of residents. These trends closely mirror those found in 2009, although in 2009 city
taxes were cited more often than traffic issues, and school levies was not identified as a
common theme (possibly due to the timing of the survey).
Table 1.2. What do you like LEAST about living in Westerville?
Categorical Response Percent Categorical Response Percent
Traffic/lack of public transportation 27.8% Roads/sidewalk maintenance/not pedestrian friendly
4.9%
City taxes 19.4% Residents 3.1%
Property taxes 11.6% Poor spending by City 3.1%
Community development issues 11.4% Walmart coming to town 2.9%
School levies 10.6% School taxes 2.7%
City staff/leaders 6.1% Quality of schools 2.1%
Figures 1.1 and 1.2 present the respondents’ opinions regarding the variety of housing choices
and the mix of land use in Westerville. The respondents believe Westerville has found a positive
mix of land uses with 91 percent agreeing that Westerville offers a good mix of commercial,
office and residential land uses. In addition to having a good land use mix, Westerville residents
also believe the City offers a good variety of housing choices in terms of pricing and selection,
with 89 percent of residents agreeing or strongly agreeing. The pattern of responses in 2012
does not differ significantly from 2009. However, for both items, since 2005, there has been a
shift from “agree” to “strongly agree.”
Figure 1.1. Westerville offers a good mix of commercial, office, and
residential land uses.
Figure 1.2. Westerville offers a good variety of housing choices in terms
of pricing and selection.
32.6%
58.5%
4.8%
1.2%
2.9%
36.3%
54.9%
6.6%
0.9%
1.3%
9.8%
73.8%
11.0%
4.0%
1.5%
0% 25% 50% 75% 100%
Strongly Agree
Agree
Disagree
Strongly Disagree
DK/NA
2012
2009
2005
31.2%
58.0%
6.8%
1.0%
3.0%
36.0%
55.0%
6.3%
1.1%
1.6%
13.7%
73.2%
9.6%
1.5%
1.8%
0% 25% 50% 75% 100%
Strongly Agree
Agree
Disagree
Strongly Disagree
DK/NA
2012
2009
2005

11
Group Differences
Years of residence: No significant differences.
Age: No significant differences.
Rent or own home: A greater percentage of homeowners agree that Westerville offers a good
variety of housing choices in terms of pricing and selection than renters.
Zone: No significant differences.
Figures 1.3 and 1.4 indicate that a strong majority of survey respondents continue to believe
that the City is doing a good job of managing the growth of housing, retail, and business. In
2012, 18 percent strongly agree and overall 75 percent agree the city is doing a good job of
managing housing growth compared to 20 percent strong agreement and 78 percent overall
agreement in 2009. With regard to managing retail and business growth, in 2012, 17 percent
strongly agree and 72 percent agree overall compared to 21 percent strongly agree and 76
percent overall agreement in 2009; this decrease in agreement from 2009 from 2012 is
statistically significant. Also of note, for both items, the percentage of respondents who are
unsure or felt the item was not applicable doubled or nearly doubled between 2009 and 2012.
Figure 1.3. Westerville does a good job of managing housing growth.
Figure 1.4. Westerville does a good job of managing retail and business
growth.
Group Differences
Years of residence: Westerville’s newest residents (those living in Westerville one year or less)
are most likely to strongly agree that the City does a good job of managing housing growth.
17.6%
56.9%
12.7%
3.6%
9.2%
20.1%
57.6%
14.4%
3.4%
4.6%
4.6%
49.4%
27.6%
12.4%
6.0%
0% 25% 50% 75% 100%
Strongly Agree
Agree
Disagree
Strongly Disagree
DK/NA
2012
2009
2005
17.3%
54.4%
17.0%
6.8%
4.5%
20.5%
55.1%
17.7%
4.3%
2.5%
4.5%
52.2%
27.0%
12.4%
3.8%
0% 25% 50% 75% 100%
Strongly Agree
Agree
Disagree
Strongly Disagree
DK/NA
2012
2009
2005

12
Age: Residents 71 years of age and older have the highest general agreement that Westerville
does a good job of managing housing growth and that Westerville does a good job of managing
retail and business growth.
Rent or own home: No significant differences.
Zone: Zone 2 residents are more likely to agree that Westerville does a good job of managing
retail and business growth than other residents.
As seen in figures 1.5 and 1.6, the majority of survey participants believe the City promotes a
positive business environment and should use tax breaks and financial incentives to attract new
business (with overall agreement of 72 percent and 64 percent, respectively). For both items,
the pattern of results has not changed significantly from 2009 to 2012.
Despite the overall agreement with the use of financial incentives, 29 percent disagree with the
use of tax breaks and incentives—of the items pertaining to economic development (Figures 1.1
through 1.6), this issue garnered the highest disagreement.
Figure 1.5. The City of Westerville promotes a business friendly
environment to foster economic development.
Figure 1.6. The City of Westerville should give tax breaks and other
financial incentives to employers to bring new businesses into the City.
Group Differences
Years of residence: No significant differences.
Age: No significant differences.
Rent or own home: Residents who rent are more likely to strongly agree that the City of
Westerville should give tax breaks and other financial incentives to employers who are willing to
bring new businesses, jobs, and investments into the city.
Zone: No significant differences.
21.0%
51.0%
10.7%
3.4%
13.9%
24.2%
52.5%
10.6%
2.0%
10.7%
0% 25% 50% 75% 100%
Strongly Agree
Agree
Disagree
Strongly Disagree
DK/NA
2012
2009
23.9%
40.0%
20.2%
8.7%
7.2%
22.4%
43.8%
22.0%
7.4%
4.4%
0% 25% 50% 75% 100%
Strongly Agree
Agree
Disagree
Strongly Disagree
DK/NA
2012
2009

13
As seen in Figures 1.7 and 1.8, in 2012 the majority of residents (68 percent) agree or strongly
agree that Westerville traffic flows on main streets are at least as good as other Columbus
suburbs. They do not tend to agree, however, that traffic flows on Westerville’s main arteries
have improved in the last three years. Only 42 percent of residents agreed or strongly agreed
with this item, which is similar to the percentage in 2005 (43 percent) but significantly lower than
the 50 percent agreement in 2009.
Figure 1.7. Westerville’s overall traffic flow on main streets is at least
as good as traffic flow on main streets in other Central Ohio
suburbs.
Figure 1.8. Traffic flows on Westerville’s main arteries have improved in the last three years.
Group Differences
Years of residence: No significant differences.
Age: No significant differences.
Rent or own home: No significant differences.
Zone: No significant differences.
14.1%
53.5%
21.7%
4.8%
5.9%
15.7%
56.0%
19.1%
5.0%
4.3%
5.6%
59.7%
21.3%
8.3%
5.1%
0% 25% 50% 75% 100%
Strongly Agree
Agree
Disagree
Strongly Disagree
DK/NA
2012
2009
2005
7.4%
34.6%
37.7%
14.1%
6.2%
10.7%
39.5%
36.2%
8.0%
5.5%
5.9%
37.0%
34.0%
18.8%
4.3%
0% 25% 50% 75% 100%
Strongly Agree
Agree
Disagree
Strongly Disagree
DK/NA
2012
2009
2005

14
In 2012, respondents were asked for the first time to indicate their level of agreement with the
statement, “The quality of Westerville’s infrastructure has improved in the last three years.” As
seen in Figure 1.9, 69 percent of respondents agree or strongly agree. About 15 percent
indicated that they are unsure.
Figure 1.9. The quality of Westerville’s infrastructure has improved in the last three years.
Group Differences
Years of residence: No significant differences.
Age: No significant differences.
Rent or own home: No significant differences.
Zone: Zone 2 residents are more likely to agree that the quality of Westerville’s infrastructure
has improved in the last three years.
As seen in Figure 1.10, a substantial majority of residents, 84 percent, agree or strongly agree
that the City of Westerville does a good job of promoting recycling and conservation. The
pattern of responses did not differ significantly from 2009 to 2012.
Figure 1.10. I believe the City of Westerville does a good job of promoting recycling and conservation.
17.1%
51.8%
12.3%
4.0%
14.7%
0% 25% 50% 75% 100%
Strongly Agree
Agree
Disagree
Strongly Disagree
DK/NA
33.4%
50.7%
10.1%
2.2%
3.7%
38.2%
48.8%
9.3%
1.5%
2.2%
0% 25% 50% 75% 100%
Strongly Agree
Agree
Disagree
Strongly Disagree
DK/NA
2012
2009

15
Group Differences
Years of residence: No significant differences.
Age: No significant differences.
Rent or own home: Homeowners are more likely than renters to strongly agree that they
believe the City of Westerville does a good job of promoting recycling and conservation.
Zone: Zone 4 residents are less likely to agree that they believe the City of Westerville does a
good job of promoting recycling and conservation.
Figure 1.11 presents mean ratings for several items regarding City departments and staff.
Means can range from 1.00 (Strongly Disagree) to 4.00 (Strongly Agree). Just as in 2005 and
2009, all but one of the scores is above 3.00, which indicates that respondents are generally
satisfied with various issues pertaining to City departments and staff. Further, the scores in
2012 do not significantly differ from those in 2009.
Also, as in previous years, the lowest score was assigned to “prudent management of finances,”
which received a mean score of 2.93 for 2012. Despite the comparatively low mean score,
however, 67 percent of resident agree or strongly agree that City leaders are prudent with their
management of City finances (see Appendix A).
Figure 1.11. Mean Ratings for Departments and Staff
3.38
3.33
3.33
3.38
3.29
2.93
3.40
3.27
3.28
3.39
3.25
2.97
3.17
3.04
3.08
3.17
3.06
2.15
1 2 3 4
Satisfied with the overall quality of services provided
Westerville’s city government does a good job of
making information available
It is convenient to reach the appropriate city
department
City staff is courteous and friendly
City staff respond to citizen requests in a timely
manner
Westerville city leaders are prudent with management
of city finances
2012
2009
2005

16
Group Differences
Years of residence: No significant differences.
Age: No significant differences.
Rent or own home: No significant differences.
Zone: Zone 2 residents are more satisfied with the overall quality of services provided by the
City of Westerville. Also, Zone 4 residents report lower agreement that Westerville City leaders
are prudent with their management of City finances than Zone 2 and Zone 3 residents.
2. Community Priorities
Survey respondents were asked about a number of issues pertaining to their opinions on
Westerville priorities, such as the reasons they chose Westerville as their home and their
perceptions about the pressing issues facing the City.
Residents were also asked about their level of awareness of City-related issues. Figure 2.1
indicates that a strong majority of residents do pay attention to City issues (80 percent overall
agreement). The pattern of responses to this question did not significantly differ from 2009.
Figure 2.1. I pay a lot of attention to City-related issues (not including Westerville School District or library issues).
Group Differences
Years of residence: Residents who have lived in Westerville 26 or more years are most likely to
agree that they pay attention to City-related issues, whereas those who have lived in Westerville
a year or less are least likely to agree with this statement.
25.0%
54.7%
15.1%
0.8%
4.3%
23.1%
55.3%
17.8%
0.8%
3.0%
13.9%
64.2%
17.4%
0.8%
3.7%
0% 10% 20% 30% 40% 50% 60% 70% 80% 90% 100%
Strongly Agree
Agree
Disagree
Strongly Disagree
DK/NA
2012
2009
2005

17
Age: Agreement with this statement increases with age, with 70 percent of respondents 18-40
years of age agreeing that they pay attention to City-related issues compared to 96 percent of
those 71 years of age and older.
Rent or own home: No significant differences.
Zone: No significant differences.
For the first time in 2012, respondents were presented a list of potential reasons why they live in
Westerville, and were asked to indicate how important each is to them. Figure 2.2 presents the
mean score for each item, on a scale from 1 (Not at all Important) to 5 (Extremely Important).
“Overall safety of the community” received the highest mean (4.65) by a fairly wide margin over
the second highest-scoring item, “the family friendly nature of the city” (4.25). Being close to
Otterbein University received the lowest rating.
Figure 2.2. Please indicate how important each is to you when thinking about why you live in Westerville.
Group Differences
Years of residence: Those who have lived in Westerville 2 to 5 years placed greater importance
on convenient location to work than residents who have lived in Westerville 6 to 10 years or 11
to 25 years. Also, Westerville’s newest residents place greater importance on the quality of the
public school district than residents who have lived in Westerville at least 6 years. Additionally,
residents who have lived in Westerville 26 years or more place greater importance on having
family and friends live nearby and being close to Otterbein University than those who have lived
in Westerville 2 to 25 years.
Age: Residents ages 41 to 50 place greater importance on convenient location to work than
residents over 50. Also, residents under the age of 51 place greater importance on access to
quality city parks and recreation space than older residents. Additionally, younger residents
place greater importance on the quality of the public school district compared to residents over
3.59
3.97
4.08
4.25
3.97
3.94
4.65
3.49
1.99
1 2 3 4 5
The convenient location to work
Convenient access to shopping and entertainment
Access to quality city parks and recreation space
The family-friendly nature of the city
Affordable housing
The quality of the public school district
Overall safety of the community
Family and friends live near by
Close to Otterbein University

18
50 years of age. Lastly, residents over 70 years of age place greater, albeit still low, importance
on being close to Otterbein University.
Rent or own home: Residents who rent place greater importance on the convenient location to
work than residents who own. Also, Residents who rent place greater importance on being
close to Otterbein University than residents who own their homes.
Zone: Residents in Zone 1 place greater importance on the convenient location to work than
other residents. Also, Zone 2 residents place greater importance on the family friendly nature of
the city then Zone 1 and Zone 4 residents. Additionally, Zone 2 residents place greater
importance on affordable housing than Zone 1 and Zone 4 residents. Also, Zone 3 residents
place greater importance on the quality of the public school district than Zone 4 residents.
Lastly, Zone 2 residents placed greater importance on the overall safety of the community than
other residents.
In order to understand which issues are viewed by residents as most important for Westerville,
respondents were presented a list of issues related to City services, general infrastructure,
economic issues, and so on, and asked to indicate which they felt was most important. This item
was also included in the 2009 survey, but respondents were only asked to select one choice,
whereas in 2012 they were also asked to select a second and third option. Another 2012
revision is that “reliable and efficient utility services” replaced the option “annexation.” The
results are presented in Table 2.1. Just as in 2009, “fiscal management and responsibility” was
chosen as the most important issue for the City of Westerville by a wide margin (41 percent in
2012 and 45 percent in 2009).
Table 2.1. Of the following potential issues, which is the MOST IMPORTANT issue for the City of Westerville?
1
st
Choice 1
st
Choice 2
nd
Choice 3
rd
Choice
Response 2012 2009 2012 2012
Maintaining current city services that are not related to safety
5.2% 7.3% 9.3% 13.6%
Fiscal management and responsibility 40.7% 45.0% 16.7% 11.3%
Maintaining current safety services 13.9% 11.5% 21.1% 15.2%
Reliable and efficient utility services 7.6% --* 15.6% 20.2%
Security and crisis management 3.1% 2.1% 3.8% 5.2%
Infrastructure and roadway maintenance 11.2% 9.8% 15.4% 15.7%
Green space preservation 4.5% 6.3% 6.2% 5.1%
Economic development and job creation 9.4% 13.7% 9.9% 10.2%
Communication of city information to residents 1.4% 1.8% 0.8% 2.3%
Other 3.0% 1.5% 1.1% 1.0%
* Option not provided in 2009.
19
Group Differences (Note: Only group differences for the responses to the first item asking
respondents to select what they believe to be the MOST important issue facing the City of
Westerville were examined.)
Years of residence: No significant differences.
Age: Residents over the age of 40 were more likely to select fiscal management and
responsibility as the most important issue for the City of Westerville. Also, residents ages 18 to
40 were more likely to select infrastructure and roadway maintenance as the most important
issue for the City of Westerville.
Rent or own home: Homeowners were more likely to cite fiscal management and responsibility
as the most important issue for the City of Westerville than renters. Renters more often cited
economic development and job creation as the most important issue for the City of Westerville
than homeowners.
Zone: No significant differences.
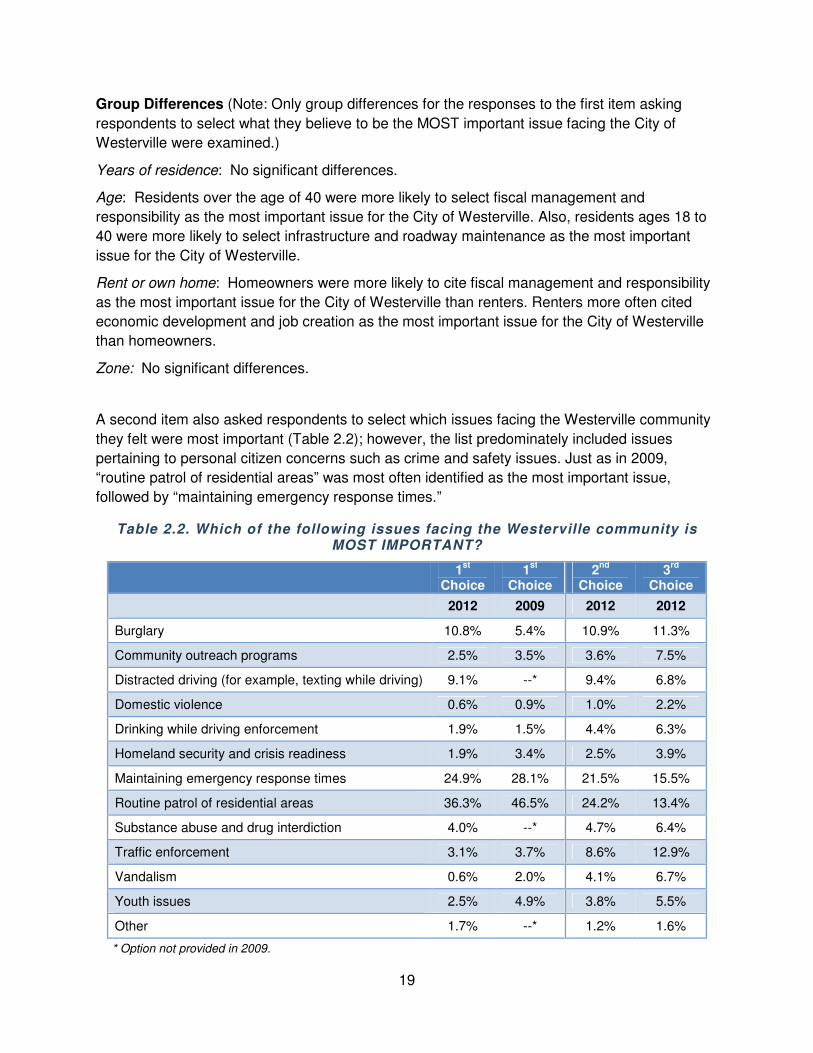
A second item also asked respondents to select which issues facing the Westerville community
they felt were most important (Table 2.2); however, the list predominately included issues
pertaining to personal citizen concerns such as crime and safety issues. Just as in 2009,
“routine patrol of residential areas” was most often identified as the most important issue,
followed by “maintaining emergency response times.”
Table 2.2. Which of the following issues facing the Westerville community is MOST IMPORTANT?
1
st
Choice 1
st
Choice 2
nd
Choice 3
rd
Choice
2012 2009 2012 2012
Burglary 10.8% 5.4% 10.9% 11.3%
Community outreach programs 2.5% 3.5% 3.6% 7.5%
Distracted driving (for example, texting while driving) 9.1% --* 9.4% 6.8%
Domestic violence 0.6% 0.9% 1.0% 2.2%
Drinking while driving enforcement 1.9% 1.5% 4.4% 6.3%
Homeland security and crisis readiness 1.9% 3.4% 2.5% 3.9%
Maintaining emergency response times 24.9% 28.1% 21.5% 15.5%
Routine patrol of residential areas 36.3% 46.5% 24.2% 13.4%
Substance abuse and drug interdiction 4.0% --* 4.7% 6.4%
Traffic enforcement 3.1% 3.7% 8.6% 12.9%
Vandalism 0.6% 2.0% 4.1% 6.7%
Youth issues 2.5% 4.9% 3.8% 5.5%
Other 1.7% --* 1.2% 1.6%
* Option not provided in 2009.

20
Group Differences (Note: Only group differences for the responses to the first item asking
respondents to select what they believe to be the MOST important issue facing the City of
Westerville were examined.)
Years of residence: No significant differences.
Age: No significant differences.
Rent or own home: No significant differences.
Zone: No significant differences.
Figure 2.3 looks at the importance of branding the city of Westerville. About 37 percent of
respondents strongly agreed that it is important for all local government agencies, community
leaders, and civic organizations to work together to tell a consistent story about the City of
Westerville, and 81 percent agreed overall. Agreement is significantly lower than in 2009, when
50 percent of respondents strongly agreed, and 93 percent agreed overall.
Figure 2.3. It is important for all local government agencies, community leaders, and civic organizations to work together to tell a consistent story about the City
of Westerville.
Group Differences
Years of residence: No significant differences.
Age: No significant differences.
Rent or own home: No significant differences.
Zone: No significant differences.
37.1%
43.4%
4.9%
10.9%
3.7%
50.0%
42.5%
4.0%
1.1%
2.4%
0% 25% 50% 75% 100%
Strongly Agree
Agree
Disagree
Strongly Disagree
DK
2012
2009
21
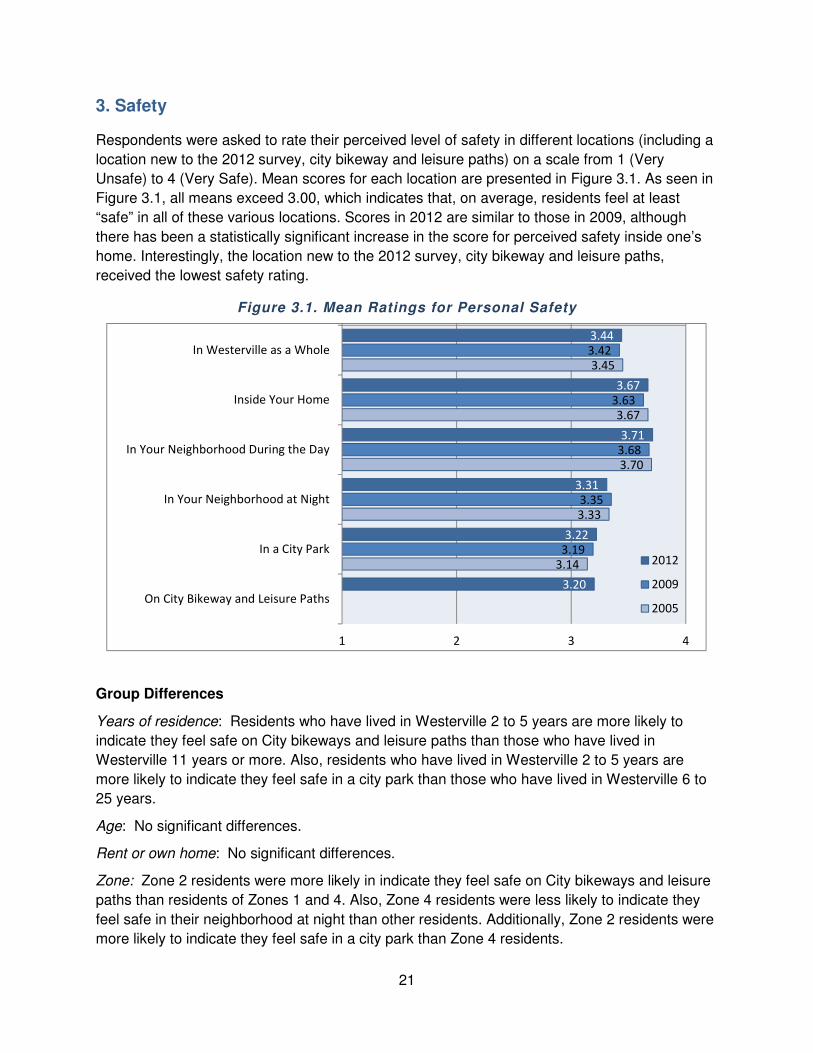
3. Safety
Respondents were asked to rate their perceived level of safety in different locations (including a
location new to the 2012 survey, city bikeway and leisure paths) on a scale from 1 (Very
Unsafe) to 4 (Very Safe). Mean scores for each location are presented in Figure 3.1. As seen in
Figure 3.1, all means exceed 3.00, which indicates that, on average, residents feel at least
“safe” in all of these various locations. Scores in 2012 are similar to those in 2009, although
there has been a statistically significant increase in the score for perceived safety inside one’s
home. Interestingly, the location new to the 2012 survey, city bikeway and leisure paths,
received the lowest safety rating.
Figure 3.1. Mean Ratings for Personal Safety
Group Differences
Years of residence: Residents who have lived in Westerville 2 to 5 years are more likely to
indicate they feel safe on City bikeways and leisure paths than those who have lived in
Westerville 11 years or more. Also, residents who have lived in Westerville 2 to 5 years are
more likely to indicate they feel safe in a city park than those who have lived in Westerville 6 to
25 years.
Age: No significant differences.
Rent or own home: No significant differences.
Zone: Zone 2 residents were more likely in indicate they feel safe on City bikeways and leisure
paths than residents of Zones 1 and 4. Also, Zone 4 residents were less likely to indicate they
feel safe in their neighborhood at night than other residents. Additionally, Zone 2 residents were
more likely to indicate they feel safe in a city park than Zone 4 residents.
3.44
3.67
3.71
3.31
3.22
3.20
3.42
3.63
3.68
3.35
3.19
3.45
3.67
3.70
3.33
3.14
1 2 3 4
In Westerville as a Whole
Inside Your Home
In Your Neighborhood During the Day
In Your Neighborhood at Night
In a City Park
On City Bikeway and Leisure Paths
2012
2009
2005

22
When presented with a list of issues and asked to select the issue they felt is MOST important
for Police Services, nearly half of respondents (47 percent) chose protection of property (Figure
3.2). Personal safety/security and community outreach services were each selected second
most often, at 12 percent. The most notable difference in responses between 2009 and 2012 is
the reversal in the percentage of respondents who chose personal safety/security (56 percent in
2009 and 12 percent in 2012) and protection of property (15 percent in 2009 and 47 percent in
2012).
Figure 3.2. Which of the following is the MOST IMPORTANT issue for Police Services?
Group Differences
Years of residence: No significant differences.
Age: Westerville’s youngest residents (18 to 40) were more likely to rate community outreach
services as the most important issue for police than other residents. Also, Westerville’s oldest
residents (71 and older) were more likely to rate personal safety and security as the most
important issue for police than residents ages 60 or younger.
Rent or own home: No significant differences.
Zone: No significant differences.
Figure 3.3 provides the mean ratings for each of Westerville’s safety services. Survey
participants were asked to rate each item on a scale from 1 (Very Poor) to 4 (Excellent). Two
new public safety services were added to the 2012 survey: emergency medical services and
EMS billing services. In addition, “fire prevention services” was modified to “fire prevention and
inspection services.” All services were rated above a 3.00. Emergency medical services and fire
11.8%
8.5%
4.0%
12.3%
46.8%
7.8%
0.1%
8.7%
14.2%
5.1%
6.0%
55.5%
14.5%
4.2%
0.5%
0% 10% 20% 30% 40% 50% 60% 70% 80% 90% 100%
Community Outreach Services
Crisis/Disaster Preparedness
Youth-Oriented Programs
Personal Safety/Security
Protection of Property
Traffic Safety
Animal Control
Other
2012
2009

23
emergency response times were rated the highest (3.70 and 3.69, respectively). EMS billing
services received the lowest rating (3.17); however, it is important to note that the vast majority
of respondents, 80 percent, chose the response, “Not Applicable/No opinion/Not aware of
this”—so the mean rating is based on a relatively small number of respondents (see Appendix
B).
The ratings for two services were significantly lower in 2012 than in 2009: fire prevention and
inspection and fire safety and education. Conversely, ratings in 2012 were significantly higher
than those in 2009 for police community outreach services.
Figure 3.3. Mean Ratings for Public Safety Services
3.70
3.17
3.64
3.56
3.35
3.41
3.69
3.60
3.41
3.53
3.19
3.60
3.57
3.50
3.48
3.67
3.56
3.38
3.42
3.21
3.56
3.56
3.46
3.44
3.60
3.52
3.34
3.31
3.09
1 2 3 4
Emergency Medical Services
EMS Billing Services
9-1-1 Dispatcher Services
Fire Suppression Services
Fire Prevention & Inspection Services
Fire Safety and Education Programs
Fire Emergency Response Times
Police Emergency Response Times
Police Patrol Services
Police Community Outreach Services
Police Animal Control Services
2012
2009
2005

24
Group Differences
Years of residence: Residents who lived in Westerville 2 to 5 years gave higher ratings to EMS
billing services than residents who have lived in Westerville 26 years or more.
Age: No significant differences.
Rent or own home: Residents who own their homes gave higher ratings to EMS billing services
than residents who rent.
Zone: Zone 3 residents gave higher ratings to police emergency response times than Zone 1
residents.
4. Parks & Recreation Facilities
Figures 4.1 and 4.2 provide the mean ratings for each of Westerville’s park and recreation
facilities. Figure 4.1 provides the mean ratings for the facilities that were also included on the
2005 and 2009 surveys; Figure 4.2 provides mean ratings for items new to the 2012 survey.
Survey participants were asked to rate each item on a scale ranging from 1 (very poor) to 4
(excellent). As Figure 4.1 shows, the Community Center and Highlands Park Aquatic Center
received the highest ratings of all the facilities. The Highlands Park Aquatic Center (referred to
as the “Pool at Highlands Park” in the 2005 and 2009 surveys) received a significantly higher
rating in 2012 than the previous years, likely due to recent renovations and improvements.
There are no other significant differences in ratings between 2009 and 2012.
Figure 4.1. Mean Ratings for Parks & Recreation Facilities
3.63
3.66
3.57
3.57
3.45
3.31
3.20
3.65
3.58
3.56
3.42
3.34
3.14
3.68
3.55
3.52
3.41
3.41
1 2 3 4
Highlands Park Aquatic Center
Community Center
Westerville Sports Complex
Everal Barn & Heritage Park
Senior Center
Skateboard/BMX Bike Park
2012
2009
2005

25
Figure 4.2. Mean Ratings for Parks & Recreation Facilities (new items)
Group Differences
Years of residence: Residents who have lived in Westerville less than six years gave higher
ratings to the Highland Park Aquatic Center than other residents. Additionally, residents who
have lived in Westerville a year or less gave higher ratings to the Millstone Creek Park than
those who have lived in Westerville 11 years or more.
Age: Residents ages 71 and older gave higher mean ratings to the Westerville Senior Center
than those between the ages of 41 and 70. Also, residents ages 18 to 40 gave higher ratings to
the Skateboard/BMX Park than those between the ages 51 to 70.
Rent or own home: No significant differences.
Zone: Zone 4 residents gave lower ratings to the Millstone Creek Park than other residents.
Also, residents from Zones 1 and 2 gave higher ratings to the Skateboard/BMX Park than those
from Zones 3 and 4.
5. Parks Services
Figure 5.1 provides the mean ratings for each of Westerville’s park services. Survey participants
were asked to rate each item on a scale ranging from 1 (Very Poor) to 4 (Excellent). A new
service was included on the 2012 survey: lacrosse fields.
All park services were rated at or above the midpoint between 3.00 (Good) and 4.00 (Excellent).
Soccer fields and tennis courts tied for the lowest ratings, whereas bikeways/leisure paths and
nature preserves had the highest ratings. There was a significant decline in ratings from 2009 to
2012 for three services: soccer fields, baseball/softball parks, and bikeways/leisure paths.
3.63
3.66
3.57
3.57
1 2 3 4
Millstone Creek Park
Bark Park
Neighborhood Parks
First Responders Park

26
Figure 5.1. Mean Ratings for Park Services
Group Differences
Years of residence: Residents who have lived in Westerville 11 to 25 years gave lower ratings
to baseball and softball fields than those who have lived in Westerville 2 to 10 years.
Age: Residents over the age of 70 gave higher ratings to Westerville’s baseball and softball
fields than those ages 51 to 70. Also, residents ages 51 to 60 gave lower ratings to Westerville’s
picnic shelters, tennis courts, and basketball courts than other residents.
Rent or own home: Residents who rent gave higher ratings to Westerville’s basketball courts
than those who own their homes.
Zone: No significant differences.
3.53
3.58
3.43
3.49
3.56
3.51
3.43
3.44
3.60
3.61
3.61
3.50
3.56
3.58
3.52
3.42
3.47
3.69
3.63
3.47
3.36
3.39
3.43
3.40
3.32
3.36
3.56
3.51
1 2 3 4
Lacrosse Fields
Parks Maintenance
Soccer Fields
Baseball/Softball Fields
Playgrounds
Picnic Shelters
Tennis Courts
Basketball Courts
Bikeways/Leisure Paths
Nature Preserves
2012
2009
2005
27
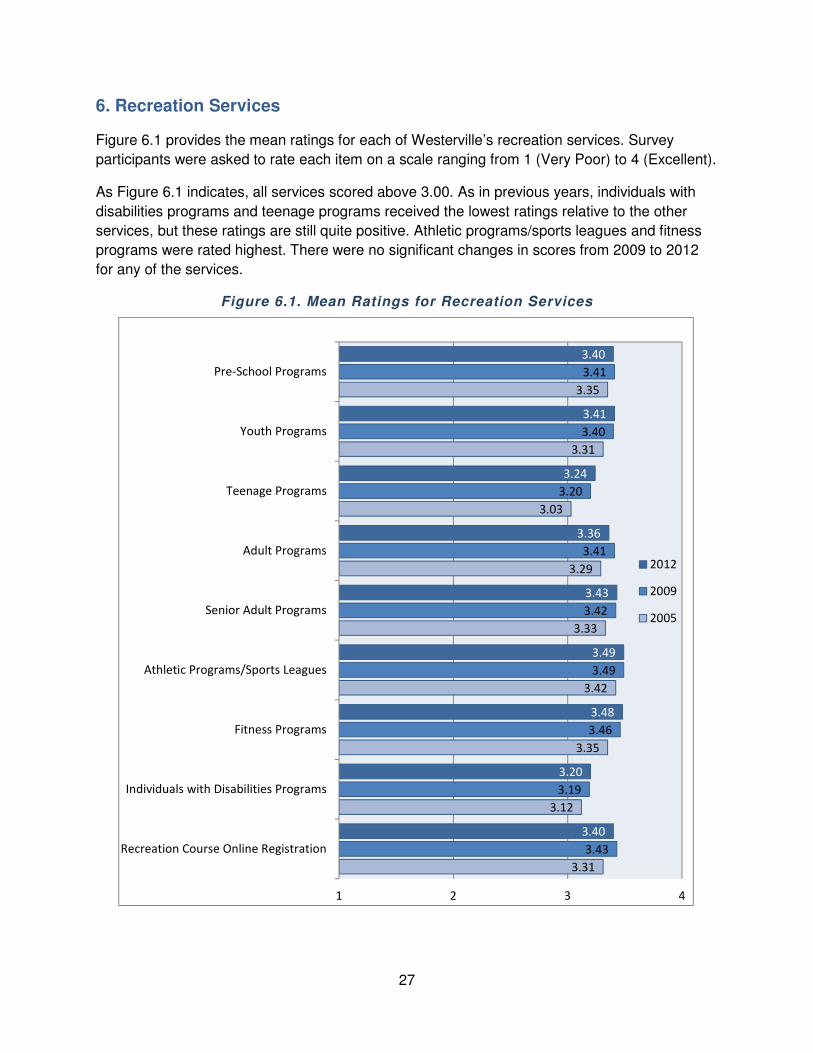
6. Recreation Services
Figure 6.1 provides the mean ratings for each of Westerville’s recreation services. Survey
participants were asked to rate each item on a scale ranging from 1 (Very Poor) to 4 (Excellent).
As Figure 6.1 indicates, all services scored above 3.00. As in previous years, individuals with
disabilities programs and teenage programs received the lowest ratings relative to the other
services, but these ratings are still quite positive. Athletic programs/sports leagues and fitness
programs were rated highest. There were no significant changes in scores from 2009 to 2012
for any of the services.
Figure 6.1. Mean Ratings for Recreation Services
3.40
3.41
3.24
3.36
3.43
3.49
3.48
3.20
3.40
3.41
3.40
3.20
3.41
3.42
3.49
3.46
3.19
3.43
3.35
3.31
3.03
3.29
3.33
3.42
3.35
3.12
3.31
1 2 3 4
Pre-School Programs
Youth Programs
Teenage Programs
Adult Programs
Senior Adult Programs
Athletic Programs/Sports Leagues
Fitness Programs
Individuals with Disabilities Programs
Recreation Course Online Registration
2012
2009
2005
28
Group Differences
Years of residence: No significant differences.
Age: Westerville’s youngest residents gave lower ratings to fitness programs than the oldest
residents. Also, residents ages 51 to 60 gave lower ratings to individuals with disabilities
programs than the oldest residents.
Rent or own home: Residents who own their own homes gave higher ratings to adult programs
that those who rent.
Zone: Zone 2 residents gave higher ratings to individuals with disabilities programs than Zone 4
residents.
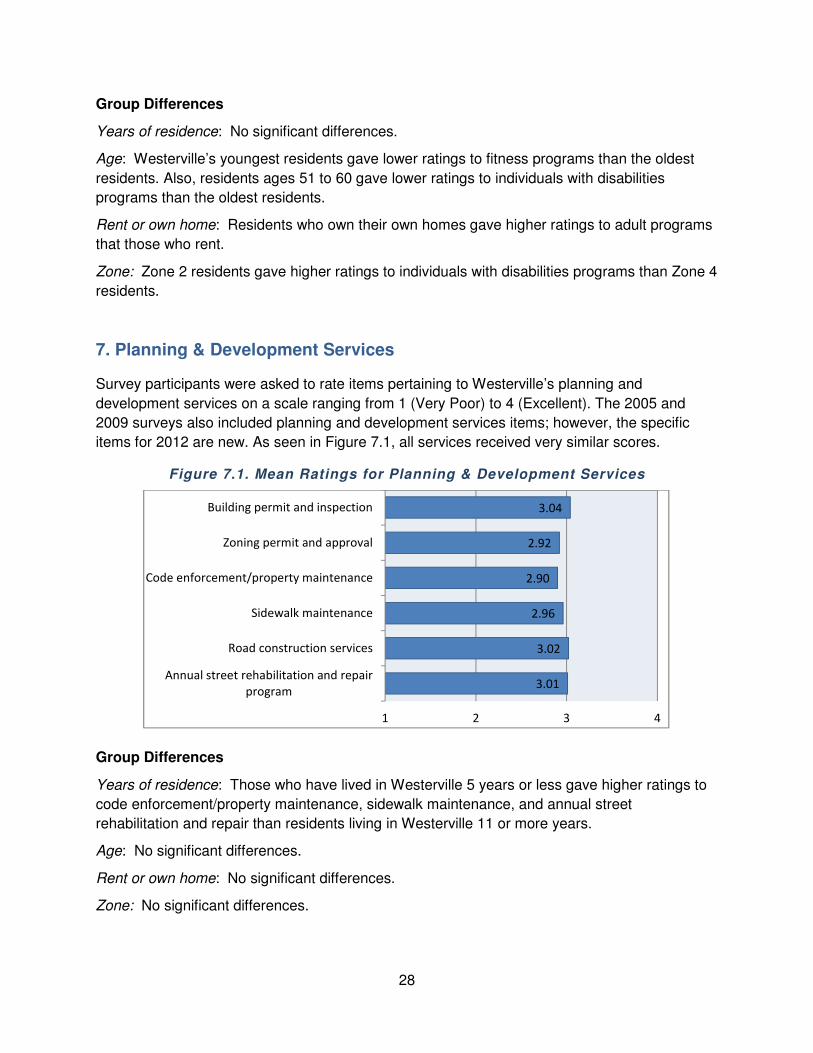
7. Planning & Development Services
Survey participants were asked to rate items pertaining to Westerville’s planning and
development services on a scale ranging from 1 (Very Poor) to 4 (Excellent). The 2005 and
2009 surveys also included planning and development services items; however, the specific
items for 2012 are new. As seen in Figure 7.1, all services received very similar scores.
Figure 7.1. Mean Ratings for Planning & Development Services
Group Differences
Years of residence: Those who have lived in Westerville 5 years or less gave higher ratings to
code enforcement/property maintenance, sidewalk maintenance, and annual street
rehabilitation and repair than residents living in Westerville 11 or more years.
Age: No significant differences.
Rent or own home: No significant differences.
Zone: No significant differences.
3.04
2.92
2.90
2.96
3.02
3.01
1 2 3 4
Building permit and inspection
Zoning permit and approval
Code enforcement/property maintenance
Sidewalk maintenance
Road construction services
Annual street rehabilitation and repair
program

29
8. Public Works Services
Figure 8.1 provides the mean ratings for each of Westerville’s public works services. Survey
participants were asked to rate each item on a scale ranging from 1 (very poor) to 4 (excellent).
One new service was added to the 2012 survey: stormwater management.
Overall, Figure 8.1 indicates a trend where public works services received high ratings, between
a 3 and 4. As in previous years, street maintenance received the lowest rating whereas yard
waste collection was the highest rated public works service. Ratings for street maintenance
decreased significantly between 2009 and 2012; however, ratings for snow removal, street
cleaning, and leaf collection increased significantly.
Figure 8.1. Mean Ratings for Public Works Services
3.20
3.02
3.57
3.41
3.29
3.53
3.61
3.58
3.64
3.28
3.41
3.32
3.29
3.37
3.60
3.58
3.62
3.05
3.37
3.25
3.21
3.35
3.49
3.49
3.50
1 2 3 4
Stormwater Management
Street Maintenance
Snow Removal
Street Cleaning
Sewer Maintenance
Leaf Collection
Refuse Collection
Recycling Collection
Yard Waste Collection
2012
2009
2005

30
Group Differences
Years of residence: No significant differences.
Age: No significant differences.
Rent or own home: Residents who own their own homes gave higher ratings to refuse
collection than those who rent.
Zone: Zone 2 residents gave higher ratings for street maintenance than Zone 3 residents. Also,
residents of Zones 2 and 3 gave higher ratings for street cleaning than Zone 1 residents.
9. Utility Services
Figure 9.1 provides the mean ratings for each of Westerville’s utilities services. Survey
participants were asked to rate each item on a scale ranging from 1 (Very Poor) to 4 (Excellent).
One new item was added to the 2012 survey: sewer services.
Overall, the results displayed in Figure 9.1 reveal that all of the utility services that respondents
were asked to rate received positive ratings. Even the mean for the lowest rated service, street
lighting fell well within the range between 3.00 (Good) and 4.00 (Excellent). There were no
significant changes in ratings from 2009 to 2012.
Figure 9.1. Mean Rating for Utility Services
3.39
3.44
3.53
3.37
3.43
3.43
3.52
3.39
3.43
3.38
3.42
3.31
3.40
1 2 3 4
Sewer
Water
Electric
Street Lighting
Utility Billing
2012
2009
2005

31
Group Differences
Years of residence: No significant differences.
Age: Residents over 60 gave higher ratings to utility billing than those ages 41 to 50.
Rent or own home: Residents who own their own homes gave higher ratings to water services,
sewer services, and utility billing than those who rent.
Zone: No significant differences.
10. Communications/Citizen Input Issues
Respondents were asked several questions about the most useful sources of information about
the City of Westerville issues and their level of use and satisfaction with specific communication
channels. This section summarizes the findings from these questions.
As seen in Table 10.1, by a wide margin, the most useful source of information about City
issues for a majority of residents was a suburban newspaper (56 percent). The second most
frequently mentioned source was the City website (12 percent) followed by city publications (11
percent). Although these are the same three sources that were most commonly cited in 2009,
the percentage of respondents selecting suburban newspaper decreased from 2009 to 2012
while the percentage of respondents selecting City website and City publications increased.
Since people rarely rely on one source of information, we asked respondents what the second
most useful source of information would be. A suburban newspaper was again selected most
often (20 percent), followed by City publications (18 percent).
Table 10.1. What information source do you find MOST USEFUL/SECOND MOST USEFUL in staying informed of City related issues?
1st
Choice 2nd
Choice
Response 2012 2009 2012 2009
Broadcast (TV) News 5.7% 1.8% 14.0% 6.7%
City Publications 11.1% 5.9% 18.3% 24.7%
City Website 11.5% 9.2% 15.0% 19.2%
Columbus Dispatch 2.9% 4.1% 12.1% 12.3%
E-mail 6.4% 2.7% 6.1% 3.5%
Public Meetings 0.2% 0.1% 1.3% 0.6%
Social Media 1.7% 0.9% 2.9% 1.7%
Suburban Newspaper 55.8% 69.6% 19.5% 14.9%
WOCC TV 3 0.6% 1.8% 2.3% 2.9%
Word of Mouth 3.3% 3.0% 7.2% 12.3%
Other 0.7% 0.9% 1.2% 1.2%

32
Group Differences
Years of residence: Residents who have lived in Westerville 26 years or more were least likely
to find either the City website or social media the most useful source for staying informed of city
related issues.
Age: Residents between 18 and 50 years of age were more likely find the City website and
least likely to find the suburban weekly newspaper the most useful source for staying informed
of city related issues. Also, residents under the age of 41 were most likely to find e-mail and
social media the most useful source for staying informed of city related issues.
Rent or own home: No significant differences.
Zone: No significant differences.
Television
Residents report Time Warner as the primary type of television programming access in their
home at 38 percent (a notable decline from 49 percent in 2009), followed by WOW at 25
percent, and AT&T at 16 percent. Nine percent of residents say they have no cable service.
Figure 10.1. What type of television programming access/service does your household have?
Group Differences
Years of residence: Residents who have lived in Westerville a year or less are more likely to
have WOW! and less likely to have AT&T as their television programming service. Additionally,
those who have lived in Westerville 26 years of more are more likely to have Time Warner as
their television programming service.
Age: Residents ages 18 to 40 are more likely to have WOW! as their television programming
service than other residents. Additionally, residents over the age of 50 are more likely to have
25.1%
37.7%
4.6%
6.0%
16.1%
1.8%
8.7%
22.3%
49.1%
3.4%
6.2%
10.9%
1.7%
6.3%
0% 10% 20% 30% 40% 50% 60% 70% 80% 90% 100%
WOW
Time Warner
Insight Communications
DirecTV
AT&T
Other
No Cable Service
2012
2009
33
Time Warner as their television programming service than those 40 and younger. Also,
residents between the ages of 18 to 50 are more likely than older residents not to have cable
service in their homes.
Rent or own home: No significant differences.
Zone: Residents of Zones 1 and 3 are more likely to have Time Warner as their television
programming service than Zone 2 and Zone 4 residents. Also, Zone 2 residents are more likely
than others to have Insight Communications. Additionally, Zone 1 residents are less likely than
other residents to have AT&T. Lastly, Zone 4 residents are more likely than others not to have
cable service.
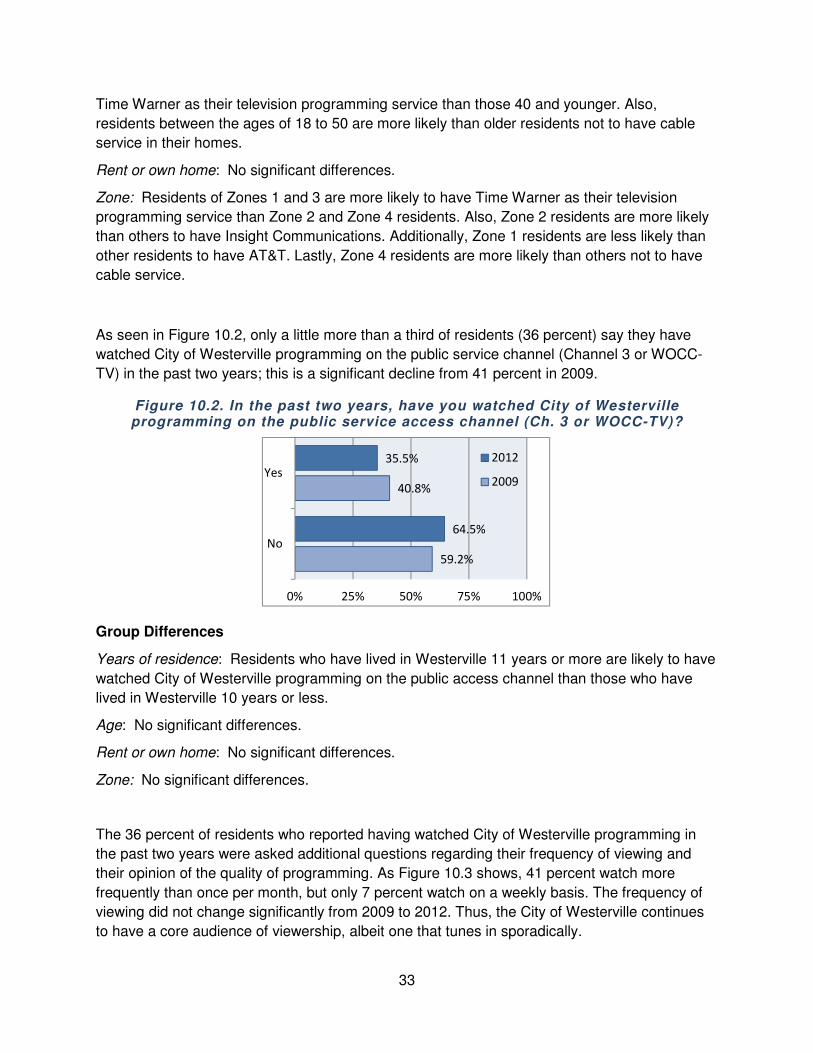
As seen in Figure 10.2, only a little more than a third of residents (36 percent) say they have
watched City of Westerville programming on the public service channel (Channel 3 or WOCC-
TV) in the past two years; this is a significant decline from 41 percent in 2009.
Figure 10.2. In the past two years, have you watched City of Westerville programming on the public service access channel (Ch. 3 or WOCC-TV)?
Group Differences
Years of residence: Residents who have lived in Westerville 11 years or more are likely to have
watched City of Westerville programming on the public access channel than those who have
lived in Westerville 10 years or less.
Age: No significant differences.
Rent or own home: No significant differences.
Zone: No significant differences.
The 36 percent of residents who reported having watched City of Westerville programming in
the past two years were asked additional questions regarding their frequency of viewing and
their opinion of the quality of programming. As Figure 10.3 shows, 41 percent watch more
frequently than once per month, but only 7 percent watch on a weekly basis. The frequency of
viewing did not change significantly from 2009 to 2012. Thus, the City of Westerville continues
to have a core audience of viewership, albeit one that tunes in sporadically.
35.5%
64.5%
40.8%
59.2%
0% 25% 50% 75% 100%
Yes
No
2012
2009

34
As seen in Figure 10.4., viewers tend to rate the quality of programming highly; over half of
respondents assigned a rating of 5 (very good) on a 1-5 scale. The average score is 3.20.
Figure 10.3. How frequently do you watch City of Westerville TV programs?
Figure 10.4. Perceived Level of Quality of City of Westerville TV Programming
Group Differences
Years of residence: No significant differences.
Age: No significant differences.
Rent or own home: No significant differences.
Zone: Residents of Zone 4 are more likely to watch City of Westerville TV programs than the
residents living in other zones.
7.1%
11.8%
21.6%
37.2%
22.3%
11.7%
12.1%
18.2%
36.5%
21.4%
0% 25% 50% 75% 100%
Once or More Per week
Once Every Two Weeks
Once Per Month
A Few Times Per Year
Rarely
2012
2009
54.0%
19.0%
35.3%
8.8%
3.4%
28.1%
0% 25% 50% 75% 100%
5 (Very good)
4
3
2
1 (Very poor)
Do Not Know

35
Table 10.2 shows the types of programming in which residents are most interested. When
combining first and second mentions, residents report that City Council Meetings (34 percent),
Westerville School Board meetings 28 percent), and promotional programming (20 percent) are
of most interest to them. However, the most commonly selected choice was “None (I am not
interested in watching public service channels)” – an option that was offered in 2012 but not
2009.
Table 10.2. What type of programming would you be MOST INTERESTED/SECOND MOST INTERESTED in watching on public service channels like WOCC-TV?
1st
Choice 2nd
Choice
Response 2012 2009 2012 2009
City Council meeting and/or work session
19.0% 25.7% 15.4% 18.2%
Westerville School Board meetings 12.8% 9.4% 14.9% 13.6%
High school sporting event 7.4% 14.7% 6.1% 11.3%
Special events, such as annual 4th of
July parade 7.6% 12.7% 8.7% 15.6%
Promotional programming, featuring Westerville sites, information
9.1% 21.4% 10.7% 16.4%
Interviews with City officials about current events
8.8% 5.4% 9.8% 6.7%
Otterbein University events and information
1.8% 0.5% 3.2% 5.8%
Other Westerville City School events 1.7% 2.9% 2.8% 5.6%
Other 2.2% 0.8% 1.1% 2.1%
None (I am not interested in watching public service channels)
29.6% -- 27.4% --
Group Differences
Years of residence: No significant differences.
Age: No significant differences.
Rent or own home: No significant differences.
Zone: Residents of Zone 1 were less likely than others to indicate they would be most
interested in watching City Council meetings. Also, Zone 2 residents were more likely than
others to indicate they would be interested in watching Westerville School Board meetings.
Additionally, Zone 4 residents were more likely to indicate they would be interested in watching
interviews with City officials about current events. Lastly, Zone 2 residents were more likely to
indicate they are not interested in watching public service channels.

36
Website Usage
Figure 10.5 shows that the majority of respondents have visited the City website (94 percent).
However, a little more than half (52 percent) report visiting the website “rarely.” The frequency of
visiting the website did not change significantly from 2009 to 2012.
Figure 10.5. How often do you visit the Westerville website?
Group Differences
Years of residence: Residents who have lived in Westerville 11 or more years were more likely
to indicate they rarely or never visit the Westerville website.
Age: Residents over 50 years of age were more likely to indicate they rarely or never visit the
Westerville website than those ages 18 to 50.
Rent or own home: No significant differences.
Zone: No significant differences.
3.4%
7.6%
30.4%
52.2%
6.4%
3.9%
6.6%
32.4%
48.4%
8.8%
0% 10% 20% 30% 40% 50% 60% 70% 80% 90%100%
Once or More Per Week
At Least Once Every Two Weeks
At Least Once Per Month
Rarely
Never
2012
2009
37
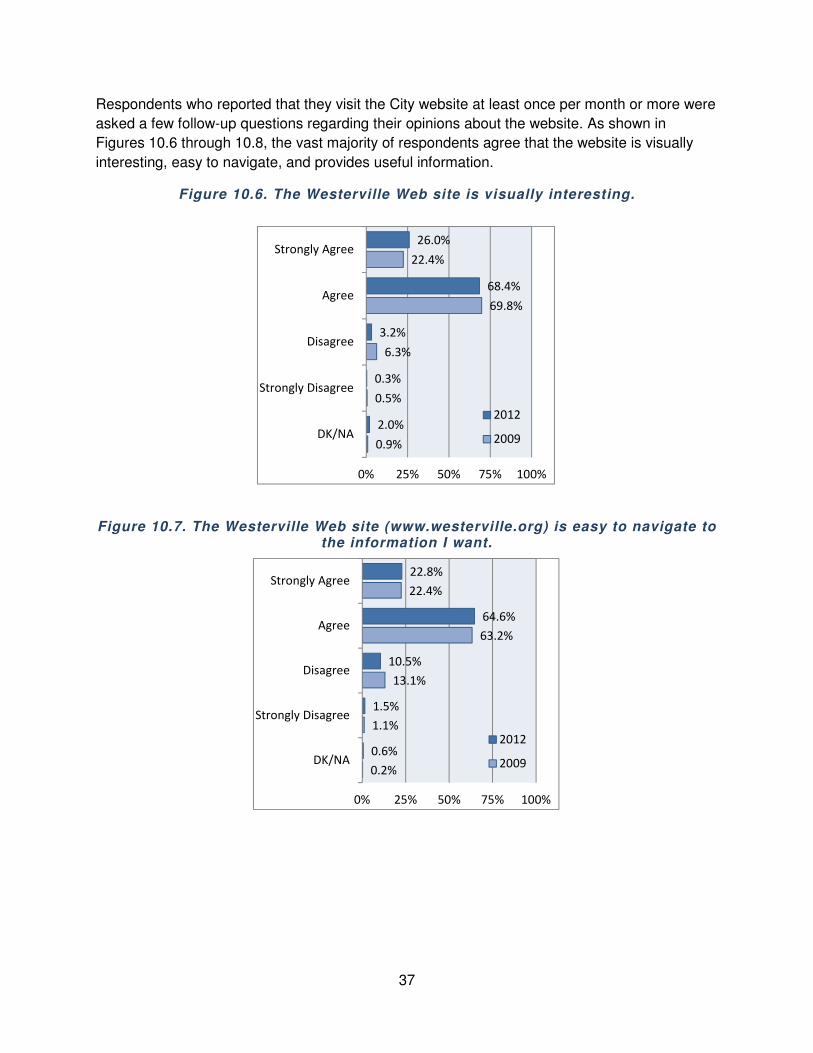
Respondents who reported that they visit the City website at least once per month or more were
asked a few follow-up questions regarding their opinions about the website. As shown in
Figures 10.6 through 10.8, the vast majority of respondents agree that the website is visually
interesting, easy to navigate, and provides useful information.
Figure 10.6. The Westerville Web site is visually interesting.
Figure 10.7. The Westerville Web site (www.westerville.org) is easy to navigate to the information I want.
26.0%
68.4%
3.2%
0.3%
2.0%
22.4%
69.8%
6.3%
0.5%
0.9%
0% 25% 50% 75% 100%
Strongly Agree
Agree
Disagree
Strongly Disagree
DK/NA
2012
2009
22.8%
64.6%
10.5%
1.5%
0.6%
22.4%
63.2%
13.1%
1.1%
0.2%
0% 25% 50% 75% 100%
Strongly Agree
Agree
Disagree
Strongly Disagree
DK/NA
2012
2009

38
Figure 10.8. The Westerville website provides useful information.
Group Differences
Years of residence: No significant differences.
Age: No significant differences.
Rent or own home: Residents who rent are more likely to strongly agree that the City of
Westerville website is visually interesting.
Zone: Zone 4 residents are less likely to agree that the City of Westerville website is visually
interesting than residents in Zones 2 and 3.
Figure 10.9 looks at respondent interest related to the ability to pay City utilities through a link
on the City website. Overall, 42 percent say they would choose this option if it were available.
Respondent interest in online utility bill payment did not change significantly from 2009 to 2012.
Figure 10.9. If the City provided the capability of paying your City utility bills on the City Website would you choose to use this option?
Group Differences
Years of residence: Residents who have lived in Westerville longer were less likely to indicate
they would chose to pay their utility bills on the City website.
Age: Younger residents were more likely to indicate they would chose to pay their utility bills on
the City website than older residents.
37.1%
60.6%
1.5%
0.0%
0.9%
0% 25% 50% 75% 100%
Strongly Agree
Agree
Disagree
Strongly Disagree
Don't Know
42.3%
57.7%
43.1%
56.9%
0% 25% 50% 75% 100%
Yes
No
2012
2009

39
Rent or own home: Residents who rent were more likely to indicate they would chose to pay
their utility bills on the City website than those who owned their own homes.
Zone: No significant differences.
Additionally, respondents were asked an open-ended response question, “What information or
services would make you use the Westerville website more often?” Of the 837 survey
respondents, 452 typed in a response. However, a large number of these, 168, were responses
such as “Don’t know,” and “Can’t think of anything,” or responses indicating that the respondent
would not visit the website no matter what information or services it offered. Another 34
respondents indicated that they felt the website is fine the way it is. Thus, in total, 250
respondents provided at least one type of information or service that would lead them to use the
website more often. These responses were coded into categorical themes which are presented
in Table 10.3. Please note that because up to two responses were coded per respondent, the
total percentage of respondents will exceed 100. By a fairly wide margin, respondents were
most likely to indicate that information related to news, emergencies, and other types of updates
(e.g., road maintenance, school closings, crime information) would lead to increased website
use. Respondents are also interested in information about upcoming events and bill pay.
Table 10.3. Information or Services that Would Make Respondents Use the Westerville Website More Often
Categorical Theme Percent
News/emergency/updates 31.2%
Events calendar/information about upcoming events 23.2%
Bill pay (e.g., taxes, utilities) 21.2%
Improved format/organization/appearance of website/make more user friendly
13.2%
A reminder/alert such as e-mail or other way to publicize (e.g., in a city publication)
9.6%
Opportunity to provide feedback/ask questions 3.6%
Other 3.6%
Coupons 2.4%
Traffic information 2.4%
Weather information 1.2%
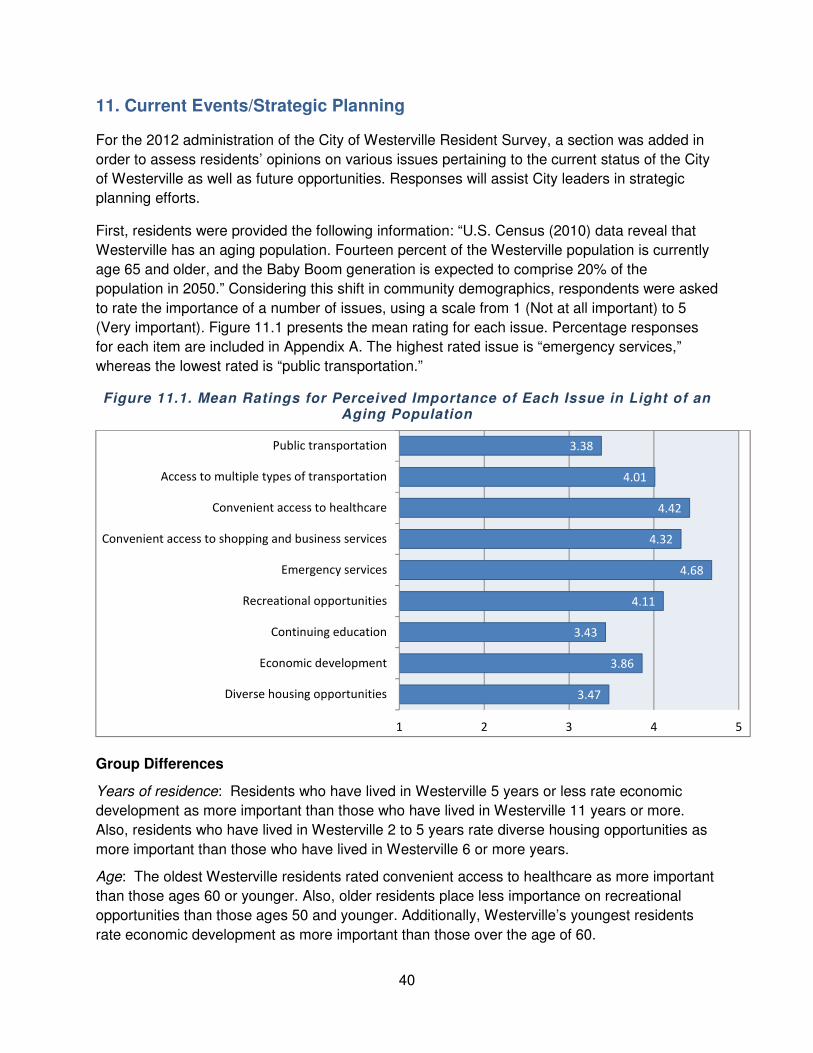
40
11. Current Events/Strategic Planning
For the 2012 administration of the City of Westerville Resident Survey, a section was added in
order to assess residents’ opinions on various issues pertaining to the current status of the City
of Westerville as well as future opportunities. Responses will assist City leaders in strategic
planning efforts.
First, residents were provided the following information: “U.S. Census (2010) data reveal that
Westerville has an aging population. Fourteen percent of the Westerville population is currently
age 65 and older, and the Baby Boom generation is expected to comprise 20% of the
population in 2050.” Considering this shift in community demographics, respondents were asked
to rate the importance of a number of issues, using a scale from 1 (Not at all important) to 5
(Very important). Figure 11.1 presents the mean rating for each issue. Percentage responses
for each item are included in Appendix A. The highest rated issue is “emergency services,”
whereas the lowest rated is “public transportation.”
Figure 11.1. Mean Ratings for Perceived Importance of Each Issue in Light of an Aging Population
Group Differences
Years of residence: Residents who have lived in Westerville 5 years or less rate economic
development as more important than those who have lived in Westerville 11 years or more.
Also, residents who have lived in Westerville 2 to 5 years rate diverse housing opportunities as
more important than those who have lived in Westerville 6 or more years.
Age: The oldest Westerville residents rated convenient access to healthcare as more important
than those ages 60 or younger. Also, older residents place less importance on recreational
opportunities than those ages 50 and younger. Additionally, Westerville’s youngest residents
rate economic development as more important than those over the age of 60.
3.38
4.01
4.42
4.32
4.68
4.11
3.43
3.86
3.47
1 2 3 4 5
Public transportation
Access to multiple types of transportation
Convenient access to healthcare
Convenient access to shopping and business services
Emergency services
Recreational opportunities
Continuing education
Economic development
Diverse housing opportunities

41
Rent or own home: Residents who rent place more importance on continuing education than
those who own.
Zone: No significant differences.
Respondents were asked, “In your opinion, what should the community be doing to attract and
retain young professionals?” Approximately 582 respondents provided a comment; of these, 89
were comments such as “Don’t know,” “Nothing,” “Can’t think of anything,” and so on, leaving
493 responses that were then coded into major themes. Table 11.1 below provides the major
themes that were identified. Please note that, because up to two responses were coded for
each respondent, the total percentage will exceed 100. The most common type of response is
that the community should be attracting businesses/employers that would appeal to young
professionals, as well as general job creation; this was mentioned by 29 percent of the 493
residents who provided a response.
Table 11.1. What should the community be doing to attract and retain young professionals?
Response Theme Percent
Attract businesses/employers that would appeal to young professionals; job creation
29.0% (143)
More/better “social” recreation; nightlife; shopping; entertainment
21.3% (105)
Offer affordable housing; diverse housing; housing options that would appeal to young professionals
17.4% (86)
Lower taxes/offer tax incentives 16.2% (79)
Maintain or improve quality of public schools; school system
14.4% (71)
Maintain or offer more/better parks; recreation; outdoor activities; bike paths
12.4% (61)
Other 12.4% (61)
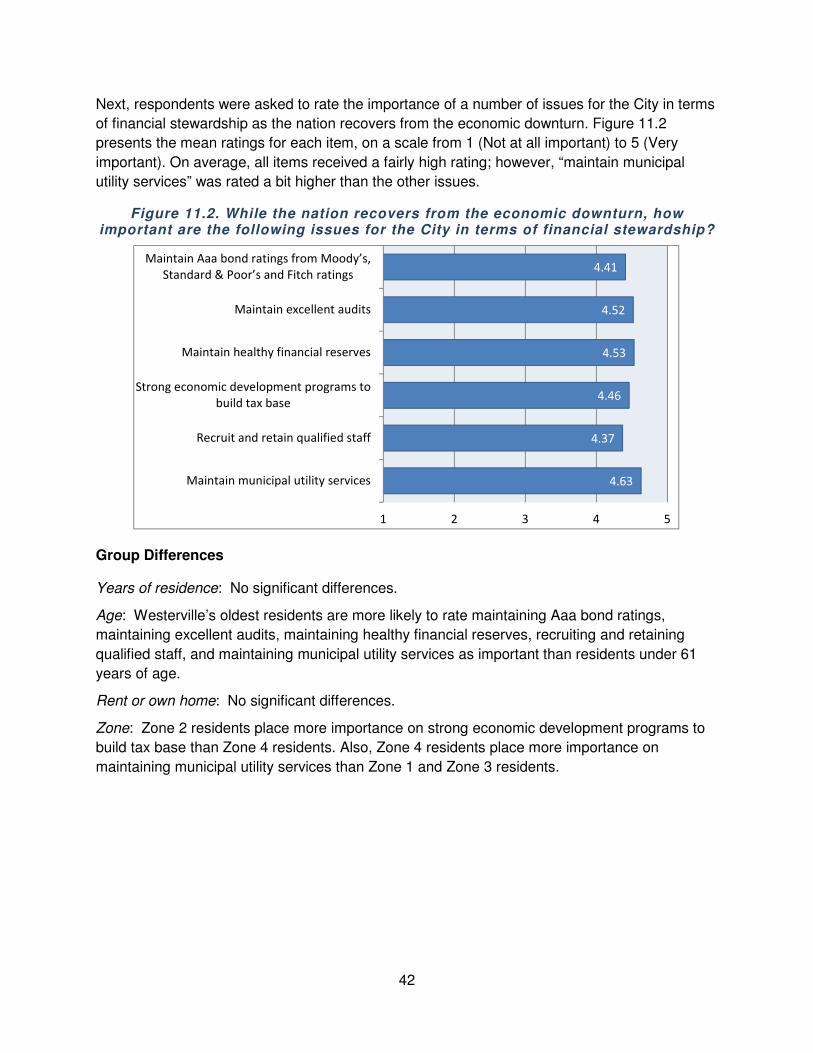
42
Next, respondents were asked to rate the importance of a number of issues for the City in terms
of financial stewardship as the nation recovers from the economic downturn. Figure 11.2
presents the mean ratings for each item, on a scale from 1 (Not at all important) to 5 (Very
important). On average, all items received a fairly high rating; however, “maintain municipal
utility services” was rated a bit higher than the other issues.
Figure 11.2. While the nation recovers from the economic downturn, how important are the following issues for the City in terms of financial stewardship?
Group Differences
Years of residence: No significant differences.
Age: Westerville’s oldest residents are more likely to rate maintaining Aaa bond ratings,
maintaining excellent audits, maintaining healthy financial reserves, recruiting and retaining
qualified staff, and maintaining municipal utility services as important than residents under 61
years of age.
Rent or own home: No significant differences.
Zone: Zone 2 residents place more importance on strong economic development programs to
build tax base than Zone 4 residents. Also, Zone 4 residents place more importance on
maintaining municipal utility services than Zone 1 and Zone 3 residents.
4.41
4.52
4.53
4.46
4.37
4.63
1 2 3 4 5
Maintain Aaa bond ratings from Moody’s,
Standard & Poor’s and Fitch ratings
Maintain excellent audits
Maintain healthy financial reserves
Strong economic development programs to
build tax base
Recruit and retain qualified staff
Maintain municipal utility services

43
Figure 11.3 provides mean ratings for several services or resources that the City currently
provides or may provide in the future. Respondents were asked to indicate how important each
of the services or resources is to them, on a scale from 1 (Not at all important) to 5 (Very
important). The City website was rated the most important, whereas a City of Westerville mobile
app was rated lowest.
Figure 11.3. How important is each of the following electronic services or resources to you?
Group Differences
Years of residence: Residents who have lived in Westerville 11 or more years place less
importance on the City website, online bill payment for utility services, and Wifi services in
Uptown and City Parks than those who have lived there less time.
Age: Residents under the age of 41 place more importance on the City website, online bill
payment for utility services, and Wifi services in Uptown and City Parks than those over the age
of 50.
Rent or own home: Residents who rent place greater importance on online bill payment for
utility services than those who own their homes.
Zone: No significant differences.
3.91
2.94
3.29
3.69
3.54
1 2 3 4 5
City website
City of Westerville mobile app (e.g., Service
Requests)
Online bill payment for utility services
E-mail communication from the City
Wifi services in Uptown and City parks

44
Next, respondents were asked if they would regularly watch 30 minutes of television
programming that aired monthly if it focused on Westerville events, issues, news and programs
and if it was developed and produced by the City. As Figure 11.4 shows, the majority of
respondents (53 percent) indicated that they would be willing to watch this programming, either
on television and/or online.
Figure 11.4. Willingness to watch at least 30 minutes of City developed and produced monthly television programming
Group Differences
Years of residence: Those who have lived in Westerville a year or less were most likely to
indicate they would watch a 30 minute program focused on Westerville, either on television
and/or online.
Age: No significant differences.
Rent or own home: No significant differences.
Zone: No significant differences.
19.9%
10.1%
22.9%
24.0%
23.1%
0% 25% 50% 75% 100%
Yes, on television
Yes, online
Yes, both on television and online
No
Don’t Know

45
Figure 11.5 presents the responses to the question, “How important do you think it is that the
City purchase, develop, and preserve available land for parks and open spaces?” The majority
(71 percent) rated the importance as a 4 or 5. The overall mean rating for this item is 4.03.
Figure 11.5. How important do you think it is that the City purchase, develop and preserve available land for parks and open spaces?
Group Differences
Years of residence: Residents who have lived in Westerville 26 years of more were less likely
to indicate it is very important to purchase, develop, and preserve land for parks and open
spaces than those who lived in Westerville 10 years or less.
Age: Younger residents were more likely to indicate it is very important to purchase, develop,
and preserve land for parks and open spaces than residents in all other age groups.
Rent or own home: No significant differences.
Zone: No significant differences.
44.2%
26.6%
15.7%
5.3%
5.0%
3.2%
0% 25% 50% 75% 100%
5 (Very important)
4
3
2
1 (Not at all important)
Do Not Know

46
Figure 11.6 presents the responses to the question, “How important is maintaining a vibrant
Uptown district?” Respondents were asked to rate the level of importance on a scale from 1
(Not at all Important) to 5 (Very Important). The vast majority (87 percent) rated the importance
as a 4 or 5. The overall mean rating for this item is 4.51.
Figure 11.6. How important is maintaining a vibrant Uptown district?
Group Differences
Years of residence: No significant differences.
Age: No significant differences.
Rent or own home: No significant differences.
Zone: No significant differences.
Respondents were asked, “In the past 12 months, have you visited Uptown Westerville?” As
seen in Figure 11.7, nearly all residents (95 percent) answered yes.
Figure 11.7. Visited Uptown Westerville in the past 12 months
Group Differences
Years of residence: No significant differences.
Age: No significant differences.
66.1%
20.7%
9.6%
1.7%
0.9%
1.0%
0% 25% 50% 75% 100%
5 (Very important)
4
3
2
1 (Not at all important)
Do Not Know
95.4%
3.9%
0.7%
0% 25% 50% 75% 100%
Yes
No
Don't remember

47
Rent or own home: Residents who own their homes were more likely to indicate they have
visited Uptown Westerville in the past 12 months than those who rent.
Zone: No significant differences.
The 780 respondents who reported that they had visited Uptown Westerville in the past 12
months were next presented a list of various reasons for visiting and were asked to indicate
which reasons applied to them. The results are presented in Figure 11.8. The most common
reason for visiting Uptown Westerville was dining/food (88 percent); the least common reason
was entertainment (24 percent). Of those who selected “Other” and wrote in a response, the
most common response was Fourth (4th) Fridays.
Figure 11.8. Reasons for visiting Uptown Westerville in the past 12 months
Group Differences
Years of residence: Those who have lived in Westerville 26 years or more were less likely to
indicate they visited Uptown for special events than other residents.
Age: Residents ages 18 to 50 were more likely to visit Uptown for special events than residents
ages 51 to 70. Also, younger residents were more likely to visit Uptown for entertainment than
those over the age of 50. Similarly, younger residents were more likely to indicate they visited
Uptown for a parade than those over the age of 60.
Rent or own home: No significant differences.
Zone: Residents of Zone 2 were more likely to indicate they visited Uptown for special events
than residents of Zones 1 and 3. Also, residents of Zones 2 and 4 were more likely to indicate
they visited Uptown for entertainment than residents of Zones 1 and 3. Similarly, residents of
79.0%
87.6%
26.2%
53.7%
48.8%
24.4%
36.4%
9.9%
0% 25% 50% 75% 100%
Shopping/Retail
Dining/Food
City Services
Special Events
Farmers Market
Entertainment
Parade
Other

48
Zones 2 and 4 were more likely to indicate they visited Uptown for a parade than residents of
Zones 1 and 3.
Figure 11.9 presents the responses to the question, “How concerned are you about crime in
Westerville?” Respondents were asked to rate their level of concern on a scale from 1 (Not at all
Concerned) to 5 (Very Concerned). Less than half (47 percent) rated their concern as a 4 or 5
(very concerned). The overall mean rating for this item is 3.44.
Figure 11.9. How concerned are you about crime in Westerville?
Group Differences
Years of residence: Those who have lived in Westerville longer were most likely to indicate they
are very concerned with crime in Westerville than those who have lived in Westerville less time.
Age: Younger residents were less likely to indicate they are very concerned with crime in
Westerville than older residents.
Rent or own home: No significant differences.
Zone: No significant differences.
24.0%
23.1%
28.3%
19.0%
4.4%
1.1%
0% 25% 50% 75% 100%
5 (Very concerned)
4
3
2
1 (Not at all concerned)
Do Not Know

49
When asked if they have noticed the road and aesthetic improvements made along the S. State
St. corridor, the vast majority of respondents (93 percent) indicated that they have (Figure
11.10).
Figure 11.10. Have you noticed the road and aesthetic improvements made along the S. State St. corridor?
Group Differences
Years of residence: Residents who have lived in Westerville a year or less were more likely to
indicate they have noticed the road and aesthetic improvements made along the S. State Street
corridor than those who have lived in Westerville two years or more.
Age: No significant differences.
Rent or own home: Residents who own their homes are more likely to indicate they have
noticed the road and aesthetic improvements made along the S. State Street corridor than those
who rent.
Zone: Residents of Zones 1 and 4 are more likely to indicate they have noticed the road and
aesthetic improvements made along the S. State Street corridor than residents of Zones 2 and
3.
Figure 11.11 presents the responses to the question asking how important respondents think
the revitalization of the S. State St. corridor is to the long-term health and vitality of the City. The
strong majority (70 percent) rated the importance as a 4 or 5. The overall mean rating for this
item is 4.05.
Figure 11.11. How important do you think the revitalization of the S. State St. corridor is to the long-term health and vitality of the City?
93.3%
6.7%
0% 25% 50% 75% 100%
Yes
No
40.8%
29.5%
18.0%
5.5%
2.2%
3.9%
0% 25% 50% 75% 100%
5 (Very important)
4
3
2
1 (Not at all important)
Do Not Know

50
Group Differences
Years of residence: No significant differences.
Age: No significant differences.
Rent or own home: No significant differences.
Zone: No significant differences.
Respondents were asked, “In your opinion, what are areas of opportunity for Westerville?”
Approximately 549 respondents provided a comment; of these, 54 were comments such as
“Don’t know,” “Nothing,” “Can’t think of anything,” and so on, leaving 495 responses that were
then coded into major themes. Comments for approximately 109 respondents could be coded
into two of the themes. Table 11.2 below provides the major themes that were identified. The
most commonly cited opportunity was improving traffic (e.g., flow) and parking availability; this
was mentioned by 20 percent of the 495 residents who provided a response. Another commonly
cited opportunity is attracting new or different businesses to the area as well as housing (16
percent).
Table 11.2. What are areas of opportunity for Westerville?
Response Theme Percent
Improve traffic; parking availability 19.6% (97)
Attract new/different businesses/retail; housing 16.0% (79)
Fix run-down areas; use existing vacant space 9.7% (48)
Lower taxes; better spending 8.7% (43)
Improve quality of roads (e.g., potholes, etc.) 8.3% (41)
More green space; parks 7.1% (35)
Increase safety/decrease crime 6.3% (31)
Make more pedestrian & bike friendly (e.g., more/better sidewalks; bike paths)
6.3% (31)
Expand Uptown 5.9% (29)
Expand nightlife/social recreation opportunities; community events
3.0% (15)
Other 30.1% (149)

51
Respondents were asked, “In your opinion, what areas of concern, if unaddressed, would
diminish the quality of life in Westerville in the future?” Approximately 582 respondents provided
a comment; of these, 39 were comments such as “Don’t know,” “Nothing,” “Can’t think of
anything,” and so on, leaving 543 responses that were then coded into major themes.
Comments for approximately 135 respondents could be coded into two of the themes. Table
11.3 below provides the major themes that were identified. The most commonly cited concern
was crime; this was mentioned by 17 percent of the 543 residents who provided a response.
Another commonly cited concern is traffic issues (15 percent).
Table 11.3. What areas of concern, if unaddressed, would diminish the quality of life in Westerville in the future?
Response Theme Percent
Crime 17.3% (94)
Traffic issues 14.9% (81)
High taxes; increasing costs; poor financial management 14.4% (78)
Declining quality of schools 13.8% (75)
Declining infrastructure/utilities 8.1% (44)
Undesirable housing; run-down properties 7.9% (43)
Big box stores (especially Walmart) 7.0% (38)
Declining police/fire/other City services 5.9% (32)
Parks maintenance/parks & recreation 5.5% (30)
Empty stores 5.2% (28)
Safety 3.9% (21)
Other 15.1% (82)
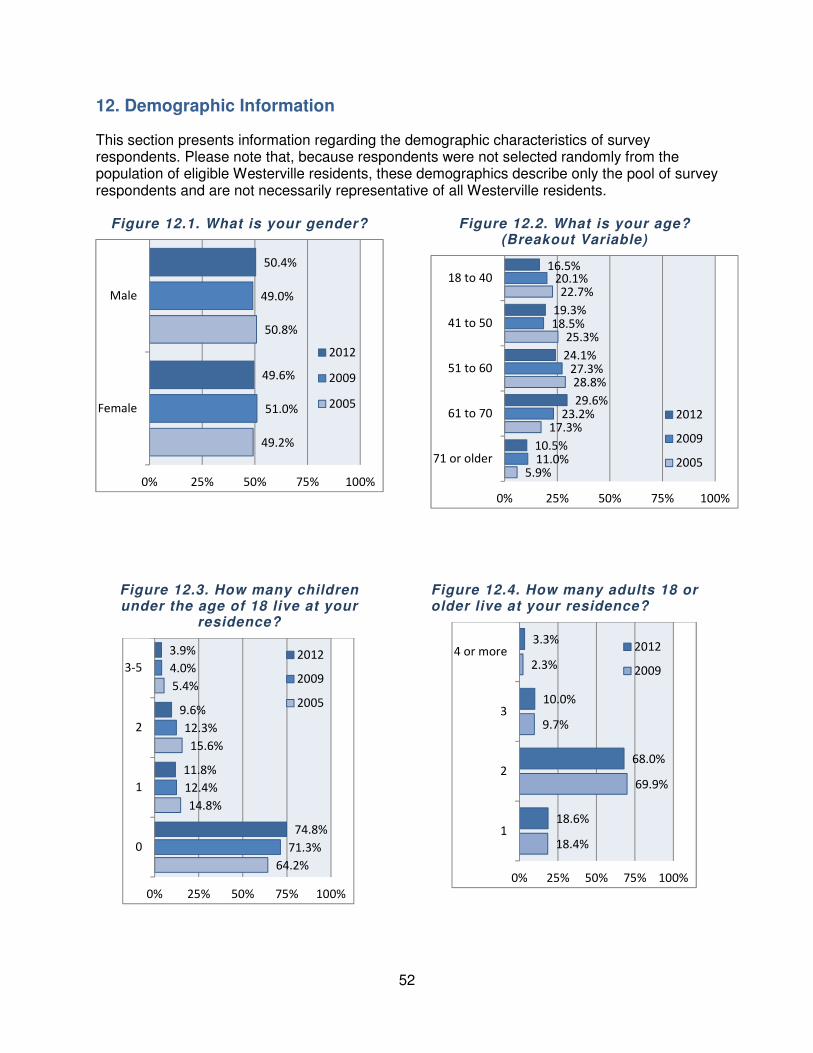
52
12. Demographic Information
This section presents information regarding the demographic characteristics of survey respondents. Please note that, because respondents were not selected randomly from the population of eligible Westerville residents, these demographics describe only the pool of survey respondents and are not necessarily representative of all Westerville residents.
Figure 12.1. What is your gender?
Figure 12.2. What is your age? (Breakout Variable)
Figure 12.3. How many children under the age of 18 live at your
residence?
Figure 12.4. How many adults 18 or older live at your residence?
50.4%
49.6%
49.0%
51.0%
50.8%
49.2%
0% 25% 50% 75% 100%
Male
Female
2012
2009
2005
16.5%
19.3%
24.1%
29.6%
10.5%
20.1%
18.5%
27.3%
23.2%
11.0%
22.7%
25.3%
28.8%
17.3%
5.9%
0% 25% 50% 75% 100%
18 to 40
41 to 50
51 to 60
61 to 70
71 or older
2012
2009
2005
3.9%
9.6%
11.8%
74.8%
4.0%
12.3%
12.4%
71.3%
5.4%
15.6%
14.8%
64.2%
0% 25% 50% 75% 100%
3-5
2
1
0
2012
2009
2005
3.3%
10.0%
68.0%
18.6%
2.3%
9.7%
69.9%
18.4%
0% 25% 50% 75% 100%
4 or more
3
2
1
2012
2009

53
Figure 12.5. Marital Status
Figure 12.6. Race
Figure 12.7. How long lived in Westerville? (Breakout Variable)
Figure 12.8. Do you rent or own your home? (Breakout Variable)
74.2%
3.6%
6.0%
11.0%
5.2%
0% 25% 50% 75% 100%
Married
Living with a partner
Single, never married
Divorced or separated
Widowed
95.6%
4.4%
96.1%
3.9%
97.6%
2.4%
0% 25% 50% 75% 100%
Caucasian
Other
2012
2009
2005
33.3%
35.7%
12.9%
12.3%
5.7%
27.8%
35.6%
15.1%
16.7%
4.8%
21.7%
35.1%
17.3%
20.1%
5.8%
0% 25% 50% 75% 100%
26 years or more
11 to 25 years
6 to 10 years
2 to 5 years
1 year or less
2012
2009
2005
93.9%
6.1%
94.6%
5.4%
95.0%
5.0%
0% 25% 50% 75% 100%
Own
Rent
2012
2009
2005

54
Figure 12.9. What is the last grade of school that you completed?
Figure 12.10. Which of the following best describes your household
income?
0.0%
7.1%
15.7%
6.3%
31.5%
11.0%
28.4%
0.0%
7.1%
13.1%
41.6%
11.3%
26.9%
0.1%
7.2%
19.2%
37.5%
10.7%
25.3%
0% 25% 50% 75% 100%
Less than High School
High School
Some College
Associate's Degree
Bachelor's Degree
Some Post-Graduate
Work
Post-Graduate Degree
2012
2009
2005
5.4%
13.3%
24.1%
30.3%
14.3%
12.7%
3.3%
14.5%
24.3%
32.2%
11.7%
14.0%
5.1%
12.9%
26.4%
34.0%
11.9%
9.6%
0% 25% 50% 75% 100%
Less than $30,000
$30,000 - $49,999
$50,000 - $79,999
$80,000 - $119,999
$120,000 - $149,999
$150,000 or more
2012
2009
2005

55
Table 12.1. In which community does the primary and secondary wage earner of your household work?
Primary Wage Earner Secondary Wage Earner
Community 2012 2009 2005 2012 2009 2005
Columbus 45.2% 44.9% 52.4% 33.9% 37.1% 44.0%
Westerville 25.3% 27.2% 28.7% 37.6% 35.1% 38.1%
Dublin 5.7% 5.3% 6.2% 3.2% 4.0% 4.5%
Worthington 3.4% 2.7% 4.5% 1.8% 3.7% 4.9%
Gahanna 2.3% 1.6% 1.7% 2.4% 1.9% 2.4%
Whitehall 2.0% 1.3% 1.0% 1.1% 1.0% 0.0%
New Albany 1.8% 2.0% 0.8% 1.3% 1.0% 2.2%
Hilliard 1.3% 0.9% 1.1% 1.8% 1.4% 1.8%
Delaware 1.3% 1.2% 0.9% 1.6% 0.6% 1.4%
Bexley 0.7% 0.3% 0.2% 0.3% 0.3% 0.0%
Grove City 0.5% 0.5% 0.6% 0.5% 0.2% 0.0%
Upper Arlington 0.5% 0.6% 0.5% 1.6% 0.6% 0.0%
Reynoldsburg 0.3% 0.7% 1.4% 0.3% 1.0% 0.6%
Other 9.8% 11.0% 0.0% 12.6% 12.2% 0.0%
Figure 12.1. Resident Zone (Breakout Variable)
14.5%
42.7%
34.1%
8.7%
15.1%
41.7%
35.1%
8.1%
0% 25% 50% 75% 100%
Zone 1
Zone 2
Zone 3
Zone 42012
2009

56
13. Summary of Group Difference Results
In this section, we provide a summary of the major trends that emerged from the group
differences analysis.
Years of residence
Newer residents seem to appreciate the modern amenities and more recent upgrades that have
taken place or could be taking place in Westerville. They tend to rate facilities that are newer
(Millstone), are recently renovated (Highlands Park Aquatic Center), or are designed to appeal
to more modern or younger residents (Millstone, Highlands Park Aquatic Center,
Skateboard/BMX Park); they also feel safer on bikeways and leisure paths and in parks.
Furthermore, they are more likely to feel that the City should keep developing spaces for parks
and other opens spaces. They also prefer and use the city website more often (along with other
means like email and social media), and are more likely to want options like online bill pay and
Wifi. They tend to rate the municipal services such as sidewalk maintenance and street
rehabilitation better and notice the improvements along S. State St. Their priorities revolve
around economic development and opportunity, quality schools, and quality housing
opportunities.
Residents who have lived in Westerville longer have different priorities. They are less concerned
with school and work, and are more concerned with convenience (e.g., wanting to be close to
friends/family and Otterbein), safety (e.g., feeling less safe in various areas and being more
concerned with crime), and fiscal responsibility (both in their rating of importance and the fact
that they pay more attention to various city issues). They are more likely to have watched cable
access TV and less likely to use the internet to get information. They are less impressed by
higher-profile events or improvements; they are less impressed by the newer parks, less likely
to go Uptown for special events, and less likely to have noticed the improvements made along
S. State St.
Age
Not surprisingly, age patterns are similar as those for years of residence. Younger residents
tend to be more focused on schools, parks (particularly in age groups where they are likely to
have young children), and work opportunity/convenience. They feel that infrastructure
development, maintenance, recreational opportunities, and community outreach by the police
are areas of greater importance. They are more likely to visit Uptown for various events.
Older residents are more focused on city-related issues, which shows in their concern about city
audits, maintaining bond ratings, and maintaining public services. They are more likely to feel
that fiscal responsibility should be the primary focus of Westerville. They do seem to feel overall
that Westerville is doing a good job of managing its growth. They want a police force focused on
safety, access to healthcare, and are not as concerned about developing green spaces or
recreational programs.
57
Home Ownership Status
People who own their homes in Westerville have higher ratings of things that serve them more
directly: recycling, refuse collection, and water/sewer/utility billing services. They also have a
more favorable perspective of some “community appeal” aspects of Westerville: they feel more
favorably towards the variability in the housing market, are more likely to have visited Uptown,
and are more likely to have noticed the S. State St. work.
Residents who rent tend to have a more jobs- or higher-education-oriented perspective. They
are in favor of economic development and fiscal incentives for jobs, and place greater
importance of convenience to work or Otterbein (and also place a higher value on continuing
education). They are more likely to want online services.
Zone
In general, Zone 1 residents seem to be somewhat less connected to the City; they place a
higher importance on convenience to work, are less likely to visit Uptown, and are less
interested in seeing City Council meetings. They are less interested in affordable housing or
family-friendliness than some other zones. They also are less impressed with City services,
rating street maintenance, street cleaning, utility services, and police response time lower than
other zones.
People living in Zone 2 seem to be the happiest with the various aspects of Westerville covered
in the survey. They tend to have higher satisfaction with a variety of services and aspects of the
community, feel safe, and are pleased with the way the City is handling development and
improvement. They tend to have family-oriented perspectives, feeling that family-friendliness is
important to the City, being more inclined to watch school board meetings, and rating the skate
park higher; they also are more likely to visit Uptown for special events, entertainment, or
parades.
Overall, Zone 4 residents seem the least satisfied of Westerville residents. They rate a variety of
aspects as lower quality, from the prudence of City financial management to the promotion of
recycling to the quality of Millstone Park to individuals with disabilities programs; when there is a
significant difference, it seems they are usually less satisfied than other residents. They also
think things like family friendliness, schools, and affordable housing are important. They do,
however, place a greater importance on maintaining municipal utility services, and are more
likely to have noticed the improvements on S. State St.
No clear trends emerge when looking at the survey results for Zone 3 residents; they rate some
aspects of Westerville higher and other aspects lower, with no clearly evident pattern.

58
14. Summary of Comparisons between 2009 and 2012 Survey Results
Significant differences between the 2009 and 2012 survey responses have been discussed
throughout the report. In this section, we summarize these results.
Items Rated Higher in 2012 than 2009:
• Perceived safety inside one’s home
• Police community outreach services
• Highlands Park Aquatic Center
• Snow removal
• Street cleaning
• Leaf collection
Items Rated Lower in 2012 than 2009:
• Agreement with the statement, “Westerville does a good job of managing retail and
business growth.”
• Agreement with the statement, “Traffic flows on Westerville’s main arteries have
improved in the last three years.”
• Agreement with the statement, “It is important for all local government agencies,
community leaders, and civic organizations to work together to tell a consistent story
about the City of Westerville.”
• Fire prevention and inspection
• Fire safety and education
• Soccer fields
• Baseball/softball parks
• Bikeways/leisure paths
• Street maintenance
• Percentage of residents who say they have watched City of Westerville programming on
the public service channel (Channel 3 or WOCC-TV) in the past two years
Demographic Differences:
Only two of the demographic measures changed significantly between 2009 and 2012: age and
years of residence. There was a decline in the percentage of respondents age 18-40 and an
increase in the percentage of respondents age 61-70. With regard to residency, there was a
decline in the percentage of respondents who have lived in Westerville 2-5 years and an
increase in the percentage of respondents who have lived in Westerville 26 years or more.
Given the strong relationship between these two measures, it is not surprising that changes in
one closely mirror changes in the other.
Overall, there were many more similarities in the survey results for 2009 and 2012 than
differences. Further, although the differences noted are statistically significant, in general the
differences are not large in magnitude.

59
Appendix A: Percentage and Number Response for Item Results Presented as Means
City Departments and Staff (Figure 1.10)
Strongly Agree
Agree Disagree Strongly Disagree
DK/NA
I am very satisfied with the overall quality of services provided by the City of Westerville. (Reminder: school and library services are not part of the City’s services.)
45.3% (378)
47.7% (398)
3.8% (32)
1.8% (15)
1.4% (12)
Westerville’s City government does a good job of making information available.
37.4% (310)
52.7% (436)
4.2% (35)
1.1% (9)
4.6% (38)
If I have a problem regarding a city service, I can conveniently reach the appropriate department.
34.7% (288)
51.7% (430)
4.0% (33)
0.5% (4)
9.1% (76)
The City staff is courteous and friendly to the citizens of Westerville.
39.4% (327)
48.6% (404)
2.6% (22)
0.8% (7)
8.5% (71)
The City staff responds to citizen requests in a timely manner.
30.5% (252)
45.3% (374)
5.2% (43)
0.8% (7)
18.1% (149)
Westerville City leaders are prudent with their management of City finances. (Reminder: school and library services are not part of the City’s services.)
15.6% (129)
51.6% (428)
11.7% (97)
4.7% (39)
16.4% (136)

60
How important each is to you when thinking about why you live in
Westerville (Figure 2.2)
5 (Very important)
4 3 2 1 (Not at all important)
NA
The convenient location to work 21.2% (175)
20.9% (173)
17.6% (145)
7.6% (63)
6.1% (50)
26.6% (220)
Convenient access to shopping and
entertainment 32.7% (270)
41.0% (339)
19.0% (157)
3.8% (31)
2.9% (24)
0.6% (5)
Access to quality city parks and
recreation space 43.1% (358)
32.7% (272)
14.7% (122)
4.6% (38)
3.7% (31)
1.2% (10)
The family friendly nature of the city 50.8% (420)
29.5% (244)
12.0% (99)
2.8% (23)
3.0% (25)
1.9% (16)
Affordable housing 34.7% (288)
35.3% (293)
19.4% (161)
3.7% (31)
3.6% (30)
3.3% (27)
The quality of the public school district 39.0% (323)
24.2% (200)
15.1% (125)
4.8% (40)
6.5% (54)
10.4% (86)
Overall safety of the community 73.8% (615)
17.3% (144)
2.8% (23)
1.0% (8)
2.0% (17)
3.1% (26)
Family and friends live near by 27.5% (228)
22.3% (185)
22.6% (187)
10.4% (86)
10.7% (89)
6.5% (54)
Close to Otterbein University 5.0% (42)
6.8% (57)
13.2% (110)
6.8% (57)
5.0% (42)
16.4% (137)
Personal Safety (Figure 3.1)
Very Safe Safe Unsafe Very Unsafe
In Westerville as a Whole 44.7% (372)
54.7% (455)
0.6% (5)
0.0% (0)
Inside Your Home 67.4% (560)
32.1% (267)
0.5% (4)
0.0% (0)
In Your Neighborhood During the Day 71.0% (592)
28.5% (238)
0.5% (4)
0.0% (0)
In Your Neighborhood at Night 34.6% (288)
61.7% (514)
3.5% (29)
0.2% (2)
In a City Park 25.6% (212)
70.5% (584)
3.9% (32)
0.0% (0)
On City Bikeway and Leisure Paths 25.2% (207)
70.3% (577)
4.1% (34)
0.4% (3)

61
Public Safety Services (Figure 3.3)
Excellent Good Poor Very Poor DK/NA
Emergency Medical Services 56.1% (463)
23.6% (195)
0.0% (0)
0.2% (2)
20.0% (165)
EMS Billing Services 5.8% (48)
12.8% (106)
0.8% (7)
0.7% (6)
79.8% (661)
9-1-1 Dispatcher Services 45.1% (370)
24.6% (202)
0.2% (2)
0.1% (1)
30.0% (246)
Fire Suppression Services 40.7% (336)
30.1% (249)
0.7% (6)
0.0% (0)
28.5% (235)
Fire Prevention & Inspection Services 19.7% (161)
31.0% (253)
1.0% (8)
0.2% (2)
48.1% (393)
Fire Safety and Education Programs 26.0% (215)
33.1% (274)
0.8% (7)
0.2% (2)
39.9% (330)
Fire Emergency Response Times 44.7% (369)
19.6% (162)
0.1% (1)
0.0% (0)
35.6% (294)
Police Emergency Response Times 45.9% (380)
22.6% (187)
10.4% (86)
10.7% (89)
25.7% (213)
Police Patrol Services 42.6% (345)
44.4% (359)
3.6% (29)
0.7% (6)
8.7% (70)
Police Community Outreach Services 40.2% (334)
31.2% (259)
0.7% (6)
0.4% (3)
27.6% (229)
Police Animal Control Services 16.6% (137)
31.3% (258)
3.9% (32)
1.3% (11)
46.8% (385)
Parks and Recreation Facilities (Figures 4.1 and 4.2)
Excellent Good Poor Very Poor DK/NA
Highlands Park Aquatic Center 37.9% (313)
16.7% (138)
16.7% (138)
1.3% (11)
43.5% (359)
Community Center 62.7% (517)
23.6% (195)
2.4% (20)
0.5% (4)
10.8% (89)
Westerville Sports Complex 40.4% (334)
26.4% (218)
0.8% (7)
0.5% (4)
31.8% (263)
Everal Barn & Heritage Park 47.2% (391)
32.0% (265)
1.3% (11)
0.1% (1)
19.4% (161)
Senior Center 22.3% (184)
19.5% (161)
2.1% (17)
0.1% (1)
56.1% (463)
Skateboard/BMX Bike Park 9.8% (81)
13.3% (110)
1.2% (10)
0.5% (4)
75.2% (620)
Millstone Creek Park 26.0% (214)
15.4% (127)
0.6% (5)
0.0% (0)
58.0% (477)
Bark Park 13.2% (108)
17.7% (145)
2.3% (19)
0.7% (6)
66.1% (541)
Neighborhood Parks 52.0% (431)
36.9% (306)
0.7% (6)
0.1% (1)
10.3% (85)
First Responders Park 36.2% (299)
24.2% (200)
1.0% (8)
0.6% (5)
38.0% (314)

62
Parks Services (Figures 5.1)
Excellent Good Poor Very Poor DK/NA
Parks Maintenance 37.9% (313)
16.7% (138)
16.7% (138)
1.3% (11)
43.5% (359)
Soccer Fields 62.7% (517)
23.6% (195)
2.4% (20)
0.5% (4)
10.8% (89)
Baseball/Softball Fields 40.4% (334)
26.4% (218)
0.8% (7)
0.5% (4)
31.8% (263)
Lacrosse Fields 47.2% (391)
32.0% (265)
1.3% (11)
0.1% (1)
19.4% (161)
Playgrounds 22.3% (184)
19.5% (161)
2.1% (17)
0.1% (1)
56.1% (463)
Picnic Shelters 9.8% (81)
13.3% (110)
1.2% (10)
0.5% (4)
75.2% (620)
Tennis Courts 26.0% (214)
15.4% (127)
0.6 % (5)
0.0% (0)
58.0% (477)
Basketball Courts 13.2% (108)
17.7% (145)
2.3% (19)
0.7% (6)
66.1% (541)
Bikeways/Leisure Paths 52.0% (431)
36.9% (306)
0.7% (6)
0.1% (1)
10.3% (85)
Nature Preserves 36.2% (299)
24.2% (200)
1.0% (8)
0.6% (5)
38.0% (314)
Ratings for Recreation Services (Figures 6.1)
Excellent Good Poor Very Poor DK/NA
Pre-School Programs 10.7% (89)
11.4% (94)
0.7% (6)
0.4% (3)
76.8% (636)
Youth Programs 13.9% (114)
14.8% (121)
1.2% (10)
0.1% (1)
69.9% (572)
Teenage Programs 7.9% (65)
12.7% (105)
2.1% (17)
0.1% (1)
77.2% (638)
Adult Programs 24.2% (198)
33.9% (278)
2.3% (19)
0.1% (1)
39.4% (323)
Senior Adult Programs 19.7% (162)
20.5% (169)
1.3% (11)
0.2% (2)
58.2% (479)
Athletic Programs/Sports Leagues 25.2% (208)
22.1% (182)
1.1% (9)
0.1% (1)
51.5% (424)
Fitness Programs 28.9% (238)
26.0% (214)
1.6% (13)
0.1% (1)
43.4% (358)
Individuals with Disabilities Programs 5.3% (44)
7.7% (63)
1.6% (13)
0.4% (3)
85.1% (700)
Recreation Course Online Registration 24.5% (202)
23.7% (195)
2.8% (23)
0.6% (5)
48.4% (399)

63
Ratings for Planning & Development Services (Figures 7.1)
Excellent Good Poor Very Poor DK/NA
Building permit and inspection 12.5% (103)
23.4% (193)
5.9% (49)
2.3% (19)
55.9% (461)
Zoning permit and approval 9.3% (76)
21.0% (172)
5.9% (48)
3.3% (27)
60.6% (497)
Code enforcement/property maintenance 12.2% (100)
29.4% (242)
11.9% (98)
2.9% (24)
43.6% (359)
Sidewalk maintenance 16.4% (135)
55.7% (459)
13.7% (113)
2.9% (24)
11.3% (93)
Road construction services 17.7% (146)
59.5% (492)
10.2% (84)
2.8% (23)
9.9% (82)
Annual street rehabilitation and repair program
20.5% (169)
54.5% (450)
11.9% (98)
3.6% (30)
9.6% (79)
Ratings for Public Works Services (Figures 8.1)
Excellent Good Poor Very Poor DK/NA
Street maintenance (pot holes) 18.5% (153)
64.5% (534)
13.0% (108)
1.9% (16)
2.1% (17)
Snow removal 58.4% (485)
38.3% (318)
1.8% (15)
0.4% (3)
1.1% (9)
Street cleaning 43.1% (357)
48.9% (405)
3.4% (28)
0.4% (3)
4.2% (35)
Sewer maintenance 24.9% (206)
42.7% (353)
3.0% (25)
0.6% (5)
28.7% (237)
Leaf collection 51.6% (426)
36.5% (301)
2.8% (23)
0.2% (2)
8.8% (73)
Refuse collection 61.6% (511)
31.2% (259)
2.2% (18)
0.5% (4)
4.6% (38)
Recycling collection 59.4% (491)
31.3% (259)
2.2% (18)
1.3% (11)
5.8% (48)
Yard waste collection 60.7% (503)
30.3% (251)
1.3% (11)
0.0% (0)
7.7% (64)
Stormwater management 21.1% (174)
37.6% (310)
5.1% (42)
1.3% (11)
34.9% (288)

64
Ratings for Utility Services (Figures 9.1)
Excellent Good Poor Very Poor DK/NA
Water 47.6% (396)
46.4% (386)
2.9% (24)
0.8% (7)
2.3% (19)
Electric 55.4% (457)
41.2% (340)
1.8% (15)
0.6% (5)
1.0% (8)
Sewer 41.8% (344)
49.0% (403)
1.7% (14)
1.6% (13)
6.0% (49)
Street lighting 42.5% (352)
49.4% (409)
5.2% (43)
0.5% (4)
2.4% (20)
Utility billing 46.9% (389)
47.3% (393)
3.7% (31)
0.6% (5)
1.4% (12)
Perceived Importance of Each Issue in Light of an Aging Population (Figure
11.1)
5 (Very important)
4 3 2 1 (Not at all important)
Don’t know
Public Transportation 23.6% (191)
22.2% (179)
24.5% (198)
12.3% (99)
10.8% (87)
6.7% (54)
Access to multiple types of transportation (public transportation, road network, pathway system, sidewalks)
40.1% (328)
29.5% (241)
18.9% (155)
4.8% (39)
3.5% (29)
3.2% (26)
Convenient access to healthcare 56.7% (465)
29.4% (241)
10.7% (88)
1.7% (14)
0.4% (3)
1.1% (9)
Convenient access to shopping and business services
47.4% (388)
37.5% (307)
12.6% (103)
1.1% (9)
0.4% (3)
1.0% (8)
Emergency Services 74.1% (607)
19.4% (159)
5.4% (44)
0.2% (2)
0.1% (1)
0.7% (6)
Recreational Opportunities 38.6% (316)
38.0% (311)
16.6% (136)
2.7% (22)
2.0% (16)
2.1% (17)
Continuing Education 16.6% (135)
30.1% (245)
31.4% (256)
9.9% (81)
6.3% (51)
5.8% (47)
Economic Development (Job Creation and Retention)
34.2% (279)
30.3% (247)
18.0% (147)
5.5% (45)
6.0% (49)
5.9% (48)
Diverse Housing Opportunities 21.8% (178)
29.5% (241)
23.4% (191)
10.4% (85)
9.3% (76)
5.5% (45)
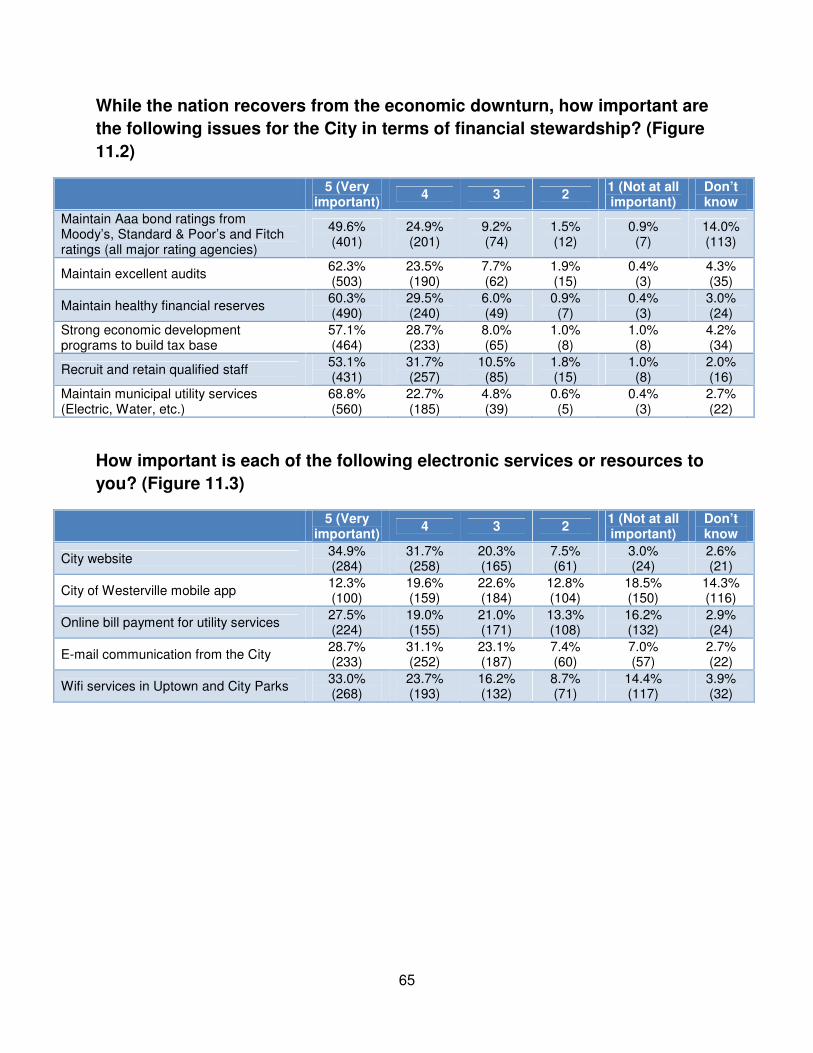
65
While the nation recovers from the economic downturn, how important are
the following issues for the City in terms of financial stewardship? (Figure
11.2)
5 (Very important)
4 3 2 1 (Not at all important)
Don’t know
Maintain Aaa bond ratings from Moody’s, Standard & Poor’s and Fitch ratings (all major rating agencies)
49.6% (401)
24.9% (201)
9.2% (74)
1.5% (12)
0.9% (7)
14.0% (113)
Maintain excellent audits 62.3% (503)
23.5% (190)
7.7% (62)
1.9% (15)
0.4% (3)
4.3% (35)
Maintain healthy financial reserves 60.3% (490)
29.5% (240)
6.0% (49)
0.9% (7)
0.4% (3)
3.0% (24)
Strong economic development programs to build tax base
57.1% (464)
28.7% (233)
8.0% (65)
1.0% (8)
1.0% (8)
4.2% (34)
Recruit and retain qualified staff 53.1% (431)
31.7% (257)
10.5% (85)
1.8% (15)
1.0% (8)
2.0% (16)
Maintain municipal utility services (Electric, Water, etc.)
68.8% (560)
22.7% (185)
4.8% (39)
0.6% (5)
0.4% (3)
2.7% (22)
How important is each of the following electronic services or resources to
you? (Figure 11.3)
5 (Very important)
4 3 2 1 (Not at all important)
Don’t know
City website 34.9% (284)
31.7% (258)
20.3% (165)
7.5% (61)
3.0% (24)
2.6% (21)
City of Westerville mobile app 12.3% (100)
19.6% (159)
22.6% (184)
12.8% (104)
18.5% (150)
14.3% (116)
Online bill payment for utility services 27.5% (224)
19.0% (155)
21.0% (171)
13.3% (108)
16.2% (132)
2.9% (24)
E-mail communication from the City 28.7% (233)
31.1% (252)
23.1% (187)
7.4% (60)
7.0% (57)
2.7% (22)
Wifi services in Uptown and City Parks 33.0% (268)
23.7% (193)
16.2% (132)
8.7% (71)
14.4% (117)
3.9% (32)

66
Appendix B: Westerville Zones

¬«3
¬«710
¬«3TU
SSIC
STRE
ET RD
DEMPSEY RD
GEMINI PL
CENTRAL COLLEGE RD
SMOTHERS RD
WORTHINGTO
N
GALENA RD
COUNTY LINE RD
W MAIN ST
E SCHROCK RDS S
TATE
ST
MAPL
E CA
NYON
AVE
E COLLEGE AVE
LAZELLE RD
S SP
RING
RD
CLEV
ELA N
D AV
E
SUNB
URY R
D
N WE
ST ST
COMMUNITY PARK DR
E WALNUT ST
PARK RD
N SP
RING
RD
W SCHROCK RD
N STAT
E ST
COOPER RD
AFRI
CA RD
KARL
R D
ORION PL
POLARIS PKWY
§̈¦71
§̈¦270§̈¦270
§̈¦71
§̈¦71
Zone2
Zone3
Zone4
Zone1