2013-las-session-59
TRANSCRIPT
SOA 2013 Life & Annuity Symposium May 6-7, 2013
Session 59 PD, Impact of the Low Interest Rate
Environment on Life Insurers
Moderator: Richard C. Pretty, FSA, MAAA
Presenters:
Joseph R. Dziwura Yidong (Winter) Liu, FSA, MAAA
Primary Competency External Forces & Industry Knowledge

1
Session 59 Panel Discussion: Impact of the Low Interest Rate Environment on Life Insurers
2013 SOA Life & Annuity Symposium
Richard Pretty, FSA, MAAA
Agenda
I. Welcome & Introductions ………………….. Richard Pretty, Senior Managing DirectorProduct Actuarial, TIAA-CREF
Joseph Dziwura, Senior Managing Director Market Risk, TIAA-CREF
Winter Liu, PrincipalOliver Wyman
II. Opening Remarks …………………………. Richard Pretty
III. Presentations ……………….……………... Joseph Dziwura
2
Winter Liu
IV. Q&A ………….………………………….….. Richard Pretty
2
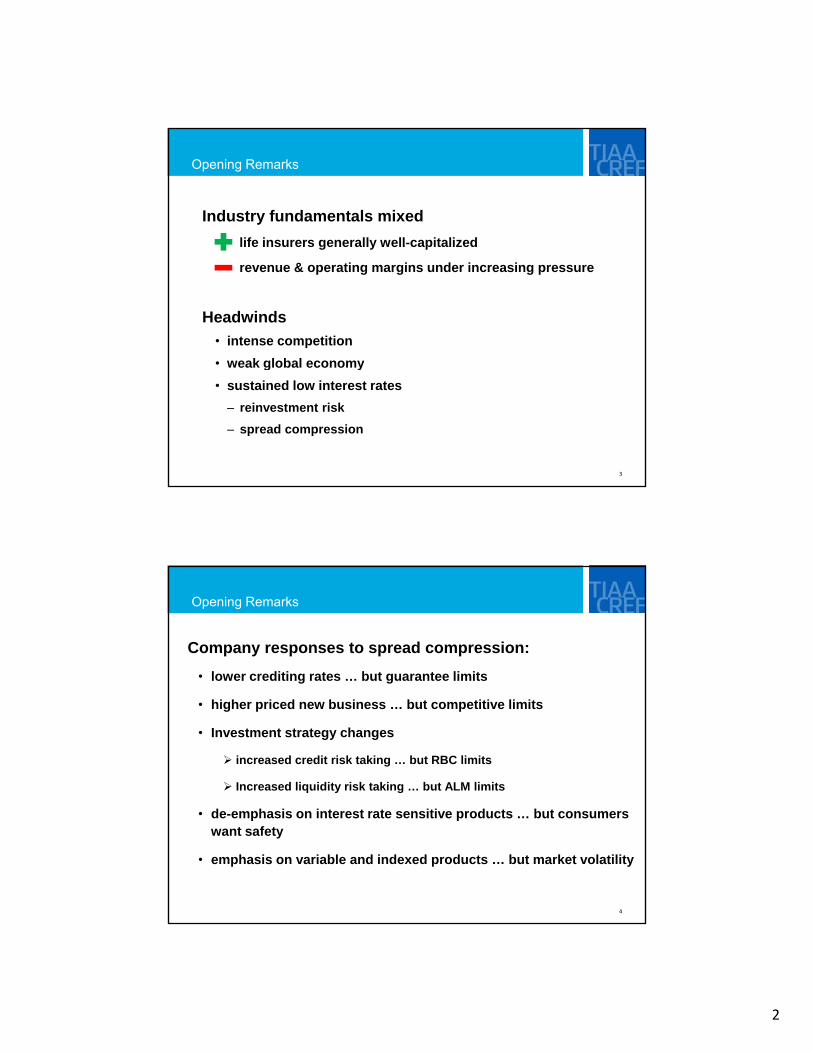
Opening Remarks
Industry fundamentals mixed
life insurers generally well-capitalizedg y p
revenue & operating margins under increasing pressure
Headwinds
• intense competition
• weak global economy
3
weak global economy
• sustained low interest rates
– reinvestment risk
– spread compression
Opening Remarks
Company responses to spread compression:
• lower crediting rates … but guarantee limits
• higher priced new business … but competitive limits
• Investment strategy changes
increased credit risk taking … but RBC limits
Increased liquidity risk taking … but ALM limits
4
• de-emphasis on interest rate sensitive products … but consumers want safety
• emphasis on variable and indexed products … but market volatility

3
Historical U.S. Treasury Yields (1981 – Present)
14
16
18
4
6
8
10
12
5
0
2
1yrCMT 5yrCMT 10yrCMT
Historical U.S. Treasury Yields (Last 10 years)
14
16
18
4
6
8
10
12
14
6
0
2
Series1 Series2 Series3

4
Impact of the Low Interest Rate Environment on Life Insurers
2013 SOA Life & Annuity Symposium
Joseph R. Dziwura
Overview
• Accommodative Federal Reserve Policy lowers interest rates through important channels:
– The Federal Reserve’s ongoing purchases of Treasury and agency mortgage-backed g g y g y g gsecurities (MBS) has led to a Federal Reserve balance sheet that is now roughly $3.0 trillion. The Fed is buying $40 billion per month of MBS, and $45 billion per month of long term U.S. treasury securities to keep long term rates low and to support the mortgage and housing market and to stimulate cyclical parts of the US economy including autos and consumer durables and other parts of the economy and promote stable financial conditions. At the same time, short-term interest rates have a zero lower bound constraint, and with expectations based on Federal Reserve “forward guidance” that rates will stay low for an extended period of time.
8
– The Federal Reserve purchases reduce interest rates and ease financial conditions through important channels. One important channel is the portfolio balance channel. The portfolio balance channel relies on the premise that financial assets are imperfect substitutes in investor’s portfolios, and a rise in the demand for a particular asset relative to supply will increase its price and reduce its yield. After selling assets to the Federal Reserve, investors may rebalance their portfolios by investing in other assets, raising the prices of those assets, lowering their yields and easing overall financial conditions, reflecting the Fed’s asset purchase program.
5
Overview
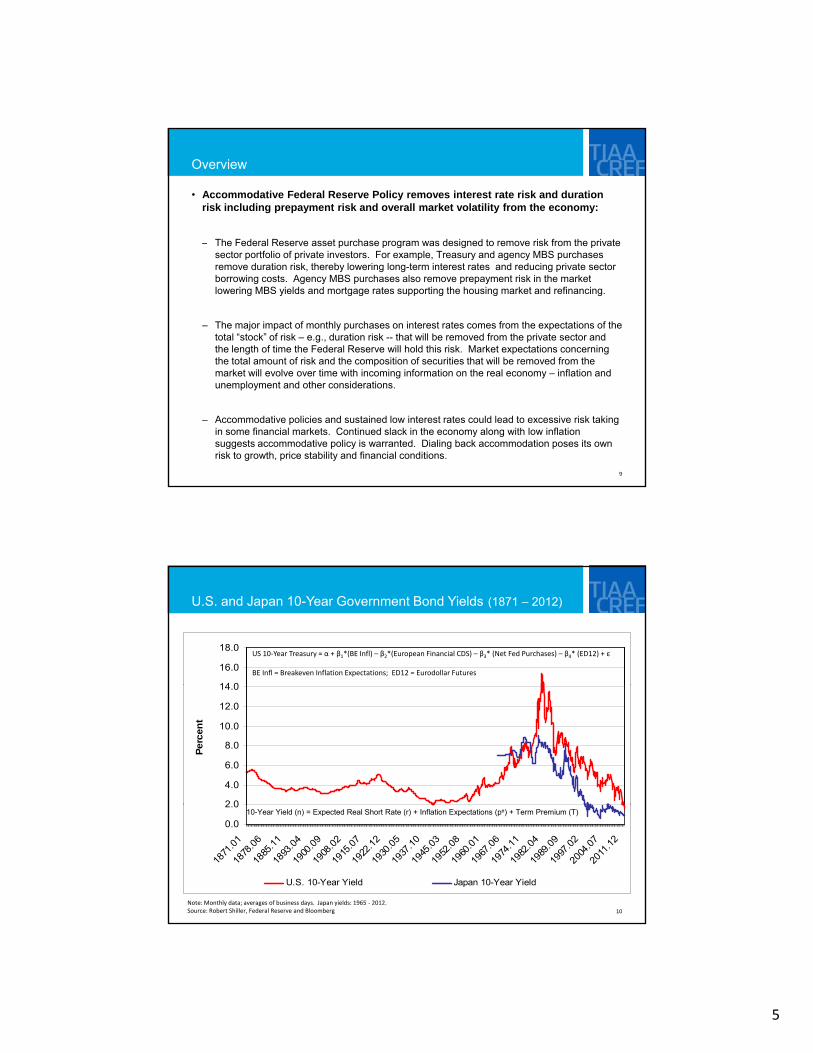
• Accommodative Federal Reserve Policy removes interest rate risk and duration risk including prepayment risk and overall market volatility from the economy:
– The Federal Reserve asset purchase program was designed to remove risk from the private p p g g psector portfolio of private investors. For example, Treasury and agency MBS purchases remove duration risk, thereby lowering long-term interest rates and reducing private sector borrowing costs. Agency MBS purchases also remove prepayment risk in the market lowering MBS yields and mortgage rates supporting the housing market and refinancing.
– The major impact of monthly purchases on interest rates comes from the expectations of the total “stock” of risk – e.g., duration risk -- that will be removed from the private sector and the length of time the Federal Reserve will hold this risk. Market expectations concerning the total amount of risk and the composition of securities that will be removed from the
9
market will evolve over time with incoming information on the real economy – inflation and unemployment and other considerations.
– Accommodative policies and sustained low interest rates could lead to excessive risk taking in some financial markets. Continued slack in the economy along with low inflation suggests accommodative policy is warranted. Dialing back accommodation poses its own risk to growth, price stability and financial conditions.
1871 - 2012
14 0
16.0
18.0US 10‐Year Treasury = α + β1*(BE Infl) – β2*(European Financial CDS) – β3* (Net Fed Purchases) – β4* (ED12) + ε
BE Infl = Breakeven Inflation Expectations; ED12 = Eurodollar Futures
U.S. and Japan 10-Year Government Bond Yields (1871 – 2012)
2 0
4.0
6.0
8.0
10.0
12.0
14.0
Perc
en
t
10
Note: Monthly data; averages of business days. Japan yields: 1965 ‐ 2012.Source: Robert Shiller, Federal Reserve and Bloomberg
0.0
2.0
1871
.01
1878
.06
1885
.11
1893
.04
1900
.09
1908
.02
1915
.07
1922
.12
1930
.05
1937
.10
1945
.03
1952
.08
1960
.01
1967
.06
1974
.11
1982
.04
1989
.09
1997
.02
2004
.07
2011
.12
U.S. 10-Year Yield Japan 10-Year Yield
10-Year Yield (n) = Expected Real Short Rate (r) + Inflation Expectations (pe) + Term Premium (T)

6
5 00%
6.00%
U.S. Government Yield Curve
Pre‐Crisis Yield Curve
2.00%
3.00%
4.00%
5.00%
Expected Yield Curve
11
0.00%
1.00%
1 M 3 M 6 M 1 Y 2 Y 3 Y 5 Y 7 Y 10 Y 30 Y
March 2013 July 2007 Implied Forward Rate December 2015
Post‐Crisis Yield Curve
Source: Bloomberg
10-Year Government Bond Yields (January 2005 – March 2013)
5
6
United States
Germany
2
3
4
Per
cen
t
Germany
Japan
12Source: Bloomberg
0
1
1/3/
200
5
3/3/
200
5
5/3/
200
5
7/3/
200
5
9/3/
200
5
11/3
/20
05
1/3/
200
6
3/3/
200
6
5/3/
200
6
7/3/
200
6
9/3/
200
6
11/3
/20
06
1/3/
200
7
3/3/
200
7
5/3/
200
7
7/3/
200
7
9/3/
200
7
11/3
/20
07
1/3/
200
8
3/3/
200
8
5/3/
200
8
7/3/
200
8
9/3/
200
8
11/3
/20
08
1/3/
200
9
3/3/
200
9
5/3/
200
9
7/3/
200
9
9/3/
200
9
11/3
/20
09
1/3/
201
0
3/3/
201
0
5/3/
201
0
7/3/
201
0
9/3/
201
0
11/3
/20
10
1/3/
201
1
3/3/
201
1
5/3/
201
1
7/3/
201
1
9/3/
201
1
11/3
/20
11
1/3/
201
2
3/3/
201
2
5/3/
201
2
7/3/
201
2
9/3/
201
2
11/3
/20
12
1/3/
201
3

7
Corporate Spreads (January 2005 – March 2013)
700
800
Spreads = α - β1* GDP Growth + β2*VIX - β3*10-Year Treasury + β4*Term Premium + ε
Spreads = f(default probability, expected recovery rate,liquidity, interest rates)
200
300
400
500
600
Bas
is P
oin
ts
13Source: Bloomberg
0
100
1/3/
2005
3/3/
2005
5/3/
2005
7/3/
2005
9/3/
2005
11/3
/200
5
1/3/
2006
3/3/
2006
5/3/
2006
7/3/
2006
9/3/
2006
11/3
/200
6
1/3/
2007
3/3/
2007
5/3/
2007
7/3/
2007
9/3/
2007
11/3
/200
7
1/3/
2008
3/3/
2008
5/3/
2008
7/3/
2008
9/3/
2008
11/3
/200
8
1/3/
2009
3/3/
2009
5/3/
2009
7/3/
2009
9/3/
2009
11/3
/200
9
1/3/
2010
3/3/
2010
5/3/
2010
7/3/
2010
9/3/
2010
11/3
/201
0
1/3/
2011
3/3/
2011
5/3/
2011
7/3/
2011
9/3/
2011
11/3
/201
1
1/3/
2012
3/3/
2012
5/3/
2012
7/3/
2012
9/3/
2012
11/3
/201
2
1/3/
2013
AAA BBB
Potential GDP and Actual GDP (March 1950 – March 2017)
$16,000
$18,000
s)
Real GDP = Y = C + I + G + NXC= Consumption
$8,000
$10,000
$12,000
$14,000
ain
ed
20
05
Do
lla
rs (
Bil
lio
ns
Output Gap
I = InvestmentG = Government SpendingNX = Net Exports
Potential GDP = ∆Productivity + ∆Labor
MV = PY = Nominal GDPM = Money and CreditV = Velocity of Money and CreditP Prices
14Source: Congressional Budget Office
$2,000
$4,000
$6,000
Mar-
50
Mar-
52
Mar-
54
Mar-
56
Mar-
58
Mar-
60
Mar-
62
Mar-
64
Mar-
66
Mar-
68
Mar-
70
Mar-
72
Mar-
74
Mar-
76
Mar-
78
Mar-
80
Mar-
82
Mar-
84
Mar-
86
Mar-
88
Mar-
90
Mar-
92
Mar-
94
Mar-
96
Mar-
98
Mar-
00
Mar-
02
Mar-
04
Mar-
06
Mar-
08
Mar-
10
Mar-
12
Mar-
14
Mar-
16
Ch
a
Real GDP Potential GDP
P = Prices
Inflation = f(Inflation Expectations, Output Gap)
8
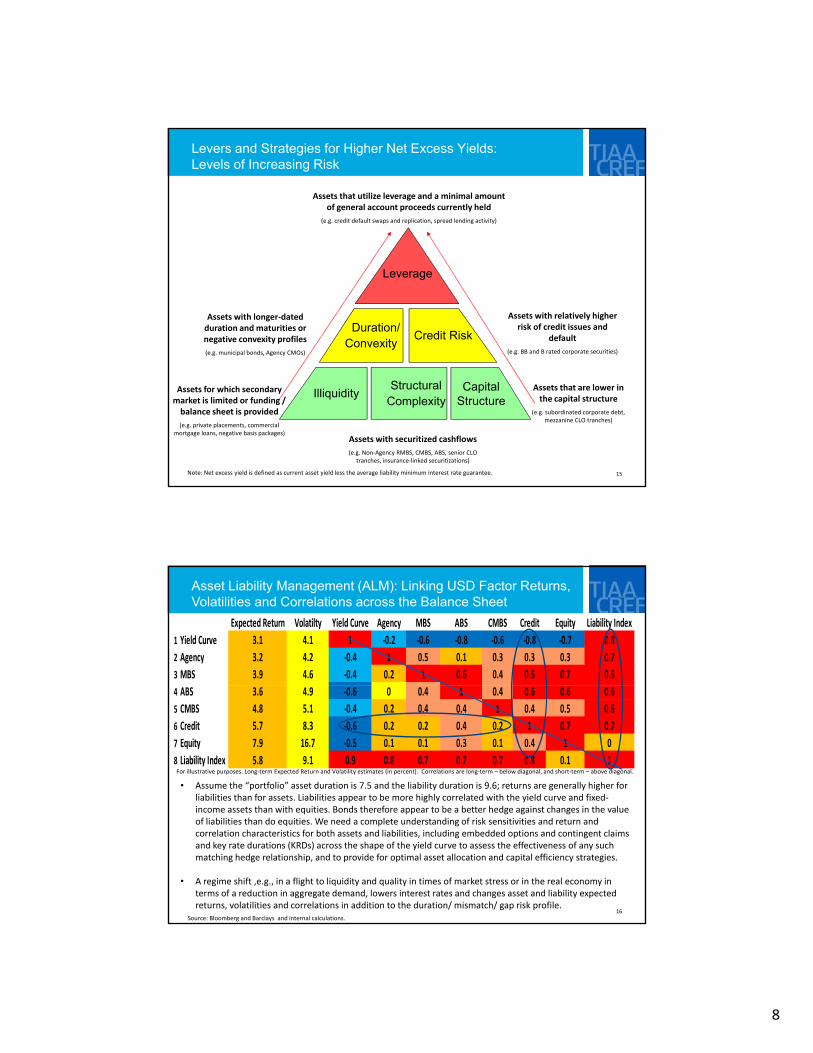
Assets that utilize leverage and a minimal amount of general account proceeds currently held
(e.g. credit default swaps and replication, spread lending activity)
Levers and Strategies for Higher Net Excess Yields: Levels of Increasing Risk
Assets with relatively higher risk of credit issues and
default
(e.g. BB and B rated corporate securities)
Assets with longer‐dated duration and maturities or negative convexity profiles
(e.g. municipal bonds, Agency CMOs)
Leverage
Duration/Convexity
Credit Risk
15
Assets for which secondary market is limited or funding / balance sheet is provided
(e.g. private placements, commercial mortgage loans, negative basis packages)
Assets that are lower in the capital structure
(e.g. subordinated corporate debt, mezzanine CLO tranches)
Assets with securitized cashflows
(e.g. Non‐Agency RMBS, CMBS, ABS, senior CLO tranches, insurance‐linked securitizations)
IlliquidityCapital
StructureStructural
Complexity
Note: Net excess yield is defined as current asset yield less the average liability minimum interest rate guarantee.
Expected Return Volatilty Yield Curve Agency MBS ABS CMBS Credit Equity Liability Index
1 Yield Curve 3.1 4.1 1 ‐0.2 ‐0.6 ‐0.8 ‐0.6 ‐0.8 ‐0.7 0.8
2 Agency 3.2 4.2 ‐0.4 1 0.5 0.1 0.3 0.3 0.3 0.7
3 MBS 3.9 4.6 ‐0.4 0.2 1 0.6 0.4 0.6 0.7 0.6
Asset Liability Management (ALM): Linking USD Factor Returns, Volatilities and Correlations across the Balance Sheet
4 ABS 3.6 4.9 ‐0.6 0 0.4 1 0.4 0.6 0.6 0.6
5 CMBS 4.8 5.1 ‐0.4 0.2 0.4 0.4 1 0.4 0.5 0.6
6 Credit 5.7 8.3 ‐0.6 0.2 0.2 0.4 0.2 1 0.7 0.7
7 Equity 7.9 16.7 ‐0.5 0.1 0.1 0.3 0.1 0.4 1 0
8 Liability Index 5.8 9.1 0.9 0.8 0.7 0.7 0.7 0.8 0.1 1For illustrative purposes. Long‐term Expected Return and Volatility estimates (in percent). Correlations are long‐term – below diagonal, and short‐term – above diagonal.
• Assume the “portfolio” asset duration is 7.5 and the liability duration is 9.6; returns are generally higher for liabilities than for assets. Liabilities appear to be more highly correlated with the yield curve and fixed‐
16
income assets than with equities. Bonds therefore appear to be a better hedge against changes in the value of liabilities than do equities. We need a complete understanding of risk sensitivities and return and correlation characteristics for both assets and liabilities, including embedded options and contingent claims and key rate durations (KRDs) across the shape of the yield curve to assess the effectiveness of any such matching hedge relationship, and to provide for optimal asset allocation and capital efficiency strategies.
• A regime shift ,e.g., in a flight to liquidity and quality in times of market stress or in the real economy in terms of a reduction in aggregate demand, lowers interest rates and changes asset and liability expected returns, volatilities and correlations in addition to the duration/ mismatch/ gap risk profile.
Source: Bloomberg and Barclays and internal calculations.

9
Directed by the board and senior t i l di
Risk‐Based decision making and iti ti /h d i d
Be an integral part of strategic and capital and liquidity planning and a guide for setting risk appetite
Scenario and Stress Testing Framework
Objective
Governance
Design
Action
Monitoring
Scenario and Stress Testing
Framework
management, including delineation of scope and
frequency with formal policy documentation
Integrate information from models and historical data with defined parameters and analytical methods
mitigation/hedging and contingency planning utilizing the results in strategic and/or tactical
actions including derivatives
Provide forward‐looking assessment and monitoring and reporting of results, impacts, and
exposure changes
1717
ProcessAnalysis
Clear activities, methodologies
responsibilities and frequency for
repeatable processes
Execution of analysis and quantification of impacts for market, credit, liquidity, operational, capital and strategic issues,
and asset‐liability management
• The scenario of projected low interest rates may not be the most likely scenario. Analytical balance sheet results need to be evaluated under a variety of yield curve environments. A protracted period of low interest rates is a feasible scenario for a number of countries
Summary: Impact of Long Term, Low Interest Rates on Balance Sheets
number of countries.
• A sustained low interest rate environment will have a negative impact on life insurance balance sheets. There is an asymmetrical relationship between the asset side and liability side due to the contractual crediting rate guarantee for accumulating and pay out annuities. The competition for assets will continue to compress spreads and keep overall yields low.
• Protracted low interest rates will impact insurance companies by affecting re-i t t t fi d i tf li If l i t t t t d t b
18
investment returns on fixed-income portfolios. If low interest rates are expected to be permanent, lower interest income will significantly impact insurers with long–term liabilities and shorter-term duration assets. To the extent that lower interest rates reflect a lower-growth environment, returns on investment in general - and equities in particular – would also be expected to be lower.
10
Impact of the Low Interest Rate Environment on Life Insurers
2013 SOA Life & Annuity Symposium2013 SOA Life & Annuity Symposium
© 2012 OLIVER WYMAN
CONSULTING ACTUARIES
Winter Liu, FSA, MAAA, CFA
Agenda
Inforce management
Product development
Impact on industry landscape
20© 2012 OLIVER WYMAN

11
Inforce managementLow rates impact insurers in multiple ways
Lower investment income
Magnify tail risk
Lapse supported products
Encourage “bad” behaviors
Lower lapse for “negative spread”
21© 2012 OLIVER WYMAN
products
Steeper mortality slope for life business; strong mortality improvement for longevity business
negative spread liabilities
Renewal deposit
Heightened interest rate shock risk
Inforce management
Consider all non-guaranteed levers to compensate for lower investment income
i Lower credited rate index capi. Lower credited rate, index capii. Reduce dividendsiii. Increase COIs, feesiv. Reduce commissions
Actively manage (potential) adverse policyholder behavior
i. Review options on renewal depositii. Review lapse assumptionsiii. Review ALM and hedging strategy
22© 2012 OLIVER WYMAN
Pay more attention to tail risks
Assess strategic options
i. Capital/reserve financing and EV securitizationii. Divestures and acquisitions

12
Product development
Longevity annuity Indexed UL
Variable annuity
Fixed annuity
Combo LTC
Simplified issue
23© 2012 OLIVER WYMAN
Indexed annuity Worksite
Product development Longevity annuity
Prolonged low interest rate and choppy equity market helped shift retirement solution mentality from wealth accumulation to income protection
D f d t it i it ti f i hi t hi ? Deferred payout annuity – is it time for survivorship to shine?
How to make it more attractive than SPIA
i. Deferral phaseii. flexible premium / contribution phaseiii. Tax advantage (“QLAC”)iv. Death benefitsv. Combo it
Payout phase
SPIA
24© 2012 OLIVER WYMAN
Deferral phase Payout phase
Payout phase
Contribution phase
Longevity annuity

13
Product development Longevity annuity
Challenges remain for longevity annuity
i. Mentality – “I am lucky to die early.”
ii DB t tiii. DB vs. payout ratio
iii. Assumption setting
iv. High rating requirement
v. Investment management
25© 2012 OLIVER WYMAN
Product development Variable annuity
The pursuit of “holy grail”
i. Control over assetsii. Wealth accumulation (“upside”)iii I it (“d id ”)iii. Income security (“downside”)iv. Affordability
Lessons from 2008 experience
i. Riders more expensive than previously thoughtii. Consumers may be ready for some trade-off
New development
26© 2012 OLIVER WYMAN
i. Embedded longevity annuityii. Volatility managed funds
14
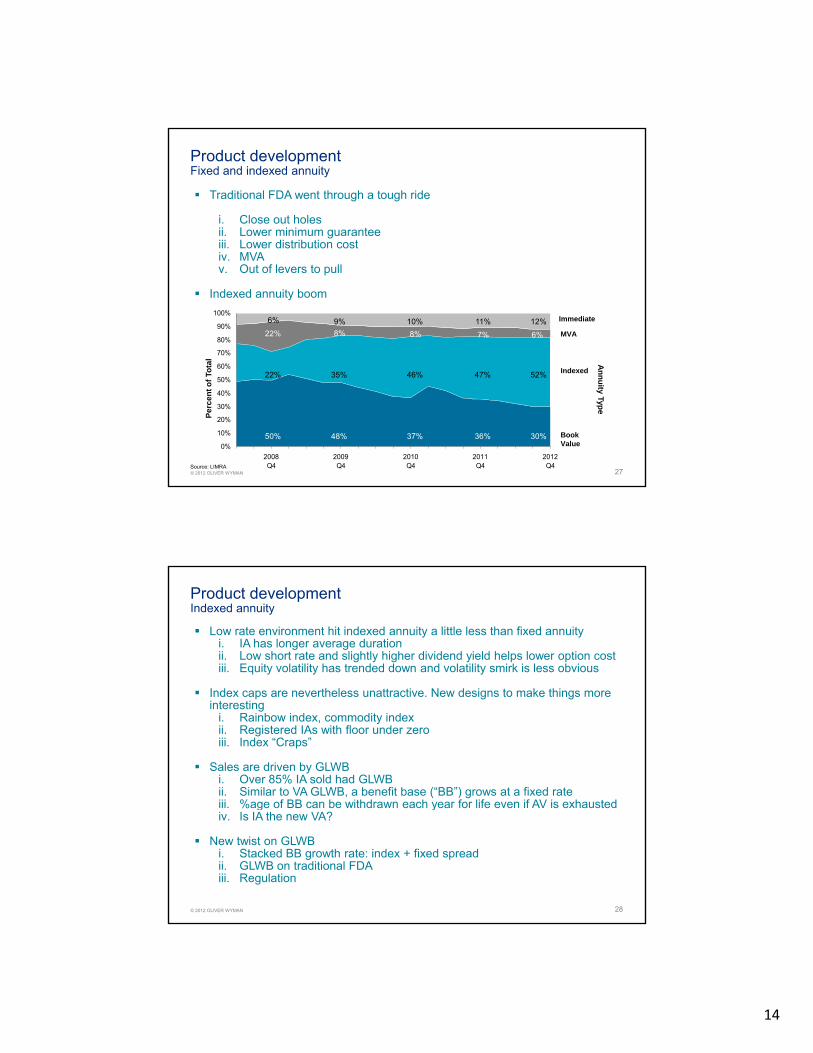
Product development Fixed and indexed annuity
Traditional FDA went through a tough ride
i. Close out holesii. Lower minimum guaranteeiii. Lower distribution costiii. Lower distribution costiv. MVAv. Out of levers to pull
Indexed annuity boom
60%
70%
80%
90%
100%
tal
12%
6%
Immediate
MVA
6%
22%
9%
8%
10%
8%
11%
7%
A
27© 2012 OLIVER WYMAN
0%
10%
20%
30%
40%
50%
60%
2008Q4
2009Q4
2010Q4
2011Q4
2012Q4
Pe
rce
nt
of
Tot
30%
52%
Book Value
Indexed
50%
22%
48%
35%
37%
46%
36%
47%
An
nu
ity Type
Source: LIMRA
Product development Indexed annuity
Low rate environment hit indexed annuity a little less than fixed annuityi. IA has longer average durationii. Low short rate and slightly higher dividend yield helps lower option costiii. Equity volatility has trended down and volatility smirk is less obvious
Index caps are nevertheless unattractive. New designs to make things more interesting
i. Rainbow index, commodity indexii. Registered IAs with floor under zeroiii. Index “Craps”
Sales are driven by GLWB i. Over 85% IA sold had GLWBii. Similar to VA GLWB, a benefit base (“BB”) grows at a fixed rateiii %age of BB can be withdrawn each year for life even if AV is exhausted
28© 2012 OLIVER WYMAN
iii. %age of BB can be withdrawn each year for life even if AV is exhaustediv. Is IA the new VA?
New twist on GLWB i. Stacked BB growth rate: index + fixed spreadii. GLWB on traditional FDAiii. Regulation

15
Product development Other products
Index ULi. Significant growth since 2008 recessionii. Index cap remained relatively high ~10%iii. More appealing illustration
Product Current indexed cap Guaranteed indexed
cap
Indexed annuity #1 3% 3%
Indexed annuity #2 3% 1%
Indexed annuity #3 3.25% 1%
Indexed life #1 10% 2.75%
Indexed life #2 12% 4%
I d d lif #3 13% 3%
29© 2012 OLIVER WYMAN
Combo LTC
Simplified issue
Worksite A&H
Indexed life #3 13% 3%
Impact on industry landscape
Wave of exits particularly with annuity and LTC products
M&A market has been exceptionally active
i. ReFocus poll - 40% responders said their companies have considered divestures and acquisitions
ii. Strong interest in fixed and indexed annuity space
Entry of private equity and asset management firmsi. Different valuation framework
30© 2012 OLIVER WYMAN