2014- dairy industry
DESCRIPTION
dairy industry in 2014, brief overview,industry trends etcTRANSCRIPT

India - Dairy 0102 - 0711 - 2013
© MARKETLINE THIS PROFILE IS A LICENSED PRODUCT AND IS NOT TO BE PHOTOCOPIED Page | 1
MarketLine Industry Profile
Dairy in India November 2014
Reference Code: 0102-0711
Publication Date: November 2014
WWW.MARKETLINE.COM
MARKETLINE. THIS PROFILE IS A LICENSED PRODUCT AND IS NOT TO BE PHOTOCOPIED
India - Dairy 0102 - 0711 - 2013
© MARKETLINE THIS PROFILE IS A LICENSED PRODUCT AND IS NOT TO BE PHOTOCOPIED Page | 2
EXECUTIVE SUMMARY
Market value The Indian dairy market grew by 8.4% in 2013 to reach a value of $5,234.8 million.
Market value forecast In 2018, the Indian dairy market is forecast to have a value of $7,433.5 million, an increase of 42% since 2013.
Market volume The Indian dairy market grew by 4.6% in 2013 to reach a volume of 519.8 million kg.
Market volume forecast In 2018, the Indian dairy market is forecast to have a volume of 637.1 million kg, an increase of 22.6% since 2013.
Category segmentation Milk is the largest segment of the dairy market in India, accounting for 91.7% of the market's total value.
Geography segmentation India accounts for 6.8% of the Asia-Pacific dairy market value.
Market share Gujarat Cooperative Milk Marketing Federation Ltd. is the leading player in the Indian dairy market, generating a 36.7%
share of the market's value.
Market rivalry Despite their diversified dairy portfolios, many players are similar to one another and this tends to boosts rivalry.
India - Dairy 0102 - 0711 - 2013
© MARKETLINE THIS PROFILE IS A LICENSED PRODUCT AND IS NOT TO BE PHOTOCOPIED Page | 3
TABLE OF CONTENTS
Executive Summary ....................................................................................................................................................... 2
Market value ............................................................................................................................................................... 2
Market value forecast ................................................................................................................................................. 2
Market volume ............................................................................................................................................................ 2
Market volume forecast .............................................................................................................................................. 2
Category segmentation .............................................................................................................................................. 2
Geography segmentation ........................................................................................................................................... 2
Market share .............................................................................................................................................................. 2
Market rivalry .............................................................................................................................................................. 2
Market Overview ............................................................................................................................................................ 7
Market definition ......................................................................................................................................................... 7
Market analysis .......................................................................................................................................................... 7
Market Data ................................................................................................................................................................... 8
Market value ............................................................................................................................................................... 8
Market volume ............................................................................................................................................................ 9
Market Segmentation ................................................................................................................................................... 10
Category segmentation ............................................................................................................................................ 10
Geography segmentation ......................................................................................................................................... 11
Market share ............................................................................................................................................................ 12
Market distribution .................................................................................................................................................... 13
Market Outlook ............................................................................................................................................................. 14
Market value forecast ............................................................................................................................................... 14
Market volume forecast ............................................................................................................................................ 15
Five Forces Analysis .................................................................................................................................................... 16
Summary .................................................................................................................................................................. 16
Buyer power ............................................................................................................................................................. 17
Supplier power ......................................................................................................................................................... 18
New entrants ............................................................................................................................................................ 19
Threat of substitutes ................................................................................................................................................. 20
Degree of rivalry ....................................................................................................................................................... 21
Leading Companies ..................................................................................................................................................... 22

India - Dairy 0102 - 0711 - 2013
© MARKETLINE THIS PROFILE IS A LICENSED PRODUCT AND IS NOT TO BE PHOTOCOPIED Page | 4
Andhra Pradesh Dairy Development Cooperative Federation Ltd. (APDDCF)......................................................... 22
Gujarat Cooperative Milk Marketing Federation Ltd. ................................................................................................ 23
Kerala Co-operative Milk Marketing Federation Ltd (KCMMF) ................................................................................. 24
Tamil Nadu Cooperative Milk Producers' Federation (TNCMPF) ............................................................................. 25
Macroeconomic Indicators ........................................................................................................................................... 26
Country Data ............................................................................................................................................................ 26
Appendix ...................................................................................................................................................................... 28
Methodology ............................................................................................................................................................. 28
Industry associations ................................................................................................................................................ 29
Related MarketLine research ................................................................................................................................... 29
India - Dairy 0102 - 0711 - 2013
© MARKETLINE THIS PROFILE IS A LICENSED PRODUCT AND IS NOT TO BE PHOTOCOPIED Page | 5
LIST OF TABLES
Table 1: India dairy market value: $ million, 2009–13 .................................................................................................... 8
Table 2: India dairy market volume: million kg, 2009–13 ............................................................................................... 9
Table 3: India dairy market category segmentation: $ million, 2013............................................................................. 10
Table 4: India dairy market geography segmentation: $ million, 2013 ......................................................................... 11
Table 5: India dairy market share: % share, by value, 2013 ........................................................................................ 12
Table 6: India dairy market distribution: % share, by value, 2013 ................................................................................ 13
Table 7: India dairy market value forecast: $ million, 2013–18 .................................................................................... 14
Table 8: India dairy market volume forecast: million kg, 2013–18 ................................................................................ 15
Table 9: Andhra Pradesh Dairy Development Cooperative Federation Ltd. (APDDCF): key facts............................... 22
Table 10: Gujarat Cooperative Milk Marketing Federation Ltd.: key facts .................................................................... 23
Table 11: Kerala Co-operative Milk Marketing Federation Ltd (KCMMF): key facts ..................................................... 24
Table 12: Tamil Nadu Cooperative Milk Producers' Federation (TNCMPF): key facts ................................................. 25
Table 13: India size of population (million), 2009–13 ................................................................................................... 26
Table 14: India gdp (constant 2005 prices, $ billion), 2009–13 .................................................................................... 26
Table 15: India gdp (current prices, $ billion), 2009–13 ............................................................................................... 26
Table 16: India inflation, 2009–13 ................................................................................................................................ 27
Table 17: India consumer price index (absolute), 2009–13 .......................................................................................... 27
Table 18: India exchange rate, 2009–13 ...................................................................................................................... 27

India - Dairy 0102 - 0711 - 2013
© MARKETLINE THIS PROFILE IS A LICENSED PRODUCT AND IS NOT TO BE PHOTOCOPIED Page | 6
LIST OF FIGURES
Figure 1: India dairy market value: $ million, 2009–13 ................................................................................................... 8
Figure 2: India dairy market volume: million kg, 2009–13 .............................................................................................. 9
Figure 3: India dairy market category segmentation: % share, by value, 2013 ............................................................ 10
Figure 4: India dairy market geography segmentation: % share, by value, 2013 ......................................................... 11
Figure 5: India dairy market share: % share, by value, 2013 ....................................................................................... 12
Figure 6: India dairy market distribution: % share, by value, 2013 ............................................................................... 13
Figure 7: India dairy market value forecast: $ million, 2013–18 ................................................................................... 14
Figure 8: India dairy market volume forecast: million kg, 2013–18............................................................................... 15
Figure 9: Forces driving competition in the dairy market in India, 2013 ....................................................................... 16
Figure 10: Drivers of buyer power in the dairy market in India, 2013 ........................................................................... 17
Figure 11: Drivers of supplier power in the dairy market in India, 2013........................................................................ 18
Figure 12: Factors influencing the likelihood of new entrants in the dairy market in India, 2013 .................................. 19
Figure 13: Factors influencing the threat of substitutes in the dairy market in India, 2013 ........................................... 20
Figure 14: Drivers of degree of rivalry in the dairy market in India, 2013 ..................................................................... 21

India - Dairy 0102 - 0711 - 2013
© MARKETLINE THIS PROFILE IS A LICENSED PRODUCT AND IS NOT TO BE PHOTOCOPIED Page | 7
MARKET OVERVIEW
Market definition The dairy market consists of retail sales of cheese, milk, soy products, spreadable fats, yogurt, cream, chilled dessert
and fromage frais.
The volume in this market consists of cheese, yoghurt and spreadable fats, milk (powdered and concentrated milk), soy
products (soy desserts), chilled dessert and fromage frais.
Any currency conversions used in the creation of this report have been calculated using 2013 annual average exchange
rates.
For the purposes of this report, Asia-Pacific comprises Australia, China, Hong Kong, India, Indonesia, Japan, Malaysia,
New Zealand, Philippines, Singapore, South Korea, Taiwan, Thailand, and Vietnam.
Market analysis The Indian dairy market has experienced strong growth in recent years. This trend is predicted to continue over the
forecast period, albeit at a somewhat decelerated rate; with annual growth rates largely remaining below 6.4%.
The Indian dairy market had total revenues of $5,234.8m in 2013, representing a compound annual growth rate (CAGR)
of 9.8% between 2009 and 2013. In comparison, the Chinese and Japanese markets grew with CAGRs of 8.1% and
1.7% respectively, over the same period, to reach respective values of $29,057.7m and $19,507.1m in 2013.
Market consumption volume increased with a CAGR of 5.3% between 2009 and 2013, to reach a total of 519.8 million kg
in 2013. The market's volume is expected to rise to 637.1 million kg by the end of 2018, representing a CAGR of 4.2%
for the 2013-2018 period.
The milk segment was the market's most lucrative in 2013, with total revenues of $4,802.0m, equivalent to 91.7% of the
market's overall value. The spreadable fats segment contributed revenues of $176.3m in 2013, equating to 3.4% of the
market's aggregate value.
The performance of the market is forecast to decelerate, with an anticipated CAGR of 7.3% for the five-year period 2013
- 2018, which is expected to drive the market to a value of $7,433.5m by the end of 2018. Comparatively, the Chinese
and Japanese markets will grow with CAGRs of 7.6% and 1.9% respectively, over the same period, to reach respective
values of $41,965.8m and $21,416.3m in 2018.

India - Dairy 0102 - 0711 - 2013
© MARKETLINE THIS PROFILE IS A LICENSED PRODUCT AND IS NOT TO BE PHOTOCOPIED Page | 8
MARKET DATA
Market value The Indian dairy market grew by 8.4% in 2013 to reach a value of $5,234.8 million.
The compound annual growth rate of the market in the period 2009–13 was 9.8%.
Table 1: India dairy market value: $ million, 2009–13
Year $ million Rs. million € million % Growth
2009 3,599.4 210,514.1 2,707.0
2010 4,038.9 236,218.7 3,037.5 12.2%
2011 4,398.7 257,261.9 3,308.1 8.9%
2012 4,827.5 282,340.7 3,630.6 9.7%
2013 5,234.8 306,162.0 3,936.9 8.4%
CAGR: 2009–13 9.8%
SOURCE: MARKETLINE M A R K E T L I N E
Figure 1: India dairy market value: $ million, 2009–13
SOURCE: MARKETLINE M A R K E T L I N E

India - Dairy 0102 - 0711 - 2013
© MARKETLINE THIS PROFILE IS A LICENSED PRODUCT AND IS NOT TO BE PHOTOCOPIED Page | 9
Market volume The Indian dairy market grew by 4.6% in 2013 to reach a volume of 519.8 million kg.
The compound annual growth rate of the market in the period 2009–13 was 5.3%.
Table 2: India dairy market volume: million kg, 2009–13
Year million kg % Growth
2009 422.4
2010 447.2 5.9%
2011 471.4 5.4%
2012 496.9 5.4%
2013 519.8 4.6%
CAGR: 2009–13 5.3%
SOURCE: MARKETLINE M A R K E T L I N E
Figure 2: India dairy market volume: million kg, 2009–13
SOURCE: MARKETLINE M A R K E T L I N E

India - Dairy 0102 - 0711 - 2013
© MARKETLINE THIS PROFILE IS A LICENSED PRODUCT AND IS NOT TO BE PHOTOCOPIED Page | 10
MARKET SEGMENTATION
Category segmentation Milk is the largest segment of the dairy market in India, accounting for 91.7% of the market's total value.
The Spreadable fats segment accounts for a further 3.4% of the market.
Table 3: India dairy market category segmentation: $ million, 2013
Category 2013 %
Milk 4,802.0 91.7%
Spreadable fats 176.3 3.4%
Yogurt 109.8 2.1%
Cheese 104.9 2.0%
Soy Products 8.8 0.2%
Other 33.0 0.6%
Total 5,234.8 100%
SOURCE: MARKETLINE M A R K E T L I N E
Figure 3: India dairy market category segmentation: % share, by value, 2013
SOURCE: MARKETLINE M A R K E T L I N E
India - Dairy 0102 - 0711 - 2013
© MARKETLINE THIS PROFILE IS A LICENSED PRODUCT AND IS NOT TO BE PHOTOCOPIED Page | 11
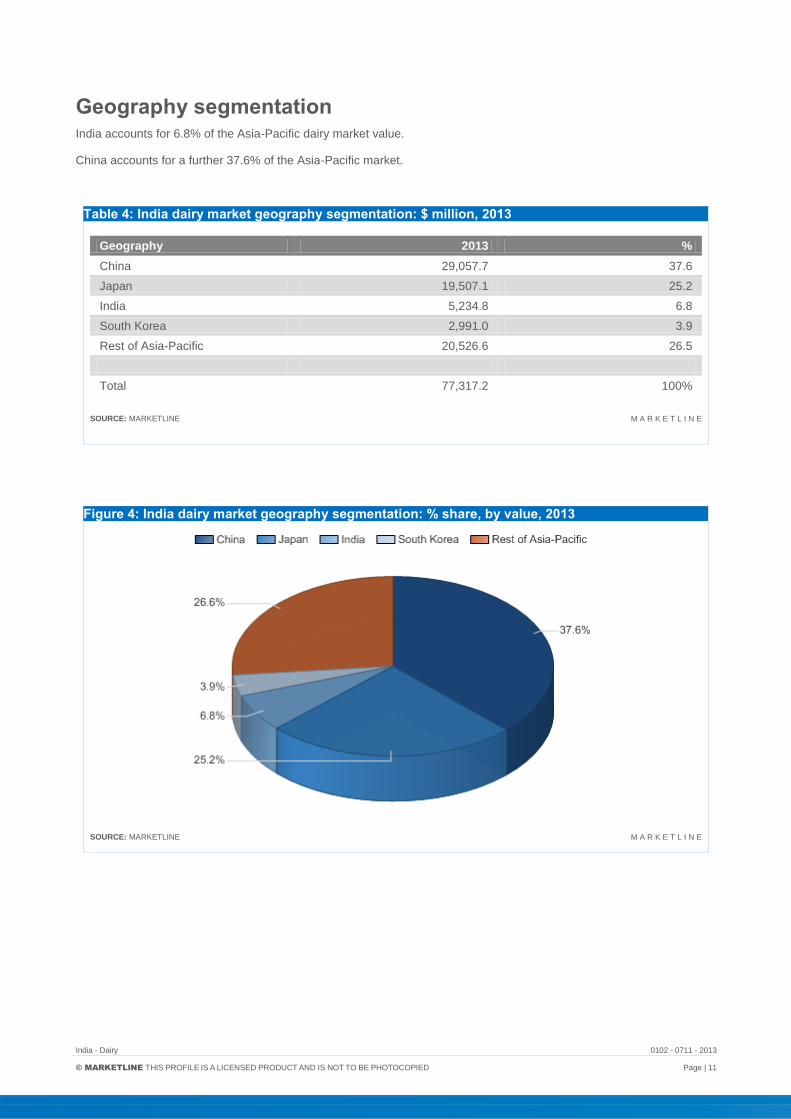
Geography segmentation India accounts for 6.8% of the Asia-Pacific dairy market value.
China accounts for a further 37.6% of the Asia-Pacific market.
Table 4: India dairy market geography segmentation: $ million, 2013
Geography 2013 %
China 29,057.7 37.6
Japan 19,507.1 25.2
India 5,234.8 6.8
South Korea 2,991.0 3.9
Rest of Asia-Pacific 20,526.6 26.5
Total 77,317.2 100%
SOURCE: MARKETLINE M A R K E T L I N E
Figure 4: India dairy market geography segmentation: % share, by value, 2013
SOURCE: MARKETLINE M A R K E T L I N E
India - Dairy 0102 - 0711 - 2013
© MARKETLINE THIS PROFILE IS A LICENSED PRODUCT AND IS NOT TO BE PHOTOCOPIED Page | 12
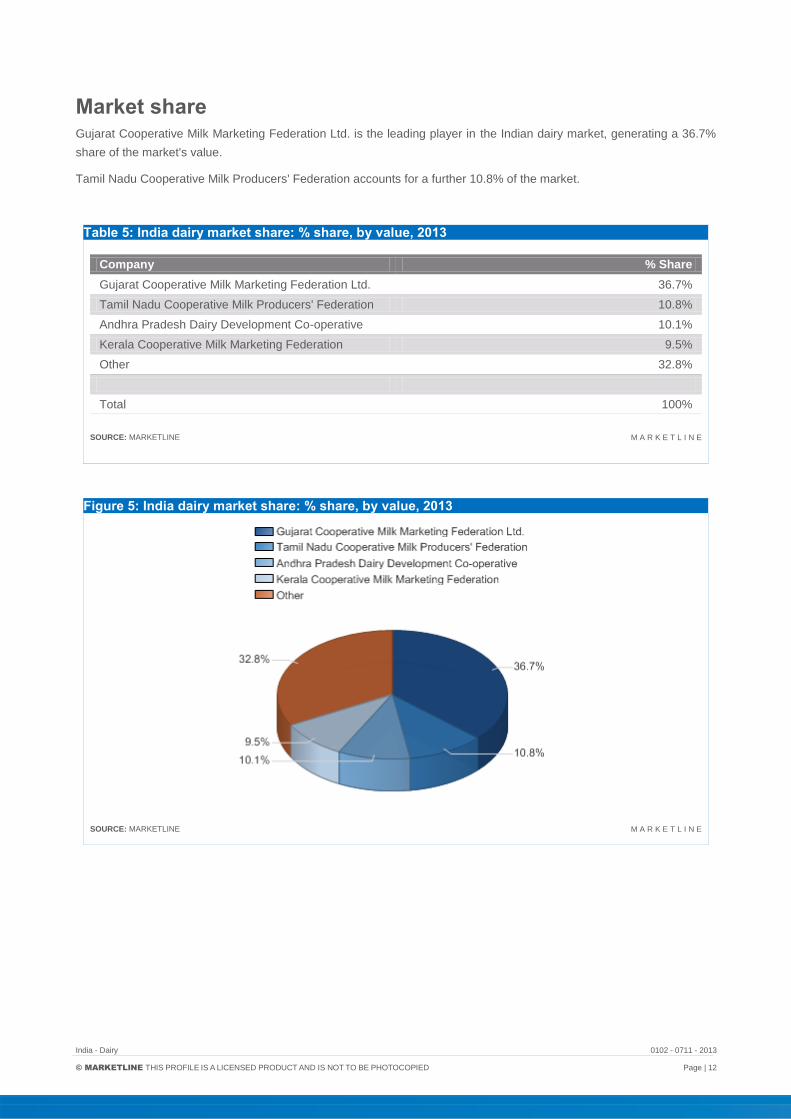
Market share Gujarat Cooperative Milk Marketing Federation Ltd. is the leading player in the Indian dairy market, generating a 36.7%
share of the market's value.
Tamil Nadu Cooperative Milk Producers' Federation accounts for a further 10.8% of the market.
Table 5: India dairy market share: % share, by value, 2013
Company % Share
Gujarat Cooperative Milk Marketing Federation Ltd. 36.7%
Tamil Nadu Cooperative Milk Producers' Federation 10.8%
Andhra Pradesh Dairy Development Co-operative 10.1%
Kerala Cooperative Milk Marketing Federation 9.5%
Other 32.8%
Total 100%
SOURCE: MARKETLINE M A R K E T L I N E
Figure 5: India dairy market share: % share, by value, 2013
SOURCE: MARKETLINE M A R K E T L I N E
India - Dairy 0102 - 0711 - 2013
© MARKETLINE THIS PROFILE IS A LICENSED PRODUCT AND IS NOT TO BE PHOTOCOPIED Page | 13
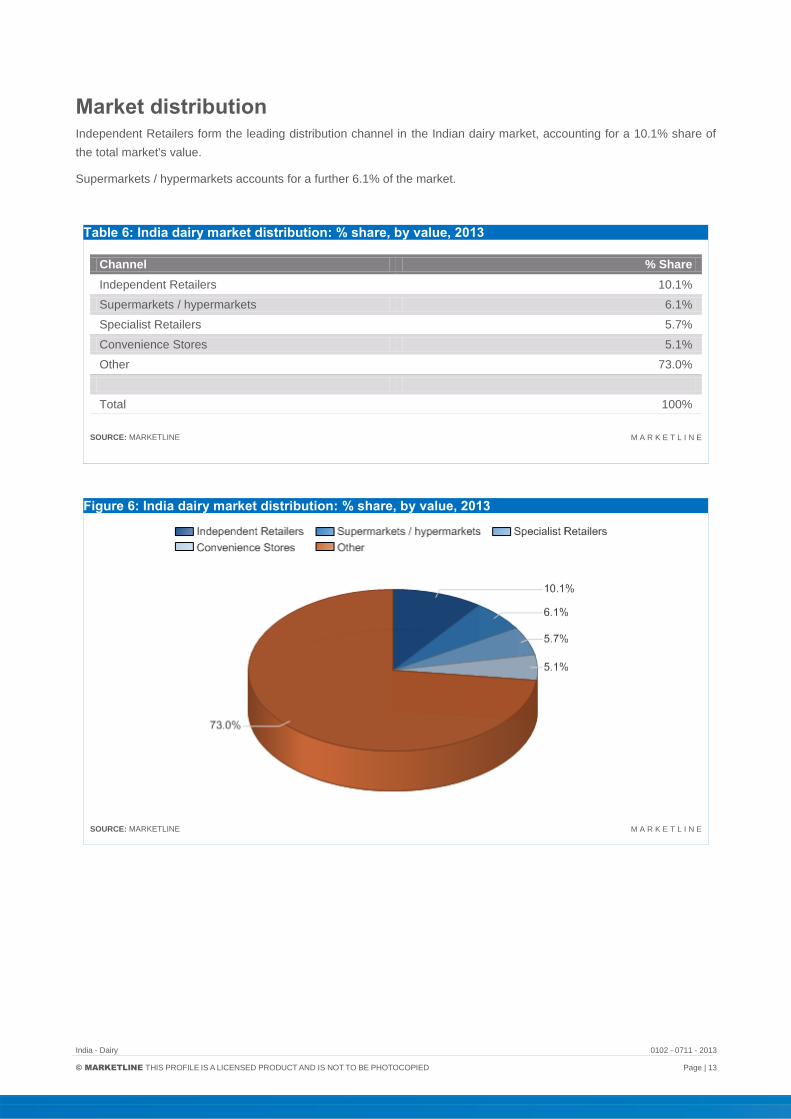
Market distribution Independent Retailers form the leading distribution channel in the Indian dairy market, accounting for a 10.1% share of
the total market's value.
Supermarkets / hypermarkets accounts for a further 6.1% of the market.
Table 6: India dairy market distribution: % share, by value, 2013
Channel % Share
Independent Retailers 10.1%
Supermarkets / hypermarkets 6.1%
Specialist Retailers 5.7%
Convenience Stores 5.1%
Other 73.0%
Total 100%
SOURCE: MARKETLINE M A R K E T L I N E
Figure 6: India dairy market distribution: % share, by value, 2013
SOURCE: MARKETLINE M A R K E T L I N E

India - Dairy 0102 - 0711 - 2013
© MARKETLINE THIS PROFILE IS A LICENSED PRODUCT AND IS NOT TO BE PHOTOCOPIED Page | 14
MARKET OUTLOOK
Market value forecast In 2018, the Indian dairy market is forecast to have a value of $7,433.5 million, an increase of 42% since 2013.
The compound annual growth rate of the market in the period 2013–18 is predicted to be 7.3%.
Table 7: India dairy market value forecast: $ million, 2013–18
Year $ million Rs. million € million % Growth
2013 5,234.8 306,162.0 3,936.9 8.4%
2014 5,671.3 331,691.1 4,265.2 8.3%
2015 6,101.2 356,834.2 4,588.5 7.6%
2016 6,525.2 381,632.2 4,907.3 6.9%
2017 6,963.2 407,249.0 5,236.7 6.7%
2018 7,433.5 434,754.9 5,590.4 6.8%
CAGR: 2013–18 7.3%
SOURCE: MARKETLINE M A R K E T L I N E
Figure 7: India dairy market value forecast: $ million, 2013–18
SOURCE: MARKETLINE M A R K E T L I N E
India - Dairy 0102 - 0711 - 2013
© MARKETLINE THIS PROFILE IS A LICENSED PRODUCT AND IS NOT TO BE PHOTOCOPIED Page | 15
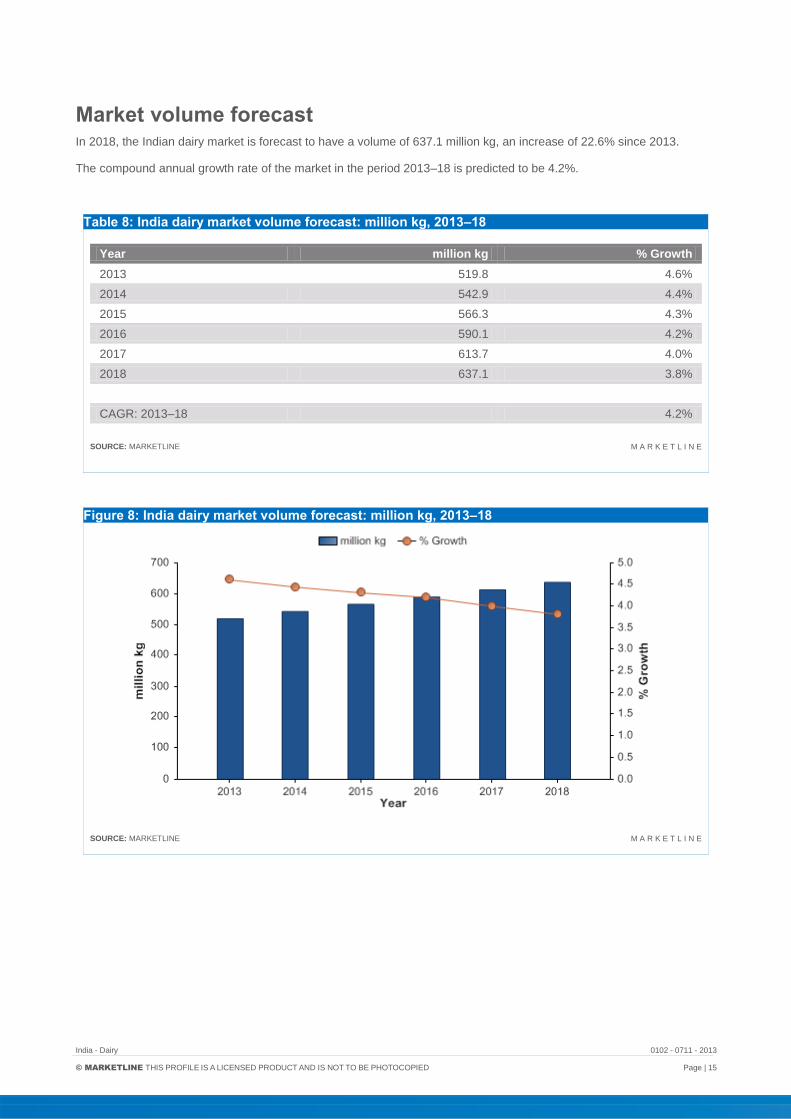
Market volume forecast In 2018, the Indian dairy market is forecast to have a volume of 637.1 million kg, an increase of 22.6% since 2013.
The compound annual growth rate of the market in the period 2013–18 is predicted to be 4.2%.
Table 8: India dairy market volume forecast: million kg, 2013–18
Year million kg % Growth
2013 519.8 4.6%
2014 542.9 4.4%
2015 566.3 4.3%
2016 590.1 4.2%
2017 613.7 4.0%
2018 637.1 3.8%
CAGR: 2013–18 4.2%
SOURCE: MARKETLINE M A R K E T L I N E
Figure 8: India dairy market volume forecast: million kg, 2013–18
SOURCE: MARKETLINE M A R K E T L I N E

India - Dairy 0102 - 0711 - 2013
© MARKETLINE THIS PROFILE IS A LICENSED PRODUCT AND IS NOT TO BE PHOTOCOPIED Page | 16
FIVE FORCES ANALYSIS
The dairy market will be analyzed taking manufacturers/packagers of dairy products as players. The key buyers will be
taken as food retailers, and dairy farmers as the key suppliers.
Summary
Figure 9: Forces driving competition in the dairy market in India, 2013
SOURCE: MARKETLINE M A R K E T L I N E
Despite their diversified dairy portfolios, many players are similar to one another and this tends to boosts rivalry.
Suppliers commonly integrate forward, as dairy co-operatives offer farmers the opportunity to access larger markets and
use capital items, such as packaging and processing plants.
The dairy market is fairly easy to enter as a small enterprise; however, in order to supply to the mass market, consumer
companies must be large and have some level of integration, if successful market entry is to be secured.
Dairy products tend to be a staple in peoples' diets; therefore they are unlikely to be replaced. However, there are many
alternatives for those wishing to cut down or cut dairy from their diets.

India - Dairy 0102 - 0711 - 2013
© MARKETLINE THIS PROFILE IS A LICENSED PRODUCT AND IS NOT TO BE PHOTOCOPIED Page | 17
Buyer power
Figure 10: Drivers of buyer power in the dairy market in India, 2013
SOURCE: MARKETLINE M A R K E T L I N E
Buyer power is strengthened in this market, where players can sell only to a small number of large buyers.
It is difficult to differentiate staple foods, such as milk and butter. Cheese and yogurt products are more differentiated,
with a number of niche cheese markets in operation. The dairy market is highly price sensitive, as buyers will tend to opt
for the cheaper option, especially in the milk market, subsequently enhancing buyer power. These factors boost buyer
power.
Manufacturers can target end-users with their branding strategies, or develop more individual, premium products, such
as organic yoghurt, to counter balance the power of buyers to make purchasing decisions on price alone.
As the majority of production is on a small scale, there is relatively high likelihood of players reversing the trend by
integrating forward into selling to consumers, which decreases the buying power of food retailers.
However, dairy products are an important part of most consumers' food and beverage purchasing in many countries, and
food retailers are therefore strongly motivated to stock them, weakening their buying power somewhat.
Overall, buyer power is assessed as moderate.
India - Dairy 0102 - 0711 - 2013
© MARKETLINE THIS PROFILE IS A LICENSED PRODUCT AND IS NOT TO BE PHOTOCOPIED Page | 18
Supplier power
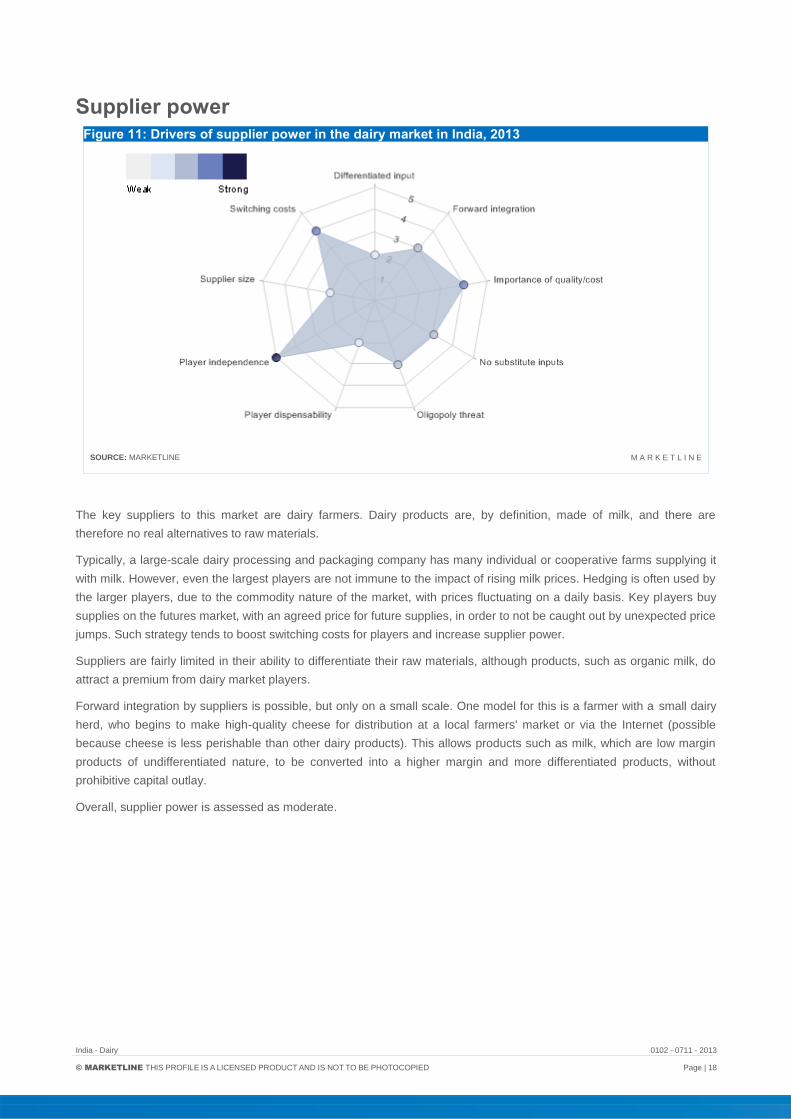
Figure 11: Drivers of supplier power in the dairy market in India, 2013
SOURCE: MARKETLINE M A R K E T L I N E
The key suppliers to this market are dairy farmers. Dairy products are, by definition, made of milk, and there are
therefore no real alternatives to raw materials.
Typically, a large-scale dairy processing and packaging company has many individual or cooperative farms supplying it
with milk. However, even the largest players are not immune to the impact of rising milk prices. Hedging is often used by
the larger players, due to the commodity nature of the market, with prices fluctuating on a daily basis. Key players buy
supplies on the futures market, with an agreed price for future supplies, in order to not be caught out by unexpected price
jumps. Such strategy tends to boost switching costs for players and increase supplier power.
Suppliers are fairly limited in their ability to differentiate their raw materials, although products, such as organic milk, do
attract a premium from dairy market players.
Forward integration by suppliers is possible, but only on a small scale. One model for this is a farmer with a small dairy
herd, who begins to make high-quality cheese for distribution at a local farmers' market or via the Internet (possible
because cheese is less perishable than other dairy products). This allows products such as milk, which are low margin
products of undifferentiated nature, to be converted into a higher margin and more differentiated products, without
prohibitive capital outlay.
Overall, supplier power is assessed as moderate.

India - Dairy 0102 - 0711 - 2013
© MARKETLINE THIS PROFILE IS A LICENSED PRODUCT AND IS NOT TO BE PHOTOCOPIED Page | 19
New entrants
Figure 12: Factors influencing the likelihood of new entrants in the dairy market in India, 2013
SOURCE: MARKETLINE M A R K E T L I N E
In the Indian dairy market, small-scale entry, perhaps as an artisanal producer of premium dairy products, does not
require very large amounts of capital. However, for new entrants aiming to challenge the major players in the mass-
consumer market, entry barriers are much higher.
Companies are more and more interested in expansion through mergers and acquisitions, as this gives them the
necessary leverage over competition in the market. The main factors standing behind the trend for mergers and
acquisitions in this market include economies of scale, increasing profit levels, and reducing overheads. Scale
economies in production are important, especially in countries where a consolidated food retail sector means that players
are forced to compete intensely on price.
Most dairy products are perishable, which means that reliable supply and distribution chains are vital to avoid the costs
of wastage.
Increased concentration of the market results in companies focusing on increasing brand value, product market share,
and international presence. Leading dairy product manufacturers may have strong brands aimed at retaining end-user
loyalty, which means that new players will have a more difficult task trying to distinguish their own brands.
Government and regulatory bodies such as Indian Dairy Industry act as a barrier to entry with strict laws regarding food
safety, which increase compliance costs. India has reaffirmed its ban on Chinese milk and dairy products recently,
extending the sanction through 2015. The ban went into effect after China’s dairy industry suffered a scandal related to
milk tainted with melamine, which killed four children and sickened thousands of others.
Very strong historic growth is likely to attract potential new entrants.
Overall, there is a moderate likelihood of new players in the Indian dairy market.
India - Dairy 0102 - 0711 - 2013
© MARKETLINE THIS PROFILE IS A LICENSED PRODUCT AND IS NOT TO BE PHOTOCOPIED Page | 20
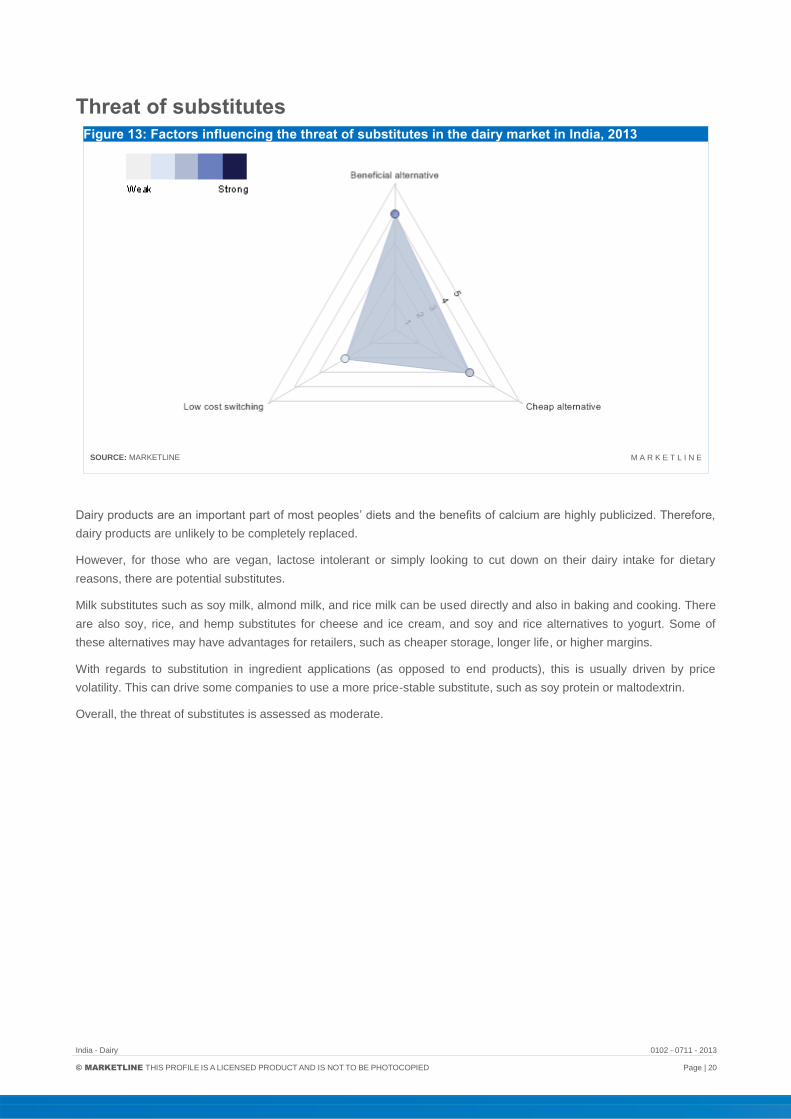
Threat of substitutes
Figure 13: Factors influencing the threat of substitutes in the dairy market in India, 2013
SOURCE: MARKETLINE M A R K E T L I N E
Dairy products are an important part of most peoples’ diets and the benefits of calcium are highly publicized. Therefore,
dairy products are unlikely to be completely replaced.
However, for those who are vegan, lactose intolerant or simply looking to cut down on their dairy intake for dietary
reasons, there are potential substitutes.
Milk substitutes such as soy milk, almond milk, and rice milk can be used directly and also in baking and cooking. There
are also soy, rice, and hemp substitutes for cheese and ice cream, and soy and rice alternatives to yogurt. Some of
these alternatives may have advantages for retailers, such as cheaper storage, longer life, or higher margins.
With regards to substitution in ingredient applications (as opposed to end products), this is usually driven by price
volatility. This can drive some companies to use a more price-stable substitute, such as soy protein or maltodextrin.
Overall, the threat of substitutes is assessed as moderate.
India - Dairy 0102 - 0711 - 2013
© MARKETLINE THIS PROFILE IS A LICENSED PRODUCT AND IS NOT TO BE PHOTOCOPIED Page | 21
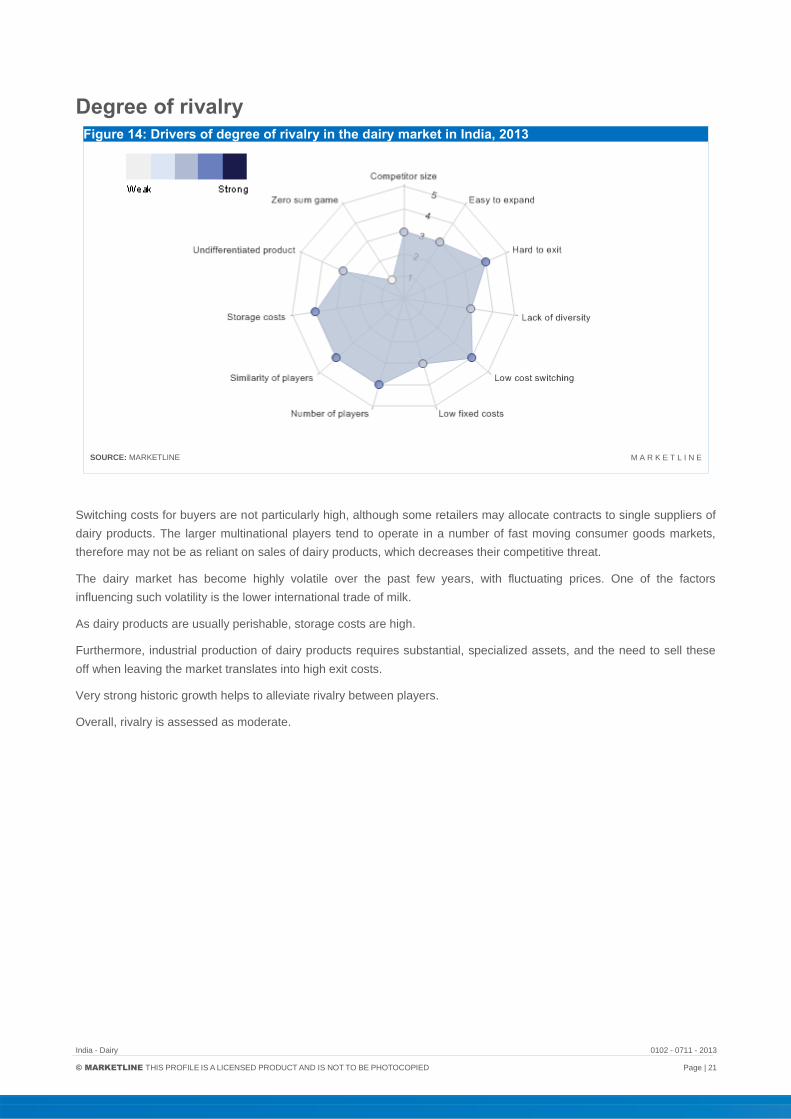
Degree of rivalry
Figure 14: Drivers of degree of rivalry in the dairy market in India, 2013
SOURCE: MARKETLINE M A R K E T L I N E
Switching costs for buyers are not particularly high, although some retailers may allocate contracts to single suppliers of
dairy products. The larger multinational players tend to operate in a number of fast moving consumer goods markets,
therefore may not be as reliant on sales of dairy products, which decreases their competitive threat.
The dairy market has become highly volatile over the past few years, with fluctuating prices. One of the factors
influencing such volatility is the lower international trade of milk.
As dairy products are usually perishable, storage costs are high.
Furthermore, industrial production of dairy products requires substantial, specialized assets, and the need to sell these
off when leaving the market translates into high exit costs.
Very strong historic growth helps to alleviate rivalry between players.
Overall, rivalry is assessed as moderate.

India - Dairy 0102 - 0711 - 2013
© MARKETLINE THIS PROFILE IS A LICENSED PRODUCT AND IS NOT TO BE PHOTOCOPIED Page | 22
LEADING COMPANIES
Andhra Pradesh Dairy Development Cooperative Federation Ltd. (APDDCF)
Table 9: Andhra Pradesh Dairy Development Cooperative Federation Ltd. (APDDCF): key facts
Head office: APDDCF LTD, Vijaya Bhavan, Lalapet, Hyderabad, AP – 500017, IND
Telephone: 91 40 27019851
Website: www.apdairy.in
SOURCE: COMPANY WEBSITE M A R K E T L I N E
Andhra Pradesh Dairy Development Cooperative Federation Ltd. (APDDCF) is an India-based dairy cooperative. The
company’s products include curd, butter milk, butter, ghee, paneer, and doodh peda.
The company’s milk procurement operations cover 11 districts and its products are marketed under the Vijaya brand.
Key Metrics
As a private entity, APDDCF is not obliged to release its financial information.
India - Dairy 0102 - 0711 - 2013
© MARKETLINE THIS PROFILE IS A LICENSED PRODUCT AND IS NOT TO BE PHOTOCOPIED Page | 23
Gujarat Cooperative Milk Marketing Federation Ltd.
Table 10: Gujarat Cooperative Milk Marketing Federation Ltd.: key facts
Head office: Amul Dairy Road, Anand 388 001, Gujarat, IND
Telephone: 91 2692 258 506
Fax: 91 2692 240 208
Website: www.amul.com
Financial year-end: March
SOURCE: COMPANY WEBSITE M A R K E T L I N E
Gujarat Cooperative Milk Marketing Federation (GCMMF) is a dairy product co-operative. The company provides a range
of dairy products under the brand names Amul, Sagar, Amulya, and Nutramul. GCMMF is also involved in the export of
its dairy products internationally in the US, Singapore, Philippines, Japan, China, Australia and the Gulf Countries. The
company primarily operates in India.
The company's daily milk procurement is around 13.2 million liters per day from 17,025 village milk cooperative societies,
17 member unions covering 31 districts, and 3.23 million milk producer members. It operates through 53 sales offices
and has a dealer network of 10,000 dealers and one million retailers.
The company's product line include bread spreads, cheese, fresh milk, UHT (ultra-high-temperature) milk, milk powders,
milk drink, health drinks, brown beverages, curd products, pure ghee, sweetened condensed milk, mithaee (ethnic
sweets), ice-cream, and chocolate and confectionery.
GCMMF offers bread spreads such as butter, lite and table margarine. The company's cheese product line includes
pasteurized processed cheese, cheese spreads, emmental cheese, pizza mozzarella cheese and gouda cheese.
GCMMF offers fresh milk with various pasteurizations such as gold milk, fresh milk, taaza double toned milk, lite slim and
trim milk, fresh cream, shakti toned milk, and calci+.
The company's UHT milk range offers 4.5% fat milk, 1.8% fat milk, 1.5% fat milk, fresh cream, and lite slim-n-trim milk.
The company's powder milk product portfolio includes infant spray milk food, instant full cream milk powder, skimmed
milk powder, tea coffee whitener and dairy whitener.
GCMMF offers milk drinks with various packaging such as kool, kool cafe, kool koko, energy drink, kool chocolate milk,
kool flavored bottled milk, kool flavored tetra pack, masti spiced buttermilk and kool thandai.
The company also provides health drinks such as stamina instant energy drink; and also brown beverages such as
Nutramul malted milk food. GCMMF offers curd products such as dahi (fresh curd), masti spiced butter milk, lassee and
yoghurt.
GCMMF also offers pure ghee and sweetened condensed milk. The company offers desserts such as ice creams,
shrikhand, mithaee, gulab jamun, basundi, ladoos and chocolates.
In addition, the company offers franchising option in various formats including Amul preferred outlets, ice cream parlors,
railways stalls, kiosks in stalls and theaters, and cafe Amul quick service restaurants.
Key Metrics
The company recorded revenues of $3.0bn in 2014. Further financial information is not available, as GCMMF operates
as a privately owned company.

India - Dairy 0102 - 0711 - 2013
© MARKETLINE THIS PROFILE IS A LICENSED PRODUCT AND IS NOT TO BE PHOTOCOPIED Page | 24
Kerala Co-operative Milk Marketing Federation Ltd (KCMMF)
Table 11: Kerala Co-operative Milk Marketing Federation Ltd (KCMMF): key facts
Head office: Pattom Palace P.O, Thiruvananthapuram-695 004, Kerala, IND
Telephone: 91 471 2555980
Fax: 91 471 2555992
Website: www.kcmmf.in
SOURCE: COMPANY WEBSITE M A R K E T L I N E
Kerala Co-operative Milk Marketing Federation Ltd (KCMMF), also known as Milma is an India-based dairy do-operative
society.
The company produces milk, fermented products (paneer, set curd, sambharam, and skimmed milk curd), fat products
(butter and ghee), ice creams and desserts, sweets and chocolates, milk drinks, powdered milk, drinking water, and a
mango-flavored fruit drink.
The company was founded in 1980.
Key Metrics
Kerala had a turnover of INR2,984.9 (approximately USD51m) in FY2013, compared to a turnover of INR2,494.7m
(approximately USD42.7m) the previous year. Further information is not available for this company.
India - Dairy 0102 - 0711 - 2013
© MARKETLINE THIS PROFILE IS A LICENSED PRODUCT AND IS NOT TO BE PHOTOCOPIED Page | 25
Tamil Nadu Cooperative Milk Producers' Federation (TNCMPF)
Table 12: Tamil Nadu Cooperative Milk Producers' Federation (TNCMPF): key facts
Head office: Aavin Illam, Madhavaram Milk Colony, Chennai, Tamilnadu - 600 051, IND
Telephone: 91 44 23464500
Fax: 91 44 23464505
Website: www.aavinmilk.com
SOURCE: COMPANY WEBSITE M A R K E T L I N E
Tamil Nadu Cooperative Milk Producers' Federation (TCMPF) is an India-based dairy co-operative society. It is one of
the leading states in India in milk production, producing about 14.5 million liters per day.
The company produces and markets milk and other milk-derived dairy products. The company runs 17 co-operative
unions, 15 dairy plants and 36 chilling centers Tamilnadu, India.
TCMPF produces and markets a wide range of dairy products, such as skim milk powder, sweets, butter, cheese,
yoghurt, table butter, flavored milk, ice-cream, UHT standardized milk, and butter milk. The company markets its
products under the flagship brand Aavin.
Key Metrics
The company is government owned and its financial information is not available.
India - Dairy 0102 - 0711 - 2013
© MARKETLINE THIS PROFILE IS A LICENSED PRODUCT AND IS NOT TO BE PHOTOCOPIED Page | 26
MACROECONOMIC INDICATORS
Country Data
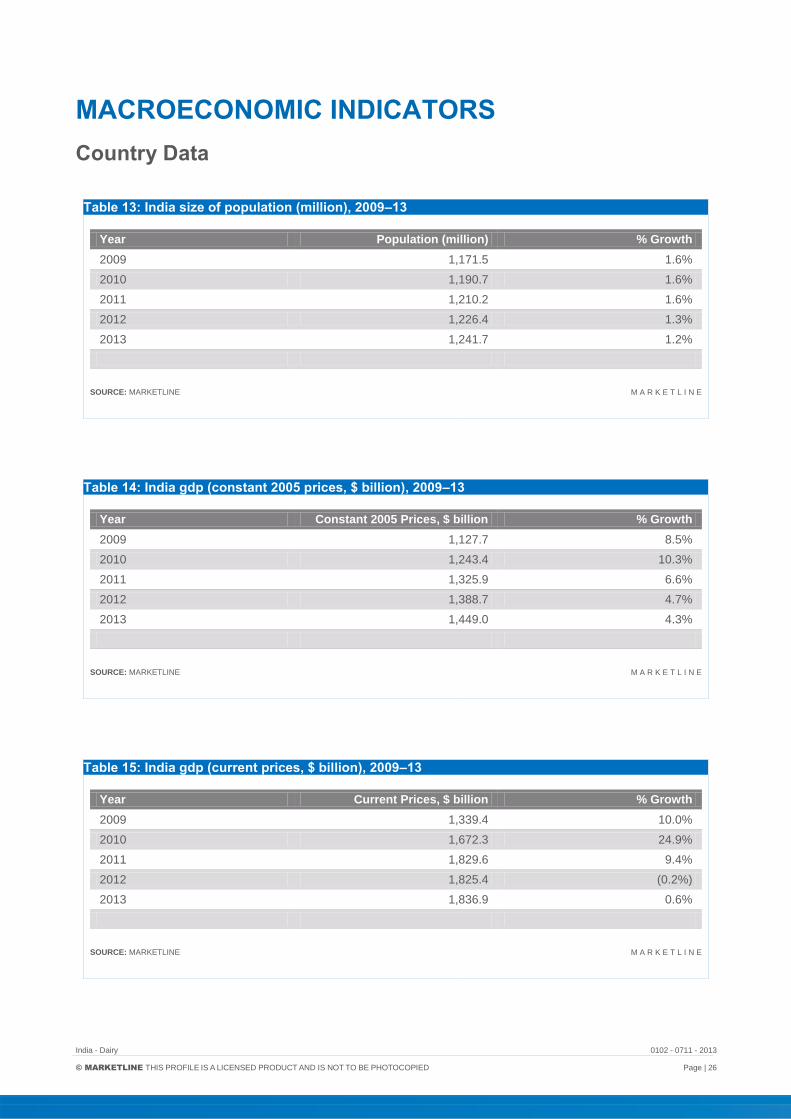
Table 13: India size of population (million), 2009–13
Year Population (million) % Growth
2009 1,171.5 1.6%
2010 1,190.7 1.6%
2011 1,210.2 1.6%
2012 1,226.4 1.3%
2013 1,241.7 1.2%
SOURCE: MARKETLINE M A R K E T L I N E
Table 14: India gdp (constant 2005 prices, $ billion), 2009–13
Year Constant 2005 Prices, $ billion % Growth
2009 1,127.7 8.5%
2010 1,243.4 10.3%
2011 1,325.9 6.6%
2012 1,388.7 4.7%
2013 1,449.0 4.3%
SOURCE: MARKETLINE M A R K E T L I N E
Table 15: India gdp (current prices, $ billion), 2009–13
Year Current Prices, $ billion % Growth
2009 1,339.4 10.0%
2010 1,672.3 24.9%
2011 1,829.6 9.4%
2012 1,825.4 (0.2%)
2013 1,836.9 0.6%
SOURCE: MARKETLINE M A R K E T L I N E
India - Dairy 0102 - 0711 - 2013
© MARKETLINE THIS PROFILE IS A LICENSED PRODUCT AND IS NOT TO BE PHOTOCOPIED Page | 27
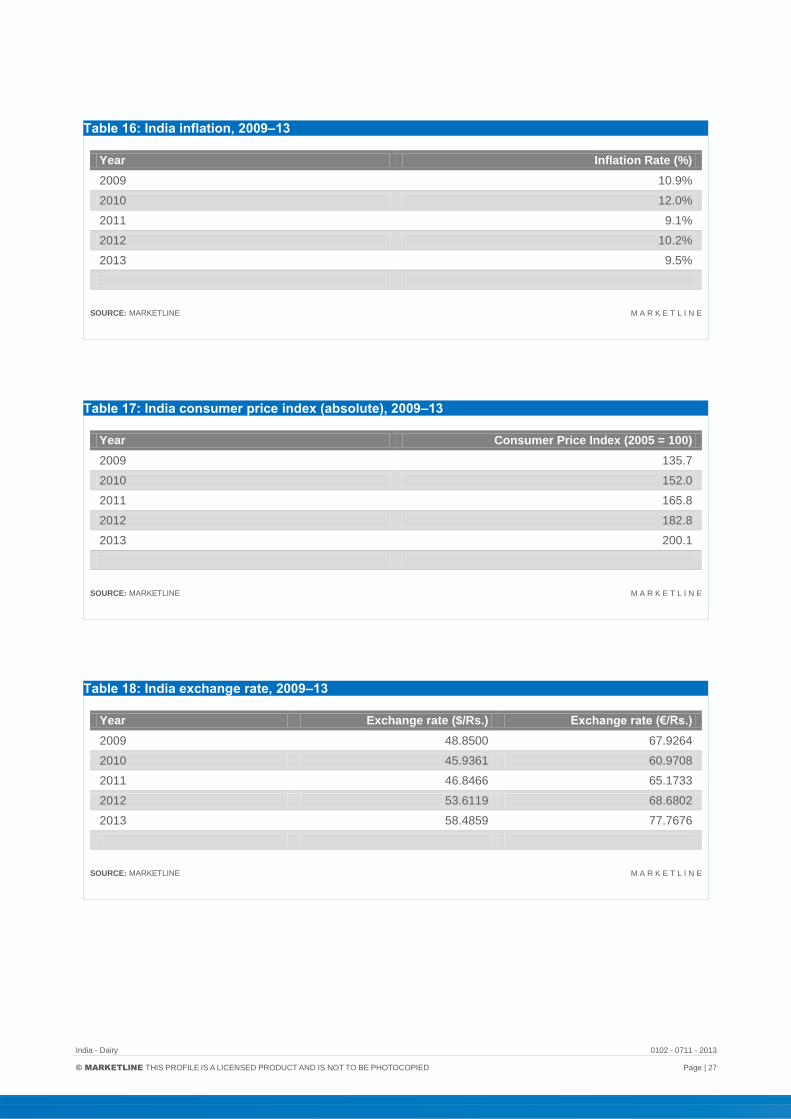
Table 16: India inflation, 2009–13
Year Inflation Rate (%)
2009 10.9%
2010 12.0%
2011 9.1%
2012 10.2%
2013 9.5%
SOURCE: MARKETLINE M A R K E T L I N E
Table 17: India consumer price index (absolute), 2009–13
Year Consumer Price Index (2005 = 100)
2009 135.7
2010 152.0
2011 165.8
2012 182.8
2013 200.1
SOURCE: MARKETLINE M A R K E T L I N E
Table 18: India exchange rate, 2009–13
Year Exchange rate ($/Rs.) Exchange rate (€/Rs.)
2009 48.8500 67.9264
2010 45.9361 60.9708
2011 46.8466 65.1733
2012 53.6119 68.6802
2013 58.4859 77.7676
SOURCE: MARKETLINE M A R K E T L I N E
India - Dairy 0102 - 0711 - 2013
© MARKETLINE THIS PROFILE IS A LICENSED PRODUCT AND IS NOT TO BE PHOTOCOPIED Page | 28
APPENDIX
Methodology MarketLine Industry Profiles draw on extensive primary and secondary research, all aggregated, analyzed, cross-
checked and presented in a consistent and accessible style.
Review of in-house databases – Created using 250,000+ industry interviews and consumer surveys and supported by
analysis from industry experts using highly complex modeling & forecasting tools, MarketLine’s in-house databases
provide the foundation for all related industry profiles
Preparatory research – We also maintain extensive in-house databases of news, analyst commentary, company
profiles and macroeconomic & demographic information, which enable our researchers to build an accurate market
overview
Definitions – Market definitions are standardized to allow comparison from country to country. The parameters of each
definition are carefully reviewed at the start of the research process to ensure they match the requirements of both the
market and our clients
Extensive secondary research activities ensure we are always fully up-to-date with the latest industry events and
trends
MarketLine aggregates and analyzes a number of secondary information sources, including:
- National/Governmental statistics
- International data (official international sources)
- National and International trade associations
- Broker and analyst reports
- Company Annual Reports
- Business information libraries and databases
Modeling & forecasting tools – MarketLine has developed powerful tools that allow quantitative and qualitative data to
be combined with related macroeconomic and demographic drivers to create market models and forecasts, which can
then be refined according to specific competitive, regulatory and demand-related factors
Continuous quality control ensures that our processes and profiles remain focused, accurate and up-to-date

India - Dairy 0102 - 0711 - 2013
© MARKETLINE THIS PROFILE IS A LICENSED PRODUCT AND IS NOT TO BE PHOTOCOPIED Page | 29
Industry associations
International Dairy Foods Association (IDFA)
1250 H Street, NW, Suite 900, Washington, DC 20005, USA
Tel.: 1 202 737 4332
Fax: 1 202 331 7820
www.idfa.org
International Dairy Federation Diamant Building, Boulevard Auguste Reyers 80, 1030 Brussels, BEL
Tel.: 32 2 733 9888
Fax: 32 2 733 0413
www.fil-idf.org
Indian Dairy Association IDA House, Sector-IV, R.K. Puram, New Delhi-110 022, IND
Tel.: 91 11 2617 0781
Fax: 91 11 2617 4719
www.indairyasso.org
Related MarketLine research
Industry Profile
Dairy in Europe
Dairy in Asia-Pacific
Global Dairy
Dairy in China

Copyright of Dairy Industry Profile: India is the property of MarketLine, a Datamonitorbusiness and its content may not be copied or emailed to multiple sites or posted to a listservwithout the copyright holder's express written permission. However, users may print,download, or email articles for individual use.