2014 financial review management’s discussion and · pdf filemanagement’s...
TRANSCRIPT
48 Reaching For Our Export Potential
Management’s Discussion and Analysis
49 Financial Results Overview
49 Impact of Foreign Exchange Translation on Financial Results
50 Financial Performance
50 Net Financing and Investment Income
52 Insurance Premiums and Insurance Guarantee Fees
52 Other (Income) Expenses
53 Provision for (Reversal of) Credit Losses
53 Claims-Related Expenses
53 Administrative Expenses
54 Financial Condition
54 Statement of Financial Position Summary
54 Corporate Plan Discussion
56 Portfolio Exposures and Credit Quality
56 Concentration of Exposure
56 Financing Portfolio
60 Insurance Portfolio
62 Marketable Securities and Derivative Instruments
63 Capital Management
64 Off Balance Sheet Arrangements
64 Financial Instruments
65 Risk Management
66 Risk Management Overview
66 Risk Governance, Oversight and Design
68 Risk Modules
68 Financial Risk
72 Operational Risk Management
73 Strategic Risk Management
73 Critical Accounting Policies and Estimates
73 Change in Accounting Standards
74 Non-IFRS Performance Measures
75 Supplemental Information
Caution regarding forward-looking statements
This document contains projections and other forward-looking statements regarding future events. Such statements require us to make assumptions and are subject to inherent risks and uncertainties. These may cause actual results to differ materially from expectations expressed in the forward-looking statements.
2014 finAnCiAl REViEW
ContentsManagement’s Discussion and Analysis (MD&A)
should be read in conjunction with our audited
consolidated financial statements and related
notes for the year ended December 31, 2014.
All amounts are expressed in Canadian dollars.
EDC Annual Report 2014 49
Ma
na
ge
Me
nt
’s D
isc
us
sio
n a
nD
an
aly
sis
Financial Results OverviewOn most accounts, 2014 was a pivotal and eventful year for the global economy. In the U.S., an unexpected weather-induced drop in first-quarter GDP was followed by economic activity and employment growth exceeding expectations over the remainder of the year. We also saw the beginning and the end of the U.S. Federal Reserve’s tapering of its third round of quantitative easing, which caused material fluctuations in the global financial system. Finally, a series of significant world events – notably the Russia-Ukraine crisis, the emergence of ISIS in Syria and Iraq, and the severe plunge in oil prices and other major commodities – have shaken the geopolitical and financial landscape and introduced substantial uncertainty over the global economic outlook likely for many years to come.
At the close of the year, the U.S. economy did not disappoint, with output growth expected to reach a decade-high in 2015; unfortunately, the same cannot be said about most other major world economies. Europe has gone from cautious optimism to faltering growth, closing the year in deflation and mired in political uncertainty. Japan has been shaken with yet another recession, Brazil narrowly pulled out of a recession in the third quarter, China’s growth has pulled back and Russia is facing the specter of stagflation and a full-blown currency crisis. Additionally, expectations of diverging monetary policies in developed markets, outperformance of the U.S. economy and the re-emergence of global financial market volatility have in turn reversed capital flows away from emerging economies and into safe haven markets, driving sovereign bond yields to record lows and has resulted in a marked strengthening of the U.S. dollar.
For Canada, global conditions produced resurgent demand for its merchandise exports which ended 10.3% higher than in 2013 and resulted in the first annual trade surplus since 2011 at $5.2 billion. Demand for EDC’s financing products increased as a result of the continued growth in exports and Canadian international business activity. The strengthening U.S. economy resulted in the signing of several large loans to U.S. borrowers. In addition, the continuation of a low interest rate environment as well as a low Canadian dollar further bolstered Canadian exports and EDC’s financial results.
The weakening Canadian dollar resulted in an increase in both our total assets and business results. Our loans receivable, which are predominantly U.S. denominated increased by 14% in 2014, a reflection of both the weaker dollar and growth in our portfolio.
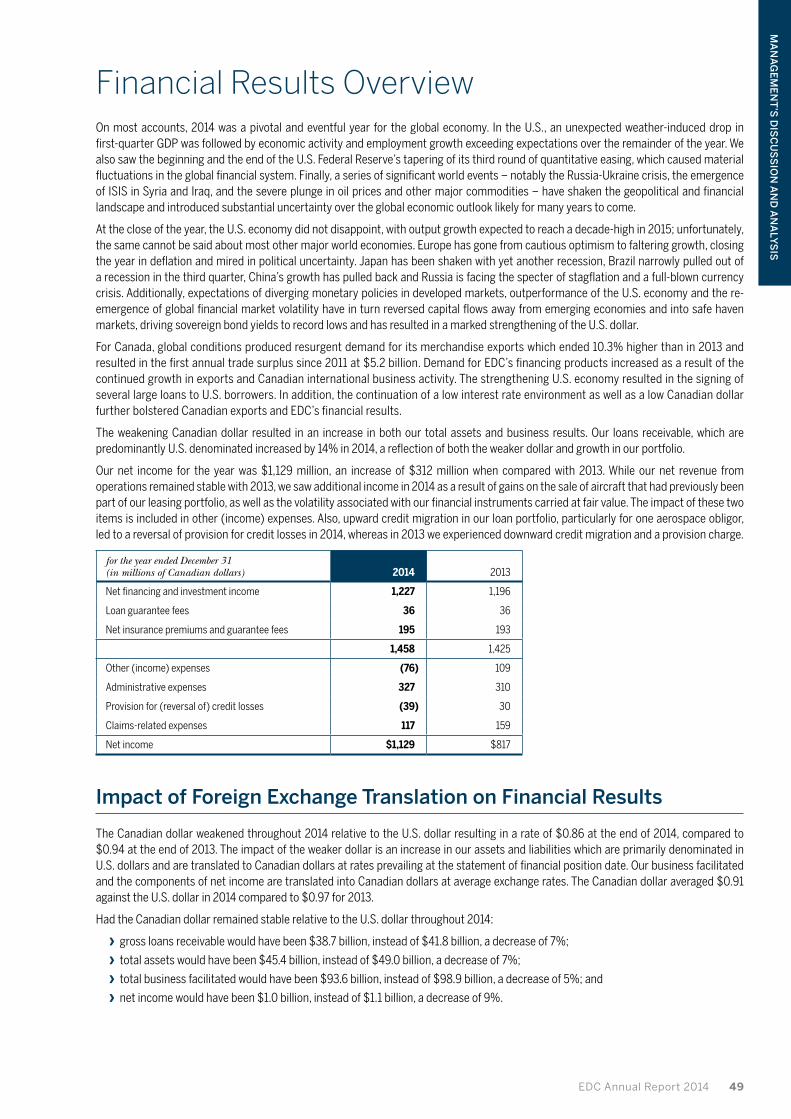
Our net income for the year was $1,129 million, an increase of $312 million when compared with 2013. While our net revenue from operations remained stable with 2013, we saw additional income in 2014 as a result of gains on the sale of aircraft that had previously been part of our leasing portfolio, as well as the volatility associated with our financial instruments carried at fair value. The impact of these two items is included in other (income) expenses. Also, upward credit migration in our loan portfolio, particularly for one aerospace obligor, led to a reversal of provision for credit losses in 2014, whereas in 2013 we experienced downward credit migration and a provision charge.
for the year ended December 31 (in millions of Canadian dollars) 2014 2013
Net financing and investment income 1,227 1,196
Loan guarantee fees 36 36
Net insurance premiums and guarantee fees 195 193
1,458 1,425
Other (income) expenses (76) 109
Administrative expenses 327 310
Provision for (reversal of) credit losses (39) 30
Claims-related expenses 117 159
Net income $1,129 $817
Impact of Foreign Exchange Translation on Financial Results
The Canadian dollar weakened throughout 2014 relative to the U.S. dollar resulting in a rate of $0.86 at the end of 2014, compared to $0.94 at the end of 2013. The impact of the weaker dollar is an increase in our assets and liabilities which are primarily denominated in U.S. dollars and are translated to Canadian dollars at rates prevailing at the statement of financial position date. Our business facilitated and the components of net income are translated into Canadian dollars at average exchange rates. The Canadian dollar averaged $0.91 against the U.S. dollar in 2014 compared to $0.97 for 2013.
Had the Canadian dollar remained stable relative to the U.S. dollar throughout 2014:
› gross loans receivable would have been $38.7 billion, instead of $41.8 billion, a decrease of 7%;
› total assets would have been $45.4 billion, instead of $49.0 billion, a decrease of 7%;
› total business facilitated would have been $93.6 billion, instead of $98.9 billion, a decrease of 5%; and
› net income would have been $1.0 billion, instead of $1.1 billion, a decrease of 9%.

50 Reaching For Our Export Potential
management’s discussion and analysis
Financial PerformanceNet Financing and Investment Income
Loan RevenueLoan revenue was $1,239 million in 2014, an increase of $65 million from 2013. The total yield on our loan portfolio (both performing and impaired) was 3.19%, down 41 basis points from the previous year.
Performing loan interest revenue was $1,057 million in 2014, an increase of $84 million compared to 2013. Growth in our portfolio accounted for the increase, a result of net loan disbursements of $2,999 million in 2014. Revenue from portfolio growth was tempered by the low interest rate environment which continued through 2014. The stronger U.S. dollar against the Canadian dollar had a positive impact on revenue.
Yields on our floating rate portfolio decreased to 2.23% in 2014 from 2.43% in 2013 as a result of lower reference rates and spreads. The reduced spread is the result of disbursements on new loans of better credit quality in 2014. Our fixed rate portfolio yields also decreased to 4.43% from 4.81% during this same period due to repayments on older loans with an average yield of 5.47% being replaced by new loans with an average yield of 3.34%. As a result, the overall yield on our performing loan portfolio decreased by 30 basis points to 2.74%.
We recognize revenue on the carrying value of our impaired loans at their original effective yield when we are reasonably able to estimate future cash flows on those impaired loans. While the average carrying value of our impaired loans remained consistent throughout 2014, we recognized $2 million of impaired revenue, a decrease of $28 million from 2013. The revenue in 2013 was primarily related to two obligors in our aerospace portfolio that returned to performing status in 2013.
Loan fee revenue increased by $10 million to $168 million in 2014 mainly due to a larger portfolio as well as other events, such as loan prepayments, which resulted in the immediate recognition of deferred revenue.
For a breakdown of loan interest yield on our fixed and floating rate portfolios, refer to Table 1 in Supplemental Information.
1,500
1,200
900
600
300
020142010 2011 2012 2013
10
8
6
4
2
0
($ in millions)
Yield (%)
YieldLoan revenue
Loan Revenue
8
6
4
2
020142010 2011 2012 2013
Yield (%)
Total loan yieldPerforming floating rate couponPerforming fixed rate coupon
Loan Interest Yield
Components of the change in loan revenue from 2013
(in millions of Canadian dollars) 2014
Revenue from portfolio growth 99
Decrease in revenue from lower yield (86)
Foreign exchange impact 71
Increase in performing loan interest revenue 84
Increase in loan fee revenue 10
Decrease in impaired revenue (28)
Decrease in other loan revenue (1)
Net change in loan revenue $65
EDC Annual Report 2014 51
Ma
na
ge
Me
nt
’s D
isc
us
sio
n a
nD
an
aly
sis
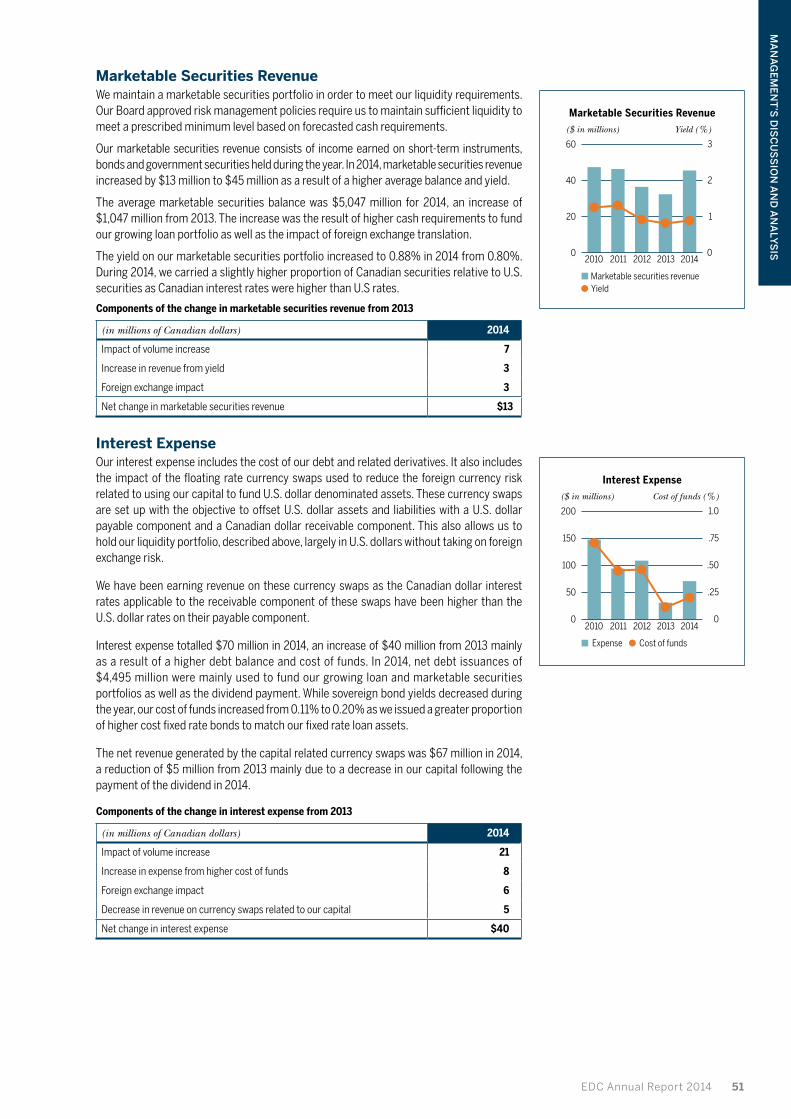
Marketable Securities RevenueWe maintain a marketable securities portfolio in order to meet our liquidity requirements. Our Board approved risk management policies require us to maintain sufficient liquidity to meet a prescribed minimum level based on forecasted cash requirements.
Our marketable securities revenue consists of income earned on short-term instruments, bonds and government securities held during the year. In 2014, marketable securities revenue increased by $13 million to $45 million as a result of a higher average balance and yield.
The average marketable securities balance was $5,047 million for 2014, an increase of $1,047 million from 2013. The increase was the result of higher cash requirements to fund our growing loan portfolio as well as the impact of foreign exchange translation.
The yield on our marketable securities portfolio increased to 0.88% in 2014 from 0.80%. During 2014, we carried a slightly higher proportion of Canadian securities relative to U.S. securities as Canadian interest rates were higher than U.S rates.
Components of the change in marketable securities revenue from 2013
(in millions of Canadian dollars) 2014
Impact of volume increase 7
Increase in revenue from yield 3
Foreign exchange impact 3
Net change in marketable securities revenue $13
Interest ExpenseOur interest expense includes the cost of our debt and related derivatives. It also includes the impact of the floating rate currency swaps used to reduce the foreign currency risk related to using our capital to fund U.S. dollar denominated assets. These currency swaps are set up with the objective to offset U.S. dollar assets and liabilities with a U.S. dollar payable component and a Canadian dollar receivable component. This also allows us to hold our liquidity portfolio, described above, largely in U.S. dollars without taking on foreign exchange risk.
We have been earning revenue on these currency swaps as the Canadian dollar interest rates applicable to the receivable component of these swaps have been higher than the U.S. dollar rates on their payable component.
Interest expense totalled $70 million in 2014, an increase of $40 million from 2013 mainly as a result of a higher debt balance and cost of funds. In 2014, net debt issuances of $4,495 million were mainly used to fund our growing loan and marketable securities portfolios as well as the dividend payment. While sovereign bond yields decreased during the year, our cost of funds increased from 0.11% to 0.20% as we issued a greater proportion of higher cost fixed rate bonds to match our fixed rate loan assets.
The net revenue generated by the capital related currency swaps was $67 million in 2014, a reduction of $5 million from 2013 mainly due to a decrease in our capital following the payment of the dividend in 2014.
Components of the change in interest expense from 2013
(in millions of Canadian dollars) 2014
Impact of volume increase 21
Increase in expense from higher cost of funds 8
Foreign exchange impact 6
Decrease in revenue on currency swaps related to our capital 5
Net change in interest expense $40
60
40
20
020142010 2011 2012 2013
3
2
1
0
($ in millions)
Yield (%)
YieldMarketable securities revenue
Marketable Securities Revenue
200
150
100
50
020142010 2011 2012 2013
1.0
.75
.50
.25
0
($ in millions)
Cost of funds (%)
Cost of fundsExpense
Interest Expense

52 Reaching For Our Export Potential
management’s discussion and analysis
Insurance Premiums and Insurance Guarantee Fees
Premium and guarantee fee revenue earned in our insurance programs in 2014 totalled $195 million compared to $193 million earned in the prior year. The main variances were within our credit and financial institutions insurance programs.
Insurance premiums earned under our credit insurance program amounted to $105 million for the year. We have partnered with reinsurers and in 2014 we ceded premiums of $6 million to our reinsurance partners resulting in net premium revenue of $99 million. The net premium decreased by $4 million from 2013 mainly due to a decline in business activity for one significant customer.
The average credit insurance premium rate has declined since 2010 when higher rates were charged to customers to reflect increased risk associated with their policies that stemmed from the global recession.
Net insurance premiums earned under our financial institutions insurance program totalled $24 million, an increase of $3 million from 2013 as the program experienced an increase in demand in major markets, particularly China and Brazil.
For the breakdown of insurance premiums and guarantee fees, refer to Table 3 in Supplemental Information.
Other (Income) Expenses
Other income was $76 million in 2014 compared to other expenses of $109 million in 2013. The key components of other income in 2014 were gains from the sale of aircraft as well as realized and unrealized fair value gains and losses on various financial instruments.
We recognized a gain of $53 million on the sale of aircraft and component parts from the held-for-sale portfolio during 2014. Refer to page 59 for further details.
We have designated the majority of our loans payable at fair value through profit or loss in order to obtain the same accounting treatment as their related derivatives. In general, these derivatives are entered into to manage interest and foreign exchange rate risks on the related loans payable.
In accordance with International Financial Reporting Standards (IFRS), our loans payable are valued on the basis of our credit rating (AAA) while the related derivatives are valued based on the credit risk of the resulting exposure. During 2014, most rates relevant to the valuation of our loans payable and the related derivatives decreased, leading to net realized and unrealized losses of $76 million on our loans payable and net realized and unrealized gains of $22 million on the related derivatives. The losses on our loans payable were greater than the gains on the related derivatives since the rates used to value our loans payable decreased more than the rates used to value the related derivatives. In contrast, in 2013, the opposite occurred: most rates relevant to the valuation of our loans payable and the related derivatives increased, leading to net realized and unrealized gains of $248 million on our loans payable and net realized and unrealized losses of $288 million on the related derivatives.
In 2014, our investments portfolio experienced realized gains of $15 million (2013 – $12 million) and unrealized gains of $35 million (2013 – losses of $8 million). The increases were primarily driven by the stronger financial performance of our direct investments and an increase in fair value of the underlying investments in our funds during 2014.
Our marketable securities portfolio is mainly sensitive to long-term U.S. Treasury rates. In 2014, the marketable securities portfolio experienced unrealized gains of $24 million (2013 – losses of $61 million), a reflection of a decrease in long-term U.S. Treasury rates during 2014 compared to an increase in 2013. In addition, as we rebalanced the portfolio to track to the relevant benchmark index, securities bearing higher coupons than prevailing market rates were sold and generated realized gains of $2 million (2013 – $9 million).
150
120
90
60
30
020142010 2011 2012 2013
0.5
0.4
0.3
0.2
0.1
0
($ in millions)
Premium rate (%)
Average ratePremiums earned
Credit Insurance Premiums
(in millions of Canadian dollars) 2014 2013
(Gain) loss on sale of aircraft and component parts (53) 9
Net realized and unrealized (gain) loss on loans payable designated at fair value through profit or loss 76 (248)
Net realized and unrealized (gain) loss on derivatives related to loans payable (22) 288
Net realized and unrealized gain on investments at fair value through profit or loss (50) (4)
Net realized and unrealized (gain) loss on marketable securities at fair value through profit or loss (26) 52
Foreign exchange translation loss 3 1
Other (4) 11
Total other (income) expenses $(76) $109
EDC Annual Report 2014 53
Ma
na
ge
Me
nt
’s D
isc
us
sio
n a
nD
an
aly
sis
Provision for (Reversal of) Credit Losses
In 2014, we recorded a provision reversal of $39 million related to our loan portfolio compared to a $30 million provision charge in 2013. There was significant credit migration activity during the year. The impact of upward credit migration, which occurred mainly in the aerospace portfolio, was tempered by downward credit migration within the sovereign, utilities and light manufacturing portfolios. In comparison, in 2013 we had downward credit migration which resulted in a provision charge.
For a breakdown of the provision for (reversal of) credit losses, refer to Table 4 in Supplemental Information.
Claims-Related Expenses
Claims-related expenses totalled $117 million in 2014, a decrease of $42 million from 2013. The reduction in our recoverable insurance claims in both years was mainly related to losses in our political risk insurance program; however, the impact was less significant in 2014 when compared to 2013.
(in millions of Canadian dollars) 2014 2013
Claims paid 62 56
Claims paid – reinsured policies 10 5
Claims recovered (12) (10)
Claims recovered – reinsured policies (1) –
Actuarial increase/(decrease) in the net allowance for claims (9) 1
Decrease in recoverable insurance claims 66 105
Claims handling expenses 1 2
Total claims-related expenses $117 $159
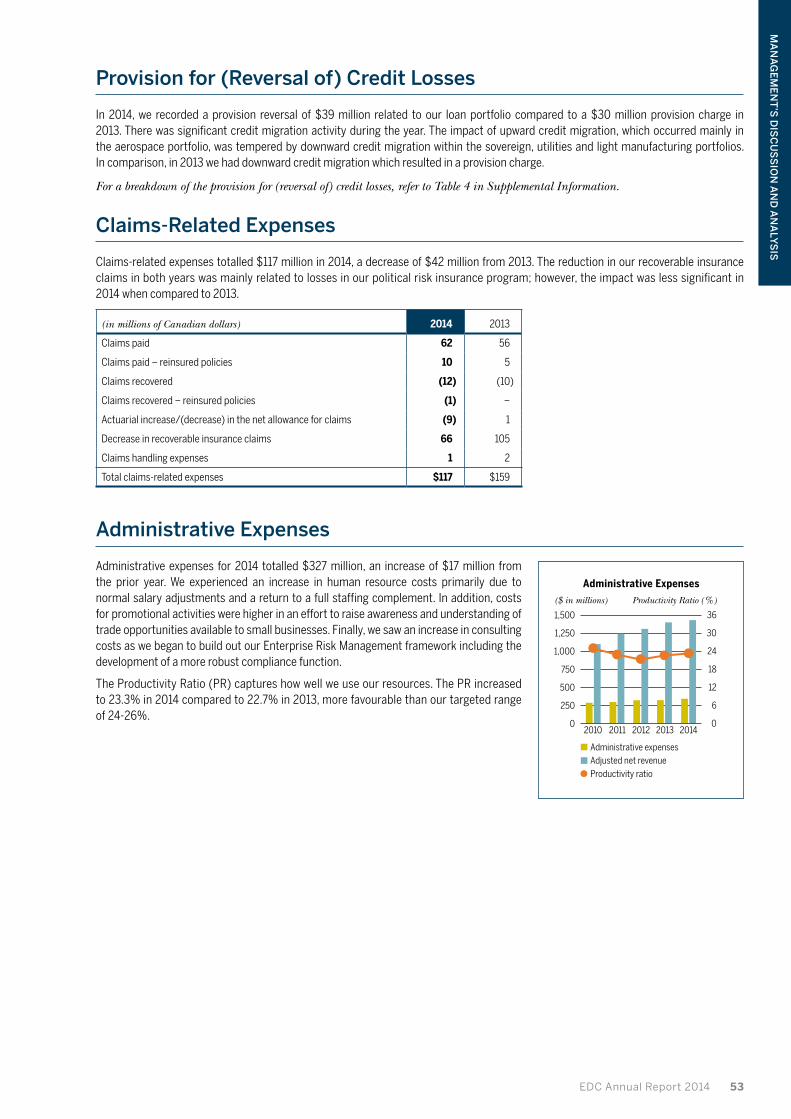
Administrative Expenses
Administrative expenses for 2014 totalled $327 million, an increase of $17 million from the prior year. We experienced an increase in human resource costs primarily due to normal salary adjustments and a return to a full staffing complement. In addition, costs for promotional activities were higher in an effort to raise awareness and understanding of trade opportunities available to small businesses. Finally, we saw an increase in consulting costs as we began to build out our Enterprise Risk Management framework including the development of a more robust compliance function.
The Productivity Ratio (PR) captures how well we use our resources. The PR increased to 23.3% in 2014 compared to 22.7% in 2013, more favourable than our targeted range of 24-26%.
1,500
1,250
1,000
750
500
250
020142010 2011 2012 2013
36
30
24
18
12
6
0
($ in millions)
Productivity Ratio (%)
Administrative expensesAdjusted net revenueProductivity ratio
Administrative Expenses
54 Reaching For Our Export Potential
management’s discussion and analysis
Financial ConditionStatement of Financial Position Summary
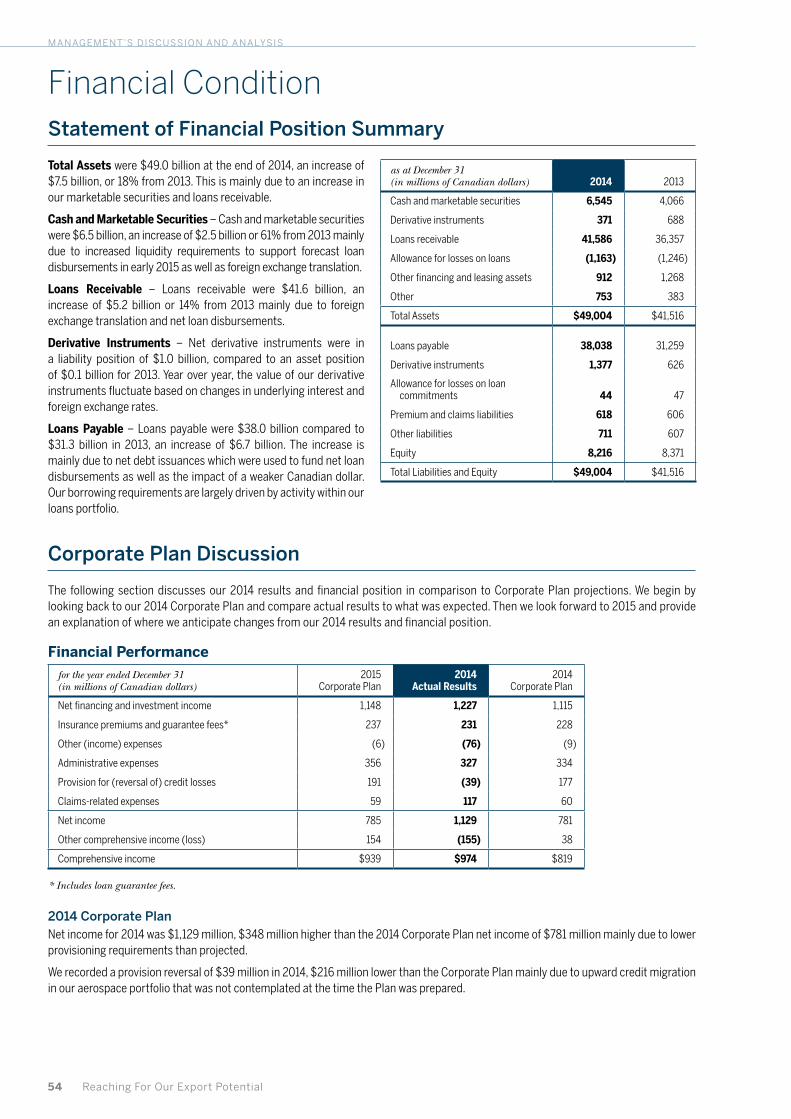
Total Assets were $49.0 billion at the end of 2014, an increase of $7.5 billion, or 18% from 2013. This is mainly due to an increase in our marketable securities and loans receivable.
Cash and Marketable Securities – Cash and marketable securities were $6.5 billion, an increase of $2.5 billion or 61% from 2013 mainly due to increased liquidity requirements to support forecast loan disbursements in early 2015 as well as foreign exchange translation.
Loans Receivable – Loans receivable were $41.6 billion, an increase of $5.2 billion or 14% from 2013 mainly due to foreign exchange translation and net loan disbursements.
Derivative Instruments – Net derivative instruments were in a liability position of $1.0 billion, compared to an asset position of $0.1 billion for 2013. Year over year, the value of our derivative instruments fluctuate based on changes in underlying interest and foreign exchange rates.
Loans Payable – Loans payable were $38.0 billion compared to $31.3 billion in 2013, an increase of $6.7 billion. The increase is mainly due to net debt issuances which were used to fund net loan disbursements as well as the impact of a weaker Canadian dollar. Our borrowing requirements are largely driven by activity within our loans portfolio.
Corporate Plan Discussion
The following section discusses our 2014 results and financial position in comparison to Corporate Plan projections. We begin by looking back to our 2014 Corporate Plan and compare actual results to what was expected. Then we look forward to 2015 and provide an explanation of where we anticipate changes from our 2014 results and financial position.
Financial Performancefor the year ended December 31 (in millions of Canadian dollars)
2015 Corporate Plan
2014 Actual Results
2014 Corporate Plan
Net financing and investment income 1,148 1,227 1,115
Insurance premiums and guarantee fees* 237 231 228
Other (income) expenses (6) (76) (9)
Administrative expenses 356 327 334
Provision for (reversal of) credit losses 191 (39) 177
Claims-related expenses 59 117 60
Net income 785 1,129 781
Other comprehensive income (loss) 154 (155) 38
Comprehensive income $939 $974 $819
* Includes loan guarantee fees.
2014 Corporate Plan Net income for 2014 was $1,129 million, $348 million higher than the 2014 Corporate Plan net income of $781 million mainly due to lower provisioning requirements than projected.
We recorded a provision reversal of $39 million in 2014, $216 million lower than the Corporate Plan mainly due to upward credit migration in our aerospace portfolio that was not contemplated at the time the Plan was prepared.
as at December 31 (in millions of Canadian dollars) 2014 2013
Cash and marketable securities 6,545 4,066
Derivative instruments 371 688
Loans receivable 41,586 36,357
Allowance for losses on loans (1,163) (1,246)
Other financing and leasing assets 912 1,268
Other 753 383
Total Assets $49,004 $41,516
Loans payable 38,038 31,259
Derivative instruments 1,377 626
Allowance for losses on loan commitments 44 47
Premium and claims liabilities 618 606
Other liabilities 711 607
Equity 8,216 8,371
Total Liabilities and Equity $49,004 $41,516
EDC Annual Report 2014 55
Ma
na
ge
Me
nt
’s D
isc
us
sio
n a
nD
an
aly
sis
Other items of note are as follows:
› Net financing and investment income was $112 million higher than the 2014 Corporate Plan mainly the result of a weaker Canadian dollar in relation to the U.S. dollar than anticipated in the Plan.
› Other income was $67 million higher than the Corporate Plan mainly due to the sale of the aircraft and component parts as discussed previously.
› Claims-related expenses were $57 million higher than planned as a result of a greater reduction in the recoverable insurance claims than projected.
› We recorded a $155 million other comprehensive loss in 2014 due to a decline in the discount rate used to value our pension obligations. In comparison the Plan had anticipated that the discount rate would go up at the end of 2014 and as a result projected other comprehensive income of $38 million.
› The productivity ratio of 23.3% for 2014 was more favourable than the 2014 Corporate Plan projection of 24.7%. The improvement is primarily due to the gain on sale of aircraft and component parts that was not anticipated at the time the Plan was prepared.
2015 Corporate Plan Net income for 2015 is planned to be $785 million, $344 million less than 2014 primarily due to higher provisioning requirements as we do not expect the 2014 level of positive credit migration to reoccur.
Other items of note are as follows:
› Net financing and investment income is projected to be $79 million lower than 2014 mainly due to an increase in interest expense as a result of lower revenue generated on our capital related currency swaps. We expect this revenue to decline as we are projecting:
› a decline in our capital position; and
› a decrease in the spread between the Canadian dollar rates applicable to the receivable component of the swaps and the U.S. dollar rates applicable to the payable component.
› Other income is expected to be $70 million lower, mainly because our 2014 results included gains on the sale of aircraft and component parts.
› Claims-related expenses are projected to be $58 million lower as we are not anticipating the same level of write-downs in recoverable insurance claims.
› Administrative expenses are expected to increase by $29 million primarily due to increased costs related to human resources, systems and promotional activities.
› Human resources costs will be higher mainly as a result of additional pension costs as we are projecting a reduction in the discount rate that is used to value our pension obligation;
› We are undergoing a large scale transformation effort to modernize our legacy systems which involves additional spending over and above our regular system costs; and
› Our investment in promotional activities is increasing in an effort to raise awareness and understanding among Canadian exporters, especially among small and medium-sized businesses, of the benefits of trade and the EDC tools available to them.
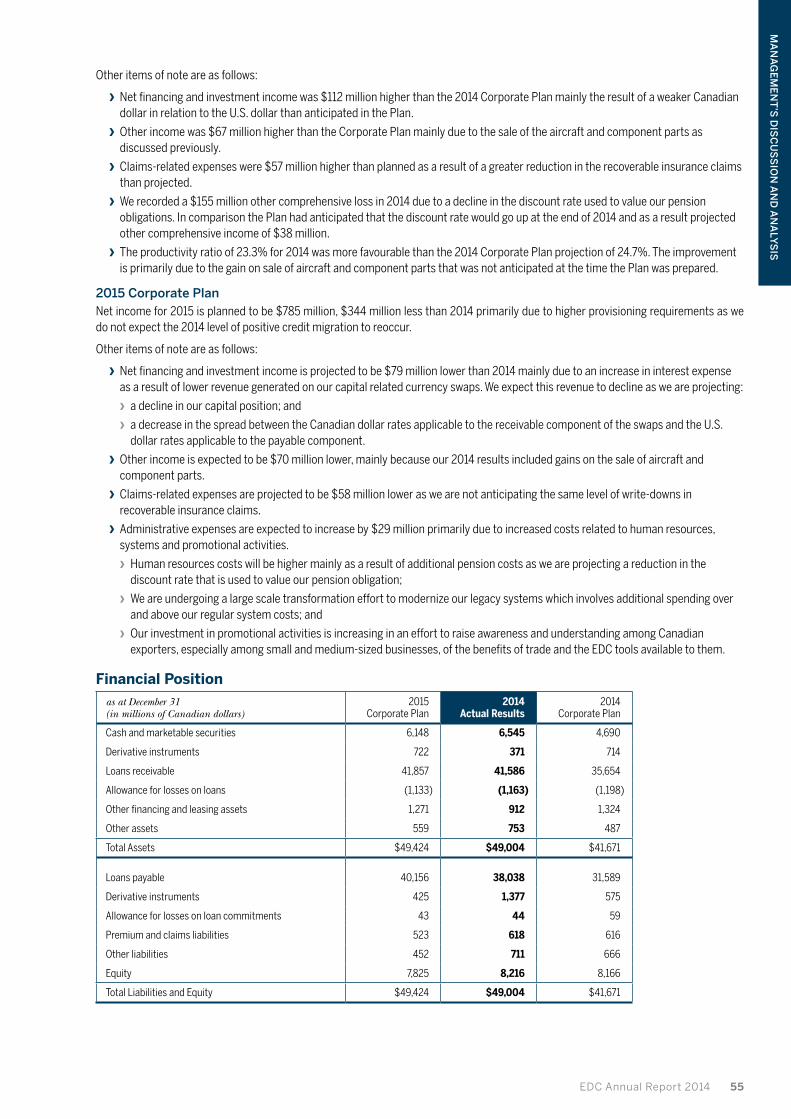
Financial Position as at December 31 (in millions of Canadian dollars)
2015 Corporate Plan
2014 Actual Results
2014 Corporate Plan
Cash and marketable securities 6,148 6,545 4,690
Derivative instruments 722 371 714
Loans receivable 41,857 41,586 35,654
Allowance for losses on loans (1,133) (1,163) (1,198)
Other financing and leasing assets 1,271 912 1,324
Other assets 559 753 487
Total Assets $49,424 $49,004 $41,671
Loans payable 40,156 38,038 31,589
Derivative instruments 425 1,377 575
Allowance for losses on loan commitments 43 44 59
Premium and claims liabilities 523 618 616
Other liabilities 452 711 666
Equity 7,825 8,216 8,166
Total Liabilities and Equity $49,424 $49,004 $41,671

56 Reaching For Our Export Potential
management’s discussion and analysis
2014 Corporate Plan Loans receivable totalled $41.6 billion at the end of 2014, $5.9 billion higher than Corporate Plan primarily as a result of a weaker Canadian dollar and a higher 2013 ending loans receivable balance than contemplated in the Corporate Plan. Loans payable for 2014 were $6.4 billion higher than projected in the Corporate Plan as a result of the funding required for the increase in loans receivable and foreign exchange translation.
2015 Corporate Plan The Corporate Plan is projecting loans receivable to be $41.9 billion at the end of 2015, a slight increase over December 31, 2014. Loans receivable for 2015 were projected using a forecast 2014 loans receivable position as the starting point. At the time of preparing the 2015 Corporate Plan, loans receivable were projected to grow in 2014 by $3.1 billion as a result of new business and foreign exchange translation, resulting in loans receivable of $39.4 billion. However, actual results for 2014 were higher than this forecast position, mainly as a result of foreign exchange translation as the Canadian dollar further weakened after the Corporate Plan was prepared. Consequently, it is likely that both loans receivable and net financing and investment income will be higher in 2015 than projected in the Corporate Plan.
Portfolio Exposures and Credit Quality
Concentration of Exposure EDC’s total exposure at the end of 2014 was $94.8 billion, an increase of $7.9 billion from 2013 mainly due to growth in our financing portfolio. The majority of the exposure was within the United States (23%) and Canada (22%). By industry, our greatest exposures are within the extractive and transportation sectors.
Exposure by Program
as at December 31 (in millions of Canadian dollars) 2014 2013
Financing portfolio:
Financing assets(1) 42,555 37,173
Commitments and guarantees(2) 23,177 22,173
Total financing portfolio 65,732 59,346
Insurance portfolio:
Credit insurance 8,665 8,407
Financial institutions insurance 3,797 4,545
Contract insurance and bonding(3) 8,379 8,322
Political risk insurance 1,564 1,683
Reinsurance ceded(4) (250) (150)
Total insurance portfolio 22,155 22,807
Marketable securities and derivative instruments(5) 6,916 4,754
Total exposure $94,803 $86,907
(1) Includes gross loans receivable, investments and gross investment in aircraft under finance leases.(2) Includes $672 million of investment commitments (2013 – $541 million).(3) Includes $7,284 million of insurance guarantees (2013 – $6,982 million).(4) Represents treaty reinsurance agreements covering most bonding obligors and the credit insurance
portfolio, including most foreign bank exposures.(5) Includes cash.
For a detailed breakdown of the major concentrations of total gross exposure by geographical market and industry, refer to Tables 5 and 6 in Supplemental Information.
Financing Portfolio
loans PortfolioWe enable Canadian exports and Canadian investments abroad by providing financing solutions to Canadian exporters and their foreign customers, to Canadian investors and to financial institutions. Not only do we provide solutions for exporters with existing contracts, we also proactively identify potential procurement needs for large foreign buyers as well as large foreign projects and provide financing in order to develop opportunities for procurement from Canadian companies which we refer to as pull facilities. Our financing products enable Canadian companies to provide their customers with flexible financing. To mitigate credit risk within our loan portfolio, we enter into risk transfer transactions such as unfunded loan participations, credit default swaps and loan default insurance.
Exposure by Geographic Market
53% North America/ Caribbean
17% Europe
11% Asia/Pacific
10% South America/ Central America
9% Middle East/ Africa
30% Extractive
25% Transportation
12% Infrastructure and Environment
10% Financial Institutions
9% Information and Communication Technology
14% Other
Exposure by Industry
EDC Annual Report 2014 57
Ma
na
ge
Me
nt
’s D
isc
us
sio
n a
nD
an
aly
sis
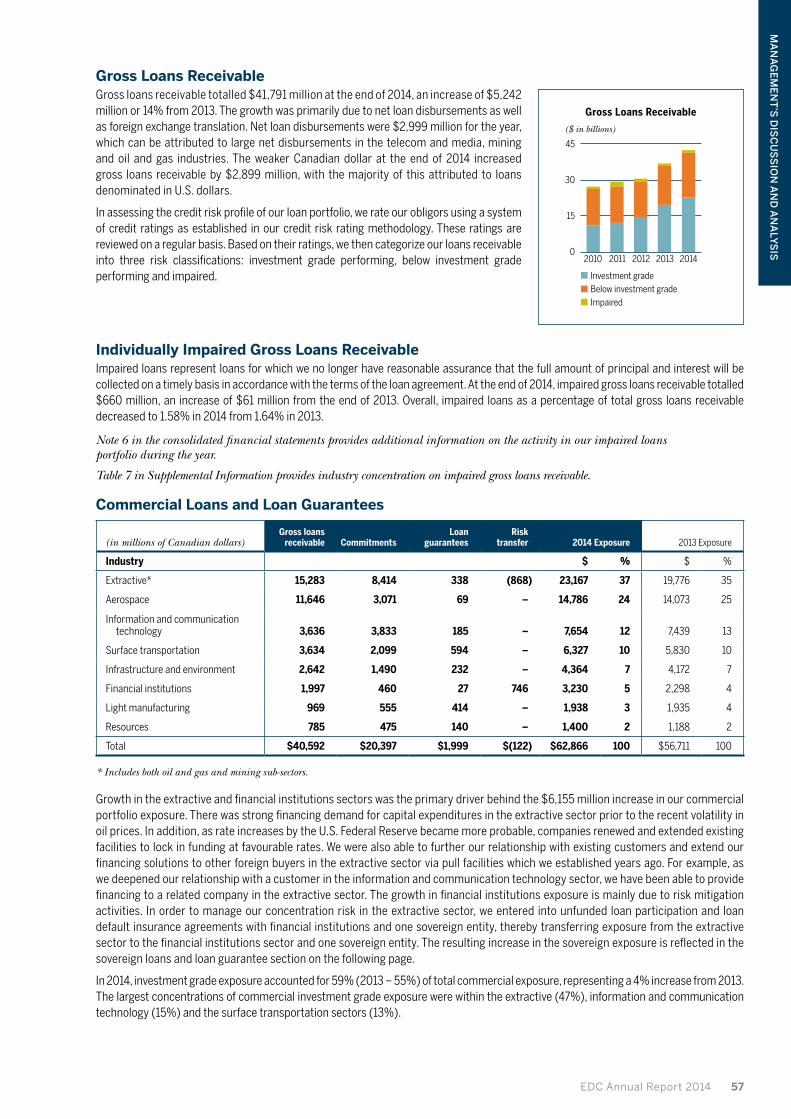
Gross Loans ReceivableGross loans receivable totalled $41,791 million at the end of 2014, an increase of $5,242 million or 14% from 2013. The growth was primarily due to net loan disbursements as well as foreign exchange translation. Net loan disbursements were $2,999 million for the year, which can be attributed to large net disbursements in the telecom and media, mining and oil and gas industries. The weaker Canadian dollar at the end of 2014 increased gross loans receivable by $2,899 million, with the majority of this attributed to loans denominated in U.S. dollars.
In assessing the credit risk profile of our loan portfolio, we rate our obligors using a system of credit ratings as established in our credit risk rating methodology. These ratings are reviewed on a regular basis. Based on their ratings, we then categorize our loans receivable into three risk classifications: investment grade performing, below investment grade performing and impaired.
Individually Impaired Gross Loans ReceivableImpaired loans represent loans for which we no longer have reasonable assurance that the full amount of principal and interest will be collected on a timely basis in accordance with the terms of the loan agreement. At the end of 2014, impaired gross loans receivable totalled $660 million, an increase of $61 million from the end of 2013. Overall, impaired loans as a percentage of total gross loans receivable decreased to 1.58% in 2014 from 1.64% in 2013.
Note 6 in the consolidated financial statements provides additional information on the activity in our impaired loans portfolio during the year.
Table 7 in Supplemental Information provides industry concentration on impaired gross loans receivable.
Commercial Loans and Loan Guarantees
(in millions of Canadian dollars)Gross loans
receivable CommitmentsLoan
guaranteesRisk
transfer 2014 Exposure 2013 Exposure
Industry $ % $ %
Extractive* 15,283 8,414 338 (868) 23,167 37 19,776 35
Aerospace 11,646 3,071 69 – 14,786 24 14,073 25
Information and communication technology 3,636 3,833 185 – 7,654 12 7,439 13
Surface transportation 3,634 2,099 594 – 6,327 10 5,830 10
Infrastructure and environment 2,642 1,490 232 – 4,364 7 4,172 7
Financial institutions 1,997 460 27 746 3,230 5 2,298 4
Light manufacturing 969 555 414 – 1,938 3 1,935 4
Resources 785 475 140 – 1,400 2 1,188 2
Total $40,592 $20,397 $1,999 $(122) $62,866 100 $56,711 100
* Includes both oil and gas and mining sub-sectors.
Growth in the extractive and financial institutions sectors was the primary driver behind the $6,155 million increase in our commercial portfolio exposure. There was strong financing demand for capital expenditures in the extractive sector prior to the recent volatility in oil prices. In addition, as rate increases by the U.S. Federal Reserve became more probable, companies renewed and extended existing facilities to lock in funding at favourable rates. We were also able to further our relationship with existing customers and extend our financing solutions to other foreign buyers in the extractive sector via pull facilities which we established years ago. For example, as we deepened our relationship with a customer in the information and communication technology sector, we have been able to provide financing to a related company in the extractive sector. The growth in financial institutions exposure is mainly due to risk mitigation activities. In order to manage our concentration risk in the extractive sector, we entered into unfunded loan participation and loan default insurance agreements with financial institutions and one sovereign entity, thereby transferring exposure from the extractive sector to the financial institutions sector and one sovereign entity. The resulting increase in the sovereign exposure is reflected in the sovereign loans and loan guarantee section on the following page.
In 2014, investment grade exposure accounted for 59% (2013 – 55%) of total commercial exposure, representing a 4% increase from 2013. The largest concentrations of commercial investment grade exposure were within the extractive (47%), information and communication technology (15%) and the surface transportation sectors (13%).
45
30
15
020142010 2011 2012 2013
($ in billions)
Gross Loans Receivable
Investment gradeBelow investment gradeImpaired
58 Reaching For Our Export Potential
management’s discussion and analysis
Our top five counterparty exposures were within the extractive and aerospace sectors, which collectively represented $7,167 million, or 11%, of the total commercial exposure. Three of these counterparties were in the extractive sector with a total exposure of $3,797 million and two were in the aerospace sector with a total exposure of $3,370 million. From a geographic perspective, these top five counterparty exposures resided with two U.S., one Mexican and two Brazilian counterparties. After considering collateral and other risk mitigation techniques, our exposure to these counterparties was $5,705 million.
Sovereign Loans and Loan Guarantees
(in millions of Canadian dollars)Gross loans
receivable CommitmentsLoan
guaranteesRisk
transfer 2014 Exposure 2013 Exposure
Country $ % $ %
Serbia 286 – – – 286 20 289 20
Ukraine 283 – – – 283 20 311 21
Indonesia 233 – – – 233 16 239 16
Uruguay – – 99 – 99 7 100 7
Argentina 71 – – – 71 5 48 3
Pakistan 66 – – – 66 5 63 4
Rwanda 58 – – – 58 4 80 5
China 35 – – – 35 2 45 3
Egypt 32 – – – 32 2 43 3
Other 135 – 10 122 267 19 252 18
Total $1,199 $– $109 $122 $1,430 100 $1,470 100
Sovereign exposure for 2014 is consistent with 2013 and includes 63% of non-investment grade exposure (2013 – 65%).
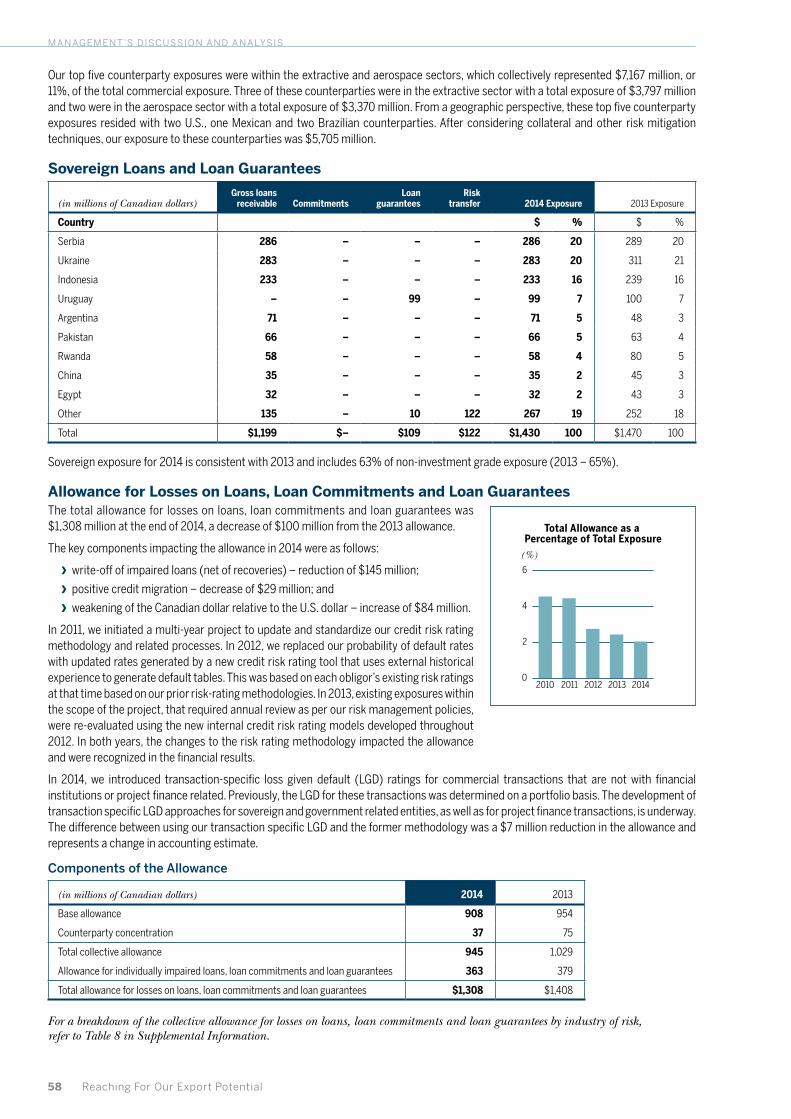
Allowance for Losses on Loans, Loan Commitments and Loan GuaranteesThe total allowance for losses on loans, loan commitments and loan guarantees was $1,308 million at the end of 2014, a decrease of $100 million from the 2013 allowance.
The key components impacting the allowance in 2014 were as follows:
› write-off of impaired loans (net of recoveries) – reduction of $145 million;
› positive credit migration – decrease of $29 million; and
› weakening of the Canadian dollar relative to the U.S. dollar – increase of $84 million.
In 2011, we initiated a multi-year project to update and standardize our credit risk rating methodology and related processes. In 2012, we replaced our probability of default rates with updated rates generated by a new credit risk rating tool that uses external historical experience to generate default tables. This was based on each obligor’s existing risk ratings at that time based on our prior risk-rating methodologies. In 2013, existing exposures within the scope of the project, that required annual review as per our risk management policies, were re-evaluated using the new internal credit risk rating models developed throughout 2012. In both years, the changes to the risk rating methodology impacted the allowance and were recognized in the financial results.
In 2014, we introduced transaction-specific loss given default (LGD) ratings for commercial transactions that are not with financial institutions or project finance related. Previously, the LGD for these transactions was determined on a portfolio basis. The development of transaction specific LGD approaches for sovereign and government related entities, as well as for project finance transactions, is underway. The difference between using our transaction specific LGD and the former methodology was a $7 million reduction in the allowance and represents a change in accounting estimate.
Components of the Allowance
(in millions of Canadian dollars) 2014 2013
Base allowance 908 954
Counterparty concentration 37 75
Total collective allowance 945 1,029
Allowance for individually impaired loans, loan commitments and loan guarantees 363 379
Total allowance for losses on loans, loan commitments and loan guarantees $1,308 $1,408
For a breakdown of the collective allowance for losses on loans, loan commitments and loan guarantees by industry of risk, refer to Table 8 in Supplemental Information.
6
4
2
020142010 2011 2012 2013
(%)
Total Allowance as a Percentage of Total Exposure

EDC Annual Report 2014 59
Ma
na
ge
Me
nt
’s D
isc
us
sio
n a
nD
an
aly
sis
Base AllowanceWe classify our performing exposure into categories based on obligor credit rating, industry of risk for commercial obligors and whether the exposure is secured. For exposures that are secured by collateral or subject to other risk mitigation measures, such as unfunded loan participations and loan default insurance, the exposure for each obligor is reduced by the fair value of collateral adjusted for estimated repossession costs or the amount of risk mitigation as applicable. Based on these exposures we determine the appropriate base allowance. Probability of default and loss given default are estimated based on historical loan loss rates, residual value, expert judgement, management assumption or model-based approaches.
Allowance OverlaysIn addition to the base allowance, we add overlays as necessary to the collective allowance. A concentration overlay is added to reflect the additional risk that we assume when our exposure to a specific counterparty is over a certain threshold. Market overlays are also established to take into consideration that current financial uncertainties are not always reflected in current credit ratings. The overlays are more fully explained in the following sections:
Counterparty Concentration OverlayA concentration component is added to adequately provision for sovereign and commercial counterparties whose level of exposure is deemed by management to represent an increased amount of risk. A counterparty whose exposure exceeds 10% of our equity based on the previous year’s audited financial statements will attract a concentration component calculated on the portion of exposure over the threshold. The allowance on this portion of exposure is calculated on the same basis as the base allowance for that counterparty.
We had a concentration overlay of $37 million at the end of 2014 compared to $75 million a year earlier. The decrease is mainly due to positive credit migration in the aerospace sector in 2014. The aerospace sector represents 81% of the concentration overlay (2013 – 95% aerospace).
Market OverlaysMarket overlays are added to our allowance as required to reflect the risk that the impact of recent economic events is not fully captured in current credit ratings. At the end of 2014, we determined that the current credit ratings appropriately captured the risk in the economy, and thus no market overlays were required.
Individual AllowancesWe establish allowances for individually impaired loans, loan commitments and loan guarantees to recognize impairment losses. Individual allowances were $363 million at the end of 2014, a decrease of $16 million from 2013 due to reduced exposure in our impaired loan guarantee portfolio.
investmentsEDC plays a role in helping Canadian companies access capital and financing. We maintain a portfolio of venture capital and private equity investments focused on promising Canadian late-stage start-ups or established small and mid-sized entities to aid these companies in growing and expanding beyond the Canadian border. In addition, we invest offshore with an emphasis on emerging markets where such investments can serve to facilitate the connection of Canadian business activity to international markets. Our investments are made both directly into Canadian businesses and into funds which in turn invest in Canadian or foreign businesses. With the goal of growing Canadian exporters and facilitating foreign business connections, investments are normally held for periods greater than five years. Divestitures are generally made through the sale of our investment interests through private sales to third parties or sales on public markets.
Consistent with our business goal of growing investments, our exposure increased by $283 million to $1,361 million in 2014 largely as a result of new commitments. During the year, we signed an additional $278 million of investment arrangements (2013 – $217 million).
Refer to Table 9 in Supplemental Information for a breakdown of exposure for our investments.
Equipment Available for lease and Assets Held-for-SaleEquipment available for lease consists of aircraft that were returned to us because of default under the related obligors’ loan agreements. While it is not EDC’s intent in the ordinary course of business to act as a lessor, we do engage in leasing activities for asset management purposes to maximize recoveries on returned aircraft and minimize potential losses.
In 2014, 8 CRJ900 aircraft valued at $89 million, 18 CRJ200 aircraft valued at $34 million and 28 Q400 aircraft and two engines valued at $348 million were reclassified out of the equipment available for lease portfolio to the held-for-sale portfolio.
All 8 CRJ900s, 10 of the 18 CRJ200s and other component parts were sold in 2014 resulting in gains of $53 million, the impact of which is included in other (income) expenses. These gains reflect the difference between the sale proceeds and the carrying value of the aircraft at the time of the sale.
The sale of the remaining 8 CRJ200s, 28 Q400s and two engines is anticipated to occur in 2015. These aircraft and two engines are carried at $364 million in our held-for-sale portfolio. At the end of 2014 there were no aircraft remaining in the equipment available for lease portfolio.

60 Reaching For Our Export Potential
management’s discussion and analysis
Aircraft Under finance leasesWe have 13 aircraft on long-term lease with one obligor in the aerospace industry in the United States. These aircraft were returned to us as a result of loan defaults by this obligor. Under the terms of a restructuring agreement, these aircraft were subsequently leased back to this obligor and classified as finance leases. Our gross investment in these finance leases is $75 million (2013 – $87 million). This exposure is below investment grade.
Insurance PortfolioCredit insurance facilitates export growth by mitigating risk, providing companies with the confidence to do business abroad knowing that their receivables will be paid should their buyer default on payment. It also enhances their cash flow as banks are generally comfortable providing additional support when their customers’ foreign receivables are insured.
Financial institutions insurance provides coverage to Canadian banks for foreign bank and foreign buyer counterparty risk in trade transactions.
EDC’s bonding products are delivered through partnerships with banks and surety companies. Our performance security and surety bond products are used by exporters primarily to guarantee their contract performance, which helps free up working capital. Our partnerships with banks and surety companies help them mitigate their risks and make it easier for exporters to obtain the coverage they need. We provide contract frustration insurance coverage to protect against commercial and political risks resulting from buyer non-payment associated with a specific contract.
As companies diversify their supply and distribution networks and expand into new markets, they are often exposed to political risks that can result in significant losses. This is particularly true of emerging markets, where political events could adversely impact a company’s foreign operations. EDC’s political risk insurance provides peace of mind to companies and their financial intermediaries that, when faced with such risks, their assets will be protected, enabling them to take advantage of export and investment opportunities in emerging markets.
The assistance that EDC provides to our policyholders within our four primary insurance programs is counted in various ways. Under the credit insurance and financial institutions insurance programs, the policyholder declares their sales volume to entities covered by their policy. These declarations are counted as business facilitated for this program. Within our contract insurance and bonding program, a facility is established and the policyholder makes requests for cover to initiate specific coverage. These requests represent business facilitated by EDC. As transactions are signed within our political risk insurance program, they are also counted as business facilitated.
In addition to directly underwriting insurance policies, we assume exposure from other insurers to fulfill our mandate to support Canadian exporters. We also cede reinsurance to other insurance companies to mitigate our risk. The ceding arrangements provide greater diversification of the business and minimize the net loss potential arising from large exposures.
Insurance in ForceOur liability associated with outstanding insurance policies and guarantees is referred to as insurance in force and exposure throughout this annual report.
Insurance in force totalled $22,155 million at the end of 2014, compared to the 2013 level of $22,807 million.
Exposure under the credit insurance program totalled $8,665 million at the end of 2014, an increase of 3% compared to 2013, which was mainly the result of foreign exchange fluctuations. The following table provides a breakdown of credit insurance exposure by industry:
(in millions of Canadian dollars) 2014 Exposure 2013 Exposure
Industry $ % $ %
Extractive 2,423 28 2,782 33
Resources 1,945 23 1,788 21
Light manufacturing 1,361 16 1,092 13
Transportation 1,330 15 1,222 15
Infrastructure and environment 989 11 777 9
Information and communication technology 617 7 746 9
Total $8,665 100 $8,407 100
The following charts show the exposure by geographic market for our financial institutions and political risk insurance programs:
29% Asia/Pacific
29% Europe
19% South America/ Central America
18% North America/ Caribbean
5% Middle East/ Africa
Financial Institutions InsuranceExposure by Geographic Market
31% South America/ Central America
27% Middle East/ Africa
23% North America/ Caribbean
15% Asia/Pacific
4% Europe
Political Risk InsuranceExposure by Geographic Market

EDC Annual Report 2014 61
Ma
na
ge
Me
nt
’s D
isc
us
sio
n a
nD
an
aly
sis
Claims
(in millions of Canadian dollars) 2014 2013
Claims paid 72 61
Claims recovered (13) (10)
Net claims $59 $51
Claim payments totalled $72 million in 2014 and were comprised of 636 claims related to losses in 65 countries (2013 – 726 claims in 70 countries). In 2014, the largest concentration of claim payments was in North America while in 2013 the largest concentration of claim payments was in the Middle East. Claim payments increased in 2014 for claims submitted in our credit insurance program.
In 2014, we recovered $14 million in total (2013 – $11 million) of which $1 million was disbursed to exporters (2013 – $1 million).
Claims Paid by Exporters’ Insured Sector
(in millions of Canadian dollars) 2014 2013
$ % $ %
Infrastructure and environment 27 37 33 55
Resources 26 36 18 30
Light manufacturing 7 10 6 10
Information and communication technology 5 7 2 3
Financial institutions 3 4 – –
Extractive 2 3 1 1
Transportation 2 3 1 1
Claims paid $72 100 $61 100
During 2014, there were 1,002 claims submitted to EDC for consideration, compared to 1,272 claims submitted in 2013.
At the end of 2014, the value of claims requests that were still under consideration was $12 million (2013 – $30 million).
For a breakdown of claims by size concentration, refer to Table 10 in Supplemental Information.
Premium and Claims LiabilitiesPremium and claims liabilities represent our estimate of future claims under the terms and conditions of our insurance policies.
At the end of 2014, the premium and claims liabilities were $618 million. The liability net of the reinsurers’ share was $530 million, an increase of $17 million from 2013. The main factor for the increase was heightened risk in our political risk insurance portfolio. This was tempered by the impact of new frequency assumptions used in the calculation of the net allowance for claims on our political risk insurance portfolio. The difference between using the new assumptions and the former assumptions is a change in accounting estimate and resulted in a $79 million reduction in the allowance.
Potential claims on insurance policies that we have ceded to reinsurance companies were $88 million compared to $93 million in 2013. This amount, recorded as an asset on the consolidated statement of financial position, represents the reinsurers’ share of our premium and claims liabilities and is also included in our premium and claims liabilities. If we were required to pay out a claim on these policies we could recover from the reinsurer depending on the terms of the agreement.
The net premium and claims liabilities as a percentage of the insurance in force was 2.4% in 2014 (2013 – 2.3%).
500
400
300
200
100
020142010 2011 2012 2013
($ in millions)
Claims submittedClaims paidClaims under consideration
Claims Submitted, Paidand Under Consideration
4
3
2
1
020142010 2011 2012 2013
(%)
Premium and Claims Liabilitiesas a % of Insurance in Force
(Net of Reinsurance)
62 Reaching For Our Export Potential
management’s discussion and analysis
As permitted by International Financial Reporting Standard 7 – Financial Instruments: Disclosures, we have shaded certain parts of our Management’s Discussion and Analysis which discuss the nature, extent and management of credit, liquidity and market risks. These disclosures form an integral part of our audited Consolidated Financial Statements for the year ended December 31, 2014.
Marketable Securities and Derivative InstrumentsOur policies and procedures, which are reviewed periodically, are designed to limit and manage credit risk associated with marketable securities and derivative instruments. These policies and procedures define the minimum acceptable counterparty rating in alignment with the Minister of Finance Financial Risk Management Guidelines for Crown Corporations. In addition, we have policies which are reviewed periodically and procedures that establish credit limits for each counterparty, which are reviewed by management no less than annually. These policies and procedures are designed to limit and manage the credit risk associated with these financial instruments.
Our interest-bearing deposits and marketable securities portfolio expose us to the risk that the deposit-taking institutions or counterparty will not repay us in accordance with contractual terms. Our potential deposit and marketable securities credit exposure is represented by the carrying value of the financial instruments.
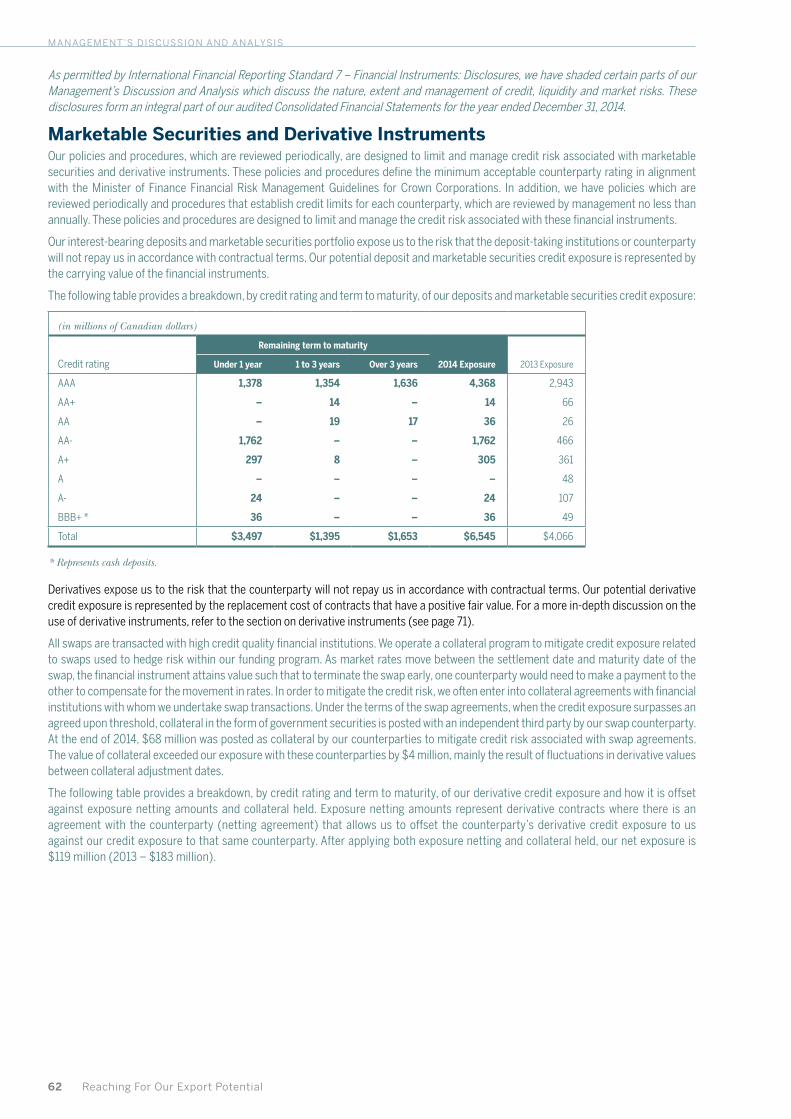
The following table provides a breakdown, by credit rating and term to maturity, of our deposits and marketable securities credit exposure:
(in millions of Canadian dollars)
Remaining term to maturity
2014 Exposure 2013 Exposure Credit rating Under 1 year 1 to 3 years Over 3 years
AAA 1,378 1,354 1,636 4,368 2,943
AA+ – 14 – 14 66
AA – 19 17 36 26
AA- 1,762 – – 1,762 466
A+ 297 8 – 305 361
A – – – – 48
A- 24 – – 24 107
BBB+ * 36 – – 36 49
Total $3,497 $1,395 $1,653 $6,545 $4,066
* Represents cash deposits.
Derivatives expose us to the risk that the counterparty will not repay us in accordance with contractual terms. Our potential derivative credit exposure is represented by the replacement cost of contracts that have a positive fair value. For a more in-depth discussion on the use of derivative instruments, refer to the section on derivative instruments (see page 71).
All swaps are transacted with high credit quality financial institutions. We operate a collateral program to mitigate credit exposure related to swaps used to hedge risk within our funding program. As market rates move between the settlement date and maturity date of the swap, the financial instrument attains value such that to terminate the swap early, one counterparty would need to make a payment to the other to compensate for the movement in rates. In order to mitigate the credit risk, we often enter into collateral agreements with financial institutions with whom we undertake swap transactions. Under the terms of the swap agreements, when the credit exposure surpasses an agreed upon threshold, collateral in the form of government securities is posted with an independent third party by our swap counterparty. At the end of 2014, $68 million was posted as collateral by our counterparties to mitigate credit risk associated with swap agreements. The value of collateral exceeded our exposure with these counterparties by $4 million, mainly the result of fluctuations in derivative values between collateral adjustment dates.
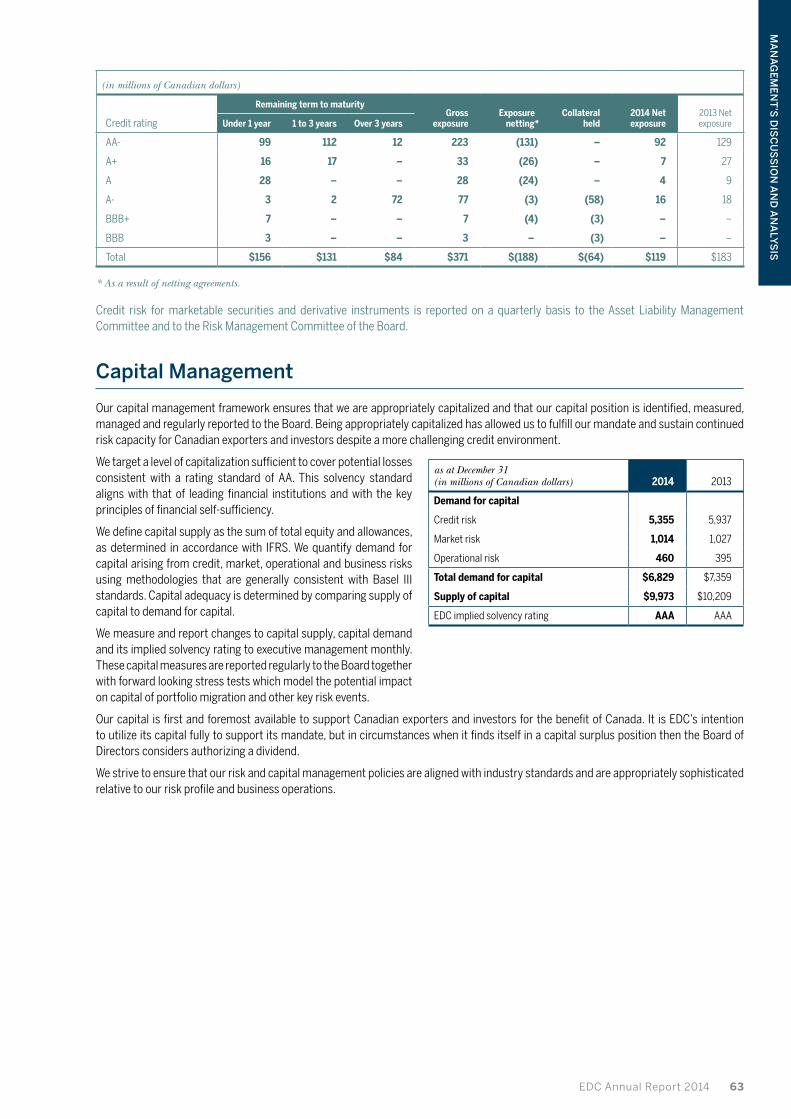
The following table provides a breakdown, by credit rating and term to maturity, of our derivative credit exposure and how it is offset against exposure netting amounts and collateral held. Exposure netting amounts represent derivative contracts where there is an agreement with the counterparty (netting agreement) that allows us to offset the counterparty’s derivative credit exposure to us against our credit exposure to that same counterparty. After applying both exposure netting and collateral held, our net exposure is $119 million (2013 – $183 million).
EDC Annual Report 2014 63
Ma
na
ge
Me
nt
’s D
isc
us
sio
n a
nD
an
aly
sis
(in millions of Canadian dollars)
Remaining term to maturityGross
exposureExposure
netting*Collateral
held2014 Net exposure
2013 Net exposureCredit rating Under 1 year 1 to 3 years Over 3 years
AA- 99 112 12 223 (131) – 92 129
A+ 16 17 – 33 (26) – 7 27
A 28 – – 28 (24) – 4 9
A- 3 2 72 77 (3) (58) 16 18
BBB+ 7 – – 7 (4) (3) – –
BBB 3 – – 3 – (3) – –
Total $156 $131 $84 $371 $(188) $(64) $119 $183
* As a result of netting agreements.
Credit risk for marketable securities and derivative instruments is reported on a quarterly basis to the Asset Liability Management Committee and to the Risk Management Committee of the Board.
Capital Management
Our capital management framework ensures that we are appropriately capitalized and that our capital position is identified, measured, managed and regularly reported to the Board. Being appropriately capitalized has allowed us to fulfill our mandate and sustain continued risk capacity for Canadian exporters and investors despite a more challenging credit environment.
We target a level of capitalization sufficient to cover potential losses consistent with a rating standard of AA. This solvency standard aligns with that of leading financial institutions and with the key principles of financial self-sufficiency.
We define capital supply as the sum of total equity and allowances, as determined in accordance with IFRS. We quantify demand for capital arising from credit, market, operational and business risks using methodologies that are generally consistent with Basel III standards. Capital adequacy is determined by comparing supply of capital to demand for capital.
We measure and report changes to capital supply, capital demand and its implied solvency rating to executive management monthly. These capital measures are reported regularly to the Board together with forward looking stress tests which model the potential impact on capital of portfolio migration and other key risk events.
Our capital is first and foremost available to support Canadian exporters and investors for the benefit of Canada. It is EDC’s intention to utilize its capital fully to support its mandate, but in circumstances when it finds itself in a capital surplus position then the Board of Directors considers authorizing a dividend.
We strive to ensure that our risk and capital management policies are aligned with industry standards and are appropriately sophisticated relative to our risk profile and business operations.
as at December 31(in millions of Canadian dollars) 2014 2013
Demand for capital
Credit risk 5,355 5,937
Market risk 1,014 1,027
Operational risk 460 395
Total demand for capital $6,829 $7,359
Supply of capital $9,973 $10,209
EDC implied solvency rating AAA AAA
64 Reaching For Our Export Potential
management’s discussion and analysis
Off Balance Sheet Arrangements
In the normal course of business, we engage in a variety of transactions with structured entities (SEs). SEs are generally created for a single purpose, have a limited lifespan and are used for risk management, legal or taxation reasons to hold specific assets for its benefactors. These transactions are generally undertaken for risk, capital and funding management purposes that benefit our clients. In accordance with IFRS, those SEs where we are not exposed, or have rights, to variable returns from our involvement with the SE and do not have decision-making power to affect the returns of the SE, have not been consolidated on our statement of financial position.
In certain financing transactions, SEs are used to securitize assets and are typically highly debt-leveraged and, in certain circumstances, equity guarantees may also be used. EDC may also use SEs to hold assets that have been foreclosed upon and cannot be held directly for legal or taxation reasons, typically for foreclosed assets in foreign countries. Refer to Note 31 for further details.
Financial Instruments
Given the nature of our business, our assets and liabilities are substantially composed of financial instruments. Financial instrument assets include cash resources, securities, investments, loans and recoverable insurance claims, while financial instrument liabilities include accounts payable, loans and loan guarantees. We also use a variety of derivative instruments including interest rate swaps, cross currency interest rate swaps, foreign exchange swaps, foreign exchange forwards and credit default swaps.
In accordance with IFRS, the majority of financial instruments are recognized on the statement of financial position at their fair value. These financial instruments include marketable securities at fair value through profit or loss, investments at fair value through profit or loss, derivative instruments, loans payable designated at fair value through profit or loss and recoverable insurance claims. Note 2 of the consolidated financial statements outlines the accounting treatment for our financial instruments, while Note 29 provides details of how their fair values are determined.
We use derivatives to manage interest rate risk, foreign exchange risk and credit risk. These derivatives are only contracted with creditworthy counterparties in accordance with policies established in the Risk Management Office and approved by our Board of Directors. Both our internal policies and guidelines and those set by the Minister of Finance limit our use of derivatives. We do not use derivatives for speculative purposes. We manage our exposure to derivative counterparty credit risk by contracting only with creditworthy counterparties, and in certain cases entering into collateral agreements with those counterparties. For further discussion on our risk management framework, refer to the Risk Management discussion on the following pages.
EDC Annual Report 2014 65
Ma
na
ge
Me
nt
’s D
isc
us
sio
n a
nD
an
aly
sis
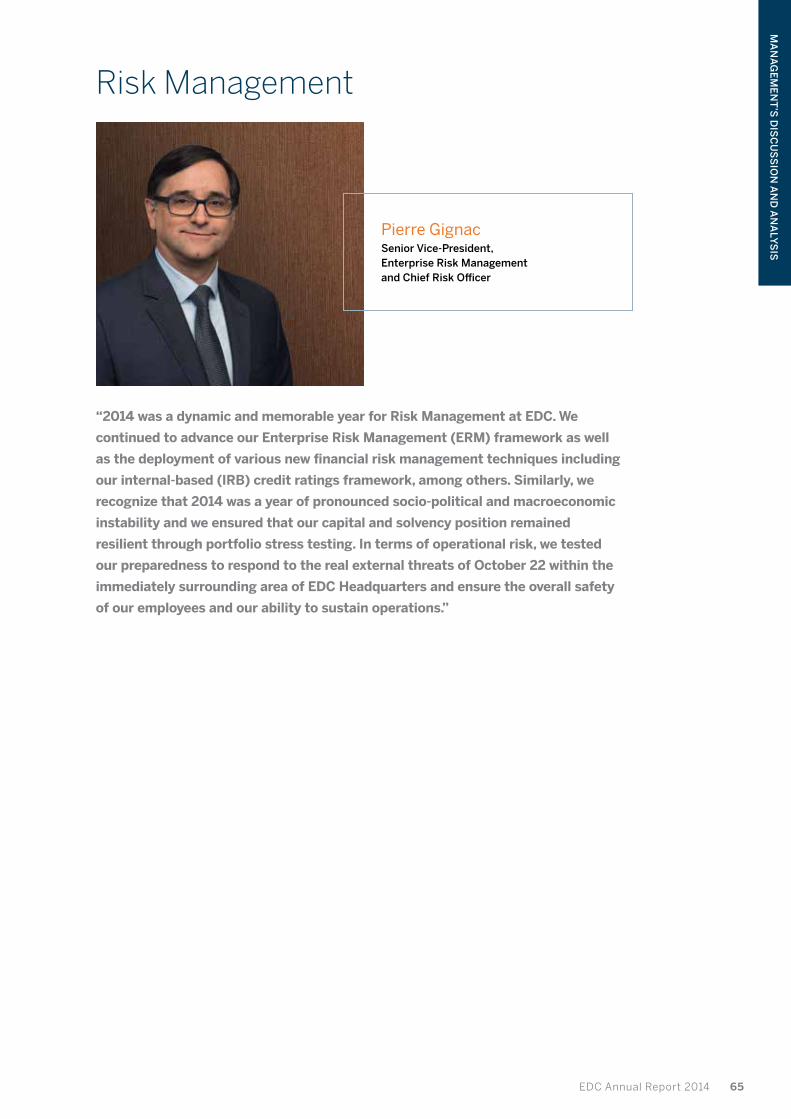
“2014 was a dynamic and memorable year for Risk Management at EDC. We
continued to advance our Enterprise Risk Management (ERM) framework as well
as the deployment of various new financial risk management techniques including
our internal-based (IRB) credit ratings framework, among others. Similarly, we
recognize that 2014 was a year of pronounced socio-political and macroeconomic
instability and we ensured that our capital and solvency position remained
resilient through portfolio stress testing. In terms of operational risk, we tested
our preparedness to respond to the real external threats of October 22 within the
immediately surrounding area of EDC Headquarters and ensure the overall safety
of our employees and our ability to sustain operations.”
Risk Management
Pierre gignacSenior Vice-President, Enterprise Risk Management and Chief Risk Officer
66 Reaching For Our Export Potential
management’s discussion and analysis
Risk Management Overview
Our business activities expose us to a wide variety of risks including financial, operational and strategic risks. Our ability to manage these risks is a key competency within the organization, and is supported by a strong risk culture and an effective risk management approach. We manage our risks by seeking to ensure that business activities and transactions provide an appropriate balance of return for the risks assumed and remain within our risk tolerance.
Our Risk Management practice sets out the major risk categories and identifies and defines a broad number of risks to which our businesses and operations could be exposed. This gives us an overall view of all potential risks faced by EDC; and forms the foundation for appropriate risk oversight processes, communication and reporting.
Risk identification and measurement are important elements of our Risk Management practice. We have enterprise-wide methodologies, models and techniques in place to measure both the quantitative and qualitative aspects of risks, appropriate for the various types of risks we face. These methodologies, models and techniques are subject to periodic assessment and review for appropriateness and reliability. Through an annual risk survey, involving interviews with management, we are able to identify and proactively address emerging risks and opportunities.
We also use techniques such as sensitivity analysis and stress testing to help ensure that the risks remain within our risk tolerance and that our capital is adequate to cover those risks. Our stress testing program includes evaluation of the potential effects of severe but plausible economic and market scenarios on our risk profile.
We continue to build upon our risk management foundation and strive for continuous improvement. Efforts are currently underway to enhance our risk management infrastructure, processes and capabilities. We believe that the steps we have taken and the initiatives we continue to pursue position us to successfully execute on our business strategy.
Risk Governance, Oversight and Design
Our risk governance structure emphasizes and balances strong central oversight and control of risk with clear accountability for, and ownership of, risk within each business unit. This structure supports the flow of information between the business units, the members of the Executive Team, who represent each significant business unit and corporate oversight function, the President and Chief Executive Officer (CEO) and the Board of Directors.
Board and its Committees
Board of DirectorsThe Board of Directors (the Board) is ultimately responsible for Risk Governance by setting the cultural tone, approving the Risk Appetite Statement and ERM Framework and seeking assurance of the effectiveness of the ERM program. The Board provides oversight and carries out its mandate with respect to risk and capital management through the Risk Management Committee of the Board and the Audit Committee of the Board. The Board maintains overall responsibility for approval of (i) risk management and accounting policies and (ii) our Code of Business Ethics and Code of Conduct and (iii) the Environmental Review Directive. The Board also maintains oversight responsibilities for the management of the credit, market and other enterprise risks of the Corporation, as well as oversight of the appropriateness of internal control systems and policies governing Corporate Social Responsibility.
Risk Management Committee of the BoardThis Committee assists the Board in fulfilling its oversight responsibilities with respect to the prudent management of our capital structure, including the management of the credit, market and other enterprise risks of the Corporation.
Audit Committee of the BoardThis Committee assists the Board in fulfilling its oversight responsibilities with respect to our standards of integrity and behaviour, financial reporting and internal control systems. The Audit Committee also monitors our corporate compliance program.
EDC Annual Report 2014 67
Ma
na
ge
Me
nt
’s D
isc
us
sio
n a
nD
an
aly
sis
Key Risk Committees
Executive Management teamThe Executive Management team, led by the President and CEO and including the executives reporting directly to the President and CEO, provides management oversight of risk management by determining risk appetite, approving policies and procedures and overseeing execution of risk management activities. The Executive Management Team has primary responsibility for the management of our risks, standards of integrity and behaviour, financial reporting and internal control systems. The Executive Management team undertakes this responsibility through various management oversight committees, by ensuring an appropriate organizational structure and governing policies are in place and through independent validation by audit.
Management Risk Management CommitteeThis Committee provides an independent endorsement as to the acceptability of certain credit commitments and acts as the authority for recommending risk policies to the Board for approval and establishing internal risk management policies and procedures.
Asset liability Management CommitteeThis Committee acts as authority for recommending Market Risk Management policies to the Board for approval and ensuring that policies are supported by appropriate procedures and practices for the measurement, management and reporting of market risk. In addition, the Committee ensures that market risk positions are managed within policy limits and addresses such risk practices as diversification requirements and reporting and monitoring of guidelines.
Risk transfer CommitteeThis Committee acts as authority to endorse recommendations for certain risk transfer activities for portfolio management purposes.
Key Risk Management Groups
Enterprise Risk Management groupThe ERM Group is headed by the SVP, Enterprise Risk Management and Chief Risk Officer and provides independent oversight and governance with respect to risk identification, measurement, control, monitoring and reporting. The ERM Group is also responsible for design, maintenance and evolution of the ERM Framework. The Risk Management Office (RMO) as part of the ERM Group works with the business segments and other corporate oversight groups to establish policies, standards, and limits that align with EDC’s risk tolerance and monitors and reports on existing and emerging risks and compliance with EDC’s risk tolerance. The RMO provides a framework for relating risks to capital requirements through capital modeling and stress testing practices and helps determine EDC’s capital adequacy requirements.
Corporate finance and Control (CfC) CFC is responsible for financial planning, accounting, financial reporting and cash management. CFC ensures that appropriate controls exist to ensure complete and accurate financial reporting and effective cash management.
internal Audit (iA) IA is responsible for evaluating the design and operating effectiveness of internal controls related to the achievement of business objectives pertaining to efficiency and effectiveness of operations, reliability of financial reporting and compliance with laws and regulations. IA evaluates internal controls based on the criteria established in the “Internal Control – Integrated Framework” issued by the Committee of Sponsoring Organizations of the Treadway Commission (COSO). IA’s work is conducted in accordance with the International Standards for the Professional Practice of Internal Auditing, incorporating Enterprise Risk Management and including input from management. IA reports audit results to management and the Audit Committee.
Business UnitsBusiness units are accountable for management and control of significant risks to which they are exposed. Business units work in partnership with the RMO to ensure that credit and market risks arising from their business are managed within approved limits as set out in risk policies.
68 Reaching For Our Export Potential
management’s discussion and analysis
Risk Modules
EDC’s Risk Management Framework breaks risk down into three broad Risk Modules, expressing the corporation’s risk appetite and tolerance in each of i) Financial Risk, ii) Operational Risk and iii) Strategic Risk. As a financial institution, financial risk is naturally front and centre and as a result the majority of this report covers this area.
Financial Risk
Portfolio Risk ProfileWhile EDC follows leading risk management practice, we generally assume more risk than a typical financial institution due to our mandate. We take on larger single counterparty exposures and larger concentration exposures by sector than other financial institutions, most notably in the transportation and extractive sectors which lead Canadian exports.
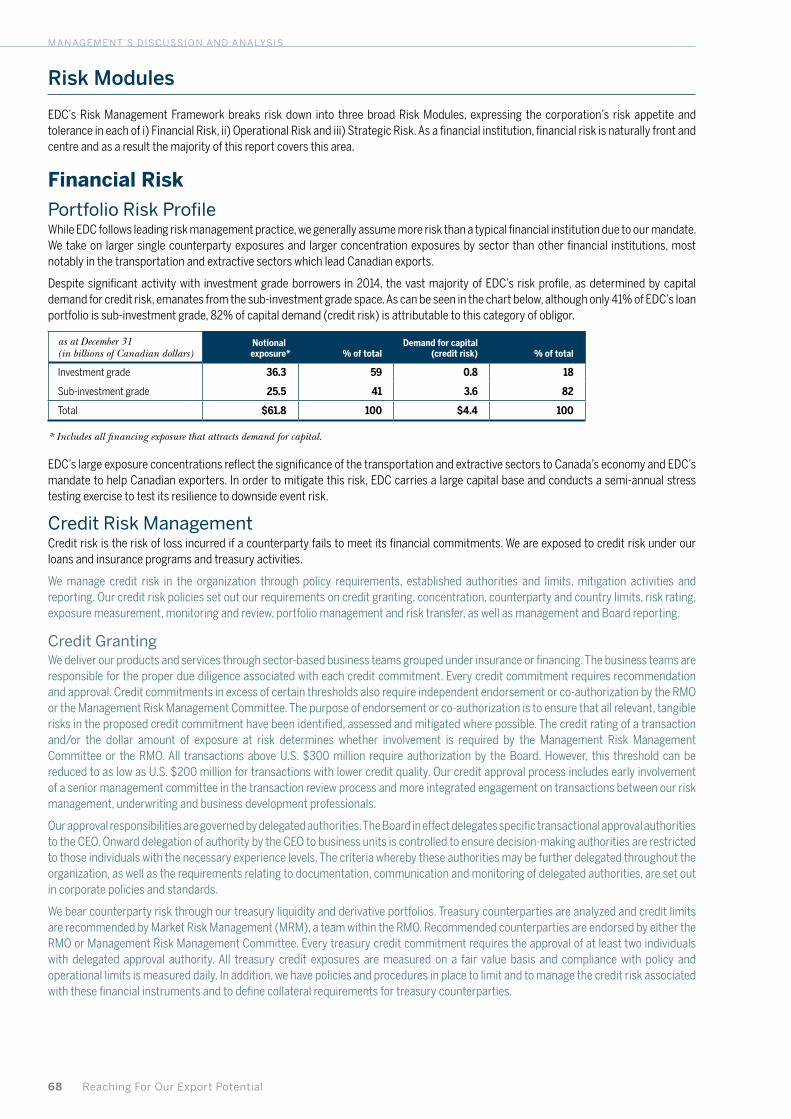
Despite significant activity with investment grade borrowers in 2014, the vast majority of EDC’s risk profile, as determined by capital demand for credit risk, emanates from the sub-investment grade space. As can be seen in the chart below, although only 41% of EDC’s loan portfolio is sub-investment grade, 82% of capital demand (credit risk) is attributable to this category of obligor.
as at December 31 (in billions of Canadian dollars)
Notionalexposure* % of total
Demand for capital (credit risk) % of total
Investment grade 36.3 59 0.8 18
Sub-investment grade 25.5 41 3.6 82
Total $61.8 100 $4.4 100
* Includes all financing exposure that attracts demand for capital.
EDC’s large exposure concentrations reflect the significance of the transportation and extractive sectors to Canada’s economy and EDC’s mandate to help Canadian exporters. In order to mitigate this risk, EDC carries a large capital base and conducts a semi-annual stress testing exercise to test its resilience to downside event risk.
Credit Risk Management Credit risk is the risk of loss incurred if a counterparty fails to meet its financial commitments. We are exposed to credit risk under our loans and insurance programs and treasury activities.
We manage credit risk in the organization through policy requirements, established authorities and limits, mitigation activities and reporting. Our credit risk policies set out our requirements on credit granting, concentration, counterparty and country limits, risk rating, exposure measurement, monitoring and review, portfolio management and risk transfer, as well as management and Board reporting.
Credit grantingWe deliver our products and services through sector-based business teams grouped under insurance or financing. The business teams are responsible for the proper due diligence associated with each credit commitment. Every credit commitment requires recommendation and approval. Credit commitments in excess of certain thresholds also require independent endorsement or co-authorization by the RMO or the Management Risk Management Committee. The purpose of endorsement or co-authorization is to ensure that all relevant, tangible risks in the proposed credit commitment have been identified, assessed and mitigated where possible. The credit rating of a transaction and/or the dollar amount of exposure at risk determines whether involvement is required by the Management Risk Management Committee or the RMO. All transactions above U.S. $300 million require authorization by the Board. However, this threshold can be reduced to as low as U.S. $200 million for transactions with lower credit quality. Our credit approval process includes early involvement of a senior management committee in the transaction review process and more integrated engagement on transactions between our risk management, underwriting and business development professionals.
Our approval responsibilities are governed by delegated authorities. The Board in effect delegates specific transactional approval authorities to the CEO. Onward delegation of authority by the CEO to business units is controlled to ensure decision-making authorities are restricted to those individuals with the necessary experience levels. The criteria whereby these authorities may be further delegated throughout the organization, as well as the requirements relating to documentation, communication and monitoring of delegated authorities, are set out in corporate policies and standards.
We bear counterparty risk through our treasury liquidity and derivative portfolios. Treasury counterparties are analyzed and credit limits are recommended by Market Risk Management (MRM), a team within the RMO. Recommended counterparties are endorsed by either the RMO or Management Risk Management Committee. Every treasury credit commitment requires the approval of at least two individuals with delegated approval authority. All treasury credit exposures are measured on a fair value basis and compliance with policy and operational limits is measured daily. In addition, we have policies and procedures in place to limit and to manage the credit risk associated with these financial instruments and to define collateral requirements for treasury counterparties.
EDC Annual Report 2014 69
Ma
na
ge
Me
nt
’s D
isc
us
sio
n a
nD
an
aly
sis
Concentration limitsTo ensure diversification of risks within our credit commitments, we have established risk limits in place to protect against being overly concentrated to any one country, industry sector or commercial obligor. All limits are determined based on our capital base and risk factors associated with the exposure including the obligor rating, country rating, associated collateral and EDC product type. Exposures beyond the risk limits require either Presidential approval within discretionary limits or review by the Risk Management Committee and approval of the Board.
Risk RatingsConsistent with the Basel II Advanced Internal Rating-Based approach, credit risk is measured by assigning (i) a risk rating to an obligor that is tied to a probability of default (PD). The PD describes the likelihood of a default of an obligor over a one year period and (ii) a rating to a transaction in the form of a loss given default (LGD) estimate. The LGD estimates the percentage of dollar exposure which EDC reasonably expects to lose should a default occur on a specific transaction.
In 2011, EDC initiated a multi-year project to develop an internal credit risk rating system that measures obligor and transaction risks for a majority of our risk exposure. This new risk rating system utilizes a 20 point rating scale to differentiate the PD of obligors. While our obligor rating is arrived at independently of external ratings for the obligor, our risk-rating methodology includes a review of those external ratings. 2014 was a significant milestone in that we moved away from a blanket estimate of portfolio LGD to a more precise transaction-specific measure, which better informs other solvency metrics including provisioning and capital adequacy. Additionally, we recently took steps to broaden deployment of our risk rating framework to our project finance portfolio.
Our Economics team is responsible for establishing, monitoring and approving country risk ratings. Country risk ratings are continually reviewed to take into consideration any changes in the world environment or a specific country.
For treasury related counterparties, EDC’s internal credit rating is assigned as no better than the lower of the highest two external ratings.
Exposure MeasurementTo ensure that the level of credit risk is transparent to both management and the Board, our credit exposure measurement guideline requires information reporting and comparison of the aggregated exposures within a portfolio against prescribed limits such as country, industry and commercial obligor. We also report on approved short-term buyer limits under our accounts receivable insurance program.
Monitoring and Review Our operating practices include ongoing monitoring of credit exposures. Specialized teams have been created to monitor and manage credit exposure within the different product lines which include monitoring of events in the country and industry of the obligor. The Credit Risk Management team within the RMO is responsible for managing the credit quality and financial performance of our portfolio of commercial loans and guarantees both at the transaction and portfolio levels. This specialized team undertakes loan reviews, assesses risk ratings and regularly monitors borrowers and the credit risk environment including research and assessment of financial, operating and industry trends. Our portfolio of credit insurance counterparties is actively monitored by our Risk Assessment and Portfolio Management team. In addition, deteriorating credits are managed by teams that specialize in restructurings, Paris Club reschedulings, claims and recoveries. Management and the Board are frequently apprised on the credit quality of the portfolio through regular reporting including detailed quarterly reporting on the breakdown of the portfolio by risk ratings, impaired obligors, loan write-offs and claims information.
Portfolio Management The goal of portfolio management is to ensure our ability to pursue mandate related opportunities while taking into consideration the availability of financial resources and limit constraints. Management and the Board are regularly updated on our portfolio of credit exposures through quarterly compliance reporting against concentration limits. We use both primary and secondary portfolio management activities to address imbalances or excess concentrations including, but not limited to, syndication at credit origination, the sale of assets, insurance, reinsurance and hedging using credit derivatives.
We continue to make use of insurance and credit derivatives for risk mitigation purposes targeting large exposures in our loan portfolio. To address credit concentration in our insurance portfolios we engage in various risk transfer activities primarily through reinsurance and co-insurance.
Management and Board Reporting The RMO provides timely and comprehensive risk reporting to management and the Board on major risks being assumed by or facing EDC, enabling appropriate management and oversight. This reporting includes, but is not limited to, a (i) quarterly risk management report, (ii) monthly credit risk policy compliance report, (iii) monthly capital adequacy report and (iv) monthly report detailing our liquidity position. Ad-hoc risk reporting is provided to senior management and the Board as warranted for new or emerging risk issues or significant changes in our level of risk. Significant credit risk issues and action plans are tracked and reported to ensure management accountability and attention are maintained.
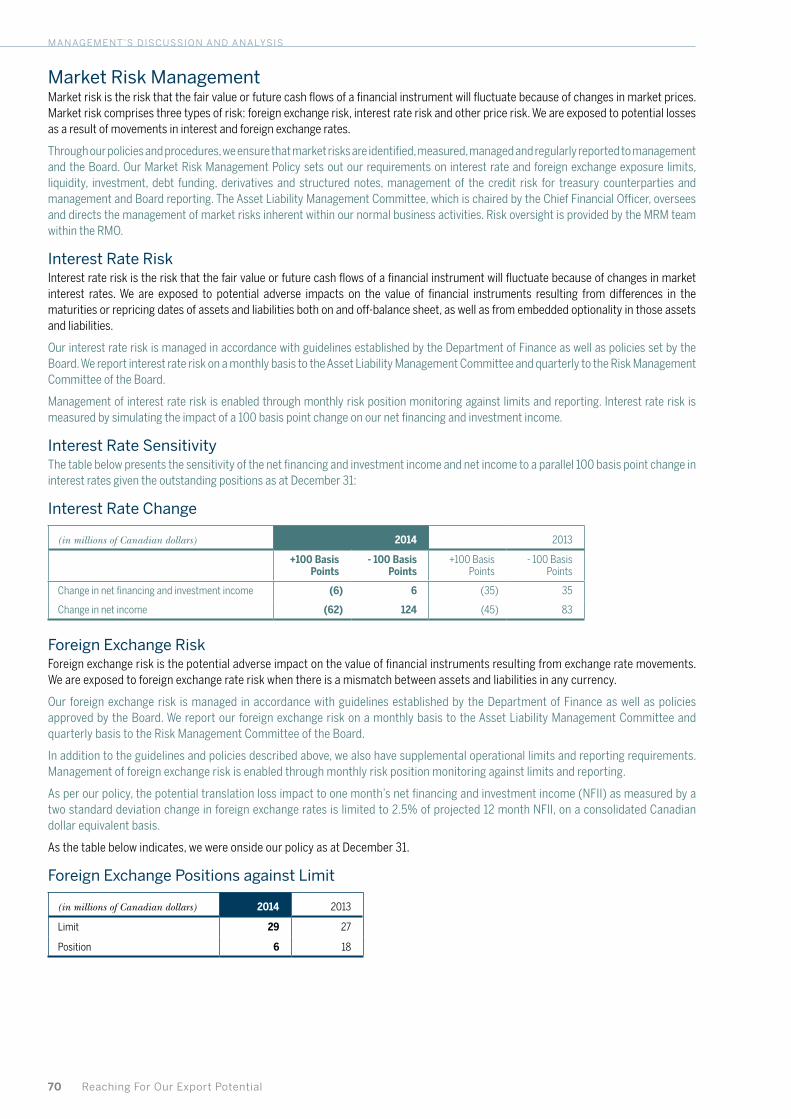
70 Reaching For Our Export Potential
management’s discussion and analysis
Market Risk Management Market risk is the risk that the fair value or future cash flows of a financial instrument will fluctuate because of changes in market prices. Market risk comprises three types of risk: foreign exchange risk, interest rate risk and other price risk. We are exposed to potential losses as a result of movements in interest and foreign exchange rates.
Through our policies and procedures, we ensure that market risks are identified, measured, managed and regularly reported to management and the Board. Our Market Risk Management Policy sets out our requirements on interest rate and foreign exchange exposure limits, liquidity, investment, debt funding, derivatives and structured notes, management of the credit risk for treasury counterparties and management and Board reporting. The Asset Liability Management Committee, which is chaired by the Chief Financial Officer, oversees and directs the management of market risks inherent within our normal business activities. Risk oversight is provided by the MRM team within the RMO.
interest Rate Risk Interest rate risk is the risk that the fair value or future cash flows of a financial instrument will fluctuate because of changes in market interest rates. We are exposed to potential adverse impacts on the value of financial instruments resulting from differences in the maturities or repricing dates of assets and liabilities both on and off-balance sheet, as well as from embedded optionality in those assets and liabilities.
Our interest rate risk is managed in accordance with guidelines established by the Department of Finance as well as policies set by the Board. We report interest rate risk on a monthly basis to the Asset Liability Management Committee and quarterly to the Risk Management Committee of the Board.
Management of interest rate risk is enabled through monthly risk position monitoring against limits and reporting. Interest rate risk is measured by simulating the impact of a 100 basis point change on our net financing and investment income.
interest Rate SensitivityThe table below presents the sensitivity of the net financing and investment income and net income to a parallel 100 basis point change in interest rates given the outstanding positions as at December 31:
interest Rate Change
(in millions of Canadian dollars) 2014 2013
+100 Basis Points
- 100 Basis Points
+100 Basis Points
- 100 Basis Points
Change in net financing and investment income (6) 6 (35) 35
Change in net income (62) 124 (45) 83
foreign Exchange Risk Foreign exchange risk is the potential adverse impact on the value of financial instruments resulting from exchange rate movements. We are exposed to foreign exchange rate risk when there is a mismatch between assets and liabilities in any currency.
Our foreign exchange risk is managed in accordance with guidelines established by the Department of Finance as well as policies approved by the Board. We report our foreign exchange risk on a monthly basis to the Asset Liability Management Committee and quarterly basis to the Risk Management Committee of the Board.
In addition to the guidelines and policies described above, we also have supplemental operational limits and reporting requirements. Management of foreign exchange risk is enabled through monthly risk position monitoring against limits and reporting.
As per our policy, the potential translation loss impact to one month’s net financing and investment income (NFII) as measured by a two standard deviation change in foreign exchange rates is limited to 2.5% of projected 12 month NFII, on a consolidated Canadian dollar equivalent basis.
As the table below indicates, we were onside our policy as at December 31.
foreign Exchange Positions against limit
(in millions of Canadian dollars) 2014 2013
Limit 29 27
Position 6 18
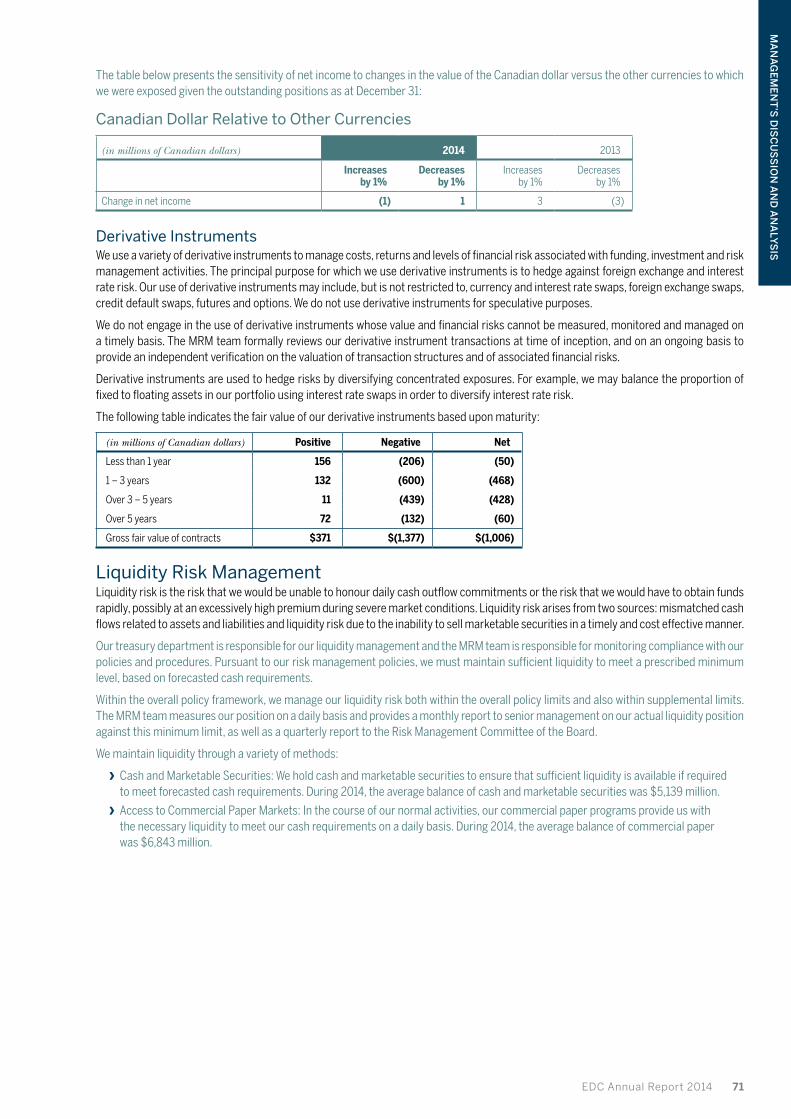
EDC Annual Report 2014 71
Ma
na
ge
Me
nt
’s D
isc
us
sio
n a
nD
an
aly
sis
The table below presents the sensitivity of net income to changes in the value of the Canadian dollar versus the other currencies to which we were exposed given the outstanding positions as at December 31:
Canadian Dollar Relative to other Currencies
(in millions of Canadian dollars) 2014 2013
Increases
by 1%Decreases
by 1% Increases
by 1%Decreases
by 1%
Change in net income (1) 1 3 (3)
Derivative instrumentsWe use a variety of derivative instruments to manage costs, returns and levels of financial risk associated with funding, investment and risk management activities. The principal purpose for which we use derivative instruments is to hedge against foreign exchange and interest rate risk. Our use of derivative instruments may include, but is not restricted to, currency and interest rate swaps, foreign exchange swaps, credit default swaps, futures and options. We do not use derivative instruments for speculative purposes.
We do not engage in the use of derivative instruments whose value and financial risks cannot be measured, monitored and managed on a timely basis. The MRM team formally reviews our derivative instrument transactions at time of inception, and on an ongoing basis to provide an independent verification on the valuation of transaction structures and of associated financial risks.
Derivative instruments are used to hedge risks by diversifying concentrated exposures. For example, we may balance the proportion of fixed to floating assets in our portfolio using interest rate swaps in order to diversify interest rate risk.
The following table indicates the fair value of our derivative instruments based upon maturity:
(in millions of Canadian dollars) Positive Negative Net
Less than 1 year 156 (206) (50)
1 – 3 years 132 (600) (468)
Over 3 – 5 years 11 (439) (428)
Over 5 years 72 (132) (60)
Gross fair value of contracts $371 $(1,377) $(1,006)
liquidity Risk Management Liquidity risk is the risk that we would be unable to honour daily cash outflow commitments or the risk that we would have to obtain funds rapidly, possibly at an excessively high premium during severe market conditions. Liquidity risk arises from two sources: mismatched cash flows related to assets and liabilities and liquidity risk due to the inability to sell marketable securities in a timely and cost effective manner.
Our treasury department is responsible for our liquidity management and the MRM team is responsible for monitoring compliance with our policies and procedures. Pursuant to our risk management policies, we must maintain sufficient liquidity to meet a prescribed minimum level, based on forecasted cash requirements.
Within the overall policy framework, we manage our liquidity risk both within the overall policy limits and also within supplemental limits. The MRM team measures our position on a daily basis and provides a monthly report to senior management on our actual liquidity position against this minimum limit, as well as a quarterly report to the Risk Management Committee of the Board.
We maintain liquidity through a variety of methods:
› Cash and Marketable Securities: We hold cash and marketable securities to ensure that sufficient liquidity is available if required to meet forecasted cash requirements. During 2014, the average balance of cash and marketable securities was $5,139 million.
› Access to Commercial Paper Markets: In the course of our normal activities, our commercial paper programs provide us with the necessary liquidity to meet our cash requirements on a daily basis. During 2014, the average balance of commercial paper was $6,843 million.
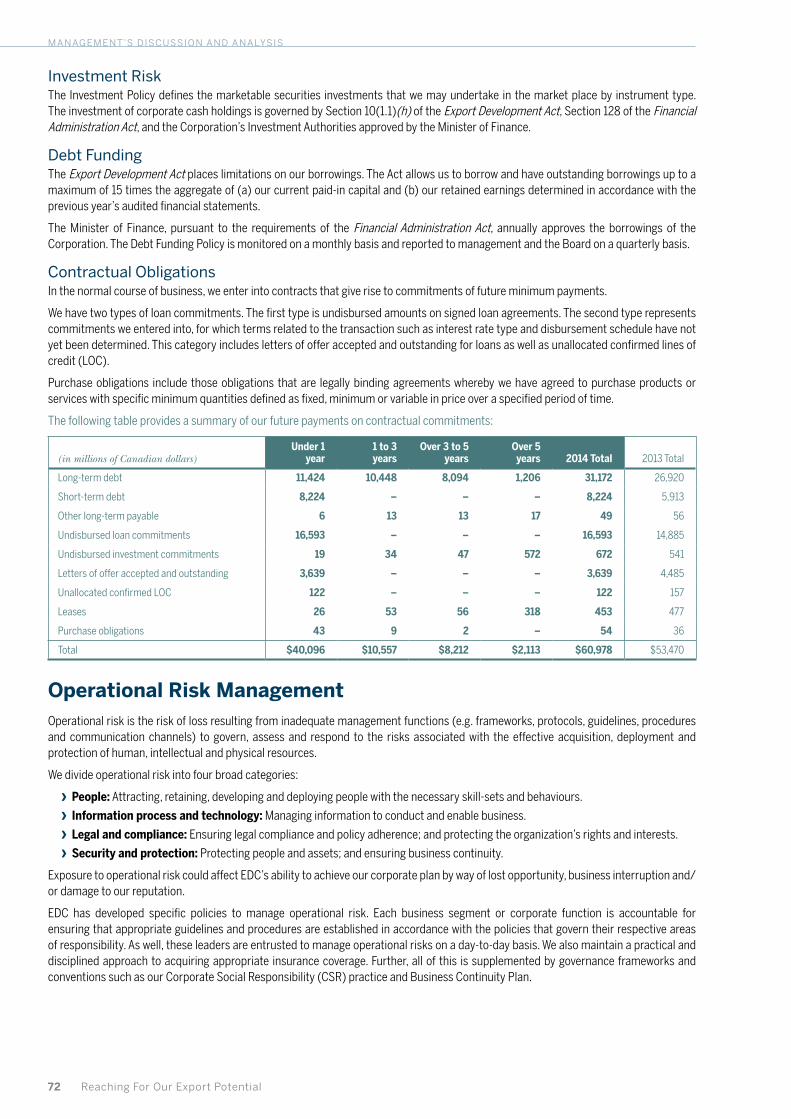
72 Reaching For Our Export Potential
management’s discussion and analysis
investment RiskThe Investment Policy defines the marketable securities investments that we may undertake in the market place by instrument type. The investment of corporate cash holdings is governed by Section 10(1.1)(h) of the Export Development Act, Section 128 of the Financial Administration Act, and the Corporation’s Investment Authorities approved by the Minister of Finance.
Debt funding The Export Development Act places limitations on our borrowings. The Act allows us to borrow and have outstanding borrowings up to a maximum of 15 times the aggregate of (a) our current paid-in capital and (b) our retained earnings determined in accordance with the previous year’s audited financial statements.
The Minister of Finance, pursuant to the requirements of the Financial Administration Act, annually approves the borrowings of the Corporation. The Debt Funding Policy is monitored on a monthly basis and reported to management and the Board on a quarterly basis.
Contractual obligations In the normal course of business, we enter into contracts that give rise to commitments of future minimum payments.
We have two types of loan commitments. The first type is undisbursed amounts on signed loan agreements. The second type represents commitments we entered into, for which terms related to the transaction such as interest rate type and disbursement schedule have not yet been determined. This category includes letters of offer accepted and outstanding for loans as well as unallocated confirmed lines of credit (LOC).
Purchase obligations include those obligations that are legally binding agreements whereby we have agreed to purchase products or services with specific minimum quantities defined as fixed, minimum or variable in price over a specified period of time.
The following table provides a summary of our future payments on contractual commitments:
(in millions of Canadian dollars)Under 1
year1 to 3 years
Over 3 to 5 years
Over 5 years 2014 Total 2013 Total
Long-term debt 11,424 10,448 8,094 1,206 31,172 26,920
Short-term debt 8,224 – – – 8,224 5,913
Other long-term payable 6 13 13 17 49 56
Undisbursed loan commitments 16,593 – – – 16,593 14,885
Undisbursed investment commitments 19 34 47 572 672 541
Letters of offer accepted and outstanding 3,639 – – – 3,639 4,485
Unallocated confirmed LOC 122 – – – 122 157
Leases 26 53 56 318 453 477
Purchase obligations 43 9 2 – 54 36
Total $40,096 $10,557 $8,212 $2,113 $60,978 $53,470
Operational Risk Management Operational risk is the risk of loss resulting from inadequate management functions (e.g. frameworks, protocols, guidelines, procedures and communication channels) to govern, assess and respond to the risks associated with the effective acquisition, deployment and protection of human, intellectual and physical resources.
We divide operational risk into four broad categories:
› People: Attracting, retaining, developing and deploying people with the necessary skill-sets and behaviours.
› Information process and technology: Managing information to conduct and enable business.
› Legal and compliance: Ensuring legal compliance and policy adherence; and protecting the organization’s rights and interests.
› Security and protection: Protecting people and assets; and ensuring business continuity.
Exposure to operational risk could affect EDC’s ability to achieve our corporate plan by way of lost opportunity, business interruption and/or damage to our reputation.
EDC has developed specific policies to manage operational risk. Each business segment or corporate function is accountable for ensuring that appropriate guidelines and procedures are established in accordance with the policies that govern their respective areas of responsibility. As well, these leaders are entrusted to manage operational risks on a day-to-day basis. We also maintain a practical and disciplined approach to acquiring appropriate insurance coverage. Further, all of this is supplemented by governance frameworks and conventions such as our Corporate Social Responsibility (CSR) practice and Business Continuity Plan.

EDC Annual Report 2014 73
Ma
na
ge
Me
nt
’s D
isc
us
sio
n a
nD
an
aly
sis
EDC has identified a list of key operational risks inherent to our business, e.g. change management, data integrity, information security, internal/external fraud, business continuity, etc. EDC has assessed and continues to assess our exposure to these risks. This is done through a number of means including the biennial employee engagement survey and the annual ERM Survey. The employee engagement survey provides us with a mechanism to gather employee input on conditions that enable or inhibit key drivers of performance and the results serve to drive action plans in order to build on our strengths and support corporate values. The annual ERM survey allows us to identify a broad spectrum of risks and facilitates the escalation of concerns to Executive Management and consideration of mitigating action, as appropriate.
Finally, Internal Audit’s independent review provides additional assurance that operational risks are appropriately managed.
Strategic Risk ManagementStrategic risk arises when an organization fails to read the environment, formulate strategies with sufficient forward vision to ensure ongoing relevance and longevity, develop products and services to address market dynamics and requirements and cascade the strategy throughout the organization. Strategic Risk Management is particularly important for EDC in light of our mandate to support, facilitate and serve to create trade.
We subdivide strategic risk into three overarching themes:
› External environment: Systematic identification and assessment of external risks and opportunities.
› Planning: Formulating and communicating corporate direction and objectives.
› New opportunities and innovation: Assuring organizational capacity to evolve and innovate.
EDC is diligent in attuning itself to the external environment through the work of specialized groups such as Economic and Political Intelligence Centre (EPIC), the Corporate Research Department (CRD) and the Market Strategy team. Our annual environmental scan involves a comprehensive assessment of risks and opportunities. As well, our annual customer survey that drives our net promoter score and our proactive business development practice affords us critical insights into customer needs. The insight gained from these surveillance activities is incorporated into our annual planning exercises.
Our CSR practice is built on five pillars: business ethics, the environment, transparency, community investment and organizational climate and plays a central role in our ongoing formulation of business strategy. We recognize that growth and sustainability must be addressed simultaneously and that CSR is intrinsic to achieving sustainable trade. In addition our focus on CSR instills the need to be conscientious of the environmental impacts of our business, to act in accordance with the highest ethical standards and invest in our communities and employees.
Critical Accounting Policies and EstimatesA summary of our significant accounting policies can be found in Note 2 of our 2014 consolidated financial statements. Judgment is required in the selection of accounting policies and their application requires the use of estimates and assumptions to arrive at the reported carrying values of our assets and liabilities. We have established procedures to ensure that accounting policies are applied consistently and that the process for making changes to methodologies and assumptions is well controlled and occurs in an appropriate and systematic manner. Areas where significant estimates are used include the allowance for losses on loans, loan commitments and loan guarantees; equipment available for lease and assets held-for-sale; recoverable insurance claims; premium and claims liabilities; retirement benefit obligations; and the fair value of financial instruments. Management exercises judgment in the allowance for losses on loans, loan commitments and loan guarantees; equipment available for lease and assets held-for-sale; premium and claims liabilities; the fair value of financial instruments; structured entities; and retirement benefit obligations. For details on our use of estimates and key judgments refer to page 89 of this annual report.
Change in Accounting Standards
The International Accounting Standards Board (IASB) has not issued new standards, interpretations or amendments effective as of January 1, 2014 requiring mandatory adoption that are relevant to EDC. In 2014, the IASB completed its project on financial instruments, introducing changes to the accounting for impairment which are expected to have a significant impact on EDC upon implementation in 2018. The IASB also released a narrow-scope amendment to IAS 1 – Presentation of Financial Statements during the year as part of its Disclosure Initiative, which will become effective in 2016 and may impact EDC’s financial statements. The IASB is currently working on projects related to insurance contracts and leases. Revisions to these standards could potentially have a significant impact on EDC’s financial statements in future years. Refer to Note 2 of our 2014 consolidated financial statements for further details.
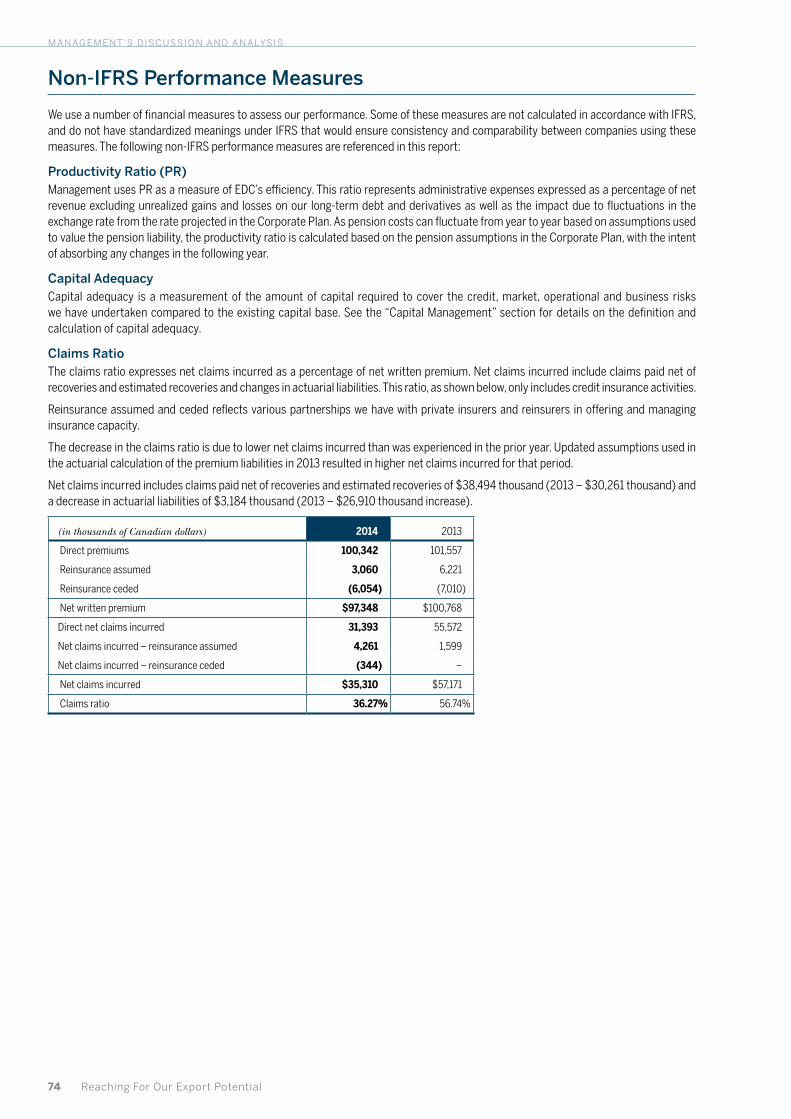
74 Reaching For Our Export Potential
management’s discussion and analysis
Non-IFRS Performance Measures
We use a number of financial measures to assess our performance. Some of these measures are not calculated in accordance with IFRS, and do not have standardized meanings under IFRS that would ensure consistency and comparability between companies using these measures. The following non-IFRS performance measures are referenced in this report:
Productivity Ratio (PR)Management uses PR as a measure of EDC’s efficiency. This ratio represents administrative expenses expressed as a percentage of net revenue excluding unrealized gains and losses on our long-term debt and derivatives as well as the impact due to fluctuations in the exchange rate from the rate projected in the Corporate Plan. As pension costs can fluctuate from year to year based on assumptions used to value the pension liability, the productivity ratio is calculated based on the pension assumptions in the Corporate Plan, with the intent of absorbing any changes in the following year.
Capital Adequacy Capital adequacy is a measurement of the amount of capital required to cover the credit, market, operational and business risks we have undertaken compared to the existing capital base. See the “Capital Management” section for details on the definition and calculation of capital adequacy.
Claims RatioThe claims ratio expresses net claims incurred as a percentage of net written premium. Net claims incurred include claims paid net of recoveries and estimated recoveries and changes in actuarial liabilities. This ratio, as shown below, only includes credit insurance activities.
Reinsurance assumed and ceded reflects various partnerships we have with private insurers and reinsurers in offering and managing insurance capacity.
The decrease in the claims ratio is due to lower net claims incurred than was experienced in the prior year. Updated assumptions used in the actuarial calculation of the premium liabilities in 2013 resulted in higher net claims incurred for that period.
Net claims incurred includes claims paid net of recoveries and estimated recoveries of $38,494 thousand (2013 – $30,261 thousand) and a decrease in actuarial liabilities of $3,184 thousand (2013 – $26,910 thousand increase).
(in thousands of Canadian dollars) 2014 2013
Direct premiums 100,342 101,557
Reinsurance assumed 3,060 6,221
Reinsurance ceded (6,054) (7,010)
Net written premium $97,348 $100,768
Direct net claims incurred 31,393 55,572
Net claims incurred – reinsurance assumed 4,261 1,599
Net claims incurred – reinsurance ceded (344) –
Net claims incurred $35,310 $57,171
Claims ratio 36.27% 56.74%
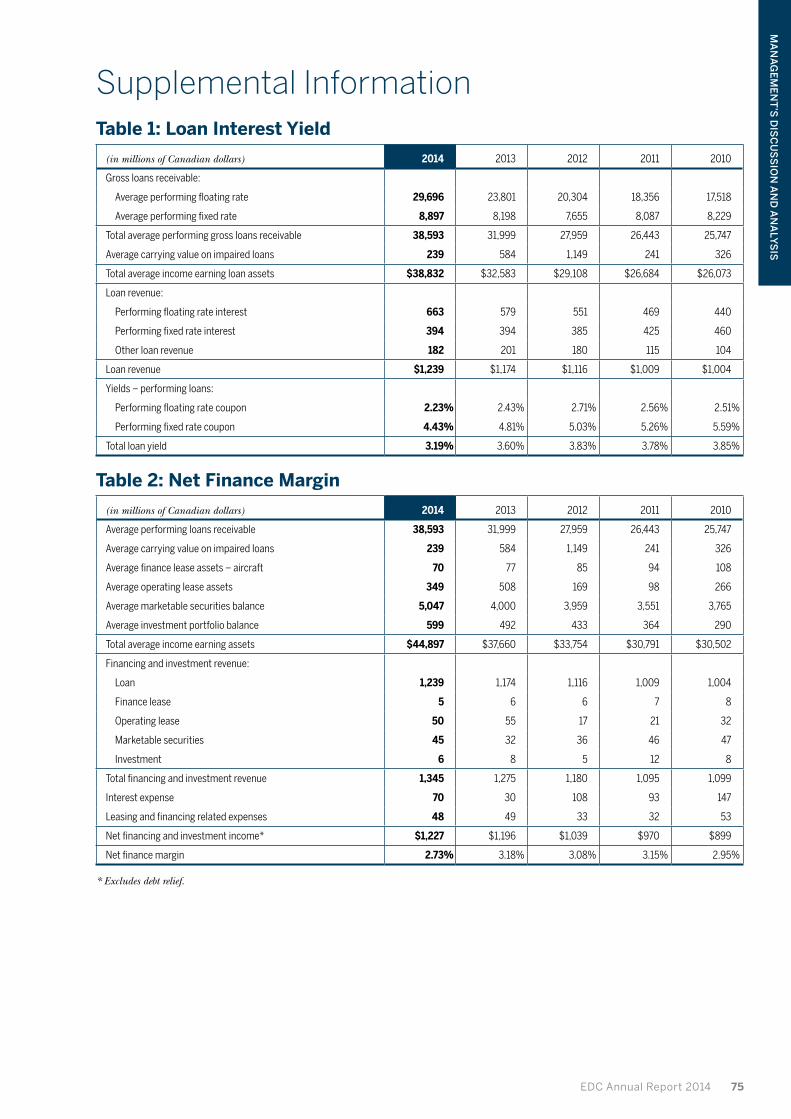
EDC Annual Report 2014 75
Ma
na
ge
Me
nt
’s D
isc
us
sio
n a
nD
an
aly
sis
Supplemental InformationTable 1: Loan Interest Yield
(in millions of Canadian dollars) 2014 2013 2012 2011 2010
Gross loans receivable:
Average performing floating rate 29,696 23,801 20,304 18,356 17,518
Average performing fixed rate 8,897 8,198 7,655 8,087 8,229
Total average performing gross loans receivable 38,593 31,999 27,959 26,443 25,747
Average carrying value on impaired loans 239 584 1,149 241 326
Total average income earning loan assets $38,832 $32,583 $29,108 $26,684 $26,073
Loan revenue:
Performing floating rate interest 663 579 551 469 440
Performing fixed rate interest 394 394 385 425 460
Other loan revenue 182 201 180 115 104
Loan revenue $1,239 $1,174 $1,116 $1,009 $1,004
Yields – performing loans:
Performing floating rate coupon 2.23% 2.43% 2.71% 2.56% 2.51%
Performing fixed rate coupon 4.43% 4.81% 5.03% 5.26% 5.59%
Total loan yield 3.19% 3.60% 3.83% 3.78% 3.85%
Table 2: Net Finance Margin
(in millions of Canadian dollars) 2014 2013 2012 2011 2010
Average performing loans receivable 38,593 31,999 27,959 26,443 25,747
Average carrying value on impaired loans 239 584 1,149 241 326
Average finance lease assets – aircraft 70 77 85 94 108
Average operating lease assets 349 508 169 98 266
Average marketable securities balance 5,047 4,000 3,959 3,551 3,765
Average investment portfolio balance 599 492 433 364 290
Total average income earning assets $44,897 $37,660 $33,754 $30,791 $30,502
Financing and investment revenue:
Loan 1,239 1,174 1,116 1,009 1,004
Finance lease 5 6 6 7 8
Operating lease 50 55 17 21 32
Marketable securities 45 32 36 46 47
Investment 6 8 5 12 8
Total financing and investment revenue 1,345 1,275 1,180 1,095 1,099
Interest expense 70 30 108 93 147
Leasing and financing related expenses 48 49 33 32 53
Net financing and investment income* $1,227 $1,196 $1,039 $970 $899
Net finance margin 2.73% 3.18% 3.08% 3.15% 2.95%
* Excludes debt relief.
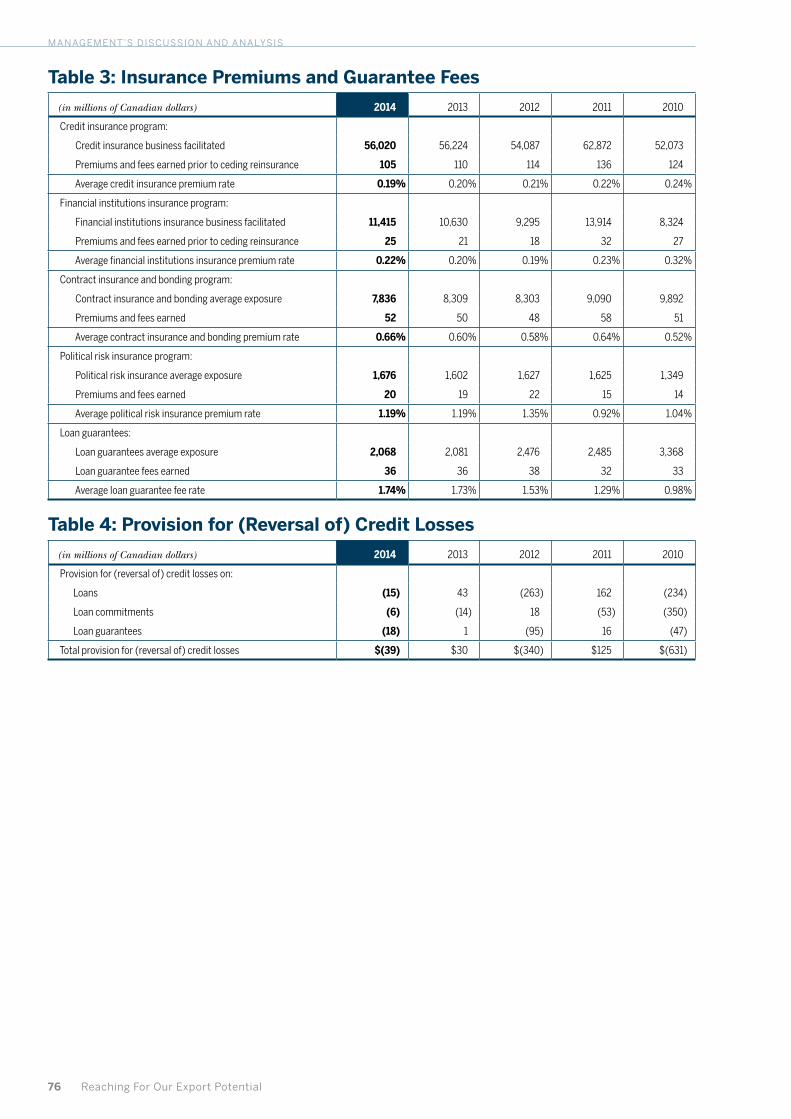
76 Reaching For Our Export Potential
management’s discussion and analysis
Table 3: Insurance Premiums and Guarantee Fees
(in millions of Canadian dollars) 2014 2013 2012 2011 2010
Credit insurance program:
Credit insurance business facilitated 56,020 56,224 54,087 62,872 52,073
Premiums and fees earned prior to ceding reinsurance 105 110 114 136 124
Average credit insurance premium rate 0.19% 0.20% 0.21% 0.22% 0.24%
Financial institutions insurance program:
Financial institutions insurance business facilitated 11,415 10,630 9,295 13,914 8,324
Premiums and fees earned prior to ceding reinsurance 25 21 18 32 27
Average financial institutions insurance premium rate 0.22% 0.20% 0.19% 0.23% 0.32%
Contract insurance and bonding program:
Contract insurance and bonding average exposure 7,836 8,309 8,303 9,090 9,892
Premiums and fees earned 52 50 48 58 51
Average contract insurance and bonding premium rate 0.66% 0.60% 0.58% 0.64% 0.52%
Political risk insurance program:
Political risk insurance average exposure 1,676 1,602 1,627 1,625 1,349
Premiums and fees earned 20 19 22 15 14
Average political risk insurance premium rate 1.19% 1.19% 1.35% 0.92% 1.04%
Loan guarantees:
Loan guarantees average exposure 2,068 2,081 2,476 2,485 3,368
Loan guarantee fees earned 36 36 38 32 33
Average loan guarantee fee rate 1.74% 1.73% 1.53% 1.29% 0.98%
Table 4: Provision for (Reversal of) Credit Losses
(in millions of Canadian dollars) 2014 2013 2012 2011 2010
Provision for (reversal of) credit losses on:
Loans (15) 43 (263) 162 (234)
Loan commitments (6) (14) 18 (53) (350)
Loan guarantees (18) 1 (95) 16 (47)
Total provision for (reversal of) credit losses $(39) $30 $(340) $125 $(631)
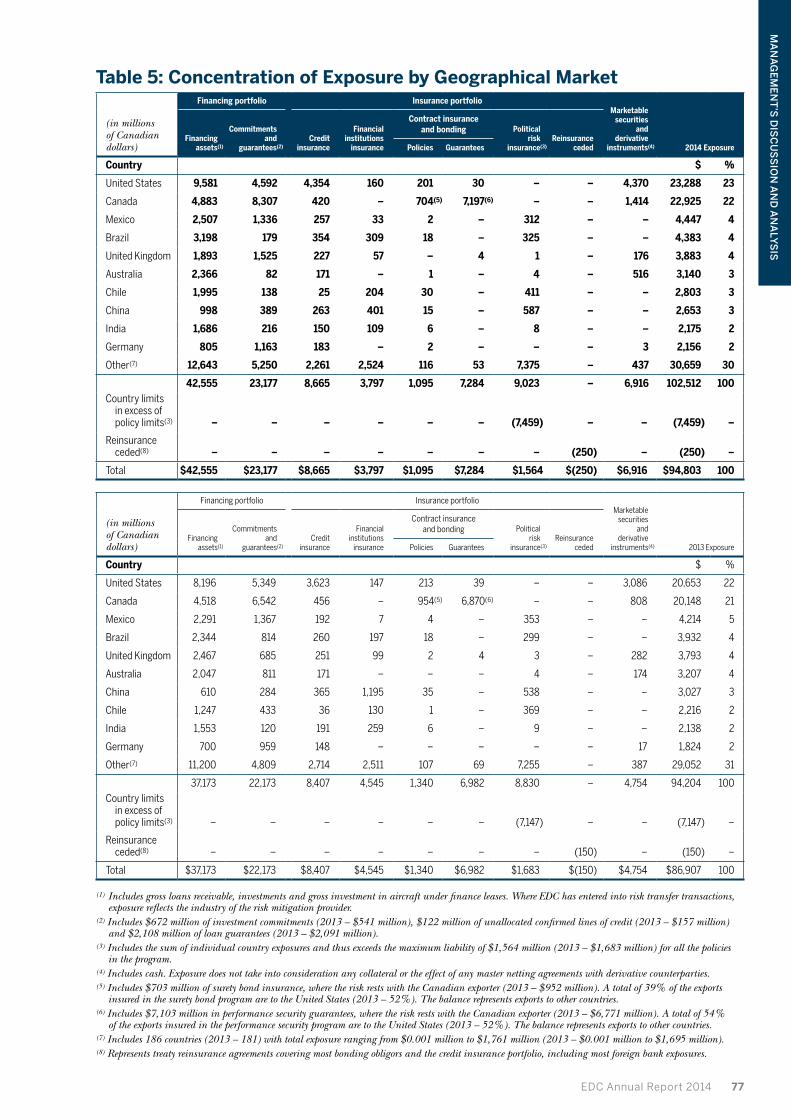
EDC Annual Report 2014 77
Ma
na
ge
Me
nt
’s D
isc
us
sio
n a
nD
an
aly
sis
Table 5: Concentration of Exposure by Geographical Market
(in millions of Canadian dollars)
Financing portfolio Insurance portfolioMarketable
securities and
derivative instruments(4) 2014 Exposure
Financing assets(1)
Commitments and
guarantees(2)Credit
insurance
Financial institutions
insurance
Contract insurance and bonding Political
risk insurance(3)
Reinsurance cededPolicies Guarantees
Country $ %
United States 9,581 4,592 4,354 160 201 30 – – 4,370 23,288 23
Canada 4,883 8,307 420 – 704(5) 7,197(6) – – 1,414 22,925 22
Mexico 2,507 1,336 257 33 2 – 312 – – 4,447 4
Brazil 3,198 179 354 309 18 – 325 – – 4,383 4
United Kingdom 1,893 1,525 227 57 – 4 1 – 176 3,883 4
Australia 2,366 82 171 – 1 – 4 – 516 3,140 3
Chile 1,995 138 25 204 30 – 411 – – 2,803 3
China 998 389 263 401 15 – 587 – – 2,653 3
India 1,686 216 150 109 6 – 8 – – 2,175 2
Germany 805 1,163 183 – 2 – – – 3 2,156 2
Other(7) 12,643 5,250 2,261 2,524 116 53 7,375 – 437 30,659 30
42,555 23,177 8,665 3,797 1,095 7,284 9,023 – 6,916 102,512 100Country limits
in excess of policy limits(3) – – – – – – (7,459) – – (7,459) –
Reinsurance ceded(8) – – – – – – – (250) – (250) –
Total $42,555 $23,177 $8,665 $3,797 $1,095 $7,284 $1,564 $(250) $6,916 $94,803 100
(in millions of Canadian dollars)
Financing portfolio Insurance portfolioMarketable
securities and
derivative instruments(4) 2013 Exposure
Financing assets(1)
Commitments and
guarantees(2)Credit
insurance
Financial institutions
insurance
Contract insurance and bonding Political
risk insurance(3)
Reinsurance cededPolicies Guarantees
Country $ %
United States 8,196 5,349 3,623 147 213 39 – – 3,086 20,653 22
Canada 4,518 6,542 456 – 954(5) 6,870(6) – – 808 20,148 21
Mexico 2,291 1,367 192 7 4 – 353 – – 4,214 5
Brazil 2,344 814 260 197 18 – 299 – – 3,932 4
United Kingdom 2,467 685 251 99 2 4 3 – 282 3,793 4
Australia 2,047 811 171 – – – 4 – 174 3,207 4
China 610 284 365 1,195 35 – 538 – – 3,027 3
Chile 1,247 433 36 130 1 – 369 – – 2,216 2
India 1,553 120 191 259 6 – 9 – – 2,138 2
Germany 700 959 148 – – – – – 17 1,824 2
Other(7) 11,200 4,809 2,714 2,511 107 69 7,255 – 387 29,052 31
37,173 22,173 8,407 4,545 1,340 6,982 8,830 – 4,754 94,204 100
Country limits in excess of policy limits(3) – – – – – – (7,147) – – (7,147) –
Reinsurance ceded(8) – – – – – – – (150) – (150) –
Total $37,173 $22,173 $8,407 $4,545 $1,340 $6,982 $1,683 $(150) $4,754 $86,907 100
(1) Includes gross loans receivable, investments and gross investment in aircraft under finance leases. Where EDC has entered into risk transfer transactions, exposure reflects the industry of the risk mitigation provider.
(2) Includes $672 million of investment commitments (2013 – $541 million), $122 million of unallocated confirmed lines of credit (2013 – $157 million) and $2,108 million of loan guarantees (2013 – $2,091 million).
(3) Includes the sum of individual country exposures and thus exceeds the maximum liability of $1,564 million (2013 – $1,683 million) for all the policies in the program.
(4) Includes cash. Exposure does not take into consideration any collateral or the effect of any master netting agreements with derivative counterparties.(5) Includes $703 million of surety bond insurance, where the risk rests with the Canadian exporter (2013 – $952 million). A total of 39% of the exports
insured in the surety bond program are to the United States (2013 – 52%). The balance represents exports to other countries.(6) Includes $7,103 million in performance security guarantees, where the risk rests with the Canadian exporter (2013 – $6,771 million). A total of 54%
of the exports insured in the performance security program are to the United States (2013 – 52%). The balance represents exports to other countries.(7) Includes 186 countries (2013 – 181) with total exposure ranging from $0.001 million to $1,761 million (2013 – $0.001 million to $1,695 million).(8) Represents treaty reinsurance agreements covering most bonding obligors and the credit insurance portfolio, including most foreign bank exposures.
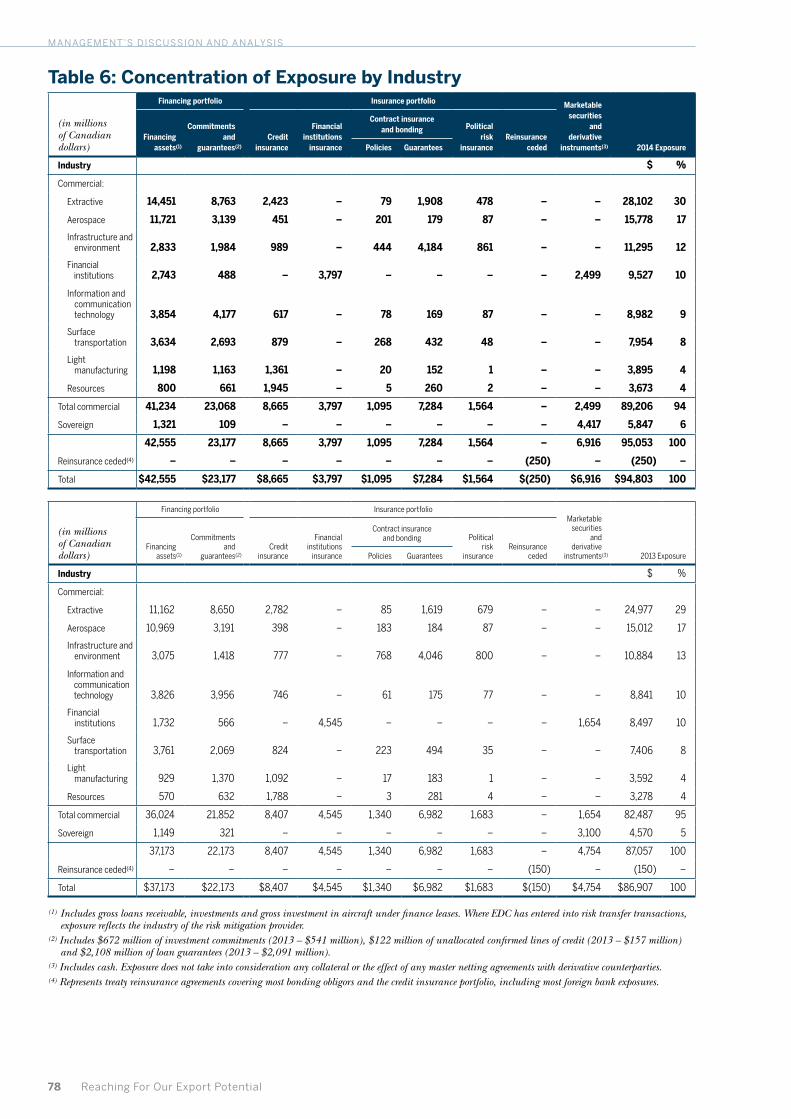
78 Reaching For Our Export Potential
management’s discussion and analysis
Table 6: Concentration of Exposure by Industry
(in millions of Canadian dollars)
Financing portfolio Insurance portfolio Marketable securities
and derivative
instruments(3) 2014 ExposureFinancing
assets(1)
Commitments and
guarantees(2)
Credit insurance
Financial institutions
insurance
Contract insurance and bonding Political
risk insurance
Reinsurance cededPolicies Guarantees
Industry $ %
Commercial:
Extractive 14,451 8,763 2,423 – 79 1,908 478 – – 28,102 30
Aerospace 11,721 3,139 451 – 201 179 87 – – 15,778 17
Infrastructure and environment 2,833 1,984 989 – 444 4,184 861 – – 11,295 12
Financial institutions 2,743 488 – 3,797 – – – – 2,499 9,527 10
Information and communication technology 3,854 4,177 617 – 78 169 87 – – 8,982 9
Surface transportation 3,634 2,693 879 – 268 432 48 – – 7,954 8
Light manufacturing 1,198 1,163 1,361 – 20 152 1 – – 3,895 4
Resources 800 661 1,945 – 5 260 2 – – 3,673 4
Total commercial 41,234 23,068 8,665 3,797 1,095 7,284 1,564 – 2,499 89,206 94
Sovereign 1,321 109 – – – – – – 4,417 5,847 6
42,555 23,177 8,665 3,797 1,095 7,284 1,564 – 6,916 95,053 100
Reinsurance ceded(4) – – – – – – – (250) – (250) –
Total $42,555 $23,177 $8,665 $3,797 $1,095 $7,284 $1,564 $(250) $6,916 $94,803 100
(in millions of Canadian dollars)
Financing portfolio Insurance portfolioMarketable
securities and
derivative instruments(3) 2013 Exposure
Financing assets(1)
Commitments and
guarantees(2)Credit
insurance
Financial institutions
insurance
Contract insurance and bonding Political
risk insurance
Reinsurance cededPolicies Guarantees
Industry $ %
Commercial:
Extractive 11,162 8,650 2,782 – 85 1,619 679 – – 24,977 29
Aerospace 10,969 3,191 398 – 183 184 87 – – 15,012 17
Infrastructure and environment 3,075 1,418 777 – 768 4,046 800 – – 10,884 13
Information and communication technology 3,826 3,956 746 – 61 175 77 – – 8,841 10
Financial institutions 1,732 566 – 4,545 – – – – 1,654 8,497 10
Surface transportation 3,761 2,069 824 – 223 494 35 – – 7,406 8
Light manufacturing 929 1,370 1,092 – 17 183 1 – – 3,592 4
Resources 570 632 1,788 – 3 281 4 – – 3,278 4
Total commercial 36,024 21,852 8,407 4,545 1,340 6,982 1,683 – 1,654 82,487 95
Sovereign 1,149 321 – – – – – – 3,100 4,570 5
37,173 22,173 8,407 4,545 1,340 6,982 1,683 – 4,754 87,057 100
Reinsurance ceded(4) – – – – – – – (150) – (150) –
Total $37,173 $22,173 $8,407 $4,545 $1,340 $6,982 $1,683 $(150) $4,754 $86,907 100
(1) Includes gross loans receivable, investments and gross investment in aircraft under finance leases. Where EDC has entered into risk transfer transactions, exposure reflects the industry of the risk mitigation provider.
(2) Includes $672 million of investment commitments (2013 – $541 million), $122 million of unallocated confirmed lines of credit (2013 – $157 million) and $2,108 million of loan guarantees (2013 – $2,091 million).
(3) Includes cash. Exposure does not take into consideration any collateral or the effect of any master netting agreements with derivative counterparties. (4) Represents treaty reinsurance agreements covering most bonding obligors and the credit insurance portfolio, including most foreign bank exposures.
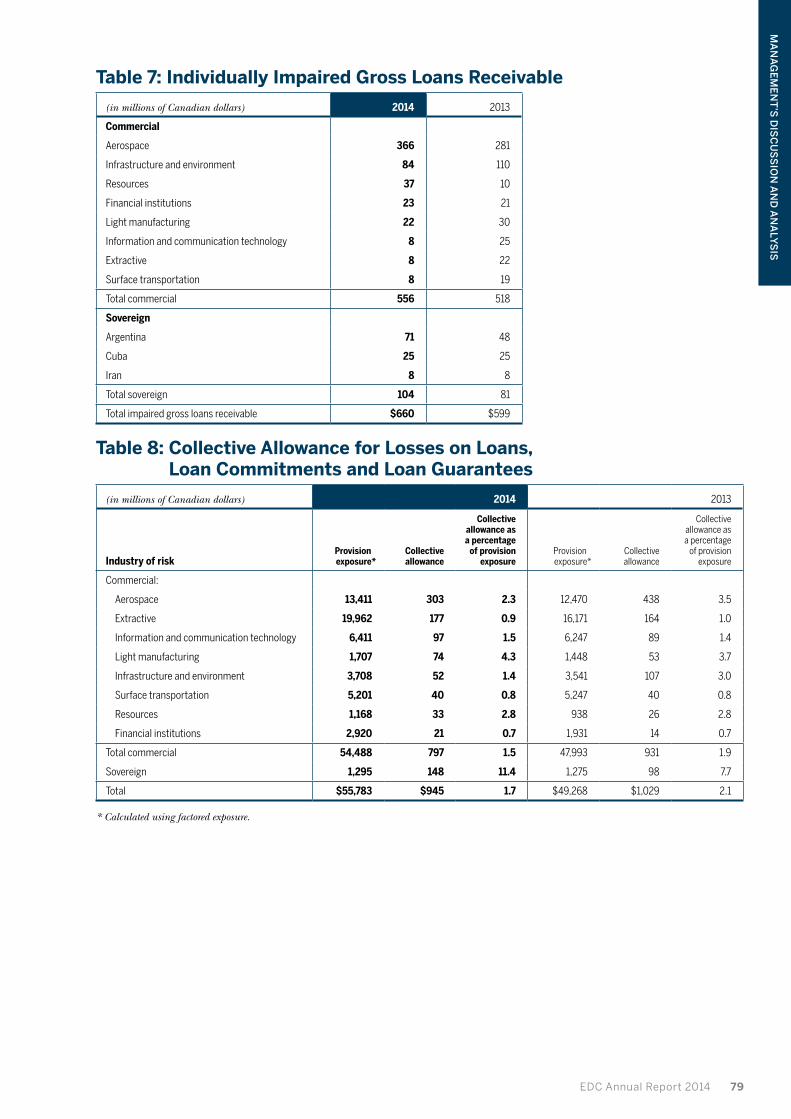
EDC Annual Report 2014 79
Ma
na
ge
Me
nt
’s D
isc
us
sio
n a
nD
an
aly
sis
Table 7: Individually Impaired Gross Loans Receivable
(in millions of Canadian dollars) 2014 2013
Commercial
Aerospace 366 281
Infrastructure and environment 84 110
Resources 37 10
Financial institutions 23 21
Light manufacturing 22 30
Information and communication technology 8 25
Extractive 8 22
Surface transportation 8 19
Total commercial 556 518
Sovereign
Argentina 71 48
Cuba 25 25
Iran 8 8
Total sovereign 104 81
Total impaired gross loans receivable $660 $599
Table 8: Collective Allowance for Losses on Loans, Loan Commitments and Loan Guarantees
(in millions of Canadian dollars) 2014 2013
Industry of riskProvisionexposure*
Collective allowance
Collective allowance as a percentage
of provision exposure
Provision exposure*
Collective allowance
Collective allowance as a percentage
of provision exposure
Commercial:
Aerospace 13,411 303 2.3 12,470 438 3.5
Extractive 19,962 177 0.9 16,171 164 1.0
Information and communication technology 6,411 97 1.5 6,247 89 1.4
Light manufacturing 1,707 74 4.3 1,448 53 3.7
Infrastructure and environment 3,708 52 1.4 3,541 107 3.0
Surface transportation 5,201 40 0.8 5,247 40 0.8
Resources 1,168 33 2.8 938 26 2.8
Financial institutions 2,920 21 0.7 1,931 14 0.7
Total commercial 54,488 797 1.5 47,993 931 1.9
Sovereign 1,295 148 11.4 1,275 98 7.7
Total $55,783 $945 1.7 $49,268 $1,029 2.1
* Calculated using factored exposure.
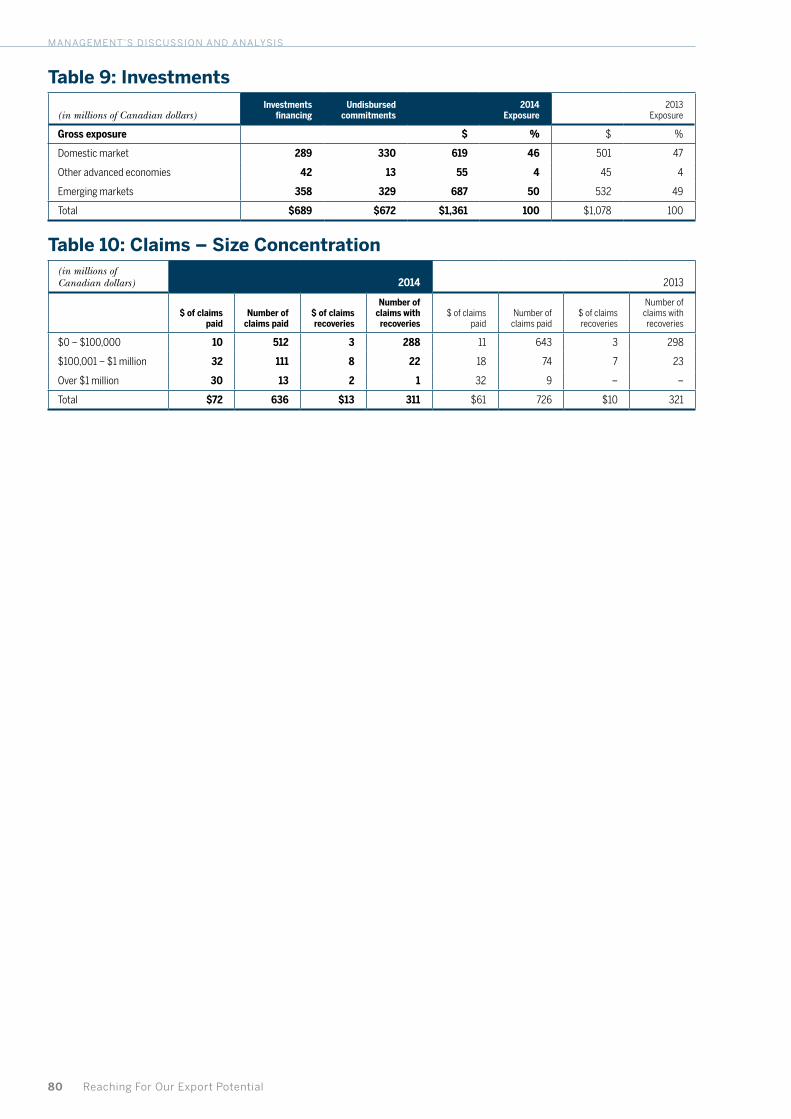
80 Reaching For Our Export Potential
management’s discussion and analysis
Table 9: Investments
(in millions of Canadian dollars) Investments
financing Undisbursed
commitments2014
Exposure2013
Exposure
Gross exposure $ % $ %
Domestic market 289 330 619 46 501 47
Other advanced economies 42 13 55 4 45 4
Emerging markets 358 329 687 50 532 49
Total $689 $672 $1,361 100 $1,078 100
Table 10: Claims – Size Concentration(in millions of Canadian dollars) 2014 2013
$ of claims paid
Number of claims paid
$ of claims recoveries
Number of claims with
recoveries$ of claims
paidNumber of
claims paid$ of claims recoveries
Number of claims with recoveries
$0 – $100,000 10 512 3 288 11 643 3 298
$100,001 – $1 million 32 111 8 22 18 74 7 23
Over $1 million 30 13 2 1 32 9 – –
Total $72 636 $13 311 $61 726 $10 321

148 Reaching For Our Export Potential
Glossary of Financial TermsActuarial Gains or Losses – Changes in the value of the defined benefit obligation and the plan assets due to differences between actuarial assumptions and what has actually occurred and due to changes in actuarial assumptions.
Actuarial Valuation (re: Pension Benefit Plans) – An assessment of the financial status of a benefit plan performed by an independent actuary. It includes the valuation of any plan assets and the defined benefit obligation using estimates of future events that will affect the costs and obligation for employee benefits plans.
Amortized Cost – The amount at which the financial asset or financial liability is measured at initial recognition minus principal repayments, plus or minus the cumulative amortization using the effective interest method of any difference between that initial amount and the maturity amount and minus any reduction (directly or through the use of an allowance account) for impairment or uncollectability.
Basis Point – One one-hundredth of a percentage point.
Contingent Liability – Potential debt which arises from past events and may become an actual obligation if certain events occur or fail to occur. Contingent liability is also referred to as insurance policies and guarantees outstanding.
Credit Risk – The risk of loss incurred if a counterparty fails to meet its financial commitments.
Defined Benefit Obligation – The actuarial present value, without deducting any plan assets, of expected future payments required to settle the obligation resulting from employee service in the current and prior periods.
Derivative Instruments – Financial contracts that derive their value from changes in interest rates, foreign exchange rates, credit spreads, commodity prices, equities, market indexes or other financial measures. Such instruments include futures, interest rate, foreign exchange, equity, commodity and credit default swaps.
Effective Interest Rate – The rate that exactly discounts estimated future cash payments or receipts through the expected life of the financial instrument or, when appropriate, a shorter period, to the net carrying amount of the financial asset or financial liability.
Exposure at Default – Generally represents the gross exposure – outstanding amount for on-balance sheet exposure and loan equivalent amount for off-balance sheet exposure.
Facultative Reinsurance – Reinsurance provided on a transactional basis.
Foreign Exchange Risk – The risk of potential adverse impact on the value of financial instruments resulting from exchange rate movements.
Gross Loans Receivable – Principal amounts outstanding under existing loan agreements.
Hedge – A risk management practice used to manage interest rate or foreign exchange exposures arising from the normal course of business operations.
Individually Impaired Loans – Loans where there is objective evidence that an impairment loss has occurred.
Insurance Risk – The risk that the actual experience under an insurance policy does not follow what was anticipated at policy inception.
Interest Rate Risk – The risk that the fair value or future cash flows of a financial instrument will fluctuate because of changes in market interest rates.
LIBOR – London Inter-Bank Offered Rate – The interest rate at which banks in London are prepared to lend funds to first-class banks.
Loss Given Default – Measures the severity of loss on a facility in the event of a borrower’s default, expressed as a percentage of exposure at default.
Liquidity Risk – The risk that we would be unable to honour daily cash outflow commitments or the risk that we would have to obtain funds rapidly, possibly at an excessively high premium during severe market conditions.
Market Risk – The risk that the fair value or future cash flows of a financial instrument will fluctuate because of changes in market prices. Market risk comprises three types of risk: foreign exchange risk, interest rate risk and other price risk.
Net Finance Margin – Net financing and investment income expressed as a percentage of average income earning assets.
Net Financing and Investment Income – Revenue earned on financing, leasing, marketable securities and investment assets, less interest and leasing and financing related expenses.
Net Revenue – Net income excluding the provision for credit losses, claims-related expenses and administrative expenses.
Operational Risk – The risk of direct or indirect loss resulting from the organizational environment, external events, inadequate internal processes, people, or systems.
Performing Loans – Loans for which there is reasonable assurance that EDC can collect the principal and interest on time.
Productivity Ratio – Administrative expenses expressed as a percentage of net revenue excluding the unrealized gains and losses on long-term debt and derivatives as well as the impact due to fluctuations in the exchange rate from the rate projected in the Corporate Plan.
Probability of Default – Measures the likelihood that a borrower will default within a one-year time horizon, expressed as a percentage.
Structured Entity (SE) – An entity that has been designed so that voting or similar rights are not the dominant factor in deciding who controls the entity, such as when any voting rights relate to administrative tasks only and the relevant activities are directed by means of contractual arrangements.
Undisbursed Loan Commitments – A contractual amount under an existing loan agreement that has yet to be advanced to the borrower.