2014 getting to zero status update - new buildings...
TRANSCRIPT

RESEARCH REPORTJanuary 2014
2014 Getting to Zero Status Update: A look at the projects, policies and programs driving zero net energy performance in commercial buildings
David and Lucile Packard Foundation, Los Altos, California
Cour
tesy
: Jer
emy
Bitte
rman

new buildings institute | 2014 Getting to Zero Status Update
New Buildings Institute (NBI) would like to thank the many individuals and organizations that contributed to the development of the 2014 Getting to Zero Status Update. NBI is thankful to the many owners and design teams who compiled and forwarded information for review, especially Integral Group, EHDD and PAE Consulting Engineers. This research would not have been possible without their willingness to publically disclose their data for the benefit of improving future generations of buildings. The generous exchange of results showcases these leaders as early adopters whose efforts are helping move more buildings onto the path to zero. Their time and resources were essential to discovery of projects, actual energy performance, and technologies that can serve as exemplars for future projects.
The following NBI staff contributed to this report:
Lead Authors: Amy Cortese, Cathy HigginsLead Analyst: Mark LylesResearch Team: Amy Cortese, Mark Lyles, Barb HamiltonContributing Author: Dave HewittGraphics and Production: Connie Umphress, Stacey HobartNBI Executive Director: Ralph DiNola
Sponsors
Companies and organizations leading in the advancement of zero net energy performance in buildings are at the forefront of a transformation in the built environment. NBI would like to acknowledge the entities below for their support of our work in ZNE and this research report.
For more information about this report or about net zero energy in general, visit:
www.newbuildings.org/zero-energy

new buildings institute | 2014 Getting to Zero Status Update
Executive Summary . . . . . . . . . . . . . . . . . . . . . . . . . . . . . . . . . . . 1 Building Status . . . . . . . . . . . . . . . . . . . . . . . . . . . . . . . . . . . . . . . . . . 1 Design Strategies and Technologies. . . . . . . . . . . . . . . . . . . . . . . . . . . 3 Policies and Programs . . . . . . . . . . . . . . . . . . . . . . . . . . . . . . . . . . . . . 4 Characterizing Costs . . . . . . . . . . . . . . . . . . . . . . . . . . . . . . . . . . . . . . 4 Challenges. . . . . . . . . . . . . . . . . . . . . . . . . . . . . . . . . . . . . . . . . . . . . . 4 Recommendations and Conclusions . . . . . . . . . . . . . . . . . . . . . . . . . . 5
Introduction. . . . . . . . . . . . . . . . . . . . . . . . . . . . . . . . . . . . . . . . . . . . 7 Terminology: How You Define ZNE Matters . . . . . . . . . . . . . . . . . . . . . 7
How Many Are There?. . . . . . . . . . . . . . . . . . . . . . . . . . . . . . . . 10 The ZNE Verified List . . . . . . . . . . . . . . . . . . . . . . . . . . . . . . . . . . . . . 10 ZNE Buildings - Verified and Emerging. . . . . . . . . . . . . . . . . . . . . . . . 13 Measured Energy Performance . . . . . . . . . . . . . . . . . . . . . . . . . . . . . 19
Technologies and Strategies. . . . . . . . . . . . . . . . . . . . . . . . . 21 Design Approach and Strategies . . . . . . . . . . . . . . . . . . . . . . . . . . . . 22 Technologies . . . . . . . . . . . . . . . . . . . . . . . . . . . . . . . . . . . . . . . . . . . 25 Operations and Occupancy . . . . . . . . . . . . . . . . . . . . . . . . . . . . . . . . 28
Characterizing Costs . . . . . . . . . . . . . . . . . . . . . . . . . . . . . . . . . 30 NBI Findings . . . . . . . . . . . . . . . . . . . . . . . . . . . . . . . . . . . . . . . . . . . 30 Integral Group High Performance Buildings Cost Study . . . . . . . . . . . 30 California ZNE Cost Study . . . . . . . . . . . . . . . . . . . . . . . . . . . . . . . . . 31 Cost Summary. . . . . . . . . . . . . . . . . . . . . . . . . . . . . . . . . . . . . . . . . . 32
ZNE Policy Trends. . . . . . . . . . . . . . . . . . . . . . . . . . . . . . . . . . . . 33 Survey of State and Local Energy Officials . . . . . . . . . . . . . . . . . . . . . 33 Policy Pathways. . . . . . . . . . . . . . . . . . . . . . . . . . . . . . . . . . . . . . . . . 34
Findings Summary . . . . . . . . . . . . . . . . . . . . . . . . . . . . . . . . . . . 40Appendices . . . . . . . . . . . . . . . . . . . . . . . . . . . . . . . . . . . . . . . . . . . 45Appendix A: List of ZNE Emerging Buildings . . . . . . . . . . . . . . . . . . . . . . 46Appendix B: List of Ultra-low Energy Verified Projects . . . . . . . . . . . . . . . 51Appendix C: Research Method . . . . . . . . . . . . . . . . . . . . . . . . . . . . . . . . 54Appendix D: References . . . . . . . . . . . . . . . . . . . . . . . . . . . . . . . . . . . . . 56
Figures and TablesFigure 1: Number of ZNE Projects from 2012 to 2014 . . . . . . . . . . . . . . . . 1Figure 2: Percent of ZNE New Construction Projects and Existing Building Renovations . . . . . . . . . . . . . . . . . . . . . . . . . . . . . . . . . . . . . . . . . . . . . . 10Figure 3: Locations of ZNE Buildings and Districts . . . . . . . . . . . . . . . . . . 14Figure 4: Count of District ZNE Projects by Type . . . . . . . . . . . . . . . . . . . 15Figure 5: ZNE Buildings by Size . . . . . . . . . . . . . . . . . . . . . . . . . . . . . . . . 17Figure 6: ZNE Buildings by Type . . . . . . . . . . . . . . . . . . . . . . . . . . . . . . . 18Figure 7: Ownership Type of ZNE Buildings . . . . . . . . . . . . . . . . . . . . . . . 18
Table of Contents

new buildings institute | 2014 Getting to Zero Status Update
Figure 8: Measured EUI of ZNE and Ultra-low Energy Office Buildings 20Figure 9: Measured EUI of ZNE and Ultra-low Energy Educational Buildings . . . . . . . . . . . . . . . . . . . . . . . . . . . . . . . . . . . . . . . . . . . . . . . . . 20Figure 10: Energy and Solar Budget — Bullitt Center Seattle, WA . . . . . . 22Figure 11: Best Current Market Types for ZNE Policy or Program Support 34Figure 12: Most Likely Advocates For ZNE Policy . . . . . . . . . . . . . . . . . . 33
Table 1: ZNE Verified Buildings. . . . . . . . . . . . . . . . . . . . . . . . . . . . . . . . . 11Table 2: ZNE Totals from 2012 to 2014 Study . . . . . . . . . . . . . . . . . . . . . 13Table 3: Number of ZNE Buildings or Districts by State and in Canada 15Table 4: ZNE and Ultra-low Energy Projects from 2012 to 2014 Study 19

new buildings institute | 2014 Getting to Zero Status Update 1
Zero net energy (ZNE) buildings1 have captivated the minds of leading design firms, companies, schools, foundations and governments that are showing the way to a lower-carbon future. In just a few years ZNE has transitioned from an impossible concept to a quite probable future. ZNE buildings have now moved beyond a handful of small demonstration projects by universities or nonprofits to more widely mainstream building types and sizes.
This 2014 Getting to Zero Status Update presents the findings on ZNE and ultra-low2 energy buildings and districts across North America and builds on the Getting to Zero 2012 Status Update work by New Buildings Institute (NBI). The 2014 Getting to Zero Status Update is based on extensive research by NBI as well as input from many of the key organizations, states and design firms that are leading the ZNE market. This executive summary provides highlights of our findings. The lists of all buildings that were studied appear in the full report.
Building Status• The ZNE verified and ZNE emerging building count has more
than doubled. The number of buildings achieving ZNE verified performance or those targeting ZNE has more than doubled in just two years, from 60 in 2012 to a listing of 160 projects in this report, although the market is still very small.
• 24% of ZNE verified projects are renovated existing buildings. This is an interesting trend that provides validation of the potential for existing buildings to achieve ZNE through a major renovation.
1 Zero net energy buildings are buildings with greatly reduced energy load such that, averaged over a year, 100% of the buildings energy use can be met with onsite renewable energy technologies.2 Ultra-low energy buildings are comparable to ZNE buildings based on energy use, design strategies and efficiency technologies but do not have a stated goal of ZNE using onsite renewable energy.
Figure 1: Number of ZNE projects from 2012 to 2014
2012
2014
ZNE Verified Buildings and Districts
ZNE EmergingBuildings and Districts
Ultra-low EnergyBuildings (2012 report used label “ZNE-Capable”)
2139
33
39 53
127
Executive Summary
new buildings institute | 2014 Getting to Zero Status Update2
• ZNE buildings use only a quarter of the energy of average buildings. Measured energy consumption of the ZNE buildings is only about one-quarter of the average commercial building energy use today3. The average verified Energy Use Index (EUI)4 of these buildings is 21 kBtu/sf/yr.
• Large ZNE buildings are becoming more common. There has been a notable increase in the number of larger, more complex buildings. More than one quarter of the ZNE and ultra-low energy buildings are larger than 50,000 sf. Of those, half are over 100,000 sf. These larger buildings — which are more complex to design, construct and operate — clearly show the potential of ZNE for larger real estate properties.
• ZNE buildings are now in 36 states and two Canadian provinces. The number of states with ZNE buildings rose by 42%, from 26 states at the time of the 2012 report to 36 U.S. states and two Canadian provinces today. These locations reflect all eight of the U.S. Department of Energy (DOE) climate zones and demonstrate that ZNE can be built in most regions in North America. More than one-third of all ZNE and ultra-low energy buildings are in California, supported by aggressive state policy, utility programs and leading high performance design firms.
• There are ZNE examples in 16 different building typologies represented. Education comprises the largest portion of ZNE projects, with kindergarten through 12th grade (K-12), universities and general education buildings representing about one-third of all ZNE buildings, closely followed by offices. Low-rise multifamily buildings are a new trend in ZNE with over a dozen examples in this study. The building types represented also include some projects that are typically more energy intensive per square foot, such as laboratories, or unusual, such as airports.
• Districts are a growing trend toward scaled ZNE. In addition to the individual buildings, there is a new trend of communities and campuses adopting commitments to make groups of buildings ZNE. NBI identified 18 ZNE districts, with the U.S. Army and several universities as the leading owners.
• Public sector leads, but private sector adoption of ZNE is increasing. With two-thirds of all projects, government buildings and public schools comprise the largest ownership type of the ZNE dataset. Public building owners are motivated by the resiliency offered by ZNE buildings and the opportunity to educate citizens about the feasibility of ZNE performance with practical and tangible examples, especially in the case of schools. Public buildings are also first to be targeted in carbon reduction policies. Advancing on the lead in the public sector, private sector interest in ZNE is growing with 26% of the ZNE buildings in this study privately developed.
3 U.S 2003 Commercial Buildings Energy Consumption Survey (CBECS) average for non-mall buildings is 91 overall and 93 for offices.4 Energy Use Intensity (EUI) is a metric of whole building energy use expressed in kBTU/sf/yr.
Measured energy consumption of the ZNE buildings is only about one-quarter of the average commercial building energy use today.

new buildings institute | 2014 Getting to Zero Status Update 3
Design Strategies and TechnologiesA zero target appears to have an aspirational influence beyond that of traditional “percent-better-than-code” or point-based goals. The pursuit of an absolute performance outcome helps unify the development process and demands early and ongoing integrated design and attention to operations. Project design teams employed commonly available technologies and equipment rather than highly specialized or experimental technologies.
They cited the use of passive energy strategies that included efficient envelopes with increased insulation, natural and night flush ventilation, daylighting and controls, exterior window shading and operable windows. Engineering firms moved outside of the typical ”box” of variable air volume and package rooftop HVAC (Heating Ventilation and Air-conditioning) systems to radiant heating and cooling, chilled beams, variable volume refrigerant systems and dedicated outside-air ventilation to yield significant energy benefits by reducing fan energy. Ground-source heat pumps and heat recovery were also prominent.
Achieving ZNE performance is about more than careful design and installing the right technologies. Continuous attention to building controls and performance monitoring and feedback are key components in most projects. The role of occupants becomes critical in ZNE buildings as their activities influence the energy use through plug loads, schedules and equipment procurement. In a building designed for net zero energy, plug loads can account for as much as 50% of total building energy use as the efficiencies of heating, cooling, lighting and ventilation are dramatically improved.
Hood River Middle School Music and Science Building, Hood River, Oregon
Cour
tesy
: Mic
hael
Mat
hers

new buildings institute | 2014 Getting to Zero Status Update4
Policies and ProgramsPolicies and programs can dramatically change the landscape for ZNE buildings. Cities and states are leading the way, accompanied by community district efforts. Schools and public buildings have been identified as early targets for ZNE in several states, and public benefits program administrators have operated successful ZNE pilots in Oregon and California. Building codes are at the early stages of considering changes that could better support ZNE in the future, including a focus on stretch codes and establishing energy targets for buildings rather than prescriptive measures.
Many buildings in this study achieved Leadership in Energy and Environmental Design® (LEED) Gold or Platinum designation through the U.S. Green Building Council®, and eight have been recognized as meeting the International Living Future Institute’s™ Living Building Challenge™ or requirements for their Net Zero Energy Building Certification™. The 2030 Challenge has also prompted 2030 Districts that are now established in multiple cities with a long-term goal of zero-carbon buildings. The Northeast Sustainable Energy Association is raising the profile of ZNE in that region through membership, awards and recognition.
Characterizing CostsWhile this study’s focus was primarily on energy performance and trends, there are some consistent findings from the research of NBI and others:
• Costs for getting to zero are not distinguishable from overall project costs. Energy efficiency and renewable technologies do have specific costs, but the design and technology tradeoffs due to the advanced systems blur the line of incremental costs.
• Green, LEED and/or zero net energy building costs are within the range of other like-type buildings. When total construction costs for these buildings are analyzed against control groups, they are approaching comparable costs.
• Design firms and early targets reduce costs. The experience of the team and the explicit goal of ZNE throughout the process are cited as critical to managing costs.
Challenges At the building level. Despite excellent design and advanced systems, achieving a ZNE target remains elusive for some buildings due to operational and occupancy variations. For others the limitations of roof and site space for photovoltaics (PVs), or initial fiscal limits on the purchase of sufficient PVs, are impediments to actual zero energy operations. In some cases a ZNE target created hesitancy on the part of building owners to provide actual energy use to this study because the building had not yet been “successful” in achieving ZNE, even in buildings with exemplary, ultra-low energy performance.
The experience of the team and the explicit goal of ZNE throughout the process are cited as critical to managing costs.

new buildings institute | 2014 Getting to Zero Status Update 5
At the research level. Data presents a dilemma. Finding and gaining access to measured data is challenging, and often the data has errors or is incomplete. Despite decades of efficiency programs, green building programs and the more recent energy disclosure requirements, this information remains largely inaccessible. The recently released U.S. Department of Energy National Buildings Performance Database is encouraging, but all parties in the industry need to supply greater quantities of commercial building data.
Recommendations and Conclusions The path to zero is a path to carbon reduction. It is imperative to evolve from a narrow path traveled by few to a broad, smooth road that will accelerate the pace and volume of projects getting to zero. The development of this report suggests some recommendations; other reports by NBI, the Zero Energy Commercial Buildings Consortium and other organizations contain more detailed recommendations to advance ZNE.
1. Encourage ZNE districts. District- or community-scale projects are increasing, and policies, programs, and planning departments need to respond and help create this opportunity. ZNE districts — as well as definitions that recognize shared, rather than just onsite, systems and renewables — will be important to serve urban areas and existing buildings where ZNE achievement on a building scale can be especially challenging.
2. Develop standard data collection protocols for all programs and pilots. More robust data is needed to facilitate learning from early examples to educate and expand the market. Benchmarking and disclosure policies are an appropriate place to start.
Coastal Maine Botanical Gardens Bosarge Family Education Center, Boothbay, ME
Cour
tesy
: Mac
lay
Arch
itect
s

new buildings institute | 2014 Getting to Zero Status Update6
3. Develop a building energy codes roadmap. If ZNE buildings are to become commonplace or standard, they must be supported and/or required by building codes. A roadmap builds the ZNE strategy over time as the market progresses in its understanding of the necessary design, construction and operational strategies, and as costs of achieving ZNE are reduced and the value of achieving ZNE is better understood.
4. Expand utility programs to support ZNE. Initial pilot program efforts in California and Oregon have been successful in creating more ZNE and ultra-low energy buildings. There is market interest in ZNE, and these early efforts illuminate lessons learned that should be emulated by others.
5. Target schools and public buildings for pilots and demonstration projects. These markets are already shown to be early adopters and can provide a broad base of constituents with practical and tangible examples of low- and zero-energy buildings.
6. Support the achievement of ZNE in existing buildings. While a number of fully renovated existing buildings have shown that ZNE can be achieved in existing buildings, tools and prototypes are needed to streamline decision making and prove there are simpler and easier ways to reach ZNE, especially for common building types.
7. Conduct additional research to bridge the gap from design to operations. ZNE outcome is highly dependent on the decisions and actions of the operator and occupants. New relationships between design and post-occupancy energy use are needed.
NBI’s 2014 Getting to Zero Status Update shows that low energy use is the foundation to ZNE buildings and that low and zero energy are being achieved today in buildings of all types, sizes and locations. All of the individuals and firms involved in the 213 ZNE and ultra-low energy buildings and districts in this report, as well as the early developers of programs and policies, deserve recognition for their efforts to achieve dramatic improvements in energy performance. They are paving the path to zero for many others to follow.

new buildings institute | 2014 Getting to Zero Status Update 7
Zero net energy (ZNE) buildings, those that consume no more energy over the course of a year than they generate with onsite renewable sources, are a growing trend in the commercial building industry. The goal of zero energy buildings provides an aspirational and clear focus for owners and design teams and underscores the importance of ongoing attention to operations and occupancy — energy end uses that are currently not regulated in energy codes yet are critical to low energy performance.
Documented cases of achieving ZNE are increasing, and more projects are in the pipeline at the planning, construction or early operations phases. In the two years since New Buildings Institute published its Getting to Zero 2012 Status Update: A First Look at the Costs and Features of Zero Energy Commercial Buildings the number of ZNE buildings has increased by 52%, and projects on the path to zero have increased by 182%.
Low energy buildings are the foundation for those taking the path to ZNE and set the stage for the most practical level of renewable energy technologies to be applied at the building or site. The 2014 Getting to Zero Status Update highlights the growing trends of ZNE buildings and districts. The report also includes valuable, whole-building measured energy performance data for both ZNE and ultra-low energy (defined below) buildings. All of the highlighted projects are pursuing an aggressive goal with a wide range of variables that can make getting to zero elusive despite best practices. Some projects will not achieve this goal in the first year and may be fine-tuning operations or adding photovoltaics for success in subsequent years. Regardless of whether a project ultimately achieves zero net energy or simply comes close, all these examples have something to teach commercial building professionals, owners and policy makers about our capability of creating a built environment with extremely low energy needs and low carbon outputs.
Terminology: How You Define ZNE MattersThere are multiple zero-energy-related definitions scattered throughout the energy industry, nonprofit organizations and in the design, construction and ownership communities. NBI recognizes the benefit of consistent terms but also the reality of preferences and need for diversity to address varying scenarios and entities. The topic of terms and definitions is evolving at the national, regional and state levels. Those selected by NBI for use in this study are explained below.
Zero Net Energy Buildings are buildings with greatly reduced energy loads such that, averaged over a year, 100% of the building’s energy use can be met with onsite renewable energy technologies. In this study ZNE is comprised of ZNE verified buildings, ZNE Emerging buildings and ZNE Districts as defined below.
ZNE Verified buildings (or districts) have been documented to have met, over the course of a year, all net energy use through onsite renewables. The energy use of all fuels (electric, natural gas, steam, etc.) is counted and offset by production from onsite renewables.
Introduction
Low energy buildings are the foundation for those taking the path to ZNE. They set the stage for the most practical level of renewable energy technologies to be applied at the building or site.

new buildings institute | 2014 Getting to Zero Status Update8
ZNE Emerging buildings (or districts) have a publically stated goal of ZNE but do not yet meet the definition of ZNE verified. These may be in the planning or design phase, under construction or have been in operation for less than a year. Others may have been operating for 12 months or longer, but their measured energy has either yet to achieve net zero or the measured data to document ZNE verified status was not available for this study.
ZNE Districts are groups of buildings such as a city district, community or campus with a stated goal of ZNE. They might be verified or emerging according to the definitions above and are counted as a single project for purposes of this study. The quantity of buildings in the districts was not known for this report.
Ultra-low Energy Buildings in this report are all “verified” in that they have shared, with NBI or publically, 12 or more months of measured energy use data that documents energy performance dramatically better than the industry average. This serves to increase the data set of measured performance. Ultra-low energy buildings are comparable to ZNE buildings based on type, energy use, design strategies and technologies but do not have a stated goal of ZNE and do not meet all their energy needs with onsite renewables, although they may have renewable resources onsite. In some cases they have provided the structure and wiring that will easily incorporate photovoltaics at a later date.
Walgreens ZNE Store, Evanston, Illinois
Cour
tesy
: Wal
gree
ns

new buildings institute | 2014 Getting to Zero Status Update 9
Energy Use Intensity (EUI) is a metric of total building energy use commonly used in benchmarking. EUI is the sum of all fuels used in the building per year divided by the building’s floor space and is expressed in thousands (kilos) of British Thermal Units (BTUs) per square foot (sf) of occupied space per year (i.e. 25 kBtu/sf/yr). This study relies solely on site EUI, as opposed to source EUI that includes energy from transmission and production. National average EUIs for commercial building energy use are from CBECS5.
Verified How? NBI accepted three methods for verification. The first method applied to the majority of buildings, with NBI staff reviewing monthly measured energy consumption data for all fuels and the renewable energy production data as provided by the ownership/design team. The second approach was representation by a third-party entity of the measured data via an evaluation report, published article, presentation, or citation in an award or other public forum. The third verification method accepted in this research was through the International Living Future Institute (ILFI) as part of the Living Building Challenge or Net Zero Energy Building Certification. The ILFI definition requires 100% of the project’s site energy to be carbon neutral (zero direct use of gas and other fossil-based fuels at the site) and supplied by renewable energy on a net annual basis.
NBI’s ZNE verification for this study does not restrict gas or other fuels but required that all fuels be accounted for in the whole building energy total EUI. Documented onsite renewable production must then equal or exceed the energy use of all fuels over the course of a year. Verification of the actual energy performance of buildings has long been part of NBI’s work to research and recognize best practices and leaders and to increase measured performance feedback that can improve the next generation of buildings. NBI’s ZNE and ultra-low energy building registry is publicly available for owners and design firms to submit buildings for ongoing studies and verification.
To submit a high performance building project, visit: www.newbuildings.org/share
Additional discussion of the data sources, research and verification methods is in Appendix C.
5 The U.S. Energy Information Agency’s 2003 Commercial Building Energy Use Survey (CBECs)

new buildings institute | 2014 Getting to Zero Status Update10
The ZNE Verified ListThe ZNE target drives an interest in, and need to measure, actual performance. Actual energy results provide the proof of performance that can influence additional projects to be ZNE. There are 32 ZNE verified buildings and one ZNE verified community district6 included in this research. Table 1 lists these 33 projects and provides general characteristics (location, size and type) as well as energy consumption and renewable energy production data. This set of ZNE verified buildings has a highly impressive average EUI of just 21 kBtu/sf/year — just one quarter of the national average for commercial buildings7. Overall EUIs for most of the verified buildings range from 3 to 33 kBtu/sf/year8. Further discussion is in the Measured Energy Performance section on page 19.
Net energy use is represented in the equation:
The Energy Equation: Renewable EUI is a representation of onsite energy production from renewables; Net EUI is the difference between the energy consumed and energy produced at the site. A zero net EUI means the building is producing the same energy as it consumes over a year, while a negative symbol indicates its use is less than its production (also called Net Positive).
Notable are the number of renovation projects on the ZNE verified list. As shown in Figure 2, almost one quarter of the ZNE verified
projects are renovations. Of these eight projects, six are small offices, one is a public assembly and one is a district with
multiple buildings. This demonstrates the applicability of ZNE during a major renovation or building renewal.
6 Anna Maria Historic Green Village is made up of former single-family homes renovated to meet ZNE as small mixed-use commercial with retail. In this study districts are counted as a single project. 7 CBECS average for non-mall buildings is an EUI of 91 kBtu/sf/yr.8 Of the three outliers, one had a low EUI of 0.1, and two were high at 48 and 92 kBtu/sf/yr.
How Many Are There?
19 - 19 = 0BUILDING’S TOTAL EUI
RENEWABLE PRODUCTION EUI
BUILDING’S NET EUI
Figure 2: Percent of ZNE New Construction Projects and Existing Building Renovations
Percent of ZNE Projects in Existing Buildings (Renovations)
Renovations
24%
New Construction
76%

new buildings institute | 2014 Getting to Zero Status Update 11
Year Completed
Name Location State Building Type Size (sf)
Total Building Actual
EUI
Site Renewable
EUI
Net Building
EUI
2000Oberlin College Lewis Center
Oberlin OH Education- higher 13,600 32 36 -4
2001Environmental Technology Center Sonoma State
Rohnert Park CA Education- higher 2,200 3 4 -1
2002Challengers Tennis Club Los Angeles CA Other 3,500 9 9 0
Leslie Shao-Ming Sun Field Station
Woodside CA Education- higher 13,200 4 6 -2
2003Audubon Center at Debs Park
E Los Angeles CA Other 5,020 17 17 0
Science House St. Paul MN Other 1,532 18 18 0
2005Hawaii Gateway Energy Center
Kailua-Kona HI Other 5,600 28 31 -3
2007Aldo Leopold Legacy Center
Baraboo WI Office 11,884 16 18 -2
IDeAs Z2 Design Facility (1) San Jose CA Office (R) 6,557 21 25 -4
2008
Camden Friends Meeting Social Hall
Camden DE Public Assembly 2,864 18 20 -2
Environmental Nature Center
Newport Beach
CA Other 8,535 18 28 -10
Hudson Valley Clean Energy Headquarters
Rhinebeck NY Other 5,470 13 13 0
2009
Bacon Street Offices San Diego CA Office (R) 4,500 13 22 -9
Chrisney Library Chrisney IN Library 2,400 15 18 -3
Living Learning Center at Tyson Research Center (1)
Eureka MO Education- higher 2,968 24 24 0
Omega Center for Sus-tainable Living (1)
Rhinebeck NY Other 6,200 13 21 -8
Pringle Creek Painter’s Hall (1)
Salem ORPublic Assembly
(R)3,600 21 21 0
Putney Field House Putney VT Education- K-12 16,800 10 10 0
Table 1: ZNE Verified Buildings
(R) - Indicates a building renovation project. UA - Building EUI and Renewable EUI information is unavailable, but the overall net was verified. (1) - Building is ZNE certified by the International Living Future Institute
2014 List of Zero Net Energy Verified Buildings

new buildings institute | 2014 Getting to Zero Status Update12
Year Completed
Name Location State Building Type Size (sf)
Total Building Actual
EUI
Site Renewable
EUI
Net Building
EUI
2010
Bertschi School Science Wing (1)
Seattle WA Education- K-12 1,425 48 48 0
Dovetail Construction Headquarters Barn
Richmond VA Office (R) 6,800 UA UA 0
DPR Construction San Diego Net Zero Office
San Diego CA Office (R) 24,000 15 17 -2
Energy Lab at Hawaii Preparatory Academy (1)
Kamuela HI Education- K-12 5,902 11 11 0
Hood River Middle School Net-Zero Addition
Hood River OR Education- K-12 5,331 27 27 0
NREL Research Support Facility
Golden CO Office 222,000 33 33 0
Richardsville Elementary School
Bowling Green
KY Education- K-12 72,285 18 18 0
2011
Anna Maria Historic Green Village
Anna Maria FL District (R) District 28 35 -7
Locust Trace AgriScience High School Campus
Lexington KY Education- K-12 70,000 10 11 -1
TD Bank Branch - Ft Lauderdale
Fort Lauderdale FL Other 3,970 92 96 -4
Vacaville Transportation Center
Vacaville CA Other 261,360 0.1 0.2 -0.1
ZHome - Issaquah (1) Issaquah WA Multifamily 5,813 21 22 -1
2012
David and Lucile Packard Foundation
Los Altos CA Office 49,161 24 28 -4
DPR Construction Phoenix Regional Office (1)
Phoenix AZ Office (R) 16,533 27 30 -3
Leon County Cooperative Extension
Tallahassee FL Office (R) 13,000 19 19 0
(R) - Indicates a building renovation project. UA - Building EUI and Renewable EUI information is unavailable, but the overall net was verified. (1) - Building is ZNE certified by the International Living Future Institute

new buildings institute | 2014 Getting to Zero Status Update 13
ZNE Buildings: Verified and EmergingZNE buildings include the ZNE verified list in Table 2 above as well as ZNE Emerging buildings (or Districts) listed in Appendix A. ZNE emerging buildings or districts have a publically stated goal of ZNE but do not yet meet the definition of ZNE verified. These may be in the planning or design phase, under construction or have been in operation for less than a year. Others may have been operating for 12 months or longer, but their measured energy has either yet to achieve net zero or the measured data to document ZNE verified status was not available for this study.
The status of ZNE buildings show clear growth in every category previously reviewed for the Getting to Zero 2012 Status Update. In this 2014 Getting to Zero Status Update, NBI found a total of 160 ZNE buildings and districts compared to 60 in the 2012 report. The ZNE totals for 2014 include 32 buildings and one district that have verified energy performance and 110 buildings and 17 districts that are emerging projects. The 2014 ZNE Emerging list shows the greatest increase — a 182% increase from the 39 buildings identified in 2012. These totals are summarized in Table 2.
Table 2: ZNE Totals from 2012 to 2014 Study
Year ZNE Verified ZNE Emerging Total ZNE ProjectsBuildings Districts Buildings Districts2012 21 39 602014 32 1 110 17 160
renovation snapshot DPR San Diego Office
DPR rehabbed a near-obsolete, 1984 build-ing into a vibrant, zero-net-energy multi-tenant office. DPR’s new 24,000 SF, LEED® Platinum tenant improvement includes an open office space along with 11 conference rooms, a large gathering area and a space dedicated to building information modeling technology. The building takes advantage of the mild climate, relying on cross and stack ventilation strategies that significantly
Building Size: 33,400 SFDPR Office Size: 24,000 SFLocation: San Diego, CaliforniaConstruction Type: RenovationConstruction Year: 1984, 2010Building Type: Small OfficeCA Climate Zone: 7
reduce the amount of time the mechanical HVAC system is used.
Improving the penetration of natural light was a main focus of the tenant improve-ment project. Natural light now fills the space, unlike before the renovation when acoustic tiles and an eight-foot ceiling height minimized daylighting opportuni-ties. Strategies include the addition of 36 Solatubes, operable roof monitors and skylights and glass garage-style doors Stripping the film from the existing windows also increased the amount of light. Energy is saved due to photosensors that automatically turn off electric lights when 30 footcandles are available from daylighting. Occupants can control their own task lights.
Cour
tesy
: Dav
e He
witt
Cour
tesy
: Ann
e Ga
rriso
n

new buildings institute | 2014 Getting to Zero Status Update14
Figure 3: Locations of ZNE Buildings and Districts
AL
AZ
AR
CA CO
CT
DE
FL
GA
ID
IL IN
IA
KSKY
LA
ME
MD
MAMI
MN
MS
MO
MT
NENV
NH
NJ
NM
NY
NC
ND
OH
OK
OR
PARI
SC
SD
TN
TX
UT
VT
VA
WA
British Columbia, Canada
Quebec, Canada
WV
WIWY
HI
AK
11
1
1
1
11
1
1
1
1 2
2
2
2
2
3
#
10
Number of ZNE Verified Buildings States with ZNE Emerging or Verified Buildings
Locations. ZNE buildings and districts are located in 36 U.S. states and Canada. In Figure 3 the 36 states with ZNE buildings — either verified or emerging — have a dark solid color and reflect a wide variety of climate zones9. ZNE Verified buildings are located in 17 states and the quantity per state is shown in the circle. California is a leader with ten ZNE Verified buildings, and Florida has three.
Table 3 provides further details on the ZNE building and district count by locations. Although California is a major leader with 47 total ZNE projects, there is broad geographical diversity by region there are now ZNE buildings in all eight of the U.S. DOE major climate zones.
9 The project locations cover all U.S. Department of Energy Climate Zones

new buildings institute | 2014 Getting to Zero Status Update 15
National HistoricSite & Campus
Neighborhood Mixed Use
Types of ZNE Districts18 multiple-building projects
8Military
81 1
Campus
Figure 4: Count of District ZNE Projects by Type
Districts. In the Getting to Zero 2012 Status Update lessons from single buildings were described as a pathway to achieving zero-energy goals on a district or regional basis. Today that is happening as adoption of ZNE targets across a set of multiple buildings is a growing trend.
One ZNE district on the verified list — the Anna Maria Historic Green Village in Florida — has documented ZNE performance for their set of renovated buildings but is also targeting ZNE in small-scale mixed-use commercial and retail. There are 17 additional district-scale projects on the ZNE Emerging list (Appendix A) that have commitments across multiple buildings to get to zero net energy performance. Figure 4 shows that many of these are military properties resulting from the U.S. Army ZNE Pilot Initiative at eight sites across the United States. Universities and community colleges are also setting goals to get their campus buildings to net zero including eight district-scale projects on the list. The synergies of bundling sets of buildings is a
natural and efficient strategy to leverage economies of scale from design, financial, district heating/cooling and energy production systems.
For districts there is a need to look beyond the definition of renewable energy produced only at the specific building. District-scale systems can be less expensive to construct and may offer benefits in terms of maintenance and reliability. For existing buildings in urban settings, onsite solar may be difficult or impossible due to space limitations, shading from neighboring structures and/or the need to serve large, multi-story buildings with limited roof area. The unique requirements and barriers of district-scale systems require more investigation, but they should
be included as an option to meet ZNE goals.
In addition to the ZNE districts identified above, there are five current 2030 Districts10. In Pittsburgh, Seattle, Cleveland,
Boston and Denver groups of building owners have joined forces
10 2030 Challenge
Table 3: Number of ZNE Buildings or Districts by State and in Canada
State ZNE Verified
ZNE Emerging
Total ZNE Projects
AZ 1 5 6CA 10 37 47
Canada 6 6CO 1 6 7DE 1 1FL 3 5 8GA 1 1HI 2 2 4IA 1 1IN 1 1IL 2 2KS 1 1KY 2 1 3
State ZNE Verified
ZNE Emerging
Total ZNE Projects
MA 6 6MD 2 2ME 2 2MI 1 1MN 1 1 2MO 1 1NC 5 5NE 1 1NH 1 1NV 1 1NY 2 6 8OH 1 1 2OR 2 8 10
State ZNE Verified
ZNE Emerging
Total ZNE Projects
PA 2 2RI 1 1SC 1 1TN 2 2TX 7 7UT 2 2VA 1 2 3VT 1 1 2WA 2 3 5WI 1 3 4WV 1 136
states 33 127 160

new buildings institute | 2014 Getting to Zero Status Update16
district snapshot
Anna Maria Historic Green Village
The Anna Maria Historic Green Village is an unusual combination of historic preservation and modern technology. Owners, Mike and Lizzie Thrasher have worked diligently to pre-serve four 100-year old buildings and merge history with state of the art green technol-ogy all while bringing jobs and economic development to local residents. The aim of the Historic Green Village is to prove the vi-ability of advanced technologies and to serve
Number of Buildings: 4 historic Total Building Size: 8,000 SFLocation: Anna Maria Island, Florida Construction Type: renovationConstruction Year: 1911/1915, 2012Building Type: Multi-use District Climate Zone: 2A
to designate urban areas committed to meeting significant energy, water and transportation emissions reduction targets. These districts have made commitments to the ultra-low energy outcomes shown in this report and together represent over 100 million sf of commercial space. This private-sector leadership and shared resources is a gateway for market transformation and the potential for getting to ZNE.
Size. Large ZNE buildings (those 50,000 sf or larger) are increasing. In 2012 only a dozen large buildings were ZNE; now there are 29, 16 of which are over 100,000 sf11. Of the 142 ZNE buildings in this study12 NBI was able to obtain accurate floor area for 104. The sizes of these 104 are shown in Figure 5, with large buildings making up 28% of this dataset. Buildings under 25,000 sf remain the highest proportion with 62% of the total.
11 Two of the buildings over 100,000 sf are warehouses.12 Districts are not included in the Buildings By Size Figure.
as an inspiration for all those to follow. The net zero aspects of the project are guided by three key components: (1) insulation, (2) geothermal and (3) renewable energy.
Insulation is one of the key aspects of Anna Maria Historic Green Village. Every structure is insulated above code levels and has high performance windows. One small 1,000 SF building is so super-insulated that its total electric bill never exceeds $20/month. A geothermal system uses the constant 72 degree aquifer on the barrier island to reject heat from air conditioning which is more ef-ficient than transferring heat into humid air. The Historic Green Village also includes 17 solar inverters on arrays totaling over 90 kW for an annual savings of $11,200/year.
Cour
tesy
: Ray
mon
d Ka
iser

new buildings institute | 2014 Getting to Zero Status Update 17
Use Types. The variety of ZNE building use types has more than doubled since the 2012 report with 16 different ZNE building types shown in Figure 6. Education buildings make up the largest portion — 36% — of the ZNE buildings and districts. Of the 58 education buildings, 32 are kindergarten through 12th grade, 21 are higher education and five are general education. Office buildings also comprise a large segment (19%) of the ZNE data set. Of the 30 ZNE office buildings, nine are verified and 21 are emerging.
Low-rise multifamily projects have begun to pursue ZNE. There are 12 multifamily projects that are ZNE emerging and one that has been verified. Within the ZNE Emerging districts two additional projects indicated that they include multifamily13. In addition, there are some multifamily projects taking a step toward ZNE by adopting zero net electric.14 While these projects do not meet NBI’s ZNE definition for this study, which includes all fuels to be zero net energy, they can provide some possible lessons and insights for full ZNE through their efforts.
13 It is not known, through this study, if the Military ZNE Districts include housing. 14 Colorado Court, Solara and Los Vecinos — all affordable housing projects in California — are examples of zero net electric projects.. NBI tracks these as ultra-low energy but this study lists only those that have verified energy data.
Figure 5: ZNE Buildings by Size
0 5 10 15 20 25
over 100k sf
50k-100k sf
25k-50k sf
5k-10k sf
1k-5k sf
10k-25k sf
ZNE Buildings by Size
ZNE Emerging
ZNE Verified
n=104
Build
ing
sf

new buildings institute | 2014 Getting to Zero Status Update18
Figure 6: ZNE Buildings by Type
0 5 10 15 20 25 30 35
ZNE EmergingZNE Verified
Education–K-12
Office
Education–Higher
Other
Multifamily
District
Public Assembly
Education–General
Retail
Library
Laboratory
Warehouse
Public Order–Safety
Airport
Mixed Use
Office-Other
Build
ing
Type
ZNE Building by Type
7%
26%
67%
Non-profitsPrivatePublic
Ownership Types of ZNE Buildings
Figure 7: Ownership Type of ZNE Buildings
Education. The impact of schools and universities as early leaders in ZNE has influence on the entire marketplace and an especially powerful effect on the next generation of citizens and leaders. Education buildings offer highly visible projects that are seen by a wide range of community members.Success stories of public funds that return lower operating costs and healthier student environments provide documentation that can be leveraged by others. At over 10 billion square feet, education buildings are the fourth largest use of building floor space in the U.S. This sector offers national and
regional education forums and associations that can facilitate the transfer of best design and operational practices.
Ownership. A rise in private development of ZNE buildings is a trend that shows that some market entities have
determined a there is a business rationale to moving their real estate assets to zero energy. Of the 160 ZNE buildings and districts, over 25% are privately owned and developed, as shown in Figure 7.

new buildings institute | 2014 Getting to Zero Status Update 19
Year ZNE Verified
Buildings & DistrictsZNE Emerging
Buildings & DistrictsUltra-low Energy
BuildingsTotals
2012 21 39 39 99
2014 33 127 53 213
Table 4: ZNE and Ultra-low Energy Projects from 2012 to 2014 Study
Measured Energy PerformanceIn this section the measured performance of ZNE verified, emerging and of ultra-low energy buildings is looked at compared to like-type buildings. All ZNE verified projects have measured performance data, while only some of the ZNE emerging projects do — for example, those that have been in operation, but perhaps have not hit the ZNE target yet. The ultra-low energy buildings are also added to this data set. Ultra-low energy buildings provide the same sets of lessons on performance outcomes, increase the number of projects with measured performance in the data set, and warrant recognition for their accomplishments. Appendix B provides a complete list of the ultra-low energy buildings, their characteristics and measured performance energy use.
From 2012 to 2014, the increase in the number of overall projects identified in these studies that are targeting and achieving ZNE and comparable ultra-low energy buildings has more than doubled from 99 in 2012 to 213 in this current study as indicated in Table 4.
Offices. Using measured performance data from the ZNE and ultra-low energy lists, one begins to get an understanding of what performance targets are achievable today. Figure 8 shows the EUI of the 25 new construction and office renovation projects. The ‘Average Building’ number (noted by a dotted horizontal line) is taken from CBECS (the source most often used to represent typical building energy use) and is 93 kBtu/sf/yr for office buildings15.
The range of EUI for any office with measured performance in this building dataset is from 13 to 33 kBtu/sf/yr. The average EUI for all of the ZNE verified office projects is only 19 kBtu/sf/yr — over 75% below the national average. Even the average ultra-low energy office is a mere 24 kBtu/sf/year, still well below the national average.
15 A code building would represent an even more comparative metric but requires that buildings be grouped by the code applicable to their project at the time of construction — a level of analysis and information not available within this study.

new buildings institute | 2014 Getting to Zero Status Update20
Figure 9: Measured EUI of ZNE and Ultra-low Energy Educational Buildings
0
20
40
60
80
100
ZNE Verified
1 2 3 4 5 6 7 1 2 3 4 5 6 7 8 9 10 11 12 13 14 15 16 17 18 19 20 212223
ZNE Emerging Ultra-low Energy
EU
I(kB
tu/s
f/yr
)
Education-Higher Education-K-12
Measured EUIs of Educational Buildings
CBECS Education Average
0
20
40
60
80
100
ZNE Verified Office
1 2 3 4 5 6 7 8 9 10 11 12 13 14 15 16 17 18 19 20 21 22 23 24
ZNE Verified Office Retrofit
ZNE Emerging Office Retrofit
Ultra-low Energy Office
Ultra-low Energy Office Retrofit
EU
I(kB
tu/s
f/yr
)
CBECS Office Average
Measured EUI of Offices
Figure 8: Measured EUI of ZNE and Ultra-low Energy Office Buildings
Education. Figure 9 shows EUIs for educational building projects split between K-12 and higher education. Again, the CBECS values of 83 kBtu/sf/yr for education buildings is represented by a dotted horizontal line. All but one of the education buildings are operating at less than half the national average.
ZNE verified education buildings have a larger EUI range (from 3-48 kBtu/sf/yr). This represents a diversity of uses within the education sector ranging from buildings that may not be continuously occupied to those that focus on higher energy uses, such as science facilities. Despite this range, the average ZNE K-12 education building has a EUI of just 22 kBtu/sf/yr. Ultra-low energy buildings EUIs range from 19 to 40 with an average EUI of only 27.
new buildings institute | 2014 Getting to Zero Status Update 21
All of the projects highlighted in this study use design approaches and state-of-the-shelf technology already proven and readily incorporated into most high performance buildings. Most of these buildings also include passive design features that have been used for centuries: higher window head heights to allow daylight deeper into the building, the use of daylight as the primary light source, orientation to solar and shading to control heat and light, natural ventilation and operable windows, passive and evaporative cooling, and individual control.
Resulting low energy outcomes are highly dependent on two factors that go beyond the scope of codes, design and construction — operations and occupancy. In most of these buildings the occupants are engaged in the green objectives of both the space and building, plug load strategies are incorporated, and operators are continually maintaining and modifying systems to ensure optimum performance.
Several efforts used in these high performance buildings should be adopted more broadly, including design team involvement during the initial year of operations, ZNE-specific commissioning and the actual implementation of a measurement and verification plan. Operations team and occupant training and engagement are also key. Project teams noted that it takes all of these strategies during the occupancy phase to get to ZNE.
This section gives an overview of the methods most commonly used in three categories: 1) Design Approach, 2) Technologies, and 3) Operations and Occupancy. It’s important to note that these trends are based on published
Technologies and Strategies
technology snapshot
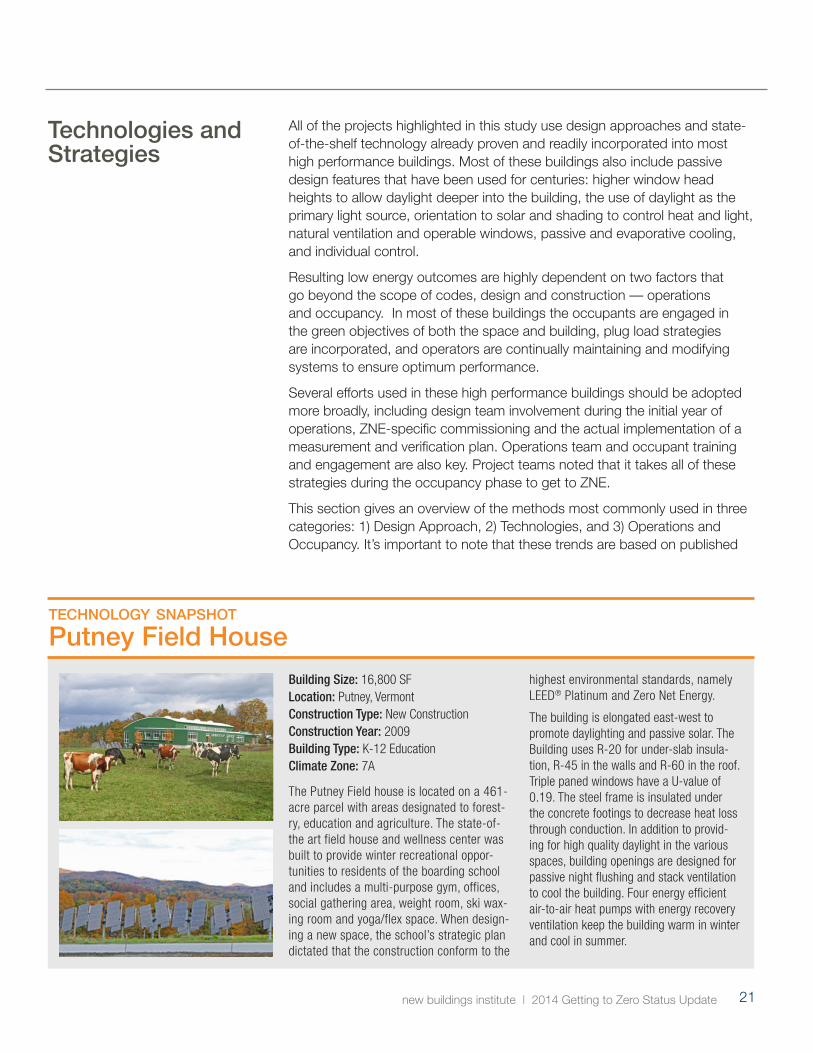
Putney Field House
The Putney Field house is located on a 461-acre parcel with areas designated to forest-ry, education and agriculture. The state-of-the art field house and wellness center was built to provide winter recreational oppor-tunities to residents of the boarding school and includes a multi-purpose gym, offices, social gathering area, weight room, ski wax-ing room and yoga/flex space. When design-ing a new space, the school’s strategic plan dictated that the construction conform to the
Building Size: 16,800 SFLocation: Putney, VermontConstruction Type: New ConstructionConstruction Year: 2009Building Type: K-12 Education Climate Zone: 7A
highest environmental standards, namely LEED® Platinum and Zero Net Energy.
The building is elongated east-west to promote daylighting and passive solar. The Building uses R-20 for under-slab insula-tion, R-45 in the walls and R-60 in the roof. Triple paned windows have a U-value of 0.19. The steel frame is insulated under the concrete footings to decrease heat loss through conduction. In addition to provid-ing for high quality daylight in the various spaces, building openings are designed for passive night flushing and stack ventilation to cool the building. Four energy efficient air-to-air heat pumps with energy recovery ventilation keep the building warm in winter and cool in summer.
new buildings institute | 2014 Getting to Zero Status Update22
and/or provided representations as well as outreach and communication with design teams or owners. Also, this study did not include details on types of renewable equipment, renewable metering and building integration components. Deeper research to investigate the frequency of the solutions, selection process and measured outcomes at the system level would be a valuable next step to provide key lessons, validation and ongoing education.
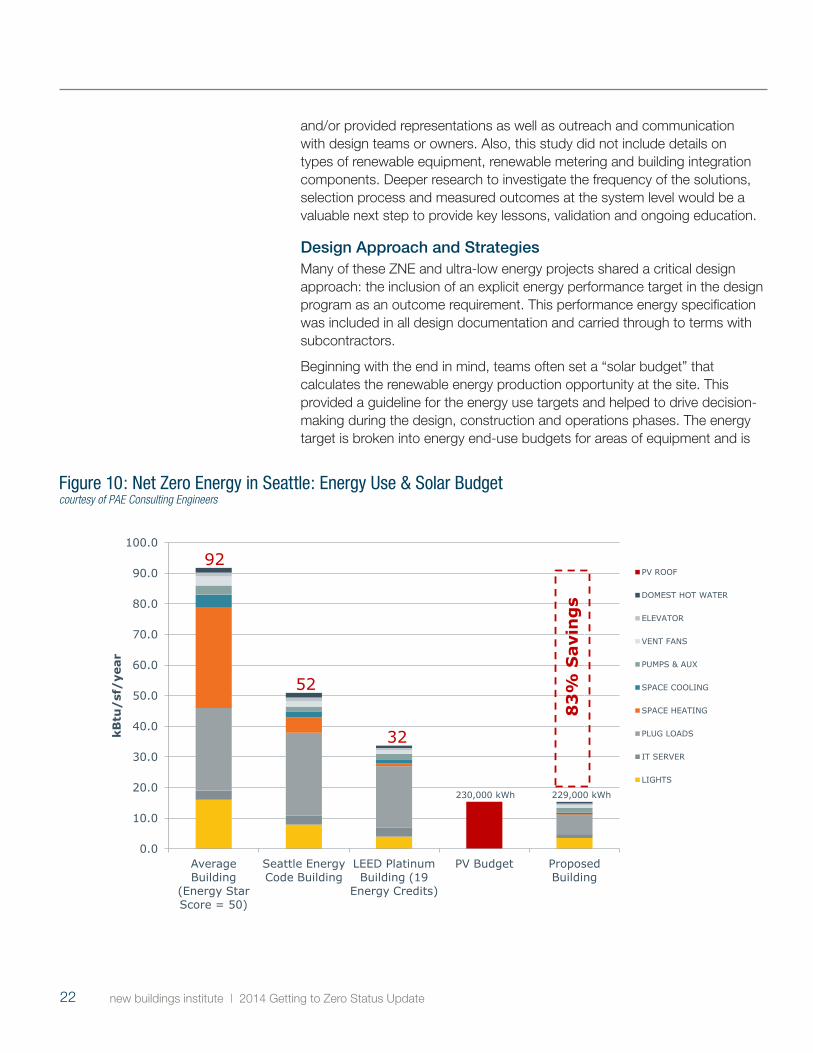
Design Approach and StrategiesMany of these ZNE and ultra-low energy projects shared a critical design approach: the inclusion of an explicit energy performance target in the design program as an outcome requirement. This performance energy specification was included in all design documentation and carried through to terms with subcontractors.
Beginning with the end in mind, teams often set a “solar budget” that calculates the renewable energy production opportunity at the site. This provided a guideline for the energy use targets and helped to drive decision-making during the design, construction and operations phases. The energy target is broken into energy end-use budgets for areas of equipment and is
0.0
10.0
20.0
30.0
40.0
50.0
60.0
70.0
80.0
90.0
100.0
Average Building
(Energy Star Score = 50)
Seattle Energy Code Building
LEED Platinum Building (19
Energy Credits)
PV Budget Proposed Building
kBtu
/sf
/ye
ar
PV ROOF
DOMEST HOT WATER
ELEVATOR
VENT FANS
PUMPS & AUX
SPACE COOLING
SPACE HEATING
PLUG LOADS
IT SERVER
LIGHTS
230,000 kWh 229,000 kWh
Net Zero Energy in Seattle Energy Use + Solar Budget
92
52
32
83
% S
avin
gs
Figure 10: Net Zero Energy in Seattle: Energy Use & Solar Budgetcourtesy of PAE Consulting Engineers

new buildings institute | 2014 Getting to Zero Status Update 23
In some cases the owner began with an interest in a high performance or high profile building … In other cases, leading design firms were the gateway to the ZNE concept for owners and served as the catalyst for these exceptional projects.
critical to understanding how energy will be used in the building, including by occupants and their plugged-in devices. Figure 10 illustrates how the energy use at the Bullitt Center in Seattle was reduced to meet the project’s photovoltaic (PV) budget.
The Bullitt Center, a six-story 52,000 sf office building, designed a roof that slightly extended over the exterior walls of the building and calculated that the selected solar panel system could then meet their energy use in an average year. For a ZNE building the solar budget becomes the cap for the building and its occupant’s energy use.
These solar and energy budgets are introduced as early as the initial design charrettes. Design teams get the various parties involved in design, construction, commissioning, operations and ownership and/or occupancy in the early phases resulting in an “integrated design approach.” Integrated design was frequently credited with maintaining low energy features and specifications by the studied projects compared to the traditional approach of value-engineering — a practice that modifies design features deemed too expensive but which can compromise the efficiency of the entire building.
Having a strong advocate providing the vision, business rationale and leadership on energy performance goals resulted in project buy-in and inspired others. In some cases the owner began with an interest in a high performance or high profile building and selected a design firm that brought the relevant expertise and a portfolio of experience. In other cases, leading design firms were the gateway to the ZNE concept for owners and served as the catalyst for these exceptional projects. In all cases, it is the influence of individuals that helped realize the outcomes presented in this study.
technology snapshot
David and Lucile Packard Foundation
The overarching goals for the David and Lucile Packard Foundation office were to provide a range of public and private work spaces that encourage collaboration and are outfitted for virtual work opportunities, have a transparent presence that interfaces well with the local community, and create a project to target zero net energy use and LEED ® Platinum certi-fication. The new building features two long, two-story wings connected by enclosed walk-
Building Size: 49,161 SFLocation: Los Altos, CaliforniaConstruction Type: NewConstruction Year: 2012Building Type: OfficeCA Climate Zone: 4
ways and organized around a landscaped courtyard. The program includes private offices, open work areas, communal spaces and conference rooms for approximately 120 employees.
A cooling tower provides chilled water to a 50,000 gallon storage tank that is passively cooled during nighttime hours. The water is circulated throughout the building to chilled beam exchangers. These chilled beams cool the localized air, allowing it to sink into the space and displace warm air. Outside ventilation air is provided by a second-ary dedicated outdoor air system (DOAS). Building occupants are notified by an icon that appears on their computers when it is appropriate to open operable windows.Co
urte
sy: J
erem
y Bi
tterm
an

new buildings institute | 2014 Getting to Zero Status Update24
As for the design itself, project teams relied on tried-and-true high performance strategies. Teams referenced orientating the building for solar access and control of heat and glare based on the site whenever possible. The need for light coupled with the avoidance of unwanted solar gain and glare was resolved with attention to window-to-wall ratios, varying window size and shape on different sides of the building, and incorporating highly efficient glazing and exterior shading devices to cut off peak-day sun angles.
For building configuration and space planning the design team added energy optimization to the list of usual drivers of space needs, use, site constraints and budget. Some projects were able to design for a narrower footprint and/or single story that optimized daylight and toplight access and reduced electrical lighting demand to the majority of the space. The configuration and the envelope are also highly influential on heating and cooling demands. These projects cited high levels of insulation, the use of green or cool roofs, and increased thermal envelope efficiencies as foundational practices to reduce overall energy use.
The interior design of many of the buildings also played a part in the low energy outcomes, with daylight as a primary consideration. Light shelves extend the penetration of light deeper into the space, allowing more electric lighting to be turned off. Light-colored interior paint and fabrics increase the efficacy of natural light, and low or no partitions create an open work area that allows daylight and ventilation to flow more effectively. Another emerging design factor that combines architecture and interior design is making stairways an attractive and highly accessible part of mobility in the building. This reduces transport energy used by elevators or escalators as well as exemplifying the message of health that is inherent in green buildings.
Summary of the design process approach and strategies:
� Energy performance target set at the start
� Integrated design approach
� Champion(s) and experienced team to provide vision and leadership
� Site orientation, building configuration and space planning optimized for daylight access
� Improved envelope performance
� Window glazing type, ratio to walls, size and orientation optimized
� Exterior window shading used to reduce peak day sun
� Interior design incorporated light shelves, light colors and low partitions
� Stairways made to attract and facilitate movement within the building, reduce transport energy

new buildings institute | 2014 Getting to Zero Status Update 25
technology snapshot
IBEW Local 595 ZNE Training Center
When it came time to upgrade their training facility, the IBEW Local 595 and NECA chapters targeted net zero energy. They wanted to demonstrate that this goal was achievable and train their electrical contractors on the latest, cutting-edge energy efficiency strategies and renewable energy sources. If California hopes to achieve its goals of all new residential construction being ZNE by 2020 and new commercial ZNE by 2030, it is critical that there be a workforce in place that has the skills to install, operate and maintain the lighting and building automation systems as well as the renewable systems used throughout the project. The building features both flat and tilted roof-mounted photovoltaic panels, a dual-axis
Building Size: 46,000 SFLocation: San Leandro, CaliforniaConstruction Type: RetrofitConstruction Year: 2013Building Type: Education- generalCA Climate Zone: 3
solar tree which tracks the sun for maximum generation, and three 12 kW wind turbines.
In order to achieve the ZNE goal, the team started early and worked iteratively ensuring that the building systems, design and occu-pants were being considered simultaneously. The design team started with a list of over 60 different ideas that were eventually whittled down to the handful that were implemented in the building. The building primarily relies on a passive heating and ventilation system aided by roof monitors that also promote a high quality daylighting design. Mechani-cal heating and cooling is provided by four Variable Refrigerant Flow (VRF) units which circulate refrigerant to remove and redis-tribute warm air within the building. This configuration allows for a high level of zonal control (only conditions spaces that are oc-cupied rather than the whole building) and can efficiently provide simultaneous heating and cooling when needed.
TechnologiesPassive systems, high performance building envelopes and the evolution of technologies for monitoring and controlling energy systems are key developments toward extremely low energy buildings. These ZNE buildings take advantage of free resources from the sun and wind to light buildings without electricity, as well as provide heating, cooling and ventilation, thus reducing the load on mechanical systems.
Advanced lighting controls that reduce or eliminate electric lighting in response to natural light or occupancy variations is a frequent technology in these projects. Lighting and daylight controls are now code in many jurisdictions, but the ZNE buildings go beyond code to integrate layers of lighting technologies that provide task, ambient and common-area light that responds to occupant needs with efficient lamps, ballasts, responsive controls and effective design. Addressable ballasts provide the ability to create and easily modify lighting zones down to the level of individual fixtures. These advanced luminaire-level controls have an added functionality of providing energy monitoring and ability for demand response.
The technology area moving furthest “outside the box” is heating, ventilation and air-conditioning (HVAC). The two most common HVAC systems in
Cour
tesy
: Cha
d Zi
emen
dorf

new buildings institute | 2014 Getting to Zero Status Update26
standard commercial building — rooftop package units and variable air volume systems — take a backseat in this building set to systems that are more advanced, efficient and represented to be more thermally comfortable.
A major HVAC trend in these buildings is decoupling ventilation air from space conditioning for optimal efficiency. This trend away from forced-air systems significantly reduces energy loss from ducts and fan power. One approach common among these projects is to separate supply ventilation air into dedicated outside air supply (DOAS) units. This allows an efficiency design focused to meet load and occupant thermal comfort needs while isolating code requirements for outside air in a unit that provides only ventilation air as efficiently as possible. Ground-source heat pumps are widely used in these projects along with radiant heating and cooling, chilled beams and natural ventilation, meeting comfort with energy reductions on the order of 30-60% over standard HVAC.
Ongoing measurement and feedback is critical in these buildings. Controls and energy information systems that monitor building energy use and performance, diagnose problems, and provide detailed data and high-level dashboards for operators and occupants are standard in the majority of the buildings. Establishing the key performance indicators appropriate to
the building size, systems and audience along with a routine of data review and action are what make this technology an important factor on the path to zero.
Renewable production was provided in all cases by PVs. In a handful of buildings, additional energy was produced by small onsite wind turbines. The cost of PVs has been descending rapidly this decade while the production efficiency has been increasing making the path to zero more attainable. Project budgets, however, were invested first in energy efficiency in order to reduce the expense and size requirements of renewables. For some of the ZNE emerging projects in this study, the purchase of sufficient PVs within the initial budget was not feasible. Most plan to add additional PVs in a future budget cycle to meet their ZNE goals.
Getting to zero is not possible without addressing plug loads, which fall outside of code and the typical design process purview.
Architect: Miller|Hull
Bullitt Center HVAC System Overview
The Bullitt Center in Seattle blends a number of systems to meet indoor comfort, ventilation requirements and energy optimization. These include operable windows, dedicated outside air with heat recover, night flush, ground source heat pump, and radiant floors.
Courtesy: PAE Consulting Engineers
new buildings institute | 2014 Getting to Zero Status Update 27
Summary of Technologies:
� High performance HVAC systems. Ground-source heat pumps, radiant heating and cooling, chilled beams, energy recovery ventilation, natural ventilation, operable windows, night flush of the thermal mass, demand controlled ventilation (DCV) through CO2 monitoring, variable volume refrigerant systems with dedicated outside-air systems for ventilation (DOAS), underfloor air distribution, ice storage, and evaporative cooling
� Advanced Lighting and Controls. Efficient design with low LPD (lighting power density), daylight photosensor controls, occupancy sensors, luminaire-level controls, layered design strategies with task, ambient and common areas, LED task lights, T5 fluorescent lamps, skylights, clerestories
� Monitoring and Feedback. Wiring for system-level monitoring, energy information and building automation systems, diagnostics, key performance indicator dashboards
� Renewables. Photovoltaics on the building or adjacent to the site, solar hot water, and some site wind turbines in use to supplement PVs
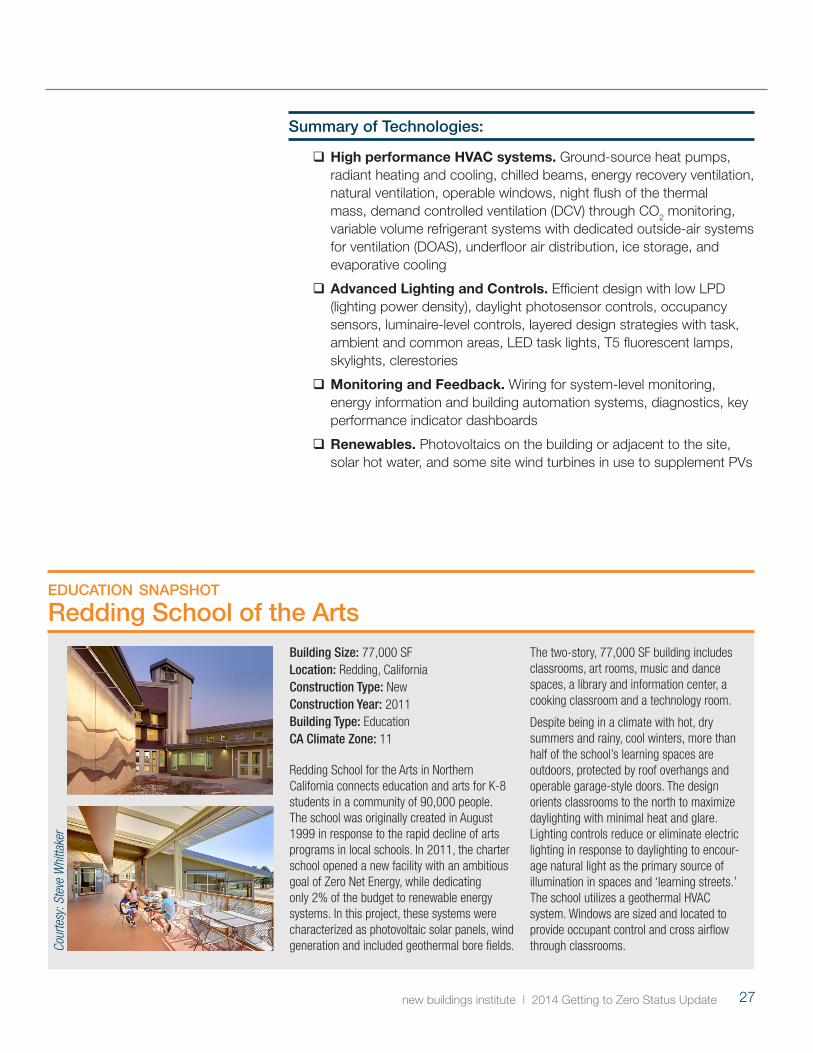
education snapshot
Redding School of the Arts
Redding School for the Arts in Northern California connects education and arts for K-8 students in a community of 90,000 people. The school was originally created in August 1999 in response to the rapid decline of arts programs in local schools. In 2011, the charter school opened a new facility with an ambitious goal of Zero Net Energy, while dedicating only 2% of the budget to renewable energy systems. In this project, these systems were characterized as photovoltaic solar panels, wind generation and included geothermal bore fields.
Building Size: 77,000 SFLocation: Redding, CaliforniaConstruction Type: NewConstruction Year: 2011Building Type: Education CA Climate Zone: 11
The two-story, 77,000 SF building includes classrooms, art rooms, music and dance spaces, a library and information center, a cooking classroom and a technology room.
Despite being in a climate with hot, dry summers and rainy, cool winters, more than half of the school’s learning spaces are outdoors, protected by roof overhangs and operable garage-style doors. The design orients classrooms to the north to maximize daylighting with minimal heat and glare. Lighting controls reduce or eliminate electric lighting in response to daylighting to encour-age natural light as the primary source of illumination in spaces and ‘learning streets.’ The school utilizes a geothermal HVAC system. Windows are sized and located to provide occupant control and cross airflow through classrooms.Co
urte
sy: S
teve
Whi
ttake
r

new buildings institute | 2014 Getting to Zero Status Update28
Operations and OccupancyIn the hands of a growing stable of leading firms in low and zero energy buildings, the design and technology practices outlined above deliver buildings with great promise for high efficiency. From there, the path to ZNE becomes highly reliant on the operations and occupancy factors.
The projects go beyond current practices for ongoing building optimization and include occupant engagement as a key strategy toward the low energy targets. In many cases these projects shared the same issues that are prevalent in all new buildings or major renovations in regard to achieving predicted energy use — different than expected occupancy density and behavior, demand from plugged-in devices and hours of operations that vary from original estimates. These types of changes are a reality for building operators, and the approaches used by these buildings helped drive energy use down toward the targets, and in some cases below expectations. For example, one environmental learning center was designed to be net zero but did not achieve its target because the space was so popular among the students that the annual energy use was significantly higher than expected.
A new label for commissioning (Cx) was coined by a project lead in this study — ZNE Commissioning, or ZNE Cx. This term reflects that the commissioning for buildings with integrated renewables and advanced energy systems entails a deeper set of skills than standard Cx. Many owners and firms invested in, and cited key energy results from, extensive commissioning.
Some form of building monitoring system was common in almost all of the buildings. Real-time feedback on system performance was cited as foundational to both the operations needs and influencing occupants. The monitoring provided key performance indicators such as energy by hour or 15-minute increment, which readily identifies schedule-related control issues. Evening and night setbacks for lighting and HVAC have large impacts on energy use. Monitoring also typically diagnoses control and operation problems within the HVAC system, red-flagging areas for the operator’s attention.
The largest new area of focus for building energy use is plug loads — the energy demanded by items plugged into outlets by occupants. For these types of buildings, since they are already addressing energy use in design and technologies, plug loads can account for as much as 50% of total building energy use. Getting to zero is not possible without addressing these loads, which fall outside of code and the typical design process purview.
Strategies used to manage plug loads included hardware such as advanced plug strips with occupant and schedule controls, controlled wall outlets, and procurement of best-in-class equipment and appliances. Software was used in some buildings through the Information Technology (IT) department to centrally ensure monitor and computer setbacks and off settings. Occupant engagement helped deliver savings through behavior changes in response to energy dashboards in central areas or directly on individual computers, green campaigns, end-of-day email prompts and notices to shut off equipment, as

new buildings institute | 2014 Getting to Zero Status Update 29
well as utilization of green teams, competitions and procurement policies. A few projects cited requiring attention to energy use or green practices as a part of the lease agreement.
Summary of Operations and Occupancy Strategies:
� ZNE and continuous commissioning
� Energy monitoring system and dashboards
� Plug load assessment and purchasing of low plug load equipment
� Controlled Plug Load at the circuit, through IT department, and with power strips
� Occupant engagement and feedback
� Server Closet / Data Center efficiencies
� Top Ten16 and Energy Star equipment/appliances
� Green leases
16 Top Ten USA at http://www.toptenusa.org
technology snapshot
TD Bank
TD Bank has been an environmental leader since 1990. As one of the ten largest banks in the United States, they chose to move beyond LEED® certification to pilot a Zero Net Energy design for a retail bank branch in Fort Lauderdale, Florida. By enhancing the already high-performance building compo-nents standard in their portfolio, the design and construction team focused their attention on further reduction of energy loads and installation of renewable energy on the site.
Building Size: 3,970 SFLocation: Ft Lauderdale, FloridaConstruction Type: New ConstructionConstruction Year: 2011Building Type: Retail BankClimate Zone: 1A
Their concerted and ongoing effort toward this net zero result helped TD Bank achieve their goal.
The process started with a green prototype to develop a cost effective base building. This standard design was adapted to the local community through a pre-defined kit of parts. More than 80% of the building components are the same as those in their typical branch design. Building commission-ing uncovered a number of challenges with the systems and controls. It also revealed that plug loads represented 40% of total energy consumption and needed to be ac-tively managed. For example, the standard 3 hot plate coffee maker was replaced with an insta-hot ‘eco’ version, saving 660 kWh/year (91% over standard practice).
Turner Construction
TD bank

new buildings institute | 2014 Getting to Zero Status Update30
Determining the costs for creating a low or zero energy building is difficult calculus. Yet understanding incremental costs for achieving ZNE is vital and frequently identified in market surveys as one of the topics most important to address. This study’s primary focus was on measured energy performance, building features and the status of ZNE and ultra-low energy buildings and policies. In the research for this information NBI requested cost information and documentation from design teams and owners and received a few quantitative sources along with anecdotal responses. In addition, a few recent studies have tackled this topic and their outcomes can be characterized to provide some analysis on the issue of costs.
Specific building case studies are the best resource for reviewing a comparable building design, technologies, climate and size, and some do include cost data. For example, the David and Lucile Packard Building, one of the most expensive ZNE buildings on a cost-per-square-foot basis, has an objective of transparency and shared learning. They have many resources on the development of their building and identify specific items such as their “replicable shell” with descriptions of what it would of cost for them to achieve ZNE without the expensive finishes they included in the project. NBI has sets of ZNE case studies online at www.newbuildings.org/zero-energy and additional sources of more detailed case studies are listed in Appendix C.
NBI FindingsThrough this research NBI can characterize the following:
• Very few projects are able to disaggregate the cost of efficient design and technologies from the overall cost of a new building.
• The addition of renewable energy technologies, most commonly photovoltaics, is usually identified as a discrete equipment cost. However, the full cost of integrating the renewables with the building systems and metering may be embedded in other labor associated with electrical, wiring and installation.
• The cost to add renewable energy was identified as a barrier to getting to full ZNE at the time of construction. Several projects planned to incrementally increase PV over time to meet their goals.
• Improved energy efficiency in buildings beyond code is a widespread practice due to the last decade of green and utility efficiency programs. This complicates the ability to establish a benchmark to compare the cost of building to zero net energy construction.
• The caliber and experience of the firms that worked on these buildings applied their growing knowledge of low and zero energy design to identify cost reductions in some areas (eg. reduced HVAC sizing) that were used to manage the overall project cost.
Integral Group High Performance Buildings Cost StudyThe cost information NBI did gather was shared with Integral Group for their more specific statistical analysis on high performance and ZNE buildings.
Characterizing Costs

new buildings institute | 2014 Getting to Zero Status Update 31
The Integral Group study is due out in early 2014 and includes analysis of buildings that are green, LEED platinum and ZNE and includes the building types of community centers, K-12 schools, low-rise office buildings and wet labs. A few initial findings were presented by Integral in fall of 2013, including:
• The cost for going green or zero is not distinguishable within the overall budget.
• Costs overall are approaching conventional buildings. The study group of green, LEED platinum and ZNE buildings costs were in comparable ranges with a variety of control group buildings of like type.
• Those study buildings that were at the high end of costs were demonstrations, high profile buildings with mission work (eg. Packard Foundation), or included green or zero costs unique to their building type (eg. school kitchen equipment upgrades or swimming pool technologies).
California ZNE Cost StudyIn 2012 Pacific Gas and Electric (PG&E) commissioned a report on behalf of the ZNE Energy Utility Programs in California. The report, California Zero Net Energy Buildings Cost Study17, was prepared by Arup and Davis Energy
17 California Zero Net Energy Buildings Cost Study is available at http://www.energydataweb.com/cpucFiles/pda-Docs/904/California_ZNE_Technical_Feasibility_Report_Final.pdf
technology snapshot
Rice Fergus Miller
Rice Fergus Miller breathed new life into an abandoned 1948 Sears Automotive Center and positioned their new office solidly on the path to net zero. This urban infill transfor-mation project took a dilapidated structure that had been abandoned for 23 years and turned it into a catalyst for the revitalization of downtown Bremerton. The goal of ultra-low energy started early in the design process when they estab-lished a target energy budget based on potential solar production at the site and started using
Building Size: 39,000 SFLocation: Bremerton, WashingtonConstruction Type: Major RenovationConstruction Year: 1948, 2011 Building Type: OfficeClimate Zone: 4C
energy modeling to evaluate options. They achieved their goal at only $109/SF.
The shell is super insulated is reported to ex-ceed Passivhaus Space Heating and Cooling requirements by a factor of two. The efficient building also uses a hybrid natural and mechanical system while maintaining a high level of personal comfort. Passive systems are utilized first so that HVAC systems can be turned off when not needed - approximately 40% of the time. Passive systems, including operable windows and ceiling fans, take advantage of the mild, marine environment. High efficiency Variable Refrigerant Volume (VRF) heat pumps, located in 23 separate zones across the space, are the prime source of mechanical cooling.
Cour
tesy
: Ric
e Fe
rgus
Mille
r
new buildings institute | 2014 Getting to Zero Status Update32
Group and found similar outcomes as the references above. Three of these from the Executive Summary of that report are:
• There is significant variability in the costs of both code compliant and high performance commercial buildings. ZNE commercial buildings put the focus on energy performance goals, while conventional buildings may focus on building amenities and treatments. Industry experts suggest that it is possible to construct ZNE commercial buildings at little or no incremental cost.
• Commercial buildings offer greater opportunities for realizing cost tradeoff benefits which can reallocate construction cost savings from HVAC downsizing to other areas, such as architectural/envelope improvements, high efficiency lighting, and higher efficiency equipment. Maximizing performance synergies that reduce first costs and generate energy savings is a key part of the commercial building integrated design process.
• Incorporation of precise and well thought out building energy use targets in construction contracts is widely recognized as an effective mechanism in focusing the design team’s effort on an appropriate design solution. The electrical subcontractor from NREL’s ZNE Research Support Facility building suggested that following this approach resulted in a several percent cost savings in their overall bid.
Cost Summary:
� Costs for getting to zero are not distinct from overall project costs. Energy efficiency and renewable technologies do have specific costs, but the design and technology tradeoffs due to the advanced systems blur the line of incremental costs.
� Green, LEED and/or Zero net energy buildings can be achieved within the range of other like-type buildings. When total construction costs for these buildings are analyzed against control groups they are comparable to conventional building costs.
� Design firms and early targets reduce costs. The experience of the team and the explicit goal of ZNE throughout the process are cited as critical to minimizing costs.
� Cost is the wrong question. The value, outcome, operating savings and market position of ZNE buildings are all, like cost, difficult to quantify but clearly recognized by the leaders in ZNE design and ownership.

new buildings institute | 2014 Getting to Zero Status Update 33
Policies and programs can dramatically change the landscape for ZNE buildings. There is burgeoning market interest in ZNE, and policies and programs can foster and grow that interest through leadership, direct support, and the reduction of risks and uncertainties.
Survey of State and Local Energy OfficialsAs part of this study, NBI conducted an informal survey of approximately 300 state energy officials, practitioners and owners at the annual conference of the National Association of State Energy Officials (NASEO). In Figure 11 the responses on the current best markets for ZNE policies are well aligned with the trends shown in this study, perhaps due in part to the work of these individuals in their home states.
An interesting outcome of the survey was that environmental groups were seen as the most likely and influential advocates for ZNE buildings within their state policy structure. This is followed by the design community, which has been a growing active force in participating in the green and ZNE policies of some states, as shown in Figure 12. An important strategy for furthering the aspirations of ZNE will be to align with key environmental groups toward the mutual mission of an improved world through lower carbon use.
ZNE Policy Trends
SchoolsPublic Buildings Single family Corporate Multifamily
15%
37%
12%6%
Where Should ZNE Policies and Programs Focus?
Per
cent
of R
esp
onse
s
30%
Figure 11: Best Current Market Types for ZNE Policy or Program Support

new buildings institute | 2014 Getting to Zero Status Update34
Designcommunity
Environmental groups
Governor’soffice
Businesscommunity
Legislature
Who are the most likely advocates for ZNE Policy in your state?
Per
cent
of R
esp
onse
s
40%
30%
13% 10%
5%
Figure 12: Most likely Advocates for ZNE Policy
Policy PathwaysThe policy approaches below depict many of the best options for advancing ZNE buildings and districts. Each is briefly described, followed by examples of where the strategy is being piloted or has been put into practice. Links to more information can be found in Appendix D.
1. Develop a building energy codes roadmap. If ZNE buildings are to become commonplace or standard, they must be supported and/or required by building codes. While broadly requiring ZNE buildings seems far in the future, a codes roadmap that progressively updates codes incrementally over time is an important policy and a clear signal to the marketplace. A roadmap builds the ZNE strategy over time as the market progresses in its understanding of the necessary design, construction and operational strategies, and as costs of achieving ZNE are reduced and the value of achieving ZNE is better understood. However, energy codes as currently formulated do not impact plug loads and other types of energy use such as vertical transport, nor do they assure the quality of building operations, two key factors in achieving ZNE performance.
Ideally a codes roadmap would be aligned with voluntary and incentive programs to ease market transformation. Elements could include:
• Establishment of a long-term goal for the level of future energy codes and requiring progressive steps over time. For example, Oregon has legislated that ZNE will be required by 2030, California requires all new buildings to be ZNE by 2030 and half of public building floors pace by 2025, and Washington State legislation requires a 70% reduction in energy use relative to the base code of 2009 by the year 2027.

new buildings institute | 2014 Getting to Zero Status Update 35
• Use of stretch or reach codes (those requiring better energy performance than code minimum) on a more limited basis for government buildings, within self-selected communities, or as the basis of incentivized programs. Massachusetts, Oregon and California have established stretch codes; national model green codes (ASHRAE 189 or International Green Construction Code) could also be referenced.
• Establishment of measured energy targets in code for commercial building types. This strategy is being pursued by the European Union to achieve “nearly Zero Energy Buildings” (nZEB)18. This policy focuses on measured energy outcomes and to date has concentrated on achieving energy efficiency goals rather than directly requiring renewable energy. At least two states and several cities are investigating this approach in North America.
2. Establish annual benchmarking and disclosure policies and aggregate energy use data to set local energy reduction targets. A better understanding of how much energy buildings actually use provides an important foundation for setting actual energy consumption goals. A number of cities have implemented mandatory benchmarking requirements, usually beginning with larger buildings. New York City and Seattle are two of the better established examples. The benchmarking data is just beginning to be analyzed, along with other sources of data, to understand what energy use levels should be targeted for various objectives. Some benchmarking and disclosure policies require disclosure of an Energy Star score. Since the Energy Star score is a relative comparison and not actual measured energy consumption, it is not the best gauge for any program targeting ZNE
3. Establish net energy metering and rate policies that acknowledge the changing role of utilities. Net metering is a powerful incentive in areas with high utility costs or high tiered rates structures. Current utility rate structures developed over the past century in response to regulated monopolies and a stable and fixed asset base. More flexible rate structures, such as variable rate blocks, net energy metering and time-of-day pricing, can better address the real value of both energy efficiency and renewable generation. The benefits of distributed solar and targeted demand reduction, especially for summer peak demand, should be more fully considered. More than 20 states have some form of net energy metering policy.
18 Analogous to ultra-low energy buildings in this study. Buildings not actively seeking ZNE but with exemplary low energy performance.

new buildings institute | 2014 Getting to Zero Status Update36
4. Provide supportive programs by utilities or program administrators. Incentive programs and technical assistance can reduce the risks inherent in piloting new approaches to design and construction. Many utility programs offer some form of incentive, ranging from single-measure support to comprehensive strategies. Other programs help defray the cost of energy modeling or to facilitate an integrated design process by paying for the cost of early design meetings called eco-charrettes.
It is also important to realize that ZNE buildings may rely on passive strategies that are difficult to incentivize since they can actually eliminate the need of systems. As noted earlier, plug loads controlled by occupants and quality operations after occupancy can also be an issue for programs. These limitations on the current incentive structure challenges utilities and public purpose funds administrators to look beyond technology-based incentives and consider incentives that pay based on actual energy performance.
Another innovative strategy to facilitate ZNE buildings is to provide a financial incentive for design firms to remain involved in the building operation over the first year. This would be similar to the eco-charrettes incentive but would occur at the end of the design process.
In California, the Savings By Design commercial new construction program has a Path to Zero program element, and in Oregon the Energy Trust of Oregon ran a pilot ZNE program. The two programs were similar in design, featuring early design assistance (such as eco-charrettes), additional technical assistance to resolve design or research problems, and additional financial assistance for deeper measures. The programs required performance at least 40% better than state energy code. More than 20 buildings participated in California and nine in Oregon, with most targeting ZNE performance. Two other states are planning similar pilots.
Other utility efforts in California include support for ZNE training, research, monitoring and design competitions. The Northwest Energy Efficiency Alliance and the utility-funded Integrated Design Labs in Washington, Oregon and Idaho have also conducted research, monitoring and training activities.
5. Create incentives for ZNE at the local government level (e.g. funding, fast track permitting, technical assistance, awards). Local governments can expand zoning regulations to encourage ZNE, using well-established tools such as density bonuses, accelerated permitting and many others. It is also important to review local zoning and code enforcement to ensure unintended restrictions don’t apply to ZNE; new approaches may require changes to

new buildings institute | 2014 Getting to Zero Status Update 37
older language and regulations to ensure compatibility. Many local jurisdictions have strategies to support green construction or other public goals such as affordable housing that can be expanded to support ZNE. In addition, Development Commissions can tie public support of building projects to ZNE and measured energy performance targets.
6. Set ZNE goals for government and other public buildings. Local and state government buildings are an excellent sector in which to demonstrate ZNE and interim energy reduction targets based on measured performance. It is particularly important for government to lead by example both for educational purposes and to establish credibility of other policy efforts. A California Executive Order requires ZNE performance for both new and existing State-owned buildings owned by 2025.
Target market efforts should encourage demonstration projects. Seeing and experiencing ZNE buildings firsthand can be a strong influence and inspiration to other local designers, policymakers and building owners. Seeing that these buildings typically use off-the-shelf systems and technologies, feel comfortable and look relatively typical can help promote an interest in pursuing a nontraditional building model. These buildings also provide examples of design methods, contract processes, costs and financing models.
education snapshot
Turkey Foot Middle School
Turkey Foot is revolutionizing the way kids learn, all within a new building that uses half the energy of the previous school despite doubling the size. Turkey Foot leveraged the practices and experience on other high perfor-mance goals in the district. For example, Turkey Foot has significantly less glazing than other schools in the district. The District learned from last projects that windows can be strategically located to enhance daylighting, minimize glare, and improve thermal performance. This, plus
Building Size: 133,000 SFLocation: Edgewood, KentuckyConstruction Type: K-12 EducationConstruction Year: 2010 Building Type: New ConstructionClimate Zone: 4A
increased insulation level through use of insulated concrete form walls, allowed the design team to downsize mechanical systems, saving first costs.
Designers convinced the Kentucky Department of Education to allow for reduced footcandle levels required by electric lighting system as long as it was supplemented through high quality day-light design. This allowed for a substantial first cost reduction, as fewer light fixtures were needed in the 36 classrooms. Side lighting high on the window wall as well as solatubes direct daylight deep into spaces. Additionally, two light sensors per classroom monitor the amount of natural light available and adjust the electric lights as needed.
Entrance
Cour
tesy
: Wes
Bat
tocl
ette

new buildings institute | 2014 Getting to Zero Status Update38
7. Identify and Support Target Sector efforts. Some commercial building market sectors are better targets for ZNE than others due to energy use patterns, ownership and leadership opportunities. Identification and structured support of target markets can accelerate activities related to ZNE as each commercial building market has a distinct ownership structure, patterns of development, financing opportunities, networks, trade associations and publications. As was true with Energy Star and U.S. Green Building Council’s LEED19 program, K-12 schools, colleges/universities and government buildings (especially small buildings and renovations) appear to be the early adopter target markets.
The State Energy Office of Kentucky has championed school energy efficiency for many years, resulting in a series of ZNE schools built at a market-average cost. Northeast Energy Efficiency Partnerships has identified public buildings as a leadership market for ZNE, published a strategy document and worked with public buildings in several northeast states. NBI has established an early adopter process in California to help state and local governments, as well as school districts, achieve ZNE performance levels.
8. Support community-scale renewable energy systems. Renewable energy systems located beyond the boundaries of a single building site offer economies of scale for installation and maintenance over time and in many instances may be preferable to individual building systems. Certainly for campus-level installations the broader scale makes sense, but a variety of options exist for noncontiguous sites too. Community scale will be valuable in serving the existing building stock, especially in urban downtowns where dense development, shading and taller structures limit the ability of onsite PV to provide sufficient renewable energy. Policies that encourage community-scale renewable energy production while guaranteeing transaction credibility are needed at the state, local and utility regulatory levels.
Examples include West Davis Village on the campus of UC Davis, which will include student housing and a variety of other university buildings. Also, the town of Lancaster, California, with its nearly ideal solar location in the Mojave Desert, powers 96% of city facilities with a series of scalable systems. EcoDistricts promotes urban community-scale solutions, as do the 2030 Districts established in Pittsburgh, Seattle, Cleveland, Denver and other cities.
19 Leadership in Energy and Environmental Design

new buildings institute | 2014 Getting to Zero Status Update 39
9. Support improved appliance standards to reduce energy use that falls outside the scope of building energy codes. Because plug loads matter in ZNE buildings, appliance standards play a critical role in reducing energy consumption. Many appliances are covered by federal standards and cannot be further regulated at the state and local levels. For equipment not covered by federal standards, California has typically led the way for effective standards, and many other states have adopted all or most of the California-developed standards.
renovation snapshot
Exploratorium at Pier 15
When the Exploratorium outgrew its old loca-tion at the Palace of Fine Arts, the City of San Francisco offered to provide piers 15 and 17 on its historic waterfront as a larger relocation option for the science museum. After structur-ally shoring up the historic piers, the design team embarked on transforming the 9 acre site into the Exploratorium’s campus. This included retrofitting the massive pier 15 shed and constructing a small new structure to house a café and bay observation deck at the end of the pier. The retrofitted shed houses
Building Size: 330,000 SFLocation: San Francisco, CaliforniaConstruction Type: Major renovationConstruction Year: 1914, 2013Building Type: Public Assembly - otherCA Climate Zone: 3
the exhibition spaces as well as a mezza-nine level for classrooms, conference rooms and office space.
After a year of study, it became clear that the building could use its location above the San Francisco bay, and its relatively constant temperature, as a heat source or a heat sink depending on the climatic conditions. Water to water heat pumps heat or cool the bay water to meet the load required. Heating and cooling is provided to the building through a radiant concrete slab that conditions the space where the building occupants are. A four-pipe system provides either heated or chilled water to a 200,000 foot network of tubing imbedded in the concrete slab. Ventilation is provided by a separate dedicated outdoor air sys-tem (DOAS).

new buildings institute | 2014 Getting to Zero Status Update40
Zero Net Energy buildings have captivated the minds of leading design firms, companies, schools, foundations and governments that are showing the way to a lower-carbon future. In just a few years ZNE has moved from an impossible concept to a quite probable future. ZNE buildings have moved beyond a handful of small demonstration projects by universities or nonprofits to more widely mainstream types and sizes.
NBI’s 2014 Getting to Zero Status Update shows that low energy use is the foundation to ZNE buildings, and achieving low and zero energy could become a standard practice for most commercial buildings today.
Overview The lists below provide an alternative quick overview by topic area of the research findings.
In just a few years ZNE has moved from an impossible concept to a quite probable future. The types, number, sizes and locations of ZNE buildings have increased rapidly, although the market is still very small.
• The study identifies 160 ZNE projects: 32 verified ZNE buildings and one district, and 110 emerging ZNE buildings and 17 districts.
• This is compared to 60 ZNE buildings listed in the Getting to Zero 2012 Status Update. The largest increase is in ZNE emerging, with a 182% increase since 2012.
• An additional 53 ultra-low energy buildings with verified energy performance are listed in this study for a total of 213 specific projects compared to 99 total projects in 2012.
ZNE requires early energy and renewable goals, integrated design teams and project champions.
Renovated existing buildings can reach ZNE.
• 24% of the ZNE verified projects are renovations providing lessons on how to transform significant portions of the existing commercial building market.
Districts are an increasing and highly valuable trend; there are 18 ZNE projects identified as targeting multiple sets of buildings, with military, universities and community colleges being most common.
• The synergies of bundling sets of buildings is a natural and efficient strategy to leverage economies of scale from design, financial, district heating/cooling and energy production systems.
• In addition to ZNE committed districts, the 2030 Districts target ultra-low energy and represent a very large set of buildings and commercial floor space that can be a gateway to ZNE renovations.
There is growth and opportunity in repeatable buildings (schools, banks, small offices).
Findings Summary
In just a few years ZNE has moved from an impossible concept to a quite probable future. The types, number, sizes and locations of ZNE buildings have increased rapidly, although the market is still very small.
new buildings institute | 2014 Getting to Zero Status Update 41
Types, Sizes and LocationsThe range of building types has more than doubled since the 2012 report. There are now 16 different types of ZNE buildings ranging from retail to offices, from laboratories to airports.
There is over 5.3 million square feet of ZNE buildings identified20.
There is a notable increase in larger, more complex buildings (50,000 sf or larger). These 29 large buildings now represent 28% of all the ZNE buildings21, and over half are greater than 100,000 square feet.
Smaller buildings (under 25,000 sf) are still the most common and represent 62% of the total ZNE buildings22.
Education represents the largest portion of ZNE projects.
• K-12, universities and general education are 36% of all ZNE buildings, followed by offices at 19%.
• Education buildings offer highly visible projects that can influence community members and the next generation of citizens.
• Success stories of public funds that return lower operating costs and healthier student environments provide documentation that can be leveraged by others.
• Education buildings are the 4th largest building floorspace in the U.S. with over 10 billion square feet.
• This sector offers national and regional forums and associations to facilitate the transfer of best design and operational practices.
The number of states with ZNE buildings has expanded since the 2012 report.
• ZNE buildings are now in 36 states, up from 26 at the time of the 2012 report, and reflect all climate zones and regions across the U.S. and Canada.
Low-rise multifamily buildings are a new trend in ZNE with over a dozen examples in this study.
OwnershipPrivate sector development of ZNE buildings is growing.
• Over 25% of the buildings were privately developed, strong evidence that the market is recognizing the value of ZNE.
• Corporate leadership in ZNE is gaining attention. PNC Bank, Walgreens, TD Bank and Melink Corporation all have prototypes, buildings or have adopted ZNE policies for their portfolios.
20 The actual number is much larger as there are 44 ZNE emerging buildings in the study that did not have square footage identified at the time of this report and 18 districts comprised of multiple buildings targeting ZNE.21 28% of those ZNE buildings (104) that had square feet available at the time of this report.22 62% of those ZNE buildings (104) that had square feet available at the time of this report.

new buildings institute | 2014 Getting to Zero Status Update42
• Architects, engineers and green construction firms are walking the talk by making their own buildings ZNE and identifying new business opportunities.
Government and education continue to create the proving ground for public investment.
• Public ownership remains the most dominant sector, representing 67% of the projects. Nonprofits make up the remaining ownership type.
EnergyEnergy use in ZNE buildings is approximately 25% of an average building energy use today.
• The average for the ZNE verified buildings in the study is an EUI of 21 kBtu/sf/yr. Most of the buildings have an EUI of less than 30, putting them in the lowest third of their type23. The ZNE office average EUI is just 21.
Renewable production is met by photovoltaics in all ZNE buildings. A few projects also supplemented with wind generators.
Buildings can go beyond net zero and be net-positive24 as several of these projects demonstrated.
Ultra-low energy buildings — those performing at ZNE levels but without the explicit target of zero - are also increasing.
• These provide the same lessons and performance data of ZNE and help build the case for the mainstreaming of low energy buildings. This study includes a list of over 50 buildings with measured energy use in the lowest quartile of comparable building types.
Programs and RecognitionLEED buildings are pushing beyond the Energy and Atmosphere (EA) credits and leading the path to ZNE. Within NBI’s ZNE verified list half (16) are LEED Platinum or Gold.
The Living Building Challenge has four buildings certified as “Living” and an additional four with “Net Zero Building Certification.”
Utility program support for design assistance and efficiency measures as well as some tax credits were cited as valuable.
Many of the buildings were identified through leading award and recognition programs such as the American Institute of Architects Committee on the Environment Top Ten Green Project awards, the Northeast Sustainable Energy Association Net Zero Energy award, and recognition in High Performing Buildings magazine and Net Zero Buildings magazines.
23 U.S 2003 Commercial Buildings Energy Consumption Survey (CBECS) average for non-mall buildings as 91 and 93 for offices.24 Net-Positive: When annual production from renewables exceeds annual energy use.
Government and education continue to create the proving ground for public investment. Public ownership remains the most dominant sector, representing 67% of the projects.

new buildings institute | 2014 Getting to Zero Status Update 43
Design and TechnologiesDesign strategies and technologies used to achieve ZNE are widely available and in use in other high performance buildings. The most oft-cited energy efficiency measures were:
• High performance envelope and glazing, passive design strategies (such as orientation, daylighting, natural ventilation), exterior window shading, green and cool roofs, interior design focused on access to daylight.
• Advanced lighting systems, including daylight controls, occupancy sensors, LED task lights and lighting schedule controls.
• High performance HVAC systems, including radiant panels, ground-source heat pumps, chilled beams, variable refrigerant flow and evaporative systems. Separation of ventilation and space conditioning, carbon dioxide (CO2) sensors that track occupancy levels and adjust HVAC also made the list.
Plug loads make up an increasingly large percentage of energy use in ZNE and ultra-low energy buildings.
Attention to operations and occupant loads is critical. The following were widely used:
• Energy monitoring and measurement systems for real-time feedback on performance, renewable production and identification of system issues.
• Dashboards in public and tenant spaces to drive awareness of energy use and inspire behavioral changes to reduce energy.
• Plug load reduction methods such as controlled plug strips, outlets or IT software. Best-in-class computers and appliances.
• Green procurement requirements.
• Occupant engagement through campaigns, email prompts, competitions and green leases.
Alameda County Library, Castro Valley, California

new buildings institute | 2014 Getting to Zero Status Update44
Costs Costs for getting to zero are not distinguishable from overall project costs. Energy efficiency and renewable technologies do have specific costs but the design and technology tradeoffs due to the advanced systems blur the line of incremental costs.
Green, LEED and/or zero net energy buildings are within the range of other like-type buildings. When total construction costs for these buildings are analyzed against control groups they are approaching comparable costs.
Design firms and early targets reduce costs. The experience of the team and the explicit goal of ZNE throughout the process are cited as critical to managing costs.
PoliciesCities and states are leading the way with ZNE policies, accompanied by community, organization and district efforts.
Strong energy codes can support the path to zero, but outcome-based codes are critical.
ZNE means jobs. Moving more buildings toward this goal requires increasing individual’s skills and the numbers of firms to design, install, operate and maintain these buildings and renewable energy systems, thus dovetailing with government policies of reducing energy use and creating jobs.
Challenges Data is a dilemma. Finding and gaining access to measured data is challenging, and often the data has errors or is incomplete requiring a high degree of quality control.
Continual commissioning required. Commissioning the metering and building systems requires is an ongoing dynamic need.
Zero success is feared. If the zero energy target was not yet met, there was hesitancy by some firms to share results despite excellent performance.
Defining ZNE is difficult. Communicating the terms and definitions can be difficult.
It is hard to be zero. Buildings rarely land exactly on zero and, if they do, it is only for a given period of time. It is a process, not a static outcome.

new buildings institute | 2014 Getting to Zero Status Update 45
Appendix A: ZNE Emerging Buildings
Appendix B: Ultra-low Energy Buildings
Appendix C: Research Method
Appendix D: Resources
Appendices

new buildings institute | 2014 Getting to Zero Status Update46
ZNE emerging buildings (or Districts) have a publically stated goal of ZNE but do not yet meet the definition of ZNE verified. These may be in planning, design, under construction or have been in operation for less than a year. Others may have been operating for 12 months or longer, but their measured energy has either yet to achieve net zero or the measured data to document ZNE verified status was not available for this study.
Project Completion Name Location State Building Type Size (sf)
2005 Melink Corporation Headquarters Milford OH Office 30,000
2007 Prairie Hill Learning Center Roca NE Education- general 2,940
2008
Aquarium of the Pacific Watershed Addition Long Beach CA Education- general 2,500
Hillandale Elementary School East Flat Rock NC Education- K-12 Unknown
Mills River Elementary School Mills River NC Education- K-12 Unknown
2009da Vinci School High Performance Classroom Portland OR Education- K-12 1,485
Oak Ridge National Lab Office Building 3156 Oak Ridge TN Office (R) 6,900
2010
Bagley Classroom University of Minnesota Duluth
Duluth MN Education- higher 2,000
Center for Energy Efficient Design Rocky Mount VA Education- K-12 3,600
Evie Garrett Dennis E12 Campus (Denver Schools)
Denver CO Education- K-12 186,468
Lowell Trial Court Lowell MA Other Unknown
Magnify Credit Union Lakeland FL Retail 4,151
Palmetto Bay Municipal Center Palmetto Bay FL Office 25,000
Turkey Foot Middle School Edgewood KY Education- K-12 133,000
2011
Centennial PK-12 School Denver CO Education- K-12 64,000
Centre for Interactive Research on Sustainability (CIRS)
Vancouver Canada Education- general 76,223
Coastal Maine Botanical Gardens Bosarge Family Education Center
Boothbay ME Education- general 8,200
EcoFlats Building Portland OR Multifamily 19,860
Frito-Lay Casa Grande Snack Factory Casa Grande AZ Other 188,000
George V Leyva Middle School Admin Building San Jose CA Office 9,200
June Key Delta Community Center Portland OR Public Assembly 2,700
McCormick Spice Net Zero Warehouse Belcamp MD Warehouse (R) 369,000
NASA Propellants Facility at Kennedy Space Center
Kennedy Space Center
FL Office- other 9,540
Pierce College Maintenance & Operations Facility and Net-Zero Central Plant
Los Angeles CA Other 42,000
Portland Community College Newberg Center Newberg OR Education- higher 13,000
Appendix A: List of ZNE Emerging Buildings

new buildings institute | 2014 Getting to Zero Status Update 47
Project Completion Name Location State Building Type Size (sf)
2011
Redding School for the Arts Redding CA Education - K-12 77,091
Rice Fergus Miller Office & Studio Bremerton WA Office (R) 39,000
Sangre de Cristo PK-12 School Mosca CO Education- K-12 8,000
VanDusen Botanical Garden Visitor Centre Vancouver Canada Public Assembly 19,000
West Irving Library Irving TX Library 25,876
Wilson Air Center - Chattanooga Airport - West Side Aviation Development -
Chattanooga TN Airport (R) 9,015
2012
Bullitt Foundation Cascadia Center for Sustainable Design and Construction
Seattle WA Office 52,000
Colonel Smith Middle School Fort Huachuca AZ Education- K-12 88,693
Conrad N. Hilton Foundation Agoura Hills CA Office 22,240
Franklin Regional Transit Center Greenfield MA Other 24,000
La Valentina North Sacramento CA Multifamily 19,875
Maharishi University of Management Sustainable Living Center
Fairfield IA Education- higher 6,900
Morphosis Architecture Studio Culver City CA Office 11,600
North Shore Community College Health and Student Services Building
Danvers MA Education- higher 58,000
Paisano Green Community El Paso TX Multifamily 55,202
Phipps Center for Sustainable Landscapes Pittsburgh PA Public Assembly 24,350
Sacred Heart Schools Stevens Family Library Atherton CA Library Unknown
Sail Lofts Thomaston ME Multifamily Unknown
Skaneateles Village Hall Skaneateles NY Office 3,723
St Petersburg Net Zero Office (Sierra Club) St Petersburg FL Office Unknown
Student Services Center at Mesa College San Diego CA Education- higher 85,000
UC Davis West Village (eco district) Davis CA Multifamily District
UniverCity Childcare Centre Burnaby Canada Education- K-12 5,690
Vernonia School k-12 Vernonia OR Education- K-12 135,000
Lady Bird Johnson Middle School Irving TX Education- K-12 152,000
2013
Beckstoffers Mill Senior Housing Complex Richmond VA Multifamily (R) 8,000
Berkeley West Branch Library Berkeley CA Library 9,300
Blackford School Multi-Use Building San Jose CA Education- K-12 Unknown
Bright ‘n Green Brooklyn NY Multifamily Unknown
Centre of Excellence at Okanagan College Kelowna Canada Education- higher 61,100
Delta Building - NYC Brooklyn NY Mixed Use 2,700
Ewa Elementary School Portable Classroom Oahu HI Education- K-12 Unknown
Exploratorium San Francisco CA Other 330,000
Foundry Court by Nexus Homes Philadelphia PA Multifamily Unknown
General Aviation Terminal Appleton WI Airport 8,000

new buildings institute | 2014 Getting to Zero Status Update48
Project Completion Name Location State Building Type Size (sf)
2013
IBEW Local 595 Zero Net Energy Center San Leandro CA Education- general 46,000
Lane Community College, Downtown Academic Center
Eugene OR Education- higher Unknown
Lenawee Intermediate School District Center for a Sustainable Future
Adrian Township MI Education- K-12 Unknown
Park Slope Brooklyn ZNE Brownstone Brooklyn NY Multifamily 7,000
PNC Net-Zero Branch - Ft. Lauderdale Ft Lauderdale FL Retail 4,900
Salt Lake City Public Safety Building Salt Lake City UTPublic Order-
safety175,480
Sandy Grove Mid. School Lumber Bridge NC Education- K-12 74,000
Sokol Blosser Winery Tasting Room Dundee OR Retail 5,000
Solterra EcoLuxury Apartments San Diego CA Multifamily Unknown
Taliesin West Net Zero Retrofit - Frank Lloyd Wright
Scottsdale AZ Multifamily District
UC San Diego J Craig Venter Institute La Jolla CA Laboratory 45,000
Wayne Aspinall Federal Building and Courthouse
Grand Junction CO Other (R) 41,562
Walgreens Evanston Store Evanston IL Retail 14,000
ZNE EMERGING IN PLANNING, DESIGN, CONSTRUCTION OR DATE UNKNOWN
435 Indio Sunnyvale CA Office 30,000
64 Catherine Street Boston MA Multifamily 1,416
Abondance - Montreal Multifamily Net Zero Montreal Canada Multifamily 3,048
Arlington Agricultural Research Station Arlington WI District District
BEST Center at Laney College Oakland CA Education- higher District
Boy Scouts of America The Summit Bechtel Reserve Treehouse
Glen Jean WV Public Assembly Unknown
California Department of Motor Vehicles Various CA Office Unknown
California DOT SFOBB Phase 2 Warehouse San Francisco CA warehouse Unknown
Cambridge MA - MLK School Cambridge MA Education- K-12 Unknown
Camp Parks Dublin CA Military District
Charlotte-Douglas Airport - Fire Rescue and Fire Facility
Charlotte NCPublic Order-
safetyUnknown
College of the Desert West Valley Campus Palm Springs CA Education- higher Unknown
Craftsbury Outdoor Center Lodge Craftsbury Common VT Other Unknown
East Bay MET School Newport RI Education- K-12 16,800
Electrical and Computer Engineering Building and University of Illinois
Urbana/Champaign IL Education- higher 250,000
Family Pet Hospital Clovis CA Other Unknown
Fort Bliss Fort Bliss TX Military District
Fort Carson Fort Carson CO Military District
Fort Detrick Frederick MD Military District

new buildings institute | 2014 Getting to Zero Status Update 49
Project Completion Name Location State Building Type Size (sf)
Fort Hunter Liggett Jolon CA Military District
Georgia Peanut Commission HQ Tifton GA Office Unknown
Green Leaf Inn Delavin WI Other Unknown
Green Phoenix Learning Center Phoenix AZ Education- K-12 Unknown
Greensburg Kansas Net Zero Community Greensburg KS Campus District
Hanover Page Mill Building Palo Alto CA Office Unknown
Kaiser Permanente Antelope Valley Specialty Medical Office Building
Lancaster CA Office 136,800
Kalaeloa NZE Community Honolulu HI District District
Keene State College Technology, Design and Safety Building
Keene NH Education- higher Unknown
King County Housing Authority Administration Building
Tukwila WA Office 36,000
La Escuelita Education Center Oakland CA Education- K-12 123,000
Los Angeles Harbor College Sciences Complex
Los Angeles CA Education- higher Unknown
Lowry Redevelopment Multifamily ZNE Denver CO Multifamily Unknown
LPL Financial Center at La Jolla Commons San Diego CA Office 415,000
Massachusetts Division of Fisheries & Wildlife - Field Headquarters Building
Westborough MA Office 45,000
New Century Elementary School Fayetteville NC Education- K-12 Unknown
Oregon National Guard Multiple OR Military District
Orangewood Middle School and studio project
Phoenix AZ Education- K-12 Unknown
P.S. 62 Staten Island NY Education- K-12 68,000
Renewable Energy Experimental Facility Reno NV Other Unknown
Richard J. Lee Elementary School Coppell TX Education- K-12 Unknown
Salt Lake City District Attorney Office Salt Lake City UT Office Unknown
Sierra Army Depot Herlong CA Military District
Sierra Nevada Aquatic Research Lab Multiuse Classroom and Lecture Hall
Mammoth Lakes CA Education- higher Unknown
SMUD Net Zero Campus - East Campus-Operations Center
Sacramento CA Office Unknown
Student Success and Retention Center at East Los Angeles College
Los Angeles CA Education- higher 136,000
UC Davis Jess S. Jackson Sustainable Winery Building
Davis CA Education- higher 8,000
UC Merced Merced CA District District
UC Santa Barbara Recreation Center Santa Barbara CA Education- higher Unknown
UC Santa Barbara Student Services Buildings Santa Barbara CA District District
UniverCity Burnaby Canada District District

new buildings institute | 2014 Getting to Zero Status Update50
Project Completion Name Location State Building Type Size (sf)
University of South Carolina Darla Moore School of Business
Columbia SC Education- higher 250,000
West Point USMA West Point NY Military District
York Elementary School Pearland TX Education- K-12 Unknown
Zero Energy Research Lab at University of North Texas
Denton TX Education- higher Unknown

new buildings institute | 2014 Getting to Zero Status Update 51
Project Completion Name Location State Building
TypeBuilding Size (sf)
Building Energy Use EUI
Site Renewable
EUI
Net Building
EUI
1994 Wampanoag Headquarters Gay Head MA Office 8,700 30 30
1995Durant Road Middle School Raleigh NC
Education- K-12
148,500 25 25
Ridgehaven Office Building San Diego CA Office 78,000 24 24
1996 Claiborne & Churchill WinerySan Luis Obispo
CA Office 2,585 20 20
1998 Vermont Law School Oakes HallSouth
RoyaltonVT
Education- higher
23,500 27 27
2000IAMU Office and Training Headquarters
Ankeny IA Office 12,500 25 25
Zion Comfort Station Springdale UT Other 2,400 20 20
2002Colorado Court Affordable Housing
Santa Monica
CA Multifamily 29,900 39 2 37
Georgina Blach Intermediate School
Los Altos CAEducation-
K-1271,741 33 33
2003
Bazzani Associates HeadquartersGrand Rapids
MI Office (R) 9,480 27 27
EcoDorm at Warren Wilson College Swannanoa NC Multifamily 9,000 23 23
Lower Windsor Township Community Center
Wrightsville PAPublic
Assembly37,100 31 31
Rinker Hall Gainesville FLEducation-
higher47,470 30 30
Schlitz Audubon Nature Center Bayside WI Other 35,387 28 28
South Rim Maintenance & Warehouse Facility
Grand Canyon
AZPublic
Order- Safety72,000 22 22
Southern York County Library Shrewsbury PA Library 10,095 32 32
Woods Hole Research Center Falmouth MA Office (R) 19,200 16 5 11
2004
Doyle Conservation Center Leominster MA Office 22,000 27 4 23
Escalante Science Center Escalante UTEducation-
general21,101 31 31
Lovejoy Opsis Building Portland OR Office (R) 20,000 33 33
Suwannee River Visitor Center Fargo GA Other 7,015 26 26
Westmont High School Science Education Facility
Campbell CAEducation-
K-1212.362 19 19
Ultra-low energy buildings are comparable to ZNE buildings based on energy use, design strategies and technologies but do not have a stated goal of ZNE. They may or may not have onsite renewables; they may provide structure and wiring to easily incorporate photovoltaics at a later date. All ultra-low energy buildings in this report are verified in that they have shared, with NBI or publically, 12 or more months of measured energy use data that documents energy performance dramatically better than the industry average.
Appendix B: List of Ultra-low Energy Verified Projects
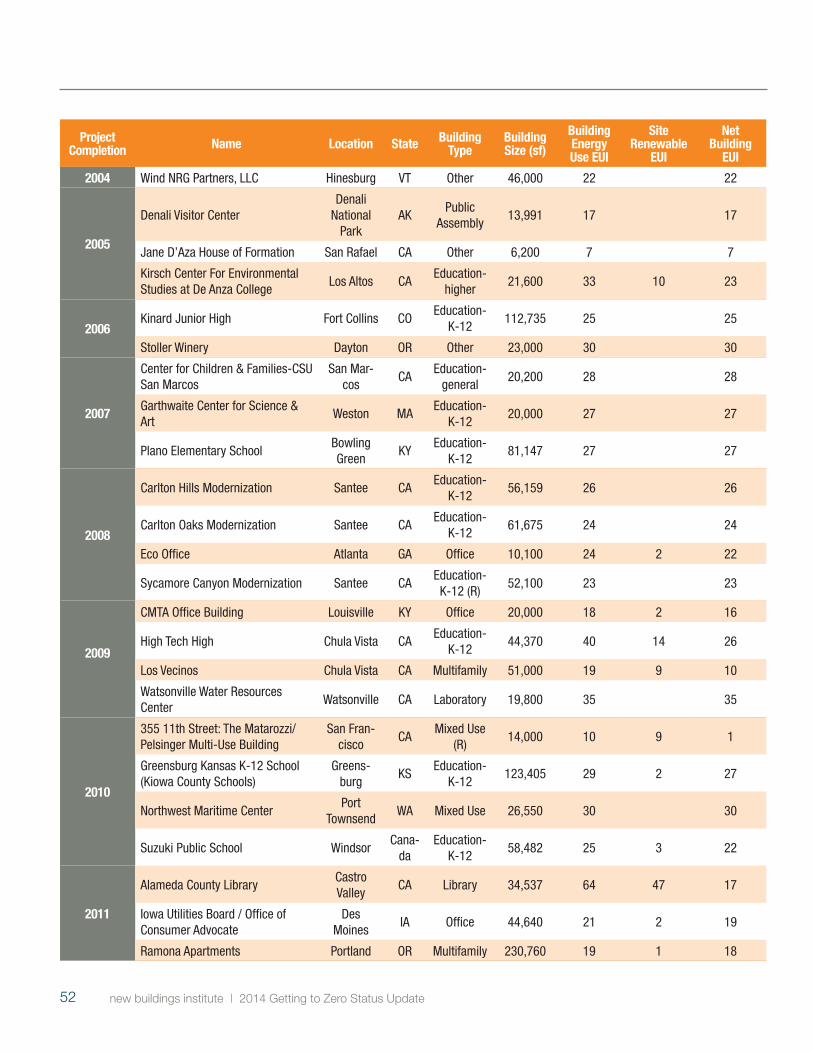
new buildings institute | 2014 Getting to Zero Status Update52
Project Completion Name Location State Building
TypeBuilding Size (sf)
Building Energy Use EUI
Site Renewable
EUI
Net Building
EUI
2004 Wind NRG Partners, LLC Hinesburg VT Other 46,000 22 22
2005
Denali Visitor CenterDenali
National Park
AKPublic
Assembly13,991 17 17
Jane D’Aza House of Formation San Rafael CA Other 6,200 7 7
Kirsch Center For Environmental Studies at De Anza College
Los Altos CAEducation-
higher21,600 33 10 23
2006Kinard Junior High Fort Collins CO
Education- K-12
112,735 25 25
Stoller Winery Dayton OR Other 23,000 30 30
2007
Center for Children & Families-CSU San Marcos
San Mar-cos
CAEducation-
general20,200 28 28
Garthwaite Center for Science & Art
Weston MAEducation-
K-1220,000 27 27
Plano Elementary SchoolBowling Green
KYEducation-
K-1281,147 27 27
2008
Carlton Hills Modernization Santee CAEducation-
K-1256,159 26 26
Carlton Oaks Modernization Santee CAEducation-
K-1261,675 24 24
Eco Office Atlanta GA Office 10,100 24 2 22
Sycamore Canyon Modernization Santee CAEducation- K-12 (R)
52,100 23 23
2009
CMTA Office Building Louisville KY Office 20,000 18 2 16
High Tech High Chula Vista CAEducation-
K-1244,370 40 14 26
Los Vecinos Chula Vista CA Multifamily 51,000 19 9 10
Watsonville Water Resources Center
Watsonville CA Laboratory 19,800 35 35
2010
355 11th Street: The Matarozzi/Pelsinger Multi-Use Building
San Fran-cisco
CAMixed Use
(R)14,000 10 9 1
Greensburg Kansas K-12 School (Kiowa County Schools)
Greens-burg
KSEducation-
K-12123,405 29 2 27
Northwest Maritime CenterPort
TownsendWA Mixed Use 26,550 30 30
Suzuki Public School WindsorCana-
daEducation-
K-1258,482 25 3 22
2011
Alameda County LibraryCastro Valley
CA Library 34,537 64 47 17
Iowa Utilities Board / Office of Consumer Advocate
Des Moines
IA Office 44,640 21 2 19
Ramona Apartments Portland OR Multifamily 230,760 19 1 18

new buildings institute | 2014 Getting to Zero Status Update 53
Project Completion Name Location State Building
TypeBuilding Size (sf)
Building Energy Use EUI
Site Renewable
EUI
Net Building
EUI
2012 NASA Sustainability BaseMountain
View CA Office-other 50,000 53 5 48
2013 31 Tannery Road Branchburg NJ Office 41508 28 19 9
Aventine La Jolla CA Office 253,000 23 23
M.E. Group Omaha Office Omaha NE Office 6,200 28 28
Navy Building 850Port
HuenemeCA Office 17,000 25 11 14
NREL Wind Site Entrance Building (SEB)
Golden CO Other 160 45 29 16
Takoma Village Cohousing Washington DC Multifamily 51,000 26 26

new buildings institute | 2014 Getting to Zero Status Update54
The number of case studies on green and ZNE buildings has grown in recent years yet measured energy performance is rarely documented through these public sources25. To meet the objective of presenting actual energy use and ZNE trends, the research team cast a wide net throughout North America in search of commercial buildings targeting or achieving Zero Net Energy. Buildings with very low energy outcomes (i.e. ultra-low energy buildings) were also included in the research because, with the exception of the renewable production, they mirror the processes, technologies and operational aspects necessary to get to zero.
Sources As a starting point for this study NBI reviewed its internal database. Buildings in the database include those identified via previous studies by NBI and others, the Getting to Zero 2012 Status Update research and those that land on a watch list as they come to the attention of staff and colleagues. These leads were supplemented with review of publications, journals and awards; buildings referenced or presented at trade meetings or conferences; outreach with design, engineering firms and owners with a record of high performance buildings; and pursuing lists through utility and green building programs. In addition, NBI issued a widespread public call for ZNE or ultra-low energy project information and established a ZNE Registry to collect the following base-level information:
• Basic building characteristics (location, size, use, certifications and awards, etc.)
• Identification of design strategies and installed energy conservation measures
• Documentation verifying 12 months of energy use for all fuels used
• Documentation verifying 12 months of onsite energy production, if applicable
• Cost information, if available
Energy Data Energy performance information is notoriously difficult to collect, even with strong working relationships with many of the sources. Data comes in many forms such as copies of utility bills, tracking software outputs, numerous iterations of spreadsheets, 15-minute interval data and/or energy dashboards. Interestingly, not all dashboards represented the information in a way that was consistent with the research protocols. In those cases, additional follow-up with a building representative was necessary to dive deeper into the software and find the relevant information. Some projects were simply unable to compile and deliver the requisite information due to time constraints or lack of data availability.
The absence of measured data shared publically or with NBI would result in a project that may actually be performing at ZNE to remain on the ZNE
25 Sources for building case studies and performance data are listed in the Appendix D.
Appendix C: Research Method

new buildings institute | 2014 Getting to Zero Status Update 55
emerging list. Additionally, data that was incomplete or showed the project did not achieve the zero target also stayed on the ZNE emerging list. All ultra-low energy buildings are verified and were added to the data set because additional measured performance data is critical to help move the focus to actual energy use versus modeled or estimated outcomes. Additionally, some of the ZNE emerging projects with measured performance (for example, those that have not yet met the zero target) were included in the analysis in the “Measured Performance” section of this report. Again, this was done to expand the number of project with measured performance data for this research.
Verified How? NBI accepted three methods for verification. The first method applied to the majority of buildings, with NBI staff reviewing monthly measured energy consumption data for all fuels and the renewable energy production data as provided by the ownership/design team. The second approach was representation by a third-party entity of the measured data by means such as an evaluation report, published article, presentation, or citation in an award or other public forum. The third verification method accepted in this research was through the International Living Future Institute (ILFI) as part of the Living Building Challenge or Net Zero Energy Building Certification. The ILFI definition requires 100% of the project’s site energy to be carbon neutral (zero direct use of gas and other fossil-based fuels at the site) and supplied by renewable energy on a net annual basis.
NBI’s ZNE verification for this study does not restrict gas or other fuels but required that all fuels be accounted for in the whole building energy total (EUI). Documented onsite renewable production must then equal or exceed the energy use of all fuels over the course of a year. Verification of the actual energy performance of buildings has long been part of NBI’s work to research and recognize best practices and leaders and to increase measured performance feedback that can improve the next generation of buildings. NBI’s ZNE and ultra-low energy building registry is publicly available to submit buildings for ongoing studies and verification.

new buildings institute | 2014 Getting to Zero Status Update56
Some of the programs, policies and resources that support ZNE are listed below.
The Energy Trust of Oregon. The Energy Trust provides technical assistance for early design, energy modeling, additional energy-related design studies, energy efficiency equipment, renewable technologies and commissioning. The Energy Trust offered a Path to Net Zero Pilot program of enhanced energy incentives for owners achieving exceptional levels of energy savings and those aiming for net zero energy use. http://energytrust.org/commercial/pilot-programs/path-to-net-zero.aspx The Evaluation of the Path to Net Zero Pilot Program offers interesting lessons learned for others considering a ZNE pilot. The evaluation is available at: http://energytrust.org/library/reports/121204_PTNZ_Report.pdf
California’s Savings by Design. The Savings by Design program provides educational opportunities and financial support for design teams and buildings that achieve energy savings above Title 24 code. This includes support for design teams, help with additional modeling and assistance with technical resources. Savings by Design has managed a Net Zero Energy pilot program for teams pursuing aggressive ZNE goals. For more information see: www.savingsbydesign.com
ZNE Communications Toolkit. This is a first-of-its-kind set of materials developed by NBI and Resource Media to help address commonly asked questions about ZNE, provide messaging for consistent communications about this ultra-efficiency goal and support advocates in advancing toward California’s aggressive ZNE goals. The toolkit includes a messaging platform, presentation template and communication guide, available at: http://newbuildings.org/index.php?q=zne-communications-toolkit
CPUC Zero Net Energy Commercial Action Plan. As part of the California Long Term Energy Efficiency Strategic Plan, the California Public Utilities Commission (CPUC) developed the Zero Net Energy Commercial Action Plan to help achieve the strategic plan goals and engage industry leaders, relevant agencies, stakeholders, utilities and other key influencers. An ongoing group continues to coordinate Action Plan activities. Find both plans at: http://www.cpuc.ca.gov/PUC/energy/Energy+Efficiency/eesp/
The Road to ZNE, Mapping Pathways to ZNE Buildings in CA. A study conducted by the Heschong Mahone Group Inc. and funded by Pacific Gas and Electric Co. on behalf of the California Investor Owned Utilities. Find the full report at: http://www.energydataweb.com/cpucFiles/pdaDocs/899/Road%20to%20ZNE%20FINAL%20Report_withAppendices.pdf
California Zero Net Energy Buildings Cost Study. This study explored the cost-effectiveness of ZNE buildings in the current residential and commercial marketplace through a review of literature, case studies, and interviews with ZNE experts familiar with residential, commercial, and community-scale projects. Read the report at http://newbuildings.org/sites/default/files/PGE_CA_ZNE_CostStudy_121912.pdf
Appendix D: References

new buildings institute | 2014 Getting to Zero Status Update 57
Kentucky Public Schools. The State of Kentucky Department for Energy Development and Independence helps school districts understand energy use in schools and improve their energy performance. Program information is available at: http://energy.ky.gov/Programs/Pages/ESschools.aspx
Massachusetts Executive Office of Energy and Environmental Affairs. Massachusetts is working to transform energy use in new and existing buildings. The Zero Net Energy Buildings Task Force and Inter-Agency ZNEB Team work to ensure the 2009 Getting to Zero plan for transforming the building sector is implemented. Find out more at: http://www.mass.gov/eea/energy-utilities-clean-tech/energy-efficiency/zero-net-energy-bldgs/
Northeast Energy Efficiency Partnership (NEEP) Roadmap for Zero Net Energy Buildings. NEEP has developed a report that recognizes the leadership potential of public buildings in the approach to ZNE. Their roadmap presents five steps that states and municipalities can do now to make zero net energy public buildings a reality across the northeast. More information about the roadmap is available at: http://www.neep.org/public-policy/energy-efficient-buildings/high-performance-public-buildings/roadmap-for-zero-net-energy-buildings
Living Building Challenge. Managed by the International Living Future Institute, the Living Building Challenge and Net Zero Energy Certification are intended to inspire design and construction of zero impact, restorative buildings. Several commercial projects have been completed and more are in progress. Find out more at https://ilbi.org/lbc
EcoDistricts. EcoDistricts is a non-profit organization that connects people with tools, services and training to help cities and urban development practitioners create resilient, vibrant, resource efficient and just neighborhoods. They have an EcoDistrict Framework to guide innovative district-scale development projects from concept through implementation. Find out more at http://ecodistricts.org/
The Zero Energy Commercial Buildings Consortium (CBC). The CBC published two reports in 2011. The first, Next Generation Technologies Barriers and Recommendations, describes barriers to achieving net zero energy related to key building systems, as well as recommendations for system improvements that would accelerate the transition to net zero energy. The second, Analysis of Cost & Non-Cost Barriers and Policy Solutions, analyzes barriers due to market and policy conditions and provides policy, financing, and other recommendations to address these barriers.
The CBC reports can be downloaded at: http://zeroenergycbc.org/resources/cbc-reports

new buildings institute | 2014 Getting to Zero Status Update58
Reach Codes. “Reach” or “Stretch” codes go beyond the minimum codes to reduce energy. Seen as an important tool to advance state and local policy toward advancing climate goals, they have been adopted in over 275 states, counties, and cities. Find out more about reach codes at: http://energycodesocean.org/research-topics/green-codes#
Benchmarking and Disclosure Policies. Currently two states and nince cities have policies that require benchmarking, rating and disclosure of energy performance information from commercial buildings. Requirements are unique to each locality. These are summarized at: http://www.buildingrating.org/content/us-policy-briefs
Net Metering Policies. Net metering policies allow those that generate renewable energy to feed surplus electricity back to the utility grid. Policies vary by state. Learn more about net metering at the Energy Efficiency and Renewable Energy website of the U.S. Department of Energy: http://apps3.eere.energy.gov/greenpower/markets/netmetering.shtml
International Approach. The European Union has three primary directives that regulate energy policy: The Energy Performance of Buildings Directive, the Energy Efficiency Directive, and the Renewable Energy Directive. Each of the EU member states develops their own approach to achieving the broad goals set out in the directives. The Buildings Performance Institute Europe hosts a data hub about energy use in Europe and maintains links to other data sources, policies and programs at: http://www.buildingsdata.eu/
High Performing Buildings magazine. ASHRAE’s HPB Magazine includes articles and in-depth case studies with technology and energy performance information: http://www.hpbmagazine.org/home
Net Zero Buildings magazine. Net Zero Buildings magazine highlights projects, applications, strategies, and products utilized in NZE buildings: http://www.nzbmagazine.com/
Net Zero Energy Design: A Guide for Commercial Architecture. Hootman, Tom 2012. This book provides a practical guide for architects and related construction professionals who want to design and build net zero energy commercial architecture. Written by an architect who is the director of sustainability for at PNL Architects — a global architecture firm.
Net Zero Energy Buildings: International Projects of Carbon Neutrality in Buildings. Voss, K.; Moss, E. 2013. This book is the result of work since 2008 through the International Energy Agency. The objective is to analyze exemplary buildings that are near a zero-energy balance in order to develop methods and tools for the planning, design and operation of such buildings. The results are documented in this publication and include presentation of selected projects with a focus on relaying knowledge and experience gained by planners and builders.

new buildings institute | 2014 Getting to Zero Status Update 59

1601 BroadwayVancouver, WA 98663www.newbuildings.org
New Buildings Institute (NBI) is a nonprofit organization working to improve the energy performance of commercial buildings. We work collaboratively with commercial building market players — governments, utilities, energy efficiency advocates and building professionals — to remove barriers to energy efficiency, including promoting advanced design practices, improved technologies, public policies and programs that improve energy efficiency.