getting to zero webinar - new buildings...
TRANSCRIPT

+
Getting to Zero Webinar April 26, 2012

+
About NASEO
Only national non-profit organization whose membership includes the 56 governor-designated energy officials from each state and territory
Improve the effectiveness of state energy programs and policies
Seven Regional Coordinators across the nation to aid in sharing lessons learned for successful policy and program replication
Act as a repository of information on issues of particular concern to the states and their citizens (e.g., financing, buildings)
Committee structure includes, Renewables, Electricity, Buildings, Industry, Energy Assurance, Financing, Government Affairs
Serve as the voice of SEOs in Washington, DC

+
Overview of State
Energy Offices
(SEOs):
56 Governor-designated State and Territory
Energy Offices (SEOs) nationwide.
States spur energy-related economic
development, minimize the environmental
impact of growth, crafting energy solutions
that address their citizens' needs and
increase our national energy security.
Funding for programs under the direction of
the governors or legislatures, as well as
federal appropriations for the cost-shared
U.S. State Energy Program.
SEOs invest $4 billion of their own funds
derived from appropriations, bonding, and
system benefit charges each year.
NASEO represents all 56 SEOs, and is
organized around seven regions with
coordinators that aid State and Local
governments in sharing lessons learned.
+ State Energy Offices and Net-Zero
Energy Buildings
ZEBs spur technology innovation and deployment and
economic development
ZEBs can provide a long-term vision and framework
for policy development
Growing interest and activity at the state and local
levels

+
Commercial buildings industry stakeholder group
Vision to transform commercial building sector to net-
zero energy by 2050
Achieves this by addressing technology and market
barriers through:
Public-private collaboration with U.S. DOE
Facilitating information exchange nationally

+ CBC Leadership: Steering
Committee Members

+
CBC Membership
Join at zeroenergycbc.org
Broad industry representation
includes:
Design professionals
Development, construction, financial and
real estate industries
Building owners and operators
Academic and research organizations
Building code agencies and
organizations
High-performance green building
organizations
Indoor air quality and intelligent
buildings experts
Utility energy efficiency programs
Manufacturers and providers of
equipment and techniques
Public transportation experts
Nongovernmental energy efficiency
organizations
+
Technology and Policy gaps and recommendation
reports
Next Generation Technologies: Barriers & Recommendations
Analysis of Cost & Non-Cost Barriers and Policy Solutions
Reviewed current landscape of activity and needs in ZEB across 13 different topics
Themes include:
Importance of integrated design
Need to address and minimize plug loads
Knowledge and analysis gaps in looking at system interactions and multi-building interactions
Connecting post-occupancy performance and energy management
Improved sharing of information, cost data, and performance data

Getting to Zero: 2012 Status Update
A look at the features and costs
of zero energy buildings
Dave Hewitt, NBI Executive Director,
Webinar presented on April 26, 2012

The Nature of Our Work

ZEBs STUDY SCOPE
• Looked at:
– Size and source of available quality data
– Energy Efficiency Measures
– Incremental costs
– Estimated incremental costs from
model-based studies
– State policies and program support

ZEBs STUDY SCOPE
• Net Zero Energy Buildings (ZEBs) – Buildings with measured results and a few modeled
buildings; meet annual needs with on-site renewables
• Zero Energy Capable Buildings (ZEC’s) – Demonstrated efficiency in range of ZEB’s but w/no
renewables
• Zero Energy Equivalent Buildings – Low-energy building that gets (investment grade)
renewable energy from off-site, either the grid or a shared renewable generator.

WHAT WE FOUND
• 21 buildings had sufficient data to call them ZEBs
• 39 buildings are recently constructed or in process with ZEB intentions
• 39 buildings are ZECs – Zero Energy Capable efficiency levels
•Always looking for more - there may be many more ZECs

What We Found: Built Examples
All buildings use PVs to generate
on-site renewable energy
Buildings use readily available
tech. and integrated design
Unique or experimental systems
are infrequently used
Priority attention to E.E. details
include minimizing plug loads
and other “unregulated” loads
2
1
4
3
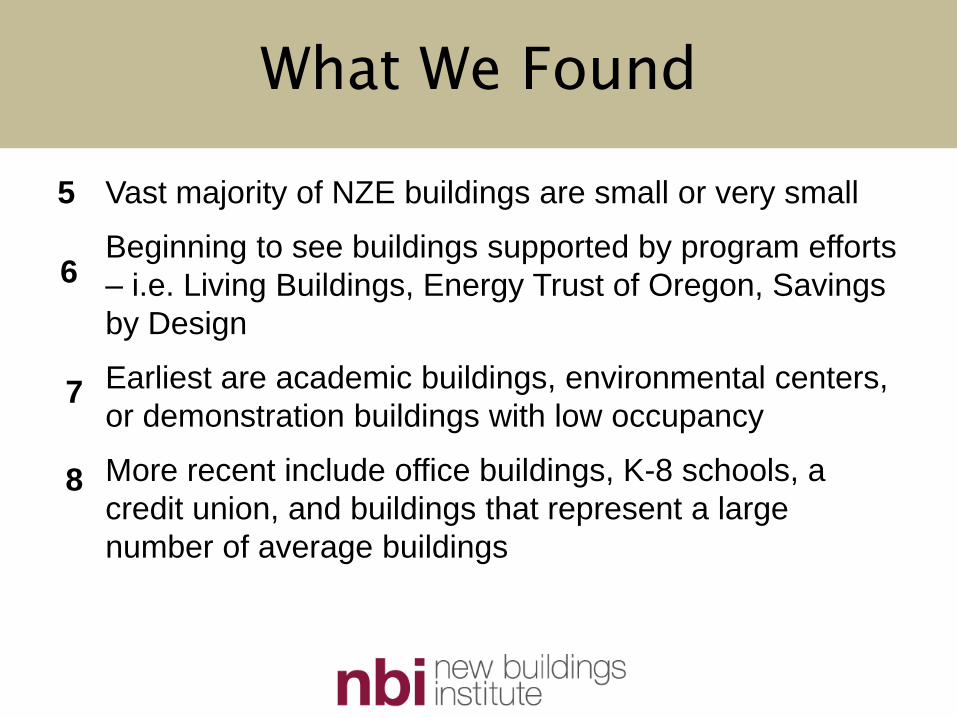
What We Found
Vast majority of NZE buildings are small or very small
Beginning to see buildings supported by program efforts
– i.e. Living Buildings, Energy Trust of Oregon, Savings
by Design
Earliest are academic buildings, environmental centers,
or demonstration buildings with low occupancy
More recent include office buildings, K-8 schools, a
credit union, and buildings that represent a large
number of average buildings
5
6
7
8

ZEBs + ZECs By Type & EUI (total of 57 projects)
0
1
2
3
4
5
6
bu
ildin
g c
ou
nt
ZE-Capable Counts by Type and Total EUI level
< 10 10 - 19.9 20 - 29.9 30 - 35.9Total EUI level
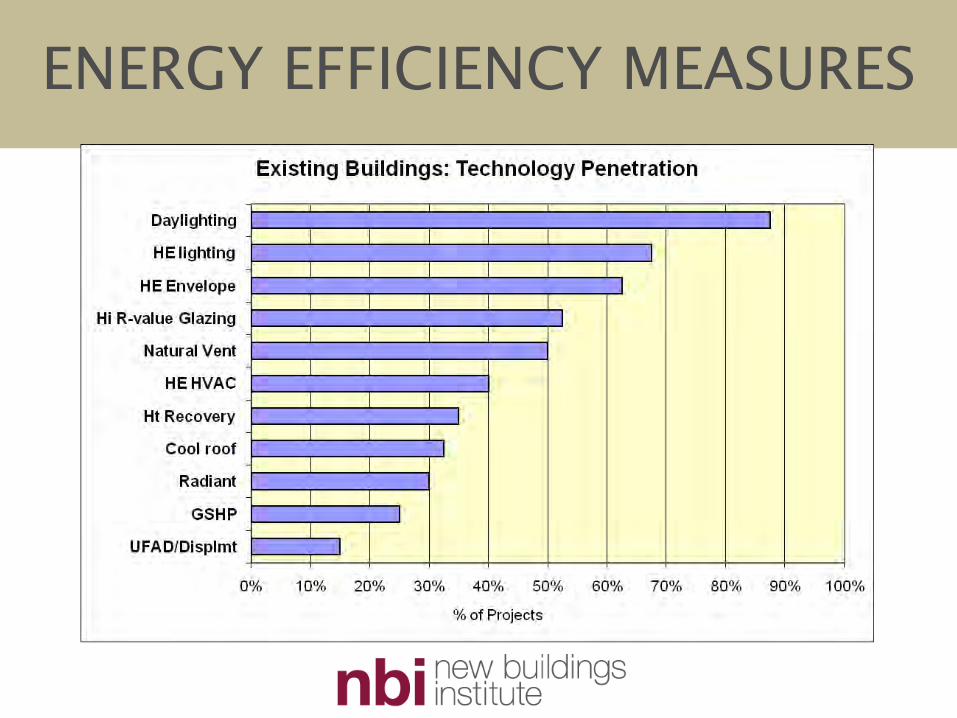
ENERGY EFFICIENCY MEASURES

MEASURING THE COST OF ZEBs
Difficult to isolate cost of individual measures
– Deep energy savings require IDP that considers
interaction of measures.
– Incremental cost must be based on a hypothetical
comparison to “what would have been built”
– Even when attempts at costs and savings are made,
changes are often not tracked through many revisions
– Building costs vary by climate, location and date of
construction
– Good data on a few projects, but hard to generalize
10 4/27/2012
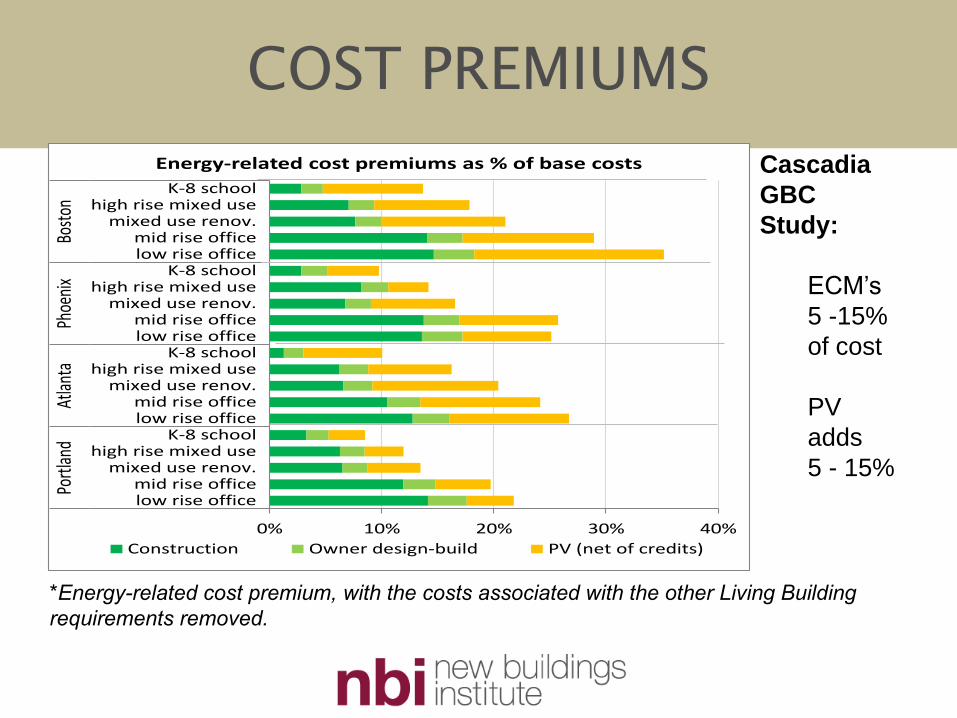
COST PREMIUMS
0% 10% 20% 30% 40%
low rise officemid rise office
mixed use renov.high rise mixed use
K-8 schoollow rise officemid rise office
mixed use renov.high rise mixed use
K-8 schoollow rise officemid rise office
mixed use renov.high rise mixed use
K-8 schoollow rise officemid rise office
mixed use renov.high rise mixed use
K-8 school
Portl
and
Atla
nta
Phoe
nix
Bost
on
Energy-related cost premiums as % of base costs
Construction Owner design-build PV (net of credits)
Cascadia
GBC
Study:
ECM’s
5 -15%
of cost
PV
adds
5 - 15%
*Energy-related cost premium, with the costs associated with the other Living Building requirements removed.

COST PREMIUMS
PNNL and NREL
Studies
Cost premiums for
ee were below 5%
for the 20,000 SF
small offices
Cost premiums for
ee were in the 5 –
7% range for the
50,000 SF
medium offices

Policy and Programs
• California Strategic Plan/Action Plan/BBG
– Action Plan/Champions for Commercial Bldgs
– Savings by Design Program
• Oregon Legislation
– Energy Trust of Oregon program
• Massachusetts Zero Energy Policy
• Living Building Challenge
• Zero Energy Commercial Buildings
Consortium

Key Policy and Program Recommendations - ZECBC
• “… high levels of energy efficiency are the first,
largest and most important step on the way to
net-zero.”
• “Net-zero-energy buildings create a catalyst to
stimulate the thinking and actions required, even
if near-term needs are more related to
establishing key fundamentals that allow the
energy efficiency market to progress...”
• “There is need for a consistent, long-term metric
to measure the performance of buildings and
policy.”

Key Policy and Program Recommendations - ZECBC
• “The move to a zero-energy building stock will
likely require a series of major shifts in the
structure of codes, both in the presentation of
code requirements and in ensuring compliance.”
• “More measured performance data is needed at
the case-study level, the system level (e.g.,
lighting vs. plug loads) and to support owner and
private financing.”
• “There needs to be aggressive financial
incentives to achieve net-zero-energy building
goals.”

California ZNE Action Plan: Priorities Survey
• Focus more on existing buildings than on
new construction.
• California is on the right track with policy,
leadership is needed in other critical areas
-- Path to Zero Campaign, financing, incentives
• More support needed for implementation
efforts, tools and resources
– Case studies, implementation guides,
recognition programs and communications

Study Conclusions
• Examples are expanding and are more representative.
A “second generation” of more typical building types
and ownership patterns is emerging.
• More about integrated design than technology
innovation
• Built ZEBs examples too limited, diverse to conclude
much on costs
• EE needed is readily available at reasonably
incremental cost for some building types
- Incremental costs for common building types ranged from 3%
to 18% depending on building type, location cost factors and
climate (not including PVs)

Recommendations
• ZEBs and ZECs can advance more rapidly with
provision of practical guidance and support
- Clear conditions where ZEB’s are most feasible
(anticipated loads, climate)
- Case Studies Needed - techniques used, results, and
lessons learned with varying climates, building types
- Need better studies of costs/benefits - both initial design
and construction costs and ongoing energy costs savings
- Policy advances at the state and local level can
support the movement to ZEBs and ZECs –
setting a pathway to guide action.

A Quick Case Study Still to Come
If you have questions about the
study, please type them in now.
19 4/27/2012

Case Study Example
IdEAs Z2 | San Jose, CA
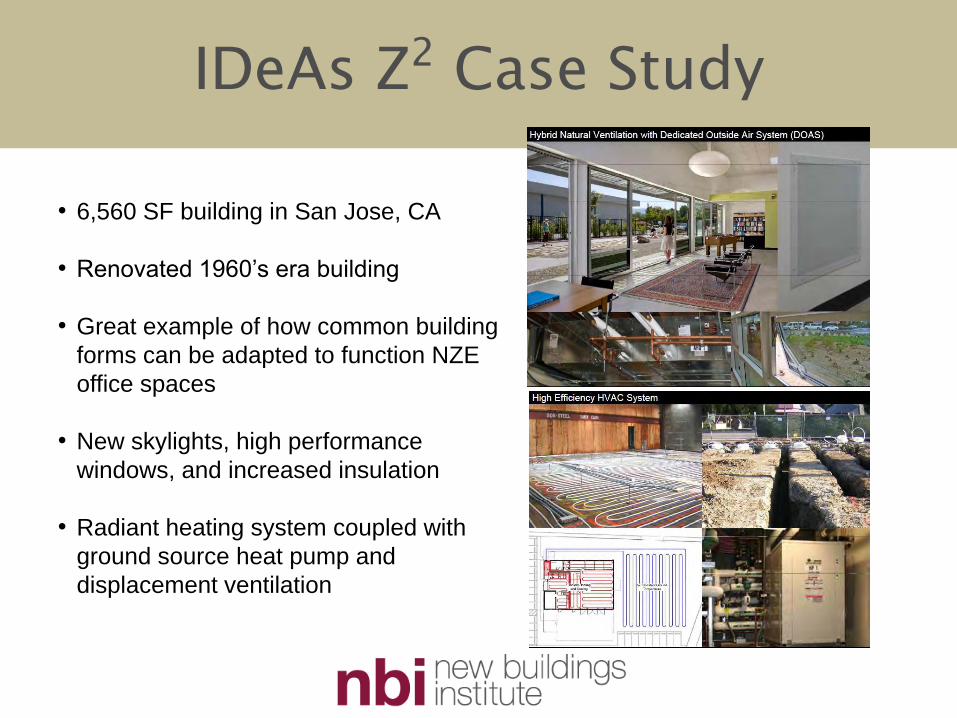
IDeAs Z2 Case Study
• 6,560 SF building in San Jose, CA
• Renovated 1960’s era building
• Great example of how common building
forms can be adapted to function NZE
office spaces
• New skylights, high performance
windows, and increased insulation
• Radiant heating system coupled with
ground source heat pump and
displacement ventilation

IDeAs Z2 Case Study
• Placed extra attention on minimizing
plug loads (both through selection
of equipment and controls)
• Controlled lighting with occupancy
and photosensors

IDeAs Z2 Case Study
• Employed custom control sequence to shut off
specified circuits when security system is armed
eliminates phantom loads and ensures equipment is off
at night
• Cost premium: 7% of the renovation construction costs
for energy efficiency related upgrades

Questions?
Study and additional information
available at
http://www.newbuildings.org/zero-energy
Net Zero EngineeringNet Zero EngineeringNASEO WebinarNASEO WebinarApril 26, 2012April 26, 2012
CMTA Consulting EngineersTony Hans, PE, RCDD, LEED AP
National Director of Sustainable Projects

AgendaAgenda
About Us:About Us:– CMTA & our Net Zero Philosophy
Net Zero:Net Zero:– Past and current Net Zero projects
Case Studies:Case Studies:– Energy Reduction Design Strategies
– Data from past Net Zero Projects

About UsAbout Us
Founded 1968
Located in Kentucky, Texas and Indiana
85 employees
Expertise is sustainability and energy efficiencyand energy efficiency
Nationwide practice focused on education and health care

About UsAbout Us
28 Professional engineers
46 LEED APs
4 RCDDs
6 Energy Modelers
15 Registered Commissioning Agents
4 Certified GeoExchangeDesigners
2 Certified Lighting Designers

LEED and ENERGY STARLEED and ENERGY STAR
Over 10 Net Zero Projects
25 LEED Projects
– 8 Gold
– 3 Silver
– 1 Certified
– 13 Registered– 13 Registered
62 ENERGY STAR Projects
– 56 Schools
– 8 with perfect scores of 100

Recognized ExpertiseRecognized Expertise
Greenbuild, TorontoNational Green Schools Conference, DenverCouncil of Educational Facilities Planners International (CEFPI), Net Zero Energy Symposium, DallasArmy Net Zero Energy Installation Conference, ChicagoNet Zero Energy Conference, Savannah SAMEAssociation for the Advancement of Sustainability in Higher Education (AASHE), IndianapolisCouncil of Educational Facilities Planners International (CEFPI), Washington, DCCouncil of Educational Facilities Planners International (CEFPI), Washington, DCSchool Building Expo, PittsburghAmerican Society of Heating, Refrigerating and Air-Conditioning Engineers’ (ASHRAE) Net Zero Conference, San FranciscoBuilding Industry Consulting Service International Annual Conference (BICSI), Las VegasASHRAE’s High Performance Schools Conference. AtlantaMidwest Healthcare Engineers, IndianapolisLightfair International in PhiladelphiaGreening the Heartland (USGBC Regional Conference), Cincinnati

Net Zero Net Zero –– Our PhilosophyOur Philosophy
1. Exhaustive study of building’s energy use.
2. Set an annual energy consumption goal to create a financial model.create a financial model.
3. Drastically reduce energy consumption.
4. Discuss Green Power Generation.

Net Zero Net Zero –– SchoolsSchoolsRichardsville Elementary
– 70,000 sf
– 348 kW solar PV
– 17kBtu/sf yr
– $204/sf w/solar PV
– 75% EUI Reduction
Turkey Foot Middle SchoolTurkey Foot Middle School
– 133,000 sf
– 22 kBtu/sf yr
– 440 kW solar PV
– $210/sf w/solar PV
– 70% EUI Reduction

Net Zero Net Zero –– CampusesCampuses
Locust Trace AgriScience Campus
Third Net Zero Energy School in Kentucky
70,000 Square Feet: Classrooms, Labs, Offices, Riding Arena
$180/sf with solar PV
LISD Center for a Sustainable FutureLISD Center for a Sustainable Future
Agri-Science Lab
Horticultural Lab
Greenhouse
Classrooms
Greenroof Learning Centers

Net Zero Net Zero –– Higher EdHigher Ed
Berea College
Deep Green Dormitory43,000 sf / 120 students
LEED Platinum (Target)
Petal Recognition (Water) under the Living Building Challenge
Net Zero ReadyNet Zero Ready
EUI of 30

Net Zero Net Zero –– OfficeOffice
CMTA Corporate Headquarters
– Energy Star – Perfect 100 (2 Years running)
– $175/sf (with phase I PV)
– 80% EUI Reduction – 80% EUI Reduction

Net Zero Net Zero –– GovernmentGovernment
Army Aviation Support Facility (AASF) – Boone National Guard Center
Harold L. Disney Training Center
DoS – Central America US EmbassyEmbassy


Energy PerformanceEnergy PerformanceCase StudiesCase Studies
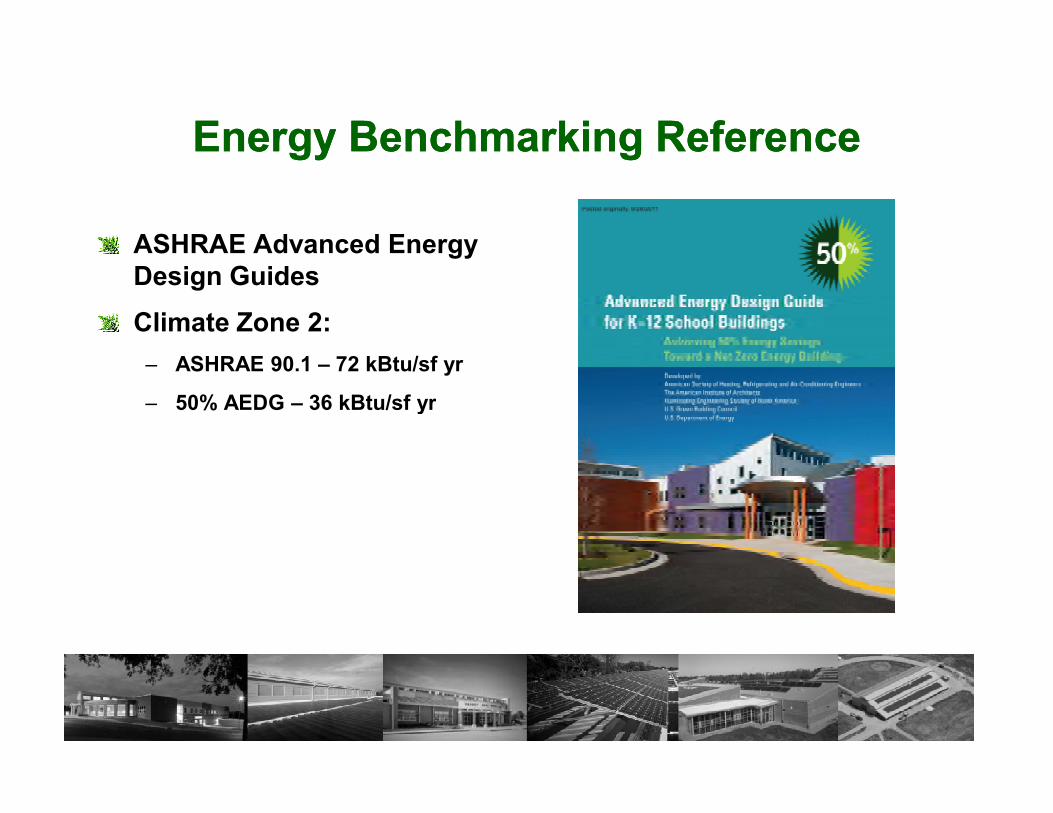
Energy Benchmarking ReferenceEnergy Benchmarking Reference
ASHRAE Advanced Energy Design Guides
Climate Zone 2:
– ASHRAE 90.1 – 72 kBtu/sf yr
– 50% AEDG – 36 kBtu/sf yr– 50% AEDG – 36 kBtu/sf yr

Integrated Design ProcessIntegrated Design Process
Stakeholders all involved
– Regulatory agencies
– Owner
– Building users
– A/E
– Utility– Utility
– Police
Architect’s design was in response to energy goal

MEP Engineering StrategiesMEP Engineering Strategies
Integrated Design Process
Geothermal HVAC
Heat recovery
Demand Control Ventilation
Energy efficient lighting
DaylightingDaylighting
Kitchen efficiencies
Occupancy Lighting / BAS
Real-time monitoring
Solar thermal
Renewables: Solar PV & Wind

Geothermal HVAC SystemGeothermal HVAC System
Dual compressor or two-speed heat pump units
Part load efficiency
Distributive pumping
One heat pump per two One heat pump per two classrooms

Outside Air VentilationOutside Air Ventilation
Dedicated outside air systems (DOAS)
Heat recovery wheel
Demand control ventilation based on CO2 and occupancyoccupancy
Occupant diversity

LightingLighting
Daylight glass (20’ x 2’) with interior light shelf
View glass has exterior shade shelf
Supplemental tubular daylighting devices
0.75 w/sf artificial lighting with digital 0.75 w/sf artificial lighting with digital lighting control system

Lighting Lighting –– Unoccupied Unoccupied
Security Goals
– Interior
– Façade
– Parking

Thermal EnvelopeThermal Envelope
Efficient shape
ICF walls
No mezzanines
Low infiltration, avoided pitched and vented roof systemssystems
Non-daylight glass percentage minimized
Good roof insulation
(R-30)

ComputersComputers
Wireless laptop computers in classrooms
Computer carts instead of computer classroom
Equipment off at night
Reduced computer power consumption by 50% from similar “non-wireless” school

KitchenKitchen
Early High Performance data showed kitchen used 21% of energy
Few energy reductions made in past projects
Need to change paradigmNeed to change paradigm
Type II hoods
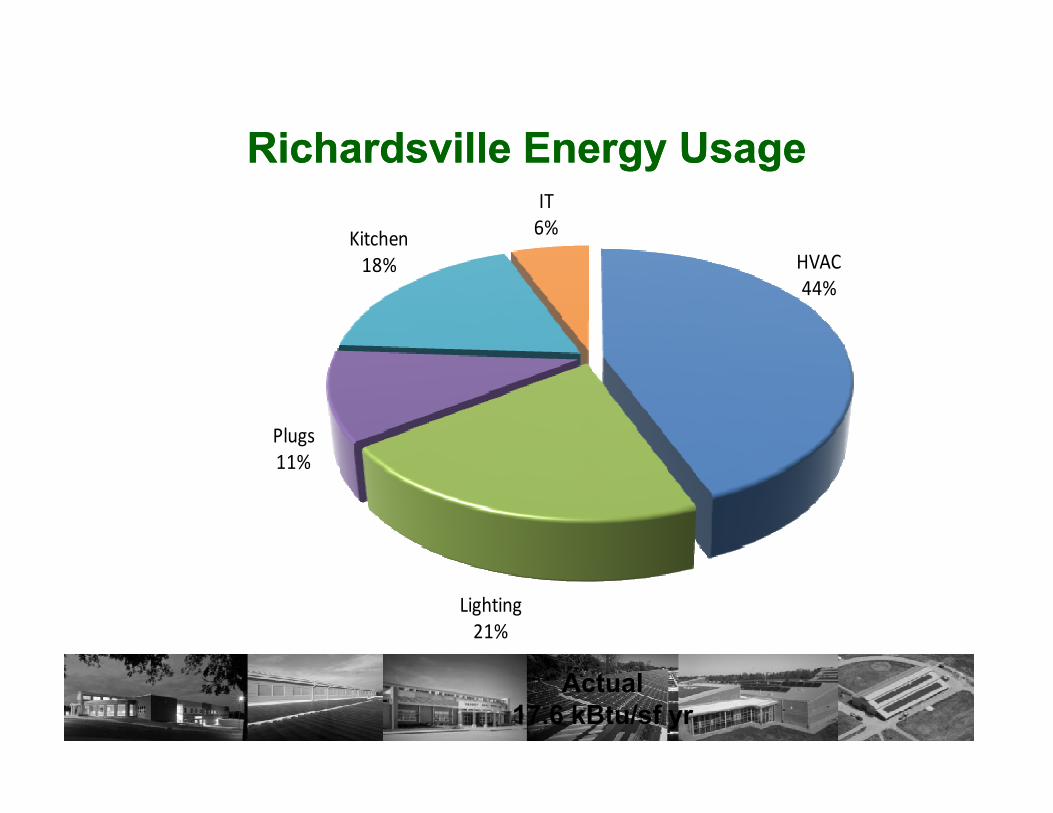
RichardsvilleRichardsville Energy UsageEnergy Usage
HVAC
44%
Kitchen
18%
IT
6%
Lighting
21%
Plugs
11%
Actual17.6 kBtu/sf yr

Turkey Foot Energy UsageTurkey Foot Energy Usage
Actual22 kBtu/sf yr

Richardsville Elementary Energy Model Richardsville Elementary Energy Model Comparison 2010 Comparison 2010 –– 2011 2011
1.5
2
2.5
0
0.5
1
1.5
kBTU
/sf
AUG SEP OCT NOV DEC JAN FEB MAR APR MAY JUN JUL
PROJECTED ACTUAL
Modeled: 17.2 kBTU/sf/yr

Turkey Foot Energy Turkey Foot Energy Model Model Comparison Comparison 20112011

Lighting Lighting -- MonthlyMonthly

Richardsville HVAC Richardsville HVAC –– MonthlyMonthly
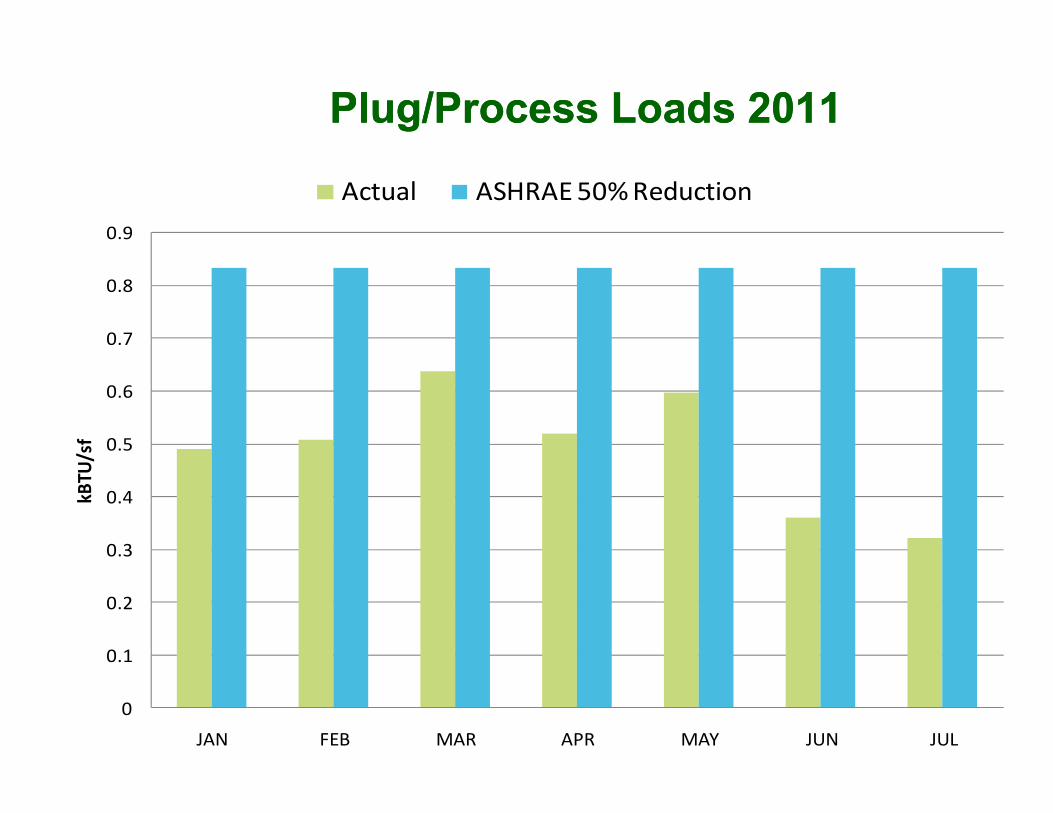
0.6
0.7
0.8
0.9
Actual ASHRAE 50% Reduction
Plug/Process Loads 2011Plug/Process Loads 2011
0
0.1
0.2
0.3
0.4
0.5
JAN FEB MAR APR MAY JUN JUL
kBTU
/sf

Richardsville Elementary HVAC EnergyRichardsville Elementary HVAC Energy

Phase I
– 60% of Required Generation
– Operational February 2011
– 208 kW Thin Film
– 245 MWh/yr electric production
Phase II
Richardsville PV System Phase I and IIRichardsville PV System Phase I and II
Phase II– 100% of Net Zero Generation
– Operational December 2011
– 138 kW On Shade Structure
– Delayed For Old School Demolition
– 163 MWh/yr Electric Production

Electric Utility Summary Electric Utility Summary -- RichardsvilleRichardsville
Read Days of Amount Energy Demand Total Generation
Date Service Due Cost Cost Cost Credit
3/15/12 29 ($2,436) $2,416 $1,826 $4,242 ($6,805)
2/14/12 30 $691 $2,974 $1,883 $4,857 ($4,166)
1/16/12 33 $273.94 $2,210 $1,800 $4,010 ($3,235)
12/14/11 29 ($622) $2,612 $1,595 $4,207 ($1.640)
11/17/11 29 ($3,189) $2,694 $1,440 $4,135 ($2,618)
10/17/11 32 ($4,705) $2,915 $1,840 $4,755 ($4,169)10/17/11 32 ($4,705) $2,915 $1,840 $4,755 ($4,169)
9/15/11 30 ($5,252) $3,544 $2,274 $5,819 ($5,215)
8/16/11 29 ($5,857) $3,162 $2,301 $5,464 ($6,728)
7/18/11 32 ($4,592) $2,355 $1,274 $3,629 ($6,665)
6/16/11 30 ($1,555) $2,846 $1,953 $4,799 ($6,288)
5/17/11 32 ($66) $2,887 $1,788 $4,675 ($4,440)
4/15/11 30 ($301) $2,427 $1,511 $3,938 ($4,239)

Net Zero Energy Net Zero Energy MWhMWh Summary Summary -- RichardsvilleRichardsvilleMWh MWh MWh
Consumed Generated Difference
(Predicted)
March-12 30.6 31 (0.4)
February-12 33.8 22 11.8
January-12 26.0 16 10
December-11 29.2 15 14.2
November-11 31.8 20 11.8
October-11 30.4 32 (1.6)October-11 30.4 32 (1.6)
September-11 38.1 41 (2.9)
August-11 28.0 48 (20.0)
July-11 28.4 54 (25.6)
June-11 28.1 51 (22.9)
May-11 34.1 45 (10.9)
April-11 27.7 38 (10.3)
Total 367 413 (46)

Let’s Talk AffordabilityLet’s Talk Affordability

Thank YouThank You
Tony Hans
Diana Lin, Program Manager, [email protected]
Dave Hewitt, Executive Director, [email protected]