2014_bsc for healthcare.pdf
TRANSCRIPT

Journal of Advances in Management ResearchDevelopment of Balanced Scorecard for healthcare using Interpretive StructuralModeling and Analytic Network ProcessKailash Meena Jitesh Thakkar
Article information:To cite this document:Kailash Meena Jitesh Thakkar , (2014),"Development of Balanced Scorecard for healthcare usingInterpretive Structural Modeling and Analytic Network Process", Journal of Advances in ManagementResearch, Vol. 11 Iss 3 pp. 232 - 256Permanent link to this document:http://dx.doi.org/10.1108/JAMR-12-2012-0051
Downloaded on: 20 October 2014, At: 10:09 (PT)References: this document contains references to 51 other documents.To copy this document: [email protected] fulltext of this document has been downloaded 19 times since 2014*
Users who downloaded this article also downloaded:Beata Kollberg, Mattias Elg, (2006),"Exploring the Use of Balanced Scorecards in Swedish Health CareOrganizations", Asian Journal on Quality, Vol. 7 Iss 2 pp. 1-18Beata Kollberg, Mattias Elg, (2011),"The practice of the Balanced Scorecard in health care services",International Journal of Productivity and Performance Management, Vol. 60 Iss 5 pp. 427-445Li#cheng Chang, (2007),"The NHS performance assessment framework as a balanced scorecard approach:Limitations and implications", International Journal of Public Sector Management, Vol. 20 Iss 2 pp. 101-117
Access to this document was granted through an Emerald subscription provided by 427157 []
For AuthorsIf you would like to write for this, or any other Emerald publication, then please use our Emerald forAuthors service information about how to choose which publication to write for and submission guidelinesare available for all. Please visit www.emeraldinsight.com/authors for more information.
About Emerald www.emeraldinsight.comEmerald is a global publisher linking research and practice to the benefit of society. The companymanages a portfolio of more than 290 journals and over 2,350 books and book series volumes, as well asproviding an extensive range of online products and additional customer resources and services.
Emerald is both COUNTER 4 and TRANSFER compliant. The organization is a partner of the Committeeon Publication Ethics (COPE) and also works with Portico and the LOCKSS initiative for digital archivepreservation.
*Related content and download information correct at time of download.
Dow
nloa
ded
by I
ndia
n In
stitu
te o
f T
echn
olog
y D
elhi
At 1
0:09
20
Oct
ober
201
4 (P
T)
Development of BalancedScorecard for healthcare using
Interpretive Structural Modelingand Analytic Network Process
Kailash Meena and Jitesh ThakkarDepartment of Industrial Engineering and Management,
Indian Institute of Technology Kharagpur, Kharagpur, India
Abstract
Purpose – The purpose of this paper is to develop a Balanced Scorecard-based performancemeasurement framework for health care system.Design/methodology/approach – An integrated ISM-ANP-based quantitative approach is used forthe development of balance scorecard for health care system. The necessary insights are drawn fromthe secondary literature.Findings – This research identifies Key Performance Indicators and their interrelationships forhealth care system. An integrated approach of ISM and ANP is employed for the development ofbalance scorecard.Research limitations/implications – The findings of the research are based on insights gainedfrom secondary literature and an analysis of five cases in health care segment and hence generalizationof proposed framework is limited to the system representing some commonalities with chosen cases.Practical implications – Health care is the diagnosis, treatment and prevention of disease, illness,injury and other physical and mental impairments in humans. Access to health care varies acrosscountries, groups and individuals, largely influenced by social and economic conditions as well as thehealth policies in place. The changing nature of today’s health care organizations, including pressureto reduce costs, improve the quality of care and meet stringent guidelines, has forced health careprofessionals to re-examine how they evaluate their performance.Originality/value – The Balanced Scorecard health care expanded organization measures beyondfinancial analysis. It was first proposed by Robert S. Kaplan and David P. Norton in their book“The Balanced Scorecard (1996, Harvard Business School Press).” This research reports adevelopment of Balanced Scorecard for health care using an integrated approach of InterpretiveStructural Modeling and Analytic Network Process is used.
Keywords Performance measurement, Balanced scorecard, Interpretive structural modeling,Analytic network process, Healthcare management, Key performance indicators
Paper type Research paper
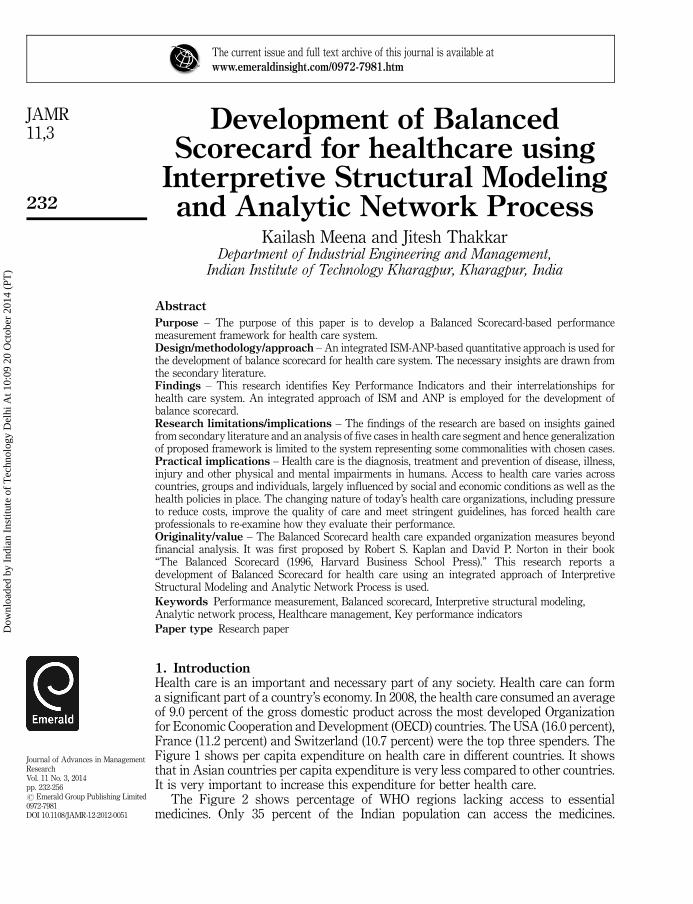
1. IntroductionHealth care is an important and necessary part of any society. Health care can forma significant part of a country’s economy. In 2008, the health care consumed an averageof 9.0 percent of the gross domestic product across the most developed Organizationfor Economic Cooperation and Development (OECD) countries. The USA (16.0 percent),France (11.2 percent) and Switzerland (10.7 percent) were the top three spenders. TheFigure 1 shows per capita expenditure on health care in different countries. It showsthat in Asian countries per capita expenditure is very less compared to other countries.It is very important to increase this expenditure for better health care.
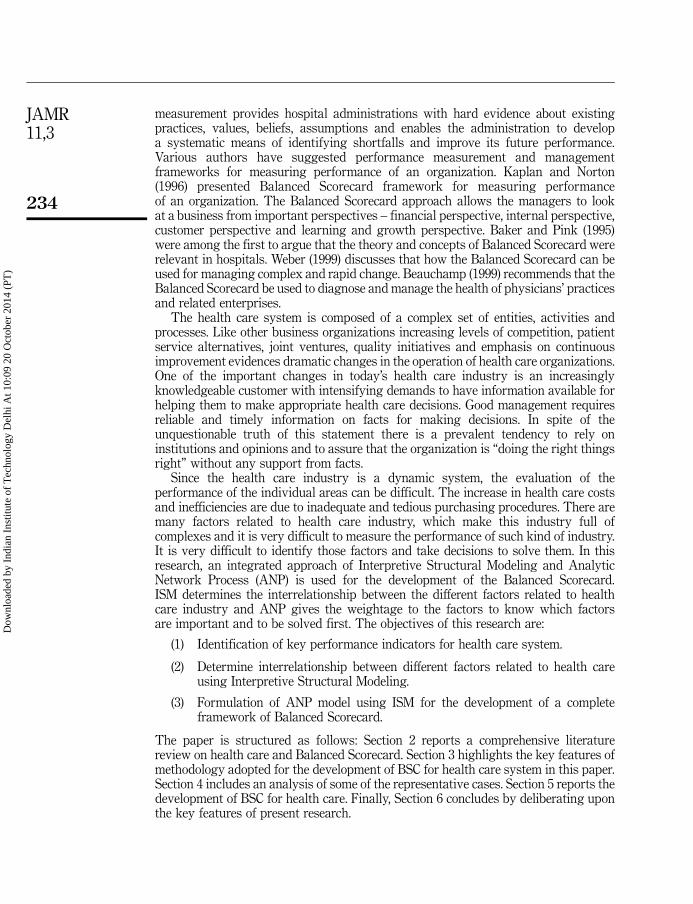
The Figure 2 shows percentage of WHO regions lacking access to essentialmedicines. Only 35 percent of the Indian population can access the medicines.
The current issue and full text archive of this journal is available atwww.emeraldinsight.com/0972-7981.htm
Journal of Advances in ManagementResearchVol. 11 No. 3, 2014pp. 232-256r Emerald Group Publishing Limited0972-7981DOI 10.1108/JAMR-12-2012-0051
232
JAMR11,3
Dow
nloa
ded
by I
ndia
n In
stitu
te o
f T
echn
olog
y D
elhi
At 1
0:09
20
Oct
ober
201
4 (P
T)

Similarly, in Africa only 53 percent of the population is getting medicines. So, itbecomes very important to look for a good health care system in Asian, African andother countries to provide good health care facilities.
The health care sector is one of the fastest growing areas of the economy of mostdeveloped countries. Health care services are complex and challenging to measure.Governments invest larger amounts of money in it, either directly or indirectlyand except a high-quality services from this sector. In reality the performance of thissector is quite different and is characterized by long waiting times, inefficiency,low productivity, stressed medical staff and dissatisfied patients. Performance
0 100 200 300 400 500
UK
India
Pakistan
China
Canada
USA
Germany
Japan
Source: Dass (2011)
Per capita expenditure worldwide
Figure 1.Per capita expenditure
on health care worldwide
African
American
East Mediterranean
Europen
South East Asian
India
West Pacific
China
All countries
0 10 20 30 40 50 60 70
Percentage of WHO regionslacking access to medicines
Source: Dass (2011)
Figure 2.Percentage of
WHO regions lackingaccess to medicines
233
Development ofBalanced
Scorecard forhealthcare
Dow
nloa
ded
by I
ndia
n In
stitu
te o
f T
echn
olog
y D
elhi
At 1
0:09
20
Oct
ober
201
4 (P
T)
measurement provides hospital administrations with hard evidence about existingpractices, values, beliefs, assumptions and enables the administration to developa systematic means of identifying shortfalls and improve its future performance.Various authors have suggested performance measurement and managementframeworks for measuring performance of an organization. Kaplan and Norton(1996) presented Balanced Scorecard framework for measuring performanceof an organization. The Balanced Scorecard approach allows the managers to lookat a business from important perspectives – financial perspective, internal perspective,customer perspective and learning and growth perspective. Baker and Pink (1995)were among the first to argue that the theory and concepts of Balanced Scorecard wererelevant in hospitals. Weber (1999) discusses that how the Balanced Scorecard can beused for managing complex and rapid change. Beauchamp (1999) recommends that theBalanced Scorecard be used to diagnose and manage the health of physicians’ practicesand related enterprises.
The health care system is composed of a complex set of entities, activities andprocesses. Like other business organizations increasing levels of competition, patientservice alternatives, joint ventures, quality initiatives and emphasis on continuousimprovement evidences dramatic changes in the operation of health care organizations.One of the important changes in today’s health care industry is an increasinglyknowledgeable customer with intensifying demands to have information available forhelping them to make appropriate health care decisions. Good management requiresreliable and timely information on facts for making decisions. In spite of theunquestionable truth of this statement there is a prevalent tendency to rely oninstitutions and opinions and to assure that the organization is “doing the right thingsright” without any support from facts.
Since the health care industry is a dynamic system, the evaluation of theperformance of the individual areas can be difficult. The increase in health care costsand inefficiencies are due to inadequate and tedious purchasing procedures. There aremany factors related to health care industry, which make this industry full ofcomplexes and it is very difficult to measure the performance of such kind of industry.It is very difficult to identify those factors and take decisions to solve them. In thisresearch, an integrated approach of Interpretive Structural Modeling and AnalyticNetwork Process (ANP) is used for the development of the Balanced Scorecard.ISM determines the interrelationship between the different factors related to healthcare industry and ANP gives the weightage to the factors to know which factorsare important and to be solved first. The objectives of this research are:
(1) Identification of key performance indicators for health care system.
(2) Determine interrelationship between different factors related to health careusing Interpretive Structural Modeling.
(3) Formulation of ANP model using ISM for the development of a completeframework of Balanced Scorecard.
The paper is structured as follows: Section 2 reports a comprehensive literaturereview on health care and Balanced Scorecard. Section 3 highlights the key features ofmethodology adopted for the development of BSC for health care system in this paper.Section 4 includes an analysis of some of the representative cases. Section 5 reports thedevelopment of BSC for health care. Finally, Section 6 concludes by deliberating uponthe key features of present research.
234
JAMR11,3
Dow
nloa
ded
by I
ndia
n In
stitu
te o
f T
echn
olog
y D
elhi
At 1
0:09
20
Oct
ober
201
4 (P
T)

2. Literature reviewThe changing nature of today’s health care organizations, including pressure to reducecosts, improve the quality of care and meet stringent guidelines, has forced health careprofessionals to re-examine how they evaluate their performance. While many healthcare organizations have long recognized the need to look beyond financial measureswhen evaluating their performance, many still struggle with what measures to selectand how to use the results of those measures. Because a growing number of health careprofessionals have readily adopted quality concepts, health care organizations shouldbe able to quickly improve their performance measurement systems by followinga few simple rules.
The popularity of Robert S. Kaplan and David P. Norton’s Balanced Scorecardmethod popularized in their book The Balanced Scorecard (1996, Harvard BusinessSchool Press), expanded health care organization measures beyond financial analysis.They led to the development of measures in four or more areas, including customer,financial, internal process and learning and growth. Baker and Pink (1995) wereamong the first to argue that the theory and concepts of BSC were relevant in hospitals.Similarly there are many researchers worked on productivity and performancemeasurement in health care services and use of Balanced Scorecard in hospitals, whichcan be shown in Tables I and II.
3. Research methodologyThe research has used an integrated approach of two techniques: InterpretiveStructural Modeling and ANP to develop a Balanced Scorecard for health care.Interpretive Structural Modeling is an effective methodology for dealing with complexissues. It has been used for over 25 years by specially trained consultants to helptheir clients understand complex situations and find solutions to complex problems.First proposed by J. Warfield in 1973, Interpretive Structural Modeling is a computerassisted learning process that enables individuals or groups to develop a mapof complex relationships between the many elements involved in complex situation.ISM is often used to provide fundamental understanding of complex situations, as wellas to put together a course of action for solving problems. It has been used worldwideby many prestigious organizations including NASA. Table III shows the recentcontributions on ISM reported in literature.
The ANP is the most comprehensive framework for the analysis of societal,governmental and corporate decisions that is available to the decision maker. It is aprocess that allows one to include all the factors and criteria, tangible and intangiblethat has bearing on making a best decision. The ANP allows both interaction andfeedback within clusters of elements and between clusters. The ANP models have twoparts: the first is the control hierarchy or network of objectives and criteria that controlthe interactions in the system under study: the second are the many sub-networksof influences among the elements and clusters of the problem, one for each controlcriterion. Table IV shows the recent contributions on ANP reported in literature.
The Balanced Scorecard is an integrated management system consisting of threecomponents:
(1) strategic management system;
(2) communication tool; and
(3) measurement system.
235
Development ofBalanced
Scorecard forhealthcare
Dow
nloa
ded
by I
ndia
n In
stitu
te o
f T
echn
olog
y D
elhi
At 1
0:09
20
Oct
ober
201
4 (P
T)

Sl. no. Reference Focus/contribution
1. Lied (2001) Takes into account resource limitations faced by small hospitals, bothhuman and technological, and suggests a number of measures that arepotentially for demonstrating accountability, benchmarking and qualityimprovement
2. Moullin(2004)
It discusses the eight essential factors of performance measurement.A well-designed performance measurement system is vital for ensuringthat organizations deliver cost effective, high-quality services that meetthe needs of service users
3. Kumar et al.(2005)
The focus was on development of a procurement performancemeasurement system. The results say that through the implementation ofBalanced Scorecard measuring the procurement process can be done veryeasily
4. Booth (2006) It suggests that performance measurement may variously be viewed asone small, but essential stage of EBLIP (Evidence based library andinformation practice)
5. Walley et al.(2006)
Shows the ways in which measurement systems disguise failed decisionsand encourage managers to take a low risk approach Symptomatic Reliefwhen trying to improve performance metrics
6. Kollberg et al.(2006)
Finds lean thinking is applicable in health care settings and flow model issuitable tool for following up initiatives in health care services
7. Peng et al. (2007) Identifies the critical intellectual capital elements and performanceindicators for performance management practices in the Taiwanesehospital industry. Reveals relative importance and ranking of human,organizational and rational capital
8. Purbey et al.(2007)
Suggests that a performance measurement system should be sensitive tochanges in the internal and external environment of an organization
9. Chang (2007) Explores the limitations and implications of Performance AssessmentFramework (PAF) as a balanced scorecard approach in NHS. Kaplan andNorton suggested that the Balanced Scorecard approach can be adaptedfor strategic performance management purposes in the public sector, thisstudy aims to argue that such claims fail to give sufficient weight to thepolitical context I which a public sector organization operates
10. Lee et al.(2007)
Reveals the problems associated with unsatisfactory delivery of servicesin the current health care system of China as experienced by patients ofdiverse social economic backgrounds, including service quality,accessibility and affordability
11. Lega andVendramini(2008)
Focus is to trace the history and development of performancemeasurement and management systems in the Italian National HealthSystem. Reports that performance management has grown considerablyin the INHS over the last 15 years. The reason for this growth arenormative, coercive and mimetic isomorphism, the introduction of quasimarkets, the adoption of DRGs
12. Dey et al.(2008)
Reveals that a combination of outcome, structure and process-basedcritical success factors and a combined AHP and logical framework-basedperformance management framework helps in managing the performanceof health care services
13. Bakar et al.(2008)
Conducts a preliminary assessment of patient attitudes regarding aspectsof service dimensions using SERVQUAL. The patients’ perceived scoreswere calculated
14. Berbee et al.(2009)
Evaluates the development and use of service level agreements in aBelgain hospital from a client’ point of view
(continued)
Table I.Comprehensive reviewon health care
236
JAMR11,3
Dow
nloa
ded
by I
ndia
n In
stitu
te o
f T
echn
olog
y D
elhi
At 1
0:09
20
Oct
ober
201
4 (P
T)

It results in a carefully selected set of measures derived from and linked to anorganization’s core strategies. There are a number of “balances” in the BalancedScorecard, among which are the balance or equilibrium between four historicaldomains or perspectives considered to be mutually linked in terms of strategy andperformance: learning and growth perspective, internal process perspective, customerperspective, financial perspective.
The Figure 3 depicts the flow diagram of the steps involved in the present research,development of Balanced Scorecard using Interpretive Structural Modeling and ANPfor health care system.
4. Case studyThis research has utilized insights of five case studies to deduct a list of critical factorsfor health care industry. A comprehensive assessment of case studies is reported inTable V.
Based on the case studies discussed above, many factors related to health careindustry are identified. The factors, their theoretical justification and relevance aretabulated in Table VI.
A detailed analysis of case studies has helped to identify 21 factors important inhealth care system. In order to focus on select key factors and minimize quantificationcomplexity, the number is reduced to 14. The simple way of group them is that thefactors which are related to performance, e.g. performance management, performancemeasurement and performance appraisal are bound in one group. Customer-relatedfactors are bound in one group. Profitability and productivity are related to each other,so bound in one group. Quality-related factors are bound in one group. Similarly, theother groups are bound. After reducing them, the factors are:
(1) performance;
(2) customer satisfaction and perception;
(3) leadership commitment;
(4) strategic planning;
(5) culture, courtesy and respect;
(6) communication;
(7) productivity and profitability;
Sl. no. Reference Focus/contribution
15. Naidu (2009) Reports that the patient satisfaction is a multidimensional health careconstruct affected by many variables. Health care quality affects patientsatisfaction, which in turn influences positive patient behaviors such asloyalty
16. Bamford andChaziaislan(2009)
Identifies gaps in the capacity and activity measures used and in thedissemination of performance information
17. Zineldin et al.(2011)
Recommends application of total relationship management and the 5Qsmodel together with a customer orientation strategy for the improvementof health care quality Table I.
237
Development ofBalanced
Scorecard forhealthcare
Dow
nloa
ded
by I
ndia
n In
stitu
te o
f T
echn
olog
y D
elhi
At 1
0:09
20
Oct
ober
201
4 (P
T)
(8) length of stay;
(9) occupancy;
(10) outpatient waiting time;
(11) employee training;
(12) quality assurance;
(13) employee satisfaction; and
(14) adaption of new technologies and new ideas.
Sl. no. Reference Focus/contribution
1. Baker and Pink(1995)
A Balanced Scorecard approach can provide management with acomprehensive framework that turns an organization’s strategicobjectives into a coherent set of performance measures
2. Weber (1999) Provides information about how the Balanced Scorecard can be used formanaging complex and rapid change
3. Santiago (1999) Adapts the Balanced Scorecard for behavioral health care and argues thatit can help organizations guide implementation of strategic planning
4. Urrutia andEriksen (2005)
The BSC is applicable to any type of organization. Hospitals shouldinclude an additional perspective which provides specific information onsocial demographic factors regarding the hospital’s operatingenvironment
5. Thakkar et al.(2006)
Illustrates use of mix approach of cause and effect diagram, InterpretiveStructural Modeling and Analytic Network Process and their use inaddressing some of shortcomings related to the development of BSC for areal life case company KVIC
6. Chen et al. (2006) Shows that BSC is effective for underlining and existing problems andidentifying opportunities for improvements
7. Manville (2007) Shows that Balanced Scorecards can be implemented within a SMEcontext. The motivations for the adoption of the scorecard were bothinternal and external due to heavily regulated organization
8. Gurd and Gao(2007)
Analyses the published cases of BSC in health care. It suggests that a morecomprehensive view would come from a cross-national survey of bestpractice use of BSC in health care
9. Funck (2007) Indicates that different interests are made visible within the perspectivesof BSC without giving priority to one interest over another. The BSC playsan important role in the formation of an equal relationship betweenorganizational interests
10. Chan (2009) Finds an increasing use of strategy map and Balanced Scorecard in thehealth care organizations and health systems
11. Cifalino andBaraldi (2009)
Reports that the operational and strategic approaches are actionable andfeasible to measure the performance of selected training programs
13. Aidemark (2010) Suggests that measurement within the frames of Balanced Scorecardmade it possible to control both volumes and health care quality deliveredby the private competing contractor
14. Atkinson (2012) Describes the performance management framework developed by theRegulation and Quality Improvement Authority in Northern Ireland andidentifies how such a framework may be proactively used to enhanceorganizational effectiveness
15. Yuen and Ng(2012)
The authors unveil evolving HA performance indicators (PI). Despite theHA staff’s explicit quality emphasis, cost control remains the primaryfocus in their performance measurements
Table II.Comprehensive reviewon Balanced Scorecard
238
JAMR11,3
Dow
nloa
ded
by I
ndia
n In
stitu
te o
f T
echn
olog
y D
elhi
At 1
0:09
20
Oct
ober
201
4 (P
T)

Sl. no. Reference Focus/contribution
1. Kumar et al.(2009)
The outcome of the research is a framework for technology transfer in ruralIndia. The research shows that there exists a group of variables having a highdriving power and low dependence requiring maximum attention
2. Sahney et al.(2010)
The ISM technique helps prioritize the strategic issues in quality assessmentqualitatively, so as to propose a hierarchical structure through prioritizing,sequencing and categorizing ideas of ideas. The elements are classified asdrivers, enablers and dependents, and the hierarchically structured
3. Soti et al.(2010)
The ISM based model indicates that “effective top management leadershiprole”, “availability of funds” and “availability of expert training”;“organizational culture”, “organizational infrastructure”, “quality maturitylevel of organization” are tactical requirements
4. Pfohl et al.(2011)
ISM is a useful methodology to structure supply chain risks in an easy anddistributed approach that can also be carried out in a step-by-step process onseveral manufacturing stages. The input to the algorithm has to be welldefined to give the user an extract understanding of all risks that have to beassessed
5. Talib et al.(2011)
The research shows that there exist two groups of barriers, one having highdriving power and low dependency requiring maximum attention and ofstrategic importance and the other having high dependency and low drivingpower and are resultant effects such as high turnover at management level,lack of continuous improvement culture
Table III.Summary of recent
contributions on ISM
Sl. no. Reference Focus/contribution
1. Liebowitz(2005)
The analytic network process when coupled with social network analysis,can be a useful technique for developing interval measures for knowledgemapping activities
2. Bayazit(2006)
Results that ANP can be used as a decision analysis tool to solvemulti-criteria supplier selection that contains interdependencies
3. Bottero andMondini(2008)
Results that the priority list of the alternatives gives a great deal ofimportance to the final project, with respect to the other possibilities. Withreference to the most relevant criteria for the sustainability of the project,the problems related to energy efficiency, the aspects concerning thelandmark and the new services for the inhabitants were given the mostimportance
4. Percin (2010) The comprehensive ANP framework presents a roadmap for successfullyselecting an appropriate KM strategy for Turkish manufacturingorganizations. As compared to human oriented KM strategy and systemoriented KM strategy, dynamic KM strategy can lead to a more targetedimprovement in terms of knowledge transparency, knowledge sharing andcommunication. Demonstrates that the ANP model with minormodifications can be useful to all firms in their KM strategy selectiondecisions
5. Ordoobadi(2012)
Allowing for interdependencies among selection criteria, as well asbetween alternatives and selection criteria provides a more realisticevaluation process than other selection processes that ignore suchinterdependencies
Table IV.Summary of recent
contributions on ANP
239
Development ofBalanced
Scorecard forhealthcare
Dow
nloa
ded
by I
ndia
n In
stitu
te o
f T
echn
olog
y D
elhi
At 1
0:09
20
Oct
ober
201
4 (P
T)

5. ISM- and ANP-based modeling for health careFigure 4 depicts the complete analytical approach (Integrated use of ISM and ANP)adapted for the modeling for health care. Here ISM results an input to ANP. ANP usesa beta version of “Super Decision” software to rank the alternatives (perspectives of theBalanced Scorecard).
Interpretive structural modelingIt enables individuals or groups to develop a map of the complex relationships betweenmany elements involved in complex decision situation. ISM is often used to providefundamental understanding of complex situations, as well as to put together a courseof action for solving a problem. The ISM process transforms unclear, poorly articulatedmental models of systems into visible, well-defined models useful for many purposes.First of all a structural self-interaction matrix is developed on the basis of case studies
Literature review
Health careBalanced Scorecard
Identification of factors relatedto health care
Six case studies reportedin literature
Grouping of factors
Use of integrated approach of ISM and ANP
Interpretive Structural Modeling
Structural self-interactionmatrixReachability matrixLevel partitionClassification of factorsBuilding the ISM model
Analytic Network Process
Super Decision softwarePairwise comparisonsSuper matrix formationSynthesis of resultsPriorities of alternatives
Classification of the factors infour categories:
1. Financial perspective2. Internal business
process perspective3. Customer perspective4. Learning and growth
perspective
Alternatives
1. Financial measures2. Customer measures3. Internal measures4. Innovation and
learning measures
Use ofinterrelationshipbetween factorsbased on ISM
Balanced Scorecard
Weightage of perspectives
OwnersObjectivesTargetsMeasuresInitiatives
Figure 3.Flow diagram of projectwork design
240
JAMR11,3
Dow
nloa
ded
by I
ndia
n In
stitu
te o
f T
echn
olog
y D
elhi
At 1
0:09
20
Oct
ober
201
4 (P
T)

discussed in chapter 4. Then a reachability matrix is formed with the help of structuralself-interaction matrix. Then partition of level is done and finally a ISM model isdeveloped.
Structural self-interaction matrixThe first is step to analyze the contextual relationships of type “leads to.” Based on thecontextual relationship, a structural self-interaction matrix is developed. The casesanalyzed from the literature are used to identify the contextual relationship amongthe factors. This is represented in structural self-interaction matrix in Table VII.Following four symbols are used to denote the direction of relationship between thefactors (Fi and F j):
V: Factor i will assist to reach factor jA: Factor j will assist to reach factor iX: Factor i and j will assist each otherO: Factors i and j are unrelated
Reachability matrixThe SSIM is transformed into a binary matrix, called a initial reachability matrix(Table VIII) by substituting V, A, X and O by 1 and 0 as per the case. The rules for thesubstitution of 1s and 0s are as follows:
. If Fi to F j¼V, then Fij¼ 1 and Fji¼ 0
. If Fi to F j¼A, then Fij¼ 0 and Fji¼ 1
. If Fi to F j¼X, then Fij¼ 1 and Fji¼ 1
. If Fi to F j¼O, then Fij¼ 0 and Fji¼ 0
Level partitionFrom the reachability matrix, the reachability set and antecedent set for each objectiveis found in Table IX. The reachability set includes factors itself and others which itmay help to achieve, similarly the antecedent set consists of factors itself and the otherfactors which help in achieving it. Then the interaction is derived for all factors. The
Variables V1, V2, V3....Vn
Priorities A1, A2, A3....An Pairwise comparisons
Driving-Dependence matrix
Super matrix formationSynthesis of results
GR1
GR2
GR3
ALT
Grouping (GR) Variables and Alternatives (ALT)V2
V1 V3
Vn
Source: Thakkar et al. (2006)
Figure 4.Integrated approach
of ISM and ANP
241
Development ofBalanced
Scorecard forhealthcare
Dow
nloa
ded
by I
ndia
n In
stitu
te o
f T
echn
olog
y D
elhi
At 1
0:09
20
Oct
ober
201
4 (P
T)

Ref
eren
ceC
hen
etal.
(200
6)M
anv
ille
(200
7)P
eng
etal.
(200
7)M
anju
nat
het
al.
(200
7)P
adm
aet
al.
(201
0)
Key
per
form
ance
ind
icat
ors/
fact
ors
Fin
anci
alp
ersp
ecti
ve:
tota
lp
rofi
tm
arg
in,
asse
ttu
rnov
erIn
tern
alb
usi
nes
sp
roce
ssp
ersp
ecti
ve:
staf
fsa
tisf
acti
on,
staf
ftu
rnov
er,l
eng
thof
stay
,oc
cup
ancy
,ou
tpat
ien
tsp
erye
arp
erd
octo
r.C
ust
omer
per
spec
tiv
e:p
atie
nt
sati
sfac
tion
,ou
tpat
ien
tw
aiti
ng
tim
e.L
earn
ing
and
gro
wth
:ex
pen
dit
ure
onm
edic
alre
sear
ch,
outp
atie
nt
acti
vit
y
Lea
rnin
gan
dg
row
thp
ersp
ecti
ve:
Nu
rsin
gst
aff
turn
over
Sta
fftr
ain
ing
Acc
ess
totr
ain
ing
Mis
sion
ind
exIn
tern
alb
usi
nes
sp
roce
ssp
ersp
ecti
ve:
ER
wai
tti
me
Res
pon
siv
enes
sM
edic
aler
ror
rate
Con
trac
tual
allo
wan
ces
Cu
stom
erp
ersp
ecti
ve:
Tim
eto
trea
tin
gp
rov
ider
Cou
rtes
yan
dre
spec
tIn
pat
ien
tsa
tisf
acti
onE
mer
gen
cyd
epar
tmen
tsa
tisf
acti
onP
atie
nt
eng
agem
ent
Fin
anci
alp
ersp
ecti
ve
Op
erat
ing
pro
fit
mar
gin
Day
sca
shon
han
dN
etre
ven
ue
incr
ease
Cos
tp
erp
atie
nt
day
Nu
rsin
gst
aff
pro
du
ctiv
ity
En
han
ced
coll
abor
atio
nIm
pro
ved
com
mu
nic
atio
nIm
pro
ved
lear
nin
g/
adap
tion
cap
abil
ity
Sh
arin
gb
est
pra
ctic
esB
ette
rd
ecis
ion
mak
ing
En
han
ced
pro
du
ctor
serv
ice
qu
alit
yE
nh
ance
din
tell
ectu
alca
pit
alIn
crea
sed
emp
ower
men
tof
emp
loye
es
Lea
der
ship
com
mit
men
tS
trat
egic
pla
nn
ing
Pat
ien
t/m
ark
etfo
cus
Per
form
ance
mea
sure
men
tP
erfo
rman
cem
anag
emen
tS
taff
lear
nin
gan
dm
otiv
atio
nS
taff
wel
l-b
ein
gan
dsa
tisf
acti
onP
roce
ssm
anag
emen
tP
atie
nt
and
oth
ercu
stom
erre
lati
onsh
ips
and
sati
sfac
tion
Gov
ern
ance
and
soci
alre
spon
sib
ilit
ies
Qu
alit
ym
anag
emen
t
Ser
vic
eq
ual
ity
and
its
imp
act
oncu
stom
ersa
tisf
acti
onIm
por
tan
ceof
per
spec
tiv
esfr
omp
atie
nts
and
thei
rat
ten
dan
ceIn
terr
elat
ion
bet
wee
nd
iffe
ren
tfa
ctor
sin
hea
lth
care
org
aniz
atio
ns
Table V.Key performanceindicators/factorsin health care sector
242
JAMR11,3
Dow
nloa
ded
by I
ndia
n In
stitu
te o
f T
echn
olog
y D
elhi
At 1
0:09
20
Oct
ober
201
4 (P
T)

Sl. no. Factors Reference Significance
F1 Accountability Emanuel(1999)
Accountability has become a major issue in health care.Accountability entails the procedures and processes bywhich one party justifies and takes responsibilities for itsactivities
F2 Performancemeasurement
Peng et al.(2007)
Performance measurement helps in reducing costs,improving the quality of care and performance andmeeting stringent guidelines
F3 Performancemanagement
Manville(2007)
Performance management in health care helps in ensuringthat the services are improving and more efficient,motivating and managing staff, learning from pastperformance and improving future performance,increasing public and user satisfaction
F4 Customersatisfaction
Bakar et al.(2008)
Customer satisfaction is a critical component ofprofitability for any business product or service orientedindustry. It helps the organization to stay in the businessand more importantly attain a competitive edge over thecompetitors
F5 Customerperception
Bakar et al.(2008)
Customer perception drives most of the success or failureof health care industry. When customers perceive a needfor a product or service, an industry has limitless ability toexpand, innovate and thrive. In the health care industryproduct customers crave is health and wellness. Health andwellness is an essential quality of life factor that manycustomers are willing to pay a high price to achieve
F6 Leadershipcommitment
Zelman et al.(2003)
Implementation of any type of performance improvementand performance management system means change.Without the absolute commitment of senior leadership,pushing these changes down throughout the organizationwill be difficult at best
F7 Strategicplanning
Purbey et al.(2007)
To maintain high level of commitment and involvement ofhospital staff, volunteers and board members througheducation, recognition and support, a strategic planning isvery important
F8 Employeetraining
Cifalino andBaraldi (2009)
Employee training including the administrator/CEO,administrative team, department managers, medical staffis very much required to maintain the quality of service
F9 Culture Zelman et al.(2003)
Health care is not a “one size fits all” profession. It isimportant to be sensitive to ways in which culture and faithimpact patients’ health care experiences
F10 Communication Zelman et al.(2003)
The aim of communication involves the study and use ofcommunication strategies to inform and influenceindividual and community decisions that enhance health.The importance of communication in health care isincreasingly recognized as a necessary element of efforts toimprove personal and public health. Health communicationcan contribute to all aspects of disease prevention andhealth promotion and is relevant in a number of contexts
F11 Length of stay Chen et al.(2006)
The time which elapses between the request by a patientfor a consultant and attendance on the patient in aconsultation room. Reducing the outpatient is veryimportant to satisfy the customer/patient
(continued)
Table VI.Extensive summary
of factors relevantto healthcare sector
243
Development ofBalanced
Scorecard forhealthcare
Dow
nloa
ded
by I
ndia
n In
stitu
te o
f T
echn
olog
y D
elhi
At 1
0:09
20
Oct
ober
201
4 (P
T)

Sl. no. Factors Reference Significance
F12 Outpatientwaiting time
Bamford andChaziaislan(2009)
It is total operating revenue minus total operating expensesdivided by total operating revenue. Profit margin can beimproved by customer satisfaction, good service quality
F13 Occupancy Chen et al.(2006)
It is simply output divided by input. If the productivityof a hospital is higher that means that the hospitalis in profit
F14 Courtesy andrespect
Chen et al.(2006)
If high quality service has a greater presence in ourpractices and institutions, it would improve clinicaloutcomes, patient and physician satisfaction whilereducing cost and it would create competitive advantagefor those who are expert in its application
F15 Employeesatisfaction
Zelman et al.(2003)
This leads to enhanced service to patients. It also improvesattitudes of employee for better services to patient
F16 Profit margin Chen et al.(2006)
This is critical for long-term survival and expansion ofhealth care system
F17 Profitability Zelman et al.(2003)
This indicates how efficiently health care system ismanaged
F18 Employeeproductivity
Kershaw andKershaw(2001)
This shows serviceability of employee in the system
F19 Service quality Kenagy et al.(1999)
This represents quality of experience and affordabilityof services to the patients
F20 Adaption ofnew technology
Kershaw andKershaw(2001)
This ensures continual improvement of services andcustomer serviceability
F21 Qualityassurance
Urrutia andEriksen(2005)
It shows the control over various processes of health caresystem
Table VI.
Factors 14 13 12 11 10 9 8 7 6 5 4 3 2 1
1. Performance A A X A A A A X A A A A A2. Customer satisfaction and perception A O O O A O A V A A A A3. Leadership commitment V V V X O O O V O V V4. Strategic planning V V V A V V V V X O5. Culture, courtesy and respect O O O A O O O V O6. Communication O O V A V V V V7. Productivity and profitability V A V A A A A8. Length of stay O O V A O O9. Occupancy O O V A O
10. Outpatient waiting time O O V A11. Employee training O V V12. Quality assurance O O13. Employee satisfaction O14. Adaption of new technology and new ideas
Table VII.Structuralself-interaction matrix
244
JAMR11,3
Dow
nloa
ded
by I
ndia
n In
stitu
te o
f T
echn
olog
y D
elhi
At 1
0:09
20
Oct
ober
201
4 (P
T)

factors for which the reachability and interaction sets are same is the top-level factor inthe ISM hierarchy.
Classification of factorsDifferent factors can be classified into four clusters, namely autonomous, dependent,linkage and independent. The driving power- dependence diagram shown in Figure 5helps to classify the factors.
The first cluster includes autonomous factors that have weak driving power andweak dependence. These factors are relatively disconnected from the system. FromFigure 5, culture, courtesy and respect, length of stay, occupancy, employee satisfactionand adaption of new technologies and new ideas fall into this cluster. The secondcluster consists of the dependent factors that have weak driving power but strongdependence. Performance, customer satisfaction and perception, productivity andprofitability and quality assurance fall in this cluster. The third cluster consists of
Factors 1 2 3 4 5 6 7 8 9 10 11 12 13 14 Driving power
1 1 0 0 0 0 0 1 0 0 0 0 1 0 0 32 1 1 0 0 0 0 1 0 0 0 0 0 0 0 33 1 1 1 1 1 0 1 0 0 0 1 1 1 1 104 1 1 0 1 0 1 1 1 1 1 0 1 1 1 115 1 1 0 0 1 0 1 0 0 0 0 0 0 0 46 1 1 0 1 0 1 1 1 1 1 0 1 0 0 97 1 0 0 0 0 0 1 0 0 0 0 1 0 1 48 1 1 0 0 0 0 0 0 0 0 0 1 0 0 49 0 0 0 0 0 0 1 0 1 0 0 1 0 0 3
10 1 1 0 0 0 0 1 1 0 1 0 1 0 0 511 1 0 1 1 1 1 1 1 1 1 1 1 1 0 1212 1 0 0 0 0 0 0 0 0 0 0 1 0 0 213 1 0 0 0 0 0 1 0 0 0 0 0 1 0 314 1 1 0 0 0 0 0 0 0 0 0 0 0 1 3Dependence power 13 8 2 4 3 3 10 4 4 4 2 10 4 4
Table VIII.Reachability matrix
Factors Reachability set Antecedent set Interaction set Level
1 1,7,12 1,2,3,4,5,6,7,8,10,11,12,13,14 1,7,12 12 1,2,7 2,3,4,5,6,8,10,14 2 43 1,2,3,4,5,7,11,12,13,14 3,11 3,11 64 1,2,4,6,7,8,9,10,12,13,14 3,4,6,11 4,6 55 1,2,5,7 3,5,11 5 46 1,2,4,6,7,8,9,10,12 4,6,11 4,6 57 1,7,12,14 1,2,3,4,5,6,7,9,10,11,13 1,7 28 1,2,8,12 4,6,8,11 8 79 7,9,12 4,6,9,11 9 7
10 1,2,7,10,12 4,6,10,11 10 711 1,3,4,5,6,7,8,9,10,11,12,13 3,11 3,11 812 1,12 1,3,4,6,7,8,9,10,11,12 1,12 313 1,7,13 3,4,11,13 13 614 1,2,14 3,4,7,14 14 8
Table IX.Level partition
245
Development ofBalanced
Scorecard forhealthcare
Dow
nloa
ded
by I
ndia
n In
stitu
te o
f T
echn
olog
y D
elhi
At 1
0:09
20
Oct
ober
201
4 (P
T)

linkage factors that have strong driving power and dependence. Any action on thesefactors will have an effect on the factors in the higher level. The fourth cluster consistsof independent factors that have strong driving power and weak dependence. In thiscause, leadership commitment, strategic planning, communication and employeetraining fall in the category of independent (driving) factors.
Building the ISM modelFrom the final reachability matrix, the interpretive structural modeling is generated.If there is a relationship the factors i and j , this is shown by an arrow which pointsfrom i to j . This graph is called a directed graph or diagraph. The developed ISMmodel is shown in Figure 6.
141312 1111 410 39 68765 104 5 8 73 9,13,14 2 12 121
1 2 3 4 5 6 7 8 9 10 11 12 13 14
Dependence
Driving power
Autonomous
Independent Linkage
Dependent
Figure 5.Driving power –dependence diagram
Adaption of new technologies and new ideas
Length of stay Outpatient waiting time Occupancy Employee training
Leadership commitment Employee satisfaction
Strategic planning Communication
Customer satisfaction and perception Culture, courtesy and respect
Quality assurance
Productivity and profitability
Performance
Figure 6.Interpretivestructural model
246
JAMR11,3
Dow
nloa
ded
by I
ndia
n In
stitu
te o
f T
echn
olog
y D
elhi
At 1
0:09
20
Oct
ober
201
4 (P
T)
From Figure 6, it can be said that:
(1) Adaption of new technologies and new ideas will lead to reduce the lengthof stay and outpatient waiting time and will also raise the occupancy of thehospital. It will also improve the employee training.
(2) Reduced length of stay and outpatient waiting time will automatically leadto improve customer satisfaction and perception.
(3) If the employee training is good, then it will lead to improve the employeesatisfaction.
(4) If the higher management and managers of different departments and otherpersonnel are committed to their goals and objectives, it will lead to a betterstrategic planning.
(5) A better strategic planning will lead to improve communication betweenthe employees and it will also improve the behavior of the medical or nursingstaff and other personnel toward the patients.
(6) A proper communication between the employees will improve the quality ofservice and will help to assure the quality.
(7) If the customers/patients are satisfied, profitability of the organization willincrease, that is the ultimate aim of any organization. It will also lead toimprove productivity of the organization.
(8) If the service of quality is up to the mark, it will help to improve profitabilityas well as productivity of the organization. An improved productivity andprofitability indicates that the performance of the organization is improving.
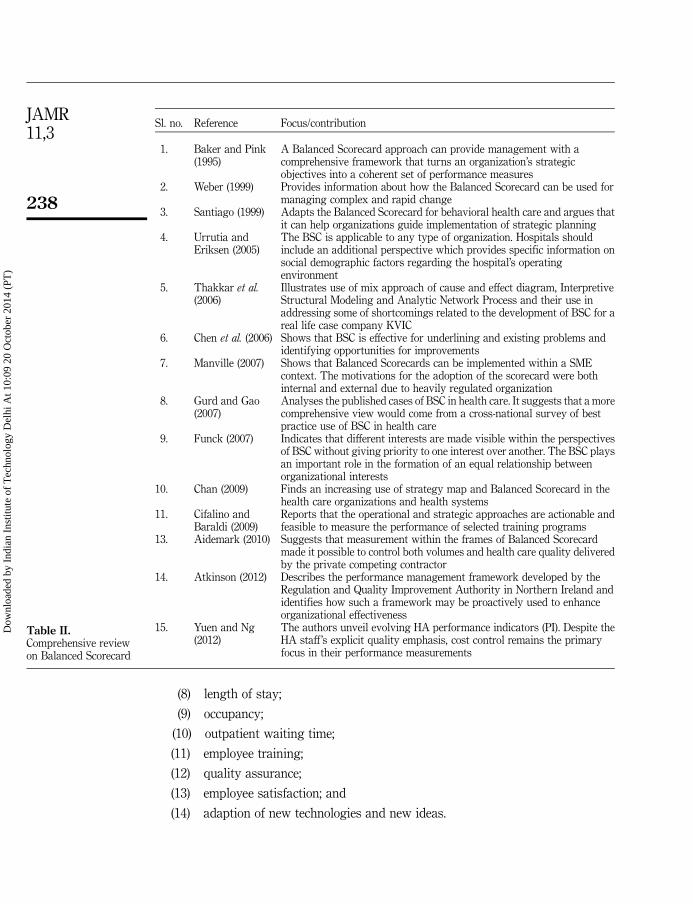
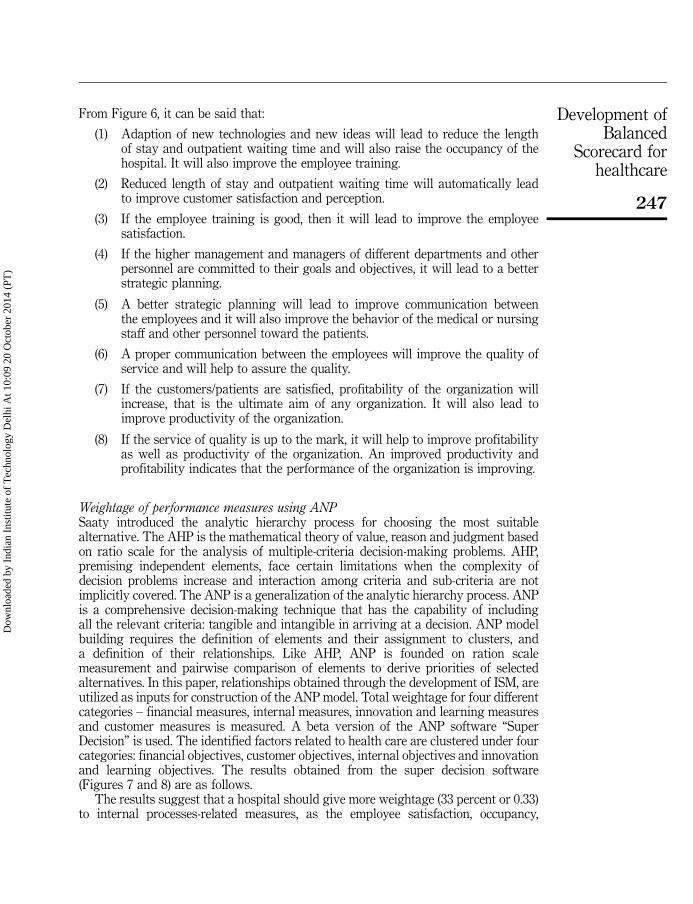
Weightage of performance measures using ANPSaaty introduced the analytic hierarchy process for choosing the most suitablealternative. The AHP is the mathematical theory of value, reason and judgment basedon ratio scale for the analysis of multiple-criteria decision-making problems. AHP,premising independent elements, face certain limitations when the complexity ofdecision problems increase and interaction among criteria and sub-criteria are notimplicitly covered. The ANP is a generalization of the analytic hierarchy process. ANPis a comprehensive decision-making technique that has the capability of includingall the relevant criteria: tangible and intangible in arriving at a decision. ANP modelbuilding requires the definition of elements and their assignment to clusters, anda definition of their relationships. Like AHP, ANP is founded on ration scalemeasurement and pairwise comparison of elements to derive priorities of selectedalternatives. In this paper, relationships obtained through the development of ISM, areutilized as inputs for construction of the ANP model. Total weightage for four differentcategories – financial measures, internal measures, innovation and learning measuresand customer measures is measured. A beta version of the ANP software “SuperDecision” is used. The identified factors related to health care are clustered under fourcategories: financial objectives, customer objectives, internal objectives and innovationand learning objectives. The results obtained from the super decision software(Figures 7 and 8) are as follows.
The results suggest that a hospital should give more weightage (33 percent or 0.33)to internal processes-related measures, as the employee satisfaction, occupancy,
247
Development ofBalanced
Scorecard forhealthcare
Dow
nloa
ded
by I
ndia
n In
stitu
te o
f T
echn
olog
y D
elhi
At 1
0:09
20
Oct
ober
201
4 (P
T)

communication, strategic planning and leadership commitment should be improvedand length of stay should be reduced. Financial and innovation and learning-relatedmeasures have the same weightage (25 percent or 0.25). Customer-related measureshave the least weightage (17 percent or 0.17) and ranked last in the priority.
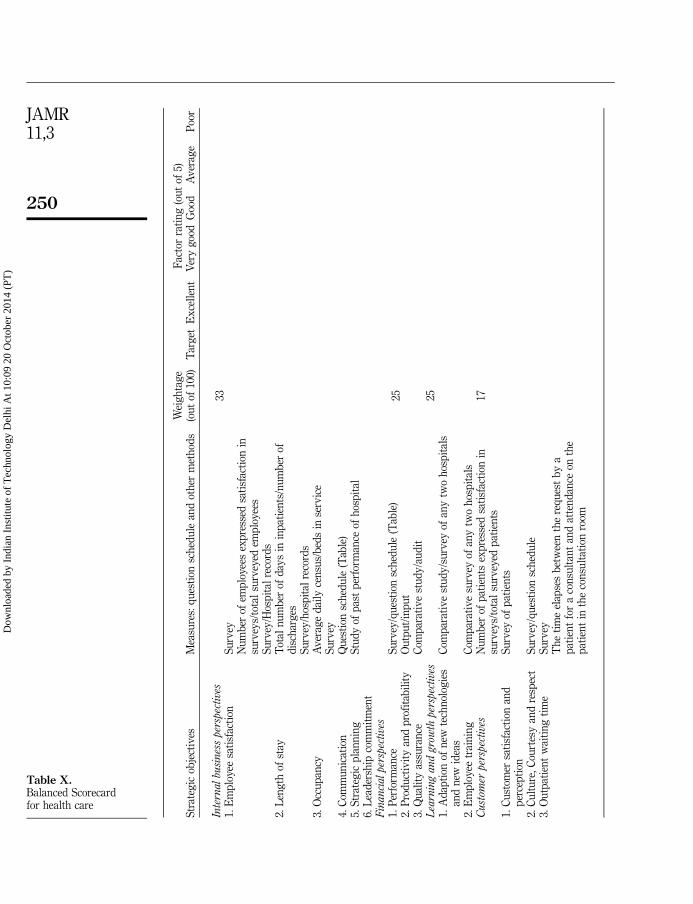
Complete framework of Balanced Scorecard for health careFrom the Balanced Scorecard the overall performance score can be calculated:
Performance score for measure i¼Rating of measure i � Weightage of measure iRating of measure: excellent¼ 5, very good¼ 4, good¼ 3, average¼ 2 and poor¼ 1Total Performance Score¼
PScore of measure i, i¼ 1 to n performance measures
(Table X).
7. ConclusionsFrom the reachability matrix (Table VIII), the employee training has the maximumdriving power, that means to improve the employee training is the key factor. Employeetraining is very important to maintain the quality of service. Next is good strategicplanning and better leadership commitment. To maintain high level of commitment andinvolvement of hospital staff, volunteers and board members through education,recognition and support, a good strategic planning is very important. Without theabsolute commitment of senior leadership, it will be very difficult to implement thechanges throughout the organization. Adaption of new technologies and new ideas willlead to reduce the length of stay and outpatient waiting time and will also raise theoccupancy of the hospital. It will also improve the employee training. Due the changingnature of today’s health care organizations, including pressure to reduce costs, improvethe quality of care and meet stringent guidelines and competition adaption of newtechnology and new ideas is very important for health care industry. Reduced length ofstay and outpatient waiting time will automatically lead to improve customersatisfaction and perception. If the employee training is good, then it will lead to improvethe employee satisfaction. Health care workers play a vital role in patients’ well-being.Their satisfaction is an important issue for all health care managers. Many measurespurport that employee satisfaction is a factor in employee motivation, employee goalachievement, and positive employee morale in the workplace. If the higher managementand managers of different departments and other personnel are committed to their goalsand objectives, it will lead to a better strategic planning. A better strategic planningwill lead to improve communication between the employees and it will also improvethe behavior of the medical or nursing staff and other personnel toward the patients.
Report for toplevel
This is a report for how alternatives fed up through the system to give us our synthesized values. Return to main menu.
Alternative Rankings
Graphic Alternatives Total Normal Ideal Ranking
Customer measures
Financial measures
Innovation and learning measures
Internal measures
0.0000
0.0000
0.0000
0.0000
0.2500
0.2500
0.3333
0.1667 0.5000
1.0000
0.7500
0.7500
4
3
2
1
Note: Results obtained from Super Decision Software
Figure 7.Alternative rankings
248
JAMR11,3
Dow
nloa
ded
by I
ndia
n In
stitu
te o
f T
echn
olog
y D
elhi
At 1
0:09
20
Oct
ober
201
4 (P
T)

Figure 8.ANP model formulation
File
Des
ign
Ass
ess/
Com
pare
Com
puta
tions
Net
wor
ksH
elp
Cus
tom
er p
ersp
ectiv
e
Fin
anci
al p
ersp
ectiv
e
Fin
anci
al m
easu
res
Cus
tom
er m
easu
res
Inte
rnal
mea
sure
s
Inte
rnal
pro
cess
per
spec
tive
Em
ploy
ee s
atis
fact
ion
13
Leng
th o
f sta
y 8
Inno
vatio
n an
d le
arni
ng m
easu
res
Lear
ning
and
gro
wth
per
spec
tive
Ada
ptio
n of
new
tech
nolo
gies
and
new
idas
14
Em
ploy
ee tr
aini
ng 1
1
Alte
rnat
ives
Per
form
ance
1
Cus
tom
er s
atis
fact
ion
and
perc
eptio
n 2
Cul
ture
, cou
rtes
y an
d re
spec
t 5
Out
patie
nt w
aitin
g tim
e 10
Pro
duct
ivity
and
pro
fitab
ility
7
Qua
lity
assu
ranc
e 12
Com
mun
icat
ion
6
Sta
tegi
c pl
anni
ng 4
Lead
ersh
ip c
omm
itmen
t 3
Occ
upan
cy 9
249
Development ofBalanced
Scorecard forhealthcare
Dow
nloa
ded
by I
ndia
n In
stitu
te o
f T
echn
olog
y D
elhi
At 1
0:09
20
Oct
ober
201
4 (P
T)
Fac
tor
rati
ng
(ou
tof
5)S
trat
egic
obje
ctiv
esM
easu
res:
qu
esti
onsc
hed
ule
and
oth
erm
eth
ods
Wei
gh
tag
e(o
ut
of10
0)T
arg
etE
xce
llen
tV
ery
goo
dG
ood
Av
erag
eP
oor
Inte
rnalbu
sines
spe
rspe
ctiv
es33
1.E
mp
loye
esa
tisf
acti
onS
urv
eyN
um
ber
ofem
plo
yees
exp
ress
edsa
tisf
acti
onin
surv
eys/
tota
lsu
rvey
edem
plo
yee
sS
urv
ey/H
osp
ital
reco
rds
2.L
eng
thof
stay
Tot
aln
um
ber
ofd
ays
inin
pat
ien
ts/n
um
ber
ofd
isch
arg
esS
urv
ey/h
osp
ital
reco
rds
3.O
ccu
pan
cyA
ver
age
dai
lyce
nsu
s/b
eds
inse
rvic
eS
urv
ey4.
Com
mu
nic
atio
nQ
ues
tion
sch
edu
le(T
able
)5.
Str
ateg
icp
lan
nin
gS
tud
yof
pas
tp
erfo
rman
ceof
hos
pit
al6.
Lea
der
ship
com
mit
men
tF
inanci
alpe
rspe
ctiv
es1.
Per
form
ance
Su
rvey
/qu
esti
onsc
hed
ule
(Tab
le)
252.
Pro
du
ctiv
ity
and
pro
fita
bil
ity
Ou
tpu
t/in
pu
t3.
Qu
alit
yas
sura
nce
Com
par
ativ
est
ud
y/a
ud
itL
earn
ing
and
grow
thpe
rspe
ctiv
es25
1.A
dap
tion
ofn
ewte
chn
olog
ies
and
new
idea
sC
omp
arat
ive
stu
dy
/su
rvey
ofan
ytw
oh
osp
ital
s
2.E
mp
loye
etr
ain
ing
Com
par
ativ
esu
rvey
ofan
ytw
oh
osp
ital
sC
ust
omer
pers
pect
ives
Nu
mb
erof
pat
ien
tsex
pre
ssed
sati
sfac
tion
insu
rvey
s/to
tal
surv
eyed
pat
ien
ts17
1.C
ust
omer
sati
sfac
tion
and
per
cep
tion
Su
rvey
ofp
atie
nts
2.C
ult
ure
,C
ourt
esy
and
resp
ect
Su
rvey
/qu
esti
onsc
hed
ule
3.O
utp
atie
nt
wai
tin
gti
me
Su
rvey
Th
eti
me
elap
ses
bet
wee
nth
ere
qu
est
by
ap
atie
nt
for
aco
nsu
ltan
tan
dat
ten
dan
ceon
the
pat
ien
tin
the
con
sult
atio
nro
om
Table X.Balanced Scorecardfor health care
250
JAMR11,3
Dow
nloa
ded
by I
ndia
n In
stitu
te o
f T
echn
olog
y D
elhi
At 1
0:09
20
Oct
ober
201
4 (P
T)

The importance of communication in health care is increasingly recognized as anecessary element of efforts to improve personal and public health. Health communicationcan contribute to all aspects of disease prevention and health promotion and is relevant ina number of contexts. A good behavior of the staff toward the patients will improve thecustomer satisfaction. Culture, courtesy and respect are very important factors for healthcare industry. It is very important to maintain a good and positive behavior toward thepatient for improving the service quality. A proper communication between theemployees will improve the quality of service and will help to assure the quality.If high-quality service has a greater presence in our practices and institutions, it wouldimprove clinical outcomes, patient and physician satisfaction while reducing cost and itwould create competitive advantage for those who are expert in its application. If thecustomers/patients are satisfied, profitability of the organization will increase, that isthe ultimate aim of any organization. It will also lead to improve productivity of theorganization. Profitability plays an important role for any type of health care industry.Every health care industry tries to gain profit and that is what they are working for.Similarly, if the productivity of a hospital is higher that means that the hospital is in profit.So, it is very important factor for health care industry. If the service of quality is up to themark, it will help to improve profitability as well as productivity of the organization.An improved productivity and profitability indicates that the performance of theorganization is improving. Performance can be divided into three categories.Performance measurement helps in reducing costs, improving the quality of care andperformance and meeting stringent guidelines. Performance management in health carehelps in ensuring that the services are improving and more efficient, motivating andmanaging staff, learning from past performance and improving future performance,increasing public and user satisfaction. Effective performance appraisal makes possiblethe establishment of an employee development plan to improve performance in thecurrent job and prepare employees for future assignment and responsibilities. It providesthe vehicle for setting individual objectives and goals for the coming appraisal period.The Balanced Scorecard developed for a health care system will be very helpful toidentify the objectives, measures and targets and based on that any health careorganization will be able to take initiative for those targets. The main purpose of theBalanced Scorecard is log-term adaption and survival. Thus the focus is onorganizational mission, strategic management, program and service improvement, andquality management.
The aim behind using the integrated approach is to correlate the strategicobjectives with performance measures, identify relevant measures and determineweightage for various perspectives toward effective system development. Beforeimplementing this framework organizations should analyze the market trends,customer preferences and competitor’s practices. The behavioral accuracy of themodel depends upon care taken in their collection. The presented frameworkis based on case studies, so it may have influence of perceptions developed in thecase studies. The Balanced Scorecard can be used for other organizations also, butcare should be taken in considering the factors, objectives, measures, targets andenvironment of the organization.
This present research is based on secondary information gained through analysis ofselect case studies. It is a combination of two case studies of foreign health care, oneMalaysian organization of knowledge management and two case studies of Indianhealth care. These inputs gave a hybridized output, the Balanced Scorecard, someperspectives will definitely change but it can be used for Indian context as well as for
251
Development ofBalanced
Scorecard forhealthcare
Dow
nloa
ded
by I
ndia
n In
stitu
te o
f T
echn
olog
y D
elhi
At 1
0:09
20
Oct
ober
201
4 (P
T)

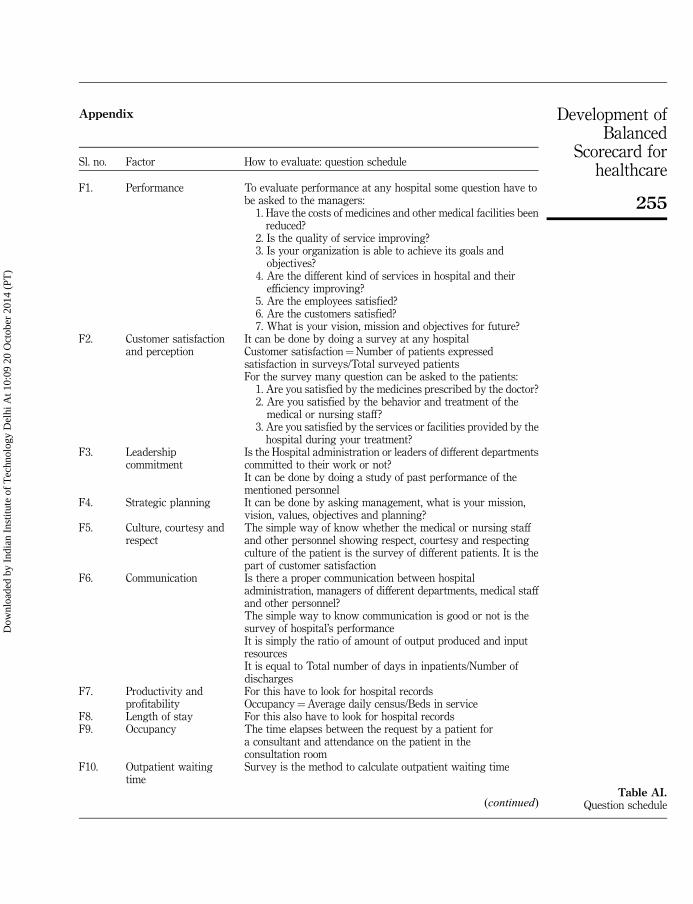
other countries also. However, we propose a questionnaire schedule in Appendix toimprove upon the validity of the proposed framework through extensive studies inhealth care system. This research has reported as integrated approach of InterpretiveStructural Modeling and ANP is used to develop a complete framework of BalancedScorecard. A combination of ISM and ANP is attractive in a way that ISM can satisfythe input demand of ANP output of ANP results in a more usable outcome, which issometimes not possible with the use of any one technique. Further development ofmore sophisticated interface integration using computer programming could increasethe efficiency of the proposed approach.
References
Aidemark, G. (2010), “Cooperation and competition: balanced scorecard and hospitalprivatization”, International Journal of Health Care Quality Assurance, Vol. 23 No. 8,pp. 730-748.
Atkinson, M. (2012), “Developing and using a performance management framework – a casestudy”, Measuring Business Excellence, Vol. 16 No. 3, pp. 102-132.
Bakar, C., Akgun, H.S. and Assaf, A.F. (2008), “The role of expectations in patients’ hospitalassessments: a Turkish university hospital example”, International Journal of Health CareQuality Assurance, Vol. 21 No. 5, pp. 503-516.
Baker, G.R. and Pink, G.H. (1995), “A balanced scorecard for Canadian hospitals”, HealthcareManagement Forum, Vol. 8 No. 2, pp. 7-21.
Bamford, D. and Chaziaislan, E. (2009), “Healthcare capacity measurement”, InternationalJournal of Productivity and Performance Management, Vol. 58 No. 8, pp. 748-766.
Bayazit, O. (2006), “Use of analytic network process in vendor selection decisions”,Benchmarking: An International Journal, Vol. 13 No. 5, pp. 566-579.
Beauchamp, G.R. (1999), “The five ‘S’ levels of enterprise health”, Physician Executive, Vol. 25No. 3, pp. 25-29.
Berbee, R.G., Gemmel, P., Droesbeke, B., Casteleys, H. and Vandaele, D. (2009), “Evaluation ofhospital service level agreements”, International Journal of Health Care Quality Assurance,Vol. 22 No. 5, pp. 483-497.
Booth, A. (2006), “Counting what counts: performance measurement and evidence basedpractice”, Performance Measurement and Metrics, Vol. 7 No. 2, pp. 63-74.
Bottero, M. and Mondini, G. (2008), “An appraisal of analytic network process and its role insustainability in Northern Italy”, Management of Environmental Quality: An InternationalJournal, Vol. 19 No. 6, pp. 642-660.
Chan, Y.L. (2009), “How strategy map works for Ontario’s health system”, International Journalof Public Sector Management, Vol. 22 No. 4, pp. 349-363.
Chang, L. (2007), “The NHS performance assessment framework as a balanced scorecardapproach: limitations and implications”, International Journal of Public SectorManagement, Vol. 20 No. 2, pp. 101-117.
Chen, X.Y., Yamauchi, K., Kato, K., Nishimura, A. and Ito, K. (2006), “Using the balancedscorecard to measure Chinese and Japanese hospital performance”, International Journalof Heath Care Quality Assurance, Vol. 19 No. 5, pp. 339-350.
Cifalino, A. and Baraldi, S. (2009), “Training programs and performance measurement: evidencefrom healthcare organizations”, Journal of Human Resource Costing and Accounting,Vol. 13 No. 4, pp. 294-315.
Dey, P.K., Hariharan, S. and Despic, O. (2008), “Managing healthcare performance in analyticalframework”, Benchmarking: An International Journal, Vol. 15 No. 4, pp. 444-468.
252
JAMR11,3
Dow
nloa
ded
by I
ndia
n In
stitu
te o
f T
echn
olog
y D
elhi
At 1
0:09
20
Oct
ober
201
4 (P
T)

Emanuel, E.J. (1999), “Choice and representation in health care”, Medical Care and ResearchReview, Vol. 56 No. 1, pp. 113-140.
Funck, E. (2007), “The balanced scorecard equates interests in healthcare organizations”,Journal of Accounting and Organizational Change, Vol. 3 No. 2, pp. 88-103.
Gurd, B. and Gao, T. (2007), “Lives in the balance: an analysis of the balanced scorecard (BSC)in healthcare organizations”, International Journal of Productivity and PerformanceManagement, Vol. 57 No. 1, pp. 6-21.
Kaplan, R.S. and Norton, D.P. (1996), The Balanced Scorecard – Translating Strategy Into Action,Harvard Business Press, Boston, MA.
Kenagy, W., Berwick, D.M. and Shore, M.F. (1999), “Service quality in health care”, The Journal ofthe American Medical Association, Vol. 281 No. 7, pp. 661-665.
Kershaw, R. and Kershaw, S. (2001), “Developing a balanced scorecard to implement strategyat St. Elsewhere hospital”, Management Accounting Quarterly, Vol. 2 No. 2, pp. 28-35.
Kollberg, B., Dahlgaard, J.J. and Brehmer, P.O. (2006), “Measuring lean initiatives in health careservices: issues and findings”, International Journal of Productivity and PerformanceManagement, Vol. 56 No. 1, pp. 7-24.
Kumar, A., Ozdamar, L. and Ng, C.P. (2005), “Procurement performance measurement system inthe health care industry”, International Journal of Health Care Quality Assurance, Vol. 18No. 2, pp. 152-166.
Kumar, N., Prasad, R., Shankar, R. and Iyer, K.C. (2009), “Technology transfer for rural housing:an interpretive structural modeling approach”, Journal of Advances in ManagementResearch, Vol. 6 No. 2, pp. 188-205.
Lee, S., Ng, A.W. and Zhang, K. (2007), “The quest to improve Chinese healthcare: somefundamental issues”, International Journal of Health Care Quality Assurance, Vol. 20 No. 5,pp. 416-468.
Lega, F. and Vendramini, E. (2008), “Budgeting and performance management in the ItalianNational Health System (INHS): assessment and constructive criticism”, Journal of HealthOrganization and Management, Vol. 22 No. 1, pp. 11-22.
Liebowitz, J. (2005), “Linking social network analysis with the analytic hierarchy processfor knowledge mapping in organizations”, Journal of Knowledge Management, Vol. 9 No. 1,pp. 76-86.
Lied, T.R. (2001), “Small hospitals and performance measurement: implications and strategies”,International Journal of Health Care Quality Assurance, Vol. 14 No. 4, pp. 168-173.
Manjunath, U., Metri, B.A. and Ramachandran, S. (2007), “Quality management in a healthcareorganization: a case of South Indian hospital”, The TQM Magazine, Vol. 19 No. 2,pp. 129-139.
Manville, G. (2007), “Implementing a balanced scorecard in a not for profit SME”, InternationalJournal of Productivity and Performance Management, Vol. 56 No. 2, pp. 162-169.
Moullin, M. (2004), “Eight essentials of performance measurement”, International Journal ofHealth Care Quality Assurance, Vol. 17 No. 3, pp. 110-112.
Naidu, A. (2009), “Factors affecting patient satisfaction and healthcare quality”, InternationalJournal of Health Care Quality Assurance, Vol. 22 No. 4, pp. 366-381.
Ordoobadi, S.M. (2012), “Application of ANP methodology in evaluation of advancedtechnologies”, Journal of Manufacturing Technology Management, Vol. 23 No. 2, pp. 229-252.
Padma, P., Rajendran, C. and Lokachari, P.S. (2010), “Service quality and its impact on customersatisfaction in Indian hospitals: perspectives of patients and their attendants”,Benchmarking: An International Journal, Vol. 17 No. 6, pp. 807-841.
253
Development ofBalanced
Scorecard forhealthcare
Dow
nloa
ded
by I
ndia
n In
stitu
te o
f T
echn
olog
y D
elhi
At 1
0:09
20
Oct
ober
201
4 (P
T)

Peng, T.A., Pike, S. and Roos, G. (2007), “Intellectual capital and performance indicators:Taiwansese healthcare sector”, Journal of Intellectual Capital, Vol. 8 No. 3, pp. 535-556.
Percin, S. (2010), “Use of analytic network process in selecting knowledge managementstrategies”, Management Research Review, Vol. 13 No. 5, pp. 452-471.
Pfohl, H.C., Gallus, P. and Thomas, D. (2011), “Interpretive structural modeling of supply chainrisks”, International Journal of Physical Distribution and Logistics Management, Vol. 41No. 9, pp. 839-859.
Purbey, S., Mukherjee, K. and Bhar, C. (2007), “Performance measurement system for healthcareprocesses”, International Journal of Productivity and Performance Management, Vol. 56No. 3, pp. 241-251.
Sahney, S., Banwet, D.K. and Karunes, S. (2010), “Quality framework in education throughapplication of interpretive structural modeling: an administrative staff perspective in theIndian context”, The TQM Journal, Vol. 22 No. 1, pp. 56-71.
Santiago, J.M. (1999), “Use of the balanced scorecard to improve the quality of behavioral healthcare”, Psychiatric Service, Vol. 50 No. 12, pp. 1571-1576.
Soti, A., Shankar, R. and Kaushal, O.P. (2010), “Modeling the enablers of Six Sigma usinginterpretive structural modeling”, Journal of Modeling in Management, Vol. 5 No. 2,pp. 124-141.
Talib, F., Rahman, Z. and Qureshi, M.N. (2011), “Analysis of interaction among barriers to totalquality management implementations using interpretive structural modeling approach”,Benchmarking: An International Journal, Vol. 18 No. 4, pp. 463-487.
Thakkar, J., Deshmukh, S.D., Gupta, A.D. and Shankar, R. (2006), “Development of a balancedscorecard: an integrated approach of interpretive structural modeling and analyticnetwork process”, International Journal of Productivity and Performance Management,Vol. 56 No. 1, pp. 25-59.
Urrutia, I. and Eriksen, S.D. (2005), “Application of the balanced scorecard in Spanish privatehealth-care management”, Measuring Business Excellence, Vol. 9 No. 4, pp. 16-26.
Walley, P., Silvester, K. and Mountford, S. (2006), “Health-care process improvement decisions:a systems perspective”, International Journal of Health Care Quality Assurance, Vol. 19No. 1, pp. 93-104.
Weber, D. (1999), “Performance management-the balanced scorecard: a framework formanaging complex and rapid change”, Strategies for Healthcare Excellence, Vol. 12No. 11, pp. 1-7.
Yuen, P.P. and Ng, A.W. (2012), “Towards a balanced performance measurement system in publichealth care organization”, International Journal of Health Care Quality Assurance, Vol. 25No. 5, pp. 421-430.
Zelman, W.N., Pink, G.H. and Matthias, C.B. (2003), “Use of the balanced scorecard in healthcare”, Journal of Health Care Finance, Vol. 29 No. 4, pp. 1-16.
Zineldin, M., Akdag, H.C. and Vasicheva, V. (2011), “Measuring, evaluating and improvinghospital quality parameters/dimensions: an integrated health care quality approach”,International Journal of Health Care Quality Assurance, Vol. 24 No. 8, pp. 654-662.
Further reading
Dass, R. (2011), “Anti-counterfeit technologies for spurious drugs in India”, International Journalof User-Driven Healthcare, Vol. 1 No. 4, pp. 42-52.
Devi, M.S. and Mago, V. (2005), “Multi-agent model for Indian rural health care”, Leadership inHealth Services, Vol. 18 No. 4, pp. 1-11.
254
JAMR11,3
Dow
nloa
ded
by I
ndia
n In
stitu
te o
f T
echn
olog
y D
elhi
At 1
0:09
20
Oct
ober
201
4 (P
T)
Appendix
Sl. no. Factor How to evaluate: question schedule
F1. Performance To evaluate performance at any hospital some question have tobe asked to the managers:
1. Have the costs of medicines and other medical facilities beenreduced?
2. Is the quality of service improving?3. Is your organization is able to achieve its goals and
objectives?4. Are the different kind of services in hospital and their
efficiency improving?5. Are the employees satisfied?6. Are the customers satisfied?7. What is your vision, mission and objectives for future?
F2. Customer satisfactionand perception
It can be done by doing a survey at any hospitalCustomer satisfaction¼Number of patients expressedsatisfaction in surveys/Total surveyed patientsFor the survey many question can be asked to the patients:
1. Are you satisfied by the medicines prescribed by the doctor?2. Are you satisfied by the behavior and treatment of the
medical or nursing staff?3. Are you satisfied by the services or facilities provided by the
hospital during your treatment?F3. Leadership
commitmentIs the Hospital administration or leaders of different departmentscommitted to their work or not?It can be done by doing a study of past performance of thementioned personnel
F4. Strategic planning It can be done by asking management, what is your mission,vision, values, objectives and planning?
F5. Culture, courtesy andrespect
The simple way of know whether the medical or nursing staffand other personnel showing respect, courtesy and respectingculture of the patient is the survey of different patients. It is thepart of customer satisfaction
F6. Communication Is there a proper communication between hospitaladministration, managers of different departments, medical staffand other personnel?The simple way to know communication is good or not is thesurvey of hospital’s performanceIt is simply the ratio of amount of output produced and inputresourcesIt is equal to Total number of days in inpatients/Number ofdischarges
F7. Productivity andprofitability
For this have to look for hospital recordsOccupancy¼Average daily census/Beds in service
F8. Length of stay For this also have to look for hospital recordsF9. Occupancy The time elapses between the request by a patient for
a consultant and attendance on the patient in theconsultation room
F10. Outpatient waitingtime
Survey is the method to calculate outpatient waiting time
(continued)Table AI.
Question schedule
255
Development ofBalanced
Scorecard forhealthcare
Dow
nloa
ded
by I
ndia
n In
stitu
te o
f T
echn
olog
y D
elhi
At 1
0:09
20
Oct
ober
201
4 (P
T)

About the authors
Kailash Meena is a Student of the Department of Industrial Engineering and Management,Indian Institute of Technology Kharagpur, West Bengal, India.
Dr Jitesh Thakkar is an Assistant Professor in the Department of Industrial Engineeringand Management at IIT Kharagpur. He has published extensively in the various peer-reviewedinternational journals like Production Planning and Control, International Journal of Productivity
and Performance Management, International Journal of Six Sigma and Competitive Advantage,Journal of Manufacturing Technology Management, Journal of Small Business and Enterprise
Development, International Journal of Innovation and Learning, etc. He is presently a reviewerfor select international journals in the area of quality and supply chain management. Dr JiteshThakkar is the corresponding author and can be contacted at: [email protected]
Sl. no. Factor How to evaluate: question schedule
F11. Employee training A comparative survey of any two hospital can be conducted,based on the performance we can rank them, say out of 10 toknow whether the hospital have trained employees or notNumber of employees expressed satisfaction in surveys/Totalemployees surveyed
F12. Employee satisfaction A survey has to be conducted for different employees of thehospitalIt is an audit to make sure that the quality of work or service isgood for company or not?
F13. Quality assurance To measure this a comparative study can be conducted to knowwhether mandatory standards are being met or not?
F14. Adaption of newtechnology andnew ideas
A comparative survey of any two health care centers can be madeto compare the adaption of new ideas, technologies, facilities,services, instruments adapted by the health care centersTable AI.
To purchase reprints of this article please e-mail: [email protected] visit our web site for further details: www.emeraldinsight.com/reprints
256
JAMR11,3
Dow
nloa
ded
by I
ndia
n In
stitu
te o
f T
echn
olog
y D
elhi
At 1
0:09
20
Oct
ober
201
4 (P
T)