2015 annual for personal use only report - · pdf filecontents chairman and ceo’s letter...
TRANSCRIPT

2015 ANNUAL REPORT
For
per
sona
l use
onl
y

CONTENTS Chairman and CEO’s Letter 5
Business Snapshot 10
Retail Store Network 12
Board of Directors 16
Directors’ Report 19
Remuneration Report 28
Auditor’s Independence Declaration 38
Independent Auditor’s Report 39
Directors’ Declaration 41
Financial Statements 42
Additional Securities Exchange Information 89
Corporate Directory 91
Godfreys Store Locator 92
Home brands (owned)
Licensed brands
3rd party brands
1Godfreys Group Limited Annual Report 2015
Godfreys is an iconic Australian brand with a trading history spanning more than 80 years. The Company is one of the largest speciality retailers of domestic and commercial floorcare and associated cleaning products in Australia and New Zealand. This includes the sale of products to the domestic and commercial markets via retail, wholesale and online channels. Key product categories offered include vacuum cleaners, carpet shampoo machines, steam cleaners, general cleaning merchandise, accessories and repairs and services.
The Company offers an extensive range of Company-owned brands (including Sauber, Wertheim and Pullman), an exclusively licensed brand (Hoover) and third party brands (such as Bissell, Miele and Electrolux).
Godfreys currently has 212 stores (132 Company-owned and 80 franchised). The stores are predominantly located in shopping centres and retail shopping strips as well as stand-alone superstores.
For
per
sona
l use
onl
y

Godfreys’ greatest strength remains our people, our strong sales culture and our reputation for innovation built on the principles of understanding changing customer needs, deep product knowledge and strong sales culture.
We areclean
Godfreys Group Limited Annual Report 2015 32
For
per
sona
l use
onl
y

CHAIRMAN’S AND CEO’S LETTER
Dear fellow shareholders,
On behalf of the Board and management team of Godfreys (Company), we are pleased to present the Company’s first Annual Report since listing on the Australian Securities Exchange (ASX), for the year ended 26 June 2015.
At the outset we would like to thank you for your continued support of Godfreys as shareholders and reassure you of our commitment to delivering on behalf of our shareholders.
+5.2%Total sales growth
37
12
Release of
NEW STORES opened in FY2015
new products
Our first year as a publicly listed company has seen Godfreys achieve a number of significant milestones, including:
Successfully listing on the Australian Securities Exchange on 10 December 2014;
Delivering on the profit forecast set out in the Prospectus;
Opening 12 new stores, taking the Company’s total stores to 212 throughout Australia and New Zealand;
Opening a new 12,000 square metre distribution centre in Altona, Victoria, doubling our warehouse capacity, and;
Continued success in product innovation and development with the release of 37 new products.
Godfreys Group Limited Annual Report 2015 54
For
per
sona
l use
onl
y

Review of Performance Godfreys successfully exceeded the Prospectus profit forecast, despite the challenging retail market conditions characterised by soft consumer confidence and aggressive competitor activity.
Sales for the year grew by 5.2% to $182.6 million, driven by the successful launch of a number of new products and new store openings.
Underlying Pro Forma Earnings before Interest, Tax, Depreciation and Amortisation (EBITDA) was $22.5 million, up $2.6 million on the previous year, representing an underlying Pro Forma EBITDA margin of 12.3%.
The Company opened twelve new stores during the year and converted eight franchise stores to Company-owned stores. Including the closure of six stores during the period, Godfreys had a total store portfolio of 212 at 26 June 2015. New store roll out will fundamentally underpin the Company’s future growth and the Company will continue to open new stores in metropolitan and regional centres in 2016.
In 2015, Management has demonstrated an ability to enhance the contribution of eight franchise stores when converted to Company-owned stores and this strategy will continue into 2016 as opportunities arise.
Optimisation of the existing store portfolio remains a core part of our growth strategy through initiatives such as relocating stores to better locations, changing store sizes and enhancements to store layouts.
In November 2014 we celebrated the successful launch of our new format “We Are Clean” concept store in Traralgon, Victoria. All future new stores and store refurbishments will adopt this design which sets a new standard in product demonstration and customer engagement. Feedback from our customers has been extremely positive to date and we look forward to introducing this new and exciting concept to more customers over the next year and beyond.
The opening of our new 12,000 square metre distribution centre in Altona, Victoria in May 2015 was also an important development for the Company. The new distribution centre has doubled our warehouse capacity, allowing us to carry more stock and better serve our individual stores and customers through periods of heavy trading.
Innovation continues to be a key driver of our performance and the strength of our dedicated in-house product development team was evidenced by the introduction of 37 new products during the year.
The highly successful launch of our Hoover Allergy bagged and bagless products and the premium Sauber ‘Excellence’ vacuum are prime examples which, combined with our growing range of air purification products, illustrate our determination to be part of every aspect of the concept of ‘clean’.
Our innovation pipeline remains strong, and we have commenced in-house product design and development in key strategic areas, further enhancing our innovation capabilities and enabling us to more quickly respond to the changing needs of our customers.
During the period we also formalised a number of key strategic alliances with overseas suppliers, which will greatly improve the reliability of our overseas product sourcing capability.
Our e-commerce capabilities are a continued area of focus in recognition of the increasing importance of online sales as a channel for our products and services. Our efforts in optimising our online offering have seen online sales grow by 33% in FY2015, with the online store our largest contributing single store by sales volume.
This has also been a major driver of our enhanced social media presence, not simply for advertising our products and services, but also for better engaging with our customers. This has resonated well with our customers, with 2.2 million unique visitors to our online webpage in FY2015.
CHAIRMAN’S AND CEO’S LETTER (CONT.)
152.
3
FY13 FY14 FY15
173.
5
182.
6
Sales $m
Godfreys Group Limited Annual Report 2015 76
For
per
sona
l use
onl
y

PeopleGodfreys’ greatest strength remains its people, its strong sales culture and its reputation for innovation built on the principles of understanding changing customer needs, deep product knowledge and strong sales culture. We thank the talented team at Godfreys for their efforts and congratulate them on a memorable year, during which we listed on the ASX and numerous key growth initiatives were successfully implemented.
We also thank our suppliers and customers for their continued support and look forward to continuing our relationship in FY2016.
SustainabilityWe have commenced a number of joint venture projects with key overseas suppliers on important new products. Our search for new suppliers overseas is ongoing and we are confident that this search will provide us with access to the most technologically advanced products and services in the world and keep us at the forefront of innovation.
Along with our continued investment in e-commerce, our commitment to investing in proprietary IT applications and software will allow us to improve efficiencies throughout the Company.
As a product of our determination to better service all of our customers’ needs, we have initiated and increased our focus on training, with a renewed push towards developing key management skills and resources as well as training our sales staff in-store. In combination with our development of new retail formats, we hope to deliver a better customer experience in each of our stores.
DividendThe Directors declared a final dividend of 12.8 cents per share, of which 3.8 cents is fully franked and 9 cents is unfranked.
The Directors also declared a special dividend of 2.6 cents per share in relation to the profit earned from IPO to 26 December 2014. The special dividend is unfranked.
Both of the dividends represent approximately a 80% payout of the Company’s underlying Pro Forma net profit after tax post IPO. These dividends are to be paid on 9 October 2015.
The Board intends to maintain its dividend policy of paying out between 70% to 80% of the Company’s annual underlying Pro Forma net profit after tax. The Board believes the Company’s strong cash flows provide shareholders with a strong return while still allowing the Company to fund its plan for future growth.
OutlookLooking ahead to next year and beyond, we are well placed to build on the foundations that have been laid down during our first year as a listed Company.
We will continue to expand our store network, capitalising on opportunities where they present in new and existing markets.
As mentioned, our product innovation pipeline remains strong, with the introduction of a number of new categories and the expansion of the existing product range.
FY2015 has been a successful year in terms of both performance and achievement, but there is still much work to be done.
While we are hopeful for the improvement of retail conditions in Australia, we understand the challenges ahead and remain committed to delivering an enhanced financial performance over the next year. We are excited about our prospects.
Sincerely,
Rod Walker Chairman
Tom Krulis Managing Director & CEO
CHAIRMAN’S AND CEO’S LETTER (CONT.)
Pro Forma NPAT $m
0
3
6
9
12
15
0
50
100
150
200
0
5
10
15
20
25
152.
3
15.8 19
.9 22.5
FY13 FY14 FY15 FY13 FY14 FY15
FY13 FY14 FY15
173.
5
182.
6
8.0 10
.8 12.9
Pro Forma EBITDA $m
0
3
6
9
12
15
0
50
100
150
200
0
5
10
15
20
25
152.
3
15.8 19
.9 22.5
FY13 FY14 FY15 FY13 FY14 FY15
FY13 FY14 FY15
173.
5
182.
6
8.0 10
.8 12.9
Underlying Pro Forma Highlights
Godfreys Group Limited Annual Report 2015 98
For
per
sona
l use
onl
y

unique store locator online page views in FY2015
Launched new store format successfully
Transitioned into
Strong free cash conversion
+33%
212 stores
12 new stores opened in FY2015
+18.8%
12,000m2
934,224operate in AUS & NZ
Pro Forma NPAT from
last year
Online store
growthnew warehouse in Altona Victoria
BUSINESS SNAPSHOT
Godfreys Group Limited Annual Report 2015 1110
For
per
sona
l use
onl
y

212STORES THROUGHOUT AUSTRALIA AND NEW ZEALAND
RETAIL STORE NETWORK
299
QLD
409
NSW
3ACT
1923
VIC
137
SA
1NT
61
TAS1811
NZ
4
132
19
80
WA
Store Format – Company-owned and Franchise Stores by Country
Company-owned stores
New Zealand
Franchised stores
Australia
FY15 FY15 FY15 FY15 FY15
173.
5
182.
6
170
23
170
24
175
26
178
28
183
29
FY11 FY12 FY13 FY14 FY15
170
23
170
24
175
26
178
28
183
29
1312 Godfreys Group Limited Annual Report 2015
For
per
sona
l use
onl
y

Our innovation pipeline remains strong, we have commenced product design and development in key strategic areas, further enhancing our innovation capabilities.
Products for life
Godfreys Group Limited Annual Report 2015 1514
For
per
sona
l use
onl
y

Rod Walker was appointed Chairman of International Cleaning Solutions Group Pty Ltd (ICSG) in February 2012 and appointed Chairman of Godfreys Group Limited on 6 November 2014. Rod has had over 30 years of experience in a variety of businesses, working in Australia, the USA and Canada.
Having had success as a CEO, director and chairman of other companies, particularly in the retail industry, Rod currently sits on several boards as chairman. He has led several companies through major acquisitions, mergers, record results and in some cases successful exits whilst also working with a number of CEOs on their professional development.
Member of the Audit & Risk Management Committee
Member of the Nomination and Remuneration CommitteeChairman of the Audit & Risk Management Committee
Member of the Nomination and Remuneration Committee
Chairman of the Nomination and Remuneration Committee
Member of the Audit & Risk Management Committee
Current roles include serving on the boards of The PAS Group, Carpet Court Australia, Micador Group, Bendalls Group and Playtime Group. Rod is also a group chairman within the CEO Circle.
Former board appointments include serving on the boards of Bras N Things, Rebel and Amart Allsports, Immune System Therapeutics, Witchery Fashions, RED Group Retail, Steinhoff International Holdings, Amber Group, Endless Rewards, SleepyHead / Beds R Us and Copperart (trading as Homeart).
In November 2005 Rod formed a private consulting company and since then has coached and mentored a number of CEOs and other senior executives whilst also consulting to a range of businesses. He has also presented to a variety of groups and forums on a range of business related topics. Prior to 2005, Rod was Managing Director of the Freedom Group. At that time Freedom had over 240 stores in the Group with six brands in three countries. Rod led the Group to record results and subsequently oversaw the privatisation of the Company.
Tom Krulis was appointed Managing Director of ICSG in December 2011 and appointed Managing Director of Godfreys Group Limited on 6 November 2014.
Tom joined Godfreys as a Salesperson in 1985 and his outstanding performance and passion for Godfreys saw him progress to Sales Manager and then Joint General Manager in 1989, where he spent time in Queensland opening new stores and establishing the Queensland operation. In 1993, Tom was appointed Managing Director of AVCC (a subsidiary of the Company), responsible for the Victorian, Tasmanian and New Zealand operations, whilst developing the Godfreys superstore concept.
Prior to joining Godfreys, Tom was a Corporate Lawyer at Freehills in Sydney and worked within Corporate Advisory at the Australian Bank (now Australia and New Zealand Banking Group Ltd).
Tom KrulisManaging Director, and Chief Executive Officer
Rod WalkerNon-Executive Chairman
Sue Morphet was appointed to the Board of Godfreys Group Limited in January 2015.
Sue has over 25 years of brand management and retail experience across Australia and New Zealand. Sue was previously CEO of Pacific Brands Limited from December 2007 to September 2012, having worked in that organisation for 17 years, most notably as Group General Manager of Bonds. She has also held senior sales and marketing roles at Sheridan and Herbert Adams. Sue was Chairman of Manufacturing Australia (2013-2015).
Sue is currently a non-executive Director of Asaleo Care Limited, Fisher & Paykel Appliances Holdings Limited and Noni B Limited.
Jon Brett was appointed as Non-Executive Director of ICSG in September 2013, appointed to Godfreys Group Limited in November 2014.
Jon has extensive experience in the areas of management, operations, finance and corporate advisory. Jon’s experience includes several years as managing director of a number of publicly listed companies. Jon is currently on the boards of The PAS Group and Vocus Communications Limited, where he is the chairman of the Audit & Risk Management Committee.
Jon is also a director of several unlisted companies and was an executive director of Investec Wentworth Private Equity Limited and formerly the non-executive deputy president of the National Roads and Motoring Association.
Brendan Fleiter was appointed to the Board of Godfreys Group Limited in November 2014.
Brendan has over 25 years of business experience, having held non-executive and executive directorships over the past 15 years on the boards of ASX listed companies, large private and unlisted public companies, and large Government Business Enterprises and not-for-profit and philanthropic organisations in sport, public health and education.
Brendan was previously CEO of The Crazy John’s Group, a national retail and telecommunications company, prior to its sale to Vodafone Australia in 2008.
Brendan is currently Deputy Chairman of the board of Australia Post (and has been a director since 2011), Deputy Chair of the board of Methodist Ladies’ College and Chair of its Foundation, and a non-executive director of Kennards Hire Pty Ltd, Volleyball Victoria, Our Neighbourhood Foundation, The Australian Food Allergy Foundation and Walnut Melbourne Pty Ltd.
Brendan FleiterNon-Executive Director
Sue MorphetNon-Executive Director
Jon BrettNon-Executive Director
BOARD OF DIRECTORS
Godfreys Group Limited Annual Report 2015 1716
For
per
sona
l use
onl
y

The directors of The Godfrey’s Group Limited (“the Company”) (“the Directors”) submit herewith the annual report of Godfreys Group Limited and its subsidiaries (“the Group”) for the financial year ended 26 June 2015. In order to comply with the provisions of the Corporations Act 2001, the Directors report as follows:
Capital reconstruction and comparative informationGodfreys Group Limited was incorporated on 6 November 2014. On 10 December 2014 the shareholders of the International Cleaning Solutions Group Pty Ltd undertook a capital reconstruction process, through which the Godfreys Group Limited acquired International Cleaning Solutions Group Pty Ltd (“ICSG”). Under the principles of capital reconstruction in accordance with the Australian Accounting Standards, the financial report of Godfreys Group Limited includes the comparative financial information of International Cleaning Solutions Group Pty Ltd for the year ended 27 June 2014.
Information about the directorsThe names and particulars of the directors of the Company during or since the end of the financial year are:
Rod Walker Non-Executive ChairmanRod Walker was appointed chairman of ICSG in February 2012, appointed chairman of Godfreys Group Limited on 6 November 2014. Rod is the Chairman and Non-Executive Director of several Boards.
A member of the Audit & Risk Management Committee and the Remuneration and Nomination Committee.
Other listed entity directorships: PAS Group Limited.
Tom Krulis Managing DirectorTom Krulis was appointed Managing Director of ICSG in December 2011, appointed Managing Director of Godfreys Group Limited on 6 November 2014. Tom joined Godfreys in 1985 and in 1993 was appointed Managing Director of AVCC (a subsidiary of the Company), responsible for the Victorian, Tasmanian and New Zealand operations, whilst developing the Godfreys superstore concept.
Other listed entity directorships: None
Jon Brett Non-Executive DirectorJon Brett was appointed to ICSG board in September 2013, appointed to the Godfreys Group Limited on 6 November 2014. Jon has extensive experience in the areas of management, operations, finance and corporate advisory. Jon’s experience includes several years as Managing Director of a number of publicly listed companies. Jon is currently on the board of The PAS Group and Vocus Communications Limited, and is the Chairman of the Audit and Risk Committee.
Chairman of the Audit & Risk Management Committee.
Other listed entity directorships: Vocus Communications Limited, PAS Group Limited.
Brendan Fleiter Non-Executive DirectorBrendan Fleiter was appointed to the Godfreys Group Limited Board on 6 November 2014. Brendan has over 25 years of business experience, having held non-executive and executive directorships over the past 15 years on the boards of ASX listed companies, large private and unlisted companies, large Government Business Enterprises and not-for-profit organisations in sport, public health and education.
Chairman of the Remuneration and Nomination Committee.
A member of the Audit & Risk Management Committee.
Other listed entity directorships: None
Sue Morphet Non-Executive DirectorSue Morphet was appointed to the Godfreys Group Limited Board on 13 January 2015. Sue has over 25 years of brand management and retail experience across Australia and New Zealand. Sue was previously CEO of Pacific Brands Limited from December 2007 to September 2012, having worked in that organisation for 17 years, most notably as Group General Manager of Bonds. She has also held senior sales and marketing roles at Sheridan and Herbert Adams. Sue was Chairman of Manufacturing Australia (2013-2015). Sue is currently a non-executive Director of Asaleo Care Limited, Fisher & Paykel Appliances Holdings Limited and Noni B Limited.
A member of the Remuneration and Nomination Committee.
Other listed entity directorships: Noni B Limited.
DIRECTORS’ REPORT
33%online sales growth
Hoover Handivac
Godfreys Group Limited 2015 Annual Report 1918
For
per
sona
l use
onl
y

Non-IFRS measuresThe Group uses certain measures to manage and report on its business that are not recognised under Australian Accounting Standards. These measures are collectively referred to as “non-IFRS financial measures”. Non-IFRS measures are intended to supplement the measures calculated in accordance with Australian Accounting Standards and are not a substitute for those measures.
Because non-IFRS financial measures are not defined by the AASB, they do not have a prescribed meaning and the way that the Group calculates them may be different to the way that other companies calculate similarly titled measures. The principal non-IFRS financial measures that are referred to in this document are as follows:
EBITDA is earnings before interest, tax, depreciation and amortisation expenses. Because it eliminates the non-cash charges for depreciation and amortisation, EBITDA is useful to help understand the operating cash generation potential of the business. However, it should not be considered as an alternative to cash flow from operations because it does not reflect actual cash movements, movements in working capital balances or investment in capital expenditure.
Management uses EBITDA to evaluate the operating performance of the business without the non-cash impact of depreciation and amortisation and before interest and tax charges which are impacted by the capital structure and historical tax position of the Group.
EBIT is earnings before interest and tax. EBIT eliminates the impact of the Group’ capital structure and historical tax position when assessing profitability, thus making it easier to perform comparable companies’ analysis with respect to profitability.
These non-IFRS financial measures have not been subject to review or audit.
Reconciliation of underlying Pro Forma results to statutory resultsThe underlying Pro Forma results represent the statutory profit adjusted for items that are material items of revenue or expense that are unrelated to the underlying performance of the business (‘significant items’) and adjustments to reflect a full year impact of transactions occurring during the year (‘Pro Forma adjustments’). Godfreys Group Limited believes that presenting underlying profit provides a better understanding of its financial performance by facilitating a more representative comparison of financial performance between financial periods.
The underlying results are presented with reference to the Australian Securities and Investment Commission Regulatory Guide 230 “Disclosing non-IFRS financial information”.
The underlying results exclude the significant items shown in the table on page 22. These adjustments were predominantly driven by the listing of the Company on the ASX.
DIRECTORS’ REPORT CONT.
Company secretarySophie Karzis was appointed Company Secretary of Godfreys Group Limited on 2 February 2015. Sophie Karzis is a practising lawyer with over 15 years’ experience as a corporate and commercial lawyer, and company secretary and general counsel for a number of private and public companies.
Principal activitiesThe Group’s principal activities are that speciality retailer and wholesaler of domestic and commercial floor care and associated cleaning products in Australia and New Zealand, where sales were made through Group owned stores, franchise outlets and other large retailers.
Operating and financial reviewAnalysis of resultsStatutory consolidated profit after tax attributable to the owners of the Company (‘Statutory Profit’) for the year ended 26 June 2015 is $12.0 million.
The Groups’ performance is presented below on an underlying Pro Forma basis (‘Pro Forma’), reflecting the ongoing consolidated operations for the year ended 26 June 2015 (‘FY2015’) and the comparative year ended 27 June 2014 (‘FY2014’).
Pro Forma Pro Forma FY 2015 FY2014 $’000 (i) $’000 (i)
Sales 182,632 173,547
Earnings before Interest, Tax, Depreciation and Amortisation (EBITDA) 22,485 19,863
Earnings before Interest and Tax (EBIT) 18,820 16,386
(i) Refer to the section ‘Reconciliation of statutory results to underlying results’ for the reconciliation of statutory to Pro Forma results.
Sales for the year of $182.6 million were up 5.2% on FY2014. The focus on the new stores rollout and store buyback program was key drivers in revenue growth.
Year ended Year ended Earnings per share (‘EPS’) 26 June 2015 27 June 2014
Basic earnings per share (cents per share) 34.70 20.46
Diluted earnings per share (cents per share) 33.84 19.86
Basic and diluted earnings per share are calculated as set out in Note 5 to the financial statements. The basic earnings per share for the comparative period before the acquisition date presented in the consolidated financial statements has been calculated using the Group’s historical weighted average number of shares.
Godfreys Group Limited 2015 Annual Report 2120
For
per
sona
l use
onl
y

1. IPO costs recognised as an expense.2. Bonus and share option expense to Key Management Personnel for the IPO retention bonus amounts.3. Impact of the change in accounting policy to apply hedge accounting from 28 June 2014.4. Freight, temporary labour and storage costs of $0.4 million relate to the relocation of Melbourne
warehouse. $0.1 million relates to group re-organisation post IPO.5. Refinancing charge and write-off of borrowing costs in connection with the repayment of fixed-interest
borrowings following the IPO.6. Tax benefit recognised on formation of an Australian tax consolidation group upon IPO that is assessed
as recoverable in accordance with AASB 112 ‘Income Taxes’ for inventory valuation and tax impact of entries for above notes 1–5.
7. Additional public company cost added to the actual costs incurred in FY2015 to reflect the impact of a full year’s cost.
8. Additional incremental executive remuneration added to the actual costs incurred in FY2015 to reflect the impact of a full year’s cost.
9. Cumulative unpaid withholding tax portion that had been withheld on interest repayments relating to loans from overseas lenders.
10. Adjustment to the actual interest cost for the year to reflect the post IPO debt profile which results in a reduced interest cost compared to the historical position.
11. Tax adjustment to the above Pro Forma adjustments which includes public company cost, incremental executive remuneration, and changes in interest costs.
The following review of performance focuses on underlying statutory EBITDA (‘Underlying EBITDA’) defined as EBITDA before significant items and underlying statutory EBIT (‘Underlying EBIT’) defined as EBIT before significant items.
Financial performance highlights
Year ended Year ended 26 June 2015 27 June 2014Underlying results $’000 $’000
Total sales 182,632 173,547
Operating gross profit 98,817 90,817
Other income 4,774 4,859
Cost of doing business (‘CODB’) (80,743) (73,571)
Underlying EBITDA(i) 22,848 22,105
Depreciation and amortisation (3,665) (3,477)
Underlying EBIT(i) 19,183 18,628
(i) Refer to the section ‘Reconciliation of statutory results to underlying results’ for the reconciliation of statutory to Pro Forma results.
Underlying EBITDA for the year ended 26 June 2015 was $22.8 million compared with $22.1 million for the prior corresponding period.
DIRECTORS’ REPORT CONT.
Reconciliation of statutory results to underlying results for FY2015 and FY2014.
Sales EBITDA EBIT NPATFinancial 2015 2014 2015 2014 2015 2014 2015 2014 year ended Note $’000 $’000 $’000 $’000 $’000 $’000 $’000 $’000
Statutory results 182,632 173,547 16,824 19,243 13,159 15,766 12,044 5,729
Adjusted for non- recurring related items and changes in accounting policy:
– IPO costs 1 – – 3,426 – 3,426 – 3,426 –
– IPO retention bonuses paid to management 2 – – 2,482 – 2,482 – 2,482 –
– Impact of the first time adoption of hedge accounting policy 3 – – (427) 2,862 (427) 2,862 (427) 2,862
– Business restructure 4 – – 543 – 543 – 543 –
– Refinancing charge & write off borrowing costs on repayment of borrowings via IPO proceeds 5 – – – – – – 1,020 –
– Tax consolidation adjustment 6 – – – – – – (7,598) –
Underlying statutory results 182,632 173,547 22,848 22,105 19,183 18,628 11,490 8,591
Adjusted for non- recurring related items and changes in accounting policy:
– Adjustment to apply annualised public company costs to actual expense incurred in FY2015 7 – – (283) (1,200) (283) (1,200) (283) (1,200)
– Adjustment to apply annualised incremental executive remuneration to actual expense incurred in FY2015 8 – – (80) (1,042) (80) (1,042) (80) (1,042)
– Withholding tax on ICSG borrowings 9 – – – – – – – 681
– Change in interest costs 10 – – – – – – 2,356 6,220
– Tax impact of Pro Forma adjustments 11 – – – – – – (598) (2,403)
Pro Forma underlying results 182,632 173,547 22,485 19,863 18,820 16,386 12,885 10,847
Godfreys Group Limited 2015 Annual Report 2322
For
per
sona
l use
onl
y

Financial position highlightsProperty, plant and equipment of $14.5 million (FY2014: $11.4 million) reflects $3.1 million of additions following the rollout of 12 new retail stores during the year and an investment spend on the new warehouse in Altona, Victoria.
The Group repaid $60.4 million of bank debt and shareholder loan using the proceeds from the IPO and a new bank facility of $20 million. In addition, as at 26 June 2015 the Group has access to an undrawn working capital facility of $10.5 million.
The Group has access to $44.0 million (FY2014: $38.4 million) of cash and assets readily convertible to cash as at 26 June 2015, made up of:
Cash balance of $13.8 million (FY2014: $7.4 million). Inventory of $25.0 million (FY2014: $25.2 million). Trade and other receivables of $5.2 million (FY 2014: $5.8 million).
OutlookThe Board believes the Company is well placed to deliver further strong growth in 2016, resulting from the following key growth drivers:
Sales are expected to benefit from: – the growth of LFL sales on the existing
store network; – the full year impact of the net 6 stores which
were opened in 2015, and 8 conversion of franchise stores to Company-owned;
– plans to open new stores; – buyback franchise stores; – continued growth with the online sales
platform. New and growing ranges including the air purifier, backpack, and upright.
Obtaining and growing licensed brands. The introduction of Pay and Collect in November 2015. This new development “Click and Collect” offer will enable customers to pay online and collect, at their convenience, from any Godfreys store.
Using available free cash to acquire and integrate complementary businesses and strategic acquisitions, subject to strict evaluation criteria.
New bank funding facility, which will provide lower borrowing costs.
The Statutory and Underlying EBITDA and Underlying EBIT by segment is presented in the following table:
EBITDA / EBIT EBITDA / EBIT (Statutory) (Underlying) Year ended Year ended Year ended Year ended 26 June 2015 27 June 2014 26 June 2015 27 June 2014 $’000 $’000 $’000 $’000
Australia 14,877 15,977 20,901 18,839
New Zealand 1,995 3,313 1,995 3,313
Unallocated (48) (47) (48) (47)
EBITDA 16,824 19,243 22,848 22,105
Depreciation and amortisation (3,665) (3,477) (3,665) (3,477)
EBIT 13,159 15,766 19,183 18,628
Net finance costsNet finance costs of $4.1 million were incurred in FY2015. This represents a decrease of $3.8 million on the prior year due to the change in debt structure following the IPO.
Year ended Year ended 26 June 2015 27 June 2014Income tax expense $’000 $’000
Statutory income tax benefit/ (expense) 2,973 (2,136)
Income tax benefit from significant items (7,598) –
Underlying tax expense (4,625) (2,136)
Statutory effective tax rate (32.8%) 27.2%
Underlying effective tax rate 28.7% 27.2%
The statutory effective tax rate for FY2015 of (32.8%) differs to the statutory corporate tax rate of 30% due to significant items. Excluding these items the underlying effective tax rate for FY2015 would be 28.7%.
DIRECTORS’ REPORT CONT.
Material business risksThe Group’s performance is sensitive to changes in economic and retail conditions in Australia, and the cyclical patterns of consumer spending. There are a number of factors, both internal and external, which may impact the Company in future periods. Macro-economic factors such as inflation rates, interest rates, government policies, consumer spending levels and exchange rates may all influence the operating and financial performance of Godfreys. Consideration of the specific material business risks facing the Company as follow:
Retail environment and discretionary consumer spendingGodfreys’ financial performance is sensitive to the current state of, and future changes in retail environment in Australia and New Zealand and the cyclical trends of consumer spending.
In addition, competition in the floorcare and associated cleaning products market is based on a variety of factors including product offering range, price, advertising, new stores, store location, store appearance, product presentation and customer service. Godfreys’ competitive position may be impacted by actions of the existing competitors, and the entry of new competitors.
The Directors believe that the Company is a well-established business model and a clear strategy which will ensure it remain highly competitive and appealing to consumers.
Exchange ratesGodfreys is exposed to the exchange rate movements, in particular movements in the A$/US$ rate, and A$/EUR rate. Given a large proportion of Godfreys payments for inventory is made in foreign currency, primarily US dollars and EUR, movement in exchange rates impact on the amounts paid for purchases. Godfreys mitigates against movements in exchange rates by hedging a significant proportion of its inventory purchases made in foreign currencies through forward exchange contracts.
Government and regulatory factorsGovernment or regulatory policies may change, which could have an impact on the economic environment, general market conditions or the retail industry. Depending on the nature of any such changes, it may adversely impact the operations or financial performance of Godfreys.
Godfreys Group Limited 2015 Annual Report 2524
For
per
sona
l use
onl
y

DIRECTORS’ REPORT CONT.
DividendThe Directors declared a final dividend of 12.8 cents per share, of which 3.8 cents is fully franked and 9.0 cents is unfranked.
The Directors also declared a special dividend of 2.6 cents per share in relation to the profit earned from IPO to 26 December 2014. The special dividend is unfranked.
Both of the dividends represent approximately 80% payout of the Company’s underlying Pro Forma net profit after tax post IPO. These dividends are to be paid on 9 October 2015. The record date is 25 September 2015.
The Board intends to maintain its dividend policy of paying out between 70% to 80% of the Company’s annual underlying net profit after tax. The Board believes the Company’s strong cash flows provide shareholders with a strong return while still allowing the Company to fund its plan for future growth.
Changes in state of affairsThere have been no significant changes in the state of affairs of the Group other than that referred to in the financial statements or notes thereto.
Subsequent eventsThere has not been any matter or circumstance occurring subsequent to the end of the financial year that has significantly affected, or may significantly affect the operations of the Group, the results of those operations, or the state of affairs of the Group in future financial years.
Future developmentsCertain likely developments in the operations of the Group and the expected results of those operations in financial years subsequent to the period ended 26 June 2015 are referred to in the preceding Operating and Financial Review. No additional information is included on the likely developments in the operations of the Group and the expected results of those operations as the directors reasonably believe that the disclosure of such information would likely result in unreasonable prejudice to the Group if included in this report and it has therefore been excluded in accordance with section 299(3) of the Corporations Act 2001.
Directors’ meetingsThe following table sets out the number of Directors’ meetings (including meetings of committees of directors) held during the financial period from registration of the Company on 10 December 2014 to 26 June 2015 and the number of meetings attended by each director (while they were a director or committee member).
Audit & Risk Remuneration and Management Board of directors Nomination committee committeeDirectors Held Attended Held Attended Held Attended
Rod Walker 7 7 2 2 1 1
Tom Krulis 7 7 – – – –
Jon Brett 7 7 – – 1 1
Brendan Fleiter 7 7 2 2 1 1
Sue Morphet 6 6 2 2 – –
Directors’ shareholdingsThe following table sets out each director’s relevant direct and indirect interest in shares and options over shares of the Company as at the date of this report:
Godfreys Group Limited Fully paid ordinary shares Share optionsDirectors Number Number
Rod Walker 36,364 –
Tom Krulis 3,080,000 141,818
Jon Brett 36,364 –
Brendan Fleiter 36,364 –
Sue Morphet 7,272 –
Remuneration of key management personnelInformation about the remuneration of key management personnel is set out in the Remuneration Report section of this directors’ report. The term ‘key management personnel’ refers to those persons having authority and responsibility for the overall planning, directing and controlling the activities of the Group, directly or indirectly, including any director (whether executive or otherwise) of the Group.
Details of unissued shares or interests under option at the date of this report are:
Exercise price Expiry date Number of shares under option Class of shares of option of options
312,266 Ordinary Nil 10 Dec 2015
312,266 Ordinary Nil 10 Oct 2016
300,362 Ordinary Nil 30 Jun 2017
Share options granted to directors and senior managementDuring and since the end of the financial year, an aggregate 924,894 share options were granted by the Group to the following Directors and officers as part of their remuneration:
Number of options granted and number Directors and of ordinary shares senior management under option
Tom Krulis 141,818
Bernie Bicknell 238,801
Barbara O’Brien 211,165
Simon Greig 121,945
Nigel Rostovsky 211,165
Environmental regulationsThe Group’s operations are not subject to any significant environmental obligations or regulations.
Indemnification of officers and auditorsDuring the financial period, the Group paid a premium in respect of a contract insuring the directors of the Group (as named above), the Company Secretary, and all executive officers of the Company and of any related body corporate against a liability incurred by such a director, secretary or executive officer to the extent permitted by the Corporations Act 2001. The contract of insurance prohibits disclosure of the nature of the liability and the amount of the premium.
The Group has not otherwise, during or since the end of the financial year, except to the extent permitted by law, indemnified or agreed to indemnify an officer or auditor of the Group or of any related body corporate against a liability incurred as such by an officer or auditor.
Non-audit servicesDetails of amounts paid or payable to the auditor for non-audit services provided during the year by the auditor are outlined in note 28 to the financial statements. The Directors are satisfied that the provision of non-audit services, during the year, by the auditor (or by another person or firm on the auditor’s behalf) is compatible with the general standard of independence for auditors imposed by the Corporations Act 2001.
The Directors are of the opinion that the services as disclosed in note 28 to the financial statements do not compromise the external auditor’s independence, based on advice received from the Audit & Risk Management Committee, for the following reasons:
all non-audit services have been reviewed and approved to ensure that they do not impact the integrity and objectivity of the auditor; and
none of the services undermine the general principles relating to auditor independence as set out in APES 110 ‘Code of Ethics for Professional Accountants’ issued by the Accounting Professional & Ethical Standards Board, including reviewing or auditing the auditor’s own work, acting in a management or decision-making capacity for the company, acting as advocate for the company or jointly sharing economic risks and rewards.
Auditor’s independence declarationThe auditor’s independence declaration is included at page 38.
Rounding off of amountsThe Company is a company of the kind referred to in ASIC Class Order 98/100, dated 10 July 1998, and in accordance with that Class Order amounts in the Directors’ report and the financial statements are rounded off to the nearest thousand dollars, unless otherwise indicated.
Godfreys Group Limited 2015 Annual Report 2726
For
per
sona
l use
onl
y

REMUNERATION REPORT
The fees paid to 3 Degrees Consulting for the remuneration advisory services amounted to $16,500. While no remuneration recommendations were made, the Remuneration and Nomination Committee is satisfied the advice received from 3 Degrees Consulting is free from undue influence from KMP to whom the advice related, as the consultants were engaged by, and reported directly to the Chairman.
A. Remuneration StrategyThe performance of the Group depends upon the quality of its directors and executives. To be successful, the Group must attract, motivate and retain highly skilled directors and executives. To this end, the Group adopts the following principles in its remuneration framework:
Provide competitive rewards to attract high calibre executives;
Link executive rewards to the performance of the Group and the creation of shareholder value;
Establish appropriate and demanding performance hurdles for variable executive remuneration;
Meet the Group’s commitment to a diverse and inclusive workplace;
Promote the Group as an employer of choice; and Comply with relevant legislation and corporate governance principles.
In accordance with best practice corporate governance, the structure of non-executive director and executive remuneration is separate and distinct. This structure is outlined below:
Non-executive directors Aggregate remuneration is determined from time to time by a general meeting in accordance with the Group’s Constitution and the ASX Listing Rules.
An amount, not exceeding the amount determined, is divided between the directors on a basis that is reviewed annually.
When undertaking the annual review process the Board will consider advice from external consultants as well as fees paid to non-executive directors of comparable companies.
Superannuation contributions are made by the Group on behalf of non-executive directors in line with statutory requirements and are included in the remuneration package amount allocated to individual directors.
Non-Executive Directors’ fees and payments are reviewed annually by the Board. Non-Executives Directors’ fees are determined within an aggregate limit (including superannuation contributions) set in accordance with the Company’s constitution. The non-executive aggregate remuneration is $0.6 million for the year ended 26 June 2015.
ExecutivesThe Board aims to reward executives with a level and mix of remuneration commensurate with their position and responsibilities within the Group. This involves:
Rewarding executives for Group, business unit and individual performance against targets set by reference to appropriate benchmarks;
Aligning the interest of executives with those of shareholders;
Linking reward with the strategic goals and performance of the Group; and
Ensuring total remuneration is competitive by market standards.
There are two main elements to executive remuneration:
Fixed remuneration; and Variable remuneration comprising the Short Term Incentive Plan (‘STIP’) and the Long Term Incentive Plan (‘LTIP’).
The Remuneration and Nomination Committee considers current market conventions when it establishes the proportion of fixed remuneration and variable remuneration elements. Fixed remuneration is reviewed annually by the Remuneration and Nomination Committee consisting of a review of Group, business and individual performance, relevant comparative remuneration in the market and internal and external advice on policies and practices where necessary.
Any Executive Director appointment to the Board is conditional on them being employed by the Group.
The Directors of Godfreys Group Limited (“the Group”) (“the Company”) present the Remuneration Report prepared in accordance with section 300A of the Corporations Act 2001 (Cth) for the Company and its controlled entities (the Group) for the year ended 26 June 2015. This Remuneration Report is audited by the Group’s external auditors, Deloitte Touche Tohmatsu.
This Remuneration Report forms part of the Directors’ Report.
Details of the Group’s remuneration strategy and arrangements for the 2015 financial year are set out in this Remuneration Report. During the year the Board reviewed the Group’s executive remuneration framework and established a Remuneration and Nomination Committee in anticipation of the initial public offering (‘IPO’) of the Company on 10 December 2014. The Board benchmarked the framework against industry best practice, analysed remuneration trends and considered proposed Government legislative changes. The Board met with its external advisor to discuss remuneration and governance issues and as a result the Board resolved to make a number of changes to provide greater alignment with the interests of shareholders.
This Remuneration Report is prepared in respect of the Key Management Personnel (KMP), being those persons who have authority and responsibility for planning, directing and controlling the activities of the Group.
The Board has determined that the KMP are the directors and executives of the Group. For the purposes of the Remuneration Report, the term
‘Executive’ is defined to mean the following:
Name Position
Mr Tom Krulis Managing Director and Chief Executive Officer
Mr Bernie Bicknell Chief Operating Officer and Chief Financial Officer
Ms Barbara O’Brien General Manager – New Product Development
Mr Simon Greig General Manager – Retail
Mr Nigel Rostovsky General Manager – Franchise
The CFO, COO and General Managers (GMs) report directly to the Managing Director/CEO, who reports to the Board. The Executives are responsible for the implementation of the Group’s vision, values, corporate strategies and risk management systems, as well as the day-to-day management of the business.
Presentation of informationThe IPO on 10 December 2014 triggered the requirement for the Group to present this Remuneration Report and therefore such information is presented herewith for the whole year 28 June 2014 to 26 June 2015. This includes information relating to International Cleaning Solutions Group Ltd (ICSG) for the period 28 June 2014 to 9 December 2014, as a corporate reorganisation was undertaken at the time of IPO whereby Godfreys Group Limited acquired ICSG. The Company was not a listed disclosing entity in the prior year and therefore information for the year ended 27 June 2014 has not been included.
Remuneration and Nomination CommitteeThe Remuneration and Nomination Committee is responsible for determining and reviewing compensation arrangements for directors and executives. The Remuneration and Nomination Committee assesses the appropriateness of the nature and amount of remuneration of directors and executives on a periodic basis by reference to relevant market conditions, as well as whether performance targets have been met, with the overall objective of ensuring maximum shareholder benefit from the retention of a high quality board and executives.
Use of Remuneration ConsultantsTo ensure the Remuneration and Nomination Committee is fully informed when making remuneration decisions, it seeks external remuneration advice. Remuneration consultants are engaged by, and report directly to, the committee. In selecting remuneration consultants, the committee considers potential conflicts of interest and requires independence from the Company’s key management personnel and other executives as part of their terms of engagement.
During the year, the Remuneration and Nomination Committee engaged 3 Degrees Consulting to provide recommendations regarding:
Insights on remuneration trends, regulatory developments and shareholder views;
Market, industry and role data in relation to key management personnel; and
Executive incentive schemes.
Godfreys Group Limited 2015 Annual Report 2928
For
per
sona
l use
onl
y

STIP Assessment Framework
Performance Gateway Scorecard percentage weighting of KPI components
Financial KPI Non-financial KPI
Quantitative KPI Qualitative KPI
Company KPI Individual KPI
Executive EBITDA Project success
CEO 75% 25%
COO / CFO 75% 25%
GMs 75% 25%
KPI Threshold (i) Target Maximum
EBITDA 96% of Budget 100% of Budget 110% of Budget
Project Success Effective Superior Outstanding
% TFR (ii) Threshold (i) Target Maximum
CEO 16% 40% 80%
COO / CFO 12% 30% 60%
GMs 8% 20% 40%
(i) Entitlements are activated only when the threshold on both KPIs are satisfied.(ii) STI vests on a pro rata, straight line basis for performance between Threshold and Maximum.
REMUNERATION REPORT CONT.
B. Executive RemunerationFixed RemunerationFixed remuneration consists of the base salary plus any superannuation contributions paid to a complying super fund on the Executive’s behalf, and the cost (including any component for fringe benefits tax) for other items such as novated vehicle lease payments.
Variable Remuneration (linking performance to remuneration)Variable remuneration in the form of a STIP and a LTIP are linked to performance to retain high calibre executives by motivating them to achieve performance goals which are aligned to the Group’s interest.
Executive Short Term Incentive Program (‘STIP’)
2015 Financial year STIPThe objective of the STIP is to link executive remuneration to the achievement of the Group’s annual operational and financial targets. For the 2015 financial year the STIP was 100% based on the achievement of the Pro Forma Forecast earnings before interest, taxes, depreciation and amortisation (Forecast Pro Forma EBITDA) as presented in the Prospectus on IPO. Achievement of this target is measured by the actual underlying Pro Forma EBITDA result for the year.
STIP entitlements are expressed as a percentage of a participant’s total fixed remuneration and are based on a scale of predetermined and approved targets. STIP entitlements are activated only when minimum performance targets are satisfied.
The entitlement under the scheme for each KMP is based on the hurdles set in the table below:
Pro Forma EBITDA CEO COO / CFO GMs
$22.1 million 20% 15% 10%
$22.7 million 22% 17% 11%
$23.2 million 24% 18% 12%
$23.7 million 26% 20% 13%
$24.2 million 28% 21% 14%
$24.7 million 32% 24% 16%
$25.2 million 40% 30% 20%
$25.7 million 48% 36% 24%
$26.2 million 56% 42% 28%
$26.7 million 64% 48% 32%
$27.2 million 80% 60% 40%
This year, the Group’s underlying Pro Forma EBITDA exceeded the minimum forecast Pro Forma EBITDA and STIP entitlements were achieved. Details of STIP entitlements at the end of the 2015 financial year are disclosed in the Remuneration Table on pages 34 and 35.
Scheme structure going forward – 2016A revised STIP was implemented on 26 June 2015 as recommended by the Nomination and Remuneration Committee and approved by the Board on 26 June 2015. The new STIP adopts the STIP assessment framework (‘STIP Assessment Framework’) detailed below to assess the Executives STIP award. The key changes from the current STIP are that:
The STIP Assessment Framework requires two performance gateways to be met: (i) the achievement of the Group’s Pro Forma EBITDA level for the 2016 financial year and (ii) the individual Executive ‘meeting expectations’ as assessed through the Group’s performance
management system, before the Executive is assessed against the Core Business KPIs and Business Health KPI targets; and
The STIP entitlements as a percentage of TFR have been revised to those shown in the tables on page 31.
Achievement of Group EBITDA target
Individual Executive ‘meeting expectations’
Godfreys Group Limited 2015 Annual Report 3130
For
per
sona
l use
onl
y

REMUNERATION REPORT CONT.
Board policy with regards to Executives limiting their exposure to risk in relation to equity optionsThe Group’s Securities Trading Policy prohibits Executives from altering the economic benefit or risk derived by the Executives in relation to their unvested Performance Options.
Employment ArrangementsChief Executive Officer and Managing Director
Mr Tom Krulis is the ‘Chief Executive Officer and Managing Director’ of the Company.
Mr Krulis is employed under a standard employment contract with no defined length of tenure. Under the terms of his employment contract:
Mr Krulis may resign from his position by providing the Group with twelve months written notice
The Group may terminate this agreement by providing twelve months written notice or provide payment in lieu of the notice period, or the unexpired part of any notice period, based on Mr Krulis’ total remuneration
The Group may terminate Mr Krulis’ employment at any time without notice if serious misconduct has occurred
Mr Krulis is a participant in the STIP and the LTIP.
ExecutivesAll other Executives are employed on standard employment contracts. The terms of employment are:
The Executive may resign from their position by providing the Group with six months written notice depending on their specific contract;
The Group may terminate the employment of the executive by providing six months written notice or payment in lieu of the notice period, based on the fixed component of the Executive’s remuneration;
The Group may terminate at any time without notice if serious misconduct has occurred
Participation in the STIP and the LTIP.
Group PerformanceThe relation of rewards to performance of directors and Executives is discussed above. The Group’s profit before tax and EPS for the last two financial years is presented in the table below:
Year Year ended ended 26 June 27 June 2015 2014 $’000 $’000
Revenue 182,632 173,547
EBITDA 16,824 19,243
Net profit before tax 9,071 7,865
Net profit after tax 12,044 5,729
Share price at end of year (i) 3.03 –
Basic earnings per share (ii) 34.70 20.46
Diluted earnings per share (ii) 33.84 19.86
(i) As the Company was listed on the Australian Securities Exchange during the current year, no comparative share price is shown for 27 June 2014.
(ii) Refer to the basis of underlying earnings per share in the Operating and Financial Review section entitled ‘Earnings per share’.
Executive Long Term Incentive Scheme (‘LTIP’)The objective of the LTIP is to reward Executives through aligning this element of remuneration with accretion in long term shareholder wealth. It aims to also support the retention of Executives through the issuance of unlisted options over ordinary shares in the Group at an exercise price equal to the then market value of the shares (‘Performance Options’).
The LTIP was approved by the Board and implemented on 10 December 2014. Effective 31 December 2014 the LTIP will operate as set out below.
Awards under the LTIP scheme are issued annually based on a 3 year performance period (‘Performance Period’), and subject to satisfaction of:
Relative Total Shareholder Return (‘TSR’), and Continued Service with the Godfreys Group for duration of the Performance Period.
Participants must be employed on the last day of the Performance Period for an entitlement to vest. All entitlements are forfeited should a participant resign from their position prior to the end of the Performance Period.
Total shareholder return (‘TSR’)LTIP awards are based on a TSR performance hurdle relative to the S&P/ASX 200 Consumer Discretionary Index over the 3-year performance period (‘TSR Options’). TSR is used as the sole LTI measures by around 50% of ASX100-200 companies, and is the measure most strongly supported by shareholders and proxy advisors. The use of TSR will provide strong alignment between LTI Plan participants and shareholders, generally seen as a key objective of LTI Plans. At the end of each Performance Period, the growth in Godfreys’ TSR over the Performance Period will be compared with the growth in TSR over the same period of the comparator group of entities and Godfreys relative ranking will be determined. The comparator group companies listed Australian retail companies within the ASX200 selected by the Board. This comparator group will be reviewed annually by the Company’s Board.
Unless the Board determines otherwise, the share prices used to calculate the TSR of a company for a Performance Period will be measured as follows:
The opening share price will be the volume weighted average price on the ASX in respect of the Company for the 10 trading days ending on the first day of the Performance Period; and
The closing share price will be the volume weighted average price on the ASX in respect of the company for the 10 trading days ending on the last day of the Performance Period.
The TSR performance targets and corresponding percentage of the maximum number of TSR Options that would vest under the LTIP are as follows:
Group’s TSR percentile ranking relative to S&P/ASX 200 Consumer Discretionary Index Percentage of over performance period TSR Options vesting
Below median of comparator group Nil
Median of comparator group 50%
Between the median Pro rata straight line and 75th percentile between 50% and 100%
75th percentile or above 100%
One-off Retention BonusFollowing IPO Listing (‘Listing’) on 10 December 2014, Bernie Bicknell, Barbara O’Brien, Simon Greig and Nigel Rostovsky are entitled to a one-off retention bonus valued at $3,434,909 in aggregate.
One half of that retention bonus was paid as a cash payment by the Group shortly after Listing (being an amount aggregate of $1,717,455, and the balance is issued in performance rights of equivalent value under the LTIP (being 624,532 performance rights).
Performance rights issued as part of the one-off retention bonus will vest in two tranches, with one tranche vesting on the first anniversary of the Listing and the second tranche vesting on the date of disclosure to ASX by the Group of its consolidated audited financial reports for the financial year ending 24 June 2016, in each case provided that the relevant executive has remained on continuous employment with the Group from the date of the grant until the date of vesting. These performance rights are not subject to any other vesting conditions.
The above entitlements under the LTIP at the end of the 2015 financial year are disclosed in the Remuneration Table.
Godfreys Group Limited 2015 Annual Report 3332
For
per
sona
l use
onl
y

REMUNERATION REPORT CONT.
Post- Long-term employment employee Share-based Short-term employee benefits benefits benefits payments
Remuneration of key management personnelThe Remuneration Table below displays remuneration as determined in accordance with Australian Accounting Standards and the Corporations Act.
The information disclosed below presents the information relating to Godfreys Group Ltd for the current year and includes the remuneration information of ICSG for the period 28 June 2014 to 9 October 2014, as described in the section of Remuneration Report entitled ‘Presentation of information’.
Salary STIP Cash Other Super- Long Performance % as and fees Bonus element (7) annuation service leave Options Total related options 2015 Note $ $ $ $ $ $ $ (%) (%)
Non-Executive Directors
Rod Walker (1) (3) 158,593 – 18,190 11,266 – – 188,049 – –
Brendan Fleiter (1) 75,000 – – 7,125 – – 82,125 – –
Jon Brett (1) 55,417 – 2,553 5,265 – – 63,235 – –
Sue Morphet (2) 63,750 – – 6,056 – – 69,806 – –
Senior Management
Tom Krulis (1) (3) 625,822 130,000 – 18,783 3,890 42,007 820,502 16 5
Bernie Bicknell (3) (4) 413,102 552,701 – 18,783 17,766 235,983 1,238,335 45 19
Simon Greig (3) (5) 280,729 275,351 – 18,783 5,413 118,744 699,020 39 17
Nigel Rostovsky (3) (4) (6) 321,250 568,701 17,732 11,255 605 227,797 1,147,340 50 20
Barbara O’Brien (3) (4) (6) 266,668 520,701 20,741 14,088 629 229,045 1,051,872 50 22
Total Remuneration 2,260,331 2,047,454 59,216 111,404 28,303 853,576 5,360,284
(1) Appointed to Godfreys Group Limited on 6 November 2014.(2) Appointed to Godfreys Group Limited on 13 January 2015.(3) Remuneration includes period 28 June 2014 to 9 October 2014 under ICSG as described in ‘Presentation of Information’.(4) Cash bonus includes a one-off payment relate to IPO bonus of $490,701.(5) Cash bonus includes a one-off payment relate to IPO bonus of $245,351.(6) These senior managers were receiving a consulting fee for their services pre IPO. Annual base salary is $300,000
per annum.(7) Incidental expenses reimbursed.
Godfreys Group Limited 2015 Annual Report 3534
For
per
sona
l use
onl
y

REMUNERATION REPORT CONT.
Key management personnel equity holdingsFully paid ordinary shares of Godfreys Group Limited
KMP Balance at Net other Balance at 27 June 2014 change 26 June 2015Name Note No. No. No.
Non-Executive Directors
Rod Walker – 36,364 36,364
Brendan Fleiter – 36,364 36,364
Jon Brett – 36,364 36,364
Sue Morphet – 7,272 7,272
Senior Management
Tom Krulis (i) – 3,080,000 3,080,000
Bernie Bicknell (i) – – –
Barbara O’Brien (i) – 545,000 545,000
Simon Greig (i) – 280,000 280,000
Nigel Rostovsky (i) – – –
(i) Acquired as part of the corporate reorganisation at the time of the IPO where by existing shareholdings in International Cleaning Solutions Group Pty Ltd were transferred to shares held in Godfreys Group Limited.
Share options of Godfreys Group Limited
KMP Granted as one- Granted off retention Balance at as LTIP bonus 26 June 2015Name No. No. No.
Tom Krulis 141,818 – 141,818
Bernie Bicknell 60,363 178,438 238,801
Barbara O’Brien 32,727 178,438 211,165
Simon Greig 32,727 89,218 121,945
Nigel Rostovsky 32,727 178,438 211,165
All share options issued to key management personnel were made in accordance with the provisions of the LTIP.
During the period, no options have vested or were exercised by key management personnel.
C. Other key management personnel transactionsEntities related to Tom Krulis’ family have interests in some of the stores that the Group is leasing (less than 14 stores). All lease agreements have been entered into on arm’s length terms.
This directors’ report is signed in accordance with a resolution of directors made pursuant to s.298(2) of the Corporations Act 2001.
On behalf of the Directors
Mr Rod WalkerChairmanMelbourne, 20 August 2015
Godfreys Group Limited 2015 Annual Report 3736
For
per
sona
l use
onl
y

The Board of DirectorsGodfreys Group LimitedBuilding 2, Level 1530 Springvale RoadGlen Waverley VIC 3150
Dear Board Members
Godfreys Group Limited
In accordance with section 307C of the Corporations Act 2001, I am pleased to provide the following declaration of independence to the directors of Godfreys Group Limited.
As lead audit partner for the audit of the financial statements of Godfreys Group Limited for the financial year ended 26 June 2015, I declare that to the best of my knowledge and belief, there have been no contraventions of:
(i) the auditor independence requirements of the Corporations Act 2001 in relation to the audit; and
(ii) any applicable code of professional conduct in relation to the audit.
Yours sincerely
DELOITTE TOUCHE TOHMATSU
Ryan HansenPartnerChartered Accountants
Liability limited by a scheme approved under Professional Standards Legislation.
Member of Deloitte Touche Tohmatsu Limited
INDEPENDENT AUDITOR’S REPORT TO THE MEMBERS OF GODFREYS GROUP LIMITED
AUDITOR’S INDEPENDENCE DECLARATION TO THE MEMBERS OF GODFREYS GROUP LIMITED
Deloitte Touche Tohmatsu ABN 74 490 121 060
550 Bourke Street Melbourne VIC 3000 GPO Box 78 Melbourne VIC 3001 Australia
Tel: +61 (0) 3 9671 7000 Fax: +61 (0) 3 9671 7001
www.deloitte.com.au
Deloitte Touche Tohmatsu ABN 74 490 121 060
550 Bourke Street Melbourne VIC 3000 GPO Box 78 Melbourne VIC 3001 Australia
Tel: +61 (0) 3 9671 7000 Fax: +61 (0) 3 9671 7001
www.deloitte.com.au
Report on the Financial ReportWe have audited the accompanying financial report of Godfreys Group Limited, which comprises the statement of financial position as at 26 June 2015, and the statement of profit or loss and other comprehensive income, statement of cash flows and statement of changes in equity for the year ended on that date, a summary of significant accounting policies, other explanatory notes and the directors’ declaration of the consolidated entity comprising the company and the entities it controlled at the year’s end or from time to time during the financial year as set out on pages 43 to 88.
Directors’ Responsibility for the Financial ReportThe directors of the company are responsible for the preparation of the financial report that gives a true and fair view in accordance with Australian Accounting Standards and the Corporations Act 2001 and for such internal control as the directors determine is necessary to enable the preparation of the financial report that gives a true and fair view and is free from material misstatement, whether due to fraud or error. In Note 1, the directors also state, in accordance with Accounting Standard AASB 101 Presentation of Financial Statements, that the consolidated financial statements comply with International Financial Reporting Standards.
Auditor’s ResponsibilityOur responsibility is to express an opinion on the financial report based on our audit. We conducted our audit in accordance with Australian Auditing Standards. Those standards require that we comply with relevant ethical requirements relating to audit engagements and plan and perform the audit to obtain reasonable assurance whether the financial report is free from material misstatement.
An audit involves performing procedures to obtain audit evidence about the amounts and disclosures in the financial report. The procedures selected depend on the auditor’s judgement, including the assessment of the risks of material misstatement of the financial report, whether due to fraud or error. In making those risk assessments, the auditor considers internal control relevant to the entity’s preparation and fair presentation of the financial report in order to design audit procedures that are appropriate in the circumstances, but not for the purpose of expressing an opinion on the effectiveness of the entity’s internal control. An audit also includes evaluating the appropriateness of accounting policies used and the reasonableness of accounting estimates made by the directors, as well as evaluating the overall presentation of the financial report.
We believe that the audit evidence we have obtained is sufficient and appropriate to provide a basis for our audit opinion.
Godfreys Group Limited 2015 Annual Report 3938
For
per
sona
l use
onl
y

INDEPENDENT AUDITOR’S REPORT CONT.
The Directors declare that:
(a) in the Directors’ opinion, there are reasonable grounds to believe that the Company will be able to pay its debts as and when they become due and payable;
(b) in the Directors’ opinion, the attached financial statements are in compliance with International Financial Reporting Standards, as stated in note 1 to the financial statements;
(c) in the Directors’ opinion, the attached financial statements and notes thereto are in accordance with the Corporations Act 2001, including compliance with accounting standards and giving a true and fair view of the financial position and performance of the consolidated entity; and
(d) the Directors have been given the declarations required by s.295A of the Corporations Act 2001.
At the date of this declaration, the Company is within the class of companies affected by ASIC Class Order 98/1418. The nature of the deed of cross guarantee is such that each company which is party to the deed guarantees to each creditor payment in full of any debt in accordance with the deed of cross guarantee.
In the Directors’ opinion, there are reasonable grounds to believe that the Company and the companies to which the ASIC Class Order applies, as detailed in note 19 to the financial statements will, as a group, be able to meet any obligations or liabilities to which they are, or may become, subject by virtue of the deed of cross guarantee.
Signed in accordance with a resolution of the Directors made pursuant to s.295(5) of the Corporations Act 2001.
On behalf of the Directors
Mr Rod WalkerChairmanMelbourne, 20 August 2015
DIRECTORS’ DECLARATION
Auditor’s Independence DeclarationIn conducting our audit, we have complied with the independence requirements of the Corporations Act 2001. We confirm that the independence declaration required by the Corporations Act 2001, which has been given to the directors of Godfreys Group Limited, would be in the same terms if given to the directors as at the time of this auditor’s report.
Auditor’s OpinionIn our opinion:
(a) the financial report of Godfreys Group Limited is in accordance with the Corporations Act 2001, including:
(i) giving a true and fair view of the consolidated entity’s financial position as at 26 June 2015 and of their performance for the year ended on that date; and
(ii) complying with Australian Accounting Standards (including the Australian Accounting Interpretations) and the Corporations Regulations 2001; and
(b) the consolidated financial statements also comply with International Financial Reporting Standards as disclosed in Note 1.
Report on the Remuneration ReportWe have audited the Remuneration Report included in pages 28 to 37 of the Directors’ Report for the year ended 26 June 2015. The directors of the company are responsible for the preparation and presentation of the Remuneration Report in accordance with section 300A of the Corporations Act 2001. Our responsibility is to express an opinion on the Remuneration Report, based on our audit conducted in accordance with Australian Auditing Standards.
Auditor’s OpinionIn our opinion the Remuneration Report of Godfreys Group Limited for the year ended 26 June 2015, complies with section 300A of the Corporations Act 2001.
DELOITTE TOUCHE TOHMATSU
Ryan HansenPartnerChartered AccountantsMelbourne 20 August 2015
Liability limited by a scheme approved under Professional Standards Legislation.
Member of Deloitte Touche Tohmatsu Limited
Godfreys Group Limited 2015 Annual Report 4140
For
per
sona
l use
onl
y

Consolidated statement of profit or loss and other comprehensive income 43
Consolidated statement of financial position 44
Consolidated statement of changes in equity 45
Consolidated statement of cash flows 46
Notes to the financial statements 47
INDEX TO THE CONSOLIDATED FINANCIAL STATEMENTS
CONSOLIDATED STATEMENT OF PROFIT OR LOSS AND OTHER COMPREHENSIVE INCOME
Year ended Year ended 26 June 2015 27 June 2014 Note $’000 $’000
Sales 2 182,632 173,547
Cost of sales (83,815) (82,731)
Operating gross profit 98,817 90,817
Other income 2 4,774 4,859
Employee benefit expenses 2 (37,897) (35,129)
Distribution expense (14,010) (13,129)
Selling and marketing expenses (5,349) (5,615)
Occupancy expenses 2 (16,980) (15,700)
Other expenses (10,287) (10,337)
IPO transaction costs 2 (5,909) –
Net finance costs 2 (4,088) (7,901)
Profit before income tax expense 9,071 7,865
Income tax benefit / (expense) 4 2,973 (2,136)
Profit after income tax attributable to equity holders of the parent entity 12,044 5,729
Other comprehensive income, net of income tax:
Items that may be reclassified subsequently to profit or loss:
Exchange differences on translating foreign operations (91) 171
Changes on the fair value of cash flow hedges, net of income tax 165 –
Other comprehensive income / (loss) for the year, net of income tax 74 171
Total comprehensive income for the year 12,118 5,900
Earnings per share
Basic (cents per share) 5 34.70 20.46
Diluted (cents per share) 5 33.84 19.86
Godfreys Group Limited 2015 Annual Report 4342
For
per
sona
l use
onl
y

CONSOLIDATED STATEMENT OF FINANCIAL POSITION
CONSOLIDATED STATEMENT OF CHANGES IN EQUITY
Capital Cash Foreign recon- Share flow currency Share struction option hedge translation Retained capital reserve reserve reserve reserve earnings Total $’000 $’000 $’000 $’000 $’000 $’000 $’000
Balance as at 28 June 2013 28,000 – 840 – (890) 21,576 49,526
Profit for the year – – – – – 5,729 5,729
Other comprehensive income for the period – – – – 171 – 171
Balance at 27 June 2014 28,000 – 840 – (719) 27,305 55,426
Balance as at 27 June 2014 28,000 – 840 – (719) 27,305 55,426
Adjustments (notes 16, 17) 81,526 (43,613) (840) – – – 37,073
Balance as at 27 June 2014 109,526 (43,613) – – (719) 27,305 92,499
Profit for the year – – – – – 12,044 12,044
Other comprehensive income for the period – – – – (91) – (91)
Share based payments – – 854 – – – 854
Changes on the fair value of cash flow hedges, net of income tax – – – 165 – – 165
Balance at 26 June 2015 109,526 (43,613) 854 165 (810) 39,349 105,471
Year ended Year ended 26 June 2015 27 June 2014 Note $’000 $’000
Assets
Current assets
Cash and cash equivalents 13,823 7,443
Trade and other receivables 6 4,695 5,255
Other financial assets 7 534 –
Inventories 8 24,997 25,173
Total current assets 44,049 37,871
Non-current assets
Other receivables 490 534
Property, plant and equipment 9 14,506 11,387
Deferred tax assets 4 6,938 2,739
Intangible assets 10 91,861 89,835
Total non-current assets 113,795 104,495
Total assets 157,844 142,366
Liabilities
Current liabilities
Trade and other payables 11 19,529 15,180
Interest-bearing loans and borrowings 12 – 5,987
Other financial liabilities 13 121 1,264
Current tax liabilities 4 233 626
Employee benefits 14 3,418 3,222
Provisions 15 3,053 2,955
Total current liabilities 26,354 29,234
Non-current liabilities
Interest-bearing loans and borrowings 12 20,000 54,410
Employee benefits 14 719 596
Provisions 15 5,300 2,700
Total non-current liabilities 26,019 57,706
Total liabilities 52,373 86,940
Net assets 105,471 55,426
Equity
Share capital 16 109,526 28,000
Reserves 17 (43,404) 121
Retained earnings 39,349 27,305
Total equity 105,471 55,426
Godfreys Group Limited 2015 Annual Report 4544
For
per
sona
l use
onl
y

Note 1Significant accounting policies
The Godfreys Group Limited (the ‘Company’) is a company limited by shares incorporated in Australia whose shares are publicly traded on the Australian Securities Exchange (‘ASX’).
The consolidated financial statements comprise the Company and its controlled entities (the ‘Group’).
Statement of complianceThese financial statements are general purpose financial statements which have been prepared in accordance with the Corporations Act 2001, Accounting Standard, and comply with other requirements of the law. For the purposes of preparing the consolidated financial statements, the Company is a for-profit entity. Accounting Standards include Australian Accounting Standards. Compliance with Australian Accounting Standards ensures that the financial statements and notes of the Company and the Group comply with International Financial Reporting Standards (‘IFRS’).
Adoption of AASB 1 ‘First time adoption of Australian Accounting Standards’As a non-reporting entity the Group has historically prepared ‘special purpose financial statements’ for the purposes of satisfying the Directors reporting requirements under Corporations Act 2001. As a disclosing entity the Group is now required to prepare an IFRS compliant ‘general purpose financial statements’ for the first time for the year ended 26 June 2015. In accordance with AASB 1 ‘First time adoption of Australian Accounting Standards’ the Group has adopted all relevant IFRS standards with effect from the beginning of the comparative period, 28 June 2014. The adoption of AASB 1 has not resulted in any changes in recognition or measurement of amounts in the financial statements.
Adoption of AASB 139 ‘Financial Instruments’The Group applied hedge accounting in accordance with AASB 139 ‘Financial Instruments’ from 28 June 2014. The Group’s accounting policies are described in note (e) Derivative financial instruments.
a) Basis of preparationRounding off of amountsThe Company is a company of the kind referred to in ASIC Class Order 98/100, dated 10 July 1998, and in accordance with that Class Order amounts in the directors’ report and the financial statements are rounded off to the nearest thousand dollars, unless otherwise indicated.
Corporate reorganisationGodfreys Group Limited was incorporated on 6 November 2014. On 10 December 2014 the shareholders of the International Cleaning Solutions Group Pty Ltd undertook a capital reconstruction process, through which Godfreys Group Limited acquired International Cleaning Solutions Group Pty Ltd. The substance of the transaction has been evaluated in accordance with AASB 3 Business Combinations and it has been determined that the transaction does not represent a business combination. Rather, the transactions will in substance be accounted for as a form of capital reconstruction. Accordingly, the consolidated financial statements of the Company are seen as a continuation of International Cleaning Solutions Group Pty Ltd and as such:
The assets and liabilities recognised and measured in the consolidated financial statements are at the carrying amounts of International Cleaning Solutions Group Pty Ltd rather than at fair value;
The retained earnings and other equity balances recognised in the consolidated financial statements are the existing retained earnings and other equity balances of International Cleaning Solutions Group Pty Ltd;
The amount recognised as issued equity instruments will reflect the market capitalisation of the Company at the date of the listing minus directly attributable costs of the listing; and
The comparative financial information presented is that of International Cleaning Solutions Group Pty Ltd.
The equity structure in the consolidated financial statements, including the number and type of equity instruments issued at the date of the acquisition reflects the equity structure of Godfreys Group Limited. A capital reconstruction reserve is recognised to record the difference between the amount paid to acquire International Cleaning Solutions Group Pty Ltd and the share capital of International Cleaning Solutions Group Pty Ltd.
CONSOLIDATED STATEMENT OF CASH FLOWS
NOTES TO THE FINANCIAL STATEMENTS
Year ended Year ended 26 June 2015 27 June 2014 Note $’000 $’000
Cash flows from operating activities
Receipts from customers 187,475 178,609
Payments to suppliers and employees (159,233) (153,032)
Cash flows from operations 28,242 25,577
Income tax paid (1,065) (1,145)
Net cash flow provided by operating activities 25 27,177 24,430
Cash flows from investing activities
Payment for property, plant and equipment (6,466) (3,148)
Payment for intangible assets (2,343) (815)
Interest received 186 215
Net cash used in investing activities (8,623) (3,748)
Cash flows from financing activities
Proceeds from issue of equity securities 77,685 –
Proceeds of new debt facility 20,000 –
Payment for the acquisition of shares in ICSG (46,175) –
Repayment of previous debt facility (59,410) (6,000)
Interest and other costs of finance paid (4,274) (6,974)
Net cash flows used in financing activities (12,174) (12,974)
Net increase in cash and cash equivalents 6,380 7,709
Cash and cash equivalents at the beginning of the year 7,443 (265)
Cash and cash equivalents at the end of the year 13,823 7,443
Godfreys Group Limited 2015 Annual Report 4746
For
per
sona
l use
onl
y

NOTES TO THE FINANCIAL STATEMENTS CONT.
e) Financial instrumentsNon-derivative financial instrumentsNon-derivative financial instruments comprise trade and other receivables, cash and cash equivalents, loans and borrowings and trade and other payables. Non-derivative financial instruments are recognised initially at fair value plus, for instruments not at fair value through profit or loss, any directly attributable transaction costs, except as described below. Subsequent to initial recognition non-derivative financial instruments are measured as described below.
A financial instrument is recognised if the Group becomes a party to the contractual provision of the instrument. Financial assets are derecognised if the Group’s contractual rights to the cash flows from the financial assets expire or if the Group transfers the financial asset to another party without retaining control or substantially all risks and rewards of the asset. Regular way purchases and sales of financial assets are accounted for at trade date, i.e., the date that the Group commits itself to purchase or sell the asset. Financial liabilities are derecognised if the Group’s obligations specific in the contract expire or are discharged or cancelled.
Cash and cash equivalents comprise cash balances and call deposits. Bank overdrafts that are repayable on demand and form an integral part of the Group’s cash management are included as a component of cash and cash equivalents for the purpose of the statement of cash flows.
Derivative financial instrumentsThe Group holds derivative financial instruments to hedge its foreign currency exposures. Derivatives are recognised initially at fair value; attributable transaction costs are recognised in profit or loss when incurred. Subsequent to initial recognition, derivatives are measured at fair value and changes therein are accounted for as described below.
Economic hedgesPrior to 28 June 2014, hedge accounting was not applied to derivative instruments that economically hedge monetary assets and liabilities denominated in foreign currencies. Changes in the fair value of such derivatives were recognised in profit or loss as part of foreign currency gains and losses.
Goodwill is measured as the excess of the sum of the consideration transferred, the amount of any non-controlling interests in the acquiree, and the fair value of the acquirer’s previously held equity interest in the acquire (if any) over the net of the acquisition-date amounts of the identifiable assets acquired and the liabilities assumed.
If the initial accounting for a business combination is incomplete by the end of the reporting period in which the combination occurs, the Company reports provisional amounts for the items for which the accounting is incomplete. Those provisional amounts are adjusted during the ‘measurement period’ (which cannot exceed one year from the acquisition date), or additional assets or liabilities are recognised, to reflect new information obtained about facts and circumstances that existed as of the acquisition date that, if known, would have affected the amounts recognised as of that date.
d) Foreign currency(i) Foreign currency transactionsAll foreign currency transactions during the financial year are brought to account using the exchange rate in effect at the date of the transaction. Foreign currency monetary items at reporting date are translated at the exchange rate existing at reporting date. Non-monetary assets and liabilities carried at fair value that are denominated in foreign currencies are translated at the rates prevailing at the date when the fair value was determined. Exchange differences are recognised in profit or loss in the period in which they arise except when exchange differences, which relate to assets under construction for future productive use, are included in the cost of those assets where they are regarded as an adjustment to interest costs on foreign currency borrowings; or exchange differences on transactions entered into in order to hedge certain foreign currency risks.
(ii) Foreign operationsThe assets and liabilities of the Group’s overseas operations are translated at exchange rates prevailing at the reporting date. Income and expense items are translated at the average exchange rates for the period unless exchange rates fluctuate significantly. Exchange differences arising, if any, are recognised in the foreign currency translation reserve, and recognised in profit or loss on disposal of the foreign operation.
The following significant accounting policies have been adopted in the preparation and presentation of the financial report:
b) Basis of consolidationThe consolidated financial statements incorporate the financial statements of the Company and entities (including structured entities) controlled by the Company and its subsidiaries. Control is achieved when the Company:
has power over the investee; is exposed, or has rights, to variable returns from its involvement with the investee; and
has the ability to use its power to affect its returns.
Consolidation of a subsidiary begins when the Company obtains control over the subsidiary and ceases when the Company loses control of the subsidiary. Specifically, income and expenses of a subsidiary acquired or disposed of during the year are included in the consolidated statement of profit or loss and other comprehensive income from the date the Company gains control until the date when the Company ceases to control the subsidiary.
c) Business combinationsAcquisitions of businesses are accounted for using the acquisition method. The consideration transferred in a business combination is measured at fair value which is calculated as the sum of the acquisition-date fair values of assets transferred, liabilities incurred and the equity instruments issued by the Company in exchange for control of the acquiree. Acquisition-related costs are recognised in profit or loss as incurred.
At the acquisition date, the identifiable assets acquired and liabilities assumed are recognised at their fair value, except that:
Deferred tax assets or liabilities and assets or liabilities related to employee benefit arrangements are recognised and measured in accordance with AASB 112 “Income Taxes” and AASB 119 “Employee Benefits” respectively;
Liabilities or equity instruments related to share-based payment arrangements of the acquire or share-based payment arrangements of the Company entered into to replace share-based payment arrangements of the acquiree are measured in accordance with AASB 2 “Share-based Payment” at the acquisition date; and
Assets (or disposal groups) that are classified as held for sale in accordance with AASB 5
“ Non-current Assets Held for Sale and Discontinued Operations” are measured in accordance with that Standard.
There is an alternate view to this approach in that such a restructure should be accounted for as a business combination that follows the legal structure of the Company being the acquirer. In the event that the transaction was deemed a business combination, the acquisition would be required to be recorded at fair value as follows:
The net assets of the Company would be increased to reflect the market capitalisation (an increase of $43.6 million);
The consolidated reserves and accumulated losses would be reset to nil as a result of the transactions;
The excess of the fair value (based on the indicative market capitalisation) compared to the book value of net assets, if a purchase price allocation were required to be undertaken in the future, would primarily be allocated to brand names and trademarks (estimated to be approximately $14.9 million), as well as franchise agreements (estimated at approximately $4.2 million) and the franchise system (estimated at approximately $6.0 million), with any residual allocated to goodwill; and
To the extent that any of the excess was allocated to finite life intangible assets (brand names, trademarks and franchise agreements), NPAT would be impacted by the annual amortisation of these intangible assets, estimated to be approximately $0.4 million per annum.
The precise impact of any acquisition accounting, if it were required to be applied in the future, cannot be accurately determined at this time, as a formal purchase price allocation has not been carried out. Accordingly, the above estimates are preliminary indicative estimates only, which may change if a formal purchase price allocation was required.
Historical cost conventionThe financial statements have been prepared on the basis of historical cost, except for certain financial instruments that are measured at revalued amounts or fair values, as explained in the accounting policies below. Historical cost is generally based on the fair values of the consideration given in exchange for assets. All amounts are presented in Australian dollars, unless otherwise noted.
Note 1Significant accounting policies cont.
Godfreys Group Limited 2015 Annual Report 4948
For
per
sona
l use
onl
y

NOTES TO THE FINANCIAL STATEMENTS CONT.
h) Tax consolidationThe Company and its wholly owned Australian resident subsidiaries are part of an income tax consolidated group under Australian tax law and are therefore taxed as a single entity. Current tax expense/income, deferred tax liabilities and deferred tax assets arising from temporary differences of the members of the tax consolidated group are recognised in the separate financial information of the members of the tax consolidated group using the “group allocation method” approach by reference to the carrying amount of assets and liabilities in the separate financial information of each entity and the tax values applying under tax consolidation.
Any current tax liabilities (or assets) and deferred tax assets arising from unused tax losses of the subsidiaries are assumed by the head entity in the tax consolidated group and are recognised as amounts payable (receivable) to (from) other entities in the tax consolidated group in conjunction with any tax funding arrangement amounts (refer below). Any difference between these amounts is recognised by the Company as an equity contribution or distribution. Any subsequent period adjustments to deferred tax assets arising from unused tax losses as a result of revised assessments of the probability of recoverability are recognised by the head entity only.
The head entity, in conjunction with other members of the tax consolidated group, entered into a tax funding arrangement on May 2015, which sets out the funding obligations of members of the tax consolidated group in respect of tax amounts. The tax funding arrangements require payments to/from the head entity equal to the current tax liability (asset) assumed by the head entity and any tax loss deferred tax asset assumed by the head entity, resulting in the head entity recognising an inter-entity receivable (payable) equal in amount to the tax liability (asset) assumed. The inter-entity receivables (payables) are at call.
g) Income taxIncome tax expense comprises current and deferred tax. Income tax expense is recognised in the profit or loss except to the extent that it relates to items recognised directly in equity, in which case it is recognised in equity.
Current tax is the expected tax payable on the taxable income for the year, using tax rates enacted or substantively enacted at the reporting date, and any adjustment to tax payable in respect of previous years.
Deferred tax is provided using the balance sheet liability method, providing for temporary differences between the carrying amounts of assets and liabilities for financial reporting purposes and the amounts used for taxation purposes. Deferred tax is not recognised for the following temporary differences: the initial recognition of goodwill, the initial recognition of assets or liabilities in a transaction that is not a business combination and that affects neither accounting nor taxable profit, and differences relating to investments in subsidiaries to the extent that they will probably not reverse in the foreseeable future. Deferred tax is measured at the tax rates that are expected to be applied to the temporary differences when they reverse, based on the laws that have been enacted or substantively enacted at the reporting date.
Deferred tax assets and liabilities are offset if there is a legally enforceable right to offset current tax liabilities and assets, and they relate to income taxes levied by the same tax authority on the same taxable entity, or on different tax entities, but they intend to settle current tax liabilities and assets on a net basis or their tax assets and liabilities will be realised simultaneously.
A deferred tax asset is recognised to the extent that it is probable that future taxable profits will be available against which the temporary difference can be utilised. Deferred tax assets are reviewed at each reporting date and are reduced to the extent that it is no longer probable that the related tax benefit will be realised.
Additional income taxes that arise from the distribution of dividends are recognised at the same time as the liability to pay the related dividend is recognised.
f) Revenuei) Goods soldRevenue from the sale of goods is measured at the fair value of the consideration received or receivable, net of returns and allowances, trade discounts and volume rebates. Revenue is recognised when the significant risks and rewards of ownership have been transferred to the buyer. No revenue is recognised if there are significant uncertainties regarding recovery of the consideration due, the costs incurred or to be incurred cannot be measured reliably, there is a risk of return of goods, or there is continuing management involvement with the goods.
Transfers of risks and rewards vary depending on the individual terms of the contract of sale. For sales of vacuum cleaners and related products, transfer usually occurs upon receipt by the customer.
ii) InterestInterest revenue is recognised when it is probable that the economic benefits will flow to the Group and the amount of revenue can be measured reliably. Interest revenue is accrued on a time basis, by reference to the principal outstanding and at the effective interest rate applicable, which is the rate that exactly discounts estimated future cash receipts through the expected life of the financial asset to that asset’s net carrying amount on initial recognition.
iii) ServicesRevenue from services rendered is recognised when the services are performed.
iv) Initial franchise feesRevenue attributable to franchise fees for the sale of a franchise is brought to account when the franchise fees have been earned, which is at the time the franchisee commences trading.
v) Ongoing franchise feesOngoing franchise fees are recognised as revenue when the services are delivered to franchisees.
vi) Deferred service plan income/Extended warranty incomeDeferred service plan income and extended warranty income is recognised in the income statement as the services are performed over the life of the plan.
Hedge accountingEffective 28 June 2014, hedges of foreign exchange risk on firm commitments are accounted for as cash flow hedges. At the inception of the hedge relationship, the Company documents the relationship between the hedging instrument and the hedged item, along with its risk management objectives and its strategy for undertaking various hedge transactions. Furthermore, at the inception of the hedge and on an ongoing basis, the Company documents whether the hedging instrument is highly effective in offsetting changes in fair values or cash flows of the hedged item attributable to the hedged risk.
Cash flow hedgesThe effective portion of changes in the fair value of derivatives that are designated and qualify as cash flow hedges is recognised in other comprehensive income and accumulated under the heading of cash flow hedging reserve. The gain or loss relating to the ineffective portion is recognised immediately in profit or loss, and is included in the other gains and losses line item. Amounts previously recognised in other comprehensive income and accumulated in equity are reclassified to profit or loss in the periods when the hedged item is recognised in profit or loss, in the same line item as the recognised hedged item.
When the hedged forecast transaction that is hedged results in the recognition of a non-financial asset or a non-financial liability, the gains and losses previously recognised in other comprehensive income and accumulated in equity are transferred from equity and included in the initial measurement of the cost of the non-financial asset or non-financial liability.
Hedge accounting is discontinued when the Group revokes the hedging relationship, when the hedging instrument expires or is sold, terminated, or exercised, or when it no longer qualifies for hedge accounting. Any gain or loss recognised in other comprehensive income and accumulated in equity at that time remains in equity and is recognised when the forecast transaction is ultimately recognised in profit or loss. When a forecast transaction is no longer expected to occur, the gain or loss accumulated in equity is recognised immediately in profit or loss.
Note 1Significant accounting policies cont.
Godfreys Group Limited 2015 Annual Report 5150
For
per
sona
l use
onl
y

NOTES TO THE FINANCIAL STATEMENTS CONT.
Capitalised IT system development costsAll costs directly incurred in the purchase or development of major computer software or subsequent upgrades and material enhancements, which can be reliably measured and are not integral to a related asset, are capitalised as intangible assets. Direct costs may include internal payroll and on-costs for employees directly associated with the project. Costs incurred on computer software maintenance or during the planning phase are expensed as incurred. Computer software is amortised over the period of time during which the benefits are expected to arise, being 4 years.
q) Impairment of intangible assetsAt each reporting date, the Group reviews the carrying amounts of its tangible and intangible assets to determine whether there is any indication of impairment. If any such indication exists, the recoverable amount of the asset is estimated in order to determine the extent of the impairment loss (if any). Where the carrying amount of an asset exceeds its recoverable amount the asset is considered impaired and is written down to its recoverable amount in profit or loss.
The recoverable amount is the greater of fair value less costs to sell and value in use. Where the asset does not generate cash flows that are independent from other assets, the Group estimates the recoverable amount of the cash generating unit to which the asset belongs. In assessing value in use, the estimated future cash flows are discounted to their present value using a pre-tax discount rate that reflects current market assessments of the time value of money and the risks specific to the asset for which the estimates of future cash flows have not been adjusted.
Non-financial assets other than Goodwill that have been impaired are tested for possible reversal of the impairment whenever events or changes in circumstances indicate the impairment may have reversed. Where an impairment loss subsequently reverses, the carrying amount of the asset (cash-generating unit) is increased to the revised estimate of its recoverable amount, but only to the extent that the increased carrying amount does not exceed the carrying amount that would have been determined had no impairment loss been recognised for the asset (cash-generating unit) in prior years. A reversal of an impairment loss is recognised in profit or loss immediately.
p) Intangible assetsGoodwillGoodwill acquired in a business combination is initially measured at its cost, being the excess of the cost of the business combination over the Company’s interest in the net fair value of the identifiable assets, liabilities and contingent liabilities recognised at the date of the acquisition. Goodwill is subsequently measured at its cost less any accumulated impairment losses.
For the purpose of impairment testing, goodwill and other indefinite life intangible assets are allocated to each of the Group’s cash-generating units, or groups of cash-generating units, expected to benefit from the synergies of the business combination. Cash generating units or groups of cash generating units to which goodwill has been allocated are tested for impairment annually or more frequently if events or changes in circumstances indicate that goodwill might be impaired. If the recoverable amount of the cash generating unit (or groups of cash generating units) is less than the carrying amount of the cash- generating unit (or groups of cash-generating units), the impairment loss is allocated first to reduce the carrying amount of any goodwill allocated to the cash-generating unit (or groups of cash-generating units) and then to the other assets of the cash generating units pro rata on the basis of the carrying amount of each asset in the cash- generating unit (or groups of cash generating units). An impairment loss recognised for goodwill is recognised immediately in profit or loss and is not reversed in a subsequent period.
On disposal of an operation within a cash-generating unit, the attributable amount of goodwill is included in the determination of the profit or loss on disposal of the operation.
Other intangible assets
Brand names, Franchise System and TrademarksGodfreys Group proprietary brands and the Franchise System intangible asset are considered to have indefinite lives. The brands are not considered to have foreseeable brand maturity dates, and have accordingly been assessed as having indefinite useful lives and are therefore not amortised. Instead, the brand names are tested for impairment annually or more frequently if events or changes in circumstances indicate that they might be impaired, and are carried at cost less accumulated impairment losses.
Trademarks are amortised over their useful life of 10–20 years.
l) Cash and cash equivalentsCash comprises cash on hand and demand deposits. Cash equivalents are short term highly liquid investments that are readily convertible to known amounts of cash which are subjected to an insignificant risk of change in value and have maturity of three months or less at the date of acquisition. Bank overdrafts are shown within borrowings in the current liabilities section of the consolidated statement of financial position.
m) Trade and other receivablesTrade receivables are recognised and carried at original invoice amount less an allowance for any uncollectible amounts. An estimate for doubtful debts is made when collection of the full amount is no longer probable. Bad debts are written off when identified.
n) InventoriesInventories are valued at the lower of cost and net realisable value. Net realisable value represents the estimated selling price less all estimated costs of completion and the estimated costs necessary to make the sale. Finished goods are measured at either a standard cost or their weighted-average cost paid for the goods. Cost includes the transfer from equity of any gains/losses on qualifying cash flow hedges relating to the purchase of inventories. Indirect costs incurred in the handling and distribution of finished goods are included in the measurement of inventories.
o) Property, plant and equipmentProperty, plant and equipment is stated at cost less accumulated depreciation and impairment. Cost includes expenditure that is directly attributable to the acquisition of the item. Depreciation is calculated on a straight-line basis so as to write off the net cost of each asset over its expected useful life to its estimated residual value. Leasehold improvements are depreciated over the period of the lease or estimated useful life, whichever is the shorter, using the straight-line method. The useful lives are as follows:
Fixtures, fittings and equipment – 1 to 20 years; and
Leasehold improvements – 3 to 5 years.
The estimated useful lives, residual values and depreciation method are reviewed at the end of each annual reporting period. An item of plant and equipment is derecognised upon disposal or where no further future economic benefits are expected from its use or disposal. During the financial year, the Directors determined that there should be no changes to the useful life of the property, plant and equipment.
i) Share-based paymentsEquity-settled share-based payments to employees and others providing similar services are measured at the fair value of the equity instruments at the grant date. The fair value determined at the grant date of the equity-settled share-based payments is expensed on a straight-line basis over the vesting period, based on the Company’s estimate of equity instruments that will eventually vest, with a corresponding increase in equity. At the end of each reporting period, the Company revises its estimate of the number of equity instruments expected to vest. The impact of the revision of the original estimates, if any, is recognised in profit or loss such that the cumulative expense reflects the revised estimate, with corresponding adjustment to the equity-settled employee benefits reserve.
Equity-settled share-based payment transactions with parties other than employees are measured at the fair value of the goods or services received, except where that fair value cannot be estimated reliably, in which case they are measured at the fair value of the equity instruments granted, measured at the date the entity obtains the goods or the counterparty renders the service.
j) Earnings per shareBasic EPS is calculated as net profit for the period, adjusted to exclude costs of servicing equity (other than dividends), divided by the weighted average number of ordinary shares, adjusted for any bonus element.
Diluted EPS is the figure used for Basic EPS adjusted to take into account dilutive potential ordinary shares assumed to be issued for no consideration.
k) ComparativesWhere current period balances have been classified differently within current period disclosures when compared to the prior period, comparative disclosures have been restated to ensure consistency of presentation between periods.
Note 1Significant accounting policies cont.
Godfreys Group Limited 2015 Annual Report 5352
For
per
sona
l use
onl
y

NOTES TO THE FINANCIAL STATEMENTS CONT.
allocated. The value in use calculation requires the Directors to estimate the future cash flows expected to arise from the cash-generating unit and a suitable discount rate in order to calculate present value. Where the actual future cash flows are less than expected, a material impairment loss may arise.
InventoriesThe net realisable value of inventories is the estimated selling price in the ordinary course of business less estimated costs to sell. The key assumptions require the use of management judgement and are reviewed annually. These key assumptions are the variables affecting the expected selling price. Any reassessment of the selling price in a particular year will affect the cost of goods sold.
z) New, revised or amending Accounting Standards and Interpretations adoptedThe consolidated entity has adopted all of the new, revised or amending Accounting Standards and Interpretations issued by the Australian Accounting Standards Board (‘AASB’) that are mandatory for the current reporting period as listed below.
AASB 2012-3 Amendments to Australian Accounting Standards – Disclosures – Offsetting Financial Assets and Financial Liabilities
AASB 2012-5 Amendments to Australian Accounting Standards arising from Annual Improvements 2009-2011 Cycle
AASB 2012-9 ‘Amendment to AASB 1048 arising from the Withdrawal of Australian Interpretation 1039
AASB CF 2013-1 Amendments to the Australian Conceptual Framework’ and AASB 2013-9 ‘ Amendments to Australian Accounting Standards – Conceptual Framework, Materiality and Financial Instruments’ (Part A Conceptual Framework).
The adoption of the above Accounting Standards and Interpretations has not had any material impact on the amounts reported in this financial report but may affect the accounting for future transactions or arrangements. Any new, revised or amending Accounting Standards or Interpretations that are not yet mandatory have not been early adopted. Refer note 1(aa).
w) Issued capitalIssued and paid up capital is recognised at the fair value of the consideration received. Transaction costs arising on the issue of equity instruments are recognised directly in equity, net of tax as a reduction of the proceeds of the equity instruments to which the costs relate. Transaction costs are the costs that are incurred directly in connection with the issue of those equity instruments and which would not have been incurred had those instruments not been issued.
Dividend is made for the amount of any dividend declared, being approved by the Board and no longer at the discretion of the Company, on or before the end of the reporting period but not distributed by the end of the reporting period.
x) Goods and services taxRevenues, expenses and assets are recognised net of the amount of goods and services tax (GST), except:
a) where the amount of GST incurred is not recoverable from the taxation authority, it is recognised as part of the cost of acquisition of an asset or as part of an item of expense; or
b) for receivables and payables which are recognised inclusive of GST. The net amount of GST recoverable from, or payable to, the taxation authority is included as part of receivables or payables. Cash flows are included in the cash flow statement on a gross basis. The GST component of cash flows arising from investing and financing activities which is recoverable from, or payable to, the taxation authority is classified as operating cash flows.
y) Critical accounting judgements, estimates and assumptionsThe Company makes estimates and assumptions concerning the future. The resulting accounting estimates will, by definition, seldom equal the related actual results. The estimates and assumptions that have a significant risk of causing a material adjustment to the carrying amounts of assets and liabilities within the next financial year are discussed below:
Impairment of goodwill and other intangible assetsDetermining whether goodwill is impaired requires an estimation of the value in use of the cash generating units to which goodwill has been
u) ProvisionsProvisions are recognised when the Group has a present obligation (legal or constructive) as a result of a past event, it is probable that an outflow of resources embodying economic benefits will be required to settle the obligation, and a reliable estimate can be made of the amount of the obligation.
If the effect of the time value of money is material, provisions are determined by discounting the expected future cash flows at a pre-tax rate that reflects current market assessments of the time value of money and, where appropriate, the risks specific to the liability. Where discounting is used, the increase in the provision due to the passage of time is recognised as a finance cost. When some or all of the economic benefits required to settle a provision are expected to be recovered from a third-party, the receivable is recognised as an asset if it is virtually certain that recovery will be received and the amount of the receivable can be measured reliably.
A provision for warranties is recognised when the underlying products or services are sold. The provision is based on historical warranty data and a weighting of all possible outcomes against their associated probabilities.
v) Employee benefitsA liability is recognised for benefits accruing to employees in respect of wages and salaries, annual leave and long service leave when it is probable that settlement will be required and they are capable of being measured reliably.
Liabilities recognised in respect of short-term employee benefits, are measured at their nominal values using the remuneration rate expected to apply at the time of settlement.
Liabilities recognised in respect of long term employee benefits are measured as the present value of the estimated future cash outflows to be made by the Group in respect of services provided by employees up to reporting date. Management judgement is applied in determining key assumptions in the calculation of long term employee benefits including future increases in wages and salaries, future on-costs and rates, experience of employee departures and expected employee periods of services.
Contributions to defined contribution superannuation plans are expensed when incurred.
r) LeasesLeases where the lessor retains substantially all the risks and benefits of ownership of the asset are classified as operating leases. Operating lease payments are recognised as an expense in the Income Statement on a straight-line basis over the shorter of the useful life of the asset or the lease term where such leases contain annual fixed escalation rates and the value of the future lease payments can be determined.
A provision for leasehold site restoration is recognised where an obligation exists in the underlying lease agreement. The provision is based on managements’ best estimate of anticipated costs to restore the leased premises at the expiry of the lease. Site restoration costs are recognised as part of the cost of assets and as a provision at the time of the obligating event.
Lease incentivesLessor contributions to the construction and fit-out of premises where the lessor retains ownership of the assets are accounted for as a reduction of the cost of the construction and fit-out. Where ownership of the assets is retained by the Group, lessor contributions are accounted for as a lease incentive liability and is reduced on a straight line basis over the remaining term of the lease.
s) Trade and other payablesTrade payables and other accounts payable are recognised when the Group becomes obliged to make future payments resulting from the purchase of goods and services.
t) Interest bearing loans and borrowingsAll loans and borrowings are initially recognised at the fair value of the consideration received less directly attributable costs. After initial recognition, interest-bearing loans and borrowings are subsequently measured at amortised cost using the effective interest method. Ancillary costs incurred in connection with the arrangement of borrowings are deferred and amortised over the period of the borrowing and are netted off against the borrowings.
Borrowings are classified as current liabilities unless the Group has an unconditional right to defer settlement of the liability for at least 12 months after the reporting date.
Note 1Significant accounting policies cont.
Godfreys Group Limited 2015 Annual Report 5554
For
per
sona
l use
onl
y

NOTES TO THE FINANCIAL STATEMENTS CONT.
Note 2Revenues and expenses
Profit before income tax includes the following items of income and expenses:
CONSOLIDATED Year ended Year ended 26 June 2015 27 June 2014 $’000 $’000
a) Sales and other incomeSale of goods 182,632 173,547
Other income 4,774 4,859
Total revenue 187,406 178,406
b) ExpensesOccupancy expense:
Minimum lease payments on operating leases (15,153) (14,099)
Other occupancy expenses (1,827) (1,601)
Total occupancy expense (16,980) (15,700)
Employee benefits expense:
Short-term employee benefits (34,800) (32,268)
Post-employment benefits (2,618) (2,305)
Other long-term employee benefits (324) (244)
Termination benefits (155) (312)
Total employee benefits expense (37,897) (35,129)
Depreciation and amortisation:
Depreciation (3,479) (3,291)
Amortisation (186) (186)
Total depreciation and amortisation (3,665) (3,477)
Net finance costs:
Interest paid to previous related parties (1,316) (5,201)
Interest and finance charges paid to banks and other financial institutions (1,846) (2,915)
Refinancing charge (1,020) –
Amortisation of deferred borrowing costs (92) –
Interest revenue 186 215
Total net finance costs (4,088) (7,901)
IPO transaction costs:
IPO costs (3,427) –
IPO retention bonus (2,482) –
Total IPO transaction costs (5,909) –
aa) New accounting standards and interpretations not yet mandatory or early adoptedAt the date of authorisation of the financial report, the following Australian Accounting Standards and Interpretations listed below have recently been issued or amended but are not yet mandatory, have not been early adopted by the consolidated entity for the annual reporting period ended 26 June 2015.
Effective for the Expected to be annual reporting initially applied period beginning in the financialStandard/Interpretation on or after year ending
AASB 9 ‘Financial Instruments’, and the relevant amending standards1 1 January 2018 31 December 2018
AASB 15 ‘Revenue from Contracts with Customers’ and AASB 2014-5 ‘Amendments to Australian Accounting Standards arising from AASB 15’ 1 January 2018 31 December 2017
AASB 2014-4 ‘Amendments to Australian Accounting Standards – Clarification of Acceptable Methods of Depreciation and Amortisation’ 1 January 2016 31 December 2016
AASB 2015-1 ‘Amendments to Australian Accounting Standards – Annual Improvements to Australian Accounting Standards 2012-2014 Cycle’ 1 January 2016 31 December 2016
AASB 2015-2 ‘Amendments to Australian Accounting Standards – Disclosure Initiative: Amendments to AASB 101’ 1 January 2016 31 December 2016
AASB 2015-3 ‘Amendments to Australian Accounting Standards arising from the Withdrawal of AASB 1031 Materiality’ 1 July 2015 31 December 2016
The Group has commenced the assessment of the above standards and consider that AASB 9 and AASB 15 may have an impact on amounts reported in future periods.
AASB 9 will impact any future hedging arrangements and require additional disclosures. Had the standard been adopted in the current period it would only impact the disclosures with additional requirements.
AASB 15 has recently been issued and the commencement date has been delayed by the AASB to periods commencing after 1 January 2018. The Group is evaluating the impact of the standard and it is expected that it will impact the financial statements from a disclosure and valuation perspective.
Note 1Significant accounting policies cont.
Godfreys Group Limited 2015 Annual Report 5756
For
per
sona
l use
onl
y

NOTES TO THE FINANCIAL STATEMENTS CONT.
CONSOLIDATED Australia New Zealand Unallocated Total2014 $’000 $’000 $’000 $’000
Sale of goods 148,292 25,255 – 173,547
Other income 4,191 668 – 4,859
Total revenue 152,483 25,923 – 178,406
Reportable segment EBITDA 15,977 3,313 (47) 19,243
Depreciation and amortisation (3,051) (426) – (3,477)
Reportable segment EBIT 12,926 2,887 (47) 15,766
Net financing costs (7,919) 18 – (7,901)
Income tax expense (1,320) (816) – (2,136)
Statutory profit after tax 3,687 2,089 (47) 5,729
Segment revenue reported above represents revenue generated from external customers. Inter-segment sales are immaterial. Segment asset and liability information is not used by the CODM for the purpose of resource allocation and assessment of segment performance.
Product informationThe Group is a speciality retailer of domestic and commercial floor care and associated cleaning products.
Major customersNo single customer contributed 10% or more to the Group’s revenue for both 2015 and 2014.
Note 3Segment information
In accordance with Australian Accounting Standard AASB 8 Operating Segments, the Company has determined that its reporting segments comprise Australia and New Zealand, consistent with the manner in which the business is managed.
These segments are those in which the chief operating decision maker (“CODM”) receives information for the purpose of resource allocation and assessment of segment performance. Godfreys’ primary reporting format is geographical segments as its risks and rates of return are predominantly affected by having operations in different countries.
AustraliaThe Australian segment includes revenues and profits generated by Godfreys Group’s retail, wholesale and online revenue streams within Australia. These comprise of 183 retail sites as at 26 June 2015.
New ZealandThe New Zealand segment includes revenues and profits generated by Godfreys Group’s retail, wholesale and online revenue streams within New Zealand. These comprise of 29 retail sites as at 26 June 2015.
The accounting policies used by the Group in reporting segments are the same as those contained in Note 1 to the financial statements and in the prior period. Information regarding the results of each reportable segment is included below.
Performance is measured based on segment profit before interest and tax as included in the internal management reports that are reviewed by the CODM. Segment profit is used to measure performance as management believe that such information is the most relevant in evaluating the results of certain segments relative to other entities that operate within these industries.
The following is an analysis of Godfreys Group Limited’s revenue, EBITDA and results from operations by reportable segment.
CONSOLIDATED Australia New Zealand Unallocated Total2015 $’000 $’000 $’000 $’000
Sale of goods 156,822 25,810 – 182,632
Other income 4,276 498 – 4,774
Total revenue 161,098 26,308 – 187,406
Reportable segment EBITDA 14,877 1,995 (48) 16,824
Depreciation and amortisation (3,331) (334) – (3,665)
Reportable segment EBIT 11,546 1,661 (48) 13,159
Net financing costs (4,109) 21 – (4,088)
Income tax benefit / (expense) 3,460 (487) – 2,973
Statutory profit after tax 10,897 1,195 (48) 12,044
Godfreys Group Limited 2015 Annual Report 5958
For
per
sona
l use
onl
y

NOTES TO THE FINANCIAL STATEMENTS CONT.
Note 4Income taxes
Income tax recognised in profit or loss:
CONSOLIDATED Year ended Year ended 26 June 2015 27 June 2014 $’000 $’000
Current tax
In respect of the current year 4,006 1,756
In respect of prior year (204) (97)
3,802 1,659
Deferred tax
In respect of the current year (6,775) 477
Total income tax (benefit) / expense recognised in the current year (2,973) 2,136
The income tax expense for the year can be reconciled to the accounting profit as follows:
Profit before tax from continuing operations 9,071 7,865
Income tax expense calculated at 29.5% (2014: 29.5%)(1) 2,676 2,320
Effect of expenses that are not deductible in determining taxable profit 1,367 34
Effect of deductible temporary differences now recognised as deferred tax assets 313 70
Tax benefit on formation of tax consolidation group (7,089) –
Adjustments recognised in the current year in relation to the current tax of prior years (240) (288)
Income tax (benefit) / expense recognised in profit or loss (2,973) 2,136
(1) Represents a blended tax rate for Australia and New Zealand.
Income tax recognised directly in equity:
CONSOLIDATED Year ended Year ended 26 June 2015 27 June 2014 $’000 $’000
Deferred tax
Cash flow hedge reserve: (70) –
Total income tax recognised directly in equity (70) –
CONSOLIDATED Year ended Year ended 26 June 2015 27 June 2014 $’000 $’000
Current tax assets and liabilities
Current tax liabilities
Income tax payable (233) (626)
Deferred tax balances
Deferred tax balances are presented in the statement of financial position as follows:
Deferred tax assets 6,938 2,739
6,705 2,113
Recognised Recognised in other com- Opening in profit prehensive Closing balance or loss income balance2015 $’000 $’000 $’000 $’000
Temporary differences
Cash flow hedges – – (70) (70)
Employee provisions 1,086 151 – 1,237
Provisions 958 (292) – 666
Accruals 419 (356) – 63
Other 276 (26) – 250
2,739 (523) (70) 2,146
Unused tax losses
Tax losses – 4,792 – 4,792
Total 2,739 4,269 (70) 6,938
Godfreys Group Limited 2015 Annual Report 6160
For
per
sona
l use
onl
y

NOTES TO THE FINANCIAL STATEMENTS CONT.
Note 5Earnings per share
Year ended Year ended 26 June 2015 27 June 2014
Weighted Weighted average no. Earnings per average no. Earnings per of ordinary share (cents of ordinary share (cents shares per share) shares per share)
Basic earnings per share 34,708,031 34.70 28,000,000 20.46
Diluted earnings per share 35,594,336 33.84 28,840,000 19.86
Net profit after tax ($’000) 12,044 5,729
Weighted average number of ordinary shares outstanding during the current period has been calculated using:
i) the number of ordinary shares outstanding from the beginning of the current period to the acquisition date computed on the basis of the weighted average number of ordinary shares of the group (accounting acquirer) outstanding during the period multiplied by the exchange ratio established in the reorganisation agreement; and
ii) the number of ordinary shares outstanding from the acquisition date to the end of the period being the actual number of ordinary shares of the group (the accounting acquiree) outstanding during that period.
The basic and diluted earnings per share for the comparative period before the acquisition date presented in the consolidated financial statements has been calculated using Godfreys Group Limited historical weighted average number of shares outstanding multiplied by the exchange ratio established in the reorganisation agreement.
Note 4Income taxes cont.
Recognised Opening in profit Closing balance or loss balance2014 $’000 $’000 $’000
Temporary differences
Employee provisions 1,014 72 1,086
Provisions 653 305 958
Accruals (453) 872 419
Other 221 55 276
1,435 1,304 2,739
Unused tax losses
Tax losses 1,781 (1,781) –
Total 3,216 (477) 2,739
Unrecognised deferred tax assets
CONSOLIDATED 2015 2014 $’000 $’000
Deductible temporary differences, unused tax losses and unused tax credits for which no deferred tax assets have been recognised are attributable to the following:
– tax losses (revenue in nature) 812 –
812 –
Godfreys Group Limited 2015 Annual Report 6362
For
per
sona
l use
onl
y
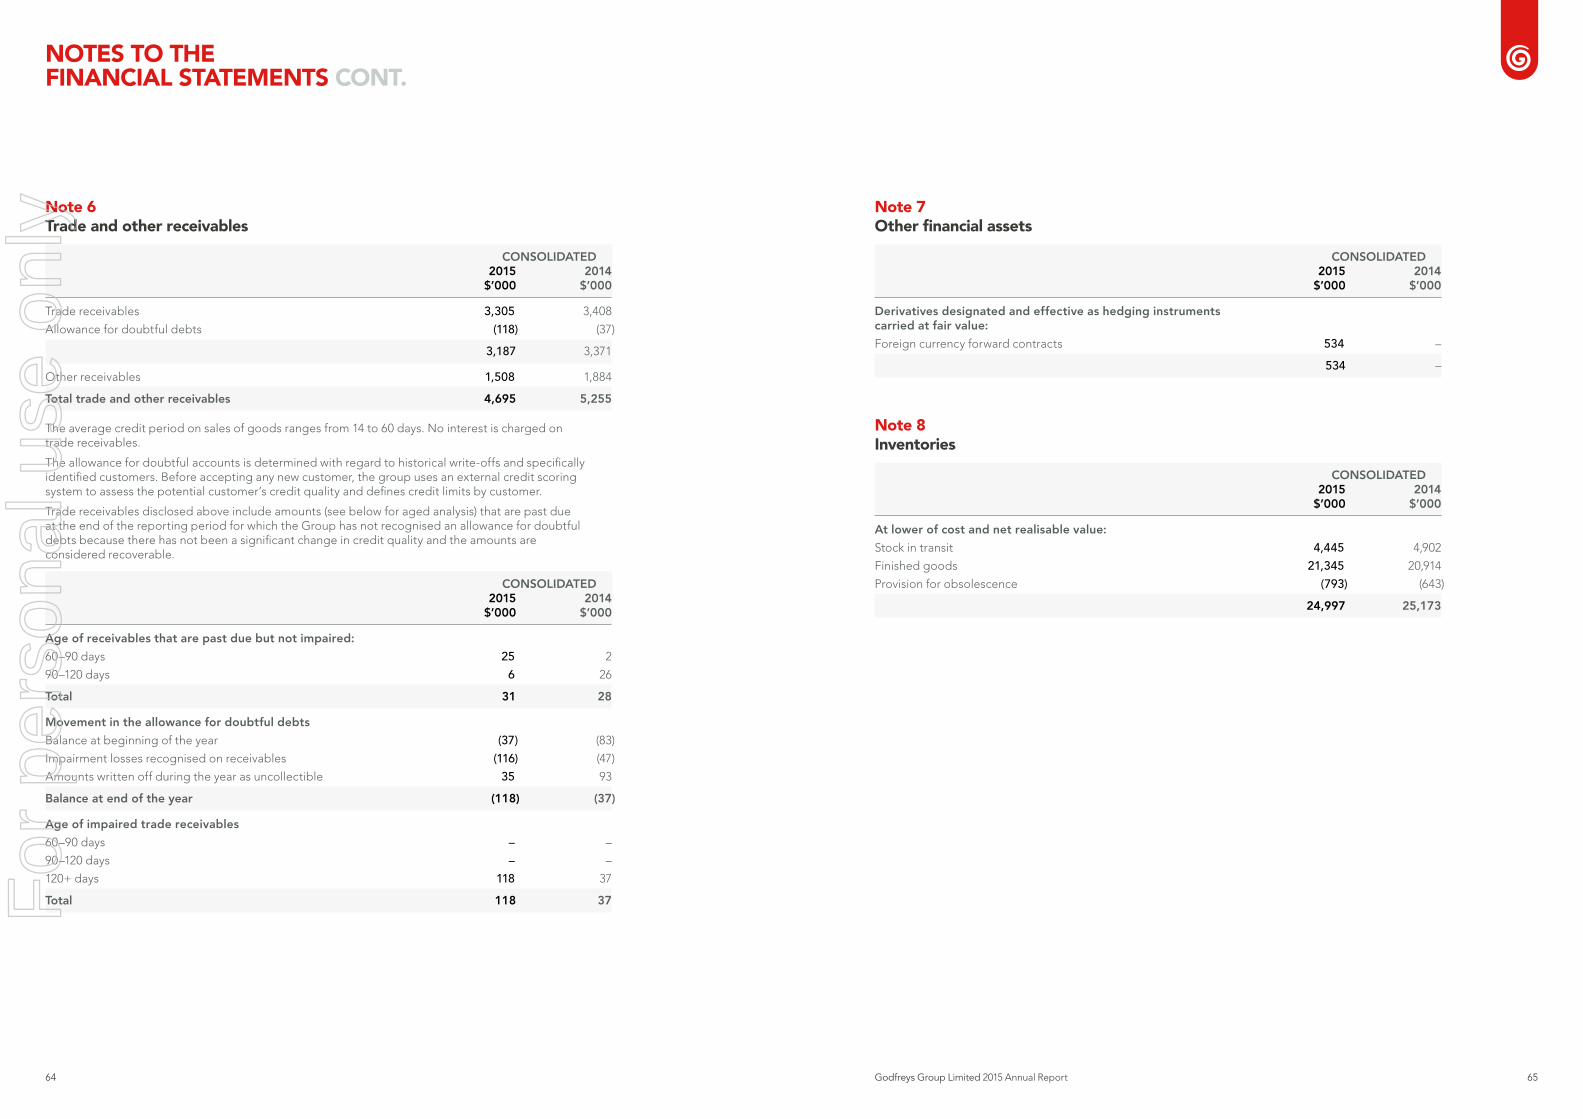
NOTES TO THE FINANCIAL STATEMENTS CONT.
Note 7Other financial assets
CONSOLIDATED 2015 2014 $’000 $’000
Derivatives designated and effective as hedging instruments carried at fair value:
Foreign currency forward contracts 534 –
534 –
Note 8Inventories
CONSOLIDATED 2015 2014 $’000 $’000
At lower of cost and net realisable value:
Stock in transit 4,445 4,902
Finished goods 21,345 20,914
Provision for obsolescence (793) (643)
24,997 25,173
Note 6Trade and other receivables
CONSOLIDATED 2015 2014 $’000 $’000
Trade receivables 3,305 3,408
Allowance for doubtful debts (118) (37)
3,187 3,371
Other receivables 1,508 1,884
Total trade and other receivables 4,695 5,255
The average credit period on sales of goods ranges from 14 to 60 days. No interest is charged on trade receivables.
The allowance for doubtful accounts is determined with regard to historical write-offs and specifically identified customers. Before accepting any new customer, the group uses an external credit scoring system to assess the potential customer’s credit quality and defines credit limits by customer.
Trade receivables disclosed above include amounts (see below for aged analysis) that are past due at the end of the reporting period for which the Group has not recognised an allowance for doubtful debts because there has not been a significant change in credit quality and the amounts are considered recoverable.
CONSOLIDATED 2015 2014 $’000 $’000
Age of receivables that are past due but not impaired:
60–90 days 25 2
90–120 days 6 26
Total 31 28
Movement in the allowance for doubtful debts
Balance at beginning of the year (37) (83)
Impairment losses recognised on receivables (116) (47)
Amounts written off during the year as uncollectible 35 93
Balance at end of the year (118) (37)
Age of impaired trade receivables
60–90 days – –
90–120 days – –
120+ days 118 37
Total 118 37
Godfreys Group Limited 2015 Annual Report 6564
For
per
sona
l use
onl
y
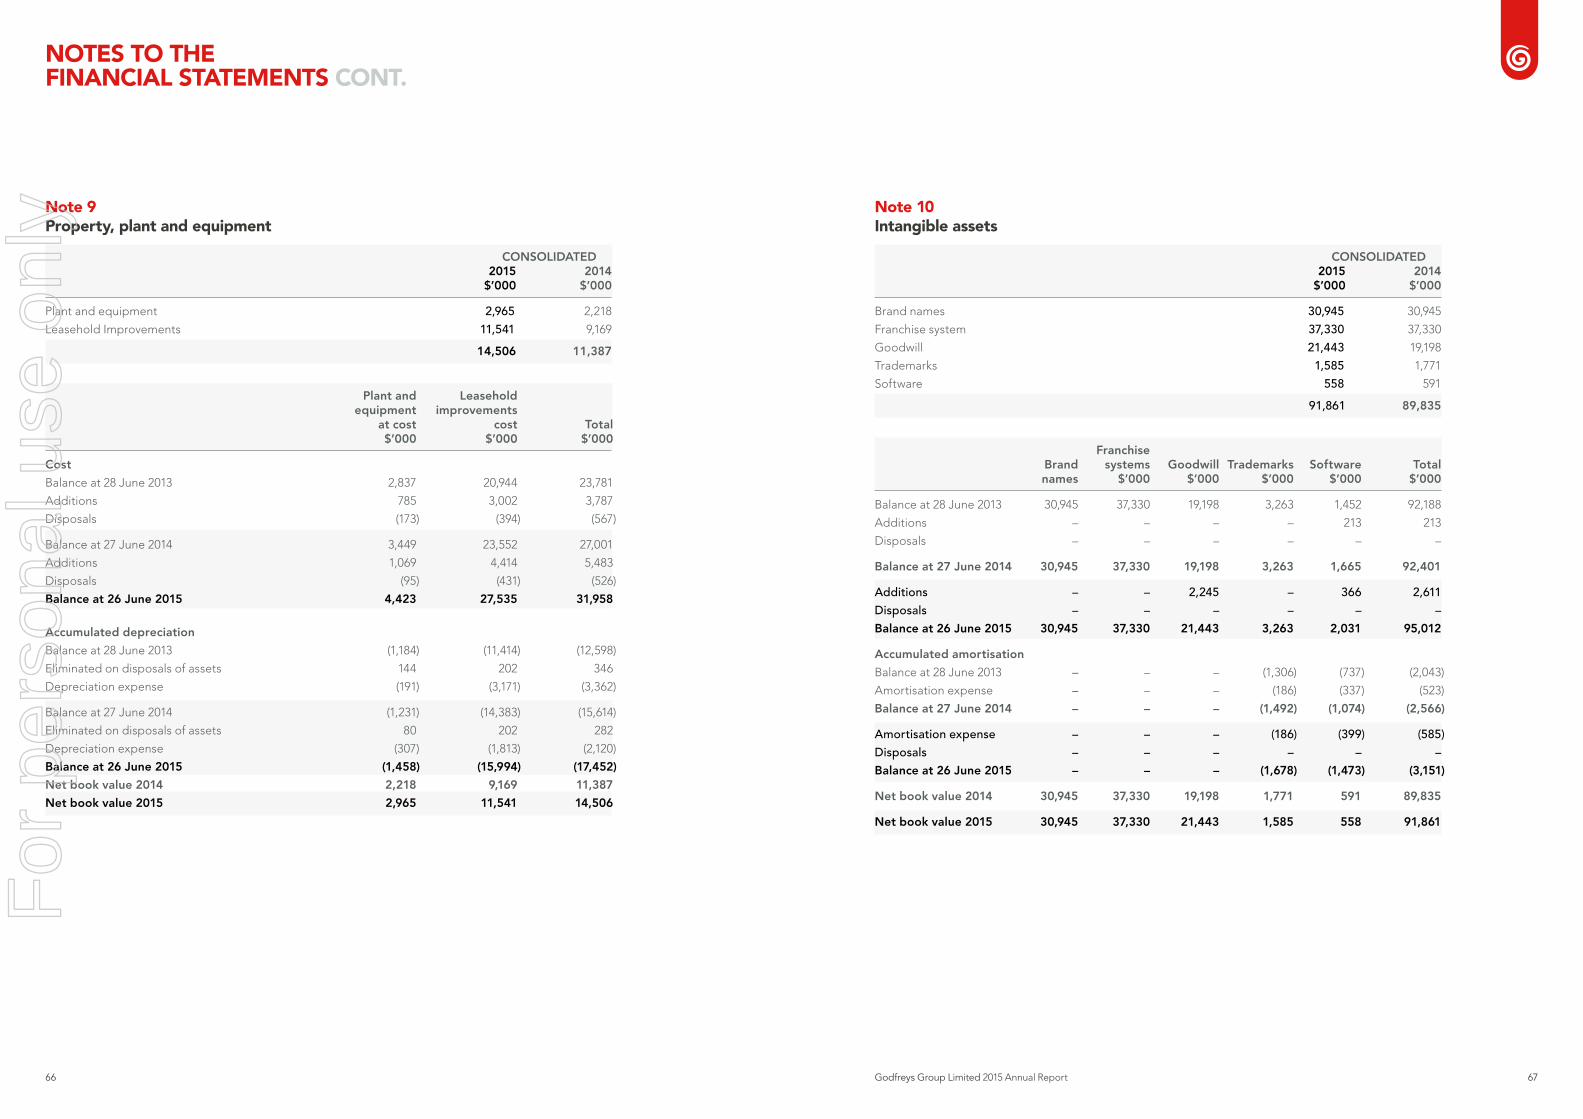
NOTES TO THE FINANCIAL STATEMENTS CONT.
Note 10Intangible assets
CONSOLIDATED 2015 2014 $’000 $’000
Brand names 30,945 30,945
Franchise system 37,330 37,330
Goodwill 21,443 19,198
Trademarks 1,585 1,771
Software 558 591
91,861 89,835
Franchise Brand systems Goodwill Trademarks Software Total names $’000 $’000 $’000 $’000 $’000
Balance at 28 June 2013 30,945 37,330 19,198 3,263 1,452 92,188
Additions – – – – 213 213
Disposals – – – – – –
Balance at 27 June 2014 30,945 37,330 19,198 3,263 1,665 92,401
Additions – – 2,245 – 366 2,611
Disposals – – – – – –
Balance at 26 June 2015 30,945 37,330 21,443 3,263 2,031 95,012
Accumulated amortisation
Balance at 28 June 2013 – – – (1,306) (737) (2,043)
Amortisation expense – – – (186) (337) (523)
Balance at 27 June 2014 – – – (1,492) (1,074) (2,566)
Amortisation expense – – – (186) (399) (585)
Disposals – – – – – –
Balance at 26 June 2015 – – – (1,678) (1,473) (3,151)
Net book value 2014 30,945 37,330 19,198 1,771 591 89,835
Net book value 2015 30,945 37,330 21,443 1,585 558 91,861
Note 9Property, plant and equipment
CONSOLIDATED 2015 2014 $’000 $’000
Plant and equipment 2,965 2,218
Leasehold Improvements 11,541 9,169
14,506 11,387
Plant and Leasehold equipment improvements at cost cost Total $’000 $’000 $’000
Cost
Balance at 28 June 2013 2,837 20,944 23,781
Additions 785 3,002 3,787
Disposals (173) (394) (567)
Balance at 27 June 2014 3,449 23,552 27,001
Additions 1,069 4,414 5,483
Disposals (95) (431) (526)
Balance at 26 June 2015 4,423 27,535 31,958
Accumulated depreciation
Balance at 28 June 2013 (1,184) (11,414) (12,598)
Eliminated on disposals of assets 144 202 346
Depreciation expense (191) (3,171) (3,362)
Balance at 27 June 2014 (1,231) (14,383) (15,614)
Eliminated on disposals of assets 80 202 282
Depreciation expense (307) (1,813) (2,120)
Balance at 26 June 2015 (1,458) (15,994) (17,452)
Net book value 2014 2,218 9,169 11,387
Net book value 2015 2,965 11,541 14,506
Godfreys Group Limited 2015 Annual Report 6766
For
per
sona
l use
onl
y

NOTES TO THE FINANCIAL STATEMENTS CONT.
Note 11Trade and other payables
CONSOLIDATED 2015 2014 $’000 $’000
Trade payables 16,794 10,320
Accruals 1,204 3,528
Goods and services tax payable 1,201 998
Deferred income 330 334
19,529 15,180
The average credit period on purchases of certain goods is 91 days.
Note 12Interest bearing loans and borrowings
CONSOLIDATED 2015 2014 $’000 $’000
Current borrowings:
Secured – at amortised cost
Loans – 5,987
Total current borrowings – 5,987
Non-current borrowings:
Unsecured – at amortised cost
Loans from previous related parties (note 24) – 19,410
– 19,410
Secured – at amortised cost
Loans 20,000 35,000
Total non-current borrowings 20,000 54,410
Secured Senior Finance FacilityThe Group entered into a Secured Senior Finance facility agreement on 16 June 2015 of $20 million which is fully drawn.
Secured Working capital facility:The Group entered into a revolving working capital facility agreement on 16 June 2015. The Lender has made available an aggregate amount of $10.5 million dollars to fund ongoing working capital and general corporate requirements. A portion of the new facility is utilised to provide letters of credit and guarantees. The facility is undrawn as at 26 June 2015.
Both facilities have a term of 3.5 years from 16 June 2015. The Lender has security over the assets of Godfreys Group Ltd and its subsidiaries.
Note 10Intangible assets cont.
Impairment testing
Goodwill and other indefinite life intangible assets are allocated to the following group of CGUs for impairment testing purposes:
2015 2014 $’000 $’000
Australia 86,879 83,110
New Zealand 2,839 4,363
89,718 87,473
The recoverable amounts of the Australian and New Zealand group of cash-generating units (‘CGUs’) are determined based on value in use calculations which use cash flow projections from financial forecast approved by the Board over a three year period. The cash flows beyond the forecast period have been extrapolated using a steady 2.5% long term growth rate (2014: 2.5%). Cash flows have been discounted using a post-tax discount rate of 10% and 10.5% for the Australian and New Zealand group of CGU’s respectively (2014: 10% and 10.5%)
The key assumptions used in the value in use calculations include sales growth, cost of doing business (CODB) efficiencies and the discount rate. The assumptions regarding sales growth and CODB efficiencies are based on past experience
and the Company’s forecast operating and financial performance for each group of CGUs. The discount rate is derived from the Group’s weighted average cost of capital, adjusted for varying risk profiles.
Management believes that any reasonably possible change in the key assumptions on which recoverable amount is based would not cause the aggregate carrying amount to exceed the aggregate recoverable amount of the group of CGUs.
Management also performed an assessment of impairment indicators for finite life intangible assets and property, plant and equipment. This involved and assessment of external and internal factors as prescribed by the accounting standards. No impairment indicators were identified.
Godfreys Group Limited 2015 Annual Report 6968
For
per
sona
l use
onl
y

NOTES TO THE FINANCIAL STATEMENTS CONT.
Note 15Provisions
2015 2014 $’000 $’000
Current Provisions
Lease incentives 384 410
Leasehold site restoration 1,016 833
Warranty and repairs 1,653 1,712
Total current provisions 3,053 2,955
Non-current Provisions
Lease incentives 3,110 827
Leasehold site restoration 1,795 1,511
Warranty and repairs 395 362
Total non-current provisions 5,300 2,700
Provision for lease incentivesThe provision for lease incentives relates to rent free periods provided by lessors pursuant to operating lease arrangements.
Provision for leasehold site restorationThe leasehold provision for site restoration represents the expected cost of restoring leased premises to their original condition as required by the respective operating lease agreements.
Warranties and repairsThe provision for warranties relates to vacuum cleaners and related products still under warranty. The provision is based on estimates made from historical warranty data associated with similar products and services and having regard to the impact of marketing new product lines. The Group expects to incur the liability over the next 1–7 years.
Note 13Other current financial liabilities
CONSOLIDATED 2015 2014 $’000 $’000
Derivatives that are designated and
effective as hedging instruments carried at fair value:
Forward foreign exchange contracts 121 1,264
121 1,264
Note 14Employee benefits
2015 2014 $’000 $’000
Current
Employee benefits 3,418 3,222
Non-current
Employee benefits 719 596
4,137 3,818
The provision for employee benefits represents annual leave and long service leave entitlements accrued and compensation claims made by employees.
Godfreys Group Limited 2015 Annual Report 7170
For
per
sona
l use
onl
y

NOTES TO THE FINANCIAL STATEMENTS CONT.
Note 17Reserves
2015 2014 $’000 $’000
Capital reconstruction reserve (43,613) –
Share options reserve 854 840
Cash flow hedge reserve 165 –
Foreign currency translation reserve (810) (719)
(43,404) 121
Capital reconstruction reserveThe equity structure in the consolidated financial statements, including the number and type of equity instruments issued at the date of the acquisition reflects the equity structure of Godfreys Group Limited. A capital reconstruction reserve is recognised to record the difference between the amount paid to acquire International Cleaning Solutions Group Pty Ltd and the share capital of International Cleaning Solutions Group Pty Ltd.
Share options reserveThe reserve is used to recognise the value of equity benefits provided to senior employees as part of their remuneration.
Cash flow hedge reserveThe reserve is used to recognise the effective portion of the gain or loss of cash flow hedge instruments that is determined to be an effective hedge.
Foreign currency translation reserveThe reserve is used to recognise exchange differences arising from translation of the financial statements of New Zealand branch operation to Australian dollars.
Note 16Issued capital
CONSOLIDATED 2015 2014 $’000 $’000
40,298,056 fully paid ordinary shares (27 June 2014: 28,000,000) 109,526 28,000
Movements in issued capital
2015 2014 Number Share capital Number of Share capital of shares $’000 shares $’000
Balance at beginning of the year 28,000,000 28,000 28,000,000 28,000
– Share options exercised 840,000 840 – –
– Share acquisition in ICSG at $2.75, net of transaction costs (16,790,881) (39,318) – –
– Fully paid ordinary shares at $2.75 issued on 10 December 2014 28,248,937 77,685 – –
– Capital reconstruction, net of transaction costs – 43,613 – –
40,298,056 110,820 28,000,000 28,000
– Transaction costs for issued share capital post tax – (1,294) – –
Balance at the end of the year 40,298,056 109,526 28,000,000 28,000
In accordance with capital reconstruction principles, issued capital recognised represents the equity of the legal subsidiary, International Cleaning Solutions Group Pty Ltd in the period before reconstruction. Subsequent to the capital reconstruction, issued capital represents the issued capital of the legal acquirer, Godfreys Group Limited.
An adjustment is recognised at the date of the capital reconstruction to adjust the value of issued capital corresponding to the issued capital of International Cleaning Solutions Group Pty Ltd.
Fully paid ordinary shares carry one vote per share and carry a right to dividends.
Godfreys Group Limited 2015 Annual Report 7372
For
per
sona
l use
onl
y

NOTES TO THE FINANCIAL STATEMENTS CONT.
Note 19Subsidiaries
Details of the Group’s’ subsidiaries at year-end are as follows.
Proportion of Place of ownership interest incorporation and voting powerName of subsidiary Note and operation held by the Group 2015 2014
Parent entity
Godfreys Group Limited (a) Australia 100% –
Subsidiaries
Electrical Home-Aids Pty Ltd (b) Australia 100% 100%
Godfreys Franchise System Pty Ltd Australia 100% 100%
Hoover Floorcare Asia Pacific Pty Ltd Australia 100% 100%
International Cleaning Solutions Pty Ltd (b) Australia 100% 100%
International Cleaning Solutions Group Pty Ltd (b) Australia 100% 100%
Australian Vacuum Cleaner Co. Pty Ltd (b) Australia 100% 100%
Godfreys Finance Company Pty Ltd (b) Australia 100% –
New Zealand Vacuum Cleaner Co Ltd New Zealand 100% 100%
(a) Godfreys Group Limited is the head entity within the Australian tax consolidated group.(b) Included in cross guarantee group (note 20)
Note 18Dividends on equity
CONSOLIDATED Year ended 26 June 2015 Year ended 27 June 2014 Cents Total Cents Total per share $’000 per share $’000
Recognised amounts
Final dividend 12.8 5,158 – –
Special dividend 2.6 1,048 – –
The Directors declared a final dividend of 12.8 cents per share, of which 3.8 cents is fully franked and 9.0 cents is unfranked.
The Directors also declared a special dividend of 2.6 cents per share in relation to the profit earned from IPO to 26 December 2014. The special dividend is unfranked.
Both of the dividends represent approximately a 80% payout of the Company’s Pro Forma net profit after tax. These dividends are to be paid on 9 October 2015 (2014: nil).
2015 2014 $’000 $’000
Franking credits available at Australian corporate tax rate of 30% 1,149,641 –
Note 20Cross guarantee group
The Godfreys Group Limited and the entities noted detailed in Note 19 formed a cross guarantee group on 19 May 2015 and therefore no movement in retained earnings and no comparative information is shown in respect to the cross guarantee group.
The consolidated income statement and consolidated statement of financial position of the entities party to the deed of cross guarantee are:
Year ended 26 June 2015Statement of comprehensive income $’000
Revenue 154,006
Cost of sales (58,076)
Other income 3,848
Other costs of sales (11,348)
Employee benefit expenses (33,652)
Marketing expense (12,110)
Selling and distribution expenses (1,635)
Occupancy expenses (15,166)
Share based payments (854)
Other expenses (6,111)
IPO transaction costs (5,017)
Earnings before interest, tax, depreciation and amortisation 13,885
Depreciation and amortisation expense (3,331)
Net finance costs (4,110)
Profit before tax expense 6,444
Income tax benefit 3,493
Profit for the year from continuing operations 9,937
Other comprehensive Income
Net gain/(loss) on cash flow hedges 165
Other comprehensive income for the year, net of tax 165
Total comprehensive Income for the year 10,102
Godfreys Group Limited 2015 Annual Report 7574
For
per
sona
l use
onl
y

NOTES TO THE FINANCIAL STATEMENTS CONT.
Note 20Cross guarantee group cont.
26 June 2015Statement of financial position $’000
Current assets
Cash and cash equivalents 13,023
Trade and other receivables 3,710
Other financial assets 534
Inventories 22,023
Current tax assets 74
Total current assets 39,364
Non-current assets
Trade and other receivables 1,204
Property, plant and equipment 13,068
Deferred tax assets 6,717
Investments 82
Intangible assets 91,631
Total non-current assets 112,702
Total assets 152,066
Current liabilities
Trade and other payables 18,400
Other financial liabilities 121
Provisions 2,728
Employee benefits 3,276
Total current liabilities 24,525
Non-current liabilities
Interest-bearing loans and borrowings 20,000
Related-parties loans 25,224
Provisions 4,898
Employee benefits 719
Total non-current liabilities 50,841
Total liabilities 75,366
Net assets 76,700
Equity
Issued capital 109,526
Reserves (42,594)
Retained earnings 9,768
Total equity 76,700
Note 21Financial instruments
Capital managementGodfreys Group Limited manages its capital to ensure that entities in the Group will be able to continue as going concerns while maximising the return to stakeholders through the optimisation of the debt and equity balance. The capital structure of the group consists of net debt, if any (borrowings offset by cash and bank balances) and equity of the Group (comprising issued capital, reserves, and retained earnings). Godfreys Group Limited is not subject to any externally imposed capital requirements. The Board reviews the capital structure of the Group on an annual basis.
CONSOLIDATED 2015 2014 $’000 $’000
Categories of financial instruments
Financial assets
Cash and bank balances 13,823 7,443
Derivative instruments in designated hedge accounting relationships 534 –
Trade and other receivables 5,184 5,789
Financial liabilities
Derivative instruments in designated hedge accounting relationships 121 –
Fair value through loss (FVTPL) – 1,264
Trade and other payables 17,998 13,848
Borrowings 20,000 60,397
Financial risk management objectivesThe Group’s treasury function provides services to the business, co-ordinates access to domestic and international financial markets, monitors and manages the financial risks relating to the operations of the Group. These risks include market risk (including currency risk and fair value interest rate risk), credit risk, liquidity risk and cash flow interest rate risk.
The Group seeks to minimise the effects of these risks by using derivative financial instruments to hedge risk exposures. The use of financial derivatives is governed by the group’s policies approved by the Board of Directors, which provide written principles on foreign exchange risk, interest rate risk, credit risk, the use of financial derivatives and non-derivative financial instruments, and the investment of excess liquidity. Compliance with policies and exposure limits is reviewed by management on a continuous basis. The Group does not enter into interest rate swap or trade financial instruments, including derivative financial instruments, for speculative purposes.
Market riskThe Group’s activities expose it primarily to the financial risks of changes in foreign currency exchange rates and interest rates. The Group enters into forward foreign exchange contracts to hedge the exchange rate risk arising on the purchase of inventory in USD and EUR to mitigate the risk of exchange rates movement.
Godfreys Group Limited 2015 Annual Report 7776
For
per
sona
l use
onl
y

NOTES TO THE FINANCIAL STATEMENTS CONT.
Note 21Financial instruments cont.
Liabilities Assets 2015 2014 2015 2014 $’000 $’000 $’000 $’000
US Dollars (USD) 34 1,063 430 27
Euro (EUR) 87 229 104 1
The following table details the forward foreign currency contracts outstanding at the end of the reporting period:
Average exchange rate Foreign currency Notional value Fair value 2015 2014 2015 2014 2015 2014 2015 2014Outstanding contracts (cents) (cents) $’000 $’000 $’000 $’000 $’000 $’000
Cash flow hedges
US$ (0 – 12 months) 77.73 89.19 24,000 21,700 30,874 24,331 396 (1,036)
Euro (0 – 12 months) 68.59 65.48 4,800 3,500 6,998 5,345 17 (228)
413 (1,264)
USD movement impact (+/-) 2015 2014 $’000 $’000
Profit or loss (i) 287 2,608
Equity (ii) 2,874 –
(i) This is mainly due to the exposure outstanding on USD receivables and payables at the end of the reporting period
(ii) This is mainly due to changes in the fair value of derivative instruments designated as hedging instruments in cash flow hedges. Nil equity impact in FY2014 as the Company adopted hedge accounting policy from 28 June 2014.
In management’s opinion, the sensitivity analysis is unrepresentative of the inherent foreign exchange risk because the exposure at the end of the reporting period does not reflect the exposure during the year. USD denominated purchases is seasonal. In addition, the impact of fluctuations in exchange rates can to some extent be recouped from suppliers and or passed through to customers.
Foreign currency sensitivity analysisAs shown in the table above the Group is mainly exposed to the currency of US Dollars (‘USD’). The following table details the Group’s sensitivity to a 10% increase and decrease in the Australian dollar against the USD at spot rate of the end of the reporting period. 10% represents management’s assessment of the reasonably possible change in foreign exchange rates. The sensitivity analysis includes only outstanding foreign currency denominated monetary items and adjusts their translation at the year-end for a 10% change in foreign currency rates. A positive number on the right column’s table indicates an increase in profit or equity where the Australian dollar strengthens 10% against the relevant currency. For a 10% weakening of the Australian dollar against the relevant currency, there would be a comparable impact on the profit or equity, and the balances on the right column’s table would be negative.
Interest rate risk managementDuring the year, the Group is exposed to interest rate risk because entities in the Group borrow funds at both fixed and floating interest rates. The risk is managed by the group by maintaining an appropriate mix between fixed and floating rate borrowings. Hedging activities are evaluated regularly to align with interest rate views and defined risk appetite, ensuring the most cost-effective hedging strategies are applied. The Group’s exposure to interest rates on financial assets and financial liabilities are detailed in the liquidity risk management section of this note.
Interest rate sensitivity analysisThe sensitivity analyses below have been determined based on the exposure to interest rates for both derivatives and non-derivative instruments at the end of the reporting period. For floating rate liabilities, the analysis is prepared assuming the amount of the liability outstanding at the end of the reporting period was outstanding for the whole year. If interest rates had been 50 basis points higher/lower and all other variables were held constant, the Group’s profit for the year ended 26 June 2015 would decrease/increase by $0.1 million (2014: decrease/increase by $0.2 million). This is mainly attributable to the Group’s exposure to interest rates on its variable rate borrowings.
Credit risk managementCredit risk refers to the risk that counterparty will default on its contractual obligations resulting in financial loss to Godfreys Group Limited. The group has adopted a policy of only dealing with creditworthy counterparties and obtaining sufficient collateral, where appropriate, as a means of mitigating the risk of financial loss from defaults. This information is supplied by independent rating agencies where available and, if not available, the Group uses other publicly available financial information and its own trading records to rate its major customers. The Group’s exposure and the credit ratings of its counterparties are continuously monitored and the aggregate value of transactions concluded is spread amongst approved counterparties. Credit exposure is controlled by counterparty limits that are reviewed and approved by Management annually.
Concentration of credit risk related to the Group largest customer did not exceed 5% of gross monetary assets at any time during the year. Concentration of credit risk to any other counterparty did not exceed 1% of gross monetary assets at any time during the year.
The credit risk on liquid funds and derivative financial instruments is limited because the counterparties are banks with high credit-ratings assigned by international credit-rating agencies.
Collateral held as security and other credit exposuresGodfreys Group Limited does not hold any collateral or other credit enhancements to cover its credit risks associated with its financial assets.
Liquidity risk managementUltimate responsibility for liquidity risk management rests with the Board of Directors, which has established an appropriate liquidity risk management framework for the management of the Group’s short-, medium- and long-term funding and liquidity management requirements. The Group manages liquidity risk by maintaining adequate reserves, banking facilities and reserve borrowing facilities, by continuously monitoring forecast and actual cash flows, and by matching the maturity profiles of financial assets and liabilities. The finance facility note below sets out details of additional undrawn facilities that the Group has at its disposal to further reduce liquidity risk.
Liquidity and interest risk tablesThe following tables detail the group’s remaining contractual maturity for its non-derivative financial liabilities with agreed repayment periods. The tables have been drawn up based on the undiscounted cash flows of financial liabilities based on the earliest date on which the group can be required to pay. The tables include both interest and principal cash flows. To the extent that interest flows are at floating rate, the undiscounted amount is derived from interest rate curves at the end of the reporting period. The contractual maturity is based on the earliest date on which the group may be required to pay. The table on page 80 also details the group’s expected maturity for its non-derivative financial assets based on the undiscounted contractual maturities of the financial assets including interest that will be earned on those assets. The inclusion of information on non-derivative financial assets is necessary in order to understand the group’s liquidity risk management as the liquidity is managed on a net asset and liability basis.
Godfreys Group Limited 2015 Annual Report 7978
For
per
sona
l use
onl
y

NOTES TO THE FINANCIAL STATEMENTS CONT.
Note 21Financial instruments cont.
Weighted average effective Less 3 interest than 1–3 months 1–5 rate 1 month months to 1 year years 5+ years Total % $’000 $’000 $’000 $’000 $’000 $’000
26 June 2015
Financial assets
Cash at bank (variable) 1.7% 13,823 – – – – 13,823
Financial liabilities
Senior debt (variable) 3.5% – – – 20,000 – 20,000
27 June 2014
Financial assets
Cash at bank (variable) 2.3% 7,443 – – – – 7,443
Financial liabilities
Loan & debt (variable) 5.4% – – – 40,987 – 40,987
Loan & debt (fixed) 15% – – – 19,410 – 19,410
The amounts included above for variable interest rate instruments for both non-derivative financial assets and liabilities is subject to change if changes in variable interest rates differ to those estimates of interest rates determined at the end of the reporting period.
The Group has access to financing facilities as described below, of which $10.5 million were unused at the end of the reporting period (2014: $7.8 million). The Group expects to meet its other obligations from operating cash flows and proceeds of maturing financial assets.
The following table details the Group’s liquidity analysis for its derivative financial instruments. The table has been drawn up based on the undiscounted contractual net cash inflows and outflows on derivative instruments that settle on a net basis and the undiscounted gross inflows and outflows on those derivatives that require gross settlement. When the amount payable or receivable is not fixed, the amount disclosed has been determined by reference to the projected interest rates as illustrated by the yield curves at the end of the reporting period.
Less than 1–3 months 1 month months to 1 year $’000 $’000 $’000
26 June 2015
Gross settled – foreign exchange forward contracts 3,060 9,330 25,482
27 June 2014
Gross settled – foreign exchange forward contracts 2,880 8,548 18,249
2015 2014Finance facilities $’000 $’000
Secured working capital facility: (i)
– amount unused 10,500 7,800
10,500 7,800
Secured bank loan facility (i)
– amount used 20,000 40,000
20,000 40,000
Shareholder loan facility
– amount used – 19,410
– 19,410
(i) Secured by a first ranking fixed and floating charge over the assets and undertakings of Group.
Fair value of financial instrumentsThis note provides information about how the group determines fair values of various financial assets and financial liabilities.
The Directors consider that the carrying amounts of financial assets and financial liabilities recognised in the consolidated financial statements approximate their fair values.
The fair value of foreign exchange forward contracts is determined using a Level 2 fair value hierarchy method, being a discounted cash flow method. Future cash flows are estimated based on forward exchange rates (from observable forward exchange rates at the end of the reporting period) and contract forward rates, discounted at a rate that reflects the credit risk of various counterparties.
The fair value of interest rate swaps is determined using a Level 2 fair value hierarchy method, being a discounted cash flow method. Future cash flows are estimated based on forward interest rates from observable yield curves at the end of the reporting period) and contract interest rates, discounted at a rate that reflects the credit risk of various counterparties.
Godfreys Group Limited 2015 Annual Report 8180
For
per
sona
l use
onl
y

NOTES TO THE FINANCIAL STATEMENTS CONT.
Note 22Shared-based payments
The Company has not previously had in place a long term incentive plan. In anticipation of the IPO the Board established a long term incentive plan. The LTIP was approved by the Board and implemented on 10 December 2014. Awards under the LTIP scheme are issued annually based on a 3 year performance period. 100% of the available LTIP awards are based on a total shareholder return (‘TSR’) performance hurdle relative to the S&P/ASX 300 Consumer Discretionary Index over the 3-year performance period (‘TSR Options’). Options vest over a 3 year period based on the achievement of total shareholder return, provided that the eligible recipient is employed by the Company on that date.
There has been no alteration of the terms and conditions of the above share-based payment arrangements since the grant date.
Fair value of share options granted in the yearThe weighted average fair value of the share options granted during the financial year is $1.41. Options were priced using the Black Scholes option pricing model. Where relevant, the expected life used in the model has been adjusted based on management’s best estimate for the effects of non-transferability, exercise restrictions (including the probability of meeting market conditions attached to the option), and behavioural considerations. Expected volatility is based on projected volatility incorporating historical average 4 year volatility for S&P/ASX300 CS&CD.
Performance rightsInputs into the model 2015
Grant date (10 December 2014) share price $2.75
Exercise price $2.75
Expected volatility 35%
Option life 3 years
Expiry date 30 June 2017
Dividend yield 7.5%
Risk-free interest rate 2.25%
Fair value at grant date $1.41
Movements in share options during the yearThe following reconciles the share options outstanding at the beginning and end of the year.
2015 Weighted average Number exercise price of options $
Balance at beginning of year – –
Granted during the year 924,894 –
Forfeited during the year – –
Exercised during the year – –
Expired during the year – –
Balance at end of year 924,894 –
Exercisable at end of year – –
Share options exercised during the yearThere were nil share options exercised during the year (2014: nil)
There were nil vested share options outstanding at the end of the year (2014: nil)
Note 23Key management personnel compensation
The aggregate compensation made to directors and other members of key management personnel of the Company and the Group is set out below:
Year ended Year ended 26 June 2015 27 June 2014 $ $
Short-term employee benefits 4,367,001 2,189,184
Post-employment benefits 111,404 55,022
Other long-term benefits 28,303 38,346
Share-based payment 853,576 –
5,360,284 2,282,552
Note 24Related party transactions
Balances and transactions between the Company and its subsidiaries, which are related parties of the Company, have been eliminated on consolidation and are not disclosed in this note. Details of transactions between the Group and other related parties are disclosed below.
2015 2014Loans from related parties $ $
Nomura International plc – 3,420,873
Investec Bank (Australia) Limited – 2,911,448
Arcade Finance Pty Ltd – 12,508,785
Loto Investments Pty Ltd – 388,193
Oakwork Pty Ltd – 180,355
– 19,409,654
The loans from the shareholders of International Cleaning Solution Group Pty. Ltd. as disclosed above were repaid upon IPO on 10 December 2014.
Other related parties transactionThe Group leases 14 store sites on arm’s length terms from entities controlled by John Johnston, who controls Arcade Finance Pty Ltd which is currently a significant shareholder of the Company.
Entities related to Tom Krulis’ family also have interests in some of these 14 store sites. All 14 lease agreements have been entered into on arm’s length terms.
The annual remuneration package of each member of the executive team is comprised of a base salary, a cash based short-term incentive plan (STIP) and participation in a long-term incentive plan (LTIP). The STIP gives participants the opportunity to earn a cash bonus based on satisfaction of certain hurdles and key performance indicators based on the Company’s performance and the individual’s contribution. The LTIP is governed by the LTIP Rules which are discussed in the Prospectus.
Godfreys Group Limited 2015 Annual Report 8382
For
per
sona
l use
onl
y

NOTES TO THE FINANCIAL STATEMENTS CONT.
Note 25Cash and cash equivalents
For the purposes of the consolidated statement of cash flows, cash and cash equivalents include cash on hand and in banks, net of outstanding bank overdrafts. Cash and cash equivalents at the end of the reporting period as shown in the consolidated statement of cash flows can be reconciled to the related items in the consolidated statement of financial position as follows:
Reconciliation of profit for the year to net cash flows from operating activities
CONSOLIDATED Year ended Year ended 26 June 2015 27 June 2014 $’000 $’000
Cash flows from operating activities
Profit for the year 12,044 5,729
Depreciation and amortisation 3,665 3,477
Share based payment expense 854 –
Offer costs expensed 5,909 –
Net finance costs 4,088 7,901
Other non-cash movement 720 (10)
(Increase)/decrease in assets:
Trade and other receivables 603 155
Deferred tax assets (4,431) 2,762
Inventory 1,322 2,773
Increase/(decrease) in liabilities:
Trade and other payables (1,215) 794
Provisions 3,225 1,475
Current tax liability 393 (626)
Net cash generated by operating activities 27,177 24,430
Note 26Net operating lease arrangements
Net operating lease commitmentsOperating leases relate to leases of retail premises, office space and office equipment with lease terms of between 1 to 10 years. All retail store operating lease contracts contain clauses for market rental reviews.
CONSOLIDATED Year ended Year ended 26 June 2015 27 June 2014 $’000 $’000
The Group as lessee
Non-cancellable operating lease commitments
Not later than 1 year 16,866 17,259
Later than 1 year and not later than 5 years 25,605 24,701
Later than 5 years 5,915 774
48,386 42,734
The Group as lessor
Non-cancellable operating lease receivables
Not later than 1 year (5,026) (5,409)
Later than 1 year and not later than 5 years (7,488) (8,678)
Later than 5 years (625) (500)
(13,139) (14,587)
Net operating lease commitments
Not later than 1 year 11,839 11,850
Later than 1 year and not later than 5 years 18,117 16,023
Later than 5 years 5,290 274
35,246 28,147
Lease incentives (note 15)
Current 384 377
Non-current 3,110 827
3,494 1,204
Godfreys Group Limited 2015 Annual Report 8584
For
per
sona
l use
onl
y

NOTES TO THE FINANCIAL STATEMENTS CONT.
Note 27Contingent liabilities
The Group has provided bank guarantees in respect to retail premises operating leases and a distribution centre lease of $2.0 million.
Note 28Remuneration of auditors
Year ended Year ended 26 June 2015 27 June 2014 $ $
Audit or review of the financial statements 280,000 140,000
Other non-audit services 20,597 –
Taxation compliance services 40,000 35,000
Accounting and tax in connection with IPO 899,676 –
1,240,273 175,000
The auditor of Godfreys Group Limited is Deloitte Touche Tohmatsu.
Note 29 Parent entity information
Godfreys Group Limited was incorporated on 6 November 2014. The accounting policies of the parent entity, which have been applied in determining the financial information shown below, are the same as those applied in the consolidated financial statements. Refer to note 1 for a summary of the significant accounting policies relating to the Group.
CONSOLIDATED Year ended 26 June 2015Financial position $’000
Assets
Deferred tax assets 6,972
Investments 109,526
Total assets 116,498
Liabilities
Current tax liabilities 233
Other liabilities 6,751
Total liabilities 6,984
Net assets 109,514
Equity
Issued capital 109,526
Retained earnings (12)
Total equity 109,514
Godfreys Group Limited is the ultimate parent entity for the period 10 December 2014 to 26 June 2015.
Godfreys Group Limited 2015 Annual Report 8786
For
per
sona
l use
onl
y

NOTES TO THE FINANCIAL STATEMENTS CONT.
Note 30Business combinations
During the financial year the Group acquired Godfreys franchise stores.
The assets and liabilities recognised as a result of the acquisition are as follows:
Year ended Year ended 26 June 2015 27 June 2014 $’000 $’000
Inventory 179 195
Net identifiable assets acquired 179 195
Goodwill 2,245 815
Purchase consideration 2,424 1,010
Impact of acquisitions on the results of the GroupIncluded in the result for the year is a profit for the period of $0.6 million attributable to the above acquisitions. Had these business combinations been effected at 1 July 2014, the revenue of the consolidated entity would have been approximately $4.5 million higher and the net profit would have been approximately $1.1 million higher for the year ended 26 June 2015.
Note 31Subsequent events
There has not been any matter or circumstance that has arisen since the end of the financial year, that has significantly affected, or may significantly affect, the operations of the consolidated entity, the results of those operations, or the state of affairs of the consolidated entity in future financial periods.
In accordance with ASX Listing Rule 4.10, the Company provides the following information to shareholders not elsewhere disclosed in this Annual Report. The information provided is current as at 30 July 2015 (Reporting Date).
1. Corporate GovernanceThe Company’s Directors and management are committed to conducting the Group’s business in an ethical manner and in accordance with the highest standards of corporate governance. The Company has adopted and substantially complies with the ASX Corporate Governance Principles and Recommendations (Third Edition) (Recommendations) to the extent appropriate to the size and nature of the Group’s operations.
The Company has prepared a statement which sets out the corporate governance practices that were in operation throughout the financial year for the Company, identifies any Recommendations that have not been followed, and provides reasons for not following such Recommendations (Corporate Governance Statement).
In accordance with ASX Listing Rules 4.10.3 and 4.7.4, the Corporate Governance Statement will be available for review on the Company’s website (www.godfreys.com.au), and will be lodged together with an Appendix 4G with ASX at the same time that this Annual Report is lodged with ASX.
The Appendix 4G will particularise each Recommendation that needs to be reported against by Godfreys, and will provide shareholders with information as to where relevant governance disclosures can be found.
The Company’s corporate governance policies and charters are all available on its website (www.godfreys.com.au).
2. Distribution and number of shareholders of equity securitiesThe distribution and number of holders of equity securities on issue in the Company as at the Reporting Date, and the number of holders holding less than a marketable parcel of the Company’s ordinary shares, based on the closing market price as at the Reporting Date is as follows:
Number of holders of equity securities
Ordinary share capital40,298,056 fully paid ordinary shares are held by 706 individual shareholders.
All issued ordinary shares carry one vote per share and the rights to dividends.
Distribution of holders of equity securities
Fully paid ordinary shares Options
1 – 1,000 117,338
1,001 – 5,000 639,847
5,001 – 10,000 930,892
10,001 – 100,000 2,173,678
100,001 and over 36,436,301 924,894
40,298,056 924,894
Holding less than a marketable parcel – –
ADDITIONAL SECURITIES EXCHANGE INFORMATION AS AT 30 JULY 2015
Godfreys Group Limited 2015 Annual Report 8988
For
per
sona
l use
onl
y

5. Voting rightsThe voting rights attaching to each class of equity securities are set out below:
6. Ordinary sharesAt a general meeting of Godfreys, every holder of ordinary shares present in person or by proxy, attorney or representative has one vote on a show of hands and on a poll, one vote for each ordinary share held.
7. OptionsOptions rights do not carry any voting rights.
8. Unquoted equity securities924,894 unlisted options over ordinary shares in the Company have been granted to 5 persons. There are no persons who hold 20% or more of options that were not issued or acquired under an employee incentive scheme.
9. Voluntary escrowThe number and class of restricted securities or securities subject to voluntary escrow that are on issue, and the date that the escrow period ends, are as follows:
Class of restricted Type of Number of Escrow securities restriction securities period
Ordinary shares Voluntary escrow 2,884,000 From 10 December 2014 to the date that is three (3) days after the Company has lodged its preliminary full year report (Appendix 4E) with ASX for the financial year ending 26 June 2015.
ADDITIONAL SECURITIES EXCHANGE INFORMATION AS AT 30 JULY 2015 CONT.
CORPORATE DIRECTORY
3. Substantial shareholdersAs at the Reporting Date, the names of the substantial holders of the Company and the number of equity securities in which those substantial holders and their associates have a relevant interest, as disclosed in substantial holding notices given to the Company, are as follows:
Fully paid ordinary shares Ordinary shareholders Number
ARCADE FINANCE PTY LTD 8,144,119
NATIONAL NOMINEES LIMITED 6,298,322
HSBC CUSTODY NOMINEES (AUSTRALIA) LIMITED 5,468,007
LOTO INVESTMENTS PTY LTD 3,080,000
CITICORP NOMINEES PTY LIMITED 2,980,056
RBC INVESTOR SERVICES AUSTRALIA NOMINEES PTY LIMITED 2,720,530
28,691,034
4. Twenty largest holders of quoted equity securitiesThe Company only has one class of quoted securities, being ordinary shares. The names of the 20 largest holders of ordinary shares, the number of ordinary shares and the percentage of capital held by each holder is as follows:
Fully paid ordinary shares Number Percentage
ARCADE FINANCE PTY LTD 8,144,119 20.21%
NATIONAL NOMINEES LIMITED 6,298,322 15.63%
HSBC CUSTODY NOMINEES (AUSTRALIA) LIMITED 5,468,007 13.57%
LOTO INVESTMENTS PTY LTD 3,080,000 7.64%
CITICORP NOMINEES PTY LIMITED 2,980,056 7.40%
RBC INVESTOR SERVICES AUSTRALIA NOMINEES PTY LIMITED 2,720,530 6.75%
J P MORGAN NOMINEES AUSTRALIA LIMITED 1,989,018 4.94%
RBC INVESTOR SERVICES AUSTRALIA NOMINEES PTY LIMITED 1,400,314 3.47%
BRISPOT NOMINEES PTY LTD 1,133,212 2.81%
NETWEALTH INVESTMENTS LIMITED 818,967 2.03%
BNP PARIBAS NOMS PTY LTD 558,892 1.39%
OAKWORK PTY LIMITED 545,000 1.35%
SNOJ INVESTMENTS PTY LIMITED 280,000 0.69%
RBC INVESTOR SERVICES AUSTRALIA NOMINEES PTY LIMITED 269,980 0.67%
MORMARL NO 2 PTY LTD 158,400 0.39%
MR GARY RICHARD BAIGENT 144,000 0.36%
NETWEALTH INVESTMENTS LIMITED 124,258 0.31%
CS FOURTH NOMINEES PTY LTD 109,136 0.27%
BECJOHN PTY LIMITED 109,090 0.27%
SAM ROBERT FLETCHER 105,000 0.26%
36,436,301 90.42%
Registered office and principal place of businessBuilding 2, Level 1530 Springvale RoadGlen Waverley VIC 3150Tel (03) 8542 2110
DirectorsMr. R. WalkerMr. T. KrulisMr. J BrettMr. B. FleiterMs. S. Morphet
Company secretaryMs. S. Karzis
AuditorsDeloitte Touche Tohmatsu550 Bourke StreetMelbourne VIC 3000Tel: (03) 9671 7000
BankersCommonwealth Bank of AustraliaLevel 20, Tower 1 Collins Street,727 Collins Street, Melbourne VIC 3000
Share registryLink Market Services LimitedLevel 12, 680 George StreetSydney NSW 2000Tel: (02) 8280 7100
Australian Legal AdvisorClayton UtzLevel 18, 333 Collins StreetMelbourne VIC 3000Tel: (03) 9286 6000
Godfreys Group Limited is listed on the Australian Securities Exchange (‘ASX’) under ASX code ‘GFY’.
Godfreys Group Limited 2015 Annual Report 9190
For
per
sona
l use
onl
y

GODFREYS STORE LOCATOR
Godfreys AustraliaVICAirport WestAlburyAscot ValeBallaratBendigoCamberwellCampbellfieldCaulfieldClaytonCranbourneDandenongDoncasterEppingEssendon AirportFootscrayFountain GateFrankston IIGeelongGreensboroughHighpointHoppers CrossingKnox CityLilydaleMeltonMilduraMorningtonNunawadingPakenhamParkdalePort MelbounePrahranPrestonRichmondRingwoodSheppartonSouthlandSunburySunshineTaylors LakesTraralgonWangarattaWarrnamboolWaurn PondsBelconnenFyshwickTuggeranong
NSWAuburnBankstownBay VillageBelroseBlacktown
Blacktown SSBondi JunctionBurwoodCampbelltown SSCampbelltownCamperdownCastle Hill SSChatswoodCoffs HarbourCrossRoadsDee WhyDubboErinaFairy MeadowsGlendaleHornsbyHurstvilleKotaraLake HavenLismoreLiverpoolMaitlandMirandaMittagongMoore ParkMt DruittMt HuttonNewcastleNorth RydeNowraPagewoodParramattaPenrith SSPenrithPort MacquariePunchbowlRouse HillShellharbourTamworthTuggerahWagga WaggaWarringah
WAAlbanyBalcattaBelmontBooragoonBunburyBusseltonCanning ValeCanningtonClaremontClarksonEdgewaterEllenbrookFloreat
GeraldtonKelmscottMandurahMidlandMorleyO’ConnorOsborne ParkRockinghamSuccessWhitford City
SAChurchillElizabethFirleGawlerGepps CrossHiltonMarionMorphettvaleMt BarkerMt GambierNailsworthNoarlungaPort Rd/CroydonRidgehavenSalisburySt MarysTea Tree PlazaUnleyVictor Harbour
QLDBrooksideBrowns PlainsBundabergBundallBurleigh HeadsCairnsCapalabaCarindaleChermsideDarwinFortitude ValleyGarden CityGladstoneHelensvaleHervey BayIndooroopillyIpswichKawana WatersKippa RingLoganholmeMackayMaroochydoreMorayfieldMt Gravatt
Mt OmmaneyNewmarketNoosavilleNth LakesRobinaRockhamptonRunaway BaySpringfieldStrathpineToombulToowoombaTownsvilleTweed HeadsUnderwood
TASBurnieCambridgeDerwent ParkDevonportHobartKingstonLaunceston
Godfreys New ZealandNZAlbanyBotany TownChristchurchCoastlandsDunedinGisborneHamilton CentralHamilton The BaseHastingsInvercargillLower HutManakauMount WellingtonNapierNelsonNew LynnNew PlymouthNorthwoodOnehungaPalmerston NorthPoriruaPukekoheRotoruaTakaniniTaurangaWairau ParkWaitakereWellington AirportWhangarei
Des
ign
Ext
rab
lack
92
For
per
sona
l use
onl
y

godfreys.com.au© 2015 Godfreys. ABN 35 602 722 985
For
per
sona
l use
onl
y