2015 annual wastewater treatment system summary … · 2015 annual wastewater treatment system ......
TRANSCRIPT
2015 ANNUAL WASTEWATER TREATMENT SYSTEM SUMMARY REPORT
Drumbo Wastewater Treatment Plant
1. General Information Oxford County prepares individual annual reports summarizing each wastewater treatment plant’s operation and treated effluent discharge quality for the nine wastewater treatment plants it owns and operates. The reports detail the latest quality testing results and quantity statistics and any non-compliance conditions that may have occurred. They are available for review by the end of February on the internet at www.oxfordcounty.ca/Services-for-You/Water-Wastewater/Wastewater/Annual-reports or by contacting the Public Works Department. All efforts have been made to ensure the information presented in this report is as accurate as possible. If you have any questions or comments concerning the report, please contact the County of Oxford at the address and phone number listed below or by email at [email protected]. Wastewater Treatment Plant: Drumbo Wastewater Treatment Plant Wastewater Treatment Plant Number: 120002479
Wastewater Treatment Plant Owner & Contact Information:
Oxford County Public Works Department Wastewater Services P.O. Box 1614, 21 Reeve Street Woodstock, ON N4S 7Y3 Telephone: 519-539-9800 | Toll Free: 866-537-7778
Reporting Period: January 1, 2015 – December 31, 2015 1.1. System Description The Drumbo Sequencing Batch Reactor (SBR) provided effective wastewater treatment in 2015 with an average plant flow of 234 m3/d, which represents 78% of the design capacity of 300 m3/d. The total flow in 2015 was 85,259 m3. The Drumbo WWTP rated capacity was increased from 272 m3/d to 300 m3/d as reflected in the amended Environmental Compliance Approval (ECA) issued by MOECC in February 2015. The wastewater treatment plant is located at 93 Peterson Street, Drumbo, Ontario. The Facility description is provided below.
Facility Drumbo Wastewater Treatment Plant
Design Capacity 300 m3/d (re-rated Feb. 2015)
2015 Average Daily Flow 234 m3/d
2015 Maximum Daily Flow 587 m3/d
2015 Total Volume of Wastewater 85,259 m3/year
Classification WWT – II
Environmental Compliance Approval (ECA) #8752-9Q4H96 (Feb 9, 2015)
Drumbo Wastewater Treatment Plant | D1
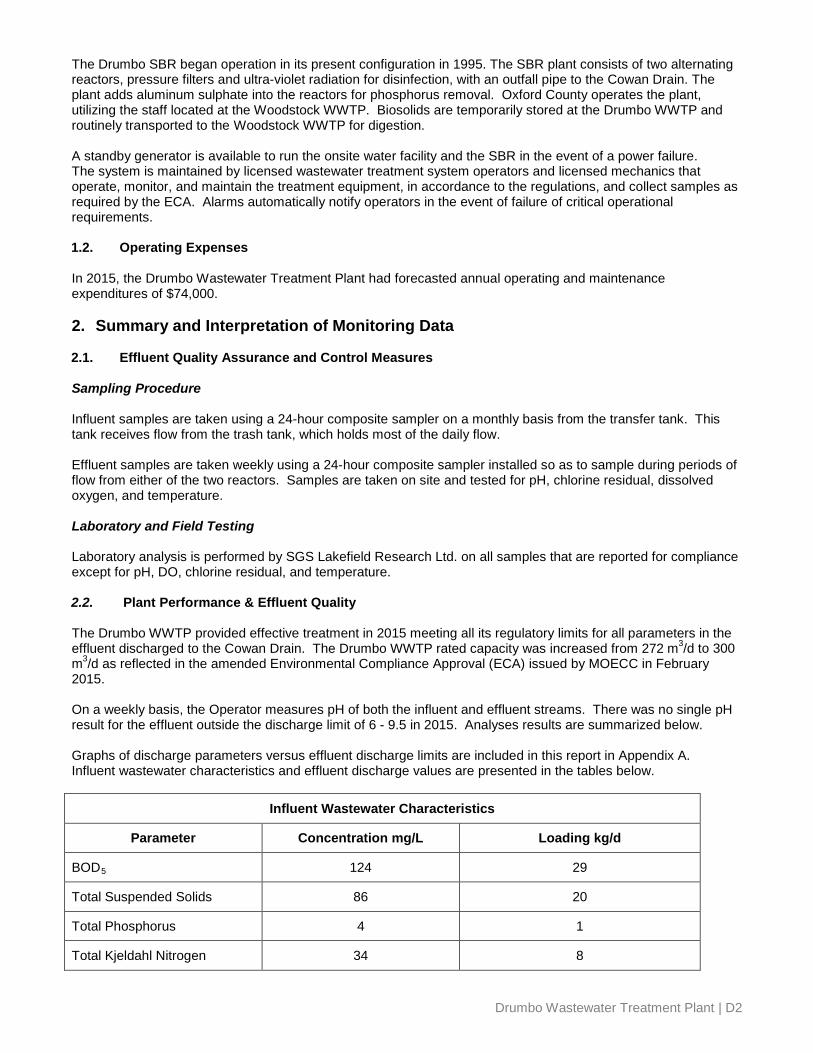
The Drumbo SBR began operation in its present configuration in 1995. The SBR plant consists of two alternating reactors, pressure filters and ultra-violet radiation for disinfection, with an outfall pipe to the Cowan Drain. The plant adds aluminum sulphate into the reactors for phosphorus removal. Oxford County operates the plant, utilizing the staff located at the Woodstock WWTP. Biosolids are temporarily stored at the Drumbo WWTP and routinely transported to the Woodstock WWTP for digestion. A standby generator is available to run the onsite water facility and the SBR in the event of a power failure. The system is maintained by licensed wastewater treatment system operators and licensed mechanics that operate, monitor, and maintain the treatment equipment, in accordance to the regulations, and collect samples as required by the ECA. Alarms automatically notify operators in the event of failure of critical operational requirements. 1.2. Operating Expenses In 2015, the Drumbo Wastewater Treatment Plant had forecasted annual operating and maintenance expenditures of $74,000. 2. Summary and Interpretation of Monitoring Data 2.1. Effluent Quality Assurance and Control Measures Sampling Procedure Influent samples are taken using a 24-hour composite sampler on a monthly basis from the transfer tank. This tank receives flow from the trash tank, which holds most of the daily flow. Effluent samples are taken weekly using a 24-hour composite sampler installed so as to sample during periods of flow from either of the two reactors. Samples are taken on site and tested for pH, chlorine residual, dissolved oxygen, and temperature. Laboratory and Field Testing Laboratory analysis is performed by SGS Lakefield Research Ltd. on all samples that are reported for compliance except for pH, DO, chlorine residual, and temperature. 2.2. Plant Performance & Effluent Quality The Drumbo WWTP provided effective treatment in 2015 meeting all its regulatory limits for all parameters in the effluent discharged to the Cowan Drain. The Drumbo WWTP rated capacity was increased from 272 m3/d to 300 m3/d as reflected in the amended Environmental Compliance Approval (ECA) issued by MOECC in February 2015. On a weekly basis, the Operator measures pH of both the influent and effluent streams. There was no single pH result for the effluent outside the discharge limit of 6 - 9.5 in 2015. Analyses results are summarized below. Graphs of discharge parameters versus effluent discharge limits are included in this report in Appendix A. Influent wastewater characteristics and effluent discharge values are presented in the tables below.
Influent Wastewater Characteristics
Parameter Concentration mg/L Loading kg/d
BOD5 124 29
Total Suspended Solids 86 20
Total Phosphorus 4 1
Total Kjeldahl Nitrogen 34 8
Drumbo Wastewater Treatment Plant | D2

Effluent Parameter
Sample Frequency
ECA Effluent Limit (Monthly Average) (milligram per liter unless
otherwise indicated)
Monthly Average Result Min-Max
(milligram per liter unless otherwise
indicated) Percentage
Removal CBOD5 (May 01 to November 30)
weekly 9.3 2 - 3.5 96.8 - 98.2
Total Suspended Solids weekly 9.3 3.2 - 7.2 91.6 - 96.3
Total Phosphorus weekly 0.46 0.2 - 0.3 92.5 - 95
Total Ammonia Nitrogen (May 1 to October 31)
weekly 2.7 1.3 - 2.6 --
Total Ammonia Nitrogen (Nov. 1 to April 30)
weekly 4.5 0.7 - 2.9 --
E.coli (May 1 to October 31) weekly
200 organisms/100 mL (monthly Geometric Mean
Density) 2 - 9 --
DO weekly 5.0 or higher 6.3 - 9.5 --
pH any single sample weekly 6.0 - 9.5 6.8 - 8.3 --
2.3. Effluent Objectives Objectives are non-enforceable effluent quality values which the owner is obligated to use best efforts to strive towards achieving on an ongoing basis. These objectives (summarized below) are to be used as a mechanism to trigger corrective action proactively and voluntarily before environmental impairment occurs and before the compliance limits are exceeded. The following table presents the range of effluent discharge values vs. ECA Objectives.
Effluent Parameter
Sample Frequency
Monthly Average Objective Concentration
(milligram per liter unless otherwise indicated)
Monthly Average Result Min-Max
(milligram per liter unless otherwise indicated)
CBOD5 weekly 4.7 2 - 3.5
Total Suspended Solids weekly 4.7 3.2 - 7.2
Total Phosphorus weekly 0.27 0.2 - 0.3
Total Ammonia Nitrogen (May 1 to October 31)
weekly 1.8 1.3 - 2.6
Total Ammonia Nitrogen (Nov. 1 to April 30)
weekly 3.6 0.7 - 2.9
E.coli (May 1 to October 31) weekly 150 organisms/100 mL
(monthly Geometric Mean Density) 2 - 9
DO weekly 6 or higher 6.3 - 9.5
pH any single sample weekly 6.5 - 8.5 6.8 - 8.3
Drumbo Wastewater Treatment Plant | D3
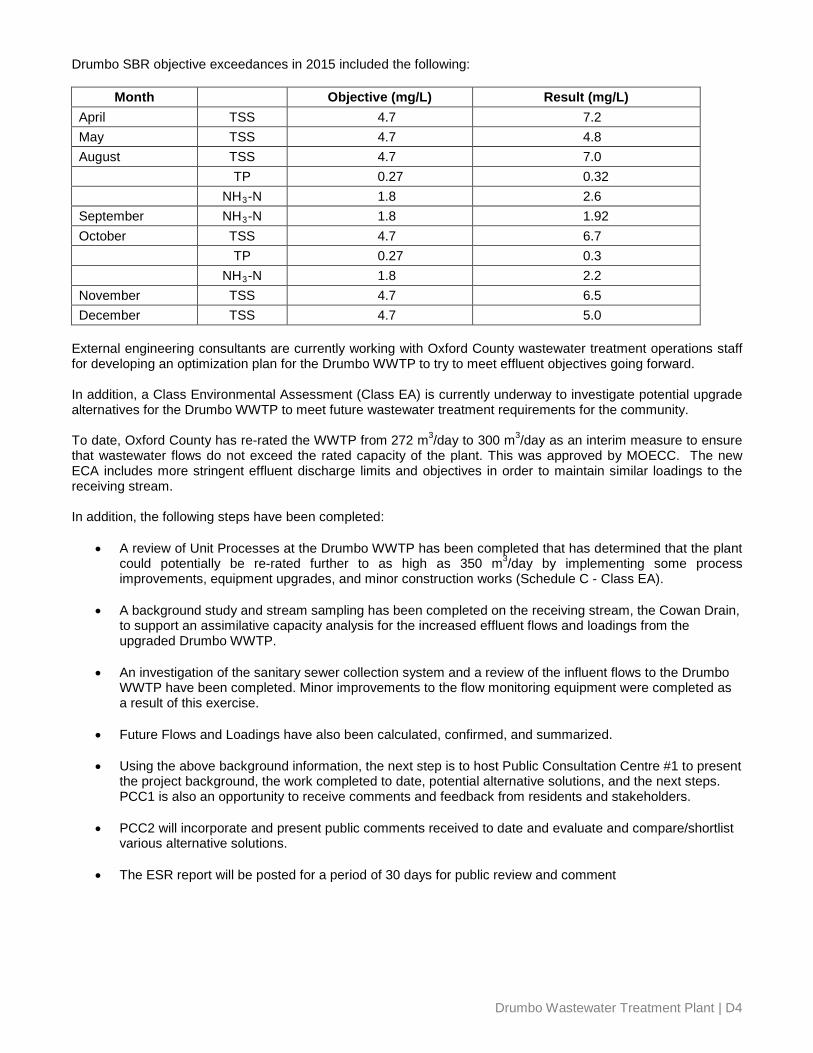
Drumbo SBR objective exceedances in 2015 included the following:
Month Objective (mg/L) Result (mg/L) April TSS 4.7 7.2 May TSS 4.7 4.8 August TSS 4.7 7.0 TP 0.27 0.32 NH3-N 1.8 2.6 September NH3-N 1.8 1.92 October TSS 4.7 6.7 TP 0.27 0.3 NH3-N 1.8 2.2 November TSS 4.7 6.5 December TSS 4.7 5.0
External engineering consultants are currently working with Oxford County wastewater treatment operations staff for developing an optimization plan for the Drumbo WWTP to try to meet effluent objectives going forward. In addition, a Class Environmental Assessment (Class EA) is currently underway to investigate potential upgrade alternatives for the Drumbo WWTP to meet future wastewater treatment requirements for the community. To date, Oxford County has re-rated the WWTP from 272 m3/day to 300 m3/day as an interim measure to ensure that wastewater flows do not exceed the rated capacity of the plant. This was approved by MOECC. The new ECA includes more stringent effluent discharge limits and objectives in order to maintain similar loadings to the receiving stream. In addition, the following steps have been completed:
• A review of Unit Processes at the Drumbo WWTP has been completed that has determined that the plant could potentially be re-rated further to as high as 350 m3/day by implementing some process improvements, equipment upgrades, and minor construction works (Schedule C - Class EA).
• A background study and stream sampling has been completed on the receiving stream, the Cowan Drain, to support an assimilative capacity analysis for the increased effluent flows and loadings from the upgraded Drumbo WWTP.
• An investigation of the sanitary sewer collection system and a review of the influent flows to the Drumbo WWTP have been completed. Minor improvements to the flow monitoring equipment were completed as a result of this exercise.
• Future Flows and Loadings have also been calculated, confirmed, and summarized.
• Using the above background information, the next step is to host Public Consultation Centre #1 to present the project background, the work completed to date, potential alternative solutions, and the next steps. PCC1 is also an opportunity to receive comments and feedback from residents and stakeholders.
• PCC2 will incorporate and present public comments received to date and evaluate and compare/shortlist various alternative solutions.
• The ESR report will be posted for a period of 30 days for public review and comment
Drumbo Wastewater Treatment Plant | D4

3. Overflows, Bypassing, Upsets, Spills, and Abnormal Conditions
There were no bypasses or overflows from the Drumbo WWTP in 2015. 4. Maintenance of Works
The operating and maintenance staff at the Woodstock WWTP conducts regularly scheduled maintenance of the plant equipment. The Plant utilizes a database system known as City Works to issue work orders and maintain records for regular maintenance and repair at the wastewater treatment facility. 5. Monitoring Equipment Maintenance and Calibration
Calibration of flow meters is conducted yearly by R&R Instrumentation. The records are kept on-site at the Plant. Operational monitoring equipment calibration records are kept on-site at the Plant. 6. Biosolids 2015 Discussion: Co-thickened primary sludge is transported to Woodstock WWTP and dumped into the grit tank for treatment at that facility. Summary The Drumbo WWTP operated within its design flow criteria and met all effluent discharge quality limits in 2015. A Class Environmental Assessment (Class EA) is currently underway to investigate potential alternatives to upgrade the Drumbo WWTP and meet future wastewater treatment requirements for the community.
Drumbo Wastewater Treatment Plant | D5
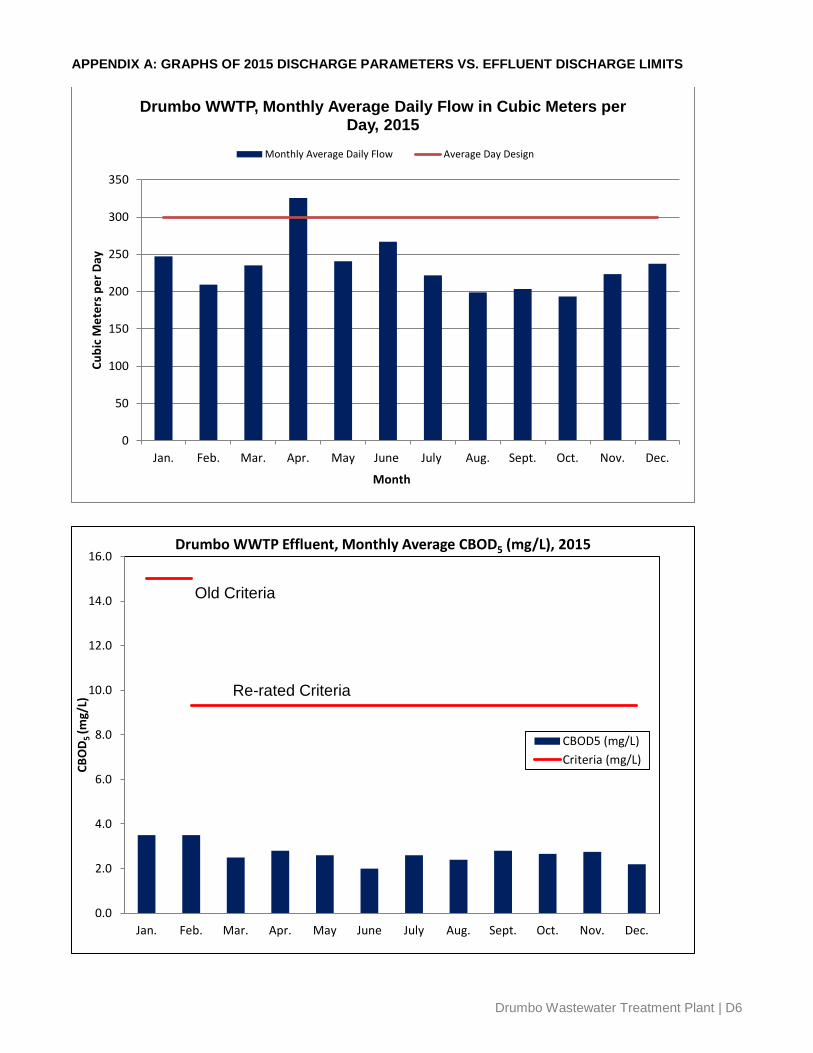
APPENDIX A: GRAPHS OF 2015 DISCHARGE PARAMETERS VS. EFFLUENT DISCHARGE LIMITS
0
50
100
150
200
250
300
350
Jan. Feb. Mar. Apr. May June July Aug. Sept. Oct. Nov. Dec.
Cubi
c M
eter
s per
Day
Month
Drumbo WWTP, Monthly Average Daily Flow in Cubic Meters per Day, 2015
Monthly Average Daily Flow Average Day Design
0.0
2.0
4.0
6.0
8.0
10.0
12.0
14.0
16.0
Jan. Feb. Mar. Apr. May June July Aug. Sept. Oct. Nov. Dec.
CBO
D 5 (m
g/L)
Drumbo WWTP Effluent, Monthly Average CBOD5 (mg/L), 2015
CBOD5 (mg/L)Criteria (mg/L)
Re-rated Criteria
Old Criteria
Drumbo Wastewater Treatment Plant | D6
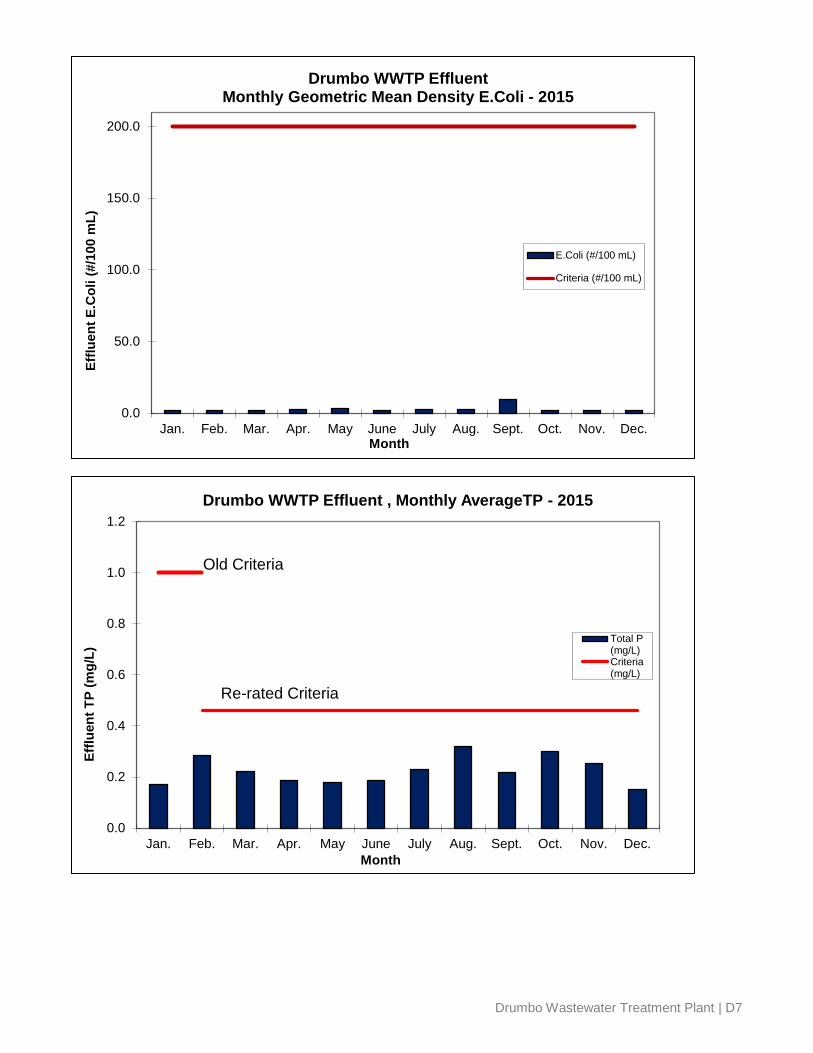
0.0
50.0
100.0
150.0
200.0
Jan. Feb. Mar. Apr. May June July Aug. Sept. Oct. Nov. Dec.
Efflu
ent E
.Col
i (#/
100
mL)
Month
Drumbo WWTP Effluent Monthly Geometric Mean Density E.Coli - 2015
E.Coli (#/100 mL)
Criteria (#/100 mL)
0.0
0.2
0.4
0.6
0.8
1.0
1.2
Jan. Feb. Mar. Apr. May June July Aug. Sept. Oct. Nov. Dec.
Efflu
ent T
P (m
g/L)
Month
Drumbo WWTP Effluent , Monthly AverageTP - 2015
Total P(mg/L)Criteria(mg/L)
Re-rated Criteria
Old Criteria
Drumbo Wastewater Treatment Plant | D7
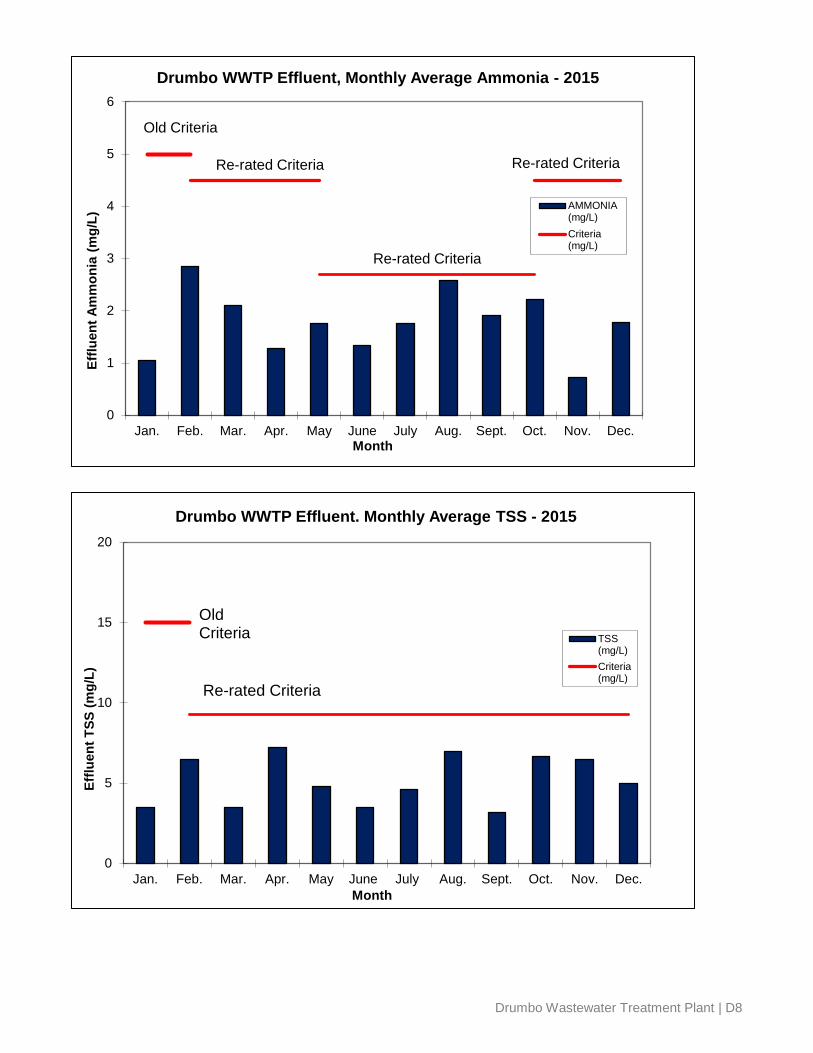
0
5
10
15
20
Jan. Feb. Mar. Apr. May June July Aug. Sept. Oct. Nov. Dec.
Efflu
ent T
SS (m
g/L)
Month
Drumbo WWTP Effluent. Monthly Average TSS - 2015
TSS(mg/L)Criteria(mg/L)
Re-rated Criteria
Old Criteria
0
1
2
3
4
5
6
Jan. Feb. Mar. Apr. May June July Aug. Sept. Oct. Nov. Dec.
Efflu
ent A
mm
onia
(mg/
L)
Month
Drumbo WWTP Effluent, Monthly Average Ammonia - 2015
AMMONIA(mg/L)Criteria(mg/L)
Re-rated Criteria
Old Criteria
Re-rated Criteria
Re-rated Criteria
Drumbo Wastewater Treatment Plant | D8

2015 ANNUAL WASTEWATER TREATMENT SYSTEM SUMMARY REPORT
Ingersoll Wastewater Treatment Plant
1. General Information Oxford County prepares individual annual reports summarizing each wastewater treatment plant’s operation and treated effluent discharge quality for the nine wastewater treatment plants it owns and operates. The reports detail the latest quality testing results and quantity statistics and any non-compliance conditions that may have occurred. They are available for review by the end of February on the internet at www.oxfordcounty.ca/Services-for-You/Water-Wastewater/Wastewater/Annual-reports or by contacting the Public Works Department. All efforts have been made to ensure the information presented in this report is as accurate as possible. If you have any questions or comments concerning the report, please contact the County of Oxford at the address and phone number listed below or by email at [email protected]. Wastewater Treatment Plant: Ingersoll Wastewater Treatment Plant (WWTP) Wastewater Treatment Plant Number: 110003969
Wastewater Treatment Plant Owner & Contact Information:
Oxford County Public Works Department Wastewater Services P.O. Box 1614, 21 Reeve Street Woodstock ON N4S 7Y3 Telephone: 519-539-9800 | Toll Free: 866-537-7778
Reporting Period: January 1, 2015 – December 31, 2015 1.1. System Description The Ingersoll WWTP provides wastewater treatment for residential, commercial, and industrial users in the Town of Ingersoll. It also provides treatment for septic tank waste, hauled waste, holding tank waste, and landfill leachate from within Oxford County The wastewater treatment plant is located at 56 McKeand St., Ingersoll, Ontario. The Facility description is provided below.
Facility Ingersoll Wastewater Treatment Plant
Design Capacity 10,230 m3/d
2015 Average Daily Flow 6,482 m3/d
2015 Maximum Daily Flow 12,970 m3/d
2015 Total Volume of Wastewater 2,365,576 m3/year
2015 Total Received Hauled Waste 15,397 m3/year
Classification WWT – III
Environmental Compliance Approval (ECA) #1614-A28P9L
Ingersoll Wastewater Treatment Plant | I1
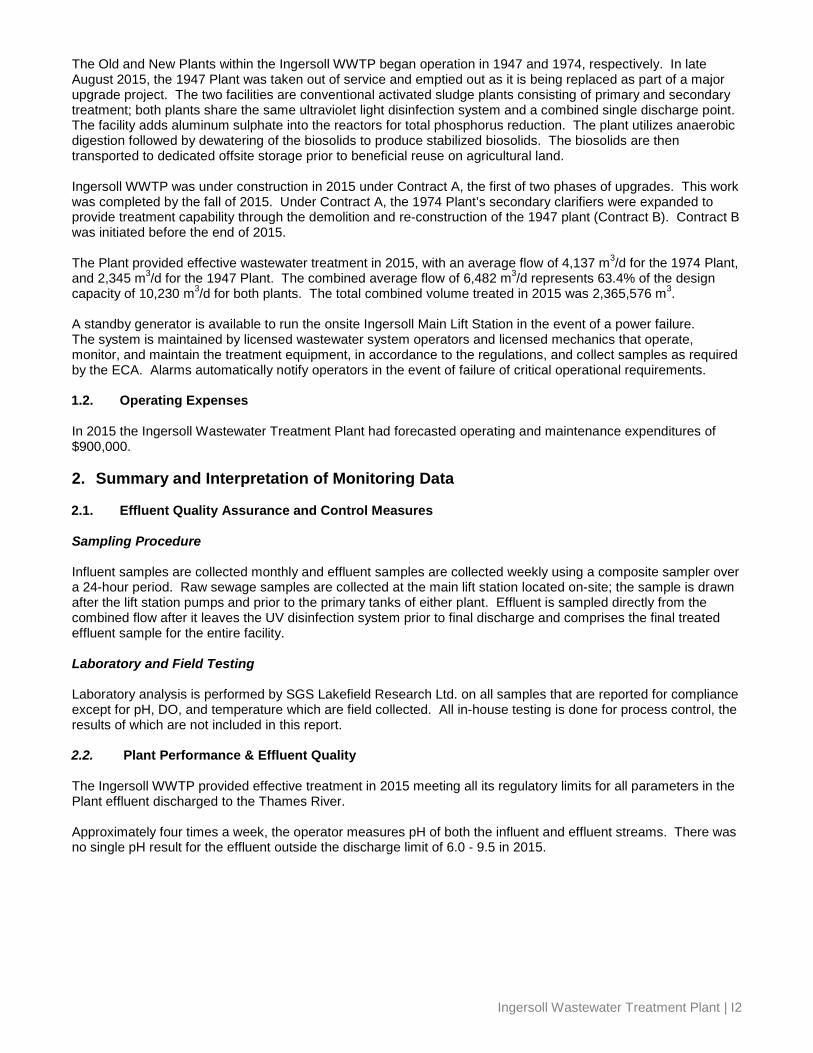
The Old and New Plants within the Ingersoll WWTP began operation in 1947 and 1974, respectively. In late August 2015, the 1947 Plant was taken out of service and emptied out as it is being replaced as part of a major upgrade project. The two facilities are conventional activated sludge plants consisting of primary and secondary treatment; both plants share the same ultraviolet light disinfection system and a combined single discharge point. The facility adds aluminum sulphate into the reactors for total phosphorus reduction. The plant utilizes anaerobic digestion followed by dewatering of the biosolids to produce stabilized biosolids. The biosolids are then transported to dedicated offsite storage prior to beneficial reuse on agricultural land. Ingersoll WWTP was under construction in 2015 under Contract A, the first of two phases of upgrades. This work was completed by the fall of 2015. Under Contract A, the 1974 Plant’s secondary clarifiers were expanded to provide treatment capability through the demolition and re-construction of the 1947 plant (Contract B). Contract B was initiated before the end of 2015. The Plant provided effective wastewater treatment in 2015, with an average flow of 4,137 m3/d for the 1974 Plant, and 2,345 m3/d for the 1947 Plant. The combined average flow of 6,482 m3/d represents 63.4% of the design capacity of 10,230 m3/d for both plants. The total combined volume treated in 2015 was 2,365,576 m3. A standby generator is available to run the onsite Ingersoll Main Lift Station in the event of a power failure. The system is maintained by licensed wastewater system operators and licensed mechanics that operate, monitor, and maintain the treatment equipment, in accordance to the regulations, and collect samples as required by the ECA. Alarms automatically notify operators in the event of failure of critical operational requirements. 1.2. Operating Expenses In 2015 the Ingersoll Wastewater Treatment Plant had forecasted operating and maintenance expenditures of $900,000. 2. Summary and Interpretation of Monitoring Data 2.1. Effluent Quality Assurance and Control Measures Sampling Procedure Influent samples are collected monthly and effluent samples are collected weekly using a composite sampler over a 24-hour period. Raw sewage samples are collected at the main lift station located on-site; the sample is drawn after the lift station pumps and prior to the primary tanks of either plant. Effluent is sampled directly from the combined flow after it leaves the UV disinfection system prior to final discharge and comprises the final treated effluent sample for the entire facility. Laboratory and Field Testing Laboratory analysis is performed by SGS Lakefield Research Ltd. on all samples that are reported for compliance except for pH, DO, and temperature which are field collected. All in-house testing is done for process control, the results of which are not included in this report. 2.2. Plant Performance & Effluent Quality The Ingersoll WWTP provided effective treatment in 2015 meeting all its regulatory limits for all parameters in the Plant effluent discharged to the Thames River. Approximately four times a week, the operator measures pH of both the influent and effluent streams. There was no single pH result for the effluent outside the discharge limit of 6.0 - 9.5 in 2015.
Ingersoll Wastewater Treatment Plant | I2
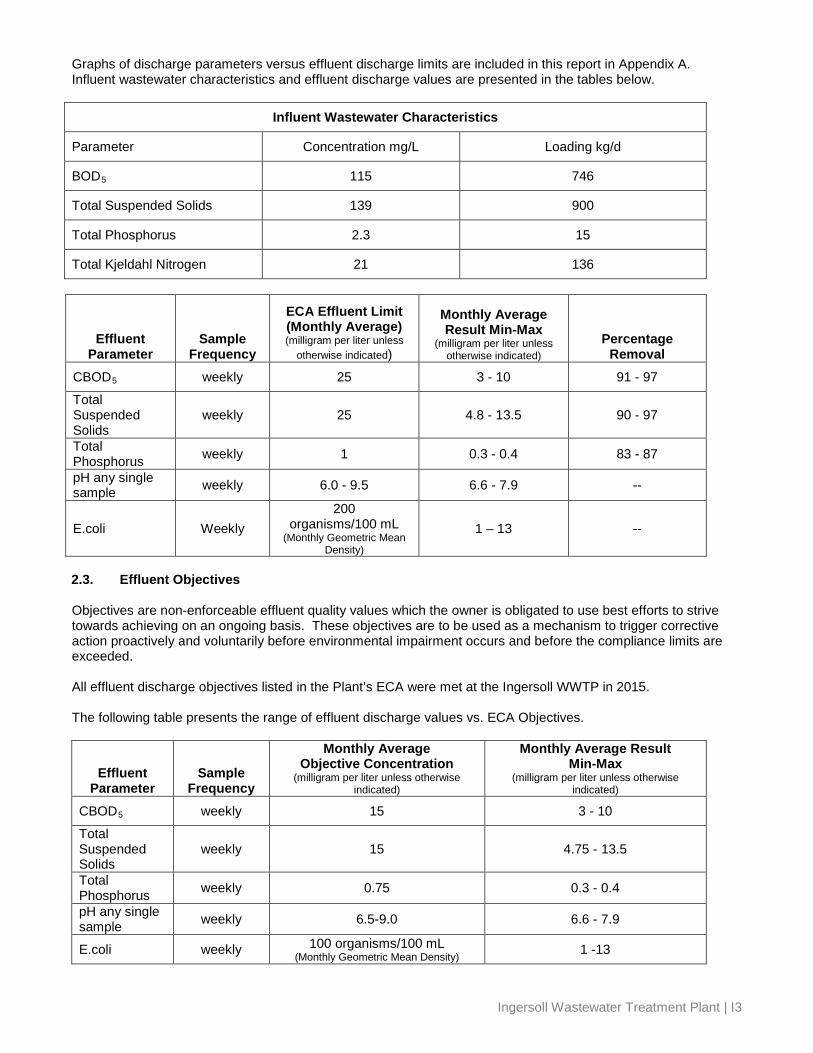
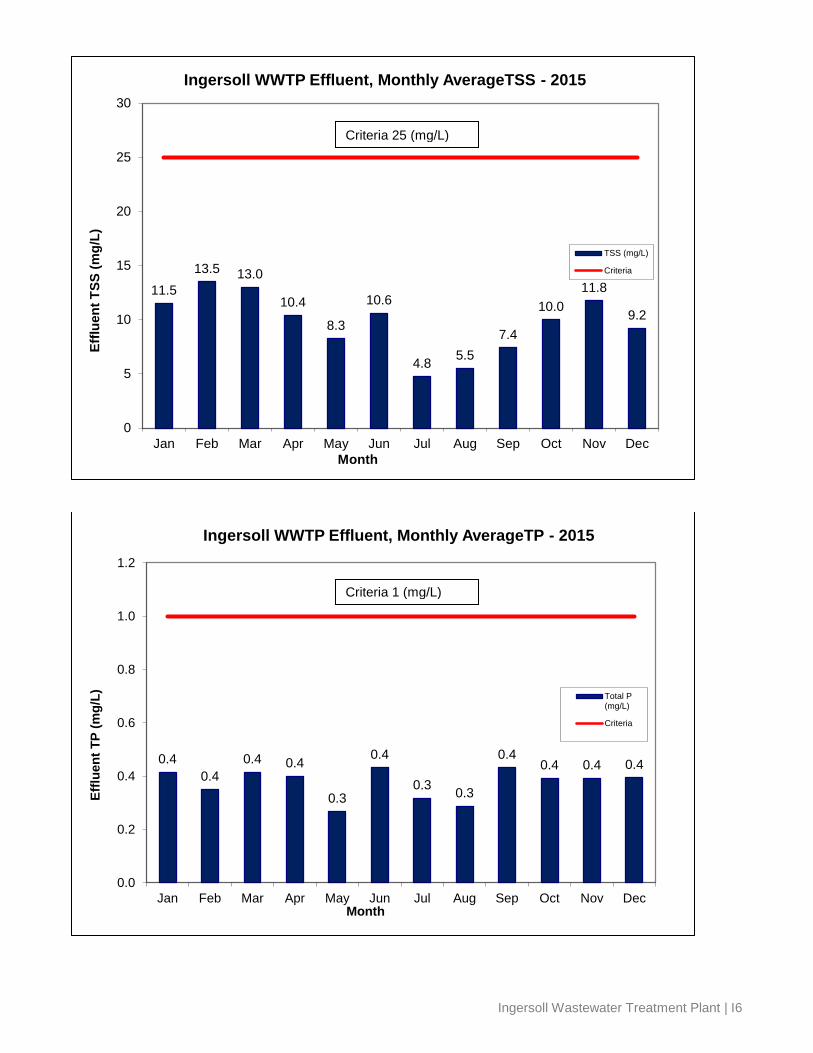
Graphs of discharge parameters versus effluent discharge limits are included in this report in Appendix A. Influent wastewater characteristics and effluent discharge values are presented in the tables below.
Influent Wastewater Characteristics
Parameter Concentration mg/L Loading kg/d
BOD5 115 746
Total Suspended Solids 139 900
Total Phosphorus 2.3 15
Total Kjeldahl Nitrogen 21 136
Effluent Parameter
Sample Frequency
ECA Effluent Limit (Monthly Average) (milligram per liter unless
otherwise indicated)
Monthly Average Result Min-Max
(milligram per liter unless otherwise indicated)
Percentage Removal
CBOD5 weekly 25 3 - 10 91 - 97
Total Suspended Solids
weekly 25 4.8 - 13.5 90 - 97
Total Phosphorus weekly 1 0.3 - 0.4 83 - 87
pH any single sample weekly 6.0 - 9.5 6.6 - 7.9 --
E.coli Weekly 200
organisms/100 mL (Monthly Geometric Mean
Density) 1 – 13 --
2.3. Effluent Objectives Objectives are non-enforceable effluent quality values which the owner is obligated to use best efforts to strive towards achieving on an ongoing basis. These objectives are to be used as a mechanism to trigger corrective action proactively and voluntarily before environmental impairment occurs and before the compliance limits are exceeded. All effluent discharge objectives listed in the Plant’s ECA were met at the Ingersoll WWTP in 2015. The following table presents the range of effluent discharge values vs. ECA Objectives.
Effluent Parameter
Sample Frequency
Monthly Average Objective Concentration
(milligram per liter unless otherwise indicated)
Monthly Average Result Min-Max
(milligram per liter unless otherwise indicated)
CBOD5 weekly 15 3 - 10
Total Suspended Solids
weekly 15 4.75 - 13.5
Total Phosphorus weekly 0.75 0.3 - 0.4
pH any single sample weekly 6.5-9.0 6.6 - 7.9
E.coli weekly 100 organisms/100 mL (Monthly Geometric Mean Density) 1 -13
Ingersoll Wastewater Treatment Plant | I3
3. Overflows, Bypassing, Upsets, Spills, and Abnormal Conditions There were no bypasses or overflows from the Ingersoll WWTP in 2015; however, there was a spill during construction of Contract A on April 16, 2015. At 11 am on April 16th, a construction packer caused a leak of 223 liters of return activated sludge (RAS) at a flange in the pipe. A dewatering pump was used to transfer the material back into the process tank. The tank with the compromised pipe was isolated to complete the repairs. The event was reported to the MOECC at the time it occurred both verbally and in writing. 4. Maintenance of Works
The operating and maintenance staff at the Ingersoll WWTP conducts regularly scheduled maintenance of the plant equipment. The Plant utilizes a database system known as City Works to issue work orders and maintain records for regular maintenance and repair at the treatment facility. 5. Monitoring Equipment Maintenance and Calibration Calibration of flow meters is conducted yearly by R&R Instrumentation. The records are kept on-site at the Plant. Operational monitoring equipment calibration records are kept on-site at the Plant. 6. Biosolids 2015 Discussion: Biosolids are anaerobically digested and dewatered at the Ingersoll WWTP using an Alfa-Laval Centrifuge. The biosolids are then stored at the Oxford County Biosolids Centralized Storage Facility (BCSF) prior to land application. The sampling results and land application details are summarized in a separate Biosolids Annual report, available at: www.oxfordcounty.ca/Services-for-You/Water-Wastewater/Wastewater/Annual-reports Summary The Ingersoll WWTP operated within its design flow criteria and met all effluent discharge quality limits in 2015. The Biosolids generated were utilized for beneficial reuse on agricultural land as a Non-agricultural source material (NASM) as regulated under the Nutrient Management Act (NMA); details of which are included in a separate report, available at www.oxfordcounty.ca/Services-for-You/Water-Wastewater/Wastewater/Annual-reports
Ingersoll Wastewater Treatment Plant | I4

APPENDIX A: GRAPHS OF 2015 DISCHARGE PARAMETERS VS. EFFLUENT DISCHARGE LIMITS
6271 6285 6522 6828
5866
7316 6561 6656 6342 6100
6541 6499
0
2000
4000
6000
8000
10000
12000
Jan Feb Mar Apr May Jun Jul Aug Sep Oct Nov Dec
Efflu
ent F
low
Cub
ic m
eter
s pe
r day
Ingersoll WWTP Effluent Flow Cubic Meters Per Day 2015
Flow (m3/d)(Combined)Plant Capacity10,230 m3
7.0
9.5 9.5 7.6
2.8 2.8 3.8
2.8 3.0
6.0 6.8 7.4
0
5
10
15
20
25
30
Jan Feb Mar Apr May Jun Jul Aug Sep Oct Nov Dec
Efflu
ent C
BO
D5 (
mg/
L)
Month
Ingersoll WWTP Effluent, Monthly Average CBOD5 - 2015
CBOD5 (mg/L)
Criteria
Design Flow 10,230 m3/d
Criteria 25 (mg/L)
Ingersoll Wastewater Treatment Plant | I5
11.5 13.5 13.0
10.4
8.3
10.6
4.8 5.5 7.4
10.0 11.8
9.2
0
5
10
15
20
25
30
Jan Feb Mar Apr May Jun Jul Aug Sep Oct Nov Dec
Efflu
ent T
SS (m
g/L)
Month
Ingersoll WWTP Effluent, Monthly AverageTSS - 2015
TSS (mg/L)
Criteria
0.4 0.4
0.4 0.4
0.3
0.4
0.3 0.3
0.4 0.4 0.4 0.4
0.0
0.2
0.4
0.6
0.8
1.0
1.2
Jan Feb Mar Apr May Jun Jul Aug Sep Oct Nov Dec
Efflu
ent T
P (m
g/L)
Month
Ingersoll WWTP Effluent, Monthly AverageTP - 2015
Total P(mg/L)
Criteria
Criteria 25 (mg/L)
Criteria 1 (mg/L)
Ingersoll Wastewater Treatment Plant | I6

1 3 2 2 3 13
0
50
100
150
200
250
Jan Feb Mar Apr May Jun Jul Aug Sep Oct Nov Dec
Efflu
ent E
.col
i (#/
100
mL)
Month
Ingersoll WWTP Effluent Monthly Geometric Mean Density E.coli - 2015
E.Coli Geomean
Limit
Criteria 200 (#/100 mL)
Ingersoll Wastewater Treatment Plant | I7
2015 ANNUAL WASTEWATER TREATMENT SYSTEM SUMMARY REPORT
Mount Elgin Wastewater Treatment Plant
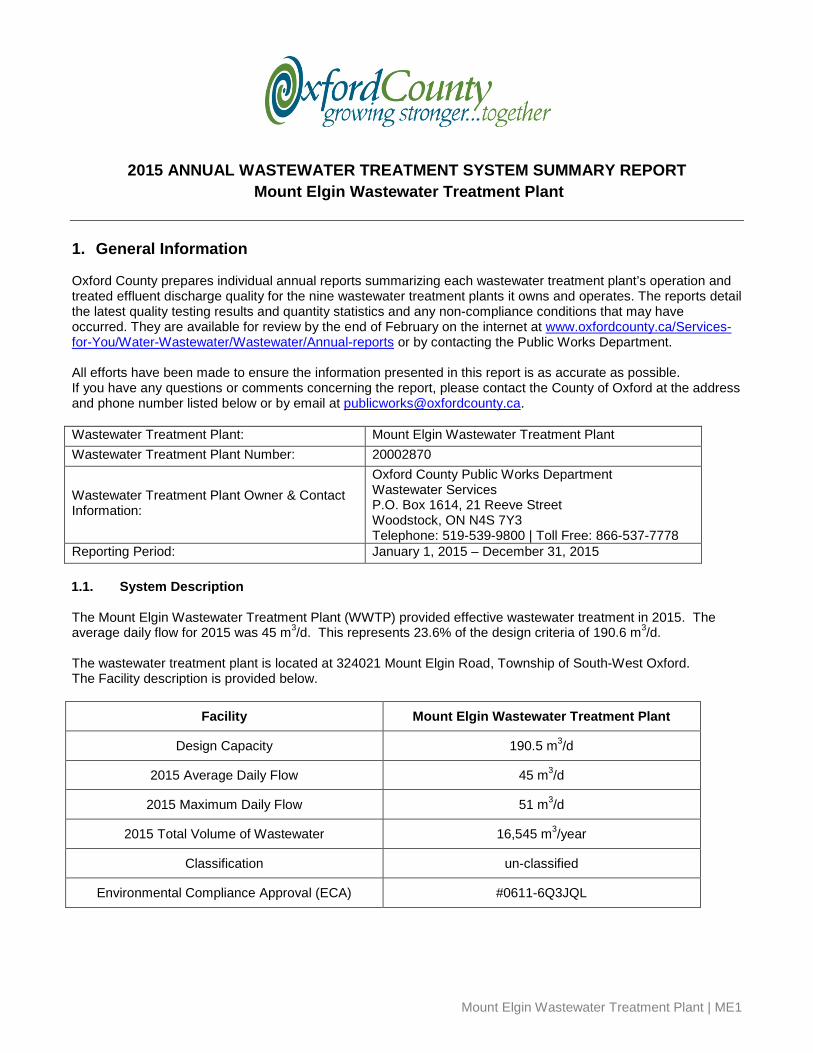
1. General Information Oxford County prepares individual annual reports summarizing each wastewater treatment plant’s operation and treated effluent discharge quality for the nine wastewater treatment plants it owns and operates. The reports detail the latest quality testing results and quantity statistics and any non-compliance conditions that may have occurred. They are available for review by the end of February on the internet at www.oxfordcounty.ca/Services-for-You/Water-Wastewater/Wastewater/Annual-reports or by contacting the Public Works Department. All efforts have been made to ensure the information presented in this report is as accurate as possible. If you have any questions or comments concerning the report, please contact the County of Oxford at the address and phone number listed below or by email at [email protected]. Wastewater Treatment Plant: Mount Elgin Wastewater Treatment Plant Wastewater Treatment Plant Number: 20002870
Wastewater Treatment Plant Owner & Contact Information:
Oxford County Public Works Department Wastewater Services P.O. Box 1614, 21 Reeve Street Woodstock, ON N4S 7Y3 Telephone: 519-539-9800 | Toll Free: 866-537-7778
Reporting Period: January 1, 2015 – December 31, 2015 1.1. System Description The Mount Elgin Wastewater Treatment Plant (WWTP) provided effective wastewater treatment in 2015. The average daily flow for 2015 was 45 m3/d. This represents 23.6% of the design criteria of 190.6 m3/d. The wastewater treatment plant is located at 324021 Mount Elgin Road, Township of South-West Oxford. The Facility description is provided below.
Facility Mount Elgin Wastewater Treatment Plant
Design Capacity 190.5 m3/d
2015 Average Daily Flow 45 m3/d
2015 Maximum Daily Flow 51 m3/d
2015 Total Volume of Wastewater 16,545 m3/year
Classification un-classified
Environmental Compliance Approval (ECA) #0611-6Q3JQL
Mount Elgin Wastewater Treatment Plant | ME1
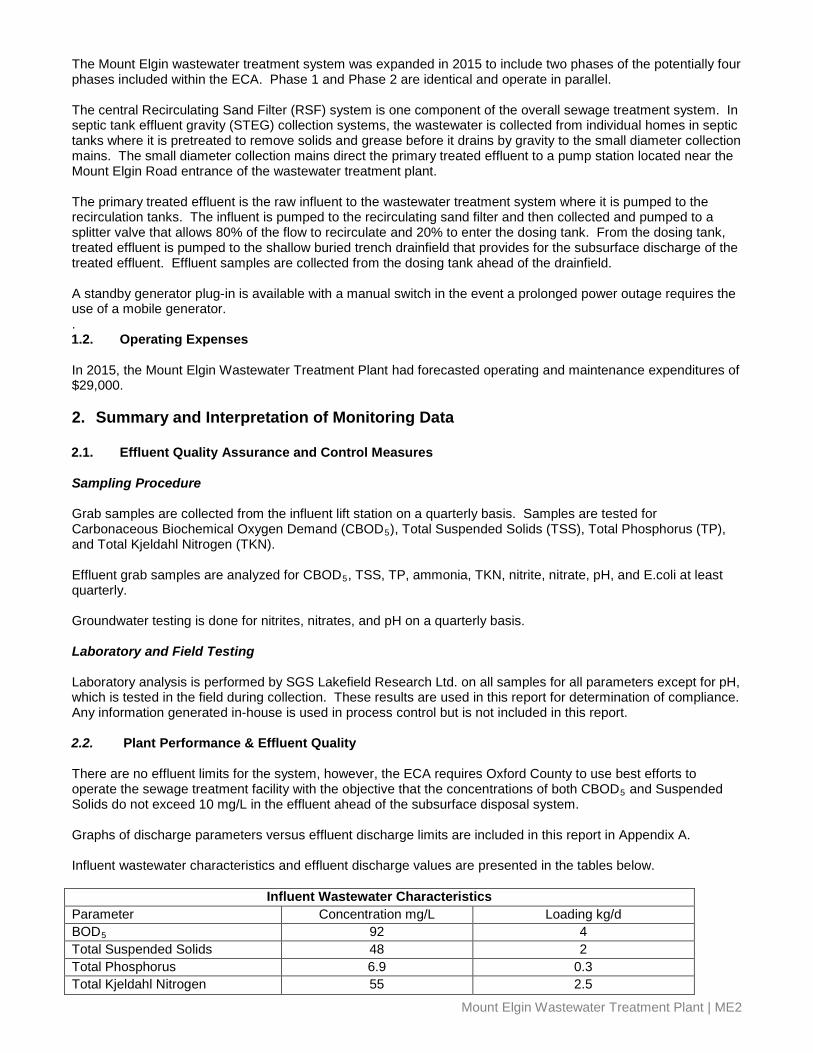
The Mount Elgin wastewater treatment system was expanded in 2015 to include two phases of the potentially four phases included within the ECA. Phase 1 and Phase 2 are identical and operate in parallel. The central Recirculating Sand Filter (RSF) system is one component of the overall sewage treatment system. In septic tank effluent gravity (STEG) collection systems, the wastewater is collected from individual homes in septic tanks where it is pretreated to remove solids and grease before it drains by gravity to the small diameter collection mains. The small diameter collection mains direct the primary treated effluent to a pump station located near the Mount Elgin Road entrance of the wastewater treatment plant. The primary treated effluent is the raw influent to the wastewater treatment system where it is pumped to the recirculation tanks. The influent is pumped to the recirculating sand filter and then collected and pumped to a splitter valve that allows 80% of the flow to recirculate and 20% to enter the dosing tank. From the dosing tank, treated effluent is pumped to the shallow buried trench drainfield that provides for the subsurface discharge of the treated effluent. Effluent samples are collected from the dosing tank ahead of the drainfield. A standby generator plug-in is available with a manual switch in the event a prolonged power outage requires the use of a mobile generator. . 1.2. Operating Expenses In 2015, the Mount Elgin Wastewater Treatment Plant had forecasted operating and maintenance expenditures of $29,000. 2. Summary and Interpretation of Monitoring Data
2.1. Effluent Quality Assurance and Control Measures Sampling Procedure Grab samples are collected from the influent lift station on a quarterly basis. Samples are tested for Carbonaceous Biochemical Oxygen Demand (CBOD5), Total Suspended Solids (TSS), Total Phosphorus (TP), and Total Kjeldahl Nitrogen (TKN). Effluent grab samples are analyzed for CBOD5, TSS, TP, ammonia, TKN, nitrite, nitrate, pH, and E.coli at least quarterly. Groundwater testing is done for nitrites, nitrates, and pH on a quarterly basis. Laboratory and Field Testing Laboratory analysis is performed by SGS Lakefield Research Ltd. on all samples for all parameters except for pH, which is tested in the field during collection. These results are used in this report for determination of compliance. Any information generated in-house is used in process control but is not included in this report. 2.2. Plant Performance & Effluent Quality There are no effluent limits for the system, however, the ECA requires Oxford County to use best efforts to operate the sewage treatment facility with the objective that the concentrations of both CBOD5 and Suspended Solids do not exceed 10 mg/L in the effluent ahead of the subsurface disposal system. Graphs of discharge parameters versus effluent discharge limits are included in this report in Appendix A. Influent wastewater characteristics and effluent discharge values are presented in the tables below.
Influent Wastewater Characteristics Parameter Concentration mg/L Loading kg/d BOD5 92 4 Total Suspended Solids 48 2 Total Phosphorus 6.9 0.3 Total Kjeldahl Nitrogen 55 2.5
Mount Elgin Wastewater Treatment Plant | ME2
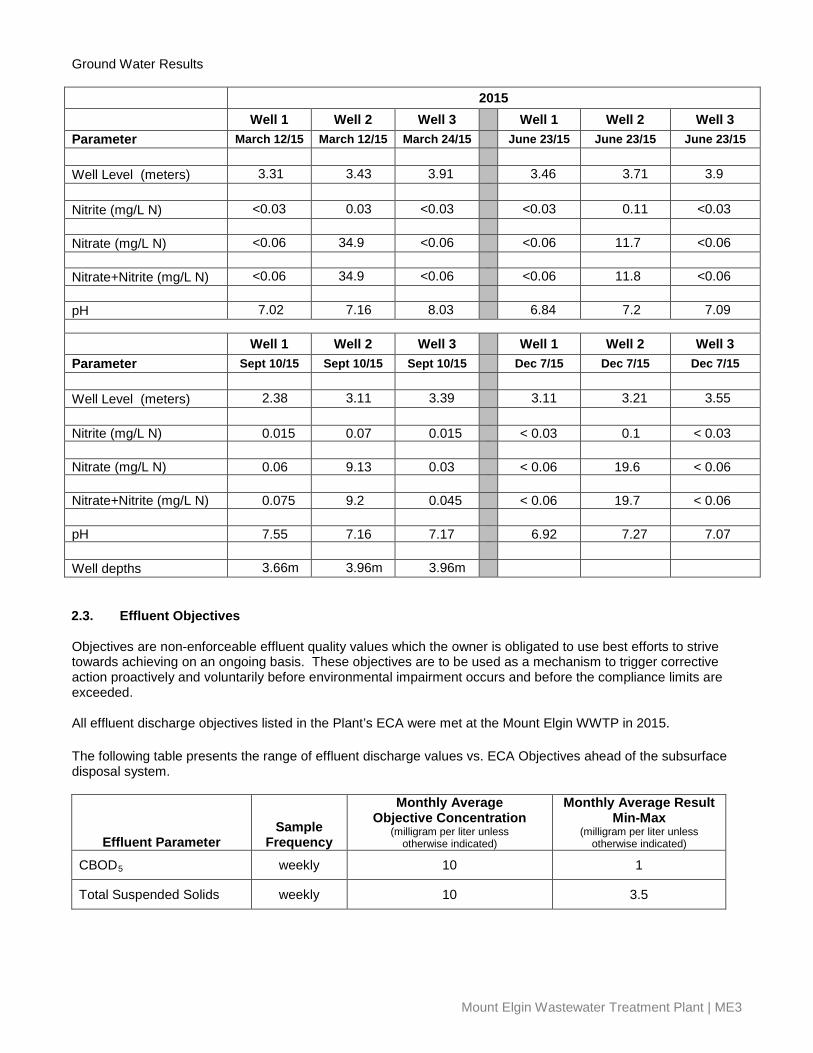
Ground Water Results 2015 Well 1 Well 2 Well 3 Well 1 Well 2 Well 3 Parameter March 12/15 March 12/15 March 24/15 June 23/15 June 23/15 June 23/15 Well Level (meters) 3.31 3.43 3.91 3.46 3.71 3.9
Nitrite (mg/L N) <0.03 0.03 <0.03 <0.03 0.11 <0.03
Nitrate (mg/L N) <0.06 34.9 <0.06 <0.06 11.7 <0.06
Nitrate+Nitrite (mg/L N) <0.06 34.9 <0.06 <0.06 11.8 <0.06
pH 7.02 7.16 8.03 6.84 7.2 7.09
Well 1 Well 2 Well 3 Well 1 Well 2 Well 3 Parameter Sept 10/15 Sept 10/15 Sept 10/15 Dec 7/15 Dec 7/15 Dec 7/15
Well Level (meters) 2.38 3.11 3.39 3.11 3.21 3.55
Nitrite (mg/L N) 0.015 0.07 0.015 < 0.03 0.1 < 0.03
Nitrate (mg/L N) 0.06 9.13 0.03 < 0.06 19.6 < 0.06
Nitrate+Nitrite (mg/L N) 0.075 9.2 0.045 < 0.06 19.7 < 0.06
pH 7.55 7.16 7.17 6.92 7.27 7.07
Well depths 3.66m 3.96m 3.96m 2.3. Effluent Objectives Objectives are non-enforceable effluent quality values which the owner is obligated to use best efforts to strive towards achieving on an ongoing basis. These objectives are to be used as a mechanism to trigger corrective action proactively and voluntarily before environmental impairment occurs and before the compliance limits are exceeded. All effluent discharge objectives listed in the Plant’s ECA were met at the Mount Elgin WWTP in 2015. The following table presents the range of effluent discharge values vs. ECA Objectives ahead of the subsurface disposal system.
Effluent Parameter Sample
Frequency
Monthly Average Objective Concentration
(milligram per liter unless otherwise indicated)
Monthly Average Result Min-Max
(milligram per liter unless otherwise indicated)
CBOD5 weekly 10 1
Total Suspended Solids weekly 10 3.5
Mount Elgin Wastewater Treatment Plant | ME3
3. Overflows, Bypassing, Upsets, Spills, and Abnormal Conditions
There were no bypasses or overflows from the Mount Elgin WWTP in 2015. 4. Maintenance of Works
The operating and maintenance staff at the Ingersoll WWTP conducts regularly scheduled maintenance of the plant equipment. The Plant utilizes a database system known as City Works to issue work orders and maintain records for regular maintenance and repair at the treatment facility. 5. Monitoring Equipment Maintenance and Calibration Calibration of flow meters is conducted yearly by R&R Instrumentation. The operational monitoring equipment calibration records are kept on-site at the Plant. Summary The Mount Elgin WWTP operated within its design flow criteria and met all effluent discharge quality objectives in 2015.
Mount Elgin Wastewater Treatment Plant | ME4
APPENDIX A: GRAPHS OF 2015 DISCHARGE PARAMETERS VS. EFFLUENT DISCHARGE LIMITS
0.039 0.038 0.048 0.049
0.038 0.051
0.041 0.041 0.051 0.051 0.048 0.048
0.00
0.05
0.10
0.15
0.20
0.25
Jan Feb Mar Apr May Jun Jul Aug Sep Oct Nov Dec
Influ
ent
(100
0 m
3 /d)
Month
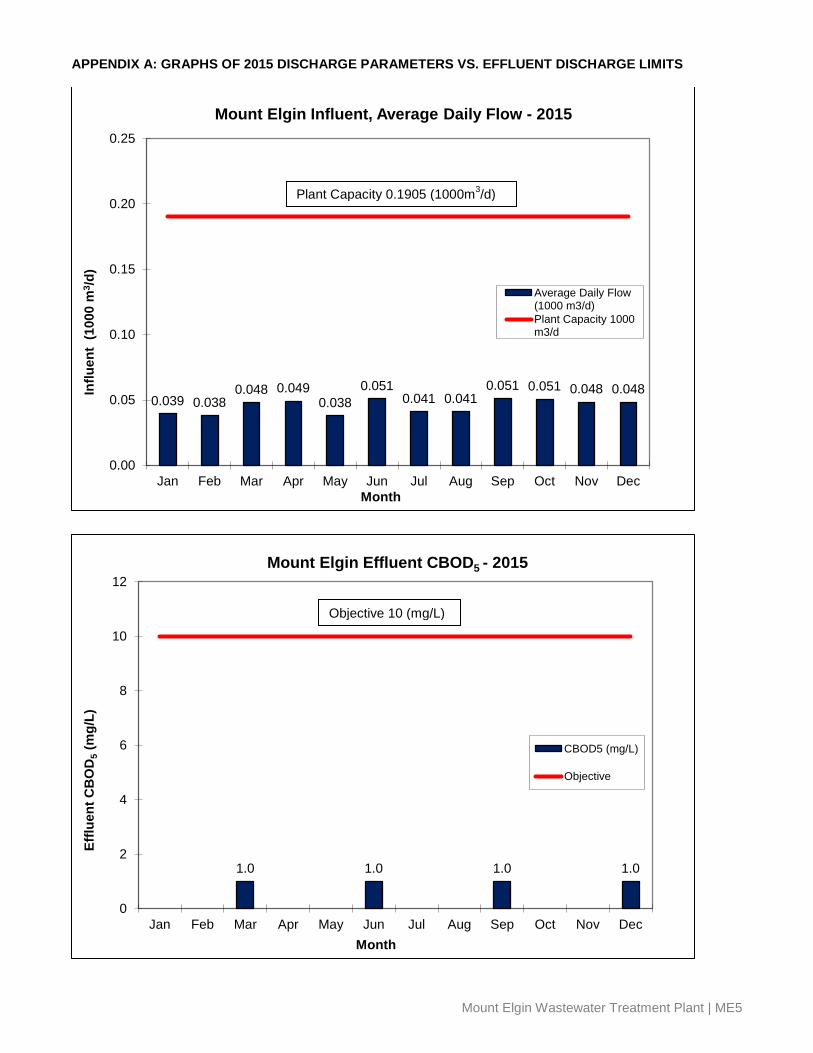
Mount Elgin Influent, Average Daily Flow - 2015
Average Daily Flow(1000 m3/d)Plant Capacity 1000m3/d
1.0 1.0 1.0 1.0
0
2
4
6
8
10
12
Jan Feb Mar Apr May Jun Jul Aug Sep Oct Nov Dec
Efflu
ent C
BO
D5 (
mg/
L)
Month
Mount Elgin Effluent CBOD5 - 2015
CBOD5 (mg/L)
Objective
Plant Capacity 0.1905 (1000m3/d)
Objective 10 (mg/L)
Mount Elgin Wastewater Treatment Plant | ME5

2.0
8.0
3.0
1.0
0
2
4
6
8
10
12
Jan Feb Mar Apr May Jun Jul Aug Sep Oct Nov Dec
Efflu
ent T
SS C
once
ntra
tion
(mg/
L)
Mount Elgin Effluent, TSS Concentration - 2015
SS (mg/L)Objective
Objective 10 (mg/L)
Mount Elgin Wastewater Treatment Plant | ME6
2015 ANNUAL WASTEWATER TREATMENT SYSTEM SUMMARY REPORT
Norwich Wastewater Treatment Plant
1. General Information Oxford County prepares individual annual reports summarizing each wastewater treatment plant’s operation and treated effluent discharge quality for the nine wastewater treatment plants it owns and operates. The reports detail the latest quality testing results and quantity statistics and any non-compliance conditions that may have occurred. They are available for review by the end of February on the internet at www.oxfordcounty.ca/Services-for-You/Water-Wastewater/Wastewater/Annual-reports or by contacting the Public Works Department. All efforts have been made to ensure the information presented in this report is as accurate as possible. If you have any questions or comments concerning the report, please contact the County of Oxford at the address and phone number listed below or by email at [email protected]. Wastewater Treatment Plant: Norwich Wastewater Treatment Plant Wastewater Treatment Plant Number: 110001480
Wastewater Treatment Plant Owner & Contact Information:
Oxford County Public Works Department Wastewater Services P.O. Box 1614, 21 Reeve Street Woodstock, ON N4S 7Y3 Telephone: 519-539-9800 | Toll Free: 866-537-7778
Reporting Period: January 1, 2015 – December 31, 2015 1.1. System Description The Norwich WWTP provided effective wastewater treatment in 2015. The average daily flow for 2015 was 856 m3/d. This represents 55.9% of the rated capacity of 1,530 m3/d. The wastewater treatment plant is located at Lot 7, Conc. 5, Norwich Township. The Facility description is provided below.
Facility Norwich Wastewater Treatment Plant
Design Capacity 1,530 m3/d
2015 Average Daily Flow 856 m3/d
2015 Maximum Daily Flow 2,305 m3/d
2015 Total Volume of Wastewater 312,423 m3/year
Classification WWT – I
Environmental Compliance Approval (ECA) #1680-6F6QR5
The Norwich WWTP is a lagoon wastewater treatment system serving the community of Norwich. The wastewater is pumped from two pump stations to a splitter box; then to either of two lagoon cells as determined by the operator. Typically the wastewater is directed to the North Cell which is operated in series with the South Cell, followed by filtering of the effluent through the sand filter beds performed for a period each day, as required.
Norwich Wastewater Treatment Plant | N1
The lagoons may discharge year-round; however, the freezing period prevents discharge through the filter beds (normally December to April). The system is maintained by licensed wastewater system operators and licensed mechanics that operate, monitor, and maintain the treatment equipment, in accordance to the regulations, and collect samples as required by the ECA. Alarms automatically notify operators in the event of failure of critical operational requirements. 1.2. Operating Expenses In 2015 the Norwich Wastewater Treatment Plant had forecasted operating and maintenance expenditures of $90,000.
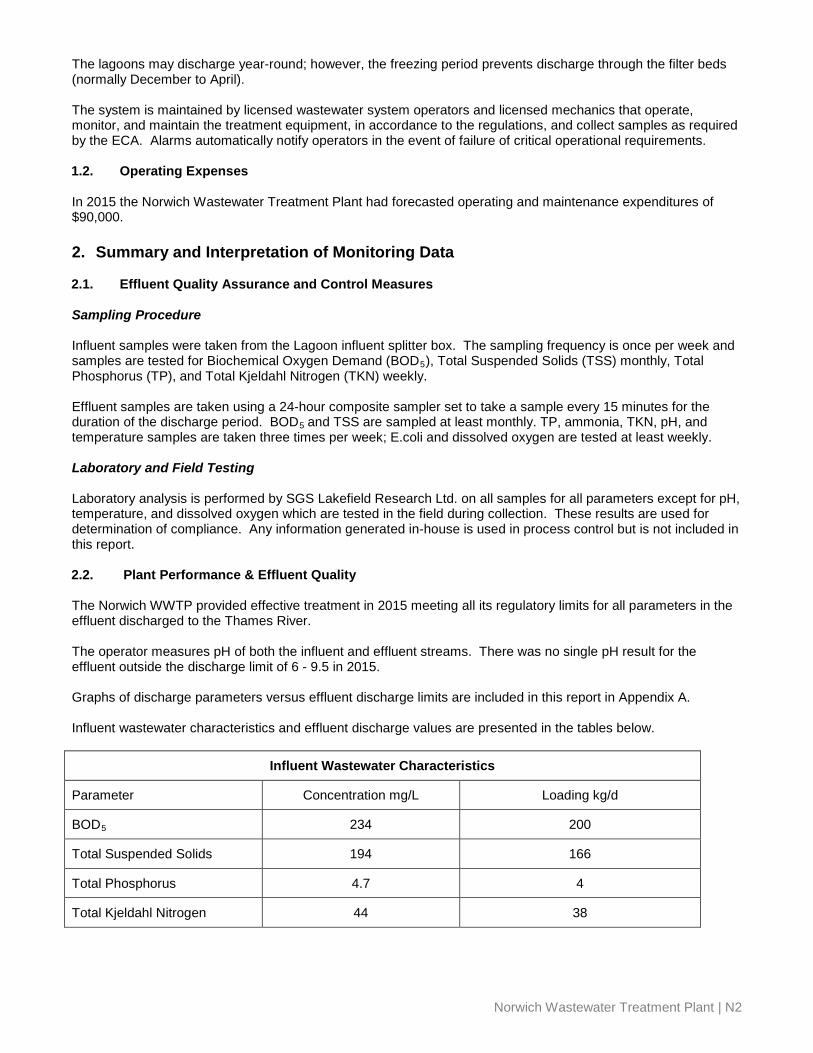
2. Summary and Interpretation of Monitoring Data 2.1. Effluent Quality Assurance and Control Measures Sampling Procedure Influent samples were taken from the Lagoon influent splitter box. The sampling frequency is once per week and samples are tested for Biochemical Oxygen Demand (BOD5), Total Suspended Solids (TSS) monthly, Total Phosphorus (TP), and Total Kjeldahl Nitrogen (TKN) weekly. Effluent samples are taken using a 24-hour composite sampler set to take a sample every 15 minutes for the duration of the discharge period. BOD5 and TSS are sampled at least monthly. TP, ammonia, TKN, pH, and temperature samples are taken three times per week; E.coli and dissolved oxygen are tested at least weekly. Laboratory and Field Testing Laboratory analysis is performed by SGS Lakefield Research Ltd. on all samples for all parameters except for pH, temperature, and dissolved oxygen which are tested in the field during collection. These results are used for determination of compliance. Any information generated in-house is used in process control but is not included in this report. 2.2. Plant Performance & Effluent Quality The Norwich WWTP provided effective treatment in 2015 meeting all its regulatory limits for all parameters in the effluent discharged to the Thames River. The operator measures pH of both the influent and effluent streams. There was no single pH result for the effluent outside the discharge limit of 6 - 9.5 in 2015. Graphs of discharge parameters versus effluent discharge limits are included in this report in Appendix A. Influent wastewater characteristics and effluent discharge values are presented in the tables below.
Influent Wastewater Characteristics
Parameter Concentration mg/L Loading kg/d
BOD5 234 200
Total Suspended Solids 194 166
Total Phosphorus 4.7 4
Total Kjeldahl Nitrogen 44 38
Norwich Wastewater Treatment Plant | N2
Effluent Parameter
Sample Frequency
(when discharging)
ECA Effluent Limit (Monthly Average) (milligram per liter unless
otherwise indicated)
Monthly Average Result Min-Max
(milligram per liter unless otherwise indicated)
Percentage Removal
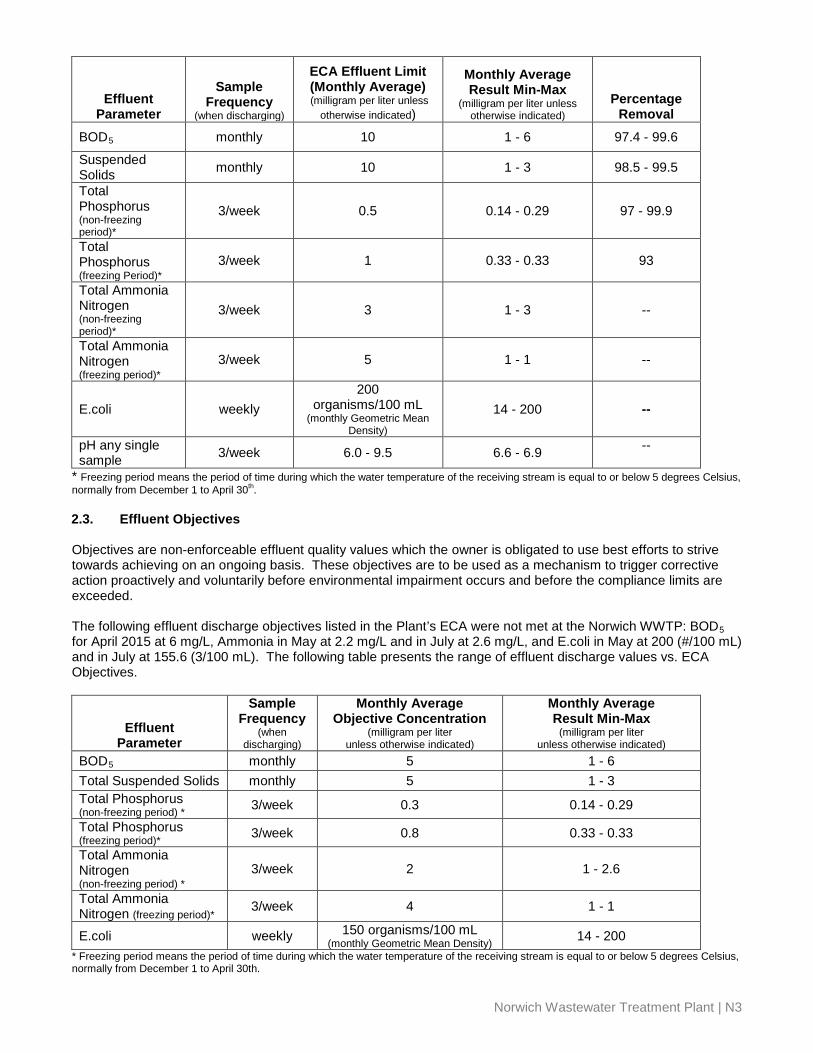
BOD5 monthly 10 1 - 6 97.4 - 99.6
Suspended Solids monthly 10 1 - 3 98.5 - 99.5
Total Phosphorus (non-freezing period)*
3/week 0.5 0.14 - 0.29 97 - 99.9
Total Phosphorus (freezing Period)*
3/week 1 0.33 - 0.33 93
Total Ammonia Nitrogen (non-freezing period)*
3/week 3 1 - 3 --
Total Ammonia Nitrogen (freezing period)*
3/week 5 1 - 1 --
E.coli weekly 200
organisms/100 mL (monthly Geometric Mean
Density)
14 - 200 --
pH any single sample 3/week 6.0 - 9.5 6.6 - 6.9 --
* Freezing period means the period of time during which the water temperature of the receiving stream is equal to or below 5 degrees Celsius, normally from December 1 to April 30th. 2.3. Effluent Objectives Objectives are non-enforceable effluent quality values which the owner is obligated to use best efforts to strive towards achieving on an ongoing basis. These objectives are to be used as a mechanism to trigger corrective action proactively and voluntarily before environmental impairment occurs and before the compliance limits are exceeded. The following effluent discharge objectives listed in the Plant’s ECA were not met at the Norwich WWTP: BOD5 for April 2015 at 6 mg/L, Ammonia in May at 2.2 mg/L and in July at 2.6 mg/L, and E.coli in May at 200 (#/100 mL) and in July at 155.6 (3/100 mL). The following table presents the range of effluent discharge values vs. ECA Objectives.
Effluent
Parameter
Sample Frequency
(when discharging)
Monthly Average Objective Concentration
(milligram per liter unless otherwise indicated)
Monthly Average Result Min-Max
(milligram per liter unless otherwise indicated)
BOD5 monthly 5 1 - 6 Total Suspended Solids monthly 5 1 - 3 Total Phosphorus (non-freezing period) * 3/week 0.3 0.14 - 0.29 Total Phosphorus (freezing period)* 3/week 0.8 0.33 - 0.33 Total Ammonia Nitrogen (non-freezing period) *
3/week 2 1 - 2.6
Total Ammonia Nitrogen (freezing period)* 3/week 4 1 - 1
E.coli weekly 150 organisms/100 mL (monthly Geometric Mean Density) 14 - 200
* Freezing period means the period of time during which the water temperature of the receiving stream is equal to or below 5 degrees Celsius, normally from December 1 to April 30th.
Norwich Wastewater Treatment Plant | N3
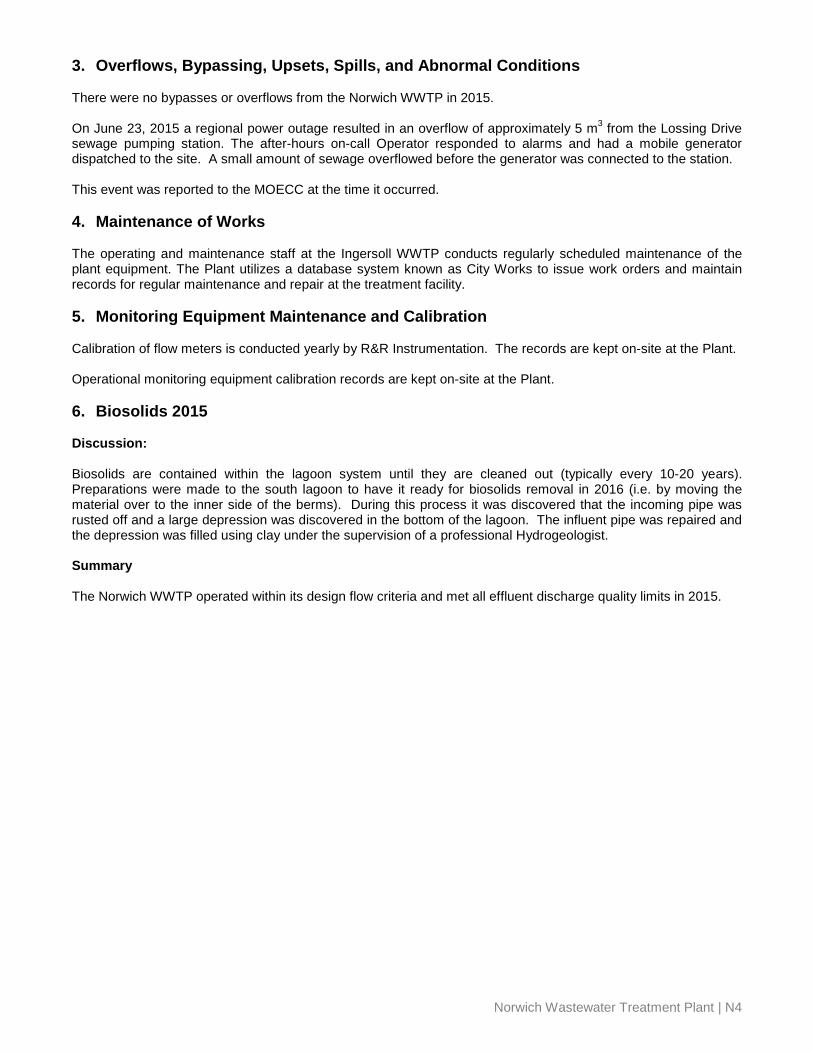
3. Overflows, Bypassing, Upsets, Spills, and Abnormal Conditions There were no bypasses or overflows from the Norwich WWTP in 2015. On June 23, 2015 a regional power outage resulted in an overflow of approximately 5 m3 from the Lossing Drive sewage pumping station. The after-hours on-call Operator responded to alarms and had a mobile generator dispatched to the site. A small amount of sewage overflowed before the generator was connected to the station. This event was reported to the MOECC at the time it occurred. 4. Maintenance of Works
The operating and maintenance staff at the Ingersoll WWTP conducts regularly scheduled maintenance of the plant equipment. The Plant utilizes a database system known as City Works to issue work orders and maintain records for regular maintenance and repair at the treatment facility. 5. Monitoring Equipment Maintenance and Calibration Calibration of flow meters is conducted yearly by R&R Instrumentation. The records are kept on-site at the Plant. Operational monitoring equipment calibration records are kept on-site at the Plant. 6. Biosolids 2015 Discussion: Biosolids are contained within the lagoon system until they are cleaned out (typically every 10-20 years). Preparations were made to the south lagoon to have it ready for biosolids removal in 2016 (i.e. by moving the material over to the inner side of the berms). During this process it was discovered that the incoming pipe was rusted off and a large depression was discovered in the bottom of the lagoon. The influent pipe was repaired and the depression was filled using clay under the supervision of a professional Hydrogeologist. Summary The Norwich WWTP operated within its design flow criteria and met all effluent discharge quality limits in 2015.
Norwich Wastewater Treatment Plant | N4
APPENDIX A: GRAPHS OF 2015 DISCHARGE PARAMETERS VS. EFFLUENT DISCHARGE LIMITS
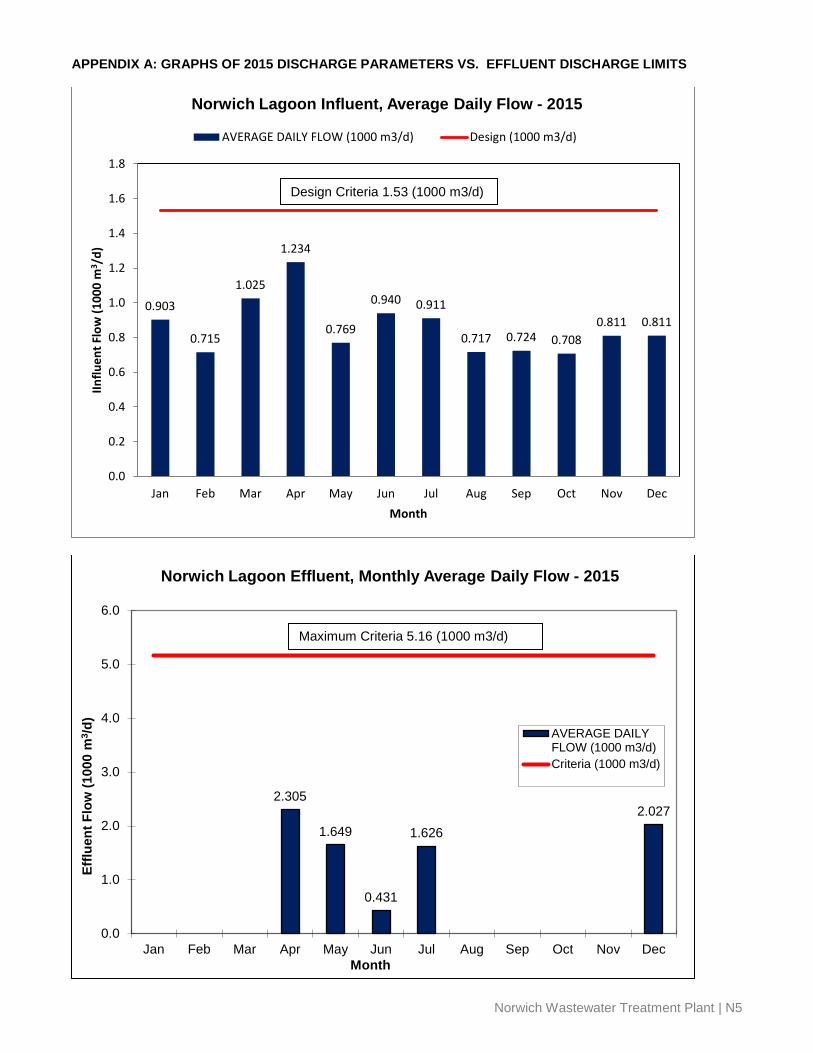
0.903
0.715
1.025
1.234
0.769
0.940 0.911
0.717 0.724 0.708 0.811 0.811
0.0
0.2
0.4
0.6
0.8
1.0
1.2
1.4
1.6
1.8
Jan Feb Mar Apr May Jun Jul Aug Sep Oct Nov Dec
IInflu
ent F
low
(100
0 m
3 /d)
Month
Norwich Lagoon Influent, Average Daily Flow - 2015
AVERAGE DAILY FLOW (1000 m3/d) Design (1000 m3/d)
2.305
1.649
0.431
1.626 2.027
0.0
1.0
2.0
3.0
4.0
5.0
6.0
Jan Feb Mar Apr May Jun Jul Aug Sep Oct Nov Dec
Efflu
ent F
low
(100
0 m
3 /d)
Month
Norwich Lagoon Effluent, Monthly Average Daily Flow - 2015
AVERAGE DAILYFLOW (1000 m3/d)Criteria (1000 m3/d)
Design Criteria 1.53 (1000 m3/d)
Maximum Criteria 5.16 (1000 m3/d)
Norwich Wastewater Treatment Plant | N5
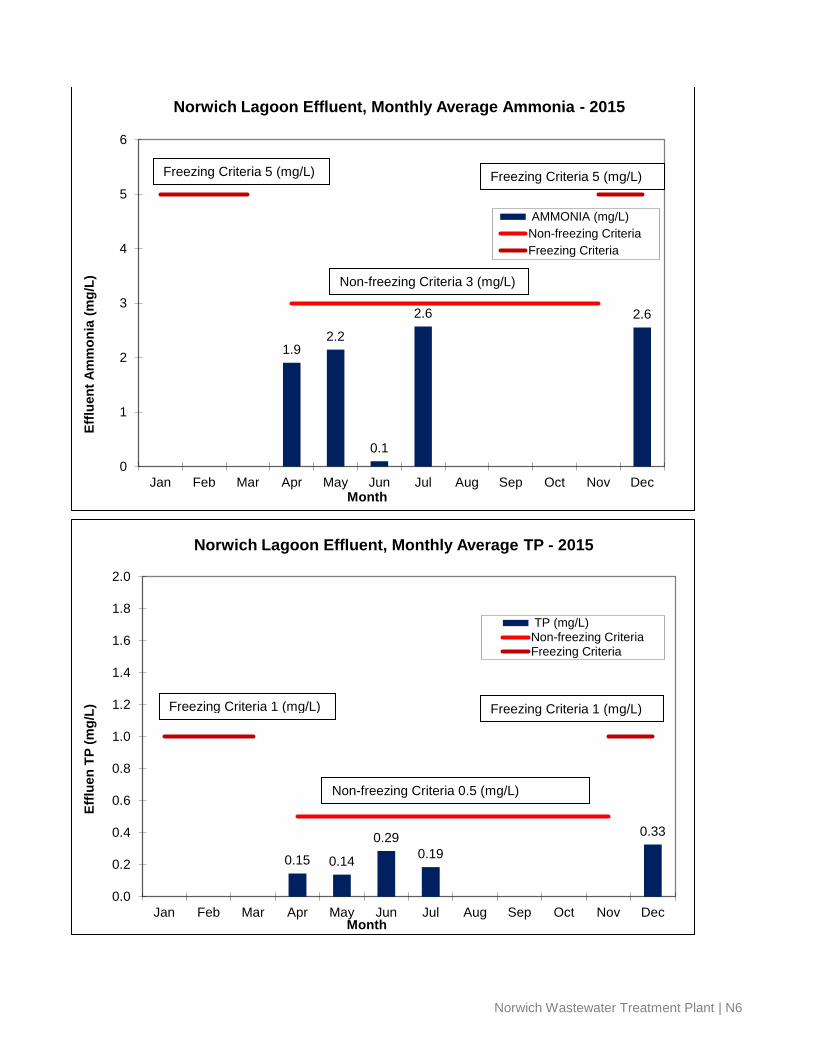
1.9 2.2
0.1
2.6 2.6
0
1
2
3
4
5
6
Jan Feb Mar Apr May Jun Jul Aug Sep Oct Nov Dec
Efflu
ent A
mm
onia
(mg/
L)
Month
Norwich Lagoon Effluent, Monthly Average Ammonia - 2015
AMMONIA (mg/L)Non-freezing CriteriaFreezing Criteria
0.15 0.14
0.29 0.19
0.33
0.0
0.2
0.4
0.6
0.8
1.0
1.2
1.4
1.6
1.8
2.0
Jan Feb Mar Apr May Jun Jul Aug Sep Oct Nov Dec
Efflu
en T
P (m
g/L)
Month
Norwich Lagoon Effluent, Monthly Average TP - 2015
TP (mg/L)Non-freezing CriteriaFreezing Criteria
Freezing Criteria 5 (mg/L)
Non-freezing Criteria 3 (mg/L)
Freezing Criteria 5 (mg/L)
Freezing Criteria 1 (mg/L)
Non-freezing Criteria 0.5 (mg/L)
Freezing Criteria 1 (mg/L)
Norwich Wastewater Treatment Plant | N6
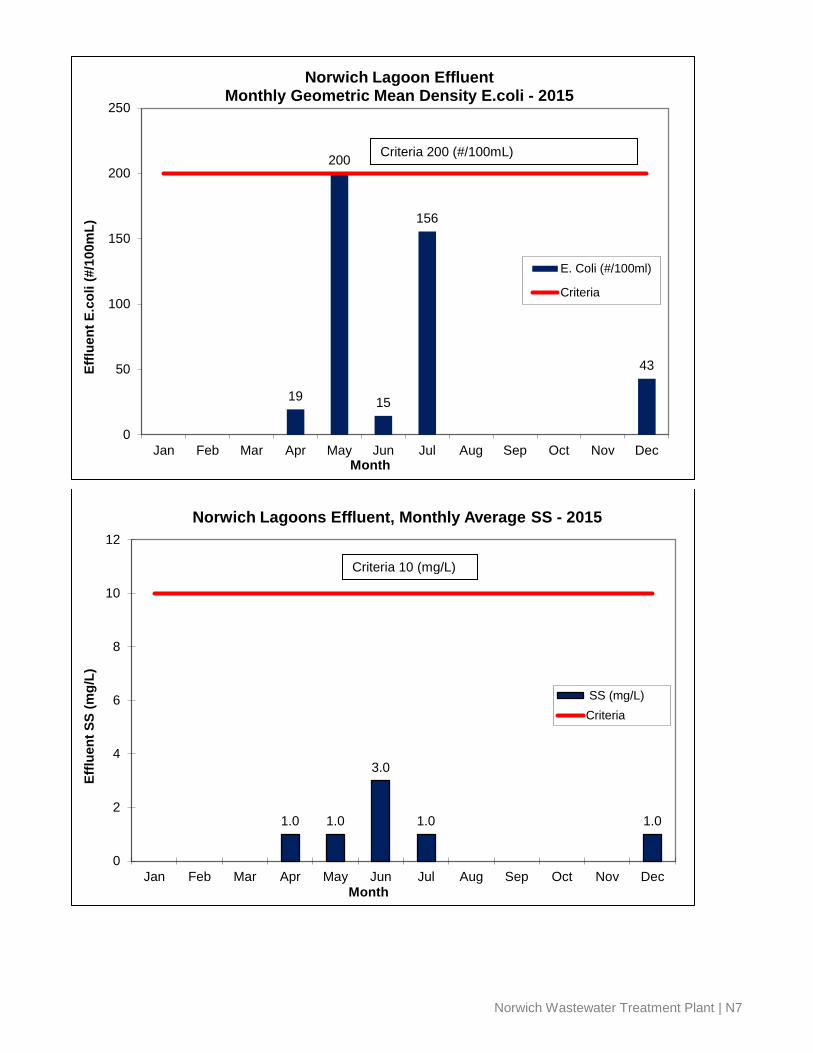
19
200
15
156
43
0
50
100
150
200
250
Jan Feb Mar Apr May Jun Jul Aug Sep Oct Nov Dec
Efflu
ent E
.col
i (#/
100m
L)
Month
Norwich Lagoon Effluent Monthly Geometric Mean Density E.coli - 2015
E. Coli (#/100ml)
Criteria
1.0 1.0
3.0
1.0 1.0
0
2
4
6
8
10
12
Jan Feb Mar Apr May Jun Jul Aug Sep Oct Nov Dec
Efflu
ent S
S (m
g/L)
Month
Norwich Lagoons Effluent, Monthly Average SS - 2015
SS (mg/L)Criteria
Criteria 200 (#/100mL)
Criteria 10 (mg/L)
Norwich Wastewater Treatment Plant | N7

6.0
5.0
1.0
2.0
5.0
0
2
4
6
8
10
12
Jan Feb Mar Apr May Jun Jul Aug Sep Oct Nov Dec
Efflu
ent B
OD
5 (m
g/L)
Month
Norwich Lagoons Effluent, Monthly Average BOD5 - 2015
BOD5 (mg/L)Criteria
Criteria 10 (mg/L)
Norwich Wastewater Treatment Plant | N8
2015 ANNUAL WASTEWATER TREATMENT SYSTEM SUMMARY REPORT
Plattsville Wastewater Treatment Plant
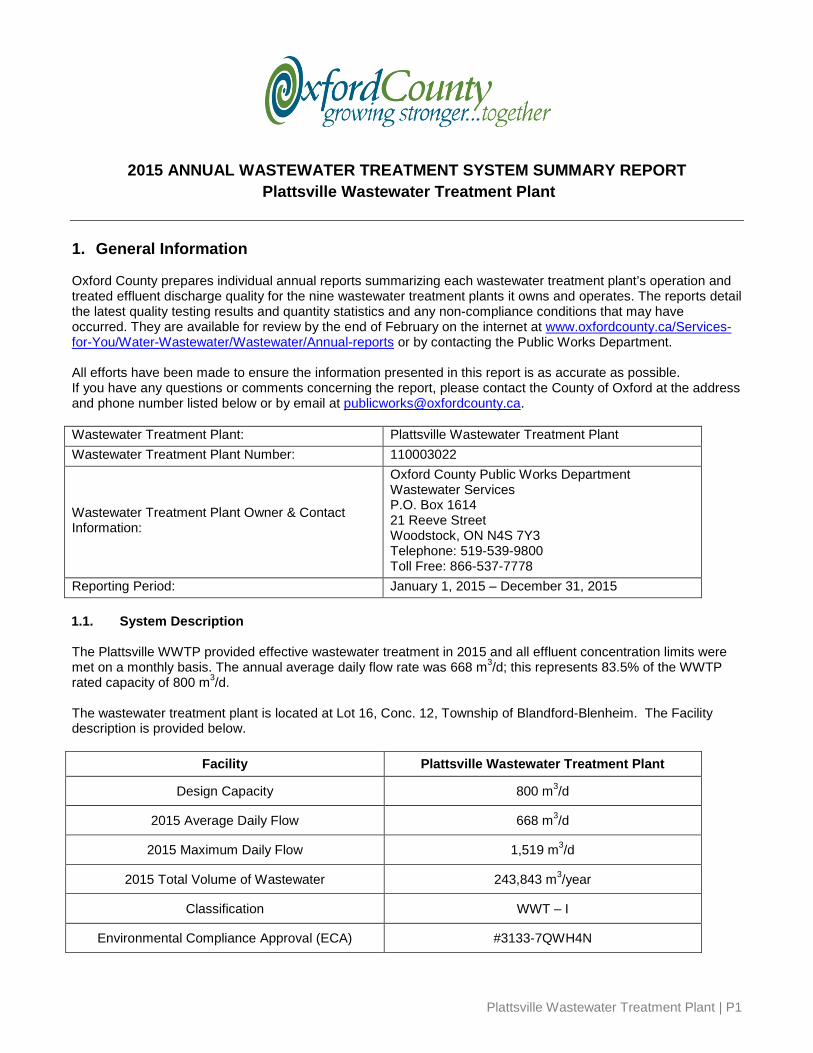
1. General Information Oxford County prepares individual annual reports summarizing each wastewater treatment plant’s operation and treated effluent discharge quality for the nine wastewater treatment plants it owns and operates. The reports detail the latest quality testing results and quantity statistics and any non-compliance conditions that may have occurred. They are available for review by the end of February on the internet at www.oxfordcounty.ca/Services-for-You/Water-Wastewater/Wastewater/Annual-reports or by contacting the Public Works Department. All efforts have been made to ensure the information presented in this report is as accurate as possible. If you have any questions or comments concerning the report, please contact the County of Oxford at the address and phone number listed below or by email at [email protected]. Wastewater Treatment Plant: Plattsville Wastewater Treatment Plant Wastewater Treatment Plant Number: 110003022
Wastewater Treatment Plant Owner & Contact Information:
Oxford County Public Works Department Wastewater Services P.O. Box 1614 21 Reeve Street Woodstock, ON N4S 7Y3 Telephone: 519-539-9800 Toll Free: 866-537-7778
Reporting Period: January 1, 2015 – December 31, 2015 1.1. System Description The Plattsville WWTP provided effective wastewater treatment in 2015 and all effluent concentration limits were met on a monthly basis. The annual average daily flow rate was 668 m3/d; this represents 83.5% of the WWTP rated capacity of 800 m3/d. The wastewater treatment plant is located at Lot 16, Conc. 12, Township of Blandford-Blenheim. The Facility description is provided below.
Facility Plattsville Wastewater Treatment Plant
Design Capacity 800 m3/d
2015 Average Daily Flow 668 m3/d
2015 Maximum Daily Flow 1,519 m3/d
2015 Total Volume of Wastewater 243,843 m3/year
Classification WWT – I
Environmental Compliance Approval (ECA) #3133-7QWH4N
Plattsville Wastewater Treatment Plant | P1

Wastewater is treated at the Plattsville WWTP, which includes two aerated lagoon cells and two conventional wastewater stabilization ponds. Phosphorus removal is accomplished through the flow paced continuous dosing of aluminum sulphate into the splitter box prior to the wastewater entering the stabilization ponds and/or when required by batch dosing via a return pump pond mixing system, which can dose either cell and recirculate the contents. Treated wastewater is pumped to an intermittent sand filter designed for ammonia removal prior to discharge to the Nith River. Oxford County operates the facility, utilizing the staff located at the Woodstock WWTP. 1.2. Operating Expenses In 2015 the Plattsville Wastewater Treatment Plant had forecasted operating and maintenance expenditures of $100,000. 2. Summary and Interpretation of Monitoring Data
2.1. Effluent Quality Assurance and Control Measures Sampling Procedure Raw influent wastewater is sampled on a monthly basis and is analyzed for BOD5, TSS, TKN, TP and pH. Effluent discharge samples are collected bi-weekly or monthly and at an interval to meet the percentage of drawdown of the lagoon cell as stipulated in the ECA during discharge periods and analyzed for CBOD5, TSS, Total Ammonia Nitrogen, TP, E.coli, temperature and pH. Laboratory and Field Testing Laboratory analyses are performed by SGS Lakefield Research Ltd. on all samples that are reported for compliance except for pH, DO, and temperature which are field collected. All in-house laboratory testing is done for process control and is not included in this report. Groundwater Testing Groundwater monitoring requires that an annual sample be collected and tested for Total Organic Carbon, Total Phosphorus, Total Kjeldahl Nitrogen, Nitrite and Nitrate. A further evaluation of the results over the last few years was conducted by a professional Hydrogeologist and a report prepared. It concluded that there was no clear evidence of an adverse effect on groundwater quality from the Plattsville WWTP. This was forwarded to the MOECC to determine if further sampling is required. Two samples were collected in 2015 and are referred to as the shallow well sample and deep well sample:
PLATTSVILLE WWTP GROUNDWATER SAMPLING
09-Jun-15 09-Jun-15 22-Sept-15 22-Sept-15
Shallow Deep Shallow Deep Parameter
TOC (mg/L) 1.9 < 1.0 2.2 2.4 Total P (mg/L) < 0.03 0.54 < 0.03 0.51 TKN (mg/L N) < 0.5 < 0.5 < 0.5 < 0.5 Ammonia/ium (mg/L) < 0.1 < 0.1 < 0.1 < 0.1 Nitrite (mg/L) < 0.03 < 0.03 < 0.03 < 0.03 Nitrate (mg/L) 0.25 < 0.06 0.25 0.11 Nitrate + Nitrite (mg/L N) 0.25 < 0.06 0.25 0.11 Chloride (mg/L) 3 19 3 21
Plattsville Wastewater Treatment Plant | P2
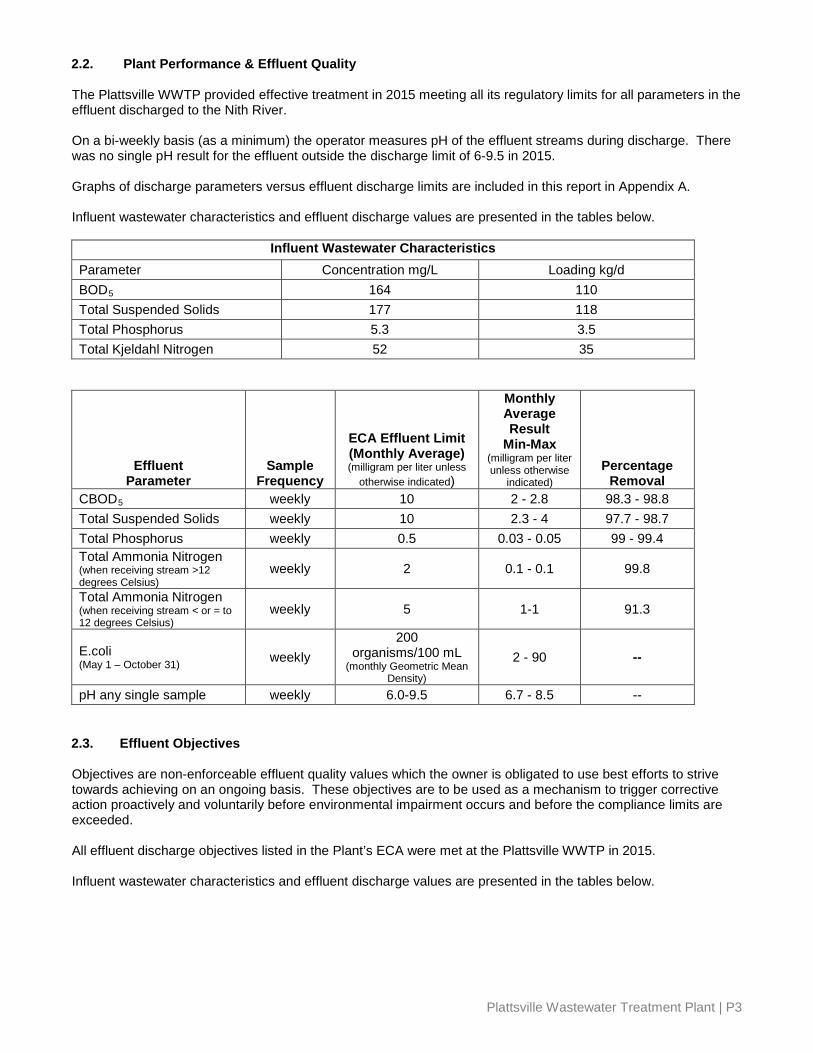
2.2. Plant Performance & Effluent Quality The Plattsville WWTP provided effective treatment in 2015 meeting all its regulatory limits for all parameters in the effluent discharged to the Nith River. On a bi-weekly basis (as a minimum) the operator measures pH of the effluent streams during discharge. There was no single pH result for the effluent outside the discharge limit of 6-9.5 in 2015. Graphs of discharge parameters versus effluent discharge limits are included in this report in Appendix A. Influent wastewater characteristics and effluent discharge values are presented in the tables below.
Influent Wastewater Characteristics Parameter Concentration mg/L Loading kg/d BOD5 164 110 Total Suspended Solids 177 118 Total Phosphorus 5.3 3.5 Total Kjeldahl Nitrogen 52 35
2.3. Effluent Objectives Objectives are non-enforceable effluent quality values which the owner is obligated to use best efforts to strive towards achieving on an ongoing basis. These objectives are to be used as a mechanism to trigger corrective action proactively and voluntarily before environmental impairment occurs and before the compliance limits are exceeded. All effluent discharge objectives listed in the Plant’s ECA were met at the Plattsville WWTP in 2015. Influent wastewater characteristics and effluent discharge values are presented in the tables below.
Effluent Parameter
Sample Frequency
ECA Effluent Limit (Monthly Average) (milligram per liter unless
otherwise indicated)
Monthly Average Result
Min-Max (milligram per liter unless otherwise
indicated) Percentage
Removal CBOD5 weekly 10 2 - 2.8 98.3 - 98.8 Total Suspended Solids weekly 10 2.3 - 4 97.7 - 98.7 Total Phosphorus weekly 0.5 0.03 - 0.05 99 - 99.4 Total Ammonia Nitrogen (when receiving stream >12 degrees Celsius)
weekly 2 0.1 - 0.1 99.8
Total Ammonia Nitrogen (when receiving stream < or = to 12 degrees Celsius)
weekly 5 1-1 91.3
E.coli (May 1 – October 31) weekly
200 organisms/100 mL
(monthly Geometric Mean Density)
2 - 90 --
pH any single sample weekly 6.0-9.5 6.7 - 8.5 --
Plattsville Wastewater Treatment Plant | P3
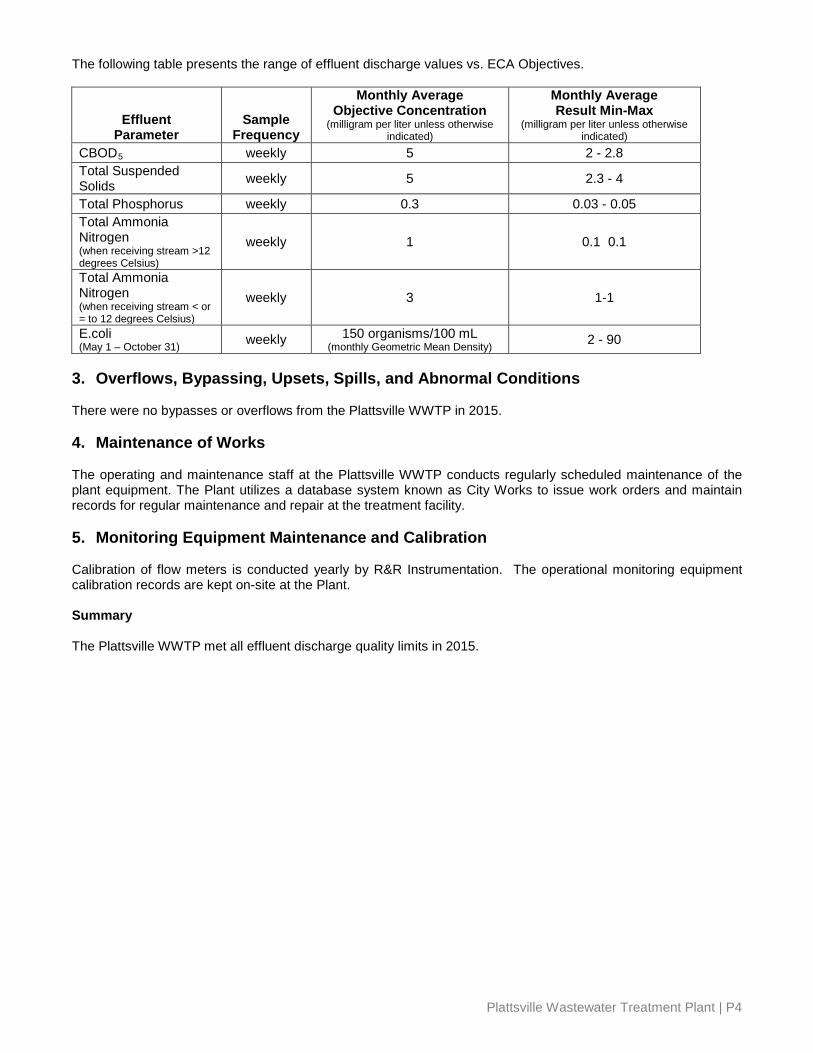
The following table presents the range of effluent discharge values vs. ECA Objectives.
Effluent Parameter
Sample Frequency
Monthly Average Objective Concentration
(milligram per liter unless otherwise indicated)
Monthly Average Result Min-Max
(milligram per liter unless otherwise indicated)
CBOD5 weekly 5 2 - 2.8 Total Suspended Solids weekly 5 2.3 - 4
Total Phosphorus weekly 0.3 0.03 - 0.05 Total Ammonia Nitrogen (when receiving stream >12 degrees Celsius)
weekly 1 0.1 0.1
Total Ammonia Nitrogen (when receiving stream < or = to 12 degrees Celsius)
weekly 3 1-1
E.coli (May 1 – October 31) weekly 150 organisms/100 mL
(monthly Geometric Mean Density) 2 - 90 3. Overflows, Bypassing, Upsets, Spills, and Abnormal Conditions There were no bypasses or overflows from the Plattsville WWTP in 2015. 4. Maintenance of Works
The operating and maintenance staff at the Plattsville WWTP conducts regularly scheduled maintenance of the plant equipment. The Plant utilizes a database system known as City Works to issue work orders and maintain records for regular maintenance and repair at the treatment facility. 5. Monitoring Equipment Maintenance and Calibration Calibration of flow meters is conducted yearly by R&R Instrumentation. The operational monitoring equipment calibration records are kept on-site at the Plant. Summary The Plattsville WWTP met all effluent discharge quality limits in 2015.
Plattsville Wastewater Treatment Plant | P4
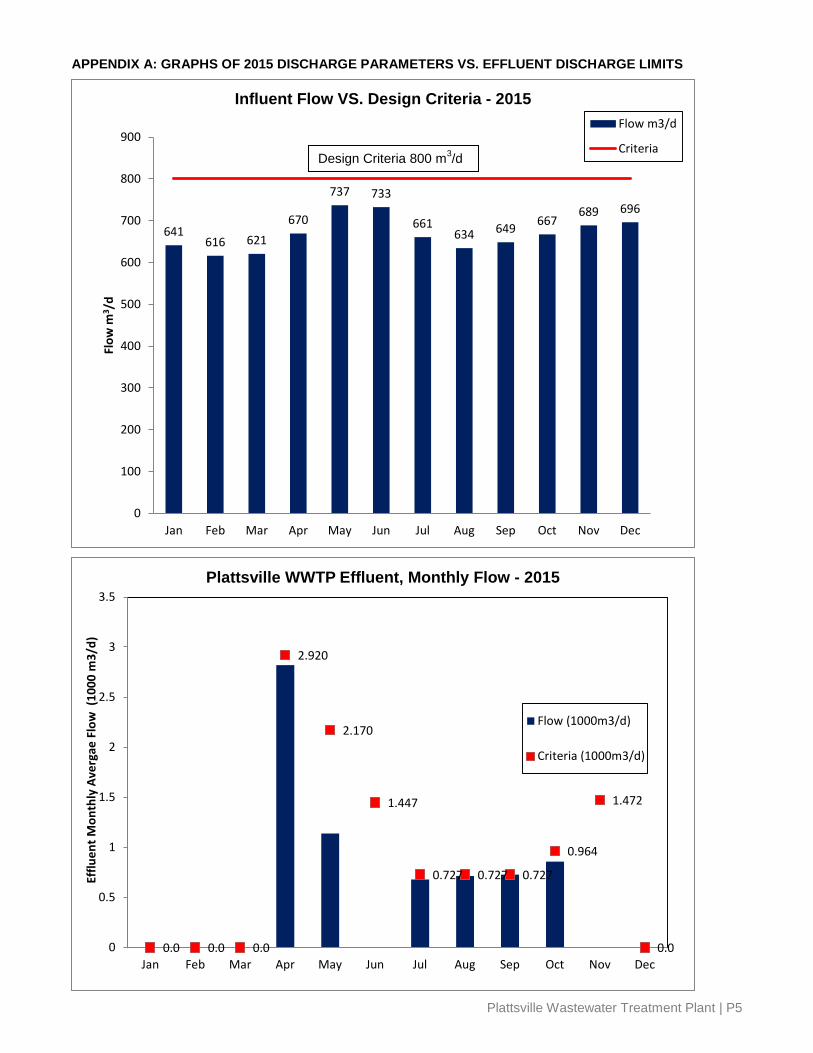
APPENDIX A: GRAPHS OF 2015 DISCHARGE PARAMETERS VS. EFFLUENT DISCHARGE LIMITS
641 616 621
670
737 733
661 634 649 667
689 696
0
100
200
300
400
500
600
700
800
900
Jan Feb Mar Apr May Jun Jul Aug Sep Oct Nov Dec
Flow
m3 /
d Influent Flow VS. Design Criteria - 2015
Flow m3/d
Criteria
0.0 0.0 0.0
2.920
2.170
1.447
0.727 0.727 0.727
0.964
1.472
0.0 0
0.5
1
1.5
2
2.5
3
3.5
Jan Feb Mar Apr May Jun Jul Aug Sep Oct Nov Dec
Efflu
ent M
onth
ly A
verg
ae F
low
(10
00 m
3/d)
Plattsville WWTP Effluent, Monthly Flow - 2015
Flow (1000m3/d)
Criteria (1000m3/d)
Design Criteria 800 m3/d
Plattsville Wastewater Treatment Plant | P5

1.0
0.1 0.10 0.10 0.1 0.10 0
1
2
3
4
5
6
Jan Feb Mar Apr May Jun Jul Aug Sep Oct Nov Dec
Efflu
ent A
mm
onia
(mg/
L)
Month
Plattsville WWTP Effluent Monthly Average Ammonia Discharge - 2015
Ammonia (mg/L)
Freezing Criteria
Non-freezing periodCriteria
0.03 0.03 0.05 0.05
0.03 0.04
0.0
0.1
0.2
0.3
0.4
0.5
0.6
Jan Feb Mar Apr May Jun Jul Aug Sep Oct Nov Dec
Efflu
ent T
P (m
g/L)
Month
Plattsville WWTP Effluent, Monthly Average TP - 2015
TP (mg/L)
Criteria
Freezing Criteria 5 (mg/L)
Non-freezing Criteria 2 (mg/L)
Freezing Criteria 5 (mg/L)
Criteria 0.5 (mg/L)
Plattsville Wastewater Treatment Plant | P6
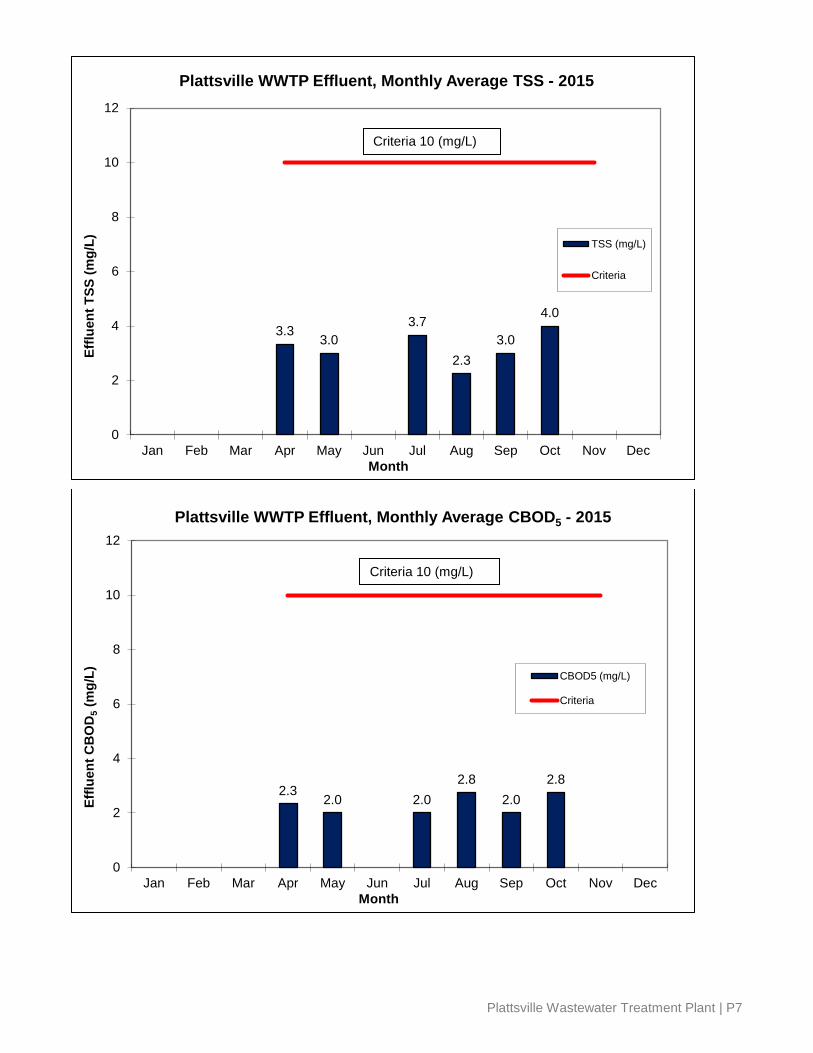
3.3 3.0
3.7
2.3 3.0
4.0
0
2
4
6
8
10
12
Jan Feb Mar Apr May Jun Jul Aug Sep Oct Nov Dec
Efflu
ent T
SS (m
g/L)
Month
Plattsville WWTP Effluent, Monthly Average TSS - 2015
TSS (mg/L)
Criteria
2.3 2.0 2.0
2.8 2.0
2.8
0
2
4
6
8
10
12
Jan Feb Mar Apr May Jun Jul Aug Sep Oct Nov Dec
Efflu
ent C
BO
D5 (
mg/
L)
Month
Plattsville WWTP Effluent, Monthly Average CBOD5 - 2015
CBOD5 (mg/L)
Criteria
Criteria 10 (mg/L)
Criteria 10 (mg/L)
Plattsville Wastewater Treatment Plant | P7
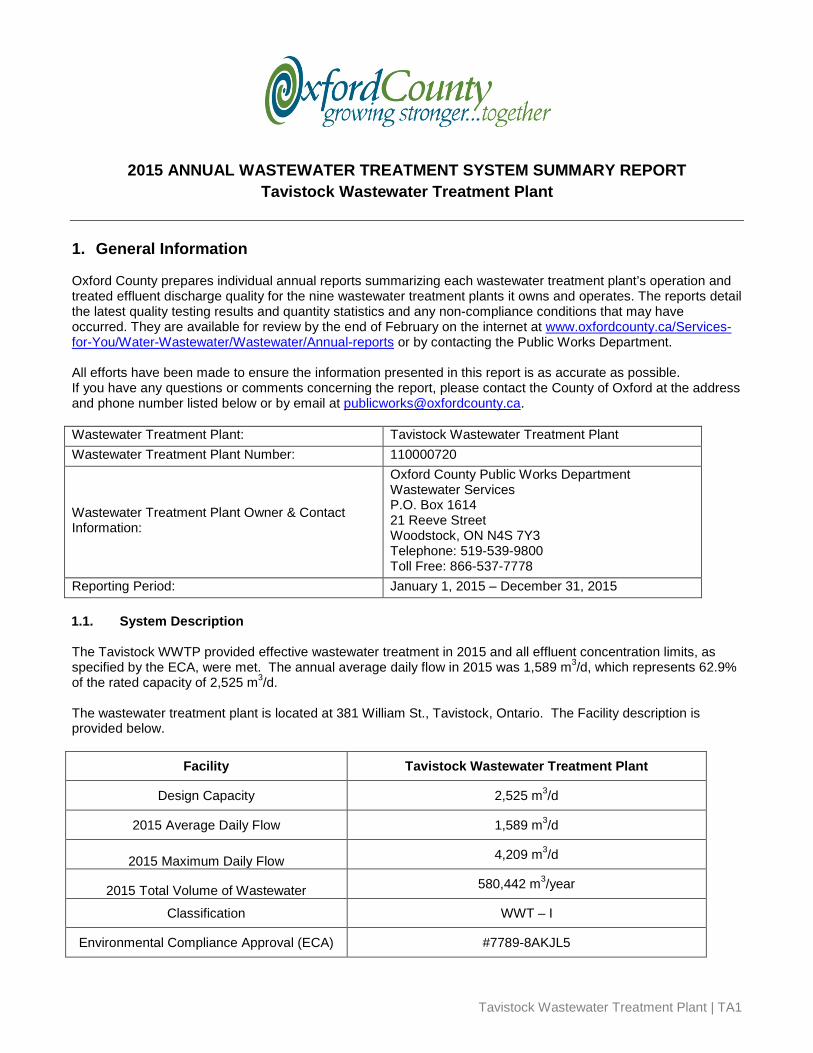
2015 ANNUAL WASTEWATER TREATMENT SYSTEM SUMMARY REPORT
Tavistock Wastewater Treatment Plant
1. General Information Oxford County prepares individual annual reports summarizing each wastewater treatment plant’s operation and treated effluent discharge quality for the nine wastewater treatment plants it owns and operates. The reports detail the latest quality testing results and quantity statistics and any non-compliance conditions that may have occurred. They are available for review by the end of February on the internet at www.oxfordcounty.ca/Services-for-You/Water-Wastewater/Wastewater/Annual-reports or by contacting the Public Works Department. All efforts have been made to ensure the information presented in this report is as accurate as possible. If you have any questions or comments concerning the report, please contact the County of Oxford at the address and phone number listed below or by email at [email protected]. Wastewater Treatment Plant: Tavistock Wastewater Treatment Plant Wastewater Treatment Plant Number: 110000720
Wastewater Treatment Plant Owner & Contact Information:
Oxford County Public Works Department Wastewater Services P.O. Box 1614 21 Reeve Street Woodstock, ON N4S 7Y3 Telephone: 519-539-9800 Toll Free: 866-537-7778
Reporting Period: January 1, 2015 – December 31, 2015 1.1. System Description The Tavistock WWTP provided effective wastewater treatment in 2015 and all effluent concentration limits, as specified by the ECA, were met. The annual average daily flow in 2015 was 1,589 m3/d, which represents 62.9% of the rated capacity of 2,525 m3/d. The wastewater treatment plant is located at 381 William St., Tavistock, Ontario. The Facility description is provided below.
Facility Tavistock Wastewater Treatment Plant
Design Capacity 2,525 m3/d
2015 Average Daily Flow 1,589 m3/d
2015 Maximum Daily Flow 4,209 m3/d
2015 Total Volume of Wastewater 580,442 m3/year
Classification WWT – I
Environmental Compliance Approval (ECA) #7789-8AKJL5
Tavistock Wastewater Treatment Plant | TA1
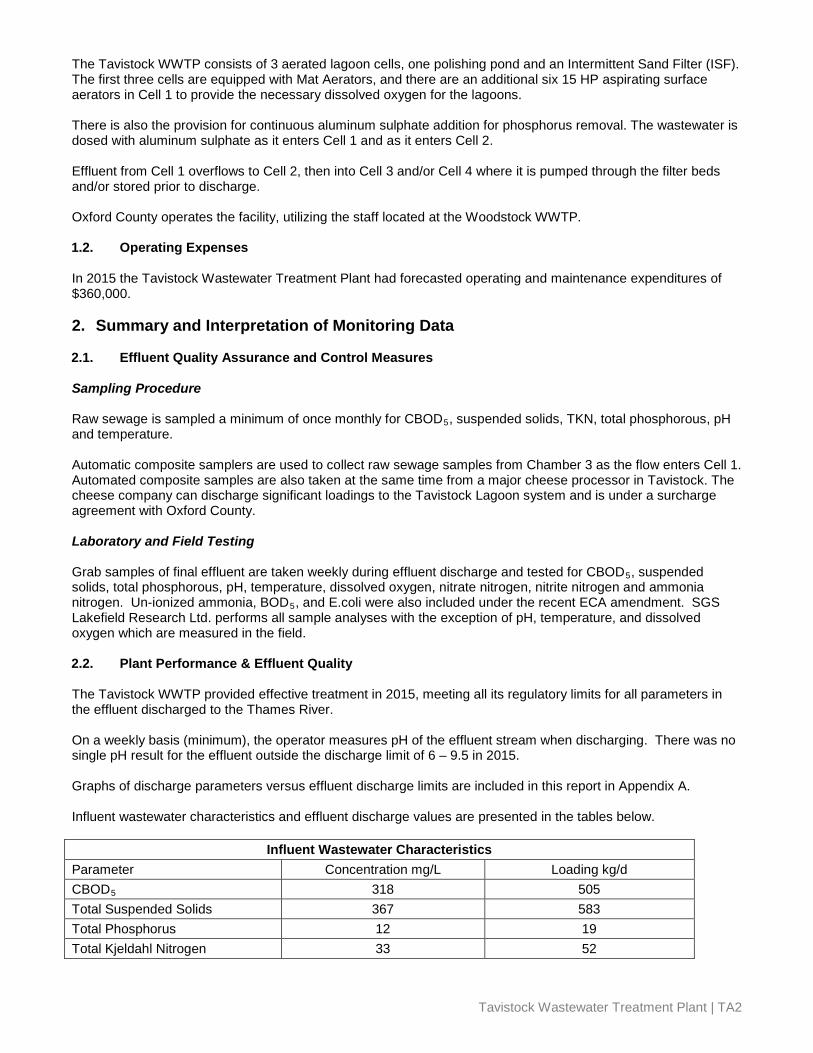
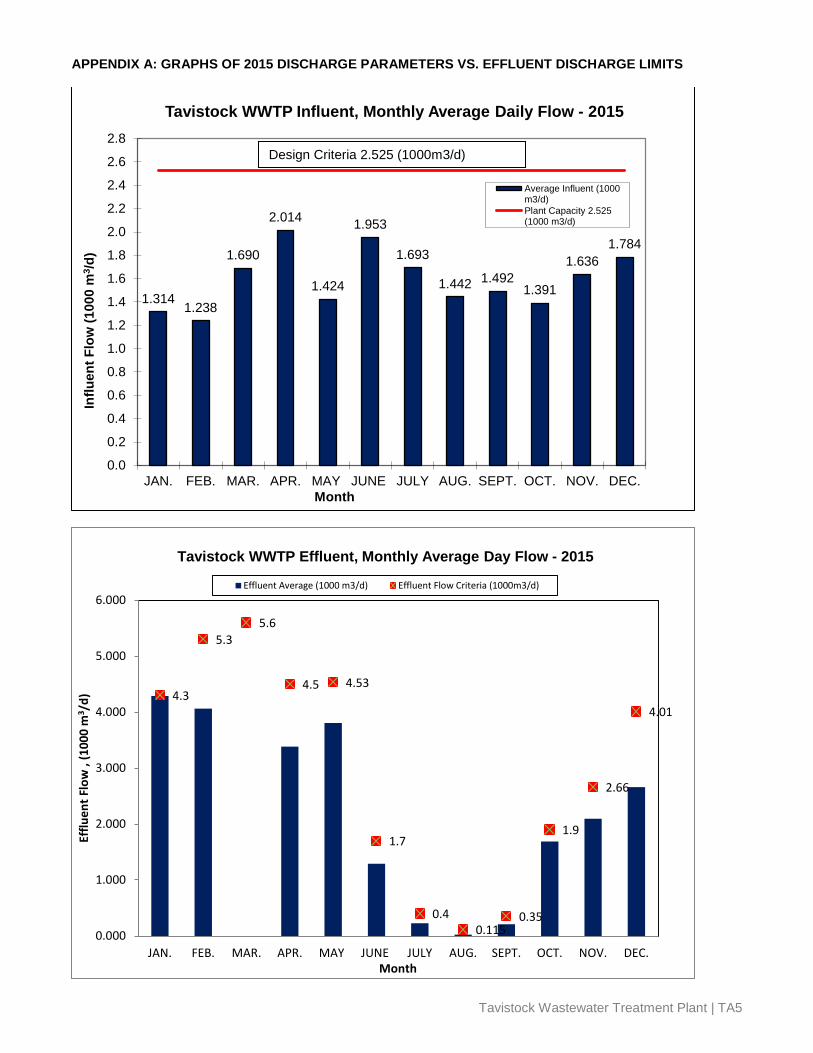
The Tavistock WWTP consists of 3 aerated lagoon cells, one polishing pond and an Intermittent Sand Filter (ISF). The first three cells are equipped with Mat Aerators, and there are an additional six 15 HP aspirating surface aerators in Cell 1 to provide the necessary dissolved oxygen for the lagoons. There is also the provision for continuous aluminum sulphate addition for phosphorus removal. The wastewater is dosed with aluminum sulphate as it enters Cell 1 and as it enters Cell 2. Effluent from Cell 1 overflows to Cell 2, then into Cell 3 and/or Cell 4 where it is pumped through the filter beds and/or stored prior to discharge. Oxford County operates the facility, utilizing the staff located at the Woodstock WWTP. 1.2. Operating Expenses In 2015 the Tavistock Wastewater Treatment Plant had forecasted operating and maintenance expenditures of $360,000. 2. Summary and Interpretation of Monitoring Data 2.1. Effluent Quality Assurance and Control Measures Sampling Procedure Raw sewage is sampled a minimum of once monthly for CBOD5, suspended solids, TKN, total phosphorous, pH and temperature. Automatic composite samplers are used to collect raw sewage samples from Chamber 3 as the flow enters Cell 1. Automated composite samples are also taken at the same time from a major cheese processor in Tavistock. The cheese company can discharge significant loadings to the Tavistock Lagoon system and is under a surcharge agreement with Oxford County. Laboratory and Field Testing Grab samples of final effluent are taken weekly during effluent discharge and tested for CBOD5, suspended solids, total phosphorous, pH, temperature, dissolved oxygen, nitrate nitrogen, nitrite nitrogen and ammonia nitrogen. Un-ionized ammonia, BOD5, and E.coli were also included under the recent ECA amendment. SGS Lakefield Research Ltd. performs all sample analyses with the exception of pH, temperature, and dissolved oxygen which are measured in the field. 2.2. Plant Performance & Effluent Quality The Tavistock WWTP provided effective treatment in 2015, meeting all its regulatory limits for all parameters in the effluent discharged to the Thames River. On a weekly basis (minimum), the operator measures pH of the effluent stream when discharging. There was no single pH result for the effluent outside the discharge limit of 6 – 9.5 in 2015. Graphs of discharge parameters versus effluent discharge limits are included in this report in Appendix A. Influent wastewater characteristics and effluent discharge values are presented in the tables below.
Influent Wastewater Characteristics Parameter Concentration mg/L Loading kg/d CBOD5 318 505 Total Suspended Solids 367 583 Total Phosphorus 12 19 Total Kjeldahl Nitrogen 33 52
Tavistock Wastewater Treatment Plant | TA2
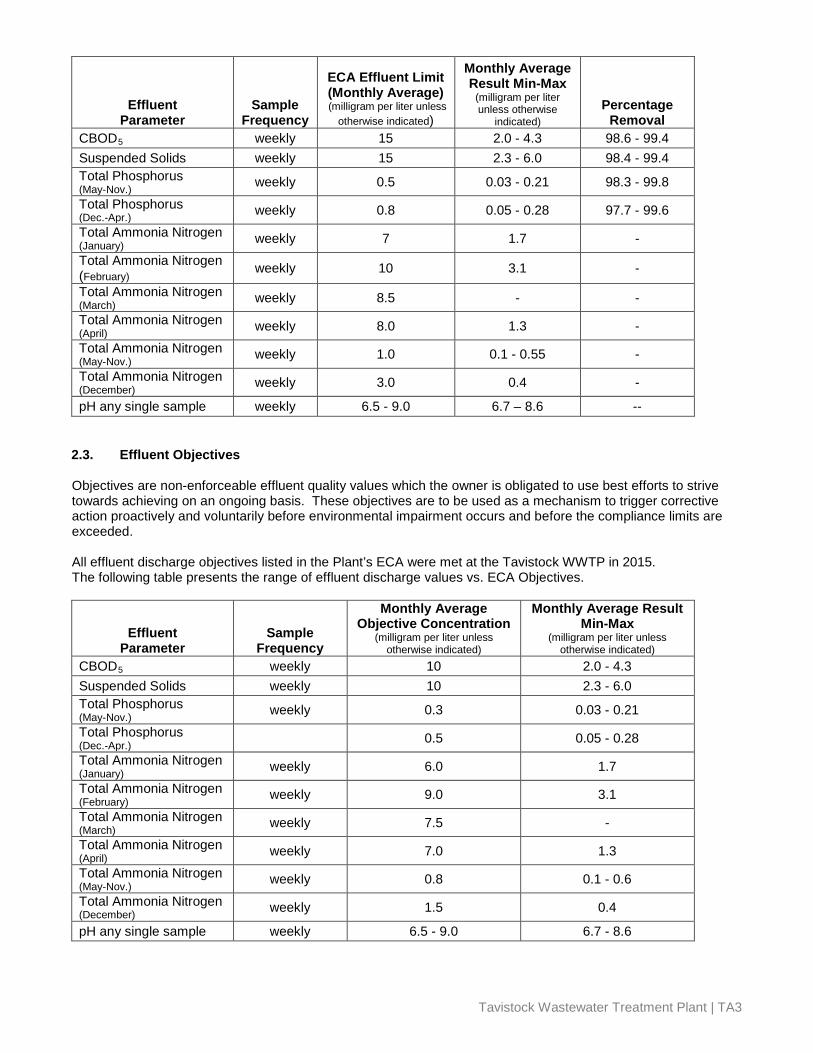
Effluent Parameter
Sample Frequency
ECA Effluent Limit (Monthly Average) (milligram per liter unless
otherwise indicated)
Monthly Average Result Min-Max
(milligram per liter unless otherwise
indicated) Percentage
Removal CBOD5 weekly 15 2.0 - 4.3 98.6 - 99.4 Suspended Solids weekly 15 2.3 - 6.0 98.4 - 99.4 Total Phosphorus (May-Nov.) weekly 0.5 0.03 - 0.21 98.3 - 99.8 Total Phosphorus (Dec.-Apr.) weekly 0.8 0.05 - 0.28 97.7 - 99.6 Total Ammonia Nitrogen (January) weekly 7 1.7 - Total Ammonia Nitrogen (February) weekly 10 3.1 -
Total Ammonia Nitrogen (March) weekly 8.5 - - Total Ammonia Nitrogen (April) weekly 8.0 1.3 - Total Ammonia Nitrogen (May-Nov.) weekly 1.0 0.1 - 0.55 -
Total Ammonia Nitrogen (December) weekly 3.0 0.4 -
pH any single sample weekly 6.5 - 9.0 6.7 – 8.6 -- 2.3. Effluent Objectives Objectives are non-enforceable effluent quality values which the owner is obligated to use best efforts to strive towards achieving on an ongoing basis. These objectives are to be used as a mechanism to trigger corrective action proactively and voluntarily before environmental impairment occurs and before the compliance limits are exceeded. All effluent discharge objectives listed in the Plant’s ECA were met at the Tavistock WWTP in 2015. The following table presents the range of effluent discharge values vs. ECA Objectives.
Effluent Parameter
Sample Frequency
Monthly Average Objective Concentration
(milligram per liter unless otherwise indicated)
Monthly Average Result Min-Max
(milligram per liter unless otherwise indicated)
CBOD5 weekly 10 2.0 - 4.3 Suspended Solids weekly 10 2.3 - 6.0 Total Phosphorus (May-Nov.) weekly 0.3 0.03 - 0.21
Total Phosphorus (Dec.-Apr.) 0.5 0.05 - 0.28 Total Ammonia Nitrogen (January) weekly 6.0 1.7 Total Ammonia Nitrogen (February) weekly 9.0 3.1
Total Ammonia Nitrogen (March) weekly 7.5 - Total Ammonia Nitrogen (April) weekly 7.0 1.3 Total Ammonia Nitrogen (May-Nov.) weekly 0.8 0.1 - 0.6
Total Ammonia Nitrogen (December) weekly 1.5 0.4
pH any single sample weekly 6.5 - 9.0 6.7 - 8.6
Tavistock Wastewater Treatment Plant | TA3
3. Overflows, Bypassing, Upsets, Spills, and Abnormal Conditions There were no bypasses or overflows from the Tavistock WWTP in 2015. 4. Maintenance of Works
The operating and maintenance staff at the Woodstock WWTP conducts regularly scheduled maintenance of the plant equipment. The Plant utilizes a database system known as City Works to issue work orders and maintain records for regular maintenance and repair at the treatment facility. 5. Monitoring Equipment Maintenance and Calibration Calibration of flow meters is conducted yearly by R&R Instrumentation. The operational monitoring equipment calibration records are kept on-site at the Plant. Summary The Tavistock WWTP operated within its design flow criteria and met all effluent discharge quality limits in 2015.
Tavistock Wastewater Treatment Plant | TA4
APPENDIX A: GRAPHS OF 2015 DISCHARGE PARAMETERS VS. EFFLUENT DISCHARGE LIMITS
1.314 1.238
1.690
2.014
1.424
1.953
1.693
1.442 1.492 1.391
1.636 1.784
0.0
0.2
0.4
0.6
0.8
1.0
1.2
1.4
1.6
1.8
2.0
2.2
2.4
2.6
2.8
JAN. FEB. MAR. APR. MAY JUNE JULY AUG. SEPT. OCT. NOV. DEC.
Influ
ent F
low
(100
0 m
3 /d)
Month
Tavistock WWTP Influent, Monthly Average Daily Flow - 2015
Average Influent (1000m3/d)Plant Capacity 2.525(1000 m3/d)
4.3
5.3 5.6
4.5 4.53
1.7
0.4 0.115
0.35
1.9
2.66
4.01
0.000
1.000
2.000
3.000
4.000
5.000
6.000
JAN. FEB. MAR. APR. MAY JUNE JULY AUG. SEPT. OCT. NOV. DEC.
Efflu
ent F
low
, (1
000
m3 /
d)
Month
Tavistock WWTP Effluent, Monthly Average Day Flow - 2015
Effluent Average (1000 m3/d) Effluent Flow Criteria (1000m3/d)
Design Criteria 2.525 (1000m3/d)
Tavistock Wastewater Treatment Plant | TA5

2.8
4.3
2.0 2.0 2.0 2.0 2.5
2.0
3.8
2.0 2.0
0.0
2.0
4.0
6.0
8.0
10.0
12.0
14.0
16.0
JAN. FEB. MAR. APR. MAY JUNE JULY AUG. SEPT. OCT. NOV. DEC.
Efflu
ent C
BO
D5 (
mg/
L)
Month
Tavistock Wastewater Effluent Monthly Average CBOD5 - 2015
CBOD5 (mg/L)
CBOD5 Criteria(mg/L)
1.7
3.1
1.3
0.1 0.1 0.1 0.1 0.1 0.6
0.1 0.4
7
10
8.5 8
3
0.0
2.0
4.0
6.0
8.0
10.0
12.0
JAN. FEB. MAR. APR. MAY JUNE JULY AUG. SEPT. OCT. NOV. DEC.
Efflu
ent A
mm
onia
(mg/
L)
Month
Tavistock WWTP Effluent, Monthly Average Ammonia - 2015
AMMONIA (mg/L)
NH3-N Criteria (mg/L)
NH3-N Criteria (mg/L)
Criteria 15 (mg/L)
Criteria 1.0 (mg/L)
Tavistock Wastewater Treatment Plant | TA6
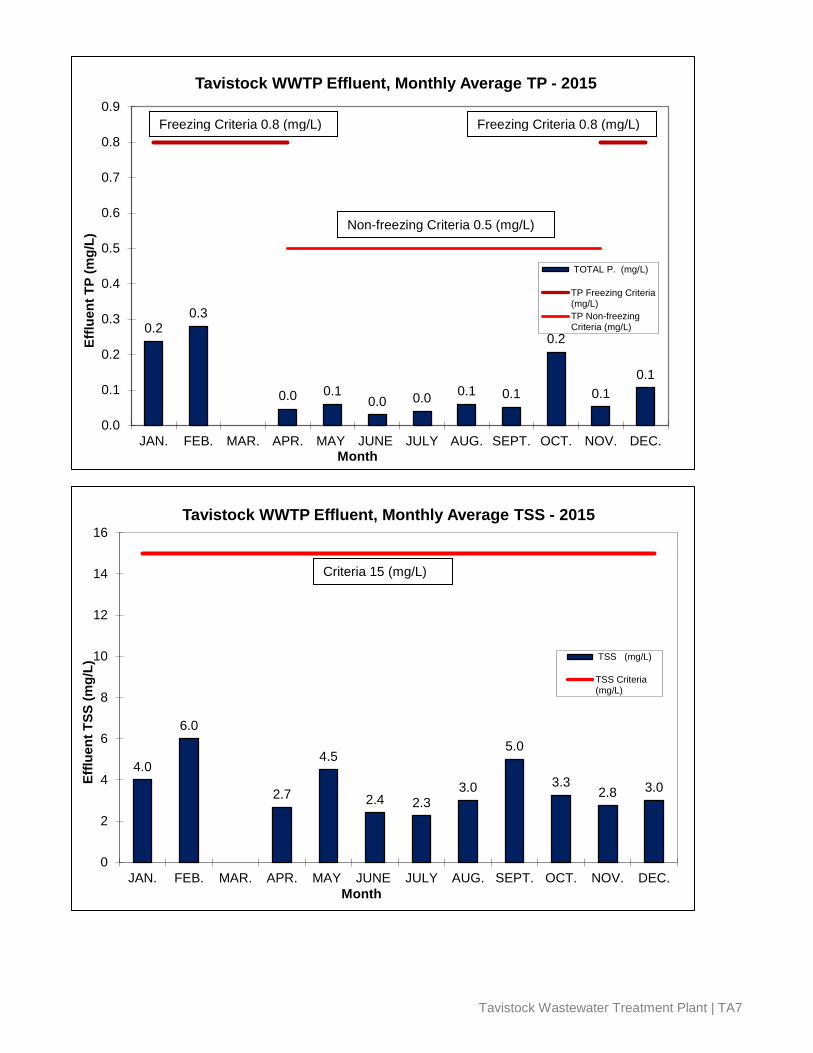
0.2 0.3
0.0 0.1 0.0 0.0 0.1 0.1
0.2
0.1 0.1
0.0
0.1
0.2
0.3
0.4
0.5
0.6
0.7
0.8
0.9
JAN. FEB. MAR. APR. MAY JUNE JULY AUG. SEPT. OCT. NOV. DEC.
Efflu
ent T
P (m
g/L)
Month
Tavistock WWTP Effluent, Monthly Average TP - 2015
TOTAL P. (mg/L)
TP Freezing Criteria(mg/L)TP Non-freezingCriteria (mg/L)
4.0
6.0
2.7
4.5
2.4 2.3 3.0
5.0
3.3 2.8 3.0
0
2
4
6
8
10
12
14
16
JAN. FEB. MAR. APR. MAY JUNE JULY AUG. SEPT. OCT. NOV. DEC.
Efflu
ent T
SS (m
g/L)
Month
Tavistock WWTP Effluent, Monthly Average TSS - 2015
TSS (mg/L)
TSS Criteria(mg/L)
Non-freezing Criteria 0.5 (mg/L)
Freezing Criteria 0.8 (mg/L) Freezing Criteria 0.8 (mg/L)
Criteria 15 (mg/L)
Tavistock Wastewater Treatment Plant | TA7

2015 ANNUAL WASTEWATER TREATMENT SYSTEM SUMMARY REPORT
Thamesford Wastewater Treatment Plant
1. General Information Oxford County prepares individual annual reports summarizing each wastewater treatment plant’s operation and treated effluent discharge quality for the nine wastewater treatment plants it owns and operates. The reports detail the latest quality testing results and quantity statistics and any non-compliance conditions that may have occurred. They are available for review by the end of February on the internet at www.oxfordcounty.ca/Services-for-You/Water-Wastewater/Wastewater/Annual-reports or by contacting the Public Works Department. All efforts have been made to ensure the information presented in this report is as accurate as possible. If you have any questions or comments concerning the report, please contact the County of Oxford at the address and phone number listed below or by email at [email protected]. Wastewater Treatment Plant: Thamesford Wastewater Treatment Plant Wastewater Treatment Plant Number: 120002601
Wastewater Treatment Plant Owner & Contact Information:
Oxford County Public Works Department Wastewater Services P.O. Box 1614, 21 Reeve Street Woodstock, ON N4S 7Y3 Telephone: 519-539-9800 | Toll Free: 866-537-7778
Reporting Period: January 1, 2015 – December 31, 2015 1.1. System Description The Thamesford Wastewater Treatment Plant (WWTP) provided effective wastewater treatment in 2015 for residential, commercial, and industrial users in the Village of Thamesford. The average daily flow for 2015 was 1,425 m3/d. This represents 57% of the Plant rated capacity of 2,500 m3/d. The total annual flow was 520,238 m3. A new blower was installed at the Plant which necessitated an updated ECA. The blower change and the use of a variable frequency drive (VFD) integrated into a SCADA control loop using dissolved oxygen feedback, was intended to reduce electrical consumption. One of the two existing 40 HP blowers was replaced with a new more efficient 100 HP blower which could then be used in combination with the other 40 HP blower and the two existing 200 HP blowers for a more flexible and efficient operation of the oxygen delivery system to the biological system. In addition to increased energy efficiency, this proactive change would result in lower GHG emissions to the atmosphere. An updated ECA was received in October 2015. The blower installation will be complete in 2016. The wastewater treatment plant is located at 10 Middleton St., Thamesford, Ontario. The Facility description is provided below.
Facility Thamesford Wastewater Treatment Plant Design Capacity 2,500 m3/d
2015 Average Daily Flow 1,425 m3/d 2015 Maximum Daily Flow 2,139 m3/d
2015 Total Volume of Wastewater 520,238 m3/year Classification WWT – III
Environmental Compliance Approval (ECA) #6974-6FKKAY & 1897-9YAKKF
Thamesford Wastewater Treatment Plant | TA1

The Thamesford WWTP is an extended air activated sludge plant equipped with tertiary sand filters and receives significant wastewater flows from a local major poultry processing plant; however, the treatment plant also receives domestic wastewater from the Community of Thamesford. The wastewater from the poultry processing plant is collected from various on-site business units and pumped to a pretreatment system comprised of an equalization silo and a Dissolved Air Flotation (DAF) unit. The company’s effluent enters a lift station dedicated to their wastewater flow at the Wastewater Treatment Plant where it is pumped to the complete mix aeration basin prior to a plug flow reactor. The extended aeration system is comprised of two tanks: the complete mix basin and the plug flow reactor. After the plug flow reactor, the wastewater flows into one of two clarifiers where the settled activated sludge is either returned or wasted and the supernatant flows to either the old or the new sand filter, prior to disinfection and direct discharge to the Middle Thames River. Wasted biosolids are processed/stabilized in two aerobic digesters, and held on-site in a storage tank for eventual removal. Biosolids are applied to agricultural land application sites with appropriate Nutrient Management Plans for Non-Agricultural Source Material (NASM). For purposes of calculating loading to the River, the treated effluent flow is measured at the Parshall flume located after the stilling well just before discharge to the re-aeration chamber and the Middle Thames River. The flow readings used to apportion the loading to the plant is from two meters: one on each lift station. The influent and all other meters are calibrated annually. A standby generator is available to run the onsite lift stations and a blower in the event of a power failure. The system is maintained by licensed wastewater system operators and licensed mechanics that operate, monitor, and maintain the treatment equipment, in accordance to the regulations, and collect samples as required by the ECA. Alarms automatically notify operators in the event of failure of critical operational requirements. 1.2. Operating Expenses In 2015, the Thamesford Wastewater Treatment Plant had forecasted operating and maintenance expenditures of $800,000. 2. Summary and Interpretation of Monitoring Data 2.1. Effluent Quality Assurance and Control Measures Sampling Procedure Influent samples were taken from sampling ports located in-line after the influent pumps. Two 24-hour composite samplers take a sample every 15 minutes for a 24-hour period concurrent with effluent sampling. A sampler is installed on each of the municipal and the food processing company’s influent lines. The two influent streams are separately tested, and then the results are mathematically combined, based on flow ratios. In 2015, effluent samples were taken using a 24-hour composite sampler set to take a sample every 15 minutes for 24 hours. Samples were drawn from a stilling well prior to the Parshall flume immediately before the discharge. Total residual chlorine (TRC) samples are taken daily from the stilling well prior to the Parshall flume. The stilling well follows the chlorination and de-chlorination chambers. The pH of the final effluent composite sample is also measured. Following the Parshall flume, effluent flows through a discharge pipe and drops approximately 0.75 m into a discharge well, where dissolved oxygen samples are taken. This discharge well aerates the effluent prior to discharge to the River, as reflected in the DO sample results. Laboratory and Field Testing Laboratory analysis is performed by SGS Lakefield Research Ltd. on all samples, except for TRC, DO, and pH which are tested in the field. These results are used for determination of compliance. Any information generated in-house is used in process control but is not included in this report.
Thamesford Wastewater Treatment Plant | TA2
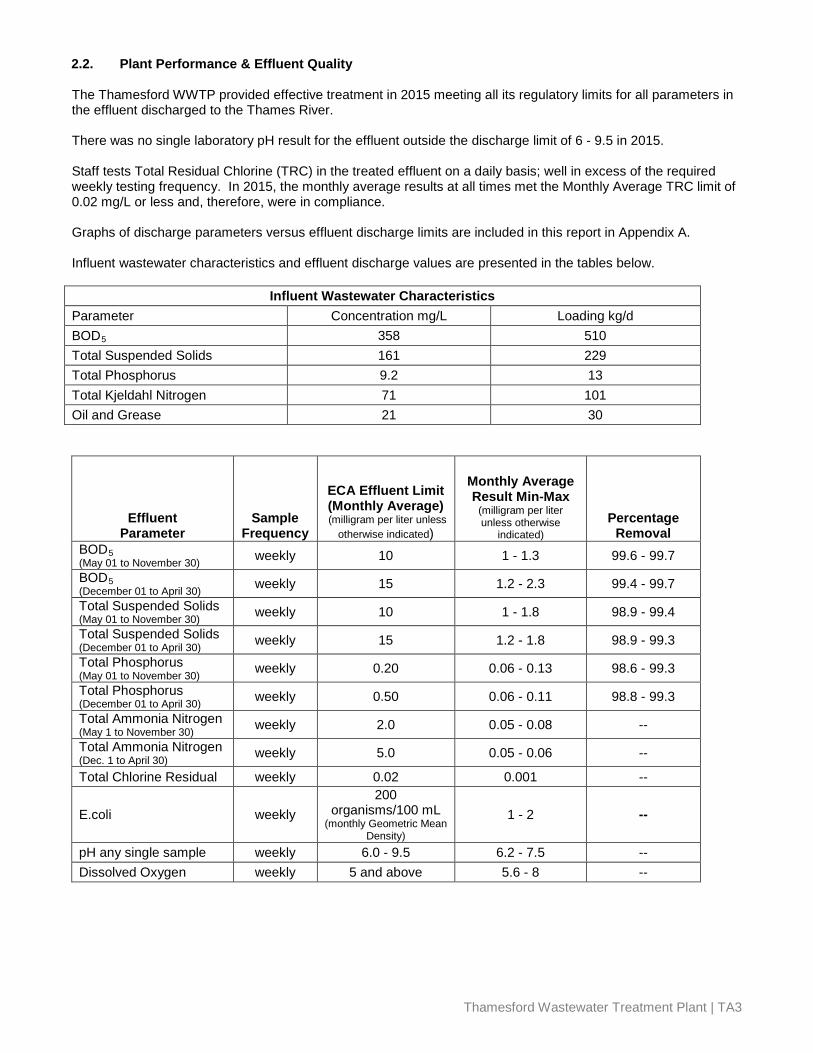
2.2. Plant Performance & Effluent Quality The Thamesford WWTP provided effective treatment in 2015 meeting all its regulatory limits for all parameters in the effluent discharged to the Thames River. There was no single laboratory pH result for the effluent outside the discharge limit of 6 - 9.5 in 2015. Staff tests Total Residual Chlorine (TRC) in the treated effluent on a daily basis; well in excess of the required weekly testing frequency. In 2015, the monthly average results at all times met the Monthly Average TRC limit of 0.02 mg/L or less and, therefore, were in compliance. Graphs of discharge parameters versus effluent discharge limits are included in this report in Appendix A. Influent wastewater characteristics and effluent discharge values are presented in the tables below.
Influent Wastewater Characteristics Parameter Concentration mg/L Loading kg/d BOD5 358 510 Total Suspended Solids 161 229 Total Phosphorus 9.2 13 Total Kjeldahl Nitrogen 71 101 Oil and Grease 21 30
Effluent Parameter
Sample Frequency
ECA Effluent Limit (Monthly Average) (milligram per liter unless
otherwise indicated)
Monthly Average Result Min-Max
(milligram per liter unless otherwise
indicated) Percentage
Removal BOD5 (May 01 to November 30) weekly 10 1 - 1.3 99.6 - 99.7 BOD5 (December 01 to April 30) weekly 15 1.2 - 2.3 99.4 - 99.7
Total Suspended Solids (May 01 to November 30) weekly 10 1 - 1.8 98.9 - 99.4 Total Suspended Solids (December 01 to April 30) weekly 15 1.2 - 1.8 98.9 - 99.3 Total Phosphorus (May 01 to November 30) weekly 0.20 0.06 - 0.13 98.6 - 99.3
Total Phosphorus (December 01 to April 30) weekly 0.50 0.06 - 0.11 98.8 - 99.3 Total Ammonia Nitrogen (May 1 to November 30) weekly 2.0 0.05 - 0.08 -- Total Ammonia Nitrogen (Dec. 1 to April 30) weekly 5.0 0.05 - 0.06 --
Total Chlorine Residual weekly 0.02 0.001 --
E.coli weekly 200
organisms/100 mL (monthly Geometric Mean
Density)
1 - 2 --
pH any single sample weekly 6.0 - 9.5 6.2 - 7.5 -- Dissolved Oxygen weekly 5 and above 5.6 - 8 --
Thamesford Wastewater Treatment Plant | TA3
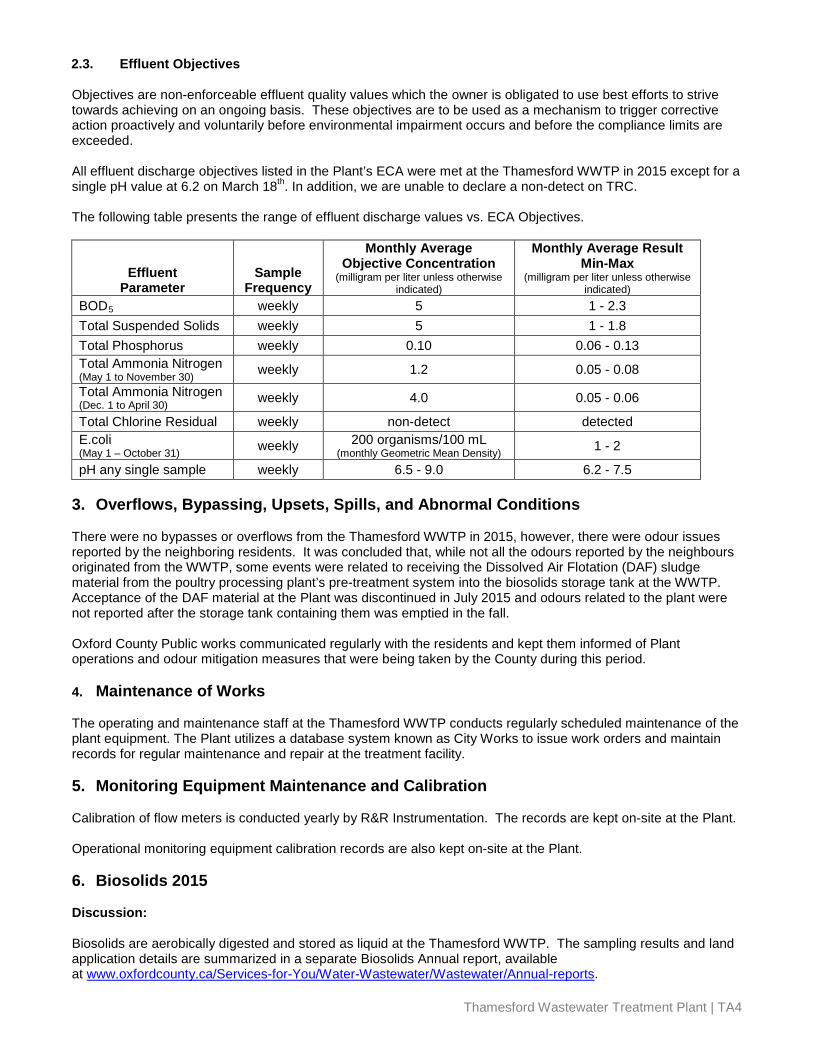
2.3. Effluent Objectives Objectives are non-enforceable effluent quality values which the owner is obligated to use best efforts to strive towards achieving on an ongoing basis. These objectives are to be used as a mechanism to trigger corrective action proactively and voluntarily before environmental impairment occurs and before the compliance limits are exceeded. All effluent discharge objectives listed in the Plant’s ECA were met at the Thamesford WWTP in 2015 except for a single pH value at 6.2 on March 18th. In addition, we are unable to declare a non-detect on TRC. The following table presents the range of effluent discharge values vs. ECA Objectives.
Effluent
Parameter Sample
Frequency
Monthly Average Objective Concentration
(milligram per liter unless otherwise indicated)
Monthly Average Result Min-Max
(milligram per liter unless otherwise indicated)
BOD5 weekly 5 1 - 2.3 Total Suspended Solids weekly 5 1 - 1.8 Total Phosphorus weekly 0.10 0.06 - 0.13 Total Ammonia Nitrogen (May 1 to November 30) weekly 1.2 0.05 - 0.08
Total Ammonia Nitrogen (Dec. 1 to April 30) weekly 4.0 0.05 - 0.06
Total Chlorine Residual weekly non-detect detected E.coli (May 1 – October 31) weekly 200 organisms/100 mL
(monthly Geometric Mean Density) 1 - 2
pH any single sample weekly 6.5 - 9.0 6.2 - 7.5 3. Overflows, Bypassing, Upsets, Spills, and Abnormal Conditions There were no bypasses or overflows from the Thamesford WWTP in 2015, however, there were odour issues reported by the neighboring residents. It was concluded that, while not all the odours reported by the neighbours originated from the WWTP, some events were related to receiving the Dissolved Air Flotation (DAF) sludge material from the poultry processing plant’s pre-treatment system into the biosolids storage tank at the WWTP. Acceptance of the DAF material at the Plant was discontinued in July 2015 and odours related to the plant were not reported after the storage tank containing them was emptied in the fall. Oxford County Public works communicated regularly with the residents and kept them informed of Plant operations and odour mitigation measures that were being taken by the County during this period. 4. Maintenance of Works The operating and maintenance staff at the Thamesford WWTP conducts regularly scheduled maintenance of the plant equipment. The Plant utilizes a database system known as City Works to issue work orders and maintain records for regular maintenance and repair at the treatment facility. 5. Monitoring Equipment Maintenance and Calibration Calibration of flow meters is conducted yearly by R&R Instrumentation. The records are kept on-site at the Plant. Operational monitoring equipment calibration records are also kept on-site at the Plant. 6. Biosolids 2015 Discussion: Biosolids are aerobically digested and stored as liquid at the Thamesford WWTP. The sampling results and land application details are summarized in a separate Biosolids Annual report, available at www.oxfordcounty.ca/Services-for-You/Water-Wastewater/Wastewater/Annual-reports.
Thamesford Wastewater Treatment Plant | TA4
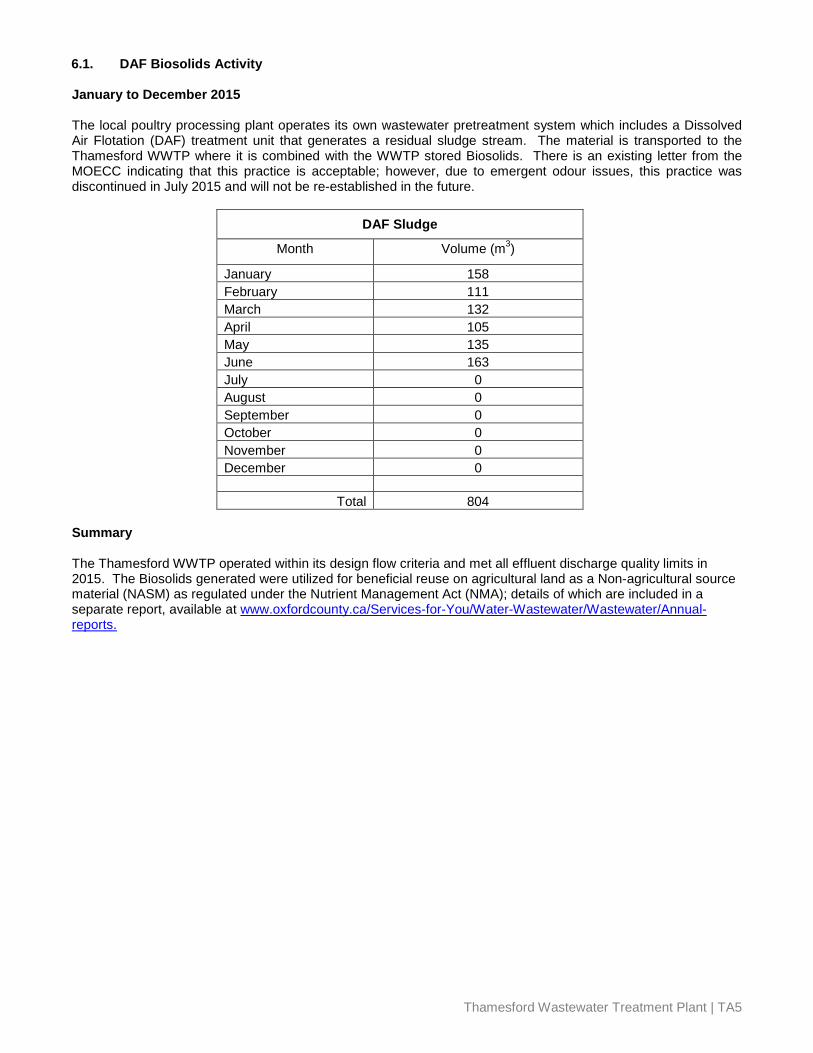
6.1. DAF Biosolids Activity January to December 2015 The local poultry processing plant operates its own wastewater pretreatment system which includes a Dissolved Air Flotation (DAF) treatment unit that generates a residual sludge stream. The material is transported to the Thamesford WWTP where it is combined with the WWTP stored Biosolids. There is an existing letter from the MOECC indicating that this practice is acceptable; however, due to emergent odour issues, this practice was discontinued in July 2015 and will not be re-established in the future.
DAF Sludge
Month Volume (m3)
January 158 February 111 March 132 April 105 May 135 June 163 July 0 August 0 September 0 October 0 November 0 December 0
Total 804 Summary The Thamesford WWTP operated within its design flow criteria and met all effluent discharge quality limits in 2015. The Biosolids generated were utilized for beneficial reuse on agricultural land as a Non-agricultural source material (NASM) as regulated under the Nutrient Management Act (NMA); details of which are included in a separate report, available at www.oxfordcounty.ca/Services-for-You/Water-Wastewater/Wastewater/Annual-reports.
Thamesford Wastewater Treatment Plant | TA5
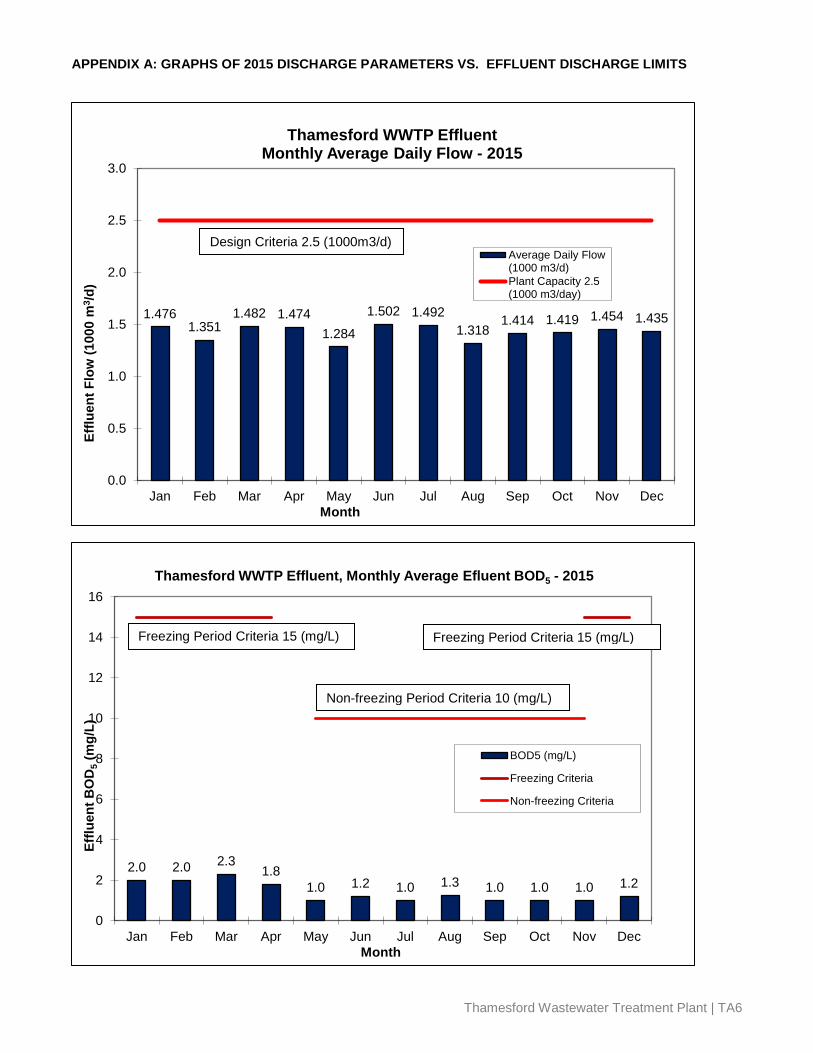
APPENDIX A: GRAPHS OF 2015 DISCHARGE PARAMETERS VS. EFFLUENT DISCHARGE LIMITS
1.476 1.351
1.482 1.474 1.284
1.502 1.492 1.318
1.414 1.419 1.454 1.435
0.0
0.5
1.0
1.5
2.0
2.5
3.0
Jan Feb Mar Apr May Jun Jul Aug Sep Oct Nov Dec
Efflu
ent F
low
(100
0 m
3 /d)
Month
Thamesford WWTP Effluent Monthly Average Daily Flow - 2015
Average Daily Flow(1000 m3/d)Plant Capacity 2.5(1000 m3/day)
2.0 2.0 2.3 1.8
1.0 1.2 1.0 1.3 1.0 1.0 1.0 1.2
0
2
4
6
8
10
12
14
16
Jan Feb Mar Apr May Jun Jul Aug Sep Oct Nov Dec
Efflu
ent B
OD
5 (m
g/L)
Month
Thamesford WWTP Effluent, Monthly Average Efluent BOD5 - 2015
BOD5 (mg/L)
Freezing Criteria
Non-freezing Criteria
Freezing Period Criteria 15 (mg/L)
Non-freezing Period Criteria 10 (mg/L)
Freezing Period Criteria 15 (mg/L)
Design Criteria 2.5 (1000m3/d)
Thamesford Wastewater Treatment Plant | TA6
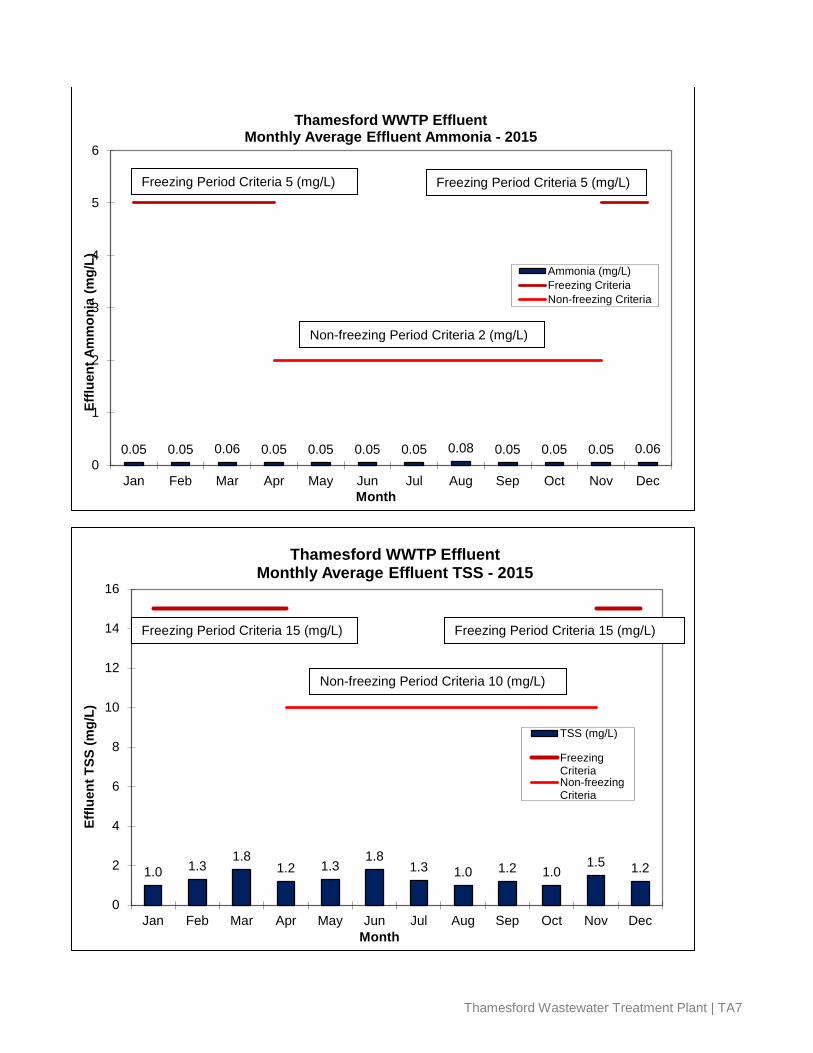
0.05 0.05 0.06 0.05 0.05 0.05 0.05 0.08 0.05 0.05 0.05 0.06 0
1
2
3
4
5
6
Jan Feb Mar Apr May Jun Jul Aug Sep Oct Nov Dec
Efflu
ent A
mm
onia
(mg/
L)
Month
Thamesford WWTP Effluent Monthly Average Effluent Ammonia - 2015
Ammonia (mg/L)Freezing CriteriaNon-freezing Criteria
1.0 1.3 1.8
1.2 1.3 1.8
1.3 1.0 1.2 1.0 1.5 1.2
0
2
4
6
8
10
12
14
16
Jan Feb Mar Apr May Jun Jul Aug Sep Oct Nov Dec
Efflu
ent T
SS (m
g/L)
Month
Thamesford WWTP Effluent Monthly Average Effluent TSS - 2015
TSS (mg/L)
FreezingCriteriaNon-freezingCriteria
Freezing Period Criteria 5 (mg/L)
Non-freezing Period Criteria 2 (mg/L)
Freezing Period Criteria 5 (mg/L)
Freezing Period Criteria 15 (mg/L)
Non-freezing Period Criteria 10 (mg/L)
Freezing Period Criteria 15 (mg/L)
Thamesford Wastewater Treatment Plant | TA7
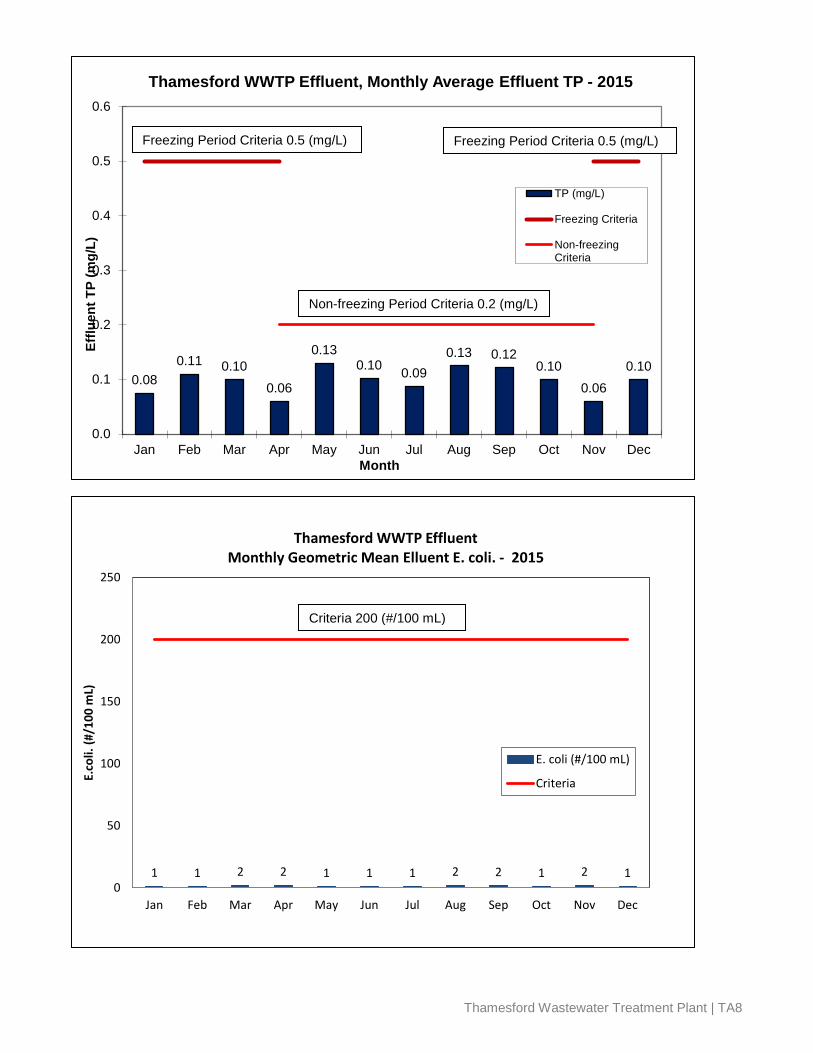
0.08 0.11 0.10
0.06
0.13 0.10 0.09
0.13 0.12 0.10
0.06 0.10
0.0
0.1
0.2
0.3
0.4
0.5
0.6
Jan Feb Mar Apr May Jun Jul Aug Sep Oct Nov Dec
Efflu
ent T
P (m
g/L)
Month
Thamesford WWTP Effluent, Monthly Average Effluent TP - 2015
TP (mg/L)
Freezing Criteria
Non-freezingCriteria
1 1 2 2 1 1 1 2 2 1 2 1 0
50
100
150
200
250
Jan Feb Mar Apr May Jun Jul Aug Sep Oct Nov Dec
E.co
li. (#
/100
mL)
Thamesford WWTP Effluent Monthly Geometric Mean Elluent E. coli. - 2015
E. coli (#/100 mL)
Criteria
Freezing Period Criteria 0.5 (mg/L) Freezing Period Criteria 0.5 (mg/L)
Non-freezing Period Criteria 0.2 (mg/L)
Criteria 200 (#/100 mL)
Thamesford Wastewater Treatment Plant | TA8
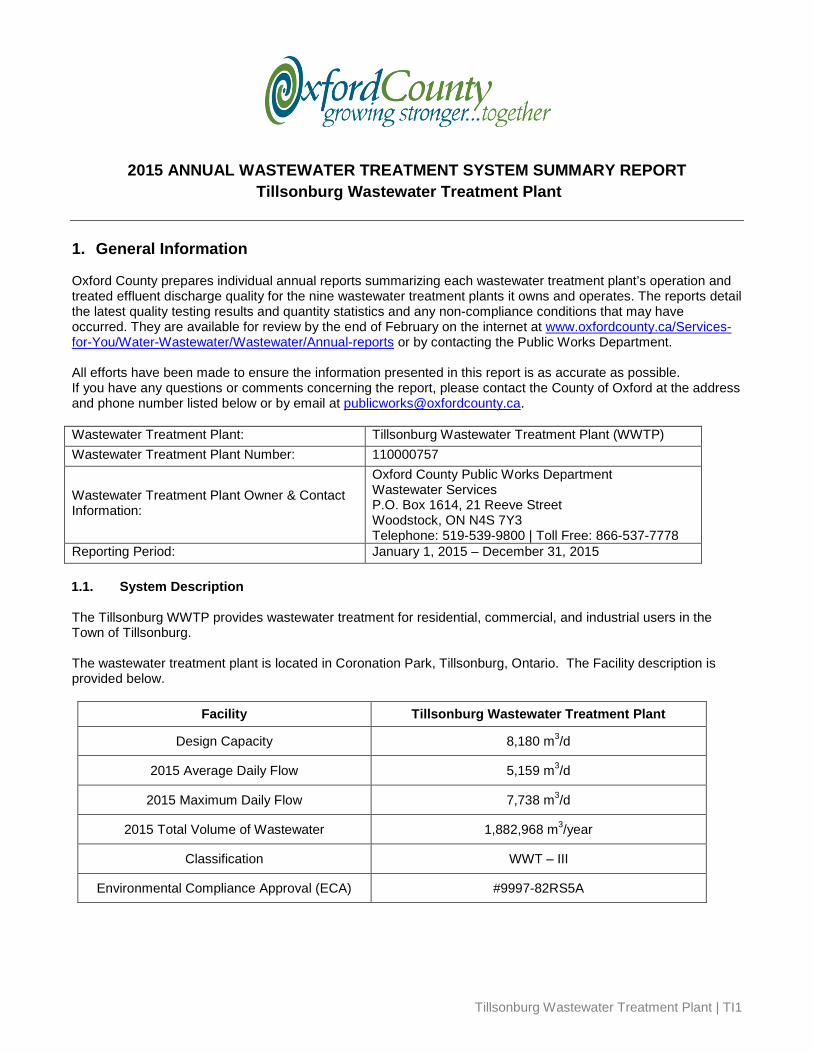
2015 ANNUAL WASTEWATER TREATMENT SYSTEM SUMMARY REPORT
Tillsonburg Wastewater Treatment Plant
1. General Information Oxford County prepares individual annual reports summarizing each wastewater treatment plant’s operation and treated effluent discharge quality for the nine wastewater treatment plants it owns and operates. The reports detail the latest quality testing results and quantity statistics and any non-compliance conditions that may have occurred. They are available for review by the end of February on the internet at www.oxfordcounty.ca/Services-for-You/Water-Wastewater/Wastewater/Annual-reports or by contacting the Public Works Department. All efforts have been made to ensure the information presented in this report is as accurate as possible. If you have any questions or comments concerning the report, please contact the County of Oxford at the address and phone number listed below or by email at [email protected]. Wastewater Treatment Plant: Tillsonburg Wastewater Treatment Plant (WWTP) Wastewater Treatment Plant Number: 110000757
Wastewater Treatment Plant Owner & Contact Information:
Oxford County Public Works Department Wastewater Services P.O. Box 1614, 21 Reeve Street Woodstock, ON N4S 7Y3 Telephone: 519-539-9800 | Toll Free: 866-537-7778
Reporting Period: January 1, 2015 – December 31, 2015 1.1. System Description The Tillsonburg WWTP provides wastewater treatment for residential, commercial, and industrial users in the Town of Tillsonburg. The wastewater treatment plant is located in Coronation Park, Tillsonburg, Ontario. The Facility description is provided below.
Facility Tillsonburg Wastewater Treatment Plant
Design Capacity 8,180 m3/d
2015 Average Daily Flow 5,159 m3/d
2015 Maximum Daily Flow 7,738 m3/d
2015 Total Volume of Wastewater 1,882,968 m3/year
Classification WWT – III
Environmental Compliance Approval (ECA) #9997-82RS5A
Tillsonburg Wastewater Treatment Plant | TI1
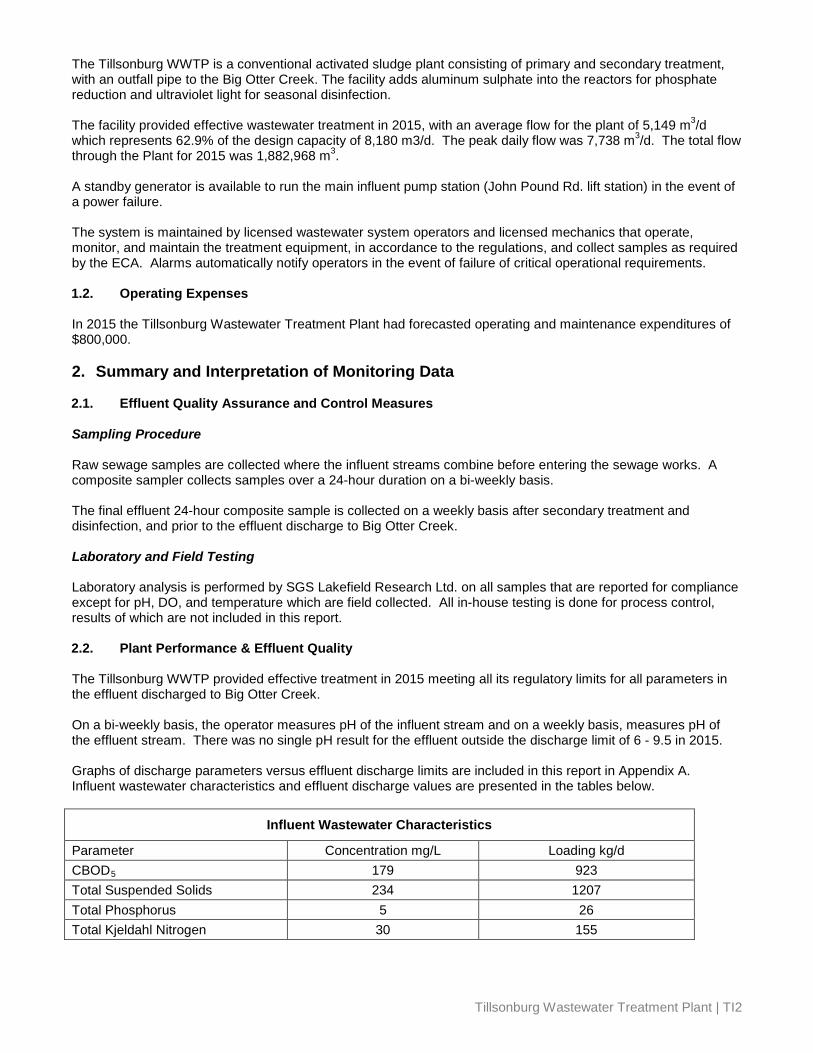
The Tillsonburg WWTP is a conventional activated sludge plant consisting of primary and secondary treatment, with an outfall pipe to the Big Otter Creek. The facility adds aluminum sulphate into the reactors for phosphate reduction and ultraviolet light for seasonal disinfection. The facility provided effective wastewater treatment in 2015, with an average flow for the plant of 5,149 m3/d which represents 62.9% of the design capacity of 8,180 m3/d. The peak daily flow was 7,738 m3/d. The total flow through the Plant for 2015 was 1,882,968 m3. A standby generator is available to run the main influent pump station (John Pound Rd. lift station) in the event of a power failure. The system is maintained by licensed wastewater system operators and licensed mechanics that operate, monitor, and maintain the treatment equipment, in accordance to the regulations, and collect samples as required by the ECA. Alarms automatically notify operators in the event of failure of critical operational requirements. 1.2. Operating Expenses In 2015 the Tillsonburg Wastewater Treatment Plant had forecasted operating and maintenance expenditures of $800,000. 2. Summary and Interpretation of Monitoring Data 2.1. Effluent Quality Assurance and Control Measures Sampling Procedure Raw sewage samples are collected where the influent streams combine before entering the sewage works. A composite sampler collects samples over a 24-hour duration on a bi-weekly basis. The final effluent 24-hour composite sample is collected on a weekly basis after secondary treatment and disinfection, and prior to the effluent discharge to Big Otter Creek. Laboratory and Field Testing Laboratory analysis is performed by SGS Lakefield Research Ltd. on all samples that are reported for compliance except for pH, DO, and temperature which are field collected. All in-house testing is done for process control, results of which are not included in this report. 2.2. Plant Performance & Effluent Quality The Tillsonburg WWTP provided effective treatment in 2015 meeting all its regulatory limits for all parameters in the effluent discharged to Big Otter Creek. On a bi-weekly basis, the operator measures pH of the influent stream and on a weekly basis, measures pH of the effluent stream. There was no single pH result for the effluent outside the discharge limit of 6 - 9.5 in 2015. Graphs of discharge parameters versus effluent discharge limits are included in this report in Appendix A. Influent wastewater characteristics and effluent discharge values are presented in the tables below.
Influent Wastewater Characteristics
Parameter Concentration mg/L Loading kg/d CBOD5 179 923 Total Suspended Solids 234 1207 Total Phosphorus 5 26 Total Kjeldahl Nitrogen 30 155
Tillsonburg Wastewater Treatment Plant | TI2
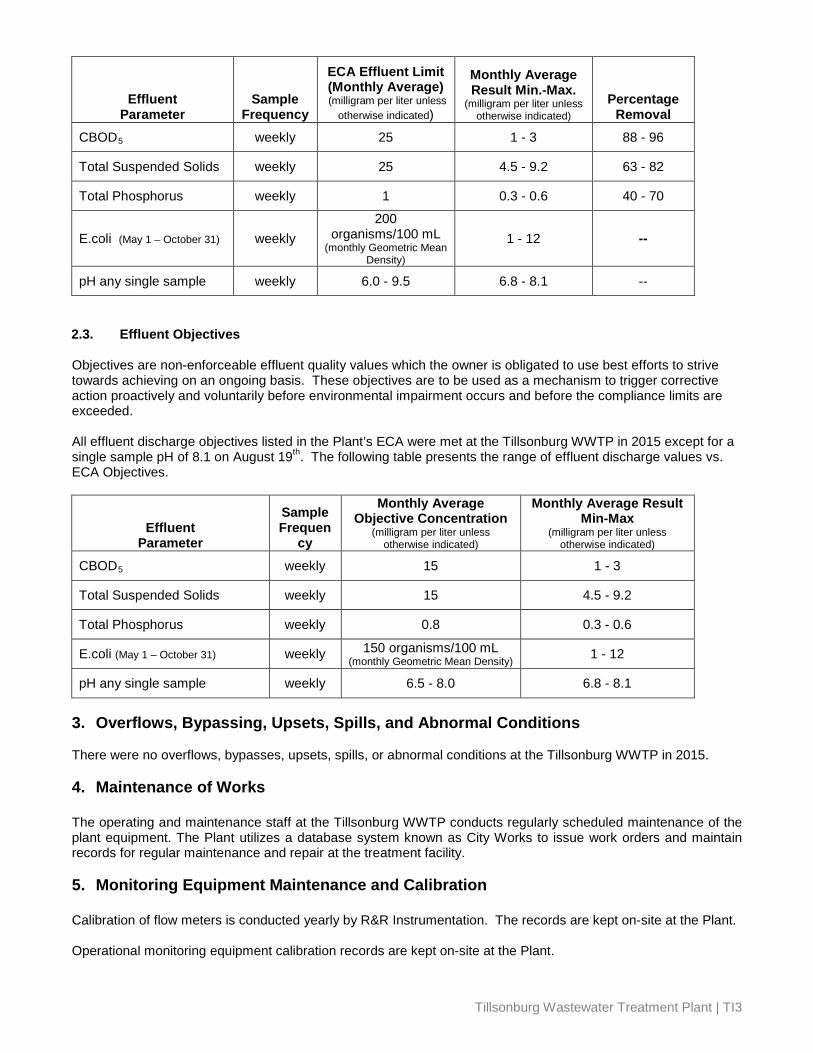
Effluent Parameter
Sample Frequency
ECA Effluent Limit (Monthly Average) (milligram per liter unless
otherwise indicated)
Monthly Average Result Min.-Max.
(milligram per liter unless otherwise indicated)
Percentage Removal
CBOD5 weekly 25 1 - 3 88 - 96
Total Suspended Solids weekly 25 4.5 - 9.2 63 - 82
Total Phosphorus weekly 1 0.3 - 0.6 40 - 70
E.coli (May 1 – October 31) weekly 200
organisms/100 mL (monthly Geometric Mean
Density)
1 - 12 --
pH any single sample weekly 6.0 - 9.5 6.8 - 8.1 --
2.3. Effluent Objectives Objectives are non-enforceable effluent quality values which the owner is obligated to use best efforts to strive towards achieving on an ongoing basis. These objectives are to be used as a mechanism to trigger corrective action proactively and voluntarily before environmental impairment occurs and before the compliance limits are exceeded. All effluent discharge objectives listed in the Plant’s ECA were met at the Tillsonburg WWTP in 2015 except for a single sample pH of 8.1 on August 19th. The following table presents the range of effluent discharge values vs. ECA Objectives.
Effluent Parameter
Sample Frequen
cy
Monthly Average Objective Concentration
(milligram per liter unless otherwise indicated)
Monthly Average Result Min-Max
(milligram per liter unless otherwise indicated)
CBOD5 weekly 15 1 - 3
Total Suspended Solids weekly 15 4.5 - 9.2
Total Phosphorus weekly 0.8 0.3 - 0.6
E.coli (May 1 – October 31) weekly 150 organisms/100 mL (monthly Geometric Mean Density) 1 - 12
pH any single sample weekly 6.5 - 8.0 6.8 - 8.1
3. Overflows, Bypassing, Upsets, Spills, and Abnormal Conditions There were no overflows, bypasses, upsets, spills, or abnormal conditions at the Tillsonburg WWTP in 2015. 4. Maintenance of Works
The operating and maintenance staff at the Tillsonburg WWTP conducts regularly scheduled maintenance of the plant equipment. The Plant utilizes a database system known as City Works to issue work orders and maintain records for regular maintenance and repair at the treatment facility. 5. Monitoring Equipment Maintenance and Calibration
Calibration of flow meters is conducted yearly by R&R Instrumentation. The records are kept on-site at the Plant. Operational monitoring equipment calibration records are kept on-site at the Plant.
Tillsonburg Wastewater Treatment Plant | TI3

6. Biosolids 2015
Discussion: Biosolids are aerobically digested and dewatered at the Tillsonburg WWTP using an Alfa-Laval Centrifuge. The Biosolids are then stored at the Oxford County Biosolids Centralized Storage Facility (BCSF) prior to land application. The sampling results and land application details are summarized in a separate Biosolids Annual report, available at www.oxfordcounty.ca/Services-for-You/Water-Wastewater/Wastewater/Annual-reports. Summary The Tillsonburg WWTP operated within its design flow criteria and met all effluent discharge quality limits in 2015. The Biosolids generated were utilized for beneficial reuse on agricultural land as a Non-agricultural source material (NASM) as regulated under the Nutrient Management Act (NMA); details of which are included in a separate report, available at www.oxfordcounty.ca/Services-for-You/Water-Wastewater/Wastewater/Annual-reports.
Tillsonburg Wastewater Treatment Plant | TI4

APPENDIX A: GRAPHS OF 2015 DISCHARGE PARAMETERS VERSUS EFFLUENT DISCHARGE LIMITS
5268 5072 5417
5771
5181 5579
5206 4993
4759 4799 4911 4954
0
1000
2000
3000
4000
5000
6000
7000
8000
9000
Jan Feb Mar Apr May Jun Jul Aug Sep Oct Nov Dec
Efflu
ent F
low
m3/
d Tillsonburg WWTP Effluent, Monthly Average Daily Flow, 2015
Flow (m3/d)Criteria
1.0 1.8 1.8 1.8 2.0 1.3 2.0 2.5 1.0
2.0 1.0 1.0
0
5
10
15
20
25
30
Jan Feb Mar Apr May Jun Jul Aug Sep Oct Nov Dec
Efflu
ent C
BO
D5 (
mg/
L)
Month
Tillsonburg WWTP Efluent, Monthly Average CBOD5 - 2015
CBOD5(mg/L)Criteria
Criteria 25 (mg/L)
Design Criteria 8180 m3/d
Tillsonburg Wastewater Treatment Plant | TI5
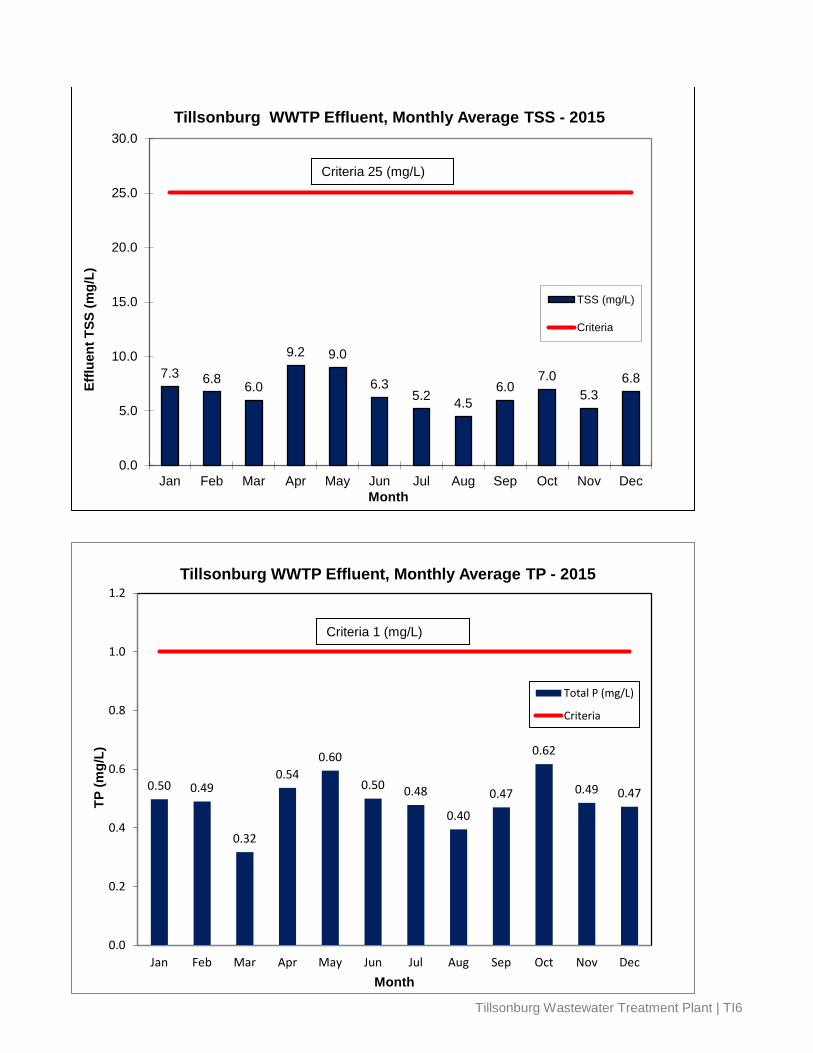
7.3 6.8 6.0
9.2 9.0
6.3 5.2 4.5
6.0 7.0
5.3 6.8
0.0
5.0
10.0
15.0
20.0
25.0
30.0
Jan Feb Mar Apr May Jun Jul Aug Sep Oct Nov Dec
Efflu
ent T
SS (m
g/L)
Month
Tillsonburg WWTP Effluent, Monthly Average TSS - 2015
TSS (mg/L)
Criteria
0.50 0.49
0.32
0.54 0.60
0.50 0.48
0.40
0.47
0.62
0.49 0.47
0.0
0.2
0.4
0.6
0.8
1.0
1.2
Jan Feb Mar Apr May Jun Jul Aug Sep Oct Nov Dec
TP (m
g/L)
Month
Tillsonburg WWTP Effluent, Monthly Average TP - 2015
Total P (mg/L)
Criteria
Criteria 25 (mg/L)
Criteria 1 (mg/L)
Tillsonburg Wastewater Treatment Plant | TI6
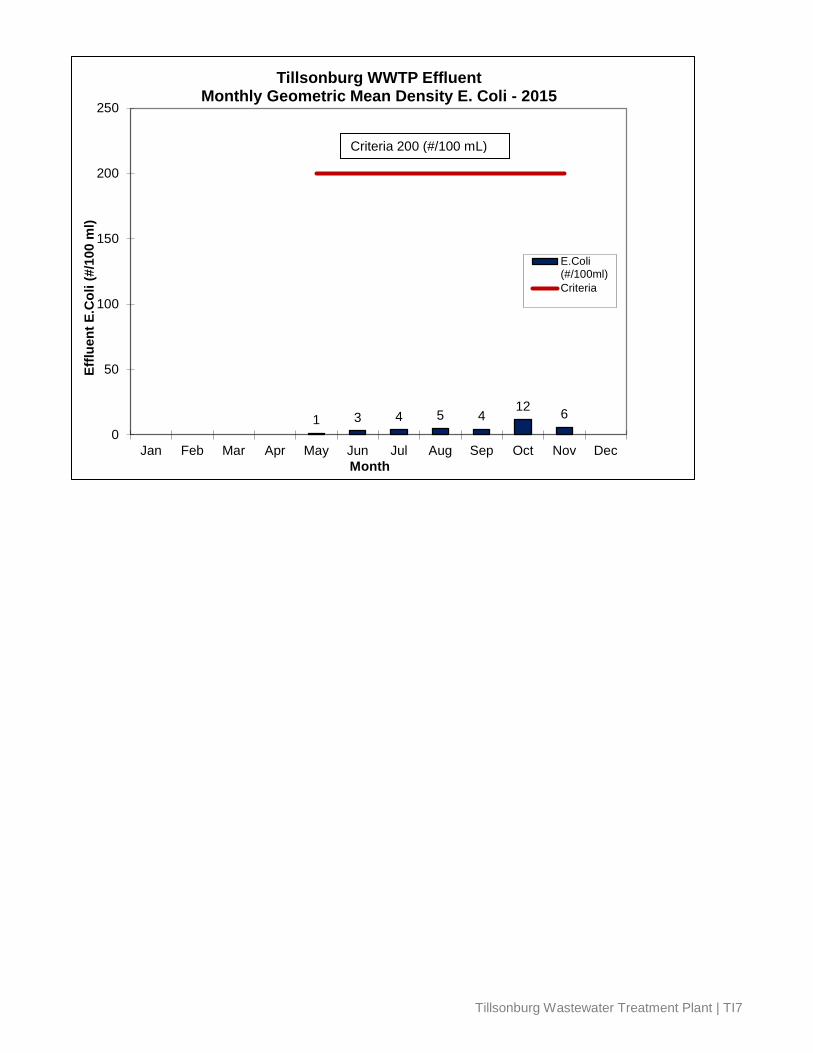
1 3 4 5 4 12 6
0
50
100
150
200
250
Jan Feb Mar Apr May Jun Jul Aug Sep Oct Nov Dec
Efflu
ent E
.Col
i (#/
100
ml)
Month
Tillsonburg WWTP Effluent Monthly Geometric Mean Density E. Coli - 2015
E.Coli(#/100ml)Criteria
Criteria 200 (#/100 mL)
Tillsonburg Wastewater Treatment Plant | TI7
2015 ANNUAL WASTEWATER TREATMENT SYSTEM SUMMARY REPORT
Woodstock Wastewater Treatment Plant
1. General Information Oxford County prepares individual annual reports summarizing each wastewater treatment plant’s operation and treated effluent discharge quality for the nine wastewater treatment plants it owns and operates. The reports detail the latest quality testing results and quantity statistics and any non-compliance conditions that may have occurred. They are available for review by the end of February on the internet at www.oxfordcounty.ca/Services-for-You/Water-Wastewater/Wastewater/Annual-reports or by contacting the Public Works Department. All efforts have been made to ensure the information presented in this report is as accurate as possible. If you have any questions or comments concerning the report, please contact the County of Oxford at the address and phone number listed below or by email at [email protected]. Wastewater Treatment Plant: Woodstock Wastewater Treatment Plant Wastewater Treatment Plant Number: 120000685
Wastewater Treatment Plant Owner & Contact Information:
Oxford County Public Works Department Wastewater Services P.O. Box 1614, 21 Reeve Street Woodstock, ON N4S 7Y3 Telephone: 519-539-9800 | Toll Free: 866-537-7778
Reporting Period: January 1, 2015 – December 31, 2015 1.1. System Description The Woodstock WWTP provides wastewater treatment for residential, commercial, and industrial users in the City of Woodstock and for the communities of Embro and Innerkip. It also provides treatment for septic tank waste, hauled waste, and holding tank waste from within Oxford County. In 2009, the plant completed a hydraulic capacity upgrade increasing the plant capacity from 25,000 m3/d to the current approved average daily flow capacity of 33,000 m3/d, with a peak flow capacity of 66,000 m3/d. The wastewater treatment plant is located at 195 Admiral Street Woodstock, Ontario. The Facility description is provided below.
Facility Woodstock Wastewater Treatment Plant
Design Capacity 33,000 m3/d
2015 Average Daily Flow 16,858 m3/d
2015 Maximum Daily Flow 25,020 m3/d
2015 Total Volume of Wastewater 6,159,391 m3/year
2015 Total Received Hauled Waste 15,628 m3/year
Classification WWT – IV
Environmental Compliance Approval (ECA) #5950-7XQKXS
Woodstock Wastewater Treatment Plant | W1

The Woodstock WWTP is a conventional activated sludge system consisting of primary and secondary treatment, with an outfall pipe to the Thames River. The facility adds ferrous chloride into the reactors for phosphorous removal. Sodium hypochlorite is added seasonally for disinfection along with sodium bisulfite for de-chlorination. The facility provided effective wastewater treatment in 2015, with an average flow for the plant of 16,858 m3/d which represents 51% of the design capacity of 33,000 m3/d. In 2015, the peak daily flow was 25,020 m3/d. The total flow through the Plant for 2015 was 6,159,391 m3. A standby generator is available to run the onsite Thames Valley Lift Station in the event of a power failure. The system is maintained by licensed wastewater system operators and licensed mechanics that operate, monitor, and maintain the treatment equipment, in accordance to the regulations, and collect samples as required by the ECA. Alarms automatically notify operators in the event of failure of critical operational requirements. 1.2. Operating Expenses In 2015 the Woodstock Wastewater Treatment Plant had forecasted operating and maintenance expenditures of $1,700,000. 2. Summary and Interpretation of Monitoring Data
2.1. Effluent Quality Assurance and Control Measures Sampling Procedure Wastewater samples are collected on a weekly basis. Raw sewage samples are collected at a location where the sewer trunks combine before entering the sewage works. A composite sampler collects samples over a 24-hour period. Following primary treatment, a second 24-hour composite sample is collected. Laboratory and Field Testing A final effluent 24-hour composite sample is collected following secondary treatment, disinfection and de-chlorination but prior to the effluent discharge to the Thames River. Laboratory analysis is performed by SGS Lakefield Research Ltd. on all samples that are reported for compliance, except for pH, DO, chlorine residual and temperature, which are field collected. All in-house testing is done for process control and is not included in this report. 2.2. Plant Performance & Effluent Quality The Woodstock WWTP provided effective treatment in 2015 meeting all its regulatory limits for all parameters in the effluent discharged to the Thames River. On a weekly basis (minimum), the operator measures pH of both the influent and effluent streams. There was no single pH result for the effluent outside the discharge limit of 6 - 9.5 in 2015. Staff tests Total Residual Chlorine (TRC) in the treated effluent on a daily basis; well in excess of the required weekly testing frequency. In 2015, the monthly average results at all times met the Monthly Average TRC limit and were less than 0.05 mg/L and, therefore, were in compliance. The Federal Government’s P2 target for TRC of 0.02 mg/L was met in 2015. Graphs of discharge parameters versus effluent discharge limits are included in this report in Appendix A. Influent wastewater characteristics and effluent discharge values are presented in the tables below.
Influent Wastewater Characteristics Parameter Concentration mg/L Loading kg/d
BOD5 132 2225 Total Suspended Solids 196 3304
Total Phosphorus 3.1 52 Total Kjeldahl Nitrogen 24.1 406
Woodstock Wastewater Treatment Plant | W2

Effluent Parameter Sample
Frequency
ECA Effluent Limit (Monthly Average) (milligram per liter unless
otherwise indicated)
Monthly Average Result Min.-Max.
(milligram per liter unless otherwise indicated)
Percentage Removal
CBOD5 (May 01 to November 30) weekly 15 2.0 - 2.8 97.5 - 98
CBOD5 (December 01 to April 30) weekly 20 2.0 - 4.0 97 - 98
Total Suspended Solids weekly 15 2.0 - 6.2 97 - 99
Total Phosphorus weekly 0.75 0.2 - 0.49 84 - 94 Total Ammonia Nitrogen (May 1 to November 30)
weekly 3 0.1 - 0.5 97 - 99
Total Ammonia Nitrogen (Dec. 1 to April 30)
weekly 5.0 0.1 - 0.7 96 - 99.5
Total Chlorine Residual (May 1-October 31) weekly <0.05 0.02 - 0.02 --
E.coli (May 1 – October 31) weekly
200 organisms/100 mL
(monthly Geometric Mean Density)
2.0 - 26 --
pH any single sample weekly 6.0 - 9.5 6.5 - 8.1 --
2.3. Effluent Objectives Objectives are non-enforceable effluent quality values which the owner is obligated to use best efforts to strive towards achieving on an ongoing basis. These objectives are to be used as a mechanism to trigger corrective action proactively and voluntarily before environmental impairment occurs and before the compliance limits are exceeded. All effluent discharge objectives listed in the Plant’s ECA were met at the Woodstock WWTP in 2015. The following table presents the range of effluent discharge values vs. ECA Objectives.
Effluent Parameter
Sample Frequency
Monthly Average Objective Concentration
(milligram per liter unless otherwise indicated)
Monthly Average Result Min-Max
(milligram per liter unless otherwise indicated)
CBOD5 weekly 12 2.0 - 2.8
Total Suspended Solids weekly 12 2.0 - 4.0
Total Phosphorus weekly 0.5 0.2 - 0.49
Total Ammonia Nitrogen (May 1 to November 30) weekly 2.0 0.1 - 0.5
Total Ammonia Nitrogen (Dec. 1 to April 30) weekly 3.0 0.1 - 0.7
E.coli (May 1 – October 31) weekly
200 organisms/100 mL (monthly Geometric Mean
Density) 2.0 - 26
pH any single sample weekly 6.0 - 8.5 6.5 - 8.1
Woodstock Wastewater Treatment Plant | W3

3. Overflows, Bypassing, Upsets, Spills, and Abnormal Conditions
There were no bypasses or overflows from the Woodstock WWTP in 2015, however, there was a single event upset condition noted during the year. On May 4th, there was some minor foaming going to the River due to multiple electrical failures. A generator was rented to run the blower building and an outside consulting electrical engineer was brought in to troubleshoot the issues and provide guidance. There were several issues identified: one was associated with the current grounding between the substation and the blower building MCC. In addition, the switchgear was not resetting. The fusing and trip protection required adjustment. The current grounding was caused by scoring of the buried wire making contact with groundwater as the underground conduit had flooded. The scoring had likely occurred during installation at the last upgrade and was made worse as the freeze and thaw caused a shifting of the conduit. Two of the switch gears at the substation were identified as problem units and were rebuilt as they would not reset or hold once tripped. A short circuit protective device coordination study was completed and a report was prepared with recommendations for adjustments to the fusing between the blower building and the substation. Corrective measures were implemented for all these items. A report was prepared by the consulting engineer on long-term alternatives for possible upgrade options for the substation due to its age and condition. The MOECC was notified at the time and follow-up reports were submitted to the Ministry during the repairs. 4. Maintenance of Works
The operating and maintenance staff at the Woodstock WWTP conducts regularly scheduled maintenance of the plant equipment. The Plant utilizes a database system known as City Works to issue work orders and maintain records for regular maintenance and repair at the treatment facility. 5. Monitoring Equipment Maintenance and Calibration Calibration of flow meters is conducted yearly by R&R Instrumentation. The records are kept on-site at the Plant. Operational monitoring equipment calibration records are kept on-site at the Plant. 6. Biosolids 2015 Discussion: Biosolids are anaerobically digested and dewatered at the Woodstock WWTP using two Alfa-Laval Centrifuges. The biosolids are then stored at the Oxford County Biosolids Centralized Storage Facility (BCSF) prior to land application. The sampling results and land application details are summarized in a separate Biosolids Annual report, available at www.oxfordcounty.ca/Services-for-You/Water-Wastewater/Wastewater/Annual-reports. Summary The Woodstock WWTP operated within its design flow criteria and met all effluent discharge quality limits in 2015. The Biosolids generated were utilized for beneficial reuse on agricultural land as a Non-agricultural source material (NASM) as regulated under the Nutrient Management Act (NMA); details of which are included in a separate report, available at www.oxfordcounty.ca/Services-for-You/Water-Wastewater/Wastewater/Annual-reports.
Woodstock Wastewater Treatment Plant | W4
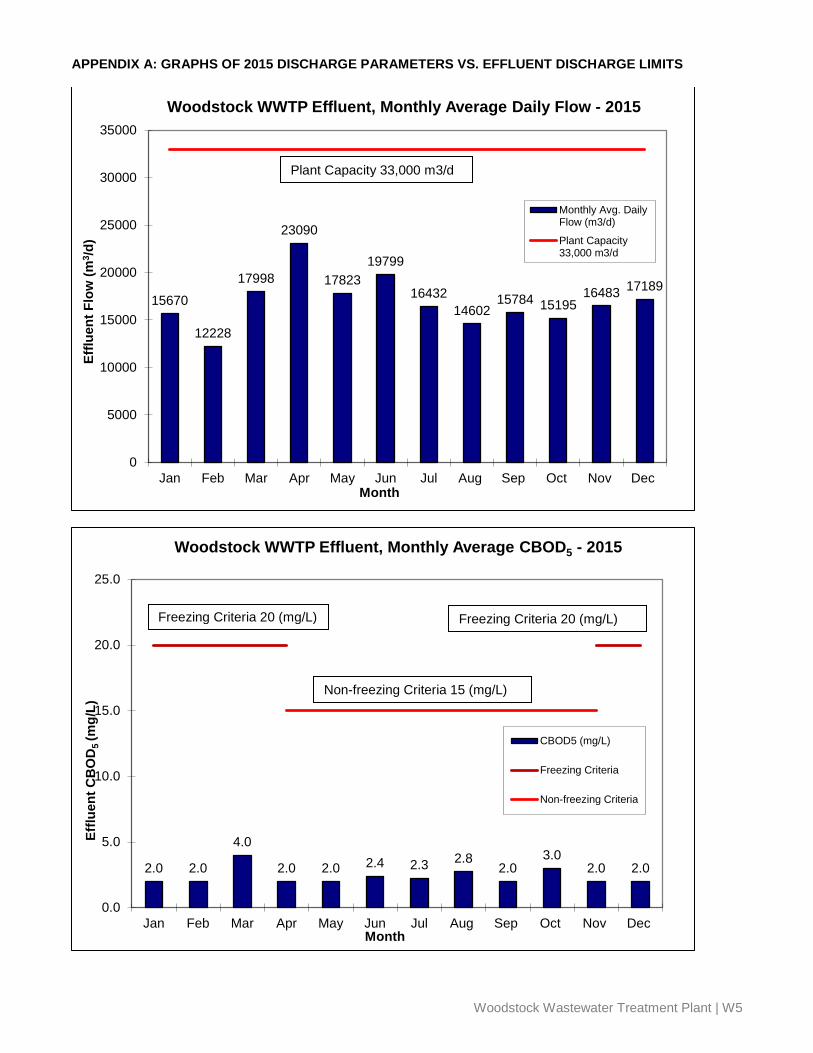
APPENDIX A: GRAPHS OF 2015 DISCHARGE PARAMETERS VS. EFFLUENT DISCHARGE LIMITS
15670
12228
17998
23090
17823 19799
16432 14602
15784 15195 16483 17189
0
5000
10000
15000
20000
25000
30000
35000
Jan Feb Mar Apr May Jun Jul Aug Sep Oct Nov Dec
Efflu
ent F
low
(m3 /d
)
Month
Woodstock WWTP Effluent, Monthly Average Daily Flow - 2015
Monthly Avg. DailyFlow (m3/d)
Plant Capacity33,000 m3/d
2.0 2.0
4.0
2.0 2.0 2.4 2.3 2.8 2.0
3.0 2.0 2.0
0.0
5.0
10.0
15.0
20.0
25.0
Jan Feb Mar Apr May Jun Jul Aug Sep Oct Nov Dec
Efflu
ent C
BO
D5
(mg/
L)
Month
Woodstock WWTP Effluent, Monthly Average CBOD5 - 2015
CBOD5 (mg/L)
Freezing Criteria
Non-freezing Criteria
Freezing Criteria 20 (mg/L)
Non-freezing Criteria 15 (mg/L)
Freezing Criteria 20 (mg/L)
Plant Capacity 33,000 m3/d
Woodstock Wastewater Treatment Plant | W5
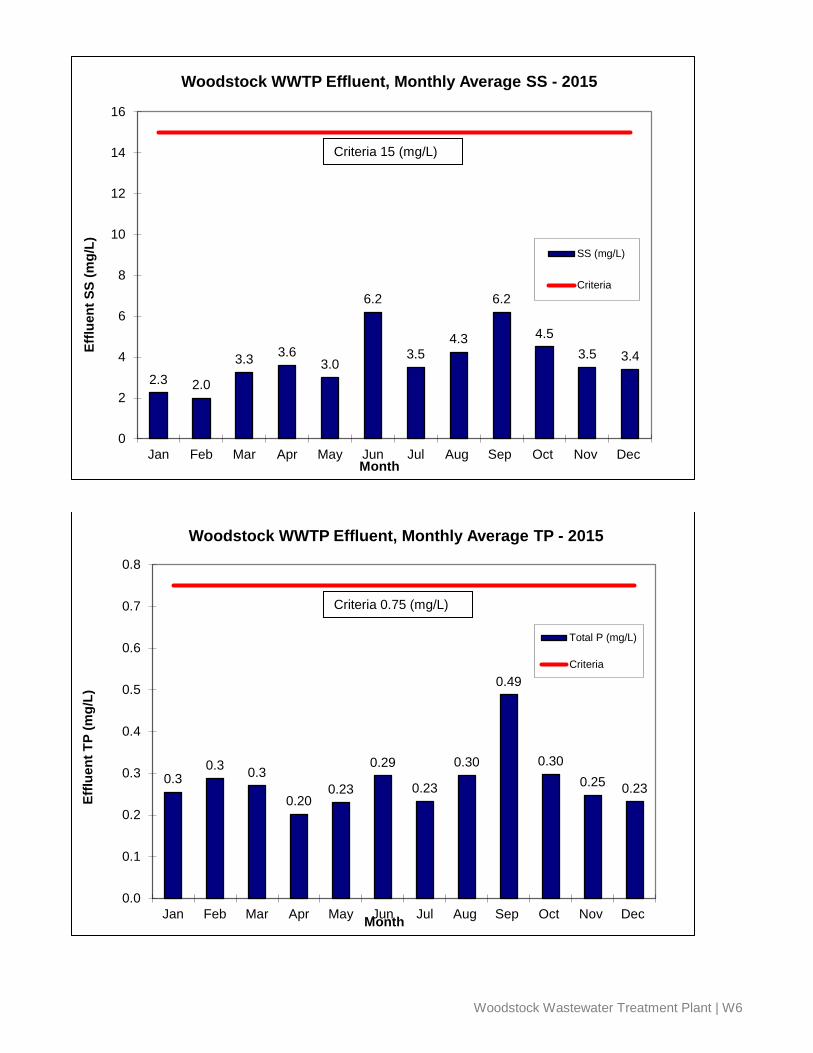
2.3 2.0
3.3 3.6 3.0
6.2
3.5 4.3
6.2
4.5 3.5 3.4
0
2
4
6
8
10
12
14
16
Jan Feb Mar Apr May Jun Jul Aug Sep Oct Nov Dec
Efflu
ent S
S (m
g/L)
Month
Woodstock WWTP Effluent, Monthly Average SS - 2015
SS (mg/L)
Criteria
0.3 0.3 0.3
0.20 0.23
0.29
0.23
0.30
0.49
0.30 0.25 0.23
0.0
0.1
0.2
0.3
0.4
0.5
0.6
0.7
0.8
Jan Feb Mar Apr May Jun Jul Aug Sep Oct Nov Dec
Efflu
ent T
P (m
g/L)
Month
Woodstock WWTP Effluent, Monthly Average TP - 2015
Total P (mg/L)
Criteria
Criteria 0.75 (mg/L)
Criteria 15 (mg/L)
Woodstock Wastewater Treatment Plant | W6
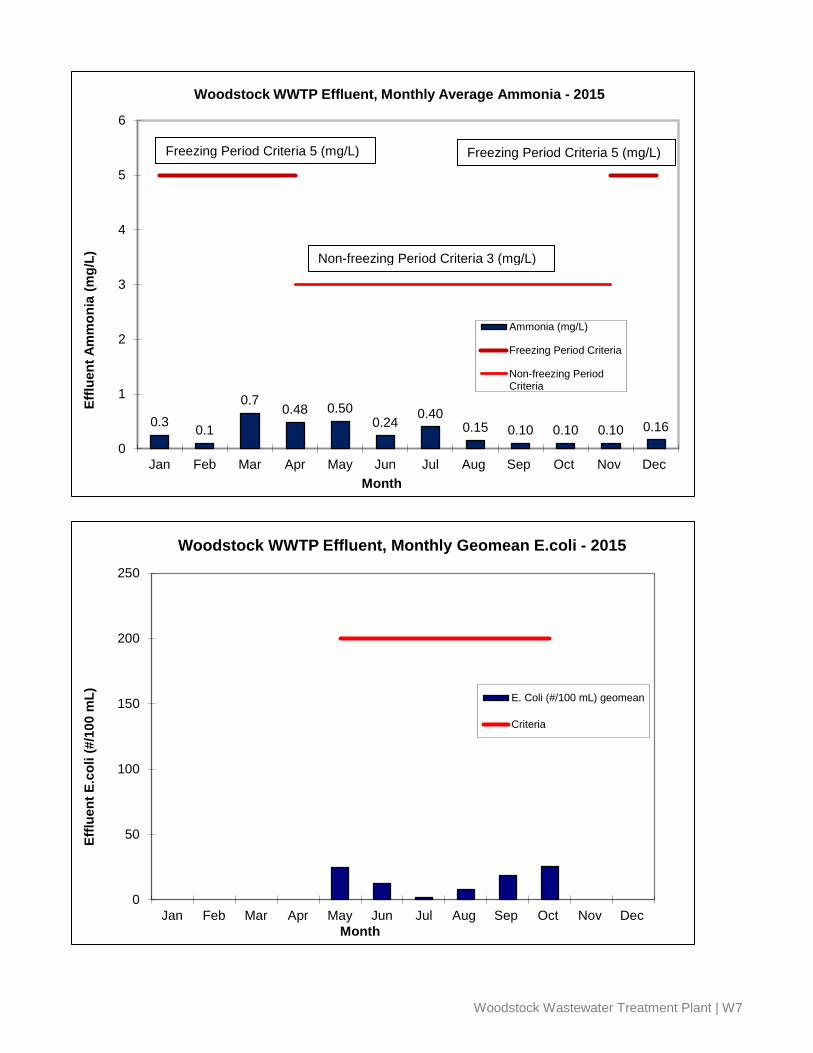
0.3 0.1
0.7 0.48 0.50
0.24 0.40 0.15 0.10 0.10 0.10 0.16
0
1
2
3
4
5
6
Jan Feb Mar Apr May Jun Jul Aug Sep Oct Nov Dec
Efflu
ent A
mm
onia
(mg/
L)
Month
Woodstock WWTP Effluent, Monthly Average Ammonia - 2015
Ammonia (mg/L)
Freezing Period Criteria
Non-freezing PeriodCriteria
0
50
100
150
200
250
Jan Feb Mar Apr May Jun Jul Aug Sep Oct Nov Dec
Efflu
ent E
.col
i (#/
100
mL)
Month
Woodstock WWTP Effluent, Monthly Geomean E.coli - 2015
E. Coli (#/100 mL) geomean
Criteria
Freezing Period Criteria 5 (mg/L)
Non-freezing Period Criteria 3 (mg/L)
Freezing Period Criteria 5 (mg/L)
Woodstock Wastewater Treatment Plant | W7