2015 full year results april 2016 - alliance...
TRANSCRIPT

John Dawson – Chief Executive
Andrew Franklin – Chief Financial Officer
2015 Full Year Results
April 2016

2
Highlights
Sales £48.3m (2014: £43.5m)
Hydromol™ continues to demonstrate good growth, year on year of +10% to £6.6m
MacuShield™ acquisition £3.5m sales
Sinclair acquisition £0.8m sales
Pre-tax profits £11.4m* (2014: £10.8m)
Free cash flow £6.3m (2014: £10.3m) after acquisition of £4.7m Sinclair inventory
Net debt : EBITDA at 2.8 times
Sanofi settlement of net £6.3m received in connection with ImmuCyst™
Acquisitions
Transformational acquisition from Sinclair IS in December 2015 - £127.5m
MacuShield Ophthalmology / OTC product in February 2015 - £8.8m
Diclectin™ in-licensed January 2015 - £1.5m
Sinopharm – five child nutrition brands in China in September 2015
Final and full year dividend up 10%
Adjusted EPS 3.69p (2014: 3.36p)
*Before the exceptional and non-underlying items, being primarily
compensation from Sanofi and Sinclair acquisition costs

3
Company Background
and Strategy

4
Background to Alliance
Started in 1998 as a specialty pharma company, using a Buy and Build model
Profitable, cash generative and dividend paying
Strong track record of 31 deals in 17 years building up a portfolio of over 90 products
Balanced portfolio:
Actively managed - organic growth from prescription and consumer products in:
Dermatology
Mother and Child
Ophthalmology
Passively managed - bedrock of sustainable cash flow from core of established niche medicines,
typically with limited competition
Sales mainly in Western Europe, but also in 90+ other countries
Direct presence in UK, Germany, France, Italy, Spain and Ireland
Office in China plus two joint ventures
Other countries via distribution partners
Virtual operating model with manufacturing, warehousing and logistics outsourced

5
Portfolio and Organisation
Promoted areas:
Dermatology
Mother & Child
Ophthalmology
Balance of actively promoted (52%) and passively managed bedrock (48%)
Geographic spread:
50% UK
75% Western Europe
Contender for pan-European opportunities
25% Rest of World
Organisation
Chippenham UK – Group and UK affiliate
Paris – International partnerships management and French affiliate
Other European affiliate offices in Dusseldorf, Milan and Madrid
“Wholly Owned Foreign Enterprise” in Shanghai plus two JVs (Shanghai and Guangzhou)

6
Balanced Portfolio
The bedrock: core portfolio of non-promoted products
48%
Dermatology
32%
Kelo-cote
Hydromol
Flammazine/
Flammacerium
Aloclair
Atopiclair
Lypsyl
Mother & Child
16%
Diclectin,
Kelo-stretch
Forceval/Fushifu,
Suprememil
Ashton & Parsons
Anbesol, Alovex
Syntometrine, MolluDab,
Timodine, Oxyplastine
Ophthalmology
4%
MacuShield
Percentages refer to pro forma sales in the 12 months to December 2015, including share of joint ventures
7
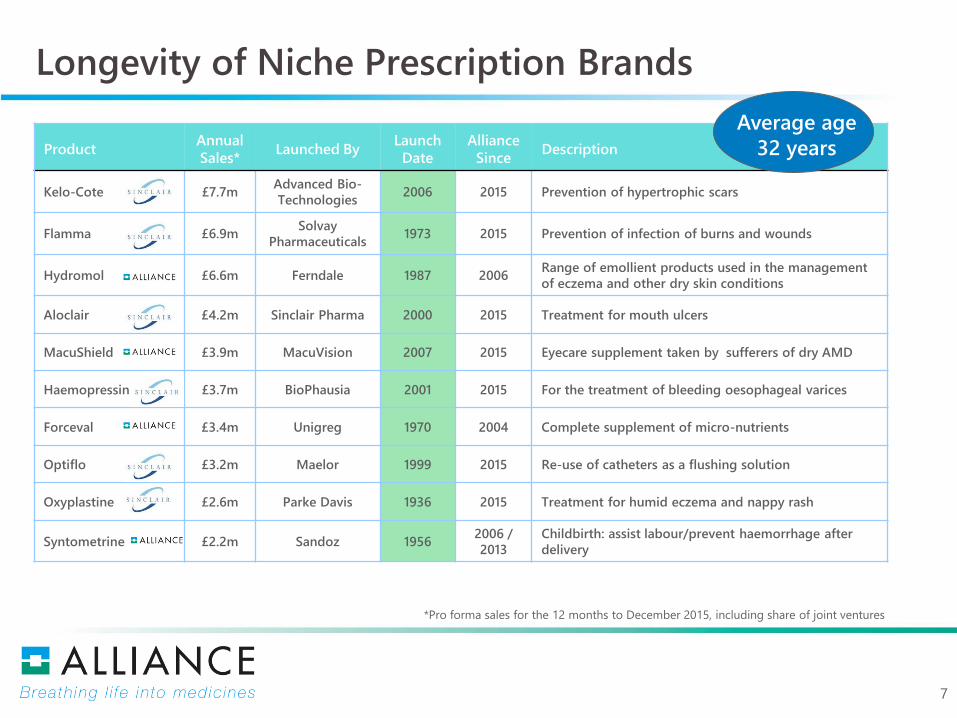
Longevity of Niche Prescription Brands
ProductAnnual
Sales*Launched By
Launch
Date
Alliance
SinceDescription
Kelo-Cote £7.7mAdvanced Bio-
Technologies2006 2015 Prevention of hypertrophic scars
Flamma £6.9mSolvay
Pharmaceuticals1973 2015 Prevention of infection of burns and wounds
Hydromol £6.6m Ferndale 1987 2006Range of emollient products used in the management
of eczema and other dry skin conditions
Aloclair £4.2m Sinclair Pharma 2000 2015 Treatment for mouth ulcers
MacuShield £3.9m MacuVision 2007 2015 Eyecare supplement taken by sufferers of dry AMD
Haemopressin £3.7m BioPhausia 2001 2015 For the treatment of bleeding oesophageal varices
Forceval £3.4m Unigreg 1970 2004 Complete supplement of micro-nutrients
Optiflo £3.2m Maelor 1999 2015 Re-use of catheters as a flushing solution
Oxyplastine £2.6m Parke Davis 1936 2015 Treatment for humid eczema and nappy rash
Syntometrine £2.2m Sandoz 19562006 /
2013
Childbirth: assist labour/prevent haemorrhage after
delivery
Average age
32 years
*Pro forma sales for the 12 months to December 2015, including share of joint ventures

8
Risk Reduction Through Diversity
Kelo-cote9%
Flamma8%
Hydromol7%
Aloclair5%
MacuShield4%
Haemopresin4%
Forceval4%
Optiflo4%
Oxyplastine3%
Syntometrine2%
Other50%
Revenue over 90 products
Pro forma
revenue in the
12 months
ended 31
December 2015,
including share
of joint
ventures
UK51%
France10%
APAC8%
MEA7%
CEE & LATAM
7%
DACH5%
ROI4% Italy
3%
Spain2% JV
2%Others
1%
Geographical split over
100 countries
Pro forma
revenue in the
12 months
ended 31
December 2015,
including share
of joint ventures

9
Buy & Build – Acquisitions Over Past 10 Years
2006 2007 2008 2009 2010 2011 2012 2013 2014 2015
C A R A D E R M
Syntometrine
£2.0m
Atarax
Deltacortril
Terracortrill
£1m
Permitabs
£0.8m
Dermamist
£0.26m
Hydromol
£3.3m
Pavacol D
£0.6m
Buccastem
Timodine
£7.5m
Cambridge
£16.4m
Quinoderm
Ceanel
£1.5m
Rizuderm +
5 Products
£2.4m
Anbesol
Ashton &
Parsons
£2.26m
Opus
£8mLypsyl
£1.9m
Syntometrine
(excl. UK)
£7.5m
Irenat
(Germany)Forceval
China
£1.95m
MacuShield
£5.5 - 11.5m
Antimalarials
£4.2m
31 deals in 17 years
Every year since 2006
Sinopharm
Sinclair
£127.5m
Diclectin
£1.5m

10
Sinclair Products Acquisition – December 2015
Largest acquisition to date
£127.5m plus £5m inventory
£39.4m sales to December 2015
£81m (net) equity raised at 41p
£100m new debt facility from Lloyds, RBS and Silicon Valley Bank
£75m drawn down: £56m for acquisition, £19m to close previous facility
Transformational deal
Market cap from £120m* to £237m**; Enterprise Value from £141m to £308m
Approximate doubling of sales, profits, people
Delivers pan-EU5 footprint to facilitate future opportunities
Strengthens China business and provides a base in SE Asia
Provides potential territories for original Alliance brands
*16th December 2015
**6th April 2016

11
Other Deals in 2015
MacuShield: £8.8m – February 2015
2015 sales £3.5m +13% (Pro-forma sales £3.9m)
90% UK & Ireland – significant international potential
Sinopharm: September 2015
Five child nutrition brands add to Mother & Child franchise in China
£1.5m sales in 12 months to March 2015
Diclectin in-licensing for UK: £1.5m – January 2015
In registration – launch expected H1 2017
Will be UK’s only licensed product for nausea and vomiting of pregnancy
Been on Canadian market for over 30 years
US approval by FDA two years ago – sales running at $160m pa

12
Hydromol – Range of emollients for remission of eczema
2015 sales £6.6m; largest territory UK
Kelo-cote™ – Scar reduction
2015 sales £7.7m; largest territory China
Flammazine™ / Flammacerium™ – Anti-infective for burns
2015 sales £6.9m; largest territory France
Aloclair™ – Oral lesions
2015 sales £4.2m; largest territory Italy
Atopiclair™ – Atopic eczema
2015 sales £1.7m; largest territory SE Asia
Papulex™ – Acne
2015 sales £1.5m; largest territory SE Asia
Dermatology – £28m / 32% of Sales

13
Mother & Child – £15m / 16% of Sales
Fushifu™ (Forceval™) – micronutrient support in pregnancy2015 sales £0.9m (60% share) / China
Diclectin – nausea and vomiting of pregnancyIn registration (expected approval H1 2017) / UK
Kelo-stretch™ – avoidance/reduction of stretchmarks2015 sales £1.5m / largest territory SE Asia
Syntometrine™ – prevention of post-partum haemorrhage2015 sales £2.2m / largest territory UK
Suprememil™ – infant formula milk2015 sales £0.4m (20% share) / China
Ashton & Parsons Infants’ Powders™ – calming relief from teething2015 sales £1.5m / UK
Anbesol™ – pain relief for teething2015 sales £1.5m / UK
Timodine™ – infected nappy rash2015 sales £1.6m / UK
Oxyplastine™ – barrier cream for nappy rash2015 sales £2.3m; largest territory MEA

14
Ophthalmology / MacuShield- Sales in 2015 £3.5m (+13% pa)
Macula is the region at the back of the eye (retina) for central vision
Three carotenoid (macular) pigments found there
Meso-zeaxanthine
Zeaxanthine
Lutein
Macular pigments filter out high energy blue light
Reduce glare (eg night-time driving)
Improve contrast sensitivity (eg sport)
Anti-oxidant and reduce oxidative stress (damage to photo-receptors)
Stabilise or reverse age-related macular degeneration (AMD)
Risk factors: poor diet, smoking, genetics
Largest cause of blindness in the elderly
500,000 registered cases in UK alone
MacuShield supplements dietary macular pigments
Only product containing lutein, zeaxanthine and meso-zeaxanthine (patented)
Promoted scientifically to optometrists / supplied commercially via consumer channels
Territories – EU + CH, N, Russia, E Europe, AUS, NZ, SA (currently 75% sales UK)

15
2015 Results

1616
2015 Full Year Results – Summary
Revenue £48.3m (2014: £43.5m)
Including Sinclair sales of £0.8m
Gross margin rate of 59.4% (2014: 57.5%)
Operating profit £12.5m* (2014: £11.8m**)
Adjusted pre-tax profit £11.4m* (2014: £10.8m**)
Reported pre-tax profit £15.2m (2014: £10.2m)
Adjusted diluted EPS 3.61p* (2014: 3.34p**)
Diluted EPS 4.55p (2014: 3.16p)
Free cash flow £6.3m (2014: £10.3m)
After acquisition of £4.7m Sinclair inventory
Net bank debt £71.5m (2014: £21.1m), with gearing at 2.8 times EBITDA
Final dividend up 10% to 0.734p (2014: 0.667p)
Total dividend up 10% to 1.100p (2014: 1.000p)
*Before the exceptional and non-underlying
items (primarily compensation from Sanofi
and Sinclair acquisition costs)
** Before impairment of Pavacol-D

17
Performance Comparison
£43.5m
£48.3m
40.0
42.0
44.0
46.0
48.0
50.0
2014 2015
£m
Sales
3.16p
4.55p
3.34p3.61p
-
1.00
2.00
3.00
4.00
5.00
2014 2015
Pen
ce
Basic & adjusted diluted EPS
Basic Diluted EPS
Adjusted Diluted EPS
£10.8m
£11.4m
10.4
10.6
10.8
11.0
11.2
11.4
11.6
2014 2015
£m
Underlying PBT
1.00p
1.10p
0.95
1.00
1.05
1.10
1.15
2014 2015
Pen
ce
DPS

18
2015 Sales Movements
2015
£m
2014
£m
Change
£m
MacuShield February 2015 acquisition3.5
0.8
6.6
-
-
6.0
+3.5
+0.8
+0.6
Sinclair Sales December 2015 acquisition
Hydromol Growth of 10%
Forceval Capsules Recover from stock-out 2.1 1.5 +0.6
Other Consumer Growth from promotion 4.1 3.7 +0.4
Fostered Products Handed back in 2014 - 1.6 (1.6)
Nu-Seals Generic competition 1.9 2.5 (0.6)
Quinoderm API unavailable 0.2 0.5 (0.3)
Other 29.1 27.7 +1.4
Group 48.3 43.5 +4.8
Share of China joint ventures 1.3 2.0 (0.7)
Total 49.6 45.5 4.1
19
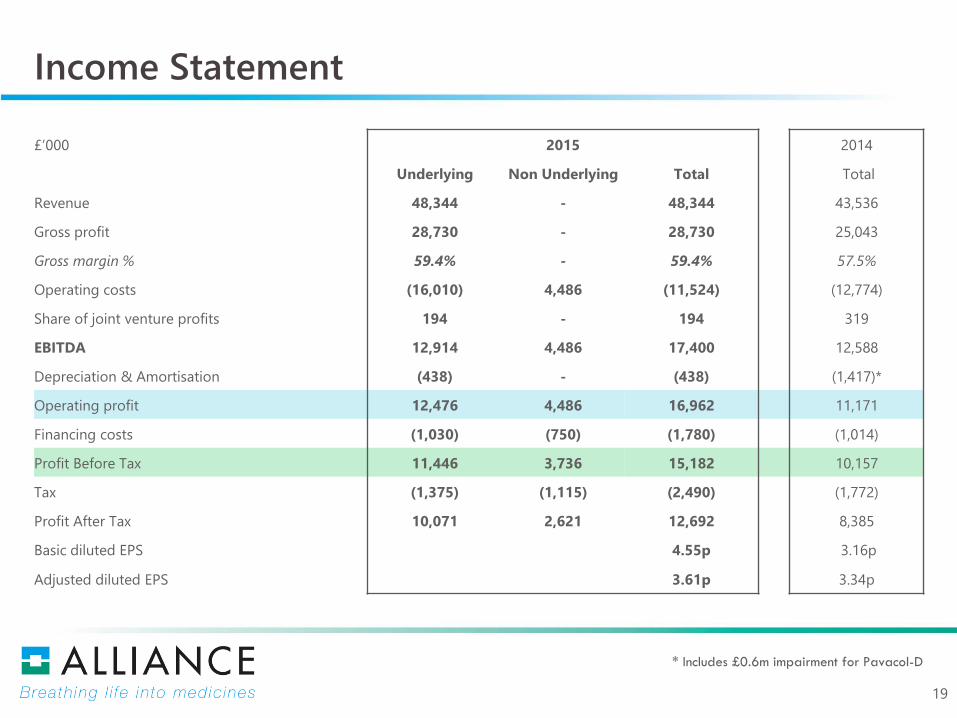
Income Statement
£’000 2015 2014
Underlying Non Underlying Total Total
Revenue 48,344 - 48,344 43,536
Gross profit 28,730 - 28,730 25,043
Gross margin % 59.4% - 59.4% 57.5%
Operating costs (16,010) 4,486 (11,524) (12,774)
Share of joint venture profits 194 - 194 319
EBITDA 12,914 4,486 17,400 12,588
Depreciation & Amortisation (438) - (438) (1,417)*
Operating profit 12,476 4,486 16,962 11,171
Financing costs (1,030) (750) (1,780) (1,014)
Profit Before Tax 11,446 3,736 15,182 10,157
Tax (1,375) (1,115) (2,490) (1,772)
Profit After Tax 10,071 2,621 12,692 8,385
Basic diluted EPS 4.55p 3.16p
Adjusted diluted EPS 3.61p 3.34p
* Includes £0.6m impairment for Pavacol-D

20
Cash Flow
£’m 2015 2014
Operating profit 17.0 11.2
Depreciation and Amortisation 0.4 1.4*
Share options 0.6 0.6
Working capital (8.2) 0.3
Cash flow from trading 9.8 13.5
Financing costs (1.0) (1.0)
Capital expenditure (0.6) (0.2)
Tax paid (1.9) (2.0)
Free cash flow 6.3 10.3
Acquisitions (133.9) (3.8)
Equity raised (net of issue costs) 81.0 -
(Payment)/receipt of borrowings (net of fees) 51.3 (1.7)
Dividend (2.6) (2.4)
Net movement in cash and cash equivalents 2.1 2.4
* Includes £0.6m impairment of Pavacol-D

21
Balance Sheet
£’m Dec 15 Dec 14 Change
Intangibles: Product licences 259.9 88.9 +171.0
Joint ventures 2.9 2.7 +0.2
Inventories 12.9 5.9 +7.0
Trade and other receivables 11.6 8.3 +3.3
Trade and other payables (13.9) (6.9) (7.0)
Taxes (current and deferred) (39.4) (7.1) (32.3)
Other net assets (0.1) 0.1 (0.2)
Net cash / overdraft 3.2 1.0 +2.2
Bank loans (74.7) (22.1) (52.6)
Net bank debt (71.5) (21.1) (50.4)
Equity 162.4 70.8 +91.6

22
Summary

23
Summary
2015 was a good year for the original Alliance business:
Sales £48.3m (+11.0%)
New growth area with MacuShield in AMD
In-licensing of Diclectin for nausea and vomiting of pregnancy
Underlying PBT £11.4m (+5.5%)
Underlying EPS 3.61p (+8.1%)
Dividend raised by 10% to 1.1p for the full year
The transformational Sinclair acquisition facilitates the buy and build strategy
Approximate doubling of sales, profits, people
Strengthens Alliance’s Dermatology offering
Strengthens Alliance’s Mother and Child offering
A 50/50 portfolio balance between growth and bedrock products is maintained
Delivers pan-EU5 footprint to facilitate future opportunities (75% of sales)
Strengthens China business and provides a base in SE Asia
Provides new potential territories for original Alliance brands
Greater financial scale opens up potentially larger M&A opportunities in the future

24
Appendices
24

25
Top 20 Investors: 1 March 2016
Holder / Fund Manager No. of Shares % Holding
Director & Related 62,182,788 13.28%
MVM Life Science Partners 55,561,900 11.87%
Aviva Investors Global Services 44,982,748 9.61%
Artemis Fund Managers Ltd 37,583,219 8.03%
Nigel Wray 37,376,510 7.98%
Slater Investments 33,947,038 7.25%
Fidelity Management & Research 33,513,321 7.16%
River & Mercantile Asset Management 24,000,000 5.13%
Hargreave Hale 11,994,159 2.56%
Franklin Templeton Investments 11,750,000 2.51%
Brown Shipley Asset Management 11,599,706 2.48%
LGT Capital Management 9,890,832 2.11%
Brown Brothers Harriman & Co 8,120,455 1.73%
BlackRock Investment Management (UK) 7,930,847 1.69%
Henderson Global Investors 6,796,204 1.45%
Cavendish Asset Management 5,994,000 1.28%
Smith & Williamson Investment 4,740,694 1.01%
Threadneedle Asset Management 4,214,732 0.90%
Redmayne Bentley Stockbrokers 3,774,849 0.81%
Barclays Wealth Management (UK) 3,199,286 0.68%
Total No of Share Owners: 934 No of Shares in Issue: 468,304,266

26
Board Members
John Dawson – Chief Executive Officer
Tony Booley – Executive Director
Andrew Franklin – Chief Financial Officer Peter Butterfield – Chief Commercial Officer
Andrew Smith – Chairman
Thomas Casdagli – Non-Executive Director
Pharmacist, MSc Finance; > 40yrs’ sector
experience, founder of Alliance
Director – International
BSc Physiology, MBA, Chartered Marketer;
30yrs’ sector experience, with Alliance since 1998
Former UK Commercial Director of Cambridge
Laboratories Ltd, graduated in Pharmacology from
University of Edinburgh
Senior positions held at SmithKline Beecham
Pharmaceuticals, Diversified Health Systems Europe,
Cerebrus plc and Parexel International
Partner in MVM Life Science Partners, Chartered
Accountant, graduated from Oxford in Molecular and
Cellular Biochemistry, joined March 2009
David Cook – Non-Executive Director
CFO and Chief Business Officer at Biotie Therapies
Inc. Chartered Accountant, graduated in
Chemistry from Oxford. Joined Alliance April 2014
Nigel Clifford – Non-Executive Director
CEO of Ordnance Survey. Previously held senior
positions at Procserve Holdings, Micro Focus Int plc,
Nokia, Symbian Software. Graduated in Geography from
the University of Cambridge
Former General Manager – European Tax and Accounting
at Panasonic. Prior to that, Finance Director of Genzyme
Therapeutics Ltd and 12 years pharmaceutical experience
in senior financial positions at Wyeth.

27
Senior Team Members
Janice Timberlake – Chief Human
Resources Officer
Fellow of CIPD with over 20 years of experience
in HR roles. Previous senior roles in My Travel
plc and National Environment Research Council.
NED and Trustee of Plymouth Marine
Laboratory Ltd, BSc Hons in Geography from
Hull University. Joined in 2011.
Dan Thomas – Chief Corporate
Development Officer
Since joining in 2006, has led Alliance’s M&A
and licensing activity, completing over 14 deals.
Has worked in Canada, Germany and France.
He holds a first class honours degree in Applied
Biochemistry from Brunel University. In 2011
Dan won the PLG/Astra Zeneca BD Executive of
the Year award.
Stephen Kidner – Chief Scientific &
Operations Officer
Sarah Robinson – Company Secretary
Over 23 years’ experience in pharma
development, manufacturing and supply chain
management gained with Wyeth and
Mundipharma International. BSc in Chemistry
from University of Wales, Swansea, MSc in
Pharmaceutics from Manchester and an MBA
from The Open University. Joined in 2013.
Over 20 years’ experience in the health and
financial services sectors, including Company
Secretary at the Financial Times and Investors
Chronicle jointly for 7 years. Has worked in
Asia, the UK and the USA. A Chartered
Secretary with an MBA from Southampton
University. Joined in 2010.

28
Product Portfolio

29
Product Portfolio

30
Product Portfolio

31
Product Portfolio

32
Product Portfolio

33
Product Portfolio

34
Product Portfolio

35
Product Portfolio

36
Product Portfolio