2015 - greater bank limited · greater building society ltd. abn 88 087 651 956. afsl/australian...
TRANSCRIPT
2015Annual Report

Contents
Chairman’s Report 01
CEO’s Report 03
Our Community 05
The Greater Charitable Foundation 09
Financial Statements 30 June 2015 11
Head Off ice: 103 Tudor Street Hamilton NSW 2303 PO Box 173 Hamilton NSW 2303 P 1300 651 400 F 02 4921 9112
Greater Building Society Ltd. ABN 88 087 651 956. AFSL/Australian Credit Licence No. 237476.

Annual Report | 2014-15Greater Building Society 0201
Chairman’s ReportI am pleased to report another strong year of performance for the Greater Building Society.
As The Greater is a customer owned financial banking organisation, the role of the Board is to protect and enhance long-term value for customers. The Board and Management have been developing a new strategy to deliver upon our mantra of customer first. The strategy is built around five broad pillars:
• Sustainably grow our customer base in target markets,
• Improve organisational efficiency,
• Proactively manage regulatory change and risk,
• Strengthen business capabilities (people, processes and systems), and
• Commit to corporate social responsibility.
This strategy is designed to ensure that The Greater continues to remain relevant and sustainably grow in a rapidly changing and highly competitive environment. While the strategy is still being implemented, our new CEO and his team are already embracing change. The CEO’s report details a number of specific achievements this year.
Our strong financial performance is good news for customers and the community. It allows The Greater to invest in the changes required for IT, core banking, products and systems to be able to offer customers even better products and services. It also allows us to continue to support the communities in which we operate through sponsorships as well as funds to The Greater Charitable Foundation. The Greater’s Capital Adequacy Ratio is again growing to exceed regulator requirements and ensure continued strength and stability.
We want to continue our history of strong financial performance, value for customers, outstanding service and support for the community while positioning The Greater to be more nimble. Being nimble is important for us to be able to anticipate and respond to customers’ changing needs as well as changes to the industry and regulatory environment.
Corporate Governance and Risk Management
The Greater has a proud history of good governance and risk management. We manage risks consistent with the best interests of customers and the long term, sound financial performance of the business.
The Board and Management have continued to strengthen their governance and risk management consistent with Prudential Standard CPS 220 Risk Management.
The Risk and Audit committees of the Board are now separate to allow a greater focus on both important aspects of the business and a demonstration of its commitment to risk management principles.
The Greater employs risk-based decision-making and oversight across all operations. The Board sets the tone from the top to ensure a sound risk culture is maintained and communicated via The Greater’s business strategy, risk appetite, understanding of risk and capabilities, as well as how risk management behaviours are encouraged and rewarded.
The Greater’s comprehensive, three lines of defence structure and Risk Management Framework are incorporated explicitly into all Greater policies. The framework allows us to identify, analyse and manage the current and emerging risks within the business. The Board is actively monitoring its risk profile to ensure that activities undertaken to achieve strategic objectives are within risk appetite.
Through the Board committees, a Chief Risk Officer (CRO) and external support, we ensure oversight of the risk profile and risk management as well as independent reporting lines to appropriately escalate issues.
Board performance
The Board and each of its committees have a charter to guide roles and responsibilities in compliance with APRA’s CPS 510 Governance and CPS 520 Fit and Proper.
Board members continue to undertake ongoing professional development activities and regularly attend Australian Institute of Company Directors events and forums to enhance their role as Directors. In addition, the Board engages external consultants to assist it with an annual review of Board performance.
Support for community
One benefit for customers banking with the customer owned Greater is that profits are invested back into improved services as well as support for their community.
The Board again provided $1.2M to The Greater Charitable Foundation this year. Those funds are being used by The Greater Charitable Foundation to provide grants to a number of outstanding charities that are making a real difference to the lives of families and a stronger community.
The future – a name change
The Board is committed to driving change to ensure The Greater remains relevant and viable to provide much needed competition to the major banks for the benefit of customers. An important change we must make is to our name. The term building society does not adequately reflect the services we provide and is not well understood, particularly by younger people.
Changing our name to Greater Bank better reflects what we do – which is to provide a comprehensive range of banking services. If the name change is approved at the AGM we will remain a mutual (customer owned). The only major change existing customers will see is more people joining them to experience our award-winning service and greater value products and services, making us even stronger and better able to offer even more value to customers and the community.
Thank you to my fellow Directors, Management and employees for their contribution to The Greater’s excellent results. I also thank them for their support for the need to change to continue to put customers first.
Wayne Russell Chairman
Greater Board Members; Front L to R: Malcolm McDonald, Jayne Drinkwater, Wayne Russell; Middle L to R: Roger Cracknell, Scott Robinson; Back: Russell Ware
Chairman, Wayne Russell

Annual Report | 2014-15Greater Building Society 0403
This is my first report as CEO and I am pleased to report this financial year has been an excellent one. Below is an overview of achievements made against the five pillars of our new strategic approach.
Sustainably grow our customer base
Against the trend of many peers we welcomed more customers to The Greater, particularly in 2015. This stems from the work we started this year to better understand what customers are looking for in terms of our branding, distribution and service capabilities.
Providing outstanding customer service has always been at the centre of our success. This was recognised when we took out a national Roy Morgan Customer Satisfaction Award for the second year running with ratings as high as 97%.
Offering the best customer experience and attracting more customers comes down to more than friendly, expert employees. We reviewed our product features, and continue to review our pricing, to ensure our products are sharp and fit for purpose. Two of our loans received accolades in the Mozo Experts Choice Awards and Australian Lending Awards. We introduced a new low fee, high interest youth savings account that is proving very popular.
Our Straightforward Banking campaign positions The Greater as a financial institution that offers customers simple, honest banking. We are straightforward but also increasingly sophisticated in our product and service offering.
The Greater is a leader among customer owned financial institutions in digital banking and use of social media. This year we introduced a new, plain English, customer centric website that is seamless across all platforms. Digital banking improvements included enhanced mobile banking apps with four-digit PINs for faster login, account balances available directly after login, on the go set up of new payees and billers, as well as the Australian first of Direct Debit SMS alerts.
Improve organisational efficiency
Our solid profit result demonstrates we are a strong, well-managed, efficient financial institution.
Our group profit of $34.95M is up 11% on last year and comprehensive income is up 17% to $36.4M. This result reflects continued focus on cost reduction as well as doing things simpler and smarter. We’ve also started to see some very good asset growth, particularly over the last eight months of the year. At the end of the year, total assets were $5.4 billion, up 6.2%.
Loan growth was modest at just over 2.2% – a sound result given the competitive environment. Importantly, lending growth strengthened in the second half of the year with net loan approval numbers at their highest since 2011. We consciously grew deposits (up 6.2%), which puts us in good stead as we continue to drive stronger lending.
Proactively manage regulatory change and risk
With the rapid changes taking place in banking, failure to manage risk and regulation effectively represents one of our greatest strategic concerns. Our achievements are detailed elsewhere in this report but we have continued to increase resources and focus on our risk management.
Strengthen business capabilities
To sustainably grow our customer base we need to continue to develop the right business capabilities. Our focus is on developing our key people, processes and system assets. We started to recruit new members of our Executive team as an important first step.
On the people front, it was pleasing to see almost 100 employees graduate with nationally accredited qualifications from our business school. This training gives employees the skills and knowledge to be experts when serving customers, as well as better leaders and team members to improve our business.
We continue to make changes to better measure and reward outstanding performance. Congratulations to our long serving North Coast Lending Manager, Michael Clement, on being named Employee of the Year and to mid North Coast Lending Manager, Mick Herb, for taking out the Ian Nelmes Award for Outstanding Service. We also had two Greater employees recognised nationally as emerging leaders within the customer owned banking sector – Ben Picton and Emma Avery. This combination of existing, new and emerging talent is key to our success.
Creating a diverse and flexible workplace is critical to attracting the best people. The Greater was named Workplace Flexibility Champion at the Hunter Diversity Awards and was also a finalist for flexible workplaces in the national HR Awards.
We made some realignments to our branch network to ensure we have branches in the right locations to meet the needs of customers. Our commitment to the Gold Coast was reaffirmed with a new Robina Branch.
That branch will serve as a concept branch to test enhancements in service such as concierge services and greater use of technology for a better banking experience.
Our ‘lending simple’, omni-channel and other business improvement programs are also delivering back and front end changes to processes to truly put our customers first.
Commit to corporate social responsibility
In the coming years we’ll continue to integrate CSR into our business strategy to promote innovation and business sustainability. We strive to operate our business in an ethical way and minimise our impact on the environment. CSR is about creating value for our business and the communities in which we operate, which includes risk management and giving back to the community.
Our customer owned structure means our focus is on customers and community rather than shareholders. Through The Greater’s many sponsorships, other business and community support and its funding of The Greater Charitable Foundation (see pages 9 and 10), we are improving the regions in which we operate and the lives of local people.
The future is exciting
Looking forward, the outlook remains challenging. Economic uncertainty surrounds our national and regional economies and competition from established and new disruptive competitors continues to increase. The Greater will respond to these challenges.
I’d like to thank the Board and our employees for their tremendous support and enthusiasm for change. I remain incredibly excited by the opportunities that lie ahead in our business.
Scott Morgan Chief Executive Officer
Greater Executive Committee; Back L to R: Craig Chapman, Scott Morgan, Michael King, Bruce White; Front L to R: Marie Hanson-Kentwell, Greg Taylor, Matthew Hingston
CEO’s Report
Chief Executive Officer, Scott Morgan

Annual Report | 2014-15Greater Building Society 0605
Our Community
Supporting grassroots sport
Through a number of sporting sponsorships, The Greater has helped people to be healthy and to do their best in their sport, as well as to save for their future.
Grassroots netball
After more than 20 years sponsoring Newcastle grassroots netball, this year The Greater expanded its support of local netball associations across regional NSW and the Gold Coast.
More than 20 netball associations received support to run their weekend games. Thousands of registered players received netball packs with water bottles as well as Life Saver accounts to help women and girls to save for their future.
New support for Hunter Academy of Sport
At the request of the Hunter Academy of Sport, The Greater has this year supported the Academy’s netball squad as well as helped it host the Festival of Sport netball competition involving academies from across NSW. The Greater is continuing to support the Academy’s annual awards night. The support is designed to help more athletes and their families.
The $2,000 Greater Building Society Olympic Scholarships were awarded to 10 athletes striving to represent Australia at upcoming Olympic and Paralympic Games.
The Greater has awarded these scholarships for 22 years, providing more than $360,000 to support more than 100 athletes over this time.
The Greater Fun Run Series
The Greater is encouraging people to have fun and get active with its new sponsorship of nine Athletics NSW fun runs across NSW in 2015 known as The Greater Fun Run Series.
The Greater supported the Hunter Track Classic for the fifth year and the event attracted some of Australia’s best athletes. The Hunter’s Fastest Kid races, also supported by The Greater, gave talented young athletes a chance to shine. Six winners were presented with Life Saver accounts.
Central Coast Carols drives young people
Young people doing it tough on the Central Coast were given a helping hand to learn to drive using the proceeds from the Mingara Christmas Under the Stars.
The Greater sponsored the event for the second year. Mingara and The Greater presented The Salvation Army’s Oasis Youth Centre, at Wyong, with $20,207 to purchase a car for its Drive for Life Program. More than 16,000 local residents attended the Carols event to enjoy some Christmas cheer and to make the donation possible.
Supporting those helping others
Skills for New England youth
At-risk young people living in the New England region have gained valuable skills in agriculture because of a $110,000 donation to Armidale-based charity, BackTrack.
The funding enabled the recruitment of a full-time AgLads Program Co-ordinator, Paul Dawson. It also assisted with program-related costs and allowed researchers at the University of New England to begin to evaluate the program.
These young people work on local training farms. The aim is to give them an opportunity to reconnect with their education and training, to become work- ready, find jobs, lead happy and productive lives and participate fully in the community. The program also helps local farmers overcome skill shortages. The funding came from the $1.5 million The Greater committed to spend in the New England region over 10 years when it merged with Armidale Building Society.
Junior Surfing Development Program
The next wave of up and coming surfers have a better chance of realising their dream of becoming pro surfers, thanks to The Greater’s support of the Merewether Surf Board Club’s new Junior Development Program. The program provides young surfers with support and advice to increase access to the sport and competitions. It encourages surf awareness, skills development and having fun. The Greater also helped the young surfers learn to save for their future with Life Saver accounts and a financial fitness seminar.
Presentation of cheque to BackTrackThis year The Greater expanded its support of local netball associations

Annual Report | 2014-15Greater Building Society 0807
Other organisations to benefit from Greater support
• Central Coast Academy of Sport
• Newcastle and Hunter Rugby Union
• The Newcastle Italian Film Festival (raising funds for motor neurone disease research)
• Hunter Young Professionals
• Property Council Hunter Chapter events
• Rotary (Newcastle Red Lantern Walk)
• Cystic Fibrosis NSW
• Regional Development Australia
• Armidale New England Enterprising Business Women’s Breakfasts and Enterprising Woman of the Year Award
• Hunter Business Award for Customer Satisfaction (under 20 employees) – won by Pepper Tree Wines in August 2014
• Junior Spirit Obstacle race in Forster
• Hunter District Cycling Club
• Big Day In – IT careers conference for young students
• Newcastle Art Prize – Society of Artists
Our Community continued
Supporting those helping others
KidzWish Giving Tree for Love and Laughter
The Greater has joined forces with Illawarra charity, KidzWish Foundation, to improve the lives of sick and disadvantaged children and their families. The Greater funded the construction of a new KidzWish Giving Tree at Stockland Shellharbour. The mural has space for personalised fundraising leaves, which people can buy from a Greater branch. The aim is to raise an additional $35,000 on top of $25,000 already donated by The Greater for KidzWish’s Love and Laughter Appeals Program. The funds raised will be distributed back to Illawarra children and their families in the form of grants to purchase equipment or services to improve their general health and independence.
Keeping Youth Off The Streets
A new partnership between The Greater and Father Chris Riley’s Youth Off The Streets was established to raise vital funds for programs that keep young people out of crisis and away from danger.
In a first for both organisations, The Greater will donate $2 to Youth Off The Streets for every Life Saver Account opened until $10,000 is raised.
The money raised will go toward outreach and educational programs that help disadvantaged young people in regional NSW.
The launch of The Giving Tree Wall with Shellharbour Branch Manager, Brendan White
Father Chris Riley in the Youth Off The Streets and Life Saver campaign
Annual Report | 2014-15Greater Building Society 1009
The Greater Charitable Foundation
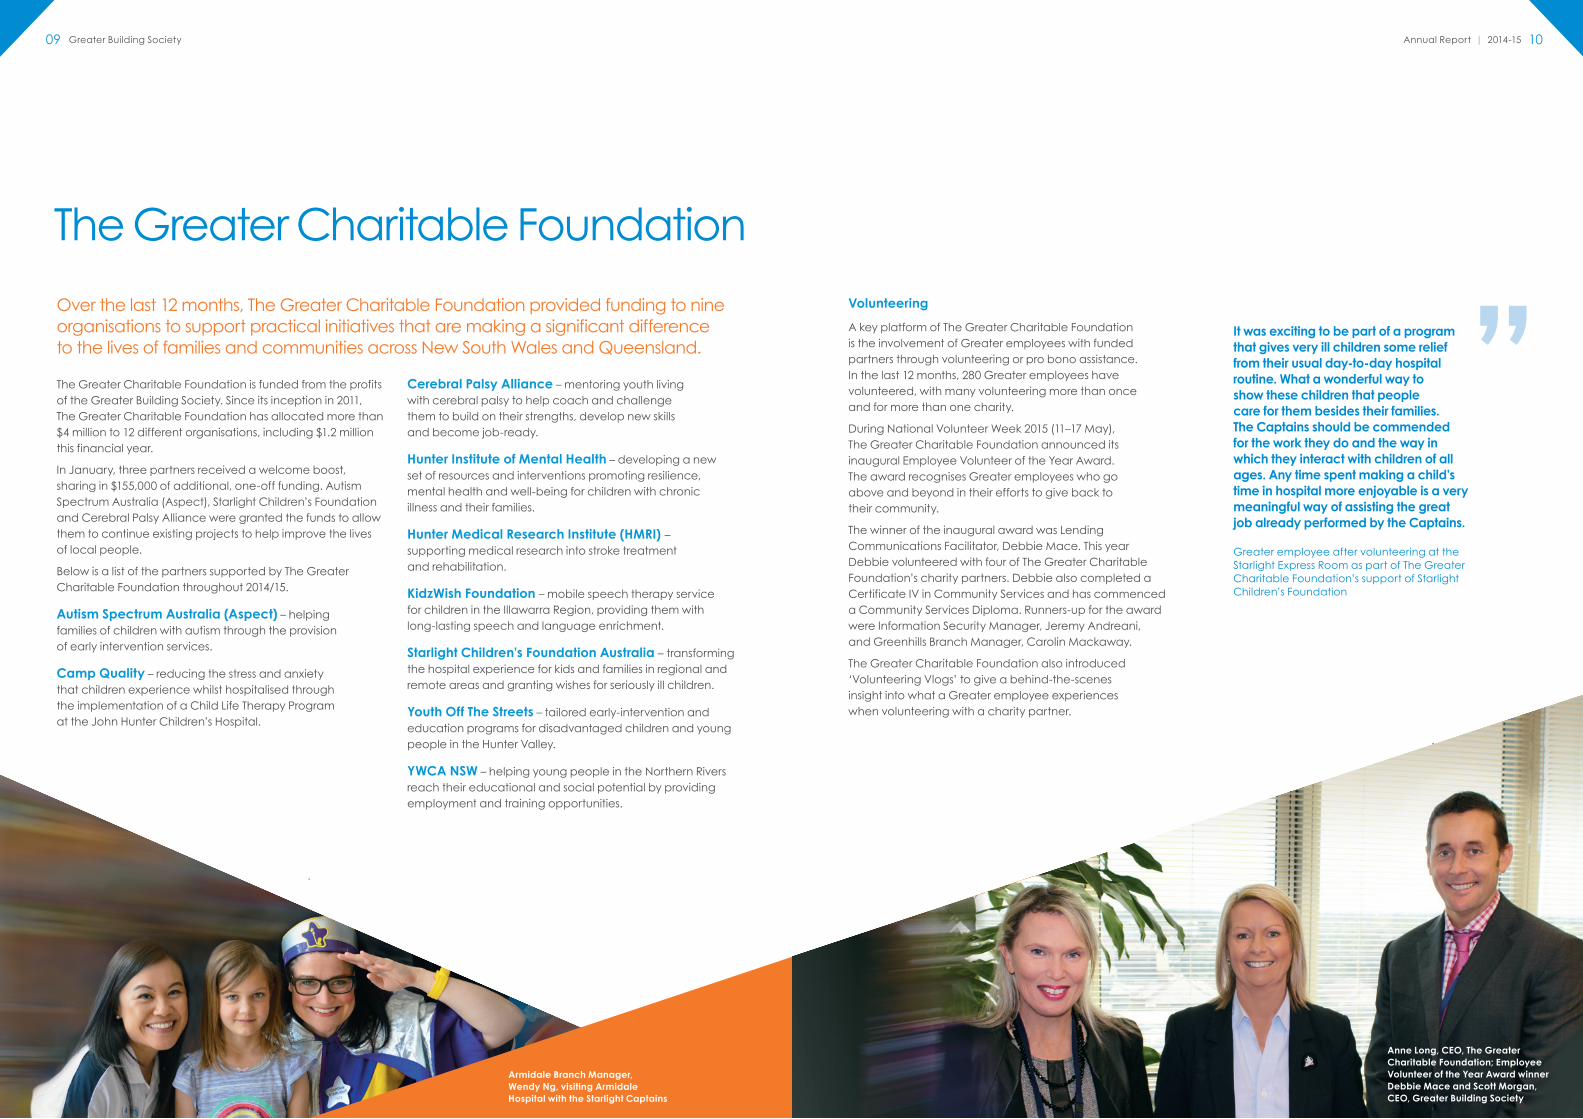
Over the last 12 months, The Greater Charitable Foundation provided funding to nine organisations to support practical initiatives that are making a significant difference to the lives of families and communities across New South Wales and Queensland.
The Greater Charitable Foundation is funded from the profits of the Greater Building Society. Since its inception in 2011, The Greater Charitable Foundation has allocated more than $4 million to 12 different organisations, including $1.2 million this financial year.
In January, three partners received a welcome boost, sharing in $155,000 of additional, one-off funding. Autism Spectrum Australia (Aspect), Starlight Children’s Foundation and Cerebral Palsy Alliance were granted the funds to allow them to continue existing projects to help improve the lives of local people.
Below is a list of the partners supported by The Greater Charitable Foundation throughout 2014/15.
Autism Spectrum Australia (Aspect) – helping families of children with autism through the provision of early intervention services.
Camp Quality – reducing the stress and anxiety that children experience whilst hospitalised through the implementation of a Child Life Therapy Program at the John Hunter Children’s Hospital.
Cerebral Palsy Alliance – mentoring youth living with cerebral palsy to help coach and challenge them to build on their strengths, develop new skills and become job-ready.
Hunter Institute of Mental Health – developing a new set of resources and interventions promoting resilience, mental health and well-being for children with chronic illness and their families.
Hunter Medical Research Institute (HMRI) – supporting medical research into stroke treatment and rehabilitation.
KidzWish Foundation – mobile speech therapy service for children in the Illawarra Region, providing them with long-lasting speech and language enrichment.
Starlight Children’s Foundation Australia – transforming the hospital experience for kids and families in regional and remote areas and granting wishes for seriously ill children.
Youth Off The Streets – tailored early-intervention and education programs for disadvantaged children and young people in the Hunter Valley.
YWCA NSW – helping young people in the Northern Rivers reach their educational and social potential by providing employment and training opportunities.
Volunteering
A key platform of The Greater Charitable Foundation is the involvement of Greater employees with funded partners through volunteering or pro bono assistance. In the last 12 months, 280 Greater employees have volunteered, with many volunteering more than once and for more than one charity.
During National Volunteer Week 2015 (11–17 May), The Greater Charitable Foundation announced its inaugural Employee Volunteer of the Year Award. The award recognises Greater employees who go above and beyond in their efforts to give back to their community.
The winner of the inaugural award was Lending Communications Facilitator, Debbie Mace. This year Debbie volunteered with four of The Greater Charitable Foundation’s charity partners. Debbie also completed a Certificate IV in Community Services and has commenced a Community Services Diploma. Runners-up for the award were Information Security Manager, Jeremy Andreani, and Greenhills Branch Manager, Carolin Mackaway.
The Greater Charitable Foundation also introduced ‘Volunteering Vlogs’ to give a behind-the-scenes insight into what a Greater employee experiences when volunteering with a charity partner.
It was exciting to be part of a program that gives very ill children some relief from their usual day-to-day hospital routine. What a wonderful way to show these children that people care for them besides their families. The Captains should be commended for the work they do and the way in which they interact with children of all ages. Any time spent making a child’s time in hospital more enjoyable is a very meaningful way of assisting the great job already performed by the Captains.
Greater employee after volunteering at the Starlight Express Room as part of The Greater Charitable Foundation’s support of Starlight Children’s Foundation
Anne Long, CEO, The Greater Charitable Foundation; Employee Volunteer of the Year Award winner Debbie Mace and Scott Morgan, CEO, Greater Building Society
Armidale Branch Manager, Wendy Ng, visiting Armidale Hospital with the Starlight Captains

Annual Report | 2014-15Greater Building Society 1211
ContentsFinancial Statements 30 June 2015
Directors’ Report
The Directors have much pleasure in presenting their report on the consolidated financial statements consisting of the Greater Building Society Ltd (the Society) ABN 88 087 651 956 and the entities it controlled at the end of, or during, the year ended 30 June 2015.
DIRECTORSThe following persons held office as Directors for the whole of the financial year and up until the date of this report.
W M Russell B.Comm, CA, GAICD, MIIA (Aust)
Mr Russell joined the Board in April 2011. He has extensive experience in providing auditing and assurance services, having worked as an audit and assurance partner at PricewaterhouseCoopers for 20 years. He is currently a partner at accountancy firm Pitcher Partners. Mr Russell is involved in a number of industry associations and is a member of the Executive and past President of the Australian Financial Institutions Auditors Association. Mr Russell has been the Chairman of the Board since his appointment on 29 November 2011.
Special Responsibilities: Member of the Board Audit Committee, Member of the Board Risk Committee, Member of the Remuneration Committee, Member of the M&A Strategy Committee and Chairman of the Succession Planning Committee.
D S Robinson B.Surveying (Hons), MAICD
Mr Robinson joined the Board in October 2007 and has over 30 years’ experience in surveying, town planning and land development. He is the Managing Director of ADW Johnson, a leading Hunter based consultancy in surveying, town planning, engineering and land development. Mr Robinson has also previously worked as a part-time teacher at TAFE and was a Junior Officer in the Royal Australian Navy.
Special Responsibilities: Deputy Chairman of the Board, Member of the M&A Strategy Committee and Member of the Succession Planning Committee.
W R Ware LL.M. (Hons), FAICD
Mr Ware joined the Board in February 2009. He practised law for 14 years until 1987 when he became a professional Company Director and Business Consultant. He has served on the boards of a number of public companies in diverse industries for over 27 years. He is a co-owner and Director of Rosedale Gardens Retirement Living, a retirement village at Cooranbong, south of Newcastle.
Special Responsibilities: Chairman of the Remuneration Committee and Member of the Succession Planning Committee.
M L McDonald B Ec. FCA, GAICD
Mr McDonald joined the Board in May 2009. He has practised as a Chartered Accountant for over 30 years and was a Partner in the Newcastle Offices of Touché Ross & Co and KPMG Peat Marwick until his resignation in 1994. He has since that date and until recently practised on his own account. He is a Trustee of the Anglican Diocese of Newcastle and has considerable involvement in the Not for Profit sector at Board and Committee level.
Special Responsibilities: Chairman of the Board Audit Committee and Board Risk Committee, Member of the Succession Planning Committee and Member of the Remuneration Committee.
V J Drinkwater B Ec. MBA (With merit), GAICD, CAHRI
Mrs Drinkwater joined the Board in October 2010. She has extensive experience as a Senior Executive in operations, customer service, IT and marketing. Mrs Drinkwater was previously employed as Interim CEO New Zealand, Chief Marketing Officer and Chief Operating Officer at nib health funds limited. She is also a Trustee of the Anglican Diocese of Newcastle.
Special Responsibilities: Member of the Remuneration Committee, Member of the Succession Planning Committee, Member of the Board Audit Committee and Member of the Board Risk Committee.
Directors’ Report 12
Auditor’s Independence Declaration 16
Directors’ Declaration 19
Statement of Comprehensive Income 20
Balance Sheet 21
Statement of Changes in Equity 22
Statement of Cash Flows 23
Notes to and Forming Part of the Financial Statements 24
Annual Report | 2014-15Greater Building Society 1413
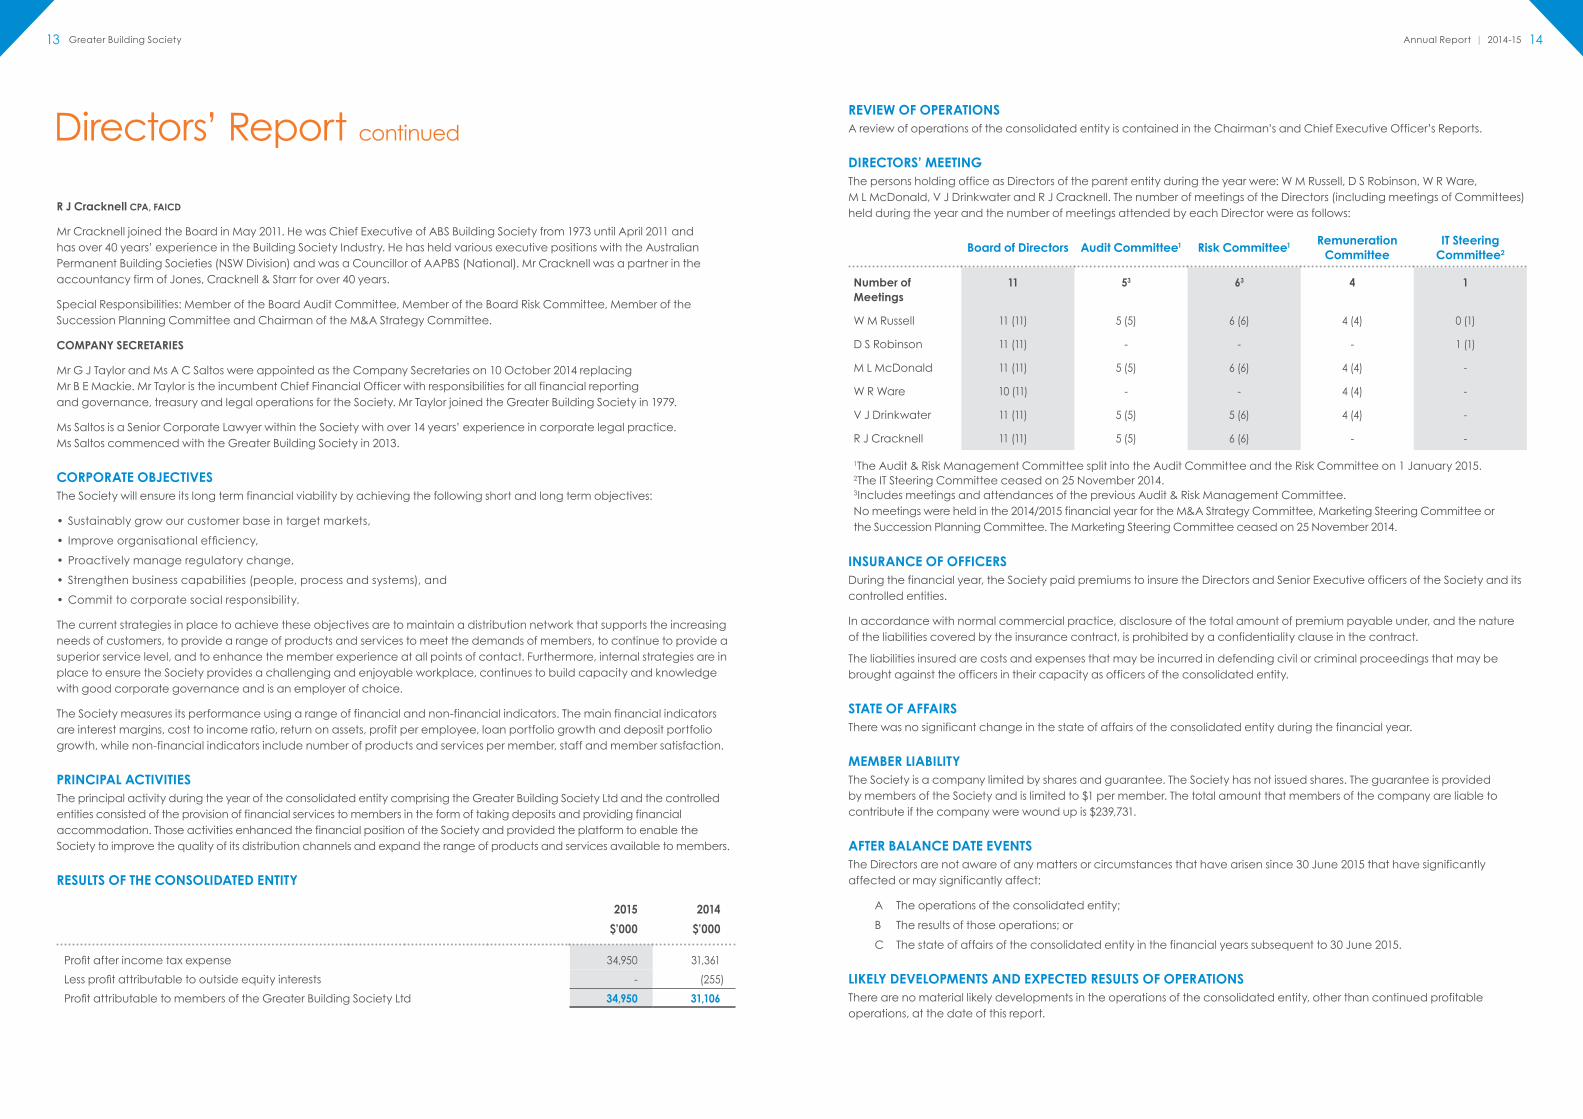
R J Cracknell CPA, FAICD
Mr Cracknell joined the Board in May 2011. He was Chief Executive of ABS Building Society from 1973 until April 2011 and has over 40 years’ experience in the Building Society Industry. He has held various executive positions with the Australian Permanent Building Societies (NSW Division) and was a Councillor of AAPBS (National). Mr Cracknell was a partner in the accountancy firm of Jones, Cracknell & Starr for over 40 years.
Special Responsibilities: Member of the Board Audit Committee, Member of the Board Risk Committee, Member of the Succession Planning Committee and Chairman of the M&A Strategy Committee.
COMPANY SECRETARIES
Mr G J Taylor and Ms A C Saltos were appointed as the Company Secretaries on 10 October 2014 replacing Mr B E Mackie. Mr Taylor is the incumbent Chief Financial Officer with responsibilities for all financial reporting and governance, treasury and legal operations for the Society. Mr Taylor joined the Greater Building Society in 1979.
Ms Saltos is a Senior Corporate Lawyer within the Society with over 14 years’ experience in corporate legal practice. Ms Saltos commenced with the Greater Building Society in 2013.
CORPORATE OBJECTIVESThe Society will ensure its long term financial viability by achieving the following short and long term objectives:
• Sustainably grow our customer base in target markets,
• Improve organisational efficiency,
• Proactively manage regulatory change,
• Strengthen business capabilities (people, process and systems), and
• Commit to corporate social responsibility.
The current strategies in place to achieve these objectives are to maintain a distribution network that supports the increasing needs of customers, to provide a range of products and services to meet the demands of members, to continue to provide a superior service level, and to enhance the member experience at all points of contact. Furthermore, internal strategies are in place to ensure the Society provides a challenging and enjoyable workplace, continues to build capacity and knowledge with good corporate governance and is an employer of choice.
The Society measures its performance using a range of financial and non-financial indicators. The main financial indicators are interest margins, cost to income ratio, return on assets, profit per employee, loan portfolio growth and deposit portfolio growth, while non-financial indicators include number of products and services per member, staff and member satisfaction.
PRINCIPAL ACTIVITIESThe principal activity during the year of the consolidated entity comprising the Greater Building Society Ltd and the controlled entities consisted of the provision of financial services to members in the form of taking deposits and providing financial accommodation. Those activities enhanced the financial position of the Society and provided the platform to enable the Society to improve the quality of its distribution channels and expand the range of products and services available to members.
RESULTS OF THE CONSOLIDATED ENTITY
2015 2014
$’000 $’000
Profit after income tax expense 34,950 31,361
Less profit attributable to outside equity interests - (255)
Profit attributable to members of the Greater Building Society Ltd 34,950 31,106
REVIEW OF OPERATIONSA review of operations of the consolidated entity is contained in the Chairman’s and Chief Executive Officer’s Reports.
DIRECTORS’ MEETINGThe persons holding office as Directors of the parent entity during the year were: W M Russell, D S Robinson, W R Ware, M L McDonald, V J Drinkwater and R J Cracknell. The number of meetings of the Directors (including meetings of Committees) held during the year and the number of meetings attended by each Director were as follows:
Board of Directors Audit Committee1 Risk Committee1 Remuneration Committee
IT Steering Committee2
Number of Meetings
11 53 63 4 1
W M Russell 11 (11) 5 (5) 6 (6) 4 (4) 0 (1)
D S Robinson 11 (11) - - - 1 (1)
M L McDonald 11 (11) 5 (5) 6 (6) 4 (4) -
W R Ware 10 (11) - - 4 (4) -
V J Drinkwater 11 (11) 5 (5) 5 (6) 4 (4) -
R J Cracknell 11 (11) 5 (5) 6 (6) - -
1The Audit & Risk Management Committee split into the Audit Committee and the Risk Committee on 1 January 2015.2The IT Steering Committee ceased on 25 November 2014.3Includes meetings and attendances of the previous Audit & Risk Management Committee.No meetings were held in the 2014/2015 financial year for the M&A Strategy Committee, Marketing Steering Committee or the Succession Planning Committee. The Marketing Steering Committee ceased on 25 November 2014.
INSURANCE OF OFFICERSDuring the financial year, the Society paid premiums to insure the Directors and Senior Executive officers of the Society and its controlled entities.
In accordance with normal commercial practice, disclosure of the total amount of premium payable under, and the nature of the liabilities covered by the insurance contract, is prohibited by a confidentiality clause in the contract.
The liabilities insured are costs and expenses that may be incurred in defending civil or criminal proceedings that may be brought against the officers in their capacity as officers of the consolidated entity.
STATE OF AFFAIRSThere was no significant change in the state of affairs of the consolidated entity during the financial year.
MEMBER LIABILITYThe Society is a company limited by shares and guarantee. The Society has not issued shares. The guarantee is provided by members of the Society and is limited to $1 per member. The total amount that members of the company are liable to contribute if the company were wound up is $239,731.
AFTER BALANCE DATE EVENTSThe Directors are not aware of any matters or circumstances that have arisen since 30 June 2015 that have significantly affected or may significantly affect:
A The operations of the consolidated entity;
B The results of those operations; or
C The state of affairs of the consolidated entity in the financial years subsequent to 30 June 2015.
LIKELY DEVELOPMENTS AND EXPECTED RESULTS OF OPERATIONSThere are no material likely developments in the operations of the consolidated entity, other than continued profitable operations, at the date of this report.
Directors’ Report continued

Annual Report | 2014-15Greater Building Society 1615
PROCEEDINGS ON BEHALF OF THE COMPANYNo person has applied to the Court under Section 237 of the Corporations Act 2001 for leave to bring proceedings on behalf of the Society, or to intervene in any proceedings to which the Society is a party, for the purpose of taking responsibility on behalf of the Society for all or part of those proceedings.
No proceedings have been brought or intervened in on behalf of the Society with leave of the Court under Section 237 of the Corporations Act 2001.
ENVIRONMENTAL REGULATIONThe Society or its controlled entities are not subject to any significant environmental regulation.
AUDITOR’S INDEPENDENCE DECLARATIONA copy of the auditor’s independence declaration as required under section 307C of the Corporations Act 2001 is set out on page 16.
ROUNDING OF AMOUNTSThe amounts in the financial statements have been rounded to the nearest thousand dollars under the option available to the Society under ASIC Class Order 98/100. The Society is an entity to which the Class Order applies.
AUDITORPricewaterhouseCoopers Australia continues in office in accordance with section 327 of the Corporations Act 2001. Details of the amounts paid or payable to the auditor (PricewaterhouseCoopers Australia) for audit and non-audit services provided during the year are disclosed in Note 27.
W M Russell Chairman
Signed at Hamilton this 22nd day of September 2015 in accordance with a resolution of the Directors.
Directors’ Report continued
Annual Report | 2014-15Greater Building Society 1817

Annual Report | 2014-15Greater Building Society 2019
Directors’ Declaration Statement of Comprehensive IncomeIn the Directors’ opinion:
A The financial statements and notes set out on pages 20 to 61 are in accordance with the Corporations Act 2001, including:
i) Complying with Accounting Standards, the Corporations Regulations 2001 and other mandatory professional reporting requirements; and
ii) Giving a true and fair view of the Society’s and consolidated entity’s financial position as at 30 June 2015 and of their performance, as represented by the results of their operations, changes in equity and their cash flows, for the financial year ended on that date; and
B There are reasonable grounds to believe that the Society will be able to pay its debts as and when they become due and payable; and
C Note 1(A) confirms that the financial statements also comply with International Financial Reporting Standards as issued by the International Accounting Standards Board.
This declaration is made in accordance with a resolution of the Directors.
W M Russell Chairman
Signed at Hamilton this 22nd day of September 2015.
for the year ended 30 June 2015
CONSOLIDATED SOCIETY
Notes 2015 2014 2015 2014
$’000 $’000 $’000 $’000
Interest revenue 2 259,260 264,079 274,821 276,862
Interest expense 3 (132,289) (139,775) (148,507) (154,388)
Net interest income 126,971 124,304 126,314 122,474
Non-interest income 4 25,030 23,830 25,374 22,223
152,001 148,134 151,688 144,697
Non-interest expense 5 (102,361) (104,039) (102,310) (100,615)
PROFIT BEFORE INCOME TAX 49,640 44,095 49,378 44,082
Income tax expense 6 (14,690) (12,734) (14,651) (13,129)
PROFIT FOR THE YEAR 34,950 31,361 34,727 30,953
PROFIT ATTRIBUTABLE TO
Members of the Greater Building Society Ltd 34,950 31,106 34,727 30,953
Non-controlling interests 25 - 255 - -
34,950 31,361 34,727 30,953
OTHER COMPREHENSIVE INCOME
Items that may be reclassified to profit or loss
Cash flow hedges 23 (966) (1,137) (966) (1,137)
Income tax relating to these items 23 290 341 290 341
Items that will not be reclassified to profit or loss
Revaluation of land and buildings 23 2,970 404 2,954 314
Income tax relating to these items 23 (891) (121) (886) (94)
Fair value assets through other comprehensive income
23 46 293 46 293
Income tax relating to these items 23 (14) (88) (14) (88)
Total other comprehensive income 1,435 (308) 1,424 (371)
TOTAL COMPREHENSIVE INCOME 36,385 31,053 36,151 30,582
TOTAL COMPREHENSIVE INCOME ATTRIBUTABLE TO
Members of the Greater Building Society Ltd 36,385 30,798 36,151 30,582
Non-controlling interests 25 - 255 - -
36,385 31,053 36,151 30,582
The above Statement of Comprehensive Income should be read in conjunction with the accompanying notes.
Annual Report | 2014-15Greater Building Society 2221
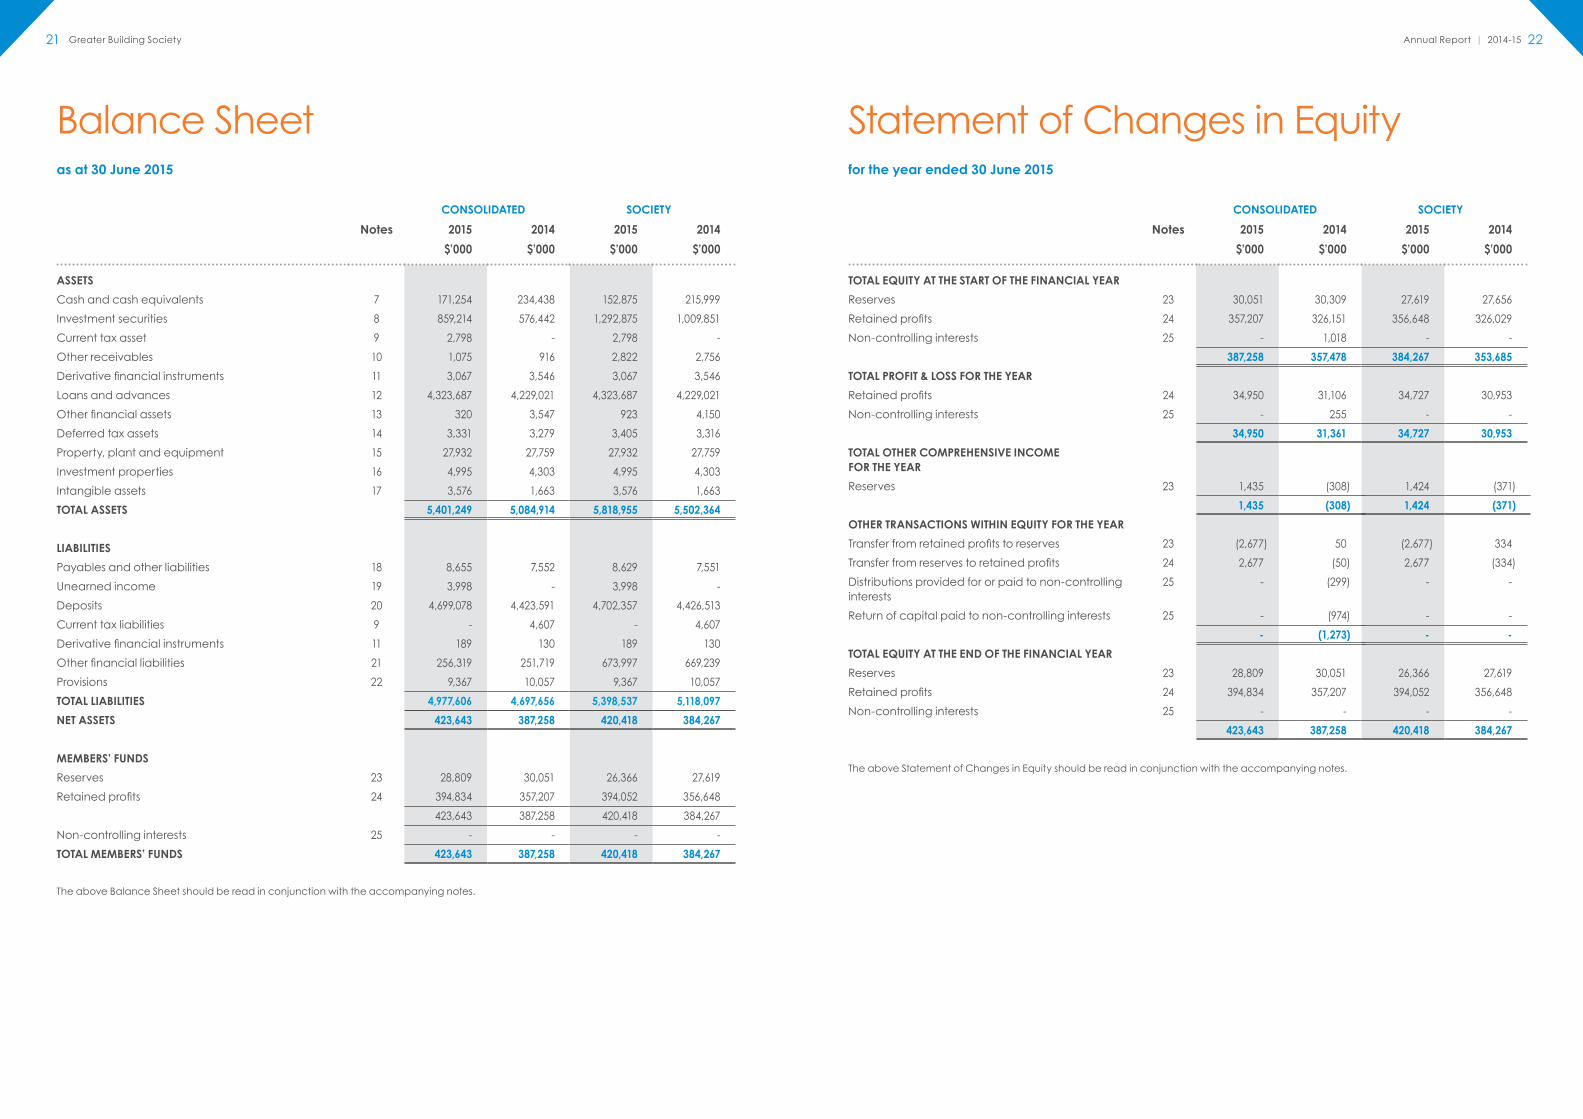
as at 30 June 2015
CONSOLIDATED SOCIETY
Notes 2015 2014 2015 2014
$’000 $’000 $’000 $’000
ASSETS
Cash and cash equivalents 7 171,254 234,438 152,875 215,999
Investment securities 8 859,214 576,442 1,292,875 1,009,851
Current tax asset 9 2,798 - 2,798 -
Other receivables 10 1,075 916 2,822 2,756
Derivative financial instruments 11 3,067 3,546 3,067 3,546
Loans and advances 12 4,323,687 4,229,021 4,323,687 4,229,021
Other financial assets 13 320 3,547 923 4,150
Deferred tax assets 14 3,331 3,279 3,405 3,316
Property, plant and equipment 15 27,932 27,759 27,932 27,759
Investment properties 16 4,995 4,303 4,995 4,303
Intangible assets 17 3,576 1,663 3,576 1,663
TOTAL ASSETS 5,401,249 5,084,914 5,818,955 5,502,364
LIABILITIES
Payables and other liabilities 18 8,655 7,552 8,629 7,551
Unearned income 19 3,998 - 3,998 -
Deposits 20 4,699,078 4,423,591 4,702,357 4,426,513
Current tax liabilities 9 - 4,607 - 4,607
Derivative financial instruments 11 189 130 189 130
Other financial liabilities 21 256,319 251,719 673,997 669,239
Provisions 22 9,367 10,057 9,367 10,057
TOTAL LIABILITIES 4,977,606 4,697,656 5,398,537 5,118,097
NET ASSETS 423,643 387,258 420,418 384,267
MEMBERS’ FUNDS
Reserves 23 28,809 30,051 26,366 27,619
Retained profits 24 394,834 357,207 394,052 356,648
423,643 387,258 420,418 384,267
Non-controlling interests 25 - - - -
TOTAL MEMBERS’ FUNDS 423,643 387,258 420,418 384,267
The above Balance Sheet should be read in conjunction with the accompanying notes.
for the year ended 30 June 2015
CONSOLIDATED SOCIETY
Notes 2015 2014 2015 2014
$’000 $’000 $’000 $’000
TOTAL EQUITY AT THE START OF THE FINANCIAL YEAR
Reserves 23 30,051 30,309 27,619 27,656
Retained profits 24 357,207 326,151 356,648 326,029
Non-controlling interests 25 - 1,018 - -
387,258 357,478 384,267 353,685
TOTAL PROFIT & LOSS FOR THE YEAR
Retained profits 24 34,950 31,106 34,727 30,953
Non-controlling interests 25 - 255 - -
34,950 31,361 34,727 30,953
TOTAL OTHER COMPREHENSIVE INCOME FOR THE YEAR
Reserves 23 1,435 (308) 1,424 (371)
1,435 (308) 1,424 (371)
OTHER TRANSACTIONS WITHIN EQUITY FOR THE YEAR
Transfer from retained profits to reserves 23 (2,677) 50 (2,677) 334
Transfer from reserves to retained profits 24 2,677 (50) 2,677 (334)
Distributions provided for or paid to non-controlling interests
25 - (299) - -
Return of capital paid to non-controlling interests 25 - (974) - -
- (1,273) - -
TOTAL EQUITY AT THE END OF THE FINANCIAL YEAR
Reserves 23 28,809 30,051 26,366 27,619
Retained profits 24 394,834 357,207 394,052 356,648
Non-controlling interests 25 - - - -
423,643 387,258 420,418 384,267
The above Statement of Changes in Equity should be read in conjunction with the accompanying notes.
Statement of Changes in EquityBalance Sheet

Annual Report | 2014-15Greater Building Society 2423
for the year ended 30 June 2015
CONSOLIDATED SOCIETY
Notes 2015 2014 2015 2014
$’000 $’000 $’000 $’000Inflows/
(Outflows)Inflows/
(Outflows)Inflows/
(Outflows)Inflows/
(Outflows)
CASH FLOWS FROM OPERATING ACTIVITIES
Interest received 257,740 264,504 273,294 277,289
Fees and commissions received 24,707 18,141 24,707 18,141
Other income received 528 3,379 825 1,245
Interest paid (134,185) (139,825) (150,987) (156,102)
Operating expenses paid (97,641) (99,041) (97,633) (99,685)
Income taxes paid (22,763) (11,202) (22,763) (11,202)
Net advances and repayments in loans and advances (94,769) (43,548) (94,026) (35,404)
Net placements and redemptions in investment securities (276,059) (20,091) (276,305) (11,161)
Net acceptances and payments in deposits 278,022 238,973 278,369 237,280
NET CASH PROVIDED BY OPERATING ACTIVITIES 30 (64,420) 211,290 (64,519) 220,401
CASH FLOWS FROM INVESTING ACTIVITIES
Net purchases and sales in other financial assets and liabilities
(189) 8 (189) 2,650
Payments for property, plant and equipment (3,720) (3,966) (3,720) (3,953)
Proceeds from sale of property, plant and equipment 592 709 592 709
Dividends and distributions received - 17 - 521
CASH FLOWS FROM INVESTING ACTIVITIES (3,317) (3,232) (3,317) (73)
CASH FLOWS FROM FINANCING ACTIVITIES
Net issue/(repayment) of commercial notes 4,553 (132,957) 4,712 (157,912)
Distributions paid - (882) - -
NET CASH PROVIDED BY FINANCING ACTIVITIES 4,553 (133,839) 4,712 (157,912)
Net increase/(decrease) in cash held (63,184) 74,219 (63,124) 62,416
CASH AT THE BEGINNING OF THE FINANCIAL YEAR 234,438 160,219 215,999 153,583
CASH AT THE END OF THE FINANCIAL YEAR 7 171,254 234,438 152,875 215,999
The above Statement of Cash Flows should be read in conjunction with the accompanying notes.
for the year ended 30 June 2015
1. SUMMARY OF SIGNIFICANT ACCOUNTING POLICIES
A Basis of Preparation
The financial report includes separate financial statements for the Greater Building Society Ltd as an individual entity (i.e. the Society) and the consolidated entity consisting of the Society and all its subsidiaries.
The financial statements of the Society and the consolidated entity are general purpose financial reports prepared in accordance with provisions of Australian Accounting Standards and the Corporations Act 2001 in Australia. The Society’s and consolidated entity’s financial statements also comply with International Financial Reporting Standards (IFRS) as issued by the International Accounting Standards Board (IASB). The Greater Building Society Ltd is a for-profit entity for the purposes of preparing financial statements.
The financial statements of the Society and the consolidated entity are prepared under the historical cost convention, as modified by the revaluation of certain financial assets and liabilities (including derivative instruments) at fair value, certain classes of property and investment property.
All amounts are expressed in Australian dollar currency.
Notes containing prior year comparatives may have been restated to provide the user with additional details. Such changes do not alter the total balance as previously disclosed.
The significant accounting policies adopted in the preparation of these financial statements and that of the previous financial year are set out below. These policies have been consistently applied to all periods presented, unless otherwise stated.
i) Criticalaccountestimatesandsignificantjudgements
The preparation of the financial statements requires the use of certain critical accounting estimates. It also requires Management to exercise judgement in the process of applying the accounting policies. The notes of the financial statements set out the areas involving a higher degree of judgement or complexity, or areas where assumptions are significant to the Society and its consolidated entity financial statements. The most significant of these are:
• impairment losses on loans and advances,
• consolidation of special purpose entities, and
• fair valuation estimates.
Estimates and judgements are continually evaluated and are based on historical experience and other factors, including reasonable expectations of future events. Management believes the estimates used in preparing the financial statements are reasonable. Actual results in the future may differ from those reported.
ii) New accounting standards and interpretations
Certain new accounting standards and interpretations have been published that are not mandatory for 30 June 2015 reporting periods. The consolidated entity’s assessment of the impact of these new standards and interpretations is set out below.
Revenue from contracts with customers (effective 1 January 2017)
The IASB has issued a new standard for the recognition of revenue. This will replace IAS18, which covers contracts for goods and services and IAS11 which covers construction contracts. The new standard is based on the principle that revenue is recognised when control of a good or service transfers to a customer, so the notion of control replaces the existing notion of risks and rewards. While the consolidated entity does not expect the new standard to have an impact on how revenue is recognised, it is yet to perform a detailed assessment.
B Consolidation
i) Controlled entities
The consolidated financial statements comprise the financial statements of the Society and its controlled entities (together, ‘the consolidated entity’). The consolidated entity controls an entity when the consolidated entity is exposed to, or has rights to, variable returns from its involvement with the entity and has the ability to affect those returns through its power to direct the activities of the entity. The effects of all transactions between entities in the consolidated entity have been eliminated in full. Non-controlling interest in the results and equity of controlled entities, where the Society owns less than 100% of the issued capital, are shown separately in the consolidated statement of comprehensive income, statement of changes of equity and balance sheet.
Statement of Cash Flows Notes to and Forming Part of the Financial Statements
Annual Report | 2014-15Greater Building Society 2625
Where control of an entity was obtained during the financial period, its results have been included in the consolidated statement of comprehensive income from the date on which control commenced. Where control of an entity ceased during the financial period, its results are included for that part of the financial period during which control existed.
Investments in subsidiaries are accounted for by the Society at cost.
ii) Business combinations
The acquisition method of accounting is used to account for all business combinations. The consideration transferred for the acquisition of a subsidiary comprises the fair values of the assets transferred, the liabilities incurred and the equity interests issued by the group. Identifiable assets acquired and liabilities and contingent liabilities assumed in a business combination are, with limited exceptions, measured initially at their fair values at the acquisition date.
Acquisition-related transaction costs are expensed as incurred.
The excess of the consideration transferred, the amount of any non-controlling interest in the acquiree and the acquisition date fair value of any previous equity interest in the acquired entity, over the fair value of the net identifiable assets acquired is recorded as goodwill. If those amounts are less than the fair value of the net identifiable assets of the subsidiary acquired, the difference is recognised directly in profit or loss as a bargain purchase.
Contingent consideration is classified either as equity or a financial liability. Amounts classified as a financial liability are subsequently remeasured to fair value with changes in fair value recognised in profit or loss.
iii) Securitisation
Securitised positions are held through a number of Special Purpose Entities (‘SPEs’). These securitised positions allow the Society to access funding. The Society does not consolidate an SPE it does not control. Where it can sometimes be difficult to determine whether the Society does control the SPE, it makes judgements about its exposure to the variable returns of the entity and its ability to affect those returns. The Society has consolidated its SPEs. Accordingly, their underlying assets, liabilities, revenues and expenses are reported in the Society’s consolidated balance sheet and statement of comprehensive income.
C Segment Reporting
Operating segments are reported in a manner consistent with the internal reporting provided to the chief operating decision maker. The chief operating decision maker, who is responsible for allocating resources and assessing performance of the operating segments, has been identified as the Chief Executive Officer. All operating segments are less than the quantitative threshold required for separate disclosure.
D Revenue Recognition
i) Interest revenue
Interest income arising from loans and held to maturity investment securities is brought to account using the effective interest rate method. Incremental fees and transaction costs associated with the origination of loans and held to maturity investment securities which are an integral part of the effective interest rate are deferred and recognised in the statement of comprehensive income on a yield basis over the expected life of the financial instrument.
The effective interest rate is that rate that exactly discounts estimated future cash flows throughout the life of the financial instrument.
The balance outstanding of the deferred origination income and expense is recognised in the balance sheet as an adjustment to the carrying amount of the loans and held to maturity investment securities outstanding.
ii) Other revenue
Other income, commission and fee income is recognised in the statement of comprehensive income as revenue on an accruals basis when the service has been provided or incurred.
E Income Tax
The consolidated entity has adopted the balance sheet liability method of tax-effect accounting which focuses on the tax effect of transactions and other events that affect amounts recognised in either the balance sheet or a tax-based balance sheet.
Deferred tax assets and liabilities are recognised for temporary differences, except where the deferred tax asset/liability arises from the initial recognition of an asset or liability in a transaction that is not a business combination and, at the time of the transaction, affects neither the accounting profit nor taxable profit or loss.
Deferred tax assets are recognised for deductible temporary differences and unused tax losses only if it is probable that the future taxable amounts will be available to utilise those temporary differences and losses.
Current and deferred tax balances attributable to amounts recognised directly in equity are also recognised directly in equity.
The Society and certain wholly owned Australian controlled entities implemented the tax consolidation legislation as of 1 July 2002. The Australian Taxation Office has been notified of the decision. As a consequence, those entities are taxed as a single entity and the deferred tax assets and liabilities of those entities are set off in the consolidated financial statements.
Tax funding and sharing agreements between the Society and certain wholly owned Australian controlled entities, known as ‘group member entities’, apply from 1 July 2013. Broadly, group member entities are required to calculate their notional tax liability as if they were standalone taxpayers before transferring their tax liability to the head entity. Such transfers will be effected on intercompany account. The Society has responsibility for settling the consolidated entity’s income tax liability with the ATO.
F Financial Assets
The consolidated entity has elected to apply AASB 9 Financial Instruments and AASB2009-11 Amendments to Australian Accounting Standards arising from AASB 9 from 1 July 2010, because the new accounting standards provide more reliable and relevant information for users to assess the amounts, timing and uncertainty of future cash flows.
All financial assets are initially recognised at fair value plus, in the case of financial assets and liabilities not classified as at fair value through profit or loss, transaction costs that are directly attributable to the acquisition or issue of the financial asset.
Financial assets are then classified as either a debt or equity financial asset, which in turn determines their subsequent accounting measurement. The categories and measurement treatments are:
i) Debt Financial Asset
A debt financial asset is classified as at amortised cost only if both of the following criteria are met:
• the asset is held within a business model with the objective to collect the contractual cash flows, and
• the contractual terms give rise on specified dates to cash flows that are solely payments of principal and interest on the principal outstanding.
The nature of any derivatives embedded in the debt financial asset are considered in determining whether the cash flows of the asset are solely payment of principal and interest on the principal outstanding and are not accounted for separately.
A gain or loss on a debt financial asset that is subsequently measured at amortised cost and is not part of a hedging relationship is recognised in profit or loss when the financial asset is derecognised or impaired and through the amortisation process using the effective interest rate method.
If either of the two criteria above are not met, the debt financial asset is classified as at fair value through profit or loss.
A gain or loss on a debt financial asset that is subsequently measured at fair value and is not part of a hedging relationship is recognised in profit or loss and presented net in the income statement within other income or other expenses in the period in which it arises.
ii) Equity Financial Asset
All equity financial assets are measured at fair value.
Equity financial assets that are held for trading are measured at fair value through profit or loss. Changes in the fair value of financial assets at fair value through profit or loss are recognised in other income or other expenses in the income statement as applicable. Interest income from these financial assets is included in the net gains/(losses). Dividend income is presented as other revenue.
For all other equity financial assets (i.e. equity financial assets other than held for trading) the consolidated entity can make an irrevocable election at initial recognition of each equity financial asset to recognise changes in fair value through other comprehensive income (OCI) rather than through profit or loss.
Where Management has elected to present fair value gains and losses on equity financial assets in other comprehensive income, there is no subsequent reclassification of fair value gains and losses to profit or loss. Gains and losses arising from subsequent changes in fair value for equity financial assets nominated as fair value through other comprehensive income are recognised directly in the financial asset at fair value through other comprehensive income reserve in equity, until the asset is derecognised, at which time the cumulative gain or loss will be transferred to retained profits. Dividends from equity financial assets continue to be recognised in profit or loss as other revenue when the right to receive payments is established and as long as they represent a return on investment.
Notes to and Forming Part of the Financial Statementsfor the year ended 30 June 2015

Annual Report | 2014-15Greater Building Society 2827
Equity financial assets are measured at fair value. Fair values of quoted equity financial assets in active markets are based on current bid prices. If the relevant market is not considered active (or the securities are unlisted), the consolidated entity establishes fair value by using valuation techniques, including recent arm’s length transactions, discounted cash flow analysis, option pricing models and other valuation techniques commonly used by market participants. Where equity financial assets cannot be reliably valued they are recorded at cost.
G Cash and Cash Equivalents
Cash and cash equivalents includes cash on hand and deposits at call and other short-term, highly liquid investments with original maturities of three months or less that are readily convertible to cash and are subject to an insignificant risk of changes in value.
H Investment Securities
i) Asset recognition
Investment securities are classified as debt financial assets and are measured at amortised cost using the effective interest rate method. Amortised cost is calculated by taking into account any discount or premium on acquisition, over the period to maturity. Any gains or losses from investments are recognised in profit and loss when the investments are derecognised, on impairment, as well as through the amortisation process.
ii) Revenue recognition
Interest income arising from investment securities is recognised in the statement of comprehensive income using the effective interest rate method (refer Note 1D).
iii) Investments in associates
Associates are those entities over which the consolidated entity exercises significant influence, but not control. Investments in associates are accounted for in the financial statements using the equity accounting method. Under this method, the consolidated entity’s share of the post acquisition profits or losses of associates is recognised in the consolidated statement of comprehensive income, and its share of post acquisition movements in reserves is recognised in consolidated reserves. The cumulative post acquisition movements are adjusted against the carrying amount of the investment.
Investments in associates are accounted for by the Society at cost.
I Loans and Advances
i) Asset recognition
Loans and advances are classified as loans and receivable assets and are recognised when cash is advanced to members. They are carried at amortised cost using the effective interest rate method (refer Note 1F).
ii) Revenue recognition
Interest income arising from loans is brought to account using the effective interest rate method (refer Note 1D).
Loan fees received and transaction costs directly attributable to the acquisition of the loan are deferred and included as an adjustment to the interest revenue of the loan on a yield basis over the expected life of the loan using the effective interest rate method. The deferred revenues and costs are included in the balance sheet as part of the value of the loans and advances outstanding.
Other loan fees, commissions and other service fees provided in relation to services are recognised as profit and loss as other income on an accruals basis.
iii) Loan impairment
All loan assets are subject to regular review and assessment for possible impairment. Allowances for impairment losses on loans are based on an incurred loss model, which recognises an allowance where there is objective evidence of impairment.
Specific allowances are raised for losses that may be incurred for loans that are known to be impaired. Estimated losses on these loans are measured at the difference between the loans carrying amount and the present value of the estimated cash flows discounted at the loans effective interest rate.
Where individual loans are found to not be impaired they are grouped together with loans of similar credit risk characteristics and then assessed collectively for impairment. Any loan that has been individually assessed and considered impaired is excluded from the collective assessment.
Loans that are collectively assessed for impairment are estimated on the basis of historical loss experience adjusted for any current conditions that may have impacted on the historical loss experience.
A credit loss reserve is maintained in equity to cover credit risks inherent in the loan portfolio. Movement in the credit loss reserve is recognised as an appropriation of retained profits (refer Note 1S).
iv) Restructured loans
A restructured loan is a non-commercial facility where the original contractual terms have been modified to provide concessional changes for reasons relating to financial difficulties of the borrower. Where the loan after restructuring remains doubtful and it is not well secured the loan shall be subject to impairment. Loans will only be recognised as restructured once the customer has formally agreed to the new terms.
v) Assets acquired through enforcement of security
Assets acquired through enforcement of security are assets acquired in full or partial settlement of a loan or similar facility through enforcement of security arrangements.
vi) Bad debts written off
Bad debts are written off as identified by Management and the Board of Directors when it is reasonable to expect that the recovery of the debt is unlikely.
Bad debts will be written off directly to profit and loss in the period in which they are identified. Bad debts can be written off directly against the allowance for impaired losses only to the extent that the allowance balance includes a specific allowance in respect of the debt being written off.
J Plant, Property and Equipment
i) Asset recognition
Land and buildings are initially recognised at cost and then subsequently carried at fair value less accumulated depreciation.
Plant and equipment are initially recognised at cost and then subsequently carried at cost less accumulated depreciation and less any impairment adjustment. Assets are reviewed for impairment annually.
Cost includes expenditure directly attributable to the acquisition of the asset.
Items of equipment, furniture and fittings and other small assets, which cost less than $1,000, are expensed at the time of purchase.
ii) Revaluations
Land and buildings are carried at fair value at the date of the revaluation less any subsequent accumulated depreciation of buildings and accumulated impairment losses.
Increases in the carrying amounts arising on revaluation of land and buildings are recognised, net of tax, in other comprehensive income and accumulated in the property revaluation surplus reserve in equity. To the extent that the increase reverses a decrease previously recognised in profit or loss, the increase is first recognised in profit or loss. Decreases that reverse previous increases of the same asset are first recognised in other comprehensive income to the extent of the remaining surplus attributable to the asset; all other decreases are charged to profit or loss. Any accumulated depreciation as at the revaluation date is eliminated against the gross carrying amount of the asset and the net amount is restated to the revalued amount of the asset. Upon disposal, any revaluation surplus reserve relating to the particular asset being disposed is transferred to retained profits.
The balances in the asset revaluation surplus reserve for each particular asset are net of any potential capital gains tax liability.
An item of property, plant and equipment is derecognised upon disposal or when no future economic benefits are expected to arise from the continued use of the asset. Any gain or loss arising on derecognition of the asset (calculated as the difference between the net disposal proceeds and the carrying amount of the item) is included in profit and loss in the year the item is derecognised.
Notes to and Forming Part of the Financial Statementsfor the year ended 30 June 2015

Annual Report | 2014-15Greater Building Society 3029
Fair value is determined by reference to market-based evidence, which is the amount that the assets could be exchanged between a knowledgeable willing buyer and a knowledgeable willing seller in an arm’s length transaction as at the valuation date. Annual assessments of the fair value are made by the Directors, supplemented by independent valuations performed every three years (or more often if circumstances require) ensuring that the carrying amount does not differ materially from the asset’s fair value at the balance sheet date.
iii) Depreciation
Depreciation is calculated so as to write off the net cost or revalued amount of each item of property, plant and equipment (excluding land) over its expected useful life. Additions are depreciated from the date of acquisition.
The consolidated entity uses the following rates and methods of depreciation:
Rate Method
Buildings 2.5% straight line
Office Furniture 25% reducing balance
Office Equipment 25% reducing balance
Motor Vehicles 30% reducing balance
Computer Hardware 40% reducing balance
Cash Dispensing Units 15% straight line
Leasehold improvements are amortised over the shorter of the unexpired period of the lease or the useful life of the leasehold improvements on a prime cost basis.
Useful lives and residual values are reviewed annually and reassessed in light of commercial and technological developments. If an asset’s carrying value is greater than its recoverable amount due to a useful life, residual value or impairment adjustment, the carrying amount is written down immediately to its recoverable amount. Adjustments arising from such restatements and on disposal of fixed assets are recognised in profit and loss.
For taxation purposes, the consolidated entity adopts an effective life for the asset as determined by Taxation Rulings made public by the Commissioner of Taxation. The consolidated entity generally uses the reducing balance method of depreciation for tax purposes.
K Investment Properties
Investment properties are initially recognised at cost and then subsequently carried at fair value. Cost includes expenditure directly attributable to the acquisition of the asset.
Fair value is determined by reference to market-based evidence, which is the amount that the assets could be exchanged between a knowledgeable willing buyer and a knowledgeable willing seller in an arm’s length transaction as at the valuation date. Annual assessments of the fair value are made by the Directors, supplemented by independent valuations performed every three years (or more often if circumstances require) ensuring that the carrying amount does not differ materially from the asset’s fair value at the balance sheet date.
Changes in fair values for investment properties are recognised directly in profit and loss.
Where the property is used by the consolidated entity for its own occupation the property is classified as plant, property and equipment.
L Inventory
No expenditure is treated as an asset where it has no realisable value or it is insignificant in size and nature. Items such as printed internal forms, advertising brochures, etc. are not treated as inventory.
All inventories are stated at the lower of cost and net realisable value.
M Intangible Assets
i) Goodwill
Goodwill represents the excess of the cost of an acquisition over the fair value of the consolidated entity’s share of the net identifiable assets of the acquired entity at the date of acquisition. Goodwill on acquisitions of controlled entities is included in intangible assets. Goodwill on acquisitions of associates is included in the carrying value of investments in associates. Goodwill is not amortised but tested for impairment annually, or more frequently if events indicate that it might be impaired. In this event, it is carried at cost less accumulated impairment losses.
ii) Computer software
Costs directly incurred in acquiring computer software, plus costs incurred in developing major products or systems that will contribute to future period financial benefits through revenue generation and/or cost reductions are capitalised to computer software and amortised over the estimated useful life. Costs incurred on research and software maintenance are expensed as incurred.
The consolidated entity uses the following rates and methods of depreciation:
Rate / Life Method
Major System or Product Development 3 to 7 years straight line
Computer Software 40% reducing balance
N Members’ Deposits
Members’ deposits are measured at amortised cost using the effective interest rate method (refer Note 1F).
Interest on deposits is brought to account using the effective interest rate method (refer Note 1D).
O Financial Liabilities
Financial liabilities are measured at amortised cost using the effective interest rate method (refer Note 1D) except for derivatives, financial liabilities designated as at fair value through profit and loss, and in other limited circumstances as allowed under AASB 9 Financial Instruments which are subsequently measured at fair value through profit and loss. All the consolidated entity’s financial liabilities except for derivatives are classified at amortised cost.
P Provisions
The consolidated entity makes provision where it has a present legal or constructive obligation as a result of past events and it is probable that an outflow of resources will be required to settle the obligation.
A provision for promotion and reward scheme costs is recognised when the present obligations arise. The provision is measured as the amount unpaid at the balance date discounted by an estimated rate of non-usage.
Q Derivative InstrumentsThe consolidated entity uses derivative financial instruments to hedge its exposure to interest rate risks arising from operational, financing and investment activities. In accordance with its treasury management policy, the consolidated entity does not hold or issue derivative financial instruments for trading purposes.
All derivatives, including those used for balance sheet hedging purposes, are recognised on the balance sheet at fair value and are disclosed as an asset where they have a positive fair value at balance date or as a liability where the fair value at balance date is negative (refer Note 1F).
Derivatives are initially recognised at fair value on the date a derivative contract is entered into and subsequently remeasured to their fair value at balance date. Fair values for interest rate swaps is the estimated amount that the Society would receive or pay to terminate the swap at the balance date, taking into account current interest rates and the credit worthiness of the swap counterparties. Movements in the carrying amounts of derivatives are recognised in profit and loss, unless the derivative is designated as a hedge and meets the requirements for hedge accounting.
i) Cash flow hedges
For a derivative designated as hedging a cash flow exposure arising from a recognised asset or liability (or a highly probable forecast transaction), the gain or loss on the derivative associated with the effective portion of the hedge is initially recognised in equity in the cash flow hedge reserve and reclassified into the statement of other comprehensive income when the hedged item is brought to account. The gain or loss relating to the ineffective portion of the hedge is recognised immediately in profit and loss.
Notes to and Forming Part of the Financial Statementsfor the year ended 30 June 2015

Annual Report | 2014-15Greater Building Society 3231
CONSOLIDATED SOCIETY
2015 2014 2015 2014
$’000 $’000 $’000 $’000
2. INTEREST REVENUE
Cash and cash equivalents 6,054 7,597 5,454 6,875
Investment securities 29,875 24,920 46,036 38,376
Loans and advances 223,331 231,562 223,331 231,611
259,260 264,079 274,821 276,862
3. INTEREST EXPENSE
Deposits 122,920 128,978 122,943 129,023
Other financial liabilities 9,369 10,797 25,564 25,365
132,289 139,775 148,507 154,388
4. NON-INTEREST INCOME
Commission 4,744 3,684 4,744 3,684
Dividend revenue (including revenue on wind-up of wholly owned subsidiary)
- 17 - 17
Fee income 16,125 14,428 16,125 14,428
Impaired losses recovered 23 16 23 16
Net gain on revaluation of investment properties 660 2 660 2
Net gain on revaluation of land and buildings 124 16 140 106
Net gain on disposal of investment securities 2,771 2,215 2,771 2,215
Net gain on disposal of property, plant and equipment
96 197 96 197
Rental revenue 267 250 267 250
Sales revenue from sale of inventory - 2,348 - -
Trust distributions - - - 504
Other revenue 220 657 548 804
25,030 23,830 25,374 22,223
5. NON-INTEREST EXPENSE
Amortisation of computer software 582 676 582 676
Cost of inventory sold - 1,541 - -
Depreciation – buildings 361 359 361 359
Depreciation – leasehold improvements 1,512 1,524 1,512 1,524
Depreciation – plant and equipment 1,565 1,886 1,565 1,886
Employee related expense 53,226 52,335 53,226 52,335
Net loss on disposal of other financial assets - 10 - 10
Net loss on disposal of property, plant and equipment 180 84 180 84
Operating rental expense 9,855 9,578 9,855 9,578
Payment system processing costs 8,006 7,107 8,004 7,105
Other general and administration expenses 27,074 28,939 27,025 27,058
102,361 104,039 102,310 100,615
ii) Fair value hedges
For a derivative designated as hedging a fair value exposure arising from a recognised asset or liability (or a firm commitment), the gain or loss on the derivative is recognised in profit and loss together with any changes in the fair value of the hedged asset or liability that are attributable to the hedged risk.
R Employee Entitlements
i) Wages and salaries and annual leave
Liabilities for wages and salaries, annual leave and sick leave are recognised and are measured at the amounts expected to be paid when the liabilities are settled.
ii) Long service leave
A liability for long service leave is recognised and is measured as the present value of expected future payments to be made in respect of services provided by employees up to the balance date using the projected unit credit method. Consideration is given to expected future wage and salary levels, experience of employee departures and periods of service. Expected future payments are discounted using market yields on national government guaranteed securities with terms to maturity that match, as closely as possible, the estimated future cash outflows.
iii) Superannuation
Contributions are made by the consolidated entity to an employee’s superannuation fund and are charged as expenses when incurred. The consolidated entity has no legal obligation to cover any shortfall in the funds’ liability to provide benefits to employees on retirement.
iv) On-costs
On-costs associated with employees, including payroll tax, are recognised as liabilities and expenses when the employment to which they relate has occurred.
S Reserves
With effect from 1 July 2005 the Society has established a reserve for credit losses to cover credit risks inherent but not yet incurred in the loan portfolio (refer Note 1I (iii)). Movement in the credit loss reserve is recognised as an appropriation of retained profits.
T Goods and Services Tax
Where capital or expense acquisitions relate to input taxed activities, goods and services tax is generally non-recoverable from taxation authorities. Accordingly, where the amount of goods and services tax incurred is not recoverable, the tax is recognised as part of the cost of acquisition of an asset or as part of an item of expense.
For the purposes of the statement of cash flows, receipts and payments from operations are inclusive of goods and services tax.
U Impairment
The carrying amounts of the consolidated entity’s assets are reviewed at least at the end of each reporting period to determine whether there is any indication of impairment. If any such indication exists, the asset’s recoverable amount is estimated. Any impairment loss is recognised whenever the carrying amount of an asset exceeds its recoverable amount. Impairment losses are recognised in profit and loss unless the asset has previously been revalued, in which case the impairment loss is recognised as a reversal but only to the extent of the previous revaluation amount.
V Rounding of Amounts
The company is of a kind referred to in ASIC Class Order 98/100, issued by Australian Securities and Investments Commission, relating to the ‘rounding off’ of amounts in the financial statements. Amounts in the financial statements have been rounded off in accordance with that Class Order to the nearest thousand dollars, or in certain cases, the nearest dollar.
Notes to and Forming Part of the Financial Statementsfor the year ended 30 June 2015

Annual Report | 2014-15Greater Building Society 3433
Notes to and Forming Part of the Financial Statementsfor the year ended 30 June 2015
CONSOLIDATED SOCIETY
Notes 2015 2014 2015 2014
$’000 $’000 $’000 $’000
6. INCOME TAX EXPENSE
A INCOME TAX EXPENSE
Current tax 14,755 12,844 14,753 12,968
Deferred tax (52) 88 (89) 359
Adjustment to current tax of prior years (13) (198) (13) (198)
14,690 12,734 14,651 13,129
Income tax expense attributable to
Profit from operations 14,690 12,734 14,651 13,129
Aggregate income tax expense 14,690 12,734 14,651 13,129
Deferred income tax expense/(revenue) included in income tax expense comprises
Decrease/(increase) in deferred tax assets 14 (857) 194 (894) 398
Increase/(decrease) in deferred tax liabilities 14 805 (106) 805 (39)
(52) 88 (89) 359
B NUMERICAL RECONCILIATION OF INCOME TAX EXPENSE TO PRIMA FACIE TAX PAYABLE
Profit from operations before income tax expense 49,640 44,095 49,378 44,082
Prima facie tax payable at 30% (2014 – 30%) 14,892 13,229 14,813 13,225
Tax effect of amounts which are not deductible (taxable) in calculating taxable income
Non-assessable income (exempt Charitable Foundation) (50) (18) - -
Non-assessable distributions - (89) - -
Research and development (154) (200) (154) (200)
Entertainment expenses 17 13 17 13
Debt forgiveness for consolidated entity - - (10) 292
Sundry items (2) (3) (2) (3)
Under/(over) provision prior year (13) (198) (13) (198)
(202) (495) (162) (96)
INCOME TAX EXPENSE 14,690 12,734 14,651 13,129
C AMOUNTS RECOGNISED DIRECTLY IN EQUITY
Aggregate current and deferred tax arising in the reporting period and not recognised in net profit or loss but directly debited or credited to equity
Current tax – credited directly to equity 111 149 111 149
Net deferred tax – debited/(credited) directly to equity
14 (726) (16) (721) 10
Reserves – debited/(credited) directly to equity - 80 - -
23 (615) 213 (610) 159
CONSOLIDATED SOCIETY
Notes 2015 2014 2015 2014
$’000 $’000 $’000 $’000
7. CASH AND CASH EQUIVALENTS
All Cash and Cash Equivalents are current assets
Cash on hand 18,711 18,916 18,731 18,937
Financial institution balance – at call 62,832 92,390 44,433 73,930
Financial institution balance – short-term 89,711 123,132 89,711 123,132
171,254 234,438 152,875 215,999
Short-term cash and cash equivalents are those where original maturity is less than 90 days.
8. INVESTMENT SECURITIES
Financial institutions balance 755,643 548,639 757,305 550,048
Investments in other securities 103,571 27,803 535,570 459,803
859,214 576,442 1,292,875 1,009,851
Investments with financial institutions are those where original maturity is greater than 90 days.
Investment securities expected to mature within 12 months 240,289 142,020 239,802 141,312
Investment securities expected to mature after 12 months 618,925 434,422 1,053,073 868,539
859,214 576,442 1,292,875 1,009,851
9. CURRENT TAX ASSET
All current tax assets (liabilities) are expected to be settled within 12 months.
Income Tax Refundable/(Payable) 2,798 (4,607) 2,798 (4,607)
2,798 (4,607) 2,798 (4,607)
10. OTHER RECEIVABLES
All Other Receivables are current assets.
Accrued income 383 224 383 224
Prepayments 681 692 677 678
Other receivables 11 - 1,762 1,854
1,075 916 2,822 2,756

Annual Report | 2014-15Greater Building Society 3635
CONSOLIDATED SOCIETY
2015 2014 2015 2014
$’000 $’000 $’000 $’000
11. DERIVATIVE FINANCIAL INSTRUMENTS
Derivative financial instrument asset
Interest rate swap contracts – cash flow hedges 3,067 3,546 3,067 3,546
3,067 3,546 3,067 3,546
Derivatives expected to mature within 12 months 917 693 917 693
Derivatives expected to mature after 12 months 2,150 2,853 2,150 2,853
3,067 3,546 3,067 3,546
Derivative financial instrument liability
Interest rate swap contracts – cash flow hedges 189 130 189 130
189 130 189 130
Derivatives expected to mature within 12 months 189 130 189 130
Derivatives expected to mature after 12 months - - - -
189 130 189 130
Cash flow hedge ineffectiveness – gain/(loss) - - - -
12. LOANS AND ADVANCES
Overdrafts 111,363 130,595 111,363 130,595
Term loans 4,213,443 4,099,457 4,213,443 4,099,457
Gross loans and advances 4,324,806 4,230,052 4,324,806 4,230,052
Allowance for specific impairment losses (1,119) (1,031) (1,119) (1,031)
Net loan and advances 4,323,687 4,229,021 4,323,687 4,229,021
Loans and advances expected to be paid within 12 months 1,355,177 1,367,403 1,355,177 1,367,403
Loans and advances expected to be paid after 12 months 2,968,510 2,861,618 2,968,510 2,861,618
4,323,687 4,229,021 4,323,687 4,229,021
A ALLOWANCE FOR SPECIFIC IMPAIRMENT LOSSES
Movement in the allowance for specific impairment losses are as follows
Opening balance 1,031 959 1,031 2,334
Bad debt write-off (222) (263) (188) (1,235)
New/(Released) provision 310 335 276 (68)
1,119 1,031 1,119 1,031
Notes to and Forming Part of the Financial Statementsfor the year ended 30 June 2015
CONSOLIDATED SOCIETY
2015 2014 2015 2014
$’000 $’000 $’000 $’000
B IMPAIRED LOANS
Impaired loans with specific provision for impairment 3,115 2,976 3,115 2,976
Less provision (1,119) (1,031) (1,119) (1,031)
1,996 1,945 1,996 1,945
Impaired loans will be either assessed individually or grouped together with similar credit risk assets and assessed collectively for impairment. Individual assessment will usually be performed where the risk exposure is either significant by amount or of a particular product type. The consolidated entity in assessing individual specific impairment will consider the counterparties’ willingness to meet their contractual arrangements, the counterparties’ economic circumstances and their future financial prospects and the security provided.
Security for housing loans is in the form of registered mortgage over residential property real estate. Security for commercial loans is in the form of registered mortgage over residential and/or commercial real estate. Security for personal loans is in the form of either registered mortgage over real estate, mortgage over other property or charges against funds held on deposit.
C ASSETS ACQUIRED THROUGH THE ENFORCEMENT OF SECURITY
Net fair value of assets acquired through the enforcement of security still held at the end of the financial year
Real estate 225 265 225 265
Other assets 9 - 9 -
234 265 234 265
Assets acquired during the year are disposed of as soon as practically possible with the proceeds used to reduce the outstanding indebtedness. Any residual proceeds after the debt is repaid are returned to the borrower.
There were no assets through the enforcement of security during the year that were used by the Society or the consolidated entity in its operations.
D PAST DUE LOANS
Analysis of loans that have not met their contractual repayment schedule but are not impaired
Less than 3 months past due 99,011 84,279 99,011 84,279
3 months to less than 6 months past due 3,054 3,669 3,054 3,669
6 months or more past due 425 1,565 425 1,565
102,490 89,513 102,490 89,513
Security for housing loans is in the form of registered mortgage over residential property real estate. Security for commercial loans is in the form of registered mortgage over residential and/or commercial real estate. Security for personal loans is in the form of either registered mortgage over real estate, mortgage over other property or charges against funds held on deposit.

Annual Report | 2014-15Greater Building Society 3837
CONSOLIDATED SOCIETY
2015 2014 2015 2014
$’000 $’000 $’000 $’000
13. OTHER FINANCIAL ASSETS
All other financial assets are non-current assets
Equity financial assets 320 3,547 320 3,547
Controlled entities - - 603 603
320 3,547 923 4,150
CONTROLLED ENTITIES
Name of Entity Class of Share
INVESTMENT HOLDING
Nature of Business2015
%
2014
%
2015
$’000
2014
$’000
Greater Investment Services Pty Ltd
Ordinary 100% 100% 603 603 Management Services
Greater Property Holdings Number 1 Pty Ltd
Ordinary 100% 100% - - Dormant Entity
Greater Charitable Foundation Trust
N/A 100% 100% - - Charitable Foundation
Greater Charitable Foundation Pty Ltd
Ordinary 100% 100% - - Trustee
GBS Receivables Trust No 4 N/A N/A N/A - -Mortgage securitisation special purpose entity
GBS Receivables Repo Trust
N/A N/A N/A - -Mortgage securitisation special purpose entity
Waratah GBS Mortgages Trust No 1
N/A N/A N/A - -Mortgage securitisation special purpose entity
Notes:
a. All the above entities are incorporated in Australia.
b. The Society has control of GBS Receivables Trust No 4, GBS Receivables Repo Trust and Waratah GBS Mortgages Trust No 1 as the Society is exposed to, and has the ability to affect, the variable returns associated with these special purpose entities.
c. The GBS Receivables Repo Trust is an internal securitisation and the Society holds all of the notes on issue.
d. The investment holding in Greater Property Holdings Number 1 Pty Ltd was impaired as at 30 June 2015 and written down to nil (2014 nil).
Notes to and Forming Part of the Financial Statementsfor the year ended 30 June 2015
CONSOLIDATED SOCIETY
2015 2014 2015 2014
$’000 $’000 $’000 $’000
14. DEFERRED TAX ASSETS
Net Deferred tax assets 3,331 3,279 3,405 3,316
A COMPOSITION OF NET DEFERRED TAX ASSETS
Deferred tax assets
The balance comprises temporary differences attributable to
Doubtful debts 336 309 336 309
Impaired assets - - 89 89
Employee benefits 2,799 2,942 2,799 2,942
Loan origination costs and fair value adjustments 12 11 12 11
Property, plant and equipment 1,664 1,796 1,664 1,796
Deferred revenue 1,199 - 1,199 -
Investment securities 27 - 27 -
Accruals 902 1,024 887 972
6,939 6,082 7,013 6,119
Amounts recognised directly in equity
Fair value assets through other comprehensive income - - - -
6,939 6,082 7,013 6,119
DEFERRED TAX LIABILITIES
Less set-off of deferred tax liabilities
The balance comprises temporary differences attributable to
Prepayments - (18) - (18)
Property, plant and equipment (514) 230 (1,561) (812)
Investment securities (116) (40) (116) (40)
Loan origination costs (31) (60) (31) (60)
(661) 112 (1,708) (930)
Amounts recognised directly in equity
Property revaluation surplus reserve (2,122) (1,231) (1,075) (189)
Fair value assets through other comprehensive income - (680) - (680)
Cash flow hedges (825) (1,004) (825) (1,004)
(2,947) (2,915) (1,900) (1,873)
Total set-off amount of deferred tax liabilities (3,608) (2,803) (3,608) (2,803)

Annual Report | 2014-15Greater Building Society 4039
CONSOLIDATED SOCIETY
2015 2014 2015 2014
$’000 $’000 $’000 $’000
B MOVEMENTS IN NET DEFERRED TAX ASSETS
Attributable to deferred tax assets
Opening balance 6,082 6,361 6,119 6,502
Credited/(charged) to the statement of comprehensive income
874 (194) 911 (398)
Under/(over) provision in prior year (17) (85) (17) 15
6,939 6,082 7,013 6,119
Less off-set of deferred tax liabilities
Attributable to deferred tax liabilities
Opening balance 2,803 2,852 2,803 2,852
Charged/(credited) to the statement of comprehensive income
669 (65) 674 (39)
Charged/(credited) to equity 726 16 721 (10)
Under/(over) provision in prior year 104 - 104 -
Transferred (to)/from retained profits (694) - (694) -
Total set-off amount of deferred tax liabilities 3,608 2,803 3,608 2,803
NET DEFERRED TAX ASSETS 3,331 3,279 3,405 3,316
C RECOVERY OF DEFERRED TAX ASSETS
Attributable to deferred tax assets
Deferred tax assets to be recovered after more than 12 months 3,554 2,801 3,644 2,875
Deferred tax assets to be recovered within 12 months 3,385 3,281 3,369 3,244
6,939 6,082 7,013 6,119
Attributable to deferred tax liabilities
Deferred tax liabilities to be settled after more than 12 months 3,320 1,850 3,320 1,850
Deferred tax liabilities to be settled within 12 months 288 953 288 953
3,608 2,803 3,608 2,803
NET DEFERRED TAX ASSETS 3,331 3,279 3,405 3,316
Notes to and Forming Part of the Financial Statementsfor the year ended 30 June 2015
CONSOLIDATED SOCIETY
2015 2014 2015 2014
$’000 $’000 $’000 $’000
15. PROPERTY, PLANT AND EQUIPMENT
All property, plant and equipment are non-current assets
Land and buildings 21,183 18,435 21,183 18,435
Less accumulated depreciation - - - -
21,183 18,435 21,183 18,435
Leasehold improvements 11,605 13,341 11,605 13,341
Less accumulated depreciation (8,984) (9,265) (8,984) (9,265)
2,621 4,076 2,621 4,076
Plant and equipment 16,454 18,354 16,454 18,354
Less accumulated depreciation (12,326) (13,106) (12,326) (13,106)
4,128 5,248 4,128 5,248
PROPERTY, PLANT AND EQUIPMENT 27,932 27,759 27,932 27,759
A VALUATION OF LAND AND BUILDINGS
The valuation of land and buildings is on the basis of fair market values based on existing use and are classified as level 3 assets. During the financial year no land and buildings were transferred between categories. In determining fair value the consolidated entity uses a variety of methods and makes assumptions that are based on market conditions existing at the end of each reporting period. Specifically, inputs include observations of the net rental market and current commercial capitalisation rates. An annual assessment is made by the Directors to ensure that the carrying values do not differ materially from the fair value. The Directors’ assessments are supported by independent valuations. Details of the independent valuations are shown below.
June 2015 – the Directors’ valuation considered the independent valuations performed at 30 June 2015 by B Player (AAPI, CPV), Reg Valuer No. 019427 and H Pawlik (FAPI, CPV), Reg Valuer No. 1192 and B Green (AAPI), Reg Valuer No. 6283.
June 2014 – the Directors’ valuation considered the independent valuations performed at 30 June 2013 by P Macadam (AAPI), Reg Valuer No. 3784 and H Pawlik (FAPI, CPV), Reg Valuer No. 1192 and B Green (AAPI), Reg Valuer No. 6283.
B CARRYING AMOUNTS THAT WOULD HAVE BEEN RECOGNISED IF LAND AND BUILDINGS WERE STATED AT COST
Freehold land and buildings stated on the historical cost basis, would be as follows
Land and buildings
Cost 18,587 18,572 18,587 18,572
Accumulated depreciation (4,113) (3,736) (4,113) (3,736)
Net book amount 14,474 14,836 14,474 14,836

Annual Report | 2014-15Greater Building Society 4241
CONSOLIDATED SOCIETY
2015 2014 2015 2014
$’000 $’000 $’000 $’000
C MOVEMENT IN LAND AND BUILDINGS
Balance as at start of year 18,435 18,572 18,435 18,572
Additions 15 71 15 71
Disposals - (269) - (269)
Building in course of construction - - - -
Revaluation increment/(decrement) recognised in profit and loss
124 16 140 106
Revaluation increment/(decrement) recognised in other comprehensive income
2,970 404 2,954 316
Depreciation expense (361) (359) (361) (359)
Balance as at end of year 21,183 18,435 21,183 18,435
D MOVEMENT IN LEASEHOLD IMPROVEMENTS
Balance as at start of year 4,076 4,589 4,076 4,589
Additions 57 1,029 57 1,029
Disposals - (18) - (18)
Depreciation expense (1,512) (1,524) (1,512) (1,524)
Balance as at end of year 2,621 4,076 2,621 4,076
E MOVEMENT IN PLANT AND EQUIPMENT
Balance as at start of year 5,248 5,866 5,248 5,866
Additions 1,113 1,552 1,113 1,552
Disposals (668) (284) (668) (284)
Depreciation expense (1,565) (1,886) (1,565) (1,886)
Transfer from leasehold improvements - - - -
Balance as at end of year 4,128 5,248 4,128 5,248
16. INVESTMENT PROPERTIES
All Investment Properties are non-current assets
Investment properties 4,995 4,303 4,995 4,303
A VALUATION OF INVESTMENT PROPERTIES
The valuation of investment properties is on the basis of fair market values based on existing use and are classified as level 3 assets. During the financial year no investment properties were transferred between categories. In determining fair value the consolidated entity uses a variety of methods and makes assumptions that are based on market conditions existing at the end of each reporting period. Specifically, inputs include observations of the net rental market and current commercial capitalisation rates. An annual assessment is made by the Directors to ensure that the carrying values do not differ materially from fair value. The Directors’ assessments are supported by independent valuations. Details of the independent valuations are shown below.
June 2015 – the Directors’ valuation considered the independent valuations performed at 30 June 2015 by B Player (AAPI, CPV), Reg Valuer No. 019427 and H Pawlik (FAPI, CPV), Reg Valuer No. 1192 and B Green (AAPI), Reg Valuer No. 6283.
June 2014 – the Directors’ valuation considered the independent valuations performed at 30 June 2013 by P Macadam (AAPI), Reg Valuer No. 3784 and H Pawlik (FAPI, CPV), Reg Valuer No. 1192 and B Green (AAPI), Reg Valuer No. 6283.
CONSOLIDATED SOCIETY
2015 2014 2015 2014
$’000 $’000 $’000 $’000
B MOVEMENT IN INVESTMENT PROPERTIES
Balance as at start of year 4,303 4,301 4,303 4,301
Additions 32 - 32 -
Revaluation increment/(decrement) recognised in profit and loss 660 2 660 2
Balance as at end of year 4,995 4,303 4,995 4,303
C LEASING ARRANGEMENTS
The investment properties are leased to tenants under short-term operating leases with rentals payable monthly. Minimum lease payments receivable on leases of investment properties are as follows.
Minimum lease payments not recognised in the financial statements are receivable as follows
Within one year 241 107 241 107
Later than one year but before five years 475 158 475 158
Balance as at end of year 716 265 716 265
D AMOUNT RECOGNISED IN PROFIT AND LOSS FOR INVESTMENT PROPERTIES
Rental income 253 222 253 222
Direct operating expenses (82) (83) (82) (83)
171 139 171 139
17. INTANGIBLE ASSETS
All intangible assets are non-current assets
Computer software 7,514 5,141 7,514 5,141
Less accumulated amortisation (3,938) (3,478) (3,938) (3,478)
3,576 1,663 3,576 1,663
A MOVEMENT IN SOFTWARE BALANCES
Balance as at start of year 1,663 1,398 1,663 1,398
Additions 2,502 965 2,502 965
Disposal (7) (24) (7) (24)
Amortisation expense (582) (676) (582) (676)
Balance as at end of year 3,576 1,663 3,576 1,663
18. PAYABLES AND OTHER LIABILITIES
All payables and other liabilities are expected to be settled within 12 months
Creditors and other accruals 8,655 7,552 8,629 7,551
Notes to and Forming Part of the Financial Statementsfor the year ended 30 June 2015

Annual Report | 2014-15Greater Building Society 4443
CONSOLIDATED SOCIETY
2015 2014 2015 2014
$’000 $’000 $’000 $’000
19. DEFERRED REVENUE
Expected to be brought to account within 12 months 944 - 944 -
Expected to be brought to account after 12 months 3,054 - 3,054 -
3,998 - 3,998 -
20. DEPOSITS
Call deposits 2,397,315 2,071,417 2,400,085 2,074,339
Term deposits 2,301,763 2,352,174 2,302,272 2,352,174
4,699,078 4,423,591 4,702,357 4,426,513
Refer note 31A for the split of current and non-current deposits.
21. OTHER FINANCIAL LIABILITIES
Commercial notes 256,319 251,719 - -
Loans – securitisation special purpose entities - - 673,997 669,239
256,319 251,719 673,997 669,239
Other financial liabilities expected to be settled within 12 months
117,053 63,397 176,779 160,732
Other financial liabilities expected to be settled after 12 months 139,266 188,322 497,218 508,507
256,319 251,719 673,997 669,239
22. PROVISIONS
Employee benefits 9,329 9,808 9,329 9,808
Other 38 249 38 249
9,367 10,057 9,367 10,057
Provisions expected to be settled within 12 months 4,138 4,427 4,138 4,427
Provisions expected to be settled after 12 months 5,229 5,630 5,229 5,630
9,367 10,057 9,367 10,057
23. RESERVES
Fair value assets through other comprehensive income - 2,547 - 2,547
Cash flow hedge reserve 1,926 2,602 1,926 2,602
Credit loss reserve 9,978 9,966 9,978 9,966
Property revaluation surplus reserve 4,952 2,873 2,509 441
Business combination reserve 10,699 10,699 10,699 10,699
Community support reserve 1,254 1,364 1,254 1,364
28,809 30,051 26,366 27,619
Notes to and Forming Part of the Financial Statementsfor the year ended 30 June 2015
CONSOLIDATED SOCIETY
2015 2014 2015 2014
$’000 $’000 $’000 $’000
MOVEMENT IN RESERVES
A FAIR VALUE ASSETS THROUGH OTHER COMPREHENSIVE INCOME RESERVE
Balance at beginning of year 2,547 2,342 2,547 2,342
Revaluation gross 46 293 46 293
Deferred tax (14) (88) (14) (88)
Transfer (to)/from retained profits (2,579) - (2,579) -
- 2,547 - 2,547
The fair value through other comprehensive income reserve relates to equity financial assets designated as fair value through other comprehensive income. Fair value movements on these equity financial assets are held in equity rather than through profit and loss as described in Note 1F. These financial assets were disposed of during the year.
B CASH FLOW HEDGE RESERVE
Balance at beginning of year 2,602 3,398 2,602 3,398
Recognised in equity during the year (595) (642) (595) (642)
Transferred to profit and loss during the year (371) (495) (371) (495)
Deferred tax 290 341 290 341
1,926 2,602 1,926 2,602
The cash flow hedge reserve represents the future value of hedged instruments that have been designated as effective hedges in accordance with hedge accounting as described in Note 1Q (i).
C CREDIT LOSS RESERVE
Balance at beginning of year 9,966 9,632 9,966 9,632
Transfer (to)/from retained profits 12 334 12 334
9,978 9,966 9,978 9,966
The credit loss reserve is a requirement of Australian Prudential Regulation Authority Prudential Standards and represents the potential inherent losses in the loans and advances portfolio under a stressed economic environment.
D PROPERTY REVALUATION SURPLUS RESERVE
Balance at beginning of year 2,873 2,781 441 221
Transfer (to)/from retained profits - (273) - -
Deferred tax - 82 - -
Revaluation gross 2,625 63 2,610 133
Deferred tax (788) (19) (783) (40)
Depreciation transfer gross 345 342 344 181
Deferred tax (103) (103) (103) (54)
4,952 2,873 2,509 441
The property revaluation surplus reserve is used to record the unrealised increments and decrements on the revaluation of property as described in Note 1J.

Annual Report | 2014-15Greater Building Society 4645
CONSOLIDATED SOCIETY
2015 2014 2015 2014
$’000 $’000 $’000 $’000
E REVALUATION ON CONSOLIDATION RESERVE
Balance at beginning of year - 93 - -
Transfer (to)/from retained profits - (93) - -
- - - -
The revaluation on consolidation reserve recognises the fair value of unrecognised assets acquired as a result of consolidating a subsidiary.
F BUSINESS COMBINATION RESERVE
Balance at beginning of year 10,699 10,699 10,699 10,699
Transfer (to)/from retained profits - - - -
10,699 10,699 10,699 10,699
The business combination reserve recognises the net assets acquired on merger.
G COMMUNITY SUPPORT RESERVE
Balance at beginning of year 1,364 1,364 1,364 1,364
Transfer (to)/from retained profits (110) - (110) -
1,254 1,364 1,254 1,364
The community support reserve has been set aside to provide services and facilities in the communities in which the Greater Building Society operates.
24. RETAINED PROFITS
Retained profits 394,834 357,207 394,052 356,648
Movement in retained profits
Balance at beginning of year 357,207 326,151 356,648 326,029
Net profit in the year 34,950 31,106 34,727 30,953
Transfer (to)/from credit loss reserve (12) (334) (12) (334)
Transfer (to)/from consolidation reserve - 93 - -
Transfer (to)/from property revaluation surplus reserve - 191 - -
Transfer (to)/from community contribution reserve 110 - 110 -
Transfer to/(from) fair value assets reserve 2,579 - 2,579 -
394,834 357,207 394,052 356,648
25. NON-CONTROLLING INTEREST
Reconciliation of non-controlling interest in controlled entities
Balance at beginning of year - 1,018 - -
Share of operating profit - 289 - -
Share of net assets of acquired entity - (34) - -
Distribution paid or payable - (299) - -
Return of capital - (974) - -
- - - -
Notes to and Forming Part of the Financial Statementsfor the year ended 30 June 2015
26. RELATED PARTIES
A CONTROLLED ENTITIES
Information in respect of controlled entities is disclosed in Note 13.
B KEY MANAGEMENT PERSONNEL
Key management personnel are the Directors and those Senior Executives who are responsible for the planning, directing and controlling of the activities of the Society and consolidated entity. Details of changes to the Directors are shown in the Directors’ Report.
i) Compensation paid to key management personnel
Short-term employee benefits 3,799,957 3,757,352 3,799,957 3,733,352
Post-employment benefits 357,832 355,167 357,832 355,167
Other long-term benefits 255,174 263,964 255,174 263,964
Termination benefits - - - -
4,412,963 4,376,483 4,412,963 4,352,483
ii) Loans to key management personnel (including related parties)
Loans outstanding at beginning of year 2,379,752 2,554,555 2,379,752 2,554,555
Net balances from changes in personnel (677,694) - (677,694) -
Advances made during the year 1,391,318 435,625 1,391,318 435,625
Interest and fees charged 94,293 117,072 94,293 117,072
Repayments made during the year (1,554,715) (727,500) (1,554,715) (727,500)
Loans outstanding at end of year 1,632,954 2,379,752 1,632,954 2,379,752
Loans granted at commercial terms are provided at the same interest rate and terms available to members generally. Security is taken in the majority of cases in accordance with the Society’s normal credit risk policy.
Loans granted at non-commercial terms relate to loans provided to Senior Executives in accordance with the concessional employees loan policy. Under this policy, employees are eligible for loans at concessional rates of interest dependent upon their length of employment, their seniority and their salary level.
iii) Deposits made by key management personnel (including related parties)
Deposits outstanding at the beginning of year 3,174,747 2,464,002 3,174,747 2,464,002
Net balances from changes in personnel (1,730,497) - (1,730,497) -
Interest paid 76,592 98,444 76,592 98,444
Net movement in deposits during the year 940,369 612,301 940,369 612,301
Deposits outstanding at the end of the year 2,461,211 3,174,747 2,461,211 3,174,747
The Society has entered into an Enterprise Agreement with its employees. Under this agreement the Society provides each employee with a deposit account upon which no transaction fees are payable. These amounts are included in the above disclosure.

Annual Report | 2014-15Greater Building Society 4847
Notes to and Forming Part of the Financial Statementsfor the year ended 30 June 2015
C TRANSACTIONS WITH OTHER RELATED PARTIES
The Society has related party transactions with the following entities:
i) Greater Rollover and Allocated Pension Fund invests funds with the Society. At balance date these deposits totalled $13,212,000 (2014 $15,179,000). The Society acted as Administrator to the Trust until April 2013. The Society provided administration services to the entity for $NIL (2014 $NIL) consideration; these services ceased at April 2013.
ii) Greater Investment Services Pty Ltd invests funds with the Society. At balance date these deposits totalled $2,167,000 (2014 $2,067,000). In support of the entities AFS licence the Society has provided a support agreement including a financial support commitment to the entity. The entity acts as the manager for GBS Receivables Trust No 4, GBS Receivables Repo Trust and Waratah GBS Mortgage Trust No 1. The Society provides administration services to the entity for $NIL (2014 $NIL) consideration.
iii) The Society provides custodian, basis swap, interest rate swap and redraw commitment facilities to GBS Receivables Trust No 4 and GBS Receivables Repo Trust as well as acting as servicer of the securitised mortgages. These trusts are special purpose entities that allow the Society to access funding by securitising mortgage loans. The revenues and fees in relation to these services are part of the funding arrangements; accordingly, they are included in the effective interest rate of the loan facility. The Society holds units in and invests funds with GBS Receivables Trust No 4. At balance date the units had a value of $7,000,000 (2014 $7,000,000) and the deposits totalled $2,147,635 (2014 $2,117,382). The Society also holds all the units with GBS Receivables Repo Trust. At balance date the units had a value of $425,000,000 (2014 $425,000,000).
iv) Waratah GBS Mortgage Trust No 1 during the year accepted the sale of mortgages from the Society. The Society provides custodian and interest rate swap facilities to the Trust as well as acting as servicer of the securitised mortgages. The trust is a special purpose entity that allows the Society to access funding by securitising mortgage loans. The revenues and fees in relation to these services are part of the funding arrangements; accordingly, they are included in the effective interest rate of the loan facility.
v) The Greater Charitable Foundation invests funds with the Society. At balance date these deposits totalled $1,125,000 (2014 $875,000). The Trust’s principal activities are the provision of distributions to other entities or persons to advance or promote a charitable purpose. During the year the Society donated $1,200,000 (2014 $1,700,000) to The Greater Charitable Foundation and provided administration services for $330,000 (2014 $306,000) consideration.
CONSOLIDATED SOCIETY
2015 2014 2015 2014
$ $ $ $
27. REMUNERATION OF AUDITORS
PricewaterhouseCoopers Australia
Income received or due and receivable by the auditors for
Auditing services for the financial statements of any entity within the consolidated entity
284,697 265,145 234,287 212,485
Auditing services for prudential regulation reporting 66,997 55,616 66,997 55,616
Other audit-related work 53,607 27,070 50,002 19,570
Taxation advisory services 112,859 117,504 112,859 111,504
General advisory services - 16,500 - 16,500
518,160 481,835 464,145 415,675
28. COMMITMENTS
The Group leases various ATM locations and Branch offices under non-cancellable operating leases expiring within two to seven years. The leases have varying terms, escalation clauses and renewal rights.
Commitments for minimum lease payments in relation to non-cancellable operating leases are payable as follows
i) Lease commitments
Within one year 6,831 7,584 6,831 7,584
Later than one year but not later than five years 8,892 11,620 8,892 11,620
Later than five years - 20 - 20
15,723 19,224 15,723 19,224
29. SEGMENTAL REPORTING
The consolidated entity’s operations are confined to one business segment being the provision of financial services and products to members in the form of taking deposits and providing financial accommodation as prescribed by the constitution.

Annual Report | 2014-15Greater Building Society 5049
CONSOLIDATED SOCIETY
2015 2014 2015 2014
$’000 $’000 $’000 $’000
30. RECONCILIATION OF NET CASH
Provided by Operating Activities to Operating Profit After Income Tax
Operating profit after income tax 34,950 31,361 34,727 30,953
Depreciation and amortisation 4,020 4,445 4,020 4,445
Impaired losses/(gains) on loans 310 335 276 (68)
Profit on sale of investments (2,771) (2,215) (2,771) (2,215)
Loss on sale of investments - 10 - 10
Profit on sale property, plant and equipment (96) (197) (96) (197)
Loss on sale of property, plant and equipment 180 84 180 84
Dividend and distributions received from investing activities - (17) - (521)
Fair value movement of land & buildings (124) (16) (140) (106)
Fair value movement of investment properties (660) (2) (660) (2)
Increase/(decrease) in accrued interest payable (1,371) (3,433) (2,096) (4,382)
Decrease/(increase) in accrued interest receivable (1,520) 425 (1,527) 426
Decrease/(increase) in other receivables (160) 29 (160) 29
Decrease/(increase) in net deferred tax assets (677) 856 (707) 587
Decrease/(increase) in sundry debtors and prepaid expenditure
29 299 125 482
Decrease/(increase) in inventory - 1,535 - -
Increase/(decrease) in deferred revenue 3,998 - 3,998 -
Increase/(decrease) in income taxes payable (7,405) 1,115 (7,405) 1,115
Increase/(decrease) in creditors and accrued expenses
373 1,101 369 (1,195)
Increase/(decrease) in other provisions (690) 241 (690) 241
Decrease/(increase) in loans and advances (94,769) (43,548) (94,026) (35,404)
Decrease/(increase) in investment securities (276,059) (20,091) (276,305) (11,161)
Increase/(decrease) in deposits 278,022 238,973 278,369 237,280
NET CASH PROVIDED BY OPERATING ACTIVITIES (64,420) 211,290 (64,519) 220,401
CONSOLIDATED SOCIETY
2015 2014 2015 2014
$’000 $’000 $’000 $’000
31. RISK MANAGEMENT AND FINANCIAL INSTRUMENTS
A FINANCIAL ASSETS AND LIABILITIES
The carrying amount of the following categories of financial assets and liabilities are
Financial assets
Financial assets measured at amortised cost 5,356,349 5,041,892 5,773,378 5,458,750
Fair value through other comprehensive income 320 3,547 923 4,150
Financial assets that are designated hedging instruments 3,067 3,546 3,067 3,546
5,359,736 5,048,985 5,777,368 5,466,446
Financial liabilities
Financial liabilities that are designated hedging instruments 189 130 189 130
Financial liabilities measured at amortised cost 4,968,050 4,682,906 5,388,981 5,103,396
4,968,239 4,683,036 5,389,170 5,103,526
The consolidated entity early adopted AASB 9 Financial Instruments and AASB2009-11 Amendments to Australian Accounting Standards arising from AASB 9 from 1 July 2010.
B RISK MANAGEMENT FRAMEWORK
The consolidated entity’s activities are principally related to the use of financial instruments. The consolidated entity predominantly accepts deposits from members at both fixed and floating rates for various periods and lends to retail borrowers at both fixed and floating rates with a range of credit standings. Surplus funding is invested in high quality liquid or investment securities. Accordingly, the consolidated entity’s activities are exposed to the following key financial risks: market risk, credit risk and liquidity risk.
Risks are monitored and managed using an enterprise wide risk management system. This system records all the identified risks, the risk controls and risk mitigants used to manage the risks and an assessment of each risk. These risks are formally reviewed by Management and presented to the Board Risk Committee on a quarterly basis.
Risk management is carried out by the Executive Committee, comprising of Senior Management Executives, under policies approved by the Board of Directors (the Board). The Board provides written principles for the overall risk management, as well as written policies covering specific areas as required, to meet minimum Prudential Standards requirements issued by the Australian Prudential Regulation Authority (APRA).
These Risk Management Policies identify the consolidated entity’s policies and procedures, processes and controls that comprise its risk management and control systems. These systems address key material risks, financial and non-financial, likely to be faced by the consolidated entity. The policies and procedures are reviewed annually by senior Management and the Board to take account of changing circumstances. In addition, the Chief Executive Officer annually certifies to APRA that Senior Management and the Board have identified key risks facing the consolidated entity. The Board has established systems to monitor those risks, including setting and requiring adherence to a series of prudential limits, adequate timely reporting processes, and compliance reporting demonstrating that these risk management systems are operating effectively and are adequate having regard to the risks they are designed to control.
Notes to and Forming Part of the Financial Statementsfor the year ended 30 June 2015

Annual Report | 2014-15Greater Building Society 5251
C MARKET RISK
The predominant market risk the consolidated entity is exposed to is interest rate risk. The consolidated entity is not exposed to foreign exchange or other price risk.
The consolidated entity’s interest rate risk arises from the net difference in cash flows from long-term fixed rate assets or liabilities which are funded by or invested in floating rate assets or liabilities. Long-term fixed rate assets include loans advanced to members and other investment securities, while long-term fixed rate liabilities includes deposits raised from members and other wholesale funding arrangements. This exposure creates an interest rate risk because the net balances and cash flows generated from these assets and liabilities are dependent upon movements in interest rates.
The consolidated entity has established policy limits for the level of interest rate risk. Current policy measures interest rate risk in terms of the net present value of a basis point (PVBP) movement in interest rates. PVBP measures the net effect on the fair value of financial instruments for every one basis point (0.01%) change in the interest rate yield curve. The policy has limits for the amount of movement in the fair value of net assets or liabilities exposed to a hypothetical basis point variance before the risk requires active management. The limits are placed for specific time periods together with an overall portfolio limit. The risk is managed by, or a combination of, changes to product pricing or product terms to change consumer product purchasing preferences, by the use of interest rate swaps or other derivative instruments, or by the maturity placement of investment securities. When interest rate swaps are used for the above purpose, the consolidated entity may use hedge accounting.
For the PVBP model the cash flows from financial assets and liabilities are allocated into time buckets based on contractual repricing except for ‘at call’ transactional accounts. At call transactional accounts are liabilities raised from members and historically have limited sensitivity to movements in interest rates. The model allocates the portion of the transactional account balances that is sensitive to movements in interest rates into the less than three months’ time bucket while the remaining portion of transaction account balances that are not sensitive to interest rate movements are evenly allocated into each time bucket over a five year time horizon. The yield curve used in the PVBP model is based off the relevant published interbank interest rates.
The following tables set out the consolidated entity’s and Society’s exposure to interest rate risk, measured by the present value of a basis point change in the yield curve.
FINANCIAL INSTRUMENTS
Present Value of Basis Point (PVBP) Profile 2015 – Consolidated
Less than 3 months 3 to 12 months 1 to 3 years 3 to 5 years Over 5 years Total
Net Exposure ($’s) 3,144 12,063 (16,438) 21,269 (6,023) 14,015
FINANCIAL INSTRUMENTS
Present Value of Basis Point (PVBP) Profile 2015 – Society
Less than 3 months
3 to 12 months 1 to 3 years 3 to 5 years Over 5 years Total
Net Exposure ($’s) 3,150 12,081 (16,285) 21,557 (6,023) 14,480
FINANCIAL INSTRUMENTS
Present Value of Basis Point (PVBP) Profile 2014 – Consolidated
Less than 3 months
3 to 12 months 1 to 3 years 3 to 5 years Over 5 years Total
Net Exposure ($’s) 7,294 11,532 (19,010) 5,906 (1,254) 4,468
FINANCIAL INSTRUMENTS
Present Value of Basis Point (PVBP) Profile 2014 – Society
Less than 3 months
3 to 12 months 1 to 3 years 3 to 5 years Over 5 years Total
Net Exposure ($’s) 7,299 11,550 (18,860) 6,185 (1,254) 4,920
Notes to and Forming Part of the Financial Statementsfor the year ended 30 June 2015
D CREDIT RISK
The consolidated entity’s credit risk predominantly arises from the risk that counterparties will not meet their contractual obligations with the consolidated entity. The main exposure to credit risk for the consolidated entity is either loans provided to members or investments made for prudential liquidity needs.
Credit risk exposure for loans is minimised by prudent assessment of each individual loan applicant, obtaining security for the majority of loans made and where credit risk warrants undertaking credit insurance.
The credit risk policy assesses the credit worthiness of the applicant considering not only the ability to service the loan but also other factors such as length and stability of employment, asset accumulation and stability of residency. To facilitate this, a credit risk grading system is used that scores or grades loan applicants based on the above criteria. Security still remains an important consideration in assessing the granting of credit. The pricing offered to loan applicants is dependent upon a combination of the loan applicant’s credit risk grade, the security provided and the reason or purpose for the credit request.
The consolidated entity minimises concentration of credit risk in relation to loans by dealing with a relatively large number of individual members of the consolidated entity. Exposure to credit risk is limited to the market area that the consolidated entity participates in. The consolidated entity is active in the retail finance markets of Newcastle, Hunter Valley, Central Coast, Sydney, South Coast, Central West and North Coast of New South Wales and South East Queensland. The Society imposes portfolio limits for each loan product and for each credit risk grade. These portfolio limits seek to limit the consolidated entities’ exposure to certain products that represent a specific credit exposure and also to ensure the portfolio is not concentrated in a specific category of credit risk grade loan applicants.
Security for housing loans is in the form of registered mortgage over residential property real estate. Security for commercial loans is in the form of registered mortgage over residential and/or commercial real estate. Security for personal loans is in the form of either registered mortgage over real estate, mortgage over other property or charges against funds held on deposit. Where appropriate, guarantees are also sought from related parties to a loan. No security is taken for loans via credit cards and some personal loans. Credit risk also arises in relation to financial guarantees given to certain parties. Such guarantees are secured by a registered mortgage over real estate property or by a charge over funds held on deposit.
The Society has entered into a number of residential mortgage backed securitisation arrangements. Loans are equitability assigned to special purpose vehicles. These special purpose vehicles issue commercial notes to note holders secured by the cash flows arising from the loans. A substantial component of the credit risk has been transferred to the unit holders. The Society still retains the market risk, operational risk and some credit risk from these loans. Due to the retention of substantially all the risks and rewards of these loans, the Society and the consolidated entity continue to recognise these assets as ‘loans and advances’.
The following sets out the carrying value of loans and the associated liabilities. The fair value of the transferred assets and associated liabilities approximates their carrying value.
CONSOLIDATED SOCIETY
2015 2014 2015 2014
$’000 $’000 $’000 $’000
Carrying amount of transferred assets
Loans and advances 262,330 260,496 262,330 260,496
Carrying amount of associated liabilities to the transferred assets
Commercial notes 264,727 261,909 264,727 261,909
Credit risk exposure for treasury transactions (i.e. investment securities, cash and derivative transactions) to counterparties is minimised by limiting transactions to pre-approved financial institutions. The consolidated entity also has policies that limit the amount of credit exposure to individual counterparties and limit portfolio exposures based on external credit rating agency bands.
The maximum exposure to credit risk at balance date in relation to each class of recognised financial assets is the carrying amount of these indicated in the balance sheet except for loans and advances. For loans and advances the maximum credit risk exposure for the consolidated entity is $4,065m (2014 $3,972m) and for the Society is $4,065m (2014 $3,972m). For loans that are securitised, credit risk is transferred to a special purpose vehicle (refer Note 1B). This maximum exposure does not take into account the value of any security.
The credit quality of financial assets that are neither past due nor impaired can be assessed by reference to the external credit rating (if available) or the security provided. The following table provides an analysis of credit risk for financial assets that are neither past due or impaired by either external credit rating or type of security.

Annual Report | 2014-15Greater Building Society 5453
Notes to and Forming Part of the Financial Statementsfor the year ended 30 June 2015
CONSOLIDATED SOCIETY
2015 2014 2015 2014
$’000 $’000 $’000 $’000
Financial assets that are neither past due nor impaired
Cash on hand 18,711 18,916 18,731 18,937
Cash & cash equivalents – by external credit rating (S&P)
- A1+/AAA 62,825 51,925 44,426 33,465
- A1/AA+/AA/AA- 19,909 45,454 19,909 45,454
- A2/A+/A/A- 69,808 118,143 69,808 118,143
- A3 - - - -
- Unrated - - - -
Investment securities – by external credit rating (S&P)
- A1+/AAA 96,559 27,803 530,706 461,921
- A1/AA+/AA/AA- 330,822 262,897 330,336 262,189
- A2/A+/A/A- 330,274 235,548 330,274 235,548
- A3 30,123 - 30,123 -
- BBB+ 41,701 30,237 41,701 30,237
- BBB 11,935 - 11,935 -
- Unrated 17,800 19,957 17,800 19,957
Other receivables (unsecured) 1,075 916 2,822 2,756
Derivative financial instruments
- A1+/AAA 3,067 3,546 3,067 3,546
Loans and advances
- mortgage over residential property security 3,878,086 3,809,891 3,878,086 3,809,891
- mortgage over other property 5,579 6,784 5,579 6,784
- other security 46,140 38,896 46,140 38,896
- no security 29,920 24,438 29,920 24,438
Other financial assets (unsecured) 320 3,547 320 4,150
4,994,654 4,698,898 5,411,683 5,116,312
Effect of collateral – all loans where the consolidated entity bears the credit risk
For loans where the consolidated entity bears the credit risk, the carrying value of the loans and the degree of credit risk involved is shown in the table following. Loans classed as ‘Fully Secured’ are residentially secured loans with either full mortgage insurance or with a loan to valuation ratio of 80% or less. Loans classed as secured are residentially secured loans with either partial or no mortgage insurance or a loan to valuation ratio of more than 80% plus commercial loans secured by non-residential property, plus secured consumer loans and secured guarantees. Loans with no security are unsecured consumer loans or credit cards.
LOANS
All Loans Where Entity Bears the Credit Risk 2015 – Consolidated
Fully Secured
$’000
Secured
$’000
No Security
$’000
Total
$’000
Mortgage Over Residential Property 3,751,736 212,856 - 3,964,592
Mortgage Over Other Property - 6,795 - 6,795
Other Security - 47,318 - 47,318
No Security - - 46,625 46,625
TOTAL 3,751,736 266,969 46,625 4,065,330
LOANS
All Loans Where Entity Bears the Credit Risk 2014 – Consolidated
Fully Secured
$’000
Secured
$’000
No Security
$’000
Total
$’000
Mortgage Over Residential Property 3,669,459 213,809 - 3,883,268
Mortgage Over Other Property - 7,656 - 7,656
Other Security - 40,124 - 40,124
No Security - - 41,450 41,450
TOTAL 3,669,459 261,589 41,450 3,972,498
LOANS
All Loans Where Entity Bears the Credit Risk 2015 – Society
Fully Secured
$’000
Secured
$’000
No Security
$’000
Total
$’000
Mortgage Over Residential Property 3,751,736 212,856 - 3,964,592
Mortgage Over Other Property - 6,795 - 6,795
Other Security - 47,318 - 47,318
No Security - - 46,625 46,625
TOTAL 3,751,736 266,969 46,625 4,065,330
LOANS
All Loans Where Entity Bears the Credit Risk 2014 – Society
Fully Secured
$’000
Secured
$’000
No Security
$’000
Total
$’000
Mortgage Over Residential Property 3,669,459 213,809 - 3,883,268
Mortgage Over Other Property - 7,656 - 7,656
Other Security - 40,124 - 40,124
No Security - - 41,450 41,450
TOTAL 3,669,459 261,589 41,450 3,972,498

Annual Report | 2014-15Greater Building Society 5655
LOANS THAT ARE PAST DUE BUT NOT IMPAIRED
An age analysis of loans that are past due but not impaired is set out in the table below. A loan is considered to be past due when any payment under contractual terms has been missed. The amount included is the carrying value, rather than the overdue amount.
LOANS
Loans – Past Due But Not Impaired 2015 – Consolidated
Less than 3 months
$’000
3 to 6 months
$’000
6 months or more
$’000
Total
$’000
Mortgage Over Residential Property 81,104 2,880 357 84,341
Mortgage Over Other Property 1,014 136 66 1,216
Other Security 1,021 38 2 1,061
No Security 15,872 - - 15,872
TOTAL 99,011 3,054 425 102,490
LOANS
Loans – Past Due But Not Impaired 2014 – Consolidated
Less than 3 months
$’000
3 to 6 months
$’000
6 months or more
$’000
Total
$’000
Mortgage Over Residential Property 52,239 14,256 4,699 71,194
Mortgage Over Other Property 678 128 66 872
Other Security 988 131 51 1,170
No Security 16,277 - - 16,277
TOTAL 70,182 14,515 4,816 89,513
LOANS
Loans – Past Due But Not Impaired 2015 – Society
Less than 3 months
$’000
3 to 6 months
$’000
6 months or more
$’000
Total
$’000
Mortgage Over Residential Property 81,104 2,880 357 84,341
Mortgage Over Other Property 1,014 136 66 1,216
Other Security 1,021 38 2 1,061
No Security 15,872 - - 15,872
TOTAL 99,011 3,054 425 102,490
LOANS
Loans – Past Due But Not Impaired 2014 – Society
Less than 3 months
$’000
3 to 6 months
$’000
6 months or more
$’000
Total
$’000
Mortgage Over Residential Property 52,239 14,256 4,699 71,194
Mortgage Over Other Property 678 128 66 872
Other Security 988 131 51 1,170
No Security 16,277 - - 16,277
TOTAL 70,182 14,515 4,816 89,513
Notes to and Forming Part of the Financial Statementsfor the year ended 30 June 2015
The coverage provided by collateral held in support of loans that are past due but not impaired is shown in the table below. The estimated realisable value of collateral held is based on a combination of formal valuations currently held in respect of such collateral and Management’s assessment of the estimated realisable value of collateral held given its experience with similar types of loans in similar situations and the circumstances peculiar to the subject collateral.
A loan is deemed ‘Fully Secured’ when it is residentially secured with either full mortgage insurance or with a loan to valuation ratio of 80% or less. ‘Partially Secured’ includes other residentially secured loans not considered ‘Fully Secured’ and other loans that have a non-residential property security. A loan is classed as ‘Unsecured’ if there is no security or if the security value is less than the loan carrying amount.
LOANS
Effect of Collateral – Past Due But Not Impaired 2015 – Consolidated
Fully Secured
$’000
Partially Secured
$’000
Unsecured
$’000
Total
$’000
Mortgage Over Residential Property 79,586 4,755 - 84,341
Mortgage Over Other Property - 1,216 - 1,216
Other Security - 1,061 - 1,061
No Security - - 15,872 15,872
TOTAL 79,586 7,032 15,872 102,490
LOANS
Effect of Collateral – Past Due But Not Impaired 2014 – Consolidated
Fully Secured
$’000
Partially Secured
$’000
Unsecured
$’000
Total
$’000
Mortgage Over Residential Property 66,306 4,888 - 71,194
Mortgage Over Other Property 688 184 - 872
Other Security 972 198 - 1,170
No Security - - 16,277 16,277
TOTAL 67,966 5,270 16,277 89,513
LOANS
Effect of Collateral – Past Due But Not Impaired 2015 – Society
Fully Secured
$’000
Partially Secured
$’000
Unsecured
$’000
Total
$’000
Mortgage Over Residential Property 79,586 4,755 - 84,341
Mortgage Over Other Property - 1,216 - 1,216
Other Security - 1,061 - 1,061
No Security - - 15,872 15,872
TOTAL 79,586 7,032 15,872 102,490

Annual Report | 2014-15Greater Building Society 5857
LOANS
Effect of Collateral – Past Due But Not Impaired 2014 – Society
Fully Secured
$’000
Partially Secured
$’000
Unsecured
$’000
Total
$’000
Mortgage Over Residential Property 66,306 4,888 - 71,194
Mortgage Over Other Property 688 184 - 872
Other Security 972 198 - 1,170
No Security - - 16,277 16,277
TOTAL 67,966 5,270 16,277 89,513
LOANS THAT ARE IMPAIRED
The following table shows the gross amount of impaired loans, along with the provision for impairment and assessment of the coverage provided by collateral held in support of impaired loans. The classification of a loan as ‘Fully Secured’, ‘Partially Secured’ and ‘Unsecured’ is on the same basis as the loans past due but not impaired.
LOANS
Effect of Collateral – Impaired Loans 2015 – Consolidated
Fully Secured
$’000
Partially Secured
$’000
Unsecured
$’000
Total
$’000
Mortgage Over Residential Property - 2,165 - 2,165
Mortgage Over Other Property - - - -
Other Security - 117 - 117
No Security - - 833 833
TOTAL - 2,282 833 3,115
Impairment Provision - (393) (726) (1,119)
Carrying Amount - 1,889 107 1,996
LOANS
Effect of Collateral – Impaired Loans 2014 – Consolidated
Fully Secured
$’000
Partially Secured
$’000
Unsecured
$’000
Total
$’000
Mortgage Over Residential Property - 2,183 - 2,183
Mortgage Over Other Property - - - -
Other Security - 58 - 58
No Security - - 735 735
TOTAL - 2,241 735 2,976
Impairment Provision - (346) (685) (1,031)
Carrying Amount - 1,895 50 1,945
Notes to and Forming Part of the Financial Statementsfor the year ended 30 June 2015
LOANS
Effect of Collateral – Impaired Loans 2015 – Society
Fully Secured
$’000
Partially Secured
$’000
Unsecured
$’000
Total
$’000
Mortgage Over Residential Property - 2,165 - 2,165
Mortgage Over Other Property - - - -
Other Security - 117 - 117
No Security - - 833 833
TOTAL - 2,282 833 3,115
Impairment Provision - (393) (726) (1,119)
Carrying Amount - 1,889 107 1,996
LOANS
Effect of Collateral – Impaired Loans 2014 – Society
Fully Secured
$’000
Partially Secured
$’000
Unsecured
$’000
Total
$’000
Mortgage Over Residential Property - 2,183 - 2,183
Mortgage Over Other Property - - - -
Other Security - 58 - 58
No Security - - 735 735
TOTAL - 2,241 735 2,976
Impairment Provision - (346) (685) (1,031)
Carrying Amount - 1,895 50 1,945
E LIQUIDITY RISK
The consolidated entity’s liquidity risk arises from the risk that the consolidated entity will encounter difficulties in financing its obligations associated with financial liabilities.
The consolidated entity manages liquidity risk by maintaining sufficient cash and highly marketable securities to not only respond to expected cash flow events but also to provide for a range of unexpected cash flow events. The consolidated entity has established policy limits around the minimum level of liquidity and the quality of liquid assets that it holds for liquidity management purposes.
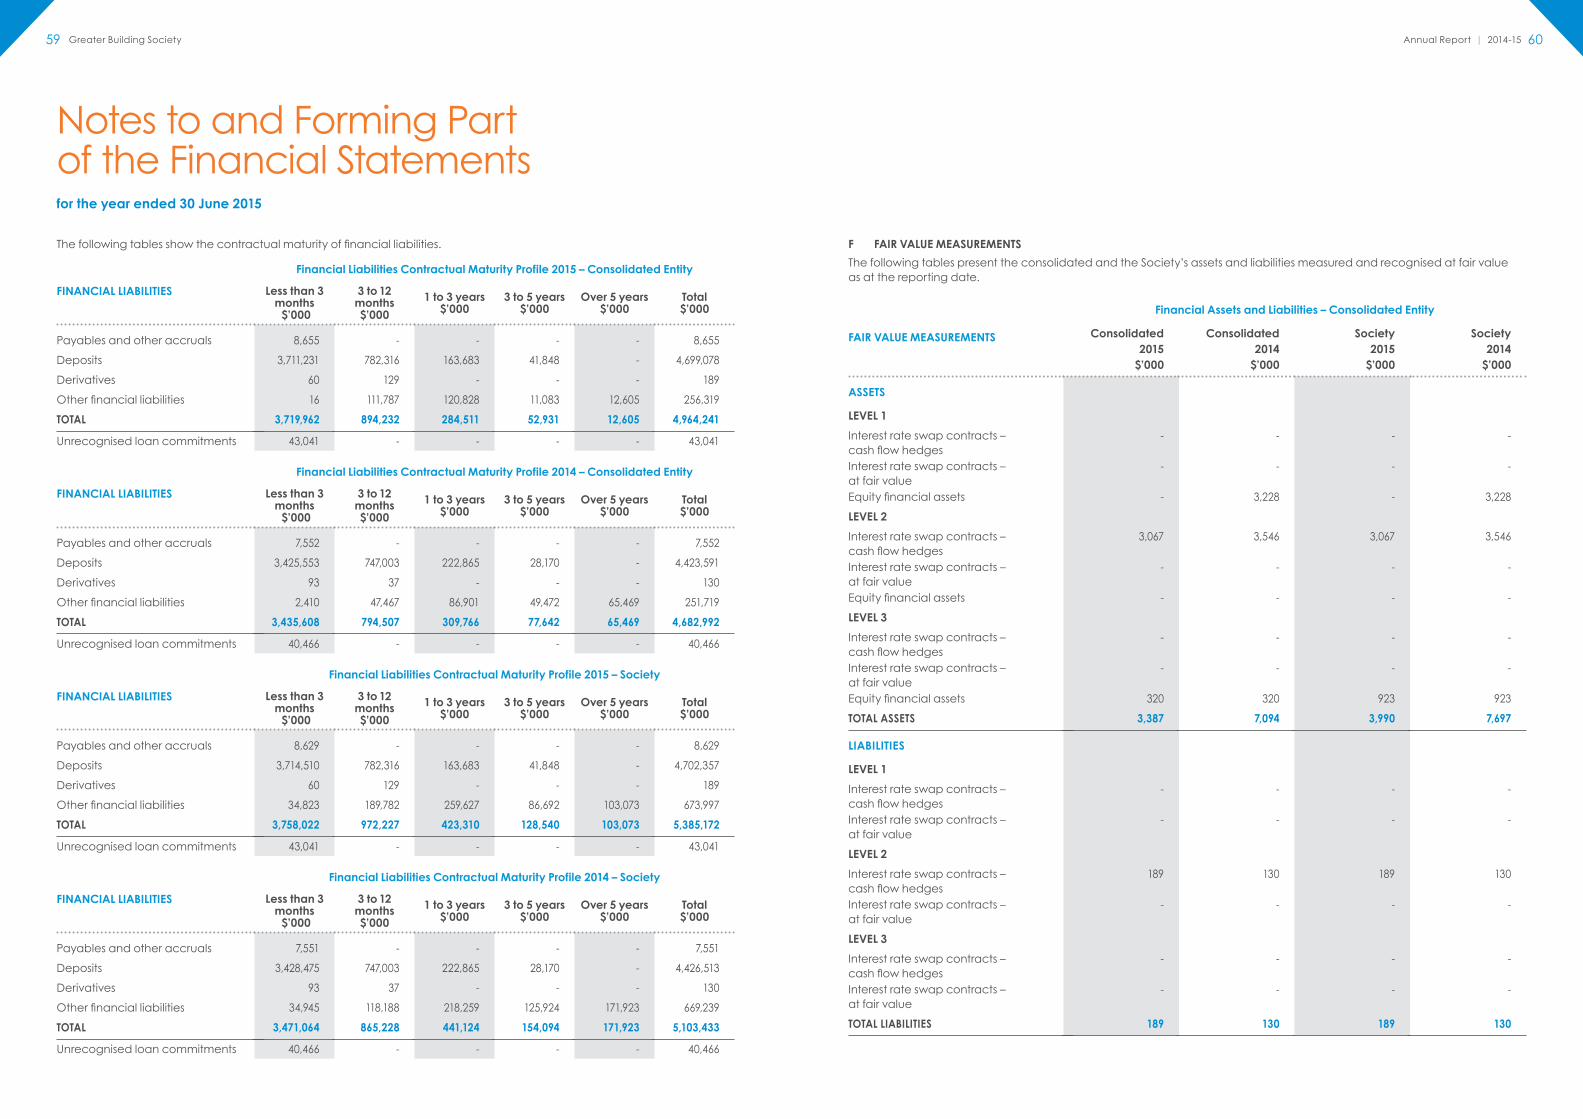
Annual Report | 2014-15Greater Building Society 6059
Notes to and Forming Part of the Financial Statementsfor the year ended 30 June 2015
The following tables show the contractual maturity of financial liabilities.
FINANCIAL LIABILITIES
Financial Liabilities Contractual Maturity Profile 2015 – Consolidated Entity
Less than 3 months $’000
3 to 12 months$’000
1 to 3 years$’000
3 to 5 years$’000
Over 5 years$’000
Total$’000
Payables and other accruals 8,655 - - - - 8,655
Deposits 3,711,231 782,316 163,683 41,848 - 4,699,078
Derivatives 60 129 - - - 189
Other financial liabilities 16 111,787 120,828 11,083 12,605 256,319
TOTAL 3,719,962 894,232 284,511 52,931 12,605 4,964,241
Unrecognised loan commitments 43,041 - - - - 43,041
FINANCIAL LIABILITIES
Financial Liabilities Contractual Maturity Profile 2014 – Consolidated Entity
Less than 3 months $’000
3 to 12 months$’000
1 to 3 years$’000
3 to 5 years$’000
Over 5 years$’000
Total$’000
Payables and other accruals 7,552 - - - - 7,552
Deposits 3,425,553 747,003 222,865 28,170 - 4,423,591
Derivatives 93 37 - - - 130
Other financial liabilities 2,410 47,467 86,901 49,472 65,469 251,719
TOTAL 3,435,608 794,507 309,766 77,642 65,469 4,682,992
Unrecognised loan commitments 40,466 - - - - 40,466
FINANCIAL LIABILITIES
Financial Liabilities Contractual Maturity Profile 2015 – Society
Less than 3 months $’000
3 to 12 months$’000
1 to 3 years$’000
3 to 5 years$’000
Over 5 years$’000
Total$’000
Payables and other accruals 8,629 - - - - 8,629
Deposits 3,714,510 782,316 163,683 41,848 - 4,702,357
Derivatives 60 129 - - - 189
Other financial liabilities 34,823 189,782 259,627 86,692 103,073 673,997
TOTAL 3,758,022 972,227 423,310 128,540 103,073 5,385,172
Unrecognised loan commitments 43,041 - - - - 43,041
FINANCIAL LIABILITIES
Financial Liabilities Contractual Maturity Profile 2014 – Society
Less than 3 months $’000
3 to 12 months$’000
1 to 3 years$’000
3 to 5 years$’000
Over 5 years$’000
Total$’000
Payables and other accruals 7,551 - - - - 7,551
Deposits 3,428,475 747,003 222,865 28,170 - 4,426,513
Derivatives 93 37 - - - 130
Other financial liabilities 34,945 118,188 218,259 125,924 171,923 669,239
TOTAL 3,471,064 865,228 441,124 154,094 171,923 5,103,433
Unrecognised loan commitments 40,466 - - - - 40,466
F FAIR VALUE MEASUREMENTS
The following tables present the consolidated and the Society’s assets and liabilities measured and recognised at fair value as at the reporting date.
FAIR VALUE MEASUREMENTS
Financial Assets and Liabilities – Consolidated Entity
Consolidated2015
$’000
Consolidated2014
$’000
Society2015
$’000
Society2014
$’000
ASSETS
LEVEL 1
Interest rate swap contracts – cash flow hedges
- - - -
Interest rate swap contracts – at fair value
- - - -
Equity financial assets - 3,228 - 3,228
LEVEL 2
Interest rate swap contracts – cash flow hedges
3,067 3,546 3,067 3,546
Interest rate swap contracts – at fair value
- - - -
Equity financial assets - - - -
LEVEL 3
Interest rate swap contracts – cash flow hedges
- - - -
Interest rate swap contracts – at fair value
- - - -
Equity financial assets 320 320 923 923
TOTAL ASSETS 3,387 7,094 3,990 7,697
LIABILITIES
LEVEL 1
Interest rate swap contracts – cash flow hedges
- - - -
Interest rate swap contracts – at fair value
- - - -
LEVEL 2
Interest rate swap contracts – cash flow hedges
189 130 189 130
Interest rate swap contracts – at fair value
- - - -
LEVEL 3
Interest rate swap contracts – cash flow hedges
- - - -
Interest rate swap contracts – at fair value
- - - -
TOTAL LIABILITIES 189 130 189 130

Annual Report | 2014-15Greater Building Society 6261
The fair value of financial assets and liabilities traded in active markets (such as publicly traded equity financial assets) is based on quoted market prices at the end of the reporting period. The quoted market price used for financial assets held by the consolidated entity is the current bid price. These instruments are included in level 1.
The fair value of financial assets and liabilities that are not traded in an active market (for example over-the-counter derivatives) is determined using valuation techniques. The consolidated entity uses a variety of methods and makes assumptions that are based on market conditions existing at the end of each reporting period. The fair value of interest rate swaps is calculated as the present value of estimated future cash flows. These instruments are included in level 2.
During the financial reporting period no assets or liabilities were transferred between categories.
Level 3 financial assets and liabilities are investments in non-listed entities, including controlled entities as set out in Note 13. These investments are illiquid and include non-traded shares and units in unit trusts where there are no reliable inputs that can be used to estimate a fair value. The Society therefore measures these investments at cost, which is supported by the net tangible assets of the entities invested in exceeding the cost value of the shares. The carrying value of level 3 financial assets and liabilities has not changed during the financial year.
32. CAPITAL MANAGEMENT
The consolidated entity has established a Capital Management Policy and Internal Capital Adequacy Assessment Process (ICAAP) Summary Statement. Their objectives are to ensure that the consolidated entity and the Society both maintain a level of capital that is:
• consistent and appropriate to the risks the consolidated entity and the Society is exposed to from its activities;
• sufficient to provide a buffer to absorb any unanticipated losses from its activities and, in the event of any major problem, enable it to continue operating while the problem is being addressed; and
• sufficient to provide depositors and creditors confidence that the consolidated entity and the Society will continue to honour its obligations to them.
The above policies are consistent with the requirements of the Prudential Standards issued by the Australian Prudential Regulation Authority (APRA).
The consolidated entity and the Society are required by APRA to measure and report capital on a risk weighted basis in accordance with the requirements of the Prudential Standards (known as ‘capital adequacy’). APRA requires the consolidated entity and Society to maintain minimum levels of capital to risk weighted assets. The consolidated entity and Society have met the capital requirements imposed by the Prudential Standards throughout the current and previous financial year. The Board has a policy of imposing an additional level of capital above the minimum required by APRA.
Capital adequacy is measured as a ratio of capital to risk weighted assets. Capital is split into two tiers. Common Equity Tier 1 is generally retained earnings, a portion of the property reserves, reserve balances available for general use and other regulatory adjustments relating to items that are included in equity but are treated differently for capital adequacy purposes. It excludes the fair value assets through other comprehensive income reserve. Tier 2 capital includes qualifying subordinated liabilities and the credit loss reserve.
The Society and consolidated entity has adopted the standardised approach for measuring credit and operational risk. Credit risk is measured based on allocating weightings to assets that seek to reflect the varying levels of risk associated to on balance sheet assets and off balance sheet exposures. Operational risk is measured based on risk weighting the investment and lending portfolios, plus each significant non-interest income source.
The consolidated entity capital results can be viewed at:
www.greater.com.au/About-Us/Regulatory-Disclosures/Regulatory-Disclosures.aspx
These results are unaudited, but are consistent with the consolidated entity’s prudential reporting requirements.
33. COMPANY DETAILS
The Greater Building Society Ltd (ABN 88 087 651 956) is a company limited by shares and guarantee, incorporated and domiciled in Australia. The registered office and principal place of business is:
Greater Building Society Ltd
103 Tudor Street
Hamilton NSW 2303
The financial report was authorised for issue by the Directors on the 22nd day of September 2015. The Directors have the power to amend and reissue the financial report.
Notes to and Forming Part of the Financial Statementsfor the year ended 30 June 2015
This page has been intentionally left blank

Annual Report | 2014-15Greater Building Society 6463
This page has been intentionally left blankThis page has been intentionally left blank
