2015 investor briefing -strategy day - woodside · pdf filesales strategy japan focus enhanced...
TRANSCRIPT
21 May 2015 | Melbourne
2015 Investor Briefing - Strategy Day

This presentation contains forward looking statements that are subject to risk factors associated with oil and gas businesses. It is believed that the expectations reflected in these statements are reasonable as at the date of this presentation but they may be affected by a variety of variables and changes in underlying assumptions which could cause actual results or trends to differ materially, including but not limited to: price fluctuations, actual demand, currency fluctuations, drilling and production results, reserve estimates, loss of market, industry competition, environmental risks, physical risks, legislative, fiscal and regulatory developments, economic and financial market conditions in various countries and regions, political risks, project delay or advancement, approvals and cost estimates. Readers are cautioned not to place undue reliance on these forward looking statements. No representation is made or will be made that any forward looking statements will be achieved or will prove to be correct. We do not undertake to update or revise any forward looking statement, whether as a result of new information, future events or otherwise.
All references to dollars, cents or $ in this presentation are to US currency, unless otherwise stated.
References to “Woodside” may be references to Woodside Petroleum Ltd. or its applicable subsidiaries.
Disclaimer and important notice
2015 Investor Briefing - Strategy Day 2

Housekeeping – Park Hyatt floor plan – Evacuation procedure
2015 Investor Briefing - Strategy Day 3
Exit here to St Andrews Place
Alert: Beep Beep
Evacuate: Whoop Whoop

Housekeeping – Assembly point
2015 Investor Briefing - Strategy Day 4
Exit onto St Andrews Place
Turn right after Parliament Place
Muster point is near the Great Petition statue
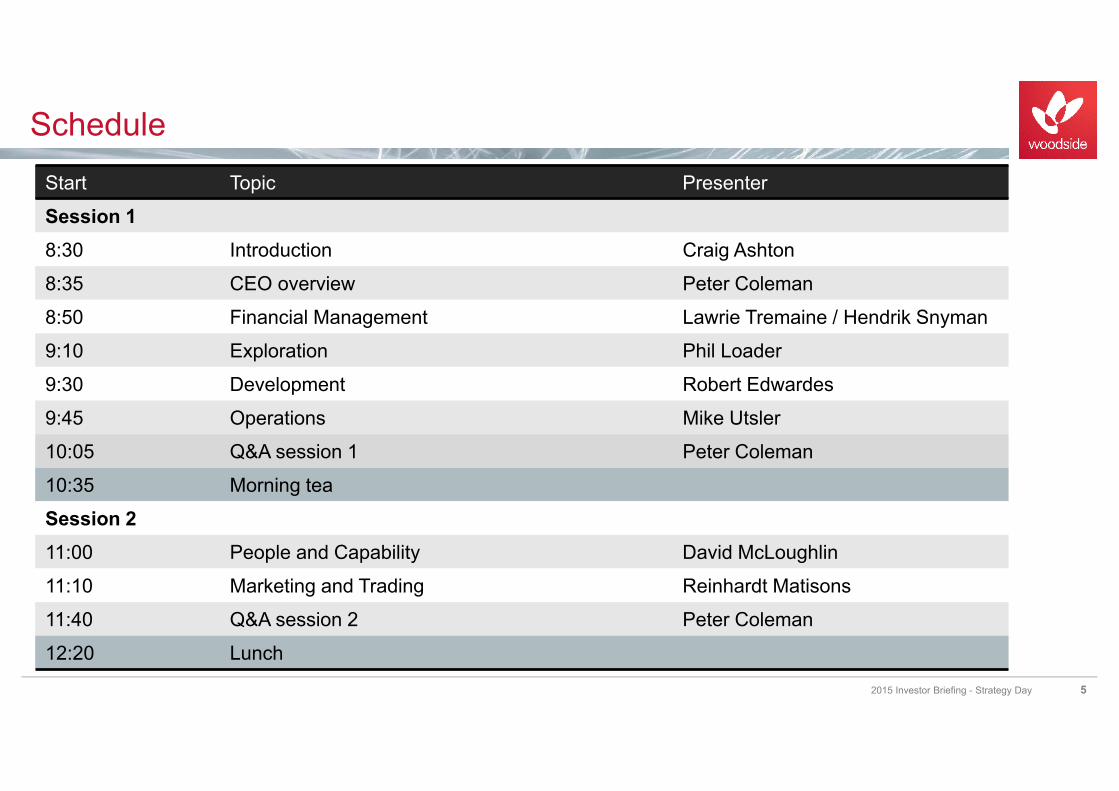
Schedule
2015 Investor Briefing - Strategy Day 5
Start Topic Presenter
Session 18:30 Introduction Craig Ashton
8:35 CEO overview Peter Coleman
8:50 Financial Management Lawrie Tremaine / Hendrik Snyman
9:10 Exploration Phil Loader
9:30 Development Robert Edwardes
9:45 Operations Mike Utsler
10:05 Q&A session 1 Peter Coleman
10:35 Morning tea
Session 211:00 People and Capability David McLoughlin
11:10 Marketing and Trading Reinhardt Matisons
11:40 Q&A session 2 Peter Coleman
12:20 Lunch

Peter Coleman | Chief Executive Officer and Managing Director
CEO overview

Our strategy is built on three related themes, is effective and unchanged
Strategy
2015 Investor Briefing - Strategy Day 7
Grow our portfolio
Leverage our capabilities
Maximise core business
Maximising operational effectiveness; continuous improvement culture Extending life of producing assets Developing contingent resources
LNG: full value chain Deep-water: drilling, FPSO’s, subsea technology Asia: market, relationships
Fill opportunity portfolio to provide: Diversity and ability to optimise Value chain opportunities
Aggregate positions around existing focus areas: Rebalancing exploration portfolio Acquisition of high quality assets in low oil price environment

Journey so far ….
2015 Investor Briefing - Strategy Day 8
Our strategy is transforming the business
Exploring Developing Producing Marketing Trading Acquisition
North West Australia focused
Expanded global
exploration portfolio
Best ever safety performance
World class LNG reliability
Point-to-point sales strategy
Japan focus
Enhanced marketing capabilities
Transition to portfolio seller
Limited M&A activity
Executed >$5.5 billion of transactions
(~20% of market cap)¹
From June 2011…
…to now
Browse FLNG
approaching FEED
1. Sold down Browse equity; exited Gulf of Mexico, exited Mutineer Exeter, purchased Wheatstone, Balnaves and Kitimat interests.
Safety performance lags industry
Pluto LNG behind scheduleBrowse onshore
development challenged

Browse FEED1 entry expected mid 2015
Wheatstone targeting first gas in late 20162
Kitimat: appraisal of upstream - cost reductions targeted
Greater Enfield: accelerating FEED to capture market conditions
Exploration: drilling high impact potential prospects in next 18 months
Acquisitions, capitalising on low price environment
Future
2015 Investor Briefing - Strategy Day 9
Triggers for near-term value growth
Grow our portfolio
Low price environment provides opportunity for entry into value adding opportunities
1. FEED = front-end engineering and design2. Source: Chevron. As at April 2015

Credit ratings reaffirmed, stable outlook Target dividend pay out ratio unchanged Refinanced balance sheet at improved terms in low oil price environment Continued focus on growth, and maintaining returns
Summary
2015 Investor Briefing - Strategy Day 10
Strong financial position
Future focus Aggregating opportunities in existing focus areas Providing strong yield with growth optionality De-risked future growth through Wheatstone acquisition Added upside with Kitimat purchase Organic growth through Browse and Greater Enfield Additional upside through exploration, acquisition, marketing and trading

Financial managementLawrie Tremaine | Chief Financial Officer

A year of record financial and operating performance
2014 results
2015 Investor Briefing - Strategy Day 12
Record production 95.1 MMboe
Strong financial result
Reported NPAT $2.4 billion
Return on equity 15.3%
Free cash flow1 $4.2 billion
Record full year dividend US 255 cents per share
$6.8 billion of liquidity
Cash $3.2 billion
Undrawn debt $3.6 billion
1. Operating less investing cash flows 12

Strong operating cash flows and low investment spend leading into period of low oil price
Financial trends
2015 Investor Briefing - Strategy Day 13
0
1000
2000
3000
4000
5000
2010 2011 2012 2013 2014
$ m
illion
Operating cash flow
0
1000
2000
3000
4000
5000
2010 2011 2012 2013 2014
$ m
illion
Investment spend
-10
0
10
20
30
2010 2011 2012 2013 2014
Perc
enta
ge (%
)
Gearing
0
100
200
300
2010 2011 2012 2013 2014
US
Cen
ts
Dividends per share
13

0
5
10
15
20
25
2009 2010 2011 2012 2013 2014
Perc
ent (
%)
ROACE¹
Woodside Peer group average
Relative investment performance
2015 Investor Briefing - Strategy Day 14
First quartile returns from world class asset portfolio
Returns well in excess of cost of capital and peers
Reflects:
World class asset portfolio
Disciplined investment decisions
1. Source: IHS data and methodology; ROACE equals (EBIT / (Average Equity + Average Non-Current Liabilities)) 2. Anadarko, Apache, BG, ENI, Hess, Marathon, Murphy, Oil Search, Origin, Pioneer, Santos, Statoil, Repsol, Talisman, Tullow
WPL construction period
2
14
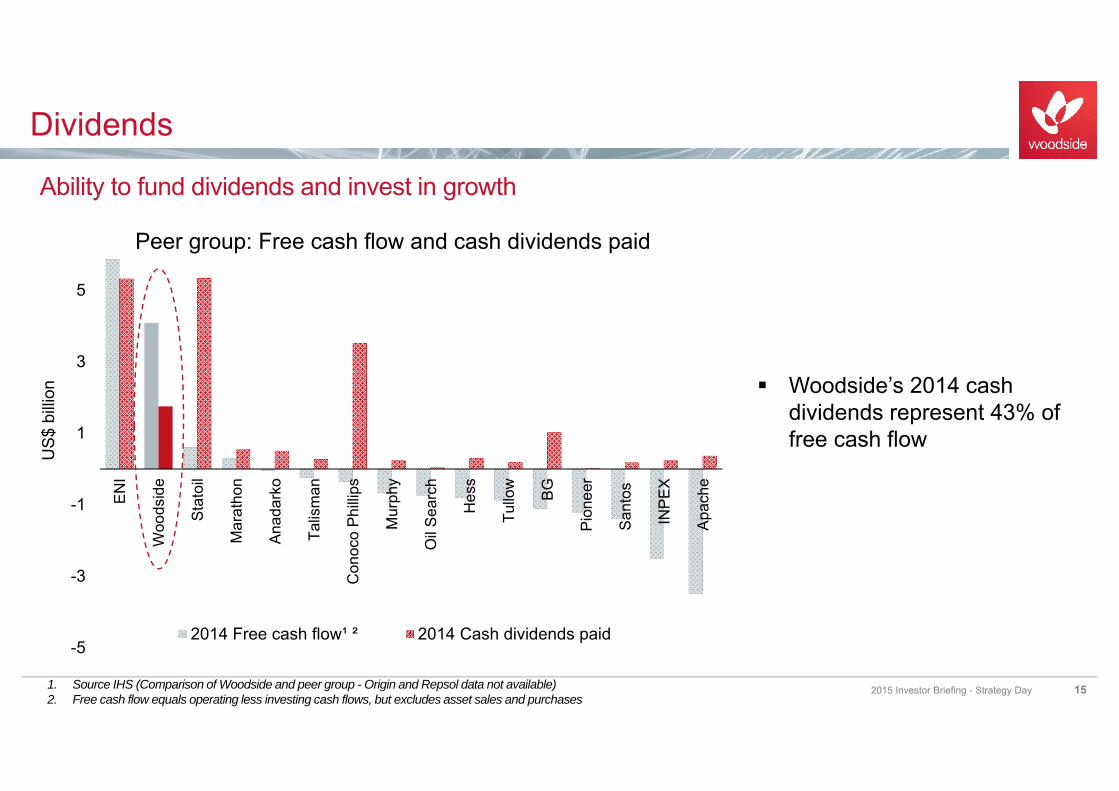
Dividends
2015 Investor Briefing - Strategy Day 15
Ability to fund dividends and invest in growth
1. Source IHS (Comparison of Woodside and peer group - Origin and Repsol data not available)2. Free cash flow equals operating less investing cash flows, but excludes asset sales and purchases
-5
-3
-1
1
3
5
ENI
Woo
dsid
e
Stat
oil
Mar
atho
n
Anad
arko
Talis
man
Con
oco
Philli
ps
Mur
phy
Oil
Sear
ch
Hes
s
Tullo
w
BG
Pion
eer
Sant
os
INPE
X
Apac
he
US$
billi
on
Peer group: Free cash flow and cash dividends paid
2014 Free cash flow¹ ² 2014 Cash dividends paid
Woodside’s 2014 cash dividends represent 43% of free cash flow
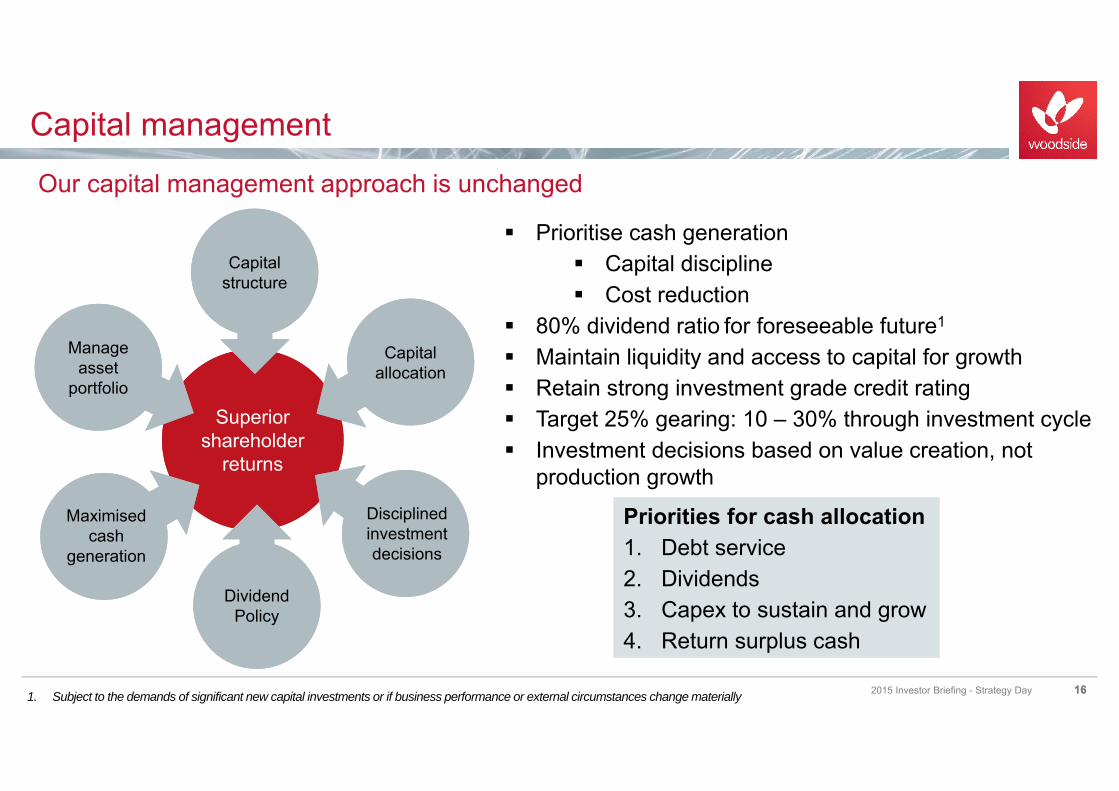
Prioritise cash generation Capital discipline Cost reduction
80% dividend ratio for foreseeable future1
Maintain liquidity and access to capital for growth Retain strong investment grade credit rating Target 25% gearing: 10 – 30% through investment cycle Investment decisions based on value creation, not
production growth
Capital management
2015 Investor Briefing - Strategy Day 16
Our capital management approach is unchanged
1. Subject to the demands of significant new capital investments or if business performance or external circumstances change materially
Priorities for cash allocation1. Debt service2. Dividends3. Capex to sustain and grow4. Return surplus cash
Superior shareholder
returns
Superior shareholder
returns
Dividend Policy
Dividend Policy
Manage asset
portfolio
Manage asset
portfolio
Capital structureCapital
structure
Maximised cash
generation
Disciplined investment decisions
Capital allocation
16

Contract portfolio provides protection in a low oil price environment
2015 LNG sales volume mix forecast to comprise: Contracted: >90% Spot: up to 10%
Current spot exposure for 2016 forecast: up to 10%
LNG revenue sensitivities
2015 Investor Briefing - Strategy Day 1717
Not a direct linear relationship between Brent oil price and LNG revenue
1. Assumes a mix of DES and FOB sales; excludes spot sales and traded volumes; assumes current provisional pricing where contract pricing is under review; assumes no volume flexibilities are exercised
2. LNG revenue is largely indexed to Japanese Custom Cleared (JCC) which has an approximate four month lag to Brent price
10
20
30
40
50
60
70
80
90
100
10 20 30 40 50 60 70 80 90 100
LNG
reve
nue
(US$
/boe
)
Brent oil price (US$/barrel)
Woodside contracted LNG revenue1 sensitivity to Brent price(applicable 2015 only)
Oil parity

Gas unit gross cash margins
2015 Investor Briefing - Strategy Day 18
Gas business remains cash positive even at low oil prices
2015 gross cash costs² $9 to $12/boe
Gas business compromises between 85 to 90% of total sales volumes
1. Gas includes LNG, LPG, pipeline natural gas and condensate2. Gross cash costs represent cost of sales less non-cash items (depreciation and amortisation and stock movement)
18
10
20
30
40
50
60
10 20 30 40 50 60 70 80 90 100
US$
/sal
es b
oe
Brent oil price (US$/barrel)
Woodside gas¹ unit gross cash margins at differentBrent prices (applicable 2015 only)

Operating cash flow expected to average approximately $2.7 billion per annum for the next four years
Adequate cash flow to fund expected dividend and investment expenditure
Operating cash flow
2015 Investor Briefing - Strategy Day 19
Significant operating cash flow generated at low oil prices ($65/bbl flat nominal Brent)
191. Based on current asset portfolio and $65/bbl flat nominal Brent oil price
0
1000
2000
3000
4000
5000
6000
2010 2011 2012 2013 2014 Average peryear 2015 -
2018E¹
US$
milli
on
Operating cash flow

0
1000
2000
3000
4000
5000
2014 2015E¹ 2015E¹ Acquiredassets
Average per year2016 - 2018E¹
US$
milli
on
Investment Expenditure
Sustaining and life extension² WheatstoneExploration BrowseOther growth Kitimat
Committed2 expenditure less than $500 million per annum
Flexibility to pace developments:
To take advantage of market conditions
To fund acquisitions
Wheatstone forecast expenditure unchanged from purchase economics
Investment expenditure
2015 Investor Briefing - Strategy Day 201. Based on current asset portfolio. Sustaining and life extension capital expenditure does not develop additional reserves2. Committed expenditure is expenditure on projects post final investment decision, sustaining and life extension expenditure and some exploration expenditure
Low committed expenditure provides flexibility
20
Closing adjustment ~$0.9b
Purchase price $2.75b
Committed2
Uncommitted

Funding
2015 Investor Briefing - Strategy Day 21
Strong ongoing debt market support
$2.75 billion raised from bond and bank markets in 2015 to date
Pre-tax portfolio cost of debt lower:
from 3.4% p.a. May 2014
to 2.6% p.a. May 2015
Liquidity provides optionality
Low cost access to diverse capital markets
Portfolio cost based on Margin + 3m Libor for floating rate debt 21
0
500
1000
1500
2000
2500
US$
milli
on
Debt maturity profile
Drawn facilities Undrawn facilities
30 April 2015 US$ billions
Cash 0.2
Undrawn debt 3.3
Total 3.5

On target to achieve $800 million in benefits by end 2016
$560 million benefits realised in 2014
Low oil price makes achieving structural change in costs critical
2015 redundancies – organisational savings now at ~20%
Cultural change in progress
Productivity
2015 Investor Briefing - Strategy Day 22
Aggressive cost and reliability management to deliver enduring value
2016 Target
+3 to 5%
-10 to -20%
-10 to -20%
-10 to -20%
2014 result
+5%
-13% opex -10% capex
>300 executed improvements
-8% roles
22

Key messages
2015 Investor Briefing - Strategy Day 23
The focus remains on creating shareholder value
No change to capital management approach
Continuing to generate significant operating cash in a low oil price environment
Maintaining dividend payout ratio
Accelerating cost reduction and reliability improvements
Flexibility in balance sheet to invest in growth
23
Hendrik Snyman | Senior Vice President Spend Reduction Initiative
Cost reduction program

Aggressive cost reduction
2015 Investor Briefing - Strategy Day 2525
Accelerate delivery of external spend reduction with sustainable outcomes
Outstanding: ~A$650M
Good: ~A$300MGreat: ~A$450M
TargetedTarget Deliver A$680 million of savings
In excess of 500 initiatives, >100 initiatives delivered
A$200 million executed to date
Objective Delivery of structural changes to costs
Values are presented in terms of gross joint venture operated expenditure in Australian dollars.
A$ m
illion
InitiativePlannedBanked
2016 Target
-10 to 20%
2014 result-13% opex-10% capex
Value of initiative pipeline by stage-gate, A$M Gross

Value levers
2015 Investor Briefing - Strategy Day 2626
Addressing all value levers to reduce external spend
Distribution of initiatives per value lever, % of program
Price Process Demand
>500 initiatives
Price (reduction in rates/contract prices) Target >10% across all spend
Demand (reduce/eliminate the requirement for a product/service) Woodside standards streamlined and aligned with industry
Process (simplify the way we conduct business) Consolidating vendor base from over 3,000 to ~800 for
Australia base business

Cost reduction example
2015 Investor Briefing - Strategy Day 2727
Spend & savings overview
Components 2014 annual spend, A$m Savings
Chemicals/Gases
Fuels
Other
Total
40%
37%
21%
36%
MRO category drivers Deliver sustainable cost reduction Reduce vendor base Maximise transaction automation Rationalise product range Manage risk
33% saving on the Maintain Repair Operate (MRO) category
Current savings delivered: A$69 million (33%) Reduced valve suppliers from 80 to one Aligned consumables spend to industry
benchmarks Segregated FPSO chemicals ordering
process from onsite supplier210
60
20
50
80
Valves
33%
Values are presented in terms of gross joint venture operated expenditure in Australian dollars.

Key messages
2015 Investor Briefing - Strategy Day 2828
Committed to deliver a structural cost change
Utilising all value levers assures a sustainable reduction
Meaningful impact in the short term
Phil Loader | Executive Vice President Global Exploration
Global Exploration

USA
Portfolio 2012Focused on Australian mature basins
Portfolio build
2015 Investor Briefing - Strategy Day 30
Peru
Myanmar
Tanzania
Republic of Korea
New Zealand
Gabon
Cameroon
Australia
Canada Morocco
Gas prone basin
Oil prone basin
Oil or Gas basin Eight new country entries, 31 new licences
Ireland
Spain
New country entries
2012 Portfolio
Expanded global footprint in emerging petroleum systems

Balancing the portfolio
2015 Investor Briefing - Strategy Day 31
Time / drilling density
Cum
ulat
ive
reso
urce
dis
cove
red
Frontier no proven petroleum system
Emerging / Immature high impact exploration highly material with repeatability petroleum system proven limited drilling
Proven / Maturing lower risk required competitive advantage
Mature infrastructure led high value if you own infrastructure
Exploration growth focused on emerging basins, with enhanced oil and gas balance
Based on Leads and Prospects inventory
Gas Countries
Oil Countries
Oil or Gas Countries

Focus areas
2015 Investor Briefing - Strategy Day 32
Sub-Saharan Africa
GabonTanzania
Cameroon
Australia and Asia-Pacific
Ireland
MoroccoSpain
Canada
Peru
Atlantic Margins and Latin America
Myanmar
Australia
New Zealand
Republic of Korea
Building inventory in oil prone unexplored/under-explored
emerging petroleum systems
Building footprint in oil prone under-explored
plays
Maximising Australia and extending the core in
material gas prone regions
2015: Develop existing acreage, core area aggregation and portfolio growth
Gas prone basin
Oil prone basin
Oil or Gas basin

Focus area 1: Australia and Asia-Pacific
2015 Investor Briefing - Strategy Day 33
Pyxis-1 Gas discovery in Q2/2015
2015 - drill three play-opening wells in Australia, Republic of Korea and Myanmar
Build inventory with new seismic in New Zealand and Myanmar
Woodside exposed to multi-Tcf resource potential
Myanmar
Republic of Korea
Australia
New Zealand
Maximising Australian acreage and extending the core in material gas prone regions
Well
3D Seismic
2D Seismic2D
3D
2D 3D
3D
(2016)
Country Prospect Size*
Australia Malaguti Large
Republic of Korea Hongge Large
Myanmar Saung Large
* Large = 100 to 400 MMboe
Gas prone basin
Oil prone basin
Oil or Gas basin

Republic of Korea
High specification 3D acquisition and processing
Hongge prospect identified with Direct Hydrocarbon Indicators
Hongge-CJujak-1
Muneo 3DLine of Section
Amplitude shutoff
Hongge prospect
Muneo 3D broadseis
Nakji 2D
Top reservoir
Top reservoir
Advanced 3D acquisition leads to 2015 drilling
2015 Investor Briefing - Strategy Day 34

Scale of opportunity 6 permits, 46,000km2 (~20% of Woodside’s
global exploration acreage)
Strategic basin position early mover advantage partnered for strength phased exploration program
Path to value Myanmar domestic gas growing Asian gas markets
The largest acreage holder in the Rakhine Basin
Myanmar
2015 Investor Briefing - Strategy Day 35
Saung well (2015)
A-7
A-4
A-6
AD-2
AD-7
AD-5Gas Pipeline
Oil FieldsGas Fields
Woodside TitlesPlay Trends
AD-7 well (2016)

Focus area 2: Atlantic Margins and Latin America
2015 Investor Briefing - Strategy Day 36
Canada (Nova Scotia)
Ireland
Spain (Canaries)
Peru
Morocco
Building a strategic footprint in oil prone under-explored plays
2D Seismic2D
2D
2D
3D Seismic3D
3D(2016)
Conjugate margins, under-explored plays
Strong evidence of working petroleum systems
Technology unlocking opportunity
Targeting multi-100MMbbl oil (Nova Scotia and Morocco) and multi-Tcf wet gas (Ireland)
Oil prone basin
Oil or Gas basin

Focus area 3: Sub-Saharan Africa
2015 Investor Briefing - Strategy Day 37
Oil prone Atlantic margin synergies
Under-explored plays in mature provinces
Drilling Cheetah-1 well in Cameroon in Q3 2015
Focus on portfolio aggregation
37
Cameroon
Gabon Tanzania
Building inventory in oil prone unexplored and under-explored emerging petroleum systems
Well
2D Seismic
Oil
2D
2D
3D Seismic3D
3D(2016)

Measures of success
2015 Investor Briefing - Strategy Day 38
Objective: Global Leader in Exploration by 2018
Measures Objective
Portfolio Scale and optionality to underpin year-on-year exploration success
Value Discipline to deliver consistent top-quartile value
Success rate > 25% commercial success rate
Discovered Resource > 120% production
Finding Costs Consistent top-quartile finding costs (< US$4/boe)

Rebalancing the portfolio, in terms of maturity, geographic focus, and oil / gas mix
Aggregating and high-grading targets in our three focus areas
Drilling an additional four wells in 2015 to test plays with material portfolio upside
Resuming international drilling as focus shifts to execution (Korea, Myanmar, Cameroon)
Maintaining a disciplined approach, underpinned by the competencies and culture to
succeed
Key messages
2015 Investor Briefing - Strategy Day 39

Bish Cove, Kitimat LNG site - Image courtesy of Chevron
DevelopmentRobert Edwardes | Executive Vice President Development
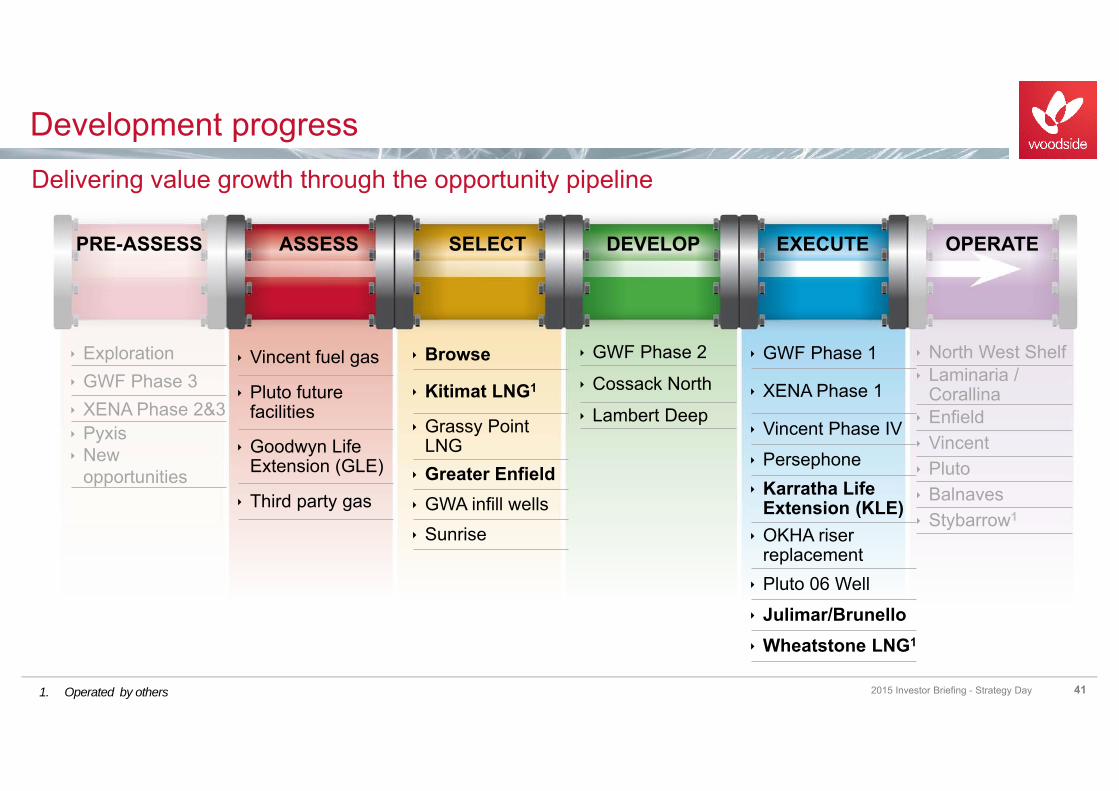
Vincent fuel gas
Pluto future facilities
Goodwyn Life Extension (GLE)
Third party gas
Browse
Kitimat LNG1
Grassy Point LNG Greater Enfield GWA infill wells Sunrise
GWF Phase 2
Cossack North
Lambert Deep
GWF Phase 1
XENA Phase 1
Vincent Phase IV Persephone Karratha Life
Extension (KLE) OKHA riser
replacement Pluto 06 Well Julimar/Brunello Wheatstone LNG1
North West Shelf Laminaria /
Corallina Enfield Vincent Pluto Balnaves Stybarrow1
Exploration GWF Phase 3 XENA Phase 2&3 Pyxis New
opportunities
PRE-ASSESS ASSESS SELECT DEVELOP EXECUTE OPERATE
Development progressDelivering value growth through the opportunity pipeline
1. Operated by others 2015 Investor Briefing - Strategy Day 41
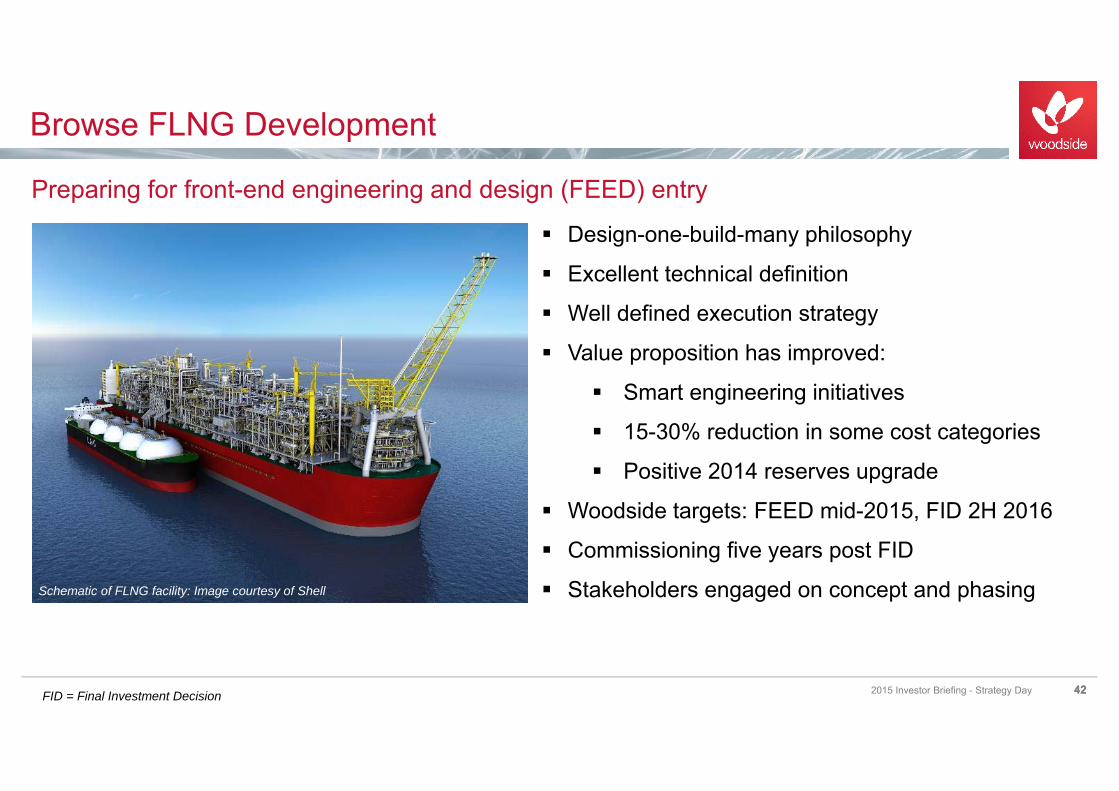
Design-one-build-many philosophy
Excellent technical definition
Well defined execution strategy
Value proposition has improved:
Smart engineering initiatives
15-30% reduction in some cost categories
Positive 2014 reserves upgrade
Woodside targets: FEED mid-2015, FID 2H 2016
Commissioning five years post FID
Stakeholders engaged on concept and phasing
Browse FLNG Development
2015 Investor Briefing - Strategy Day 4242
Preparing for front-end engineering and design (FEED) entry
Schematic of FLNG facility: Image courtesy of Shell
FID = Final Investment Decision

Oil development via Ngujima-Yin FPSO
Laverda and Cimatti reservoirs: 70MMboe recoverable volume (gross)
Previously marginal
Well and subsea costs comprise >90% of execution estimate
New approach delivering economic project
Targeting FID in 2016
Accelerating FEED gives potential savings from:
Lower rig and vessel market rates
Subsea equipment and installation synergies
Greater Enfield
2015 Investor Briefing - Strategy Day 4343
Accelerating FEED to capture market conditions
Schematic of FLNG facility: Image courtesy of Shell

Karratha Gas Plant life extension
2015 Investor Briefing - Strategy Day 44
Portfolio of refurbishment projects
Targeting external corrosion, obsolescence and ageing facilities
Efficient program management approach
10% complete; executing safely, efficiently and predictably
Average annual spend of $50-70 million net
44
Implementing efficient, cost conscious approach, no pre-investment
Primary marine facilities complete
LNG trains external corrosion complete
Pipeline gas trains external corrosion complete
LNG train life extension complete
External corrosion focus and KLE program definition
% c
ompl
ete
Circa 20252015
100
KLE activity timeline
KLE = Karratha Gas Plant life extension
10% complete

Wheatstone LNG Project
2015 Investor Briefing - Strategy Day 4545
Image courtesy of Shell
Wheatstone LNG Project 60% complete1
Topside float over completed 12 April 2015
Targeting first gas in late 20161
Woodside is operator of Julimar-Brunello upstream gas development, which ties into Wheatstone platform
Julimar-Brunello Project 60% complete, targeting completion mid 2016
Supporting Chevron in delivery of Wheatstone through our experience in LNG projects
1. Source: Chevron. As at April 2015
Wheatstone Platform float-over. Image courtesy of Chevron Australia

Kitimat LNG (50% equity)
2015 Investor Briefing - Strategy Day 4646
World-class resource
2 LNG trains, initial capacity 10 mtpa (5 mtpa net) Liard and Horn River Basins An advanced opportunity in Canada:
First Nations: Benefits agreement for Pacific Trail Pipeline in place
Current focus – Liard resource appraisal Concurrently:
Competitive fiscal framework Competitive project cost structure LNG market capture
Reviewing LNG plant costs: reductions targetedBish Cove, Kitimat LNG Site – Image courtesy of Chevron Canada

Liard and Horn River appraisal
2015 Investor Briefing - Strategy Day 4747
Focus on appraising the Liard resource
Liard and Horn River resources 10-40 Tcf net
Appraisal well data suggests recoveries of
~ 40 Bcf/well in the Liard Basin
~ 20 Bcf/well in the Horn River Basin
The first two horizontal wells in the Liard Basin will be completed and tested in 2H 2015
Liard North Pad – Image courtesy of Chevron Canada

Development enablers
2015 Investor Briefing - Strategy Day 48
Up to 40% lower rig and vessel rates Reduced cost through subsea tieback
campaign synergies Woodside standards now industry aligned
48
Taking advantage of low oil price environment to achieve capital cost reductions
2016 Target
-10 to 20%
2014 result -13% opex -10% capex
Xena example: Simplified to lower unit development cost Subsea cooler and manifold scope eliminated Well tied into existing Pluto infrastructure Schedule reduced and on track
Subsea installation in progress and under budget Campaign approach enhances efficiency
80%
90%
100%
110%
120%
130%
0%
50%
100%
150%
200%
250%
BOD entrySep 2012
FEED EntryFeb 2013
FID July2013
CurrentForecast
Cha
nge
in C
apex
, Res
ourc
es,
Uni
t Dev
elop
men
t Cos
t (U
DC
)
Cha
nge
in V
alue
(NPV
)
Xena Phase 1 Performance Metrics Movement
Value Capex Resource Volume UDC
Browse: proposing FEED entry based on robust business case in current environment
KLE: implementing efficient, cost conscious approach, average annual spend $50-70m net
Wheatstone: seeking opportunities to create additional value
Canada: appraising Liard resource in 2015
Driving down our unit development costs by at least 20%
Key messages
2015 Investor Briefing - Strategy Day 49
Mike Utsler | Executive Vice President and Chief Operating Officer
Operations

Value chain
2015 Investor Briefing - Strategy Day 5151
Supplier of choice Reliable supplier Trading capability
Maximise recovery Reservoir optimisation Drilling and well interventions
Underpinned by relentless focus on HSE and cost management
Increased volumes Reliability and capacity improvements Maintaining deliverability
Maximising value from reservoir to market
Reservoir
Wells
Platformsand FPSOs Plant Pipelines and
shipping
Customers
Pipeline

HSE performance
2015 Investor Briefing - Strategy Day 5252
Improving, on track to deliver world class HSE performance
Our best ever HSE performance in 2014
37% reduction in total recordable injury rate
50% reduction in process safety events
29% reduction in flaring
5
4
2
0
2
4
6
2012 2013 2014
Num
ber o
f eve
nts
Tier 1 and 2 process safety events
Tier 1 Tier 2
1. International Association of Oil and Gas Producers, 2014 data not available
0
0.2
0.4
0.6
0.8
1
2010 2011 2012 2013 2014
Per m
illion
hou
rs w
orke
d
Lost time injury frequency
Woodside IOGP¹ top quartile
0
1
2
3
4
5
6
2010 2011 2012 2013 2014
Per m
illion
hou
rs w
orke
d
Total recordable injury rate
0 0 0
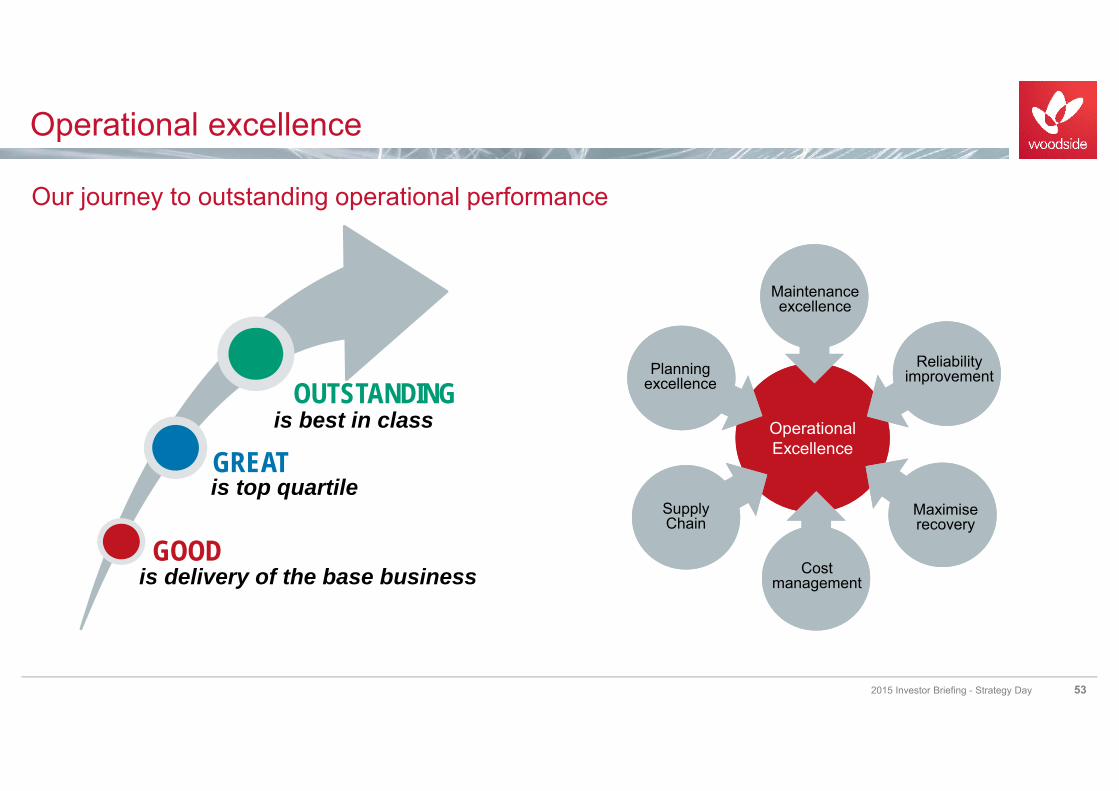
Operational excellence
2015 Investor Briefing - Strategy Day 53
Our journey to outstanding operational performance
Operational ExcellenceOperational Excellence
Supply ChainSupply Chain
Maintenance excellence
Planning excellence
Reliability improvement
Cost management
Maximise recovery
is best in class
is top quartile
is delivery of the base business
OUTSTANDING
GREAT
GOOD

Increased volumes
2015 Investor Briefing - Strategy Day 54
Achieved top quartile LNG reliability performance on NWS and Pluto in 2014
Oil performance improved, further gains in 2015
Facility optimisation through constraints management
Planned LNG capacity increases: potential 1 to 2% improvement on Pluto and NWS
54
Delivering on our productivity promises – reliability and capacity improvement
2016 Target +3 to 5%
2014 result +5% attributed
to reliability
50
60
70
80
90
100
2010 2011 2012 2013 2014
Mm
boe
Total production
80
85
90
95
100
2010 2011 2012 2013 2014 2015 2016+
Rel
iabi
lity
(%)
Reliability
OIL
LNG
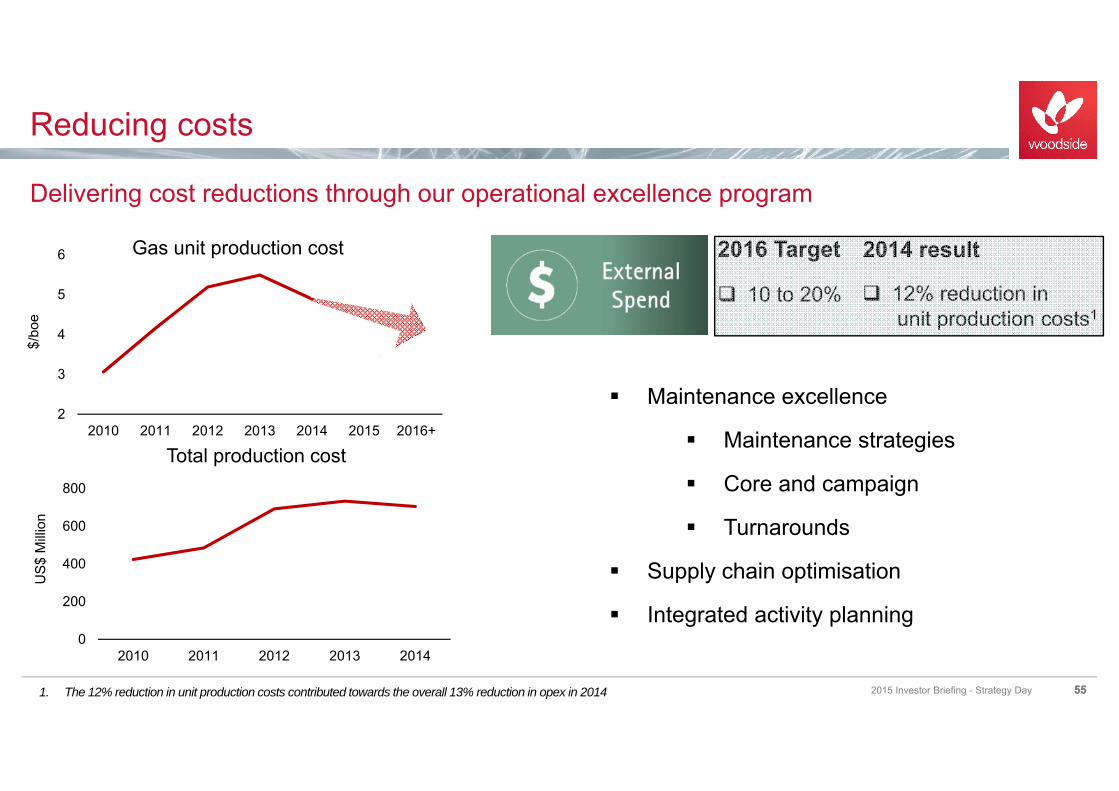
Reducing costs
2015 Investor Briefing - Strategy Day 5555
Delivering cost reductions through our operational excellence program
0
200
400
600
800
2010 2011 2012 2013 2014
US$
Milli
on
Total production cost
2016 Target
10 to 20%
2014 result
Maintenance excellence
Maintenance strategies
Core and campaign
Turnarounds
Supply chain optimisation
Integrated activity planning
2
3
4
5
6
2010 2011 2012 2013 2014 2015 2016+
$/bo
e
Gas unit production cost
12% reduction inunit production costs1
1. The 12% reduction in unit production costs contributed towards the overall 13% reduction in opex in 2014

North West Shelf post 2025
2015 Investor Briefing - Strategy Day 56
Maximise the value of the North West Shelf through plateau extension
Horizon 3
Horizon 2
2015 2020 2030
Horizon 1: Safe and reliable operations of the base business
Horizon 2: Disciplined project delivery to develop North West Shelf reserves
Horizon 3: Extend plateau beyond current reserves
Fortuna 3D seismic
Other resource owners
2025
Key messages
2015 Investor Briefing - Strategy Day 572014
Continue our journey to outstanding operational performance
Maximise value from reservoir to market
Relentless focus on HSE performance
Maximise volumes through reliability and capacity enhancement
Continue to deliver cost efficiencies
Delivering sustained value through continuous improvement
Leverage our capabilities and world-class assets

58
Question and AnswerPeter Coleman | CEO

59
Return at 11:00am AEST
Morning tea
Schedule
2015 Investor Briefing - Strategy Day 60
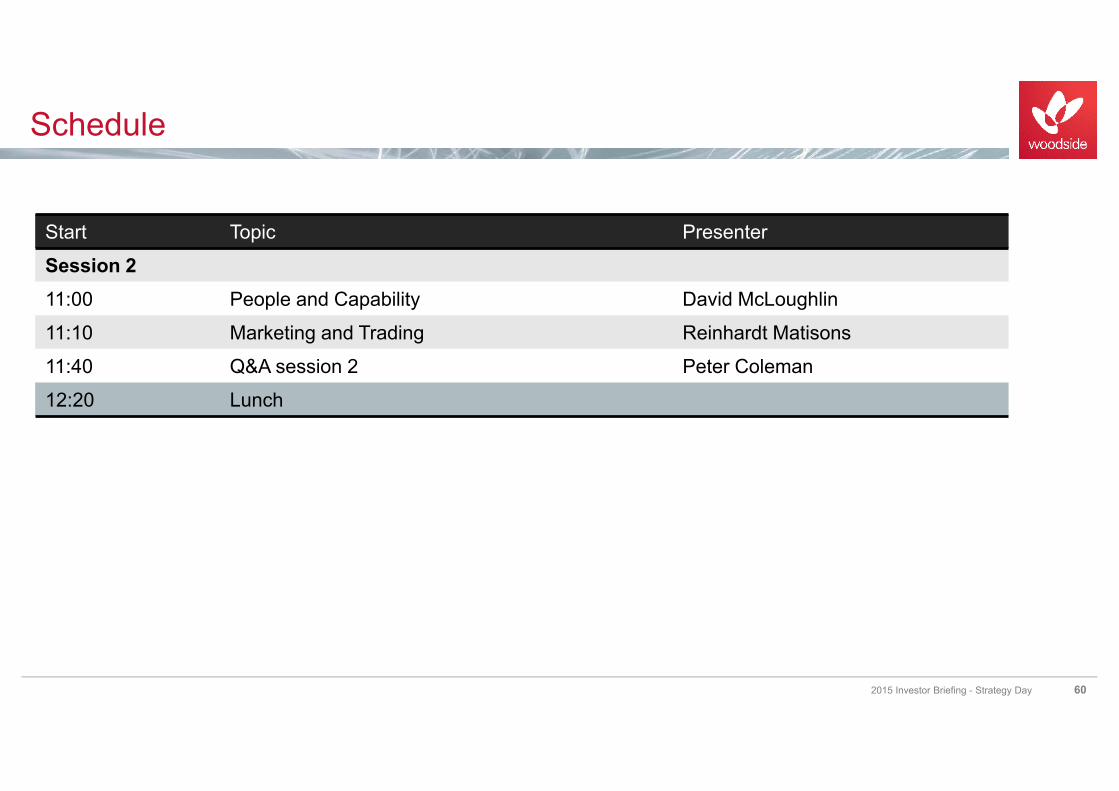
Start Topic Presenter
Session 211:00 People and Capability David McLoughlin
11:10 Marketing and Trading Reinhardt Matisons
11:40 Q&A session 2 Peter Coleman
12:20 Lunch

David McLoughlin | Vice President People and Capability
People and Capability

Our workforce
2015 Investor Briefing - Strategy Day 6262
Reshaping our workforce with discipline to deliver organisational efficiency
Productivity review identified an opportunity to improve 10 - 20% in organisational efficiency
From early 2014 we have achieved a 20% organisational efficiency, while delivering on our growth commitments and graduate / traineeship intake
To streamline the organisation we have:
reduced organisational layers from ~ 8 to 7
reduced managers by ~18%
improved spans of control from ~ 5 to 6.5
~4,100
~3,500
January 2014FTE
Recruitment:graduates &traineeships
Absorbedattrition and
growth
Redundancies March 2015FTE
Resourcing Levels

Our culture in action
2015 Investor Briefing - Strategy Day 63
Discipline and continuous improvement culture delivering results
Third party contractor numbers reduced from 295 in 2012 to 88 in 2015
Associated spend reduced from A$120 million in 2012 to A$32 million in 2014
Average of 27% rate reductions implemented in 2015
Working smarter and building staff capability and culture
63
Creating in-house capability and embedding a high performance culture
Values are presented in terms of gross joint venture operated expenditure in Australian dollars.1. Excluding apprentices, trainees and service providers
0
50
100
150
200
250
300
350
Oct-12 Oct-13 Oct-14 Jan-15 May-15
Total number of third party contractors1
(2012-2015)

Our talent pipeline
2015 Investor Briefing - Strategy Day 6464
Developing talent and leadership from within
46
71
103
2012 2013 2014
Graduate recruitment year
55% 77%
2012 2014
Promotions v External hires (Senior employees)
New hires Promotions
Committed to developing talent Implemented best practice graduate
development program Expanding international graduate pool Ratio of almost 2:1 graduate hire to mid career
hire in 2014
Promoting our next generation of leaders from within Strong progress towards our aspiration of 80%

Diversity
2015 Investor Briefing - Strategy Day 65
Gender diversity focus and committed to growth Female workforce increased to 29% compared
to 16% in the Australian resource sector
Providing indigenous opportunities
15 scholarships awarded
8 community cadetships
44 participants in traineeships and apprenticeship programs
Indigenous comprise 2.7% of workforce compared to 3.1% in the Australian resource sector and 1.4% in all Australian industries
65
Delivering progress on building a diverse workforce

Diversity video
2015 Investor Briefing - Strategy Day 6666
http://youtu.be/aSRQbD65RRY

Key messages
2015 Investor Briefing - Strategy Day 67
Achieved ~20% organisational efficiency, ~600 FTEs reduced since Jan 2014
Ahead of the curve with controlled re-structuring
Ongoing commitment to building a values-led performance culture
Developing our leadership and talent through:
promotion from within
increased graduate intake
67

Marketing and TradingReinhardt Matisons | Executive Vice President Marketing, Trading and Shipping

Strategy
Ability to supply any market, at any time, from any source (not single source to single buyer)
A competitive supplier of LNG into Asia (price, terms, supply reliability and security) to meet customer requirements
Woodside’s transition to a portfolio seller:
Backed by substantial equity LNG and third party sources
Secure sales contracts with source flexibility
Enhanced and more diversified customer offerings
Trading strategy is to be an “optimiser” (a trader of physical cargoes) not a proprietary trader
Support projects
Pursue incremental value through trading and shipping optimisation
69
Focus is competitive bulk supply of LNG into Asia and other regional markets
2015 Investor Briefing - Strategy Day 69

Global LNG market
LNG trade expected to grow ~7% p.a. to 2020
Asia-Pacific demand remains core at ~70% of market
Significant new demand across a broader customer base
Expanding import infrastructure
Traditional buyers recontacting demand
Momentum for many proposed projects stalled
To avoid post 2021 supply shortfall, buyers and industry need to support ~15 mtpa of project FIDs per year
70
Market continues to grow, including substantial uncontracted Asian demand 2021+
2015 Investor Briefing - Strategy Day 70
0
100
200
300
400
500
2015 2017 2019 2021 2023 2025 2027 2029
mtp
a
Global LNG supply and demandWoodside supply outlook - April 2015
Operational Under constructionProbable development Industry consensus demandSupply gap

LNG upside opportunities
2015 Investor Briefing - Strategy Day 71
Replace oil transport and overall energy growth in non OECD countries such as China
Transport Other sectors
02468
10121416
LCV HGV Passenger Aviation Shipping Rail
2013 Global oil demand - Transport (MMboe/d)
2013 Global oil demand
Global LNG trade 2013 = 6.1 MMboe/d
Global oil demand 2013 = 90.8 MMboe/d
Transport represents 50.5 MMboe/d
Transportation fuel displacement market is three times 2013 LNG traded (~ 19 MMboe/d):
Heavy good vehicles ~ 13 MMboe/d
Shipping ~ 5 MMboe/d
Rail ~ 1 MMboe/d
LNG opportunities
90.8 MMboe/d
Source: IHS Energy, Study conducted on 2013 data concluded in February 2015 71

LNG demand profile is diversifying
2015 Investor Briefing - Strategy Day
Woodside has opportunities both in traditional and new regions
60
80
0
40
20
100
06 1107 1204 131009 14E0805
LNG demand by region
Japan, Korea and Taiwan have been the dominant premium LNG markets over last decade
Incremental demand: 2015 - 2022
Chi
na
Kuw
ait
Indi
a
Thai
land
Sout
h Ko
rea
Turk
eyUK
Arge
ntin
a
Japa
n
Fran
ceBr
azil
Spai
nIta
lyPo
rtuga
lG
reec
eBe
lgiu
mD
om. R
ep.
Puer
to R
ico
Sout
h Af
rica
Philli
pine
sC
hile
Paki
stan
Dub
aiC
roat
iaVi
etna
mSi
ngap
ore
Taiw
anM
exic
oM
orro
co
Woodside’s current customersLNG demand countries
The largest future incremental growth is being seen in emerging economies
Source: Wood Mackenzie data; BCG demand model; BCG analysis; EIA; IEA
Japan, Korea, Taiwan
Europe
China / IndiaN America
Historic Future
72
Perc
enta
ge (%
)
mtp
a

Woodside’s LNG portfolio
73
Strong suite of existing LNG contracts; portfolio marketing to secure robust new SPAs
2015 Investor Briefing - Strategy Day 73
Limited exposure to current spot market 2015 - 2016: up to 10% of total LNG
sales Uncommitted volumes are available for
short, mid and long-term marketing Wheatstone adds further high quality
LNG SPAs to our existing portfolio Existing mid-term contracts provide
optionality Existing mid and long-term LNG
agreements have varying levels of indexation to oil / JCC
0
1
2
3
4
5
6
7
8
9
10
2015 2016 2017 2018 2019 2020
mtp
a
Woodside equity and purchased LNG
Contracted LNG NWS uncommittedPluto uncommitted Wheatstone uncommittedCorpus Christi

LNG price indexation
2015 Investor Briefing - Strategy Day 74
Low oil prices:
Challenges financial feasibility / ability to progress to FID for many projects
Future arrangements:
Likely to include a mix of pricing structures, but still majority oil linked
Opportunities to balance downside price protection with upside
Differentiated pricing in Asia-Pacific to continue; low oil prices disruptive to new projects
74
0
50
100
150
200
250
300
350
400
2014 2016 2018 2020 2022 2024 2026 2028 2030
mtp
a
LNG contracts into Asia Pacific
Existing oil-indexed Contracted US supply Uncontracted demand Short-mid term
Trading strategy and evolution
2015 Investor Briefing - Strategy Day 75
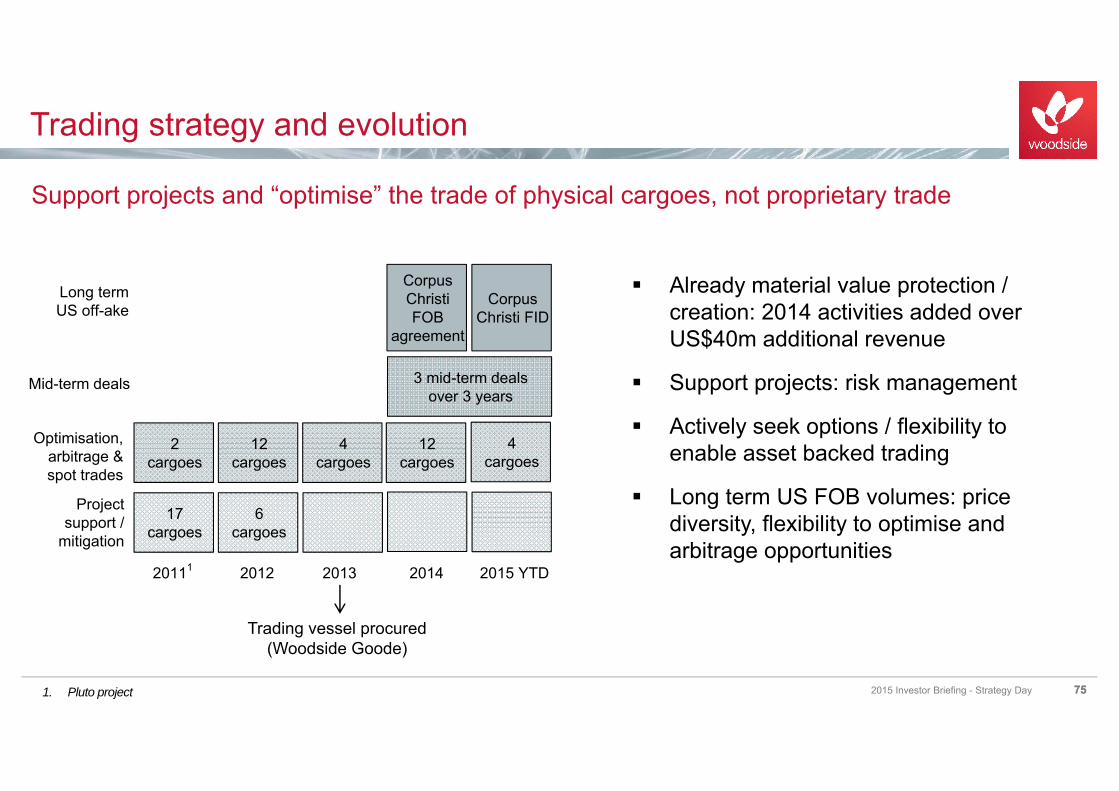
Support projects and “optimise” the trade of physical cargoes, not proprietary trade
Long term US off-ake
Optimisation,arbitrage & spot trades
Mid-term deals
Project support /
mitigation
2 cargoes
17 cargoes
20111
12 cargoes
6 cargoes
2012
4 cargoes
2013
Corpus Christi FOB
agreement
12cargoes
3 mid-term deals over 3 years
2014
Corpus Christi FID
2015 YTD
Trading vessel procured (Woodside Goode)
1. Pluto project
4cargoes
Already material value protection / creation: 2014 activities added over US$40m additional revenue
Support projects: risk management
Actively seek options / flexibility to enable asset backed trading
Long term US FOB volumes: price diversity, flexibility to optimise and arbitrage opportunities
75
Trading optionality
2015 Investor Briefing - Strategy Day 76
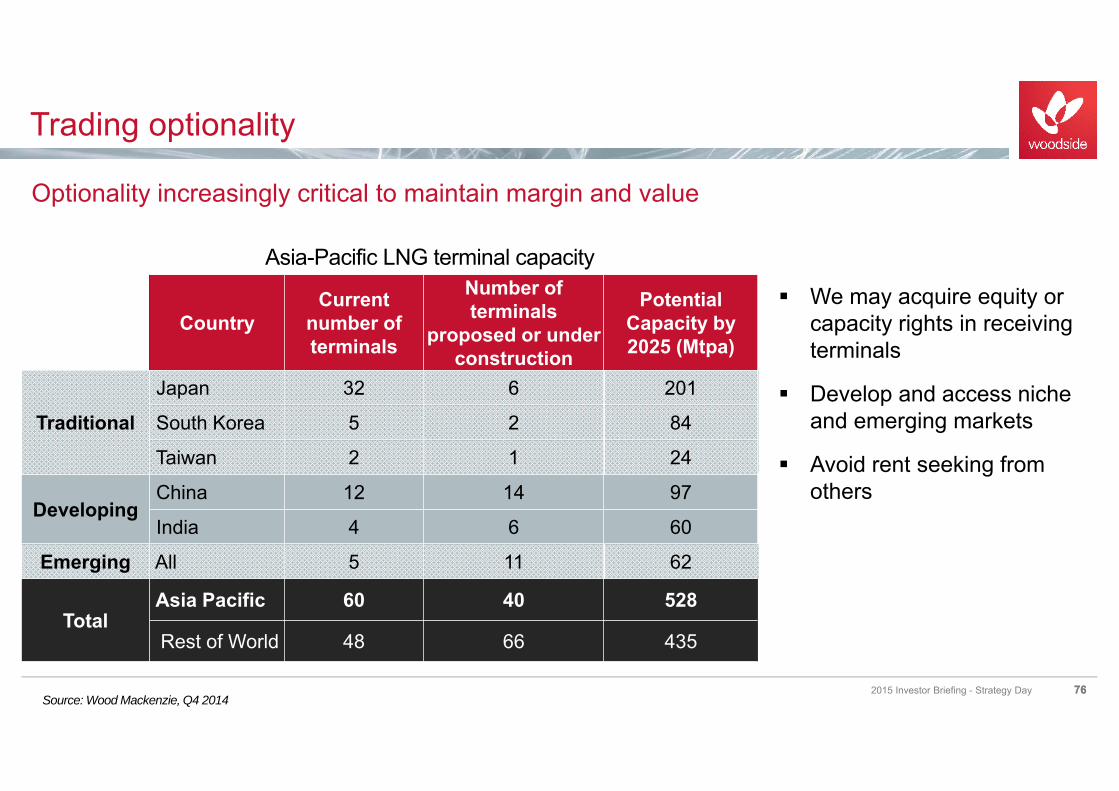
Optionality increasingly critical to maintain margin and value
We may acquire equity or capacity rights in receiving terminals
Develop and access niche and emerging markets
Avoid rent seeking from others
Source: Wood Mackenzie, Q4 201476
Asia-Pacific LNG terminal capacity
CountryCurrent
number of terminals
Number of terminals
proposed or under construction
Potential Capacity by 2025 (Mtpa)
TraditionalJapan 32 6 201
South Korea 5 2 84
Taiwan 2 1 24
DevelopingChina 12 14 97
India 4 6 60
Emerging All 5 11 62
TotalAsia Pacific 60 40 528
Rest of World 48 66 435
Key messages
Market:
LNG market continues to grow (size and number of participants)
Customer base is broadening
Substantial uncontracted demand 2021+ for our growth projects
Our strategy:
Supplying Asia and other regional markets with competitive bulk supply of LNG
Transitioning to a portfolio based seller; leverage experience, capability and growing portfolio
Trading to optimise and add incremental value
Securing optionality - we may acquire equity or capacity rights in receiving terminals
772015 Investor Briefing - Strategy Day 77

Peter Coleman | Chief Executive Officer and Managing Director
Wrap up
Credit ratings reaffirmed, stable outlook Dividend pay out ratio unchanged Refinanced balance sheet at improved terms (in low oil price environment) Continued focus on growth, and maintaining returns
Summary
2015 Investor Briefing - Strategy Day 79
Strong financial position
Strategy
Future focus
Effective, unchanged
Aggregating opportunities in existing focus areas Providing strong yield with growth optionality De-risked future growth through Wheatstone acquisition Added upside with Kitimat purchase Organic growth through Browse and Greater Enfield Additional upside through exploration, acquisition, marketing and trading

Biographies

2015 Investor Briefing - Strategy Day 8181
Peter ColemanBEng (Civil and Computing), MBA,FATSEChief Executive Officer andManaging DirectorPeter was appointed as Chief Executive Officer and Managing Director in May 2011, and has over 30 years’ experience in the global oiland gas industry. Peter is the Chairman of the Australian-Korea Foundation, a Fellow of the Australian Academy of Technological Sciences and Engineering and, in 2012, was awarded the honorary title of Adjunct Professor in Corporate Strategy from the University of Western Australia. In 2013, he received the Distinguished Alumni Lifetime Achievement Award from Monash University. Following graduation from Monash University, he began his career at Esso Australia (which became part of theExxonMobil group) and stayed with ExxonMobil until joining Woodside.
Lawrie TremaineBBus, FCPAExecutive Vice PresidentFinance and Commercial andChief Financial OfficerLawrie was appointed as Chief Financial Officer in 2010. In 2014, leadership of the Commercial function was also added to his remit.He joined Woodside in 2006 and has over 30 years of finance leadership experience, predominantly in the resourceand minerals processing industry.Lawrie is responsible for a range of functions including finance, investor relations, commercial, contracting and procurement, information technology and performance excellence.Prior to joining Woodside, heworked for Alcoa for 17 years.He is a National ExecutiveMember of the Group of 100.

2015 Investor Briefing - Strategy Day 8282
Michael UtslerBSc (Petroleum Engineering)Chief Operations OfficerMichael was appointedas Chief Operations Officerin 2013, following an extensivecareer in upstream oil and gasspanning 36 years.He is responsible forWoodside’s producingfacilities and stewardship ofprograms in health, safety,environment and security andemergency management.Prior to joining Woodside,Michael held the positionof President for the BP-GulfCoast restoration organisation,leading the DeepwaterHorizon response effort.
Dr Robert EdwardesBSc (Eng), PhDExecutive Vice PresidentDevelopmentRobert was appointed asExecutive Vice PresidentDevelopment in 2012. He has over 37 years of resources industry experience, spanning the full breadth of operations and projects.In his current role, he is accountable for front-end planning and execution of onshore and offshore capital projects, reservoirmanagement, engineering and subsea.Prior to joining Woodside, Robert’s roles included Managing Director of Worley Parsons (US and Latin America) and Project Director of the Kizomba deepwater oil development in Angola with ExxonMobil.
2015 Investor Briefing - Strategy Day 8383
Phil LoaderBSc (Geology), MBA, MSc, DICExecutive Vice PresidentGlobal ExplorationPhil was appointed asExecutive Vice PresidentGlobal Exploration in 2013,following an extensive careerin the upstream sectorspanning over 30 years.Phil is responsible for thecompany’s global explorationactivities.Prior to joining Woodside,Phil’s roles included SeniorVice President Exploration atMubadala Petroleum in theUnited Arab Emirates andVice President Exploration atAnadarko Petroleum.
Reinhardt MatisonsBEng, MBA, MIE Aust, CPEng, CPAExecutive Vice PresidentMarketing, Trading andShippingReinhardt was appointedas Executive Vice PresidentMarketing, Trading and Shipping in 2014. He has over 33 years’ experience in the energy industry.In his current position, he isaccountable for the newlyformed marketing, trading andshipping function. Reinhardtjoined Woodside in 1996 andhas held various marketingand commercial roles.Prior to this, he held seniorleadership roles with Poten &Partners, Alinta Gas, WesternPower and the State EnergyCommission of WesternAustralia.

2015 Investor Briefing - Strategy Day 8484
David McLoughlinB.A (Psychology), FAHRVice President People and CapabilityDavid was appointed as Vice President, People and Capability in 2014. He has twenty years’ experience in mining, minerals and engineering services throughout Australia, SE Asia and the Americas. David is responsible for the People and Capability/Human Resources function within Woodside.Prior to Woodside David has held a variety of roles including Manager Integration Minera Las Bambas, Vice President Human Resources Glencore Xstrata Copper, General Manager Xstrata Copper Australia, various roles with Thiess Pty Ltd and Rio Tinto.
Hendrik SnymanBSc (Eng.), MBASenior Vice President Spend Reduction InitiativeHendrik was appointedas Senior Vice PresidentSpend Reduction Initiativein 2015. Previously he was in the role of SVP Chief Procurement Officer.He joined Woodside in 2013 and has
over 26 years of Oil and Gas Industry experience, spanning the full breadth of operations and projects, includingHSE and operations integrity, development planning and delivery of major capital projects.Hendrik is responsible in leading a company wide Spend reduction program to deliver a restructured cost base and position Woodside as a partner of choice.Prior to working for Woodside he was a General Manager for Shell for 7 years.
2015 Investor Briefing - Strategy Day 8585
Craig AshtonBSc (MechEng), BLaw, MAppFinVice President Investor RelationsCraig was appointed as Vice President, Investor Relations in 2013. He has over twenty years’ commercial experience in the resources industry in Australia and South Africa. Craig is responsible for the Investor Relations function within Woodside. He joined Woodside in 2000 and has held various Commercial and Business Manager roles.Prior to Woodside Craig worked at Iscor Limited, a South African mining and steel company where he held roles in corporate business development, corporate strategy, marketing and shipping.

1. Unless otherwise stated, all petroleum resource estimates in this presentation are quoted as at the balance date (i.e. 31 December) of Woodside’s most recent Annual Report released to ASX and available at www.woodside.com.au/Investors-Media/Annual-Reports, net Woodside share at standard oilfield conditions of 14.696 psi (101.325 kPa) and 60 degrees Fahrenheit (15.56 deg Celsius).
2. Woodside reports reserves net of the fuel and flare required for production, processing and transportation up to a reference point. For offshore oil projects, the reference point is defined as the outlet of the Floating Production Storage and offtake Facility (FPSO), while for the onshore gas projects the reference point is defined as the inlet to the downstream (onshore) processing facility.
3. Woodside uses both deterministic and probabilistic methods for estimation of petroleum resources at the field and project levels. Unless otherwise stated, all petroleum estimates reported at the company or region level are aggregated by arithmetic summation by category. Note that the aggregated Proved level may be a very conservative estimate due to the portfolio effects of arithmetic summation.
4. ‘MMboe’ means millions (106) of barrels of oil equivalent. Dry gas volumes, defined as ‘C4 minus’ hydrocarbon components and non-hydrocarbon volumes that are present in sales product, are converted to oil equivalent volumes via a constant conversion factor, which for Woodside is 5.7 Bcf of dry gas per 1 MMboe. Volumes of oil and condensate, defined as ‘C5 plus’ petroleum components, are converted from MMbbl to MMboe on a 1:1 ratio.
5. Unless otherwise stated all petroleum resource estimates refer to those estimates set out in the Reserves Statement in Woodside’s most recent Annual Report released to ASX and available at www.woodside.com.au/Investors-Media/Annual-Reports. Woodside is not aware of any new information or data that materially affects the information included in the Annual Report. All the material assumptions and technical parameters underpinning the estimates in the Annual Report continue to apply and have not materially changed.
6. The estimates of petroleum resources are based on and fairly represent information and supporting documentation prepared by qualified petroleum reserves and resources evaluators. The estimates have been approved by Mr Ian F. Sylvester, Woodside’s Vice President Reservoir Management, who is a full-time employee of the company and a member of the Society of Petroleum Engineers. Mr Sylvester’s qualifications include a Master of Engineering (Petroleum Engineering) from Imperial College, University of London, England, and more than 20 years of relevant experience.
Notes on Petroleum Resource Estimates
2015 Investor Briefing - Strategy Day 86