2015 management plan pmo - european commission pmo: commitment, quality, efficiency page 2 the pmo...
TRANSCRIPT

The PMO: commitment, quality, efficiency Page 1
2015
Management Plan
PMO
Ref. Ares(2015)759022 - 23/02/2015

The PMO: commitment, quality, efficiency Page 2
The PMO 2015 Management Plan
Table of content
1 MISSION STATEMENT ................................................................................................................................................... 3
2 ACTIVITIES AND RESOURCES ......................................................................................................................................... 3
3 THIS YEAR’S CHALLENGES ............................................................................................................................................. 4
4 SPECIFIC OBJECTIVES FOR OPERATIONAL ACTIVITIES .................................................................................................... 5
4.1 HUMAN RESOURCES AVAILABLE ............................................................................................................................................... 6 4.2 FINANCIAL RESOURCES AVAILABLE ............................................................................................................................................ 6 4.3 ESTABLISH AND MANAGE INDIVIDUAL RIGHTS AND PAY SALARIES, PENSIONS AND ALLOWANCES ............................................................ 7 4.4 REIMBURSE EXPENSES AND OPTIMISE MANAGEMENT OF FUNDS, IMPLEMENTING RULES AND CONTRACTS ............................................... 9 4.5 COMMUNICATION AND CLIENT SERVICES ................................................................................................................................. 11
5 SPECIFIC OBJECTIVES FOR HORIZONTAL ACTIVITIES .................................................................................................... 13
5.1 MANAGEMENT, STAFF ENGAGEMENT AND INTERNAL COMMUNICATION ........................................................................................ 13 5.2 ENSURE SOUND FINANCIAL MANAGEMENT, EFFECTIVE INTERNAL CONTROL, RISK MANAGEMENT AND BUSINESS CONTINUITY; MEASURE AND REPORT ON PERFORMANCE ............................................................................................................................... 16 5.3 IT STRATEGY IN SUPPORT OF THE BUSINESS OPERATIONS ............................................................................................................. 19 5.4 MEASURING EFFICIENCY, EFFECTIVENESS AND ECONOMY OF MANAGEMENT ................................................................................... 23
6 KEY FIGURES ............................................................................................................................................................... 24

The PMO: commitment, quality, efficiency Page 3
Mission statement The mission of the PMO is to provide a high quality and user friendly service to beneficiaries by promptly
and accurately managing, determining and paying individual rights and expenses, providing clear and relevant
information and ensuring efficient and effective controls. The PMO administers, calculates and pays the
financial entitlements of the staff, pensioners and right holders of the European Commission and many of the
other EU institutions, agencies and other bodies. It ensures the:
determination of individual financial rights for staff, pensioners and rights holders;
payment of salaries and allowances;
payment of pensions and transfers of pension rights;
reimbursement of sickness and accident insurance expenses;
reimbursement of mission expenses and the emission of visas;
reimbursement of experts’ expenses;
payment of unemployment allowances.
Activities and resources (Post and/or person excl. external personnel) / (Payment appropriations in EUR million); source = Annual Activity Report 2013
Activities Short description Number
of files
Human
resources
Spent in
2013
Establish individual rights Establishment, management and payment of the
financial entitlements of staff in activity.
103,342 69 2,775.0
Calculation and payment of
salaries per month
40,248 68
Calculation and payment of
pensions per month
Establishment of rights and payment of pensions and
other indemnities to all former staff under Staff
Regulations and CEOS.
20,779 39.5 1,364.0
Manage transfers of pension rights Management of transfers of pension rights from
external schemes towards the Pension Scheme of the
European Union's Institutions.
3,030 31 -52.1(1)
Manage severance grants and
transfers ‘OUT’ of pension rights
Establishment of rights and payment of capitals
representing acquired pension rights towards external
pension schemes, and severance grants for all former
staff linked to termination of service.
664 7.5 33.2
Calculation and payment of
unemployment allowances
Establishment of rights and payment of unemployment
benefits for former temporary and contract staff.
2,156 10 21.0
Calculation and reimbursement of
sickness insurance expenses (JSIS)
Calculation and reimbursement of sickness / accident
insurance expenses.
2,500,000 203 281.1
Calculation and reimbursement of
accident insurance expenses
1,749 18 (2)
Calculation and reimbursement of
mission expenses
Calculation and reimbursement of mission expenses. 106,509 59 79.4
Emission of visas Issuing visa for staff going on mission or taking up
duties in EU delegation.
4,593 6.5 0.1
Calculation and reimbursement of
experts’ expenses
Reimbursement of travel and / or residence expenses
for government and private experts’ called in the
various working groups of the Commission, and the
costs associated with the holding of these meetings.
68,310 17.5 48.6
Manage daily allowances for SNEs Manage daily allowances for SNEs. 1,791 1 44.4
Other 3.5
Total operational activities 4,650.3
Total operating expenditure 42.5
Operational activities headcount 530
Horizontal activities headcount (overhead) 36
Total 566 4,692.8 (1) Recovery orders for transfer IN, amount not included in the total operational expenditure of EUR 4,650.3 million. (2) Amounts spent by the Commission, included in JSIS, the rest is paid by insurance companies and is not included in this table.

The PMO: commitment, quality, efficiency Page 4
This year’s challenges The PMO aims to be an organisation that is recognised across the Commission and other EU institutions,
agencies and bodies for its commitment, quality and efficiency.
Building on the progress made towards this goal over the past few years, the focus in 2015 will be on the
following main challenges:
to further raise overall quality of service, including through the deployment and improvement of user-
oriented IT developments (including the ‘JSIS Call Centre’1), and to drive forward simplification;
to respond to new requests for PMO services from other EU institutions, agencies and bodies, e.g. the
integration of the management of former Members' pensions of all EU institutions as of 2015;
to enhance value-for-money notably in the fields of medical services and missions;
to maintain efforts to streamline procedures, enhance the efficiency of controls and improve internal
organisation and IT, so as to optimise resources and improve productivity in the face of budgetary
restrictions, increasing volumes and additional tasks and responsibilities;
to enhance communication and team development within the PMO so as to strengthen service culture and
ethical awareness, boost employee engagement and motivation and promote internal mobility.
In view of the main challenges presented above, the following five key performance indicators have been
identified by PMO for 2015:
Indicator Baseline (2014)
(Latest known result)
2015 Target
Average time taken to reply to
enquiries through the:
• ‘JSIS Call Centre’ Current average time to reply:
30 minutes
Average time to reply to drop below
10 minutes by end-2015.
• ‘PMO Contact Online’ 20 % of monthly volume of
questions not answered within 15 working days
< 10 % of monthly volume of
questions not answered within 15 working days
Rights established correctly,
correct calculation and payment
of pensions and salaries.
Error rate < 1 % of the amount
established annually.
Error rate < 1 % of the amount
established annually.
Average time taken to treat
reimbursement claims.
Experts: 20 days Experts: < 20 days
Missions: 10 days Missions: < 15 days
Medical expenses: 15 days Medical expenses: < 20 days
Unemployment: 100 % of the
payments within 20 calendar days.
Unemployment: 100 % of the
payments within 20 calendar days.
Financial transactions: Error rate. Error rate of < 2 % of the amount
paid annually.
Error rate of < 1 % of the amount
paid annually.
Percentage of programmed
project milestones mentioned in
the IT Strategy timely
implemented.
85 %2 85 %
1 Former ‘PMO Contact Call Centre’.
2 Considering additional priorities implemented to respond to imperative operational needs.

The PMO: commitment, quality, efficiency Page 5
Specific objectives for operational activities The purpose of the PMO is to provide a high quality and user friendly service and to do so in a way which
reflects the fundamental values to which it aspires: commitment, quality and efficiency.
Deriving from this, the 2015 Management Plan is built around three operational objectives which encompass
all of the PMO’s operations:
To establish and manage rights and pay salaries and pensions fairly, accurately and promptly;
To reimburse expenses accurately and promptly and manage funds and implementing rules in an optimal fashion;
To provide high quality communication and client services.
These operational objectives, and the main outputs developed within them, provide an overview of what the
PMO is looking to deliver in 2015.
These three specific operational objectives are also enriched by two more horizontal themes:
efforts to simplify across the range of the PMO’s work;
the growing inter-institutional dimension of the PMO’s work.
The Management Plan is supplemented by Unit level plans detailing more specifically how each operational
and management objective will be delivered at Unit level. These plans are published on the Intranet.

The PMO: commitment, quality, efficiency Page 6
Human Resources available (Post and/or person)
ABB Activity Officials and
temporary staff
Contractual
agents
Other external
personnel
Total
Administration 178
(1) 410
(2) 17 609
Pensions
(1) 178 job quotas available in Sysper on 01/12/2014: 33 AD and 145 AST posts.
(2) 410 contractual agents on 01/12/2014. 193 paid on budgetary appropriations, 197 paid on earmarked revenues, 20 paid by the JRC and
the University of Florence.
Financial Resources available (Payment appropriations in EUR million, rounded figures)
Activity Operational
Expenditure
Administrative expenditure
(DG managed)
Total
Members of the Commission (1)
15.1 15.1
Officials and temporary staff 2,510.3 2,510.3
Pensions 1,567.1 1,567.1
Contract staff and SNEs (2)
335.1 335.1
Missions/Meetings (2)
114.7 114.7
Personnel PMO (2)
32.2 32.2
Operating PMO 7.3 7.3
IT Developments PMO (2)
5.5 5.5
Legal claims, interests and others 1.9 1.9
Total (of financial resources managed by the PMO) 4,544.3 45.0 4,589.3
Unemployment fund (2)
21.0 21.0
PM: Sickness Insurance Scheme (off budget) (2)
297.2 297.2
(1) including special advisers, missions and representation costs source: Budget 2015 (Dec. 2014)
(2) includes estimated figures

The PMO: commitment, quality, efficiency Page 7
Establish and manage individual rights and pay salaries, pensions and allowances In 2015 the PMO expects to establish the individual rights of about 5,000 colleagues entering into service in
the Commission and other institutions and services, and to make 130,000 adjustments to the individual rights
of colleagues. It will also continue to reabsorb the exceptional backlog of the remaining 3,600 inward pension
transfer requests3.
In 2015 the PMO expects to calculate and/or pay 41,000 salaries, 21,700 pensions and up to
1,600 unemployment allowances each month, a total of 771,600 transactions over the year, an increase of
0.9 % compared to 2014 and a total volume of payments of EUR 4,448 million.
Specific objectives (all non-spending)
1 Establish and manage all rights and obligations related to the Staff Regulations accurately and within reasonable
delay at each event having an impact on an individual’s rights (entry into service, departure, birth, marriage,
pension transfer, etc.).
2 Correct calculation of salaries for all EU institutions, agencies and other bodies, payment of salaries for the
Commission, and payment of pensions and unemployment allowances for all EU institutions, agencies and other
bodies.
Result indicator
(Source = PMO source of data) Baseline
(2014 – latest known result)
2015 Target
1 Entitlements: number of rights
established correctly, correct
calculation and payment of pensions
and salaries.
Error rate ex post controls < 1 %
of the amount established annually.
Error rate < 1 % of the amount
established annually.
2 Time to execute the payment Unemployment: 100 % paid
within 20 calendar days.
Unemployment: 100 % paid within
20 calendar days.
3 Number of Article 90 complaints
upheld
486 received, 357 closed of which
34 upheld (9.5 %).
< 10 % of complaints received
upheld.
Main outputs in 2015
Description Indicator 2015 Target
1 High level of service in managing
rights, processing salaries, pensions, and allowances.
Processing all requests for rights
change within two months.
95 %
2 Continue to implement the action
plan to reabsorb pending requests for
inward transfers of pension rights
and reduce backlogs in line with the agreed schedule.
Number of inward and number of
outward transfers.
4,000 inward and 1,200 outward
transfers (incl. Parliamentary assistants – APA).
3 Reduction of the backlog in inward
transfers.
Degree of increase in difference
between incoming requests and
closed files.
1,625 new requests
4,000 closed files
4 Maintain a high priority on effective
controls for salaries, pensions and all types of rights.
Percentage of planned ex-post
controls and control activities carried out.
Planning of ex-post control: 100 %.
Control activities carried out: 100 %.
3 Including all non-initiated inward transfer files

The PMO: commitment, quality, efficiency Page 8
Main outputs in 2015
Description Indicator 2015 Target
5 Planned development of 10 Sysper-
modules
Completion of development 85 % of planned Sysper-modules
developed.
Planned development of PABS4-
modules
95 % of planned PABS-modules
developed.
Planned development of Payment
Factory
25 % of Payment Factory
developed.
6 Implement an automatic transfer tool
(Transcode) for the payment of
salaries of executive agencies, thus
reducing the need for double
encoding and improving the accuracy of the pay.
Implementation of Transcode Transcode implemented for three
executive agencies
4 Post-Activity Beneficiaries Suite.

The PMO: commitment, quality, efficiency Page 9
Reimburse expenses and optimise management of funds, implementing rules and contracts In 2015 the PMO expects to process and reimburse some 2,700,000 single medical expenses, 120,000 mission
claims and 70,000 expert payments for a total volume of payments of EUR 419 million.
The financial balance of the JSIS5 and unemployment fund will continue to require close scrutiny.
Specific objectives (all non-spending)
1 Ensure the prompt and accurate reimbursement of medical, mission and experts expenses.
2 Ensure the effective management of contracts, implementing rules and the Joint Sickness Insurance Scheme and
the unemployment fund including their financial balance.
Result indicator
(Source = PMO source of data) Baseline
(2014 – latest known result)
2015 Target
1 Average reimbursement time. Experts: 20 days Experts: < 20 days
Missions: 10 days Missions: < 15 days
Medical expenses: 15 days Medical expenses: < 20 days
Average reimbursements paid after
30 calendar days.
Experts: 30 % Experts: < 10 %
Missions: 1 % Missions: < 5 %
Medical expenses 6 % Medical expenses < 10 %
Average reimbursements paid within
20 calendar days
Unemployment: 100 % paid
within 20 calendar days.
Unemployment: 100 % of the
payments within 20 calendar days.
2 Financial transactions: Error rate. All reimbursements: financial
error rate < 2 % of the amount
paid annually.
All type of reimbursements:
financial error rate < 1 % of the
amount paid annually.
3 JSIS: financial balance. Operational deficit is monitored
and controlled
The operational deficit may not
exceed 5 % of the JSIS global
assets, while bearing in mind the
medium term goal of achieving an
operational equilibrium.
JSIS global assets remain at a
sufficiently high level
The JSIS global assets may not
decrease by more than 5 % compared to the previous year.
4 Unemployment fund: financial
balance.
(The evolution of the Fund will be
closely monitored and reported to the
DG HR in case of a significant deterioration)
Operational result is monitored
closely.
Immediate reporting to DG HR in
case the unemployment fund falls
below EUR 3 million.
5 Visas. 100 % of visas delivered on time 100 % of visas delivered on time
5 Joint Sickness Insurance Scheme.

The PMO: commitment, quality, efficiency Page 10
Main outputs in 2015
Description Indicator 2015 Target
1 Publication of the adopted update of
the Guide to Missions.
Revised Guide to Missions
published.
Revised guide to Missions
published in 2015.
2 Strictly monitor the financial balance
of JSIS and constantly reinforce the
implementation of soft measures.
These include further negotiations
with the Brussels area hospitals
(preferential rates) and awareness-
raising actions targeted at JSIS
beneficiaries (prevention of ‘medical
over-spending’). In addition, JSIS
management will keep strengthening
its actions in rule enforcement (e.g.
supporting documents), with
particular focus on the compliance of
supporting documents and systematic
implementation of article 20.2
(‘excessive costs’) of the General
Implementing Provisions (GIPs).
Reducing the gap between JSIS
income and disbursements to a
maximum of 3 %, while bearing in
mind the medium term goal of
achieving an operational equilibrium.
Permanent financial monitoring:
Monthly cash-based reporting
The cash-based report has to be
provided each month.
Annual accounts: Annual
reporting to the Management
Committee (CGAM) (‘article 47’ report).
Annual report will be sent to
CGAM before 30 June 2015.
3 Promoting the new call for
expression of interest in order to offer the best tariffs for our members.
Processing submissions by
operators in the public health sector.
Negotiation of agreements with
the largest providers of health
services in the ‘most populated
areas’ in the EU (e.g.: Brussels, Luxemburg, Ispra, etc.)
Publication in 2015 of lists of
health care providers offering
special rates and Newsletters.
Reinforcing communication with
JSIS members.
Using the media of project JSIS
Online (front office), website, JSIS
Conference, etc.
4 Contribute actively in the
development of the new IT system
called ‘Agora’ in view of replacing
the ‘Apex’ IT system, with the aim to
be in the medium term a unique corporate IT tool for all DGs.
New Agora system in use at the
Commission.
Agora pilot project will be launched
early 2015. Partial implementation carried out at the end of 2015.
5 Continue to offer an excellent visa
service to the mission performers.
Streamline visa request
procedures and develop new visa
related MiPS6 functionalities, both
at front and back offices’ level.
100 % of visa request procedures
streamlined.
6 Mission Processing System.

The PMO: commitment, quality, efficiency Page 11
Communication and client services In 2015, the PMO expects to handle some 100,000 requests for information through ‘PMO Contact Online’
and 25,000 calls through ‘JSIS Call Centre’, and for its ‘My IntraComm’ webpages to remain in high demand.
It will also maintain and further develop its relations with the other EU institutions, agencies and other bodies.
Specific objectives (non-spending)
1 Provide prompt, good quality and relevant information and ensure high quality client services across the board.
Result indicator
(Source = PMO source of data) Baseline
(2014 – latest known result)
2015 Target
1 Average time taken to reply to
enquiries through the ‘JSIS Call Centre’.
Current average time to reply:
30 minutes
Average time to reply to drop
below 10 minutes by end-2015.
2 Average time taken to reply to
enquiries through the ‘PMO Contact Online’.
20 % of monthly volume of
questions not answered within 15 working days
< 10 % of monthly volume of
questions not answered within 15 working days
Main outputs in 2015
Description Indicator 2015 Target
1 PMO’s Service Charter in order to
clearly state PMO’s commitments
towards its clients and define available communication channels
Adoption of the PMO’s Service
Charter
First quarter of 2015.
2 Redefine the way the PMO
communicates with its clients by
reducing and rationalizing its
communication entry points: enrich
Sysper-Rights, JSIS Online and
MiPS as communication tools;
Degree of development of a new
strategy regarding the functioning
and role of the new help phone
line ‘JSIS Call Centre’.
100 % focus the scope of the
current ‘PMO Contact Call Centre’
on JSIS issues and rename the help
phone line into ‘JSIS Call Centre’ by the second quarter of 2015.
25 % decrease of the number of
‘PMO Contact Online’ tickets related to specific file handling.
Discontinue the use of functional
mail boxes to communicate with
external clients and concentrate all
the traffic within the ‘PMO Contact Online’ front and back offices.
Degree of information transmitted
to users.
All concerned users informed of
the role and purpose of each PMO communication entry point
Make a clear distinction between
general PMO communication
channels (e.g.: ‘PMO Contact
Online’) and those for specific file
handling (JSIS Online, Sysper and
MiPS). Build new bridges between
the various channels to allow the
transfer of client’s requests if needed.
Number of communication
channels created.
Full implementation of general and
specific communication channels
and bridges between the different
channels
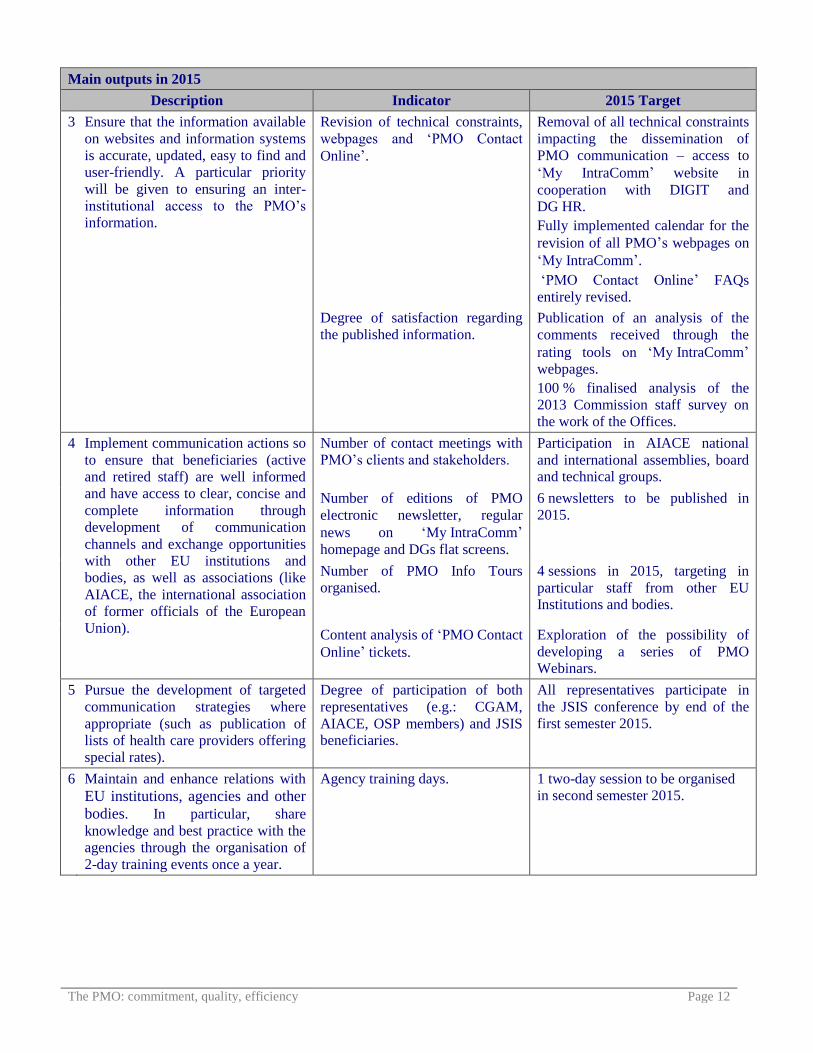
The PMO: commitment, quality, efficiency Page 12
Main outputs in 2015
Description Indicator 2015 Target
3 Ensure that the information available
on websites and information systems
is accurate, updated, easy to find and
user-friendly. A particular priority
will be given to ensuring an inter-
institutional access to the PMO’s
information.
Revision of technical constraints,
webpages and ‘PMO Contact
Online’.
Removal of all technical constraints
impacting the dissemination of
PMO communication – access to
‘My IntraComm’ website in
cooperation with DIGIT and DG HR.
Fully implemented calendar for the
revision of all PMO’s webpages on
‘My IntraComm’.
‘PMO Contact Online’ FAQs
entirely revised.
Degree of satisfaction regarding
the published information.
Publication of an analysis of the
comments received through the
rating tools on ‘My IntraComm’ webpages.
100 % finalised analysis of the
2013 Commission staff survey on
the work of the Offices.
4 Implement communication actions so
to ensure that beneficiaries (active
and retired staff) are well informed
and have access to clear, concise and
complete information through
development of communication
channels and exchange opportunities
with other EU institutions and
bodies, as well as associations (like
AIACE, the international association
of former officials of the European
Union).
Number of contact meetings with
PMO’s clients and stakeholders.
Participation in AIACE national
and international assemblies, board and technical groups.
Number of editions of PMO
electronic newsletter, regular
news on ‘My IntraComm’ homepage and DGs flat screens.
6 newsletters to be published in
2015.
Number of PMO Info Tours
organised.
4 sessions in 2015, targeting in
particular staff from other EU Institutions and bodies.
Content analysis of ‘PMO Contact
Online’ tickets.
Exploration of the possibility of
developing a series of PMO Webinars.
5 Pursue the development of targeted
communication strategies where
appropriate (such as publication of
lists of health care providers offering
special rates).
Degree of participation of both
representatives (e.g.: CGAM,
AIACE, OSP members) and JSIS beneficiaries.
All representatives participate in
the JSIS conference by end of the
first semester 2015.
6 Maintain and enhance relations with
EU institutions, agencies and other
bodies. In particular, share
knowledge and best practice with the
agencies through the organisation of
2-day training events once a year.
Agency training days. 1 two-day session to be organised
in second semester 2015.
The PMO: commitment, quality, efficiency Page 13
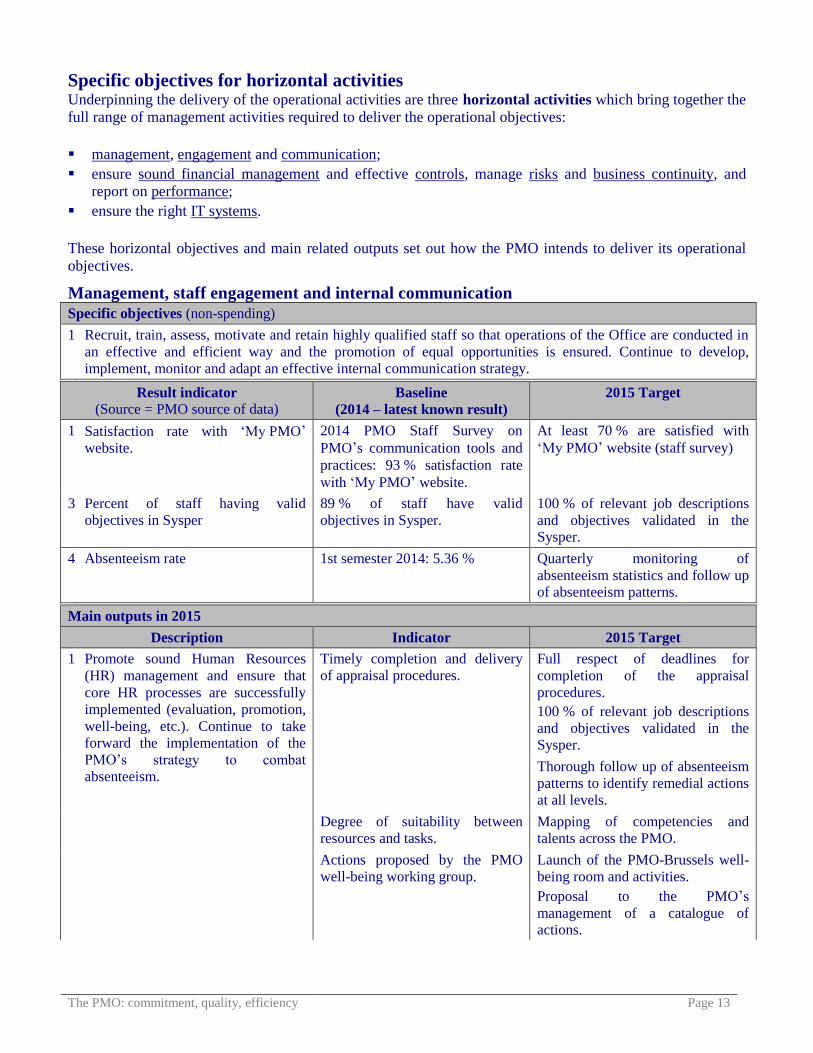
Specific objectives for horizontal activities Underpinning the delivery of the operational activities are three horizontal activities which bring together the
full range of management activities required to deliver the operational objectives:
management, engagement and communication;
ensure sound financial management and effective controls, manage risks and business continuity, and report on performance;
ensure the right IT systems.
These horizontal objectives and main related outputs set out how the PMO intends to deliver its operational
objectives.
Management, staff engagement and internal communication
Specific objectives (non-spending)
1 Recruit, train, assess, motivate and retain highly qualified staff so that operations of the Office are conducted in
an effective and efficient way and the promotion of equal opportunities is ensured. Continue to develop,
implement, monitor and adapt an effective internal communication strategy.
Result indicator
(Source = PMO source of data) Baseline
(2014 – latest known result)
2015 Target
1 Satisfaction rate with ‘My PMO’ website.
2014 PMO Staff Survey on
PMO’s communication tools and
practices: 93 % satisfaction rate
with ‘My PMO’ website.
At least 70 % are satisfied with
‘My PMO’ website (staff survey)
3 Percent of staff having valid
objectives in Sysper
89 % of staff have valid
objectives in Sysper.
100 % of relevant job descriptions
and objectives validated in the Sysper.
4 Absenteeism rate 1st semester 2014: 5.36 % Quarterly monitoring of
absenteeism statistics and follow up of absenteeism patterns.
Main outputs in 2015
Description Indicator 2015 Target
1 Promote sound Human Resources
(HR) management and ensure that
core HR processes are successfully
implemented (evaluation, promotion,
well-being, etc.). Continue to take
forward the implementation of the
PMO’s strategy to combat
absenteeism.
Timely completion and delivery
of appraisal procedures.
Full respect of deadlines for
completion of the appraisal
procedures.
100 % of relevant job descriptions
and objectives validated in the
Sysper.
Thorough follow up of absenteeism
patterns to identify remedial actions
at all levels.
Degree of suitability between
resources and tasks.
Mapping of competencies and
talents across the PMO.
Actions proposed by the PMO
well-being working group.
Launch of the PMO-Brussels well-
being room and activities.
Proposal to the PMO’s
management of a catalogue of actions.

The PMO: commitment, quality, efficiency Page 14
Main outputs in 2015
Description Indicator 2015 Target
Team building: Use unit, sector or
team based events to promote an esprit de corps across the PMO.
Number of team building events
organised.
75 % of units organised a team
building event.
2 Foster a knowledge sharing and
learning culture across the PMO.
Average number of training days
per staff member.
4 days/year of formal training.
In view to support the learning of
staff with management
responsibilities, specific training
needs for team leaders should be
analysed and an adapted program put
in place in the course of 2015.
Degree of analysis of the specific
training needs and of
implementation of adapted
program.
Production of the training needs
analysis and implementation of adapted program.
In view to improve the quality of the
service provided to our clients via
‘PMO Contact Online’ and ‘JSIS
Call Centre’, analysis of specific
training needs for ‘PMO Contact
Online’ and ‘JSIS Call Centre’
agents followed by an adapted
program put in place by the beginning of 2015.
Degree of analysis of the specific
training needs.
Production of the training needs
analysis.
Foster effective communication within the PMO.
Number of ICN meetings. 5 ICN meetings in 2015
3 Ethics and data protection: Maintain
a high level of ethical awareness.
Promote a data protection culture within the PMO.
Practical guidance on ethics in a
dedicated section on the intranet
on a quarterly basis: 4 updates in 2015.
In-house data protection training
sessions
Percentage of staff that attended
in-house data protection training
sessions.
At least 3 specific training sessions
for newcomers.
2 Awareness raising campaigns for
PMO Staff.
At least 3 specific training sessions
on data protection.
Treatment of data protection matters. State of drafting of the final
report.
Report with recommendations to
each unit on how to improve data protection.
4 Internal communication: Continue to
develop ‘My PMO’ website and its
collaborative potential as well as
other actions to support effective
communication. Use the results of
the PMO Internal Staff Survey,
focused on communication, to
improve communication with staff
and identify their specific needs.
Level of participation of PMO
staff on internal collaborative
platforms (collaborative spaces in
‘My PMO’, ‘Yammer’).
100 % realisation of the commu-
nication campaign and training
programme on the use and value-added of collaborative platforms.
100 % organisation of 2 training
sessions on the use of collaborative
platforms.

The PMO: commitment, quality, efficiency Page 15
Main outputs in 2015
Description Indicator 2015 Target
5 Anti-fraud strategy: Launch of a new
section on anti-fraud strategy on the
‘My PMO’ website in order to
continue to ensure that members of
staff have the necessary information
and training to respond to clients both by e-mail and telephone.
Degree of activity on anti-fraud
on the ‘My PMO’ website.
Full launch of a section on anti-
fraud strategy on the ‘My PMO’ website.

The PMO: commitment, quality, efficiency Page 16
Ensure sound financial management, effective internal control, risk management and
business continuity; measure and report on performance
Specific objectives (all non-spending)
1 Manage the spending of financial resources in such a way that sound financial management is ensured
throughout the Office’s activities.
2 Maintain and report on an effective and reliable internal control system, manage and mitigate specific and critical
risks, ensure the ability of the PMO to respond to critical events in order to assure continuity of service, and
report on key performance indicators.
Result indicator
(Source = PMO source of data) Baseline
(2014 – latest known result)
2015 Target
1 Average delay to recover undue
payment.
95 % of recovery orders
established within 5 working days
after pre-information deadline.
95 % of recovery orders established
within 5 working days after pre-
information deadline.
2 Quality of AAR (Court of Auditors)
and inclusion of the harmonised cost efficiency indicators in the AAR.
A A
100% integration of cost efficiency
indicators in the AAR.
3 Financial transactions: Error rate < 1 % < 1 %
4 Open discharge recommendations 0 0
5 IAS/IAC recommendations due in
2015: Proportion reported closed.
46 % of due recommendations
closed on 1 November 2014.
80 %
6 Number of critical/very important
IAC/IAS recommendations overdue for more than 12 months.
IAC: 11
IAS: 0
IAC: 4
IAS: 0
7 Number of critical risks identified
and percentage of critical risks
reported in the Management plan.
Source: PMO source of data
3 critical risks and 100 % reported 3 critical risks and 100 % reported
8 Anti-fraud: percentage of OLAF and
IDOC7 final case reports (transmitted
to PMO) for which follow-up has been established.
100 % 100 %
9 Timely publication of monthly
statistics and regular report to the
Management board.
Monthly, ≤ 15th of the month Monthly, ≤ 15th of the month
Main outputs in 2015
Description Indicator 2015 Target
1 Financial transactions: continue to
ensure all financial transactions are
initiated and validated within the deadlines.
all financial transactions are
initiated and validated within the
deadlines
100 %
2 Budgetary situation: monitor on a
quarterly basis the budgetary
execution of the operational budget.
% of budget execution (payments)
with respect to budget
appropriations.
> 99 %
7 Investigation and Disciplinary Office of the Commission.

The PMO: commitment, quality, efficiency Page 17
Main outputs in 2015
Description Indicator 2015 Target
3 Control: continue to implement the
reinforced effective control strategy8.
Continue the adoption and
implementation of revised internal
control strategies in the operational units.
Degree of revised internal control
strategies adopted and
implemented in the operational units.
80 % adopted and implemented.
4 Anti-fraud: implement the PMO anti-
fraud strategy, based on the action
plan included in the strategy adopted in December 2013.
Degree of implementation of the
action plan included in the Anti-
Fraud strategy.
90 % implemented.
5 Procedures: follow up on
documented internal procedures to
ensure they are user-friendly, kept
up-to-date and used effectively.
Evaluation of need for review and
prioritisation of procedures to be updated.
All PMO’s units will identify the
critical procedures and workflows
in need of revision and create a
planning with milestones leading to a review of those procedures.
In the framework of continuous
development of IT systems,
increased focus will be dedicated to
assess the impact on processes and
procedures. In 2015, the development
of MiPS and PABS will reach a level
allowing for a revision of the workflow and related procedures.
Degree of updated procedures in
the units dealing with mission expenditure and post-activity.
70 % of the procedures impacted by
the changes in the workflow
process are reviewed before yearend 2015.
6 Business Intelligence: continue to
analyse reporting needs and
implement the Business Intelligence
Strategy including the publication of
management statistics and the
provision of dashboards and
scorecards to make available the
appropriate information at the
appropriate level (Board, Commissioner, Director, and Unit).
Reporting issued without delay at
the start of every month
100 % of reporting published
before the 10th of the month.
7 Ensure that contracts are successfully
managed (administrative and
operational) and ensure the effective
control of the performance, quality
and invoicing of the externalised
services (medical advisors, travel agencies and insurance company).
Degree of centralised oversight
and contract management
planning within the PMO.
Contract management planning and
oversight will be reviewed at three
management meetings in 2015.
8 According to Common Control Efficiency Indicators set out in the new AAR standing instructions issued for 2014, with a
view to report in the 2015 AAR, an average detected error rate and amount at risk for the whole Office.

The PMO: commitment, quality, efficiency Page 18
Main outputs in 2015
Description Indicator 2015 Target
8 Value for money: The PMO
endeavours to provide the best value
for money for those travelling on a
mission through the negotiation of
reduced rates with airlines that serve
destinations travelled to by staff
members.
Degree of implementation of the
value for money dashboard
indicating clearly the savings achieved due to tariff agreements.
Value for money dashboard entirely
implemented by February 2015
9 Sound financial management of our
public procurements.
Number of framework contracts
signed.
Three framework contracts signed:
Corporate credit card: Public
procurement process completed
and contract signed by
31 October 2015 so as to be
implemented as from
19 November 2015.
Travel agency contract: OBT
(on-line booking tool) tested
with a DG before spring 2015
and fully implemented in 2015.
Air taxi: Public procurement
process launched mid-2015.
10 Business Continuity: Updates to the
existing documentation in function of
changed business procedures (linked
to technology changes); Operate the
weekly PMO Duty Officer rotation
and the corporate Permanence tools;
Tests of the degree of preparedness
for crises. Simulate potential
disruptions in individual units or
sectors; Perform alert tests in NOAH involving all staff.
Degree of updating of the current
Business Continuity Plan to the 2015 challenges.
Produce and publish an improved
new version of PMO Business
Continuity Plan (BCP); Be 100%
prepared to give support to
corporate services in the case of
occurring power cuts in the winter
period.

The PMO: commitment, quality, efficiency Page 19
IT strategy in support of the business operations The scope of the PMO activities and thus its IT systems goes well beyond the Commission perimeter. Indeed,
the PMO provides more and more services to all EU institutions, agencies and other bodies.
Given that the PMO yearly workload is growing, IT tools are a key instrument for its daily work consequently,
the timely development and deployment of effective information systems are crucial to ensure high levels of
client service and adequate support to the PMO’s staff in their operations.
The PMO activities are mainly supported by information systems developed in the past years (e.g.: NAP,
MiPS, Sysper-Rights, etc.). These information systems are continuously updated and improved, to enhance the
services already offered and to add new functionalities. They are crucial to provide ‘high quality and user
friendly service to beneficiaries’. In recent years, the PMO has pursued this trend by developing new front
office modules in Sysper-Rights, revamping the existing MiPS platform, adding a common service for
scanned documents and launching ‘JSIS Online’ and ‘PMO Contact Online’.
Through the new objectives set for the next phase of the PMO’s ICT strategy, smart e-services will further
transform the PMO by introducing innovations whilst containing costs, by focusing all new projects on sound
business cases and the need to rationalise IT system development, by delivering increased added value and/or
improved efficiency and staff productivity, and by contributing to simplified processes. All this contributes to
offer our customers an efficient and high quality service.
Consequently, ‘continuous transformation and convergence’ will remain the motto for 2015.
In 2015, efforts will continue to:
streamline procedures,
extend the coverage of business processes especially for individual pecuniary rights, post-activity and JSIS,
enhance internal IT organisation, and
develop the inter-institutional dimension
in order to optimise resource utilisation and improve productivity, thus, allowing the PMO to face budgetary
constraints and workload increases better. Detailed information on PMO IT projects is provided in the
annexes.
Specific objectives (non-spending)
1 Ensure the development and deployment of effective IT systems so as to ensure high levels of client service and
adequate support for PMO staff in their daily work.
Result indicator
(Source = PMO source of data) Baseline
(2014 – latest known result)
2015 Target
1 Percentage of projects or
programmed milestones of projects
mentioned in the IT Strategy
implemented on time
85 % Full implementation.

The PMO: commitment, quality, efficiency Page 20
Main outputs in 2015
Description Indicator 2015 Target
1 JSIS Online: The main targets are: Degree of implementation of
programmed developments.
90 % of the planned
developments implemented. 1) implement on line correction mechanism (first quarter);
2) fine tune the tarification module in the back office (first quarter);
3) implement the back office for direct billing (second quarter);
4) build financial module (second semester);
5) implement the accident milestone (third
quarter).
2 Sysper-Rights: The main targets are: Degree of implementation of
programmed developments.
85 % of the planned
developments implemented. 1) full integration of the management of
individual rights;
2) increase efficiency and effectiveness of
business processes, and improve
communication with beneficiaries;
3) increase percentage of automated
controls and procedures;
4) increase focus on access management;
5) promotion of paperless handling;
6) extend use of Sysper to Executive Agencies and Non-Executive Agencies.
3 NAP: The main targets are: Degree of implementation of programmed developments.
85 % of the planned developments implemented. 1) extend the medium-term review of the
salary payment system from the IT and procedures perspective;
2) increase effectiveness and efficiency of
‘Transcode’ (the interface between
Sysper and NAP) by extending its
coverage to other EU bodies to give it an
inter-institutional dimension;
3) support extension of Sysper to other
institutions as a prerequisite to objectives 1) and 2).
4 MiPS: The main targets are: Degree of implementation of
programmed developments.
85 % of the planned
developments implemented. 1) implementation of selective ex-ante
control (fast track);
2) improvement and roll-out of invoicing
controls (incorporating e-prior);
3) continuous improvement of the back-
office.

The PMO: commitment, quality, efficiency Page 21
Main outputs in 2015
Description Indicator 2015 Target
5 Post-activity: The main targets are: Degree of implementation of
programmed developments.
85 % of the planned
developments implemented. 1) module ‘PABS Transfer IN sector’ fully
operational;
2) module ‘PABS Pensions Retirement
(ANC) calculation engine and Document
generation’ operational;
3) module ‘Calculation rules analysis for
complex careers’ operational;
4) launch of the Sysper-pension project.
6 PMO Contact Online: The main targets are: Degree of implementation of
programmed developments.
85 % of the planned
developments implemented. 1) develop new front office communication
tools to reduce the number of questions
submitted via the portal;
2) develop a new ‘professional’ front and
back office tools to improve
communication with case handlers from
all EU Institutions, agencies and bodies,
including possible integration within the future Single Entry Point for HR matters.
7 Payment factory: The main targets are: Degree of implementation of
programmed developments. 90 % of the planned
developments implemented. 1) SINAPS9 refactoring and phasing out;
2) start integration of accounting for all
upstream systems except for NAP;
3) analysis of the first ‘Compensation and
Debt Management Module’.
8 IT Coordination & Security: The main targets
are:
Degree of implementation of
programmed developments.
90 % of the planned
developments implemented.
1) increased focus on integrating audit and
internal control recommendations related
to the development of IT modules in the
planning and prioritisation of planned IT developments;
2) harmonise documentation of all
Information Systems;
3) maintain a continuous focus on access
management.
9 Business Intelligence: The main targets are: Degree of implementation of
programmed developments.
80 % of the planned
developments implemented. 1) completion of the ‘Executive Information
System’ (EIS);
2) develop synergies and streamline the work with HR Data Warehouse.
9 SINAPS is the IT tool for the management of Bank Account Files and Legal Entity Files of beneficiaries and is the
interface with ABAC, enabling mass payments to be carried out.

The PMO: commitment, quality, efficiency Page 22

The PMO: commitment, quality, efficiency Page 23
Measuring efficiency, effectiveness and economy of management To illustrate the engagement to continuously trying to improve its functioning, the following two examples illustrate how improvements to the
procedures will help the PMO economise on the cost of inputs in 2015.
Example 1: implementation of revised internal control methodologies
In 2014, the decision has been taken to revise the integral internal control structure at PMO. The exercise sets out to optimise effectiveness,
efficiency of the existing control strategies at the different operational units, while respecting the principle of economy. In three operational units,
dealing with reimbursement of medical, mission and expert claims, the exercise of remodelling and redrafting of the current control methodologies
has already been finalised. The year 2015 will be dedicated to the implementation of these revised control structure in these units. In two remaining
operational units, the revision process has been launched but not yet finalised. The process of remodelling and redrafting the control methodologies will be continued in 2015.
To illustrate the impact of this exercise: in the operational unit in charge of processing JSIS reimbursement claims, the ex-ante control structure has
been altered in such way that, while continuing to respect the principles of effectiveness and efficiency, less resources are employed. As the sample
used to establish the extrapolated error rate for the whole of JSIS expenditure has been reduced to fit the confidence level (95 %, instead of 99 % until now) set by the European Court of Auditors, saved resources were redeployed to other areas in need.
Example 2:
The unit managing the mission claims is currently undergoing an entire revision of its workflow, following the recommendations issued by an IAC
audit on ‘the effectiveness and efficiency of the mission management workflow’. A material result of this process is the revision of the control
structure, notably through introduction of a risk based component. This will lead to a more economic use of resources and free a number of FTEs that
can be redeployed to other areas where such resources are needed.
The new control structure has been approved at the end of 2014 and will be implemented in 2015, from the moment the developments in the IT application are finalised.
The PMO: commitment, quality, efficiency Page 24
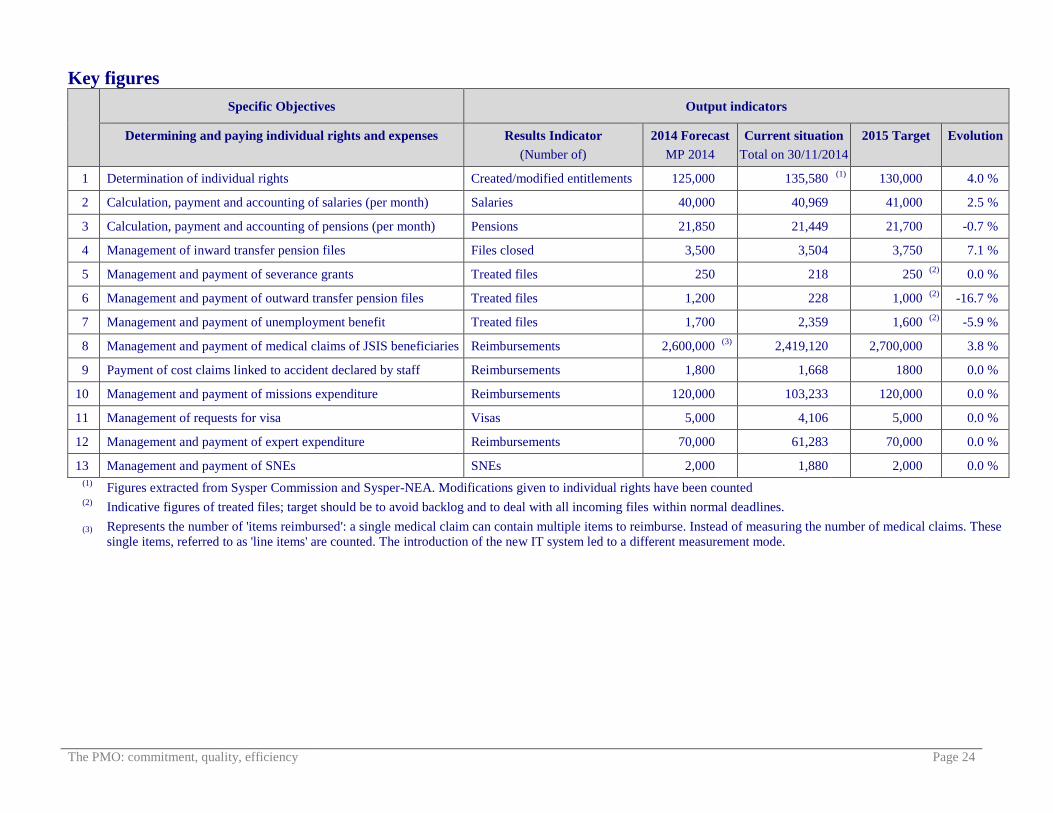
Key figures
Specific Objectives Output indicators
Determining and paying individual rights and expenses Results Indicator
(Number of)
2014 Forecast
MP 2014
Current situation
Total on 30/11/2014
2015 Target Evolution
1 Determination of individual rights Created/modified entitlements 125,000 135,580 (1)
130,000 4.0 %
2 Calculation, payment and accounting of salaries (per month) Salaries 40,000 40,969 41,000 2.5 %
3 Calculation, payment and accounting of pensions (per month) Pensions 21,850 21,449 21,700 -0.7 %
4 Management of inward transfer pension files Files closed 3,500 3,504 3,750 7.1 %
5 Management and payment of severance grants Treated files 250 218 250 (2)
0.0 %
6 Management and payment of outward transfer pension files Treated files 1,200 228 1,000 (2)
-16.7 %
7 Management and payment of unemployment benefit Treated files 1,700 2,359 1,600 (2)
-5.9 %
8 Management and payment of medical claims of JSIS beneficiaries Reimbursements 2,600,000 (3)
2,419,120 2,700,000 3.8 %
9 Payment of cost claims linked to accident declared by staff Reimbursements 1,800 1,668 1800 0.0 %
10 Management and payment of missions expenditure Reimbursements 120,000 103,233 120,000 0.0 %
11 Management of requests for visa Visas 5,000 4,106 5,000 0.0 %
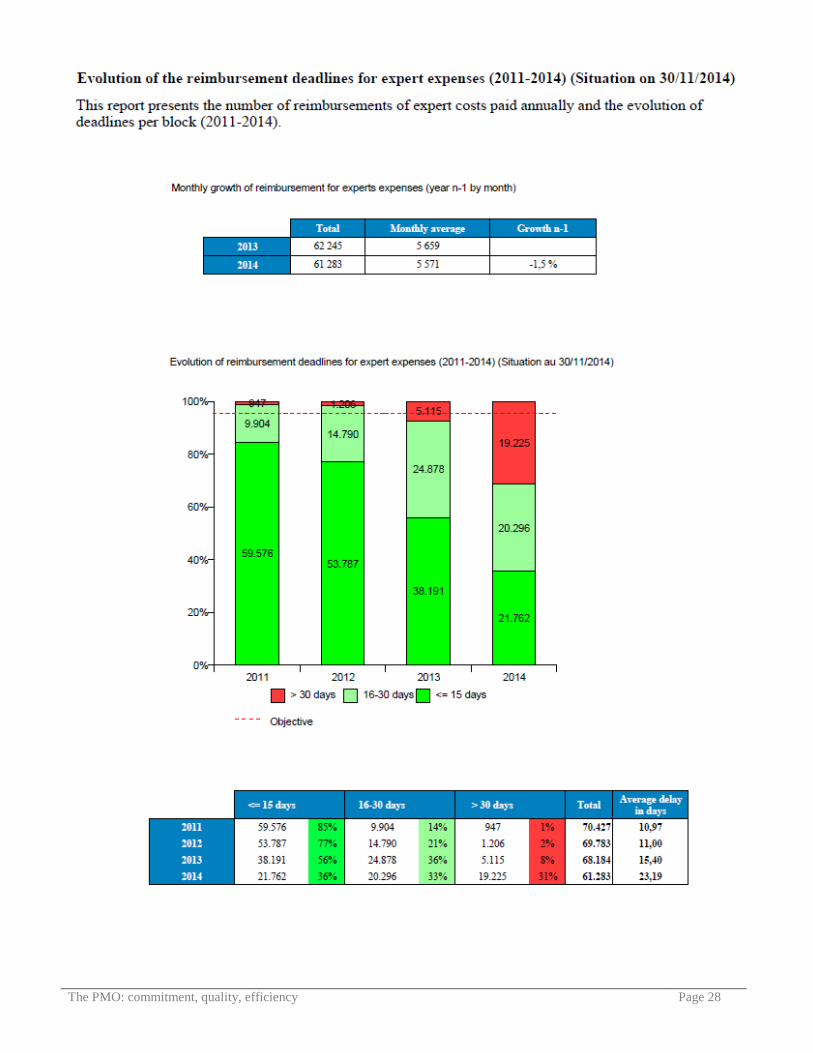
12 Management and payment of expert expenditure Reimbursements 70,000 61,283 70,000 0.0 %
13 Management and payment of SNEs SNEs 2,000 1,880 2,000 0.0 %
(1) Figures extracted from Sysper Commission and Sysper-NEA. Modifications given to individual rights have been counted
(2) Indicative figures of treated files; target should be to avoid backlog and to deal with all incoming files within normal deadlines.
(3) Represents the number of 'items reimbursed': a single medical claim can contain multiple items to reimburse. Instead of measuring the number of medical claims. These
single items, referred to as 'line items' are counted. The introduction of the new IT system led to a different measurement mode.
The PMO: commitment, quality, efficiency Page 25

The PMO: commitment, quality, efficiency Page 26

The PMO: commitment, quality, efficiency Page 27
The PMO: commitment, quality, efficiency Page 28