2015 modularization of korea’s development experience
TRANSCRIPT

Early Warning System for Financial Crisis
2015
2015 Modularization of Korea’s Development Experience:


Early Warning System for Financial Crisis2015 Modularization of Korea’s Development Experience:

Early Warning System for Financial Crisis
Title Early Warning System for Financial Crisis
Supervised by Ministry of Strategy and Finance (MOSF), Republic of Korea
Prepared by Hanyang University
Author Hangyong Lee, Professor, Hanyang University
Advisory Hyungmin Jung, Head of Early Warning System Office,
Korea Center for International Finance
Moon-Soo Kang, Professor, KDI School of Public Policy
and Management
Research Management KDI School of Public Policy and Management
Supported by Ministry of Strategy and Finance (MOSF), Republic of Korea
2015 Modularization of Korea’s Development Experience
Government Publications Registration Number 11-1051000-000678-01
ISBN 979-11-5545-177-9 94320
ISBN 979-11-5545-171-7 [SET 6]
Copyright © 2014 by Ministry of Strategy and Finance, Republic of Korea
Early Warning System for Financial Crisis
Knowledge Sharing Program
Government Publications Registration Number
11-1051000-000678-01
2015 Modularization of Korea’s Development Experience

Preface
The study of Korea’s economic and social transformation offers a unique window of opportunity to better understand the factors that drive development. Within approximately a single generation, Korea transformed itself from an aid-recipient basket-case to a donor country with fast-paced yet sustained economic growth. What makes Korea’s experience even more remarkable is that the fruits of Korea’s rapid growth were relatively widely shared.
In 2004, the Korean Ministry of Strategy and Finance (MOSF) and the Korea Development Institute (KDI) launched the Knowledge Sharing Program (KSP) to assist partner countries in the developing world by sharing Korea’s development experience. To provide a rigorous foundation for knowledge exchange engagements, KDI School has accumulated case studies through the KSP Modularization Program since 2010. During the first five years, the Modularization Program has amassed 138 case studies, carefully documenting noteworthy innovations in policy and implementation in a wide range of areas including economic policy, admistration·ICT, agricultural policy, health and medicine, industrial development, human resources, land development, and environment. Individually, the case studies convey practical knowhow and insights in an easily accessible format; collectively, they illustrate how Korea was able to kick-start and sustain economic growth for shared prosperity.
Building on the success during the past five years, we are pleased to present an additional installment of six new case studies and two e-content topics completed through the 2015 Modularization Program. The six reports employ a wide range of examples to better illustrate the continued efforts to improve the effectiveness of managing the incumbent policy and management. The new case studies continue the tradition in the Modularization Program by illustrating how different agents in the Korean society including the government and civil society organizations worked together to find creative solutions to challenges for shared prosperity.
More specifically, these efforts include strengthening social communication between government and the people for sustainable growth through economic education; as well as open-door policies and measures to ensure fiscal stability while achieving sustainable growth in today’s globalized world; and painstaking efforts to reform the financial industry

using the real-name financial system for fairness and equity; the informatization of personal information to increase effectiveness of public services; building up a national early warning system for fiscal stability and soundness.
Further contributing to knowledge sharing, the e-contents section features videos delving into Korea’s export-oriented growth, often cited as a key government strategy that facilitated Korea’s period of rapid development; and the gaming industry, a key success story in the sector for cultural contents. We also proudly note that the World Bank Group’s Open Learning Campus (OLC), which will be launching in January 2016, has confirmed that it will feature the fourteen e-content programs built by the modularization program thus far.
I would like to express my gratitude to all those involved in the project this year. First and foremost, I would like to thank the Ministry of Strategy and Finance for the continued support for the Modularization Program. Heartfelt appreciation is due to the contributing researchers and their institutions for their dedication in research, to the former public officials and senior practitioners for their keen insight and wisdom they so graciously shared as advisors and reviewers, and also to the KSP Executive Committee for their expert oversight over the program. Last but not least, I am thankful to each and every member of the Development Research Team for their sincere efforts to bring the research to successful fruition, and to Professor Taejong Kim for his supervision.
As always, the views and opinions expressed by the authors in the body of work presented here do not necessarily represent those of KDI School of Public Policy and Management.
December 2015
Joon-Kyung Kim
President
KDI School of Public Policy and Management

06 • Early Warning System for Financial Crisis
Contents | LIST OF CHAPTERS
Chapter 1
Introduction ··································································································································· 15
Summary ······································································································································· 11
Chapter 2
National Early Warning System in Korea ····················································································· 21
1. Structure of the System ···············································································································22
2. KCIF’s Early Warning System ······································································································24
3. FSS and Financial Industry EWS ································································································25
4. EWS for Financial Markets ··········································································································26
5. EWS for Real Estate Market ········································································································26
6. EWS for Petroleum and Commodity ····························································································27
7. EWS for Labor Market ··················································································································28
Chapter 3
EWS for Currency Crisis ··············································································································· 29
1. Methodology: Signal Approach ····································································································30
1.1. Dating Historical Crisis Periods ···························································································30
1.2. Selecting Leading Indicators ································································································32
1.3. Evaluating Forecasting Power of Indicators ········································································32
1.4. Composite Index ···················································································································34
2. Applications ·································································································································35

Contents • 07
Chapter 4
EWS for Financial Industry and Institutions ················································································· 43
1. Daily Financial Soundness Indicators ·························································································44
2. Early Warning Models of the FSS ································································································46
2.1. Risk Index Model ··················································································································47
2.2. Leading Risk Index ···············································································································50
2.3. Early Warning Models for Individual Financial Institutions ················································51
3. CAEL Rating System ····················································································································53
3.1. To Select CAEL Candidate Indicators···················································································54
3.2. To Set Rating Intervals of Each Indicator·············································································55
3.3. To Compute Composite Rating ····························································································57
4. Macroprudential Indicators ·········································································································58
Chapter 5
Policy Recommendations for EWS ······························································································· 63
1. Qualitative Monitoring ··················································································································64
2. Other Policy Recommendations ··································································································67

08 • Early Warning System for Financial Crisis
Contents | LIST OF CHAPTERS
Capital Flows and Crisis Prevention Policy ················································································· 69
1. Foreign Exchange Policy ··············································································································70
2. Prudential Regulations ················································································································72
3. Capital Controls ···························································································································73
4. Sovereign Wealth Fund ················································································································75
5. Bilateral Swaps and Global Financial Safety Nets (GFSNs) ·······················································75
References ···································································································································· 80
Appendices ···································································································································· 82
Chapter 6
Conclusion ···································································································································· 77
Chapter 7

Contents • 09
Contents | LIST OF TABLES
Table 1-1 Underlying Vulnerabilities and Triggers in Selected Crises ········································18
Chapter 1
Chapter 5
Table 5-1 Guidelines on Contingency Policy ················································································67
Chapter 2
Table 2-1 Seven Early Warning Sectors and Public Institutions ·················································23
Table 2-2 Comparison of EW Models and the DFSI ·····································································25
Chapter 3
Table 3-1 Possible Outcomes in Signal Approach ·······································································33
Table 3-2 Leading Indicators ········································································································35
Table 3-3 Crisis Periods ················································································································36
Table 3-4 Noise-to-signal Ratio ····································································································39
Chapter 4
Table 4-1 Daily Financial Soundness Indicators ··········································································45
Table 4-2 Coverage of Early Warning Models for Financial Institutions ·····································46
Table 4-3 Indicators in the Risk Index ··························································································48
Table 4-4 Variables for the Leading Risk Index ············································································51
Table 4-5 Illustrative List of Indicators by Risk Categories ·························································55
Table 4-6 Criteria for Rating Intervals of Component Indicators ················································56
Table 4-7 Thresholds of the Rating Intervals of Indicators ··························································56
Table 4-8 Thresholds for Ratings of Risk Categories: An Illustration ·········································57
Table 4-9 Minimum Composite Score for Composite Ratings ····················································58

010 • Early Warning System for Financial Crisis
Contents | LIST OF FIGURES
Figure 2-1 National Early Warning System in Korea ···································································23
Chapter 2
Chapter 3
Figure 3-1 EMPI ····························································································································36
Figure 3-2 Composite Index ·········································································································40
Chapter 4
Figure 4-1 Credit-GDP Gap in Korea ····························································································60
Figure 4-2 Household Debt-disposable Income Gap in Korea ····················································61
Chapter 5
Figure 5-1 Organization of the KCIF ·····························································································66

Summary
Summary • 011
Since the Mexican crisis in 1994 and the East Asian crisis in 1997, interest in developing early warning systems has soared in emerging market countries. The global financial crisis also increased interest in developing an effective early warning system. Indeed, immediately after the onset of the global financial crisis, the G20 asked the IMF and the FSB (Financial Stability Board) to establish an early warning system for a periodic assessment of system-wide risks.
A financial crisis is a combined result of vulnerability of an economy and specific trigger events. Given that past experience tells us that trigger events are almost unpredictable, an early warning system should aim to identify vulnerabilities of an economy. Thus, IMF(2010) points out that an early warning system is a “flag-raising” exercise, signaling trends that could make markets or countries vulnerable to unanticipated events. If an early warning system can identify vulnerabilities and assess downside tail risks sufficiently in advance, preemptive policy measures can be implemented to reduce the risk of a crisis.
As a part of the effort to prevent another crisis from taking place, the Korean government decided to build up a national early warning system. In 2004, the Presidential Office in Korea launched the project of establishing the national early warning system and it has been in operation since the next year. The national early warning system covers seven different sectors in the economy to detect early symptoms of crisis in each sector. In addition, the system is designed to monitor potential spillover effects across different sector in a more comprehensive way. The seven sectors are foreign exchange market, domestic financial market, domestic financial institutions and industry, petroleum, commodity market, labor market, and real estate market. Each sector is equipped with different quantitative early

012 • Early Warning System for Financial Crisis
warning models independently developed by different public research institutions. Among the seven sectors, early warning systems for the foreign exchange market and financial industry are particularly important.
The early warning system for currency crisis was developed and operated by the Korea Center for International Finance (KCIF). The KCIF was established in 1999 by the Korean government and the Bank of Korea. Having learned that the Asian financial crisis was caused by a foreign currency liquidity problem, the Korean government needed a public institution that could assist the government in preventing currency crises. Thus the main responsibilities of the KCIF are monitoring international financial markets and operating an early warning system for currency crisis. The early warning models in the KCIF employ the signal approach which was first developed and used by Kaminsky and Reinhart (1999). The underlying assumption of the signal approach is that the economy shows unusual behavior shortly before a financial crisis and that this pattern would recur in the next crisis in a systematic way.
The Financial Supervisory Service (FSS) in Korea developed the Financial Industry Early Warning System (FIEWS). The early warning system in the FSS includes the Daily Financial Soundness Indicators (DFSI) and the early warning models. The DFSI, also called the Handy Index Assessment System, is a real time crisis detection system using a small range of handy indices. The early warning models in the FSS include six different models for nine financial sectors and have been in operation since 2007.
The global financial crisis highlights that macroprudential policy is important to limit the vulnerabilities of the economy. To implement macroprudential policy, which aims to achieve the safety and soundness of the financial system as a whole, the authority needs early warning indicators to identify when bank asset growth is excessive. The credit-GDP gap and the ratio of core to noncore liabilities, among other indicators, may point to financial cycle phase, thus serving as useful guidelines for macroprudential policies.
This report also makes several policy recommendations on effective build-up and operation of early warning systems. First, a crisis management manual is required, specifying contingency policies depending on the riskiness. Second, continuous update and revision are important for better performance of the early warning models. Third, as high quality leading indicators are essential prerequisites for a successful early warning system, the government should improve the overall statistical capacity by enhancing the expertise of staff members, adapting new methodologies and upgrading the IT infrastructure. Fourth, it is recommended that simple models are developed before more sophisticated models. In the long-term, auxiliary models are required as supplementary tools to minimize model risks.
Summary • 013
It is true that an early warning model is useful for timely assessment of the risk in the economy, yet it is also clear that all the quantitative models cannot be perfect. This suggests that the governments should strengthen qualitative monitoring on financial markets and institutions. Qualitative monitoring helps identify imminent risk and supplements the quantitative models.
Massive capital inflows may result in economic overheating and asset price bubbles, and the following sudden reversal of capital flows is likely to cause a foreign exchange liquidity problem and, if severe, trigger a currency crisis. This report also describes appropriate policy responses to surges in capital inflow. First, the basic direction of foreign exchange policy is to maintain flexibility of the foreign exchange rate and hold adequate stock of foreign exchange reserves. Past crisis episodes demonstrate the importance of foreign exchange reserves as a self-insurance for the liquidity problems of foreign exchanges. Second, in order to maintain sound a banking system and thereby to prevent a banking crisis, policymakers may strengthen prudential regulations to contain the risks generated by cross-border financial transactions. Third, if these policies are not sufficient, capital controls can be introduced to manage massive capital inflows. Fourth, commodity exporting countries may consider establishing a sovereign wealth fund (SWF). Since commodity exporting countries are vulnerable to swings of commodity prices, a well-managed commodity-based sovereign wealth fund can shield the economy against volatile commodity prices. Fifth, emerging market countries can access the IMF’s lending facilities including the multi-country Flexible Credit Line (FCL) and the Precautionary Credit Line (PCL) before the outbreak of a crisis. They can also establish and use regional financial arrangements.

Chapter 12015 Modularization of Korea’s Development ExperienceEarly Warning System for Financial Crisis
Introduction

Introduction
016 • Early Warning System for Financial Crisis
Interest in building up early warning systems soared in the 1990s with financial crises erupting in emerging market countries. Several projects to design an effective early warning system were initiated after the Mexican crisis in 1994. The East Asian crisis in 1997 provided additional stimulus to this effort and many emerging market countries attempted to establish their own early warning system with technical assistance provided by the international institutions.1 The early warning systems developed after these crises focused mostly on currency crises caused by an excessive external imbalance.
The global financial crisis recalled the importance of an effective early crisis warning system. Indeed, immediately after the onset of the global financial crisis, the G20 asked the IMF and the FSB (Financial Stability Board) to establish an early warning system for a periodic assessment of system-wide risks. The G20 Communique (November 15, 2008) states that the IMF, in collaboration with the expanded FSB and other bodies, should work to better identify vulnerabilities, anticipate potential stress, and act swiftly to play a key role in crisis response. Since the global financial crisis originated in the US and spilled over into other advanced countries and emerging market countries, the early warning systems discussed after the global financial crisis is more likely to focus on the broad financial sector and mechanisms implicated in the contagion across countries and sectors.
Glostein, Kaminsky, and Reinhart (2000) point out that there are two reasons why countries and international institutions became interested in establishing an early warning system. First, financial crises are extremely costly to the national economy and the world economy. The direct government bail-out costs of resolving a crisis is huge. Glostein,
1. Asian Development Bank published “Early Warning System for Financial Crises: Application to East Asia” in 2005.

Chapter 1. Introduction • 017
Kaminsky, and Reinhart report that the bail-out costs amount to 58 percent of GDP for Indonesia, 30 percent for Thailand, 16 percent for Korea, and 10 percent for Malaysia after the Asian financial crisis. In addition to the direct fiscal costs, financial crisis incurs enormous amount of economic and social costs. A sharp decline in economic activity leads to a plunge in household income and a rise in unemployment rate. Moreover, financial crisis in one country often spills over into other countries through close trade or financial linkages as witnessed in the global financial crisis. The high costs of a financial crisis translate into greater returns on a well-functioning early warning system.
Second, there is considerable evidence that a single indicator does not always perform well in predicting a crisis. In particular, forward-looking asset prices have not provided clear signals in recent crisis episodes. For example, the default spread defined by the difference in interest rates between higher-rated bonds and lower-rated bonds failed to signal vulnerability before the onset of financial crisis. The spread between domestic and foreign interest rates did not widen significantly prior to the crises in emerging market countries. Sovereign credit ratings also failed to predict past financial crises. This is partly because asset prices may not reflect timely, accurate, and comprehensive information on the borrower’s credit worthiness. Moreover, asset prices sometimes embed the market expectation that the government or the international institutions will bail out the troubled borrowers.
Meanwhile, an early warning system is comprehensive in that it uses all available information to identify the vulnerability of an economy. It extracts relevant information in a systematic way from a large set of economic and financial indicators to maximize predictability of crisis. Moreover, since an early warning system is based on the historical experiences of past crises and well-defined methodology, the early signals from the system are more likely to be reliable.
A financial crisis is a combined result of vulnerabilities of an economy and specific trigger events. In this regard, IMF (2010) notes that underlying vulnerability is a necessary but not a sufficient condition for financial crises. Vulnerability includes asset price bubble, currency or maturity mismatch in the balance sheets of banks or non-financial corporations, insufficient capitalization, and so on. A trigger, in contrast, could be any event such as terms of trade shocks, monetary tightening in foreign countries, political uncertainty and contagion from other countries. In the case of Korea, financial crisis in 1997 was triggered by the deterioration in terms of trade, lower profitability of chaebols, and contagion from the crisis in Thailand. The vulnerabilities in Korea, however, were excessively high leverage of corporate sector along with currency and maturity mismatch between assets and liabilities. <Table 1-1>, adapted from Ghosh and others (2008, 2009), describes the vulnerabilities and trigger events in recent crisis episodes.

018 • Early Warning System for Financial Crisis
Table 1-1 | Underlying Vulnerabilities and Triggers in Selected Crises
Crisis Vulnerability Trigger
Finland (1991)Norway (1988)Sweden (1991)
Credit and house price booms, overheating, thin capitalization of banks, concentrated loan exposures, domestic lending in foreign currency, financial deregulation without strengthening of prudential regulation and supervision; weaknesses in risk management at the individual bank level.
Tax reforms, tightening of monetary policy, collapse of trade with the Council for Mutual Economic Assistance, exchange rate depreciation
Mexico (1994)Government’s short-term external (and foreign exchange-denominated) liabilities
Tightening of U.S. monetary policy, political shocks
Argentina (1995)Banking system short-term external and peso and FX-denominated liabilities
Contagion from Mexico crisis
Japan (1995)
Credit and real estate boom, financial deregulation without strengthening of prudential regulation and supervision, weak corporate governance and regulatory forbearance.
Real estate collapse
Thailand (1997)
Financial and nonfinancial corporate sector external liabilities, concentrated exposure of finance companies to property sector
Terms of trade deterioration, asset price deflation
Korea (1997)
Financial sector external liabilities (with substantial maturity mismatch) and concentrated exposure to chaebols, high corporate debt/equity ratio
Terms of trade deterioration, profitability of chaebols, contagion from Thailand crisis
Indonesia (1997)
Corporate sector external liabilities, concentration of banking system assets in real estate/property-related lending, high corporate debt/equity ratio
Contagion from Thailand crisis, banking crisis
Russia (1998)Government’s short-term external financing needs
Failure to implement budget deficit targets; terms of trade deterioration

Chapter 1. Introduction • 019
Crisis Vulnerability Trigger
Brazil (1999)Government’s short-term external liabilities
Doubts about ability to implement budget cuts; current account deficit; contagion from Russian default
Turkey (2000)Government short-term liabilities; banking system foreign exchange and maturity mismatches
Widening current account deficit, real exchange rate appreciation, terms of trade shock; uncertainty about political will of the government to undertake reforms in the financial sector
Argentina (2002)Public and private sector external and FX denominated liabilities
Inconsistency between currency board arrangement and fiscal policy; Russian default
Uruguay (2002)Banking system short-term external liabilities.
Argentine deposit freeze leading to mass withdrawals from Uruguayan banks
United States(2007)
Credit and house price boom, weaknesses in financial regulation resulting in a build-up of leverage and mispricing of risk
Collapse of the subprime mortgage market
Source: Ghosh and others (2008, 2009).
Past experience tells us that trigger events are nearly unpredictable. This points to the difficulty of predicting the time of outbreak of a crisis. Therefore, an early warning system should aim to identify vulnerabilities of an economy, and not to predict trigger events themselves or the timing of the triggers. Indeed, IMF (2010) defines an early warning system as a “flag-raising” exercise, signaling trends that could make markets or countries vulnerable to unanticipated events, rather than actually predicting the next crisis.
If an early warning system can identify vulnerabilities and assess the downside tail risks sufficiently in advance, preemptive policy measures can be implemented to reduce the risk of a crisis. Controlling asset price bubbles, restricting foreign currency exposure of financial institutions and non-financial corporations, and requiring higher capitalization are examples of corrective actions to mitigate the build-up of vulnerabilities.
The performance of existing early warning models is mixed. It is well known that the early warning models’ predictions contain substantial information about crisis, but it is also true that the models often give rise to false alarms. Nevertheless, the false alarms do not necessarily imply mistakes in the model. When warning signals are issued and the

020 • Early Warning System for Financial Crisis
government takes appropriate policy measures to avoid a crisis successfully, only false alarms are observed ex post even though they are true warning signals. More generally, the models correctly send warning signals that countries are truly at risk, but a crisis may not occur because of favorable external situations or as a result of pure good luck.
Given that the ultimate goal is to prevent a crisis, an effective early warning system should identify growing vulnerability not only sufficiently in advance but also convincingly. Unfocused and vague warning signals are not likely to lead the government to adopt prompt and corrective policy actions. Thus, an early warning system requires rigorous analysis on the possible worst case scenarios and active communications with the government.
The purpose of this report is to describe Korea’s early warning system and explain the technical aspects of the models thereby to help emerging market countries build up their own early warning systems for financial crisis. In particular, this report focuses on the methodology and the indicators employed in the Korea Center for International Finance (KCIF)’s early warning model for currency crisis and the Financial Supervisory Service (FSS)’s model for financial industry. This report also provides several recommendations for developing and operating an early warning system and describes the policy toolkits to prevent currency crisis in response to massive capital flows across borders.
This report does not attempt to evaluate the performance of the early warning system in Korea. This is because the outcome of the early warning system has been confidential. In fact, the government keeps the official outcome of the early warning system confidential to prevent adverse reactions by the financial markets. Nevertheless, the fact that the KCIF revised the existing early warning model and also developed new models after the global financial crisis suggests that the early warning model might not perform well in predicting the 2008~09 crisis.
This report is organized as follows. Chapter 2 describes the national early warning system in Korea. Chapter 3 explains the signal approach, which is the most popular toolkit for building up an early warning system. Then, the report provides applications for early warning systems of currency crisis for a number of Asian countries. Chapter 4 documents the early warning system for the financial industry and financial institutions developed by the FSS. It also discusses macroprudential indicators. Chapter 5 discusses the operation of an early warning system with several policy recommendations for emerging market countries. Chapter 6 explains crisis prevention policy in response to volatile capital flows. Chapter 7 concludes.

Chapter2 2015 Modularization of Korea’s Development ExperienceEarly Warning System for Financial Crisis
National Early Warning System in Korea
1. Structure of the System
2. KCIF’s Early Warning System
3. FSS and Financial Industry EWS
4. EWS for Financial Markets
5. EWS for Real Estate Market
6. EWS for Petroleum and Commodity
7. EWS for Labor Market
National Early Warning System in Korea
022 • Early Warning System for Financial Crisis
1. Structure of the System
As a result of lessons learned from the currency crisis in 1997, Korean government strengthened macroeconomic and financial management. As a part of the effort to prevent another crisis from taking place, the Korean government decided to build up a national early warning system. In 2004, the Presidential Office in Korea launched the project of establishing the national early warning system and it has been operated since the next year. The system covers seven different sectors in the economy to detect early symptoms of crisis in each sector. In addition, the system is designed to monitor potential spillover effects across different sector in a more comprehensive way.
The seven sectors are foreign exchange market, domestic financial market, domestic financial institutions and industry, petroleum, commodity market, labor market, and real estate market.2 Each sector is equipped with different quantitative early warning models independently developed by different public research institutions. <Table 2-1> shows the seven sectors and the institutions responsible for developing early warning models.
2. The labor market early warning system is replaced by the public finance early warning system. Development of more sophisticated early warning models for public finance is currently underway.

Chapter 2. National Early Warning System in Korea • 023
Table 2-1 | Seven Early Warning Sectors and Public Institutions
Early Warning Model Institution
Currency Crisis Korea Center for International Finance (KCIF)
Financial Market Financial Services Commission (FSC)
Financial Institutions Financial Supervisory Service (FSS)
Energy Korea National Oil Corporation (KNOC)
Commodity Korea Institute for Industrial Economics (KIET)
Labor Market Korea Labor Institute (KLI)
Real Estate Market Korea Research Institute for Human Settlements (KRIHS)
Source: Lee and Lee (2014).
Each institution has its counterparty ministry and submit reports on the results of the early warning models to the ministry. The public institution and the ministry also closely collaborate in monitoring the sector. The Ministry of Strategy and Finance collects the results from the sectors for overall assessment for risks of the economy before reporting to the presidential office.
Figure 2-1 | National Early Warning System in Korea
FXMarket
MOSFKCIF
FinancialMarket
FSC
FinancialInstitution
FSS MOTIEKNOC
MOTIEKIET
MOELKLI
RealEstate
MOLITKRIHS
Energy Commodity Labor
President
MOSF
Note: MOSF: Ministry of Strategy and Finance, MOTIE: Ministry of Trade, Industry and Energy, MOEL: Ministry of Employment and Labor, MOLIT: Ministry of Land, Infrastructure and Transport.
Source: Lee and Lee (2014), Jung (2015).

024 • Early Warning System for Financial Crisis
2. KCIF’s Early Warning System
The Korea Center for International Finance (KCIF) is operating the early warning system for currency crisis.3 The KCIF’s early warning system has four models: the domestic crisis assessment model, the international financial market risk model, the domestic financial market risk model and the proximate crisis assessment model. The domestic crisis assessment model was developed in 1999 based on the signal approach which will be explained in the next chapter. This model uses twenty six leading indicators from four sectors: domestic real sector (such as industrial production), domestic financial sector (such as stock price and dishonored bill ratio), external real sector (such as current account balance, trade volume, and terms of trade), and external financial sector (such as external debt and capital account balance). In this model, a composite index calculated as a weighted sum of signals from the leading indicators summarizes the overall risks of currency crisis in the next twelve months. In addition, composite indexes for each of the four sectors are also constructed independently to measure the risk levels of each sector.
The global financial crisis casts doubt on the effectiveness of the domestic crisis assessment model. The domestic crisis assessment model is designed to assess the likelihood of a crisis caused by problems in domestic factors. Thus, it is not a good monitoring tool when a crisis from abroad spills over into the domestic economy. Faced with this challenge, the KCIF decided to develop new quantitative models. At the same time, the domestic crisis assessment model was upgraded to reflect the changes in risk caused by the global financial crisis.
The newly developed international financial market risk index model monitors volatility in international financial markets. It has five market sectors: international stock market, international bond market, foreign exchange market, interbank funding market and investor sentiment. The model uses major stock market price indexes such as Dow Jones Industrial, Dax, and FTSE, CDS premiums, bond market spread, and implied volatilities of exchange rates. The domestic financial market risk index model monitors the volatility in domestic financial market including domestic stock market, bond market and foreign exchange market. It also keeps a close watch on capital flows across borders.
The proximate risk index model is designed to identify newly developing imminent risks in the external sector of the economy. This model is practically useful and important, but newly developing risks imply that it is difficult to find relevant past episodes. Therefore,
3. Details of the KCIF’s models can be found in Jung (2015).

Chapter 2. National Early Warning System in Korea • 025
the model cannot employ a sophisticated statistical methodology and must often rely on the modelers’ discretion. A simple ratio or a deviation from the historical average is often used to construct the index.
3. FSS and Financial Industry EWS
The Financial Supervisory Service (FSS) in Korea developed the Financial Industry Early Warning System (FIEWS).4 The liquidity crunch of credit card companies in 2003 as well as the Asian financial crisis served a momentum to developing the system. The early warning system in the FSS includes the Daily Financial Soundness Indicators (DFSI) and the early warning models. The DFSI, also called the Handy Index Assessment System, is a real time crisis detection system using a small range of handy indices. The early warning models in the FSS include six different models for nine financial sectors and have been operated since 2007. A comparison of the two systems is presented in <Table 2-2>.
Table 2-2 | Comparison of EW Models and the DFSI
EW Models DFSI
ObjectiveAssessment and estimation of the risk level of financial industry and companies
Real time monitoring of risk levels in the financial industry and companies
Operation Statistical quantitative modelsRating of a small number of handy indexes
DataFinancial information of financial companies and macroeconomic data
Indexes for solvency, profitability and liquidity, etc.
Frequency Quarterly Daily
Source: Financial Supervisory Service.
Following the FSS, there are three distinct features in the early warning models of the FSS. First, they are designed to detect not only the early signs of insolvency of individual financial institutions, but also the early symptoms of crisis in the financial industry as a whole. Thus, the early warning models of the FSS are designed from both microprudential and macroprudential perspectives. Second, the early warning models incorporate the market
4. The Financial Supervisory Service was established in January, 1999, under the Act on the Establishment of Financial Supervisory Organizations. Banking Supervisory Authority, Securities Supervisory Board, Insurance Supervisory Board, and Non-bank Supervisory Authority were merged into a single supervisory authority. The FSS is responsible for examination and supervision of financial institutions.

026 • Early Warning System for Financial Crisis
assessment including stock and bond market variables and information from credit rating companies as well as balance sheet variables and macroeconomic data. For example, the FSS developed the credit rating prediction model and the expected default frequency (EDF) model which uses stock market information. Third, the FSS minimizes modeling risk by developing several different models. If different models produce the same early warning signals, supervisors may have more confidence in the outcome.
4. EWS for Financial Markets
The early warning system for financial markets attempts to detect signs of instability in stock market, bond market, and loan market. A stock market crash or liquidity crunch in bank loans are major concerns of this early warning model. However, predicting the erratic behavior of financial asset prices is very difficult because asset prices can fluctuate by changes in investors’ sentiment not related to any changes in fundamentals.
The early warning system for financial markets, developed by Kang, Kim and Lee (2005), also employs the signal approach. The periods of financial market instability are identified by unusual behaviors in stock price, corporate bond yield, and the rate of dishonored bill. In addition, the trading volumes in stock and bond markets, the volatility of stock price and bond yield, term spread and default spread are also used to determine the periods of financial instability. The identified periods include the period of the collapse of Daewoo in 1999, the liquidity crunch of Hyundai group in 2000~01, the credit card crisis in 2003 and the currency crisis period in 1997. Thus, the crisis periods in the early warning model for financial markets are more broadly identified than the model for currency crisis,
The leading indicators considered in the model are categorized into four groups: monetary and credit variables (such as monetary aggregate and credit growth), stock market variables (such as foreign investors’ net investment and dividend-price ratio), macroeconomic variables (such as foreign exchange reserve, unemployment rate), and foreign variables (such as the US stock return, LIBOR, and oil price).
5. EWS for Real Estate Market
The early warning system for the real estate market has two different yet closely related models. They are the national model and the regional model which examine housing prices and land prices. The national model deals with aberrant behaviors of the nation-wide real estate market while the regional model focuses on the Seoul metropolitan area. The regional
Chapter 2. National Early Warning System in Korea • 027
model is important because changes in housing prices in Seoul are ultimately expected to spill-over into other regions. The national model employs signaling approach and the regional model uses a probit model. The leading indicators in the models are financial indicators (such as liquidity in financial institutions and stock price index) and macroeconomic variables (interest rate and business cycle related variables) as well as real estate related variables (such as construction orders). A report of the findings of the early warning models is submitted to a committee to incorporate qualitative judgments. The committee is made up of members from real estate industry, academia, research institutes and the government.
6. EWS for Petroleum and Commodity
Korea lacks natural resources and thus imports petroleum and other commodities from abroad. Hence, a sudden jump in the prices of such commodities can have huge adverse impacts on the domestic economy. An early warning system in this sector, therefore, is an important part of the national system. Nevertheless, the petroleum and commodity sectors are unique in that the prices are determined in the international markets. So, even though the model sends an early warning signal of an imminent jump in prices, the Korean government cannot prevent or reduce the price changes. Nevertheless, the early warning signals make it possible for the government and the private sector to prepare for emergencies in order to reduce the adverse effects of higher commodity prices.
The early warning system for petroleum uses an artificial neural network model to monitor the global petroleum market. The leading indicators considered in the model are the US petroleum inventory, OPEC’s oil production, business cycle variables, and the net position in futures contracts on crude oil. It is true, however, that forecasting future changes in world oil prices is very difficult partly because non-economic factors such as geopolitical situations, natural disasters, and OPEC’s energy policy are also important determinants.
Unlike other sectors, the results of the early warning system for petroleum are released to the public. This is because international markets are not likely to react to the outcomes of the early warning system. Rather, this information can help firms prepare for potential rises in oil price.
The early warning system for other commodities also monitors global economic variables such as business cycles in major countries, inventory of each commodity, and commodity futures prices. Like petroleum, the model for other commodities may have limited forecasting power as the prices of commodities are also determined by non-economic factors. Thus, qualitative monitoring should be emphasized in this sector.

028 • Early Warning System for Financial Crisis
7. EWS for Labor Market
Two different early warning models are developed to monitor labor markets. The first model is developed to predict a sharp decline in the employment rate in the next three months. The leading indicators in this model are mostly business cycle related variables including production and investment. The second early warning model is designed to monitor labor union-management relations. This model keeps a watch on strikes and other problems between labor union and management in order to reduce the potential cost of strikes.

Chapter 32015 Modularization of Korea’s Development ExperienceEarly Warning System for Financial Crisis
EWS for Currency Crisis
1. Methodology: Signal Approach
2. Applications

EWS for Currency Crisis
030 • Early Warning System for Financial Crisis
1. Methodology: Signal Approach
The signal approach was first developed and used by Kaminsky and Reinhart (1999) to assess the predictability of macroeconomic and financial variables for the joint currency and banking crises. Since then, the signal approach has been widely employed in building up an early warning system in emerging market countries. The underlying assumption of the signal approach is that the behavior of an economy is unusual right before financial crisis and that this unusual behavior would repeat itself systematically in subsequent crises. Kaminsky, Lizondo, and Reinhart (1998) provide empirical support for this pattern. The signal approach is also widely used in the national early warning system in Korea. The KCIF’s model for currency crisis, the early warning model for financial markets, and the model for the national real estate market employ the signal approach. This subsection describes how to build up an early warning model using this approach. Kim, Lee, and Thanh (2011), Lee and Tsedevsuren (2013) and Lee and Lee (2014) also explain the signal approach in developing early warning models for selected Asian countries.
1.1. Dating Historical Crisis Periods
The first step to set up an early warning model is to identify historical crisis periods. Sometimes, crisis periods are determined according to big events that triggered financial crises. For example, the collapse of Lehman Brothers can be considered a start date of the global financial crisis.
However, most models date crisis periods in a statistical way which requires a clear definition of currency crisis. Countries hit by a currency crisis experienced large losses in

Chapter 3. EWS for Currency Crisis • 031
foreign exchange reserves and/or a sharp depreciation of the domestic currency. Given this observation, early warning models for currency crisis typically identify the crisis periods based on a foreign exchange market pressure index (EMPI) proposed by Eichengreen, Rose, and Wyplosz (1994). EMPI is a weighted average of the changes in foreign exchange rates and the changes in foreign exchange reserves as follows:
EMPI = (∆e-μ∆e)/σ∆e – (∆RES - μ∆RES)/σ∆RES,
where ∆e and ∆RES are the percentage changes in the nominal exchange rate against US dollar and the percentage changes in foreign exchange reserves minus gold (in US dollar), respectively.5 μ∆e and μ∆RES are the sample means of the changes in exchange rate and the changes in reserves, respectively. σ∆e and σ∆RES denote the standard deviations of the variables. Changes in exchange rate and changes in foreign exchange reserves are divided by their standard deviations so that both variables have the same sample volatility. An increase in EMPI by either a depreciation of the currency or a loss of foreign exchange reserves implies strong pressure on selling the domestic currency.
In practice, the crisis periods are identified when the EMPI is higher than its mean by more than k times its standard deviation where k is an arbitrary number. That is, in crisis periods,
EMPI > μ + kσ,
where μEMPI is the sample mean and σEMPI is the standard deviation of the EMPI.
An alternative way to date crisis periods is to set a fixed cutoff value for changes in exchange rate and/or changes in foreign exchange reserves. For example, crisis periods are chosen if the exchange rate depreciation rate is greater than 20 percent and/or the percentage loss of reserves is greater than 30 percent.
If we are interested in building up an early warning model for a more broadly defined financial crisis, other financial pressure index can also be constructed and used to identify historical crisis periods. For example, interest rates, stock returns, and the volatility of returns can be incorporated to construct a financial pressure index. For example, similar to EMPI, a stock market pressure index (SMPI) can be constructed with changes in stock price index and its volatility. Since a large decline in stock price corresponds to a crisis, changes in stock price index are multiplied by minus one. The volatility of stock returns can be estimated by GARCH-type time series models. Then, SMPI can be defined as a weighted
5. Eichengreen, Rose, and Wyplosz (1994) also include changes in short-term interest rate to date crisis periods.

032 • Early Warning System for Financial Crisis
average of normalized changes in stock price and its volatility measure. A bond market pressure index (BMPI) can also be constructed with normalized changes in nominal interest rate. Finally, a broad composite financial market pressure index (FMSI) is simply the sum of the EMPI, SMPI, and BMPI.
FSI = EMPI + SMPI + BMPI.
1.2. Selecting Leading Indicators
Given the identified crisis periods, we need to select leading indicators which have potential forecasting power for future crises. The candidate leading indicators are chosen based on theoretical backgrounds and timely availability of data. Kaminsky, Lizondo, and Reinhart (1998) document a large set of leading indicators studied in the literature.
In fact, this step is analogous to the selection process for constructing a composite leading index for business cycle. According to OECD (2008), the following criteria are important in selecting leading indicators. First, most importantly, leading indicators should be evaluated based on the predictability of the indicator. Second, the value of the leading indicator should be close to the (unknown) true value. The accuracy of leading indicators is often related to the credibility of the data source. The credible source implies that the data is produced professionally in line with appropriate statistical standards. In this sense, leading indicators compiled by an official source such as the national statistical office are preferred. Third, good leading indicators should convey information that is timely since outdated information may be insufficient in predicting a crisis. Therefore, the short time interval between availability of the data and the event that the data describes is important. Fourth, leading indicators need to be accessed from original sources, contributing to the credibility of the early warning models. Fifth, the definitions and the classifications of leading indicators should be available. Sixth, leading indicators should be compiled according to common concepts, definitions and methodology over time.
1.3. Evaluating Forecasting Power of Indicators
A good leading indicator should send warning signals in advance of the outbreak of a crisis. To evaluate the predictability of leading indicators, we need to set a forecasting horizon, also called as crisis window or signaling horizon, which is the maximum lead time of indicators. If this signaling horizon is too short, the early warning model cannot work properly because policymakers do not have sufficient time to prevent crisis. If the horizon is too long, on the other hand, most indicators may lose forecasting power. Considering this

Chapter 3. EWS for Currency Crisis • 033
tradeoff, the maximum time interval between the issues of signals and the onset of the crisis is usually set 12 or 24 months.6
Once the crisis periods are identified and the signaling time horizon is determined, we select leading indicators based on a statistical test. As in usual hypothesis tests, the process of selecting indicators calls for a threshold or critical value which divides the probability distribution of the indicator. The optimal threshold is chosen so that the forecasting power of the indicator can be maximized.7
Given the threshold value for each indicator, a leading indicator issues a warning signal when it is above the threshold value. Thus, for any indicator, each point of time falls into one of the four cases as in <Table 3-1>. If an indicator issues a signal and a crisis beaks out within the signaling horizon, the signal is a correct one (cell A). If an indicator sends a signal but no crisis beaks out, this signal is said to be a false alarm or noise (cell B). In contrast, when an indicator does not send a signal but a crisis beaks out, it is a missed call (cell C). The last one is the case with no signal and no crisis (cell D). Hence, a good leading indicator has more observations in cell A and cell D, while fewer observations in cell B and cell C. In contrast, a noisy indicator has fewer observations in cell A and cell D, and more observations in cell B and cell C.
Table 3-1 | Possible Outcomes in Signal Approach
Crisis Occursin the Crisis Window
No Crisis Occursin the Crisis Window
Signal Issued A B (False Alarms)
No Signal Issued C (Missed Calls) D
Based on the observations in <Table 3-1>, several ratios are suggested to evaluate the forecasting power of leading indicators. First, (A+D)/(A+B+C+D) is the proportion of correct signals. Second, A/(A+C) is the proportion of correctly called crisis given that a crisis actually breaks out. Similarly, 1-[A/(A+C)]=C/(A+C) is the proportion of missed calls given the outbreak of a crisis, which is Type I errors. Third, D/(B+D) is the proportion of no crisis periods correctly predicted given that no crisis breaks out. 1-[D/(B+D)] is the
6. The time interval between signal and crisis could be different across indicators, crisis episodes, and countries. But, the signaling horizon of 12 or 24 months seems to be appropriate for most indicators.
7. Technically, a grid search procedure is employed to obtain the minimum noise-to-signal ratio and the associated threshold values.
034 • Early Warning System for Financial Crisis
proportion of false alarms given no crisis, which is Type II errors. Fourth, A/(A+B) is the proportion of correct signals among the observations of signals issued and 1-[A/(A+B)] is the proportion of false alarms among the issued signals. Note that Pr(Crisis|Signal) = A/(A+B) is the conditional probability. To the extent that an indicator is informative in prediction crisis, the conditional probability is greater than the unconditional probability of (A+D)/(A+B+C+D). Fifth, [B/(B+D)]/[A/(A+C)] the ratio of the proportion of false alarms to the proportion of correct signals. This measure is known as the noise-to-signal ratio (NSR), the most important and frequently used statistic to evaluate the performance of leading indicators in the signal approach. Note that the noise-to-signal ratio can also be written as type II error/(1-type I error).
Different indicators would yield different noise-to-signal ratios. If an indicator has no forecasting power and thus issues signals at random, the noiseto-signal ratio converges to one as sample size increases. Therefore, if an indicator exhibits a noise-to-signal ratio higher than one, it is not a good leading indicator with excessive noise.
An alternative way to select leading indicators is to use a regression analysis. The dependent variable takes on one if time t is a crisis period and zero otherwise. The explanatory variables are leading indicators. Then, a probit or a logit model can be employed to evaluate the forecasting power of the leading indicators. If the estimated coefficients on the leading indicators are economically and statistically significant, they are selected for the final model and the regression results help to infer the probability of crisis.
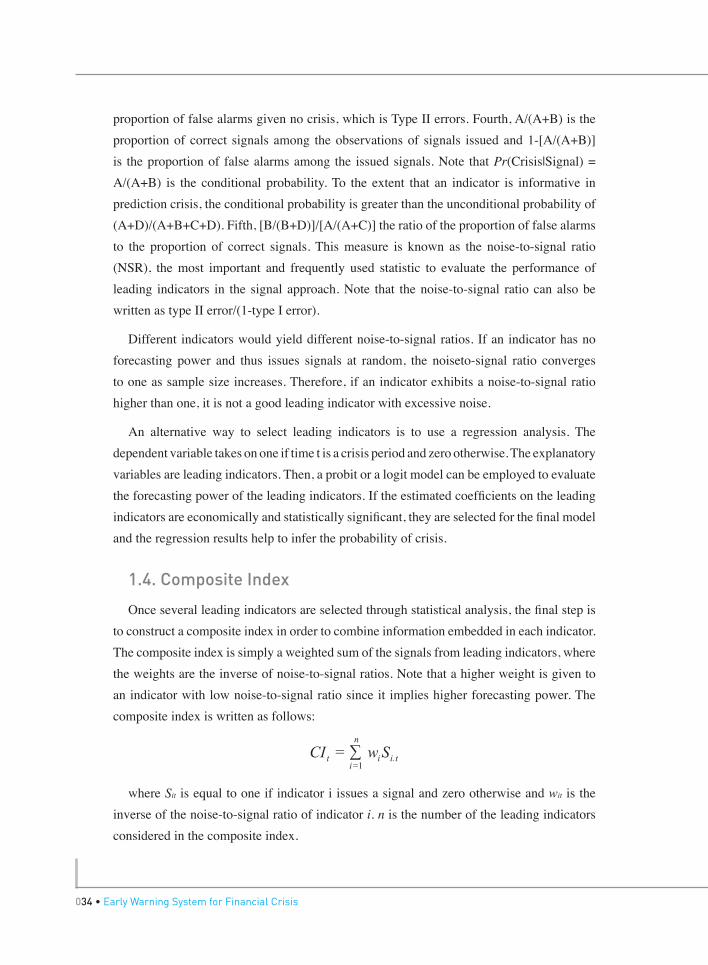
1.4. Composite Index
Once several leading indicators are selected through statistical analysis, the final step is to construct a composite index in order to combine information embedded in each indicator. The composite index is simply a weighted sum of the signals from leading indicators, where the weights are the inverse of noise-to-signal ratios. Note that a higher weight is given to an indicator with low noise-to-signal ratio since it implies higher forecasting power. The composite index is written as follows:
,
where Sit is equal to one if indicator i issues a signal and zero otherwise and wit is the inverse of the noise-to-signal ratio of indicator i. n is the number of the leading indicators considered in the composite index.
Chapter 3. EWS for Currency Crisis • 035
Alternative way to construct a composite index is using equal weighs for the indicators. In this case, the composite index simply reflects the number of indicators that issue warning signals. This alternative measure can be written as
.,
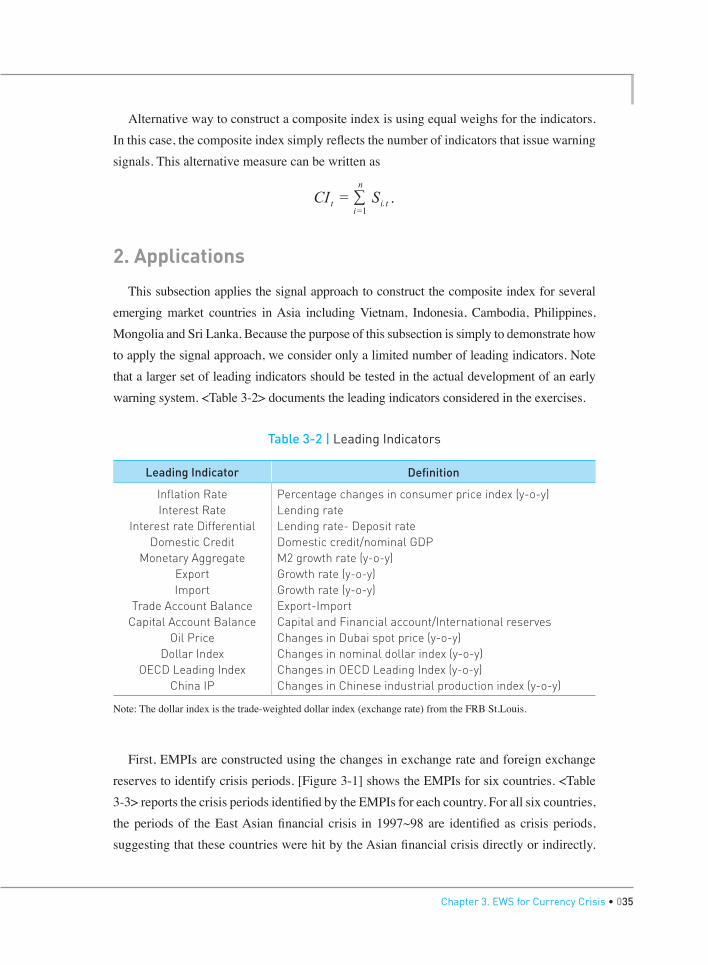
2. Applications
This subsection applies the signal approach to construct the composite index for several emerging market countries in Asia including Vietnam, Indonesia, Cambodia, Philippines, Mongolia and Sri Lanka. Because the purpose of this subsection is simply to demonstrate how to apply the signal approach, we consider only a limited number of leading indicators. Note that a larger set of leading indicators should be tested in the actual development of an early warning system. <Table 3-2> documents the leading indicators considered in the exercises.
Table 3-2 | Leading Indicators
Leading Indicator Definition
Inflation RateInterest Rate
Interest rate DifferentialDomestic Credit
Monetary AggregateExportImport
Trade Account BalanceCapital Account Balance
Oil PriceDollar Index
OECD Leading IndexChina IP
Percentage changes in consumer price index (y-o-y)Lending rateLending rate- Deposit rateDomestic credit/nominal GDPM2 growth rate (y-o-y)Growth rate (y-o-y)Growth rate (y-o-y)Export-ImportCapital and Financial account/International reservesChanges in Dubai spot price (y-o-y) Changes in nominal dollar index (y-o-y)Changes in OECD Leading Index (y-o-y)Changes in Chinese industrial production index (y-o-y)
Note: The dollar index is the trade-weighted dollar index (exchange rate) from the FRB St.Louis.
First, EMPIs are constructed using the changes in exchange rate and foreign exchange reserves to identify crisis periods. [Figure 3-1] shows the EMPIs for six countries. <Table 3-3> reports the crisis periods identified by the EMPIs for each country. For all six countries, the periods of the East Asian financial crisis in 1997~98 are identified as crisis periods, suggesting that these countries were hit by the Asian financial crisis directly or indirectly.

036 • Early Warning System for Financial Crisis
The periods of the global financial crisis are also identified by the EMPI in Indonesia, Philippines, Sri Lanka, and Vietnam but not in Cambodia and Mongolia.8 Nevertheless, the periods from September 2008 to August 2010 are considered as crisis periods in Cambodia and Mongolia in this exercise.
Table 3-3 | Crisis Periods
Country Crisis Periods K
Cambodia 1998/05, 2008/09~2010/08 1.5
Indonesia1997/08, 1997/10, 1997/12, 1998/01, 1998/05, 1998/06, 2000/09, 2006/06, 2008/10, 2011/09
1.5
Mongolia 1995/04, 1998/01, 2003/12, 2008/09~2010/08 2.0
Philippines1995/02, 1997/07, 1997/09, 1997/12, 1998/01, 1998/06, 2000/10, 2008/10
2.0
Sri Lanka 1998/07, 2000/11, 2001/01, 2009/01, 2009/03, 2011/09, 2011/11 1.4
Vietnam1997/03, 1997/10, 1997/11, 1998/02, 1998/08, 2001/06, 2001/11, 2008/05, 2008/06, 2009/04, 2009/11, 2010/02, 2010/03, 2011/02
1.5
Figure 3-1 | EMPI
4
2
0
-2
-4
-6
-8
-10
-12
-14
94 96 98 00 02 04 06 08 10 12
A. Cambodia
8. For the sample period between 1999 and 2011, Lee and Tsedevsuren (2013) report that three months (2008.12, 2009.1, and 2009.2) during the global financial crisis are identified as crisis periods in Mongolia when k is set equal to 2.2. Note that lower k identifies more crisis periods. In fact, in April 2009, IMF approved a Stand-by Arrangement in the amount of SDR 153.3 million to Mongolia.

Chapter 3. EWS for Currency Crisis • 037
4
2
0
-2
-4
-6
-894 96 98 00 02 04 06 08 10 12
C. Mongolia
10
8
6
4
2
0
-2
-494 96 98 00 02 04 06 08 10 12
B. Indonesia
8
6
4
2
0
-2
-494 96 98 00 02 04 06 08 10 12
D. Philippines

038 • Early Warning System for Financial Crisis
12
10
8
6
4
2
0
-2
-4
-6
-894 96 98 00 02 04 06 08 10 12
E. Sri Lanka
5
4
3
2
1
0
-1
-2
-3
-494 96 98 00 02 04 06 08 10 12
F. Vietnam
Given the identified crisis periods in <Table 3-3>, the forecasting power of the leading indicators in <Table 3-2> are evaluated as explained in the previous section. In this exercise, leading indicators are selected if the noise-to-signal ratio is less than one. <Table 3-4> reports the noise-to-signal ratios for the leading indicators. Among the leading indicators, inflation rate, trade account balance, oil price, and dollar index exhibit a noise-to-signal ratio of less than one for every country.

Chapter 3. EWS for Currency Crisis • 039
Table 3-4 | Noise-to-signal Ratio
(1) (2) (3) (4) (5) (6)
Inflation Rate 0.08 0.38 0.22 0.40 0.41 0.53
Interest Rate 2.22 0.24 0.61 0.19 1.66 0.26
Interest Rate Differential 11.16 1.09 0.28 0.59 0.36 1.35
Domestic Credit 0.03 3.29 0.69 - 1.25 0.25
Monetary Aggregate 0.18 0.46 0.44 0.33 2.25 0.26
Export 0.07 4.91 0.36 1.56 1.23 0.19
Import 1.42 0.40 0.54 0.37 0.36 0.56
Trade Account Balance 0.17 0.79 0.79 0.29 0.39 0.24
Capital Account Balance 0.06 0.42 2.22 - 0.72 0.36
Oil Price 0.23 0.16 0.34 0.19 0.20 0.48
Dollar Index 0.27 0.65 0.40 0.57 0.24 0.10
OECD Leading Index 0.19 1.80 0.34 1.41 0.39 0.00
China IP 0.57 1.36 1.27 0.88 0.48 0.39
Note: (1) Cambodia (2) Indonesia (3) Mongolia (4) Philippines (5) Sri Lanka (6) Vietnam.
Then, a composite index is constructed with the selected leading indicators where the weights are the inverse of the noise-to-signal ratios. [Figure 3-2] illustrates the composite indexes. In [Figure 3-2], the shaded areas denote the crisis periods identified by the EMPIs. [Figure 3-2] shows that the composite indexes send crisis warning signals as they tend to rise before the crisis periods. For example, the composite index for Cambodia began to rise sharply in late 2007 or early 2008 after prolonged periods, indicating that the vulnerability of the domestic economy is increasing. The results for Cambodia and other countries show the potential usefulness of an early warning system. If the government implements appropriate policies in response to the signals from the early warning system, the adverse impact of the crisis could be minimized.

040 • Early Warning System for Financial Crisis
Figure 3-2 | Composite Index
1
0.8
0.6
0.4
0.2
0
94 96 98 00 02 04 06 08 10 12
C. Mongolia
1
0.8
0.6
0.4
0.2
0
94 96 98 00 02 04 06 08 10 12
A. Cambodia
1
0.8
0.6
0.4
0.2
0
94 96 98 00 02 04 06 08 10 12
B. Indonesia

Chapter 3. EWS for Currency Crisis • 041
1
0.8
0.6
0.4
0.2
0
94 96 98 00 02 04 06 08 10 12
D. Philippines
1
0.8
0.6
0.4
0.2
0
94 96 98 00 02 04 06 08 10 12
E. Sri Lanka
1
0.8
0.6
0.4
0.2
0
94 96 98 00 02 04 06 08 10 12
F. Vietnam


Chapter 42015 Modularization of Korea’s Development ExperienceEarly Warning System for Financial Crisis
EWS for Financial Industry and Institutions
1. Daily Financial Soundness Indicators
2. Early Warning Models of the FSS
3. CAEL Rating System
4. Macroprudential Indicators

EWS for Financial Industry and Institutions
044 • Early Warning System for Financial Crisis
1. Daily Financial Soundness Indicators
The Financial Supervisory Service (FSS) developed the Daily Financial Soundness Indicators (DFSI) as a part of the national early warning system in 2004. The DFSI is designed to assess the current level of risks by monitoring the financial health of individual financial institutions on a daily basis. The most important strength of the DFSI is real time provision of information to the supervisory authority. In contrast, the weakness of the DFSI stems from the restricted coverage of monitoring because only small number of indicators is available on a daily basis. Thus, the financial supervisory authority should be careful when interpreting the signals from the DFSI. Any warning signals from the DFSI can simply reflect a temporary problem not related to any financial distress of the financial institutions. Another drawback is that, because of the small number of indicators, the DFSI cannot assess all the aspects of risks and therefore may miss an important signal of distress.
The DFSI consists of the indicators reflecting financial soundness in the categories of asset quality, liquidity, profitability, credit standing, and risk management. For example, delinquency rate, defined by the ratio of delinquent loans to total loans, is one of the most important measures of bank asset quality. A higher delinquency rate ultimately weakens profitability and undermines capital adequacy. <Table 4-1> shows the indicators of the DFSI.

Chapter 4. EWS for Financial Industry and Institutions • 045
On a daily basis, the FSS assigns one of the five ratings (sound, precautionary, cautionary, grave, and critical) for each indicator, which is provided by financial institutions. Then, the daily rating of each financial institution is determined by taking the lowest rating among the ratings of each indicator. The monthly rating of the financial institution is the average score of the daily ratings (one for sound, two for precautionary, three for cautionary, four for grave, and five for critical). In addition, the monthly rating of each financial sector can also be computed by the weighted average of ratings of the financial institutions in each sector where weighs are given by the asset size of the financial institutions.
Table 4-1 | Daily Financial Soundness Indicators
Sector Indicators
Banks
Delinquency RateShort-term Lending Ratio Growth Rate of Won Deposits Number of Days with Smaller Won Deposits Number of Days with Smaller New Loans Call Rate Spread (credit standing)Valuation Losses on Securities Holdings
Insurance Companies (life and non-life)
Delinquency Rate Short-term Liquidity Ratio Claims Payout RatioGrowth Rate of Initial Premiums
Securities CompaniesReceivables Growth Rate Liquidity RatioDerivatives Risk
Asset ManagementGrowth Rate of Assets under Management (AUM)Number of Days with Decrease in AUMDifference Ratio between Market and Book Value of MMF
Credit Card and
Installment Financing
Monthly Ratio of Paid Amount to Billed Amount (credit card)Available LiquidityRollover Ratio of Bonds or Commercial PaperSpread of Bonds or Commercial Paper
Mutual Savings Bank
Delinquency RateGrowth Rate of Unsecured LoansGrowth Rate of Short-term BorrowingDeposits Growth RateValuation Losses on Securities Holdings
Source: Financial Supervisory Service (2009).

046 • Early Warning System for Financial Crisis
2. Early Warning Models of the FSS
The early warning models of the FSS include two index models for the financial industry as a whole and five models for individual financial institutions. The two index models are the risk index model and the leading risk index model, which cover all of the finance sectors such as commercial banks, life insurance companies, non-life insurance companies, security firms, asset management firms, mutual saving banks, credit card companies, installment financing, and credit unions. The five early warning models for individual financial institutions are the risk index model, the statistical CAEL rating system, the capital adequacy estimation model, the credit rating prediction model, and the expected default frequency (EDF) model. The coverage of the early warning models is given in <Table 4-2>. Every one of the nine financial sectors is covered in the risk index model and the statistical CAEL model, but only part of the sectors are considered in other models.
Table 4-2 | Coverage of Early Warning Models for Financial Institutions
Model (1) (2) (3) (4) (5) (6) (7) (8) (9)
Industry
RiskIndex
O O O O O O O O O
LeadingRisk Index
O O O O O O O O
Individual Financial Institution
RiskIndex
O O O O O O O O O
StatisticalCAEL
O O O O O O O O O
CapitalAdequacyEstimation
O O O O O O O O
Credit RatingPrediction
O O O
Expected DefaultFrequency
O O O O O
Note: (1) Banking (2) Life Insurance (3) Non-life Insurance (4) Securities (5) Asset Management (6) Mutual Savings Bank (7) Credit card (8) Installment Financing (9) Credit Union.
Source: Financial Supervisory Service (2009).

Chapter 4. EWS for Financial Industry and Institutions • 047
2.1. Risk Index Model
The Risk index model is one of the most comprehensive and thus frequently used models, covering all the financial sectors in the economy. The risk index model collects information on the soundness of each financial sector and summarizes the overall risk levels of the financial industry by constructing an aggregate index.
To construct a risk index, in the first step, the time series of the candidate variables are collected and tested to obtain the final list of the variables which constitute the risk index. The candidate variables are balance sheet variables of financial institutions and macroeconomic variables. For the banking industry, fifty three variables are considered including four variables on capital adequacy, sixteen variables on asset quality, thirteen variables on profitability, seven variables on liquidity, one variable on loan growth, twelve IMF’s financial soundness indicators, and macroeconomic variables such as economic growth, interest rate, and stock price index.
The selection process starts with statistical analyses such as ordered probit model estimation and/or correlation analysis with distress. This process, however, often fails to provide sufficient information in selecting variables because statistical significance does not necessarily imply economic significance. For example, although the coefficient estimate on a variable is statistically significant in the probit model estimation or the correlation coefficient between the variable and insolvency is high, it is possible that the contribution of the variable to overall riskiness is not large. In addition, this process cannot provide guidelines on the weights of individual variables. Thus, the FSS employs the principal component analysis (PCA) to narrow down the list of component variables and to assign adequate weights on the variables. The selected component variables which constitute the risk index, as of September 2007, are presented in <Table 4-3>.

048 • Early Warning System for Financial Crisis
Table 4-3 | Indicators in the Risk Index
Sector Category Variables
Banks
Capital Adequacy BIS Capital Ratio, Equity Capital Ratio
Asset QualitySubstandard and Below Loan Ratio, Loss-risk Weighted bad Loan Ratio
ProfitabilityNet Interest Margin, Structural Determinant of Profitability, ROA
LiquidityDomestic Currency Liquidity Ratio, Foreign Currency Liquidity Ratio
Macroeconomy -
Life Insurance
Capital AdequacySolvency Margin Ratio I, Solvency Margin Ratio II
Asset Quality Bad Asset Ratio, Risk-weighted Ratio
ProfitabilityGrowth of Premium Revenue, Average Estimated Interest Rate vs. ROA
Liquidity Actuarial Balance Ratio
Macroeconomy -
Non-lifeInsurance
Capital AdequacySolvency Margin Ratio I, Solvency Margin Ratio II
Asset Quality Bad Asset Ratio, Risk-weighted Ratio
ProfitabilityCombined Ratio (sum of loss ratio and operating expense ratio), ROA
Liquidity Monetary Actuarial Balance Ratio
Macroeconomy -
SecurityCompanies
Capital Adequacy Net Capital Ratio I, Net Capital Ratio II
Asset Quality -
ProfitabilityNet Income on Equity Capital, ROA, operating Income to Total Asset Ratio
Liquidity -
Macroeconomy KOSPI
AssetManagement
Capital Adequacy Ratio of Equity to Risks, Reserve Ratio
Asset Quality -
Profitability ROA, Expense Coverage Ratio
Liquidity -
Macroeconomy KOSPI, Growth of AUM

Chapter 4. EWS for Financial Industry and Institutions • 049
Sector Category Variables
SavingsMutual Banks
Capital Adequacy BIS Capital Ratio, BIS Tier I Capital Ratio
Asset QualityLoss-risk Weighted bad Loan Ratio, Overdue Loan Ratio, Substandard and Below Loan Ratio
Profitability Expenses to Income Ratio, ROA
Liquidity Available Liquidity Ratio, Liquidity Ratio
Macroeconomy -
Credit Cards
Capital Adequacy Adjusted Capital Ratio, Equity Capital Ratio
Asset QualityLoss-risk Weighted bad Loan Ratio, Overdue Loan Ratio
Profitability Expenses to Income Ratio, ROA
LiquidityLiquidity Ratio, Business-purpose Fixed Asset Ratio
Macroeconomy -
InstallmentFinancing
Capital Adequacy Adjusted Capital Ratio, Equity Capital Ratio
Asset QualityLoss-risk Weighted bad Loan Ratio,Overdue Loan Ratio
Profitability Expenses to Income Ratio, ROA
LiquidityLiquidity Ratio, Business-purpose Fixed Asset Ratio
Macroeconomy -
Credit Unions
Capital Adequacy Reserve Ratio
Asset QualityLoss-risk Weighted bad Loan Ratio, Overdue Loan Ratio, NPL Ratio
Profitability Expenses to Income Ratio, ROA
Liquidity Fixed Asset Ratio
Macroeconomy -
Source: Financial Supervisory Service (2009).
Once the component variables are selected, the next step is to aggregate the individual variable to construct the risk index. To do this, each component variable is standardized by subtracting the mean and then dividing by the standard deviation after taking the difference (or log difference) of each variable. Then, the weighted average of the standardized components is computed where the weights are from the principal component analysis. Finally, the risk index, RI(t), is written as

050 • Early Warning System for Financial Crisis
RI(t) = RI(t-1) × [(200+z(t))/(200-z(t))],
where z(t) is the weighted average of the standardized components and RI(1)=100.
The risk index model is a useful and comprehensive device to evaluate risks in financial industry and financial institutions. Despite its advantages, the risk index model also has several limitations. First, the risk index model is designed to assess current risks rather than to predict future vulnerability. Moreover, the variables constituting the risk index are not available in real time. For example, the risk index for the first quarter becomes available only in May or June after all the component variables are released. Second, the risk index measures the risks relative to the base year. Thus, it cannot tell us about the absolute degree of risk, which is more relevant in the assessment of vulnerability. Third, although the risk index model provides information for individual financial sector and individual financial institutions, it is not possible to compare risks across sectors and institutions. This is because the risk indexes of different sectors are constructed using different variables. The risk index is designed for time series comparison, not for cross-section comparison.
2.2. Leading Risk Index
Since the risk index is developed to assess the current soundness of the financial industry and financial institutions, it does not present a numerical value on the likelihood of future distress in financial institutions. To supplement this shortcoming of the risk index, the FSS developed the leading risk index. The purpose of the leading risk index is to forecast the risk index in the next six months.
Both macroeconomic variables and balance sheet variables are considered in constructing the leading risk index as long as they are known to have some predictability. The final component variables in the leading risk index can be selected through standard regression analyses where the dependent variable is the percentage changes in risk index and the explanatory variables are six month lagged leading indicators. Then, the percentage changes in the leading risk index are computed using the estimation results. The FSS (2009) provides the list of explanatory variables for the leading risk index.

Chapter 4. EWS for Financial Industry and Institutions • 051
Table 4-4 | Variables for the Leading Risk Index
Variables
BankingCurrent Account Balance/GDP, GDP Growth,Percentage Change in FX Reserves, CPI, Terms of Trade
Life InsuranceCurrent Account Balance/GDP, GDP Growth,Percentage Change in FX Reserves, CPI, Terms of Trade,Growth Rate of Premium Revenue, Dishonored Bill Ratio
Non-life InsuranceCurrent Account Balance/GDP, GDP Growth,Percentage Change in FX Reserves, CPI, Terms of Trade,Dishonored Bill Ratio
SecuritiesTerms of Trade, GDP Growth,Wholesale and Retail Sales Index, KOSPI
Asset ManagementCurrent Account Balance/GDP, GDP Growth,CPI, AUM to the Number of Funds, KOSPI
Savings BanksCurrent Account Balance/GDP, House Sales Price Index,CPI, Terms of Trade
Credit CardGrowth Rate of Household Loans, GDP Growth,Growth Rate of Consumer Spending, CPI,Spread of Bond Issued by Credit Card Company
Installment FinancingCurrent Account Balance/GDP, GDP Growth,Terms of Trade, Production Index of Automotive Industry,Growth Rate of Billed Amount
Source: Financial Supervisory Service (2009).
The leading risk index is also used to predict the direction of future risk levels by estimating a logit model. The dependent variable is a binary variable which takes on one if the change in risk index is positive and zero otherwise. The explanatory variables are the six month lagged changes in the leading risk index. The FSS confirms that the coefficient estimate is highly significant. The estimated value of the dependent variable is then used to estimate the probability of the rise in risk in the next six month.
2.3. Early Warning Models for Individual Financial Institutions
The FSS developed four early warning models for individual financial institutions: the Capital Adequacy Prediction Model (CAPM), the Credit Rating Prediction Model (CRPM), the Expected Default Frequency (EDF) Model and the statistical CAEL rating system. This subsection briefly introduces the first three models and the next subsection describes the statistical CAEL rating system in more detail.

052 • Early Warning System for Financial Crisis
First, the FSS operates the Capital Adequacy Prediction Model (CAPM) for individual financial institutions in nine financial sectors. Indeed, capital helps prevent failure of financial institutions and thus has been regarded as the most important measure of the financial soundness. Moreover, a minimum amount of bank capital is required by the regulatory authority. Given the importance of capital, the CAPM is designed to estimate the likelihood of deterioration in capital adequacy as an early warning signal of financial distress. Specifically, the CAPM employs a logit model to estimate the probability of a capital adequacy rating falling below the threshold level within the next two quarters. The explanatory variables in the regression model include both balance sheet variables and macroeconomic variables. For example, in the banking sector CAPM, growth of corporate and household loans, overdue loan ratio, ROA, net interest margin as well as macroeconomic indicators such as yield on Treasury bond are considered as explanatory variables. The variables are selected according to their statistical and economic significance.
Second, the Credit Rating Prediction Model (CRPM) is developed to predict the credit ratings of financial institutions produced by credit rating agencies. The credit ratings themselves have useful and unique information as they reflect the opinions of the market participants. The CRPM adopts an ordered logit model in which the dependent variable is the rank of the credit ratings. The credit ratings are classified into five ranks with one being the best quality of AAA and AA, and five being the worst quality of B and below. The same explanatory variables in the capital adequacy prediction mode are also used in the ordered logit model. One drawback of the CRPM is that the model cannot be applied to all financial institutions because the credit ratings are available for only a limited number of financial companies.
Third, the FSS also developed the Expected Default Frequency (EDF) Model as a part of its early warning system. Most early warning models in the FSS, in fact, relies on information from balance sheet data of financial institutions. The only exception is the credit rating prediction model which partially utilizes the assessment of credit rating agencies. The EDF model also attempts to examine information not reflected in the financial data of the balance sheet by using equity price data. Based on the option pricing theory of Merton-Black-Scholes, the EDF model estimates the probability that liability exceeds asset for a listed financial firm within a year. The model is a complementary tool to the early warning system as it is able to incorporate the stock market’s assessment. In addition, the model can be operated on a high frequency basis as long as new information from the stock market is available.

Chapter 4. EWS for Financial Industry and Institutions • 053
3. CAEL Rating System
Financial supervisory authorities have engaged in a number of supervisory activities to monitor and assess the financial soundness of financial institutions. The best way to do this is that supervisors visit financial institutions to review all aspects of their safety and soundness, known as on-site examinations. In addition to the regularly scheduled on-site examinations, supervisors have also used off-site surveillance system to assess the up-to-date financial health of financial institutions through a computerized system.
Off-site surveillance has several advantages over on-site examination. First, an off-site surveillance system can provide an ongoing picture of financial institution’s conditions because the system is updated frequently with newly acquired information while on-site examination is usually conducted once a year. Second, in terms of cost, off-site surveillance is more efficient. On-site examination incurs significant cost in time and effort during the review process, but off-site surveillance can minimizes these costs. In addition, on-site examination is a burden to financial institutions because it can be destructive to daily operations. Third, off-site surveillance helps to schedule on-site examination if necessary. When off-site surveillance identifies a distressed financial institution, supervisors can schedule and conduct more targeted on-site examination.
Off-site surveillance, however, also has certain disadvantages. It is not possible for off-site surveillance to examine every aspect of risk and thus can overlook an important source of risk which could lead to the failure of financial institutions. In particular, off-site surveillance cannot assess the quality of management practices which is only possible during on-site examination. Another potential problem in off-site surveillance is that it may fail to assess long-term risk factors as it mainly concentrates on the current financial soundness of financial institutions.
One of the most popular off-site surveillance tools is the CAEL rating system.9 The CAEL rating system is an effective and comprehensive device for routine off-site surveillance. It is designed to assign a rating to each financial institution according to its overall financial safety and soundness. The time-series trend and the cross-section distribution of the ratings provide valuable information to assess risks in the financial institutions. Thus the CAEL rating system serves as an important toolkit of the integrated early warning system for financial institutions.
CAEL stands for capital adequacy, asset quality, earnings, and liquidity. Explanations on these four risk categories are provided by Federal Reserve System (2012) as follows.
9. The Korea Deposit Insurance Corporation also operates a similar surveillance system.

054 • Early Warning System for Financial Crisis
• Capital Adequacy (C): C stands for the adequacy of capital position in a financial institution. The supervisors should take into account the risk inherent in a financial institution’s activities in the evaluation of capital adequacy.
• Asset Quality (A): A reflects the quality of a financial institution’s assets. The evaluation should consider both on-balance sheet and off-balance sheet exposures, the size of nonperforming assets, the adequacy of underwriting standards, the concentration risk, the procedure of credit administration policy, and the adequacy of management information systems for credit risk.
• Earnings (E): E reflects the quality of earnings. The level, trend, and source of earnings, as well as the ability of earnings to augment capital should be evaluated to support ongoing activities of financial institutions.
• Liquidity (L): L stands for the liquidity of a financial institution. It evaluates the ability to finance and maintain the sources of short-term funds to support its operations and meet its obligations.
The CAEL rating system selects indicators in each risk category and assigns points to each indicator according to the financial soundness of a financial institution. The weighted average of constituent indicators, referred to as a rating score, is mapped into a composite rating scale ranging from one (best) to five (worst).
The CAEL rating system can be developed in two ways, supervisory CAEL and statistical CAEL. The main difference lies in the way that indicators are selected and weights are computed. In the supervisory CAEL, indicators are selected by supervisory policies, and the weights on each indicator are often chosen at the supervisor’s discretion. On the other hand, the statistical CAEL employs a complicated statistical model such as a principal component analysis to select indicators and assign weights. The statistical CAEL model, thus, requires large set of data for a rigorous analysis. A description of each step in developing a CAEL rating system is contained in the following subsections based on the FSS (2009) and Lee and Lee (2013).
3.1. To Select CAEL Candidate Indicators
The first step to building up the CAEL rating system is to select the indicators that have the most relevant information on the risk levels in each risk category. In the supervisory CAEL system, the selection process is based upon the past experience or judgement of the supervisors. In the statistical CAEL rating system, however, an econometric model such as a principal component analysis is employed to sort out the indicators from a large dataset.

Chapter 4. EWS for Financial Industry and Institutions • 055
Table 4-5 | Illustrative List of Indicators by Risk Categories
Risk Category Financial Ratios Sign
Capital Adequacy (C)
BIS Capital Adequacy Ratio -
BIS Tier 1 Capital to Risk-weighted Assets Ratio -
Equity Capital Ratio -
Asset Quality (A)
Loss-risk Weighted bad Loan Ratio +
Substandard and below Loan Ratio +
Overdue Loan Ratio +
Loan Loss Provision Ratio -
Earnings (E)
Ordinary Income to Assets Ratio -
Expenses to Income Ratio +
Expense Coverage Ratio +
Liquidity (L)
Net Short-term Loans to Total Loans Ratio -
Korean Won Currency Liquidity Ratio -
Foreign Currency Liquidity Ratio -
Source: Financial Supervisory Service (2009).
<Table 4-5> documents thirteen indicators in four risk categories, which may be selected from a large dataset by a statistical analysis. For instance, BIS capital adequacy ratio is arguably the most important indicator representing the adequacy of bank capital and thus should be included in the final list of the indicators in the C category. In the third column of <Table 4-5>, the “sign” indicates the direction of the value of the corresponding indicator toward higher risk. Thus, a positive (negative) sign implies that the probability of failure is increasing (decreasing) in the value of the indicator.
3.2. To Set Rating Intervals of Each Indicator
In the second step, the rating intervals are set for the selected indicators according to either parametric method or non-parametric method. In the simplest case, the rating intervals can be determined based on the mean and the standard deviation of each indicator. For example, <Table 4-6> shows the rating intervals set by the multiple of standard deviations (0.5 standard deviation and 1.5 standard deviations) from the mean. The multiples are generally large for volatile indicators. Alternatively, the empirical distribution of the indicator can directly be used to set the rating intervals if the indicator is believed to exhibit non-normality.
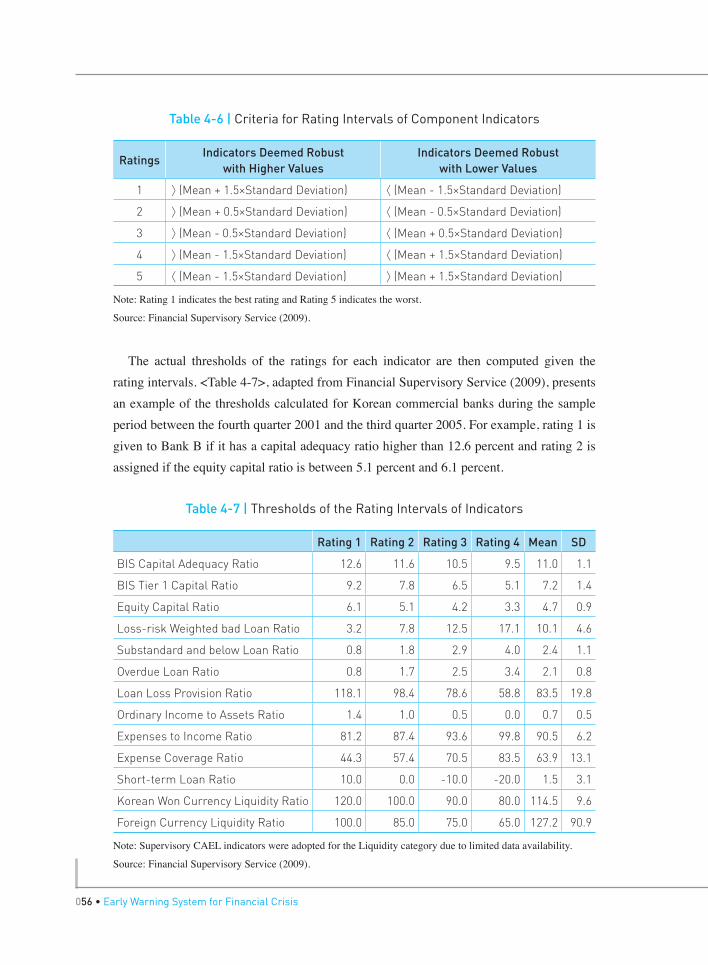
056 • Early Warning System for Financial Crisis
Table 4-6 | Criteria for Rating Intervals of Component Indicators
RatingsIndicators Deemed Robust
with Higher ValuesIndicators Deemed Robust
with Lower Values
1 > (Mean + 1.5×Standard Deviation) < (Mean - 1.5×Standard Deviation)
2 > (Mean + 0.5×Standard Deviation) < (Mean - 0.5×Standard Deviation)
3 > (Mean - 0.5×Standard Deviation) < (Mean + 0.5×Standard Deviation)
4 > (Mean - 1.5×Standard Deviation) < (Mean + 1.5×Standard Deviation)
5 < (Mean - 1.5×Standard Deviation) > (Mean + 1.5×Standard Deviation)
Note: Rating 1 indicates the best rating and Rating 5 indicates the worst.
Source: Financial Supervisory Service (2009).
The actual thresholds of the ratings for each indicator are then computed given the rating intervals. <Table 4-7>, adapted from Financial Supervisory Service (2009), presents an example of the thresholds calculated for Korean commercial banks during the sample period between the fourth quarter 2001 and the third quarter 2005. For example, rating 1 is given to Bank B if it has a capital adequacy ratio higher than 12.6 percent and rating 2 is assigned if the equity capital ratio is between 5.1 percent and 6.1 percent.
Table 4-7 | Thresholds of the Rating Intervals of Indicators
Rating 1 Rating 2 Rating 3 Rating 4 Mean SD
BIS Capital Adequacy Ratio 12.6 11.6 10.5 9.5 11.0 1.1
BIS Tier 1 Capital Ratio 9.2 7.8 6.5 5.1 7.2 1.4
Equity Capital Ratio 6.1 5.1 4.2 3.3 4.7 0.9
Loss-risk Weighted bad Loan Ratio 3.2 7.8 12.5 17.1 10.1 4.6
Substandard and below Loan Ratio 0.8 1.8 2.9 4.0 2.4 1.1
Overdue Loan Ratio 0.8 1.7 2.5 3.4 2.1 0.8
Loan Loss Provision Ratio 118.1 98.4 78.6 58.8 83.5 19.8
Ordinary Income to Assets Ratio 1.4 1.0 0.5 0.0 0.7 0.5
Expenses to Income Ratio 81.2 87.4 93.6 99.8 90.5 6.2
Expense Coverage Ratio 44.3 57.4 70.5 83.5 63.9 13.1
Short-term Loan Ratio 10.0 0.0 -10.0 -20.0 1.5 3.1
Korean Won Currency Liquidity Ratio 120.0 100.0 90.0 80.0 114.5 9.6
Foreign Currency Liquidity Ratio 100.0 85.0 75.0 65.0 127.2 90.9
Note: Supervisory CAEL indicators were adopted for the Liquidity category due to limited data availability.
Source: Financial Supervisory Service (2009).
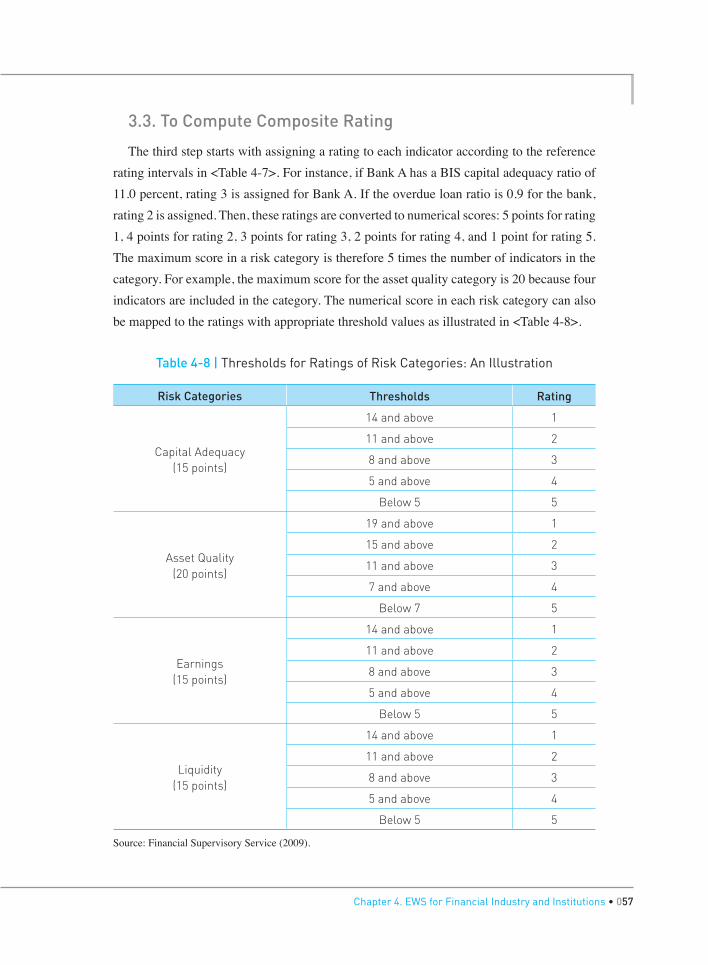
Chapter 4. EWS for Financial Industry and Institutions • 057
3.3. To Compute Composite Rating
The third step starts with assigning a rating to each indicator according to the reference rating intervals in <Table 4-7>. For instance, if Bank A has a BIS capital adequacy ratio of 11.0 percent, rating 3 is assigned for Bank A. If the overdue loan ratio is 0.9 for the bank, rating 2 is assigned. Then, these ratings are converted to numerical scores: 5 points for rating 1, 4 points for rating 2, 3 points for rating 3, 2 points for rating 4, and 1 point for rating 5. The maximum score in a risk category is therefore 5 times the number of indicators in the category. For example, the maximum score for the asset quality category is 20 because four indicators are included in the category. The numerical score in each risk category can also be mapped to the ratings with appropriate threshold values as illustrated in <Table 4-8>.
Table 4-8 | Thresholds for Ratings of Risk Categories: An Illustration
Risk Categories Thresholds Rating
Capital Adequacy(15 points)
14 and above 1
11 and above 2
8 and above 3
5 and above 4
Below 5 5
Asset Quality(20 points)
19 and above 1
15 and above 2
11 and above 3
7 and above 4
Below 7 5
Earnings(15 points)
14 and above 1
11 and above 2
8 and above 3
5 and above 4
Below 5 5
Liquidity(15 points)
14 and above 1
11 and above 2
8 and above 3
5 and above 4
Below 5 5
Source: Financial Supervisory Service (2009).

058 • Early Warning System for Financial Crisis
The weighted sum of the numerical scores in the risk categories is the composite score. Assuming that the weights on capital adequacy, asset quality, and earnings are 30 percent, and the weight on liquidity is 10 percent, the composite score can be computed as follows:
Composite score
= (score for C)×(30/15)+(score for A)×(30/20)+(score for E)×(30/15)+(score for L)×(10/15)
For example, if Bank A earns 14 points in the capital adequacy category, 16 points in the asset quality category, 10 points in the earnings category, and 12 points in the liquidity category, the composite score is 80 points.10 Similarly, the minimum score for the composite rating can be calculated as illustrated in <Table 4-9>.
Table 4-9 | Minimum Composite Score for Composite Ratings
Rating 1 Rating 2 Rating 3 Rating 4 Rating 5
93.8 and above 73.8 and above 53.8 and above 33.8 and above Below 33.8
Source: Financial Supervisory Service (2009).
Following Federal Reserve System (2012), a rating 1 is the highest one indicating that a financial institution is financially sound in almost every respect. A financial institution with a rating 2 is financially sound but may have modest weaknesses that can be corrected during the normal course of business. A rating 3 implies that a financial institution exhibits weaknesses and thus is less resistant to adverse business conditions, requiring more than normal supervision. A rating 4 indicates that close supervisory attention and prompt action are needed to correct the inadequate conditions of the financial institution. A rating 5 suggests that the financial weakness is so critical, urgent aid is required to prevent insolvency of the financial institution.
4. Macroprudential Indicators
Before the global financial crisis, supervisory authorities focused on the safety and soundness of individual financial institutions, known as microprudential supervision. The CAEL rating system is, therefore, a miroprudential toolkit. The global financial crisis, however, reveals that microprudential policies are not enough to prevent a crisis
10. 14×(30/15)+16×(30/20)+10×(30/15)+12×(10/15) = 80.0

Chapter 4. EWS for Financial Industry and Institutions • 059
and highlights the importance of macroprudential policy in limiting the vulnerabilities of the economy. Macroprudential policy focuses on the safety and soundness of the financial system as a whole to contain system-wide risk.
A recent important progress in macroprudential regulations is the countercyclical capital buffer under the framework of Basel III. The Basel Committee on Banking Supervision (2010) states that the primary aim of the countercyclical capital buffer is to use a buffer of capital to achieve the broader macro-prudential goal of protecting the banking sector from periods of excess aggregate credit growth that have often been associated with the build-up of system-wide risk. In this regulation, banks are required to build up the countercyclical capital buffer in periods of excessively rapid credit growth. Banks can also release the capital buffer to prevent an excessive decline in credit supply during periods of financial distress. Consequently, the role of the countercyclical capital buffer is to dampen the pro-cyclicality by smoothing the supply of credits by banks.
To introduce regulations on the countercyclical capital buffer, the authority needs a macroprudential indicator which guides the build-up and the release of the capital buffer. Indeed, a rule-based macroprudential policy requires objective indicators which can help identify when bank asset growth is excessive. These indicators also contribute to enhancing the transparency of the macroprudential policies.
To select the best indicator, Drehmann, Borio, and Tsatsaronis (2011) employ the signal approach to find that credit-GDP gap is a good common reference in the build-up phase of capital buffer. Credit-GDP gap is defined as the deviation from the long-term trend of aggregate credit to GDP ratio.11 Drehmann, Borio, and Tsatsaronis argue that credit-GDP gap exhibits good signaling properties, as fast credit growth widens the gap as early as three or four years prior to the crises across countries and crisis episodes, allowing banks to build up capital sufficiently in advance.12 However, the Basel Committee on Bank Supervision (2010) states that the choice of indicators in implementing countercyclical capital buffer is left to the discretion of the authorities in each country.
In fact, Lee, Shim, and Jo (2013) find that the credit-GDP gap is a good macroprudential indicator in Korea, but the household debt-disposable income gap is also a valuable complementary indicator. [Figure 4-1] and [Figure 4-2] depict the credit-GDP gap and the household debt-disposable income gap in Korea, respectively. The credit-GDP gap (I) is
11. The one-sided Hodrick-Prescott filter was used to compute the trend.
12. Drehmann, Borio, and Tsatsaronis (2011) also find that the credit-GDP gap does not generate many false alarms.

060 • Early Warning System for Financial Crisis
based on the credit supplied by deposit-taking institutions while the credit-GDP gap (II) uses the sum of corporate bonds, commercial papers and credit by deposit-taking institutions. The vertical line denotes the periods of crises including the East Asian crisis in 1997, the credit card crisis in 2002, and the global financial crisis in 2008. [Figure 4-1] clearly shows that the credit-GDP gap increased before the East Asian crisis and the global financial crisis, while [Figure 4-2] demonstrates that the household debt-disposable income gap was a good leading indicator for the credit card crisis in Korea. This finding suggests that these two macroprudential indicators are useful early warning indicators in Korea.
Figure 4-1 | Credit-GDP Gap in Korea
1990Q1 1993Q1 1996Q1 1999Q1 2002Q1 2005Q1 2008Q1 2011Q1
0.25
0.20
0.15
0.10
0.05
0.00
-0.05
-0.10
-0.15
-0.20
-0.25
Credit/GDP gap (I)
Credit/GDP gap (II)
Threshold (0.02)
Source: Lee, Shim, and jo (2013).

Chapter 4. EWS for Financial Industry and Institutions • 061
Figure 4-2 | Household Debt-disposable Income Gap in Korea
1990Q1 1993Q1 1996Q1 1999Q1 2002Q1 2005Q1 2008Q1 2011Q1
0.25
0.15
0.05
-0.05
-0.15
-0.25
Source: Lee, Shim, and jo (2013).
Another notable macroprudential indicator is the ratio of core to non-core liabilities proposed by Shin (2009). The core liabilities of banks are the funds financed domestically during normal times and thus mostly consist of retail deposits. During a lending boom, however, deposits are more likely to be insufficient to meet the rapidly growing bank assets. In this situation, banks attempt to seek other sources of financing to expand assets. Therefore, this phase of the financial cycle is likely to reflect the changing pattern in the composition of bank liabilities. Shin (2009) examines the case of the UK bank, Northern Rock, which failed in 2007. He finds that, before the global financial crisis, Northern Rock depended on wholesale funding to finance its rapidly increasing lending. This example illustrates that the core to noncore liability ratio is an informative early warning indicator and serves as a useful reference for macroprudential policies.

Chapter 52015 Modularization of Korea’s Development ExperienceEarly Warning System for Financial Crisis
Policy Recommendations for EWS
1. Qualitative Monitoring
2. Other Policy Recommendations

Policy Recommendations for EWS
064 • Early Warning System for Financial Crisis
1. Qualitative Monitoring
While a statistical early warning model is a useful device for assessing the vulnerability of an economy, it is also clear that no quantitative model is perfect. The deficiencies of quantitative early warning models imply that qualitative monitoring is important to preventing a crisis . Qualitative monitoring helps identify imminent risk and thus supplements the early warning models. Indeed, quantitative models and qualitative monitoring are two pillars of an early warning system.
For conducting qualitative monitoring and operating quantitative models, the government needs to establish an organization. The organization can be an independent institute or a department in either central bank or government. In Korea, the Korea Center for International Finance (KCIF) was established in April, 1999 by the Korean government and the Bank of Korea. Having learned that the Asian financial crisis is caused by foreign currency liquidity problem, the Korean government needed a public institution that could assist the government in preventing currency crises. Thus, the main responsibilities of the KCIF are monitoring international financial markets and operating early warning models.

Chapter 5. Policy Recommendations for EWS • 065
Following the KCIF’s website, other missions include 1) watching and analyzing foreign investors’ views, trends in foreign investment toward Korea and unusual movements in the market, 2) taking countermeasures against possible dangers and assisting the government in the event of a crisis, 3) providing advisory services to the government and the private sector on international financial activities such as the issuance of exchange equalization funds, public and private institutions’ financing from abroad and foreign exchange risk management, and 4) providing information both for domestic financial institutions looking to move into foreign markets and for overseas financial institutions hoping to enter Korea.
The KCIF has six offices as shown in [Figure 5-1]. Among them, the early warning system office is responsible for operation of the quantitative models. The other four offices (the financial market office, the research and analysis office, the capital flows monitoring office and the market monitoring office) closely monitor the domestic and the foreign financial markets.
The financial market office monitors global financial markets. It analyzes recent global market trends such as foreign exchange, fixed income, equity, and derivatives markets to prepare reports on important issues. The members of this office have work experiences at financial institutions. The research and analysis office keeps a watch on regional economies including US, Europe, China, Japan, and emerging market countries. The office also closely monitors international commodity markets.
The work area of the capital flows monitoring office is non-residents’ capital flows into the domestic economy via bond market, stock market and bank loans. The office also monitors external debt which is one of the most important vulnerability measures. For effective monitoring, the capital flows monitoring office is allowed to access the online FX monitoring system operated by the Bank of Korea and real time information on foreign investors’ capital flow managed by the Financial Supervisory Service. The market monitoring office follows up on media and other reports published in foreign countries. This office often prepares reports of news bulletin summarizing the overnight issues in the global financial market to submit to policymakers and market participants.

066 • Early Warning System for Financial Crisis
Figure 5-1 | Organization of the KCIF
AdministrationOffice
Capital FlowMonitoring Office
Research&Analysis Office
FinancialMarket Office
Early WarningSystem Office
Market MonitoringOffice
Deputy President
President
Board of Directors
KCIF, NY
Quantitative EWS
Qualitative EWS
Source: KCIF homepage at www.kcif.or.kr.
The KCIF analyzes the real time data released by domestic and foreign sources and also monitors the reports published in foreign countries. The sources include foreign financial institutions (Goldman Sachs, JP Morgan, etc), credit rating agencies (S&P, Moody’s, Fitch), financial news and media (Bloomberg, Reuters), research institutes (Oxford Analytica, Global Insight, Institute for International Finance), as well as periodicals (Financial Times, Wall Street Journal, Economist, Euromoney). The KCIF also runs a New York office in the center of the global financial market to collect and analyze detailed information.
It is recommended that a government in an emerging market country strengthen qualitative monitoring of financial markets, financial institutions, and foreign markets in tandem with developing quantitative models. Given the limit of quantitative models, qualitative monitoring is especially crucial in emerging market countries where high quality data is not available as compared to advanced countries. Qualitative monitoring supplements the numerical outcomes of quantitative statistical models during the decision phase regarding the risk of crisis and subsequent policy responses.

Chapter 5. Policy Recommendations for EWS • 067
2. Other Policy Recommendations
This subsection provides several recommendations for the improved development and operation of an early warning system. First, effective operation of an early warning system requires the government to prepare a crisis management manual. In the crisis management manual, contingency policy directions are described based on the degree of warning signals from the early warning system. For example, the signals from the composite index can be classified into five levels such as (1) normal, (2) caution, (3) warning, (4) quasiemergency, and (5) emergency. The government then sets up guidelines of contingency policies as described in <Table 5-1>.
Table 5-1 | Guidelines on Contingency Policy
Level Guidelines on Contingency Policy Actions
Normal -
Caution
Tighter monitoring on domestic/global markets and cross-border short-term capital flowsIncrease the quantity and quality of information shared inside and outside of the government for the risk factors identified
Warning
Strengthen the monitoring function on illegal FX transactionsStricter requirements on FX liquidity soundness of financial institutionsPrepare policy action plans on risk factors identifiedActive sovereign IR
Quasi-emergency
Prepare contingency plans for short-term GX liquidity shortageActivate pan-government daily checking system and crisis management entityDouble check safeguard trigger condition
Emergency Activate safeguard following predetermined trigger conditions
Source: Jung (2015 ) and the Ministry Strategy and Finance.
Second, it should be noted that any statistical early warning model is developed based on past crisis episodes . For example, the signal approach used in the EWS for currency crisis presumes that abnormal behaviors of leading indicators on the eve of past crises would be repeated in the future. However, the underlying vulnerabilities and triggering events could be different in future crises . Therefore, in principle, there is no guarantee that a model that performed well in the past would continue to work well in the future.

068 • Early Warning System for Financial Crisis
In particular, emerging market economies may experience rapid changes in the structure of their own economy. If an early warning model fails to incorporate these changes properly and in a timely manner, the model would perform poorly with more missed calls and false signals. For example, although large current account deficits certainly represent vulnerability, volatile capital flows across borders have become increasingly more important in recent years. Therefore, new leading indicators predicting the capital and financial account balance should be added to the model to signal a crisis caused by sudden capital outflows. In addition, as longer time series data become available, noise-to-signal ratios, threshold values, and other statistics should be re-estimated, leading to changes in the structure of composite index. Indeed, continuous updates and revisions are critical to improving the performance of early warning models.
Third, ensuring the quality of leading indicators is essential to a successful early warning system. To improve overall statistical capacity, the central statistical agency should collect, process, and disseminate data in accordance with international standards. The statistical agency needs to enhance the expertise of its staff members through various training programs in collaboration with international organizations. It is also important for the agency to adapt new methodologies and technologies and to upgrade the IT infrastructure.
Fourth, it is recommended that emerging market countries develop a simple model in the early stage and then evolve into more sophisticated models over time. It should also be noted that early warning signals based on a single quantitative model are subject to model risk. It is always possible for the model to miss a warning call or send a false alarm. In response to these possibilities, therefore, it is recommended that auxiliary models be developed as supplementary tools. The main model and auxiliary models may use different statistical methodologies and data

Chapter 62015 Modularization of Korea’s Development ExperienceEarly Warning System for Financial Crisis
Capital Flows and Crisis Prevention Policy
1. Foreign Exchange Policy
2. Prudential Regulations
3. Capital Controls
4. Sovereign Wealth Fund
5. Bilateral Swaps and Global Financial Safety Nets (GFSNs)

Capital Flows and Crisis Prevention Policy
070 • Early Warning System for Financial Crisis
In the long run, financial market opening is beneficial to the economy to the extent that foreign capital is used for productive investment opportunities. However, massive capital inflows are likely to increase vulnerability through economic overheating and asset price bubbles. Moreover, if foreign capital suddenly flows out, domestic economy may bring about a foreign exchange liquidity problem, which can trigger a currency crisis, if severe. Thus, appropriate policy responses to the surges in capital inflow are crucial to prevent a crisis in emerging market countries. This chapter describes several policy recommendation based on Ostry and others (2010, 2011).
1. Foreign Exchange Policy
The basic direction of foreign exchange policy is to maintain flexibility of the foreign exchange rate and hold adequate stock of foreign exchange reserves. If the domestic currency is undervalued, it is recommended to appreciate domestic currency passively as foreign capital inflows to domestic economy. If the flexibility of the exchange rate is not maintained, the market will expect the currency to appreciate, thereby attracting further capital inflows and aggravating the situation.
On the other hand, when the domestic currency appears to be overvalued, the policy response needs to be more proactive. In this case, the government and the central bank may want to conduct foreign exchange market intervention to accumulate foreign exchange reserves. The policy actions, however, are likely to lead to an increase in money supply and higher inflation. If higher inflation is a concern, the resulting increase in money supply can be sterilized by a contractionary open market operation.

Chapter 6. Capital Flows and Crisis Prevention Policy • 071
However, it is important to recognize that there must be limits to sterilization. In emerging market economies, financial markets are typically underdeveloped and cannot fully absorb the sterilization bonds. More importantly, emerging market economies would end up paying a fiscal cost associated with the interest rate differential, leading to deterioration of the central bank’s balance sheet. This is because the central banks in emerging market countries typically pay higher interest rates on the domestic sterilization bonds while foreign exchange reserves earns lower interest rates as they are mostly held as safe assets such as US Treasury bonds.
Despite the fiscal cost, past crises have demonstrated the importance of foreign exchange reserves. It is often pointed out that countries with larger reserves showed better economic outcome during the global financial crisis. Indeed, foreign exchange reserves work as self-insurance for the foreign exchange liquidity problem. Countries holding insufficient amount of foreign exchange reserves are more likely to be hit harder by a crisis, as evidenced in many emerging market countries including Korea during the East Asian crisis in 1997-98.
Therefore, decisions regarding reserve accumulation should depend on the relative size of benefits and costs of holding reserves. Although it is difficult to determine the optimal amount of foreign exchange reserves, there are several potential factors that should be considered in the management of foreign exchange reserves. First, the most traditional and common measure is the size of imports. A country with larger imports needs to hold more foreign exchange reserves. The vulnerability of an economy to current account shocks is an important determinant of reserve holdings. Second, as a result of globalization, external debt is becoming an increasingly important measure of vulnerability. It is clear that countries with a higher ratio of (short-term) external debt to reserve were hit harder by a crisis because sudden capital outflows put pressure on reserve holdings. Third, countries with a history of financial crisis may need to accumulate larger reserves. A stigma effect is more likely to result in loss of confidence, accelerating capital outflows.
The Korean experience during the global financial crisis deserves attention. Before the bankruptcy of Lehman Brothers in 2008, the Korean government believed that the Korean economy would not be affected severely by financial turmoil in the US despite moderate capital outflows from the equity market. In fact, the Korean government believed the $242.7 billion in foreign exchange reserves would shield the domestic economy. However, the spillover effect of the global financial crisis was larger than anticipated, leading to large-scale capital outflows. The amount of the capital outflows exceeded $40 billion in the fourth quarter of 2008, which caused a sharp depreciation of Korean won.

072 • Early Warning System for Financial Crisis
The unprecedented credit crunch in the banking sector in advanced countries is mainly responsible for the sudden and large capital outflows from emerging market countries. But, large capital inflows into Korea since the mid-2000s made the outflows possible. Indeed, the domestic banking sector, both Korean banks and the branches of foreign banks, has expanded rapidly financed by foreign borrowings, leading to large external debts in Korea. The total external debt was only $187.9 billion in 2005, but it increased to $426.1 billion in the third quarter of 2008 primarily by foreign borrowings by banks. As a result, the external debt to GDP ratio reached to 206% in the fourth quarter of 2008, comparable to the ratio during the currency crisis in 1997–98.13 More problematic was short-term external debt. The short-term external debt tripled during the period from $65.9 billion in 2005 to $189.6 billion in the third quarter of 2008. At that time, the short-term debt accounted for 45% of the total external debt, amounting 79.1 percent of the foreign exchange reserves.
This excessively high external debt, especially short-term debt, can explain why Korean economy was affected so severely by the global financial crisis relative to other emerging market countries. At the onset of the crisis, international investors lost confidence in the Korean economy because of large external debt, leading to massive capital outflows. In addition, international investors judged that Korean economy is vulnerable simply because it was hit by the East Asian crisis. This stigma effect also contributed to the severe spillover effect.
Another important consideration in foreign exchange management is that central bank should take into account liquidity in the composition of reserve assets. Foreign exchange reserve assets should be drawn upon quickly to defend the domestic economy during the crisis period. Thus, central bank should pay attention to the liquidity management of foreign exchange reserves.
2. Prudential Regulations
Currency crisis and banking crisis tend to break out together in emerging market countries. Currency risk typically arises when borrowings are denominated in foreign currency while revenues are denominated in local currency. In this situation, foreign currency denominated borrowing by nonfinancial corporations implies that the depreciation of the domestic currency increases indebtedness in terms of domestic currency. Thus, firms may not be able to pay back loans to domestic banks. Foreign currency denominated borrowing by banks also directly deteriorates banks’ balance sheets. These losses at banks are likely to cause banks to fail, creating banking crisis.
13. The external debt to GDP ratio was 210% in the first quarter of 1998.
Chapter 6. Capital Flows and Crisis Prevention Policy • 073
Prudential regulations are designed to achieve financially sound banking system and thereby to prevent a banking crisis. In particular, regulatory authority relies on prudential regulations to contain the risks generated in crossborder financial transactions. First, the regulatory authority can require banks to manage credit risk by monitoring the currency mismatch between the assets and liabilities in the borrowing firms’ balance sheets. For example, higher capital requirements on foreign exchange loans can be imposed. Second, the regulatory authority can regulate the currency mismatch stemmed from borrowing in foreign currency and lending in local currency in banks’ balance sheets. Prudential measures to solve this problem include limiting foreign exchange net open positions and imposing foreign exchange liquidity requirements (Ostry and others (2011)).
In addition, prudential regulation not related to foreign currency is also important to protect the banking industry. Given that monitoring of borrowers is weak in emerging market countries, a lending boom is likely to lead to asset price bubbles and enormous loan losses in the banking sector. Examples of regulations to contain the risk associated with the lending boom include imposing limits on loan-to-value ratios, limits on domestic credit growth, limits on loan concentration in a specific sector, and dynamic loan-loss provisions.
3. Capital Controls
During normal times, foreign exchange policy and prudential regulations are sufficient to cope with moderate capital inflows. However, if these policies are not sufficient, government can use capital controls to manage capital inflows. Capital controls refer to residency-based policy measures to regulate capital flows across borders. While international organizations such as the International Monetary Fund at one time discouraged capital controls, they have changed their stance in recent years. Ostry and others (2010) argue that capital controls can be adopted if the economy is operating near potential GDP, if the economy holds an adequate amount of foreign exchange reserves, if the exchange rate is at the equilibrium level, and if the capital inflows are temporary. Then, Ostry and others (2010) point out that these circumstances imply that capital controls must be used only after foreign exchange policy and prudential regulations have been adjusted.
Depending on risks associated with capital inflows, the government can choose economy-wide measures, sector specific measures, or industry-specific measures. The capital controls may also be applied to all capital inflows or may focus on a specific type of market (debt, equity, or FDI) or the maturity of capital inflows (short-term or long-term).

074 • Early Warning System for Financial Crisis
In principle, capital controls and foreign exchange related prudential regulations are two different toolkits. Capital controls are based on the residency of funds while prudential regulations discriminate according to the currency of transactions. Thus, if the government sets higher reserve requirements on the liability to non-residents in bank balance sheets, it is a measure of capital controls. In contrast, if the government imposes higher reserve requirements on foreign currency denominated liabilities, this would not be considred capital control, rather a prudential regulation.
However, in practice, most foreign currency denominated liabilities are from non-residents. Therefore, capital controls and foreign exchange related prudential policies are often together referred to as capital flow measures (CFM) in the sense that the purpose of both policy tools is to affect foreign capital flows. Korea introduced the macro-prudential stability levy on banks’ non-deposit foreign currency liabilities. This measure is a prudential regulation, but it effectively works like capital control as long as most of the foreign currency nondeposit funds are financed by nonresidents.
Nevertheless, Ostry and others (2010) emphasize that capital controls should be used only for temporary capital inflows while prudential regulations need to be strengthened for both temporary and permanent capital inflows, implying that capital controls should not be a permanent solution. For permanent and persistent capital inflows, governments should also adjust macroeconomic and foreign exchange policies.
The relative effectiveness of these two policy tools depends on the channels of capital inflows. Prudential regulations are preferred if foreign capital flows into domestic economy through the intermediation of financial institutions. But, when the capital inflows are more likely to bypass the regulated financial sector, capital controls would be a better policy measure to deal with capital inflows.
Ostry and others (2011) and Baba and Kokenyne (2011) point out that capital controls need to be imposed on all types of capital inflows at least when the government concerns about macroeconomic risks. If capital control measures target a specific type of capital inflow, circumventions through exempt transactions, relabeling, or derivatives markets are likely to be created, significantly reducing the effectiveness of the policy. In particular, because foreign direct investment is often exempt from capital controls, foreign investors may find a way to avoid controls through relabeling.

Chapter 6. Capital Flows and Crisis Prevention Policy • 075
When introducing capital controls, the government can use either price-based measures or quantity-based measures.14 Price-based capital controls uses market mechanism to increase the cost of capital inflows. In contrast, quantity-based capital controls rely on administrative decisions to restrict capital inflows by outright exclusions or explicit quantitative limits. 15 Specific price-based measures include taxes on capital inflows and unremunerated reserve requirements (URRs). URRs creates liquidity costs by requiring part of the capital inflows to be deposited in an unremunerated account in the central bank for a pre-specified period of time.
4. Sovereign Wealth Fund
Sovereign wealth fund (SWF) is a financial vehicle managed by the government or public institutes. The sovereign wealth fund is financed by excess liquidity in the public sector, including fiscal surplus or foreign exchange reserves. The sovereign wealth fund is popular in commodity exporting countries. Since they are intrinsically vulnerable to swings in commodity prices, a well-managed commodity-based sovereign wealth fund can shield the economy against volatile commodity prices.
In fact, many countries operate sovereign wealth funds to insulate government spending from volatile government revenue, which is tied to changes in commodity prices. When commodity exporting prices are high, the extra revenues from commodity exports are saved in the SWF. When the prices are low, on the contrary, money is withdrawn from the fund to supplement government spending. In this way, sovereign wealth funds in commodity exporting countries contribute to stabilizing government spending and the economy. Moreover, as long as the sovereign wealth fund is managed in foreign currencies, it can act similarly to foreign exchange reserves which is valuable at the onset of a currency crisis.
5. Bilateral Swaps and Global Financial Safety Nets (GFSNs)
For emerging market countries, the East Asian crisis and the global financial crisis reconfirms the belief that large foreign exchange reserves can shield the domestic economy from external shocks. In particular, small open economies whose economic growth heavily
14. Price-based measures are, in general, more transparent and predictable.
15. Empirical studies report that capital controls may increase the average maturity of capital inflows by incurring a larger burden on short-term funds.

076 • Early Warning System for Financial Crisis
relies on international trade are more likely to accumulate large foreign exchange reserves. If reserves are not sufficient and external financing is no longer available at crisis onset, these countries would face serious shortage of trade finance, which leads to a sharp drop of exports and imports, and severe contractions in economic activity.
As documented previously, however, holding excessively large reserves is quite costly for both domestic economy and global economy.16 In addition, large foreign exchange reserves cannot be a solution under some circumstances. The extreme uncertainties about the duration of the global financial crisis led many countries including Korea to be reluctant to use foreign exchange reserves because they were the last resort to trade finance.
Indeed, despite large reserve holdings at the onset of the global financial crisis, Korea did not actively use foreign exchange reserves. Rather, the Korean government undertook enormous efforts to restore confidence by improving investor relations (IRs) around the world, but these efforts turned out to be ineffective. It was the bilateral swap arrangement between the Federal Reserve System in the US and the Bank of Korea on October 29, 2008 that stabilized the foreign exchange market.17 The bilateral swap arrangement was effective because it is not subject to stigma effect.
As a result of this experience, Korea proposed the agenda of global financial safety nets in the G20 summit in 2010. But, as pointed out in Lee and Rhee (2012) the temporary bilateral swap arrangements cannot be a solution because they are determined politically. Therefore, Korea attempted to institutionalize the bilateral swap lines with the central banks in advanced countries in the framework of the global financial safety nets. Unfortunately, however, central banks in advanced countries were against to the institutionalized swap lines, pointing out that they are subject to serious moral hazard problems. Instead, the G20 agreed to introduce new IMF’s lending facilities, the multi-country Flexible Credit Line (FCL) and the Precautionary Credit Line (PCL). Emerging market countries can access these lending facilities before the outbreak of a crisis. Indeed, IMF states that the Flexible Credit Line is designed to meet the demand for crisis-prevention and crisis-mitigating lending for countries with very strong policy frameworks and track records in economic performance. Countries can also establish and use regional financial arrangements such as the Multilateral Chiang Mai Initiative Mechanism.
16. Large reserve holdings by emerging market economies may aggravate global imbalances which are likely to intensify trade conflicts.
17. The Federal Reserve System announced in its press release that the swap arrangement was designed to mitigate the spread of difficulties in obtaining US dollar funding in fundamentally sound and well-managed economies such as Brazil, Mexico, Korea, and Singapore.

Chapter 72015 Modularization of Korea’s Development ExperienceEarly Warning System for Financial Crisis
Conclusion

Conclusion
078 • Early Warning System for Financial Crisis
An early warning system is designed to assess riskiness in an economy. If a well-functioning early warning system succeeds in detecting early symptoms of a crisis, the government can conduct preemptive policies to reduce the probability of financial crisis. This report introduces the national early warning system in Korea, which was established in 2005. In particular, this report provides the KCIF’s early warning models for currency crisis and the FSS’s off-site surveillance system for financial institutions along with the methodologies and applications.
Although statistical early warning model is a valuable device for timely assessment of the vulnerability, there is limit as to what quantitative models can do. The imperfection of quantitative models suggests that emerging market countries should strengthen qualitative monitoring to prevent a crisis from taking place. Indeed, quantitative models and qualitative monitoring are two pillars of an early warning system.
The government needs to establish an organization for conducting qualitative monitoring and operating quantitative models. The Korea Center for International Finance (KCIF) is a good reference for emerging market countries. Given the lack of a sufficient dataset and modeling expertise, it is recommended that a simple model be developed first, followed by the gradual build-up of more sophisticated models. Once the models are developed, continuous update and revision are important for better performance of the early warning models. In addition, improving the quality of data and securing human capital in the organization are crucial to maintaining the system.
Chapter 7. Conclusion • 079
The early warning signals help governments prepare for contingency policy actions but the information should be kept confidential. If early warning signals are open to the public, they may elicit adverse reactions by the markets. For example, if market participants acknowledge that the model has sent warning signals of a currency crisis, capital outflows would be further accelerated, followed by financial turmoil. If the government makes public the model’s assessment of troubled banks, this disclosure could make the situation worse and, in the worst case, even lead to bank-runs. Thus, the government should keep official reports confidential, especially when financial stability is at risk.

References
080 • Early Warning System for Financial Crisis
Asian Development Bank (2005), Early Warning System for Financial Crisis: Application to East Asia.
Baba, C. and A. Kokenyne (2011), “Effectiveness of Capital Controls in Selected Emerging Markets in the 2000s,” IMF working paper/11/281.
Basel Committee on Banking Supervision (2010), “Guidance for National Authorities Operating Countercyclical Capital Buffer,” Bank for International Settlements.
Drehmann, M., C. Borio, L. Gambacorta, G. Jimenez, and C. Truchate (2010), “Countercyclical capital buffers: exploring options,” BIS working paper no.317.
Drehmann, M., C. Borio, and K. Tsatsaronis (2011), “Anchoring countercyclical capital buffers: the role of credit aggregates,” BIS working paper no.355.
Eichengreen, B., A. Rose, and C. Wyplosz (1994), “Exchange Market Mayhem: The Antecedents and Aftermath of Speculative Attacks,” Economic Policy, vol.21, pp. 249~312.
Financial Supervisory Service (2009), Financial Industry Early Warning System (in Korean).
Federal Reserve System (2012) “Bank Holding Company Rating System,” Docket No. OP 1207.
Ghosh A., J. Ostry and N. Tamirisa (2009), “Anticipating the Next Crisis,” Finance and Development vol.46, no.3, International Monetary Fund.
Glostein, M., G. Kaminsky, and C. Reinhart (2000), Assessing Financial Vulnerability: An Early Warning System for Emerging Markets, Institute for International Economics.
International Monetary Fund (2010), The IMF-FSB Early Warning Exercise: Design and Methodological Toolkit.
Jung, H. (2015), Policy Recommendations for Financial EWS in Honduras, Knowledge Sharing Program, Korea development Institute.
Kamisnsky, G., S. Lizondo, and C. Reinhart (1998), “Leading Indicators of Currency Crisis,” IMF Staff Paper, vol. 45, no. 1, pp. 1~48.
Kaminsky, G. and C. Reinhart (1999), “The twin crises: the causes of banking and balance of payments problems,” American Economic Review, vol. 89, no. 3, pp. 473~500.
Kang, D., J. Kim, and H. Lee (2005), “An early warning system for financial markets in Korea,” Korea Development Institute. (in Korean)

References • 081
Kim, M., H. Lee, and N. Thanh (2011), “Establishing Early Warning System for Vietnamese Financial Markets,” Knowledge Sharing Program, Korea Development Institute.
Lee, H. and M. Tsedevsuren (2013), “Establishing Early Warning System for Currency Crisis in Mongolia,” in Selective Policy Recommendations for Sustainable Economic Growth of Mongolia: Trade, Macroeconomic and Public Policy Area, Korea Development Institute.
Lee, H and J. Lee (2014), “Establishing Early Warning System in Saudi Arabia,” Knowledge Sharing Program, Korea Development Institute.
Lee, H., W. Shim, and K. Jo (2013), “The Countercyclical Capital Buffer: Its Application in Korea,” Financial Stability Studies, vol. 14, no.1, pp. 35~73 (in Korean).
Lee, H. and C. Rhee (2012), “Lessons from 1997 and the 2008 Crises in Korea,” Asian Economic Policy Review, vol.7, no. 1, pp. 47~66.
OECD (2008), Handbook on Constructing Composite Indicators: Methodology and User Guide.
Ostry, J., A. Ghosh, K. Habermeier, M. Chamon, M. Qureshi, and D. Reinhardt (2010), “Capital Inflows: The Role of Controls,” IMF Staff Position Note/10/04.
Ostry, J., A. Ghosh, K. Habermeier, L. Laeven, M. Chamon, M. Qureshi, and A. Kokenyne (2011), “Managing Capital Inflows: What Tools to use,” IMF Staff Position Note.
Shin, H. (2009), “Reflections on Northern Rock: The Bank Run that Heralded the Global Financial Crisis,” Journal of Economic Perspectives, 23(1).

Appendices
082 • Early Warning System for Financial Crisis
APPENDIX: Statistical Results from Signal Approach
Table A1 | Cambodia
Threshold A/(A+C) B/(B+D) A/(A+B)[B/(B+D)]/[A/(A+C)]
Inflation Rate 1.02 0.37 0.03 0.78 0.08
Interest Rate 0.33 0.10 0.23 0.12 2.22
Interest Rate Differential 0.85 0.02 0.23 0.02 11.16
Domestic Credit 1.31 0.33 0.01 0.92 0.03
Monetary Aggregate 1.29 0.25 0.04 0.69 0.18
Export 0.94 0.39 0.03 0.80 0.07
Import 0.67 0.12 0.17 0.17 1.42
Trade Account Balance 0.51 0.53 0.09 0.67 0.17
Capital Account Balance 1.47 0.25 0.02 0.90 0.06
Oil Price 1.24 0.27 0.06 0.54 0.23
Dollar Index 1.24 0.24 0.07 0.50 0.27
OECD Leading Index 0.95 0.29 0.05 0.58 0.19
China IP 1.15 0.14 0.08 0.32 0.57
Table A2 | Indonesia
Threshold A/(A+C) B/(B+D) A/(A+B)[B/(B+D)]/[A/(A+C)]
Inflation Rate 0.29 0.20 0.08 0.56 0.38
Interest Rate 0.72 0.24 0.06 0.67 0.24
Interest Rate Differential 0.62 0.13 0.15 0.30 1.09
Domestic Credit 0.65 0.08 0.25 0.12 3.29
Monetary Aggregate 0.24 0.29 0.13 0.55 0.46
Export 1.19 0.04 0.20 0.09 4.91
Import 0.94 0.32 0.13 0.55 0.40
Trade Account Balance 1.34 0.12 0.09 0.38 0.79
Capital Account Balance 1.24 0.15 0.06 0.60 0.42
Oil Price 1.24 0.24 0.04 0.75 0.16
Dollar Index 1.09 0.21 0.14 0.42 0.65
OECD Leading Index 0.95 0.07 0.12 0.21 1.80
China IP 1.11 0.09 0.13 0.26 1.36

Appendices • 083
Table A3 | Mongolia
Threshold A/(A+C) B/(B+D) A/(A+B)[B/(B+D)]/[A/(A+C)]
Inflation Rate 0.14 0.43 0.09 0.68 0.22
Interest Rate 0.40 0.15 0.09 0.44 0.61
Interest Rate Differential 0.22 0.32 0.09 0.63 0.28
Domestic Credit 0.83 0.24 0.17 0.48 0.69
Monetary Aggregate 0.83 0.17 0.08 0.52 0.44
Export 0.83 0.23 0.08 0.57 0.36
Import 0.87 0.20 0.11 0.47 0.54
Trade Account Balance 1.06 0.12 0.09 0.38 0.79
Capital Account Balance 0.71 0.11 0.25 0.20 2.22
Oil Price 1.24 0.19 0.06 0.58 0.34
Dollar Index 1.24 0.17 0.07 0.54 0.40
OECD Leading Index 0.95 0.19 0.06 0.58 0.34
China IP 1.15 0.08 0.10 0.27 1.27
Table A4 | Philippines
Threshold A/(A+C) B/(B+D) A/(A+B)[B/(B+D)]/[A/(A+C)]
Inflation Rate 0.74 0.35 0.14 0.48 0.40
Interest Rate 0.90 0.25 0.05 0.67 0.19
Interest Rate Differential 1.16 0.16 0.09 0.38 0.59
Domestic Credit 0.68 0.00 0.22 0.00 -
Monetary Aggregate 0.80 0.40 0.13 0.53 0.33
Export 0.54 0.14 0.22 0.19 1.56
Import 1.22 0.19 0.07 0.50 0.37
Trade Account Balance 0.84 0.41 0.12 0.57 0.29
Capital Account Balance 0.67 0.00 0.23 0.00 -
Oil Price 1.24 0.25 0.05 0.67 0.19
Dollar Index 1.09 0.24 0.14 0.39 0.57
OECD Leading Index 0.95 0.08 0.11 0.21 1.41
China IP 1.11 0.13 0.11 0.30 0.88

Appendices
084 • Early Warning System for Financial Crisis
Table A5 | Sri Lanka
Threshold A/(A+C) B/(B+D) A/(A+B)[B/(B+D)]/[A/(A+C)]
Inflation Rate 1.10 0.21 0.09 0.44 0.41
Interest Rate 1.18 0.07 0.11 0.17 1.66
Interest Rate Differential 1.21 0.21 0.07 0.48 0.36
Domestic Credit 0.71 0.16 0.19 0.21 1.25
Monetary Aggregate 0.65 0.09 0.19 0.13 2.25
Export 1.04 0.12 0.15 0.21 1.23
Import 0.20 0.34 0.13 0.48 0.36
Trade Account Balance 1.27 0.19 0.07 0.46 0.39
Capital Account Balance 0.63 0.23 0.17 0.37 0.72
Oil Price 1.24 0.26 0.05 0.63 0.20
Dollar Index 1.24 0.24 0.06 0.58 0.24
OECD Leading Index 0.95 0.19 0.07 0.46 0.39
China IP 1.15 0.16 0.07 0.41 0.48
Table A6 | Vietnam
Threshold A/(A+C) B/(B+D) A/(A+B)[B/(B+D)]/[A/(A+C)]
Inflation Rate 0.52 0.21 0.11 0.61 0.53
Interest Rate 1.01 0.22 0.06 0.72 0.26
Interest Rate Differential 1.07 0.15 0.20 0.33 1.35
Domestic Credit 0.97 0.23 0.06 0.73 0.25
Monetary Aggregate 0.58 0.24 0.06 0.72 0.26
Export 1.38 0.19 0.04 0.80 0.19
Import 1.17 0.14 0.08 0.57 0.56
Trade Account Balance 0.84 0.29 0.07 0.77 0.24
Capital Account Balance 0.74 0.30 0.11 0.70 0.36
Oil Price 1.24 0.15 0.07 0.58 0.48
Dollar Index 1.24 0.22 0.02 0.88 0.10
OECD Leading Index 0.95 0.26 0.00 1.00 0.00
China IP 1.15 0.15 0.06 0.64 0.39


Knowledge Sharing Program Development Research and Learning Network
● www.kdischool.ac.kr
ww
w.k
sp.g
o.kr
Ministry of Strategy and Finance, Republic of Korea
30109, Government Complex-Sejong, 477, Sejong-si, Korea Tel. 82-44-215-2114 www.mosf.go.krKDI School of Public Policy and Management
● Tel. 82-44-550-1172
30149, 263 Namsejong-ro, Sejong-si, Korea Tel. 82-44-550-1114 www.kdischool.ac.kr
● 30149, 263 Namsejong-ro, Sejong-si, Korea