2015 q1 earnings call presentation
TRANSCRIPT

First Quarter Financial Results February 5, 2015
Pursuing Growth • Building Value
a global diversified industrial company

2015 Hillenbrand
Hillenbrand Participants
Q1 ‘15 Earnings Presentation | 2
Joe Raver
– CEO
Kristina Cerniglia
– CFO
Thomas Kehl
– President – Coperion

2015 Hillenbrand
Forward-Looking Statements and Factors That May Affect Future Results:
Throughout this presentation, we make a number of “forward-looking statements” within the meaning of the Private Securities Litigation Reform Act of
1995. As the words imply, these are statements about future plans, objectives, beliefs, and expectations that might or might not happen in the future, as
contrasted with historical information. Forward-looking statements are based on assumptions that we believe are reasonable, but by their very nature are
subject to a wide range of risks.
Accordingly, in this presentation, we may say something like,
“We expect that future revenue associated with the Process Equipment Group will be influenced by order backlog.”
That is a forward-looking statement, as indicated by the word “expect” and by the clear meaning of the sentence.
Other words that could indicate we are making forward-looking statements include:
This is not an exhaustive list, but is intended to give you an idea of how we try to identify forward-looking statements. The absence of any of these words,
however, does not mean that the statement is not forward-looking.
Here is the key point: Forward-looking statements are not guarantees of future performance, and our actual results could differ materially from those set
forth in any forward-looking statements. Any number of factors, many of which are beyond our control, could cause our performance to differ significantly
from what is described in the forward-looking statements.
For a discussion of factors that could cause actual results to differ from those contained in forward-looking statements, see the discussions under the
heading “Risk Factors” in Item 1A of Part I our Form 10-Q for the period ended December 31, 2014, located on our website and filed with the SEC. We
assume no obligation to update or revise any forward-looking statements.
Disclosure regarding forward-looking statements
Q1 ‘15 Earnings Presentation | 3
2015 Hillenbrand
Hillenbrand’s strategy is focused on three key areas
Q1 ‘15 Earnings Presentation | 4
Develop Hillenbrand into a world-class global diversified industrial company
Leverage our strong financial foundation and the Hillenbrand Business System to deliver sustainable profit growth, revenue expansion, and free cash flow
Reinvest this cash in new growth initiatives, both organic and inorganic, that create shareholder value

2015 Hillenbrand
Q1 Highlights
Q1 ‘15 Earnings Presentation | 5
Q1 2015 Consolidated Highlights
– Revenue increased 4% to $401.5 million, or 8% on a constant currency basis,
driven by the Process Equipment Group
– Adjusted EPS* grew 44% to $0.49 per diluted share
PEG Q1 2015 Highlights
– Revenue increased $14 million to $256 million, +6%, or +12% on a constant
currency basis, versus the prior year
– Adjusted EBITDA* margin grew 390 bps compared to prior year
Batesville Q1 2015 Highlights
– Revenue increased 2% to $145 million driven by an increase in volume, offset
by a lower average selling price
– Adjusted Gross Margin* was 38.1%, down 110 bps, driven by lower average
selling price
*See appendix for reconciliation
2015 Hillenbrand
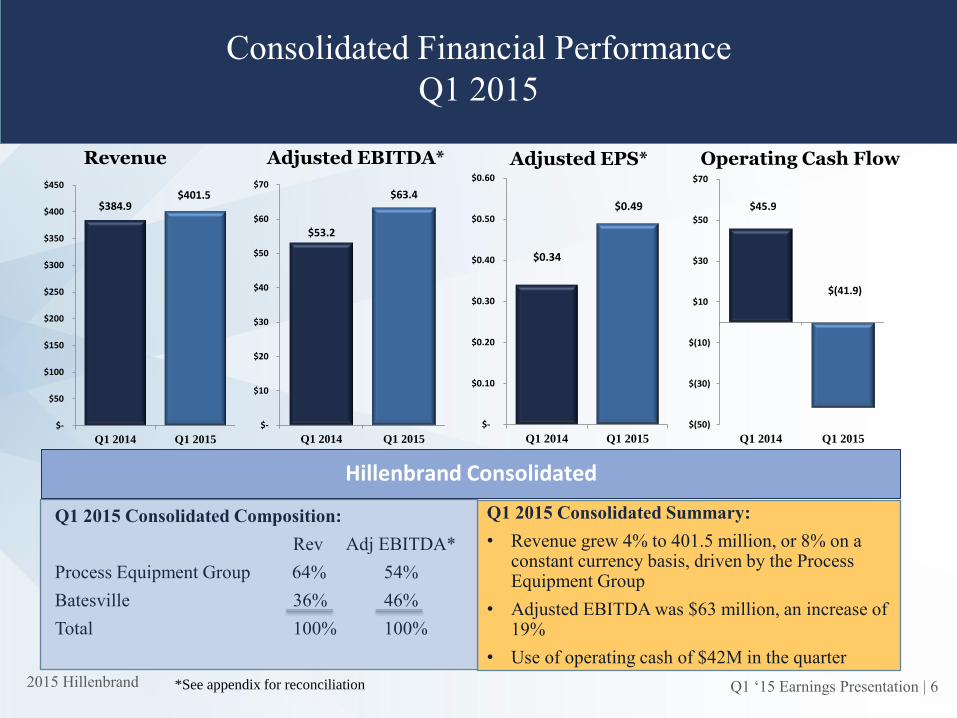
Consolidated Financial Performance
Q1 2015
Adjusted EPS*
Q1 2015 Consolidated Summary:
• Revenue grew 4% to 401.5 million, or 8% on a constant currency basis, driven by the Process Equipment Group
• Adjusted EBITDA was $63 million, an increase of 19%
• Use of operating cash of $42M in the quarter
Hillenbrand Consolidated
Operating Cash Flow
Q1 ‘15 Earnings Presentation | 6
Adjusted EBITDA* Revenue
*See appendix for reconciliation
Q1 2015 Consolidated Composition:
Rev Adj EBITDA*
Process Equipment Group 64% 54%
Batesville 36% 46%
Total 100% 100%
$384.9 $401.5
$-
$50
$100
$150
$200
$250
$300
$350
$400
$450
Q1 2014 Q1 2015
$53.2
$63.4
$-
$10
$20
$30
$40
$50
$60
$70
Q1 2014 Q1 2015
$45.9
$(41.9)
$(50)
$(30)
$(10)
$10
$30
$50
$70
Q1 2014 Q1 2015
$0.34
$0.49
$-
$0.10
$0.20
$0.30
$0.40
$0.50
$0.60
Q1 2014 Q1 2015

2015 Hillenbrand Q1 ‘15 Earnings Presentation | 7
Segment Performance
Q1 2015
Process Equipment Group Batesville
Revenue Adjusted EBITDA* Revenue Adjusted EBITDA*
Q1 2015 Summary:
• Revenue was $145 million, up 2%
• Adjusted gross margin* was 38.1%, down 110 basis points, driven by lower average selling price
Q1 2015 Summary:
• Revenue was up 6% due to increased volume of capital projects and continued momentum of sales of equipment and parts into the proppant market
• Adjusted EBITDA* grew 43% driven by volume and operating expense discipline
Process Equipment Group Batesville
*See appendix for reconciliation
$242.2
$256.4
$-
$50
$100
$150
$200
$250
$300
Q1 2014 Q1 2015
$26.7
$38.1
$-
$5
$10
$15
$20
$25
$30
$35
$40
$45
Q1 2014 Q1 2015
$142.7 $145.1
$-
$50
$100
$150
$200
$250
$300
Q1 2014 Q1 2015
$34.5 $32.6
$-
$5
$10
$15
$20
$25
$30
$35
$40
$45
Q1 2014 Q1 2015

2015 Hillenbrand
Hillenbrand Outlook: FY 2015 Guidance
2% - 4% Constant Currency Growth Revenue
Q1 ‘15 Earnings Presentation | 8
$2.05 - $2.15 per Diluted Share EPS
(adjusted)

Q&A
Q1 ‘15 Earnings Presentation | 9

2015 Hillenbrand
Replay Information
Q1 ‘15 Earnings Presentation | 10
Dial In: (855) 859-2056
International: +1 (404) 537-3406
Conference ID: 60438544
Encore Replay Dates: 2/05/2015 - 2/19/2015
Log on to: http://ir.hillenbrandinc.com/investor-relations

2015 Hillenbrand
Appendix
Q1 ‘15 Earnings Presentation | 11

2015 Hillenbrand Q1 ‘15 Earnings Presentation | 12
Q1 FY15 & Q1 FY14 - Adjusted EBITDA to Consolidated Net
Income Reconciliation
2014 2013
Adjusted EBITDA:
Process Equipment Group 38.1$ 26.7$
Batesville 32.6 34.5
Corporate (7.3) (8.0)
Less:
Interest income (0.3) (0.2)
Interest expense 5.7 6.3
Income tax expense 11.8 9.0
Depreciation and amortization 15.0 14.3
Business acquisition and integration 0.3 1.9
Restructuring 0.7 0.3
Litigation 0.5 -
Consolidated net income 29.7$ 21.6$
Three months ended December 31,

2015 Hillenbrand
Q1 FY15 & Q1 FY14 Non-GAAP Operating Performance
Measures
Q1 ‘15 Earnings Presentation | 13
GAAP Adj Adjusted GAAP Adj Adjusted
Cost of goods sold 263.1$ (1 .2)$ (a) 261 .9$ 253.9$ (0.1 )$ (d) 253.8$
Operating expenses 91 .2 (1 .5) (b) 89.7 94.0 (2.1 ) (e) 91 .9
Income tax expense 1 1 .8 0.8 (c) 1 2.6 9.0 0.6 (c) 9.6
Net income1
29.5 1 .9 31 .4 20.3 1 .6 21 .9
Diluted EPS 0.46 0.03 0.49 0.32 0.02 0.34
Ratios:
Gross margin 34.5% 0.3% 34.8% 34.0% 0.1 % 34.1 %
22.7 % (0.4%) 22.3% 24.4% (0.5%) 23 .9%
1 Net income attributable to Hillenbrand
P = Process Equipment Group; B = Batesv ille; C = Corporate
(a) Restructuring ($1 .2 B)
(b) Restructuring ($0.3 P, $0.4 C), business acquisition and integration costs ($0.1 P, $0.2 C), litigation costs ($0.5 B)
(c) Tax effect of adjustments
(d) Restructuring ($0.1 B)
(e) Business acquisition and integration costs ($0.7 P, $1 .2 C) and restructuring ($0.2 P)
Three months ended December 31,
2014
Operating expenses as a % of
net rev enue
2015

2015 Hillenbrand
Hillenbrand Outlook: FY 2015 Guidance Revenue constant currency growth 2-4%; ADJ EPS $2.05-$2.15
Q1 ‘15 Earnings Presentation |
14
EPS EPS
Range
Revenue Growth* 2% 4%
Revenue $ 1,700 1,734
FY 14 Adjusted EPS $ 2.06 $ 2.06
One-time adjustments (0.14) (0.14)
Effective Tax Rate 0.06 0.06
Normalized FY14 Base $ 1.98 $ 1.98
Normalized FY14 Base $ 1.98 $ 1.98
Organic Revenue Growth 0.04 0.07
Interest on Fixed Debt (0.03) (0.03)
PEG EBITDA improvement 0.13 0.20
FX (0.07) (0.07)
Adjusted EPS $ 2.05 $ 2.15
Normalized EPS Growth 3% 9%
1.85
1.90
1.95
2.00
2.05
2.10
ReportedAdj EPS
ForethoughtWarrant
LP Gain BatesvilleCustomerContract
CancellationFee
CoperionCommission
Error
Tax Rate NormalizedAdj EPS
$2.06
$1.98
0.06
0.03
0.03 0.02
0.06
FY14 Reported Adjusted to
Normalized Adjusted EPS Bridge
* Constant currency