2015 uli latam mia aka final
TRANSCRIPT

Innovation&InvestinginGrowthOpportunties
Alejandro(Alex)KrellPALADINREALTYPARTNERS


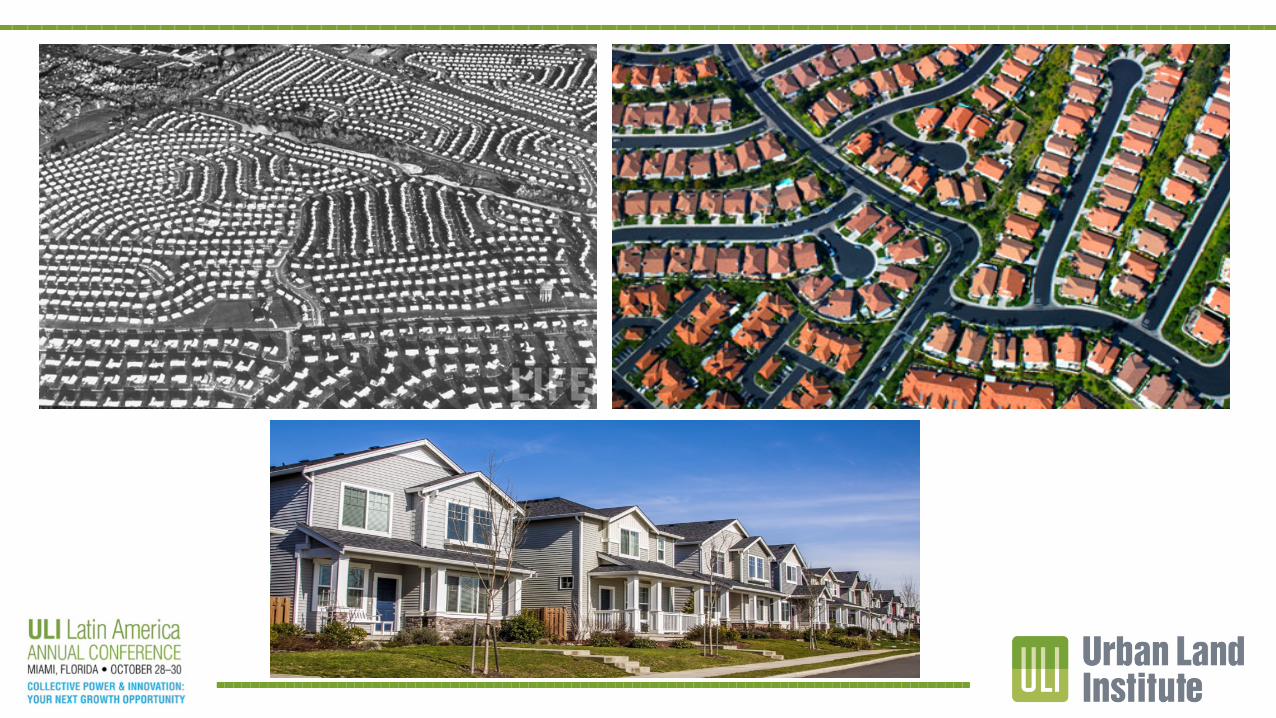


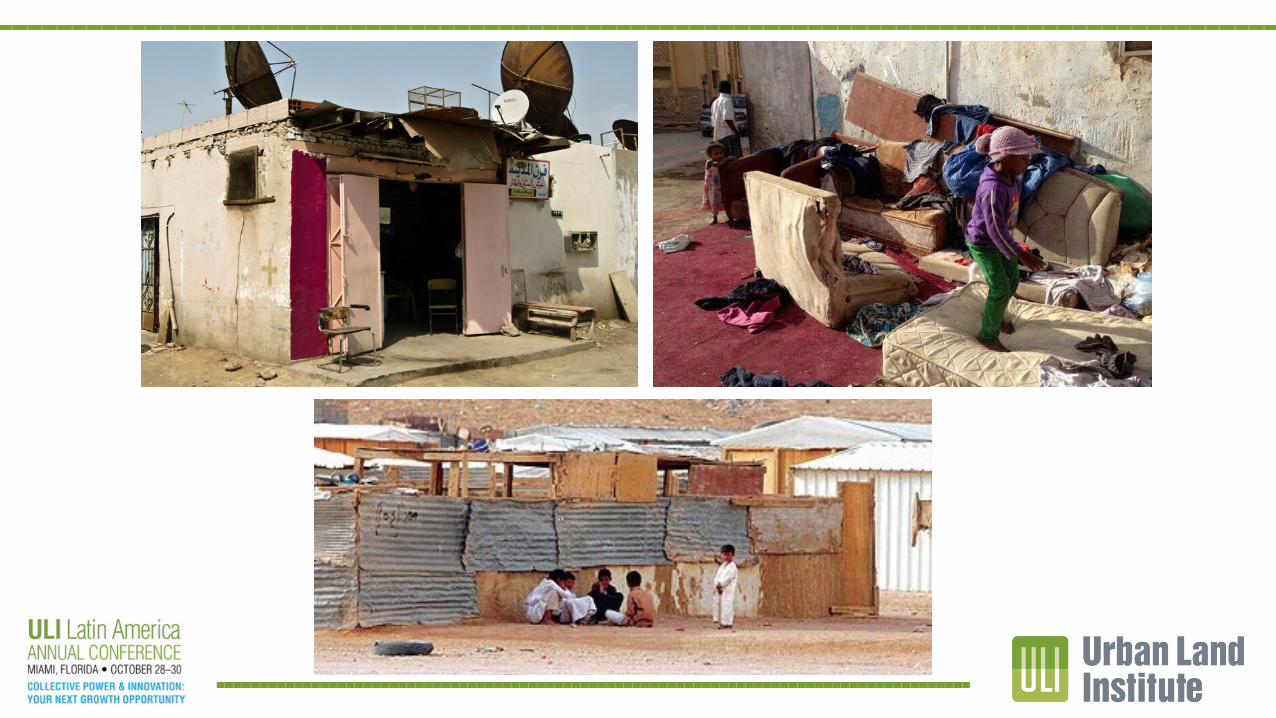

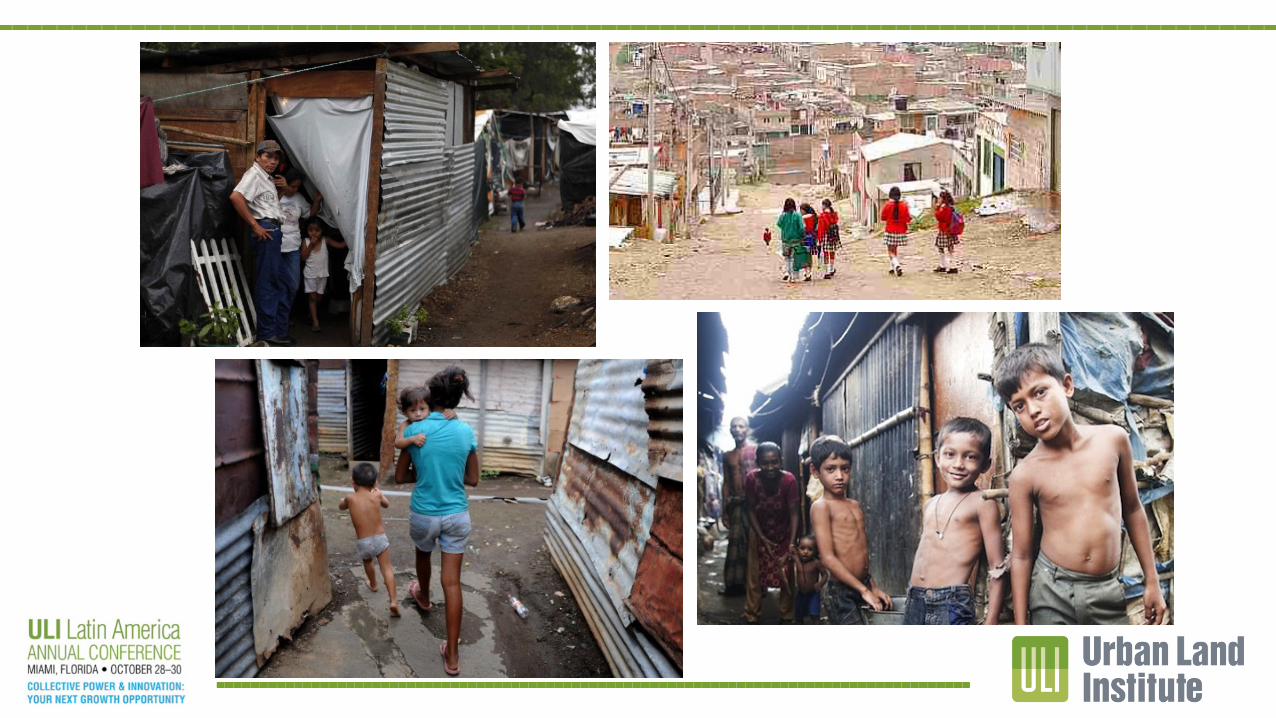
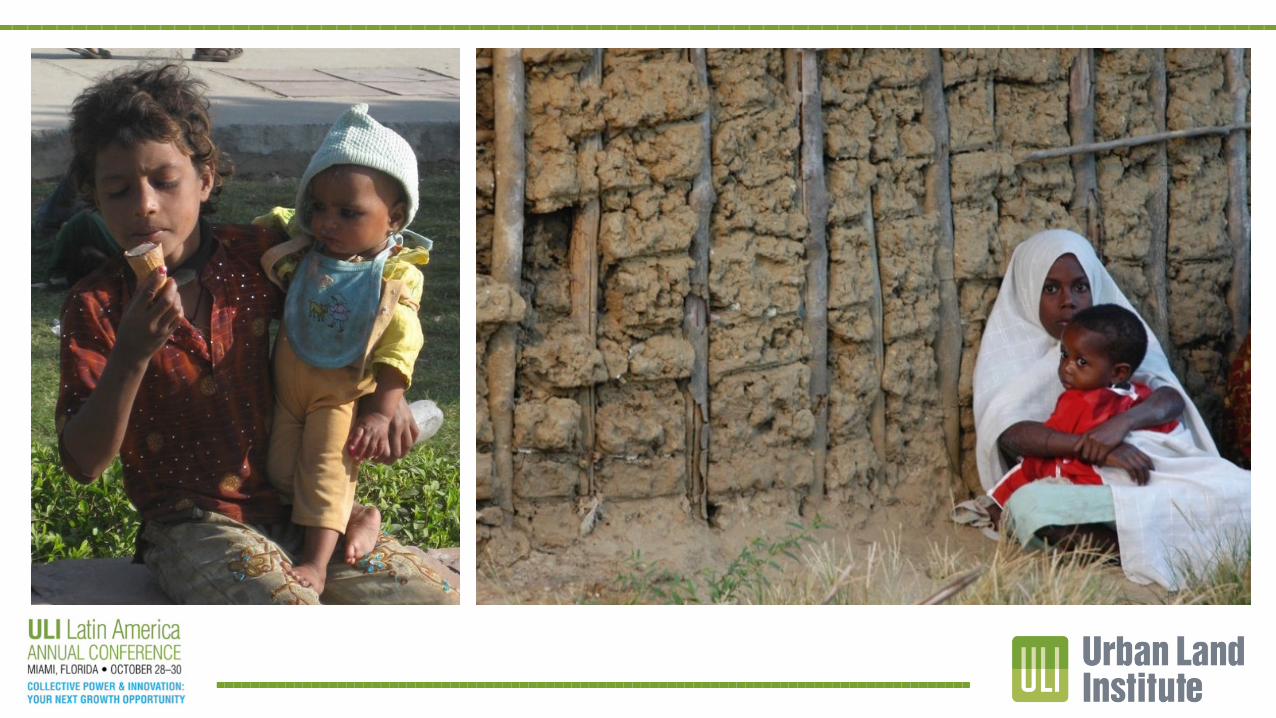
800+millionpeopleliveinslums
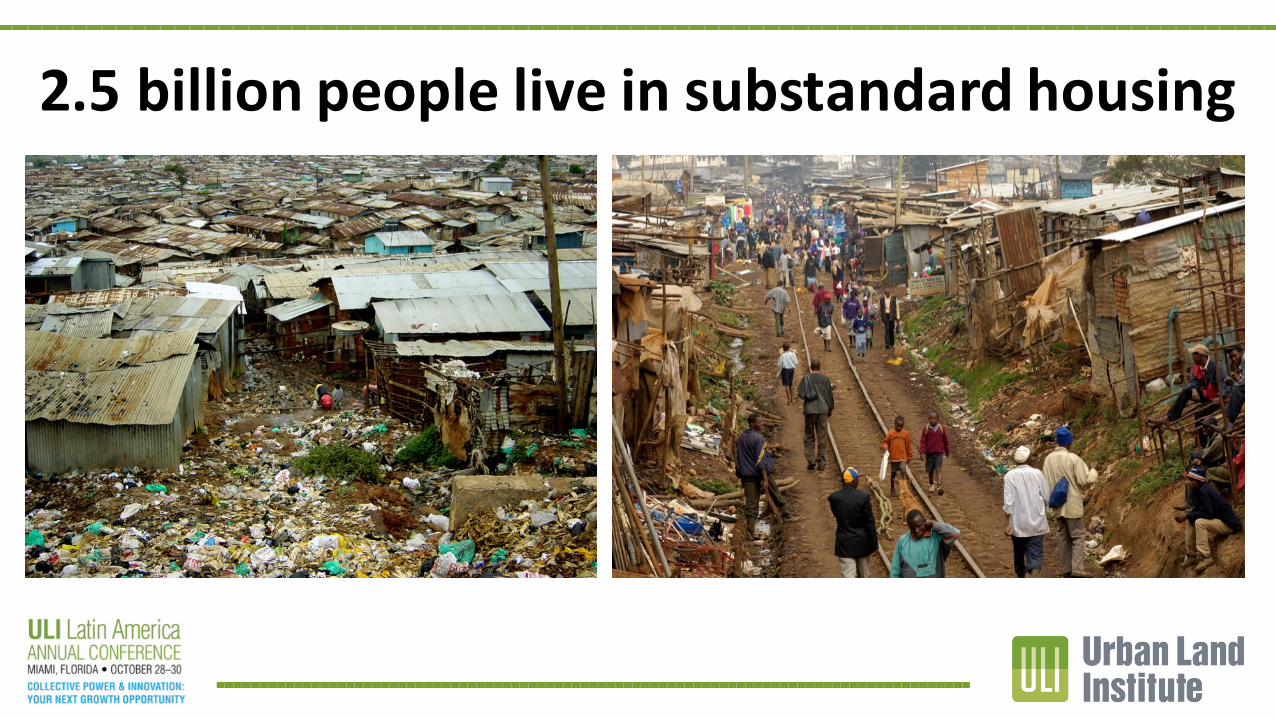
2.5billionpeopleliveinsubstandardhousing


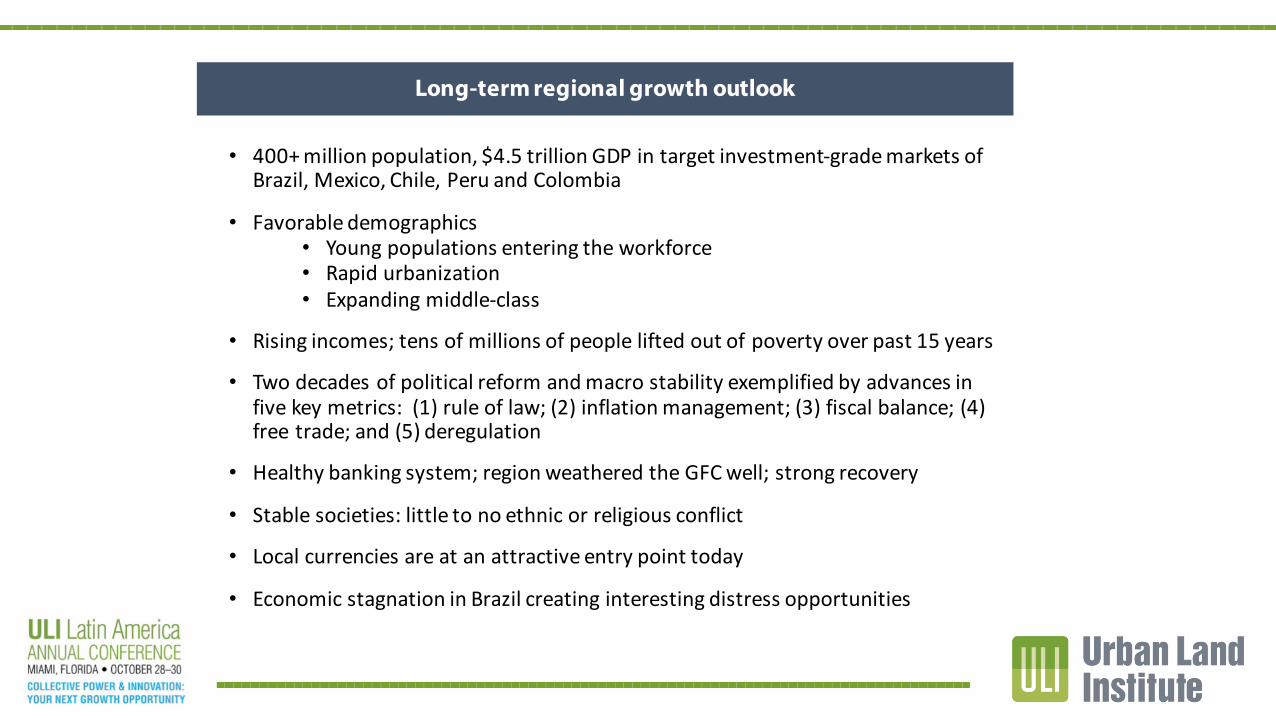
• 400+millionpopulation,$4.5trillionGDPintargetinvestment-grademarketsofBrazil,Mexico,Chile,PeruandColombia
• Favorabledemographics• Youngpopulationsenteringtheworkforce• Rapidurbanization• Expandingmiddle-class
• Risingincomes;tensofmillionsofpeopleliftedoutofpovertyoverpast15years
• Twodecadesofpoliticalreformandmacrostabilityexemplifiedbyadvancesinfivekeymetrics:(1)ruleoflaw;(2)inflationmanagement;(3)fiscalbalance;(4)freetrade;and(5)deregulation
• Healthybankingsystem;regionweatheredtheGFCwell;strongrecovery
• Stablesocieties:littletonoethnicorreligiousconflict
• Localcurrenciesareatanattractiveentrypointtoday
• EconomicstagnationinBrazilcreatinginterestingdistressopportunities
47
Long-term regional growth outlook
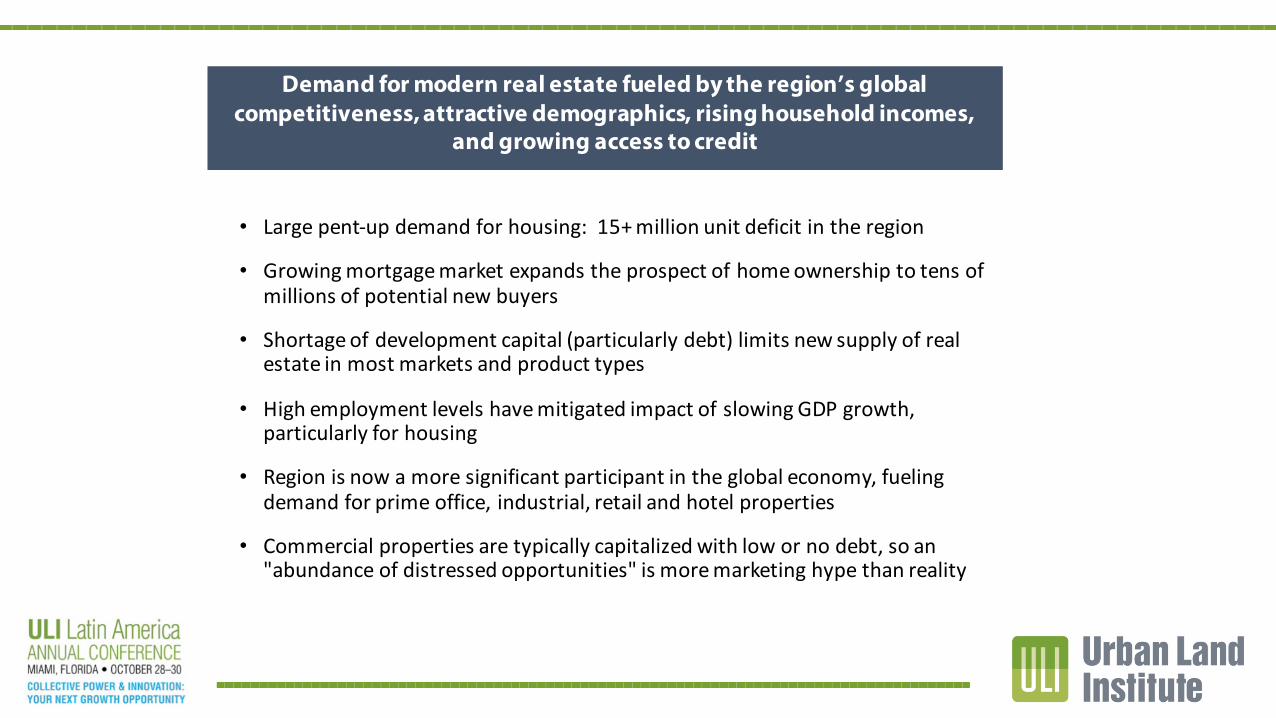
Demand for modern real estate fueled by the region’s global competitiveness, attractive demographics, rising household incomes,
and growing access to credit
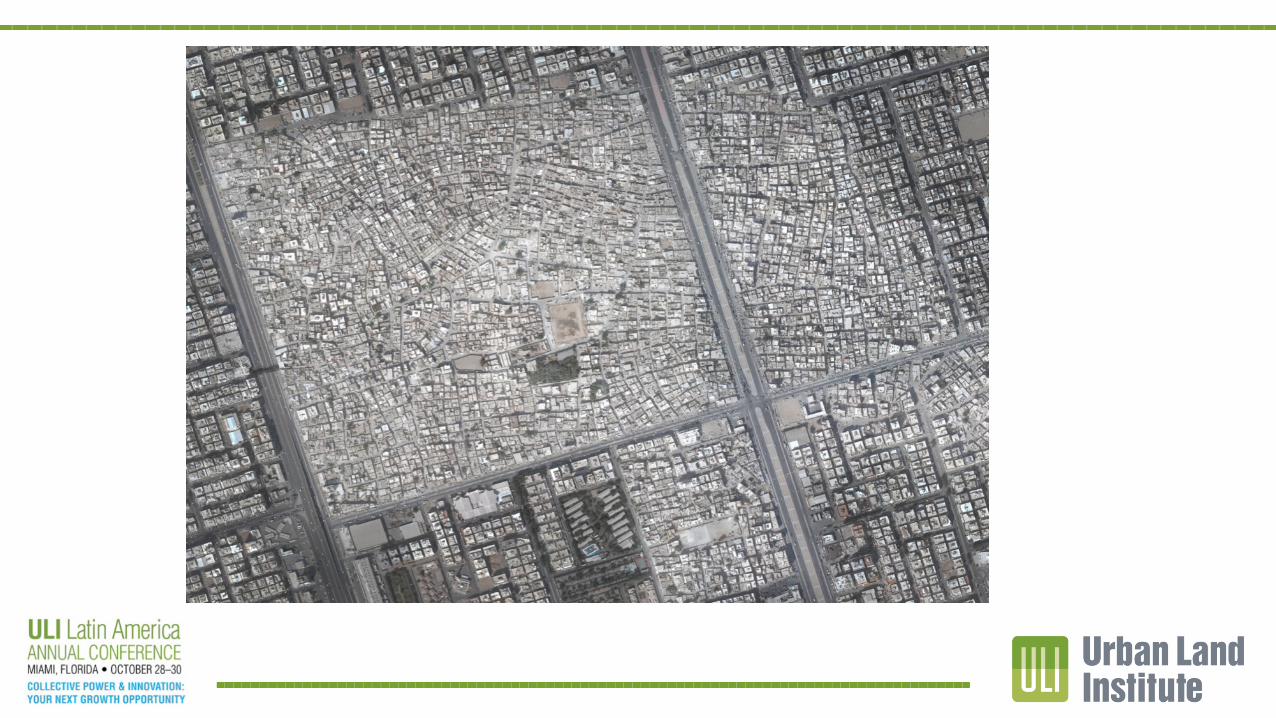
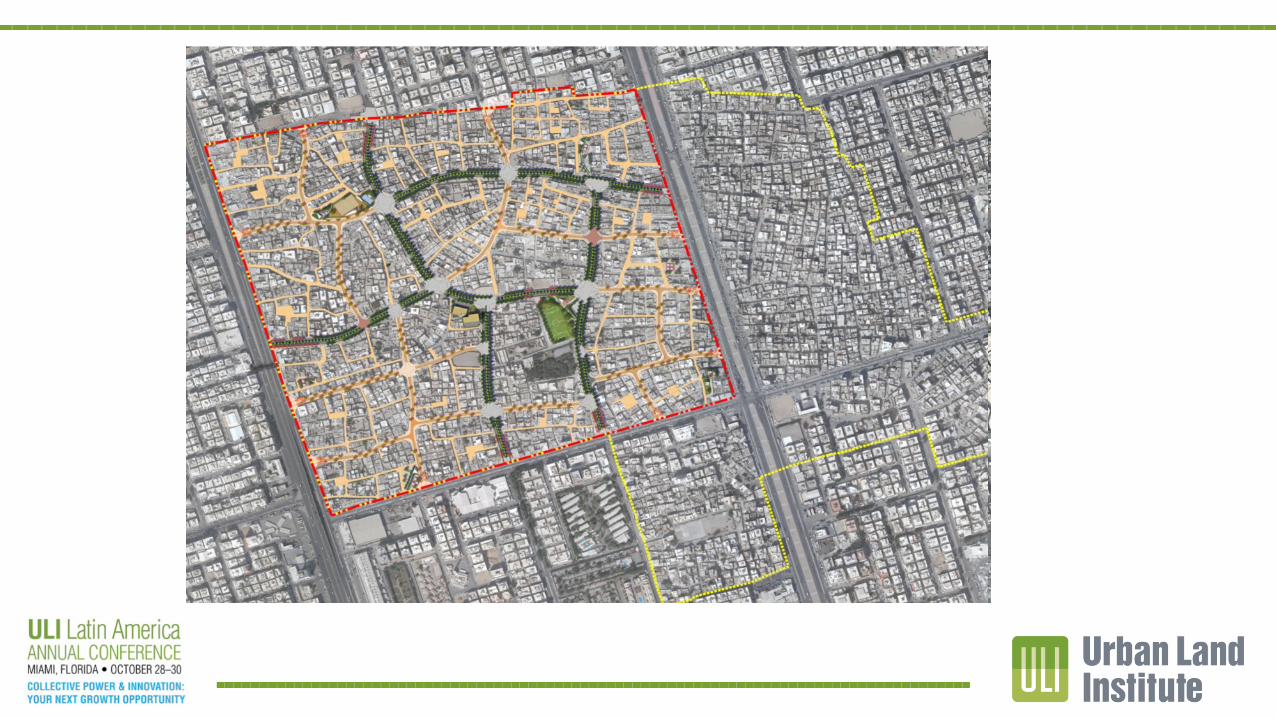
• Largepent-updemandforhousing:15+millionunitdeficitintheregion
• Growingmortgagemarketexpandstheprospectofhomeownershiptotensofmillionsofpotentialnewbuyers
• Shortageofdevelopmentcapital(particularlydebt)limitsnewsupplyofrealestateinmostmarketsandproducttypes
• HighemploymentlevelshavemitigatedimpactofslowingGDPgrowth,particularlyforhousing
• Regionisnowamoresignificantparticipantintheglobaleconomy,fuelingdemandforprimeoffice,industrial,retailandhotelproperties
• Commercialpropertiesaretypicallycapitalizedwithlowornodebt,soan"abundanceofdistressedopportunities"ismoremarketinghypethanreality
48

10,000,000 5,000,000 0 5,000,000 10,000,000
0-45-9
10-1415-1920-2425-2930-3435-3940-4445-4950-5455-5960-6465-6970-7475-7980-8485+
Brazil Population - 2030
15,000,000 10,000,000 5,000,000 00 5,000,000 10,000,000 15,000,000
0-45-9
10-1415-1920-2425-2930-3435-3940-4445-4950-5455-5960-6465-6970-7475-7980-8485+
US Population - 2000
Source: Bloomberg, The Economist Intelligence Unit, April 2010; US Census15,000,000 5,000,000 5,000,000 15,000,000
0-45-9
10-1415-1920-2425-2930-3435-3940-4445-4950-5455-5960-6465-6970-7475-7980-8485+
US Population - 2030
Female
Male
15,000,000 5,000,000 5,000,000 15,000,000
0-45-9
10-1415-1920-2425-2930-3435-3940-4445-4950-5455-5960-6465-6970-7475-7980-8485+
US Population - 2030
Female
Male
15,000,000 5,000,000 5,000,000 15,000,000
0-45-9
10-1415-1920-2425-2930-3435-3940-4445-4950-5455-5960-6465-6970-7475-7980-8485+
US Population - 2030
Female
Male
15,000,000 5,000,000 5,000,000 15,000,000
0-45-9
10-1415-1920-2425-2930-3435-3940-4445-4950-5455-5960-6465-6970-7475-7980-8485+
US Population - 2030
Female
Male
Latin America’s baby boomers are entering the workforce by the millions
10,000,000 5,000,000 0 5,000,000 10,000,000
0-45-9
10-1415-1920-2425-2930-3435-3940-4445-4950-5455-5960-6465-6970-7475-7980-8485+
Brazil Population - 2000
15,000,000 10,000,000 5,000,000 00 5,000,000 10,000,000 15,000,000
0-45-9
10-1415-1920-2425-2930-3435-3940-4445-4950-5455-5960-6465-6970-7475-7980-8485+
US Population - 1970

0
5,000
10,000
15,000
20,000
25,000
1980 1985 1990 1995 2000 2005 2010 2015e
Brazil
Chile
Colombia
Mexico
Peru
Uruguay
Latam weathered the 2008-09 the GFC well and has resumed growth…
Real GDP Growth in Latin America by Country Key Paladin Target Markets
Real Growth Per Capita GDP (PPP)
Source: IMF
…leading to rising incomes and lifting tens of millions from poverty
In Brazil alone, 30+ million people were lifted out of poverty during the past decade; over 4 million people expected to enter Brazil’s middle-class annually through 2030
Sources: IMF WEO Data, Morgan Stanley Research, April 2014.
USS
-2.0%0.0%2.0%4.0%6.0%8.0%
10.0%
Brazil Mexico Chile Colombia Peru
2010 2011 2012 2013 2014e 2015e
50

Real estate investments in Latin America offer superior project-level returns with downside risk mitigation due to low leverage and significant pre-sales
§ Higher projected unlevered profit margins in most markets and products than comparable investments in the U.S. and other developed markets
§ Development risk in the housing market is greatly mitigated by substantial pre-sales (30-70%) before start of construction
§ Lower leverage than comparable investments in the U.S. and Europe. Housing developments typically built with debt equal to 30-40% of cost (vs. 70-90% in U.S.)
§ Higher local interest rates and regional cap rates mitigate cap rate expansion risk and will likely lead to cap rate compression as growth picks up and rates decline
§ Key benefits to global real estate investors who choose to diversify into the region:– Opportunistic returns (20-25% IRRs) projected with less than half the debt
of a typical opportunity fund– Capital preservation, downside protection and diversification due to
combination of high projected profit margins, lower expected leverage, pre-sales and resilient real estate demand
51


Thankyou