20150505 bond efficiency-gmsg-ice-v1-r04 determining · pdf...
TRANSCRIPT
Global Mining Standards and Guidelines (GMSG) Group
20150505_Bond_Efficiency-GMSG-ICE-v1-r04
Determining the Bond Efficiency of industrial grinding circuits
SUBMITTED BYThe Bond Efficiency Guideline Sub-Committee
VERSION DATE05 May 2015
Annexes: 26 Mar 2015
APPROVED BYVote of the Industrial Comminution Efficiency Working Group
05 May 2015and
GMSG Governing Council 11 May 2015
EDITED BYJanice M. Burke
20 Aug 2015
DATE DOCUMENT TO BE REVIEWED 05 May 2020
PREPARED BY THE BOND WORK INDEX SUB-COMMITTEE OF THE INDUSTRIAL COMMINUTION EFFICIENCY WORKING GROUP
Robert E. McIvor, Metcom Technologies Inc. (sub-committee leader)
Global Mining Standards and Guidelines (GMSG) Group
DETERMINING THE BOND EFFICIENCY OF INDUSTRIAL GRINDING CIRCUITS | i
DISCLAIMER
Although these guidelines and other documents or information sources referenced at http://www.globalminingstandards.orgare believed to be reliable, we do not guarantee the accuracy or completeness of any of these other documents or informationsources. Use of these guidelines or the above documents or information sources is not intended to replace, contravene orotherwise alter the requirements of any national, state, or local governmental statutes, laws, regulations, ordinances, or otherrequirements regarding the matters included herein. Compliance with these guidelines is entirely voluntary.
Global Mining Standards and Guidelines (GMSG) Group
ii | DETERMINING THE BOND EFFICIENCY OF INDUSTRIAL GRINDING CIRCUITS
COPYRIGHT NOTICE
This document is copyright-protected by the Global Mining Standards and Guidelines (GMSG) Group. Working orcommittee drafts can be reproduced and used by GMSG participants during guideline development. GMSG hereby grantspermission for interested individuals/organizations to download one copy. Written permission from GMSG is required toreproduce this document, in whole or in part, if used for commercial purposes.
To request permission, please contact:
Global Mining Standards and Guidelines GroupHeather Ednie, Managing [email protected]://www.globalminingstandards.org
Reproduction for sales purposes may be subject to royalty payments or a licensing agreement.
Violators may be prosecuted.
Global Mining Standards and Guidelines (GMSG) Group
DETERMINING THE BOND EFFICIENCY OF INDUSTRIAL GRINDING CIRCUITS | iii
TABLE OF CONTENTS
DISCLAIMER i
COPYRIGHT NOTICE ii
TABLE OF CONTENTS iii
1. FOREWORD 1
2. DEFINITIONS OF TERMS, SYMBOLS, AND ABBREVIATIONS 1
3. KEYWORDS
4. INTRODUCTION AND BACKGROUND 1
5. SCOPE 1
6. OTHER USEFUL DOCUMENTS 1
7. DETERMINING THE BOND EFFICIENCY OF A GRINDING CIRCUIT 1
7.1 Method 1
7.2 Demonstration/Example Calculations 3
7.2.1 Generic Circuit Calculation 3
7.2.2 Common Plant Grinding Circuit Calculations 3
8. Wi TEST EQUIPMENT AND PROCEDURES 4
8.1 Bond Impact Crushing Wi Test 4
8.1.1 Apparatus 4
8.1.2 Sample 4
8.1.3 Procedure 5
8.1.4 Calculations 5
8.2 Bond Rod Mill Wi Test 5
8.2.1 Apparatus 5
8.2.2 Sample 5
8.2.3 Procedure 5
8.2.4 Calculations 6
8.3 Bond Ball Mill Wi Test 6
8.3.1 Apparatus 6
8.3.2 Sample 7
8.3.3 Procedure 7
8.3.4 Calculations 7
8.4 Accuracy of Comparative Circuit Work Index Efficiency Determinations 7
9. DATABASE OF BOND GRINDING CIRCUIT EFFICIENCIES 8
10. RESOURCES, REFERENCES, AND RECOMMENDED READING 8
ANNEXES A-C 9–11
Global Mining Standards and Guidelines (GMSG) Group
DETERMINING THE BOND EFFICIENCY OF INDUSTRIAL GRINDING CIRCUITS | 1
1. FOREWORDThe Global Mining Standards and Guidelines (GMSG)
Group is a global, multi-stakeholder community to advancethe availability and use of standards and guidelines for theinternational mining industry. This GMSG document wasprepared by a GMSG working group. Draft documents arechecked and approved by working group members, priorto approval by the GMSG Governing Council.
Formed as part of the Canadian Institute of Mining, Met-allurgy and Petroleum (CIM), GMSG is supported by CIM andthree other Partner Organizations: the Australasian Instituteof Mining and Metallurgy (AusIMM), the Southern AfricanInstitute of Mining and Metals (SAIMM), and the SurfaceMining Association for Research and Technology (SMART),as well as its Member Companies and participants.
Please note: if some of the elements of this documentare subject to patent rights, the GMSG and CIM are notresponsible for identifying such patent rights.
2. DEFINITIONS OF TERMS, SYMBOLS, AND ABBREVIATIONS
α Angle to which the two hammers are raised fromthe vertical (degrees)
C Energy per unit thickness to break a particle (J/mm)Cmean Mean energy per unit thickness to break the parti-
cles (J/mm)d Particle thickness between the points that it is con-
tacted by the two hammers (mm)F80 80% passing size of the circuit feed (µm) Gpr Grams (new minus closing screen aperture) per mill
revolutionIPP Mass of Ideal Potential Product from a test cycle
(g)n Number of fragments of a broken particleP Equipment power (kW)P100 100% passing size or closing screen aperture (µm)P80 80% passing size of the circuit product (µm)sg Particle specific gravity (unitless)SAG Semi-Autogenous GrindingT Circuit tonnage (metric t/h)W Specific energy (work) input (kWh/t)Wi Bond Work Index (kWh/t)WiBM Bond Ball Mill Test Work Index (kWh/t)Wic Bond Impact Crushing Test Work Index (kWh/t)WioACT Actual Operating Bond Work Index determined
from measurements on the circuit (kWh/t)WiRM Bond Rod Mill Test Work Index (kWh/t)WiSTD Standard Circuit Bond Work Index (expected or
designed) used for circuit design. Specific energyrequirement at the drive pinions.
3. KEYWORDSWork Index, Work Index Efficiency, Bond Work Index
testing
4. INTRODUCTION AND BACKGROUNDThe Bond method allows for quantification and com-
parison of relative energy efficiencies of most industrialcomminution circuits. It is an essential tool for managingthe important business (cost) of grinding.
For early analyses of plant grinding efficiency issues, seeBond (1957, 1960).
5. SCOPEThis Bond Efficiency determination applies to most
brittle materials in their naturally occurring (unscalped)size distributions being treated in size reduction circuitsdown to an 80% passing size of the circuit product (P80)of approximately 70 µm. Unusually shaped materials (e.g.,mica) should be regarded with caution. The Bond WorkIndex (Wi) is the specific energy associated with a stan-dard amount of size reduction: from a very large F80 (80%passing circuit feed) of approximately infinity to a P80 of100 µm.
6. OTHER USEFUL DOCUMENTSThe sampling and surveying guideline (GMSG, under
approval) will provide guidance on how to collect informa-tion related to the operation of the circuit (F80, P80, powerand mill feed rate).
7. DETERMINING THE BOND EFFICIENCY OF AGRINDING CIRCUIT
7.1 MethodIn the plant:1. Define the circuit for which the Bond Efficiency is to be
determined. 2. Procure samples of the circuit feed and product.3. Obtain the power draw of the size reduction equipment
at the drive pinion(s).4. Obtain the circuit throughput rate (dry tonnage).In the laboratory:1. Conduct screen analyses of the circuit feed and product
samples.2. Conduct Wi test(s) on the circuit feed (see Section 8)..
Use a 1,190 µm screen to close the rod mill Wi test forthese purposes. Choose a closing screen for the ball milltest that is one (standard square root of 2 series) meshsize coarser than the plant ball mill circuit P80. If choos-ing between two standard mesh sizes, choose the finerone.
Global Mining Standards and Guidelines (GMSG) Group
2 | DETERMINING THE BOND EFFICIENCY OF INDUSTRIAL GRINDING CIRCUITS
Calculations:1. Calculate the Actual Operating Bond Work Index of the
grinding circuit.• Estimate the F80 and P80. • Calculate the work or specific energy input from the
size reduction equipment power and circuit tonnage(equation 1). Auxiliary equipment power is excluded.
P W = ––– (1) T
Where, W is the specific work input (kWh/t), P is the equip-ment power (kW), and T is the circuit tonnage (metric t/h).• Calculate the Actual Operating Bond Work Index
(equation 2):
W WioACT = –––––––––––– (2) 10 10 (–––– - ––––) √P̄80 √F̄80
Where, WioACT is the Actual Operating Bond Work Index(kWh/t), W is the specific energy input (kWh/t), P80 isthe 80% passing size of product (µm), and F80 is the80% passing size of circuit feed (µm).
2. Calculate the Standard Circuit Bond Work Index (WiSTD)for the material being processed (equation 3).
Wtotal WiSTD = –––––––––––– (3) 10 10 (–––– - ––––) √P̄80 √F̄80
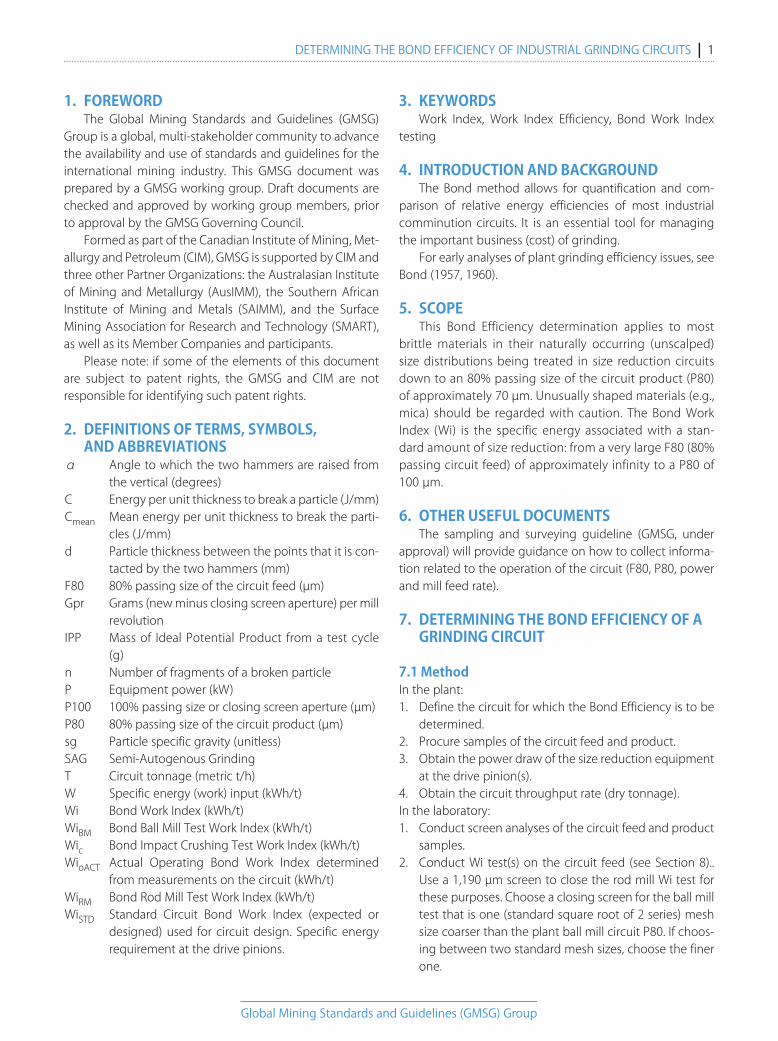
The Bond Standard Circuit is the “conventional” crush-ing-rod-ball milling circuit that was popular circa 1950 to1980, designed so that no correction factors apply to theWiSTD (Figure 1). It is also the "design" Wi for this circuitbased on the laboratory Wi test results. To avoid introduc-ing design inefficiency factors into the reference Bond Stan-dard Circuit, assume 2.44 m diameter overflow mills, anduse a rod mill F80 of 16,000 µm and a rod mill P80 of 1,000µm. Note that—in order for no correction factor for ball millproduct fineness to apply—the ball mill circuit P80 shouldbe no less than approximately 70 µm (Bond, 1962). ThisBond Efficiency determination should not be applied to cir-cuits with a P80 finer than approximately 70 µm withoutmaking qualifications. 3. Calculate the circuit Wi Efficiency Ratio (equation 4):
WiSTD Wi Efficiency Ratio = ––––––– (4) WioACT
Where, WiSTD is the Standard Circuit Bond Work Index(kWh/t) and WioACT is the Actual Operating Bond WorkIndex (kWh/t).
• If the Wi Efficiency Ratio is 1.0 or 100%, the circuit is per-forming with the same efficiency as the Bond StandardCircuit (and the ore Wi = circuit operating Wi), in accor-dance with the correlation that Bond (1962) establishedbetween plant operating data and test data from hislaboratory test equipment. That is, the circuit is usingthe same energy per tonne as the design energy pre-dicted by the Bond design/scale-up method for thestandard circuit, with no correction factors.
• If the Wi Efficiency Ratio is greater than 1.0 or 100%, thecircuit is performing at an energy efficiency thatexceeds the Bond Standard Circuit.
• If the Wi Efficiency Ratio is less than 1.0 or 100%, the cir-cuit is performing at an energy efficiency that is lowerthan the Bond Standard Circuit.Note that a similar circuit efficiency parameter was pub-
lished by C. A. Rowland, Jr. (Please see references by Rowland,1976 and 1998). This "Bond Standard Circuit Energy Factor"
Figure 1. The Bond Standard Circuit
Global Mining Standards and Guidelines (GMSG) Group
DETERMINING THE BOND EFFICIENCY OF INDUSTRIAL GRINDING CIRCUITS | 3
(equation 5) is equal to the inverse of the Wi Efficiency Ratio;it can be used by multiplying against the laboratory-derivedWiSTD to give the actual operating work index of a circuit,WioACT.
WioACT Bond Standard Circuit Energy Factor = –––––––– (5) WiSTD
7.2 Demonstration/Example Calculations
7.2.1 Generic Circuit Calculation
3,150 W = –––––– = 7.0 kWh/t 450
7 WioACT = ––––––––––––––– = 14.4 kWh/t 10 10 (––––– - –––––––) √ ̄̄212 √̄  ̄ ̄2,500
16.1 Wi Efficiency Ratio = ––––– = 1.12 or 112% 14.4
14.4Bond Standard Circuit Energy Factor = ––––– = 0.89 or 89% 16.1
This circuit is performing approximately 12% betterthan predicted by Bond, based on the average performanceof the plant circuits that Bond correlated with his laboratorytesting. This circuit is consuming 89% of the Bond specified(design) circuit energy.
7.2.2 Common Plant Grinding Circuit Calculations
1. Rod-Ball Mill Circuit (Single-Stage Ball Mill, Multi-StageBall Mill, or High Pressure Grinding Roll-Ball Mill)
8.56 WioACT = –––––––––––––––––––– = 11.8 kWh/t 10 10 (––––––-–––––––––) √ ̄̄̄̄̄̄155 √ ̄̄  ̄16,000
• Bond Standard Circuit:Assume the test Wi of the rod mill (9.5) applies from theactual rod mill feed size of 19,300 µm (although some ofthis work might ideally be done by crushers to achieve arod mill F80 of 16,000 µm) to a rod mill (circuit) productsize of 1,000 µm.
10 10 W1 = 9.8 × ( ––––––– - –––––––––) = 0.07 kWh/t √ ̄̄  ̄16,000 √ ̄ ̄̄19,300
10 10 W2 = 9.5 × ( ––––––– - –––––––) = 2.25 kWh/t √ ̄ ̄1,000 √ ̄ ̄ ̄16,000
10 10 W3 = 9.8 × ( ––––––– - –––––––––) = 4.77 kWh/t √ ̄̄155 √ ̄ ̄̄1,000
Wtotal = 0.07 + 2.25 + 4.77 = 7.09 kWh/t
9.70 Wi Efficiency Ratio = –––––– = 0.83 or 83% 11.7
11.7Bond Standard Circuit Energy Factor = –––– = 1.21 or 121% 9.70
2. Semi-Autogenous Grinding (SAG)-Ball Mill Circuit
14.6 WioACT = –––––––––––––––––––––– = 16.8 kWh/t 10 10 (–––––––-––––––––––) √ ̄ ̄125 √ ̄ ̄ ̄165,000
• Bond Standard Circuit:
10 10 W1 = 16.0 × ( –––––––––– - –––––––––) = 0.9 kWh/t √ ̄ ̄ ̄16,000 √ ̄ ̄ ̄165,000
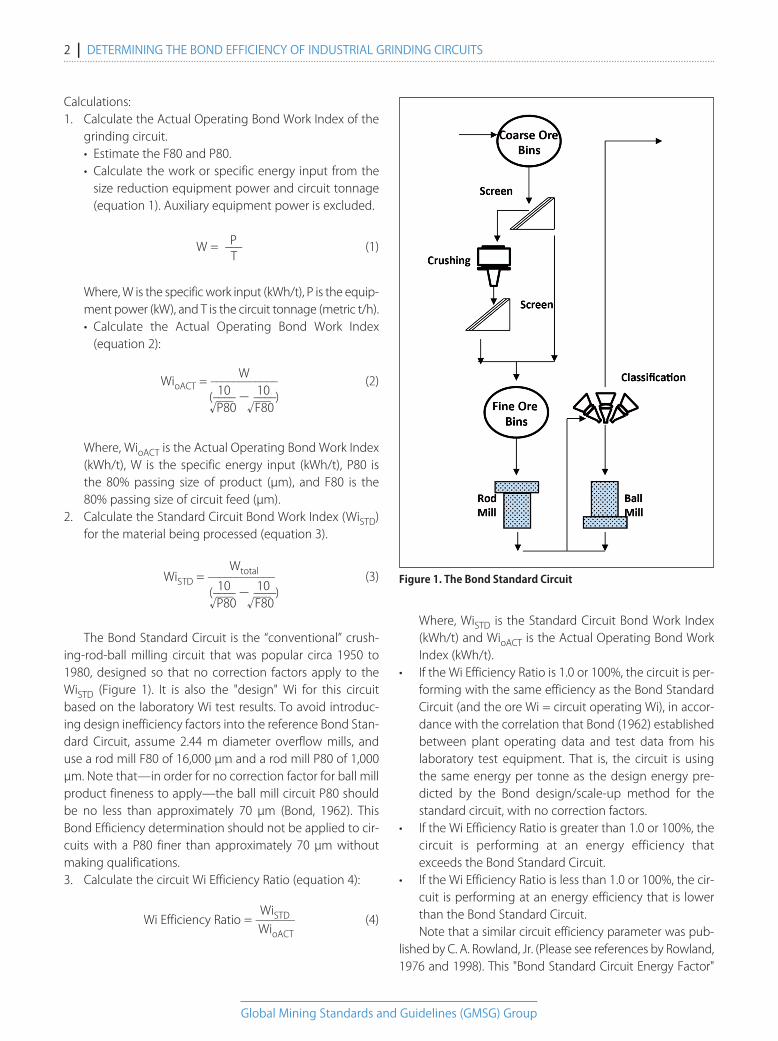
Table 1. Values used for generic circuit calculations
Parameter ValuePower draw of mill(s) at pinion(s) (kW) 3,150Circuit dry tonnage (metric t/h) 450Circuit P80 (µm) 212Circuit F80 (µm) 2,500Test ball mill Wi of circuit feed ore (kWh/t) 16.1Test rod mill Wi of circuit feed ore (kWh/t) 16.1
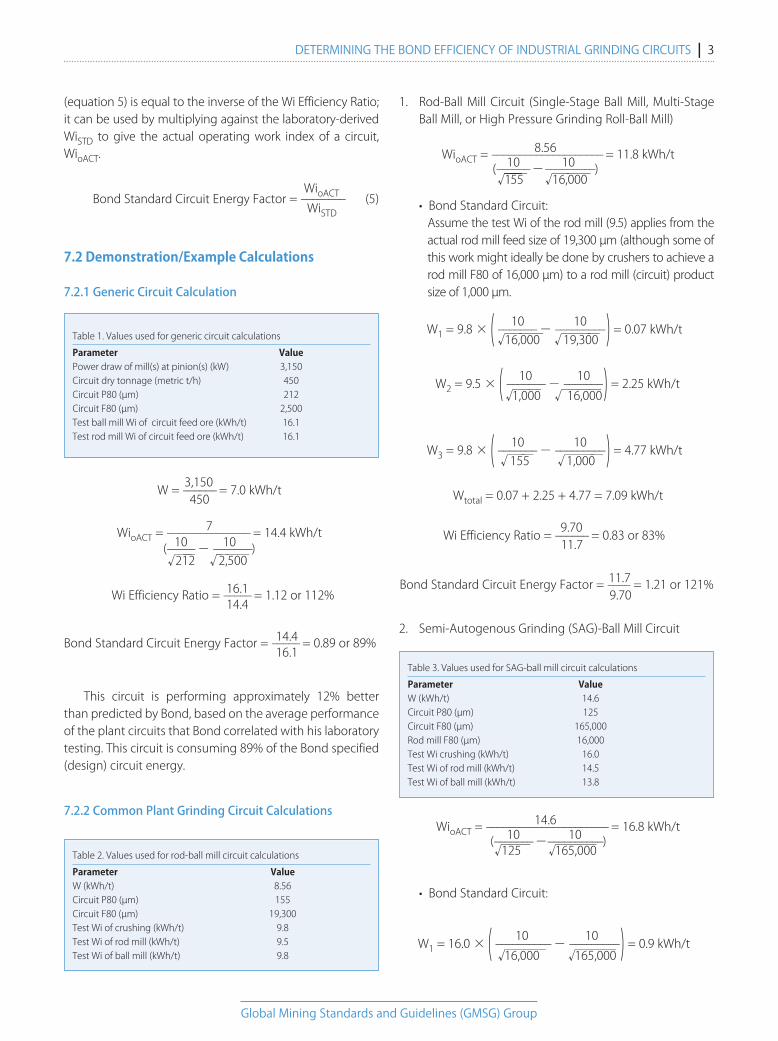
Table 2. Values used for rod-ball mill circuit calculations
Parameter ValueW (kWh/t) 8.56Circuit P80 (µm) 155Circuit F80 (µm) 19,300Test Wi of crushing (kWh/t) 9.8Test Wi of rod mill (kWh/t) 9.5Test Wi of ball mill (kWh/t) 9.8
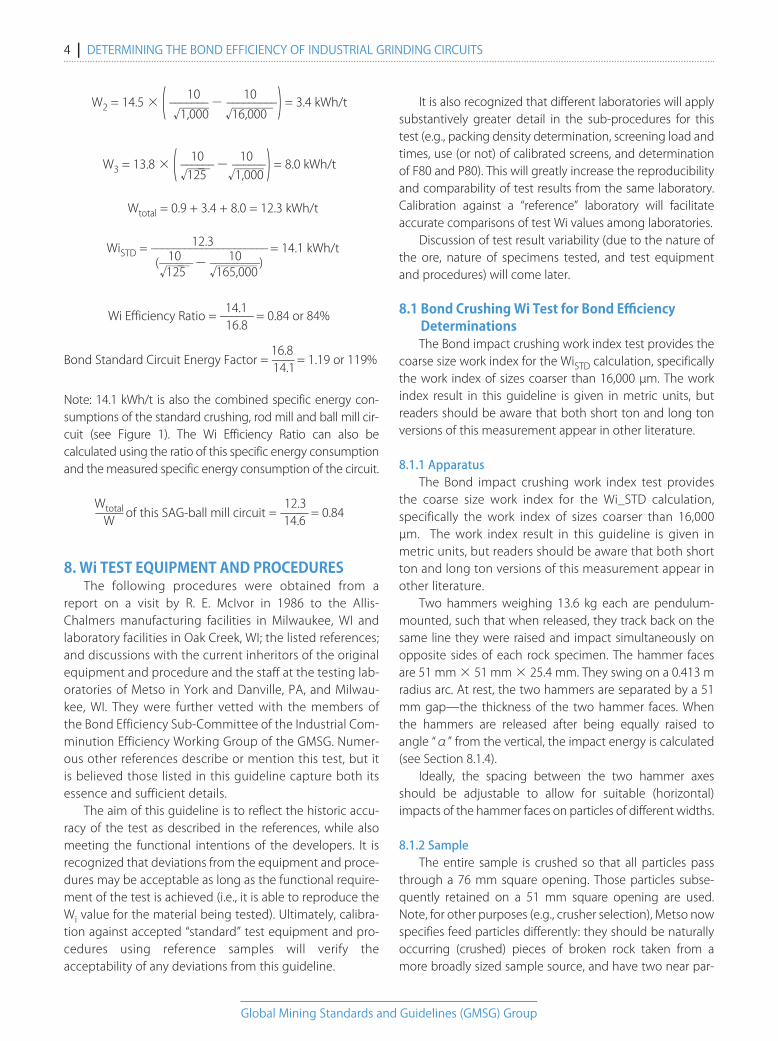
Table 3. Values used for SAG-ball mill circuit calculations
Parameter ValueW (kWh/t) 14.6Circuit P80 (µm) 125Circuit F80 (µm) 165,000Rod mill F80 (µm) 16,000Test Wi crushing (kWh/t) 16.0Test Wi of rod mill (kWh/t) 14.5Test Wi of ball mill (kWh/t) 13.8
Global Mining Standards and Guidelines (GMSG) Group
4 | DETERMINING THE BOND EFFICIENCY OF INDUSTRIAL GRINDING CIRCUITS
10 10 W2 = 14.5 × ( ––––––– - –––––––––) = 3.4 kWh/t √ ̄ ̄1,000 √ ̄ ̄ ̄16,000
10 10 W3 = 13.8 × ( –––––– - ––––––) = 8.0 kWh/t √1̄25̄ √ ̄ ̄1,000
Wtotal = 0.9 + 3.4 + 8.0 = 12.3 kWh/t
12.3 WiSTD = ––––––––––––––––––––– = 14.1 kWh/t 10 10 (––––––- –––––––––) √ ̄̄125 √ ̄ ̄ ̄165,000
14.1 Wi Efficiency Ratio = –––––– = 0.84 or 84% 16.8
16.8Bond Standard Circuit Energy Factor = –––– = 1.19 or 119% 14.1
Note: 14.1 kWh/t is also the combined specific energy con-sumptions of the standard crushing, rod mill and ball mill cir-cuit (see Figure 1). The Wi Efficiency Ratio can also becalculated using the ratio of this specific energy consumptionand the measured specific energy consumption of the circuit.
Wtotal 12.3 ––––– of this SAG-ball mill circuit = ––––– = 0.84 W 14.6
8. Wi TEST EQUIPMENT AND PROCEDURES The following procedures were obtained from a
report on a visit by R. E. McIvor in 1986 to the Allis-Chalmers manufacturing facilities in Milwaukee, WI andlaboratory facilities in Oak Creek, WI; the listed references;and discussions with the current inheritors of the originalequipment and procedure and the staff at the testing lab-oratories of Metso in York and Danville, PA, and Milwau-kee, WI. They were further vetted with the members ofthe Bond Efficiency Sub-Committee of the Industrial Com-minution Efficiency Working Group of the GMSG. Numer-ous other references describe or mention this test, but itis believed those listed in this guideline capture both itsessence and sufficient details.
The aim of this guideline is to reflect the historic accu-racy of the test as described in the references, while alsomeeting the functional intentions of the developers. It isrecognized that deviations from the equipment and proce-dures may be acceptable as long as the functional require-ment of the test is achieved (i.e., it is able to reproduce theWi value for the material being tested). Ultimately, calibra-tion against accepted “standard” test equipment and pro-cedures using reference samples will verify theacceptability of any deviations from this guideline.
It is also recognized that different laboratories will applysubstantively greater detail in the sub-procedures for thistest (e.g., packing density determination, screening load andtimes, use (or not) of calibrated screens, and determinationof F80 and P80). This will greatly increase the reproducibilityand comparability of test results from the same laboratory.Calibration against a “reference” laboratory will facilitateaccurate comparisons of test Wi values among laboratories.
Discussion of test result variability (due to the nature ofthe ore, nature of specimens tested, and test equipmentand procedures) will come later.
8.1 Bond Crushing Wi Test for Bond EfficiencyDeterminationsThe Bond impact crushing work index test provides the
coarse size work index for the WiSTD calculation, specificallythe work index of sizes coarser than 16,000 µm. The workindex result in this guideline is given in metric units, butreaders should be aware that both short ton and long tonversions of this measurement appear in other literature.
8.1.1 ApparatusThe Bond impact crushing work index test provides
the coarse size work index for the Wi_STD calculation,specifically the work index of sizes coarser than 16,000µm. The work index result in this guideline is given inmetric units, but readers should be aware that both shortton and long ton versions of this measurement appear inother literature.
Two hammers weighing 13.6 kg each are pendulum-mounted, such that when released, they track back on thesame line they were raised and impact simultaneously onopposite sides of each rock specimen. The hammer facesare 51 mm × 51 mm × 25.4 mm. They swing on a 0.413 mradius arc. At rest, the two hammers are separated by a 51mm gap—the thickness of the two hammer faces. Whenthe hammers are released after being equally raised toangle “α” from the vertical, the impact energy is calculated(see Section 8.1.4).
Ideally, the spacing between the two hammer axesshould be adjustable to allow for suitable (horizontal)impacts of the hammer faces on particles of different widths.
8.1.2 SampleThe entire sample is crushed so that all particles pass
through a 76 mm square opening. Those particles subse-quently retained on a 51 mm square opening are used.Note, for other purposes (e.g., crusher selection), Metso nowspecifies feed particles differently: they should be naturallyoccurring (crushed) pieces of broken rock taken from amore broadly sized sample source, and have two near par-
Global Mining Standards and Guidelines (GMSG) Group
DETERMINING THE BOND EFFICIENCY OF INDUSTRIAL GRINDING CIRCUITS | 5
allel faces that are between 51 and 76 mm in thickness. Ifthis is the case, the Impact Crushing Wi nevertheless can beused in Bond Efficiency calculations. A minimum of ten(preferably twenty) pieces are tested.
8.1.3 Procedure1. Weigh the specimen (piece) to the nearest gram.2. Mount the specimen between the hammers (e.g., use
modelling clay on the pedestal below) such that itssmallest dimension is between the hammer faces.
3. Measure the specimen thickness at the point betweenthe hammer faces if they are touching the specimen tothe nearest 2.5–3 mm.
4. Implement suitable safety measures.5. Initially raise the hammers as deemed suitable (e.g., 10
degrees from the vertical or more if the known materialcharacteristics warrant).
6. Release the hammers to impact simultaneously oneither side of the specimen.
7. Check the specimen for cracking or breaking. It is con-sidered fractured if 33% or more of the original weightis broken off.
8. If the specimen is still whole, remeasure the thicknessand increase the hammer angle by a suitable increment(e.g., 5 degrees from the vertical or more if the knownmaterial characteristics warrant) and return to the sameorientation. Machines may also be marked off in impactenergy units.
9. Repeat steps 4–8 until the specimen is broken. Recordthe last release angle used. If the particle continuallychips away but does not break cleanly, note same anddisregard in calculations.
10. Note the number of major fragments from the brokenspecimen. This number and the particle weight do notenter the Wi calculations.
11. Repeat the above steps for all specimens.12. Determine the specific gravity of the specimens.13. For each specimen, tabulate the weight (in g), thickness
(in mm), hammer release angle (in degrees), and num-ber of major fragments.
8.1.4 Calculations1. Calculate the impact energy used to break each speci-
men (equation 6):
110.2 × (1‑ cos α) C = ––––––––––––––––– (6) d
Where, C is the impact energy (J/mm thickness), α isthe impact angle (degrees from the vertical), and d isthe specimen thickness (mm).
2. Calculate the mean impact energy for all specimens(Cmean).
3. Calculate the Crushing Work Index (equation 7):
Cmean Wic = 48.5 × 1.1023 × –––––– (7) sg
Where, Wic is the Crushing Work Index (kWh/t), Cmean isthe mean impact energy for all specimens (J/mm thick-ness), and sg is the specific gravity of the specimens(unitless). See Annex A for example test report and calculations.
Other test statistics may be calculated and reported.
8.2 Bond Rod Mill Wi Test
8.2.1 ApparatusThe Bond rod mill is made of metal, 305 mm maximum
inside diameter, with a wave-type lining. The internal milllength is 610 mm. The grinding charge consists of six 31.8mm and two 44.5 mm diameter steel rods, all 533.4 mm inlength, and weighing a total of 33,380 g.
The Bond rod mill runs at 46 rpm, and has a revolutioncounter. In order to deal with material segregation at theends, it is run in a level position for eight revolutions, tilted5 degrees up for one revolution, and then tilted 5 degreesdown for one revolution repeatedly during each grindingperiod.
Below the test feed control size of 12.7 mm, the normalroot of 2 series sieve analysis equipment is used for testfeed, test product, and circulating load (screen oversize)material dry size analyses. Dry screening on one or moresieves is done between grinding cycles, with the size ofaperture (“closing screen aperture”) chosen to close-circuitthe test. Dry screening is suitable for rod mill test require-ments, except final product size analysis, which may requirewet and dry sieving.
8.2.2 SampleEnsure the material is dry. It is best to start with
approximately 14 kg of material with a specific gravity of2.7, and proportionally more for material with higher spe-cific gravity. This will allow for up to 10 grinding cycles. Thematerial used for the feed size analysis can be re-used forthe grind test.
8.2.3 ProcedureTests can be made at closing screen apertures from 4
mesh (4.76 mm) to 65 mesh (212 µm), but normally 8 mesh
Global Mining Standards and Guidelines (GMSG) Group
6 | DETERMINING THE BOND EFFICIENCY OF INDUSTRIAL GRINDING CIRCUITS
(2.38 mm) to 28 mesh (300 µm). The test control size chosenfor these efficiency calculations is generally 1,190 µm.
At the end of each grinding period, the mill is dis-charged, and the ground material is screened at the desig-nated closing screen aperture. The undersize is weighed,and an equal amount of fresh feed is added to the oversizeto make up the total weight of the 1,250 cm3 originallycharged to the mill. This is returned to the mill and groundfor the number of revolutions calculated to give a circulat-ing load of 100%. The grinding cycles are continued untilthe grams of undersize produced per revolution reach equi-librium, and/or reverse direction (change from increase todecrease or vice versa). Then the final circulating load andthe undersize from the last three cycles are screen analyzed.
Steps:1. Stage crush the rod mill test feed and screen through a
12.7 mm screen. Avoid overcrushing by screening, thencrushing the oversize successively, until it all passes the12.7 mm screen.
2. Conduct a screen analysis of the crushed test feedthrough the test closing screen aperture.
3. Determine the packed bulk density of the test materialusing a suitably sized container.
4. Determine the weight of 1,250 cm3 of the materialwhen packed. This is the material charge weight to bepresent in the rod mill.
5. Calculate the Ideal Potential Product (IPP) for 100% cir-culating load, which is the material charge weight (in g)divided by two.
6. Rotary split the sample into suitably small batches,slightly smaller than the IPP. Further rotary split one ortwo of these batches into smaller sub-batches.
7. Make up the initial 1,250 cm3 mill material charge fromits calculated weight using the batches and sub-batches.
8. Place the material and ball charge in the mill and run for50 revolutions, for example. This number can varyaccording to the closing screen aperture and experi-ence of the laboratory. If the test feed contains 50% ormore minus the closing screen aperture, assign zero asthe first number of revolutions, screen the material atthe closing screen, and make up the material to beground to the desired weight with fresh feed.
9. Dump the material charge, screen it with the closingscreen(s), and weigh screen oversize and undersize product.
10. Determine the weight of net product in grams (equa-tion 8):
Net product = (8) Undersize product ‑ Undersize in mill feed
11. Determine the net product per revolution (net Gpr) ingrams (equation 9):
Net product Net Gpr = ––––––––––––––– (9) No. revolutions
12. Add new feed to oversize (circulating load) to bring it upto the desired material load in the mill.
13. Calculate the number of mill revolutions to use for thenext cycle (equation 10):
(IPP ‑ Weight of undersize in newly added fresh feed) No. revolutions = –––––––––––––––––––––––––––– (10) Previous net Gpr
Where IPP is the Ideal Potential Product for 100% circulatingload (g), and net Gpr is net product per revolution (g).14. Repeat steps 9–13 for at least five grind cycles, or until
the net Gpr reaches equilibrium, and/or reverses itsdirection of increase or decrease.
15. Determine the circulating load ratio for the last threecycles (equation 11):
(Material charge ‑ Mean product weight)Circulating = ––––––––––––––––––––––––––––––––––––––– (11)load ratio Mean product weight
16. Conduct screen analyses of the combined undersize(product) of the last three cycles and the oversize (circu-lating load) from the last cycle.
17. The mean grams per revolution of the last three grindcycles is the rod mill Gpr.
8.2.4 CalculationsBond Rod Mill Wi (equation 12):
1.1023 × 62 WiRM = –––––––––––––––––––––––––––––––––– (12) 10 10 P1000.23 × Gpr0.625 × (––––––‑ ––––––) √ ̄̄P80 √ ̄̄F80
Where, WiRM is the Bond Rod Mill Wi (kWh/t), P100 is theclosing screen aperture (µm), Gpr is the net product per rev-olution (g), P80 is the 80% passing size of circuit product(µm), and F80 is the 80% passing size of circuit feed (µm).
See Annex B for an example test report and calculations.Other test statistics may be calculated and reported.
Global Mining Standards and Guidelines (GMSG) Group
DETERMINING THE BOND EFFICIENCY OF INDUSTRIAL GRINDING CIRCUITS | 7
8.3 Bond Ball Mill Wi Test
8.3.1 ApparatusThe metal Bond ball mill is 30.5 cm inside diameter and
30.5 cm inside length, with rounded corners. It is smoothexcept for the door hole used for charging.
The grinding charge consists of 285 iron or steel balls (43 @ 36.8 mm diameter, 67 @ 29.7 mm diameter, 10 @ 25.4 mm diameter, 71 @ 19.1 mm diameter, and 94 @ 15.5 mm diameter) weighing a total of 20,125 g. The ballcharge surface area is 5,432 cm2. The mill runs at 70 rpm andhas a revolution counter.
The normal root of 2 series sieve analysis equipment isused for test feed, test product, and circulating load (screenoversize) material size analyses. Dry screening on one ormore sieves is done between grinding cycles when the clos-ing screen aperture chosen to close-circuit the test is 75 µm(200 mesh) or coarser. Wet screening between grind cyclesis used when the closing screen is 53 µm (270 mesh) or finer.
8.3.2 SampleEnsure the material is dry. It is best to start with approxi-
mately 8 kg of material with a specific gravity of 2.7, and pro-portionally more with higher material specific gravity. Thiswill allow for up to 10 grinding cycles. The material used forthe feed size analysis can be re-used for the grind test.
8.3.3 ProcedureTests can be made at a closing screen aperture of 28
mesh (600 µm) or finer. The test control size to be chosenfor the test is described in Section 7.1.
At the end of each grinding period, the mill is discharged,and the discharge is screened at the designated closing screenaperture. The undersize is weighed, and an equal amount offresh feed is added to the oversize to make up the total weightof the 700 cm3 originally charged to the mill. This is returned tothe mill and ground for the number of revolutions calculatedto give a circulating load of 250%. The grinding cycles are con-tinued until the grams of undersize produced per revolutionreach equilibrium, and/or reverse direction of increase ordecrease. Then the final circulating load and the undersizefrom the last three cycles are screen analyzed.
Steps:1. Stage crush the ball mill test feed sample and screen
through a 3.36 mm (6 Tyler mesh) screen. Avoid over-crushing by screening, then crushing the oversize suc-cessively, until it all passes the 3.36 mm screen.
2. Conduct a screen analysis of the crushed test feed, atleast through the test closing screen aperture.
3. Determine the packed bulk density of the test materialusing a suitably sized container.
4. Determine the weight of 700 cm3 of the material whenpacked. This is the material charge weight to be presentin the ball mill.
5. Calculate the IPP for 250% circulating load, which is thematerial charge weight divided by 3.5.
6. Rotary split the sample into suitably small batches,slightly smaller than the IPP. Further rotary split one ortwo of these batches into smaller sub-batches.
7. Make up the initial 700 cm3 mill material charge from itscalculated weight using the batches and sub-batches.
8. Place the material and ball charge in the mill and run for150 revolutions, for example. This number can varyaccording to the closing screen aperture and experi-ence of the laboratory. If the fresh feed contains 30% ormore minus the closing screen aperture, assign zero asthe first number of revolutions, screen out the under-size, and add fresh feed to make up the charge to thedesired weight to be ground first.
9. Dump the material charge, screen it with the closingscreen(s), and weigh screen oversize and undersizeproduct.
10. Determine the weight of net product in grams (equa-tion 8):
11. Determine the net Gpr (equation 9):12. Add new feed to oversize (circulating load) to bring it up
to the desired material load in the mill.13. Calculate the number of mill revolutions to use for the
next cycle (equation 10):14. Repeat steps 9–13 for at least five grind cycles, or until
the net Gpr reaches equilibrium, and/or reverses itsdirection of increase or decrease.
15. Determine the circulating load ratio for the last threecycles (equation 11):
16. Conduct screen analyses of the combined undersize(product) of the last three cycles and the oversize (circu-lating load) from the last cycle.
17. The mean grams per revolution of the last three grindcycles is the ball mill Gpr.
8.3.4 CalculationsBond Ball Mill Wi (equation 13):
1.1023 × 44.5 WiBM = –––––––––––––––––––––––––––––––––– (13) 10 10 P1000.23 × GpR0.82 × (––––––‑ ––––––) √ ̄̄P80 √ ̄̄F80
Where, WiBM is the Bond Ball Mill Wi (kWh/t), P100 is closingscreen aperture (µm), Gpr is the net grams per revolution ofproduct, P80 is the 80% passing size of product (µm), andF80 is the 80% passing size of circuit feed.
Global Mining Standards and Guidelines (GMSG) Group
8 | DETERMINING THE BOND EFFICIENCY OF INDUSTRIAL GRINDING CIRCUITS
See Annex C for an example test report and calculations.Other test statistics may be calculated and reported.
8.4 Accuracy of Comparative Circuit Work IndexEfficiency DeterminationsThis will follow in an addendum to this guideline.
Subtopics will include the following:• accuracy/sources of error in determining plant circuit
WioACT;• reproducibility of laboratory tests (in the same laboratory);• comparing efficiencies measured on the same circuit
and parallel circuits;
10. RESOURCES, REFERENCES, AND RECOMMENDED READINGBergstrom, B. H. (1985a). Bond closed circuit grindability tests. InN. L. Weiss (Ed.), Mineral processing handbook (pp. 30-65 to 30-68). Littleton, CO: Society for Mining, Metallurgy & Exploration Inc.
Bergstrom, B. H. (1985b). Crushability test. In N. L. Weiss (Ed.), Min-eral processing handbook (pp. 30-65 to 30-67). Littleton, CO:Society for Mining, Metallurgy & Exploration Inc.
Bond, F. C. (1946, January). Crushing tests by pressure and impact.Mining Technology, T.P. No. 1895.
Bond, F. C. (1947). Crushing tests by pressure and impact. AIMETransactions, 169, 58–66.
Bond, F. C. (1957). Non-cataracting ball mill study. Engineeringand Mining Journal, 158(3), 98–105.
Bond, F. C. (1960). Action in a rod mill. Engineering and MiningJournal, 161(3), 82–85.
Bond, F. C. (1961, August). Crushing and grinding calculations.Reprinted from British Chemical Engineering, Parts I and II, withadditions and revisions, April, 1962. Allis-Chalmers PublicationNo. 07R9235D.
Global Mining Standards and Guidelines (GMSG) (under approval).Methods to survey and sample grinding circuits. Montreal, QC:Global Mining Standards and Guidelines Group.
McIvor, R. E. (1986, January 13). Bond Rod Mill Work Index test lab-oratory procedure. Allis-Chalmers Form 7669-M-4, provided toMcGill University.
McIvor, R. E. (1986, January 13). Bond Ball Mill Work Index test lab-oratory procedure. Allis-Chalmers Form 7669-3, revised May 17,1983, provided to McGill University.
McIvor, R. E. (1986, January 17). Grinding circuit study at Les MinesSelbaie: Report on Field trip to Allis-Chalmers, Milwaukee, Wis-consin. McGill University, Montreal, QC.
Rowland, C. A., Jr. (1976). The tools of power power: The Bondwork index, a tool to measure grinding efficiency. AIME Fall Meet-ing, Denver, CO.
Rowland, C. A., Jr. (1998). Using the Bond Work Index to measureoperating comminution efficiency. Minerals and MetallurgicalProcessing, 15(4), 32–36.
Rowland, C. A., Jr., & McIvor, R. E. (2009). The Bond standard forcomminution efficiency. In D. Malhotra, P. Taylor, E. Spiller, & M.LeVier (Eds.), Recent advances in mineral processing plant design(pp. 328–331). Littleton, CO: Society for Mining, Metallurgy &Exploration Inc.
• comparing efficiencies of different circuits; and• development and use of reference/calibration sample(s)
and laboratories.
9. DATABASE OF BOND GRINDING CIRCUITEFFICIENCIESThis database is being developed and will follow in an
addendum to this guideline. See slide no. 13 in the presen-tation “Bond Efficiency SLC (rev3)-print.pdf” available fordownload at the GMSG website for preliminary “Examplesfrom DataBase”.
Global Mining Standards and Guidelines (GMSG) Group
DETERMINING THE BOND EFFICIENCY OF INDUSTRIAL GRINDING CIRCUITS | 9
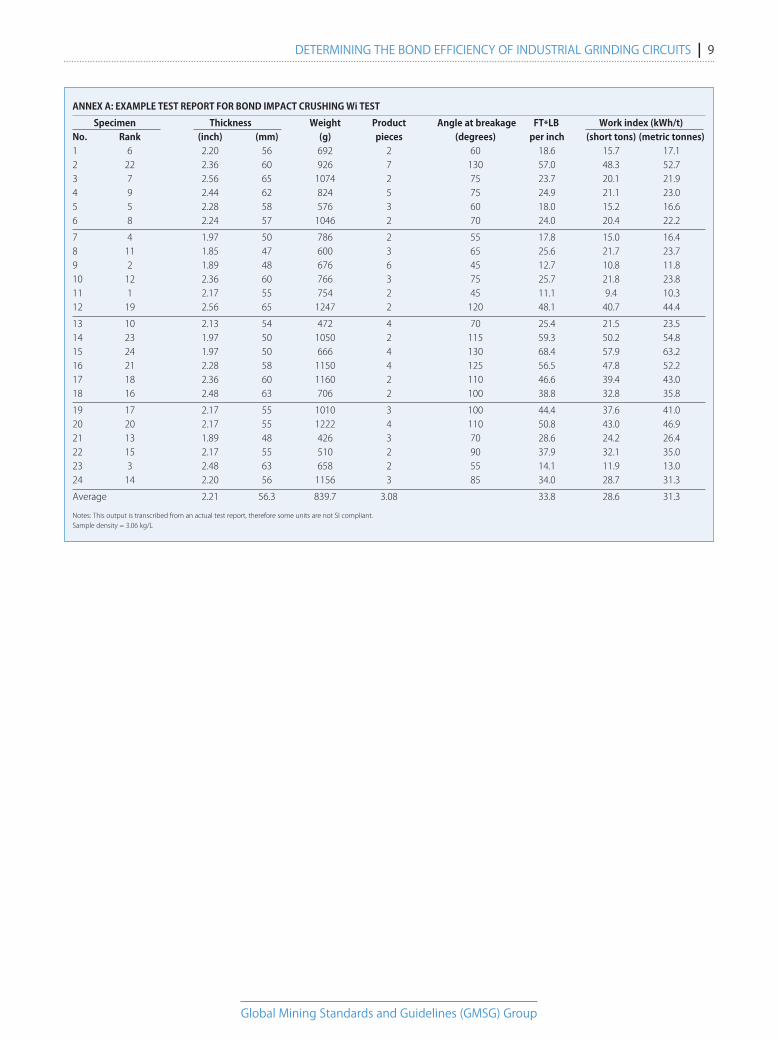
ANNEX A: EXAMPLE TEST REPORT FOR BOND IMPACT CRUSHING Wi TEST
Specimen Thickness Weight Product Angle at breakage FT*LB Work index (kWh/t)No. Rank (inch) (mm) (g) pieces (degrees) per inch (short tons) (metric tonnes)1 6 2.20 56 692 2 60 18.6 15.7 17.12 22 2.36 60 926 7 130 57.0 48.3 52.73 7 2.56 65 1074 2 75 23.7 20.1 21.94 9 2.44 62 824 5 75 24.9 21.1 23.05 5 2.28 58 576 3 60 18.0 15.2 16.66 8 2.24 57 1046 2 70 24.0 20.4 22.2
7 4 1.97 50 786 2 55 17.8 15.0 16.48 11 1.85 47 600 3 65 25.6 21.7 23.79 2 1.89 48 676 6 45 12.7 10.8 11.810 12 2.36 60 766 3 75 25.7 21.8 23.811 1 2.17 55 754 2 45 11.1 9.4 10.312 19 2.56 65 1247 2 120 48.1 40.7 44.4
13 10 2.13 54 472 4 70 25.4 21.5 23.514 23 1.97 50 1050 2 115 59.3 50.2 54.815 24 1.97 50 666 4 130 68.4 57.9 63.216 21 2.28 58 1150 4 125 56.5 47.8 52.217 18 2.36 60 1160 2 110 46.6 39.4 43.018 16 2.48 63 706 2 100 38.8 32.8 35.8
19 17 2.17 55 1010 3 100 44.4 37.6 41.020 20 2.17 55 1222 4 110 50.8 43.0 46.921 13 1.89 48 426 3 70 28.6 24.2 26.422 15 2.17 55 510 2 90 37.9 32.1 35.023 3 2.48 63 658 2 55 14.1 11.9 13.024 14 2.20 56 1156 3 85 34.0 28.7 31.3
Average 2.21 56.3 839.7 3.08 33.8 28.6 31.3
Notes: This output is transcribed from an actual test report, therefore some units are not SI compliant.Sample density = 3.06 kg/L
Global Mining Standards and Guidelines (GMSG) Group
10 | DETERMINING THE BOND EFFICIENCY OF INDUSTRIAL GRINDING CIRCUITS
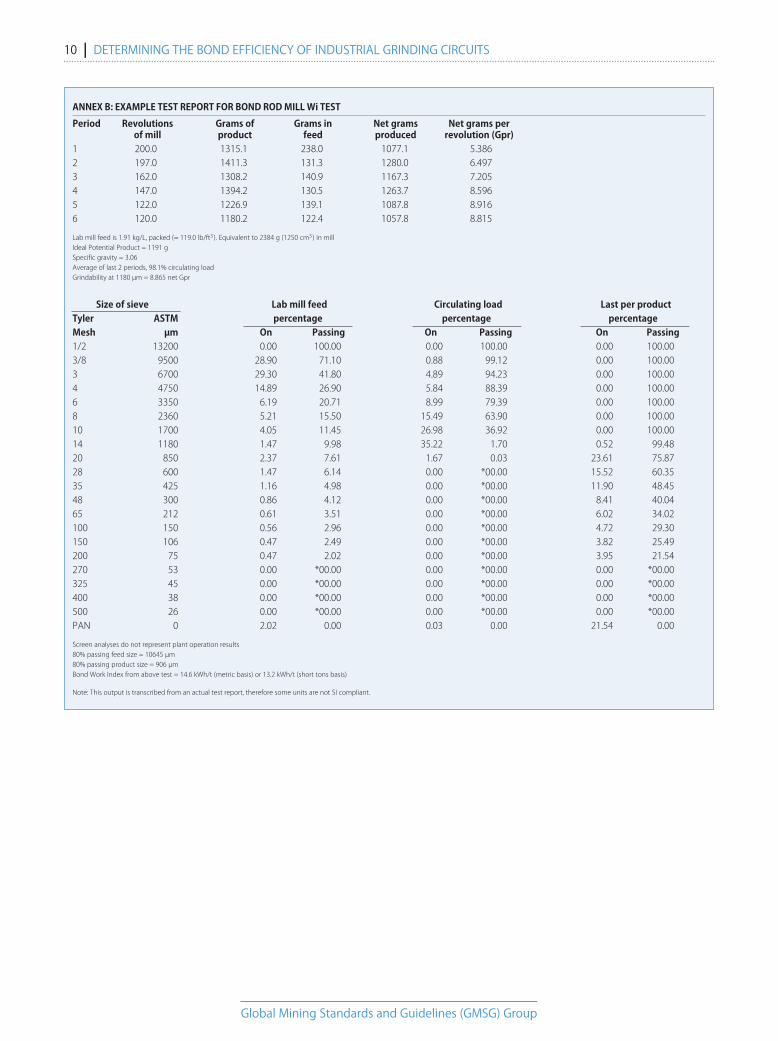
ANNEX B: EXAMPLE TEST REPORT FOR BOND ROD MILL Wi TEST
Period Revolutions Grams of Grams in Net grams Net grams per of mill product feed produced revolution (Gpr)1 200.0 1315.1 238.0 1077.1 5.3862 197.0 1411.3 131.3 1280.0 6.4973 162.0 1308.2 140.9 1167.3 7.2054 147.0 1394.2 130.5 1263.7 8.5965 122.0 1226.9 139.1 1087.8 8.9166 120.0 1180.2 122.4 1057.8 8.815
Lab mill feed is 1.91 kg/L, packed (= 119.0 lb/ft3). Equivalent to 2384 g (1250 cm3) in mill Ideal Potential Product = 1191 g Specific gravity = 3.06 Average of last 2 periods, 98.1% circulating load Grindability at 1180 µm = 8.865 net Gpr
Size of sieve Lab mill feed Circulating load Last per productTyler ASTM percentage percentage percentageMesh µm On Passing On Passing On Passing1/2 13200 0.00 100.00 0.00 100.00 0.00 100.003/8 9500 28.90 71.10 0.88 99.12 0.00 100.003 6700 29.30 41.80 4.89 94.23 0.00 100.004 4750 14.89 26.90 5.84 88.39 0.00 100.006 3350 6.19 20.71 8.99 79.39 0.00 100.008 2360 5.21 15.50 15.49 63.90 0.00 100.0010 1700 4.05 11.45 26.98 36.92 0.00 100.0014 1180 1.47 9.98 35.22 1.70 0.52 99.4820 850 2.37 7.61 1.67 0.03 23.61 75.8728 600 1.47 6.14 0.00 *00.00 15.52 60.3535 425 1.16 4.98 0.00 *00.00 11.90 48.4548 300 0.86 4.12 0.00 *00.00 8.41 40.0465 212 0.61 3.51 0.00 *00.00 6.02 34.02100 150 0.56 2.96 0.00 *00.00 4.72 29.30150 106 0.47 2.49 0.00 *00.00 3.82 25.49200 75 0.47 2.02 0.00 *00.00 3.95 21.54270 53 0.00 *00.00 0.00 *00.00 0.00 *00.00325 45 0.00 *00.00 0.00 *00.00 0.00 *00.00400 38 0.00 *00.00 0.00 *00.00 0.00 *00.00500 26 0.00 *00.00 0.00 *00.00 0.00 *00.00PAN 0 2.02 0.00 0.03 0.00 21.54 0.00
Screen analyses do not represent plant operation results80% passing feed size = 10645 µm80% passing product size = 906 µmBond Work Index from above test = 14.6 kWh/t (metric basis) or 13.2 kWh/t (short tons basis)
Note: This output is transcribed from an actual test report, therefore some units are not SI compliant.
http://www.globalminingstandards.org
DETERMINING THE BOND EFFICIENCY OF INDUSTRIAL GRINDING CIRCUITS | 11
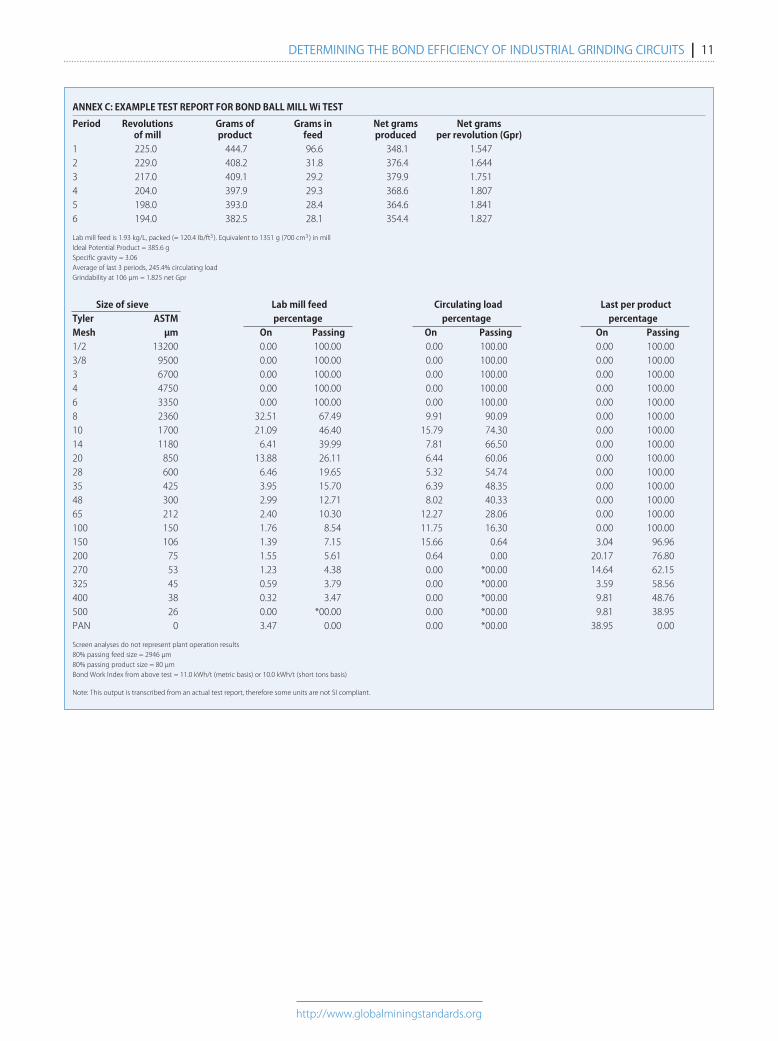
ANNEX C: EXAMPLE TEST REPORT FOR BOND BALL MILL Wi TEST
Period Revolutions Grams of Grams in Net grams Net grams of mill product feed produced per revolution (Gpr)1 225.0 444.7 96.6 348.1 1.5472 229.0 408.2 31.8 376.4 1.6443 217.0 409.1 29.2 379.9 1.7514 204.0 397.9 29.3 368.6 1.8075 198.0 393.0 28.4 364.6 1.8416 194.0 382.5 28.1 354.4 1.827
Lab mill feed is 1.93 kg/L, packed (= 120.4 lb/ft3). Equivalent to 1351 g (700 cm3) in millIdeal Potential Product = 385.6 g Specific gravity = 3.06 Average of last 3 periods, 245.4% circulating load Grindability at 106 µm = 1.825 net Gpr
Size of sieve Lab mill feed Circulating load Last per productTyler ASTM percentage percentage percentageMesh µm On Passing On Passing On Passing1/2 13200 0.00 100.00 0.00 100.00 0.00 100.003/8 9500 0.00 100.00 0.00 100.00 0.00 100.003 6700 0.00 100.00 0.00 100.00 0.00 100.004 4750 0.00 100.00 0.00 100.00 0.00 100.006 3350 0.00 100.00 0.00 100.00 0.00 100.008 2360 32.51 67.49 9.91 90.09 0.00 100.0010 1700 21.09 46.40 15.79 74.30 0.00 100.0014 1180 6.41 39.99 7.81 66.50 0.00 100.0020 850 13.88 26.11 6.44 60.06 0.00 100.0028 600 6.46 19.65 5.32 54.74 0.00 100.0035 425 3.95 15.70 6.39 48.35 0.00 100.0048 300 2.99 12.71 8.02 40.33 0.00 100.0065 212 2.40 10.30 12.27 28.06 0.00 100.00100 150 1.76 8.54 11.75 16.30 0.00 100.00150 106 1.39 7.15 15.66 0.64 3.04 96.96200 75 1.55 5.61 0.64 0.00 20.17 76.80270 53 1.23 4.38 0.00 *00.00 14.64 62.15325 45 0.59 3.79 0.00 *00.00 3.59 58.56400 38 0.32 3.47 0.00 *00.00 9.81 48.76500 26 0.00 *00.00 0.00 *00.00 9.81 38.95PAN 0 3.47 0.00 0.00 *00.00 38.95 0.00
Screen analyses do not represent plant operation results80% passing feed size = 2946 µm80% passing product size = 80 µmBond Work Index from above test = 11.0 kWh/t (metric basis) or 10.0 kWh/t (short tons basis)
Note: This output is transcribed from an actual test report, therefore some units are not SI compliant.