2015_delab_2
DESCRIPTION
;;TRANSCRIPT
1
Innovation and internationalization.
Evidence for Poland from a firm-level survey
Tomasz Brodzicki
Several important studies find that innovation and exporting are inextricably linked at firm-
level. Aw et al. (2011) find that the marginal benefit of simultaneous exporting and innovating
increases with productivity, with self-selection effect typical for heterogeneous firm literature
a la Melitz (2003) driving a large part of the observed complementarity. Altomonte et al.
(2013) show that there is a positive, broad, strong and robust correlation between the extent
of internationalization of firms and innovation activities in the panel of European
manufacturing firms (EFIGE dataset).
Apart form several recent studies the literature on the role of firm heterogeneity in Polish
trade and the nexus with innovation performance is in its infancy. The goal of this article is to
present some initial results of a large survey of Polish exporting and non-exporting firms
conducted by the team of the Institute for Development aimed at filling this important gap.
JEL classification: F12, F14, C83
Keywords: internationalization, innovation activity, firms survey
^The research was conducted and financed within the grant of National Science Centre Analysis
of international trade of Poland in the light of new trade theories. Implications for economic
policy at the crisis era (2012/05/B/HS4/04209) chaired by Professor Gawlikowska-Hueckel.
Tomasz Brodzicki, PhD
*University of Gdansk Faculty of Economics, Economics of European Integration Division
Ul. Armii Krajowej 119/121
81-824 Sopot, Poland
e-mail: [email protected]
**Institute for Development
ul. A. Mickiewicza 10, 81-832 Sopot, Poland
e-mail: [email protected]
2
1. Introduction
“Innovation distinguishes between a leader and a follower” is a famous quote from Steve
Jobs. It seems that at least to some extent it distinguishes between exporter and non-exporter
status as well. Several focal studies find that innovation and exporting are inextricably linked
at firm-level. Aw et al. (2011) find that the marginal benefit of simultaneous exporting and
innovating increases with productivity, with self-selection effect typical for heterogeneous
firm literature driving a large part of the observed complementarity. Altomonte et al. (2013)
show that there is a positive, broad, strong and robust correlation between the extent of
internationalization of firms and innovation activities in the panel of European manufacturing
firms (EFIGE dataset). We have to stress, however, that preceding the new new trade theory a
la Melitz (2003) quite a number of studies in the innovation literature found links between
innovation and export performance at firm level (please refer to a short literature review in
section 2 of the paper).
Apart form several recent studies the literature on the role of firm heterogeneity in Polish
trade and in particular on the nexus with innovation performance is in its infancy. The goal of
this article is to present some initial results of a large survey of Polish exporting and non-
exporting firms conducted by the Institute for Development within a research project
“Analysis of international trade of Poland in the light of new trade theories. Implications for
economic policy at the crisis era”1.
As the access to officially gathered firm-level or micro-level data for Polish enterprises is
restricted, the Institute conducted a large survey on a sample on exporting and non-exporting
enterprises merging it with financial data provided by InfoCredit (provider of data for the
well-known Amadeus database). The following selection criteria for the sample of enterprises
have been applied (this to some extent could bias our results): an enterprise had to have a
complete 5 year period of data availability in InfoCredit records, total sales per enterprises
should exceed 2 million PLN (roughly 500k EUR) each year, for exporters - exports shall
exceed 1 million PLN each year (or approx. 250k EUR). This constituted a database of about
7000 relatively large and matured enterprises across Poland, from which randomly selected
ones were surveyed (depicting spatial distribution at NUTS-2 level) with direct contact - a
pollster personally visited the enterprises and conducted in-depth interviews. Therefore, the
1Financed by National Science Centre (grant number: 2012/05/B/HS4/04209), carried out in the Institute for
Development and chaired by Professor Gawlikowska-Hueckel. The questionnaire was prepared by S. Uminski,
T. Jurkiewicz and T. Brodzicki.

3
sample in the present study consists of rather large enterprises (upper tail of distribution),
predominantly from manufacturing industry, that have at least 5 year continuity of financial
reports (and thus exist for at least 5 years). Out of 709 effectively questioned enterprises, 498
were exporters (X) and the remaining where non-exporters (NX).
The questionnaire (in Polish, available upon request) focused on several categories/groups of
questions: competitiveness, barriers and obstacles of doing business, consequences of
membership of Poland in the EU and of crisis 2008+, exports, imports, firms expectations and
perspectives for the future. In the present paper we focus only on issues related to innovation
performance and innovation behaviour at firm level. Other issues will be analysed in-depth in
the forthcoming papers.
The structure of the reminder of the paper is as follows. In section 2 we shortly review the
literature on the nexus between export performance of companies and their innovativeness. In
section 3 we present and discuss the results of the survey. Finally, section 4 concludes,
discusses the limitations of our research as well as gives guidelines for future empirical
studies.
2. Innovation and exports performance
As we have already stressed several important studies find that innovation and exporting and
other internationalization activities are inextricably linked at firm-level. For instance
Cassiman and Golovko (2011) show that product and to a lesser extent process innovation
drive firm exports. Altomonte et al. (2013) show that there is a positive, broad, strong and
robust correlation between the extent of internationalization of firms and innovation activities
in a large panel of European manufacturing firms. They stress at the same time that trade
promotion and innovation policies should be better and closely coordinated to reap the
benefits of the apparent synergies.
The results obtained by Cieślik et al. (2014) confirm the importance of firm characteristics for
export performance in the CEE countries, including Poland. According to Cieślik et al. (2014)
the financial support to R&D and innovation activities in transition economies should bring an
improvement the export performance of firms.
4
We have to stress however that most of studies in the heterogeneous firms literature treat the
notion of innovation in a very simplified manner. In most of the studies it has been proxied by
R&D spending or in-house R&D activity (e.g. Cieślik et al. 2014). Innovation itself is a much
broader term and innovation activities taken within and outside of an organisation are
numerous (Tidd & Bessant 2009, Keeley et al. 2013). Not only R&D matters in firms
internationalization. Sterlacchini (1999) in his study of small Italian firms in non-R&D-
intensive industries belonging mainly to supplier dominated industries found that the
probability of being an exporter was affected positively by the size of a firm and negatively
by its nature as a sub-contractor. At the same time innovative non-R&D activities, and in
particular the amount of expenditure on design, engineering and pre-production
developments, exerted a significant and positive impact on the share of exports in sales.
Wakelin (1998) conducted an interesting study for a sample of UK firms analysing export
behaviour of both innovating and non-innovating firms. Export behaviour was defined both as
the probability of a firm exporting and the propensity to export of the exporting firms. She
found the determinants to vary between innovators and non-innovators. Surprisingly, non-
innovative firms were found to be more likely to export than innovative firms controlling for
their size. At the same time larger innovators were found to be more likely to enter foreign
markets. Small innovators on the other hand with one or two innovations were less likely to
export, and more likely to service the domestic market alone than the equivalent non-
innovators. The fixed costs of entering foreign markets could be too large for smaller
innovative firms. Nevertheless, the number of past innovations had a positive impact on the
probability of an innovative firm exporting. At the same time improved quality of sectoral
innovation system was noticed to improve the probability of exporting of both innovative and
non-innovative firms. The study showed that innovators with higher unit labour costs were
more likely to export and had a higher propensity to export and had higher average wages
which could reflect to us either utilization of more skilful labour (human capital) or higher
overall productivity. Wakelin (1998) concluded that the capacity to innovate changed the
behaviour of the firm relative to non-innovators.
Roper and Love (2002) analysed determinants of export performance of UK and German
manufacturing plants finding significant differences. Non-innovators differed from innovators
in particular in absorption of spillover effects. Product innovation had a strong and positive
impact on the probability and propensity to export in both states. Innovation activity was
higher in Germany. However, scale of innovation activity had a positive impact on export
5
propensity in UK, while it was negative in Germany. Surprisingly, co-location of other
innovative firms was found to discourage exporting (argument contra industrial clustering).
Basile (2001) analysed export behaviour of Italian manufacturing firms finding that
innovation capabilities were among the most important competitive factors and to a large
extent explained heterogeneity in export behaviour. The export intensity of innovating firms
was systematically higher than that of non-innovators.
Nassimbeni (2001) conducted an empirical analysis on a sample of 165 small Italian
manufacturing firms comparing exporters and non-exporters in in terms of technology, ability
to innovate, and a number of other structural factors (such as size and age). The propensity of
small firms to export was strictly linked to their ability to innovate the product and develop
valid inter-organisational relations, while it was to a smaller extent related to a given firm’s
technological profile. Larger size increased propensity to export, although small firms were
found not to be totally precluded from entering foreign markets. Age also proved to be the
factor. Taking into account product and process innovations it seems that product innovations
are of greater importance for small exporters as ability to break into a foreign market and to
successfully compete against the local offer is closely linked to a wider product range and to
the availability of novel products. Nassimbeni stressed that exporters faced more
heterogeneous market demands and fiercer competition, whereby they were stimulated to
improve their product innovation or customisation capability (reverse causality). Technology
and process innovations were identified as not discriminant for exporters.
Guan and Ma (2003) analysed several aspects of innovation capabilities of Chinese firms and
their export performance in a panel of 213 manufacturing industry firms. They identified that
export growth was related to improvement of several considered innovation dimensions,
except for the manufacturing capability. Domestic market share proved to be irrelevant, while
the impact of productivity growth rate was robust and significant. At the same time larger
firms demonstrated stronger export competitiveness. Guan and Ma (2003) stated that core
innovation assets (R&D, manufacturing and marketing) could not alone lead to sustainable
export growth. Supplementary assets are required in order to gain competitiveness in more
demanding international markets.
DiPietro and Anoruo (2006) analysing export performance of Chinese firms show that
interaction and harmonizing of various innovation assets available at firm level are primary
factors in the improvement of international competitiveness. They reach the policy conclusion

6
concerning next generation of export promotion policies that should include measures towards
establishing a favourable environment for creativity. Internationalization and innovation
potential seem to be closely linked. This is further stressed by Altomonte et al. (2013).
3. Innovation activity and export performance of Polish firms
Our sample consist of 709 effectively questioned enterprises: 498 exporters (X) and the
remaining where non-exporters (NX). The data was supplemented by financial data from
InfoCredit. The questionnaire consisted out of 90 questions with around 10 per cent related to
innovation capabilities and performance of firms. Our intention was also to identify important
differences between exporters and non-exporters with respect to the issues analysed.
In an interesting study on Korean firms Hobday et al. (2004) distinguished four different
groups of firms according to innovation capability depending on their awareness of need to
change and preparedness and ability to change in practice. Firms with low awareness and low
ability to change are unaware and passive and thus constitute the non-innovator group. Firms
having mediocre or high awareness and ability constitute the innovators group. Ad innovators
introduce innovations from time to time and can be followers (they introduce it following the
leaders) and thus have reactive strategies or can be the leaders themselves and thus behave in
strategic manner assuming the role of a leader (and thus gaining first mover advantage).
Highly innovation-aware firms, introduce innovations constantly and thus are referred to as
creative.
Following Hobday et al. (2004) we included the necessary questions in our survey (please
refer to Tables 1- 3). Respondents, generally, are aware of the need of change – 75,4 per cent
of them identified it as important or key. Looking at the structure of responses of exporters
and non-exporters it is clear that exporters are more aware of the need to change than non-
exporters. The difference between the two analysed groups is statistically significant (as
shown by the value of chi-square test).
Around 18,5 per cent of companies in the sample declared that they did not introduce change.
They were thus passive. Passive firms represent 15,5 per cent of exporters and 25,6 per cent
of non-exporters. 37,8 per cent of firms declare to introduce innovation from time to time.
Within the group non-exporters are more likely to be reactive ad hoc innovators (followers)
and exporters are more likely to be strategic ad hoc innovators thus taking overall the role of
7
the leader in the relevant market. 43,7 per cent of firms declare to introduce change constantly
which is surprising. 48,6 per cent of exporters and 32,2 per cent of non-exporters can be
referred to as creative. The difference between exporters and non-exporters is once again
statistically significant (chi-square test).
The high share of creative firms should be treated with caution. One of the questions in the
questionnaire allows us to verify it (Has the company got on offer in the last three years
innovative products or services?). 57,5 per cent of enterprises disagreed. 23,3 per cent
answered that they introduced new products or services which were innovative for the firm,
and only 19,2 per cent introduced new products or services which were innovative for the
market in which they operated.
The firms have also indicated the share of innovative products and services in their total sales
in the last three years. The share of innovative products is overall low, with small advantage
for exporters over non-exporters which is clear from the histogram (please refer to Figure 1).
The distribution is clearly skewed to the right as could have been expected.
Most of firms (64,6 per cent) judge their ability to introduce innovations as high (4 or 5) and
only 10 per cent as low (1 or 2). The ratio of responses by exporters to non-exporters once
again points in favour of exporters. The difference between the two analysed groups is
statistically significant (chi-square test).
Generally, as exporters are more aware of the need to change and having higher ability to
introduce change in practice – should be more innovative. It however highly depends on their
market strategies.
In another question: In the past three years has the company introduced new products or
services? 45 per cent of firms answered no (42,6 per cent of exporters and 50,7 per cent of
non-exporters) and 55 per cent agreed (57,4 per cent of exporters and 49,3 per cent of non-
exporters).
We take the introduction of new products or services as a verification of the actual status of an
innovator. If the firm declares to be creative (permanent innovator) or ad hoc innovator, but
has not introduced a new product or service in the last three years, we treat it as a non-
innovator.

8
The modified results show that overall 60,5 per cent of firms in the sample are non-innovators
– 55,8 and 71,6 per cent respectively for exporters and non-exporters. 29,1 per cent of
exporters and only 15,2 per cent of non-exporters are creative. Exporters are also more likely
to be ad hoc innovators with the leader status in the market. The share of reactive ad hoc
innovators is roughly the same in both groups.
Most of the companies in the sample introduced new products or services or technologically
improved products or services (please refer to Table 7). Exporters outperform non-exporters
in all innovation-related activities in the last 3 years (as shown by X to NX ratio). The
difference is particularly evident with entry into new markets (new market innovation),
significant organizational changes, significant changes in ownership, modern production
methods and technologically improved products or services. Among exporting firms the
following changes are the most frequent (introduced during the last 3 years) – product
innovations (novel products or services – 57,4 per cent and technologically improved products
or services – 44 per cent), process innovations (modern production methods – 35,1 per cent)
and entry into new markets (31,3 per cent). However, the difference between the two groups
is statistically significant only in the case of technologically improved products or services as
well as expansion and acquisition of new markets for their products or services.
Next table presents average properties of firms in our sample (please refer to Table 8)
dividing it into innovating and non-innovating exporters and non-exporters. Innovating firms
are the ones that introduced novel or technologically improved products in the last three years.
Innovators both exporters and non-exporters are larger in terms of number of employees than
non-exporters. Innovating exporters are on average the largest. Exporters are larger than non-
exporters in terms of total assets, total sales and value added. Average value added in 2012
was clearly higher for non-innovators. Innovators are on average younger than non-
innovators. Innovating exporters have the highest total productivity and capital productivity
with on average lower labour productivity. Exporters are more capital intensive. Innovating
exporters have the highest return on assets however not far away from non-innovating
exporters at the same time having the lowest current liquidity.
We would like to stress here, that the new, new trade theory rejects the standard assumption
of a representative firm and firms' homogeneity. Micro-level data clearly show that firms
differ a lot between and within sectors. This new strand of literature highlights heterogeneity
in productivity, size, and other characteristics even within narrowly defined industries

9
(Melitz, Redding 2014). Furthermore, heterogeneity is systematically related to participation
in foreign trade, with exporters being on average larger and more productive than non-
exporters, prior to entering export markets. Only firms breaching a certain level of
productivity threshold can enter and remain in the foreign markets and thus gain an exporter
status. Firms with low-productivity are unable to penetrate foreign markets but can be also
eliminated from the domestic market. Firms usually learn their actual productivity in
comparison to competitors only after they have already entered the market.
In our study we have utilized the detailed financial data provided by InfoCredit to calculate
different productivity indices in order to identify statistically significant differences between
exporters and non-exporters: including labour productivity, total productivity and TFP. We
will concentrate on labour productivity (LP).
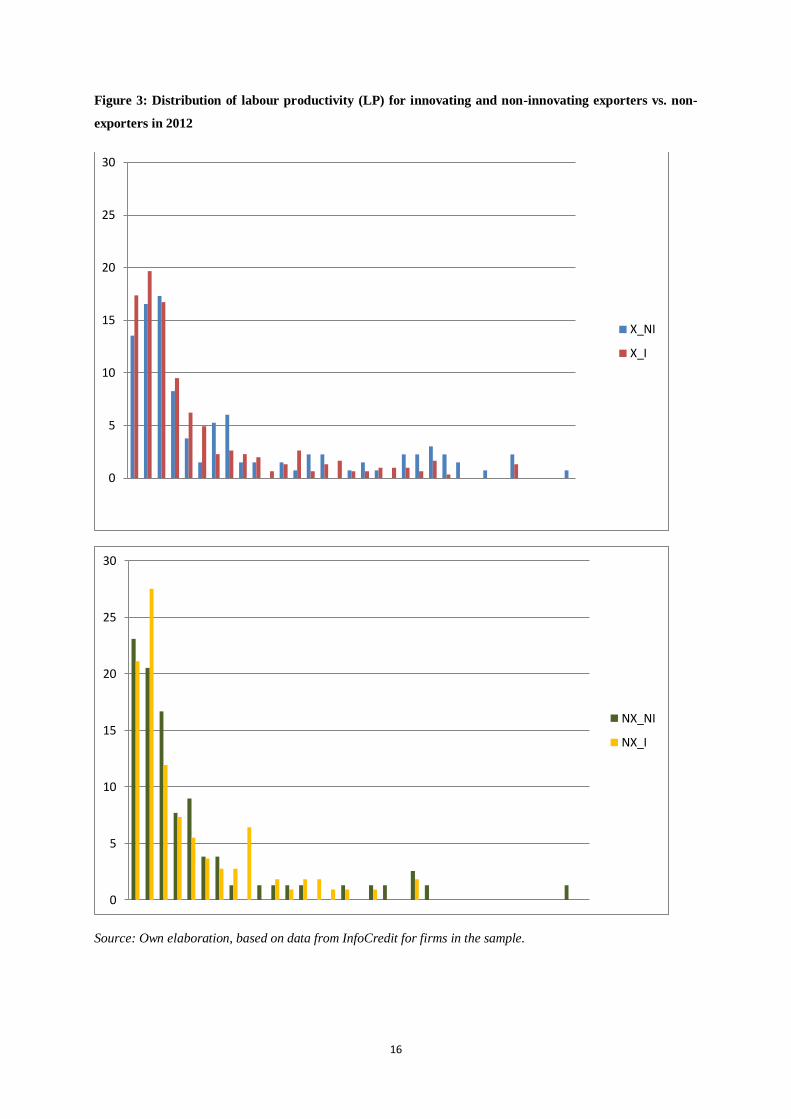
The histogram of labour productivity in 2012 (please refer to Figure 2) shows that it is clearly
skewed to the right for both exporters and non-exporters, as could be expected. Firms with
very high productivity are rare, while firms with low productivity dominate. We further
decompose it into innovating and non-innovating firms in Figure 3. No clear differences can
be identified and there is no clear advantage in labour productivity of innovating exporters
More elaborated statistical analysis showed that he differences between the two analysed
groups was statistically significant with labour productivity generally higher for exporters
(based on the comparison with V-Cramer and eta, available upon request).
4. Concluding remarks
We generally agree that innovation plays a central role in economic prosperity. It seems to
play a significant role in export behaviour of firms and the internationalization-innovation
nexus is evident. Similarly to other country level studies we identified important differences
with respect to innovation activity for Polish exporters and non-exporters.
Exporters proved to be more focused on innovations, are more aware of the need to
implement changes, and are better prepared to introduce them in reality. They are more
probable to be creative (constantly introduce change) and are more likely to behave in more
strategic manner (ad hoc innovators) taking position of market leaders. It seems that the

10
propensity of Polish firms to export is linked to their ability to innovate in particular along the
product dimension.
Exporters outperform non-exporters in all innovation-related activities. The difference is
particularly evident with entry into new markets (new market innovation), significant
organizational changes, significant changes in ownership, modern production methods and
technologically improved products or services. Among exporting firms product innovations,
process innovations and entry into new markets are the most popular.
Product innovators, both exporters and non-exporters, are on average larger in terms of
number of employees than non-exporters. At the same time innovating exporters are the
largest. Exporters are larger than non-exporters in terms of total assets, total sales and value
added. Innovators are on average younger than non-innovators. Innovating exporters have the
highest total productivity and capital productivity with lower, on average, labour productivity.
Innovating exporters have the highest return on assets however not far away from non-
innovating exporters at the same time having the lowest current liquidity.
The results presented here are initial and require more elaborated analysis in the second stage
of our research project with the use of a logistic regression model where innovation –related
variables alongside other factors will explain the export-status of firms.

11
Literature
Altomonte C. et al. (2013), Internationalization and Innovation of Firms: Evidence and
Policy, Economic Policy, Vol. 28(76), pp. 663-700.
Aw B. Y. et al. (2011), R&D Investment, Exporting, and Productivity Dynamics, American
Economic Review, Vol. 101(4), pp. 1312-44.
Basile R. (2001), Export behaviour of Italian manufacturing firms over the nineties: the role
of innovation, Vol. 30, pp. 1185–1201.
Bernard A.B., Jensen B. J. (2004), Why Some Firms Export, The Review of Economics and
Statistics, Vol. 86(2), pp. 561-569
Cassiman B., Golovko E. (2011), Innovation and Internationalization Through Exports,
Journal of International Business Studies, Vol. 42(1), pp. 56-75.
Cieślik A. et al. (2014), The Influence of Firm Characteristics and Export Performance in
Central and Eastern Europe: Comparisons of Visegrad, Baltic and Caucasus States,
Entrepreneurial Business and Economics Review, Vol. 2(1), pp. 7-18.
DiPietro W. R., Anoruo E. (2006), Creativity, innovation, and export performance, Journal of
Policy Modeling Vol. 28, pp. 133–139.
Guan J, Ma N. (2003), Innovative capability and export performance of Chinese firms,
Technovation, Vol. 23, pp. 737–747.
Hobday M. et al. (2004), Approaching the Innovation Frontier in Korea: The Transition Phase
to Leadership, Research Policy, Vol. 33(10), pp. 1433-1457.
Keeley L. et al. (2013), Ten Types of Innovation. The Discipline of Building Breakthroughs,
Wiley, Hoboken, New Jersey.
Melitz M. (2003), The Impact of Trade on Intra‐industry Reallocations and Aggregate
Industry Productivity, Econometrica, Vol.71(6), pp. 1695-1725.
Melitz M., Redding S. (2014), Heterogeneous Firms and Trade, [in:] Gopinath G., Helpman
E., Rogoff K., eds., Hand Books in Economics, International Economics, Elsevier, North-
Holland, Vol. 4, pp. 1-54, Elsevier.
Nassimbeni G. (2001), Technology, innovation capacity, and the export attitude of small
manufacturing firms: a logit/tobit model, Research Policy, Vol. 30, pp. 245–262.
Roper S., Love J. H. (2002), Innovation and export performance: evidence from the UK and
German manufacturing plants, Vol. 31, pp. 1087–1102.
Sterlacchini A. (1999), Do innovative activities matter to small firms in non-R&D-intensive
industries? An application to export performance, Research Policy, Volume 28(8), pp. 819–
832.
Tidd J., Bessant J. (2009), Managing innovation. Integrating Technological, Market and
Organizational Change, Wiley and Sons, Haddington.
Wakelin K. (1998), Innovation and export behaviour at the firm level, Research Policy, Vol,
26, pp. 829–841.

12
Table 1. Respondents' readiness to introduce changes
How far is the firm prepared and able to change in
practice?
1 - low 2 3 4 5 - high Overall
How far
firm is
aware of
the need
to
change?
1 – low
(irrelevant) 41,9 20,0 4,4 0,4 0,5 4,4
2 9,7 30,0 5,6 0,8 1,9 4,4
3 38,7 17,5 35,6 8,2 4,2 15,8
4 3,2 27,5 40,0 58,6 12,6 35,8
5 – high (key) 6,5 5,0 14,4 32,0 80,8 39,6
Overall 100,0 100,0 100,0 100,0 100,0 100,0
Source: Own elaboration, based on survey results.
Table 2. To what extent the Respondent is aware of the need to change? Exporters vs. non-exporters
differences (percent of responses)
Exporters
(X)
Non-exporters
(NX)
Overall
(X+NX)
Ratio
X/NX
1 – low (irrelevant) 3,4 6,6 4,4 0,51
2 3,2 7,1 4,4 0,45
3 14,3 19,4 15,8 0,73
4 34,9 37,9 35,8 0,92
5 – high (key) 44,2 28,9 39,6 1,53
Overall 100,0 100,0 100,0 1,00
Source: Own elaboration, based on survey results.
Table 3. To what extent is a respondent prepared and able to change in practice? (percent of responses)
Exporters
(X)
Non-exporters
(NX)
Overall
(X+NX)
Ratio
X/NX
1 – low 3,41 6,64 4,37 0,51
2 5,02 7,11 5,64 0,71
3 22,29 32,70 25,39 0,68
4 35,94 30,81 34,41 1,17
5 – high 33,33 22,75 30,18 1,47
Overall 100,00 100,00 100,00 1,00
Source: Own elaboration, based on survey results.

13
Table 4. Market strategies followed by respondents (in per cent)
Exporters
(X)
Non-exporters
(NX)
Overall
(X+NX)
Ratio
X/NX
Passive 15,5 25,6 18,5 0,60
Ad hoc - reactive 17,1 26,5 19,9 0,64
Ad hoc - strategic 18,9 15,6 17,9 1,21
Creative 48,6 32,2 43,7 1,51
Overall 100,0 100,0 100,0 -
Source: Own elaboration, based on survey results.
Table 5. Character of innovations (their novelty) introduced by Respondents
Exporters
(X)
Non-exporters
(NX)
Overall
(X+NX)
Ratio
X/NX
no 53,6 66,8 57,5 0,80
new to firm 25,9 17,1 23,3 1,52
new to market 20,5 16,1 19,2 1,27
Total 100,0 100,0 100,0 1,00
Source: Own elaboration, based on survey results.
Table 6. Character of innovations (creativity and leadership) introduced by Respondents
Exporters
(X)
Non-exporters
(NX)
Overall
(X+NX)
Ratio
X/NX
Passive 55,8 71,6 60,5 0,78
Ad hoc - reactive 5,8 5,7 5,8 1,02
Ad hoc - strategic 9,2 7,6 8,7 1,22
Creative 29,1 15,2 25,0 1,92
Overall 100,0 100,0 100,0
Source: Own elaboration, based on survey results.
Table 7. Type of innovation introduced in the last 3 years by Respondents
Change area
X NX Overall X/NX
ratio
new products or services no 42,6 50,7 45,0 0,84
yes 57,4 49,3 55,0 1,17
technologically improved products or services no 56,0 66,8 59,2 0,84
yes 44,0 33,2 40,8 1,33
modern production methods no 64,9 73,9 67,6 0,88
yes 35,1 26,1 32,4 1,35
significant organizational changes no 73,5 81,5 75,9 0,90
yes 26,5 18,5 24,1 1,43
significant changes in ownership no 89,0 91,9 89,8 0,97
yes 11,0 8,1 10,2 1,37
new cooperation with other firms or institutions
(e.g. R&D)
no 85,7 87,2 86,2 0,98
yes 14,3 12,8 13,8 1,11
entry into new markets no 68,7 78,2 71,5 0,88
yes 31,3 21,8 28,5 1,44
Source: Own elaboration, based on survey results.

14
Table 8. Average properties of companies in our sample
Exporters (X) Non-exporters (NX)
Non-innovators Innovators Non-innovators Innovators
No of employees 110 161 42 134
Total assets (K) 16100 13335 2506 4055
Total sales 76858 64411 17103 18533
Value added 36140 25911 6581 7403
Value added per worker 939 412 1059 184
Unit labour costs 141 59 52 53
Average wage 115 48 43 45
K/L 585 125 80 67
Capital productivity 47 137 48 49
Labour productivity 2661 735 1351 485
Total productivity 75 78 43 45
Year established 1992 1994 1992 1996
ROA 0,06 0,07 0,04 -0,06
Current liquidity 9,8 3,5 4,3 4,1
Source: Own elaboration, based on survey results.

15
Figure 1. Share of innovative products in total sales (in last 3yrs as declared by respondents)
Source: Own elaboration, based on survey results.
Figure 2: Distribution of labour productivity (LP) – exporters vs. non-exporters in 2012
Source: Own elaboration, based on InfoCredit database.
0%
2%
4%
6%
8%
10%
12%
14%
16%
18%
ex tjLP_2012 no tjLP_2012
16
Figure 3: Distribution of labour productivity (LP) for innovating and non-innovating exporters vs. non-
exporters in 2012
Source: Own elaboration, based on data from InfoCredit for firms in the sample.
0
5
10
15
20
25
30
X_NI
X_I
0
5
10
15
20
25
30
NX_NI
NX_I