2016 annual report - maire tecnimont · 2016 annual report. maire tecnimont group 2 contents 1....
TRANSCRIPT

1
2016 Annual
Report

Maire Tecnimont Group
2
Contents
1. Board of Directors, Board of Statutory Auditors and Independent Audit Firm 8
2. Investor information 9
3. Key Events 11
4. Group operating performance 15
5. Performance by Business Unit 17
6. Backlog by Business Unit and Region 21
7. Group balance sheet and financial position 36
8. Human Resources 42
9. Training, Incentives, Organization and Security 44
10. Industrial Relations 48
11. IT Systems and General Services 49
12. Health, safety and environment 50
13. Innovation and Research & Development 51
14. Risks and uncertainties 53
15. Financial risk management 55
16. Disputes 56
17. Corporate Governance and Ownership Structure Report 66
18. Treasury shares and shares of the parent company 66
19. Going Concern 66
20. Subsequent events and outlook 67
21. Outlook 68
22. Parent company operating performance 69
Consolidated Financial Statements and Explanatory Notes 71
23. Financial Statements 72

3
23.1. Consolidated Income Statement 72
23.2. Consolidated Comprehensive Income Statement 73
23.3. Consolidated Balance Sheet 74
24. Statement of changes in Consolidated Shareholders’ Equity 76
25. Consolidated Cash Flow Statement (indirect method) 77
26. Explanatory Notes at December 31, 2016 78
27. Notes to the income statement 99
27.1. Revenues 99
27.2. Other operating revenues 100
27.3. Business segment information 101
27.4. Raw materials and consumables 105
27.5. Service costs 105
27.6. Personnel expense 106
27.7. Other operating costs 108
27.8. Amortization, depreciation & write-downs 109
27.9. Doubtful debt provision and risk provisions 110
27.10. Financial income 110
27.11. Financial expenses 111
27.12. Investment income/(expenses) 112
27.13. Income taxes 113
27.14. Earnings per share 114
28. Notes to the Balance Sheet 115

Maire Tecnimont Group
4
28.1. Property, plant and equipment 115
28.2. Goodwill 116
28.3. Other intangible assets 119
28.4. Investments in associates and Joint Ventures 121
28.5. Financial instruments - Non-current Derivatives 123
28.6. Other non-current financial assets 124
Investments in non-consolidated subsidiaries 124
28.7. Other non-current assets 127
28.8. Deferred tax assets and liabilities 128
28.9. Inventories and Advances to Suppliers 129
28.10. Construction contracts 129
28.11. Trade receivables 130
28.12. Current tax assets 131
28.13. Financial instruments - Derivatives 132
28.14. Other current financial assets 133
28.15. Other current assets 133
28.16. Cash and cash equivalents 134
28.17. Shareholders’ Equity 135
28.18. Financial payables - non-current portion 137
28.19. Provisions for charges - beyond 12 months 138
28.20. Post employ. & other employee benefits 139
28.21. Other non-current liabilities 140
28.22. Financial instruments - Derivatives - Non-current 141
28.23. Other non-current financial liabilities 141
28.24. Short-term financial payables 143
28.25. Provisions for charges - within 12 months 144
28.26. Tax payables 145
28.27. Financial instruments - Derivatives 145
28.28. Other current financial liabilities 146
28.29. Client advance payments 146
28.30. Construction contracts liabilities 147
28.31. Trade payables 147
28.32. Other current liabilities 148
29. Commitments and contingent liabilities 149
30. Related party transactions 150
31. Independent Audit Firm fees 151
32. Financial risk management 152

5
32.1. Credit risk 152
32.2. Liquidity risk 154
32.3. Market risks 155
32.4. Interest rate risk 157
32.5. Default and debt covenant risk 157
32.6. Classification of the financial instruments 160
33. Positions or transactions arising from atypical and/or unusual operations 162
34. Significant non-recurring events and operations 162
35. Subsequent events to December 31, 2016 162
36. Statement on the consolidated financial statements as per Article 154-bis, paragraph 5 of Legislative Decree No. 58/98 and subsequent amendments and supplements 163
Financial Statements and Explanatory Notes 164
37. Financial Statements 165
37.1. Income Statement 165
37.2. Comprehensive Income Statement 166
37.3. Balance Sheet 167
38. Statement of changes in Shareholders’ Equity 169
39. Cash Flow Statement (indirect method) 170
40. Explanatory Notes at December 31,2016 171
40.1. Accounting policies 175
41. Notes to the income statement 186
41.1. Revenues 186
41.2. Other operating revenues 186
41.3. Raw materials and consumables 187
41.4. Service costs 187
41.5. Personnel expenses 188
41.6. Other operating costs 189
41.7. Amortization, depreciation & write-downs 190
41.8. Financial income 190
41.9. Financial expenses 191
41.10. Investment income/(expenses) 191
41.11. Income taxes 191
41.12. Earnings per share 193
42. Notes to the Balance Sheet 194
Maire Tecnimont Group
6
42.1. Property, plant and equipment 194
42.2. Other intangible assets 195
42.3. Investments in subsidiaries 196
42.4. Other non-current assets 199
42.5. Other non-current financial assets 200
42.6. Deferred tax assets and liabilities 200
42.7. Trade receivables 201
42.8. Current tax assets 202
42.9. Financial instruments - Derivatives 202
42.10. Other current assets 203
42.11. Cash and cash equivalents 203
42.12. Shareholders’ Equity 204
42.13. Financial payables - non-current portion 206
42.14. Provisions for risks and charges - beyond 12 months 206
42.15. Post employ. & other employee benefits 206
42.16. Other non-current financial liabilities 208
42.17. Short-term financial payables 209
42.18. Tax payables 210
42.19. Trade payables 210
42.20. Other current liabilities 211
43. Commitments and contingent liabilities 212
44. Related party transactions 213
45. Financial risk management 215
46. Independent Audit Firm fees 220
47. Significant non-recurring events and operations 221
48. Transactions relating to atypical or unusual operations 221
49. Subsequent events at December 31, 2016 221
50. Statement on the financial statements as per Article 154-bis, paragraph 5 of Legislative Decree No. 58/98 and subsequent amendments and supplements 222
51. Board of Directors proposal 223
52. Report of Board of Statutory Auditors 225
53. Report of the Independent Auditors on the Consolidated Financial Statements 237
54. Report of the Independent Auditors on the Financial Statements 241

7
Directors’ Report

Directors’ Report
8
1. Board of Directors, Board of Statutory Auditors and Independent Audit Firm
Board of Directors
Chairman Fabriz io DI AMATO
Chief Executive Officer Pierroberto FOLGIERO
Director Luigi ALFIERI (*)
Independent Director Gabriella CHERSICLA (**Chairman) (*** Chairman)
Director Stefano F IORINI (**)
Independent Director Vittoria GIUSTINIANI (*)
Independent Director Andrea PELLEGRINI (* Chairman) (**) (***)
Independent Director Mauriz ia Squinz i
Independent Director Patriz ia RIVA (***)
The Board of Directors w as appointed by the Shareholders’ Meeting of April 27, 2016 and w ill rem ain in office until the approval of the 2018 Annual Accounts
(*) Member of the Rem unerati on Committee
(**) Member of the Control and Risks Committee
(***) Member of the Related Parti es Committee
Board of Statutory Auditors
Chairman Francesco FALLACARA
Statutory Auditor Giorgio LOLI
Statutory Auditor Antonia DI BELLA
Alternate Auditor Massimiliano LEONI
Alternate Auditor Roberta PROVASI
Alternate Auditor Andrea LORENZATTI
The Board of Statutory Auditors was appointed by the Shareholders’ Meeting of April 27, 2016 and w ill remain in office until approval of the 2018 Annual Accounts
Independent Audit Firm
PricewaterhouseCoopers S.p.A.
The company’s Ordinary Shareholders’ Meeting of December 15, 2015 awarded the audit of accounts for the years 2016-2024 to the independent audit firm PricewaterhouseCoopers S.p.A..

9
2. Investor information
MAIRE TECNIMONT S.P.A. SHARE CAPITAL AT DECEMBER 31, 2016
MAIRE TECNIMONT SHARE PERFORMANCE
In 2016, the capitalization of the Issuer increased 2.8% from Euro 766,874,025 at December 31, 2015 to Euro 788,260,950 at December 31, 2016.
The share performance in 2016 was significantly influenced by:
• Generally weak stock markets in the first two months of 2016 due to economic and political uncertainty.
• The announcement in March 2016 of strong 2015 results and the general raising of analyst recommendations and target prices in support of the performance in the second part of Q1.
• On the other hand, negative Oil Services sector sentiment in the middle of the year - despite the oil price recovery.
• Improving sentiment in the second half of the year, particularly after the summer, significantly benefitting the share price.
The Issuer’s ordinary shares numbered 305,527,500 at 31/12/16, unchanged on 31/12/15.
The average daily trading volume in 2016 was 787,786 shares, at an average price of Euro 2.3323.
Milan Stock Exchange ordinary share price (Euro) 01/01 - 31/12/2016
Maximum (March 18, 2016) 2.72
Minimum (February 9, 2016) 1.855
Average 2.3323
Period-end (December 30, 2016) 2.58
Stock market capitalization (at December 31, 2016) 788,260,950
Share Capital Euro 19,689,550
Number of ordinary shares 305,527,500
Number of floating shares 106,875,000
Floating capital percentage 34.980%

Directors’ Report
10
Maire Tecnimont 2016 share performance against the FTSE MIB.
The graph highlights Maire Tecnimont’s 13.5% outperformance of the FTSE Italia MIB (40 largest cap shares).
70
75
80
85
90
95
100
105
110
115
120
Jan-16 Feb-16 Mar-16 Apr-16 May-16 Jun-16 Jul-16 Aug-16 Sep-16 Oct-16 Nov-16 Dec-16
Maire Tecnimont FTSE MIB Index
11
3. Key Events
The Group’s key operating events in 2016 were as follows:
MAIRE TECNIMONT ORDINARY SHAREHOLDERS’ MEETING
On April 27, 2016, the Shareholders’ Meeting of Maire Tecnimont S.p.A. met in ordinary session and in first call, approving all matters on the Agenda. Specifically, the Shareholders’ AGM approved the 2015 Annual Accounts of Maire Tecnimont S.p.A., which reported a Net Profit of Euro 18.5 million, the proposal of a dividend distribution totaling approx. Euro 14.4 million (33% pay-out on the consolidated net profit) and the adoption of a Share Performance Plan and a Share Ownership Plan, both with a focus on engaging employees in growing the Group’s value and aligning the interests of Shareholders and Stakeholders with the Group’s strategic objectives.
The Shareholders’ Meeting also appointed the new Board of Directors, which will remain in office until the approval of the 2018 Annual Accounts, comprising: Luigi Alfieri, Gabriella Chersicla, Fabrizio Di Amato, Stefano Fiorini, Pierroberto Folgiero, Vittoria Giustiniani, Andrea Pellegrini and Patrizia Riva – from the slate presented by the majority shareholder GLV Capital S.p.A. – and Maurizia Squinzi – from the minority slate, jointly presented by a number of funds.
The Shareholders’ Meeting also confirmed Mr. Fabrizio Di Amato as Chairman of the Board of Directors. The Directors Gabriella Chersicla, Vittoria Giustiniani, Andrea Pellegrini, Patrizia Riva and Maurizia Squinzi declared their independence in accordance with law and the Self-Governance Code for listed companies. Four members of the under-represented gender were therefore elected to Maire Tecnimont’s Board.
The Shareholders’ Meeting appointed the new Board of Statutory Auditors, which will remain in office until the approval of the 2018 Annual Accounts, comprising: Francesco Fallacara (Chairman), from the minority slate, and Giorgio Loli and Antonia Di Bella (Statutory Auditors), both from the majority slate. The Alternate Auditors Massimiliano Leoni and Roberta Provasi were appointed from the majority slate, while the Alternate Auditor Andrea Lorenzatti was appointed from the minority slate.
The Shareholders’ Meeting finally voted in favor of the First Section of the Remuneration Report drawn up in accordance with Article 123-ter of the CFA.
MAIRE TECNIMONT BOARD OF DIRECTORS’ MOTIONS
On April 27, 2016, the Board of Directors of Maire Tecnimont S.p.A., on conclusion of the Shareholders’ Meeting, noted the confirmation of Fabrizio Di Amato as Chairman of the Board of Directors by the Shareholders’ Meeting, confirming his appointment and the allocation of powers in accordance with statutory law and the By-Laws, including in particular, the undertaking of institutional relations and external relations and the oversight of implementation of the strategic plans approved by the Board of Directors.
The Board of Directors confirmed Pierroberto Folgiero as Executive Director and General Manager, granting him as the most senior operating manager executive functions for the management and co-ordination of Group operations. Pierroberto Folgiero was also confirmed as Director in charge of the internal control and risk management system.
The Board of Directors also assessed and confirmed, on the basis of available information and the declarations of the interested parties, the independence in accordance with law and the Self-Governance Code for listed companies (“Code”) of the Directors Gabriella Chersicla, Vittoria Giustiniani, Andrea Pellegrini, Patrizia Riva and Maurizia Squinzi.

Directors’ Report
12
The Board of Statutory Auditors, also meeting on conclusion of the appointing Shareholders’ Meeting, verified the independence as per statutory law and the Code of its members Francesco Fallacara, Giorgio Loli and Antonia Di Bella.
In addition, the Board of Directors confirmed the Independent Director Gabriella Chersicla as Lead Independent Director.
The Board of Directors also established:
(i) The Control and Risks Committee, comprising the Independent Directors Gabriella Chersicla (Chairman) and Andrea Pellegrini and the Non-Independent Director Stefano Fiorini, all with appropriate accounting and financial or risk management experience;
(ii) The Remuneration Committee, comprising the Independent Directors Andrea Pellegrini (Chairman) and Vittoria Giustiniani and the Non-Independent Director Luigi Alfieri, all with appropriate finance or remuneration policy knowledge and experience;
(iii) The Related Parties Committee, comprising the Directors (all independent) Gabriella Chersicla (Chairman), Andrea Pellegrini and Patrizia Riva.
The Board of Directors, on approval by the Board of Statutory Auditors, in addition confirmed Dario Michelangeli as the Executive for Financial Reporting, granting the powers set out under applicable provisions and the By-Laws.
Finally, the Board of Directors, following the conclusion of mandate of the previous board, appointed to the company’s Supervisory Board as per Legislative Decree 231/2001, Luciana Sara Rovelli (Chairman), Iole Savini and Valerio Actis Grosso. The Supervisory Board will remain in office until approval of the 2018 Annual Accounts.
ADJUSTMENT OF THE CONVERSION PRICE OF THE “EQUITY-LINKED” BOND LOAN
On May 3, 2016, Maire Tecnimont S.p.A., with regards to the equity-linked bond loan reserved for qualifying Italian and overseas investors, called the “Euro 80 million 5.75 percent. Unsecured Equity-Linked Bonds due 2019” (“the Bonds”) and with that approved by the Ordinary Shareholders’ Meeting of April 27, 2016 concerning the distribution of a dividend per share of Euro 0.047, paid out from May 4, 2016, with dividend coupon of May 2, 2016 - communicated to have sent to the Bondholders a Notice on the same date through Euroclear and Clearstream Luxembourg. The Notice stated that the Calculation Agent determined, following the payment of the dividend, the change in the conversion price of the Bonds from Euro 2.1898 to Euro 2.1509, in accordance with conditions 6 (b) (iii) and 6 (f), at the effective date of May 2, 2016 (first trading date of the ordinary shares ex dividend on the Milan Stock Exchange).
TECNIMONT/KBR COLLABORATION AGREEMENT
Tecnimont, a subsidiary of Maire Tecnimont, and KBR, Inc. signed a collaboration agreement for the incorporation of an Engineering, Procurement and Construction joint venture for an ammonia and urea plant (in addition to auxiliary structures and installations) for Cronus Fertilizer, LLC, in Tuscola, Illinois, USA. As previously announced to the market, the estimated project value is approx. USD 1.5 billion and is subject to financial closing. With this agreement, the Maire Tecnimont Group and KBR bring together the global competences of the two companies and leverage on strategic synergies stemming from their respective areas of expertise.

13
MAIRE TECNIMONT STRENGTHENS PRESENCE IN RUSSIA AND THE CASPIAN SEA REGION THROUGH NEW AGREEMENTS AND PARTNERSHIPS
Maire Tecnimont S.p.A. announced a series of agreements signed at the St. Petersburg International Economic Forum (SPIEF) 2016. The agreements were signed in the presence of senior representatives of the countries involved - specifically the Italian Prime Minister Matteo Renzi and the Russian President Vladimir Putin.
Tecnimont, the main Maire Tecnimont Group contractor, signed a collaboration agreement with the client Eurochem and with the Russian construction company Velesstroy. This agreement confirms the commitment to ammonia plant construction collaboration, with Tecnimont (as EPC contractor) currently engaged in Kingisepp (in the Leningrad region). The construction sub-contracts have a total value of approx. USD 228 million. Velesstroy is among the oil & gas sector construction leaders in Russia and employs more than 17,000.
In addition, Tecnimont signed a Memorandum of Understanding, as an EPC contractor, with the Russian Azot, one of the leading chemical enterprises in Russia and with Codest, a De Eccher Group construction company, for the development of the Kemerovo Fertilizer Complex. The project involves a fertiliser complex, including an ammonia plant with a 2,000 tons per year capacity (MTPD), a nitric acid plant (1,200 MTPD), an ammonia nitrate plant (1,000 MTPD) and an ammonia nitrate solution plant (1,250 MTPD). The project shall be executed in Kemerovo in South-East Siberia, Russia.
Finally, SOCAR, the Azerbaijan State oil company, the CDP Group through the subsidiary SACE, the Italian export credit agency EXIAR, the Russian export credit agency and the GAZPROMBANK Group jointly announced the signing of a Memorandum of Understanding (MoU) to fund the major natural gas GPC Project. Maire Tecnimont is the initiative’s promoter and shall be well positioned for the project’s EPC (Engineering, Procurement and Construction) phase. This project involves the construction of a 10 BCM (billion cubic meters) per year natural gas treatment plant, a polyethylene plant, with capacity of approx. 570,000 tons per year and a polypropylene unit with a capacity of 120,000 tons per year, in addition to accessory infrastructure. The GPC Project will be located in Garadagh, close to Baku, Azerbaijan.
MAIRE TECNIMONT INVESTS IN SILURIA TECHNOLOGIES. MAIRE TECNIMONT AND SILURIA WILL TOGETHER DEVELOP NEW TECHNOLOGIES FOR THE CONVERSION OF NATURAL GAS INTO PETROCHEMICAL-BASED PRODUCTS
On June 1, 2016, Maire Tecnimont S.p.A. and Siluria Technologies signed a co-operation agreement, based on which the two companies’ combined their respective technologies, know-how and experience for the commercialization of a new process to directly convert natural gas into chemical products and their derivatives.
Alongside the co-operation agreement, Maire Tecnimont invested USD 10 million in Siluria through Round E funding. Maire Tecnimont proudly joins Siluria’s international Group of strategic investors, which includes companies such as Saudi Aramco and National Petrochemical Industrial Company (NATPET).
Since its foundation in 2009, Siluria has committed itself to limiting carbon resource usage through innovative solutions, while also focusing on the most interesting opportunities available on the energy and petrochemical market. Siluria’s main technology directly converts natural gas into ethylene through the oxidative coupling of methane. This technology offers the first and only solution available for small scale and distributed production of ethylene. Siluria is currently focused on refinery commercialization and midstream projects and is undertaking a series of petrochemical licensing projects through its global level collaboration with Linde. Siluria’s innovative methane Oxidative Coupling process is the first to be commercialized which directly converts methane and ethane into ethylene. Siluria’s second technological process converts ethylene into combustible liquids, such as petrol. Both processes facilitate the replacement of oil by natural gas as the leading global raw material

Directors’ Report
14
for transport combustibles, in addition to chemical products. Siluria’s revolutionary catalysis and process technologies bring together nano-materials, catalytic development and chemical engineering, to convert natural gas into higher added value products through efficient processes which may be integrated into existing industrial infrastructure.
NEW PROJECTS 12 MONTHS 2016
In 2016, the Maire Tecnimont Group won new projects and existing contract extensions worth approx. Euro 1,778.8 million, almost exclusively in the Technology, Engineering & Construction sector and delivering on the core business refocus strategy. For further details, reference should be made to the “Backlog by Business Unit and Region” section.

15
4. Group operating performance
The Maire Tecnimont Group 2016 key financial highlights (compared to 2015) are reported below:
(in thousands of Euro) FY 2016 % FY 2015 % Change
Performance indicators:
Revenues 2,435,426 1,669,626 765,801 45.9%
Bus iness Profit (*) 241,243 9.9% 211,231 12.7% 30,013 14.2%
EBITDA (**) 160,025 6.6% 130,841 7.8% 29,183 22.3%
EBIT 152,572 6.3% 115,427 6.9% 37,146 32.2%
Net financ ia l expense (18,738) (0.8%) (37,814) (2.3%) 19,077 (50.5%)
Income before tax 133,835 5.5% 77,613 4.6% 56,222 72.4%
Income taxes (48,542) (2.0%) (33,822) (2.0%) (14,721) 43.5%
Tax rate (36.3%) (43.6%) N/A
Net income 85,293 3.5% 43,791 2.6% 41,502 94.8%
Group net income 74,371 3.1% 43,956 2.6% 30,415 69.2%
(1) “Business Profit” is the industria l margin before the allocation of general and administrative costs and research and development expenses; its percentage of revenues is the Business Margin.
(**) EBITDA is net income for the year before taxes (current and deferred), net financial expenses, currency
exchange differences, gains and losses on the valuation of holdings, amortization and depreciation and prov isions .
EBITDA is a measure utilized by management to monitor and assess the operating performance. Management
consider EBITDA a key parameter in measuring the Group’s performance as not impacted by the effects of differing criteria applied to taxable income, the amount and characteristics of the capital utilized and by amortization and
depreciation. As EBITDA is not governed by the Group’s accounting standards, the Group calculation criteria may not
be uniform with those adopted by other groups and, therefore, may not be comparable.
The Maire Tecnimont Group in 2016 reported revenues of Euro 2,435.4 million, up 45.9% on 2015 (Euro 1,669.6 million).
The increase in volumes reflects progress on backlog projects and principally the beginning of full operations on the main EPC projects, which in the previous year were still in the initial engineering stage.
The Group reports a Business Profit of Euro 241.2 million for 2016, up 14.2% on Euro 211.2 million for 2015. The 2016 Consolidated Business Margin was 9.9%, down on 12.7% for 2015.
The reduced margin reflects Technology, Engineering & Construction BU project developments and an altered mix of contracts in progress compared to the previous year. The current mix includes various EPC projects, while in 2015 there was a higher margin from engineering, procurement and licensing projects, which carry higher margins and lower volumes.
G&A costs were Euro 76.2 million, up approx. Euro 2.3 million: they however account for a considerably reduced amount of consolidated revenues (4.4% in 2015 compared to 3.1% for 2016).

Directors’ Report
16
The Group, taking account also of R&D costs of approx. Euro 5 million, reports EBITDA of Euro 160 million for 2016 (up 22.3% on Euro 130.8 million for 2015). The 2016 consolidated EBITDA margin was 6.6%, reducing on the previous year (-7.8%). These developments principally relate to the Technology, Engineering & Construction BU business margin and the differing order stage, as previously outlined. Amortization, depreciation, write-downs and provisions amounted to Euro 7.5 million, reducing on 2015 (Euro 15.4 million) which included write-downs and provisions to align the book value of held-for-sale property investments with their expected realizable value.
Net financial expenses, on the basis of the financial expense and income items (including investments), were Euro 18.7 million - reducing approx. Euro 19.1 million on 2015, confirming improved financial management, thanks to the reduction in the bank debt and average cost following the financial reorganization executed in 2015 and currency market movements.
For 2016, the account includes net charges on derivatives of approx. Euro 2.3 million: comprising charges of Euro 6.3 million in relation to the “time value” part of currency hedging derivatives; income of Euro 2.4 million on raw material price risk derivatives and income of Euro 1.6 million concerning the net value of cash-settled Total Return Equity Swap (TRES) derivative instruments, undertaken to hedge against movements in the Maire Tecnimont share price.
Strong operational results and reduced financial charges returned income before tax of Euro 133.8 million, up on Euro 77.6 million for the previous year.
Income taxes were estimated at Euro 48.5 million. The effective tax rate was approx. 36.3%, in line with the normalized average tax rate reported for the preceding quarters and based on the various countries in which operations are carried out.
2016 Net Income was Euro 85.3 million, improving 94.8% on 2015 (Euro 43.8 million).
Group net income amounted to Euro 74.4 million, up 69.2% on 2015 (Euro 44 million).
In 2016, the Maire Tecnimont Group won new projects and existing contract extensions worth approx. Euro 1,778.8 million, almost exclusively in the Technology, Engineering & Construction sector and delivering on the core business refocus strategy.
The Maire Tecnimont Group Backlog at December 31, 2016 was Euro 6,516 million, slightly reducing approx. Euro 376 million on 2015, mainly due to the significant amount of works executed in 2016.

17
5. Performance by Business Unit
INTRODUCTION
Maire Tecnimont S.p.A. heads an integrated industrial group providing engineering services and works in the following sectors on the domestic and international markets:
- (I) Technology, Engineering & Construction; - (II) Infrastructure & Civil Engineering. The BU figures are in line with the internal reporting structure utilized by company Top Management. The features of these sectors are outlined below:
I. “Technology, Engineering & Construction” Business Unit - designs and constructs plant, principally for the “natural gas chain” (involving separation, treatment, liquefaction, transport, storage, regasification and compression and pumping stations); designs and constructs chemical and petrochemical industry plant for the production, in particular, of polyethylene and polypropylene (polyolefin), ethylene oxide, ethylene glycol, purified terephthalic acid ("PTA"), ammonia, urea and fertilizers; issues, in addition, within the fertilizer sector, licenses on patented technology and proprietary know-how to current and potential urea producers. Other major activities related to the sulphur recovery process, hydrogen production and high temperature furnaces. It is also engaged in the design and construction of hydro-carbon electric power plant and waste-to-energy and district heating plant.
II. “Infrastructure & Civil Engineering” Business Unit - engaged in the design and construction of major infrastructural projects (such as roads and motorways, rail lines, underground and surface metro lines, tunnels, bridges and viaducts) and industrial and commercial and tertiary sector facilities and buildings; it provides environmental services for infrastructure, civil and industrial construction and energy sector projects and plant in general. The Group provides maintenance and facility management services, in addition to general services for temporary construction facilities and Operation & Maintenance services. It also works on large-scale renewables sector plant (mainly solar and wind).
The Maire Tecnimont Group 2016 key financial highlights by Business Unit (compared to 2015) are reported below:

Directors’ Report
18
(in Euro thousands)
Technology, Engineering & Construction
Infrastructure & Civil Engineering
Total
Total %
Revenues Total % Revenues Total
% Revenue
s
31/12/2016
Revenues 2,327,889 107,537 2,435,426
Business Margin 237,331 10.2% 3,912 3.6% 241,243 9.9%
EBITDA 161,831 7.0% (1,806) (1.7%) 160,025 6.6%
31/12/2015
Revenues 1,553,460 116,165 1,669,626
Business Margin 208,550 13.4% 2,681 2.3% 211,231 12.7%
EBITDA 133,412 8.6% (2,571) (2.2%) 130,841 7.8%
Change 2016 vs. 2015
Revenues 774,429 49.9% (8,628) (7.4%) 765,801 45.9%
Business Margin 28,781 13.8% 1,231 45.9% 30,013 14.2%
EBITDA 28,419 21.3% 764 (29.7%) 29,184 22.3%
TECHNOLOGY, ENGINEERING & CONSTRUCTION BUSINESS UNIT
2016 revenues were up 49.9% to Euro 2,327.9 million (Euro 1,553.5 million in 2015).
This improvement relates to progress on backlog projects and mainly the advancement of recently awarded projects, while in the preceding period the main projects had reached a very advanced stage and were not yet offset by new orders.
The 2016 Business Profit increased to Euro 237.3 million (Euro 208.6 million for 2015). The Business margin for 2016 was 10.2%, reducing on 13.4% in 2015.
The reduced margin reflects an altered mix of contracts in progress compared to the previous year. The current mix includes various advanced EPC projects, while in 2015 there was a higher contribution from engineering and procurement projects, which carry higher margins and lower volumes, in addition to projects in final stages.
2016 EBITDA was Euro 161.8 million (Euro 133.4 million in 2015), with a margin of 7% (8.6% in 2015); this performance is reflective of the business margin, as previously outlined.
INFRASTRUCTURE & CIVIL ENGINEERING BUSINESS UNIT
2016 revenues of Euro 107.5 million contracted 7.4% on the previous year (2015 revenues of Euro 116.2 million). This decrease is principally due to the completion of some projects (in particular the Etihad railway) and the slowdown ahead of the definition of changes with the client, of the amount of the public contribution and of the revision of the Financial Plan for the Alba-Bra’ Hospital, not yet offset by new orders.

19
The 2016 Business Profit was Euro 3.9 million (Euro 2.7 million in 2015). The Business margin for 2016 was 3.6%, increasing on 2.3% in 2015.
2016 EBITDA however reported a loss of Euro 1.8 million, due to the absorption of G&A costs; 2015 EBITDA was a loss of Euro 2.6 million.
2016 EBITDA was therefore impacted by the commercial and organisational initiatives rolled out under the new business refocus strategy regarding also the sector for large scale renewable plant.
The above results take into account not only the recognition of contractual payments, but also works variations, incentives and any reserves (“claims”) and for the reliably measured amount expected to be collected.
The following tables outline the Revenues, Business Profit and EBITDA by Business Unit commented upon above.
2,328
108
1,553
116
0
500
1,000
1,500
2,000
2,500
Technology, Engineering &Construction
Infrastructure & Civil Engineering
Revenues by Business Unit (Euro millions)
2016 2015
237
4
209
3 0
50
100
150
200
250
Technology, Engineering &Construction
Infrastructure & Civil Engineering
Business Profit by Business Unit (Euro millions)
2016 2015

Directors’ Report
20
REVENUES BY REGION:
The regional breakdown of Revenues in 2016 compared to the previous year is illustrated below:
(in Euro thousands)
2016 2015 Change
Total % Total % Total %
Italy 461,845 19.0% 334,598 20.0% 127,247 38.0%
Overseas • Europe (EU) 248,172 10.2% 236,927 14.2% 11,245 4.7%
• Europe (non-EU) 258,599 10.6% 124,278 7.4% 134,321 108.1%
• Middle East 800,364 32.9% 434,688 26.0% 365,676 84.1%
• The Americas 219,808 9.0% 407,845 24.4% (188,037) -46.1%
• Africa 152,058 6.2% 43,289 2.6% 108,769 251.3%
• Asia 294,580 12.1% 88,001 5.3% 206,579 234.7%
Total Consolidated Revenues 2,435,426 1,669,626 765,801 45.9%
162
-2
133
-3 -20
0
20
40
60
80
100
120
140
160
180
Technology, Engineering &Construction
Infrastructure & Civil Engineering
EBITDA by Business Unit (Euro millions)
2016 2015

21
The main regional revenue sources were the Middle East (32.9%) and Italy (19%). As previously illustrated in the Revenues by Business Unit table, this figure highlights the significant contribution of the “Technology, Engineering & Construction” Business Unit in the Middle East, in which the Group has a long-standing presence. The Americas reports a significant decrease in production volumes due to the conclusive phase of the orders in the US, Mexico and Santo Domingo.
6. Backlog by Business Unit and Region
The following tables outline the Group’s Backlog, broken down by Business Unit at December 31, 2016, net of third party shares and compared to the previous year:
BACKLOG BY BUSINESS UNIT (in Euro thousands)
Technology, Engineering & Construction
Infrastructure & Civil Engineering
Total
Initial Order Backlog at 01/01/2016 6,454,835 438,131 6,892,966
Adjustments/Eliminations (**) 250,990 18,560 269,551
2016 Order Intake 1,678,062 99,704 1,777,766
Revenues net of third parties (*) 2,319,099 104,702 2,423,801
Backlog at 31/12/2016 6,064,788 451,694 6,516,482
(*) Backlog revenues are net of third party shares of Euro 11.6 million.
(**) 2016 Adjustment/E liminations principally reflect portfolio currency adjustments.
462
248 259
800
220 152
295 335
237
124
435 408
43
88
0
100
200
300
400
500
600
700
800
900
Italy Europe(EU)
Europe(non-EU)
MiddleEast
TheAmericas
Africa Asia
Revenues by Region (Euro millions)
2016 2015

Directors’ Report
22
(in Euro thousands)
Backlog at 31.12.2016
Backlog at 31.12.2015
Change December 2016 vs December 2015
Technology, Engineering & Construction 6,064,788 6,454,835 (390,047) (6.0%)
Infrastructure & Civ il Engineering 451,694 438,131 13,563 3.1%
Total 6,516,482 6,892,966 (376,484) (5.5%)
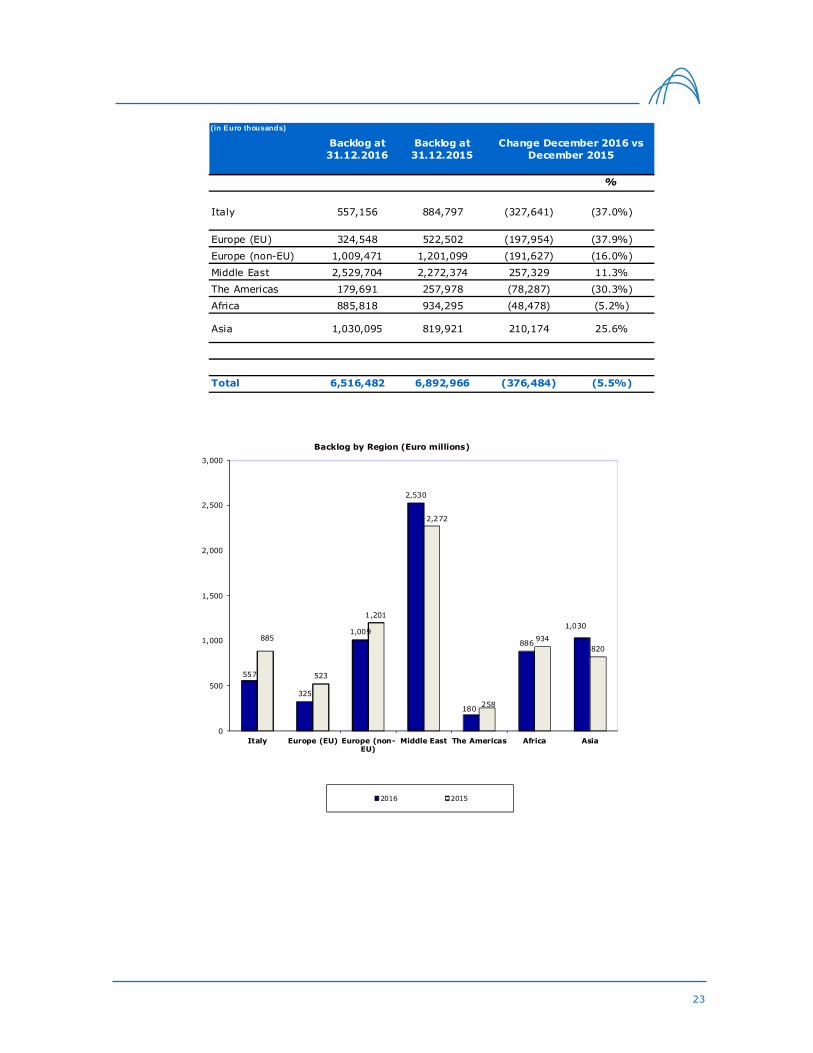
The Maire Tecnimont Group Backlog at December 31, 2016 was Euro 6,516 million, slightly reducing approx. Euro 376 million on 2015, mainly due to the significant amount of works executed in 2016.
BACKLOG BY REGION
The Group Backlog broken down by region at December 31, 2016 and compared with the previous year is presented below:
(*) Backlog revenues are net of third party shares totaling Euro 11.6 million.
(**) 2016 Adjustment/Eliminations principally reflect portfolio currency adjustments.
6,065
452
6,455
438
0
500
1,000
1,500
2,000
2,500
3,000
3,500
4,000
4,500
5,000
5,500
6,000
6,500
7,000
Technology, Engineering &Construction
Infrastructure & CivilEngineering
Backlog by Business Unit (Euro millions)
2016 2015
( in Euro thousands) Italy Total
Europe (EU) Europe (non-EU) Middle East The Americas Africa Asia
Initial Backlog at 01/01/2016 884,797 522,502 1,201,099 2,272,374 257,978 934,295 819,921 6,892,966
Adjustments/Eliminations (**) 86,603 16,683 44,948 80,882 39,106 (5,113) 6,443 269,550
2016 Order Intake 44,774 33,535 22,024 968,021 102,406 108,693 498,311 1,777,766
Revenues net of third parties (*) 459,019 248,172 258,599 791,574 219,800 152,058 294,580 2,423,801
Backlog at 31/12/2016 557,156 324,548 1,009,471 2,529,704 179,691 885,818 1,030,095 6,516,482
Overseas
23
( in Euro thousands)
Backlog at 31.12.2016
Backlog at 31.12.2015
%
Italy 557,156 884,797 (327,641) (37.0%)
Europe (EU) 324,548 522,502 (197,954) (37.9%)
Europe (non-EU) 1,009,471 1,201,099 (191,627) (16.0%)
Middle East 2,529,704 2,272,374 257,329 11.3%
The Americas 179,691 257,978 (78,287) (30.3%)
Africa 885,818 934,295 (48,478) (5.2%)
Asia 1,030,095 819,921 210,174 25.6%
Total 6,516,482 6,892,966 (376,484) (5.5%)
Change December 2016 vs December 2015
557
325
1,009
2,530
180
886
1,030
885
523
1,201
2,272
258
934
820
0
500
1,000
1,500
2,000
2,500
3,000
Italy Europe (EU) Europe (non-EU)
Middle East The Americas Africa Asia
Backlog by Region (Euro millions)
2016 2015

Directors’ Report
24
ORDER INTAKE BY BUSINESS UNIT AND REGION
The table below outlines 2016 Group Order Intake broken down by Business Unit and Region and compared with the previous year:
(in Euro thousands)
FY 2016 FY 2015 Change 2016 vs 2015
% of total
% of total
Order Intake by Business Unit
Technology, Engineering & Construction
1,678,062 94.4% 3,102,703 96.7% (1,424,641) (45.9%)
Infrastructure & Civil Engineering 99,704 5.6% 106,658 3.3% (6,954) (6.5%)
Total 1,777,766 100.0% 3,209,361 100.0% (1,431,595) (44.6%)
Order Intake by Region:
Italy 44,774 2.5% 376,447 11.7% (331,673) (88.1%)
Europe (EU) 33,535 1.9% 474,385 14.8% (440,849) (92.9%)
Europe (non-EU) 22,024 1.2% 1,128,730 35.2% (1,106,706) (98.0%)
Middle East 968,021 54.5% 334,551 10.4% 633,469 189.3%
The Americas 102,406 5.8% 36,271 1.1% 66,135 182.3%
Africa 108,693 6.1% 47,745 1.5% 60,949 127.7%
Asia 498,311 28.0% 811,232 25.3% (312,921) (38.6%)
Total 1,777,766 100.0% 3,209,361 100.0% (1,431,595) (44.6%)
In 2016, the Maire Tecnimont Group won new projects and existing contract extensions worth approx. Euro 1,778.8 million, almost exclusively in the Technology, Engineering & Construction sector and delivering on the core business refocus strategy. New orders in particular included in 2016: OMAN OIL REFINERIES and PETROLEUM INDUSTRIES COMPANY - SAOC (ORPIC), (Oman), (total contract value of approx. USD 895 million); SOCAR POLYMER, (Republic of Azerbaijan), (total project value of approx. USD 180 million); PETRO RABIGH, (Saudi Arabia), (total project value of approx. USD 148 million); BELAYIM PETROLEUM COMPANY (PETROBEL) ZOHR DEVELOPMENT PROJECT (Egypt), (Lump Sum basis contract amount of USD 91 million); HDPE MALESIA – PETRONAS (Malaysia), (total project value of approx. USD 328 million, of which a Tecnimont share of 65%).
The Infrastructure BU’s order intake principally concerns the renewable energy order through Met NewEn, its renewables subsidiary which has been awarded an EPC contract worth over USD 70 million.

25
ANALYSIS OF THE “TECHNOLOGY, ENGINEERING & CONSTRUCTION” BUSINESS UNIT
BACKLOG
The Backlog at December 31, 2016 compared with the previous year is as follows:
(in Euro thousands)
Backlog at 31.12.2016
Backlog at 31.12.2015
Change December 2016 vs December
2015
%
Technology, Engineering & Construction
6,064,788 6,454,835 (390,047) (6.0%)
The “Technology, Engineering & Construction” Business Unit Backlog at December 31, 2016 was Euro 6,054.8 million, decreasing on the previous year Euro 390 million.
PRINCIPAL PROJECTS AWARDED:
OMAN OIL REFINERIES and PETROLEUM INDUSTRIES COMPANY - SAOC (ORPIC), for the construction of a polyethylene plant and a polypropylene plant for the LPIC project. The contract relates to one of the four packages comprising the Liwa Plastic Complex (LPIC) Project. The units will be located in the Sohar Industrial Port Area. The contract value is approx. USD 895 million. This project, announced in December 2015 following the Notice-to-Proceed received in 2016, was included in the Backlog. The project includes engineering services, the provision of equipment and materials and construction until testing, start-up and the performance tests. The overall state of advancement of the project is 8.7% (Engineering 24.6%; Procurement 8.1%; Construction 3.5%).
SOCAR POLYMER, (Republic of Azerbaijan), for the construction of a Lump Sum Turn-Key Polyethylene plant. The plant will be located in the Sumgayit Petrochemical Complex - around 30 KM North of Baku, Azerbaijan. The total project value is approx. USD 180 million, of which USD 120M Tecnimont S.p.A.’s share, with a KT S.p.A. share of USD 60M. SOCAR POLYMER is a company held by SOCAR, Azerbaijan’s national petroleum company and involved in the oil & gas, petrochemical and fertiliser sector.
6,065 6,455
0500
1,0001,5002,0002,5003,0003,5004,0004,5005,0005,5006,0006,5007,000
2016 2015
“Engineering & Technology” Backlog (Euro millions)

Directors’ Report
26
PETRO RABIGH, (Saudi Arabia), a Clean Fuel project by Rabigh Refining and Petrochemicals Company (Petro Rabigh, a joint venture between Saudi Aramco and Sumitomo Chemical), to be constructed within the Rabigh Petrochemical Complex. The project value is approx. USD 148M, of which USD 65M the Tecnimont Arabia Limited (a Tecnimont S.p.A. subsidiary) share, with KT S.p.A.’s amounting to USD 83M. It regards the EPC development of a new Naphta Hydrotreater unit, with a capacity of 17,000 barrels per day, a new sulphur recovery unit with a capacity of 290 tons per day, in addition to interconnecting works. The main process activities are almost complete, while engineering is in progress. The first material orders shall take place shortly.
BELAYIM PETROLEUM COMPANY (PETROBEL) ZOHR DEVELOPMENT PROJECT (Egypt), - on May 12, 2016, the subsidiary KT S.p.A. received from Belayim Petroleum Company (PETROBEL) the Letter of Award for a project involving the construction of a Sulphur Recovery Unit (SRU – three trains) and a Tail Gas Treatment Unit (TGTU – two trains). The Lump Sum contractual value is USD 91 million, together with a Change Order for advanced delivery based on a Bonus/Malus formula. Provision is modulated, while on-site construction is outside of the contract scope. The initially established delivery date of 12 months from the Effective Date (coinciding with the Letter of Award receipt date) ex-works on a CIF basis to the Egyptian Port was advanced on the client’s request, with an acceleration plan on the basis of lots. Engineering is complete, while procurement exclusively concerns a review of the bulk material orders. The modularization of the first lot is complete, while the others are in progress for delivery on May 15, 2017.
HDPE MALESIA – PETRONAS (Malaysia), in November the Tecnimont Group was awarded as part of a joint venture with China Hanie Contracting & Engineering Corporation (HQC) an EPCC Lump Sum Turn Key project for the construction of a high density polypropylene unit for the Pandering Integrated Complex (PIC) by PRPC Polymers SD Bud (PRPC Polymers). PRPC is a PETRONAS (Petrolia Nasional Berthed) subsidiary, the Malaysian multi-national involved in the oil & gas sector and one of the largest global players. The unit will be constructed at the Pen Gerang Integrated Complex, located in Pen Gerang in South-East Johor, Malaysia. The total project value is approx. USD 328 million, with Tecnimont’s share constituting 65%. The project includes engineering services, the provision of equipment and materials and construction until the start-up of the plant and the performance tests. Completion is scheduled for the beginning of the third quarter of 2019. The high density polyethylene unit will be based on LyondelBasell Hostalen Advance Cascade Process (HACP) technology, with a capacity of 400 thousand tons/year.
Other awards: Further to the contracts outlined above, additional projects and change orders to contracts under execution were acquired in Europe and the Middle East, Southern Asia and the Far East for Licensing, design and maintenance services, in addition to Technology Packages.
PROJECTS IN PROGRESS:
ADCO (United Arab Emirates) Tecnimont on December 11, 2014 signed an EPC contract with Abu Dhabi Company for Onshore Oil Operations (ADCO) for construction of phase III of the Al Dabb’iya Surface Facilities project in Abu Dhabi, UAE. The project involves EPC operations until the Performance Tests for the expansion of the existing plant - including in particular: the collection of crude oil through a pipeline network; a Central Process Plant (CPP); the relative oil and associated gas export pipeline. Engineering activities are 90% complete, with material acquisition is 75% complete, while delivery of materials and the execution of civil construction and mechanical works are ongoing. Operations will continue for 34 months from the Contract Commencement Date to the Ready for Commissioning (October 10, 2017), followed by reimbursable services for commissioning and start-up. Plant completion (PAC) is contractually scheduled for 10 February 2018, followed by a guarantee period of 12 months.

27
ADGAS (United Arab Emirates). On February 3, 2015, Tecnimont S.p.A., in consortium with the company Archirodon, received from the Client ABU DHABI GAS LIQUEFACTION COMPANY LTD (ADGAS) the “Letter of Award”, followed on March 12, 2015 by the signing of the Signature Agreement, for construction of the Package 1 IGD Expansion Project in Abu Dhabi-Das Island, United Arab Emirates. The project involves EPC operations until the Performance Tests for the expansion of the existing plant on the island. Tecnimont’s role principally centers on expansion of the gas drying plant with the installation of an additional unit and related structures, while Archirodon will be involved in the preparation of the site with backfill and civil works and sea works along the western coast of Das Island for the above-stated expansion, including further preparation works upon the site with backfill for the IGD-E2 package (upcoming plant expansion project). The total advancement of the project is 51.4%. Specifically: engineering has reached 98.6% completion, with the procurement of materials 97.6% complete and construction at 29.1%. Mechanical completion of works is scheduled by February 16, 2018, with the overall Test Run by April 16, 2018 and Provisional Acceptance Certificate (PAC) by June 16, 2018, followed by a mechanical guarantee period of 18 months before Final Acceptance Certificate (FAC). PP SOCAR (Azerbaijan) In April 2015 Tecnimont S.p.A. and KT – Kinetics Technology S.p.A. agreed with SOCAR POLYMER a lump sum EPC 180 kTY polypropylene plant construction contract in Sumgayit (30 KM north of Baku). The project includes engineering services, the provision of equipment and materials and construction until the start-up of the plant and the performance tests. The home office services have reached 98% completion, with procurement/manufacturing 76% compete, while construction has reached 37% progress. The total advancement of the project is 61%. Completion is scheduled for April 2018. KINGISEPP (Russia) - acquired in June 2015, the project is executed under two Lump-Sum-Turn-Key Contracts between JSC “Eurochem NorthWest”, a EuroChem Group AG (“EuroChem”) subsidiary and a global agro-chemical sector leader, TecnimontS.p.A and Tecnimont Russia. The Client is availing of SACE financing. The project involves the construction of a new industrial grass root plant for the production and storage of ammonia, based on KBR technology and of 2,700 Tons per day capacity. The site is within an existing industrial complex close to the city of Kingisepp . The Project has reached an 32.5% physical state of advancement, with engineering 69.2% complete and procurement of materials (Purchasing + Manufacturing & Delivery) at 43.2%, while Construction in 5.9% complete. The completion of the project (Plant Provisional Acceptance Certificate) is scheduled for the third quarter of 2018. CORU – RAFFINERIA MOSCA (Russia), in June 2015, a letter of intent was signed with JSC Gazprom Neft for construction of the Combined Oil Refinery Unit (CORU) Project at the existing Moscow Refinery in the Russian Federation. The contract was signed on October 5, 2015. It covers Detail Engineering, Procurement and Construction Management services. Engineering is 90,6% complete, with material procurement at 63.7%, while construction is 7.2% complete. The total advancement of the project is 63.0%. Mechanical Completion and completion of the project (RFSU – Ready for Start-Up) are respectively scheduled for 33 months and 36 months from the Work Commencement Date (WCD) of June 2015. SLUISKIL – YARA (Netherlands) acquired in July 2015 from the client Yara Sluiskil B.V.. The project involves the lump sum turn-key construction of a new urea granulation plant with a production capacity of 2,000 tons per day, in addition to a number of related units. The complex will use Yara proprietary technology, enabling production of a special variety of urea, enriched with sulphur. Engineering is 94% complete, with material procurement at 97.8%, while construction is 37% complete. The total advancement of the project is 64.9%. The mechanical completion of works is scheduled for October 2017, with plant start-up in November 2017, followed by a mechanical guarantee period of 24 months (November 2019). PP MALESIA – PETRONAS (Malaysia), in November 2015, PRPC Polymers SD Bud (PRPC Polymers) - (“PETRONAS”) Group - awarded the Tecnimont Group as part of a joint venture

Directors’ Report
28
with China Hanie Contracting & Engineering Corporation Ltd. (HQC) an EPCC Lump Sum Turn Key project for the construction of two polypropylene units for the RAPID (Refinery and Petrochemical Integrated Development) complex. The two units will be constructed at the RAPID complex, located in Pen Gerang in South-East Johor, Malaysia. The project includes engineering services, the provision of equipment and materials and construction until the start-up of the plant and the performance tests. Engineering is 67.1% complete, with material procurement at 41.5%, while construction is 4.1% complete. The total advancement of the project is 27.3%. Mechanical completion, scheduled for August 31, 2018, permits the achievement of Ready for Start Up on November 30, 2018. On issue of the PAC, expected on April 15, 2019, a period of twelve months for achievement of Final Acceptance will follow. GRUPA LOTOS - COKING UNIT AND HYDROGEN GENERATION UNIT (Poland), in July 2015 KT S.p.A. was awarded an EPC (Engineering, Procurement and Construction) contract by Lotos Asfalt Sp. z o. o., a subsidiary of Grupa LOTOS SA, for the extension of a refinery unit at their Gdansk, Poland plant as part of the EFRA (Effective Refining) project. Grupa Lotos is one of the largest refinery companies in Poland, engaged in the extraction and processing of oil and the wholesale of refined petroleum products. The total value of the contract is approx. Euro 308.5 million. Mechanical completion is scheduled for 2018. The contract covers the installation of a delayed coking unit, a coker naphtha hydrotreating unit and a hydrogen production unit (developed using KT proprietary technology), in addition to accessory structures at the Gdansk refinery. In addition, it concerns the use of the best technology available for the unloading and dewatering of coke. This technology is the most innovative available as reducing the environmental impact of the delayed coking process. Project advancement is currently on schedule, with critical material orders issued and no significant differences for the delivery dates. A number of bulk order reviews are required for completion of the procurement campaign. The DCU and HGU Civil Works have been completed. The installation of the Pipe Rack has been completed. Piping and equipment installation has begun. GRUPA LOTOS – HYDROWAX VACUUM DISTILLATION UNIT (Poland), also at the end of October 2015, KT S.p.A. received from Grupa Lotos an order (EPC Lump Sum) for the construction of a “HYDROWAX VACUUM DISTILLATION” plant, to be integrated into the Gdansk refinery in Poland. The project involves the construction of the HVDU - Hydrowax Vacuum Distillation Unit (licensed by ThyssenKrupp Uhde Engineering Services) and is part of the extension of the Gdansk refinery involving the construction of other units and facilities. The contract value is Euro 36.2 million. Completion is scheduled by January 2018. The award is part of the above-stated EFRA (Effective Refining) investment program to optimize refinery production efficiency. The project is proceeding on schedule, with all equipment having been procured and fabrication of the column at the supplier completed. The piling and civil works have been completed. Mechanical assembly has begun. Punta Catalina (Santo Domingo) Tecnimont S.p.A., in consortium with Construtora Norberto Odebrecht S.A. and Ingenieria Estrella S.R.L., was awarded in November 2013 the construction of a strategically important industrial complex for the country’s development (a coal fired thermal power plant, an offshore terminal and other related structures). The client is CDEEE, the Dominican Republic national electricity company. The project involves the construction of two coal fired 360 MW plant in Punta Catalina, Dominican Republic. The EPC contract was signed in April 2014, with effective date set retroactively as February 7, 2014. Tecnimont will undertake all engineering works (except for the offshore marine and transmission line works), the procurement of the power island equipment and commissioning and delivery of the plant with the relative acceptance tests. Engineering has reached 96.6% completion, with the procurement of materials at 93.9% completion, while construction by CNO is 38% complete. The start-up of the two units is scheduled respectively 54/57 months from the plant start-up date, followed by a mechanical guarantee period of 12 months. TEMPA ROSSA (Italy) On April 5, 2012, a temporary consortium (ATI) comprising Tecnimont S.p.A. and KT S.p.A. was awarded a contract for the Engineering, Procurement, Supply,

29
Construction and Commissioning of the "Tempa Rossa" Oil & Gas Treatment Centre located close to Corleto Perticara (Potenza). The client is Total E&P Italia S.p.A., an Italian subsidiary of the Total Group. The project has reached a 81% overall state of advancement. The engineering activities are over 99% complete, while procurement, manufacturing and delivery of materials to the site are 90% complete. Works on the GG2 well have begun. Construction work at the Oil Centre and the LPG storage center are 64% complete. KIMA (Egypt) The Lump Sum Turn Key contract was acquired on October 30, 2011 from Egyptian Chemical & Fertilizers Industries – KIMA, an Egyptian chemical sector group. The contract involves the construction of a new fertiliser complex for the production of ammonia with a capacity of 1,200 tons per day, and of Urea with a production capacity of 1,575 tons per day and relative services. The plant will be constructed at the existing industrial district in the Assuan region (Northern Egypt). Due to the current political/social situation in Egypt, client operations have slowed significantly for the sourcing of funding for the initiative. The situation was successfully resolved at the end of 2015 with the finalization of credit lines by the client and an increase in Tecnimont’s contractual value. In January 2016, recommencement of the project was declared. The engineering and home office activities reached 89% completion, while the site commissioning, begun in February 2016, was 22% complete. The project is 36% complete. The Provisional Acceptance Certificate (PAC) is expected in November 2018, followed by a 12 month guarantee period, on conclusion of which all obligations will be fully discharged and the Final Acceptance Certificate (FAC) issued. GASCO (United Arab Emirates) acquired on July 15, 2009 under a joint venture with Japan Gas Corporation (JGC) one of the largest gas development projects globally. The project was officially awarded to Tecnimont by the company Abu Dhabi Gas Industries Ltd. (GASCO). The contract includes the provision of engineering, procurement, construction and start-up services for the Habshan 5 processing plant, part of the Integrated Gas Development (IGD) complex in Abu Dhabi (United Arab Emirates). Operations were completed as per the project schedule. The engineering operations were completed and the “as built” final documentation was delivered to GASCO. The home office is engaged only in occasional assistance to Site operations for the works under guarantee. Procurement has sent all materials to be assembled and completed delivery to the site of the 2 Years Spare Parts. The Construction activities have been completed. All of the key milestones have been reached (Mechanical Completion and Provisional Acceptance (PAC) both for Phase 1 and Phase 2) and the issue of the Final Acceptance Certificate (FAC) is expected by Q1 2017. BOROUGE 3 (United Arab Emirates) two turnkey projects acquired in May 2010 as part of a Joint Venture with Samsung Engineering Co. Ltd, with Tecnimont as leader with a 55% holding. The Client Borouge is a Joint Venture between Abu Dhabi National Oil Company (ADNOC) and Borealis. The two EPC contracts respectively concern: 2 polypropylene (PP) plant,2 polyethylene (PE) plant and 1 low density polyethylene plant (LDPE). All plants have started up successfully and production under the End Client has begun. The Provisional Acceptance Certificate (PAC) of the PE/PP Plant was issued by the Client on July 26, 2015. For the LDPE Plant, the PAC was issued on June 17, 2015. The 12-month Guarantee periods began on these dates and both have been completed. The Final Acceptance Certificate (FAC) of the plant is still awaited. LDPE BRATISLAVA – SLOVNAFT (Slovakia) on April 3, 2012, Tecnimont S.p.A. and its subsidiary Tecnimont Planung und Industrieanlagenbau gmbh were awarded an EPCC (Engineering - Procurement – Construction - Commissioning) lump sum contract for the construction of a 220 KTY LDPE plant in Bratislava. The Client is Slovnaft Petrochemicals s.r.o., a Slovakian petrochemicals company, part of the Hungarian MOL group. The engineering, procurement, manufacturing, construction and pre-commissioning are 100% complete. As per the last contractual amendment, on November 26, 2015 Mechanical Completion of the plant was achieved. The plant entered into production in May 2016. The extended production, environmental impact and performance tests were completed by September 2016. The Provisional Acceptance Certificate (PAC), subject to the client’s annual

Directors’ Report
30
scheduled maintenance during which the final test upon the plant will be executed, is expected by the first half of 2017.
HP-LDPE SADARA (Saudi Arabia) On July 23, 2012, Tecnimont S.p.A. and its subsidiary Tecnimont Arabia Limited were awarded a contract for the construction of a 350 KTY HP-LDPE plant (DOW technology) at Al-Jubail, Saudi Arabia. The Client is Sadara Chemical Company, a Joint Venture between Saudi Aramco and Dow Chemical Company. A 28-month lump sum EPC contract until Mechanical Completion (including pre-commissioning) was agreed. Any assistance to commissioning, start-up and the test run will be provided on a reimbursable basis. Engineering is 100% complete, with material procurement at 100%, while construction is 99.95% complete. The total advancement of the project is 99.98%. The mechanical completion of works is scheduled to be completed in 2017, followed by 18 months of mechanical guarantee.
FERTILIZZANTI IOWA (United States) On September 5, 2012, Tecnimont S.p.A. was awarded a contract for the complete provision of engineering and material procurement services for the construction of a new ammonia plant of 2,200 tons per day (MTPD) capacity in Wever (USA). The scope of works includes Construction Supervision services and commissioning and start-up operations. The client is Iowa Fertilizer Company (IFCo). Engineering is 100% complete, with the physical advancement of the procurement services 100% complete. The total advancement of the project is 90%. Completion of the plant is scheduled by May 2017, followed by an 18-month guarantee period.
LDPE MESSICO (Mexico) acquired in December 2012 from Etileno XXI Services B.V.. This concerns an Engineering and Procurement contract for the construction of a low density polyethylene unit (LDPE), with a capacity of 300 thousand tons per year, at the Etileno XXI petrochemical complex in Coatzacoalcos (MX). The project is 100% complete. The as-builts have been completed and sent to the client, concluding all of Tecnimont’s scope of works. The Ready for Start-Up (RFSU) of the plant is scheduled for 2017. PP DAHEJ GUJARAT (OPaL) (India) The Lump Sum Turn Key (LSTK) contract was acquired in June 2011 from OPaL (ONGC Petro Additions Ltd.) for the construction of a plant comprising a polypropylene (PP) line of 340 KTPA capacity; the Ineos technology adopted for this specific project is a first for the Group and further extends our broad technological portfolio. The plant has been completed and the commissioning successfully carried out utilizing a limited quantity of propylene provided by the client. True and proper commissioning will be carried out when the client Opal makes propylene available on a continuous basis. LLDPE/HDPE DAHEJ GUJARAT (OPaL) (India) The Lump Sum Turn Key (LSTK) contract was acquired in June 2011 from OPaL (ONGC Petro Additions Ltd.) for the construction of a plant comprising two LLDPE/HDPE polypropylene (PP) lines of 360 KTPA capacity; the Ineos technology adopted for this specific project is a first for the Group and further extends our broad technological portfolio. The plant has been completed and is ready for commissioning, which currently may not be undertaken due to the unavailability of the feed provided by the client OpAL. TOBOLSK (Russia) - acquired in December 2009 from Sibur Holding JSC – Tobolsk Polymer LLC. The project involves the construction of a propane dehygeneration (PDH) plant with TPY 510,000 capacity. Engineering, Procurement and Construction has been completed. Mechanical Completion was achieved on August 23, 2013. With Commissioning completed, on June 19, 2015 the Provisional Acceptance Certificate was signed and the Punch List attached. The guarantee period of the entire plant concluded on February 23, 2016. For the parts included in the Punch List points, the guarantee period of 6 months from the relative Act of Acceptance was however extended to December 31, 2016. The issue of the Final Acceptance Certificate is in progress. LDPE NOVY URENGOY (Russia) - acquired in May 2010 from the Operator C.S. Construction Solution (UK) Limited with End Client Novy Urengoy GCC (Gas and Chemical Complex). The

31
contract concerns the provision of materials and assistance by TCM personnel. 27 orders were issued, 24 of which have been delivered. The three remaining supplies shall be delivered, as agreed with the client, in the second half of 2018. Conclusion of service and supply activities (including the site reconditioning of materials) is scheduled for 2018. The presence of our personnel on site as per the Tecnimont Russia supervision contract will continue until the end of 2019.
TOMSK (Russia) - acquired in March 2014 from Tomskneftekhim (TNH), a SIBUR Group subsidiary. The project involves the provision of engineering, procurement and technical advisory services for the revamping of a LDPE plant to increase production capacity from 240 KTA to 270 KTA. All engineering, procurement and on-site assistance activities have been fully completed. The residual activities in progress concern post start-up technical assistance or the replacement of materials under guarantee by the vendors. The plant’s Performance Test is awaited. Both for engineering services and the supply of materials the guarantee period concludes on 31.12.2017 i.e. 18 months from Mechanical Completion of the plant (achieved on 30.06.2016).
JAZAN IGCC PAKAGE 2 (SRU) (Saudi Arabia), in May 2014 SAIPEM and KT S.p.A. signed a Sub-Contract Agreement for the provision of 12 skids (end user Saudi Aramco), equally divided between two units (J30, A07) for the Jazan Refinery in Saudi Arabia. The supply is completed off skid by 6 Steam Driers, 6 Convectives and 6 Stacks and electro-instrumental bulk. The Project formally entered into force in February 2015. The total contract value includes one part in Euro (28.5 million) for the supply of equipment to the J30 Unit and related services and one part in USD (16.0 million) for the supply of equipment to the A07 unit. The mechanical design of the equipment has been completed. Engineering is involved in supplier follow-up activities. The equipment procurement phase has concluded. Delivery in accordance with the revised schedule agreed with the client is in progress. ROG – REFINERY OFF GAS (Belgium), in April, 2014, two contracts were signed with Total Olefins Antwerpen (Total Group) for execution of the Refinery Off Gas (ROG) project at the Total refinery in Antwerp, Belgium. The scope of the ROG project is to recover significant volumes of hydrocarbons which currently are used as combustible gas and their treatment in the existing naphtha cracker. The total value of the two contracts is approx. Euro 214.1 million. The first involves EPC operations for the new ROG units for the treatment of the off-gas of the refinery and the recovery of hydrocarbons. The new ROG Unit will be entirely modular to minimize construction at the refinery. The second is an EPCa (Engineering, Procurement and Construction assistance) contract for alteration of the existing naphtha cracker for the treatment of hydrocarbon streams recovered from the new ROG unit and interconnecting works. Engineering and procurement have been completed. Electro-instrumental and insulation installation is in progress in order to meet the recently extended target date of May 2017. SRU, OGA, SWS PROJECT FOR THE MILAZZO REFINERY (RAM) (Italy), The project, of an initial value of approx. Euro 42 million, concerns the LSTK execution of engineering, procurement, construction and commissioning works at the new complex comprising a sulphur recovery plant, an acidic water removal plant and an amine regeneration unit, called “SRU2, SWS3 and OGA2”, awarded to KT by the Milazzo S.p.A. Refinery. On May 11, 2012, KT received the Letter of Intent (LOI) for construction of the plant and subsequently in August formally signed the definitive contract. In December 2012, the company received a contractual amendment concerning the construction of the interconnection with the existing units for Euro 3.7 million. The project duration of 24 months is however linked to the site opening date, initially scheduled for April 2014, although now substantially delayed due to the fault of the client. Change orders were agreed for an amount of approx. Euro 9.1 million and include the extension of the project. After a suspension period, the Civil works permits were granted and therefore on February 17, 2015 the relative contract was issued. Civil Works have been completed. On March 4, 2016, RAM and KT agreed the “Site Opening Delay” variant, which schedules the activities for completion and the new Construction Completion date (July 31, 2017). Piping pre-fabrication and mechanical assembly is in progress.

Directors’ Report
32
GS – ERC PROJECT (Egypt) KT was awarded the Engineering and Procurement contract for the construction of a 100,000 Nm3/h new hydrogen unit (HPU) and three sulphur recovery units (SRU), a tail gas treatment (TGT) unit, an ammonia treatment unit and a Coker furnace at the Egyptian Refinery Company’s (ERC) new refinery in MOSTOROD – Cairo (Egypt). The total value of the Main Contractor project is approx. USD 3.7 million. KT GS signed the contract in the middle of September 2012 and the project has a value for KT of approx. Euro 104 million and USD 12 million. The initial program established mechanical completion for the first half of 2017, although the Client officially requested an extension of this date until the end of 2018. Engineering activities have concluded. The itemized material was delivered, as demonstrated by the delivery Completion Certificate of December 28, 2016. GS completed construction of the foundations and installation of the U/G and is proceeding with installation of the equipment, the skids and the pre-fabricated piping at the client’s offices.
Other projects: all actions necessary on projects under completion and other minor engineering and services contracts are being taken.
ANALYSIS OF THE “INFRASTRUCTURE AND CIVIL ENGINEERING” BUSINESS UNIT
BACKLOG
The Backlog at December 31, 2016 compared with the previous year is as follows:
(in Euro thousands) Backlog at
31.12.2016 Backlog at 31.12.2015
Change December 2016 vs December
2015
Total %
Infrastructure & Civ il Engineering 451,694 438,131 13,563 3.1%
The Infrastructure and Civil Engineering Backlog at December 31, 2016 amounts to Euro 451.7 million, increasing on the previous year Euro 13.6 million. In 2016, new contracts were acquired and change orders and project variants agreed worth Euro 99.7 million.
The Infrastructure and Civil Engineering BU continued the turnaround launched in previous years, through a corporate restructuring to both increase capacity to adapt to altered production volumes and to ensure a greater focus and consequent capacity to respond to
452438
050
100150200250300350400450500
2016 2015
“Infrastructure & Civil Engineering” Backlog (Euro millions)

33
engineering services demand. It also works on large-scale renewables sector plant (mainly solar and wind), as demonstrated also by recent acquisitions.
PRINCIPAL PROJECTS AWARDED:
The Infrastructure BU’s order intake principally concerns the renewable energy order through the Met NewEn Group, operating in renewable energy, which has been awarded an EPC contract worth over USD 70 million by a major electricity company. The contract concerns the construction of a new wind farm in Mexico, which will be one of the country’s largest. The Met NewEn Group shall be responsible for all project execution and civil and electromechanical activities concerning the wind park and the relative approx. 80 KM transmission line. The client shall be responsible for the procurement and assembly of the aerogenerators.
PROJECTS IN PROGRESS:
RAIL PROJECTS:
Etihad Railway Project – (Ruwais, UAE), the contract was acquired by Tecnimont in October 2011 in consortium with Saipem SpA and Dodsal Engineering and Construction Pte, with Tecnimont SpA’s scope transferred to Tecnimont Civil Construction S.p.A. with effect from July 1, 2013. The client is Etihad Rail Company, the developer and operator of the United Arab Emirate national rail system. The project for the construction of a rail line connecting Ruwais/Habshan (section 1) and Habshan/Shhah (section 2) for the transport of sulphur has substantially been completed and the punch list actions are under execution. The trains are operative and the transfer of sulphur has begun. The guarantee period is 24 months. The negotiations with the client for the recognition of the claims presented are in the formalization stage.
Fiumetorto Railway line doubling – (Cefalù, Italy) - acquired in September 2005, the contract concerns the doubling of the rail line between Fiumetorto and Ogliastrillo and is under execution on behalf of Rete Ferroviaria Italiana S.p.A. The economic state of advancement is 75%. Tunnel excavation works have been completed and the doubling of the tracks on the Fiumetorto – Campofelice – Lascari section completed. The overall physical state of advancement is approximately 76%. Against “provision 17” of ANSF substantial delays accumulated in the dismantling of the historic line and times for execution of the works alongside the track in service are expected to lengthen. The second deferment request stemmed from the additional time needed for execution of works alongside the track in service and resulted in the granting of a new General Works Completion date of September 9, 2016. Taking account of the additional changes requested by the client, in 2016 an application for a further review of the contractual terms was prepared, which RTI considered and established 23/10/2017 as the date for works completion. In May 2014, an initial amicable settlement as per Article 240 of Legislative Decree 163/2006 for the reserves presented was signed; a portion of the reserves presented to date and considered of probable recognition and reliably valued also on the basis of the opinion of our legal representatives, in addition to technical opinions where considered appropriate, have already been recognized to the financial statements.
Lamezia – Catanzaro Railway Line (Lamezia Terme, Italy) - acquired in February 2015 by the Tecnimont Civil Construction (65%) and S.E.L.I. Spa (35%) consortium (ATI). The Lamezia Terme – Settingiano railway line contract was awarded by Rete Ferroviaria Italiana S.p.A. and has been concluded as per the contractual terms. In February 2016, a final settlement of the case was reached at the Ordinary Court, including all pending matters between the parties. In February 2014, the partner SELI S.p.A. presented a “continuity” administration application in accordance with Article 161, sixth paragraph of the Bankruptcy

Directors’ Report
34
Law. On conclusion of proceedings, the Rome Court issued the relative decree. With regards to that outlined above, the relative risks were provided for in the financial statements.
TURIN - LYON PROJECT (Val di Susa, Italy – Maurienne, France) - project awarded in May 2009 by LTF – Lyon-Turin Ferroviaire s.a.s.. The strategically important contract involves the design of civil and geological works, general coordination and the safety of the line from the Italian-French border to Chiusa San Michele on behalf of the company L.T.F.. Operations were carried out as part of a temporary consortium between the French, Swiss and Italian engineering companies. The Client assistance phase is currently ongoing until approval of project conclusion; preparatory operations for the final review phase of the project have been initiated; this phase will conclude in Q1 2017.
METRO PROJECTS:
Rome Metro - B1 Line Extension – (Rome, Italy) - acquired in 2005. The contract is currently under execution on behalf of Roma Metropolitane (Municipality of Rome) by a consortium comprising Salini-Impregilo S.p.A., Tecnimont Civil Construction S.p.A. and ICOP S.p.A.. Tecnimont Civil Construction S.p.A., a designer under the Integrated Contract, has undertaken the Executive Design of the Project. In relation to the contract for the Bologna – Conca d`Oro line, the test report was issued in February 2013. With regard however to the additional Conca D’Oro - Jonio extension, with the exception of some minor actions concerning access and external works, works have been completed. Both sections are in commercial operation. The procedure initiated before the Ordinary Court continued for recognition of the reserves requested under Article 240. Turin Metro – System Works (Turin, Italy). In February 2013, through TRANSFIMA GEIE (Tecnimont Civil Construction S.p.A. – Siemens),the framework contract for systemic technological works for extension of the Lingotto – Benghazi line and the relative Addendums were agreed. The delays in the execution of the civil works, outside of the scope of the contract agreed with Transfima GEIE, are resulting in a slowdown of the executive works awarded to Transfima GEIE. On-site works are now scheduled for June 2017. The maintenance contract also continued for the Collegno-Lingotto line for the 2013-2017 five-year period. In 2017, a contract was in addition signed for adjustment of the MAV system and the resolution of obsolesences. However, for the extension of the Fermi-Cascine Vica section, Transfima GEIE delivered to the client Infra.To. the final design required for receipt of funding for the new line and therefore the subsequent awarding of works.
Istanbul Metro - Design (Istanbul, Turkey). In May 2016, the contract for the definitive design and preparation of the tender documentation of the Istinye- Itu- Kağithane Metropolitan Line was acquired, which will extend for 12 KM and includes 7 stations. The client is the municipal company İSTANBUL BÜYÜKŞEHİR BELEDİYESİ. The contract duration is 270 days. Although of a contained amount, the contract is strategically important as marking the entry into a country which will see significant transport sector infrastructure investment.
CIVIL AND INDUSTRIAL PROJECTS:
Alba-Brà Hospital (Verduno, Italy) - acquired in November 2015 under a “construction and management” contract signed with ASL CN2. The initiative is headed by the project company MGR Verduno S.p.A. (Tecnimont Civil Construction 96% and Gesto 4%). The works have reached an approx. 70% state of advancement. With reaching of the amicable settlement as per Article 240 of Legislative Decree 163/2006 and subsequent addendums, the new contractual completion date of September 30, 2015 was also set.

35
In 2016 the works slowed ahead of the definition of changes with the client, of the amount of the public contribution, of the revision of the Financial Plan and the setting of a new works completion deadline. In February 2017, addendum No. 3 was agreed, defining the above points and establishing the deadline for completion of works as September 30, 2018 and the initiation of the management phase as October 1, 2018.
Avio Plant - (Colleferro, Italy) - acquired in August 2015 from the client Avio S.p.A.. The project involves the design and construction of the Vega and Ariane 6 carbon fiber modules production plant extension. The extension comprises a new industrial building of approx. 10,000 sq.m alongside the existing prototype building. The project covers the design, procurement and construction, testing and launch of all production infrastructure, excluding only the operating and test machinery to be acquired and installed by the Operator. The construction is broken down into 3 functionally autonomous Packages. The executive design has substantially being completed, while construction of the first package has substantially been completed; the Package 2 (Bunker RX) and Package 3 (metal fabrication and structuring) works have respectively been 47% and 27% completed, in line with the work schedule. Conclusion of works is scheduled for the middle of 2017.
REAL ESTATE INITIATIVES:
Initiatives and discussions are ongoing for the “Cinque Cerchi” project with the other Partners for re-structuring involvement in the real estate development project with CDP Immobiliare. The commercialization of the first lot comprising approx. 25% of the entire initiative however continues. With regards to the “Campus Firenze” project, a project financing scheme by the University of Florence undertaken by the subsidiary Birillo 2007 Scarl, it was necessary, in accordance with the agreement, to initiate in August 2011 an arbitration procedure to rebalance the financial terms of the initiative. In October 2013 the Arbitration Board judged in favor of the Licensee, granting an amount to rebalance the financial terms of the initiative. Against this arbitration award, a challenge was initiated against the University of Florence for non-compliance with the judgment terms. In 2016, the parties initiated discussions, which on the one hand sought to reach an amicable settlement of the disputed matters and on the other set out solutions to complete the initiative. In the second half of the year, following agreement between the parties, construction of the project commenced.

Directors’ Report
36
7. Group balance sheet and financial position
The Maire Tecnimont Group key balance sheet highlights at December 31, 2016 and December 31, 2015 were as follows:
Maire Tecnimont Condensed Consolidated Balance Sheet
December 31, 2016 December 31, 2015
Change
(in Eur o thousands)
Non-current assets 532,753 543,142 (10,390)
Inventories/Advances to Suppliers 362,720 161,655
201,065
Construction contracts 879,639 504,506
375,133
Trade receivables 526,402 393,094
133,308
Cash and cash equivalents 497,138 362,385
134,753
Other current assets 250,747 201,292
49,455
Current assets 2,516,646 1,622,932
893,715
Assets held for sale, net of eliminations 0 0
0
Total Assets 3,049,399 2,166,074
883,325
Group shareholders’ equity 169,577 124,871
44,707
Minorities Shareholders' Equity 15,079 1,328
13,751
Financial debt - non-current portion 306,559 346,001
(39,442)
Other non-current financial liabilities 75,117 73,113
2,004
Other non-current liabilities 160,173 113,679
46,494
Non-current liabilities 541,849 532,793
9,056
Short-term debt 143,205 75,606
67,599
Other financia l liab ilities 330 330
0
Client advance payments 299,233 259,373
39,860
Construction contracts 555,028 344,969
210,059
Trade payables 1,150,157 726,779
423,379
Other current liabilities 174,940 100,025
74,915
Current liabilities 2,322,894 1,507,082
815,812
Liabilities he ld fo r sale, net of eliminations 0 0
0
Total Shareholders’ Equity and Liabilities 3,049,3 99 2,166,074
883,325
“Non-current assets” reduced on the previous year, principally due to the reduction in deferred tax assets following their usage, amortization and depreciation in the year and the reduction in withholding guarantees to clients for the successful completion of works in progress.
“Current assets” increased on the previous year, by Euro 893,715 thousand and whose main changes were as illustrated below.
Inventories/Advances to Suppliers, amounting to Euro 362,720 thousand, principally refer to the advances paid to foreign and Italian suppliers and sub-contractors against materials

37
shipped for the construction of plant and work in progress. The increase in the payments on account to suppliers is a direct consequence of the advancement of the projects acquired in the previous year and for which significant numbers of principal equipment orders were made and in addition increased materials held in warehouses for shipment.
Contract work-in-progress classified under assets (construction contract assets) reflects the net positive amount, by individual order, between the advancement of works and the relative invoicing on account and the contractual risks provision. The increase of Euro 375,133 thousand is principally due to the much greater volume of works executed during the year.
Trade receivables at December 31, 2016 amount to Euro 526,402 thousand, an increase of Euro 133,308 thousand compared to December 31, 2015. The increase in trade receivables is mainly due to the greater volume of works executed during the year, as well as the contractual terms of the main projects; a further increase in invoicing is expected in the coming months. Cash and cash equivalents at December 31, 2016 amount to Euro 497,138 thousand, an increase of Euro 134,753 thousand compared to December 31, 2015.
Operating cash flow amounts to Euro 163,187 thousand, which in addition to the result for the year was positively impacted by changes in working capital.
Investing activities absorbed cash for Euro 20,568 thousand, mainly due to the costs incurred for the installation of software and other applications, license development and new technologies - patents of Stamicarbon B.V and the Maire Tecnimont Innovation Center (MTIC), capex and the investment in Siluria Technologies for Euro 8,973 thousand.
Financing activities also absorbed cash for Euro 7,867 thousand, principally due to interest expense paid in the year, advance repayment of invoices related to the working capital management of specific contracts and the reduction of bank overdrafts and also following the payment of the dividend approved by the Ordinary Shareholders’ Meeting of April 27, 2016 of Euro 14,360 thousand.
The key cash flow statement movements are outlined in the following table:
Cash Flow Statement December 31, 2016
December 31, 2015
Change
(in Euro thousands)
Cash and cash equivalents at beginning of year (A) 362,385 160,242 202,143
Cash flow generated by operating activities (B) 163,187 289,833 (126,647)
Cash flow absorbed by investing activities (C) (20,568) (7,350) (13,219)
Cash flow absorbed by financing activities (D) (7,867) (80,342) 72,475
Increase/(Decrease) in cash and cash equivalents (B+C+D )
134,753 202,143 (67,390)
Cash and cash equivalents at end of year (A+B+C+D)
497,138 362,385 134,753
of which: Cash and cash equivalents of Discontinued Operations 0 0 0
Cash and cash equivalents at end of year reported in financial statements
497,138 362,385 134,753

Directors’ Report
38
The Net Financial Position is outlined in the following table:
NET FINANCIAL POSITION December 31, 2016
December 31, 2015 Change
(in Eur o thousands)
Short-term debt 143,205 75,606 67,599
Other current financial liabilities 330 330 0
Financial instruments - Current derivatives 54,540 10,610 43,931
Financial debt - non-current portion 306,559 346,001 (39,442)
Financial instruments - Non-current derivatives 4,045 3,789 256
Other non-current financial liabilities 75,117 73,113 2,004
Total debt 583,796 509,448 74,348
Cash and cash equivalents (497,138) (362,385) (134,753)
Temporary cash investments 0 (3,405) 3,405
Other current financial assets (7,373) (5,005) (2,369)
Financial instruments - Current derivatives (21,315) (854) (20,461)
Financial instruments - Non-current derivatives (9,059) (1,610) (7,449)
Other non-current financial assets (6,065) (10,598) 4,533
Total cash and cash equivalents (540,950) (383,856) (157,095)
Other financia l liab ilities of discontinued operations 0 0 0
Other financia l assets of discontinued operations 0 0 0
Net financial position 42,846 125,592 (82,747)
As the Net Financ ial Position is not governed by the Group’s accounting standards, the Group calculation c riteria may not be uniform
with those adopted by other groups and, therefore, may not be comparable.
The Net Financial Position at December 31, 2016 was a debt position of Euro 42.8 million, decreasing by Euro 82.7 million compared to December 31, 2015 (debt of Euro 125.6 million). The improvement is mainly due to the increase in liquidity held, thanks to the operating cash flow generated in the year, offset in part by the increase in short-term debt for the management of working capital on some projects and the significant decrease of Euro 16.2 million in the mark-to-market of the derivative instruments to hedge the currency risk on the cash flows of revenues and costs on projects, principally following the strengthening of the Dollar against the Euro compared to December 31, 2015. Financial payables net of the current portion amount to Euro 306,559 thousand, a decrease of Euro 39,442 thousand compared to December 31, 2015 following the reclassification to short-term of a portion of the Euro 350 million loan of the subsidiary Tecnimont S.p.A., subject to the financial reorganization concluded on December 28, 2015. The residual debt - non-current portion of Euro 9,946 thousand refers to the loan received by Tecnimont during the year from Credito Valtellinese.
Short-term debt amounts to Euro 143,205 thousand, an increase of Euro 67,599 thousand compared to December 31, 2015, following the above-mentioned reclassification from medium/long term of a portion of the Euro 350 million loan and for the utilization of short-term lines for working capital management on some projects.
Other non-current financial liabilities include the financial component of the equity-linked bond, net of accessory charges; the equity component of the instrument was classified to “other reserves” of shareholders’ equity; for further details, reference should be made to the relevant section of this note. At December 31, 2016, no overdue debt positions are highlighted.

39
At December 31, 2016 there are no financial payable positions overdue to report.
Group Shareholders' equity December 31, 2016 amounts to Euro 169,577 thousand, an increase of Euro 44,707 thousand compared to December 31, 2015 (increase of Euro 124,871). Total consolidated Shareholders’ Equity, considering minority interests, at December 31, 2016 amounts to Euro 184,656 thousand, an increase of Euro 58,457 thousand compared to December 31, 2015. This increase is also due to the change in minority interest equity including the result for the year; this result takes into account the positive effects of the final settlement on a project in partnership with minority shareholders.
The overall change in Group Shareholders’ Equity is mainly due to the result for the year together with the negative change in the Cash Flow Hedge reserve of the derivative instruments for Euro 13,472; this change as previously illustrated mainly relates to the mark-to-market losses of the derivative instruments to hedge the currency risk of the revenues and costs from the projects, net of the relative tax effect. Group Shareholders’ Equity decreased due to the payment of the dividend approved by the Ordinary Shareholders’ Meeting of April 27, 2016 of Euro 14,360 thousand.
Client advance payments at December 31, 2016 totaled Euro 299,233 thousand, increasing Euro 39,860 thousand on December 31, 2015. They concern contractual advances from clients on the signing of construction contracts. The increase principally refers to advances on the Socar Polymer LLC, ORPIC Plastic LLC, Lotos and EuroChem projects, partially offset by the reabsorption, through invoicing on account, of advances received in previous years.
Contract work-in-progress classified as liabilities (construction contract liabilities) reflects the net negative amount, by individual order, between the advancement of works and the relative invoicing on account and the contractual risks provision. The increase in the net value of construction contract liabilities, amounting to Euro 210,059 thousand, relates to the advancement of the projects and their contractual terms, against which the value of works carried out in the year was lower than the invoicing on account despite a substantial increase in production volumes in the year.
Trade payables at December 31, 2016 amount to Euro 1,150,157 thousand, an increase of Euro 423,380 thousand compared to December 31, 2015. This increase relates to the development of new projects entering into a phase of intense production and the increase in production volumes. In fact, materials and services acquired rose significantly as for the main orders acquired last year procurement has been completed and the delivery of materials is ongoing.
In 2016, payment requests relating to ordinary administrative management were received and at December 2016 there were no trade payables overdue beyond normal trade terms.
At December 31, 2016, there were no tax or social security payables overdue.

Directors’ Report
40
The Net Financial Position of the Parent Company Maire Tecnimont S.p.A. is presented below:
NET FINANCIAL POSITION (MET spa .) December 31, 2016
December 31, 2015
(in Eur o thousands)
Change
Short-term debt 4,702 7,485
(2,783)
Financia l debt - non-current portion 0 2,929
(2,929)
Financia l instruments - Current derivatives 0 0
0
Other non-current liab ilities - Bond Equity Linked 75,117 73,113
2,004
Other non-current financia l liabilities 344,646 321,979
22,667
Total debt 424,465 405,505
18,960
Cash and cash equivalents (298) (303)
5
Financia l instruments - Current derivatives (1,150) 0
(1,150)
Other non-current financia l assets (45,361) (34,054)
(11,307)
Total cash and cash equivalents (46,808) (34,357)
(12,451)
Net financia l position 377,657 371,148
6,509
As the Net Financ ial Position is not governed by the Group’s accounting standards, the Group calculation c riteria may not be uniform
with those adopted by other groups and, therefore, may not be comparable.
The Net Financial Position at December 31, 2016 was a debt position of Euro 377.7 million, increasing Euro 6.5 million on December 31, 2015 (debt of Euro 371.1 million).
Short-term debt amounts to Euro 4,702 thousand, reducing on December 31, 2015, principally as a combined effect of the settlement of bank loans and following the medium/long-term reclassification of a certain portion of old loans; the residual amount of financial debt relates to the Intesa San Paolo loans not subject to the 2015 financial re-organization and being repaid according to their natural maturity.
Other non-current financial liabilities include the financial component of the equity-linked bond, net of accessory charges; the equity component of the instrument was classified to “other reserves” of shareholders’ equity; for further details, reference should be made to the relevant section of this note. Derivative financial instruments for Euro 1,150 thousand relates to the positive fair value of two derivative instrument (TRES); in fact in February 2016, Maire Tecnimont S.p.A. subscribed to a cash-settled Total Return Equity Swap (TRES) contract to hedge against movements in the Maire Tecnimont share price, in view of the implementation of a buy-back program for a maximum 10,000,000 shares, approved by the Ordinary Shareholders’ Meeting of December 15, 2015, as illustrated in the 2015 Annual Report. The contract was underwritten with a financial intermediary and currently there is no obligation for Maire Tecnimont to acquire the treasury shares, but only the obligation for settlement between the parties of the differential between the exercise price and the Maire Tecnimont share price on the maturity of the instrument. The instrument matures in May 2019, but provides for annual intermediary windows (April - May 2017 & April - May 2018) in which Maire Tecnimont may exercise a partial “Early Termination” option. Maire Tecnimont in addition to an initial fee, must recognize a financial expense (interest rate expense) over the duration of the contract for the capital invested by the intermediary to implement the share purchase program on maturity. The TRES is not considered a hedge instrument for hedge accounting purposes and therefore is measured in accordance with IAS 39 as a fair value derivative through P&L. In October 2016, Maire Tecnimont S.p.A. subscribed to a further derivative contract (TRES) to

41
hedge against movements in the Maire Tecnimont share price, in view of an increase in the number of shares to be purchased on the market for a total amount of 4,500,000 treasury shares. The contract is substantially similar to the previous contract signed although there are no optional annual intermediary windows and therefore the final maturity is May 2019.
Other non-current financial liabilities total Euro 344,646 thousand and concern payables to subsidiaries for inter-company loans, principally Tecnimont S.p.A; other non-current financial assets totaled Euro 45,361 thousand and concern receivables from subsidiaries for inter-company loans, principally Tecnimont Civil Construction S.p.A..
RELATED PARTY TRANSACTIONS
All related party transactions have been conducted at market conditions. The company’s receivables/payables (including financial) and cost/revenue transactions with related parties for the period are presented in the tables below. The tables also show the balances resulting from transactions in the preceding year and those in progress:
31/12/2016 (in Euro thousands)
Trade Receivables
Trade Payables
Financial Receivables
Financial payables Costs Revenues
G.L.V. Capital S.p.A 0 (190) 0 0 (426) 0
Elfa Investimenti S.r.l 0 (74) 0 0 (257) 0
Total 0 (264) 0 0 (683) 0
In particular, payable contracts refer to the lease of office buildings from Group companies, the use of the “Maire” trademark and other minor recharges from the parent G.L.V. Capital S.p.A. and from transactions with Elfa Investimenti S.r.l., a company owned by the majority shareholder of Maire Tecnimont S.p.A., for the lease of office buildings and the lease of premises within the research center concerning the collaboration with La Sapienza University.
Transactions with other non-consolidated and/or associated Group companies are purely commercial and relate to specific activities linked to contracts; in addition, certain consortiums, having substantially concluded operations, are in liquidation:
31/12/2016 (in Euro thousands)
Trade Receivables
Trade Payables
Financial Receivables
Financial payables Costs Revenues
MCM Servizi Roma S.c.a.r.l. 0 (95) 70 0 (35) 0
Studio Geotecnico Italiano 0 (428) 0 0 (1,696) 0
Villaggio Olimpico MOI S.c.a.r.l. in liquidation 0 (4) 69 0 0 0
Ravizza S.c.a.r.l in liqu idation 2 (0) 0 0 0 0
Parco Grande S.c.a.r.l. in liquidation 34 0 0 0 0 0
Program International Consulting Engineers S.r.l in liquidation 461 0 0 0 0 20
Desimont Contracting 1,666 0 0 (371) 0 557
Biolevano S.r.l 6,650 0 0 0 0 3,543
Processi Innovativi S.r.l 63 (123) 0 0 (208) 85
BIO P S.r.l 0 0 0 0 (25) 0
Tecnimont Bolivia S.r.l. 0 0 0 (129) 0 0
Total 8,877 (650) 139 (499) (1,965) 4,205

Directors’ Report
42
The remuneration of Directors and Statutory Auditors and Key Management Personnel, as required by IAS 24, appears in the 2016 Corporate Governance and Ownership Structure Report and the 2016 Remuneration Report, both available on the company website at www.mairetecnimont.it, in the “Governance” section.
8. Human Resources
The headcount at December 31, 2016 of the Maire Tecnimont Group was 4,956, compared to 4,596 at December 2015, with a net increase of 360. This increase, attributable to the Group Human Resource policy based on the achievement of the objectives and business needs and increased business volumes, is the net difference between 911 hires and 550 departures in the year.
The increase in the year was mainly in Italy - rising from 1,994 to 2,204 employees - and Asia, with an increase of 112 employees, mainly in the United Arab Emirates in support of the activities related to the Adco and Adgas projects, in addition to Russia for the start-up of the Eurochem and Coru projects, the development of the partnership agreements to consolidate the Group`s presence in the region and, finally, the upscaling of the Moscow office to serve the entire Russia & Commonwealth of Independent States Region. With reference to the regions outlined above, it should be noted that Tecnimont Private Ltd, the Indian subsidiary, is once again the principal pool for the recruitment of resources with technical skills.
On the other hand, the reductions of the headcount in Kuwait (209 employees) and Saudi Arabia (49 employees) are attributable, respectively, to the progressive completion of the AGRP Project and, within the Sadara Project, the significant scaling down of direct personnel in the activities related to the start-up of the plant.
Graduates at the Maire Tecnimont Group at December 31, 2016 accounted for 66% of the workforce; the average age was approx. 41.
In terms of gender breakdown, females (further increasing on the previous year) represent 14% of managers and 19% of the total workforce.
The workforce at 31/12/2016 of the Maire Tecnimont Group, with movements on 31/12/2015 (and the average workforce for the year) are outlined in the following tables:
Change in workforce by qualification (31/12/2015-31/12/2016):
Category Workforce
31/12/2015 Hires Departures
Reclassification employee
category (*)
Workforce 31/12/2016
∆ Workforce 31/12/2016
vs. 31/12/2015
Executives 483 48 (31) 33 533 50
Managers 1,575 230 (111) 50 1,744 169
White-collar 2,217 616 (169) (84) 2,580 363
Blue-colla r 321 17 (239) 0 99 (222)
Total 4,596 911 (550) 0 4,956 360
Average headcount
4,365 4,854
(*) inc ludes promotions, changes in category following inter-company transfers / Job Title reclassif ications
The category “Executives” and “Managers” does not reflect the Italian contractual term, but refers to national and international
Management and Middle Management identification parameters utilized for Italian and overseas managerial staff.

43
Changes in workforce by region (31/12/2015-31/12/2016):
Region Workforce
31/12/2015 Hires Departures
Reclassification employee
category (*)
Workforce 31/12/2016
∆ Workforce
31/12/2016 vs.
31/12/2015
Italy 1,994 330 (120) 0 2,204 210
Rest of Europe 238 49 (44) 9 252 14
Asia 2,336 501 (379) (9) 2,448 112
The Americ as 18 5 (4) 19 1
Afric a 10 26 (3) 0 33 23
Tota l 4,596 911 (550) 0 4,956 360
Maire Tecnimont Group Average headcount
2015 Average headcount
2016 Change
Engineering 2,215 2,520 305
Operations 967 1,001 34
Remainder Technical Area 409 509 100
Commerc ial A rea 137 143 6
Staff Area 637 681 44
Tota l by professional category 4,365 4,854 489
- Italy 1,939 2,174 235
- Rest of Europe 246 240 (6)
- Asia 2,158 2,400 242
- The Americas 15 19 4
- Africa 7 21 14
Tota l by region 4,365 4,854 489
of which:
Italian open-ended 1,895 2,090 195
Italian fixed term 44 84 40
Tota l 1,939 2,174 235
Maire Tecnimont Group Average headcount 2015 Average headcount 2016 Change
Maire Tecnimont S.p.A. 97 108 11
Met NewEn S.p.A. 5 15 10
MET T&S Limited (*) 16 34 18
Stamicarbon (*) 144 155 11
KT (*) 379 427 48
KT Arabia LLC 4 4 0
Processi Innovativi 12 11 (1)
Tecnimont S.p.A. (*) 1,490 1,716 226
Tecnimont HQC BHD 0 4 4
Tecnimont Russia 15 58 43
MST S.r.l. 81 83 2
Tecnimont Arab ia 84 54 (30)

Directors’ Report
44
Maire Tecnimont Group Average headcount 2015 Average headcount 2016 Change
Tecnimont Private Limited (*) 1,768 1,966 198
Tecnimont Chile 2 3 1
TPI 41 41 (0)
Tecnimont Usa Inc . 1 1 0
TWS 53 18 (35)
Tecnimont do Brasil-Contruçao de projetos LTDA 12 11 (1)
Tecnimont C ivil Const ruction 100 93 (7)
Cefalù 20 61 56 (6)
Total 4,365 4,854 489
(*) Fi gure also i ncludes Branches and representative offices.
9. Training, Incentives, Organization and Security
PERSONNEL TRAINING AND DEVELOPMENT
In continuity with previous years, again in 2016 institutional, technical-specialist and Quality, Health & Safety, Environment training was provided, in support of change processes and to facilitate the professional growth of employees.
In terms of institutional training, in addition to the ongoing Project Management initiatives, in terms of Contract Management a new course was provided (197 participants for 3,349 hours) to further educate and assign duties to key project roles for contract drafting and management, encouraging at the same time the establishment of an internal Contract Management culture based on international standards, in addition to the development of conduct and best practices which effectively support interface management with effects on contracts. During the year, the Project Management skill certification policy continued according to the IPMA method, focusing on key project roles, with the obtaining of 35 Level C and D Certifications and the renewal of other certifications.
Finally, financial and Internal Audit courses were organized, for a total of approx. 4,000 hours and the Leadership Soft Skills, Team Building, Communication and Time Management training programs were again held.
Technical-specialist training, for a total of 19,203 hours and focusing on the enhancement of technical-professional know-how, was provided through participation in courses and internal and external conferences.
Targeted training for Young new hire apprentices was provided through involvement in courses held by the regional entities involved in the issues of Employment Law, Communication, Company Organization and Quality and Security. In order to promote understanding of the corporate environment and the business of the Maire Tecnimont Group, in addition to general and inter-cultural engagement among employees, the Young Graduates took part in an induction course involving 3,030 hours of training.
In 2016, numerous initiatives (2,431 participations for a total of 8,698 hours) were organized regarding the Quality, Health and Safety culture and Information & Communication Technology (ICT), in addition to new company processes. A total of 7,511 hours of training was provided on the use of applications for the implementation of an integrated Group project control model, for order tracing reporting (PROMETEO and BISR) and for the management and qualification of suppliers and online negotiations (E2Y).
Through collaboration with consultants for the presentation and reporting on training courses, numerous funding requests were made during the year to the main sector inter-professional

45
funds, regarding the Contract Management, Economics & Finance initiatives and, more generally, specialist training.
The Empowerment to PM Project also continued in 2016, involving training courses for Project Directors and Project Managers of the company Tecnimont, focused on areas of improvement in terms of technical and conduct skills - recognized as fundamental for project success. After identifying priority areas, skills enhancement and extension programs were drawn up for an improved and more complete management of the role through the identification of concrete action plans to contribute to improved management of complex projects, also from a communications viewpoint.
The collaboration with the “Polytechnic of Milan” was again undertaken, involving a preferential relationship with the university and participation in initiatives and events to promote the company brand and image.
Finally, in support of promoting the Group’s value model, the previously launched “Employee Performance Commitment” human resources assessment process, based on an assessment of conduct, technical skills and individual results, was extended to all employees of the companies Maire Tecnimont and Tecnimont, in addition to KT – Kinetics Technology. Its promotion among the Group internationally was also continued.
COMPENSATION AND INCENTIVES
The Maire Tecnimont compensation and incentive policy again in the year centered on the following pillars:
- increased focus of management on the achievement of the approved Industrial Plan objectives;
- improving the strategic personnel retention capacity, increasing their commitment and loyalty to common objectives;
- bringing the company’s Remuneration Policies in line with best practice in terms of balancing the fixed and variable remuneration components;
- guaranteeing full application of the recommendations of Article 6 of the Self-Governance Code for Listed Companies.
Furthermore, the conclusion of a number of incentive plans which facilitated the company’s turnaround and stabilized managerial roles in order to achieve the strategic objectives was seen as an opportunity to reflect on new Top Management incentive instruments to be deployed in support of the new development phase initiated, while recognizing at the same time the professional skills and contribution of each to the Group’s success. In this regard a new Compensation Policy cycle for the 2016-2018 three-year period was drawn up with a focus on growth, development and creation of value over the long-term, while establishing even greater consistency between the work of the human resources department and the interests of shareholders and stakeholders.
In addition to the above initiatives, in order to establish a more extensive and innovative reward policy for Group Personnel, the innovative 2016-2018 General Share Plan was set up for all employees to encourage involvement in growing value and pursuing corporate objectives, in support of the Group’s development, also through reinforcing motivation and a sense of belonging and loyalty over the long-term. This plan involves the allocation to employees in general of Maire Tecnimont shares on the basis of the achievement of a consolidated industrial objective. The Plan objectives are based on the need to identify a new lever to strengthen the employer brand, promote the commitment and motivation of employees towards company value growth, in addition to long-term retention. The above-mentioned Shareholder Plan includes a Rights Granting Cycle for each year (2016-2017-2018) and the possibility, for all employees, to receive Maire Tecnimont shares without consideration on the basis of the overall profitability of the Group. The First Cycle (2016) saw almost total uptake, with more than 96% of the 4,270 employees internationally signing up to the plan.

Directors’ Report
46
In completion of employee rewards, in 2016 the Group launched also a Flexible Benefits Plan called “MAIRE4YOU”, matching the most innovative compensation policies generally. The Plan is available at most Italian entities and concerns the recognition to beneficiaries of a personal flexible benefits fund which may be utilized for a vast range of services, such as the repayment of medical and educational expenses, interest on mortgages, access to goods and services or the funding of a supplementary pension and, finally, vouchers. This new incentive system permits beneficiary employees to access their flexible benefits fund through a dedicated platform which enables the building of a package of goods and services which satisfies personal and household needs, while at the same time optimizing spending capacity thanks to tax and contribution advantages available under Italian law. The “MAIRE4YOU” Plan, agreed with the Trade Unions, is yet another confirmation of the Group’s willingness to reward personnel, considered as fundamental to its success and the building a common approach for the achievement of company objectives.
This new 2016-2018 Compensation Policy, detailed in the 2016 Remuneration Report approved by the Board of Directors on March 16, 2016 and the Shareholders’ Meeting of April 27, 2016, introduces in addition the 2016-2018 Performance Share Plan dedicated to approx. 30 Executives. Specifically, this Plan, which seeks to fully align the interest of management with shareholders and support the retention of key personnel over the long-term, involves the granting of rights to Maire Tecnimont shares without consideration in the three-year period 2016-2018 and their effective granting based on pre-set industrial performance objectives, to be assessed annually and at the end of the period.
Far-reaching activities in FY 2016, in addition to the above-stated setting up of new incentive, retention and engagement instruments for key personnel in furtherance of company objectives, were completed by the monitoring and management of existing systems, the Management by Objectives - MBO - and the 2015-2017 Phantom Stock Plan dedicated to the Chief Executive Officer and Group Senior Managers.
During the year, the parent company in addition drew up for the Group companies Remuneration Policy Guidelines for the recognition of talent and performances and the alignment of remuneration levels to market competitiveness criteria and for internal pay equity among roles. The assignment of objectives process, also for Executives and strategic personnel, was also completed during the year.
We highlight the issue to beneficiary employees of the 2015 Attendance bonus.
SYSTEM ORGANIZATION AND QUALITY
In terms of further strengthening the management and co-ordination of the parent company, we indicate the creation of the Corporate Strategy Department in support of the strategic planning at Group level of the Chief Executive Officer, and the development of the Group Finance structure and the units responsible for financial activities, the setting up of new departments - Special Transactions, Derivatives, Guarantees and Financial Planning & Reporting - in addition to the integration of special skill sets to guarantee an even better response to operational developments and company initiatives.
The “Credit Management” and the Procurement & Sub-Contract Legal Support Function teams were in addition set up to respectively support the coordinated management of receivables for the orders and projects, with the latter involved in drawing up and negotiating contracts. We in addition highlight the establishment of the Group Special Initiatives and Regions Coordination Department to support and enhance consistency between Group guidelines and the local content strategies implemented by the Operating Companies in terms of industrial stakeholder relations.
The management and co-ordination of the parent company was further improved by the setting up of the Group Project Control Processes and Systems Function, which supports increasing integration and harmonization of such methodologies and operating practices within
47
the Group and guarantees the consistent adequacy of the systems to processes, through close co-ordination with the Group Organization, ICT & System Quality Function.
Presence in the Group’s areas of strategic interest was also extended, with the setting up of the North Africa Region and further development of oversight in Iran with the creation of an ad hoc task force.
In terms of the Operating Companies and specifically the subsidiary Tecnimont, the Engineering & Projects area was overhauled and its Management reorganized, with the creation of a new function to guarantee a comprehensive service for the Technology departments. In addition, the Pipelines and Marine Works Functions were set up, managing the construction of pipes and marine works, in addition to the Revamping, Operations & Maintenance function dedicated to Revamping projects and related services for third party operations, maintenance and training. The structure which oversees specialized competences for the management of contracts was also developed, with the creation of the Contract & Claim Management Function to guarantee the necessary support from the initial project phases to the drawing up of the guidelines and management of communication with clients, in addition to any claims.
Finally, we highlight the integration within the commercial area of the Services Projects Estimating & Proposal Function for the drawing up of estimates and the proposal of offers for Services projects.
The collaboration for the updating of the Maire Tecnimont Organization, Management and Control Model as per Legislative Decree 231/2001 (“Model 231”), including the relative protocols, approved by the Board of Directors on March 16, 2016, was of particular significance.
With regards to the above-mentioned update, the Procedures optimization project according to an integrated Risk Based approach is highlighted, for complete alignment with the above Organization, Control and Management Model. New procedures were also issued for the operating companies to ensure, through the definition of activities, roles and responsibilities, better uniformity and optimization of processes and operations at Group level.
Also in terms of the review/updating of the document base, in terms of Group level operating processes and guidelines, the “Document management system” Standard was reviewed for greater uniformity and integration of processes and methodologies, while the new “IT System Data Security Policy” and the “IT usage regulation” standards were issued, with the former dedicated to improving the description of the policy, roles and general directives in support of IT security and the latter governing in detail the use of IT devices to ensure compliance with the Ethics Code and existing company processes.
In terms of project activities, we highlight:
- the launch of the Global HR Project involving numerous Functions, with a goal of defining a new completely integrated model for Group human resources, through the installation of a supporting IT platform. The initiative seeks to standardize the management of key Human Resources processes, further improving efficiency and efficacy and involves the design of the main HR processes for the Italian companies, based on feasibility studies for subsequent implementation at Group level; specific analyses for the development of attendance and transfer management processes were also conducted;
- the launch of the smart working project in collaboration with the Research Center of the same name at the Polytechnic of Milan, with a view to developing working processes and the management of human resources and the opportunity to introduce a new organizational model which combines the needs of the business and individuals, in order to create increased responsibility towards set objectives and providing an appropriate response to the need for a work/life balance. The company has wanted to directly involve employees in the project and the implementation of this new working philosophy, offering the possibility to identify and propose personal solutions based on greater flexibility and “personalization”, together with increasing empowerment towards results. An ideas course called "BE ADAPTIVE! - Think

Directors’ Report
48
Tank" was therefore launched, which in 2017 awarded the five best “smart working” proposals at the Milan headquarters of the main Group companies;
- as part of the “Prometeo Program” for the implementation of an integrated Group project control model with an ultimate goal of continually improving project management and monitoring processes across all Departments and companies, the solution design activities and the relative implementation and start-up of change management initiatives was also completed in support of the change process, involving communication and training activities for the personnel involved;
- the “Process review” activities dedicated to analyzing key processes and the identification of possible solutions for improvement.
SECURITY
In implementation of the general Group Security policies, the following were rolled out:
- support and direction of the various managerial and operating company functions in terms both of the general Corporate Governance system and the management of “critical” and/or potentially “critical” situations;
- monitoring of the socio-political-economic conditions in countries of interest for the Maire Tecnimont Group, reporting periodically to senior management and the heads of the companies involved and ensuring adequate security for management’s commercial and/or operative missions in at risk countries.
Information and support activities centered in particular on projects in Iran, Egypt, Saudi Arabia, the Maghreb Countries, the Middle East, Mexico, Russia and Malaysia, in addition to activities in Europe following the events in France, Belgium and Germany.
The Function provided, also for current offers, info/operational support for the appointed commercial functions and the relative task forces in the various countries, constantly monitoring security conditions where orders may be acquired in border areas or where projects in progress are expected to restart (the Il Cairo - KT Kinetics Technology S.p.A. - and Kima –Tecnimont S.p.A. refinery project).
For Mexican operations assistance involved, in addition to the monitoring of security conditions, surveys in the areas of interest to investigate and guarantee the best synergies for the protection of on-site personnel.
We highlight in addition the support, also in the proposal phase, for various ongoing projects in terms of the review of country risk conditions and the drafting of mitigating security measures, also in line with Client requirements.
At national level finally, the usual support to Italian projects continued, completing implementation of company processes for the organization and management of main offices/operating sites, with particular regard to the infrastructural projects in Sicily (Cefalù 20 Project) and Basilicata (Tempa Rossa Project), through contacts and/or meetings with the competent local institutions.
10. Industrial Relations
In continuity with previous years, Company Management has maintained ongoing and fruitful relations with the Trade Unions representing Maire Tecnimont Group workers and those of the main Italian companies.
In this regard, in conclusion of intense negotiations with the Trade Unions, on April 1, 2016 the Regional Trade Union Representatives and the Company Labor Organizations and management of the parent company and the subsidiary Tecnimont S.p.A. signed two

49
agreements respectively concerning the Attendance Bonus for the subsequent three-year period and the introduction of a new structured engagement and incentive policy for Executives and Managers.
In fact, following on from the 2016-2018 Maire Tecnimont Group General Share Plan, Management designed and drew up, in collaboration with the Maire Tecnimont and Tecnimont Trade Union Organizations, the new “MAIRE4YOU” Flexible Benefits Plan, to be extended to other Group companies.
On October 27, 2016, the management of Maire Tecnimont S.p.A. and Tecnimont S.p.A. and the relative company Trade Union Organizations in addition signed an agreement regarding a number of issues concerning working hours and the transfer of employees between the respective companies. On December 16, 2016, the Management and Trade Unions representing Executives of Maire Tecnimont S.p.A., Tecnimont S.p.A. and Tecnimont Civil Construction S.p.A. signed an agreement concerning attendance and vacations for Executives.
With regards to the subsidiary Tecnimont Civil Construction, in 2016 the usual meetings with the Trade Union Representatives continued, involving with regards to the Cefalu’ 20 Scarl consortium, meetings with the Trade Unions and subsequently procedural meetings which resulted in the signing of the Trade Union Agreement of September 20, 2016, with the consequent redundancy on December 20, 2016 of 31 employees, of which 1 effective January 2017.
11. IT Systems and General Services
In 2016, synergies between Information, Communication and Technology and General Services were fully consolidated, confirming the strong results previously achieved in terms of operating and control process and cost containment efficiencies. In addition to the monitoring and management of requirements for space, application programs and infrastructure related to growing Group operational volumes, activities relating to the launch of the Smart Working Project also took place which, in line with current global working trends, sought to introduce a flexible working model, leveraging also on the most advanced IT technologies available.
The company therefore began a series of activities focused on the virtualization - in terms of remote accessibility to work programs and data, from any device and with any operating system - for the collaborative management of information and to guarantee, through the setting up of technological infrastructure, consistent connectivity among the various offices. This initiative also included the updating of user devices and the gradual move towards portable computers and mobile telephones in order to ensure maximal and comprehensive support for mobility. We highlight also the space and layout optimization initiatives in support also of the new working modes.
The development of the central ERP system is certainly a part of this shift, with the adoption from July 2016 of the HANA (SAP-ECC On HANA) infrastructure to support the integration of all major business processes, enabling users to operate in a uniform environment independently of the application area. This infrastructure guarantees excellent processing and accessibility performances, also through mobile devices and enables in addition the use of the new “FIORI” framework which allows access from any device.
Business development support, as previously, focused on the adoption of innovative tools which increase performance efficiency and quality, in view of and on the basis of expected operational volume growth and with an ongoing focus on cost streamlining. The development and integration of the application platform therefore continued, also through adopting the best software available on the market, meeting the Group’s operating requirements and ensuring the correct management of Administration, Finance and Control and Engineering, Procurement and Project Control processes.

Directors’ Report
50
The scope of companies integrated into the central ERP system was also extended to two new Group companies (Tecnimont Russia and MET T&S) and four new branches, respectively in Oman, Malaysia, Azerbaijan and the Netherlands.
In September 2016, the migration and updating of the Capital Projects Document system concluded, utilizing the new hardware infrastructure and server previously utilized by the Marian system which improves engineering activity efficiency through reducing response time. This in addition guarantees optimal performance from remote offices for the management, through typical sector processes, of project and vendor documentation, integrated with the Primavera application for the assessment of related advancements with the availability of documentation.
12. Health, safety and environment
In 2016, the Group continued to monitor and oversee HSE (Health, Safety and Environment), viewed as a key element of corporate identity, while protection of the Environment and the health and safety of its employees and those involved in the various design and construction phases of works or plant have always been considered as key values.
The Group policies outline the principles, objectives, targets, roles and responsibilities, in addition to the management criteria required for the oversight of Health and Safety. These objectives are shared throughout the organization - beginning with Top Management - through the involvement of all personnel and roles.
The Group, through its main subsidiaries, has for some time and consistently implemented, maintained and strengthened its Workplace, Health and Safety and Environment Management System, setting up a flexible system which permits ongoing adaptation and full functionality within changeable and varied environments and activities within the areas of application, ensuring focus on specific needs while complying with the guidelines, monitoring and control applied across the entire organization and enabling the adoption for each project and at each Group site of prevention and protection methods and measures which limit as far as possible any anomalies or undesired events and particularly accidents.
This is also enabled the Group to guarantee over time and at all working environments compliance with applicable legislation, full satisfaction of client contractual clauses, while maintaining the organization’s development towards continuous improvement and for many years has held the OHSAS 18001:2007 certification (benchmark standard for workplace Health and Safety management systems) and the ISO 14001:2004 certification (benchmark standard for environmental management systems), in recognition of complete and correct oversight across its multinational operations.
In addition to the above-stated management systems, for the main subsidiaries we cite the SA standard 8000:2008 application and certification (benchmark standard for Social Accountability management systems) in terms of the Group’s focus upon its employees.
The Group achieves its objectives in this regard through:
• the involvement at all levels in the systemic identification of hazards and risk assessments;
• continual training and education at offices and sites;
• close and attentive selection of contractors, from whom communication commitments and guarantees upon Group Health, Safety and Environmental Policies were sought;
• a communication and education process upon HSE policies and principles;
• creation of incentive systems which reward both individuals and Groups of workers, contributing to ensuring or improving workplace safety and health;
• continuous and periodic updating of personnel in charge of HSE supervision;

51
Thanks to an ongoing and effective audit process to verify and confirm the proper functioning of the Management System and its capacity to support achievement of the HSE objectives, the Tecnimont Group can identify deviations and opportunities for improvement, strengthening and consolidating knowledge and skills and adopting the most adequate and efficient solutions for the ongoing improvement of the safety culture and the consolidation of accident indicator results.
The construction activity accident figures once again were highly satisfactory, in line with the trend established for some time and significantly ahead of sector averages.
The figures updated to December 31, 2016 for the main Group operating companies are reported below in terms of:
• LTIF: accident indicator reflecting interruption to work performed by the persons involved (Lost Time Injury Frequency);
• TRIR: “recordable” accident frequency index (Total Recordable Injury Rate).
The indices are calculated on an OSHA (Occupational Safety and Health Administration) and IOGP (International Association of Oil & Gas Producers) basis - the main international benchmarks - and compared with the international Oil & Gas sector average.
Maire Tecnimont Group*
Safety – 2016
(base 29.14 million s ite hours)
International comparison
IOGP
(base 1,000,000 hours)
K P I (**)
Total Projects OSHA
(base 200,000 hours)
Total Projects IOGP
(base 1,000,000 hours)
Oil & Gas Producers - 2015
Contractor figures (***)
LTIF (Accident indicator
reflecting interruption to work performed by the
persons involved)
0.020 0.103 0.16
TRIR (“Recordable” accident
frequency index) 0.199 0.995 1.05
(*) Safety Performance Indicators referring only to Construction Sites of Technology, Engineering & Construction Business Unit
(**) KPI - Key Performance Indicator (***) Source: International Association of Oil & Gas Producers - Report No 2015s, Jun 2016 - Safety Performance
Indicators 2015 - Contractors Engaged in Construction Activities
13. Innovation and Research & Development
Maire Tecnimont closely focuses upon research and development in order to develop and commercialize new technologies and intellectual property rights (patents).
Within the Group, the Maire Tecnimont Innovation Center leads and coordinates all related activities, particularly concentrating on the Group’s engineering hubs located in Italy, India, the Netherlands and Germany.

Directors’ Report
52
One of the objectives of the Maire Tecnimont Innovation Center is to support the creation of value through presenting a portfolio of Intellectual Property and Strategic Alliances, in addition to promoting a culture of innovation with the signing of short and long-term collaboration agreements with other companies, universities and Research Institutes.
In order to accelerate innovation and monitor progress, in 2010 the MTIC developed the Innovation Pipeline (IPL) method. Since then more than 100 project ideas have been converted into 42 families of patents and a range of projects in the commercialization phase.
Research and development projects are under execution in the following areas: Oil & Gas; Polymers; Urea and fertilizers; Hydrogen and Sulphur Recovery; Renewable Energies.
Maire Tecnimont is highly cognizant of the social and environmental trends which will impact the petrochemical and fertilizers industry in the near future. The Group believes that open innovation, co-creation and collaboration are the only effective means to tackle the global environmental and technological challenges.
The Group owns more than 90 families of patents registered in various countries for a total of more than 1,000 specific patents and patent applications.
The Group licenses its technologies principally through the subsidiary Stamicarbon.
The “Technology & Licensing” Group Division provides a wide range of patented technologies and relative engineering services. The Group has over 60 years’ experience in the development and licensing of urea technologies and over 40 years in the production of hydrogen and synthesis gas, gas treatment and sulphur recovery.
The license portfolio has been diversified both for plant construction and revamping projects and benefits from long-term relationships with major technology licensees in the Group’s operating fields.
The Group is also involved in the development of an innovative process for the removal of CO2 and other acid gas components from deposits, separating them from the natural gas, which is then supplied to the network. This new technology, developed together with the Polytechnic of Milan, will be an innovative solution compared to “traditional” CO2/H2S separation methods through alkanolamines, while economically competitive when a significant amount of acid components in the gas require treatment.
Activities with the Sapienza University of Rome on the basis of a strategic collaboration agreement for a high technological content new skills development hub continued. In particular, a number of priority areas for advanced projects were identified, including: the production of bio-polymers, the reusage of carbon dioxide as a base raw material for the production of chemicals (polymers, fine chemicals) and the research of new materials for industrial applications.
Group Research and Development focused also on continual innovation and improvement of engineering design standards and methodologies.
During the year, Tecnimont S.p.A. and Siluria Technologies also announced the signing of a co-operation agreement, based on which the two companies combined their respective technologies, know-how and experience for the commercialization of a new process to directly convert natural gas into chemical products and their derivatives. Siluria’s revolutionary catalysis and process technologies bring together nano-materials, catalytic development and chemical engineering, to convert natural gas into higher added value products through efficient processes which may be integrated into existing industrial infrastructure.

53
14. Risks and uncertainties
In this section the main risks and uncertainties concerning the Maire Tecnimont Group and its sectors are outlined. The factors considered by the company risk system regarding the foreseeable future are for this purpose analyzed.
The Maire Tecnimont Group’s core operations concern the design and construction of Engineering & Technology sector plant and the design and construction of major public works. In addition, the Group licenses patented technology and know-how for use by urea producers.
BACKLOG RISKS
The consolidated Backlog at December 31, 2016 was Euro 6,516 million. The timing of revenue and expected cash flows is subject to uncertainty as unforeseeable events may occur which impact Backlog Orders (such as for example the slowdown of works, the delayed start-up of works or indeed the interruption of works or other events). The Group mitigates this risk through termination/cancellation clauses which ensure adequate reimbursement on the occurrence of such events.
BACKLOG CONCENTRATION RISKS AND DEPENDENCE ON A CURTAILED NUMBER OF
MAJOR CONTRACT OR CLIENTS
At December 31, 2016, approx. 79% of Group consolidated revenues related to 16 major contracts, corresponding at the same date to approx. 58% of the Backlog value. Any interruptions or cancellations to even one of the major contracts, subject to applicable legal and contractual remedies, may impact on the Group’s results and balance sheet. In addition, the Group works with a contained number of clients. At December 31, 2016, consolidated revenues from the 10 leading clients constituted 73% of total consolidated revenues. One of the key operational guidelines concerns the greater distribution of initiatives among more clients and thereafter the opening up to new markets and clients.
RISKS RELATED TO GROUP SECTOR INVESTMENT AND THE FINANCIAL CRISIS.
Group markets are cyclical, principally dependent on available investment, which in turn is impacted by: (i) economic growth and (ii) a significant number of economic-financial (e.g. interest rates and the price of oil) and political-social (economic, public spending and infrastructure policies) variables. Therefore, general recessions may impact the Group’s results and balance sheet. The continuation or deterioration of the current global financial crisis may impact the Group results and balance sheet. Regional and business line diversification assists the mitigation of this risk.
RISKS RELATED TO JOINT LIABILITY TO CLIENTS
Group companies execute orders independently or together with other operators through the incorporation (for example) of consortiums in Italy or joint control arrangements overseas. In this latter case, each party under applicable public regulations or general contractual practice are usually jointly liable to the client for the design and construction of the entire works. In the case of damage suffered by a client caused by an associated operator, the Group company involved may be called to replace the damage-causing party and fully compensate the damage caused to the client, subject to the right of regress against the non-compliant associated operator. The right to regress among associated operators is normally governed among the partners through contracts (usually called cross indemnity agreements). Company policy is to conclude agreements/associations with operators of proven sector experience and appropriately verified available capital. This policy has ensured that the assumption of partner obligations by a Group company has not yet been requested as a result of non-fulfilment.

Directors’ Report
54
RISKS CONCERNING LIABILITY TO THE CLIENT FOR NON-FULFILMENT OR DAMAGE
CAUSED BY SUB-CONTRACTORS OR SUPPLIERS
In executing operations the Group relies on third parties (including sub-contractors) to produce, supply and assemble part of the plant constructed, in addition to suppliers of raw materials, semi-finished products, sub-systems, components and services. The Group’s capacity to discharge its obligations to clients is however reliant also on the fulfilment of contractual obligations by sub-contractors and suppliers. In the case of Group sub-contractor or supplier non-fulfilment (even partially), the provision of products and/or services not in line with that agreed or falling short of the required quality or with defects, the Group may incur additional costs due to delays or the need to deliver replacement services or procure equipment or materials at a higher price. In addition, the Group may in turn not fulfil that agreed with the client and be subject to compensation claims, subject to the Group’s right to regress from non-compliant sub-contractors and suppliers. However, where the Group is unable to reclaim the entire compensation paid from such parties through its right to regress, the Group results and balance sheet may be impacted. The Group system for the assessment and selection of suppliers, identified on the basis of price, in addition to their technical abilities and capital structure, requires the request and provision of bank performance guarantees from such parties. Group companies are also covered by appropriate insurance policies to meet any particular difficulties.
RISKS RELATED TO INTERNATIONAL OPERATIONS
The Group is engaged in approx. 30 countries and is therefore exposed to a range of risks, including any restrictions on international trade, market instability, foreign investment restrictions, infrastructural deficiencies, currency movements, currency limitations and controls, regulatory changes, natural catastrophes (e.g. earthquakes and extreme weather events) or other extraordinary events (e.g. wars and acts of terrorism, major raw material or semi-finished product or energy supply interruptions, fires, sabotage, attacks or kidnappings). The Group in addition is subject to the risk of greater operational difficulties in regions featuring high levels of corruption, distance from the markets and the traditional workforce and material procurement sources, and which often are politically and socially difficult and unstable (e.g. the Middle East, Iran, Russian Federation, Latin America and Nigeria). In order to mitigate this risk, appropriate insurance and/or coverage for the type of risks at issue to mitigate financial impacts from such instability may be undertaken.
RISKS RELATING TO ERRONEOUS ORDER EXECUTION COST ESTIMATES
Almost all of Group consolidated revenues concern long-term contracts, whose settlement (in favor of the Group) is established at the date of the tender or the awarding of contract, particularly for lump sum - turn key contracts. For such contracts, the margins originally estimated by the Group may reduce due to higher costs incurred by the Group during order execution. Where the Group’s policies and procedures to identify, monitor and manage costs for order execution do not reflect the duration and complexity of such orders, or are no longer accurate following the occurrence of unforeseeable events, the Group’s results and balance sheet may be impacted. However, during offer preparation the Group closely analyses the risks pertaining to each order, particularly focusing on the provisioning of contingencies in coverage of such risks.

55
15. Financial risk management
The Group’s principal financial risks stemming from core operations are outlined below:
MARKET RISK
The Group operates within an international environment and is subject to interest rate, exchange rate and price risk. A risk of fluctuating cash flows from core operations therefore follows, which may only partly be mitigated through appropriate policies.
PRICE AND CASH FLOW RISK
Group results may be impacted by raw material, finished product and insurance cost price changes. This risk is mitigated through a precise and timely procurement policy. Maire Tecnimont also seeks to minimize transaction currency risk through derivative contracts.
CURRENCY RISK
The currency used for the consolidated financial statements is the Euro. As stated, the Group operates in an international environment, with part of its receipts and payments made in currencies other than the Euro. A significant amount of projects are quoted in or linked to the US Dollar or Russian Ruble; this factor, together with timing differences between the accrual of revenues and costs in currencies other than the presentation currency and their financial realization, exposes the Group to currency risk (transaction currency risk).
Maire Tecnimont seeks to minimize transaction currency risk through derivative contracts. Group level planning, coordination and management of such operations is carried out by the Finance Department, which monitors the correct correlation between derivative instruments and underlying cash flows and their appropriate representation as per international accounting standards.
The Group furthermore has investments in subsidiaries in countries not belonging to the Eurozone and shareholders’ equity changes from local currency movements against the Euro are temporarily recognized to the “translation reserve” shareholders’ equity reserve.
INTEREST RATE RISK
Maire Tecnimont Group interest rate risk essentially concerns its variable medium/long-term loans. Variable rate debt interest rate risk not hedged through derivative instruments is however partly mitigated by liquidity remunerated at rates indexed to the same debt parameter (euribor). Any consequent interest rate fluctuations may create similar effects upon cash flows generated from inventories, although in an opposing manner than those produced on cash flows related to debt positions.
CREDIT RISK
The Group credit risk represents the exposure to potential losses following the non-fulfilment of obligations by counterparties. This stems from normal operations and is monitored by the operating and financial departments on the basis of set procedures and periodic reporting. The individual positions are written down, if individually significant, with a provision which reflects the partial or total non-recovery of the receivable. Against the receivables which are not individually written down, a general provision is made, taking into account historical experience and statistical data.
LIQUIDITY RISK
This risk concerns the difficulty in sourcing new funding or access to liquid assets, resulting in the enterprise’s failure to satisfy payment commitments, being forced to incur additional

Directors’ Report
56
funding costs or, in extreme instances, being faced with potential insolvency which may put its going concern at risk.
At the present moment, Maire Tecnimont considers that the good levels of liquidity held and prudent and functional management of the credit lines available are important elements for stability and sufficient to guarantee the resources necessary for operating continuity.
Cash and cash equivalents at December 31, 2016 amount to 497,138 thousand, increasing Euro 134,753 thousand on December 31, 2015; cash flows generated by operating activities were Euro 162,107 thousand and benefitted from, in addition to the result for the year, positive working capital changes.
FINANCIAL COVENANT RISK
This concerns the possibility that loan contracts include clauses permitting the lending Banks to request immediate repayment on the occurrence of certain events, resulting therefore in a liquidity risk.
The loan issued on December 28, 2015 for Euro 350 million to the subsidiary Tecnimont is subject to covenants based on market practice, calculated on the Consolidated Financial Statements of the Maire Tecnimont Group. Specifically, the financial covenants of the loan concern the ratio between the net financial position and net equity, as well as between the net financial position and EBITDA.
Maire Tecnimont is currently not aware of any default situations regarding the above-mentioned covenants.
RISKS CONCERNING THE GROUP CAPACITY TO OBTAIN AND RETAIN GUARANTEED
CREDIT LINES AND BANK GUARANTEES
In the course of operations and, in particular, for participation in tenders, the signing of contracts with operators or receiving advances and payments from such during order execution, the Group is required to issue bank and/or insurance guarantees in favor of operators.
The Group’s capacity to obtain such guarantees from banks and/or insurance companies depends on an assessment of the Group’s financial statements and, in particular, of the Group company involved, from analysis of the order risk, experience and the Group companies competitive positioning within its sector. In the Group’s wider renegotiations with the banking syndicate regarding the terms and conditions of the new loan, the existing credit lines were confirmed.
16. Disputes
Before outlining the main disputes, we highlight that the directors have allocated sufficient amounts to the risk provisions in coverage of such. Proceedings concerning disputes which potentially concern amounts of equal to or greater than 5 million are outlined below.
CIVIL, ADMINISTRATIVE AND ARBITRATION PROCEEDINGS
J&P Avax S.A.: arbitration procedure initiated by Tecnimont in August 2002 against J&P Avax S.A. (“J&P”) for compensation for damages suffered following delayed execution of a sub-contract awarded to J&P as part of Tecnimont’s construction of a polypropylene production plant in Salonicco, Greece, commissioned by the Greek enterprise Helpe. Tecnimont’s arbitration claim amounts to Euro 17.4 million, while J&P advanced a counter claim for Euro 28.5 million. The Arbitration Board in December 2007 issued a partial award, attributing 75% liability for the 4 month work execution delay to J&P and 25% to Tecnimont. J&P challenged

57
on December 28, 2008 the partial award before the Paris Appeal Court, which with judgment of February 12, 2009 cancelled the award due to the alleged lack of independence and impartiality of the Arbitrary Board’s Chair. Tecnimont subsequently challenged this decision before the Court of Cassation, which on November 4, 2010 announced in favor of Tecnimont, overturning the Appeal Court judgment. The Arbitration Board therefore decided to re-examine the arbitration, although J&P challenged the partial award before the Reims Court of Appeal, which on November 2, 2011 again cancelled the partial award for alleged improper constitution of the Arbitrary Board. Tecnimont therefore presented a fresh appeal to the French Court of Cassation, which again overturned the appeal court judgment and postponed its decision. The Court of Appeal judged in favor of Tecnimont and J&P has appealed to the Court of Cassation. The Arbitration Tribunal however decided to re-initiate the arbitration process. In the meantime, the Chair of the Arbitration Board resigned due to health issues and a new Chairperson was appointed, who fixed the next hearings for May 2017. The issue of the final award is not expected until the end of 2017.
Mainka: in December 2010 Tecnimont received notification from the International Court of Arbitration of the opening of a procedure against the company by Mainka, a German construction company engaged in the Münchsmünster project. The subcontract signed in August 2007 concerned the execution of civil works at the polyethylene production plant located in Münchsmünster, Germany. The Mainka claim concerns the recognition of alleged higher costs incurred for the execution of works for a total of approx. Euro 16.7 million. Tecnimont presented a formal response to the arbitration appeal, rejecting all Mainka claims and presenting a counterclaim for Euro 7.9 million. According to the Terms of Reference filed in September 2011, the Arbitration Board was called to decide in first instance the preliminary issue concerning the applicability of German law which considers clauses contained in forms and questionnaires as void. On this basis, Mainka argued the nullity of the liquidated damages and performance bond clauses. In parallel, Tecnimont initiated at the German Court an enforcement action upon the performance bond through two proceedings: i) against Mainka at the Ingolstadt court with subsequent appeal to the Munich Court of Appeal and with a successful outcome for Tecnimont (due to lack of jurisdiction) ii) against the insurance company at the Wiesbaden Court. On December 5, 2011, the ICC hearing on the partial award was held and it was decided to postpone any payment of the bond until conclusion of the arbitration process. It was also decided to continue the process on the Termination point. The petitions of the parties were filed between February and April 2012 and at the beginning of May 2012 the ICC hearing on the Termination was held. The Arbitration Board, without formally pronouncing upon the question of the Termination, therefore initiated a review of Mainka’s claim and Tecnimont’s counterclaim. The parties presented new petitions upon the claim and the counterclaim between August and December 2012. In January 2013, the hearing upon the “final invoice” was held, where it was decided to re-submit to the arbitrators a shared list of outstanding questions with indication of whether strictly legal or technical matters to be submitted by the Arbitration Board to its appointed expert. In May 2014, the Arbitration Board fixed new dates for presentation of additional petitions and for a further hearing which was held in July 2014. At this hearing, the Chairman of the Arbitration Board suggested a potential conflict impacting his independence and impartiality. The parties therefore expressly requested the replacement of the Chairman, with the ICC accepting this request. In autumn 2014, the new Chairman was appointed, who in turn formalized the appointment of the technical consultant. In the first half of 2015, the parties met with the Tribunal and with the expert in the form of the facilitator. Following these meetings, an agreement was not reached and the Tribunal decided that the arbitration should continue, maintaining the expert who would have acted to all intents and purposes as the technical consultant appointed by the Tribunal.
In February 2016, the hearing at which the testimonies were cross-examined was held. The Tribunal appointed expert issued a technical opinion at the beginning of September 2016, which was commented upon by the parties at the end of October. In November 2016, the final hearing was held, at which the Tribunal nominated expert was questioned. Indicatively, the final award will be issued in the spring of 2017.

Directors’ Report
58
Juruena: in May 2009, Maire Sapezal Ltda (now Tecnimont Sapezal, a subsidiary of Maire Engineering do Brazil, now Tecnimont do Brazil Ltda) was forced to resolve the contract with Juruena concerning the construction of 5 hydroelectric power plant in the Mato Grosso region. This followed serious financial difficulties emerging during the project caused by events outside of Tecnimont Sapezal’s scope of responsibility which decisively impacted timelines and costs, including: in addition to a year of suspension due to non-renewal of the client’s environmental licenses, a suspension order upon works issued by the local magistrate, basic design errors by the client, destruction and fire on site caused by indigenous peoples, site flooding due to exceptional rainfalls and the failure to pay invoices issued and approved by the client. Following the resolution of contract, Maire Sapezal blocked the legal actions taken by the counterparty at the Cuiabá (Mato Grosso) Court, in clear contradiction of the arbitration clause and the attempt to enforce the performance insurance guarantee and completed the site transfer operations as planned. Maire Sapezal therefore filed an international arbitration claim (ICC) to obtain payment of approx. Reals 115 million for: i) non-adjustment of the contractual price following delays caused by the failure to renew local environmental licenses by Juruena; ii) non-adjustment of the contractual price following additional costs due to basic design errors by Juruena; and iii) non-compliance with the obligations agreed between the parties under an operational agreement for price resetting on an open book basis; iv) Juruena’s liability for the incursion of indigenous peoples which devastated the sites and non-recognition of the damage caused to Tecnimont; v) non-payment of invoices approved for services provided by Tecnimont; vi) improper recourse to the Mato Grosso Court in violation of the contractual arbitration clause; vii) violation of the principle of good faith. The client in turn filed an arbitration claim for approx. Reals 346 million. The Arbitration Court was constituted and during the ICC procedure petitions and technical, economic and market reports were filed and written testimonies gathered. On June 9, 2013, the Group received from its Brazilian legal representatives a copy of the (partial) arbitration award, subsequently amended on October 17, 2013 and not immediately executive, which contained the following: i) both parties were deemed responsible for resolution of contract; ii) the award concludes all Tecnimont do Brazil Ltda claims, with recognition of approx. Reals 21.15 million; iii) the award concludes Juruena’s claims with recognition of approx. Reals 16.4 million. The proceedings expenses will be decided as part of the final award. The ICC procedure concluded with a final award which recognized certain costs for the re-execution of works requested by Juruena. Tecnimont presented a request for the annulment of the Award on the basis of procedural technicalities. On the other hand, Juruena has not yet requested execution of the Award. The parties are in addition negotiating a settlement.
Kesh: Maire Engineering S.p.A. (now Tecnimont S.p.A.) in February 2007 signed an EPC contract for the construction of an EPC plant located in Vlore (Valona), Albania with the operator Kesh Dh. Albanian Power Corporation, an Albanian state-owned company. The initial “lump sum” contract value was Euro 92 million, thereafter increased by an additional Euro 4.1 million. Since the beginning of the project, Tecnimont has encountered significant difficulties which have impacted the timely execution of works and led to additional costs and damages. The initial difficulties stemmed from the fact that the contract tender was carried out in a period of greatly different market conditions than those which Tecnimont encountered two years subsequent to the awarding of the contract. Apart from the increase in the contract value of Euro 4.1 million, Kesh without basis has neither recognized an additional adjustment to the contract value or an extension to the completion deadline. Furthermore, in addition to deteriorated market conditions, other events have increased Tecnimont’s costs and delayed works completion, including: ongoing storms and requests to carry out temporary rather than permanent repairs. In 2009, Tecnimont presented an Interim Report requesting review of the Operational Acceptance date and, in the case of non-acceptance, the payment of the additional costs incurred in accelerating works to reduce the delay, meaning that Kesh would not have had other grounds to request payment of the delayed penalties. In July 2009, the change proposals were submitted to Kesh. Despite all this, Kesh in September 2011 demanded the payment of penalties of Euro 9.2 million from Tecnimont. In November 2011, Tecnimont sent a Supplementary Report concerning the events between February 2009 and October 2011, which would have entitled Tecnimont to request a longer extension to the

59
completion date than that already requested through the Interim Report and additional damage and cost claims. In particular, recognition of approx. Euro 56 million and approx. USD 22.5 million was requested. The Operational Acceptance Certificate was thereafter issued in November 2011, although with retroactive effect to October 2011. Apart from the unjustified delay in issuing the certificate, Kesh has not released the remaining 5% of the contractual price for an amount of Euro 4.7 million and has not reduced the Performance Bond from 10% to 5% of the contract value. In addition, Kesh has not extended beyond December 31, 2011 the duration of the letter of credit in guarantee of its payment obligations, therefore not complying with its contractual and legal obligations. As a direct consequence, Tecnimont sent to Kesh a first Notice of Termination in April 2012, followed by a second Notice in May and a third in September 2012. Despite this, Kesh subsequently threatened to enforce the entire amount of the Performance Bond of Euro 9.6 million. In January 2012 and therefore subsequently to obtaining Operational Acceptance and following the transfer of the plant from the custodianship of Kesh a storm hit the plant, damaging the sea outlet piping. Tecnimont considers that the damage to the tubing related to events entirely outside of its scope of responsibility and due to the improper management of the plant by Kesh personnel. In order to avoid enforcement of the entire Performance Bond amount of Euro 9.6 million claimed by Kesh in September 2012, Tecnimont claimed and obtained from the Milan Court an injunction recognizing enforcement of half the Performance Bond as illegal; the guarantee issue bank therefore paid Kesh only half of the Performance Bond. In October 2012, Tecnimont therefore filed an arbitration claim at the ICC against Kesh for payment of the remaining 5% of the contract value, the reimbursement of the half of the Performance Bond enforced, in addition to Euro 51 million, plus USD 22 million of additional costs for damages, further to a declaration of non-responsibility for the delayed penalties. In addition, Tecnimont requested resolution of the EPC contract on the basis of Kesh’s non-fulfilment, reserving the right to present additional damage claims during the same arbitration procedure. On January 4, 2013, Kesh presented a brief rejoinder, requesting that the matter is preliminarily submitted for an adjudicator’s assessment. This assumes that the EPC contract established this preliminary step before the matter is dealt with by the Arbitration Board. The ICC proposed that the parties reach an agreement to suspend arbitration and resubmitted the matter to the adjudicator’s assessment. The contract establishes however that the party unsatisfied with the adjudicator’s assessment may initiate an arbitration proceeding. In February 2014, Tecnimont therefore filed an initial adjudicator application concerning Kesh’s non-compliance with its obligations in relation to the Performance Bond reduction. On April 2, 2014, the adjudicator’s decision was in favor of Tecnimont and on April 28, 2014 Kesh announced its intension to challenge this decision through arbitration in accordance with the contract. However, Kesh has thus far not initiated any arbitration in this regard at the ICC. Simultaneously, on February 18, 2014 Tecnimont was summoned to appear in Albania with regards to the case initiated in October 2012 by Kesh against Intesa Sanpaolo Bank Albania for payment of the residual performance bond (Euro 4,830,000), which was blocked by the Milan Court. The first level judgement rejected Kesh’s demands, which within the thirty following days challenged this decision. With judgement of March 27, 2015, the Court of Appeal confirmed the first level decision, rejecting therefore Kesh’s claim. Against this provision, on April 17, 2015 Kesh filed an appeal before the Albanian Court of Cassation, which was only notified to Tecnimont on May 25. The Court of Cassation decision is expected to be issued in the first half of 2017.
NGSC/Iranian Bank of Mines and Industry: On January 16, 2014 Sofregaz (now TCM FR) presented a request for arbitration to the International Arbitration Court of the ICC against the client NGSC (Natural Gas Storage Company) to obtain rejection of a number of compensation claims previously advanced by NGSC, the payment of an overdue amount of Euro 1,286,339.06 and relative interest and withdrawal of the payment request of the Performance Bond and the Advance Payment (or, where payment has already taken place, reimbursement of the relative amount). Initially, the arbitration was suspended due to the embargo restrictions as concerning an Iranian company, although thereafter resuming on May 29, 2015. The Tribunal was established on June 7, 2016. On December 1, 2016, TCM FR

Directors’ Report
60
presented the statement of claim concerning a further request for damages of over Euro 9 million.
Immobiliare Novoli: as part of the construction of the Novoli (Florence) property complex, on July 7, 2007 Tecnimont advanced against the client Immobiliare Novoli a payment request for services, in addition to compensation for damage and higher costs incurred during the works, for a total amount of over Euro 30 million. Immobiliare Novoli submitted in turn a damage claim of approx. Euro 52.7 million. On February 27, 2012, the arbitration award was issued, recognizing Tecnimont the right to payment of approx. Euro 10.4 million, in addition to interest, for a total of approx. Euro 16.1 million. With deed notified on June 18, 2012, Immobiliare Novoli challenged this arbitration award before the Florence Court of Appeal. On July 15, 2014, this latter Court issued a Judgement which substantially declared the partial nullity of the award with regard to the section judging payment of Euro 6,441,248.24 against Immobiliare Novoli. Currently, Tecnimont has appointed its legal representative to appeal the revocation of the judgment at the Court of Cassation and subordinately an appeal for overturning of the judgement. Immobiliare Novoli has overall paid Tecnimont a total of Euro 5,274,064.61. Tecnimont S.p.A. presented an appeal to the Court of Cassation and a revocation application of the Court of Appeal judgment. On May 12, 2015, Tecnimont S.p.A. sought to register the appeal, with the proceeding allocated General Role No. 11267/2015. Also on May 12, 2015, Tecnimont S.p.A. sought to register the subpoena for revocation of the Court of Appeal judgment, with the procedure assigned General Role No. 1039/2015. On June 4, 2015, Immobiliare Novoli notified Tecnimont S.p.A. of its counter appeal. The hearing of November 27, 2015, during which it was not possible to make any clarifications, was postponed to October 28, 2016 for conclusions. On March 17, 2016, following the dispute arising with regards to the payment of an additional amount of Euro 1,774,365.93 by Immobiliare Novoli Tecnimont in favor of Tecnimont on February 27, 2015 (on the basis of the Award and Judgement No. 1775/2014), the parties reached a settlement agreement under which, subject to the effects deriving from the revocation judgements (before the Florence Court of Appeal) and challenging judgements (before the Supreme Court of Cassation) of the first point only of the grounds of the Florence Court of Appeal judgement No. 1775/2014, Immobiliare Novoli paid the further amount of Euro 400,000.00, while in addition committing to indemnify and release Tecnimont from all and every claim previously advanced or which may be advanced relating to contracts signed between the parties. On January 16, 2017 the conclusive responses concerning the revocation application were filed.
Municipality of Venice – Manifattura Tabacchi: with subpoena notified on June 5, 2010, the Municipality of Venice summoned the Temporary Consortium comprising Tecnimont (59% mandatee), Progin and other mandatees (the “ATI”), as designer of the new Venice legal headquarters (ex Manifattura Tabacchi), requesting from the ATI repayment of damages alleged by the Municipality of Venice for the failings and omissions of the executive projects (concerning in particular, the failure to carry out chemical analysis of the soil, structure and plant errors/omissions and the failure undertake archaeological surveys). The damage claim amounted to Euro 16.9 million. In its opening, the ATI strongly contested that alleged by the Municipality of Venice. Currently, following the observations drawn up by the parties on the definitive expert’s opinion presented on August 30, 2014, the Judge required that the Technical Expert respond by March 17. The Judge on March 24, 2015 granted the extension requested by the Technical Expert and postponed the hearing of March 27, 2015 to April 24, 2015. At the April 24, 2015 hearing, the Judge outlined the serious inadequacies in both the definitive expert’s opinion and in the Technical Expert response to the criticisms of the parties, with even the Municipality of Venice lawyers agreeing with our criticisms. Reappointment of the Technical Expert was requested, together with admission of the additional claims outlined in the petitions as per Article 183 of the C.P.C.. The new judge so appointed fixed the final ruling for June 17, 2016. At the hearing of June 17, 2016, Tecnimont requested authorization for the filing of the partial judgement which completed the verdict against Works Management and thereafter resubmitted the acquisition request for the technical consultancy carried out within the proceeding. The Judge ordered the filing of the judgement and referred

61
the decision on the applications to the hearing of September 16, 2016. At the hearing of September 16, 2016, the Judge ordered the acquisition of the expert report issued at the proceedings taken by the Municipality of Venice against Works Management. The report should be filed by November 30, 2016. Following this, Tecnimont had until January 31, 2017 to draw up its observations. The Judge also stated that most likely the case file shall be assigned to a different Judge. At the hearing of February 10, 2017, the legal representatives of the parties (and the third party insurance companies called) considered the need for an additional expert opinion. The Judge withheld decision following the discussion.
Tecnimont/TCM FR – STMFC (Society du Terminal Methane de Foes Cavour): the contract concerns the construction of a regasification terminal and was signed in September 2014 between the client STMFC - Society du Terminal Methane de Foes Cavour (70% Gas De France, 30% Total) - subsequently assigned to Fosamax LNG - and STS (society end participation), comprising: 1% Sofregaz, 49% Tecnimont, 50% Saipem France (hereafter “STS“). The award was issued on February 13, 2015, under which STS is required to pay Fosamax delay penalties, costs related to accidents, disorder and harmful events at the site and for residual works carried out by Fosamax; Fosamax however shall pay STS for the increase in contractual value, the reimbursement of bank guarantees and additional costs, in addition to interest as provided for in the Judgement. The recognition of the respective positions took place in April 2015. Fosamax LNG subsequently challenged the award before the French Council of State, requesting nullification of the allegation put forward that the Arbitration Board erroneously applied private law in the place of public law. STS filed its defense petition before the Council of State. The parties exchanged petitions at the hearing before the French Council of State (Conseil d’Etat). Subsequently, at the hearing of the Rapporteur Public (Reporting Judge), the debate phase was closed. The Rapporteur referred the case to the Tribunal des Conflits, which is required to reach its decision within three months from the day of referral. At the hearing of December 3, 2015 for discussion of the suspension of the counterparty’s procedure taken at the Court of Appeal, the case was adjourned to the hearing of January 7, 2016. At this hearing, the Court of Appeal suspended the proceedings ahead of the Tribunal des Conflits decision. With decision No. 4043 the Tribunal declared the administrative jurisdiction as competent for the arbitration award appeal. On November 9, 2016, the Conseil d’Etat only partially annulled the Award, in terms of the section in which the request of the company Fosamax LNG for payment by the STS Group of costs for the at risk works and expenses of the STS Group (mise end régie (under authority of a third party)) was rejected, confirming however all other decisions of the Arbitration Board. Fosamax in addition initiated further legal proceedings before the Court of Appeal: one concerning the cancellation of the award and the other cancellation of the decree of the TGI Chairman (hereafter the “exequatur”). (1) Award cancellation appeal: With regards to this appeal, STS requested the Court to consider itself as lacking jurisdiction in view of the decision of April 11, 2016 of the Tribunal des conflits which declared the jurisdiction of the Conseil d’Etat for the award cancellation appeal. The Paris Court of Appeal accepted STS’s arguments and therefore declared itself to lack jurisdiction to decide upon this appeal (in favor of administrative jurisdiction) both for the principal appeal and accessory (enforcement appeal). (2) Appel nullité dell’exequatur: With regards to the second appeal, STS requested the Court to consider the action inadmissible due to the non-fulfilment of the initiation requirements. Subordinately, STS requested the Court to consider that as Fosamax made payment willingly it implicitly accepted the award, which was therefore no longer challengeable. The decision of the Court of Appeal rejected STS’s grounds, founding its decision, among other matters, on the control of the award allocated to administrative jurisdiction and the possibility to challenge the decision before the civil jurisdiction. As considering arguments relating to compliance with the award, the Court of Appeal considered that this review required the competent judge to declare upon the cancellation of the award: therefore judgement was not made on the point, referring the decision to the Conseil d’Etat. In addition, the Court of Appeal considered itself competent to review the appeal, taking account of the fact that the decision was issued by a civil authority and may no longer be challenged before the administrative jurisdiction. Therefore, this procedure will continue on such lines and the Court of Appeal will fix a date in the coming weeks for examination and

Directors’ Report
62
discussion of the case. The practical impact of a negative decision by the Court of Appeal is quite reduced (except for judgment against legal and case expenses) as the Conseil d’Etat, through its November 9, 2016 decision confirmed the validity of the award, with the exception of the request of Fosamax concerning mise end régie.
KT – HYL TECHNOLOGIES – on July 22, 2015, an arbitration request was notified by the Client HYL TECHNOLOGY for alleged serious non-fulfilment by KT in the execution of the EP contract signed with the Client in May 2011. The claim presented by HYL amount to USD 32 million for damages and USD 45 million for loss of earnings. As per the contractual terms, the arbitration was taken to the International Court of Arbitration of the International Chamber of Commerce and was held in Milan. In the defensive petitions filed on September 18, 2015 and August 4, 2016, KT contested the accusation of poor design and rejected the assumption, drawn up by the plaintiff, of KT’s liability for the accident at the plant on November 2, 2014. KT made a counter-claim requesting the sum of approx. Euro 2.7 million together with the restoration of costs incurred to date of Euro 900 thousand in relation to the arbitration. The claim requested by HYL for damages does not appear founded and does not contain specified detailed attachments such as (i) non-compliance by KT; (ii) indication of the link between the event which caused the damage and the activities undertaken by KT in execution of the contract and (iii) the certified damage incurred. The request by the counterparty for the loss of earnings - which is subject to the outcome on the assessment of the direct damage - is also unfounded in consideration of the following: (i) the contract underwritten between the parties expressly provides for the exclusion of indirect and consequential damage (citing, for example purposes, loss of production or profit, loss of revenue, loss of use, loss of capital); ii) the non-awarding of the order to HYL would principally be due to the (reduced/lower) reliability of the technology of this latter, in both absolute terms (compared to historical performances of the plant constructed by HYL), and in relative terms (compared to its competitors). The latest “Procedural Timetable” sent to the Parties by the Arbitration Court establishes a deadline of April 6, 2017 for the filing of our third brief and fixed the dates of May 22-30 for the hearings to be held in Milan.
Indian Oil Corporation Limited (“IOCL”), the dispute with the client IOCL concerns a lump sum EPC contract signed on November 25, 2006 for the construction of a “Polypropylene Plant con Product Warehouse facilities for Polypropylene2” (Part-A) (EPCC-2A) located in the Panipat Naptha Cracker Complex (Haryana). During execution of the project, a number of events occurred affecting the rights of the Contractor to the deferment of plant delivery terms, as per the contractual terms. In May 2010, the Contractor formally requested an extension, submitting to the Client a document in support of this request. The Client only responded to these extension requests on April 5, 2012, presenting its contractual price reduction request following the project delays: (i) 9.5% contract price reduction for delayed achievement of mechanical completion; (ii) Rs. 27,000,000 for delayed achievement of the Interim Milestone. In October 2012, Tecnimont filed an arbitration request for, among other matters, payment of the amounts related to the achievement of mechanical completion (ii) an extension and payment of additional costs, (iii) payment of interest on delayed payments to date. On November 9, 2012, IOCL filed its response to the arbitration application, rejecting entirely Tecnimont’s arguments. The arbitration - which in fact was interrupted due to discussions between the parties for a possible settlement - was reinitiated with the constitution of the Arbitration Tribunal of August 10, 2015. On September 29, 2015, the preliminary hearing was held to set out the arbitration procedure calendar and on January 27, 2016 Tecnimont filed its Statement of Claim requesting again payment for: (i) the portion of the contractual price considered plus interest; (ii) certain extra works; (iii) additional costs incurred due to delays caused by IOCL and disruptions; (iv) the acceleration costs; (v) interest on delayed payments to date. On May 23, 2016, IOCL filed a motion as per Section 16 of the Arbitration and Conciliation Act of 1996, requesting rejection of Tecnimont’s arbitration application as relating to matters not covered by the arbitration clause. Following an exchange of briefs between the parties and two hearings in April and July 2016, on September 1, 2016 the Arbitration Tribunal rejected IOCL’s motion, confirming the applicability of arbitration to Tecnimont’s claims and ordering therefore the continuation of the arbitration proceedings. As fixed by the Arbitration Tribunal on September 8, 2016, on

63
November 20, 2016 IOCL filed its Statement of Defense (without counterclaim). On January 23, 2017, a further hearing was held which fixed, among other matters, a deadline of March 20, 2017 for the filing of Tecnimont’s response (Rejoinder) to the Statement of Defense of IOCL and the date for the next hearing (May 5, 2017).
NANGAL (India) - project acquired in May 2010 from National Fertilizer Limited (NFL). The project involved the reconversion of the existing Nangal fertilizer plant, replacing the fuel oil and natural gas system and modernizing the accessory infrastructure. Engineering, material procurement and construction have been completed. The project is 99.9% complete. The mechanical completion of works was delivered on February 15, 2013, while plant start-up took place on April 9, 2013. The performance tests were successfully completed. In 2015, negotiations for the settlement of outstanding matters with the client continued. In February 2016, following the unexpected requests of the client and without notice or notice of contractual non-fulfilment, a procedure for the enforcement of the project Performance Bond was initiated; a legal case was opened in India under Section 9 of the Arbitration and Conciliation Act. 1996. The High Court of Delhi on February 15, 2016 immediately blocked enforcement until March 9, 2016. At the subsequent hearing of March 9, 2016, the Delhi Court maintained the “status quo” of NFL requests until April 29, 2016. At that hearing, NFL requested an extension to the deadline for the filing of its petitions. At the hearings of July 29, 2016 and October 6, 2016, the same Court maintained the “status quo”. At the last hearing of December 6, 2016, the Court decided to maintain the supervision order of February 15, 2016 unaltered until the decision of the sole arbitrator, referring therefore to the arbitrator the decision upon enforcement of the Performance Bond. With order of December 6, 2016, the Court therefore declared the proceedings closed as per Section 9 of the Arbitration and Conciliation Act. 1996. The Maire Tecnimont Group, supported by its consultants, does not concur with the actions of the Client and considers that strong arguments in its favor exist. Simultaneously, Tecnimont on February 27, 2016 presented an arbitration for recognition of the previously advanced requests to the client for the issue of improperly withheld payments for the works carried out, in addition to recognition of additional compensation due to the extra costs incurred and chargeable to the client. With order of December 9, 2016 of the Supreme Court of India (pronouncing upon the Section 11 of the Arbitration and Conciliation Act of 1996 proceeding), Justice S.S. Nijjar was appointed as the sole arbitrator. On February 15, 2017, the parties agreed with the arbitrator the arbitration calendar. In this regard, among other matters it was established that Tecnimont should file its next petition (Statement of Claim) on May 15, 2017 and NFL its reply (Statement of Defense and counterclaim) on August 11, 2017. The next hearing is fixed for November 17, 2017 and arbitration should conclude in the second half of 2018.
NAGRP Kuwait (Kuwait) - acquired in July 2010 from Kuwait National Petroleum Company (KNPC). The EPC contract regards the provision of three portions of plant: a new process plant (New AGRP), a steam generation plant (Utilities) and the development of an existing plant (AGRP Revamping). Without any notice and entirely unexpectedly, on May 16, 2016, the Client terminated the contract and which was immediately contested by Tecnimont S.p.A. before the competent judicial courts. Following the resolution Tecnimont in fact commenced a civil procedure requesting the competent judge to accept the illegitimacy of the contract resolution as well as requesting condemnation of the Client for the payment of the contractual price matured to the date of the resolution, to the restitution of the sums received following the enforcement of the bank guarantees and payment for all damages incurred. Despite these proceedings the Parties began negotiations on the possibility to conclude a settlement agreement which would provide, among the various aspects, that the Client would commit to the payment of the trade payables of the projects which, for such purpose, would be ceded from Tecnimont to the client. Currently, negotiations are still in progress with conclusion expected in the short-term. Based on that discussed and on information available to the Group, the outcome will not result in the recognition of significant liabilities. The company however does not intend to withdraw from the legal action unless a Settlement is agreed with the Client.

Directors’ Report
64
TAX DISPUTES
Maire Tecnimont Group Tax Disputes concern outstanding tax proceedings relating to ordinary operations of Group companies. Against these disputes, directors have allocated sufficient amounts to the relative financial statement provisions. A summary of the main positions at December 31, 2016 according to currently available information is presented below.
TECNIMONT SPA: Assessments for the years 2006, 2007, 2008, 2009, 2010 and 2011. On March 24, 2011, in conclusion of the Finance Police’s IRES, IRAP and VAT tax audit, a Tax Assessment for the years 2006, 2007, 2008 and 2009 (“PVC2011”) was drawn up and sent to Tecnimont S.p.A.. The findings contained in PVC2011 concern costs for inter-company services and the loss on the FOS order. More in detail, the first finding concerned inter-company service costs for tax years 2006, 2007, 2008 and 2009, i.e. management fees recharged to Tecnimont S.p.A. by the parent company Maire Tecnimont S.p.A., considered by the inspectors as non-deductible for IRES and IRAP purposes. The second finding however stemmed from the transfer by Tecnimont S.p.A. to its organization in France of positions concerning the subsidiary Sofregaz and relating to a tender contract (“FOS Contract”) and a French agreement (SEP Agreement) established for management of the above-cited FOS contract. In addition, on July 29, 2013, on conclusion of the general tax audit by the Tax Agency - Lombardy Regional Division, a second Tax Assessment (“PVC2013”) for 2008 was drawn up (extended to 2009, 2010 and 2011 for a limited number of cases). The findings of the inspectors concerned the deductibility of losses on a number of orders, principally the FOS Contract, costs considered as not applicable and/or not relative, in addition to personnel costs and other minor costs. In relation to the PVC2011 findings and the PVC2013 findings concerning the years 2006, 2007, 2008, 2009 and 2010, the Tax Agency notified separate IRES, IRAP and VAT tax assessments. The company considers that the claims in the tax assessments are not founded. Therefore, Tecnimont S.p.A. and Maire Tecnimont S.p.A. (as IRES consolidating company) have appealed these acts to the Milan Provincial Tax Commission and, simultaneously, have continued the dialogue in progress with the Tax Agency - Lombardy Regional Section. Ahead of judgment, the Tax Agency has positively assessed the company’s new arguments concerning management fees. Therefore, the Tax Agency abandoned the findings for 2008 and 2009, while for 2006 and 2007 the parties reached a legal agreement involving the almost total nullification of the findings (reduced to additional taxes of Euro 396 thousand, in addition to reduced interest and penalties). The Milan Provincial Tax Commission, after numerous postponements following various joint applications by the company and the Tax Agency, decided to join the appeals into a single procedure discussed at the hearing of February 23, 2016. With judgement No. 2265, filed on March 8, 2016, substantially in favor of the company, the first level justices nullified the majority of requests put forward by the Agency, and, among these, all those concerning the FOS contract. Despite the favorable judgement of the Provincial Tax Commission, the company continued its dialogue with the Tax Agency to reach an agreement regarding all of the findings in the PVC2011 and PVC2013 and the contestations notified to the company (and to Maire Tecnimont S.p.A. as IRES consolidating company) through the following claims subject to dispute: 1) tax assessment for 2007 (additional taxes of Euro 6,467 thousand plus interest and penalties of Euro 10,840 thousand claimed); 2) tax assessment for 2008 (additional taxes of Euro 10,571 thousand plus interest and penalties of Euro 10,543 thousand claimed); 3) tax assessment of 2009 (additional taxes of Euro 2,536 thousand plus interest and penalties of Euro 2,536 thousand claimed); 4) tax assessment for 2010 (additional taxes for Euro 10,752 thousand, in addition to interest and penalties for Euro 10,752 thousand claimed). The agreement with the Tax Agency was finalized and formalized on December 22, 2016. All charges arising from the settlement with the Tax Agency were settled on the same date through the offsetting of IRES receivables available through the tax consolidation (without any cash payment). On the basis of this agreement, the Tax Agency committed to nullify all contestations in place regarding the findings contained in PVC2011, in PVC2013, in addition to all other matters in the tax assessments issued and subject to the tax dispute.

65
TECNIMONT SPA: Tax assessment concerning IRPEG - IRAP - VAT and withholding taxes for 2003. With IRPEG - IRAP - VAT and withholding tax assessments concerning 2003, notified to Maire Engineering (subsequently incorporated into Tecnimont SpA), the Tax Agency assessed higher IRPEG of Euro 4,656 thousand, higher IRAP of Euro 577 thousand, higher VAT of Euro 3,129 thousand, higher withholding taxes of Euro 10 thousand, higher regional levy of Euro 700 thousand and issued a penalty totaling Euro 6,988 thousand. Tecnimont S.p.A. in a timely manner challenged the claim in question before the competent Turin Provincial Tax Commission, which substantially pronounced in favor of the company. This judgement was reviewed in 2008 by the justices of the Regional Commission, which accepted the Tax Agency’s appeal. Among the findings annulled by the first level justices, although thereafter confirmed by the Turin Regional Tax Commission, we highlight finding No. 2 concerning an extraordinary gain of Euro 12,022 thousand following the issue of the UNCITRAL arbitration award. The parties appealed to the Court of Cassation which on April 15, 2016 confirmed the previous decision (concerning the main findings) and referred the case to a differing section of the Turin Regional Tax Commission. Ahead of judgement, the company paid to the Tax Agency Euro 12,130 thousand: following the judgement issued by the Court of Cassation and in light of the changes to the penalty system introduced by Legislative Decree 158/15, this amount exceeded that due. Tecnimont S.p.A. therefore initiated a counter appeal against the Tax Agency for the exact calculation of the repayment due. In addition, on November 24, 2009 a repayment application for the taxes previously paid in 2005 relating to income from the Quetta Fund (Euro 2,329 thousand, plus interest) was presented to the Turin Tax Agency. The company, following the Court of Cassation judgement and the non-payment of the Agency, will take a specific legal action before the competent Tax Commission.
Ingenieria y Construccion Tecnimont Chile y Compania Limitada: Tax assessment 2011. In May 2013 Ingenieria y Construccion Tecnimont Chile y Compania Limitada (“Tecnimont Chile”) was notified of an application by the Chilean tax authorities regarding tax findings and claims. In particular, the calculation of the 2011 tax result was contested, rejecting the tax losses accumulated (approx. CLP 71.9 billion) and claiming taxes for a total of approx. CLP 4.9 billion. Tecnimont Chile promptly requested nullification of the claim as illegitimate and unfounded, providing fresh and extensive documentation not previously considered by the Chilean Tax Agency. On the basis of this documentation provided, on August 8, 2013 the Chilean Tax Agency partially nullified the act, acknowledging the validity of part of the tax loss, while also almost entirely cancelling all payment demands for increased taxes and interest previously notified to the company. Tecnimont Chile continued to appeal in support of the correctness of its activity.
TWS SA: Tax assessment - financial years 2004 to 2009. In December 2014, the Tax Agency notified the Swiss company TWS SA of separate tax assessments, establishing the tax residence of the company in Italy for the 2004 to 2009 tax years. The assessed and demanded taxes totaled Euro 3,198 thousand (in addition to penalties of Euro 3,838 thousand). The company considered these assessments as illegitimate and unfounded and, supported by a leading legal and tax firm, challenged all of these acts before the competent Milan Provincial Tax Commission which, with the judgment filed on June 29, 2015, accepted all appeals, judging expenses against the Tax Agency. Following this decision, the Tax Agency presented an appeal before the Lombardy Regional Tax Commission (hearing pending).
KT Kinetics Technology SpA: Tax Agency audit on FY 2011, On November 3, 2016, in conclusion of the Finance Police`s tax audit relating to the year 2011, the Tax office (Lazio Regional Tax Office) issued a tax assessment for IRES, IRAP and withholding taxes. The company immediately sent an appeal to the Tax Office requesting and obtaining the cancellation of some assessments which were illegitimate (without charge to the company) and agreed a simplified settlement for some minor items disputed for only IRAP purposes and withholding taxes (charge of Euro 247 thousand). In relation to the principal matters disputed in the assessment notices for IRES corporate tax (notification also sent to Maire Tecnimont as tax consolidating company) not yet concluded, the matters related to withholding tax on some financial contracts and dividends from a foreign owned company. The higher taxes requested

Directors’ Report
66
amount to Euro 1,064 thousand, in addition to penalties. The company considers that it has correctly accounted for such transactions and, supported by leading tax consultants, will continue in its dialogue with the Tax Office for a possible settlement (while reserving the right to appeal to the competent Tax Commission).
17. Corporate Governance and Ownership Structure Report
In accordance with the regulatory obligations of Article 123-bis of the CFA, the “Corporate Governance and Ownership Structure Report” is drawn up annually and contains a general outline of the Corporate Governance System adopted by the company and information upon the ownership structure, including the main governance practices applied and the features of the risk management and internal control system with regards to financial disclosure.
This report is available on the company website www.mairetecnimont.it, in the “Governance” section.
18. Treasury shares and shares of the parent company
The company does not hold, directly or indirectly, treasury shares.
As reported in the “Key Events in 2015” paragraph, the Shareholders’ Meeting of December 15, 2015 authorized the purchase and disposal of up to a maximum 10,000,000 ordinary shares for a period of 18 months. From the Shareholders’ Meeting date, as was the case for the entire financial year of 2015 and 2016, shares of the issuer were not acquired or disposed of, directly or indirectly.
19. Going Concern
The Group for 2016 reported net income of Euro 85.3 million (Euro 43.8 million in 2015) and at December 31, 2016 reported consolidated shareholders’ equity of Euro 184.3 million (Euro 126.2 million at December 31, 2015). At the same date, the net financial debt totaled Euro 42.8 million (Euro 125.6 million at December 31, 2015), thanks to the generation of operating cash flows relating both to the result and the working capital changes from operational receipts.
The Group in 2016 generated an Order Intake worth approx. Euro 1,777.8 million, increasing the Backlog at December 31, 2016 to Euro 6,516 million. At 2015 year-end, the Group concluded an additional financial reorganization concerning almost the totality of the medium/long-term debt, in addition to a portion of the short-term debt. This was facilitated through the issue of a new Euro 350 million loan to the subsidiary Tecnimont at improved conditions than those obtained in April 2015. In particular, the debt cost was immediately reduced to 2.5%, with the repayment deadline extended to 5 years.
In relation to the results and the financial position at the end of 2016, and the forecasts within the long-term plan approved on November 12, 2015 there are no significant variances and the results achieved are in line with the strategic projections of the Group confirming the forecasts based on the operational planning of the various projects and order backlog and of those expected to be acquired, confirming the actions undertaken quarter after quarter.
In light of the results and the initiatives which the Group has undertaken and executed, the Board of Directors declare that no doubts surround the Group’s going concern.

67
20. Subsequent events and outlook
The key events were as follows:
MAIRE TECNIMONT EXPANDS ITS UAE PRESENCE THROUGH NEW JOINT VENTURE
Abu Dhabi, January 12, 2017 – Maire Tecnimont S.p.A. announced that its subsidiary Tecnimont Civil Construction has established a new company in UAE called Value Technology Engineering LLC, in partnership with SBK Holding - the holding company of His Highness Sheikh Zayed Bin Sultan Bin Khalifa Bin Zayed Al Nahyan - and Geointelligence, part of Value Lab. The new company marries the significant capacity and know-how of the parties regarding innovative solutions to monitor the presence of sand, other materials and the impact of events, in order to reduce potential hazards generated by extreme desert environmental conditions during the operating phases. Typical fields of application for this innovative technology are plant equipment, oil pipelines and over ground and metro rail networks. This achievement further consolidates the Maire Tecnimont Group presence in the United Arab Emirates, one of the largest Group Oil & Gas, Petrochemical and Infrastructure sector markets, also through collaboration with its strategic partner ARDECO. Value Technology Engineering LLC will develop its patent, giving clients maximum problem solving capacity and advanced technology to improve the security and efficiency of infrastructure and plant. The new company will collaborate with UAE and Italian Universities to grow and share technological development and know-how acquired.
MAIRE TECNIMONT BOLSTERS REVAMPING BUSINESS WITH DEDICATED COMPANY
Maire Tecnimont S.p.A. strengthens its commitment to the revamping segment, one of the drivers of the current business strategy. Vinxia Engineering a.s. was therefore incorporated in the Czech Republic. The new company, held by Tecnimont and Stamicarbon, part of the Maire Tecnimont Group, and by a minority shareholder UNIS (20% holding), will be based in Prague. Vinxia will pursue new revamping project business opportunities in the fertilizers sector in the Russian Federation and Eastern Europe and the Caspian. The Czech company UNIS, headquartered in Brno, is an EPC (Engineering, Procurement and Construction) contractor, providing plant services to the Oil & Gas treatment sector, with subsidiaries in Russia and the countries of the ex-Soviet Union. Revamping (modernization of existing plant) has become one of the main drivers of the hydrocarbons value chain. In particular, on the Russian and Easter European fertilizers market, plant has for some time benefitted from the latest technological standards, in order to boost production capacity, reduce emissions and optimize energy consumption. Stamicarbon in this regard has recently won three engineering contracts for the revamping of three urea plant.
MERGER OF THE SUBSIDIARY MET NEWN S.P.A.
On January 27, 2017, the Extraordinary Shareholders’ Meetings of the subsidiary Met Newen S.p.A. and the subsidiary Tecnimont Civil Construction S.p.A. approved the merger proposal of Met Newen S.p.A. into Tecnimont Civil Construction S.p.A..
The merger is part of the restructuring of industrial and commercial operations and the shortening of the Maire Tecnimont Group’s chain of control, optimizing the business operating model and generating both financial and operating savings through cutting overheads and leveraging on all available economies of scale.
In particular, this initiative directly stems from the new business model of Met Newen S.p.A. for the construction of major renewable sector plant for which Tecnimont Civil Construction S.p.A., thanks to its infrastructural/civil engineering and construction know-how, is the ideal partner for Met Newen S.p.A. for such operations, and is investing a significant amount of the project funding. The completion of the merger and the consolidation of synergies between

Directors’ Report
68
Tecnimont Civil Construction S.p.A. and Met Newen S.p.A. follows through on the 2017-2021 Industrial Plan guidelines for the Infrastructure and Renewable Energy Business Unit, drawn up to generate additional flexibility for the Maire Tecnimont Group’s business model through, on the one hand, consolidated infrastructural experience and, on the other, a singular vision for the renewables business.
21. Outlook
The significant backlog at 2016 year-end indicates for the present year a prevalence of EPC project execution operations, following on from a significant increase in EPC production in Q4 2016, with margins reflecting those generally applied for such contracts.
Organizational streamlining will continue, further cutting the percentage of general production expenses - even considering the Euro 33.9 million reduction already achieved compared to 2011.
Although within a challenging market, the backlog is expected to remain high, thanks to our recognized technological know-how which is continually developing and expanding, recent acquisitions and a flexible model capable of adapting to market demands and changes.
This combination, together with the continually improving financial performance, has delivered a robust commercial pipeline which is expected to produce new major contracts in the current year.

69
22. Parent company operating performance
Maire Tecnimont S.p.A. is a company incorporated in Italy at the Rome Companies Registration Office, acting as the Maire Tecnimont Group holding company. The company Maire Tecnimont S.p.A. reported net income of Euro 9.5 million for 2016, with an EBITDA of Euro 17.9 million and shareholders’ equity of Euro 415.7 million.
The main increase in non-current assets follows the increased value of investments in subsidiaries due to the acquisition of the holding in Met Gas Processing Technologies S.p.A. and the subsequent share capital increase ahead of the completion of the acquisition of the Siluria Technologies investment and the new loans issued to the subsidiary Tecnimont Civil Construction for the management of working capital in the short-term.
Current assets principally comprise tax receivables and in particular the VAT receivable and trade receivables from subsidiaries, also related to the tax consolidation and the Group VAT consolidation.
Shareholders’ Equity at December 31, 2016 was Euro 415,684 thousand, a net decrease on the previous year of Euro 788 thousand, essentially due to the payment of the dividend, while including net income for the year.
Non-current liabilities increased Euro 27,381 thousand; the main changes concerned the obtaining of additional inter-company loans from the subsidiary Tecnimont S.p.A. in order to provide funding to other Group companies requiring liquidity for ordinary operations, in addition to the management of Maire Tecnimont S.p.A.’s working capital. Current liabilities principally concern payables to subsidiaries and relate to interest expense on loans received from the subsidiaries, in addition to other services received; in particular, Maire Tecnimont structurally benefitted from services provided, including the availability of office spaces, in addition to the provision of other related services (general services, facilities, security, equipment) and other AFC services and personnel management.
The remaining amount concerns the current portion of loans and trade payables to third party suppliers.
Balance Sheet
(in Euro thousands) 2016 2015
Non-current assets 803,317 778,171
Current assets 85,003 78,917
Total Assets 888,320 857,088
Shareholders’ Equity 415,684 416,472
Non-current liabilities 432,027 404,646
Current liabilities 40,609 35,970
Shareholders’ Equity & Liabilities 888,320 857,088

Directors’ Report
70
Revenues in the year principally concerned the dividends received in 2016 from the subsidiaries and“ Inter-company services” revenues from the direct subsidiaries. In the previous year, this benefitted from a higher dividend due to the strong performance of the Dutch subsidiary Stamicarbon BV.
Production costs increased, essentially relating to personnel expense following both an average increase in personnel numbers and higher remuneration and incentive policy estimates following the introduction of new long-term incentive plans.
Financial expense was Euro 16.9 million, significantly reducing on the previous year as capital amounts owing to the banks have almost been entirely settled. This mainly concerned interest on inter-company loans for Euro 9.5 million, interest on bank loans for Euro 0.8 million and for Euro 6.6 million the cash and non-cash components of interest on the Euro 80 million equity linked bond issued in 2014.
Income taxes were positive for Euro 5,838 thousand and principally relate to the recognition of deferred tax income on the tax loss and non-deductible interest transferred to the tax consolidation and utilized in the calculation of the Tax consolidation’s assessable income, net of releases in the period and allocation differences on the previous year.
Income Statement
(in Euro thousands) 2016 2015
Total Revenues 66,564 82,597
Total Costs (48,663) (40,772)
EBITDA 17,901 41,825
Amortization, depreciation, write-downs and provis ions (20) (190)
Operating income 17,881 41,635
Financia l income 2,740 2,478
Financia l expenses (16,928) (20,447)
Investment income/(losses) 0 (12,140)
Income before tax 3,693 11,526
Income taxes, current and deferred 5,838 6,996
Net income for the year 9,531 18,522
Earnings (loss) per share 0.031 0.061
Diluted earnings (loss) per share 0.028 0.054
The “Reconciliation between the net income of Maire Tecnimont S.p.A. and Group net income” and the “Net equity of Maire Tecnimont S.p.A. and Group net equity” is reported in the explanatory notes to the consolidated financial statements.

71
Consolidated Financial
Statements and
Explanatory Notes
at December 31, 2016

Maire Tecnimont Group
72
23. Financial Statements
23.1. Consolidated Income Statement
(in Euro thousands)
Note 2016 2015
Revenues 27.1 2,408,768 1,637,455
Other operating revenues 27.2 26,658 32,171
Total revenues 2,435,426 1,669,626
Raw materia ls and consumables 27.4 (940,127) (653,909)
Serv ice costs 27.5 (876,271) (523,862)
Personnel expense 27.6 (333,069) (273,293)
Other operating expenses 27.7 (125,936) (87,721)
Total Costs (2,275,402) (1,538,785)
EBITDA 160,025 130,841
Amortization, deprec iation and write-downs 27.8 (5,759) (6,118)
Write-down of current assets 27.9 (738) (2,419)
Provisions for risks and charges 27.9 (955) (6,878)
EBIT 152,572 115,427
Financ ial income 27.10 16,784 2,510
Financ ial expenses 27.11 (35,552) (39,130)
Investment income/(expense) 27.12 30 (1,194)
Income before tax 133,835 77,613
Income taxes, current and deferred 27.13 (48,542) (33,822)
Net income 85,293 43,791
Group 74,371 43,956
Minorities 10,922 (165)
Basic earnings per share 27.14 0.243 0.144
Diluted earnings per share 0.217 0.129
The transactions with related parties, pursuant to Consob Resolution No. 15519 of July 27, 2016, are illustrated in the separate disclosure “Related Party Transactions”.

73
23.2. Consolidated Comprehensive Income Statement
(in Euro thousands)
Note December 31, 2016
December 31, 2015
Net income for the year 85,293 43,791
Other comprehensive income/(expense) which may not be subsequently reclassified to income/(loss) for the period:
Actuaria l ga ins/(losses) 28.18 (449) 4
Relative tax effect 123 (1)
Total other comprehensive income/(expense) which may not be subsequently reclassified to income/(loss) for the period:
(325) 3
Other comprehensive income/(expense) which may be subsequently reclassified to income/(loss) for the period:
Translation diffe rences 28.18 (1,628) (4,204)
Net valuation of derivatives instruments:
ation derivative instruments 28.18 (18,582) (6,440)
• derivative financ ial instruments
5,110 1,771
• relative tax effect
Total other comprehensive income/(expense) which may be subsequently reclassified to income/(loss) for the period:
(15,100) (8,873)
Total other comprehensive income/(expense), net of the tax effect
(15,426) (8,870)
Total comprehensive income 68,867 34,921
Attributable to:
Up
58,946 35,086
• Group
10,922 (165)
• Minorities
Basic comprehens ive earnings per share
0.193 0.115
Diluted comprehens ive earnings per share
0.172 0.103
The transactions with related parties , pursuant to Consob Resolution No. 15519 of July 27, 2016, are illus trated in the separate disc losure “Re lated Party Transactions”.

Maire Tecnimont Group
74
23.3. Consolidated Balance Sheet
(in Euro thousands)
Note December 31, 2016
December 31, 2015
Assets
Non-current assets
Property , plant and equipment 28.1 33,582 33,631
Goodwill 28.2 291,754 291,754
Other intangible assets 28.3 32,108 26,076
Investments in associates 28.4 13,055 10,060
Financ ial instruments – Derivatives 28.5 9,059 1,610
Other non-current financia l assets 28.6 15,037 10,598
Other non-current assets 28.7 69,632 90,996
Deferred tax assets 28.8 68,524 78,417
Total non-current assets 532,753 543,142
Current assets
Inventories 28.9 5,587 902
Advance payments to suppliers 28.9 357,132 160,753
Construction contracts 28.10 879,639 504,506
Trade rece ivables 28.11 526,402 393,094
Current tax assets 28.12 122,873 123,074
Financ ial instruments – Derivatives 28.13 21,315 854
Other current financ ial assets 28.14 7,373 8,410
Other current assets 28.15 99,185 68,954
Cash and cash equivalents 28.16 497,138 362,385
Total current assets 2,516,646 1,622,932
Non-current assets class ified as held-for-sale 0 0
Elimination of assets to and from assets/liabilities held-for-sale 0 0
Total Assets 3,049,399 2,166,074
The transactions with related parties, pursuant to Consob Resolution No. 15519 of July 27, 2016, are illustrated in the separate disclosure “Related Party Transactions”.

75
(in Euro thousands)
Note December 31, 2016
December 31, 2015
Shareholders’ Equity
Share capital 28.17 19,690 19,690
Share premium reserve 28.17 224,698 224,698
Other reserves 28.17 64,456 62,019
Valuation reserve 28.17 (21,233) (7,436)
Total shareholders` equity and reserves 28.17 287,612 298,971
Retained earnings/(accumulated losses) 28.17 (192,405) (218,056)
Net income for the year 28.17 74,371 43,956
Total Group Shareholders’ Equity 169,577 124,871
Minorities 15,079 1,328
Total Shareholders’ Equity 184,656 126,199
Non-current liabilities
Financia l debt - non-current portion 28.18 306,559 346,001
Provis ions for risk and charges - beyond 12 months 28.19 70,524 48,695
Deferred tax liabilities 28.8 25,055 20,597
Post-employment & other employee benefits 28.20 11,689 12,204
Other non-current liabilities 28.21 48,861 28,394
Financia l instruments – Derivatives 28.22 4,045 3,789
Other non-current financial liabilities 28.23 75,117 73,113
Total non-current liabilities 541,849 532,793
Current liabilities
Short-term debt 28.24 143,205 75,606
Provis ions for risks and charges - within 12 months 28.25 3,906 0
Tax payables 28.26 50,536 33,331
Financia l instruments – Derivatives 28.27 54,540 10,610
Other current financia l liabilities 28.28 330 330
Client advance payments 28.29 299,233 259,373
Construction contracts 28.30 555,028 344,969
Trade payables 28.31 1,150,157 726,779
Other current liabilities 28.32 65,956 56,084
Total current liabilities 2,322,894 1,507,082
Liabilities directly associated with non-current assets classified as held-for-sale
0 0
Elimination of liabilities to and from assets/liabilities he ld-for-sale 0 0
Total Shareholders’ Equity and Liabilities 3,049,399 2,166,074
The transactions with related parties , pursuant to Consob Resolution No. 15519 of July 27, 2016, are illus trated in the separate disc losure “Re lated Party Transactions”.

Maire Tecnimont Group
76
24. Statement of changes in Consolidated Shareholders’ Equity
December 31, 2014 19,690 224,698 75,297 (9,074) (2,770) (265,940) 50,297 92,199 1,506 93,705
Allocation of the result 50,297 (50,297) - -
Change to consolidation scope -
Other changes (2,413) (2,413) (13) (2,426)
Distribution dividends - - -
Comprehensive Income/(loss) for year (4,204) (4,666) 43,956 35,086 (165) 34,921
December 31, 2015 19,690 224,698 75,297 (13,278) (7,436) (218,056) 43,956 124,871 1,328 126,199
December 31, 2015 19,690 224,698 75,297 (13,278) (7,436) (218,056) 43,956 124,871 1,328 126,199
Allocation of the result 43,956 (43,956) - -
Change to consolidation scope - 2,775 2,775
Other changes (3,946) (3,946) 54 (3,892)
IFRS 2 (Employee share plans) 4,066 4,066 4,066
Distribution dividends (14,360) (14,360) (14,360)
Comprehensive Income/(loss) for year (1,628) (13,797) 74,371 58,946 10,922 69,867
December 31, 2016 19,690 224,698 79,363 (14,907) (21,233) (192,405) 74,371 169,577 15,079 184,656
G roup & Minority int. c onsol. share.
equity
( in E uro thousands)
Share ca pital
Share premium reserve
Other reserves
Translation reserve
V aluation reserve
Retained earnings/ accum. losses
Income/ ( loss) f or year
Group Shareholders’
E quity
Minority interest
capital & reserves

77
25. Consolidated Cash Flow Statement (indirect method)
Cash and cash equivalents at beginning of year (A) 362,385 160,242
Operations
Net Income of Group and Minorities 85,293 43,791
Adjustments:
- Amortization of intangible assets 2,705 3,069
- Depreciation of non-current tangible assets 3,054 3,049
- Provisions 1,693 9,297
- (Revaluations)/Write-downs of investments (30) 1,193
- Financial (Income)/Charges 18,768 36,621
- Income & deferred tax 48,542 33,821
- Capital (Gains)/Losses 16 (68)
- (Increase) / Decrease inventories/supplier advances (201,064) (7,988)
- (Increase) / Decrease in trade receivables (133,308) 81,288
- (Increase) / Decrease in construction contract receivables (359,626) (88,126)
- Increase /(Decrease) in other liabilities 90,855 3,473
- (Increase) / Decrease in other assets (80,130) 27,559
- Increase / (Decrease) in trade payables/advances from clients 463,239 68,865
- Increase / (Decrease) in construction contract payables 210,059 98,012
- Increase / (Decrease) in provisions (incl. post-employ. benefits) 16,673 (17,361)
- Income taxes paid (3,551) (6,660)
Cash flow from operations (B) 163,187 289,833
Investments
(Investment)/Disposal of non-current financial assets (3,022) (3,121)
(Investment)/Disposal of intangible assets (8,737) (3,123)
(Investment)/Disposal of associated companies (8,810) (1,002)
(Increase)/Decrease in other investments - (103)
Cash flow from investments (C) (20,568) (7,350)
Financing
Increase/(Decrease) in bank overdrafts (29,702) (31,045)
Change in financial payables 39,092 (55,072)
(Increase)/Decrease in securities/bonds 3,405 495
Change in other financial assets/liabilities (6,301) 5,279
Dividends (14,360) 0
Cash flow from financing (D) (7,867) (80,342)
Increase/(Decrease) in cash and cash equivalents (B +C+D) 134,753 202,143
Cash and cash equivalents at end of year (A+B+C+D) 497,138 362,385
of which: Cash and cash equivalents of Discontinued Operations - -
CASH AND CASH EQUIVALENTS AT END OF YEAR REPORTED I N FINANCIAL STATEMENTS 497,138 362,385
( in Euro thousands)December 31,
2016December 31,
2015

Maire Tecnimont Group
78
26. Explanatory Notes at December 31, 2016
BASIS OF PREPARATION
INTRODUCTION
Maire Tecnimont S.p.A. is a company incorporated in Italy at the Rome Companies Registration Office. The addresses of the registered office and principal headquarters of Group activities are reported in the introduction to the Annual Report.
The financial statements for the year 2016 were prepared in accordance with IFRS issued by the International Accounting Standards Board (“IASB”) and approved by the European Union, as well as the provisions issued under Article 9 of Legislative Decree No. 38/2005. IFRS include all the revised international accounting standards (IAS) and all interpretations of the International Financial Reporting Interpretations Committee (“IFRIC”), previously known as the Standing Interpretations Committee (“SIC”). The financial statements are prepared under the historical cost convention, modified where applicable for the valuation of certain financial instruments. The present consolidated financial statements at December 31, 2016 are expressed in Euro, as the majority of Group operations are carried out in this currency. The foreign subsidiaries are included in the consolidated financial statements in accordance with the accounting policies described in the notes below.
GOING CONCERN
The Group and the Company consider the going concern principle appropriate for the preparation of the consolidated financial statements at December 31, 2016.
FINANCIAL STATEMENTS
The financial statements prepared by the Group include the integrations introduced following the application of “IAS 1 revised”, as follows:
The Balance Sheet accounts are classified between current and non-current, while the Consolidated Income Statement and Comprehensive Income Statement are classified by nature of expenses. The Consolidated Cash Flow Statement is presented in accordance with the indirect method, adjusting the income for the period with non-cash items. The Statement of change in Shareholders’ Equity reports comprehensive income (charges) for the period and the changes in Shareholders’ Equity.
ACCOUNTING STANDARDS, AMENDMENTS AND IFRS INTERPRETATIONS APPLICABLE
FROM JANUARY 2016
The following IFRS accounting standards, amendments and interpretations were applied for the first time by the Group from January 1, 2016:
• Amendments to IAS 19 “Defined Benefit Plans: Employee Contributions” (published on November 21, 2013): requires the recognition in the financial statements of contributions made by employees or third parties to defined benefit plans.
• Amendment to IFRS 11 - Joint Arrangements – “Accounting for acquisitions of interests in joint operations” (published on May 6, 2014): requires the recognition of the acquisition of interests in a joint operation, in which the activity of the joint operation constitutes a business.
• Amendments to IAS 16 Property, Plant and Equipment and IAS 41 Agriculture – “Bearer Plants” (published on June 30, 2014): bearer plants, therefore plants creating

79
annual harvests (for example vines and hazelnuts plants) must be recognized according to IAS 16 (rather than IAS 41).
• Amendments to IAS 16 Property, Plant and Equipment and IAS 38 Intangibles Assets – “Clarification of acceptable methods of depreciation and amortization” (published on May 12, 2014): amortization or depreciation based on revenue recognition is generally not appropriate, as according to the amendment revenues generated by an asset which includes the use of an asset subject to amortization or depreciation generally reflects factors other than the sole consumption of economic benefits from the asset itself, which is however a requirement for amortization or depreciation.
• Amendment to IAS 1 - “Disclosure Initiative” (published on December 18, 2014): the amendment seeks to provide clarification on disclosure elements which may be considered impediments to a clear preparation of the financial statements.
• Amendments to IFRS 10, IFRS 12 and IAS 28 “Investment Entities: Applying the Consolidation Exception” (published on December 18, 2014), containing amendments to the issues emerging following the application of the consolidation exception granted to investment entities.
Finally, within the annual improvement process, on December 12, 2013, the IASB published the “Annual Improvements to IFRS: 2010-2012 Cycle” document (among which IFRS 2 Share-Based Payments – Definition of vesting condition, IFRS 3 Business Combination – Accounting for contingent consideration, IFRS 8 Operating segments – Aggregation of operating segments and Reconciliation of total of the reportable segments’ assets to the entity’s assets, IFRS 13 Fair Value Measurement – Short-term receivables and payables) and on September 25, 2014 “Annual Improvements to IFRS: 2012-2014 Cycle” (among which: IFRS 5 – Non-current Assets Held for Sale and Discontinued Operations, IFRS 7 – Financial Instruments: Disclosure and IAS 19 – Employee Benefits) which partially supplements the pre-existing standards. The amendments will be applicable from January 1, 2016. The adoptions of these amendments do not have any effects on the Group consolidated financial statements.
IFRS AND IFRIC ACCOUNTING STANDARDS, AMENDMENTS AND INTERPRETATIONS
APPROVED BY THE EU, NOT YET MANDATORY AND NOT ADOPTED IN ADVANCE BY THE
GROUP AT DECEMBER 31, 2016
• Standard IFRS 15 – Revenue from Contracts with Customers (published on May 28, 2014 and supplemented with further clarifications on April 12, 2016) which replaces IAS 18 - Revenue and IAS 11 - Construction Contracts, in addition to the interpretations IFRIC 13 - Customer Loyalty Programs, IFRIC 15 - Agreements for the Construction of Real Estate, IFRIC 18- Transfers of Assets from Customers and SIC 31 - Revenues-Barter Transactions Involving Advertising Services. The standard establishes a new revenue recognition model, which will apply to all contracts with clients, with the exception of those falling under the application of other IAS/IFRS such as leasing, insurance contracts and financial instruments. The essential issues for the recognition of revenues according to the new model are: the identification of the contract with the client; the identification of the performance obligations of the contract; the establishment of the price; the allocation of the price to the performance obligations of the contract; the recognition criteria of the revenues when the entity satisfies each of the performance obligations.
The standard will be effective from January 1, 2018, although advance application is permitted. The directors consider that the application of IFRS 15 may have impacts on the amounts recognized as revenues and on the relative disclosure in the Group consolidated financial statements. During 2017 activities will commence on a project

Maire Tecnimont Group
80
with reference to the areas to be updated as indicated above in order to identify the potential impact on the financial statements and verify any adjustments required to the internal control system relating to financial reporting. However, it is not possible to provide a reasonable estimate of the effects until the Group has completed a detailed analysis.
• Final version of IFRS 9 - Financial instruments (published on July 24, 2014). The document incorporates the results of the Classification and measurement, Impairment and Hedge accounting phases of the IASB project to replace IAS 39:
o the standard introduces new criteria for the classification and measurement of financial assets and liabilities;
o The impairment requirements are based on an expected credit loss (ECL) model that replaces the IAS 39 incurred loss model, utilizing supporting information, available without unreasonable charges or effort, which includes historic, current and projected figures;
o introduces a new hedge accounting model (increase in the types of transactions eligible for hedge accounting, changes in the accounting method of forward contracts and options when included in a hedge accounting relationship, change in the effectiveness test).
The new standard, which replaces the previous version of IFRS 9, must be applied for financial statements beginning on or after January 2018.
The directors consider that the application of IFRS 9 may have a significant impact on the amounts and the relative disclosure in the Group consolidated financial statements.
During 2017 activities will commence on a project with reference to three areas to be updated as indicated above in order to identify the potential impact on the financial statements and verify any adjustments required to the internal control system relating to financial reporting. However, it is not possible to provide a reasonable estimate of the effects until the Group has completed a detailed analysis
IFRS STANDARDS, AMENDMENTS AND INTERPRETATIONS NOT YET APPROVED BY THE
EUROPEAN UNION
At the date of the present Annual Report, the relevant bodies of the European Union have not yet concluded the process necessary for the implementation of the amendments and standards described below.
• On January 13, 2016, the IASB published the new standard IFRS 16 - Leases, which replaces IAS 17 – Leases, as well as the interpretations IFRIC 4 Determining whether an Arrangement contains a Lease, SIC-15 Operating Leases—Incentives and SIC-27 Evaluating the Substance of Transactions Involving the Legal Form of a Lease. The new standard provides a new definition of leases and introduces a criterion based on control (right of use) of an asset to distinguish leasing contracts from service contracts, identifying essential differences: the identification of the asset, the right of replacement of the asset, the right to obtain substantially all the economic benefits from the use of the asset and the right to use the asset underlying the contract. The standard establishes a single model to recognize and measure leasing contracts for the leasee (lessees) which provides also for the recognition of operating leases under assets with a related financial payable, providing the possibility not to be recognize as leasing contracts “low-value assets” and leasing contracts less than 12 months. This Standard does not contain significant amendments for lessors. The standard is effective from January 1, 2019, although advance application is permitted, only for companies which have applied in advance IFRS 15 - Revenue from Contracts with Customers. It is not possible to provide a reasonable estimate of

81
the effects until the Group has completed a detailed analysis of the relative contracts.
• On January 19, 2016, the IASB published the “Recognition of Deferred Tax Assets for Unrealized Losses (Amendments to IAS 12)” document, which contains amendments to IAS 12. The document provides clarifications on the recognition of deferred tax assets on unrealized losses on the occurrence of certain circumstances and on estimates of assessable income for future years. The amendments are effective from January 1, 2017, although advance application is permitted. The Directors are currently assessing the possible effects from the introduction of these amendments on the Group consolidated financial statements.
• On January 29, 2016, the IASB published the “Disclosure Initiative (Amendments to IAS 7)” document, which contains amendments to IAS 7. The document provides clarifications to improve disclosure on financial liabilities. In particular, the amendments require the provision of disclosure which enables readers of the financial statements to understand the changes to liabilities following funding operations. The amendments are effective from January 1, 2017, although advance application is permitted. The presentation of comparative disclosure relating to preceding periods is not required. The Directors are currently assessing the possible effects from the introduction of these amendments on the Group consolidated financial statements.
• On June 20, 2016, the IASB published the “Classification and measurement of share-based payment transactions (Amendments to IFRS 2)” document, which contains clarifications upon the recognition of the effects of vesting conditions in the presence of cash-settled share-based payments, on the classification of share-based payments with characteristics of net settlement and the recognition of the amendments to the terms and conditions of a share-based payment which changes the classification from cash-settled to equity-settled. The amendments are effective from January 1, 2018, although advance application is permitted. The Directors are currently assessing the possible effects from the introduction of these amendments on the Group consolidated financial statements.
• “Applying IFRS 9 Financial Instruments with IFRS 4 Insurance Contracts” (published on September 12, 2016). For entities primarily involved in insurance activities, the amendments clarify the considerations deriving from application of the new IFRS 9 to financial assets, before the replacement by the IASB of the current IFRS 4 with the new standard currently under discussion, under which however financial liabilities are measured.
• “Annual Improvements to IFRSs: 2014-2016 Cycle”, published on December 8, 2016 (including IFRS 1 First-Time Adoption of International Financial Reporting Standards - Deletion of short-term exemptions for first-time adopters, IAS 28 Investments in Associates and Joint Ventures – Measuring investees at fair value through profit or loss: an investment-by-investment choice or a consistent policy choice, IFRS 12 Disclosure of Interests in Other Entities – Clarification of the scope of the Standard) which partially integrates the pre-existing standards. The Directors are currently assessing the possible effects from the introduction of these amendments on the Group consolidated financial statements.
• Interpretation IFRIC 22 “Foreign Currency Transactions and Advance Consideration” (published on December 8, 2016). The interpretation provides guidelines for transactions in foreign currencies where advances or non-monetary payments on account are recorded in the financial statements, before the recognition of the relative asset, cost or revenue. This document provides indications on how an entity should determine the date of a transaction, and consequently, the exchange rate to

Maire Tecnimont Group
82
be utilized concerning operations in foreign currencies concerning payments made or received in advance. IFRIC 22 is applicable from January 1, 2018, but advanced application is permitted. The Directors are currently assessing the possible effects from the introduction of these amendments on the Group consolidated financial statements.
• Amendment to IAS 40 “Transfers of Investment Property” (published on December 8, 2016). These amendments clarify the transfers of a building to, or from, investment property. In particular, an entity shall reclassify a building to, or from, investment property only when there is a clear indication of a change in the use of the building. This change must be attributable to a specific event and shall not therefore be limited to only a change in intention by management of the entity. The amendments are applicable from January 1, 2018, although advance application is permitted. The Directors are currently assessing the possible effects from the introduction of these amendments on the Group consolidated financial statements.
• On September 11, 2014, the IASB published an amendment to IFRS 10 and IAS 28 Sales or Contribution of Assets between an Investor and its Associate or Joint Venture. The document was published in order to resolve the current conflict between IAS 28 and IFRS 10 relating to the measurement of the gain or loss from the sale or conferment of a non-monetary asset to a joint venture or associate in exchange for a share of the capital of this latter. Currently, the IASB has suspended the application of this amendment.
CONSOLIDATION SCOPE
In addition to the Parent Company Maire Tecnimont S.p.A., the consolidation scope includes the directly and indirectly held subsidiaries. In particular, the companies consolidated are those in which Maire Tecnimont S.p.A. exercises control, either due to a direct shareholding or the indirect holding of the majority of the voting rights, or having the power to determine the financial and operating choices of the company/entity, obtaining the relative benefits, irrespective of the shareholding. The Joint Operations in which two or more parties undertake an economic activity which is subject to joint control are consolidated under the proportional method. All the subsidiaries are included in the consolidated scope at the date in which control is acquired by the Group. Entities are excluded from the consolidation scope from the date the Group cedes control.
The changes in the consolidation scope compared to December 31, 2015 were as follows:
• Inclusion in the consolidation scope of Tecnimont HQC S.c.a.r.l. and Tecnimont HQC SD Bhd. The two companies were incorporated at the end of 2015 following the project awarded for a petro-chemical plant in Malaysia by Petronas for the Rapid complex; they are consolidated under the line-by-line method with the Group shareholding of 60%;
• Imm.Lux. S.A, ML 3000 S.c.a.r.l. and Noy Engineering S.r.L were liquidated and discontinued operations;
• In May, the merger by incorporation was approved of KT Immobiliare Srl into KT S.p.A. This merger is within the corporate reorganization project of the Maire Tecnimont Group.
• The holding in KT Star Co. S.A.E. was consolidated under the line-by-line method.
• Incorporation and inclusion in the consolidation scope of MET NEWen Mexico SA de CV involved the construction of a new wind park in Mexico.

83
For the consolidation in accordance with IFRS, all consolidated subsidiaries prepared a specific “reporting package”, based on IFRS accounting standards adopted by the Group and illustrated below, reclassifying and/or adjusting the accounts approved by the boards of the respective companies.
The following criteria and methods were utilized in the consolidation: a) adoption of the line-by-line consolidation method, with the full recognition of assets,
liabilities, costs and revenue, irrespective of the shareholding; b) adoption of the proportion consolidation method, recognizing the percentage held in
the assets, liabilities, costs and revenue; c) elimination of balance sheet and income statement transactions between Group
companies, including the reversal of any gains or losses not yet realized, deriving from operations between consolidated companies, recording any consequent deferred tax effects;
d) elimination of inter-company dividends and relative adjustment of opening equity reserves;
e) elimination of the book value of investments, relating to companies included in the consolidation, and the corresponding share in net equity and allocation of the positive and/or negative differences deriving from the relative accounts (assets, liabilities and equity), defined with reference to the date of acquisition of the investment and subsequent changes;
f) recognition, in separate equity and income statement accounts, of the share capital, reserves and income for the period of minorities;
g) adoption of the conversion method of financial statements of foreign companies which prepare their financial statements in currencies other than the Euro, which provides for the conversion of all monetary assets and liabilities at the period-end rate and the average period rate for income statement items. The difference deriving from the conversion is recorded under equity reserves.
The exchange rates applied for the conversion of financial statements in foreign currencies illustrated below are those published by the UIC:
Exchange rates
January-December 16
31.12.2016 January-December
15 31.12.2015
Euro/US Dollar 1.1069 1.0541 1.10951 1.0887
Euro/Brazilian Rea l 3.8561 3.4305 3.7004 4.3117
Euro/Indian Rupee 74.3717 71.5935 71.1956 72.0215
Euro/Nigeria Naira 285.4470 332.3050 219.5150 216.7030
Euro/Chilean Peso 748.4770 704.9451 726.4060 772.7126
Euro/Russian Ruble 74.1446 64.3000 68.0720 80.6736
Euro/Saudi Arabia Riyal 4.1516 3.9544 4.1620 4.0862
Euro/Polish Zloty 4.3632 4.4103 4.1841 4.2639
Euro/Yen 120.1970 123.4000 134.3140 131.0700
Euro/Malays ian Ringgit 4.5835 4.7287
Euro/Mexican Pesos 20.6673 21.7719

Maire Tecnimont Group
84
The consolidation scope at December 31, 2016 is shown below:
Companies consolidated by the line-by-line method:
Consolidated companies Consolidation
method Location/Country Currency Share capital
%
Group Through:
Maire Tecnimont S.p.A. Line-by-line Italy (Rome) EUR 19,689,550 – Parent Company
Tecnimont S.p.A. Line-by-line Italy (Milan) EUR 1,000,000 100% Maire Tecnimont S.p.A. 100%
Tecnimont Civil Construction S.p.A.
Line-by-line Italy EUR 6,000,000 100% Maire Tecnimont S.p.A. 100%
Met NewEN S.p.A. Line-by-line Italy EUR 3,807,549 100% Maire Tecnimont S.p.A. 99%
Tecnimont Civil Construction
S.p.A. 1%
Met NewEN Mexico SA de C V Line-by-line Mexico MXN 4,200,000 100% Met NeweEN S.p.A. 99%
Tecnimont Messico SA de
CV 1%
Met T&S Ltd Line-by-line Italy GBP 100,000 100% Met NewEN S.p.A. 100%
MET GAS Processing Technologies S.p.A. (formerly Protecma S.r.l.)
Line-by-line Italy EUR 4,000,000 100% Maire Tecnimont S.p.A. 100%
Stamicarbon B.V. Line-by-line Netherlands EUR 9,080,000 100% Maire Tecnimont S.p.A. 100%
KT S.p.A. Line-by-line Italy EUR 6,000,000 100% Maire Tecnimont S.p.A. 100%
Processi Innovativi S.r.l Line-by-line Italy EUR 45,000 56.67% KT S.p.A. 56.67%
KTI Arabia LLC Line-by-line Saudi Arabia Riyal 500,000 70% KT S.p.A. 70%
KT Cameroun S.A. Line-by-line Cameroon XAF 70,000,000 75% KT S.p.A. 75%
KT Star CO. S.A.E. Line-by-line Egypt USD 1,000 40% KT S.p.A. 40%
MST S.r.l. Line-by-line Italy EUR 400,000 100% Tecnimont S.p.A. 100%
TCM FR S.A. Line-by-line France EUR 37,000 100% Tecnimont S.p.A. 100%
TPI Tecnimont Planung und Industrieanlagenbau Gmbh
Line-by-line Germany EUR 260,000 100% Tecnimont S.p.A. 100%
Tws S.A. Line-by-line Switzerland EUR 507,900 100% T.P.I. 100%
Tecnimont Poland Sp.Zo.o Line-by-line Poland Plz 50,000 100% Tecnimont S.p.A. 100%
Tecnimont Arabia Ltd. Line-by-line Saudi Arabia Riyal 5,500,000 100% Tecnimont S.p.A. 100%
Tecnimont Nigeria Ltd. Line-by-line Nigeria Naire 10,000,000 100% Tecnimont S.p.A. 100%
Tecnimont Russia Line-by-line Russia RUR 18,000,000 100%
Tecnimont S.p.A. 99%
T.P.I. 1%
Tecnimont Private Limited Line-by-line India Indian rupee
13,968,090 100% Tecnimont S.p.A. 100%
Tecnimont do Brasil Ltda. Line-by-line Brazil Real 571,900,501 100%
Tecnimont S.p.A. 99.30%
Maire Engineering France S.A. 0.70%
Tecnimont Chile Ltda. Line-by-line Chile Pesos 57,303,813,403 100.00%
Tecnimont S.p.A. 95.71%
Tecnimont do Brasil Ltda. 4.28%
T.P.I. 0.01%
Consorcio ME Ivai Line-by-line Brazil Real 12,487,309 65% Tecnimont do Brasil Ltda. 65%
Tecnimont Mexico SA de CV Line-by-line Mexico MXN 50,000.00 100%
Tecnimont S.p.A. 90.00%
TWS S.A, 10.00%
Maire Engineering France S.A.
Line-by-line France EUR 680,000 99.98% Tecnimont S.p.A. 99.98%
Tecnimont USA INC. Line-by-line Texas (USA) USD 4,430,437 100.00% Tecnimont S.p.A. 100.00%
TecnimontHQC S.c.a.r.l. Line-by-line Italy EUR 10,000 60.00% Tecnimont S.p.A. 60.00%
TecnimontHQC SD Bhd. Line-by-line Malaysia MYR 750,000 60.00% Tecnimont S.p.A. 60.00%

85
Consolidated companies Consolidation
method Location/Country Currency Share capital
%
Group Through:
Transfima S.p.A. Line-by-line Italy EUR 1,020,000 51% Tecnimont C ivil C onstruction
S.p.A. 51%
Transfima G.E.I.E. Line-by-line Italy EUR 250,000 50.65%
Tecnimont C ivil C onstruction S.p.A 43%
Transfima S.p.A. 15%
Cefalù 20 S.c.a.r.l. Line-by-line Italy EUR 20,000,000 99.99% Tecnimont C ivil C onstruction
S.p.A 99.99%
Corace S.c.a.r.l. in liquidation
Line-by-line Italy EUR 10,000 65% Tecnimont C ivil C onstruction
S.p.A 65%
MGR Verduno 2005 S.p.A. Line-by-line Italy EUR 600,000 95.95% Tecnimont C ivil C onstruction S.p.A
95.95%
Birillo 2007 S.c.a.r.l. Line-by-line Italy EUR 1,571,940 100%
Tecnimont C ivil C onstruction S.p.A
98.4%
MST S.r.l. 1.6%
Coav S.c.a.r.l. in liquidation Line-by-line Italy EUR 25,500 51% Tecnimont C ivil C onstruction
S.p.A 51.0%
TCC Denmark Aps Line-by-line Italy EUR 10,728 100% Tecnimont C ivil C onstruction
S.p.A 100.0%
Companies consolidated line-by-lined based on shareholding:
Consolidated companies Consolidation
method Location/Country Currency
Share capital
% Group Through:
JTS C ontracting Company Ltd Proportional Malta EUR 100,000 45%
Tecnimont S.p.A. 35%
TC M FR S.A. (formerly Sofregaz S.A.) 10%
Sep FOS(*) Proportional France EUR - 50%
Tecnimont S.p.A. 49%
TC M FR S.A. (formerly Sofregaz S.A.)
1%
Consorzio Turbigo 800 Proportional Italy EUR 100,000 50% Tecnimont S.p.A. 50%
JV Gasco(*) Proportional United Arab Emirates
USD - 50% Tecnimont S.p.A. 50%
JO Saipem-Dodsal-Tecnimont (*)
Proportional United Arab Emirates
AED - 32% Tecnimont Civil Construction S.p.A.
32%
UTE Hidrogeno C adereyta(*) Proportional Spain Eur 6,000 43% KT S.p.A 43%
KT- C ameroun S.A. (*) Proportional Cameroon XAF 70,000,000 75% KT- Kinetics Technology 75%
(*) Joint c ontrol agreement incorporated to manage a specific project and measured as a joint operation in accordance with the
introduction of IFRS 11.

Maire Tecnimont Group
86
ACCOUNTING POLICIES
The main accounting policies adopted in the preparation of the financial statements are illustrated below:
BUSINESS COMBINATIONS
Business combinations are recorded in accordance with the purchase method. The cost of the business combination is measured as the aggregate of the fair values, at the date of exchange, of assets acquired, liabilities incurred or assumed, and equity instruments issued by the Group, in exchange for control of the company acquired.
The identifiable assets, liabilities and contingent liabilities of the company acquired that comply with the conditions for recognition under IFRS 3 are recognized at their fair value at the acquisition date, with the exception of non-current assets (or disposal groups) which are classified as held-for-sale in accordance with IFRS 5 and are recognized and measured at fair value, net of sales costs.
Goodwill deriving from acquisition is recognized under assets and initially measured at cost, represented by the excess of the acquisition cost compared to the Group share in the present value of the identifiable assets, liabilities and contingent liabilities recognized. Where, after the measurement of these values, the Group share in the present value of the identifiable assets, liabilities and contingent liabilities exceeds the acquisition cost, the excess is immediately recorded in the Income Statement.
The share of minorities in the entity acquired is initially measured in line with their share of the present value of the assets, liabilities and contingent liabilities recognized.
INVESTMENTS IN ASSOCIATES
An associate is a company in which the Group has significant influence, but not full control or joint control. The Group exerts its influence by taking part in the associate’s financial and operating policy decisions.
The results and assets and liabilities of associates are recorded in the consolidated financial statements under the Equity method, except where the investments are classified as held-for-sale in which case they are recognized separately in accordance with IFRS 5 - Non-current assets held-for-sale and discontinued operations.
Under this method, investments in associates are recorded in the Balance Sheet at cost, adjusted for changes after the acquisition in the net assets of the associates, less any impairment in the value of the individual investments. Losses of associates in excess of the Group share (including medium/long-term interests which, in substance are part of the Group net investment in the associate) are not recorded unless the Group has an obligation to cover them.
INVESTMENTS IN JOINT VENTURES AND JOINT OPERATIONS
A joint operation is a contractual agreement whereby the Group undertakes a jointly controlled business venture with other parties. Joint control is defined as the contractually shared control over a business activity and only exists when the financial and operating strategic decisions of the activities requires the unanimous consent of the parties sharing control.
When an enterprise of the Group undertakes its activities directly through joint operations, the assets and liabilities jointly controlled with other participants are recognized in the consolidated financial statements of the company based on the Group holding and classified in accordance with their nature. The liabilities and the costs incurred directly in relation to the activity jointly controlled are recognized on the basis of the accruals principle. The share of the gains deriving from the sale or use of the resources produced by the joint operation, net of the relative share of expenses, are recognized when it is probable that the economic

87
benefits deriving from the operations will benefit the Group and their amount may be measured reliably.
Joint venture agreements, which involve the incorporation of a separate entity in which each participant has a shareholding, are considered joint control investments. The Group records the joint control investments utilizing the equity method. Under this method the joint ventures are recorded in the Balance Sheet at cost, adjusted for changes after acquisition in the net assets of the associates, less any impairment in the value of the individual investments. The losses of the associates exceeding the Group interest and including medium/long-term interests (which, in substance are part of the Group net investment in the associates) are not recorded, unless the Group has an obligation to cover such losses.
Unrealized profits and losses on transactions between a Group company and a joint controlled entity are eliminated to the extent of the Group’s share in the joint controlled entity, except when the unrealized losses constitute a reduction in the value of the asset transferred.
GOODWILL
Goodwill deriving from the acquisition of a subsidiary or a joint controlled entity represents the excess of the acquisition cost over the Group’s share in the fair value of the identifiable assets, liabilities and contingent liabilities of the subsidiary or the joint controlled entity at the acquisition date. Goodwill is recorded as an asset and an impairment test is undertaken annually.
Impairments are recorded immediately in the Income Statement and may not be subsequently restated, in accordance with IAS 36 - Impairment of assets.
For the impairment test, the goodwill acquired in a business combination must be allocated to each cash-generating unit of the acquirer, or groups of cash-generating units, which will gain from the synergies of the business combination. When the recoverable value of the cash-generating unit (or groups of cash- generating units) is lower than the book value, a write-down is recorded.
On the disposal of a subsidiary or joint controlled entity, the part of the goodwill attributable to the disposal is included in the measurement of the gain or loss.
Goodwill deriving from acquisitions prior to the transition date to IFRS are maintained at the values applicable under Italian GAAP at that date and which were subject to an impairment test at that date.
NON-CURRENT ASSETS CLASSIFIED AS HELD-FOR-SALE
Non-current assets (and disposal groups) are classified as held-for-sale when their carrying value is expected to be recovered by means of a sales transaction rather than through use in company operations. This condition is met only when the sale is highly likely, the assets (or group of assets) are available for immediate sale in their current condition and, consequently, management is committed to a sale, which should take place within 12 months of the classification as held-for-sale.
Non-current assets (and disposal groups) classified as held-for-sale are measured at the lower of their previous carrying value and market value less selling costs.
REVENUE RECOGNITION
Revenues are recorded at the fair value of the amount received less returns, discounts and allowances as follows:
• revenue from sales: on the effective transfer of the risks and rewards typically connected with ownership;
• revenue from services: on the provision of the service.

Maire Tecnimont Group
88
The Group classifies exchange differences deriving from commercial operations under operating results, and in particular in the accounts other operating revenues and other operating costs depending on whether the net effect is a gain or loss, with detailed information provided in the Explanatory Notes.
The amounts matured, where expressed in foreign currencies, are calculated taking into account the exchange rates at the date of the relative hedging operations.
CONSTRUCTION CONTRACTS
Where the result of a construction contract may be estimated reliably, the revenues relating to the project must be recorded in relation to the advancement of the activities at the reporting date, based on the percentage of costs incurred for the activities up to the reporting date to the total estimated project costs (so-called “cost to cost” method).
Given the technical complexity, the size and the duration of the projects, the additional payments, contract changes, price revisions and incentives must necessarily be taken into account and measured, before formalization of the agreement with the counterparty. The request of additional payments deriving from modifications to the work contractually agreed is considered in the total amount of the payments when it is probable that the buyer will approve the variations and the relative price; the other requests (claims) deriving, for example, from higher charges attributable to the buyer, are considered in the total amount of the payments only when it is probable that they will be accepted from the state of advancement of negotiations or technical/legal valuations, considering also the document produced by other bodies (Arbritation Board, Dispute Adjudication Board, etc.). In the evaluation of these issues the Group records a revenue only when it is considered probable the recognition by the buyer and that there is a possibility of a reliable quantification of the amount.
Where the result of a construction contract may not be estimated reliably, the revenues related to the relative contract are recorded only within the limits of the project costs incurred which will probably be recovered. The project costs are recorded as expenses in the year in which they are incurred.
Where it is probable that the total project costs are higher than the relative contractual revenues, the expected loss is immediately recorded as a cost.
PROPERTY, PLANT AND EQUIPMENT
Plant and machinery utilized for the production or the provision of goods and services are recorded in the financial statements at historic cost, including any accessory and direct costs necessary for the asset to be available for use.
Plant, machinery & equipment are recognized at cost, net of accumulated depreciation and any write-down for loss in value.
Property is recorded at fair value at the revaluation date net of any subsequent accumulated depreciation and any subsequent loss in value accumulated and is depreciated based on their estimated useful lives. Buildings are revalued annually on the basis of an independent expert’s valuation. The positive/negative difference is recorded in the revaluation reserve under equity.
Depreciation is calculated on a straight-line basis on the cost of the assets, according to their estimated useful life, which is reviewed annually at following rates:

89
Asset Category Rate
Land 0%
Buildings from 2% to 10%
Plant and machinery from 7.5% to 15%
Industrial & commercial equipment 15%
Furniture 12%
EDP 20%
Motor vehicles from 20% to 25%
Gains and losses deriving from the disposal or sale of assets are determined as the difference between the sales revenue and the net book value of the asset and are recorded in the Income Statement in the year.
Ordinary maintenance costs are fully charged to the income statement.
Improvements on the original value of the assets are capitalized and depreciated based on their residual utilization.
Leasehold improvements which may be recorded as an asset are recognized under property, plant and equipment and depreciated at the lower between the residual duration of the contract and the residual useful life of the asset.
Leased assets
Leasing contracts which do not provide for the transfer of all of the risks and benefits of ownership to the Group are considered operating leases.
Operating lease costs are recorded on a straight-line basis over the duration of the lease agreement.
Grants
Capital grants are recognized when there is reasonable certainty that they will be received and that the conditions will be satisfied for their attainment.
Capital grants are recorded as a direct reduction of the asset to which they refer. The value of an asset is adjusted by straight-line depreciation, calculated on the basis of the residual useful life of the asset.
INTANGIBLE ASSETS
Intangible assets acquired separately are recorded at cost less amortization and any net loss in value. Amortization is calculated on a straight-line basis over the useful life of the asset. The amortization method and the residual useful life are reviewed at the end of each accounting period. The effects deriving from the change in the amortization method and the residual useful life are recorded prospectively.
Intangible assets generated internally – research and development costs
Research costs are expensed to the income statement in the period in which they are incurred.
Intangible assets generated internally deriving from the development phase of a Group internal project are only recognized under assets when the following conditions are met:
• There is the technical feasibility to complete the intangible asset for its use or sale;
Maire Tecnimont Group
90
• There is the intention to complete the intangible asset and utilize or sell the asset;
• There is the capacity to utilize or sell the intangible asset;
• It is probable that the asset will generate future economic benefits;
• There exists the technical, financial and other resources in order to complete the development and utilize or sell the asset during the development phase.
The initial amount recognized of the intangible assets generated internally corresponds to the sum of the expenses incurred at the date in which the asset meets the criteria described above. Where these expenses may not be recorded as intangible assets generated internally, the development expenses are expensed in the Income Statement in the period in which they are incurred.
Subsequent to initial recognition, the intangible assets generated internally are recorded at cost less any accumulated loss in value, as occurs for intangible assets acquired separately.
Intangible assets acquired through a Business Combination
Intangible assets acquired in a business combination are identified and the amortization is recorded where they satisfy the definition of intangible assets and their fair value may be determined reliably. The cost of these intangible assets is their fair value at the acquisition date. Subsequent to initial recognition, the intangible assets acquired in a business combination are recorded at cost less amortization and any accumulated loss in value, as occurs for intangible assets acquired separately.
IMPAIRMENT OF TANGIBLE, INTANGIBLE AND FINANCIAL ASSETS
At each reporting date, the Group reviews the carrying value of its intangible, tangible and financial assets to determine if there are indications that these assets have incurred a loss in value. Where it is not possible to make an estimate of the recoverable amount of an asset individually, the Group makes an estimate of the recoverable amount of the cash-generating unit the asset belongs to. When it is established that a potential loss exists, an estimate of the recoverable amount is made in order to identify the amount of the loss.
The indefinite intangible assets, as for goodwill, are verified annually and whenever there is an indication of a possible loss in value, in order to determine if there has been a loss in value.
The recoverable value is the higher between fair value less costs to sell and value in use. In determining the value in use, the estimated future cash flows are discounted on a pre-tax basis which reflects the market assessment of the time value of money and the risks specific to the asset. In the determination of this value various cash flow scenarios are utilized (sensitivity analysis).
If the recoverable value of an asset (or a CGU) is considered lower than its carrying value, it is reduced to its recoverable value. A loss in value is recognized in the income statement immediately.
Where, subsequently, the loss in value no longer exists or reduces, the book value of the asset is increased up to the new estimate of the recoverable value and may not exceed the value which would be determined where no loss in value had been recorded. The reversal of a loss in value is immediately recorded in the income statement.
INVENTORIES
Inventories are measured at the lower of cost and net realizable value. Cost includes direct materials and, where applicable, direct labor costs, general production costs and other costs which are incurred in bringing the inventories to their present location and condition. The cost is calculated using the weighted average cost method. The net realizable value is represented

91
by the estimated sales price less the estimated cost for completion and estimated costs to sell.
FINANCIAL INSTRUMENTS
Financial assets and liabilities are recorded in the financial statements when the Group has the contractual obligations of the instrument.
FINANCIAL ASSETS
Receivables
Receivables are initially recognized at fair value and subsequently measured at amortized cost, utilizing the effective interest rate method, net of the relative losses in value with reference to amounts considered non-recoverable, recorded in a specific doubtful debt provision. The estimate of the amounts considered non-recoverable are determined based on the expected future cash flows. These cash flows consider the expected recovery time, the forecast realizable value, any guarantees and the costs to be incurred for the recovery of the receivables. The original amount is restated whenever the reasons for the adjustment no longer apply. In this case, any reversal of previous provisions are recorded in the income statement and may not exceed the amortized cost of the receivable in the absence of the previous adjustments.
Trade receivables which mature within the normal commercial terms are not discounted. Receivables in currencies other than the operational currency of the individual companies are recorded at the period-end exchange rates.
Other financial assets
Financial assets, where there exists the intention and capacity of the Group to maintain them until maturity in accordance with IAS 39, are recognized at cost, recorded at the trading date, represented by the fair value of the initial amount given in exchange, increased by any transaction costs (for example: commissions, consultancy etc.) directly attributable to the acquisition of the asset. After initial recognition, these assets are measured at amortized cost using the original effective interest method.
Financial assets held for speculative purposes in the short-term are recognized and measured at fair value, with changes recorded in the income statement; any other financial assets other than those above are classified as financial instruments available for sale, recognized and measured at fair value with changes recorded through equity. These amounts are subsequently recorded in the income statement when the asset is sold or incurs a loss in value. This latter category includes investments other than control, joint control or associates.
Cash and cash equivalents
Cash and cash equivalents include cash balances and bank current accounts and deposits repayable on-demand, plus other highly liquid short term financial investments that can be readily converted into cash and are not subject to a significant risk of a change in value.
FINANCIAL LIABILITIES AND EQUITY INSTRUMENTS
Financial liabilities and Equity instruments issued by the Group are classified in accordance with the underlying contractual agreements and in accordance with the respective definition of liabilities and Equity instruments. These latter are defined as those contracts which give the right to benefit from the residual interest of the assets of the Group after the reduction of the

Maire Tecnimont Group
92
liabilities. The accounting policies adopted for specific financial liabilities and Equity instruments are described below.
Payables
Payables are initially recorded at cost, corresponding to the fair value of the liability, net of directly attributable transaction costs.
Subsequent to initial recognition, the payables are measured under the amortized cost method, utilizing the effective interest rate method. This category includes interest bearing bank loans and overdrafts.
Trade payables which mature within the normal commercial terms are not discounted. Payables in currencies other than the operational currency of the individual companies are recorded at the period-end exchange rates.
FAIR VALUE MEASUREMENT
Fair value is the amount in which an asset (or a liability) may be exchanged in a transaction between independent counterparties with reasonable knowledge of the market conditions and significant events related to the item under negotiation. The presumption that an entity is fully operational and does not need to liquidate or significantly reduce activities, or undertake operations at unfavorable conditions, is fundamental to the definition of fair value. The fair value reflects the credit quality of the instrument as it incorporates the counterparty risk.
Receivables and Payables:
For receivables and payables recorded in the financial statements at cost or amortized cost, the fair value for the purposes of the disclosure to be provided in the Explanatory Notes is determined as follows:
• for short-term receivables and payables, it is considered that the value paid/received reasonably approximates fair value;
• for medium/long-term receivables/payables, the measurement is principally undertaken through the discounting of future cash flows. The discounting of the expected cash flows is normally undertaken through the zero coupon curve increased by the margin represented by the specific credit risk of the counterparty.
Other financial instruments (Debt and equity securities)
The fair value for this category of financial asset is measured taking as reference the listed prices at the reporting date of the financial statements where existing, otherwise with reference to technical valuations utilizing as input exclusively market data.
EQUITY INSTRUMENTS
Equity instruments issued by the Company are recognized based on the amount received, net of direct issue costs.
CONVERTIBLE BONDS
In accordance with IAS 32 “Financial Instruments: Presentation in the financial statements” convertible bonds are recorded as hybrid financial instruments, formed by two components which are treated separately only if significant: a liability and a conversion option. The liability corresponds to the present value of the future cash flows based on the current interest rate at the issue date for an equivalent non-convertible bond. The value of the option is defined as the difference between the net amount received and the amount of the liability and is

93
recorded under equity. The value of the conversion option in shares does not change in subsequent periods. On the contrary, where the characteristics of the bond result in, on the exercise of the conversion right, the right of the company to deliver shares or offer a combination of shares and cash, the option is recognized as a financial liability for the incorporated host, measured at fair value through P&L, while the difference compared to the original nominal value or rather the financial liability (host) is recorded at amortized cost.
In consideration of the convertible bond placement in February 2014 issued by Maire Tecnimont S.p.A. this is a hybrid financial instrument whose accounting method is described above.
DERIVATIVE INSTRUMENTS AND HEDGE ACCOUNTING
The Group utilizes derivative instruments (swap contracts, options, and forwards) to hedge against risks from interest rate changes on bank loans and currency movements on cash flows in foreign currencies.
The structure of the contracts in place is in line with the Group “hedging” policy.
Derivative instruments are measured at fair value with recognition of any changes in fair value to the income statement where they do not satisfy the conditions to be considered as hedges either due to the type of instrument or the choice of the company not to undertake the efficiency test. Derivative instruments are classified as hedging instruments when the relation between the derivative and the hedged item is formally documented and the effectiveness of the hedge, periodically verified, is high in accordance with IAS 39. The accounting of the hedging instruments differs depending on the objective of the hedge: cash flow hedges or fair value hedges.
Cash flow hedge
The changes in the fair value of the derivative instruments which are designated, and which are efficient, to hedge future cash flows relating to the Group contractual commitments are directly recorded under Equity, while the non-efficient portion are immediately recorded in the Income Statement.
The amounts recorded directly under Equity are included in the Income Statement in the same period that the contractual commitment hedged is included in the Income Statement.
Fair value hedge
For the efficient hedge of a “change in fair value” the item hedged is adjusted by the fair value changes attributable to the risk hedged recognized through the Income Statement. The gains and losses deriving from the fair value of the derivatives are also recorded in the income statement.
The changes in the fair value of the derivative instruments which do not qualify as hedges are recorded in the Income Statement in the period in which they arise.
Embedded derivatives
Embedded derivatives included in contracts are treated as separate derivatives only when:
• their risks and features are not strictly related to those of the host contracts;
• the separate embedded instrument satisfies the definition of a derivative;
• the hybrid instrument is not recognized at fair value with changes recorded through P&L.

Maire Tecnimont Group
94
Where an embedded derivative is separated, the relative host contract must be recorded in accordance with IAS 39, if the contract is a financial instrument, and in accordance with the other accounting standards if the contract is not a financial instrument.
Fair value calculation
The fair value of financial instruments is represented by the current market price or, in their absence the application of appropriate financial valuation models which take into consideration all the factors adopted by market operators and the prices obtained in a real market transaction. In particular, the fair value of the interest rate swaps is measured discounting the expected cash flows, while the fair value of currency forward contracts is determined on the basis of the forward exchange rate at the reference date and the differential rates between the currencies.
DERECOGNITION OF FINANCIAL INSTRUMENTS
Financial assets are eliminated from the balance sheet when the right to receive the cash flows no longer exist and all the related risks and benefits are substantially transferred (so-called derecognition) or where the item is considered definitively non-recoverable after the completion of all the necessary recovery procedures. Financial liabilities are derecognized from the balance sheet when the specific contractual obligations are extinct. Receivables transferred following factoring operations are eliminated from the balance sheet only when the related risks and benefits of ownership have been substantially transferred. With recourse receivables and non-recourse receivables which do not satisfy these requisites remain on the balance sheet of the company, even if legally transferred; in this case a financial liability of a similar amount is recorded under liabilities against advances received.
SHAREHOLDERS’ EQUITY
Share capital
The share capital is the amount of the subscribed and paid-in capital of the Parent Company. The costs strictly related to the issue of new shares are classified as a reduction of the share capital when they refer to costs directly attributable to the equity operation.
Treasury shares
They are recorded as a decrease in Group Shareholders' Equity. The costs incurred for the issue of new shares by the Parent Company are recorded as a reduction in equity, net of any deferred tax effect. The gains or losses for the purchase, sale, issue or cancellation of treasury shares are not recorded in the income statement.
Retained earnings/ (accumulated losses)
This refers to the results of previous years for the part not distributed or recorded under reserves (in the case of profit) or recapitalized (in the case of losses). The account also includes the transfers from other equity reserves when those reserves are no longer required as well as the effects of the recording of changes to accounting policies and material errors.
Other reserves
These include the fair value reserves recorded under equity in accordance with the applicable criterion, the treasury share reserve, the legal reserve and the translation reserve.

95
Valuation reserve
These include the cash flow hedge reserve relating to the efficient portion of the hedge and the actuarial reserve on defined benefit plans recognized directly to equity.
CONTRACTUAL LIABILITIES DERIVING FROM FINANCIAL GUARANTEES
The contractual liabilities deriving from financial guarantees are initially measured at their fair value and subsequently measured at the higher between:
• the amount of the contractual obligation, determined in accordance with IAS 37 – Provisions, Contingent Liabilities and Contingent Assets;
• the initial amount recorded net, where applicable, of the accumulated amount recorded in accordance with the recognition of the revenues as described above.
PROVISIONS FOR RISKS AND CHARGES
Provisions are recorded when the Group has a current obligation (legal or implied) that is the result of a past event and it is probable that the Group will be required to fulfil the obligation. Provisions are made based on the best estimate of the cost of fulfilling the obligation at the reporting date, and are discounted when the effect is significant.
When the Group considers a provision for risks and charges must be in part or in full reimbursed, the indemnity is recorded under assets only when the reimbursement is almost certain and the amount of reimbursement may be determined reliably.
Onerous contracts
Where the Group has an onerous contract, the current obligation contained in the contract must be recognized and measured as a provision.
An onerous contract is a contract in which the non-discretional costs necessary to settle the obligations exceed the economic benefits deriving from such.
Restructuring provision
A provision for restructuring costs is recorded only when the Group has undertaken a formal detailed program for the restructuring and there exists a valid expectation in those affected that it will carry out the restructuring by starting to implement that plan or announcing its main features to those affected by it.
A provision for restructuring must only include the direct expenses deriving from the restructuring and not associated with the current activities of the Group.
Guarantees
The provisions for guarantee costs are accrued when it is considered probable that the request to honor the guarantee will be made. The calculation of the provision is made based on the best estimate by Management of the costs required to comply with the obligation.
POST-EMPLOYMENT BENEFITS
The payments for defined contribution plans are recognized in the Income Statement of the period in which they are due.
For the defined benefit plans, the cost relating to the benefits recognized is determined using the projected unit credit method, making actuarial valuations at the end of each period.

Maire Tecnimont Group
96
Actuarial gains and losses are recognized in the period they arise and recorded directly in a specific equity reserve. The cost relating to past employment service is immediately recorded when the benefits have already matured.
The liabilities for post-employment benefits recorded in the balance sheet represent the present value of the liabilities for the defined benefit plans adjusted to take into account any actuarial gains or losses not recorded and costs relating to past employment services not recorded, and reduced by the fair value of the asset plan. Any net assets resulting from this calculation are limited to the value of the actuarial losses not recorded and costs relating to past employment services not recorded, plus the present value of any repayments and reductions in future contributions to the plan.
Other long-term employee benefits
The accounting treatment of the other long-term benefits is similar to those of the plans for post-employment benefits with the exception of the fact that the actuarial gains and losses and costs deriving from past employment services are recognized in the income statement fully in the year in which they arise.
SHARE-BASED PAYMENTS
The Group recognizes additional benefits to employees through equity participation plans. The above-mentioned plans are recognized in accordance with IFRS 2 (Share-based payments). In accordance with IFRS 2, these plans represent a remuneration component of the beneficiaries; therefore, for the equity participation plans, the cost is represented by the fair value of these instruments at the granting date, and recognized in the income statement under “Personnel expense” over the period between the granting date and that of maturity, and in the “IFRS 2 reserve” under equity. Changes subsequent to the granting date in the fair value do not have an effect on the initial value. At the end of each year the estimate is updated on the number of rights which will mature on maturity. The change in the estimate reduces the amount in the “IFRS 2 reserve” and is recorded under “Personnel expense” in the P&L.
FINANCIAL INCOME AND EXPENSES
Interest is recognized in accordance with the effective interest rate method, utilizing therefore the interest rate which is financially equivalent to all the cash inflows and outflows (including premiums, discounts, commissions etc.) which comprise an operation. The Group classifies in this account the exchange differences deriving from financial operations, while the exchange differences from commercial operations are classified under operating results, and in particular in the accounts other operating revenues and other operating costs, depending on whether the net effect is a gain or loss, with detailed information provided in the Explanatory Notes.
INCOME TAXES
Income taxes for the year represent the sum of current and deferred taxation.
Current income taxes
Current income taxes for the year and previous years are recorded for the amount expected to be paid to the fiscal authorities.
The liability for current income taxes is calculated using the current rates at the reporting date in the individual countries where the Group operates.

97
Deferred taxes
Deferred taxes are the taxes that it is expected to pay or recover on the temporary differences between the carrying value of the assets and of the liabilities in the financial statements and the corresponding fiscal value utilized in the calculation of the assessable income, accounted under the liability method. Deferred tax liabilities are generally recorded on all temporary assessable differences, while deferred tax assets are recorded based on the probability that the future assessable results will permit the use of the temporary deductible differences. These assets and liabilities are not recognized if the temporary differences deriving from the goodwill or the initial recognition (not in business combinations) of other assets or liabilities in operations do not have an impact on the accounting result or on the assessable fiscal result.
The carrying value of deferred tax assets is revised at the end of the year and reduced to the extent that it is no longer likely that there will be sufficient taxable income against which to recover all or part of the assets.
Deferred taxes are calculated based on the fiscal rates that are expected to be in force at the moment of the realization of the asset or the settlement of the liability. Deferred taxes are recognized directly in the income statement with the exception of those relating to accounts directly recognized to equity, in which case the deferred taxes are also recognized to equity.
Deferred tax assets and liabilities are offset when there is a direct right to compensate the tax assets and liabilities and when they refer to income taxes due to the same fiscal authority and the Group intends to pay the amount on a net basis.
Deferred taxes are recognized directly to the income statement with the exception of those relating to accounts directly recognized to equity, in which case the deferred taxes are also recognized to equity.
USE OF ESTIMATES
The preparation of the financial statements and the relative notes in application of IFRS require that management make estimates and assumptions on the values of the assets and liabilities in the financial statements and on the disclosures relating to the assets and contingent liabilities at the reporting date. The estimates and assumptions used are based on past experience and other factors considered relevant. The actual results may differ from such estimates. The estimates and assumptions are reviewed periodically and the effects of any changes are recorded in the income statement in the period of the revision of the estimate, if the revision has effect only on that period, or also in subsequent periods if the revision has effect on the current year and on future years. In this regard, the situation caused by the current economic and financial crisis resulted in the need to make assumptions on an outlook characterized by significant uncertainty and for which it is reasonably possible - on the basis of currently available information - that within the following year, results may differ from estimates, requiring even significant adjustments (including to the book value of the relative items).
The accounts principally affected by such uncertainty are:
• construction contracts: almost all Group consolidated revenues derive from long-term contracts, whose amount is determined at the participation date of the tender and any subsequent award of the contract. In relation to these contracts, the margins originally estimated may reduce as a consequence of an increase in costs incurred during the construction of the projects (for example costs for raw materials, contractual penalties on delays or unexpected circumstances or disputes with the buyers, subcontractors and suppliers).
• goodwill, other intangible assets, financial assets: they are tested annually and whenever there is an indication of a possible loss in value in order to determine the recoverability of these values.

Maire Tecnimont Group
98
• derivative instruments: initially recognized at cost, they are adjusted to fair value on subsequent reporting dates. The fair value represents the current market price or, in their absence, the value from application of appropriate financial valuation models.
• provisions for risks and charges: provisions are made based on the best estimate of the cost of fulfilling the obligation at the reporting date, and are discounted when the effect is significant.
• employee benefits: the cost relating to employment services is made utilizing the best actuarial valuations at the estimate date.
CHANGES IN ACCOUNTING ESTIMATES AND ERRORS
The Group in the selection and application of the accounting policies, in the accounting of the changes in accounting policies and of the changes in accounting estimates and corrections of previous year errors applies IAS 8.
SUBSEQUENT EVENTS AFTER THE REPORTING PERIOD
Subsequent events are events which occur after the reporting date up to the authorized publication date. The date for authorization of publication is considered the approval date by the Board of Directors. Subsequent events may concern events which provide information on the situation existing at the reporting date (adjusting subsequent events) or events arising after the reporting date (non adjusting subsequent events). For the former, the relative effects are reflected in the financial statements and updated disclosure provided, while for the latter, if significant, adequate disclosure alone is provided in the Explanatory Notes.

99
27. Notes to the income statement
27.1. Revenues
Revenues in 2016 amounted to Euro 2,408,768 thousand, an increase of Euro 771,313 thousand compared to 2015.
(in Euro thousands) 2016 2015
Revenues from sales and services 621,729 1,407,190
Change in contract work-in-progress 1,787.040 230,265
Total 2,408,768 1,637,455
The improvement is principally due to the Euro 1,556,775 thousand increase in the account “change in contract work-in-progress”, which mainly owes to the advancement of the orders acquired in the previous year and in 2016 compared to the previous year.
“Revenues from sales and services” however reported a decrease of Euro 785,462 thousand, mainly due to the lower revenues from orders completed in the year.
This general improvement relates to progress on backlog projects and principally the advancement of recently awarded projects, while in the previous year the main projects had reached a very advanced stage and were not yet offset by new orders.
Group core business revenues derived for 95.6% from the “Technology, Engineering & Construction” business unit (93% in 2015), increasing on the previous year in terms of consolidated volumes following the advancement of new projects acquired in previous years and in line with the Group strategy based on the consolidation of the traditional EPC activities, with greater emphasis on the E and EP components and the leveraging of technological know-how and customer service activities, through driving the specific skill sets which set the Group apart on the market.
The principal projects of the “Technology, Engineering & Construction” BU concerned Tempa Rossa, ADCO, ADGAS, Kingisepp, CORU, Kima and Punta Catalina.
The “Infrastructure & Civil Engineering” BU accounted for approx. 4.4% of revenues (7% in 2015), a decrease of approx. Euro 8.6 million.
This decrease is principally due to the completion of some projects (in particular the Etihad railway) and the slowdown ahead of the definition of changes with the client, of the amount of the public contribution and of the revision of the Financial Plan for the Alba-Bra’ Hospital, not yet offset by new orders.
The change in work-in-progress takes into account not only the recognition of contractual amounts agreed upon, but also changes in work orders, incentives and any reserves (“claims”) for the probable amount to be recognized by the buyer and reliably measured. In particular, the calculation of the claims was made based on reasonable expectations through the negotiations in progress with the buyers to recognize the higher costs incurred or disputes in course and therefore by their nature may present a risk. Currently, these claims account for approx. Euro 4.6% of Technology, Engineering & Construction BU contract values and approx. 11.6% of Infrastructure BU contracts.

Maire Tecnimont Group
100
27.2. Other operating revenues
“Other Operating Revenues” in 2016 amounted to Euro 26,658 thousand, down Euro 5,513 thousand on the previous year and relate to:
(in Eur o thousands) 2016 2015
Operating currency gains 5,911 0
Prior year income 5,696 5,765
Use of doubtful debt provision 4,705 1,410
Use of other risk provis ions 3,564 0
Revenues from material sales 1,077 734
Contract penalties 211 156
Gains on disposals 160 90
Currency derivative gains 86 355
Other income 5,247 11,866
Green certificate revenues 0 11,794
Total 26,658 32,171
Other operating revenues refer to revenues not directly connected to the Group core business. Other operating revenues mainly refer to:
• operating currency gains of Euro 5,911 thousand, reflecting the net gain between currency gains and losses; the net gain follows currency market movements and those on foreign currencies regarding ongoing projects; as this account was a net loss in the previous year, it was reclassified to the account “Other Operating Costs”.
• prior year income of Euro 5,696 thousand, principally relating to the write-off of payables no longer due and the reversal of higher costs accrued in previous years;
• use of doubtful debt provision for Euro 4,705 thousand for losses on receivables which were determined as irrecoverable in 2016 and recorded in the account “Other operating charges”; and for Euro 3,564 thousand the use of other risk provisions relating to projects for which during 2016 the probability of future charges reduced.
• the other accounts refer to contractual penalties, mainly relating to penalties applied to suppliers, material sales (mainly relating to spare parts), disposal gains, currency derivative gains and other income.
Green certificate revenues in the previous year refer to the value of the certificates - annual renewable production securities - on the basis of production at the Olevano biomas plant up to the date of sale.

101
27.3. Business segment information
Maire Tecnimont S.p.A. heads an integrated industrial group providing engineering services and works in the following sectors on the domestic and international markets:
- (I) Technology, Engineering & Construction; - (II) Infrastructure & Civil Engineering. The BU figures are in line with the internal reporting structure utilized by company Top Management. The features of these sectors are outlined below:
I. “Technology, Engineering & Construction” Business Unit - designs and constructs plant, principally for the “natural gas chain” (involving separation, treatment, liquefaction, transport, storage, regasification and compression and pumping stations); designs and constructs chemical and petrochemical industry plant for the production, in particular, of polyethylene and polypropylene (polyolefin), ethylene oxide, ethylene glycol, purified terephthalic acid ("PTA"), ammonia, urea and fertilizers; issues, in addition, within the fertilizer sector, licenses on patented technology and proprietary know-how to current and potential urea producers. Other major activities related to the sulphur recovery process, hydrogen production and high temperature furnaces. It is also engaged in the design and construction of hydro-carbon electric power plant and waste-to-energy and district heating plant.
I. “Infrastructure & Civil Engineering” Business Unit - engaged in the design and construction of major infrastructural projects (such as roads and motorways, rail lines, underground and surface metro lines, tunnels, bridges and viaducts) and industrial and commercial and tertiary sector facilities and buildings; it provides environmental services for infrastructure, civil and industrial construction and energy sector projects and plant in general. The Group provides maintenance and facility management services, in addition to general services for temporary construction facilities and Operation & Maintenance services. It also works on large-scale renewables sector plant (mainly solar and wind).
The Group assesses the performance of the operating segments based on the segment operating result. Segment revenues are those directly deriving from or attributable to the Segment and from core operations and include revenues from agreements with third parties. Segment costs are charges from segment operations incurred from third parties. For Group operations, amortization, depreciation, provisions for risks, financial income and expense and income taxes are borne by the corporate entity as excluded from operating activities and are presented in the total column. Segment disclosure is reported in the following tables: Segment disclosure is reported in the following tables:

Maire Tecnimont Group
102
2016 SEGMENT REVENUES AND RESULT:
(in Eur o thousands) Revenues Segment result (EBITDA)
2016 2015 2016 2015
Technology, Engineering & Construction 2,327,889 1,553,460 161,831 133,412
Infrastructure & Civil Engineering 107,537 116,165 (1,806) (2,571)
Total 2,435,426 1,669,626 160,025 130,841
2 2016 SEGMENT INCOME STATEMENT: 016 INCOME STATEMENT BY SEGMENT
(in Eur o thousands) Technology, Engineering & Construction
Infrastructu re & Civ il Engineering
Total
Segment revenues 2,327,889 107,537 2,435,426
Industria l margin (Business Profit) 237,331 3,912 241,243
Segment result (EBITDA) 161,831 (1,806) 160,025
Amortization, depreciation, write-downs and provis ions (7,452)
EBIT 152,572
Financial income/(expenses) (18,738)
Income before tax 133,835
Income taxes for the year (48,542)
Net income 85,293
Group 74,371
Minorities 10,922

103
2015 SEGMENT INCOME STATEMENT: NCOME STATEMENT BY
(in Euro thousands)
Technology, Engineering & Construction
Infrastructure & Civil Eng ineering
Total
Segment revenues 1,553,460 116,165 1,669,626
Industria l margin (Business Pro fit) 208,550 2,681 211,231
Segment result (EBITDA) 133,412 (2,571) 130,841
Amortization, depreciation, write-downs and provisions (15,415)
EBIT 115,427
Financial income/(expenses) (37,814)
Income before tax 77,613
Income taxes for the year (33,822)
Net income 43,791
Group 43,956
Minorities (165)
BALANCE SHEET AT 31 .12.2016 BY SEGMENT:
(in Euro thousands) Technology, Engineering & Construction
Infrastructure & Civil Eng ineering
Total
Segment assets 1,961,397 333,145 2,294,542
Assets not allocated (**) 754,857
Total Assets 3,049,399
Segment liab ilities (2,050,923) (135,424) (2,186,348)
Liab ilities not allocated (**) (863,051)
Total Liabilities (3,049,399)
(**) The asset and liability accounts not allocated princ ipally refer to treasury and tax assets and liabilit ies of the corporate entity and
are not allocated to the segments as excluding operating ac tivities.

Maire Tecnimont Group
104
BALANCE SHEET AT 31.12.2015 BY SEGMENT:
(in Eur o thousands) Technology, Engineering & Construction
Infrastructu re & Civ il Engineering
Total
Segment assets 1,240,117 326,411 1,566,528
Assets not allocated (**) 599,545
Total Assets 2,166,074
Segment liabilities (1,321,562) (140,165) (1,461,727)
Liabilities not allocated (**) (704,347)
Total Liabilities (2,166,074)
(**) The asset and liability accounts not allocated princ ipally refer to treasury and tax assets and liabilities of the corporate entity and
are not allocated to the segments as exc luding operating activities.
REGIONAL SEGMENTS:
The regional breakdown of Revenues in 2016 compared to the previous year is illustrated below:
(in Eur o thousands) 2016 2015 Change
Tota l % Tota l % Total %
Italy 461,845 19.0% 334,598 20.0% 127,247 38.0%
Overseas
• Europe (EU) 248,172 10.2% 236,927 14.2% 11,245 4.7%
• Europe (non-EU) 258,599 10.6% 124,278 7.4% 134,321 108.1%
• Middle East 800,364 32.9% 434,688 26.0% 365,676 84.1%
• The Americas 219,808 9.0% 407,845 24.4% (188,037) -46.1%
• Africa 152,058 6.2% 43,289 2.6% 108,769 251.3%
• Asia 294,580 12.1% 88,001 5.3% 206,579 234.7%
Total Consolidated Revenues 2,435,426 1,669,626 765,801 45.9%
The main regional revenue sources were the Middle East (32.9%) and Italy (19%). As previously evident from the Revenues by Business Unit table, this figure highlights the significant contribution of the “Technology, Engineering & Construction” Business Unit in the Middle East, in which the Group has a long-standing presence. The Americas reports a significant decrease in production volumes due to the conclusive phase of the orders in the US, Mexico and Santo Domingo.

105
27.4. Raw materials and consumables
Raw materials and consumables for the year 2016 amount to Euro 940,127 thousand, an increase of Euro 286,217 thousand compared to the previous year.
The breakdown of the account is as follows:
(in Euro thousands) 2016 2015
Raw material purchases (926,541) (645,526)
Consumables (12,701) (7,547)
Fuel (811) (731)
Change in inventories (74) (105)
Total (940,127) (653,909)
In particular, “Raw material purchases” in 2016 increased Euro 281,015 thousand due to the intensive material buying phase in the previous year (metal structures, cables and primary equipment such as valves, pumps, compressors, boilers and machinery) for the projects acquired in prior years and for which the principal equipment orders were completed and works underway. “Consumables” were impacted by greater general and office material requirements following the start-up of new projects acquired and the purchase of specific consumable materials for the opening of new sites.
27.5. Service costs
Service costs in 2016 amounted to Euro 876,271 thousand, an increase of Euro 352,409 thousand on the previous year.
The breakdown of the account is as follows:
(in Euro thousands) 2016 2015
Sub-contractors (388,566) (245,263)
Turnkey design (281,920) (100,219)
Cost recharges (15,470) (6,371)
Utilities (6,410) (6,492)
Transport costs (32,617) (23,246)
Maintenance (6,331) (5,739)
Consultants and related services (25,747) (34,251)
Increase in internal work capitalized 8,350 5,417
Bank expenses and sureties (37,038) (29,788)
Selling & advertising costs (10,641) (6,072)
Accessory personnel costs (35,929) (25,912)
Post & telephone and similar (356) (343)
Insurance (10,800) (6,908)
Other (32,796) (38,675)
Total (876,271) (523,862)

Maire Tecnimont Group
106
The increase in “Service costs” reflects the progress on order book projects and mainly the advancement of recently awarded projects, while in the preceding period the main projects had reached a very advanced stage and were not yet offset by new orders.
“Sub-contractors” principally concerns construction sub-contracting costs and “Turnkey design” reflects such developments, with both significantly increasing.
“Transport costs” increased on the previous year, also due to a different operational mix, with a considerable increase in 2016 in the acquisition and delivery to sites of raw materials and equipment.
“Consultants and related services” decreased due to a lower recourse to “per hour” freelance technicians; this also includes professional fees (principally legal), Audit fees, commercial consultancy and service fees and consultancy fees on projects carried out during the year.
“Bank expenses and sureties” significantly increased following the issue of guarantees on the new large projects acquired, although a cost reduction is noted following the improvement of the Group’s rating, as highlighted also by the recent financial reorganization.
“Accessory Personnel costs” increased, principally due to a higher average number of personnel compared to 2015.
“Other” costs principally relate to non-capitalized IT costs, application package maintenance expenses, various services incurred by other consolidated companies, various site and general costs and emoluments to corporate boards.
The other costs are substantially in line with the previous year.
27.6. Personnel expense
Personnel expense in 2016 amount to Euro 333,069 thousand, an increase of Euro 59,775 thousand compared to the previous year.
The breakdown of the account is as follows:
(in Eur o thousands) 2016 2015
Wages and salaries (261,173) (216,315)
Social security charges (54,541) (43,239)
Post-employment benefits (12,880) (11,065)
Other costs (4,475) (2,674)
Total (333,069) (273,293)
The headcount at December 31, 2016 of the Maire Tecnimont Group was 4,956, compared to 4,596 at December 2015, with a net increase of 360. This increase, attributable to the Group Human Resource policy based on the achievement of the objectives and business needs and increased business volumes, is the net difference between 911 hires and 550 departures in the year.
The increase in the year was mainly in Italy - rising from 1,994 to 2,204 employees - and Asia, with an increase of 112 employees, mainly in the United Arab Emirates in support of the activities related to the Adco and Adgas projects, in addition to Russia for the start-up of the Eurochem and Coru projects, the development of the partnership agreements to consolidate the Group`s presence in the region and, finally, the upscaling of the Moscow office to serve

107
the entire Russia & Commonwealth of Independent States Region. With reference to the regions outlined above, it should be noted that Tecnimont Private Ltd, the Indian subsidiary, is once again the principal pool for the recruitment of resources with technical skills.
On the other hand, the reductions of the headcount in Kuwait (209 employees) and Saudi Arabia (49 employees) are attributable, respectively, to the progressive completion of the AGRP Project and, within the Sadara Project, the significant scaling down of direct personnel in the activities related to the start-up of the plant.
The increase in personnel expense is therefore attributable to the factors illustrated above; social security charges on total remuneration were lower than the theoretical Italian charge as many of the staff are employed abroad.
The workforce at 31/12/2016 of the Maire Tecnimont Group, with movements on 31/12/2015 (and the average workforce for the year), is outlined in the following tables:
Change in workforce by qualification (31/12/2015-31/12/2016):
Category Workforce
31/12/2015 Hires Departures
Reclassification
employee category (*)
Workforce
31/12/2016
∆ Workforce 31/12/2016
vs. 31/12/2015
Executives 483 48 (31) 33 533 50
Managers 1,575 230 (111) 50 1,744 169
White-colla r 2,217 616 (169) (84) 2,580 363
Blue-collar 321 17 (239) 0 99 (222)
Tota l 4,596 911 (550) 0 4,956 360
Average headcount 4,365 4,854
(*) includes promotions, changes in category following inter-company transfers / Job T itle rec lassif ic ations
The category “Executives” and “Managers” does not reflect the Italian contractual term, but refers to national and international
Management and Middle Management identific ation parameters utilized for Italian and overseas managerial staff.
Changes in workforce by region (31/12/2015-31/12/2016):
Region Workforce
31/12/2015 Hires Departures
Reclassification
employee category (*)
Workforce
31/12/2016
∆ Workforce 31/12/2016
vs. 31/12/2015
Italy 1,994 330 (120) 0 2,204 210
Rest of Europe 238 49 (44) 9 252 14
Asia 2,336 501 (379) (9) 2,448 112
The Americ as 18 5 (4) 19 1
Afric a 10 26 (3) 0 33 23
Tota l 4,596 911 (550) 0 4,956 360
It should be noted that employee numbers may vary based on the stage of the project and on scheduling, which may provide for recourse to direct employees with consequent utilization of Group materials and staff, or recourse to third party services. In particular, Group policy provides for the hiring of the workforce necessary for the execution of the individual projects in accordance with the time period necessary for their completion.
In application of IFRS 2 Share-based payments, the 2016-2018 Share Ownership Plan and the 2016-2018 Performance Share Plan are recorded in the Group financial statements as “Equity Settled” plans as the Group has granted equity participation instruments as additional

Maire Tecnimont Group
108
remuneration against services received (employment service). The Group did not however assume any liability to be settled with cash and cash equivalents or with other assets for employees. Given the impossibility to reliably estimate the fair value of the services received from the employees, the benefit cost to the employees is represented by the fair value of the shares granted, calculated at the grant date, to be recognized in the income statement under personnel expense and in a specific reserve under equity. The total cost of these plans for the year amount to Euro 4,066 thousand also based on an weighed average fair value of the capital instruments equal to Euro 2.28 per share.
The above-mentioned Shareholder Plan includes a Rights Granting Cycle for each year (2016-2017-2018) and the possibility, for all employees, to receive Maire Tecnimont shares without consideration on the basis of the overall profitability of the Group. In addition, the 2016-2018 Performance Share Plan concerns approx. 30 Senior Managers, with the granting of rights to Maire Tecnimont shares without consideration in the three-year period 2016-2018 and their effective granting based on pre-set industrial performance objectives, to be assessed annually and at the end of the period.
The effects in the financial statements of the Plans, estimated through adequately weighing the defined maturity conditions (including the probability of employees remaining in the Group for the duration of the Performance Plan), will be recognized over the maturity period of the benefit, or rather over the duration of the Plans, under “Personnel expense”.
“Personnel expense” also includes the fair value component recognized in the period relating to the Phantom Stock incentive plan for the Chief Executive Officer of the company and some Senior Managers of the Group; these costs also include the new employee flexible benefit plan (“Maire4You”) and the new profit participation bonus.
27.7. Other operating costs
Other operating costs in 2016 amounted to Euro 125,936 thousand, an increase of Euro 38,215 thousand compared to the previous year.
The breakdown of the account is as follows:
(in Eur o thousa nds) 2016 2015
Contractual charges (58,506) (600)
Rental (27,284) (27,053)
Hire (20,799) (12,746)
Currenc y derivative losses (154) (1,671)
Losses on receivables (2,909) (2,376)
Operating currency losses 0 (10,232)
Other costs (16,284) (33,043)
Total (125,936) (87,721)
“Contractual charges” mainly relate to the charges arising from the NAGRP Kuwait project in accordance with the wishes of the parties and primarily for the agreement of a final settlement. For further information concerning the situation with the client KNPC, reference should be made to the “Disputes” section of the Directors’ Report.
“Rental” concerns Group office rental costs and was in line with the previous year.
“Hire”, which increased compared to the previous year, mainly relates to Group plant hire charges, motor vehicle leasing and application software licenses.

109
“Losses on receivables”, net of the use of the provision for an equal amount, relate principally to an assessment on the collectability of receivables.
“Other costs” principally comprise indirect taxes and various local taxes, mainly concerning a number of overseas companies, membership fees, prior year charges, other general costs and license and patent usage fees; the decrease relates to the purchase of licenses and patents for a number of new orders acquired in the previous year.
“Operating currency losses” reflect the net loss between currency gains and losses; the gain or loss follows currency market movements and those on foreign currencies regarding ongoing projects; as this account was a net gain in 2016, it was reclassified to the account “Other Operating Income”.
27.8. Amortization, depreciation & write-downs
Amortization, depreciation and write-down of fixed assets in 2016 amounted to Euro 5,759 thousand, a decrease of Euro 358 thousand compared to the previous year.
The breakdown of the account is as follows:
(in Euro thousands) 2016 2015
Amortization (2,705) (3,069)
Depreciation (3,046) (3,049)
Other fixed asset write-downs (9) 0
Total (5,759) (6,118)
Amortization and depreciation is substantially in line with the previous year.
Amortization of intangible assets principally refers to:
• amortization of patent rights, amounting to Euro 1,274 thousand, principally relating to urea licenses patented by Stamicarbon and the other licenses developed by the Maire Tecnimont Innovation Center (MTIC);
• amortization of concessions and licenses, amounting to Euro 707 thousand and principally relating to SAP, Tagetik, Primavera and Zucchetti licenses and other Group software license applications;
• amortization of other intangible assets, amounting to Euro 725 thousand. This account principally refers to accessory and consultant costs incurred for the installation of the principal Group software applications and residually to the amortization of other intangible assets arising from the acquisition of Stamicarbon B.V. and Tecnimont PL..
Depreciation of property, plant and equipment principally refers to:
• depreciation of own buildings for Euro 462 thousand related to the capital gains of the buildings recorded in the accounts following the acquisition of Tecnimont Private Limited and residually for other owned assets;
• depreciation of plant and equipment for Euro 372 thousand and industrial equipment for Euro 269 thousand (on-site plant);

Maire Tecnimont Group
110
• for Euro 1,943 thousand depreciation of other assets, office furniture, leasehold improvements, EDP, motor vehicles and industrial transport vehicles.
27.9. Doubtful debt provision and risk provisions
The doubtful debt provision and risk provisions for 2016 amount to Euro 1,693 thousand, a decrease of Euro 7,604 thousand compared to the previous year.
The breakdown of the account is as follows:
(in Eur o thousands) 2016 2015
Doubtful debt provision (738) (2,419)
Charges provision (955) (6,878)
Total (1,693) (9,297)
The doubtful debt provision in the year amounted to Euro 738 thousand. The individual positions are written down, if individually significant, through a provision which reflects the partial or total non-recovery of the receivable. The amount of the write-down takes into account the estimate of the recoverable cash flows and the relative date of collection, charges and future recovery costs.
The charges provision decreased Euro 5,923 thousand compared to the previous year. It relates to various legal and personnel disputes; the provision also includes other risks related to investments in real estate assets.
27.10. Financial income
(in Eur o thousands) 2016 2015
Income from subsidiaries 20 32
Other income 8,655 2,478
Income on derivatives 8,109 0
Total 16,784 2,510
Financial income amounted to Euro 16,784 thousand and increased Euro 14,274 thousand compared to the previous year.
“Income from subsidiaries” relates to interest from the non-consolidated subsidiary Program International liquidation, reducing following the closure of the respective positions during the year.
“Other income” mainly relates to interest matured on temporary liquidity invested, on bank current accounts and financial instruments classified as loans and on receivables measured at amortized cost. Interest income increased on the previous year due to higher levels of liquidity held, as well as good yields obtained on deposits in some regions where the Group is currently operating, for example Russia.
Income on derivatives for Euro 8,109 thousand refer specifically to:

111
• for Euro 4,131 thousand the “time-value” portion of currency hedging derivatives. As not considered a hedging component, the change to the fair value is recognized to the income statement. This component increased on the previous year due to swap point movements (differences between Eurozone and US interest rates), in addition to new contracts signed by the Group to cover cash flows for new and major orders exposed to the Russian Ruble;
• for Euro 2,364 thousand the positive mark-to-market change in the hedging instruments to hedge the exposure to changes in the price of raw materials (principally copper); these instruments, although hedging raw material risk, for accounting purposes are classified as held-for-trading instruments and consequently measured at fair value with changes recognized to profit and loss;
• for Euro 1,150 thousand to the positive fair value change of two derivative instruments (TRES); in fact in February 2016, Maire Tecnimont S.p.A. subscribed to a cash-settled Total Return Equity Swap (TRES) contract to hedge against movements in the Maire Tecnimont share price, in view of the implementation of a buy-back program for a maximum 10,000,000 shares, approved by the Ordinary Shareholders’ Meeting of December 15, 2015, as illustrated in the 2015 Annual Report. The contract was underwritten with a financial intermediary and currently there is no obligation for Maire Tecnimont to acquire the treasury shares, but only the obligation for settlement between the parties of the differential between the exercise price and the Maire Tecnimont share price on the maturity of the instrument. The instrument matures in May 2019, but provides for annual intermediary windows (April - May 2017 & April - May 2018) in which Maire Tecnimont may exercise a partial “Early Termination” option. In addition, Maire Tecnimont in addition to an initial fee, must recognize a financial expense (interest rate expense) over the duration of the contract for the capital invested by the intermediary to implement the share purchase program on maturity. The TRES is not considered a hedge instrument for hedge accounting purposes and therefore is measured in accordance with IAS 39 as a fair value derivative through P&L. In October 2016, Maire Tecnimont S.p.A. subscribed to a further derivative contract (TRES) to hedge against movements in the Maire Tecnimont share price, in view of an increase in the number of shares to be purchased on the market for a total amount of 4,500,000 treasury shares. The contract is substantially similar to the previous contract signed, although there are no optional annual intermediary windows and therefore the final maturity is May 2019;
• for Euro 464 thousand relating to income from the first TRES contract, related to the distribution of dividends by Maire Tecnimont S.p.A., which the intermediary in part receded to the issuer.
27.11. Financial expenses
(in Euro thousands) 2016 2015
Charges from group companies (2) (3)
Other charges (18,521) (28,259)
Equity Linked Bond interest & other charges (6,604) (6,421)
Charges on derivatives (10,424) (4,447)
Total (35,552) (39,130)
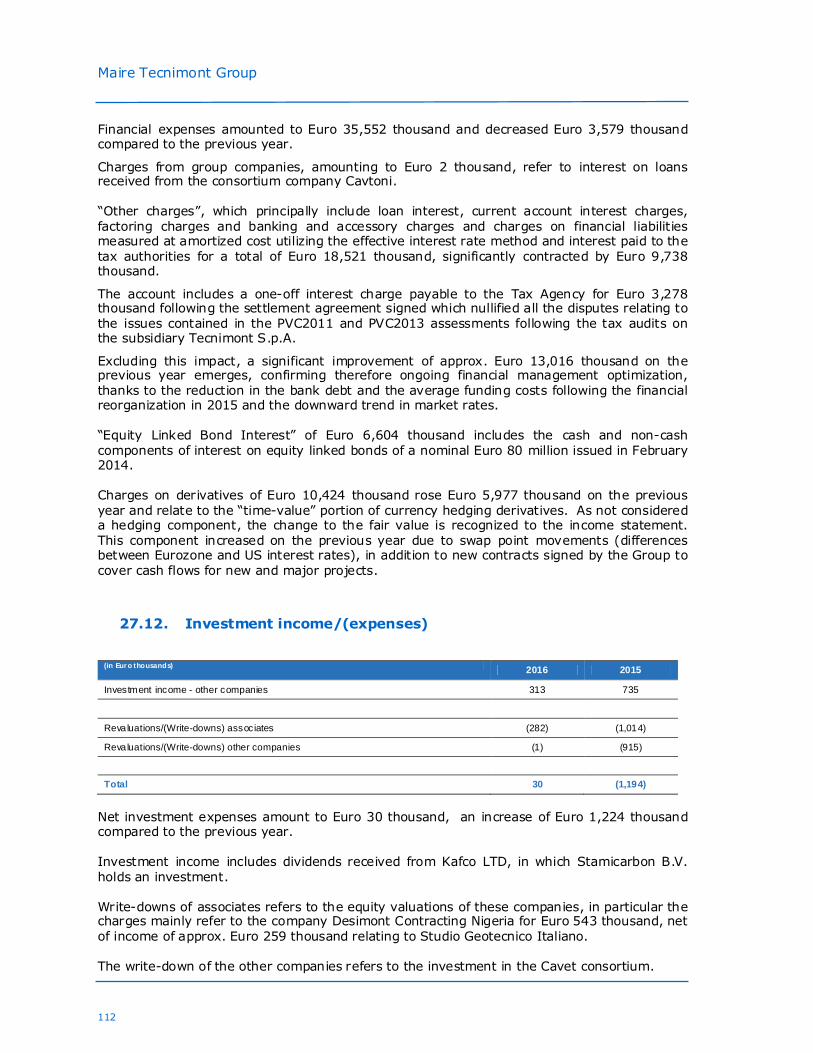
Maire Tecnimont Group
112
Financial expenses amounted to Euro 35,552 thousand and decreased Euro 3,579 thousand compared to the previous year.
Charges from group companies, amounting to Euro 2 thousand, refer to interest on loans received from the consortium company Cavtoni.
“Other charges”, which principally include loan interest, current account interest charges, factoring charges and banking and accessory charges and charges on financial liabilities measured at amortized cost utilizing the effective interest rate method and interest paid to the tax authorities for a total of Euro 18,521 thousand, significantly contracted by Euro 9,738 thousand.
The account includes a one-off interest charge payable to the Tax Agency for Euro 3,278 thousand following the settlement agreement signed which nullified all the disputes relating to the issues contained in the PVC2011 and PVC2013 assessments following the tax audits on the subsidiary Tecnimont S.p.A.
Excluding this impact, a significant improvement of approx. Euro 13,016 thousand on the previous year emerges, confirming therefore ongoing financial management optimization, thanks to the reduction in the bank debt and the average funding costs following the financial reorganization in 2015 and the downward trend in market rates.
“Equity Linked Bond Interest” of Euro 6,604 thousand includes the cash and non-cash components of interest on equity linked bonds of a nominal Euro 80 million issued in February 2014.
Charges on derivatives of Euro 10,424 thousand rose Euro 5,977 thousand on the previous year and relate to the “time-value” portion of currency hedging derivatives. As not considered a hedging component, the change to the fair value is recognized to the income statement. This component increased on the previous year due to swap point movements (differences between Eurozone and US interest rates), in addition to new contracts signed by the Group to cover cash flows for new and major projects.
27.12. Investment income/(expenses)
(in Eur o thousands) 2016 2015
Investment income - other companies 313 735
Revaluations/(Write-downs) associates (282) (1,014)
Revaluations/(Write-downs) other companies (1) (915)
Total 30 (1,194)
Net investment expenses amount to Euro 30 thousand, an increase of Euro 1,224 thousand compared to the previous year.
Investment income includes dividends received from Kafco LTD, in which Stamicarbon B.V. holds an investment.
Write-downs of associates refers to the equity valuations of these companies, in particular the charges mainly refer to the company Desimont Contracting Nigeria for Euro 543 thousand, net of income of approx. Euro 259 thousand relating to Studio Geotecnico Italiano.
The write-down of the other companies refers to the investment in the Cavet consortium.

113
27.13. Income taxes
(in Euro thousands) 2016 2015
Current income taxes (37,890) (32,784)
Taxes re lating to previous periods (3,020) 1,902
Deferred tax income (9,999) (2,921)
Deferred tax charge 2,368 (19)
Total (48,542) (33,822)
Estimated income taxes amount to Euro 48,542 thousand, an increase of Euro 14,719 thousand, mainly due to higher pre-tax income compared to the previous year.
The effective tax rate in 2016 was approx. 36.3%, in line with the average normalized rate in recent quarters, taking into account the regions in which operating activities are undertaken. The tax rate for the previous year was impacted for approx. Euro 5.3 million by the charge following the adjustment of the reduction in the IRES rate on the deferred tax assets and liabilities recorded in the balance sheet and which were therefore restated.
Current income taxes mainly includes “IRES” Italian corporation tax and foreign overseas corporation tax as well as an estimate of the “IRAP” Italian regional income tax and other taxes.
Prior year income taxes mainly includes the extra tax charges recognized to the Tax Agency following the conciliatory agreement signed in December 2016 which nullified all disputes relating to the issues contained in the PVC2011 and PVC2013 assessments following the tax audits on the subsidiary Tecnimont S.p.A. and the differences arising between the amounts accrued for taxes and the actual tax declarations for the year.
Net deferred tax income and charges includes the effect of the utilization of deferred tax income on fiscal losses realized in previous years and temporary differences arising in previous years and deductible in the current year.

Maire Tecnimont Group
114
27.14. Earnings per share
The share capital of Maire Tecnimont S.p.A. comprises ordinary shares, whose earnings (loss) per share is calculated dividing the Group net income in 2016 by the weighted average number of Maire Tecnimont S.p.A. shares in circulation in the period considered. At the reporting date, the number of shares in circulation was 305,527,500. This figure was used as the denominator for the calculation of the earnings (loss) per share at December 31, 2016. The basic earnings per share was Euro 0.243.
( in Euro ) 2016 2015
Number of shares in circulation 305,527,500 305,527,500
(Treasury shares) 0 0
Number of shares to calculate earnings per share 305,527,500 305,527,500
Group net income 74,371,253 43,956,482
Number of shares reserved capital increase Equity L inked Bond 36,533,017 36,533,017
Earnings per share (Euro)
Group basic earn ings per share 0.243 0.144
Group diluted earnings per share 0.217 0.129
We also report that in February 2014 the Parent Company completed an equity-linked bond operation amounting to Euro 80 million, placed with qualified Italian and foreign investors.
The bonds were initially convertible, at a fixed conversion price of Euro 2.1898, in new ordinary shares issued of the Company; subsequently on May 3, 2016 following approval by the Ordinary Shareholders’ Meeting of April 27, 2016 relating to the distribution of a dividend per share of Euro 0.047, Maire Tecnimont S.p.A. communicated to have sent to the bondholders a Notice on the same date through Euroclear and Clearstream Luxemburg. The Notice stated that the Calculation Agent determined, following the payment of the dividend, the change in the conversion price of the Bonds from Euro 2.1898 to Euro 2.1509, in accordance with conditions 6 (b) (iii) and 6 (f), at the effective date of May 2, 2016 (first trading date of the ordinary shares ex dividend on the Milan Stock Exchange).
At the date of the present report account was taken in the calculation of the diluted earnings of this component, as at December 31, 2016 the conversion was “in the money”.
The diluted earnings per share was Euro 0.217.

115
28. Notes to the Balance Sheet
28.1. Property, plant and equipment
(in Euro thousands) 2015 Changes in the
year 2016
Land 4,130 7 4,137
Buildings 21,836 (499) 21,337
Plant & machinery 518 (159) 359
Industria l & commercial equipment 682 (205) 477
Other assets 6,465 806 7,271
Total 33,631 (50) 33,582
The following table illustrates the changes in the historical cost, accumulated amortization and net book values for the year 2016:
(in Euro thousands)
Land Buildings Plant and M achiner y
Industrial and com mercial equipment
Other assets Total
Net book va lue a t December 31, 2015 4,130 21,836 518 682 6,465 33,631
Increases 0 0 202 0 1,614 1,816
Disposals 0 0 0 0 0 0
Deprec iation 0 (462) (372) (269) (1,943) (3,046)
Cost reclassification/adjustm ents 0 (36) 0 0 956 920
Change in consolidat ion scope 0 0 0 0 0 0
Revaluations/(Write-downs) 0 0 0 0 (9) (9)
Other m ovements 7 (2) 11 65 186 267
Net book va lue a t December 31, 2016 4,137 21,337 359 477 7,271 33,582
Historic cost 4,137 27,061 5,353 3,782 44,939 85,272
Accumulated depreciat ion 0 (5,724) (4,993) (3,305) (37,668) (51,690)
The changes mainly refer to depreciation in the year, net of acquisitions. The principal changes in the year related to:
• Land, with a net increase of Euro 7 thousand, due to the conversion of amounts in foreign currencies;
• Buildings, with a net decrease of Euro 499 thousand, principally due to depreciation in the year. The other decreases mainly refer to the translation effect of amounts in foreign currencies;

Maire Tecnimont Group
116
• Plant and machinery, with a net decrease of Euro 159 thousand, principally due to depreciation in the year. The increases mainly refer to the acquisition of small site equipment;
• Industrial and commercial equipment, with a net decrease of Euro 205 thousand,
principally due to the depreciation in the year. The increases relate to the purchases of specific site materials and other changes deriving from the conversion of accounts in foreign currencies;
• Other assets, with a net increase of Euro 806 thousand, mainly due to leasehold improvements, office furniture, EDP and depreciation in the year. The increases relate to the growth in the Group portfolio, as well as new offices located at Milan dedicated to the integrated project teams; in addition, work continued on the overseas offices in line with the current Group development plan.
For comparative purposes the changes relating to the previous year are shown below:
(in Euro thousands)
Land Buildings Plant and Machiner y
Industrial and comm ercial equipment
Other assets
Total Total
Ne t book value at December 31, 2014 4.058 22.145 1.005 700 5.554 28 33.490
Increases 0 36 23 208 2.34, 0 2,607
Disposals 0 0 0 0 (2) 0 (2)
Depreciation 0 (456) (510) (283) (1,799) 0 (3,049)
Cost reclassification/adjustments 0 28 0 0 0 (28) 0
Change in consolidat ion scope 0 0 0 0 0 0 0
Revaluations/(Write-downs) 0 0 0 0 0 0 0
Other movem ents 72 83 0 57 371 0 583
Ne t book value at December 31, 2015 4,130 21,836 518 682 6,465 0 33,631
Historic cost 4,130 27,709 4,606 3,860 39,793 0 80,098
Accumulated depreciat ion 0 (5,873) (4,088) (3,179) (33,328) 0 (46,468)
28.2. Goodwill
(in Eur o thousa nds)
2015 Changes in the
year 2016
Goodwill 291,754 0 291,754
Total 291,754 0 291,754
This account, amounting to Euro 291,754 thousand, did not change during the year 2015 and includes the consolidation differences relating to:
• for Euro 135,249 thousand the acquisition of the Tecnimont Group;

117
• for Euro 53,852 thousand the acquisition and subsequent merger of Maire Engineering S.p.A. into Maire Investimenti S.p.A. (following the merger Maire Investimenti S.p.A. changed its name to Maire Engineering S.p.A), net of the write-down of Euro 10,000 thousand in 2013;
• for Euro 18,697 thousand the acquisition and subsequent merger into Maire Engineering of Tecno Impianti di Amato & Orlandi S.p.A., SIL Società Italiana Lavori S.p.A. and Calosi e Del Mastio S.p.A.;
• for Euro 55,284 thousand the acquisition of the subsidiary Tecnimont Private Limited;
• for Euro 137 thousand the purchase of the share capital of Noy Engineering S.r.l.;
• for Euro 2,184 thousand the acquisition of the subsidiary Stamicarbon B.V.;
• for Euro 26,351 thousand the acquisition of the KT Group.
In application of the IAS 36 impairment method, the Maire Tecnimont Group identified the Cash Generating Units (CGU) which represent the smallest identifiable group of activities capable of generating cash flows largely independently within the consolidated financial statements. The maximum level of the aggregation of the CGU’s is represented by the segments of activities as per IFRS 8.
The goodwill was allocated to the cash generating units from which the related benefits from the business combination are expected to arise.
The CGU’s were identified with similar criteria to the previous year also in line with the representation of the operating segments.
The table below summarizes the value of goodwill allocated by sector:
(in Euro thousands)
2015 Changes in the
year 2016
Technology, Engineering & Construction 238.6 0 238.6
Infrastructure & Civil Engineering 51 0 51
Licensing 2.2 0 2.2
Total 291.8 0.0 291.8
The recoverability of the goodwill and of the other intangible and tangible fixed assets is verified at least once a year also in the absence of indicators of loss in value. The recoverable value of the cash-generating units, whose individual goodwill were allocated, was determined through the determination of the value in use, considered as the present value of the expected cash flows, utilizing an interest rate which reflects the specific risks of the individual cash-generating units at the valuation date. The book value of the CGU’s (carrying amount) includes the book value of the non-current assets which may be attributed directly, or separated based on a reasonable and uniform criterion, to the CGU’s. The net working capital items are not included in the calculation of the book value and of the recoverable value. The working capital items are separately tested for loss in value, in accordance with the applicable accounting standards.
This analysis was undertaken in conjunction with an independent expert, utilizing the cash flows based on the 2017 Budget, and for the period 2017-2021 on a review of the industrial and financial plan, approved by the Board of Directors on March 15, 2017.
These cash flows confirm the assumptions and the strategic projections of the Group plan and reflect the best estimates made by Top Management in relation to the principal assumptions concerning business operations (macro-economic trends and prices, and business development). The underlying assumptions and the corresponding financial numbers are considered appropriate for the impairment test. The plan, in addition to the project margins, includes commercial, general and administrative costs.

Maire Tecnimont Group
118
The principal assumptions reflected in the 2017 Budget and Industrial Plan take into account the high level of the backlog at the end of 2016, which would indicate for the present year a prevalence of EPC project execution operations, following on from a significant increase in EPC production in Q4 2016, with margins reflecting those generally applied for such contracts. Although within a challenging market, for the coming years the backlog is expected to remain high, thanks to our recognized technological know-how which is continually developing and expanding, recent acquisitions and a flexible model capable of adapting to market demands and also a robust commercial pipeline with the expectation of new important contracts.
The value in use was determined based on the estimated future cash flows discounted which the CGU will be capable of producing in the future. The estimated cash flows include the recharge of general and administration costs (G&A) of the Group for all the CGU’s. The value of the cash flows was expressed net of the notional imposition, considering the tax benefit relating to any deductibility of amortization and depreciation. No considerations were adopted relating to changes in net working capital, nor in relation to fixed capital investment.
For the determination of the recoverable value, the cash flows refer to the business plan, as well as a final value (Terminal Value) beyond the plan horizon, in line with the nature of the investments and with sector operations. Relating to the estimate of the Terminal Value, the last year of the cash flows was not taken as an expression of the “normalized” cash flow, but rather the average margin of the Plan future cash flows was considered.
The “normalized” cash flow was capitalized considering a growth rate between an interval of 1.2% and 2.2% for the “Technology, Engineering & Construction” CGU, between 1.2% and 2.2% for the “Licensing” CGU and between 0.4% and 1.4% for the “Infrastructure and Civil Engineering” CGU.
For the purposes of the discounting of the operating cash flows, the interest rate identified was the weighted average cost of capital (WACC) post tax. The parameters utilized in the estimate of the discounting rate (Beta and Net Financial Position) were determined on the basis of a basket of comparable operators respectively in the “Infrastructure” sector for the I&IC CGU and in the “Plant” sector for all the other CGU’s, calculating for each the key financial indicators, in addition to the most significant market values.
The risk free rate utilised considered the real return on benchmark country AAA government securities (United States), the expected medium/long-term inflation rate for the reference countries and the relative Country Risk Premium (determined on the basis of the differential between the country CDS spread and the country benchmark CDS spread). The market risk premium was estimated at 5.6%. It was considered appropriate to consider a specific risk for each CGU above the relative discounting rate; this premium was determined based on the comparison between the size of the CGU and the companies utilised for the estimate of the Beta Unlevered. This risk was increased by a Company Specific Risk Premium in relation to the conditions of the individual CGU`s.
For the cost of equity component, the rate was prudently increased by 0.9 percentage points for the “Technology, Engineering & Construction”, by 2.8 percentage points for the “Licensing” units and by 6.95 percentage points for the “Infrastructure and Civil Engineering” CGU, also considering the prospects of the CGU following the redefinition of the operating structure, the commercial repositioning as well as the strengthening of synergies and know-how
The analysis undertaken based on the parameters outlined above did not result in any loss in value.
A sensitivity analysis was also undertaken on the basis of the changes in the following parameters: i) discount rate and ii) growth rate for the estimate of the Terminal Value; based on this analysis, the range of the recoverable value of the CGU’s was determined.

119
Discount rate (WACC post tax) Lower extreme Higher extreme
Technology, Engineering & Construction CGU 11.9% 12.9%
Infrastructure & Civil Engineering CGU 10.7% 11.7%
Licensing CGU 13.3% 14.3%
Growth rate beyond plan period Lower extre me Higher extreme
Technology, Engineering & Construction CGU 1.2% 2.2%
Infrastructure & Civil Engineering CGU 0.4% 1.4%
Licensing CGU 1.2% 2.2%
The results of these sensitivity analyses did not highlight any impacts on the values recorded by the three CGU’s. It is also noted that if there had been changes in the working capital in the cash flows relating to the Infrastructure and Civil Engineering CGU, the results of the test and the relative sensitivity would not have indicated any impact on the value recognized relating to this CGU.
In the application of this method, management utilized assumptions, including the estimate of the future increases in the backlog, revenues, gross margin, operating costs, growth rate of the terminal value, investments and average weighed cost of capital (discount rate). The cash flow forecasts refer to current business conditions, therefore they do not include cash flows related to events of an extraordinary nature.
The estimates and the budget data were determined by Group management based on past experience and forecasts relating to the development of the Group’s markets. However, the estimate of the recoverable value of the cash generating units requires discretionary interpretation and the use of estimates by management. The Group cannot guarantee that there will not be a loss in value of the goodwill in future years. In fact, various market environment factors may require a review of the value of goodwill. The circumstances and events which could give rise to a further loss in value will be monitored constantly by the Group.
28.3. Other intangible assets
(in Euro thousands)
2015 Changes in the year
2016
Patents 19,023 943 19,966
Concessions, licenses, trademarks & similar rights 1,564 617 2,183
Other 2,172 (1,327) 844
Assets in progress and advances 3,317 5,798 9,115
Total 26,076 6,032 32,108
The following table illustrates the changes in the historical cost, accumulated amortization and net book values for the year 2016:

Maire Tecnimont Group
120
(in Eur o thousands)
Patents
Concessions, licenses,
trade marks & others
Others Assets in progress and advances
Total
Net book value at December 31, 2015 19,023 1,564 2,172 3,317 26,076
Increases 2,216 1,416 236 5,802 9,670
Disposals 0 0 (24) 0 (24)
Amortization (1,274) (707) (725) 0 (2,705)
Cost reclassification/adjustments 0 0 (977) 0 (977)
Change in consolidation scope 0 0 0 0 0
Revaluations/(Write-downs) 0 0 0 0 0
Other movements 0 (90) 161 (4) 67
Net book value at December 31, 2016 19,966 2,183 844 9,115 32,108
Historic cost 30,086 11,000 23,338 9,115 73,540
Accumulated amortization (10,121) (8,817) (22,494) 0 (41,432)
The value of the other intangible assets at December 31, 2016 amounted to Euro 32,108 thousand, with an increase of Euro 6,032 thousand compared to December 31, 2015; this increase mainly derives from acquisitions net of amortization for the year.
The principal changes in the year related to:
• Patent rights, with a net increase of Euro 943 thousand, mainly refer to the new technologies and intellectual property rights (patents and licenses) developed and filed by Stamicarbon B.V and by Maire Tecnimont Innovation Center (MTIC); the change in the year refers to amortization in the year, net of new registrations of intellectual property;
• Concessions, licenses and trademarks, with a net increase of Euro 617 thousand mainly refers to the costs incurred for the purchase of software licenses for operational activities, engineering applications and the management of business processes, as well as the installation of new management and document digitalization systems; the change in the year also related to amortization;
• Other Intangible assets, with a net decrease of Euro 1,327 thousand, mainly due to amortization in the year;
• Intangible assets in progress and advances report a net increase of Euro 5,798 thousand, which mainly includes new software and relative installations still in progress. We highlight the commencement of the migration of the ERP SAP to the new HANA infrastructure, the updating of the principal engineering applications and the documentation system (Documentum EPFM), the Prometeo project activities in support of Project Control and the Group HR project for the management of human resources.

121
For comparative purposes the changes relating to the previous year are shown below:
(in Euro thousands)
Patents
Concessions, licenses,
trademarks & others
Others Assets in
progress and advances
Backlog orders
Total
Net book value at December 31, 2014 20,825 371 2,157 1,541 1,128 26,022
Increases 1,461 1,743 1,175 1,776 0 6,155
Disposals 0 0 0 0 0 0
Amortization (1,236) (551) (1,282) 0 0 (3,069)
Cost reclassification/adjustments 0 0 0 0 0 0
Change in consolidation scope 0 0 0 0 0 0
Revaluations/(Write-downs) (2,027) 0 0 0 (1,128) (3,155)
Other movements 0 2 121 0 0 123
Net book value at December 31, 2015 19,023 1,564 2,172 3,317 (0) 26,076
Historic cost 29,888 9,345 51,210 3,317 40,694 134,456
Accumulated amortization (10,865) (7,781) (49,038) 0 (40,694) (108,378)
28.4. Investments in associates and Joint Ventures
(in Euro thousands)
2015 Changes in the
year 2016
Investments in associates:
• Studio Geotecnico Italiano s.r.l. 1,021 81 1,102
• MCM servizi Roma S.c.a.r.l. in liquidation 4 0 4
• UCC Engineering LLP - Kazakistan (**) 0 0 0
• Desimont Contracting Nigeria (*) 0 0 0
• JV TSJ Limited (*) 0 0 0
• Villaggio Olimpico Moi S.c.a.r.l. in liquidation 3 0 3
• FEIC Consortium in liquidation 5 0 5
• Tecnimont Construction Co WLL-Qatar 20 0 20
• KT Star Co. S.A.E. 1,757 (1,757) 0
• HIDROGENO C ADEREYTA – S.A.P.I. de C.V. (*) 0 0 0
• Baltica S .c.a r.l. in liqu idation 5 (5) 0
• Bio - P S .r.l. 4 25 29
• Biolevano S.r.l. 7,240 4,500 11,740
• Kazakhstan JV Tecnimont-KTR LLP 0 151 151
Total 10,060 2,995 13,055
(*) The investment was completely written down and a provision for accumulated losses is recorded under provisions for risks and charges.
(**) Sold in H1 2016.
During 2016 the following changes took place in the investments held in associates:
- the investment in the company Bio-P S.r.l. increased by Euro 25 thousand following a further share capital increase;

Maire Tecnimont Group
122
- the investment in the company UCC Engineering LLP - Kazakistan was sold.
- the investment in KT Star Co. S.A.E. was fully consolidated.
- the incorporation of JV Kazakhstan Tecnimont-KTR LLP for the development of initiatives in the country with a new strategic partner.
- the investment in Baltica S.c.a.r.l was liquidated.
The investment held in Biolevano S.r.l increased Euro 4,500 thousand following the conversion of the shareholder loan for a similar amount into paid-in share capital in order to capitalize the company, while the investment held in Studio Geotecnico S.r.l increased following valuation at equity.
The breakdown of associates and joint ventures is as follows:
Company Location/Country Currency Share capital
% Group
Through: %
Studio Geotecnico Ita liano
ITA EUR 1,550,000 44.00% Tecnimont S.p.A. 44%
MCM servizi Roma S.c.a.r.l. in liquidation
ITA EUR 12,000 33.33% MST S.r.l. 33.33%
Desimont Contracting Nigeria
Nigeria NGN 0 45% Tecnimont S.p.A. 45%
JV TSJ Limited Malta USD 123,630 55.00% Tecnimont S.p.A. 55.00%
Villaggio O limpico Moi S.c.a.r.l. in liquidation
ITA EUR 10,000 33.33% Tecnimont C.C.
S.p.A. 33.33%
FEIC Consortium in liquidation
ITA EUR 15,494 33.85% Tecnimont C.C.
S.p.A. 33.85%
Tecnimont Construction Co WLL-Qatar
Qatar QAR 42,000 49% Tecnimont C.C.
S.p.A. 49%
HIDROGENO CADEREYTA – S.A.P.I. de C.V.
Mexico MXN 10,000 40.7% KT S.p.A. 40.7%
Biolevano S.r.l. ITA EUR 18,274,000 30.0% MET NEWen
S.p.A. 30.0%
BIO - P S.r.l. ITA EUR 50,000 30.0% Processi
Innovativi S.r.l 30.0%
Kazakhstan JV Tecnimont-KTR LLP
KZT KZT 110,000,000 50.0% Tecnimont S.p.A. 50.0%
The key financial highlights of the principal associates and joint ventures and the reconciliation with the book value of the investments is shown below:
KEY FINANCIAL HIGHLIGHTS
(in Eur o thousa nds)
Studio Geotecnico TSJ Limited Biolevano S.r.l.
NO N-CURRENT ASSETS 140 0 62,990
CURRENT ASSETS 5,894 3,357 16,040
FINANCIAL ASSETS 445 27,640 15,053
TOTAL ASSETS 6,479 30,997 94,083
NET EQUITY 2,468 (35,203) 36,851
NO N-CURRENT LIABILITIES 855 0 1,788
CURRENT LIAB ILITIES 2,991 66,200 10,034
FINANCIAL LIABILIT IES (current and non-current) 165 0 45,365
TOTAL NET EQUITY AND LIABILIT IES 6,479 30,997 94,038

123
(in Euro thousands) Studio Geotecnico TSJ Limited Biolevano S.r.l.
REVENUES 4,188 -3,056 29,933
EBITDA 218 -16,785 24,252
TOTAL COMPREHENSIVE INCO ME 151 -16,796 2,250
RECONCILIATION WITH THE BOOK VALUE OF THE INVESTMEN T
(in Euro thousands)
Studio Geotecnico
TSJ Limited
Biolevano S.r.l.
GROUP SHARE 44% 55% 30%
EQUITY SHARE 1,086 (19,361) 11,055
OTHER AD JUSTMENTS (*) 16 19,361 685
BOOK VALUE OF THE INVESTMENTS 1,102 0 11,740
(*) The “other adjustments” relating to the JV TSJ Limited concern the risk provision for accumulated losses in relation to Biolevano S.r.l., mainly for the revaluation of fair value of the residual holding after the sale of the company.
With reference to the other investments held by the Group in associates and joint ventures, there are no individually significant investments compared to total consolidated assets, operating activities or regional operations and, therefore, the disclosure required in such cases by IFRS 12 is not provided.
28.5. Financial instruments - Non-current Derivatives
(in Euro thousands)
2015 Changes in the year
2016
Financial instruments - Currenc y hedging derivatives 1,610 7,254 8,864
Financial instruments - Raw materia l hedging derivatives 0 195 195
Total 1,610 7,449 9,059
The account Non-current derivative financial instruments at December 31, 2016 amounts to Euro 9,059 thousand, an increase of Euro 7,449 thousand compared to December 31, 2015.
The account for Euro 8,864 thousand relates to the measurement at fair value of the derivative contracts in place; specifically, they refer to the measurement of the derivative instruments to hedge against currency risks on the cash flows related to project revenues and costs; the positive mark-to-market will be set off against future operating cash flows of a similar amount. The account for Euro 195 thousand refers to the measurement of the derivative instruments to hedge against changes in the prices of raw materials (copper) whose value on the overall margin of the projects is significant. The change derives from the market movements of exchange rates and commodities.
For further information and analysis of the Fair Value Hierarchy, reference should be made to the “FINANCIAL RISKS” section.

Maire Tecnimont Group
124
28.6. Other non-current financial assets
(in Eur o thousands) 2015 Changes in the
year 2016
Equity investments:
Non-consolidated subsidiaries 184 65 249
Other companies 4,298 8,520 12,820
Total equity investments 4,482 8,588 13,068
Financial receivables from associates 4,500 (4,498) 2
Financial receivables from group companies 1,610 0 1,610
Other receivables 6 350 356
Total financia l receivables 6,116 (4,147) 1,969
Total 10,598 4,441 15,037
Investments in non-consolidated subsidiaries
(in Eur o thousands)
2015 Changes in the
year 2016
Investments in non-consolidated subsidiaries:
• Svincolo Taccone S.c.a.r.l. in liquidation 8 0 8
• Ravizza S.c.a.r.l. in liqu idation 5 0 5
• Parco Grande S.c.a.r.l. in liquidation 5 0 5
• Program International C.E. S.r.l. in liquidation (*) 0 0 0
• Exportadora de Ingegniería y Servicios TCM SpA 68 0 68
• Tecnimont Illinois Llc. 9 0 9
• Tecnimont HQC SD Bhd. 83 (83) 0
• Tecnimont HQC S.c.a.r.l. 6 (6) 0
• Tecnimont Bolivia S.r.l. 0 129 129
• Tecnimont Iberia S .l.u. 0 25 25
Total 184 65 249
(*) The investment was completely written down
The decreases in 2016 are due exclusively to the inclusion of TecnimontHQC S.c.a.r.l. and TecnimontHQC SD Bhd. in the consolidation scope following the start-up of the projects for which they were incorporated.
The new companies Tecnimont Bolivia S..r.l. and Tecnimont Iberia S.l.u were also incorporated following the possible commencement of a new special purpose project next year; the companies are not yet operative and were therefore not consolidated.
Tecnimont Exportadora de Ingegniería y Servicios TCM SpA in Chile and Tecnimont Illinois LLC in the United States are still not operational and were therefore not included in the consolidation.
The breakdown of the non-consolidated subsidiaries is as follows:

125
Company Location/Country Currency %
Group Through: %
Rav izza S.c.a.r.l in liquidation ITA EUR 50% Tecnimont C.C.
S.p.A. 50%
Parco Grande S.c.a.r.l. in liquidation ITA EUR 50% Tecnimont C.C.
S.p.A. 50%
Program International C .E. S.r.l in liquidation
ITA EUR 100% KT S.p.A. 100%
Svincolo Taccone S.c.a.r.l. in liquidation
ITA EUR 80% Tecnimont S.p.A. 80%
Exportadora de Ingegniería y Servic ios TCM SpA
Chile CLP 100% Tecnimont S.p.A. 100%
Tecnimont Illino is Llc. USA USD 100% Tecnimont USA Inc. 100%
Tecnimont Bo liv ia S.r.l. Bo liv ia BS 100% Tecnimont S.p.A. 99%
Tecnimont Messico
SA de CV 1%
Tecnimont Iberia S.l.u. Spa in EUR 100% Tecnimont S.p.A. 100%
The investments in non-consolidated subsidiaries mainly refer to consortiums incorporated for specific projects whose corporate duration is related to the duration of the project which is currently either terminated or not yet commenced. The investments in non-consolidated subsidiaries are classified as financial instruments available for sale; these investments must be measured at fair value, but as the investment relates to securities which are not listed on an active market, the fair value may not be reliably determined; however the fair value is not expected to vary from the cost. These investments are therefore maintained at cost, adjusted for any loss in value.
With reference to the investments held by the Group in non-consolidated subsidiaries there are no individually significant investments compared to the total of the consolidated assets, operating activities or regional operations and, therefore, the disclosures required in such cases by IFRS 12 are not provided.
INVESTMENTS IN OTHER COMPANIES
(in Euro thousands)
2015 Changes in the year
2016
• Metrofiera S.c.a.r.l. 2 9 11
• Bata S.p.A. in liquidation 38 (38) 0
• R.C.C.F. S.p.A. – Nodo di Torino 4 0 4
• Finenerg ia S.p.A. in liquidation 26 0 26
• Società Interporto Campano S.p.A. 1,653 0 1,653
• Penta Domus S.p.A 509 (422) 87
• Cavtomi consortium 150 0 150
• Cavet consortium 434 0 434
• Lotto 5A S.c.a.r.l. 2 0 2
• Metro B1 S .c.a.r.l. 352 0 352
• RI.MA.TI. S .c.a.r.l. 40 0 40
• Sirio consortium 0.3 0 0.3
• Lybian Joint Company 9 0 9

Maire Tecnimont Group
126
(in Eur o thousands) 2015
Changes in the year 2016
• Progetto Alfiere Costruzione in liqu idation (*) 0 0 0
• Cisfi S.p.a. 1,008 0 1,008
• Fondazione ITS 10 0 10
• Contratto di programma Aquila consortium (*) 0 0 0
• Consorzio parco scientifico e tecnologico Abruzzo (*) 0 0 0
• Tecnosanità S .c.a.r.l. 17 0 17
• Tecnoenerg ia Nord S.c.a.r.l. consortium 35 0 35
• Tecnoenerg ia Sud S.c.a.r.l. consortium 7 0 7
• Siluria Technologies Inc. 0 8,974 8,974
Total 4,297 8,522 12,820
(*) The holdings were entirely written down The increase in 2016 is essentially due to the subscription by MET GAS S.p.A. (formerly Protecma S.r.l.) of shares in Siluria Technologies Inc through the Round E investment. Parallel to this investment, Maire Tecnimont S.p.A. and Siluria Technologies signed a co-operation agreement, based on which the two companies combined their respective technologies, know-how and experience for the commercialization of a new process to directly convert natural gas into chemical products and their derivatives. The decrease is related to the liquidation of Bata S.p.A. and the write-down of the investment in Penta Domus S.p.A. following the reduction in the share capital of the company due to the losses incurred by the “Ex Area Vitali” real estate project through the vehicle company Cinque Cerchi S.p.A.
The investments in other companies mainly refers to consortiums incorporated for specific projects whose duration is related to the project span. These investments should be measured at fair value, but as the investment relates to securities which are not listed on an active market, the fair value may not be reliably determined. They are therefore maintained at cost, adjusted for any loss in value. The investments in other companies are classified as financial instruments available-for-sale.
The key financial highlights relating to other companies is reported below:
Company Location/Country
Currency %
Group Through: %
Contratto di programma Aquila consortium
ITA EUR 5.50% KT S.p.A. 5.50%
Fondazione ITS ITA EUR 10% KT S.p.A. 10%
Parco scientifico e tecnologico Abruzzo consortium
ITA EUR 11.10% KT S.p.A. 11.10%
Tecnoenergia Nord S.c.a.r.l. consortium ITA EUR 12.50% MST S.r.l 12.50%
Tecnoenergia Sud S.c.a.r.l. consortium ITA EUR 12.50% MST S.r.l 12.50%
Tecnosanità S.c.a.r.l. ITA EUR 17% MST S.r.l 17%
Cavtomi consortium ITA EUR 3% Tecnimont C.C. S.p.A. 3%
Società Interporto Campano S.p.A. ITA EUR 3.08% Tecnimont C.C. S.p.A. 3.08%
R.C.C.F. SC.p.A. – Nodo di Torino ITA EUR 4% Tecnimont C.C. S.p.A. 4%

127
Company Location/Country
Currency %
Group Through: %
RI.MA.TI. S.c.a.r.l. ITA EUR 6.15% Tecnimont C.C . S.p.A. 6.15%
Cavet consortium ITA EUR 8% Tecnimont C.C . S.p.A. 8%
Lotto 5°A S.c.a.r.l. ITA EUR 15% Tecnimont C.C . S.p.A. 15%
Progetto Alfiere Costruz ione in liquidation
ITA EUR 19% Tecnimont C.C . S.p.A. 19%
Metro B1 S.c.a.r.l. ITA EUR 19.30% Tecnimont C.C . S.p.A. 19.30%
Penta Domus S.p.A ITA EUR 13.52% Tecnimont C.C . S.p.A. 13.52%
Metrofie ra S.c .a.r.l. ITA EUR 9.99% Tecnimont C.C . S.p.A. 9.99%
Cisfi S.p.a ITA EUR 0.69% Tecnimont C.C . S.p.A. 0.69%
Lybian Jo int Company Libya Libyan Dinar
0.33% Tecnimont S.p.A. 0.33%
Finenergia S.p.A. in liquidation ITA EUR 1.25% Tecnimont S.p.A. 1.25%
Siluria Techno logies Inc . USA USD 2.55% MET GAS S.p.A. 2.55%
NON-CURRENT FINANCIAL RECEIVABLES FROM ASSOCIATES
Receivables from associates amount to Euro 2 thousand and relate to the financial receivable from the associate Bio-P S.r.l. for the operating activities of the newly incorporated company; the loan is non-interest bearing. The reduction in receivables from associates is due to the conversion of the loan of Euro 4,500 thousand into a share capital increase for Biolevano S.r.l for a similar amount in order to capitalize the company; consequently, the investment held in Biolevano S.r.l increased by Euro 4,500 thousand. The loam is non-interest bearing.
NON-CURRENT FINANCIAL RECEIVABLES FROM GROUP COMPANIES
Receivables from group companies amount to Euro 1,610 thousand and relate to the financial receivable of Tecnimont Civil Construction S.p.A. from the group company Penta Domus S.p.A for the funding of the “Ex Area Vitali” project of this latter.
NON-CURRENT FINANCIAL RECEIVABLES FROM OTHER COMPANIES
Financial receivables from other companies relate to the financial receivable of Tecnimont C.C. S.p.A. from RCCF Nodo di Torino S.C.P.A. in Liquidation for Euro 6 thousand and for Euro 350 thousand financial prepayments and accrued income.
28.7. Other non-current assets
(in Euro thousands)
2015 Changes in the year
2016
Trade receivables beyond 12 months 73,204 (22,965) 50,238
Other trade receivables beyond 12 months 12,270 1,099 13,369
Prepayments beyond 12 months 5,522 503 6,026
Total 90,996 (21,365) 69,632
Other non-current assets amount to Euro 69,632 thousand, decreasing Euro 21,365 thousand compared to December 31, 2015.

Maire Tecnimont Group
128
Trade receivables due beyond 12 months mainly relate to receivables of Tecnimont S.p.A. and KT – Kinetics Technology S.p.A. for withholding guarantees by the buyer for the correct completion of works in progress. The decrease of Euro 22,965 thousand is the net effect of greater releases of withholding guarantees in 2016 than those matured. The decrease mainly refers to the Etihad Railway Project which was substantially completed.
Other trade receivables beyond 12 months amount to Euro 13,369 thousand and increased Euro 1,099 thousand; this amount mainly refers to receivables from J&P Avax and other receivables beyond 12 months, including guarantee deposits.
For further information on the situation with the supplier J&P Avax, reference should be made to the “Disputes” section of the Directors’ Report.
Prepayments beyond twelve months amount to Euro 6,026 thousand and mainly comprise
advance payments on bank guarantee commissions relating to new large projects acquired.
28.8. Deferred tax assets and liabilities
(in Eur o thousands)
2015 Changes in the
year 2016
Deferred tax assets 78,417 (9,893) 68,524
Deferred tax liabilities (20,597) (4,453) (25,050)
Total 57,820 (14,346) 43,473
Deferred tax assets and liabilities present a positive net balance of Euro 43,473 thousand, decreasing Euro 14,346 thousand compared to December 31, 2015 as a combined effect of the reduction in deferred tax assets and the increase in deferred tax liabilities.
The decrease in deferred tax assets is substantially due to the combined effect of the release of deferred tax assets on fiscal losses in previous years of some Group companies utilized in the year to reduce the Group tax charge and the release of deferred tax assets on excess interest expenses not deductible in previous years and deductible in the current year, offset by the deferred tax assets arising on temporary charges deductible in future years.
Deferred tax liabilities increased by Euro 4,453 thousand and relate to provisions on temporary differences which will be assessable in future years.
Deferred tax assets were measured through critically assessing the future recoverability of these assets on the basis of the capacity of the company and of the Maire Tecnimont Group, also through use of the “tax consolidation” option, to generate assessable income in future years. The National Tax Consolidation was renewed for the years 2016-2018.
The Group reports theoretical tax benefits for tax losses which may be carried forward of approx. Euro 56.3 million not recognized to the balance sheet.

129
28.9. Inventories and Advances to Suppliers
(in Euro thousands)
2015 Changes in the year
2016
Products in work-in-progress and semi-finished 0 4,759 4,759
Finished products and goods 902 (75) 828
Advance payments to suppliers 160,753 196,378 357,132
Total 161,655 201,065 362,720
The account “Products in work-in-progress and semi-finished goods”, equal to Euro 4,759 thousand, relate to the “Campus Firenze” initiative, project financing concession of the Florence University which in 2016 was restarted following acgrement between the parties.
“Finished products and goods”, amounting to Euro 828 thousand, relate to consumable materials and finished products utilized by the Cefalù 20 Consortium for its site activities.
Advance payments to suppliers, amounting to Euro 357,132 thousand, refer to the advances paid to foreign and Italian suppliers and sub-contractors against materials shipped for the construction of plant and work in progress.
The increase of Euro 196,378 thousand is a direct consequence of the advancement of the projects acquired in the previous year and for which significant principal equipment orders were issued, in addition to higher materials held in warehouses for shipment.
28.10. Construction contracts
(in Euro thousands)
2015 Changes in the
year 2016
Works-in-progress - Payments on account 9,278,326 1,767,144 11,045,470
(Payments received on green certificates) (8,773,820) (1,392,011) (10,165,831)
Total 504,506 375,133 879,639
Contract work-in-progress classified under assets (construction contract assets) reflects the net positive amount, by individual order, between the advancement of works and the relative invoicing on account and the contractual risks provision.
The increase of Euro 375,133 thousand is principally due to the much greater volume of works executed during the year.
The main construction contracts concern Infrastructure orders, including for the Fiumetorto-Cefalù rail line and the Etihad Railways network. For the Technology, Engineering & Construction sector the main contracts are those of Tempa Rossa, Kima, Punta Catalina, ADCO and AGRP Kuwait.
The value of construction contracts includes additional requests on orders in an advanced state of negotiation, for the portion expected to be accepted by the client.

Maire Tecnimont Group
130
28.11. Trade receivables
(in Eur o thousands)
2015 Changes in the year
2016
Trade receivables due within 12 months 358,474 125,741 484,213
Subsidiaries - within 12 months 906 (399) 507
Associates - w ith in 12 months 21,833 8,323 30,157
Group companies - within 12 months 11,881 (357) 11,524
Total 393,094 133,308 526,402
Trade receivables at December 31, 2016 amount to Euro 526,402 thousand, an increase of Euro 133,308 thousand compared to December 31, 2015.
The increase in trade receivables is mainly due to the greater volume of works executed during the year, as well as the contractual terms of the main projects; a further increase in invoicing is expected in the coming months.
Trade receivables from subsidiaries refer to non-consolidated subsidiaries; the account comprises receivables from Program International Consulting Engineers S.r.l. for Euro 426 thousand, Parco Grande for Euro 34 thousand, Ravizza for Euro 3 thousand and the newly incorporated Tecnimont Bolivia for Euro 44 thousand.
Receivables from associates amount to Euro 30,157 thousand and mainly refer for Euro 21,806 thousand to receivables for services provided by the Group to TSJ Limited for the “Borouge 3” project; the increase follows greater completion phase activity. They concern for Euro 6,650 thousand Biolevano S.r.l. for residual trade receivables relating to the Biomass plant to be received in January 2017 and for Euro 1,701 thousand the recharges and services to Desimont Contracting Ltd.
Trade receivables from group companies primarily relate to engineering services provided and concern Metro B1 for Euro 5,637 thousand, the Cavtomi Consortium for Euro 3,033 thousand, Interporto Campano for Euro 1,751 thousand and for Euro 353 thousand Penta Domus S.p.A. for asset and project management services on the “Ex Area Vitali” project and residually for Euro 21 thousand from the Cavet consortium.
Trade receivables are recorded net of the doubtful debt provision of Euro 6,129 thousand at December 31, 2016 (Euro 10,065 thousand at December 31, 2015).
(in Eur o thousands)
2015 Provisions Utilizations Change in
consolidation scope
Other changes 2016
Doubtful debt provision 10,065 738 (4,705) 0 30 6,129
Total 10,065 738 (4,705) 0 30 6,129
The provisions mainly related to Technology, Engineering & Construction BU projects. The decrease in the year concerns utilizations following the realization of losses on receivables previously provisioned.
Overdue trade receivables principally refer to the Infrastructure and Civil Engineering Business Unit and concern Italian public sector entities; in relation to the Technology, Engineering & Construction BU, they refer to a few positions and are constantly monitored. Neither client

131
categories provide concern from a solvency viewpoint (Italian and foreign state bodies), or for the recoverability of the amounts.
All trade receivables in the accounts substantially approximate fair value which was calculated as indicated in the accounting policies section.
28.12. Current tax assets
(in Euro thousands)
2015 Changes in the
year 2016
Tax receivables 123,074 (201) 122,873
Total 123,074 (201) 122,873
Tax receivables amount to Euro 122,873 thousand, decreasing Euro 201 thousand compared to December 31, 2015. The account mainly refers to VAT for Euro 63,042 thousand and other tax receivables of Euro 59,803 thousand. The VAT receivables relate to the balance of the tax consolidation executed by the Parent Company Maire Tecnimont S.p.A. of Euro 18,635, receivables of the Italian companies not yet within the Group consolidation and foreign companies amounting to Euro 14,243 thousand and for Euro 30,164 the foreign subsidiaries Tecnimont Do Brasil and Tecnimont Chile. The VAT receivables of the South American entities are considered recoverable not only through the acquisition of new projects by the South American Group, but also in view of their recognition on any sale of the company. Other tax receivables for Euro 59,803 thousand principally refer to:
• tax receivables of foreign companies for Euro 30,734 thousand, mainly related to the tax receivables of the subsidiary Tecnimont Private Limited;
• residual tax receivables of Euro 29,069 thousand mainly related to: excess corporation tax payment on account compared to current income taxes of the other companies of the Group, IRAP payments on account, tax receivable for bank interest withholding tax and other tax receivables for various reimbursements, as well as tax credits for income taxes paid abroad.
Maire Tecnimont S.p.A. and the subsidiaries Tecnimont S.p.A., MST S.r.l., Met Gas Processing Technologies (formerly Protecma S.r.l), Tecnimont Civil Construction S.p.A, Met Newen S.p.A and KT S.p.A. opted to apply the Tax Consolidation regime which permits the calculation of the IRES corporation tax on a tax basis representing the aggregate of the taxable income and losses of the individual companies. The companies Tecnimont S.p.A., Tecnimont Civil Construction S.p.A, Met Gas Processing
Technologies (formerly Protecma S.r.l), Consorzio Cefalù 20, Consorzio Corace in liquidation and Met Newen and M.S.T. S.r.l. have also applied the Group VAT consolidation regime.

Maire Tecnimont Group
132
28.13. Financial instruments - Derivatives
(in Eur o thousands)
2015 Changes in the year
2016
Financial instruments - Currency hedging derivatives 854 17,447 18,301
Financial instruments - Raw material hedging derivatives 0 1,865 1,865
Financial instruments - Total Return Equity SWAP (TRES) derivatives 0 1,150 1,150
Total 854 20,461 21,315
Derivative financial instruments at December 31, 2016 amount to Euro 21,315 thousand, increasing Euro 20,461 thousand compared to December 31, 2015 and concern the fair value measurement of the derivative contracts in force. The account for Euro 18,301 thousand relates to the measurement of the derivative instruments to hedge against currency risks on the cash flows related to project revenues and costs. The mark-to-market is positive as the movement in the exchange rate since the subscription date of the derivative instruments to the reporting date saw a weakening principally of the Dollar against the Euro; the positive mark-to-market will be offset by the future operating cash flows for a similar amount. The account derivative financial instruments for Euro 1,865 thousand refers to the measurement of the derivative instruments to hedge against changes in the prices of raw materials (copper) whose value is significant on the overall margin of the projects. The change derives from the market movements of exchange rates and commodities. The account for Euro 1,150 thousand relates to the positive fair value of two derivative instrument (TRES); in fact in February 2016, Maire Tecnimont S.p.A. subscribed to a cash-settled Total Return Equity Swap (TRES) contract to hedge against movements in the Maire Tecnimont share price, in view of the implementation of a buy-back program for a maximum 10,000,000 shares, approved by the Ordinary Shareholders’ Meeting of December 15, 2015, as illustrated in the 2015 Annual Report. The contract was underwritten with a financial intermediary and currently there is no obligation for Maire Tecnimont to acquire the treasury shares, but only the obligation for settlement between the parties of the differential between the exercise price and the Maire Tecnimont share price on the maturity of the instrument. The instrument matures in May 2019, but provides for annual intermediary windows (April - May 2017 & April - May 2018) in which Maire Tecnimont may exercise a partial “Early Termination” option. Maire Tecnimont in addition to an initial fee, must recognize a financial expense (interest rate expense) over the duration of the contract for the capital invested by the intermediary to implement the share purchase program on maturity. The TRES is not considered a hedge instrument for hedge accounting purposes and therefore is measured in accordance with IAS 39 as a fair value derivative through P&L. In October 2016, Maire Tecnimont S.p.A. subscribed to a further derivative contract (TRES) to hedge against movements in the Maire Tecnimont share price, in view of an increase in the number of shares to be purchased on the market for a total amount of 4,500,000 treasury shares. The contract is substantially similar to the previous contract signed although there are no optional annual intermediary windows and therefore the final maturity is May 2019. For further information and analysis of the Fair Value Hierarchy, reference should be made to the “FINANCIAL RISKS” section.

133
28.14. Other current financial assets
(in Euro thousands)
2015 Changes in the
year 2016
Financial receivables within 12 months:
Subsidiaries 900 (900) 0
Associates 510 (371) 139
Group companies 1,425 (1,169) 255
Other securities 3,405 (3,405) 0
Others 2,170 4,808 6,979
Total 8,410 (1,037) 7,373
Other current financial assets at December 31, 2016 amount to Euro 7,373 thousand, a decrease of Euro 1,037 thousand compared to December 31, 2015.
Receivables from subsidiaries were from Program International Consulting Engineers S.r.l. and the respective positions were settled during the year.
Financial receivables from associates concern Villaggio Olimpico Moi for Euro 69 thousand and MCM Servizi Roma for Euro 70 thousand.
Financial receivables from group companies concern the CAVET Consortium and the reduction in the year is the direct consequence of off-setting between creditor and debtor positions of the Group with the Consortium.
“Other securities” of Euro 3,145 thousand principally concern temporary liquidity investments in SICAV’s by the subsidiary TCM FR S.A. which were liquidated in the year.
Other receivables amount to Euro 6,979 thousand and report an increase of Euro 4,808 thousand; this account includes for Euro 1,623 thousand financial prepayments and accrued income and for Euro 5,356 thousand financial receivables from factoring companies and banks for the residual portion of advances received, receivables from some minor consortiums for special purpose projects of the Tecnimont Civil Construction Group and various deposits relating to the KT Group. For all financial assets, the book value approximates the fair value which is calculated as described in the accounting policies section.
28.15. Other current assets
(in Euro thousands)
2015 Changes in the
year 2016
Others receivables within 12 months 56,522 34,523 91,045
Commercial prepayments 12,432 (4,292) 8,140
Total 68,954 30,231 99,185
Other current assets at December 31, 2016 amount to Euro 99,185 thousand, an increase of Euro 30,231 thousand compared to December 31, 2015. The account mainly comprises receivables from other shareholders of the consolidated consortiums, commercial discounts, employee receivables, social security and tax receivables, VAT and taxes of foreign companies

Maire Tecnimont Group
134
and other various receivables, as well as the Alba-Brà Hospital construction and management project represented in accordance with the IFRIC 12 model. The increase is mainly related to the reclassification of the above-mentioned Alba-Brà project from trade receivables to other current assets and the increase of receivables from consolidated consortiums for the third party share following the start-up of TecnimontHQC S.c.a.r.l’s activities on the Rapid Maleysia project, net of the decrease which mainly concerned commercial prepayments and accrued income and tax receivables, VAT and taxes of foreign companies.
All current assets in the accounts substantially approximate fair value. The breakdown of other receivables due within 12 months is shown in the table below:
(in Eur o thousa nds)
2015 Changes in the year
2016
Alba-Bra’ Hospital Concession 0 27,796 27,796
Receivables from consortiums and JV’s 14,993 4,800 19,793
Other debtors 26,258 1,694 27,952
Taxes, VAT and levies (foreign companies) 7,096 3,005 10,101
Insurance premiums 1,253 (980) 273
Guarantee deposits 1,841 196 2,037
Other prepayments (renta l, commissions, assistance) 12,432 (4,293) 8,140
Employee receivables 864 405 1,268
Advance payments to suppliers 2,833 (2,328) 505
Social security institu tions 1,065 246 1,311
Receivables for unpaid contributions from other shareholders 319 (310) 9
Total 68,955 30,228 99,185
The Alba-Brà Hospital concession is a “construction and management” contract signed with ASL CN2. The initiative is headed by the project company MGR Verduno S.p.A. and the work is approx. 70% completed. Following the positive conclusion, in September 2013, of the amicable settlement pursuant to Article 240 of Legislative Decree 163/2006 and subsequent addendums, the new contractual terms were agreed upon for completion of the works on September 30, 2015. In 2016, the works slowed ahead of the definition of changes with the client, of the amount of the public contribution, of the revision of the Financial Plan and the setting of a new works completion deadline. In February 2017, addendum No. 3 was agreed, defining the above points and establishing the deadline for completion of works as September 30, 2018 and the initiation of the management phase as October 1, 2018 for twenty years.
28.16. Cash and cash equivalents
(in Eur o thousands)
2015 Changes in the year
2016
Bank deposits 362,054 134,851 496,905
Cash in hand and similar 331 (98) 233
Total 362,385 134,753 497,138

135
Cash and cash equivalents at December 31, 2016 amount to Euro 497,138 thousand, an increase of Euro 134,753 thousand compared to December 31, 2015.
Operating cash flow amounts to Euro 163,187 thousand, which in addition to the result for the year was positively impacted by changes in working capital.
Investing activities absorbed cash for Euro 20,568 thousand, mainly due to the costs incurred for the installation of software and other applications, license development and new technologies - patents of Stamicarbon B.V and the Maire Tecnimont Innovation Center (MTIC), capex and the investment in Siluria Technologies for Euro 8,973 thousand.
Financing activities also absorbed cash for Euro 7,867 thousand, principally due to interest expense paid in the year, advance repayment of invoices related to the working capital management of specific contracts and the reduction of bank overdrafts and also following the payment of the dividend approved by the Ordinary Shareholders’ Meeting of April 27, 2016 of Euro 14,360 thousand.
The estimate of the “fair value” of bank and postal deposits at December 31, 2015 approximates their book value.
28.17. Shareholders’ Equity
Group Shareholders' equity December 31, 2016 amounts to Euro 169,577 thousand, a net increase of Euro 44,707 thousand compared to December 31, 2015 (Euro 124,871).
Total consolidated Shareholders’ Equity, considering minority interests, at December 31, 2016 amounts to Euro 184,656 thousand, an increase of Euro 58,457 thousand compared to December 31, 2015. This increase is also due to the change in minority interest equity including the result for the year; this result takes into account the positive effects of the final settlement on a project in partnership with minority shareholders.
The overall change in Group Shareholders’ Equity is mainly due to the result for the year, together with the decreases to the Cash Flow Hedge reserve for derivative instruments for Euro 13,472; this, as previously illustrated, mainly relates to the mark-to-market gains of the derivative instruments to hedge the currency risk of the revenues and costs from the projects, net of the relative tax effect.
Group Shareholders’ Equity decreased due to the payment of the dividend approved by the Ordinary Shareholders’ Meeting of April 27, 2016 of Euro 14,360 thousand.
SHARE CAPITAL
The Share capital at December 31, 2016 was Euro 19,689,550 and was comprised of 305,527,500 shares without par value and with normal rights.
SHARE PREMIUM RESERVE
The reserve comprises for Euro 25,000 thousand the share premium prior to November 26, 2007 and for Euro 58,045 thousand the share premium on the capital increase of 2007 net of the listing costs of Euro 3,971 thousand, net of the tax effect.
The change in 2013 was Euro 141,653 thousand, comprising share premium paid following the reserved share capital increase and from other shareholders amounting to Euro 146,417 thousand, offset for Euro 4,167 thousand for share capital increase charges net of the tax effect.

Maire Tecnimont Group
136
This reserve may be utilized for share capital increases without consideration and/or for the coverage of losses. In accordance with Article 2431 of the Civil Code, this reserve may be distributed to the shareholders following a Shareholders’ Meeting motion.
OTHER RESERVES
The other reserves at December 31, 2016 amount to Euro 64,456 thousand and comprise:
• Legal Reserve of the Parent Company Maire Tecnimont S.p.A. at December 31, 2016 of Euro 5,328 thousand;
• Asset revaluation reserve of Euro 9,772 thousand recorded following the accounting of the purchase of the residual 50% of Tecnimont Private Limited, and the revaluation of other buildings;
• Translation reserve at December 31, 2016 of a negative Euro 14,907 thousand and comprising the temporary translation differences of the financial statements in foreign currencies; the change in the year was a decrease of Euro 1,628 thousand, impacted by currency movements.
• Statutory Reserves, which at December 31, 2016 were Euro 46,554 thousand, did not change in the year.
• Other reserves, which at December 31, 2016 amounted to Euro 6,732 thousand.
• “Equity” component reserve of the Euro 80 million equity linked convertible bond issued in February 2014 amounting to Euro 6,960 thousand. This concerns the conversion option into shares of the convertible bond, for the accounting of which reference should be made to the “Other non-current financial liabilities” paragraph in these Explanatory Notes.
• IFRS 2 Reserve for Euro 4,066 thousand, which includes the valuation of the equity participation plans offered to employees as additional benefits. The above-mentioned plans are recognized in accordance with the provisions for share-based payments. In accordance with IFRS 2, these plans represent a remuneration component of the beneficiaries; therefore, for the equity participation plans, the cost is represented by the fair value of these instruments at the granting date, and recognized in the income statement under “Personnel expense” over the period between the granting date and that of maturity, and in the “IFRS 2 reserve” under equity.
VALUATION RESERVE
The valuation reserve, which at December 31, 2016 was a negative Euro 21,422 thousand, refers to the Cash Flow Hedge reserve and the actuarial gains and losses reserve. The changes in the revaluation reserve are shown below:
(in Eur o thousands) Cash Flow Hedge
Reserve
Actuarial gains/(losses)
Total
Net book value at December 31, 2015 (6,606) (828) (7,436)
Actuarial gain/(losses) 0 (449) (449)
Relative tax effect 0 123 123
Net valuation of derivatives instruments:
Valuation derivative instruments (18,582) 0 (18,582)
Relative tax effect 5,110 0 5,110
Net book value at December 31, 2016 (20,078) (1,155) (21,233)

137
The reconciliation between the “net income of Maire Tecnimont S.p.A. and Group net income” and the “Net equity of Maire Tecnimont S.p.A. and Group net equity” is shown below.
RECONCILIATION BETWEEN NET INCOME OF MAIRE TECNIMONT S.P.A. AND GROUP
NET INCOME
(in Euro thousands)
2015 2016
Maire Tecnimont S.p.A. net income 18,522 9,531
Inter-company dividends eliminated in consolidated financial statements (53,826) (33,602)
Result reported by subsidiaries 66,650 100,711
Elimination of in ter-company profits and write-downs 12,140 (991)
Other consolidation adjustments 304 0
Current and deferred taxes 166 (1,279)
Group net income 43,956 74,371
RECONCILIATION BETWEEN NET EQUITY OF MAIRE TECNIMONT S.P.A. AND GROUP
NET EQUITY (in Euro thousands)
2015 2016
Maire Tecnimont S.p.A. net equity 416,472 415,684
Elimination of the book value of consolidated investments (736,271) (750,280)
Recognition of net equity of the consolidated investments 294,113 345,802
Other consolidation adjustments 150,557 158,370
Group Shareholders’ equity 124,871 169,577
Minority Interest 1,328 15,079
Total consolidated Shareholders’ equity 126,199 184,656
28.18. Financial payables - non-current portion
(in Euro thousands)
2015 Changes in the year
2016
Bank payables beyond 12 months 346,001 (39,442) 306,559
Total 346,001 (39,442) 306,559
Financial payables – non-current portion amount to Euro 306,559 thousand, a decrease of Euro 39,442 thousand compared to December 31, 2015, principally following the

Maire Tecnimont Group
138
reclassification to short-term of a portion of the Euro 350 million loan of the subsidiary Tecnimont S.p.A. subject to the financial reorganization concluded on December 28, 2015.
The residual debt - non-current portion of Euro 9,946 thousand refers to the loan received by Tecnimont during the year from Credito Valtellinese.
The loan of Euro 350 million includes covenants in line with normal business practice for such operations; specifically, the loan’s financial covenants concern the ratio between the net financial position and net equity, as well as between the net financial position and EBITDA. Maire Tecnimont is currently not aware of any default situations regarding the above-mentioned covenants.
At December 31, 2016, no overdue debt positions are highlighted.
28.19. Provisions for charges - beyond 12 months
(in Eur o thousands)
2015 Changes in the
year 2016
Provisions for charges - beyond 12 months 48,695 21,829 70,524
Total 48,695 21,829 70,524
The provision for charges amounts to Euro 70,524 thousand, an increase of Euro 21,829 thousand compared to December 31, 2015.
The account mainly includes provisions for charges relating to remuneration and incentive policies, other charges related to legal cases and disputes in course, in addition to personnel disputes and contractual risks on projects closed.
This account also includes the measurement at equity of companies with a negative net equity for which the company has the intention - although not immediate given the absence of regulatory obligations - to contribute to the coverage of the negative net equity of the investee.
The main increases relate to the losses reported by companies measured at equity, probable charges related to disputes on completed projects and provisions for remuneration policies.
The decrease in the provisions is related to the utilizations in the year, mainly concerning remuneration policies concluded and for the utilization of charges related to tax risks following the settlement agreement signed in December 2016 with the Tax Agency which nullified all the disputes relating to the PVC2011 and PVC 2013 assessments concerning the tax audits on the subsidiary Tecnimont S.p.A.
The composition and changes in the year are shown below:

139
(in Euro thousands)
2015 Provisions Util. Reclass./Chane in
consolidation scope 2016
Prov ision for personal charges 20,928 24,808 (16,419) 0 29,317
Other provisions 19,677 24,808 (15,868) 0 28,617
Disputes provis ion 1,251 0 (551) 0 700
Provision for fiscal risks 11,097 1,500 (8,003) 0 4,594
Provision for other charges: 16,670 19,943 0 0 36,613
Legal disputes 3,907 0 0 0 3,907
Coverage for losses in associates 10,203 10,550 0 0 20,753
Risks on orders 1,106 9,393 0 0 10,499
Other 1,454 0 0 0 1,454
Total 48,695 46,251 (24,422) 0 70,524
28.20. Post employ. & other employee benefits
(in Euro thousands)
2015 Changes in
the year 2016
Post-employment & other employee benefits 12,204 (515) 11,689
Total 12,204 (515) 11,689
The Group has a liability to all employees of the Italian companies regarding the statutory TFR (Post-employment benefit) provision, while the employees of some foreign companies of the Tecnimont Group are recognized defined contribution plans.
In accordance with IAS 19 (Employee benefits), the Group estimated the liability for defined benefit plans at December 31, 2016; the changes in the year are shown below:
(in Euro thousands) POST-EMPLOYMENT
BENEFIT PROVISION
LOYALTY BONUS
OTHER PLANS
Total
Balance at December 31, 2015 11,617 22 565 12,204
Changes in the year (356) (22) (137) (515)
Balance at December 31, 2016 11,261 0 428 11,689
The main decreases in the Post-employment benefit provision and the Loyalty Bonus relate to the departure of employees.
The Cost relating to current employment services is recognized in the Income Statement under “Personnel expenses”. Financial charges on obligations assumed are recognized in the Income Statement under financial expenses - other charges. Actuarial gains and losses and

Maire Tecnimont Group
140
recognized in a specific valuation reserve under Equity. In particular, the assumptions adopted in the valuation of the Post-employment benefit provision relate to:
• First assumption: it was decided to adopt a rate of 1.2% for the year 2017 and a rate of 1.5% for subsequent years, as the average inflation taken from the “2016 Economic and Finance Document” and the subsequent Update.
• Salary increases: the salary line takes into account both the merit and contractual components, and inflation adjustments and is utilized in order to estimate the future Post-employment benefits which employees may mature from the valuation date until their departure from the company for those companies that do not transfer the provision to the INPS treasury fund; in particular an average annual merit increase of 4% including inflation was utilized.
• Discount rate: determined with reference to bond market rates of primary companies at the valuation date, and therefore utilizing the “Composite” interest rate of the curve of corporate issuers with “Investment Grade” AA ratings in the Eurozone (source: Bloomberg) at December 31, 2016.
• Workforce reference: for the internal workforce subject to analysis of the Maire Tecnimont Group, the average age and length of service were considered (Post-employment benefit base) and an estimate of staff turnover.
Sensitivity analysis was also undertaken based on the changes in the following parameters: a) discount rate, b) inflation rate, c) salary increase, d) probability of departure and advances on Post-employment benefit provision; on the basis of these analyses, the range of values of the liabilities for defined benefit plans was established which did not highlight any significant impacts.
In relation to the liabilities at December 31, 2016, a change of +0.5% in the discount rate applied to the calculation would produce a positive effect equal to Euro 0.4 million and in the same manner a change of -0.5% would produce a negative effect of Euro 0.4 million. A change of +0.5% in the inflation rate applied to the calculation would produce a negative effect of Euro 0.2 million and in the same manner a change of -0.5% would produce a positive effect of Euro 0.2 million. A change of +0.5% in the salaries applied to the calculation would produce a negative effect of Euro 0.1 million and in the same manner a change of -0.5% would produce a positive effect of Euro 0.1 million. A change of +0.5% in the probability of the termination of employment applied to the calculation would produce a positive effect of Euro 0.1 million and in the same manner a change of -0.5% would produce a negative effect of Euro 0.1 million.
28.21. Other non-current liabilities
(in Eur o thousands)
2015 Changes in the year
2016
Trade payables beyond 12 months 28,196 19,422 47,618
Tax payables beyond 12 months 109 (22) 87
Accrued liabilities 89 1,066 1,156
Total 28,394 20,467 48,861
Other non-current other liabilities at December 31, 2016 amount to Euro 48,861 thousand and mainly refer to the withholdings made by the Group to suppliers/sub-contractors in accordance with contractual guarantees for the correct completion of works.

141
The increase concerns the advancement of orders and the contractual terms with suppliers, against which withholding taxes were greater than December 31, 2015, also due to increased production volumes in 2016.
Tax payables beyond 12 months are in line with the previous year.
28.22. Financial instruments - Derivatives - Non-current
(in Euro thousands)
2015 Changes in the
year 2016
Financial instruments - Currenc y hedging derivatives 3,789 256 4,045
Total 3,789 256 4,045
Derivative financial instruments at December 31, 2016 amount to Euro 4,045 thousand, with an increase of Euro 256 thousand compared to December 31, 2015 and concern the fair value measurement of the derivative contracts in force. The account relates to the measurement of the derivative instruments to hedge against currency risks on the cash flows related to project revenues and costs. The mark-to-market is negative as exchange rates between the subscription date of the derivative instruments and the reporting date saw a revaluation principally of the Dollar against the Euro; the negative mark-to-market will be offset by future operating cash flows of a similar amount. This component increased on the previous year due to swap point movements (differences between Eurozone and US interest rates), in addition to new contracts signed by the Group to cover cash flows for new and major projects. For further information and analysis of the Fair Value Hierarchy, reference should be made to the “FINANCIAL RISKS” section.
28.23. Other non-current financial liabilities
(in Euro thousands)
2015 Changes in
the year 2016
Payables to other lenders 73,113 2,004 75,117
Total 73,113 2,004 75,117
Other non-current financial liabilities include the financial component of the equity linked bond, net of accessory charges. The equity component of the instrument was classified to “other reserves” of shareholders’ equity.
In this regard, we report the following:
On February 20, 2014, the Parent Company Maire Tecnimont S.p.A. completed an equity-linked bond operation amounting to Euro 80 million, placed with qualified Italian and foreign investors.

Maire Tecnimont Group
142
The initial conversion price of the Bond was fixed at 2.1898; the Bonds were issued at a unitary nominal value of Euro 100,000, with 5 year duration and a fixed annual coupon of 5.75%, payable half-yearly in arrears. Where the Bonds were not previously converted, surrendered, acquired or cancelled, they would be reimbursed at the par value on February 20, 2019.
Subsequently, on May 3, 2016 following the Ordinary Shareholders’ Meeting of April 27, 2016 concerning the distribution of a dividend per share of Euro 0.047, Maire Tecnimont communicated to have sent to the Bondholders a Notice on the same date through Euroclear and Clearstream Luxembourg. The Notice stated that the Calculation Agent determined, following the payment of the dividend, the change in the conversion price of the Bonds from Euro 2.1898 to Euro 2.1509, in accordance with conditions 6 (b) (iii) and 6 (f), at the effective date of May 2, 2016 (first trading date of the ordinary shares ex dividend on the Milan Stock Exchange).
From March 7, 2018, Maire Tecnimont would have the right to settle each conversion through payment in cash for an amount up to the nominal value of the Bonds and deliver a number of shares calculated in accordance with the method outlined in the Regulation (the “Net Share Settlement Election”). In addition, at the maturity date of the Bonds, the Company would have had the right to deliver a combination of shares and cash, instead of converting the Bonds exclusively for cash, in accordance with the procedures outlined in the Regulation.
On July 9, 2014, the Board of Directors of the Company approved the Revised Budget for the year 2014 and updated the 2013-2019 Group Industrial Plan, as well as all the forecasts contained therein with particular reference to the exercise relating to the settlement of the convertible bond.
Also based on these forecasts and after a detailed review by the Board of Directors of the figures approved, the Board (exercising their prerogative and the rights assigned to them under the recently issued bond regulation and after their initial evaluations at the board meeting of May 14, 2014 reviewing the quarterly results) confirmed their decision not to proceed, taking into account these assumptions and renouncing, where possible, exercise of the residual net share settlement election in accordance with the terms of the loan and instead opted, for the time being and in accordance with that outlined above, for the settlement only in shares in relation to the bond loan.
In accordance with IAS 32 “Financial Instruments: Presentation in the financial statements” convertible bonds are recorded as hybrid financial instruments, formed by two components which are treated separately only if significant: a liability and a conversion option. The liability corresponds to the present value of the future cash flows based on the current interest rate at the issue date for an equivalent non-convertible bond. The value of the option is defined as the difference between the net amount received and the amount of the liability and is recorded under equity. The value of the conversion option in shares does not change in subsequent periods. On the contrary, where the characteristics of the bond result in, on the exercise of the conversion right, the right of the company to deliver shares, pay the amount in cash or offer a combination of shares and cash, the option is recognized as a financial liability for the incorporated host, measured at fair value through P&L, while the difference compared to the original nominal value or rather the financial liability (host) is recorded at amortized cost.
As illustrated above, in consideration of irrevocable waiver of the Net Share Settlement Election by the Company, the option is (de facto) “cancelled” in substance. Therefore, in theory, where there is a proposal to pay cash in accordance with the option, the bondholders may expect satisfaction through the delivery of shares. This waiver, resulting in the maintenance of a fixed ratio of conversion in shares over the duration of the bond, identifies a hybrid financial instrument whose accounting method is illustrated above.

143
28.24. Short-term financial payables
(in Euro thousands)
2015 Changes in the
year 2016
Bank payables 49,509 51,431 100,940
Payables to other lenders 23,413 15,298 38,711
Accrued liabilities 2,684 870 3,554
Total 75,606 67,599 143,205
Short-term financial payables amount to Euro 143,205 thousand, an increase of Euro 67,599 thousand compared to December 31, 2015 following the reclassification from medium/long term of a portion of the Euro 350 million loan of the subsidiary Tecnimont S.p.A., subject to the financial reorganization concluded on December 28, 2015.
At December 31, 2016, short-term bank payables mainly refer to:
- for Euro 48,262 thousand the current capital portion of the new Euro 350 million loan granted to the subsidiary Tecnimont S.p.A. by Banca IMI following the financial reorganization concluded on December 28, 2015;
- for Euro 43,000 thousand the revolving line granted to the subsidiary Tecnimont S.p.A. by Banca IMI, also related to the financial reorganization concluded on December 28, 2015;
- for Euro 2,924 thousand to the residual current capital portion of the loan granted to Maire Tecnimont S.p.A. by Intesa San Paolo relating to a loan not subject to the financial reorganization in 2015 and which will be repaid in accordance with the original maturity plan.
- for Euro 6,754 thousand current account overdrafts for the utilization of credit lines granted and commercial advances relating to projects in progress.
Other current lenders amount to Euro 38,711 thousand and mainly relate to the factoring operations within the management of the working capital of some projects, as well as the transfer of VAT receivables and other financial payables.
Interest due on loans and bank overdrafts matured and not yet paid amount to Euro 3,554 thousand.
The Net Financial Position at December 31, 2016 was a debt position of Euro 42.8 million, decreasing by Euro 82.7 million compared to December 31, 2015 (debt of Euro 125.6 million).
The improvement is mainly due to the increase in liquidity held, thanks to the operating cash flow generated in the year, offset in part by the significant decrease of Euro 16.2 million in the mark-to-market of the derivative instruments to hedge the currency risk on the cash flows of revenues and costs on projects, and the increase in the short-term financial debt for the management of working capital on some projects.
The composition of the net financial position is reported in the paragraph “Group balance sheet and financial position” in the Directors’ Report, to which reference should be made for further information on the changes compared to the previous period.
The following table reports the Group’s net financial debt at December 31, 2016 and December 31, 2015, in line with Consob communication No. DEM/6064293/2006 of July 28, 2006:

Maire Tecnimont Group
144
The following table presents the reconciliation between the net financial debt and the net financial position of the Group at December 31, 2016 and December 31, 2015:
The estimate of the “fair value” of these financial instruments, calculated as indicated in the accounting policies section, at December 31, 2016 substantially approximated their book value. The breakdown by maturity of the gross financial debt is reported in the financial risks section.
At December 31, 2016, no overdue debt positions are highlighted.
28.25. Provisions for charges - within 12 months
(in Euro thousands)
2015 Changes in the
year 2016
Provis ions for charges - within 12 months 0 3,906 3,906
Total 0 3,906 3,906
NET FINANCIAL DEBT MAIRE TECNIMONT GROUP
In Euro thousands 31/12/2016 31/12/2015
A. Cash (233) (331)
B. Bank and postal deposits (496,905) (362,054)
C. Securities - (3,405)
D. Liquidity (A+B+C) (497,138) (365,790)
E. Current financial receivables (28,689) (5,859)
F. Current bank payables 94,943 69,799
G. Current portion of non-current debt 48,262 5,807
H. Other current financial payables 54,870 10,940
I. Current financial debt (F+G+H) 198,075 86,546
J. Net current financial debt (I-E-D) (327,751) (285,103)
K. Non-current bank payables 306,559 346,001
L. Bonds issued 75,117 73,113
M. Other non-current payables 4,045 3,789
N. Non-current financial debt (K+L+M) 385,722 422,903
O. Net financial debt (J+N) 57,969 137,800
RECONCILIATION NFD & NFP
In Euro thousands 31/12/2016 31/12/2015
O. Net financial debt 57,969 137,800
Net financial debt of discontinued operations - -
Other non-current financial assets (6,065) (10,598)
Financial instruments - Non-current derivatives (9,059) (1,610)
42,846 125,592 Net Financial Debt

145
The provision for charges within 12 months amounts to Euro 3,906 thousand and concerns the estimated costs for remuneration and incentive policies.
28.26. Tax payables
(in Euro thousands)
2015 Changes in
the year 2016
Tax payables 33,331 17,206 50,536
Total 33,331 17,206 50,536
Tax payables were Euro 50,536 thousand, increasing Euro 17,206 thousand on December 31, 2015.
The account principally includes payables for overseas company taxes, including VAT, for Euro 36,100 thousand, mainly concerning the overseas companies Tecnimont Private Limited, Stamicarbon B.V. and Tecnimont Russia.
Other tax payables concern the Group consolidated IRES corporation tax and IRES corporation tax and IRAP of companies not involved in the tax consolidation, VAT payables principally concerning deferrable VAT which will be paid following settlement by public sector clients.
The residual amount includes IRPEF personnel withholding tax payables and withholding taxes on account for third party compensation and other tax payables.
At December 31, 2016, there were no overdue tax and social security positions.
Tax payables are shown in the table below:
(in Euro thousands)
2015 2016
Current income taxes payable - Ires/Irap 2,451 6,928
Current income taxes payable - Imp. Estero 20,856 24,211
VAT payables 2,769 10,692
Substitute taxes 5,889 6,157
Other payables 1,366 2,548
Total 33,331 50,536
28.27. Financial instruments - Derivatives
(in Euro thousands)
2015 Changes in
the year 2016
Financial instruments - Currenc y hedging derivatives 10,610 43,931 54,540
Total 10,610 43,931 54,540

Maire Tecnimont Group
146
Derivative financial instruments at December 31, 2016 amount to Euro 54,540 thousand, an increase of Euro 43,931 thousand compared to December 31, 2015 and concern the fair value measurement of the derivative contracts in force. The account relates to the measurement of the derivative instruments to hedge against currency risks on the cash flows related to project revenues and costs. The mark-to-market is negative as the exchange rate between the subscription date of the derivative instruments and the reporting date saw a revaluation principally of the Dollar against the Euro; the negative mark-to-market will be offset by the future operating cash flows of a similar amount. This component increased on the previous year due to swap point movements (differences between Eurozone and US interest rates), in addition to new contracts signed by the Group to cover cash flows for new and major projects. For further information and analysis of the Fair Value Hierarchy, reference should be made to the “FINANCIAL RISKS” section.
28.28. Other current financial liabilities
(in Eur o thousands)
2015 Changes in the year 2016
Other current financial liabilities 330 0 330
Total 330 0 330
Other current financial liabilities of Euro 330 thousand do not relate to bank debt but rather loans received from consortium companies. Current financial liabilities specifically relates to the consortium company Cavtomi.
28.29. Client advance payments
(in Eur o thousa nds)
2015 Changes in the year
2016
Client advance payments 259,373 39,860 299,233
Total 259,373 39,860 299,233
Client advance payments at December 31, 2016 were Euro 299,233 thousand, increasing Euro 39,860 thousand on December 31, 2015. They concern contractual advances from clients on the signing of construction contracts. The increase principally refers to advances on the Socar Polymer LLC, ORPIC Plastic LLC, Lotos and EuroChem projects, partially offset by the reabsorption, through invoicing on account, of advances received in previous years.

147
28.30. Construction contracts liabilities
(in Euro thousands)
2015 Changes in the
year 2016
Payments received on certificates 9,395,728 1,580,583 10,976,311
(Works-in-progress) (9,050,759) (1,370,524) (10,421,283)
Total 344,969 210,059 555,028
Contract work-in-progress classified as liabilities (construction contract liabilities) reflects the net negative amount, by individual order, between the advancement of works and the relative invoicing on account and the contractual risks provision.
The increase in the net value of construction contract liabilities, amounting to Euro 210,059 thousand, relates to the advancement of the projects and their contractual terms, against which the value of works carried out in the year was lower than the invoicing on account despite a substantial increase in production volumes in the year.
The main construction contract liabilities concern the NH3 Kingisepp, EPCM Moscow Refinery, PP Malesia and Orpic projects.
The value of construction contracts includes additional requests on orders in an advanced state of negotiation, for the portion expected to be accepted by the client.
28.31. Trade payables
(in Euro thousands)
2015 Changes in the
year 2016
Suppliers - beyond 12 months 697,925 433,351 1,131,274
Subsidiaries - w ith in 12 months 1,328 (1,329) 0
Associates - within 12 months 1,405 (877) 528
Parent companies - within 12 months 169 23 190
Group companies - within 12 months 25,952 (7,787) 18,165
Total 726,779 423,380 1,150,157
Trade payables at December 31, 2016 amount to Euro 1,150,157 thousand, an increase of Euro 423,380 thousand compared to December 31, 2015.
This increase relates to the development of new projects entering into a phase of intense production and the increase in production volumes. In fact, materials and services acquired rose significantly as for the main orders acquired last year procurement has been completed and the delivery of materials is ongoing.
Trade payables to subsidiaries relate to the non-consolidated companies Ravizza S.c.a.r.l., Parco Grande S.c.a.r.l. and Program International Consulting Engineers S.r.l..
Trade payables to associates were Euro 528 thousand and principally concern Studio Geotecnico Italiano for Euro 389 thousand, MCM Servizi Roma for Euro 95 thousand and TSJ Limited for Euro 14 thousand.

Maire Tecnimont Group
148
Payables to parent companies amount to Euro 190 thousand and concern GLV S.p.A for leasing of office spaces and use of brands and
Payables to associates of Euro 18,165 thousand principally concern the Cavet Consortium for Euro 764 thousand, Lotto 5A S.c.a.r.l. in liquidation for Euro 11,948 thousand, Metro B1 Consortium for Euro 12,109 thousand, Metrofiera Scarl in liquidation for Euro 639 thousand and Rimati for Euro 510 thousand.
Payables to group companies of Euro 18,165 thousand principally concern payables to consortiums and infrastructure initiatives relating to Lotto 5A S.c.a.r.l. in liquidation for Euro 5,537 thousand, Metro B1 Consortium for Euro 11,311 thousand, Metrofiera Scarl in liquidation for Euro 639 thousand and Cavtmi consortium for Euro 590 thousand.
During 2016 payment requests were received in relation to the normal operating activities and at December 31, 2016 there were no trade payable positions overdue on normal operations.
28.32. Other current liabilities
(in Eur o thousands)
2015 Changes in the year 2016
Matured by personnel, not yet settled 19,432 6,643 26,075
Payables due to social security institutions 10,571 3,351 13,923
Expropriation payables 6,750 (1,314) 5,436
Tax payables (overseas states) 3,952 5,808 9,760
Accrued expenses and deferred income 693 2,305 2,998
Other payables (other creditors) 14,686 (6,921) 7,765
Total 56,084 9,872 65,956
Other current liabilities at December 31, 2016 amount to Euro 65,956 thousand, increasing Euro 9,872 thousand on December 31, 2015.
The increase essentially concerns amounts matured and not yet paid to personnel and related social security payables due to the significant increase in the workforce during the year.
The remaining other current liabilities principally concern expropriation payables and other various payables.
“Expropriation payables” concern the payable for expropriations accumulated to date related to the “Fiumetorto-Cefalù” project managed by the company Cefalù 20 S.c.a r.l.; this payable is subject to reimbursement from the client.
“Other payables” principally concern the VAT payables of overseas branches.
At December 31, 2016, there were no overdue tax and social security positions.

149
29. Commitments and contingent liabilities
The Maire Tecnimont Group’s financial guarantees at December 31, 2016 and December 31, 2015 were as follows:
MAIRE TECNIMONT GROUP FINANCIAL GUARANTEES 31/12/2016 31/12/2015
(in Euro thousands)
GUARANTEES ISSUED IN THE INTEREST OF THE GROUP
Sureties issued by third parties in favor of third parties, of which:
Issued in favor of clients for orders under execution
Performance bonds (banks and insurance) 1,120,473 1,116,312
Advance Bonds (banks and insurance) 508,846 656,167
Others 247,754 216,595
TOTAL GAURANTEES 1,877,073 1,989,073
“Guarantees issued in the interest of the Group” of Euro 1,877,073 thousand concern guarantees issued by Banks or Insurance companies in the interest of Group operating companies in relation to commitments undertaken upon core operations. In particular: • “Performance Bonds”: contract “successful execution” guarantee. With this guarantee, the
bank undertakes the obligation to repay the client, up to a set amount, in the case of non-compliant execution of the contract by the contractor. In the case of large orders, SACE insurance cover may be requested for these risks in favor of the Bank.
• “Advance Bonds”: repayment guarantee, requested for payment of contractual advances. With this guarantee the bank undertakes the obligation to repay the client a set amount, as reimbursement for amounts advanced, in the case of contractual non-compliance by the party requesting the guarantee (the contractor). In the case of large orders, SACE insurance cover may be requested for these risks in favor of the Bank.
Commitments
The Parent Company assumed commitments to clients and/or other beneficiaries to fulfil obligations, contractually undertaken by the company and/or subsidiaries awarded tenders as part of their core operations and therefore in the execution of orders, in the case of non-fulfilment of such and for the reimbursement for any damage from such non-fulfilment.
These commitments, which involve the undertaking of an obligation to complete, guarantee contracts whose total value amounts to Euro 13,370 million (Euro 12,404 million at December 31, 2015), including works already executed and the residual backlog at December 31, 2016.
The Parent Company also undertook other residual commitments (letters of Patronage) in favor of banks in the interest of some subsidiaries, principally Tecnimont S.p.A..

Maire Tecnimont Group
150
30. Related party transactions
All related party transactions have been conducted at market conditions. The company’s receivables/payables (including financial) and cost/revenue transactions with related parties for the period are presented in the tables below. The tables also show the balances resulting from transactions in the preceding year and those in progress:
31/12/2016 (in Eur o thousa nds)
Trade Receivables
Trade Payables
Financial Receivables
Financial payables Costs Revenues
G.L.V. Capital S.p.A 0 (190) 0 0 (426) 0
Elfa Investimenti S.r.l 0 (74) 0 0 (257) 0
Total 0 (264) 0 0 (683) 0
In particular, payable contracts refer to the lease of office buildings from Group companies, the use of the “Maire” trademark and other minor recharges from the parent G.L.V. Capital S.p.A. and from transactions with Elfa Investimenti S.r.l., a company owned by the majority shareholder of Maire Tecnimont S.p.A., for the lease of office buildings and the lease of premises within the research center concerning the collaboration with La Sapienza University.
Transactions with other non-consolidated and/or associated Group companies are purely commercial and relate to specific activities linked to contracts; in addition, certain consortiums, having substantially concluded operations, are in liquidation:
31/12/2016 (in Eur o thousa nds)
Trade Receivables
Trade Payables
Financial Receivables
Financial payables Costs Revenues
MCM Servizi Roma S.c.a.r.l. 0 (95) 70 0 (35) 0
Studio Geotecnico Italiano 0 (428) 0 0 (1,696) 0
Villaggio Olimpico MOI S.c.a.r.l. in liquidation 0 (4) 69 0 0 0
Ravizza S.c.a.r.l in liquidation 2 (0) 0 0 0 0
Parco Grande S.c.a.r.l. in liquidation 34 0 0 0 0 0
Program International Consulting Engineers S.r.l in liquidation 461 0 0 0 0 20
Desimont Contracting 1,666 0 0 (371) 0 557
Biolevano S.r.l 6,650 0 0 0 0 3,543
Processi Innovativi S.r.l 63 (123) 0 0 (208) 85
BIO P S.r.l 0 0 0 0 (25) 0
Tecnimont Bolivia S.r.l. 0 0 0 (129) 0 0
Total 8,877 (650) 139 (499) (1,965) 4,205
The remuneration of Directors and Statutory Auditors and Key Management Personnel, as required by IAS 24, appears in the 2016 Corporate Governance and Ownership Structure Report and the 2016 Remuneration Report, both available on the company website at www.mairetecnimont.it in the “Governance” section.

151
31. Independent Audit Firm fees
The following table, prepared pursuant to Article 149 of the Consob Issuer’s Regulation, reports the payments made in 2016 for audit services and other services carried out by the Audit Firm.
Services
Prov ider Company 2016 Fees
(in Euro thousands)
Audit
Pricewaterhousecoopers S.p.A. Parent Company - Maire
Tecnimont
199
Pricewaterhousecoopers S.p.A. Maire Tecnimont Group
804
Rete Pricewaterhousecoopers Maire Tecnimont Group
221
Certification services (*) Pricewaterhousecoopers S.p.A.
Parent Company - Maire Tecnimont
4
Pricewaterhousecoopers S.p.A. Maire Tecnimont Group
21
Other services ** Pricewaterhousecoopers network Maire Tecnimont Group
431 The fees do not include VAT, expenses and any Consob oversight contribution repayments
* Certification serv ices include the signing of tax declarations.
** The Other serv ices include tax compliance, administration services, HR consultancy undertaken until March 31, 2016.

Maire Tecnimont Group
152
32. Financial risk management
The Group’s ordinary operations are exposed to financial risks. Specifically:
• credit risk, both in relation to normal commercial transactions with clients and financial activities;
• liquidity risk, concerning difficulties in liquidating positions held within necessary timeframes or in sourcing operating funding;
• market risk, relating to fluctuations in interest rates, exchange rates and the prices of goods, as the Group operates at an international level in various currencies and utilizes financial instruments which generate interest;
• default and debt covenant risk regarding the possibility that loan contracts include clauses permitting the lending Banks to request immediate repayment on the occurrence of certain events, resulting therefore in a liquidity risk.
The Maire Tecnimont Group constantly controls Group financial risks, anticipating potential negative impacts and undertaking appropriate corrective actions.
The following section provides qualitative and quantitative information on the impact of these risks on the Maire Tecnimont Group. The following quantitative data may not be used for forecasting purposes, in particular the sensitivity analysis on market risks may not reflect the complexity and the related market reactions from any change in assumptions.
32.1. Credit risk
The Maire Tecnimont Group credit risk represents the exposure to potential losses deriving from the non-compliance with obligations by counterparties. Credit risk stems from normal operations and is monitored by the operating and financial departments on the basis of set procedures, which establish the methods for quantifying and controlling client risk.
They are managed according to procedures, including credit recovery and dispute management.
Presently, there is no significant concentration of credit risk by region or by Client, as the Group operates on geographically diversified markets and through a range of business lines.
The maximum theoretical exposure to the credit risk for the Group at December 31, 2016 is the carrying value of the financial assets recorded in the accounts, and the nominal value of the guarantees given on debts and commitments to third parties.
Receivables at December 31, 2016 were recognized net of write-downs calculated according to counterparty non-compliance risk, based on client reliability (third parties, related parties and public sector clients).
At December 31, 2016, Trade receivables from third parties due within and beyond 12 months, respectively totaled Euro 484,213 thousand (Euro 358,474 thousand at December 31, 2015) and Euro 50,238 thousand (Euro 73,204 thousand at December 31, 2015), net of the doubtful debt provision of Euro 6,129 thousand (Euro 10,065 thousand at December 31, 2015). The estimate of the amounts considered non-recoverable are determined based on the expected future cash flows. These cash flows consider the expected recovery time, the forecast realizable value, any guarantees and the costs to be incurred for the recovery of the receivables.

153
Trade receivables from third parties by maturity and business unit are summarized below:
(in Euro thousands)
Overdue at 31/12/2016
Not
overdue
From 0 to 90 days
From 91 to 365 days
From 365 to 731 days
Over 731 days
Total
Technology, Engineering & Construction 244,531 39,625 43,975 45,591 106,771 480,493
Infrastructure & C iv il Engineering 26,051 8,106 2,023 7,570 4,628 48,378
Other 1,219 762 2,432 48 1,118 5,580
Total trade receivables – third parties 271,802 48,493 48,431 53,209 112,517 534,452
Of which:
Within 12 months
484,213
Beyond 12 months 50,238
(in Euro thousands) Overdue at 31/12/2015
Not overdue
From 0 to 90 days
From 91 to 365 days
From 365 to 731 days
Over 731 days
Total
Technology, Engineering & Construction 171,315 60,971 24,753 28,948 70,759 356,747
Infrastructure & Civil Engineering 41,278 11,471 11,697 6,321 4,127 74,894
Other 21 16 0 0 0 37
Total trade receivables – third parties
212,614 72,458 36,450 35,269 74,886 431,678
Of which:
Within 12 months
358,474
Beyond 12 months 73,204
Trade receivables are recorded net of the doubtful debt provision of Euro 6,129 thousand at December 31, 2016 (Euro 10,065 thousand at December 31, 2015).
(in Euro thousands)
2015 Provisions Utilizations Change in
consolidation scope
Other changes
2016
Doubtful debt provis ion 10,065 738 (4,705) 0 30 6,129
Total 10,065 738 (4,705) 0 30 6,129
The decrease in the year relates to utilizations following the realization of losses on receivables previously provisioned.

Maire Tecnimont Group
154
Overdue trade receivables principally refer to the Infrastructure and Civil Engineering Business Unit and relate to Italian Public Sector entities whereby solvency and collectability are not of concern.
Trade receivables overdue by 366 days and over 731 days for the Technology, Engineering & Construction BU concern a reduced number of positions and are constantly monitored; in both cases, client solvency and collection is not at issue (Italian and overseas state entities).
The principal positions are with the Indian clients Indian Oil Corporation Limited (IOCL) and National Fertilizer Limited (NFL), with disputes arising in both cases for recognition of the previously advanced requests to the client for the issue of improperly withheld payments for the works carried out, in addition to recognition of additional compensation due to the extra costs incurred and chargeable to the client.
32.2. Liquidity risk
This risk concerns the difficulty in sourcing new funding or access to liquid assets, resulting in the enterprise’s failure to satisfy payment commitments, being forced to incur additional funding costs or, in extreme instances, being faced with potential insolvency which may put its going concern at risk.
At the present moment, Maire Tecnimont considers that the good levels of liquidity held and prudent and functional management of the credit lines available are important elements for stability and sufficient to guarantee the resources necessary for operating continuity.
Cash and cash equivalents at December 31, 2016 amounted to Euro 497,138 thousand, increasing Euro 134,753 thousand on December 31, 2015; cash flows generated by operating activities were Euro 162,107 thousand and benefitted from, in addition to the result for the year, positive working capital changes.
The breakdown of the financial debt is as follows:
31/12/2016 Due within 1
year
Due between 2 & 5 years
Due beyond 5
years Total
(in Euro thousands)
Bank payables 104,494 306,559 0 411,053
Payables to other lenders 38,711 0 0 38,711
Other current financ ial liabilities 330 0 0 330
Other non-current financia l liabilities 0 75,117 0 75,117
Derivative instruments 54,540 4,045 0 58,585
Total financial liabilities (current and non-current) 198,075 385,721 0 583,796

155
31/12/2015 Due within 1
year
Due between 2 & 5 years
Due beyond 5
years Total
(in Euro thousands)
Bank payables 52,193 346,001 0 398,194
Payables to other lenders 23,413 0 0 23,413
Other current financia l liabilities 330 0 0 330
Other non-current financial liabilities 0 73,113 0 73,113
Derivative instruments 10,610 3,789 0 14,399
Total financial liabilities (current and non-current) 86,546 422,903 0 509,449
Bank payables of approx. Euro 350 million relate to the loan received on December 28, 2015 by the subsidiary Tecnimont, which include covenants in line with business practice for such operations, calculated on the Consolidated Financial Statements of the Maire Tecnimont Group. Other non-current financial liabilities of Euro 75,117 include the financial component of the equity linked bond, net of accessory charges. The equity component of the instrument was classified to “other reserves” of shareholders’ equity. At the date of the present financial report and based on the value of the underlying share and the strike price of the instrument, the potential conversion was “in the money”. The account Derivative Instruments relates to the measurement of the derivative instruments to hedge against currency risks on the cash flows related to project revenues and costs. The mark-to-market is negative as the exchange rate between the subscription date of the derivative instruments and the reporting date saw a revaluation principally of the Dollar against the Euro; the negative mark-to-market will be offset by the future operating cash flows for a similar amount.
32.3. Market risks
Currency risk
The Group is exposed to risks deriving from exchange rate fluctuations, which may impact on the result and on the net equity value. In particular, where the companies of the Group incur costs in currencies other than those of the respective revenues, the variance in the exchange rate may impact on the operating result of these companies.
The principal exchange rates the Group is exposed to are:
• Euro/USD, in relation to US Dollar sales on markets where the Dollar is the basis currency for trading and production/purchases of the Maire Tecnimont Group’s sector;
• EUR/RUB, in relation to trading and production/purchases on certain Maire Tecnimont Group sector orders in Rubles.
Other lesser exposures concern the EUR/GBP, EUR/JPY, EUR/MYR and EUR/PLN exchange rates.

Maire Tecnimont Group
156
In order to reduce currency risk, the Maire Tecnimont Group companies have adopted the following strategies:
• on signing the individual contracts, the part of receipts to cover payments in differing currencies, calculated during the entire duration of the order, are hedged through currency derivatives (cash flow hedging).
• contracts, where possible, are agreed in the payment currency in order to reduce hedging costs.
The assets and liabilities of companies consolidated in currencies other than the Euro may be translated into Euro at varying exchange rates. In accordance with the accounting principles adopted, the effects of these changes are recorded directly in equity, in the account Translation reserve.
Raw material price change risk
The Group is exposed to risks deriving from raw material price fluctuations, which may impact on the result and on the net equity value. In particular, where Group companies incur semi-finished or finished product procurement costs (e.g. machinery, piping, cables), for which the raw material content is a significant portion of the overall project margin, price changes in this commodity may impact the operating results of these companies.
Maire Tecnimont share price change risk
The company utilizes derivative instruments to hedge against movements in the Maire Tecnimont share price, in view of the implementation of a buy-back program . Maire Tecnimont S.p.A therefore subscribed to two cash-settled Total Return Equity Swap (TRES) derivative instruments, undertaken to hedge against movements in the Maire Tecnimont share price. The TRES derivative instruments are not considered as hedge instruments for hedge accounting purposes and therefore are measured in accordance with IAS 39 as a fair value derivative through P&L.
Sensitivity analys is
The potential fair value loss (see table below) on shareholders’ equity, currency risk derivatives (current swap/forwards) and raw material price derivatives (commodity swaps) held by the Group at December 31, 2016 following a hypothetical unfavorable and immediate change of 10% in the exchange rates of the main foreign currencies against the Euro would be approx. Euro (62,500) thousand, net of the tax effect.

157
Receivables, payables and future cash flows are not considered where hedging operations have been undertaken. It is considered reasonable that currency movements may produce an opposing impact, of an equal amount, on the hedged underlying transactions.
32.4. Interest rate risk
The Maire Tecnimont Group is exposed to interest rate risk in relation to debt service costs.
Net Debt
Total Hedged portion Non-hedged
portion (in Euro thousands)
Short-term debt 143,535 0 143,535
Medium/long-term debt 306,559 0 306,559
Total debt 450,094 0 450,094
Total Cash and Cash Equivalents (497,138) 0 (497,138)
The risk on the variable rate debt is presently essentially mitigated by the fact that Group cash deposits are remunerated at interest rates indexed to the same debt parameter (Euribor).
32.5. Default and debt covenant risk
This concerns the possibility that loan contracts include clauses permitting the lending Banks to request immediate repayment on the occurrence of certain events, resulting therefore in a liquidity risk.
Financial instrument(in Euro thousands)
Book value at
31/12/2016
Income statement
impact
Shareholders’
equity impact
Income statement
impact
Shareholders’
equity impact
Net Financial Assets/Liabilities
Currency Option (*) (7,570) - 10,010 - (18,331)
Currency Forward (*) (23,850) (380) 55,633 466 (67,877)
Commodity 2,060 1,359 - (1,359) -
Impact on financial assets/liabilities
before tax effect 979 65,642 (892) (86,207)
Tax rate 27.50% 27.50% 27.50% 27.50%
Impact on financial assets/liabilities, net
of tax effect 710 47,591 (647) (62,500)
Total increase (decrease) 710 47,591 (647) (62,500)
(*) “Level 2" of Fair-Value
+10% -10%

Maire Tecnimont Group
158
The loan issued on December 28, 2015 for Euro 350 million to the subsidiary Tecnimont is subject to covenants based on market practice, calculated on the Consolidated Financial Statements of the Maire Tecnimont Group. Specifically, the financial covenants of the loan concern the ratio between the net financial position and net equity, as well as between the net financial position and EBITDA.
Maire Tecnimont is currently not aware of any default situations regarding the above-mentioned covenants.
FORWARD OPERATION AND DERIVATIVES INSTRUMENTS
In presenting hedges, the IAS 39 requirements are verified for application of hedge accounting. In particular:
• hedges under IAS 39: these are broken down between cash flow hedges and fair value hedges. For cash flow hedges, which are currently the only category present, the matured result, where realized, is included in EBITDA with regards to currency hedges, while the fair value change is recognized to shareholders’ equity for the effective portion and to the income statement for the ineffective portion.
• not considered hedges under IAS 39: the result and the fair value change are recognized to the financial statements under EBITDA in financial income and expenses.
Derivative instruments at December 31, 2016
The tables below outline the following:
• the outstanding amounts of derivatives in place at the reporting date, analyzed by maturity;
• the fair value portion at the previous point recognized to the income statement.
Finally, any difference between the balance sheet value and the fair value recognized to the income statement represents the fair value of cash flow hedges, which in accordance with the applicable standard are directly recognized to the shareholders’ equity reserve.
Currency derivatives
The Group utilizes currency derivatives to offset any future order receipt and/or payment cash flow fluctuations from unfavorable currency movements.
At December 31, 2016, derivative financial instruments concerned forward operations and, particularly, currency hedges related to Maire Tecnimont Group foreign currency orders.
(In Euro thousands)
Book value at
31/12/2016
Book value Projected cash flows Less than 1 Year From 2 to 5 years Over 5 years
Currency Option (*) (7,570) 119,059 119,059
Currency Forward (*) (23,850) 1,258,002 1,075,375 182,627
Commodity (*) 2,060 13,518 12,213 1,305
(*) “Level 2" of Fair-Value
31/12/2016

159
Currency derivatives are undertaken with leading Italian and overseas banks in order to hedge operations and also for accounting purposes. These instruments qualify as hedging instruments. The changes in the fair value of the derivative instruments designated, and which are efficient, to hedge future cash flows relating to the Group contractual commitments are directly recorded under Shareholders’ Equity, while the non-efficient portion are immediately recorded in the Income Statement.
The amounts recorded directly under Shareholders’ Equity are included in the Income Statement in the same period that the cash flow hedged is included.
IFRS 7 requires that the classification of financial instruments valued at fair value is determined based on the quality of the input sources used in the valuation of the fair value. The IFRS 7 classification implies the following hierarchy:
• Level 1: fair value calculation according to active market prices. Group instruments do not fall within this category;
• Level 2: fair value measurement according to market prices or similar assets or through measurement techniques for which all significant factors are directly or indirectly based on observable market data. Group instruments fall within this category.
• Level 3: fair value measurement according to valuation models whose input is not based on observable market data (“unobservable inputs”). Currently, no instruments whose value is based on models with inputs not directly based on observable market data are in place.
For all derivative instruments used by the Group, the fair value is calculated according to measurement techniques based on observable market parameters (“Level 2”); during 2016, no transfers were made between Level 1 and Level 2 and vice versa.

Maire Tecnimont Group
160
32.6. Classification of the financial instruments
As required by IFRS 7, we report the type of financial instruments present in the financial statements, with indication of the accounting policies applied. The book value of financial assets and liabilities substantially coincides with their fair value.
31/12/2016
Loans and Receivables
Assets at Fair
Value through P&L held-for-trading
(*)
Hedging derivatives
(*)
Assets held-to-
maturity
Financial
assets available-
for-sale
Tota l (in Euro thousands)
Other non-current financia l assets
1,969 - - 13,068 15,037
Other non-current assets 69,632 - - - - 69,632
Trade rece ivables 526,402 - - - - 526,402
Financ ial instruments - Current and non-current derivatives
- 3,210 27,164 - - 30,374
Other current financ ial assets 7,373 - - - - 7,373
Other current assets 99,185 - - - - 99,185
Cash and cash equivalents 497,138 - - - - 497,138
Total Financial Assets 1,201,701 3,210 27,164 0 13,068 1,245,143
(*) “Level 2” of the Fair-Value
31/12/2015
Loans and
Receivables
Assets at fair
value through P&L held-for-trading
Hedging
derivatives (*)
Assets
held-to-maturity
Financial assets
available-for-sale
Total (in Euro thousands)
Other non-current financia l assets
6,116 - - 4,482 10,598
Other non-current assets 90,996 - - - - 90,996
Trade rece ivables 393,094 - - - - 393,094
Financ ial instruments - Current and non-current derivatives
- - 2,464 - - 2,464
Other current financ ial assets
8,410 - - - - 8,410
Other current assets 68,954 - - - - 68,954
Cash and cash equivalents 362,385 - - - - 362,385
Total Financial Assets 929,954 0 2,464 0 4,482 936,900
(*) “Level 2” of the Fair-Value
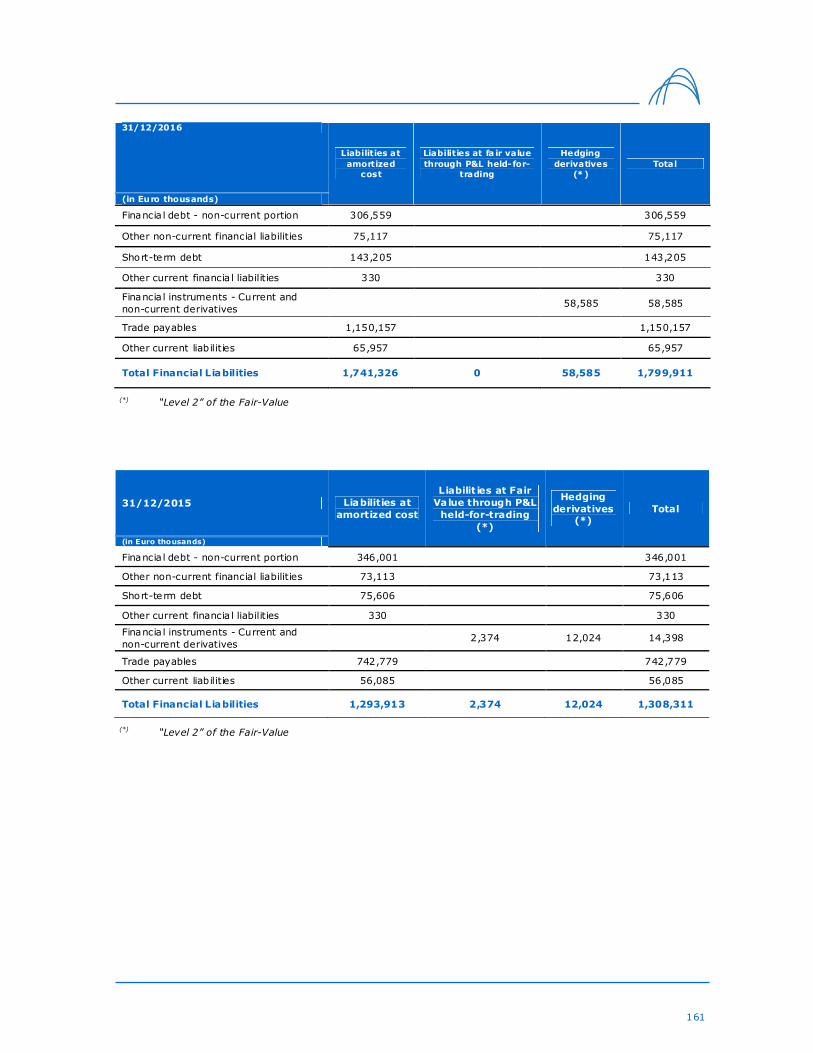
161
31/12/2016
Liabilities at
amortized cost
Liabilities at fa ir value
through P&L held-for-trading
Hedging
derivatives (*)
Total
(in Euro thousands)
Financia l debt - non-current portion 306,559 306,559
Other non-current financial liabilities 75,117 75,117
Short-term debt 143,205 143,205
Other current financia l liabilities 330 330
Financia l instruments - Current and non-current derivatives
58,585 58,585
Trade payables 1,150,157 1,150,157
Other current liabilities 65,957 65,957
Total Financial Liabilities 1,741,326 0 58,585 1,799,911
(*) “Level 2” of the Fair-Value
31/12/2015 Liabilities at amortized cost
Liabilit ies at Fair Value through P&L
held-for-trading (*)
Hedging derivatives
(*) Total
(in Euro thousands)
Financia l debt - non-current portion 346,001 346,001
Other non-current financial liabilities 73,113 73,113
Short-term debt 75,606 75,606
Other current financia l liabilities 330 330
Financia l instruments - Current and non-current derivatives
2,374 12,024 14,398
Trade payables 742,779 742,779
Other current liabilities 56,085 56,085
Total Financial Liabilities 1,293,913 2,374 12,024 1,308,311
(*) “Level 2” of the Fair-Value
Maire Tecnimont Group
162
33. Positions or transactions arising from atypical and/or unusual operations
In accordance with Consob Communication of July 28, 2006 No. DEM/6064293, the Group did not undertake any atypical and/or unusual operations, as defined in the communication.
34. Significant non-recurring events and operations
In 2016, the Group did not execute any significant non-recurring operations in accordance with Consob Communication No. DEM/6064293 of July 28, 2006, other than those outlined in the “Key Events” section of the Directors’ Report.
35. Subsequent events to December 31, 2016
For significant events following year-end, reference should be made to the accompanying Directors’ Report.

163
36. Statement on the consolidated financial statements as per Article 154-bis, paragraph 5 of Legislative Decree No. 58/98 and subsequent amendments and supplements
1. The undersigned Pierroberto Folgiero, as “Chief Executive Officer” and Dario Michelangeli as “Executive for Financial Reporting” of MAIRE TECNIMONT S.p.A. declare, and also in consideration of Article 154-bis, paragraphs 3 and 4, of Legislative Decree No. 58 of February 24, 1998:
• the adequacy in relation to the characteristics of the company and
• the effective application of the administrative and accounting procedures for the compilation of the consolidated financial statements for 2016.
2. In addition, we declare that the consolidated financial statements:
• are drawn up in conformity with the applicable international accounting standards recognized by the European Union in accordance with Regulation (CE) No. 1606/2002 of the European Parliament and the Commission of July 19, 2002;
• correspond to the underlying accounting documents and records;
• are drawn up as per Article 154-ter of the above-stated Legislative Decree No. 58/98 and subsequent amendments and supplements and provide a true and fair view of the balance sheet, income statement and financial position of the issuer and the companies included in the consolidation.
3. The Directors’ Report includes a reliable analysis on the performance and operating result as well as the situation of the issuer and of the companies included in the consolidation, together with a description of the principal risks and uncertainties to which they are exposed.
This statement is provided also in accordance with Article 154-bis, paragraph 2 of Legislative Decree No. 58 of February 24, 1998.
Milan, March 15, 2017
The Chief Executive Officer The Executive for Financial Reporting
Pierroberto Folgiero Dario Michelangeli

Maire Tecnimont Group
164
Financial Statements and
Explanatory Notes
at December 31, 2016

165
37. Financial Statements
37.1. Income Statement
(in Euro) Note 2016 2015
Revenues 41.1 63,469,875 80,474,175
Other operating revenues 41.2 3,093,872 2,122,986
Total revenues 66,563,747 82,597,161
Raw materials and consumables 41.3 (31,034) (36,518)
Service costs 41.4 (19,116,872) (21,175,470)
Personnel expenses 41.5 (27,470,363) (17,590,200)
Other operating expenses 41.6 (2,045,323) (1,969,725)
Total Costs (48,663,592) (40,771,913)
EBITDA 17,900,155 41,825,248
Amortization, deprec iation and write-downs 41.7 (19,556) (189,513)
EBIT 17,880,599 41,635,734
Financial income 41.8 2,740,844 2,477,828
Financial expenses 41.9 (16,927,458) (20,446,916)
Investment income/(expense) 41.10 0 (12,140,000)
Income before tax 3,693,984 11,526,647
Income taxes 41.11 5,837,506 6,995,721
Net income 9,531,490 18,522,368
Basic earnings per share 41.12 0.031 0.061
Diluted earnings per share 41.12 0.028 0.054
The transactions with related parties , pursuant to Consob Resolution No. 15519 of July 27, 2016, are illus trated in the separate disc losure “Re lated Party Transactions”.

Maire Tecnimont S.p.A.
166
37.2. Comprehensive Income Statement
(in Euro) Note 2016 2015
Net income for the year 9,531,490 18,522,368
Other comprehensive income/(expense) which may not be subsequently reclass ified to income/(loss) for the period:
Actuarial ga ins/(losses) 42.12 (35,679) 27.891
Relative tax effect 42.12 9.812 (7.670)
Total other comprehensive income/(expense) which may not be subsequently reclass ified to income/(loss) for the period:
(25.867) 20.221
Total comprehensive income 9,505,623 18,542,589
Basic comprehensive earnings per share 0.031 0.061
Diluted comprehensive earnings per share 0.028 0.054
The transactions with related parties , pursuant to Consob Resolution No. 15519 of July 27, 2016, are illustrated in the separate disclosure “Related Party Transactions”.

167
37.3. Balance Sheet
(in Euro) Note 2016 2015
Assets
Non-current assets
Property, plant and equipment 42.1 94,494 90,650
Other intangible assets 42.2 3,269,690 3,142,966
Investments in subsidiaries 42.3 750,279,683 736,271,203
Other non-current assets 42.4 1,100,000 1,100,000
Other non-current financ ial assets 42.5 45,361,074 34,054,474
Deferred tax assets 42.6 3,211,953 3,512,033
Total non-current assets 803,316,894 778,171,326
Current assets
Trade receivables 42.7 58,301,932 33,737,754
Current tax assets 42.8 21,788,574 27,197,865
Financial instruments - Derivatives 42.9 1,149,636 0
Other current assets 42.10 3,465,176 17,677,911
Cash and cash equivalents 42.11 297,534 302,746
Total current assets 85,002,852 78,916,276
Total Assets 888,319,746 857,087,602
The transactions with related parties , pursuant to Consob Resolution No. 15519 of July 27, 2016, are illus trated in the separate disc losure “Re lated Party Transactions”.

Maire Tecnimont S.p.A.
168
(in Euro) Note 2016 2015
Shareholders ’ Equity & Liabilities
Shareholders’ Equity
Share capita l 42.12 19,689,550 19,689,550
Share premium reserve 42.12 224,698,265 224,698,265
Other reserves 42.12 163,518,622 159,452,304
Va luation reserve 42.12 (44,982) (19,115)
Total shareholders` equity and reserves 42.12 407,861,455 403,821,004
Retained earnings(accumulated losses) 42.12 (1,708,879) (5,871,454)
Net income for the year 42.12 9,531,489 18,522,367
Total Shareholders’ Equity 415,684,065 416,471,917
Non-current liabilities
Financ ial debt - non-current portion 42.13 0 2,928,571
Provisions for risks and charges - beyond 12 months 42.14 11,411,169 5,830,850
Deferred tax liabilities 42.6 420,959 364,468
Post-employment & other employee benefits 42.15 431,996 430,141
Other non-current financ ia l liabilities 42.16 419,763,129 395,091,555
Total non-current liabilities 432,027,253 404,645,585
Current liabilities
Short-term debt 42.17 4,701,800 7,485,215
Tax payables 42.18 3,953,838 594,423
Trade payables 42.19 27,399,686 19,776,878
Other current liabilities 42.20 4,553,104 8,113,584
Total current liabilities 40,608,428 35,970,100
Total Shareholders’ Equity and Liabilities 888,319,746 857,087,602
The transactions with related parties , pursuant to Consob Resolution No. 15519 of July 27, 2016, are illustrated in the separate disclosure “Related Party Transactions”.

169
38. Statement of changes in Shareholders’ Equity
( i n Euro ) Share Capital
Share Premium Reserve
Legal Reserve
Other reserves
Valuation reserve
Retained earnings accum. Losses
Income (loss) for year
Shareholders' Equity
December 31, 2014 19,689,550 224,698,265 5,328,333 154, 123,971 (39,336) (3,787,440) (2,084,013) 397,929,330
Allocation of the result (2,084,013) 2,084,013 0
Comprehensive Income(loss) for the year 20,221 18,522,367 18,542,588
December 31, 2015 19,689,550 224,698,265 5,328,333 154, 123,971 (19,115) (5,871,454) 18,522,367 416,471,917
December 31, 2015 19,689,550 224,698,265 5,328,333 154, 123,971 (19,115) (5,871,454) 18,522,367 416,471,917
IFRS 2 (Employee share plan) 4,066,319 4,066,319
Distribution of dividends (14,359,793) (14,359,793)
Allocation of the result 4,162,574 (4,162,574) 0
Comprehensive Income(loss) for the year (25,867) 9,531,489 9,505,622
December 31, 2016 19,689,550 224,698,265 5,328,333 158, 190,290 (44,982) (1,708,879) 9,531,489 415,684,065

Maire Tecnimont S.p.A.
170
39. Cash Flow Statement (indirect method)
(in Euro) 2016 2015
Cash and cash equivalents at beginning of year (A) 302,746 1,090,808
Operations
Net Income 9,531,489 18,522,367
Adjustments for:
Amortization of intangible assets 13,774 183,780
Depreciation of non-current tangible assets 5,782 5,733
Financia l (Income)/Charges 14,186,615 17,969,088
Income taxes (5,837,506) (6,995,721)
Write-downs on investments 0 14,000,00
(Increase) / Decrease in trade receivables (24,564,178) (2,300,652)
Increase /(Decrease) in other liabilities (3,560,479) (22,567,803)
(Increase) / Decrease in other assets 14,212,735 (3,733,140)
Increase/(Decrease) in trade payables 7,622,808 (56,933,321)
Increase / (Decrease) in provisions (inc l. post-employ. benefits)
6,294,625 (1,617,666)
Income taxes paid 14,962,783 16,223,599
Cash flow from operations (B) 32,868,448 (27,243,734)
Investvests
(Investment)/Disposal of non-current tangible assets (9,226) (13,465)
(Investment)/Disposal of intangible assets (140,898) 0
(Increase)/Decrease in other investments (10,680,480) (43,920,00)
Cash flow from investments (C) (10,830,604) (43,933,465)
Financing
Change in financial payables (17,894,344) (85,056,033)
Change in other financial assets/liabilities 10,211,082 155,445,170
Dividends (14,359,793) 0
Cash flow from financing (D) (22,043,055) 70,389,137
Increase/(Decrease) in cash and cash equivalents (B+C+D)
(5,211) (788,062)
Cash and cash equivalents at end of year (A+B+C+D) 297,535 302,746
The transactions with related parties , pursuant to Consob Resolution No. 15519 of July 27, 2016, are illustrated in the separate disclosure “Related Party Transactions”.

171
40. Explanatory Notes at December 31,2016
BASIS OF PREPARATION
INTRODUCTION
Maire Tecnimont S.p.A. is a company incorporated in Italy at the Rome Companies Registration Office. According to the provisions of the first paragraph of Article 4 of Legislative Decree 38/2005, the statutory financial statements of Maire Tecnimont S.p.A. (separate financial statements), as listed on an Italian regulated market, have been prepared according to International Financial Reporting Standards (hereafter “IFRS” or international accounting standards) issued by the International Accounting Standards Board (IASB) and adopted by the European Commission according to the procedure at Article 6 of Regulation (EC) No. 1606/2002 of the European Parliament and Council of July 19, 2002. The financial statements are prepared under the historical cost convention (modified where applicable for the valuation of certain financial instruments), as well as on the going concern assumption.
The financial statements are presented in Euro which is the Company’s functional currency.
FINANCIAL STATEMENTS
The financial statements and disclosure reported in these statutory financial statements were prepared as per IAS 1 REVISED, CONSOB communication No. 1559 and CONSOB communication No. 6064293, issued on July 28, 2006.
The Balance Sheet accounts are classified between current and non-current, while the Income Statement and Comprehensive Income Statement are classified by nature of expenses.
The Cash Flow Statement is presented in accordance with the indirect method, adjusting the income for the period with non-cash items.
The Statement of change in Shareholders’ Equity reports comprehensive income (charges) for the period and the changes in Shareholders’ Equity.
GOING CONCERN
The Group and the Company consider the going concern principle appropriate for the preparation of the consolidated financial statements at December 31, 2016.
ACCOUNTING STANDARDS, AMENDMENTS AND IFRS INTERPRETATIONS APPLICABLE
FROM JANUARY 2016
The following accounting standards, amendments and interpretations were applied for the first time by the Company from January 1, 2016:
• Amendments to IAS 19 “Defined Benefit Plans: Employee Contributions” (published on November 21, 2013): requires the recognition in the financial statements of contributions made by employees or third parties to defined benefit plans.
• Amendment to IFRS 11 - Joint Arrangements – “Accounting for acquisitions of interests in joint operations” (published on May 6, 2014): requires the recognition of the acquisition of interests in a joint operation, in which the activity of the joint operation constitutes a business.
• Amendments to IAS 16 Property, Plant and Equipment and IAS 41 Agriculture – “Bearer Plants” (published on June 30, 2014): bearer plants, therefore plants creating annual harvests (for example vines and hazelnuts plants) must be recognized according to IAS 16 (rather than IAS 41).

Maire Tecnimont S.p.A.
172
• Amendments to IAS 16 Property, Plant and Equipment and IAS 38 Intangibles Assets – “Clarification of acceptable methods of depreciation and amortization” (published on May 12, 2014): amortization or depreciation based on revenue recognition is generally not appropriate, as according to the amendment revenues generated by an asset which includes the use of an asset subject to amortization or depreciation generally reflects factors other than the sole consumption of economic benefits from the asset itself, which is however a requirement for amortization or depreciation.
• Amendment to IAS 1 - “Disclosure Initiative” (published on December 18, 2014): the amendment seeks to provide clarification on disclosure elements which may be considered impediments to a clear preparation of the financial statements.
• Amendments to IFRS 10, IFRS 12 and IAS 28 “Investment Entities: Applying the Consolidation Exception” (published on December 18, 2014), containing amendments to the issues emerging following the application of the consolidation exception granted to investment entities.
Finally, within the annual improvement process, on December 12, 2013, the IASB published the “Annual Improvements to IFRS: 2010-2012 Cycle” document (among which IFRS 2 Share-Based Payments – Definition of vesting condition, IFRS 3 Business Combination – Accounting for contingent consideration, IFRS 8 Operating segments – Aggregation of operating segments and Reconciliation of total of the reportable segments’ assets to the entity’s assets, IFRS 13 Fair Value Measurement – Short-term receivables and payables) and on September 25, 2014 “Annual Improvements to IFRS: 2012-2014 Cycle” (among which: IFRS 5 – Non-current Assets Held for Sale and Discontinued Operations, IFRS 7 – Financial Instruments: Disclosure and IAS 19 – Employee Benefits) which partially supplements the pre-existing standards. The amendments will be applicable from January 1, 2016. The adoptions of these amendments do not have any effects on the consolidated financial statements.
IFRS AND IFRIC STANDARDS, AMENDMENTS AND INTERPRETATIONS APPROVED BY THE
EUROPEAN UNION, NOT YET MANDATORY AND NOT ADOPTED IN ADVANCE BY THE
COMPANY AT DECEMBER 31, 2016
• Standard IFRS 15 – Revenue from Contracts with Customers (published on May 28, 2014 and supplemented with further clarifications on April 12, 2016) which replaces IAS 18 - Revenue and IAS 11 - Construction Contracts, in addition to the interpretations IFRIC 13 - Customer Loyalty Programs, IFRIC 15 - Agreements for the Construction of Real Estate, IFRIC 18- Transfers of Assets from Customers and SIC 31 - Revenues-Barter Transactions Involving Advertising Services. The standard establishes a new revenue recognition model, which will apply to all contracts with clients, with the exception of those falling under the application of other IAS/IFRS such as leasing, insurance contracts and financial instruments. The essential issues for the recognition of revenues according to the new model are: the identification of the contract with the client; the identification of the performance obligations of the contract; the establishment of the price; the allocation of the price to the performance obligations of the contract; the recognition criteria of the revenues when the entity satisfies each of the performance obligations. The standard will be effective from January 1, 2018, although advance application is permitted. The directors consider that the application of IFRS 15 may have impacts on the amounts recognized as revenues and on the relative disclosure in the separate financial statements. During 2017 a project will commence which will identify the potential issues in the various operating sectors, and with potential impact on the financial statements and the need for any amendments to the internal control system relating to financial reporting. However, it is not possible to provide a

173
reasonable estimate of the effects until the Company has completed a detailed analysis.
• Final version of IFRS 9 - Financial instruments (published on July 24, 2014). The document incorporates the results of the Classification and measurement, Impairment and Hedge accounting phases of the IASB project to replace IAS 39:
o the standard introduces new criteria for the classification and measurement of financial assets and liabilities;
o The impairment requirements are based on an expected credit loss (ECL) model that replaces the IAS 39 incurred loss model, utilizing supporting information, available without unreasonable charges or effort, which includes historic, current and projected figures;
o introduces a new hedge accounting model (increase in the types of transactions eligible for hedge accounting, changes in the accounting method of forward contracts and options when included in a hedge accounting relationship, change in the effectiveness test).
The new standard, which replaces the previous version of IFRS 9, must be applied for financial statements beginning on or after January 2018.
The directors consider that the application of IFRS 9 may have a significant impact on the amounts and the relative disclosure in the company financial statements. During 2017 a project will commence which will identify the potential issues in the various operating sectors, and with potential impact on the financial statements and the need for any amendments to the internal control system relating to financial reporting. However, it is not possible to provide a reasonable estimate of the effects until the Company has completed a detailed analysis.
IFRS STANDARDS, AMENDMENTS AND INTERPRETATIONS NOT YET APPROVED BY THE
EUROPEAN UNION
At the date of the present Annual Report, the relevant bodies of the European Union have not yet concluded the process necessary for the implementation of the amendments and standards described below.
• On January 13, 2016, the IASB published the new standard IFRS 16 - Leases, which replaces IAS 17 – Leases, as well as the interpretations IFRIC 4 Determining whether an Arrangement contains a Lease, SIC-15 Operating Leases—Incentives and SIC-27 Evaluating the Substance of Transactions Involving the Legal Form of a Lease. The new standard provides a new definition of leases and introduces a criterion based on control (right of use) of an asset to distinguish leasing contracts from service contracts, identifying essential differences: the identification of the asset, the right of replacement of the asset, the right to obtain substantially all the economic benefits from the use of the asset and the right to use the asset underlying the contract. The standard establishes a single model to recognize and measure leasing contracts for the leasee (lessees) which provides also for the recognition of operating leases under assets with a related financial payable, providing the possibility not to be recognize as leasing contracts “low-value assets” and leasing contracts less than 12 months. This Standard does not contain significant amendments for lessors. The standard is effective from January 1, 2019, although advance application is permitted, only for companies which have applied in advance IFRS 15 - Revenue from Contracts with Customers. It is not possible to provide a reasonable estimate of the effects until the Company has completed a detailed analysis of the relative contracts.

Maire Tecnimont S.p.A.
174
• On January 19, 2016, the IASB published the “Recognition of Deferred Tax Assets for Unrealized Losses (Amendments to IAS 12)” document, which contains amendments to IAS 12. The document provides clarifications on the recognition of deferred tax assets on unrealized losses on the occurrence of certain circumstances and on estimates of assessable income for future years. The amendments are effective from January 1, 2017, although advance application is permitted. The Directors are currently assessing the possible effects from the introduction of these amendments on the separate financial statements of the company.
• On January 29, 2016, the IASB published the “Disclosure Initiative (Amendments to IAS 7)” document, which contains amendments to IAS 7. The document provides clarifications to improve disclosure on financial liabilities. In particular, the amendments require the provision of disclosure which enables readers of the financial statements to understand the changes to liabilities following funding operations. The amendments are effective from January 1, 2017, although advance application is permitted. The presentation of comparative disclosure relating to preceding periods is not required. The Directors are currently assessing the possible effects from the introduction of these amendments on the separate financial statements of the company.
• On June 20, 2016, the IASB published the “Classification and measurement of share-based payment transactions (Amendments to IFRS 2)” document, which contains clarifications upon the recognition of the effects of vesting conditions in the presence of cash-settled share-based payments, on the classification of share-based payments with characteristics of net settlement and the recognition of the amendments to the terms and conditions of a share-based payment which changes the classification from cash-settled to equity-settled. The amendments are effective from January 1, 2018, although advance application is permitted. The Directors are currently assessing the possible effects from the introduction of these amendments on the separate financial statements of the company.
• “Applying IFRS 9 Financial Instruments with IFRS 4 Insurance Contracts” (published on September 12, 2016). For entities primarily involved in insurance activities, the amendments clarify the considerations deriving from application of the new IFRS 9 to financial assets, before the replacement by the IASB of the current IFRS 4 with the new standard currently under discussion, under which however financial liabilities are measured.
• “Annual Improvements to IFRSs: 2014-2016 Cycle”, published on December 8, 2016 (including IFRS 1 First-Time Adoption of International Financial Reporting Standards - Deletion of short-term exemptions for first-time adopters, IAS 28 Investments in Associates and Joint Ventures – Measuring investees at fair value through profit or loss: an investment-by-investment choice or a consistent policy choice, IFRS 12 Disclosure of Interests in Other Entities – Clarification of the scope of the Standard) which partially integrates the pre-existing standards. The Directors are currently assessing the possible effects from the introduction of these amendments on the separate financial statements of the company.
• Interpretation IFRIC 22 “Foreign Currency Transactions and Advance Consideration” (published on December 8, 2016). The interpretation provides guidelines for transactions in foreign currencies where advances or non-monetary payments on account are recorded in the financial statements, before the recognition of the relative asset, cost or revenue. This document provides indications on how an entity should determine the date of a transaction, and consequently, the exchange rate to be utilized concerning operations in foreign currencies concerning payments made or received in advance. IFRIC 22 is applicable from January 1, 2018, but advanced application is permitted. The Directors are currently assessing the possible effects

175
from the introduction of these amendments on the separate financial statements of the company.
• Amendment to IAS 40 “Transfers of Investment Property” (published on December 8, 2016). These amendments clarify the transfers of a building to, or from, investment property. In particular, an entity shall reclassify a building to, or from, investment property only when there is a clear indication of a change in the use of the building. This change must be attributable to a specific event and shall not therefore be limited to only a change in intention by management of the entity. The amendments are applicable from January 1, 2018, although advance application is permitted. The Directors are currently assessing the possible effects from the introduction of these amendments on the separate financial statements of the company.
• On September 11, 2014, the IASB published an amendment to IFRS 10 and IAS 28 Sales or Contribution of Assets between an Investor and its Associate or Joint Venture. The document was published in order to resolve the current conflict between IAS 28 and IFRS 10 relating to the measurement of the gain or loss from the sale or conferment of a non-monetary asset to a joint venture or associate in exchange for a share of the capital of this latter. Currently, the IASB has suspended the application of this amendment.
40.1. Accounting policies
The main accounting policies adopted in the preparation of the financial statements are illustrated below:
BUSINESS COMBINATIONS
Business combinations are recorded in accordance with the purchase method. The cost of the business combination is measured as the aggregate of the fair values, at the date of exchange, of assets acquired, liabilities incurred or assumed, and equity instruments issued by the Company, in exchange for control of the company acquired, plus any costs directly attributable to the business combination.
The identifiable assets, liabilities and contingent liabilities of the company acquired that comply with the conditions for recognition under IFRS 3 are recognized at their fair value at the acquisition date, with the exception of non-current assets (or disposal groups) which are classified as held-for-sale in accordance with IFRS 5 and are recognized and measured at fair value, net of sales costs.
Goodwill deriving from acquisition is recognized under assets and initially measured at cost, represented by the excess of the acquisition cost compared to the Group share in the present value of the identifiable assets, liabilities and contingent liabilities recognized. Where, after the measurement of these values, the Group share in the present value of the identifiable assets, liabilities and contingent liabilities exceeds the acquisition cost, the excess is immediately recorded in the Income Statement.
INVESTMENTS
Investments in subsidiaries, in jointly held subsidiaries and in associates, differing from those held-for-sale, are measured at purchase cost including direct accessory costs. Where there is an indication of a reduction in the value of an asset, its recovery is verified comparing the carrying value with the relative recoverable value, represented by the higher between the fair value, net of selling costs, and the value in use. In the absence of a binding sales agreement, the fair value is estimated on the basis of the values in an active market, from recent transactions or on the basis of the best information available to reflect the amount which the

Maire Tecnimont S.p.A.
176
entity could obtain from the sale of the asset. The value in use is generally established, within the limits of the corresponding portion of net equity of the investee from the consolidated financial statements, by discounting the projected cash flows of the asset and, if significant and reasonably calculable, from its disposal, less disposal costs. The cash flow is determined on the basis of reasonable and documented assumptions represented by the best estimates of the expected economic conditions, giving greater significance to the indications obtained from outside sources. Discounting is carried out at a rate which takes account of the implied risk within the company’s operating sector. The risk deriving from any losses exceeding the net equity is recorded in a specific account up to the amount the parent company is committed to comply with legal or implicit obligations in relation to the investee or in any case to cover the losses.
If the reasons for the recognition of the impairment loss no longer exist, the previously recognized impairment loss shall be reversed. The amount of the reversal shall be recognized in the income statement under investment income/expense. Other investments are measured at fair value with recognition of the effects to the income statement if held-for-trading, or to the “Other reserves” net equity account; in this latter case, the reserve is recognized to the income statement on write-down or realization. Where the fair value may not be reliably calculated, the investments are valued at cost, adjusted for impairments; impairments may be not written back.
Investments held-for-sale are measured at the lower of their book value and fair value, less selling costs.
NON-CURRENT ASSETS CLASSIFIED AS HELD-FOR-SALE
Non-current assets (and disposal groups) are classified as held-for-sale when their carrying value is expected to be recovered by means of a sales transaction rather than through use in company operations. This condition is met only when the sale is highly likely, the assets (or group of assets) are available for immediate sale in their current condition and, consequently, management is committed to a sale, which should take place within 12 months of the classification as held-for-sale.
Non-current assets (and disposal groups) classified as held-for-sale are measured at the lower of their previous carrying value and market value less selling costs.
REVENUE RECOGNITION
Revenues are recorded at the fair value of the amount received less returns, discounts and allowances as follows:
• revenue from sales: on the effective transfer of the risks and rewards typically connected with ownership;
• revenue from services: on the provision of the service.
The Company classifies exchange differences deriving from commercial operations under operating results, and in particular in the accounts other operating revenues and other operating costs depending on whether the net effect is a gain or loss, with detailed information provided in the Explanatory Notes.
Dividends received
Dividends are recognized where the shareholder right to receipt arises, normally the year in which the Shareholders’ Meeting of the investee is held approving the distribution of profits or reserves.

177
PROPERTY, PLANT AND EQUIPMENT
Plant and machinery utilized for the production or the provision of goods and services are recorded in the financial statements at historic cost, including any accessory and direct costs necessary for the asset to be available for use.
Plant, machinery & equipment are recognized at cost, net of accumulated depreciation and any write-down for loss in value.
Depreciation is calculated on a straight-line basis on the cost of the assets, according to their estimated useful life, which is reviewed annually at following rates:
Asset Category Rate
Land 0%
Buildings from 3% to 10%
Plant and Machinery from 7.5% to 15%
Industrial & commercial equipment 15%
Furniture 12%
EDP 20%
Motor vehicles 25%
Gains and losses deriving from the disposal or sale of assets are determined as the difference between the sales revenue and the net book value of the asset and are recorded in the Income Statement in the year.
Ordinary maintenance costs are fully charged to the income statement.
Improvements on the original value of the assets are capitalized and depreciated based on their residual utilization.
Leasehold improvements which may be recorded as an asset are recognized under property, plant and equipment and depreciated at the lower between the residual duration of the contract and the residual useful life of the asset.
Leased assets
Leasing contracts which do not provide for the transfer of all of the risks and benefits of ownership to the Company are considered operating leases.
Operating lease costs are recorded on a straight-line basis over the duration of the lease agreement.
Grants
Capital grants are recognized when there is reasonable certainty that they will be received and that the conditions will be satisfied for their attainment.
Capital grants are recorded as a direct reduction of the asset to which they refer. The value of an asset is adjusted by straight-line depreciation, calculated on the basis of the residual useful life of the asset.

Maire Tecnimont S.p.A.
178
INTANGIBLE ASSETS
Intangible assets acquired separately are recorded at cost less amortization and any net loss in value. Amortization is calculated on a straight-line basis over the useful life of the asset. The amortization method and the residual useful life are reviewed at the end of each accounting period. The effects deriving from the change in the amortization method and the residual useful life are recorded prospectively.
Intangible assets generated internally – research and development costs
Research costs are expensed to the income statement in the period in which they are incurred.
Intangible assets generated internally deriving from the development phase of a Company internal project are only recognized under assets when the following conditions are met:
• There is the technical feasibility to complete the intangible asset for its use or sale;
• There is the intention to complete the intangible asset and utilize or sell the asset;
• There is the capacity to utilize or sell the intangible asset;
• It is probable that the asset will generate future economic benefits;
• There exists the technical, financial and other resources in order to complete the development and utilize or sell the asset during the development phase.
The initial amount recognized of the intangible assets generated internally corresponds to the sum of the expenses incurred at the date in which the asset meets the criteria described above. Where these expenses may not be recorded as intangible assets generated internally, the development expenses are expensed in the Income Statement in the period in which they are incurred.
Subsequent to initial recognition, the intangible assets generated internally are recorded at cost less any accumulated loss in value, as occurs for intangible assets acquired separately.
Intangible assets acquired through a Business Combination
Intangible assets acquired in a business combination are identified and the amortization is recorded where they satisfy the definition of intangible assets and their fair value may be determined reliably. The cost of these intangible assets is their fair value at the acquisition date. Subsequent to initial recognition, the intangible assets acquired in a business combination are recorded at cost less amortization and any accumulated loss in value, as occurs for intangible assets acquired separately.
IMPAIRMENT OF TANGIBLE, INTANGIBLE AND FINANCIAL ASSETS
At each reporting date, the Company reviews the carrying value of its intangible, tangible and financial assets to determine if there are indications that these assets have incurred a loss in value. Where it is not possible to make an estimate of the recoverable amount of an asset individually, the Company makes an estimate of the recoverable amount of the cash-generating unit the asset belongs to. When it is established that a potential loss exists, an estimate of the recoverable amount is made in order to identify the amount of the loss.
The indefinite intangible assets, such as goodwill and brands, are verified annually and whenever there is an indication of a possible loss in value, in order to determine if there has been a loss in value.
The recoverable value is the higher between fair value less costs to sell and value in use. In determining the value in use, the estimated future cash flows are discounted on a pre-tax basis which reflects the market assessment of the time value of money and the risks specific

179
to the asset. In the determination of this value various cash flow scenarios are utilized (sensitivity analysis).
If the recoverable value of an asset (or a CGU) is considered lower than its carrying value, it is reduced to its recoverable value. A loss in value is recognized in the income statement immediately.
Where, subsequently, the loss in value no longer exists or reduces, the book value of the asset is increased up to the new estimate of the recoverable value and may not exceed the value which would be determined where no loss in value had been recorded. The reversal of a loss in value is immediately recorded in the income statement.
FINANCIAL INSTRUMENTS
Financial assets and liabilities are recorded in the financial statements when the Company has the contractual obligations of the instrument.
FINANCIAL ASSETS
Receivables
Receivables are initially recognized at fair value and subsequently measured at amortized cost, utilizing the effective interest rate method, net of the relative losses in value with reference to amounts considered non-recoverable, recorded in a specific doubtful debt provision. The estimate of the amounts considered non-recoverable are determined based on the expected future cash flows. These cash flows consider the expected recovery time, the forecast realizable value, any guarantees and the costs to be incurred for the recovery of the receivables. The original amount is restated whenever the reasons for the adjustment no longer apply. In this case, any reversal of previous provisions are recorded in the income statement and may not exceed the amortized cost of the receivable in the absence of the previous adjustments.
Trade receivables which mature within the normal commercial terms are not discounted. Receivables in currencies other than the operational currency of the individual companies are recorded at the period-end exchange rates.
Other financial assets
Financial assets, where there exists the intention and capacity of the Company to maintain them until maturity in accordance with IAS 39, are recognized at cost, recorded at the trading date, represented by the fair value of the initial amount given in exchange, increased by any transaction costs (for example: commissions, consultancy etc.) directly attributable to the acquisition of the asset. After initial recognition, these assets are measured at amortized cost using the original effective interest method.
Financial assets held for speculative purposes in the short-term are recognized and measured at fair value, with changes recorded in the income statement; any other financial assets other than those above are classified as financial instruments available for sale, recognized and measured at fair value with changes recorded through equity. These amounts are subsequently recorded in the income statement when the asset is sold or incurs a loss in value. This latter category includes investments other than control, joint control or associates.

Maire Tecnimont S.p.A.
180
Cash and cash equivalents
Cash and cash equivalents include cash balances and bank current accounts and deposits repayable on-demand, plus other highly liquid short term financial investments that can be readily converted into cash and are not subject to a significant risk of a change in value.
FINANCIAL LIABILITIES AND EQUITY INSTRUMENTS
Financial liabilities and equity instruments issued by the Company are classified based on the substance of the contractual agreements that generated them and in accordance with the respective definitions of financial liabilities and equity instruments. These latter are defined as those contracts which give the right to benefit from the residual interest of the assets of the company after the reduction of the liabilities. The accounting policies adopted for specific financial liabilities and Equity instruments are described below.
Payables
Payables are initially recorded at cost, corresponding to the fair value of the liability, net of directly attributable transaction costs.
Subsequent to initial recognition, the payables are measured under the amortized cost method, utilizing the effective interest rate method. This category includes interest bearing bank loans and overdrafts.
Trade payables which mature within the normal commercial terms are not discounted. Payables in currencies other than the operational currency of the individual companies are recorded at the period-end exchange rates.
FAIR VALUE MEASUREMENT
Fair value is the amount in which an asset (or a liability) may be exchanged in a transaction between independent counterparties with reasonable knowledge of the market conditions and significant events related to the item under negotiation. The presumption that an entity is fully operational and does not need to liquidate or significantly reduce activities, or undertake operations at unfavorable conditions, is fundamental to the definition of fair value. The fair value reflects the credit quality of the instrument as it incorporates the counterparty risk.
Receivables and Payables:
For receivables and payables recorded in the financial statements at cost or amortized cost, the fair value for the purposes of the disclosure to be provided in the Explanatory Notes is determined as follows:
• for short-term receivables and payables, it is considered that the value paid/received reasonably approximates fair value;
• for medium/long-term receivables/payables, the measurement is principally undertaken through the discounting of future cash flows. The discounting of the expected cash flows is normally undertaken through the zero coupon curve increased by the margin represented by the specific credit risk of the counterparty.
Other financial instruments (Debt and equity securities)
The fair value for this category of financial asset is measured taking as reference the listed prices at the reporting date of the financial statements where existing, otherwise with reference to technical valuations utilizing as input exclusively market data.

181
EQUITY INSTRUMENTS
Equity instruments issued by the Company are recognized based on the amount received, net of direct issue costs.
CONVERTIBLE BONDS
In accordance with IAS 32 “Financial Instruments: Presentation in the financial statements” convertible bonds are recorded as hybrid financial instruments, formed by two components which are treated separately only if significant: a liability and a conversion option. The liability corresponds to the present value of the future cash flows based on the current interest rate at the issue date for an equivalent non-convertible bond. The value of the option is defined as the difference between the net amount received and the amount of the liability and is recorded under equity. The value of the conversion option in shares does not change in subsequent periods. On the contrary, where the characteristics of the bond result in, on the exercise of the conversion right, the right of the company to deliver shares or offer a combination of shares and cash, the option is recognized as a financial liability for the incorporated host, measured at fair value through P&L, while the difference compared to the original nominal value or rather the financial liability (host) is recorded at amortized cost.
In consideration of the convertible bond placement in February 2014 issued by Maire Tecnimont S.p.A. this is a hybrid financial instrument whose accounting method is described above.
DERIVATIVE INSTRUMENTS AND HEDGE ACCOUNTING
The company utilizes derivative instruments to hedge against movements in the Maire Tecnimont share price, in view of the implementation of a buy-back program. The structure of the contracts in place is in line with the Group “hedging” policy.
The TRES derivative instruments are not considered as hedge instruments for hedge accounting purposes and therefore are measured in accordance with IAS 39 as a fair value derivative through P&L.
Fair value calculation
The fair value of financial instruments is represented by the current market price or, in their absence the application of appropriate financial valuation models which take into consideration all the factors adopted by market operators and the prices obtained in a real market transaction.
In particular, the fair value of the TRES is measured discounting the expected cash flows, calculated on the basis of market interest rate at the reference date and the price of the underlying listed shares.
DERECOGNITION OF FINANCIAL INSTRUMENTS
Financial assets are eliminated from the balance sheet when the right to receive the cash flows no longer exist and all the related risks and benefits are substantially transferred (so-called derecognition) or where the item is considered definitively non-recoverable after the completion of all the necessary recovery procedures. Financial liabilities are derecognized from the balance sheet when the specific contractual obligations are extinct. Receivables transferred following factoring operations are eliminated from the balance sheet only when the related risks and benefits of ownership have been substantially transferred. With recourse receivables and non-recourse receivables which do not satisfy these requisites remain on the balance sheet of the company, even if legally transferred; in this case a financial liability of a similar amount is recorded under liabilities against advances received.

Maire Tecnimont S.p.A.
182
SHAREHOLDERS’ EQUITY
Share capital
The share capital is the amount of the subscribed and paid-in capital of the Company. The costs strictly related to the issue of new shares are classified as a reduction of the share capital when they refer to costs directly attributable to the equity operation.
Treasury shares
They are recorded as a decrease of the shareholders’ equity. The costs incurred for the issue of new shares by the Company are recorded as a reduction in equity, net of any deferred tax effect. The gains or losses for the purchase, sale, issue or cancellation of treasury shares are not recorded in the income statement.
Retained earnings/ (accumulated losses)
This refers to the results of previous years for the part not distributed or recorded under reserves (in the case of profit) or recapitalized (in the case of losses). The account also includes the transfers from other equity reserves when those reserves are no longer required as well as the effects of the recording of changes to accounting policies and material errors.
Other reserves
These include, among others, the legal reserve and the extraordinary reserve.
Valuation reserve
These include, among others, the actuarial reserve on defined benefit plans recognized directly to equity.
CONTRACTUAL LIABILITIES DERIVING FROM FINANCIAL GUARANTEES
The contractual liabilities deriving from financial guarantees are initially measured at their fair value and subsequently measured at the higher between:
• the amount of the contractual obligation, determined in accordance with IAS 37 – Provisions, Contingent Liabilities and Contingent Assets;
• the initial amount recorded net, where applicable, of the accumulated amount recorded in accordance with the recognition of the revenues as described above.
PROVISIONS FOR RISKS AND CHARGES
Provisions are recorded in the financial statements when the Company has a present obligation (legal or implied) that is the result of a past event and it is probable that the obligation must be met. Provisions are made based on the best estimate of the cost of fulfilling the obligation at the reporting date, and are discounted when the effect is significant.
When the Company considers a provision for risks and charges must be in part or in full reimbursed, the indemnity is recorded under assets only when the reimbursement is almost certain and the amount of reimbursement may be determined reliably.

183
Onerous contracts
Where the Company has an onerous contract, the current obligation contained in the contract must be recognized and measured as a provision.
An onerous contract is a contract in which the non-discretional costs necessary to settle the obligations exceed the economic benefits deriving from such.
Guarantees
The provisions for guarantee costs are accrued when it is considered probable that the request to honor the guarantee will be made. The calculation of the provision is made based on the best estimate by Management of the costs required to comply with the obligation.
POST-EMPLOYMENT BENEFITS
The payments for defined contribution plans are recognized in the Income Statement of the period in which they are due.
For the defined benefit plans, the cost relating to the benefits recognized is determined using the projected unit credit method, making actuarial valuations at the end of each period. Actuarial gains and losses are recognized in the period they arise and recorded directly in a specific equity reserve. The cost relating to past employment service is immediately recorded when the benefits have already matured. The liabilities for post-employment benefits recorded in the balance sheet represent the present value of the liabilities for the defined benefit plans adjusted to take into account any actuarial gains or losses not recorded and costs relating to past employment services not recorded, and reduced by the fair value of the asset plan. Any net assets resulting from this calculation are limited to the value of the actuarial losses not recorded and costs relating to past employment services not recorded, plus the present value of any repayments and reductions in future contributions to the plan.
Other long-term employee benefits
The accounting treatment of the other long-term benefits is similar to those of the plans for post-employment benefits with the exception of the fact that the actuarial gains and losses and costs deriving from past employment services are recognized in the income statement fully in the year in which they arise.
SHARE-BASED PAYMENTS
The company recognizes additional benefits to employees through equity participation plans. The above-mentioned plans are recognized in accordance with IFRS 2 (Share-based payments). In accordance with IFRS 2, these plans represent a remuneration component of the beneficiaries; therefore, for the equity participation plans, the cost is represented by the fair value of these instruments at the granting date, and recognized in the income statement under “Personnel expenses” over the period between the granting date and that of maturity, and in the “IFRS 2 reserve” under equity. Changes subsequent to the granting date in the fair value do not have an effect on the initial value. At the end of each year the estimate is updated on the number of rights which will mature on maturity. The change in the estimate reduces the amount in the “IFRS 2 reserve” and is recorded under “Personnel expense” in the P&L.
FINANCIAL INCOME AND EXPENSES
Interest is recognized in accordance with the effective interest rate method, utilizing therefore the interest rate which is financially equivalent to all the cash inflows and outflows (including

Maire Tecnimont S.p.A.
184
premiums, discounts, commissions etc.) which comprise an operation. The Company classifies in this account the exchange differences deriving from financial operations, while the exchange differences from commercial operations are classified under operating results, and in particular in the accounts other operating revenues and other operating costs, depending on whether the net effect is a gain or loss, with detailed information provided in the Explanatory Notes.
INCOME TAXES
Income taxes for the year represent the sum of current and deferred taxation.
Current income taxes
Current income taxes for the year and previous years are recorded for the amount expected to be paid to the fiscal authorities.
Current income tax liabilities are calculated using applicable rates and tax regulations or those substantially approved at the reporting date. Maire Tecnimont SpA and the main subsidiaries resident in Italy have opted for a consolidated tax regime. This means that the IRES (Corporation Tax) charge is calculated on a tax base representing the aggregate of the taxable income and tax losses of the individual companies.
Deferred taxes
Deferred taxes are the taxes that it is expected to pay or recover on the temporary differences between the carrying value of the assets and of the liabilities in the financial statements and the corresponding fiscal value used in the calculation of the assessable income.
Deferred tax liabilities are generally recorded on all temporary assessable differences, while deferred tax assets are recorded based on the probability that the future assessable results will permit the use of the temporary deductible differences.
The carrying value of deferred tax assets is revised at the end of the year and reduced to the extent that it is no longer likely that there will be sufficient taxable income against which to recover all or part of the assets.
Deferred taxes are calculated based on the fiscal rates that are expected to be in force at the moment of the realization of the asset or the settlement of the liability. Deferred taxes are recognized directly in the income statement with the exception of those relating to accounts directly recognized to equity, in which case the deferred taxes are also recognized to equity.
USE OF ESTIMATES
The preparation of the financial statements and the relative notes in application of IFRS require that management make estimates and assumptions on the values of the assets and liabilities in the financial statements and on the disclosures relating to the assets and contingent liabilities at the reporting date. The estimates and assumptions used are based on past experience and other factors considered relevant. The actual results may differ from such estimates. The estimates and assumptions are reviewed periodically and the effects of any changes are recorded in the income statement in the period of the revision of the estimate, if the revision has effect only on that period, or also in subsequent periods if the revision has effect on the current year and on future years. In this context it is reported that the situation caused by the current economic and financial crisis resulted in the need to make assumptions on a future outlook characterized by significant uncertainty, for which it cannot be excluded that results in the next year will be different from such estimates and which therefore could

185
require adjustment, currently not possible to estimate or forecast, which may even be significant, to the book value of the relative items.
The accounts principally concerned by such uncertainty are:
• bad debt provision;
• Impairments of financial assets;
• depreciation and amortization;
• asset write-downs;
• employee benefits;
• income taxes;
• provisions;
• measurement of derivatives and relative underlying assets.

Maire Tecnimont S.p.A.
186
41. Notes to the income statement
41.1. Revenues
Revenues in 2016 amounted to Euro 63,470 thousand, a decrease of Euro 17,004 thousand compared to the previous year and broken down as follows:
Revenues from subsidiary dividends amounted to Euro 33,602 thousand and concern those received during the year from the subsidiary KT-Kinetics Technology S.p.A. for Euro 11,781 thousand and the subsidiary Stamicarbon B.V. for Euro 21,821 thousand. In the previous year, this benefitted from a higher dividend due to the strong performance of the Dutch subsidiary.
Revenues from sales and services were Euro 29,868 thousand and principally concern “Inter-company services” provided to the direct subsidiaries.
Service revenues specifically concern those provided by the Parent Company as part of the management, co-ordination and control from a legal, administrative, tax, financial and strategic viewpoint in the interest of Group companies.
41.2. Other operating revenues
Other operating revenues in the year amounted to Euro 3,094 thousand and concerned for Euro 3,092 thousand income from specific administrative, tax, legal and procurement service contracts undertaken between Maire Tecnimont S.p.A. and a number of Group subsidiaries (Tecnimont S.p.A, Met NewEn S.p.A., KT Kinetics Technology S.p.A. and MET Gas Processing Technologies S.p.A.).
( in Euro thousands) 2016 2015
Revenues from sales and services 29,868 26,648
Dividends from subsidiaries 33,602 53,826
Total 63,470 80,474
( in Euro thousands) 2016 2015
Cost recoveries 2 2
Prior year income 0 90
Insurance indemnities 0 28
Other 3,092 2,003
Total 3,094 2,123

187
41.3. Raw materials and consumables
Raw materials and consumables costs for the year were Euro 31 thousand.
The breakdown of the account is as follows:
The account principally concerns the purchase of stationary for Euro 16 thousand and fuel consumption for Euro 13 thousand for company vehicles.
41.4. Service costs
Service costs in 2016 amounted to Euro 19,117 thousand, a decrease of Euro 2,058 thousand on the previous year.
The breakdown of the account is as follows:
Consultants and related services include professional fees, principally legal and administrative services and legal and consultancy for projects under execution during the year and audit and tax and commercial consultancy fees.
Director and Statutory Auditor Remuneration concerns that matured by the members of the Board of Directors, the Board of Statutory Auditors’ emoluments, those of the Supervisory Committee, the Remuneration Committee, the Internal Control Committee and the Related Parties Committee.
Accessory personnel costs mainly relate to travel costs and other related costs undertaken by personnel which mainly increased on the previous year due to the rise in the average number of employees compared to 2015.
The Other account mainly concerns inter-company services for the Via Gaetano de Castillia (Milan) offices, including office canteen expenses, maintenance and other accessory activities.
( in Euro thousands) 2016 2015
Consumables (18) (22)
Fuels (13) (15)
Total (31) (37)
( in Euro thousands) 2016 2015
Utilities (248) (218)
Maintenance (77) (80)
Consultants and related services (5,849) (5,559)
Director and Statutory Auditor Remuneration (2,321) (2,024)
Bank expenses and sureties (674) (603)
Selling & advertising costs (292) (264)
Accessory personnel costs (4,355) (4,137)
Post & telephone and similar (11) (8)
Insurance (192) (161)
Other (5,098) (8,121)
Total (19,117) (21,175)

Maire Tecnimont S.p.A.
188
The account in addition includes non-capitalized IT costs, application package maintenance expenses and printing and reproduction service costs; in the previous year the account also included costs for company events.
41.5. Personnel expenses
Personnel expenses in 2016 amount to Euro 27,470 thousand, an increase of Euro 9,880 thousand compared to the previous year.
The breakdown of the account is as follows:
The workforce at December 31, 2016 numbered 112, increasing 11 on the previous year; the average headcount increased from 97 to 108.
The movement in the company’s workforce by category is as follows:
The increase in personnel costs is therefore a consequence of the factors illustrated above and the increase in the estimates related to the remuneration policy and employee incentive plans; the social security charges also increased on the previous year and their percentage of total remuneration is in line with the requirements by law.
In fact, in the previous year the conclusion of a number of incentive plans which facilitated the company’s turnaround and stabilized managerial roles in order to achieve the strategic objectives was seen as an opportunity to reflect on new Top Management incentive instruments to be deployed in support of the new development phase initiated, while recognizing at the same time the professional skills and contribution of each to the Group’s success. In this regard a new Compensation Policy cycle for the 2016-2018 three-year period was drawn up with a focus on growth, development and creation of value over the long-term, while establishing even greater consistency between the work of the human resources department and the interests of shareholders and stakeholders.
( in Euro thousands) 2016 2015
Wages and salaries (21,563) (13,368)
Social security charges (4,820) (3,509)
Post-employment benefits (1,065) (713)
Other costs (22) 0
Total (27,470) (17,590)
Category Workforce at December 31,
2015
Hires Departures Promotions Workforce at December 31,
2016
Executives 37 1 (2) 1 37
Managers 34 4 (4) 3 37
White-collar 30 10 0 (2) 38
Blue-collar 0 0 0 0 0
Total 101 15 (8) 2 112
Average headcount 97 108

189
“Personnel expenses” also includes the fair value component recognized in the period relating to the Phantom Stock incentive plan for the Chief Executive Officer of the company and some Senior Managers of the Group; these costs also include the new employee flexible benefit plan (“Maire4You”), the new profit participation bonus, as well as the 2016-2018 Shareholder Plan and the 2016-2018 Performance Share Plan.
In application of IFRS 2 Share-based payments, the 2016-2018 Shareholder Plan and the 2016-2018 Performance Share are recorded in the financial statements as “Equity Settled” plans as the Group has granted equity participation instruments as additional remuneration against services received (employment service). The Group did not however assume any liability to be settled with cash and cash equivalents or with other assets for employees. Given the impossibility to reliably estimate the fair value of the services received from the employees, the benefit cost to the employees is represented by the fair value of the shares granted, calculated at the grant date, to be recognized in the income statement under personnel costs and in a specific reserve under equity.
The above-mentioned Shareholder Plan includes a Rights Granting Cycle for each year (2016-2017-2018) and the possibility, for all employees, to receive Maire Tecnimont shares without consideration on the basis of the overall profitability of the Group. In addition, the 2016-2018 Performance Share Plan concerns approx. 30 Senior Managers, with the granting of rights to Maire Tecnimont shares without consideration in the three-year period 2016-2018 and their effective granting based on pre-set industrial performance objectives, to be assessed annually and at the end of the period.
The effects in the financial statements of the Plans, estimated through adequately weighing the defined maturity conditions (including the probability of employees remaining in the Group for the duration of the Performance Plan), will be recognized over the maturity period of the benefit, or rather over the duration of the Plans, under “Personnel expense”.
The total cost of these plans for the year amount to Euro 738 thousand also based on an weighed average fair value of the capital instruments equal to Euro 2.36 per share.
41.6. Other operating costs
Other operating costs in 2016 amounted to Euro 2,045 thousand, an increase of Euro 75 thousand compared to the previous year.
The breakdown of the account is as follows:
Hire principally concerns the application packages and motor vehicles.
Rental charges concern the leasing of office buildings, in particular those at Piazza Flamingo (Rome) and Via Castello Della Malian (Rome); the account also includes rental for premises at via di Vanning (Rome) within the partnership agreement with the La Sapienza University.
Other costs of Euro 1,100 thousand principally concern membership fees, sales representative costs, gratuities and other general costs.
( in Euro thousands) 2016 2015
Hire (534) (479)
Rental (411) (519)
Other costs (1,100) (972)
Total (2,045) (1,970)

Maire Tecnimont S.p.A.
190
41.7. Amortization, depreciation & write-downs
Amortization, depreciation and write-down of fixed assets in 2016 amounted to Euro 20 thousand, a decrease of Euro 170 thousand compared to the previous year.
The breakdown of the account is as follows:
Amortization of intangible assets of Euro 14 thousand relates to concessions and licenses (SAP, Tagetik and other company software applications) and other intangible assets, principally concerning consultancy costs for the installation and launch of these applications. The decrease relates to the conclusion of the depreciation of certain assets during the year.
Depreciation of Euro 6 thousand concerns EDP and miscellaneous equipment.
41.8. Financial income
Income from subsidiaries of Euro 1,087 thousand concerns interest matured on loans, financial instruments classified as loans and receivables valued at amortized cost, granted to Tecnimont Civil Construction S.p.A.
Currency gains of Euro 40 thousand concerned both the adjustment of items in foreign currencies and realized profits.
Income on derivatives amounting to Euro 1,613 thousand relates to the measurement of the cash-settled Total Return Equity Swap (TRES and TRES II) in order to hedge the risk on the Maire Tecnimont share price.
( in Euro thousands) 2016 2015
Amortization (14) (184)
Depreciation (6) (5)
Total (20) (190)
( in Euro thousands) 2016 2015
Income from subsidiaries 1,087 2,331
Other income 0 77
Currency gains 40 70
Income on derivatives 1,613 0
Total 2,740 2,478

191
41.9. Financial expenses
Financial expenses were Euro 16,928 thousand and concern for Euro 9,490 thousand interest charges on loans received from Stamicarbon B.V., KT-Kinetics Technology S.p.A., Tecnimont S.p.A., Tecnimont Russia, Tecnimont Planung und Industrieanlagenbau GmbH, Imm.Lux S.A. and Maire Engineering France S.A.. These charges are measured under the amortized cost criteria, using the effective interest rate method. Other charges relate to interest expense on bank loans and decreased significantly on the previous year due to the repayment of almost all the loans. “Equity Linked Bond Interest” of Euro 6,604 thousand includes the cash and non-cash components of interest on equity linked bonds of Euro 80 million issued in 2014.
41.10. Investment income/(expenses)
At December 31, 2016, no write-downs were made on investments based on the impairment testc carried out on the Maire Tecnimont S.p.A. investments, as described in the “Investments in subsidiaries” paragraph.
In the previous year a write-down was made in the subsidiary Tecnimont Civil Construction S.p.A.
41.11. Income taxes
( in Euro thousands) 2016 2015
Charges from group companies (9,490) (10,094)
Other charges (834) (3,933)
Equity Linked Bond interest & other charges (6,604) (6,420)
Total (16,928) (20,447)
( in Euro thousands) 2016 2015
Revaluations/(Write-downs) subsidiaries 0 (14,000)
Revaluations/(Write-downs) financial assets 0 1,860
Total 0 (12,140)
( in Euro thousands) 2016 2015
Current income taxes (1,032) 410
Taxes relating to previous periods (202) 138
Deferred tax income 7,128 6,445
Deferred tax charge (56) 3
Total 5,838 6,996

Maire Tecnimont S.p.A.
192
The account reports a positive value of Euro 5,838 thousand and a decrease of Euro 1,158 thousand on the previous year.
Current income taxes amount to Euro 1,032 and relate to the earnings in excess of the ROL transferred by the companies within the tax consolidation in 2016 and utilized by the company for the deduction of the excess interest expense transferred.
Prior year taxes amounts to Euro 202 thousand and relates to the income allocation difference for the remuneration of tax losses utilized in the CNM 2016 - year 2015 consolidation compared to that indicated in the financial statements.
Maire Tecnimont S.p.A. and the subsidiaries Tecnimont S.p.A., Met Gas Processing Technologies S.p.A., Tecnimont Civil Construction S.p.A, Met Newen S.p.A, KT-Kinetics Technology S.p.A. and M.S.T S.r.l opted to apply the Tax Consolidation regime which permits the calculation of the IRES corporation tax on a tax basis representing the aggregate of the taxable income and losses of the individual companies. Deferred tax assets on fiscal losses and carried forward are recognized only for those amounts for which it is probable there will be future assessable income to recover the amounts.
Deferred tax income for Euro 7,128 thousand principally relate to the recognition of deferred tax assets on the tax loss and non-deductible interest transferred to the tax consolidation and utilized in the calculation of the Tax consolidation’s assessable income, net of releases in the period and allocation differences on the previous year.
Deferred tax charges of Euro 56 thousand concern fiscally recognized amortization of the Tecnimont and KT-Kinetics Technology trademarks which, as considered of indefinite useful life, were not subject to statutory amortization and recognized the benefit only for tax purposes.
An analysis of the difference between the theoretical and effective tax charge for the year follows:
Ires
Description 31/12/2016
Income before tax 3,492
Theoretical Rate (*) 27.5%
Theoretical tax charge 960
Temporary diffe rences deductible in future years:
Taxable temporary diffe rences 24,507
Total 24,507
Reversa l of temporary differences from previous years:
Deductible temporary differences 5,786
Total 5,786
Non-reversing differences in future years (**):
Increases 1,576
Decreases -31,922
Total -30,346
Total changes -11,625
Tax loss -8,133
Current taxes -2,237
Effective IRES rate N/A

193
(*) For the purposes of a better understanding on the reconciliation between the tax charge recorded in the accounts and the theoretical tax charge, no account is taken of the IRAP regional tax charge, as consisting of a
tax with a different assessable base would generate distortions between each year. Therefore, theoretical taxes
were calculated apply ing only the applicable rate in Italy (27.5% for IRES in 2016) to the pre-tax result.
(**) The account principally concerns dividends received from subsidiaries and the write-down of investments .
41.12. Earnings per share
The share capital of Maire Tecnimont S.p.A. comprises ordinary shares, whose earnings (loss) per share is calculated dividing the net income in 2016 by the weighted average number of Maire Tecnimont S.p.A. shares in circulation in the period considered. At the reporting date, the number of shares in circulation was 305,527,500. This figure was used as the denominator for the calculation of the earnings (loss) per share at December 31, 2016. The basic earnings per share was Euro 0.031.
We also report that in February 2014 the Parent Company completed an equity-linked bond operation amounting to Euro 80 million, placed with qualified Italian and foreign investors.
The bonds were initially convertible, at a fixed conversion price of Euro 2.1898, in new ordinary shares issued of the Company; subsequently on May 3, 2016 following approval by the Ordinary Shareholders’ Meeting of April 27, 2016 relating to the distribution of a dividend per share of Euro 0.047, Maire Tecnimont S.p.A. communicated to have sent to the bondholders a Notice on the same date through Euroclear and Clearstream Luxemburg. The Notice stated that the Calculation Agent determined, following the payment of the dividend, the change in the conversion price of the Bonds from Euro 2.1898 to Euro 2.1509, in accordance with conditions 6 (b) (iii) and 6 (f), at the effective date of May 2, 2016 (first trading date of the ordinary shares ex dividend on the Milan Stock Exchange).
At the date of the present report account was taken in the calculation of the diluted earnings of this component, as at December 31, 2016 the conversion was “in the money”.
The diluted earnings per share was Euro 0.028.
2016 2015
Number of shares in circulation 305,527,500 305,527,500
(Treasury shares) 0 0
Number of shares to calculate earnings per share 305,527,500 305,527,500
Net income 9,531,489 18,542,366
Number of shares reserved capital increase Equity Linked Bond 36,533,017 36,533,017
Earnings per share (Euro)
Basic earnings per share 0.031 0.061
Diluted earnings per share 0.028 0.054
( in Euro )

Maire Tecnimont S.p.A.
194
42. Notes to the Balance Sheet
42.1. Property, plant and equipment
The following table illustrates the changes in the historical cost, accumulated depreciation and net book values:
The main decreases relate to depreciation in the year; the increases in Other assets is due to the purchase of office furniture and EDP.
For comparative purposes the changes relating to the previous year are shown below:
( in Euro thousands) 31/12/15 Changes in the year
31/12/16
Other assets 91 3 94
Total 91 3 94
( in Euro thousands) Plant and Machinery
Industrial and commercial equipment
Other assets
Total
Net book value at 31.12.2015 0 0 91 91
Increases 0 0 9 9
Depreciation & write-downs 0 0 (5) (5)
Net book value at 31.12.2016 0 0 94 94
Historic cost 2 20 481 504
Accumulated depreciation (2) (20) (387) (409)
( in Euro tho usand s) Plant and Machinery
Industrial &
commer. equip.
Other assets
Total
Net book value at 31.12.2014 0 0 83 83
Increases 0 0 13 13
Depreciation & w rite-dow ns 0 0 (5) (5)
Net book value at 31.12.2015 0 0 91 91
Historic cost 2 20 473 495
Accumulated depreciation (2) (20) (382) (404)

195
42.2. Other intangible assets
The following table illustrates the changes in the historical cost, accumulated amortization and net book values for the year 2016:
The breakdown of the trademarks with indefinite useful lives is shown in the table below.
(in Euro thousands) 2016
Tecnimont brand 3,016
KT- Kinetics Technology brand 70
Total 3,086
The Company verifies the recovery of the indefinite useful lives of the trademarks at least on an annual basis or more frequently when there is an indication of a loss in value. The recoverable value of trademarks with indefinite life was compared to the value in use.
For comparative purposes the changes relating to the previous year are shown below:
( in Euro thousands) 31/12/15 Changes in the year
31/12/16
Concessions, licenses, trademarks & similar rights 3,143 (12) 3,131
Assets in progress and advances 0 139 139
Total 3,143 127 3,270
( in Euro thousands) Concessions, licenses,
trademarks & similar rights
Other Assets in progress and advances
Total
Net book value at 31.12.2015 3,143 0 0 3,143
Increases 2 0 0 2
Amortization & write-downs (14) (0) 0 (14)
Other movements 0 0 139 139
Net book value at 31.12.2016 3,131 (0) 139 3,270
Historic cost 4,344 4,508 139 8,992
Accumulated amortization (1,214) (4,508) 0 (5,722)

Maire Tecnimont S.p.A.
196
42.3. Investments in subsidiaries
(in Euro thousands) 2015 Changes in the year
2016
Subsidiary companies:
Tecnimont S.p.A. 588,510 2,387 590,897
Tecnimont Civ il Construction S.p.A. 71,800 140 71,940
Met NewEn S.p.A. 8,860 110 8,970
K.T. S.p.A. 26,972 467 27,439
MET GAS Processing Technologies S.p.A. 0 10,680 10,680
Stamicarbon B.V. 40,129 224 40,353
Total 736,271 14,008 750,280
The value of the investments in subsidiaries amounts to Euro 750,280 thousand, with the increase in the year due to the acquisition of MET Gas Processing Technologies S.p.A.. On May 17, 2016, in execution of Maire Tecnimont S.p.A. Board of Directors’ resolution of May 12, 2016 and Tecnimont S.p.A. Board of Directors’ resolution of May 16, 2016, the transfer took place of 100% of the share capital in the former Protecma S.r.l., now MET Gas Processing Technologies S.p.A. from Tecnimont S.p.A. to Maire Tecnimont S.p.A..
MET Gas Processing Technologies S.p.A. is principally involved in the research and development of high content technological and industrial innovation, and on June 1, 2016 acquired a shareholding in Siluria Technologies Inc through Round E investment. Parallel to this investment Maire Tecnimont S.p.A. and Siluria Technologies signed a co-operation agreement, based on which the two companies combined their respective technologies, know-how and experience for the commercialization of a new process to directly convert natural gas into chemical products and their derivatives.
The value of investments also increased due to the free assignment of shares in favor of employees of the companies of the Group in accordance with IFRS 2. In fact, the compensation component from shares granted by Maire Tecnimont S.p.A. to employees of other Group companies is recognized as a capital contribution to the subsidiaries which employ beneficiaries of the stock option plans, and, as a result, is recorded as an increase in the carrying amount of the investment, with a balancing entry recognized directly in equity. The effects in the financial statements of the Plans, estimated through adequately weighting

197
the defined maturity conditions (including the probability of employees remaining in the Group for the duration of the Plan), will be recognized over the maturity period of the benefit, or rather over the duration of the Plan.
Investments in subsidiaries are measured at cost.
The last column of the following table shows the differences between the book value at cost and the relative share of Net Equity:
Company
(in Euro thousands)
Registered Office
S hare capital
Currency Book Net Equity (Group
share) *
% held Book net equity
share (A)
Book value (B) Change
(A-B)
Tecnimont S.p.A. Via G. De
C astillia 6/A (MI)
1,000 Euro 196,564 100% 196,564 590,897 (394,333)
Tecnimont CiVil C onstruction S.p.A.
Via G. De C astillia 6/A
(MI)
6,000 Euro 68,207 100% 68,207 71,940 (3,733)
Met Newen S.p.A. Via G. De C astillia 6/A
(MI) 3,807 Euro 7,717 99% 7,640 8,970 (1,330)
KT S.p.A. Viale Castello
Della Malian (RM)
6,000 Euro 29,412 100% 29,412 27,439 1,973
MET Gas Processing Technologies S.p.A.
Via G. De C astillia 6/A
(MI
4,000 Euro 10,725 100% 10,725 10,680 45
Stamicarbon B.V. Sittard-The Netherlands
9,080 Euro 37,226 100% 37,226 40,353 (3,127)
(*) As per the latest consolidated financial statements approved by the respective Boards of Directors, or where not available, the consolidated reporting packages.
Events occurred during the year indicating an impairment and therefore the possible non-recoverability of the book value of the investment in Tecnimont Civil Construction S.p.A – related to the Infrastructure & Civil Engineering BU; in fact, this BU continued the turnaround launched in previous years, through a corporate restructuring to both increase capacity to adapt to altered production volumes and to ensure a greater focus and consequent capacity to respond to engineering services demand. In 2016, the acquisition of new orders was slightly delayed, although order intake figures were strong; in fact in 2016 new orders were acquired and project change orders and variances formalized for a value of Euro 99.7 million.
An impairment test was also carried out on the investment in Tecnimont S.p.A. as the book value of the investment was higher than the pro-quota net equity at December 31, 2016, as was the case also in the previous year.
This analysis was undertaken in conjunction with an independent expert, utilizing the cash flows based on the 2017 Budget, and for the period 2017-2021 on a review of the industrial and financial plan, approved by the Board of Directors on March 15, 2017.
These cash flows confirm the assumptions and the strategic projections of the Group plan and reflect the best estimates made by Top Management in relation to the principal assumptions concerning business operations (macro-economic trends and prices and business development). The underlying assumptions and the corresponding financial numbers are considered appropriate for the impairment test. The plan, in addition to the project margins, includes commercial, general and administrative costs.
The principal assumptions reflected in the 2017 Budget and Industrial Plan take into account the high level of the backlog at the end of 2016, which would indicate for the present year a prevalence of EPC project execution operations, following on from a significant increase in EPC production in Q4 2016, with margins reflecting those generally applied for such contracts.

Maire Tecnimont S.p.A.
198
Although within a challenging market, for the coming years the backlog is expected to remain high, thanks to our recognized technological know-how which is continually developing and expanding, recent acquisitions and a flexible model capable of adapting to market demands and also a robust commercial pipeline with the expectation of new important contracts.
The value of Maire Tecnimont’s investment was calculated estimating the operating value (OV), the net financial position (NFP) and the value of accessory assets (ACC).
The operating value of each unit was determined based on the estimated future cash flows discounted which the CGU will be capable of producing in the future. The estimated cash flows include the recharge of general and administration costs (G&A) of the Group for all the CGU’s. The value of the cash flows was expressed net of the notional imposition, considering the tax benefit relating to any deductibility of amortization and depreciation.
For the determination of the recoverable value, the cash flows refer to the business plan, as well as a final value (Terminal Value) beyond the plan horizon, in line with the nature of the investments and with sector operations. Relating to the estimate of the Terminal Value, the last year of the cash flows was not taken as an expression of the “normalized” cash flow, but rather the average margin of the Plan future cash flows was considered.
The “normalized” cash flow was capitalized at a g growth rate as detailed in the subsequent tables.
For the purposes of the discounting of the operating cash flows, the interest rate identified was the weighted average cost of capital (WACC) post tax. The parameters utilized in the estimate of the discounting rate (Beta and Net Financial Position) were determined on the basis of a basket of comparable operators respectively in the “Infrastructure” sector for the I&IC CGU and in the “Plant” sector for all the other CGU’s, calculating for each the key financial indicators, in addition to the most significant market values.
The risk free rate utilized considered the real return on benchmark country AAA government securities (United States), the expected medium/long-term inflation rate for the reference countries and the relative Country Risk Premium (determined on the basis of the differential between the country CDS spread and the country benchmark CDS spread). The market risk premium was estimated at 5.6%. It was considered appropriate to consider a specific risk for each investment above the relative discounting rate; this premium was determined based on the comparison between the size of the investment and the companies utilized for the estimate of the Beta Unlevered. This risk was increased by a Company Specific Risk Premium in relation to the conditions of the individual investments.
For the cost of equity component, therefore the rate was prudently increased by 0.9 percentage points for the investments in Tecnimont and in KT, 2.8 percentage points for the investment in Stamicarbon and 6.95 percentage points for the investment in Tecnimont Civil Construction, also considering the prospects following the redefinition of the operating structure, the commercial repositioning as well as the strengthening of synergies and know-how.
The principal accessory asset/liability (ACC) included in the valuation were the tax benefits from prior year tax losses over the Plan duration.
The analysis undertaken based on the parameters outlined above did not result in any loss in value.
A sensitivity analysis was also undertaken on the basis of the changes in the following parameters: i) discount rate and ii) growth rate for the estimate of the Terminal Value; based on this analysis, the range of the recoverable value of the CGU’s was determined.

199
Discount rate (WACC post tax) Lower extreme Higher extreme
Tecnimont S.p.A. & KT S.p.A. 11.9% 12.9%
Tecnimont Civil Construction S.p.A. 10.7% 11.7%
Stamicarbon B.V. 13.3% 14.3%
Growth rate beyond plan period Lower extre me Higher extreme
Tecnimont S.p.A. & KT S.p.A. 1.2% 2.2%
Tecnimont Civil Construction S.p.A. 0.4% 1.4%
Stamicarbon B.V. 1.2% 2.2%
The results of the sensitivity analysis did not highlight any impacts on the investments.
On January 27, 2017, the Extraordinary Shareholders’ Meetings of the subsidiary Met Newen S.p.A. and the subsidiary Tecnimont Civil Construction S.p.A. approved the merger proposal of Met Newen S.p.A. into Tecnimont Civil Construction S.p.A..
The merger is part of the restructuring of industrial and commercial operations and the shortening of the Maire Tecnimont Group’s chain of control, optimizing the business operating model and generating both financial and operating savings through cutting overheads and leveraging on all available economies of scale.
In particular, this initiative directly stems from the new business model of Met Newen S.p.A. for the construction of major renewable sector plant for which Tecnimont Civil Construction S.p.A., thanks to its infrastructural/civil engineering and construction know-how, is the ideal partner for Met Newen S.p.A. for such operations, and is investing a significant amount of the project funding. The completion of the merger and the consolidation of synergies between Tecnimont Civil Construction S.p.A. and Met Newen S.p.A. follows through on the guidelines for the Infrastructure and Renewable Energy Business Unit, drawn up to generate additional flexibility for the Maire Tecnimont Group’s business model through, on the one hand, consolidated infrastructural experience and, on the other, a singular vision for the renewables business.
42.4. Other non-current assets
Other non-current assets concern disputed receivables from clients due beyond 12 months and specifically from the Calabria Region for Euro 1,100 thousand.
With regards to this receivable, the arbitral award accepted most of the company’s demands. The counterparty has proposed an appeal against the arbitral award and in 2013 the Catanzaro Court of Appeal nullified the award on the basis only of formal errors; the company therefore decided to challenge the judgement filed on May 6, 2013 and to appeal to the Cassation Court. The appeal was accepted with notification of 20/6/14; the Calabria Region did not make a counter appeal and the hearing date for discussion and subsequent decision is awaited. The above amount is currently considered recoverable on the basis of the strong grounds previously expressed in the arbitral award.
( in Euro thousands) 31/12/15 Changes in the year
31/12/16
Trade receivables beyond 12 months 1,100 0 1,100
Total 1,100 0 1,100

Maire Tecnimont S.p.A.
200
These receivables were due to the company Protecma S.r.l (now MET Gas Processioning Tecchnologies S.p.A.) from the client for works executed in the past. For more effective management of the dispute, the company transferred these receivables to Maire Tecnimont S.p.A on the basis of an expert’s valuation. This receivable is recognized at estimated realizable value.
42.5. Other non-current financial assets
Non-current financial assets amount to Euro 45,119 thousand and concern receivables from Tecnimont Civil Construction S.p.A related to the short-term management of its working capital and for Euro 490 thousand from Tecnimont do Brasil LTDA.. The amount of the loans issued to Tecnimont do Brasil LTDA were fully written down as not considered recoverable. All loans are interest-bearing at market rates and maturity is scheduled beyond the subsequent year. Other non-current financial assets are classified as financial instruments and subsequent to initial recognition are measured at amortized cost, utilizing the effective interest rate method. The estimate of the “fair value” of these receivables granted approximate substantially the carrying value which was calculated as indicated in the section on accounting policies.
42.6. Deferred tax assets and liabilities
Deferred tax assets and liabilities report a positive balance of Euro 2,791 thousand, reducing Euro 357 thousand on the previous year and comprising deferred tax assets for Euro 3,212 thousand and deferred tax liabilities for Euro 421 thousand.
Maire Tecnimont S.p.A. and the subsidiaries Tecnimont S.p.A., MET Gas Processing Technologies S.p.A., Tecnimont Civil Construction S.p.A, Met Newen S.p.A, KT-Kinetics Technology S.p.A. and Most S.r.l opted to apply the Tax Consolidation regime which permits the calculation of the IRES corporation tax on a tax basis representing the aggregate of the taxable income and losses of the individual companies. Deferred tax assets on fiscal losses and carried forward are recognized only for those amounts for which it is probable there will be future assessable income to recover the amounts.
( in Euro thousands) 31/12/15 Changes in the year
31/12/16
Non-current financial assets: 34,054 11,065 45,119
Financial prepayments 0 242 242
Total 34,054 11,307 45,361
( in Euro thousands) 31/12/15 Changes in the year
31/12/16
Deferred tax assets 3,512 (300) 3,212
Deferred tax liabilities (364) (57) (421)
Total 3,148 (357) 2,791

201
The decrease in deferred tax assets is due principally to the combined effect of the allocation of deferred taxes on tax losses, on excess interest charges transferred to the tax consolidation, utilized in the consolidation to reduce the assessable amount for the year, in addition to deferred tax assets on temporary differences deductible in future years for the allocation of charges for remuneration policies and personnel bonuses and the reversal of temporary differences from previous years in the year.
Deferred tax liabilities of Euro 421 thousand mainly concern fiscally recognized amortization of the Tecnimont and KT-Kinetics Technology trademarks which, as considered of indefinite useful life, were not subject to statutory amortization and recognized the benefit only for tax purposes.
The breakdown and changes in the deferred tax assets and liabilities is shown below:
42.7. Trade receivables
Receivables from subsidiaries were Euro 58,293 thousand, of which Euro 9,204 thousand from Tecnimont S.p.A. for coordination and control and for the tax, financial and legal service and other recharges, Euro 5,649 thousand from KT-Kinetics Technology S.p.A. for coordination and control, Euro 12,635 thousand from Tecnimont Civil Construction S.p.A. for coordination and control, Euro 200 thousand from Met Newen S.p.A. for coordination and control and administrative/tax services, Euro 7,029 thousand from Stamicarbon B.V., of which Euro 29 thousand for various recharges and Euro 7,000 thousand for dividends relating to the year 2015, approved but not yet paid at the year-end. Finally, Euro 21,889 thousand relates to receivables for the tax consolidation; the amount concerns the net balance of advances and tax credit and debit positions transferred to the consolidating company by the subsidiaries involved in the tax consolidation. The account
(i n E ur o thousa nd s) 2015 Provisions Utilis ations Reclas sifications/ transfers
2016
Defer red tax ass ets
Other 1,501 1,141 (50) 151 2,743
Share capital increase charges - IAS 32 946 (514) (6) 426
Post-employment benefits 48 0 (5) 43
Tax Losses 1,017 6,332 (6,322) (1,027) 0
Total defer red tax ass ets 3,512 7,473 (6,891) (882) 3,212
Defer red tax liabilities
Difference in intangible asset values (Trademarks) (364) (57) 0 (421)
Total defer red tax liabilities (364) (57) (421)
Total 3,148 7,416 (6,891) (882) 2,791
( in Euro thousands) 31/12/15 Changes in the year
31/12/16
Trade receivables - within 12 months 16 (16) 0
Subsidiaries - within 12 months 33,712 24,581 58,293
Associates - within 12 months 10 (2) 8
Total 33,738 24,563 58,301

Maire Tecnimont S.p.A.
202
includes IRES excesses transferred to subsidiaries according to Presidential Decree 29/09/1973 of Euro 1,350 thousand, which they may utilize to offset other tax payables.
42.8. Current tax assets
Current tax assets at December 31, 2016 amount to Euro 21,789 thousand, reducing on the previous year. This decrease is mainly due to the decrease of the excess IRES, utilized to offset both the tax consolidated income taxes for the year and the settlement agreed with the Tax Agency which nullified all the disputes in progress (and potential) relating to the issues contained in the PVC2011 and PVC2013 assessments following the tax audits on the subsidiary Tecnimont S.p.A. Tax receivables principally concern:
• Receivables for VAT paid by Maire Tecnimont S.p.A. as tax consolidating company for Euro 18,673 thousand;
• Receivables for excess IREAP payment on account for Euro 227 thousand; • The residual Euro 2,888 thousand refers to receivables from the tax authorities for
various reimbursements.
In 2016, the Group VAT consolidation was renewed and Maire Tecnimont S.p.A. as parent company consolidated the debit and/or credit balances of the subsidiaries involved in the consolidation.
42.9. Financial instruments - Derivatives
The account for Euro 1,150 thousand relates to the positive fair value of two derivative instrument (TRES); in fact in February 2016, Maire Tecnimont S.p.A. subscribed to a cash-settled Total Return Equity Swap (TRES) contract to hedge against movements in the Maire Tecnimont share price, in view of the implementation of a buy-back program for a maximum 10,000,000 shares, approved by the Ordinary Shareholders’ Meeting of December 15, 2015, as illustrated in the 2015 Annual Report. The contract was underwritten with a financial intermediary and currently there is no obligation for Maire Tecnimont to acquire the treasury shares, but only the obligation of the settlement between the parties of the differential between the exercise price and the Maire Tecnimont share price on the maturity of the instrument. The instrument matures in May 2019, but provides for annual intermediary windows (April - May 2017 & April - May 2018) in which Maire Tecnimont may exercise a partial “Early Termination” option. Maire Tecnimont in addition to an initial fee, must
( in Euro thousands) 31/12/15 Changes in the year
31/12/16
Tax receivables 27,198 (5,409) 21,789
Total 27,198 (5,409) 21,789
( in Euro thousands) 31/12/15 Changes in the year
31/12/16
Financial instruments - Derivatives 0 1,150 1,150
Total 0 1,150 1,150

203
recognize a financial expense (interest rate expense) over the duration of the contract for the capital invested by the intermediary to implement the share purchase program on maturity. The TRES is not considered a hedge instrument for hedge accounting purposes and therefore is measured in accordance with IAS 39 as a fair value derivative through P&L.
In October 2016, Maire Tecnimont S.p.A. subscribed to a further derivative contract (TRES) to hedge against movements in the Maire Tecnimont share price, in view of an increase in the number of shares to be purchased on the market for a total amount of 4,500,000 treasury shares. The contract is substantially similar to the previous contract signed although there are no optional annual intermediary windows and therefore the final maturity is May 2019.
42.10. Other current assets
Other current assets at December 31, 2016 amounted to Euro 3,465 thousand and principally concern receivables from subsidiaries for Group VAT, prepayments for costs incurred in advance, and deposits; the decrease of Euro 14,213 thousand compared to the previous year is due to the reduction in the receivable from the subsidiaries due to the offsetting during the year.
Again in 2016 a number of Group companies renewed the tax consolidation, transferring their VAT settlement debit/credit balances to the consolidating Maire Tecnimont S.p.A..
42.11. Cash and cash equivalents
(in Euro thousands) 31/12/15 Changes in the year
31/12/16
Bank and postal deposits 297 (6) 291
Cash in hand and similar 6 0 6
Total 303 (5) 298
Cash and cash equivalents at December 31, 2016 amounted to Euro 298 thousand.
Operating cash flow generated Euro 32,869 thousand, improving on 2015 which reported an absorption of Euro 27,244 thousand. Operating cash flow in addition to the result for the year, was positively impacted by changes in working capital.
Investing activity on the other hand absorbed cash for Euro 10,830 thousand, mainly due to the acquisition of the investment in Met Gas Processing Technologies S.p.A. and the subsequent share capital increase, preliminary to the acquisition of the investment in Siluria Technologies; the remaining absorption of cash relates to costs for the implementation of software and other applications.
( in Euro thousands) 31/12/15 Changes in the year
31/12/16
Other receivables - within 12 months 14,862 (11,562) 3,300
Commercial prepayments 2,816 (2,651) 165
Total 17,678 (14,213) 3,465

Maire Tecnimont S.p.A.
204
Financing activities also absorbed cash for Euro 22,044 thousand, principally due to the payment of the dividend approved by the Ordinary Shareholders’ Meeting of April 27, 2016 amounting to Euro 14,360 thousand, expense interest paid mainly on the convertible bond and repayment of the loans.
The estimate of the “fair value” of bank and postal deposits at December 31, 2016 approximates their book value.
42.12. Shareholders’ Equity
SHAREHOLDERS’ EQUITY
Shareholders’ Equity at December 31, 2016 was Euro 415,684 thousand, a decrease on the previous year of Euro 788 thousand.
SHARE CAPITAL
The Share Capital of Euro 19,690 thousand comprises 305,527,500 shares.
SHARE PREMIUM RESERVE
The reserve comprises for Euro 25,000 thousand the share premium prior to November 26, 2007 and for Euro 58,045 thousand the share premium on the capital increase of 2007 net of the listing costs amounting to Euro 3,971 thousand, net of the tax effect.
The change in 2013 was Euro 141,653 thousand, comprising the share premium paid by the shareholder Ardeco and the other shareholders amounting to Euro 146,417 thousand, offset for Euro 4,764 thousand for share capital increase charges net of the tax effect.
The share premium reserve may be utilized for share capital increases without consideration and/or for the coverage of losses. In accordance with Article 2431 of the Civil Code, this reserve may be distributed to the shareholders following a Shareholders’ Meeting motion.
OTHER RESERVES
The other reserves at December 31, 2016 amount to Euro 163,518 thousand and comprise:
• Statutory reserves, which at December 31, 2016 amounted to Euro 140,432 thousand, and did not change in the year.
• Legal Reserve which at December 31, 2016 amounts to Euro 5,328 thousand;
• Other reserves acquisition shares - IFRS 2 at December 31, 2016 amounted to Euro 4,066 thousand.
• Other reserves of Euro 6,731 thousand, comprising Euro 6,376 thousand of income from the sale of treasury shares in May 2010 and Euro 355 thousand from the sale of option rights following the share capital increase of July 2013.
• “Equity” component reserve of the Euro 80 million equity linked convertible bond issued in February 2014 amounting to Euro 6,960 thousand. This concerns the conversion option into shares of the convertible bond, and for the accounting of which reference should be made to the “Other non-current financial liabilities” paragraph in these Explanatory Notes.

205
VALUATION RESERVE
The valuation reserve at December 31, 2016 was negative for Euro 45 thousand and comprised the actuarial gains and losses reserve for IAS 19 valuations. The changes compared to the previous year are shown below:
(in Euro thousands) Actuarial gains/(loss)
Total
Net book value at December 31, 2015 (19) (19)
Actuarial gain/(losses) (36) (36)
Relative tax effect 10 10
Net book value at December 31, 2016 (45) (45)
RETAINED EARNINGS/(ACCUMULATED LOSSES)
This amounts to Euro 1,709 thousand following the Shareholders’ Meeting decision to carry forward the 2015 profit.
In relation to the equity reserves the following is noted:
AVAILABILITY OF RESERVES FOR DISTRIBUTION
(in Euro thousands) 2016 Possibility of use
Quota available
Share capita l 19,690 -
Share premium reserve 224,698 A,B,C 224,698
Legal reserve 5,328 B -
Extraordinary reserve 140,432 A,B,C 140,432
Other reserves - Ifrs 2 (*) 4,066 B -
Other reserves 17,713 A,B,C 6,731
Reta ined earnings/(accumulated losses) (1,709) -
Key:
A: for share capital increase
B: to cover losses
C: for distribution to shareholders
Note: (*) In accordance with Article 6, paragraph 5 of Legis lative Decree No. 38 of 2005 these reserves are only available to cover losses with prior utilization of the profit reserves available and the lega l reserve. In this case the above-mention reserves must be reintegrated covering the retained earnings.

Maire Tecnimont S.p.A.
206
SUMMARY OF UTILIZATIONS IN LAST 3 YEARS
(in Euro thousands) Cover losses
Distribution Transfer to other
reserves
Other
Share capita l
Share premium reserve
Lega l reserve
Extraordinary reserve
Other reserves
42.13. Financial payables - non-current portion
The account balance is zero as the two loans with Intesa San Paolo will be fully repaid during 2017 and consequently reclassified to short-term.
42.14. Provisions for risks and charges - beyond 12 months
The provisions for risks and charges beyond twelve months increased Euro 5,580 thousand on the previous year. These principally comprise provisions for estimated costs related to personnel remuneration and incentive policies. For further information, reference should be made to Note 41.5.
42.15. Post employ. & other employee benefits
The company has a liability to all employees of the Italian companies of the statutory TFR (Post-employment benefit) provision, similar to defined benefit plans.
In accordance with IAS 19 (Employee benefits), the company estimated, with the support of an actuary, the liability for defined benefit plans at December 31, 2016. The changes in this liability in 2016 are shown below:
( in Euro thousands) 31/12/15 Changes in the year
31/12/16
Bank payables beyond 12 months 2,929 (2,929) 0
Total 2,929 (2,929) 0
( in Euro thousands) 31/12/15 Changes in the year
31/12/16
Provisions for risks and charges - beyond 12 months 5,831 5,580 11,411
Total 5,831 5,580 11,411

207
Financial charges on obligations assumed are recognized in the Income Statement under financial expenses - other charges. Actuarial gains and losses and recognized in a specific valuation reserve under Equity.
In particular, the assumptions adopted in the valuation of the Post-employment benefit provision relate to:
• First assumption: it was decided to adopt a rate of 1.2% for the year 2017 and a rate of 1.5% for subsequent years, as the average inflation taken from the “2016 Economic and Finance Document” and subsequent Updates.
• Salary increases: in line with that carried out for the demographic technical parameters, new salary lines were constructed for the companies which do not deposit Post-Employment Benefits to the INPS Treasury Fund. In agreement with management, a salary growth rate of 4% annually was assumed for all employees, including inflation. • Discount rate: determined with reference to bond market rates of primary companies at the valuation date, and therefore utilizing the “Composite” interest rate of the curve of corporate issuers with “Investment Grade” AA ratings in the Eurozone (source: Bloomberg) at December 31, 2016.
• Workforce reference: for the internal workforce subject to analysis of Maire Tecnimont S.p.A., the average age and length of service were respectively 46.2 and 12.7 years.
In relation to the liabilities at December 31, 2016, a change of +0.5% in the discount rate applied to the calculation would produce a positive effect equal to Euro 15 thousand and in the same manner a change of -0.5% would produce a negative effect of Euro 16 thousand. A change of +0.5% in the inflation rate applied to the calculation would produce a negative effect of Euro 10 thousand and in the same manner a change of -0.5% would produce a positive effect of Euro 10 thousand. A change of +0.5% in the salaries applied to the calculation would produce a positive effect of Euro 4 thousand and in the same manner a change of -0.5% would produce a negative effect of Euro 4 thousand.
Post-employment benefit provision Total
Balance at December 31, 2015 430 430
+ costs relating to current employee services 0 0
+ net actuarial losses/(profits) 34 34
+ financial charges on obligations undertaken 0 0
+ other changes (2) (2)
- utilizations (30) (30)
Balance at December 31, 2016 432 432
( in Euro )

Maire Tecnimont S.p.A.
208
42.16. Other non-current financial liabilities
Other non-current financial assets were Euro 419,763 thousand and concern for Euro 344,646 thousand payables to subsidiaries for inter-company loans, in particular payables to KT-Kinetics Technology S.p.A for Euro 25,113 thousand, to Tecnimont S.p.A. for Euro 314,768 thousand, to Tecnimont Russia for Euro 2,000 thousand, to Tecnimont Planung und Industrieanlagenbau GmbH for Euro 2,200 thousand, to Maire Engineering France S.A. for Euro 665 thousand and to Stamicarbon B.V for Euro 400 thousand. These loans were principally received in order to grant loans to other Group companies requiring liquidity for ordinary operating activities, as well as for the working capital management of Maire Tecnimont S.p.A.. The balance takes account also of the effect of Tecnimont S.p.A. inter-company payables assumed as part of the wider recapitalization of the company through the subsequent waiver by Maire Tecnimont S.p.A. of the relative receivables in 2013. All loans are interest-bearing at market rates and maturity is scheduled beyond the subsequent year. Subsequent to initial recognition, the payables are measured under the amortized cost method, utilizing the effective interest rate method. Other non-current financial liabilities includes for Euro 75,117 thousand the financial component of the equity linked bond, net of accessory charges. The equity component of the instrument was classified to “other reserves” of shareholders’ equity.
In this regard, we report the following:
On February 20, 2014, the Parent Company Maire Tecnimont S.p.A. completed an equity-linked bond operation amounting to Euro 80 million, placed with qualified Italian and foreign investors.
The initial conversion price of the Bond was fixed at 2.1898; the Bonds were issued at a unitary nominal value of Euro 100,000, with 5 year duration and a fixed annual coupon of 5.75%, payable half-yearly in arrears. Where the Bonds were not previously converted, surrendered, acquired or cancelled, they would be reimbursed at the par value on February 20, 2019.
Subsequently, on May 3, 2016 following the Ordinary Shareholders’ Meeting of April 27, 2016 concerning the distribution of a dividend per share of Euro 0.047, Maire Tecnimont communicated to have sent to the Bondholders a Notice on the same date through Euroclear and Clearstream Luxembourg. The Notice stated that the Calculation Agent determined, following the payment of the dividend, the change in the conversion price of the Bonds from Euro 2.1898 to Euro 2.1509, in accordance with conditions 6 (b) (iii) and 6 (f), at the effective date of May 2, 2016 (first trading date of the ordinary shares ex dividend on the Milan Stock Exchange).
From March 7, 2018, Maire Tecnimont would have the right to settle each conversion through payment in cash for an amount up to the nominal value of the Bonds and deliver a number of shares calculated in accordance with the method outlined in the Regulation (the “Net Share Settlement Election”). In addition, at the maturity date of the Bonds, the Company would
( in Euro thousands) 31/12/15 Changes in the year
31/12/16
Payable to subsidiaries 321,979 22,667 344,646
Payables to other lenders 73,113 2,004 75,117
Total 395,092 24,671 419,763

209
have had the right to deliver a combination of shares and cash, instead of converting the Bonds exclusively for cash, in accordance with the procedures outlined in the Regulation.
On July 9, 2014, the Board of Directors of the Company approved the Revised Budget for the year 2014 and updated the 2013-2019 Group Industrial Plan, as well as all the forecasts contained therein with particular reference to the exercise relating to the settlement of the convertible bond.
Also based on these forecasts and after a detailed review by the Board of Directors of the figures approved, the Board (exercising their prerogative and the rights assigned to them under the recently issued bond regulation and after their initial evaluations at the board meeting of May 14, 2014 reviewing the quarterly results) confirmed their decision not to proceed, taking into account these assumptions and renouncing, where possible, exercise of the residual net share settlement election in accordance with the terms of the loan and instead opted, for the time being and in accordance with that outlined above, for the settlement only in shares in relation to the bond loan.
In accordance with IAS 32 “Financial Instruments: Presentation in the financial statements” convertible bonds are recorded as hybrid financial instruments, formed by two components which are treated separately only if significant: a liability and a conversion option. The liability corresponds to the present value of the future cash flows based on the current interest rate at the issue date for an equivalent non-convertible bond. The value of the option is defined as the difference between the net amount received and the amount of the liability and is recorded under equity. The value of the conversion option in shares does not change in subsequent periods. On the contrary, where the characteristics of the bond result in, on the exercise of the conversion right, the right of the company to deliver shares, pay the amount in cash or offer a combination of shares and cash, the option is recognized as a financial liability for the incorporated host, measured at fair value through P&L, while the difference compared to the original nominal value or rather the financial liability (host) is recorded at amortized cost.
As illustrated above, in consideration of the irrevocable waiver of the Net Share Settlement Election by the Company, the option is (de facto) “cancelled” in substance. Therefore, in theory, where there is a proposal to pay cash in accordance with the option, the bondholders may expect satisfaction through the delivery of shares. This waiver, resulting in the maintenance of a fixed ratio of conversion in shares over the duration of the bond, identifies a hybrid financial instrument whose accounting method is illustrated above.
42.17. Short-term financial payables
The short-term financial payables amount to Euro 4,702 thousand decreasing Euro 2,783 thousand compared to December 31, 2015; this decrease is mainly due to the repayment of loans. The short-term portion of financial payables for Euro 2,924 thousand relates to the current portion of the loans with Intesa San Paolo, which will be fully repaid during the next year; for the residual part they relate to deferred income on loans, Bond Convertible matured and not yet settled.
( in Euro thousands) 31/12/15 Changes in the year
31/12/16
Bank payables 7,485 (2,783) 4,702
Total 7,485 (2,783) 4,702

Maire Tecnimont S.p.A.
210
The estimate of the “fair value” of these financial instruments substantially approximated their book value.
42.18. Tax payables
Tax payables amount to Euro 3,954 thousand and refer for Euro 600 thousand to employee withholding taxes and Euro 3,354 thousand to IRES corporation tax from the National tax consolidation net of the receivable from prior years of Euro 2,184 thousand.
At December 31, 2016, no overdue debt positions are highlighted.
Tax payables are shown in the table below:
(in Euro thousands)
2015 2016
Current income tax payables - Ires/Irap 0 3.354
Substitute taxes payable 594 600
Total 594 3.954
42.19. Trade payables
This account amounts to Euro 27,400 thousand and increased on the previous year Euro 7,623 thousand.
Payables to suppliers of Euro 3,914 thousand concern trade payables for ordinary operations. Payables to subsidiaries amount to Euro 23,296 thousand. increasing on the previous year and relate to interest expense on loans received from subsidiaries, in particular, Tecnimont S.p.A and other services received; in particular Maire Tecnimont structurally benefitted from services provided, including the availability of office spaces, in addition to the provision of other related services (general services, facilities, security, equipment) and other AFC services and personnel management.
( in Euro thousands) 31/12/15 Changes in the year
31/12/16
Tax Payables 594 3,359 3,954
Total 594 3,359 3,954
( in Euro thousands) 31/12/15 Changes in the year
31/12/16
Suppliers - beyond 12 months 5,864 (1,950) 3,914
Subsidiaries - within 12 months 13,744 9,552 23,296
Parent companies - within 12 months 169 22 190
Total 19,777 7,623 27,400

211
Payables to parent companies for Euro 190 thousand relate to the payable to G.L.V. S.p.A. for rent and use of brands.
42.20. Other current liabilities
Other current liabilities at December 31, 2016 amount to Euro 4,553 thousand, reducing Euro 3,561 thousand on December 31, 2015. The account concerns Social Security Institution payables, those matured by personnel and other various payables. Other payables for Euro 3,018 thousand concern payables to subsidiaries for Group VAT. Again in 2016 a number of Group companies renewed the tax consolidation, transferring their VAT settlement credit balances to the consolidating Maire Tecnimont S.p.A..
At December 31, 2016, no overdue debt positions are highlighted.
( in Euro thousands) 31/12/15 Changes in the year
31/12/16
Payables to social security institutions 708 87 795
Matured by personnel, not yet settled 574 166 740
Other payables 6,832 (3,814) 3,018
Total 8,114 (3,561) 4,553

Maire Tecnimont S.p.A.
212
43. Commitments and contingent liabilities
Maire Tecnimont S.p.A financial guarantees at December 31, 2016 and December 2015 were as follows:
( in Euro thousands) 2016 2015
Guarantees granted in the interest of the company
Sureties issued by third parties in favor of third parties 113,726 86,065
Total guarantees 113,726 86,065
Sureties issued in favor of third parties concern those in favor of the Lazio and Lombardy Regional Tax Agency and Provincial Section II of the Rome Large Contributions Office for Repayments and Offsets for Group VAT and Tecnimont S.p.A. Disputes.
(in Euro thousands) 2016 2015
“Parent company guarantees” “ in the interest of subsidiaries 13,317,669 12,361,498
of which:
Performance Bond 10,026,547 9,831,943
Others 3,291,122 2,529,555
Other commitments of Euro 13,317,669 thousand concern “Parent Company Guarantees” issued in favor of clients of Subsidiaries, in relation to commitments undertaken in the execution of core operations and therefore orders undertaken.
These commitments, which involve the undertaking of an obligation to complete, guarantee contracts whose total value amounts includes works already executed and the residual backlog at December 31, 2016. The increase in the year relates to the Parent Company Guarantees issued for new orders, principally LIWA PLASTIC, ZHOR DEVELOPMENT and PETRORABIGH net of releases in the year.
“Other Unsecured Guarantees” residually concern other guarantees (letters of Patronage) in favor of banks in the interest of some subsidiaries, principally Tecnimont S.p.A.. and KT Kinetics Tecnology SpA..

213
44. Related party transactions
In view of the transactions carried out by Maire Tecnimont in 2016, related parties principally concern:
• group and related parties (Tecnimont S.p.A., KT-Kinetics Technology S.p.A., Tecnimont Civil Construction S.p.A., M.S.T S.r.l., Met Newen S.p.A., Stamicarbon B.V., MET Gas Processing Technologies S.p.A., Corace S.c.a r.l., Cefalù S.c.a.r.l.; TCM do Brasil, TCM Russia, TPI and M.E France);
• the holding companies G.L.V. Capital S.p.A. and Elfa Investimenti S.r.l. Specifically, payable contracts refer to the lease of office buildings used by the company, in particular the offices in Piazza Flamingo (Rome), the use of the “Maire” trademark and other minor recharges (transactions with GLV Capital S.p.A.); the transactions with Elfa Investimenti S.r.l. relate to costs for rental of the premises at via di Vanning (Rome) in relation to the partnership agreement with the Sapienza University. Maire Tecnimont structurally benefitted from services provided by Tecnimont S.p.A, specifically the availability of office spaces, in addition to the provision of other related services (general services, facilities, security, equipment) and other AFC services from the subsidiary KT. The balance takes account also of the effect of Tecnimont S.p.A. inter-company payables assumed as part of the wider recapitalization of the company through the subsequent waiver by Maire Tecnimont S.p.A. of the relative receivables in 2013 (TCM France, TCM Russia, TPI and M.E. France).
The loan contract payables refer to loans received (Tecnimont S.p.A., KT S.P.A., Stamicarbon B.V), in addition to the financial payables balance, again in this case taking account also of the effect of the assumption of Tecnimont S.p.A. inter-company financial payables in 2013 (TCM Russia, TPI and M.E. Russia). All loans are interest-bearing at market rates.
Commercial contract receivables principally concern services provided by Maire Tecnimont S.p.A. in favor of the subsidiaries (Tecnimont S.p.A., KT-Kinetics Technology S.p.A. Tecnimont Civil Construction S.p.A., Met Newen S.p.A.), the administrative/tax/legal service (Tecnimont S.p.A., Met Newen S.p.A., MET Gas Processing Technologies S.p.A) and the recharge of a number of costs incurred on behalf of the subsidiaries.
Financial contract receivables concern the loans granted to the subsidiaries (Tecnimont Civil Construction S.p.A. TCM do Brasil,) for management of their operating activities. All loans are interest-bearing at market rates.
The residual balances are payables arising under the tax consolidation agreement (Tecnimont S.p.A., Met Newen S.p.A., KT-Kinetics Technology S.p.A., Tecnimont Civil Construction S.p.A., MET Gas Processing Technologies S.p.A., M.S.T S.r.l.), and payables and receivables arising following the VAT consolidation (M.S.T S.r.l., Tecnimont Civil Contruction S.p.A., Tecnimont S.p.A., MET Gas Processing Technologies S.p.A., Corace S.c.a r.l, Cefalù S.c.a r.l).
All related party transactions have been conducted at market conditions.
The Company’s receivables/payables and cost/revenue transactions with related parties for the year are presented in the tables below.

Maire Tecnimont S.p.A.
214
( in Euro thousands) 31/12/2016
T rade Receivables
T rade Payabl es T rade Payables to
assume
Finan cial Receivables
F inancial Payab les
F inancial Payabl es to
assume
Receivables (Payables) for VAT con sol .
Receivables (Payables) for tax
consol.
Commerci al Revenu es
Commercial Costs
Fin ancial I ncome
Financial Charges
Tecnimont S.p.A. 9,204 -19,863 -314,768 -2,909 22,582 26,446 -3,689 -8,266
KT S.p.A. 5,649 -265 -13,395 -11,718 15,756 5,155 -437 -895
Tecnimont Civil Contruction S.p.A. 12,635 45,119 58 -15,935 1,114 1,087
Met Newen S.p.A. 200 11 (656) 32
Stamicarbon B.V. 7,029 -47 -400 29 -47
Met Gas Processing Technology S.p.A. 1 -66 -192 5 -44
G.L.V Capital S.p.A.(*) -190 -426
Elfa Investimenti S.r.l -12
MST S.r.l. 14 -135 292 335 23 -120
TCM Russia 3 -26 -2,000 4 -58
TPI 1 -611 -1,635 -2,200 4 -175
ME France -24 -12 -165 -5
MET T&S LIMITED 259 7
Corace S.c.a.r.l. -17
Cefalù S.c.a.r.l. 2,618
Tecnimont Private Limited 41 42
TCM Do Brasil 3 490 3
Tecnimont Cile 3 3
TCM FR -678
TCM Poland
Tecnimont México3 3
Tecnimont USA Inc. 3 3
Tecnimont Arabia Ltd 3 3
TecnimontHQC Sdn. Bhd. 3 3
Noy Engineering S.r.l., cancelled on 30.12.2016 4
Biolevano S.r.l. 8
Total 35,062 -21,161 -2,325 45,609 -328,563 -16,083 -13 21, 890 32,883 -4,684 1,087 -9,490

215
45. Financial risk management
For more complete disclosure on financial risks, reference should be made to the “FINANCIAL RISKS” section of the Explanatory Notes of the Consolidated Financial Statements of the Maire Tecnimont Group.
Maire Tecnimont S.p.A`s ordinary operations are exposed to financial risks. Specifically:
• Credit risk, both in relation to normal commercial transactions with clients and financial activities;
• Liquidity risk, concerning difficulties in liquidating positions held within necessary timeframes or in sourcing operating funding;
• Market risk, relating to fluctuations in interest rates for financial instruments which generate interest;
• Default and debt covenant risk regarding the possibility that loan contracts include clauses permitting the lending Banks to request immediate repayment on the occurrence of certain events, resulting therefore in a liquidity risk.
Maire Tecnimont S.p.A constantly controls financial risks, anticipating potential negative impacts and undertaking appropriate corrective actions.
The following section provides qualitative and quantitative information on the impact of these risks on Maire Tecnimont S.p.A. The following quantitative data may not be used for forecasting purposes, as market risks may not reflect the complexity and the related market reactions from any change in assumptions.
IFRS 7 requires that the classification of financial instruments measured at fair value is determined based on the quality of the input sources used in the measurement of the fair value (level 1, 2 and 3); the financial statements of Maire Tecnimont S.p.A. includes financial instruments measured at fair value.
CREDIT RISK
Maire Tecnimont credit risk represents the exposure to potential losses following the non-fulfilment of obligations by counterparties. Credit risk stems from normal operations and is monitored by the operating and financial departments on the basis of set procedures, which establish the methods for quantifying and controlling client risk.
They are managed according to procedures, including credit recovery and dispute management.
The maximum theoretical exposure to the credit risk for the Company at December 31, 2016 is the carrying value of the financial assets recorded in the accounts, and the nominal value of the guarantees given on debts and commitments to third parties.
At December 31, 2016, Trade receivables within and beyond 12 months respectively were Euro 58,302 thousand and Euro 1,100 thousand. A summary of the trade receivables and the relative doubtful debt provisions is reported below:

Maire Tecnimont S.p.A.
216
Receivables by expiry date
(in Euro thousands) Overdue at 31/12/2016
Not overdue
Up to 365 days
From 365 to 731 days
Over 731 days
Total
TRADE RECEIVABLES 432 48,096 2,854 6,920 58,302
OTHER NON-CURRENT ASSETS 0 0 0 1,100 1,100
Total trade receivables 432 48,096 2,854 8,020 59,402
Of which:
Within 12 months (Note 42.6, 42.4)
58,302
1,100
(in Euro thousands) Overdue at 31/12/2015
Not overdue
Up to 365 days
From 365 to 731 days
Over 731 days
Total
TRADE RECEIVABLES 9,220 19,188 5,173 157 33,738
OTHER NON-CURRENT ASSETS 0 0 0 1,100 1,100
Total trade receivables 9,220 19,188 5,173 1,257 34,838
Of which:
Within 12 months (Note 42.6, 42.4)
33,738
1,100
Other non-current assets overdue more than 731 days concern disputed receivables from clients due beyond 12 months and specifically from the Calabria Region for Euro 1,100 thousand. With regards to this receivable, the arbitral award accepted most of the company’s demands. The counterparty has proposed an appeal against the arbitral award and in 2013 the Catanzaro Court of Appeal nullified the award on the basis only of formal errors; the company therefore decided to challenge the judgement filed on May 6, 2013 and to appeal to the Cassation Court. The appeal was accepted with notification of 20/6/14; the Calabria Region did not make a counter appeal and the hearing date for discussion and subsequent decision is awaited. The above amount is currently considered recoverable on the basis of the strong grounds previously expressed in the arbitral award.
The trade receivables are from subsidiaries and therefore they are all considered recoverable.
LIQUIDITY RISK
This risk concerns the difficulty in sourcing new funding or access to liquid assets, resulting in the enterprise’s failure to satisfy payment commitments, being forced to incur additional funding costs or, in extreme instances, being faced with potential insolvency which may put its going concern at risk.

217
At the present moment, Maire Tecnimont considers that the good levels of liquidity held and prudent and functional management of the credit lines available are important elements for stability and sufficient to guarantee the resources necessary for operating continuity.
Cash and cash equivalents at December 31, 2016 of Maire Tecnimont S.p.A. amounts to Euro 298 thousand substantially in line with December 31, 2015 which was Euro 303 thousand; however the cash and cash equivalent at December 31, 2016 of the Maire Tecnimont Group of Euro 497,138 thousand increased Euro 134,753 thousand on December 31, 2015; cash flows generated from operating activities totaled Euro 162,107 thousand deriving from, in addition to the result for the year, positive changes in working capital.
31/12/2016
(in Euro thousands)
Due within 1 year
Due between 2 & 5 years
Due beyond 5
years
Total
Bank payables 4,702 0 0 4,702
Other intercompany lenders 0 344,646 0 344,646
Other lenders 0 75,117 0 75,117
Total financial liabilities (current and non-current)
4,702 419,763 0 424,465
31/12/2015
(in Euro thousands)
Due within 1 year
Due between 2 & 5 years
Due beyond 5
years
Total
Bank payables 7,485 2,929 0 10,414
Other intercompany lenders 0 321,979 0 321,979
Other lenders 0 73,113 0 73,113
Total financial liabilities (current and non-current)
7,485 398,021 0 405,506
They relate to cash flows not discounted and therefore may differ from the amount in the accounts.
Non-current financial liabilities amount to Euro 344,646 thousand and concern payables to subsidiaries for inter-company loans; the distribution of maturities was based on the residual contractual duration and the initial date on which payment may be requested. Other financial liabilities include the financial component of the equity linked bond, net of accessory charges. The equity component of the instrument was classified to “other reserves” of shareholders’ equity. At the date of the present financial report and based on the value of the underlying share and the strike price of the instrument, the potential conversion was “in the money”.
MARKET RISKS
CURRENCY RISK
The Company is theoretically exposed to risks deriving from changes in the exchange rate although the amount of financial assets and liabilities in currencies other than the Euro which may impact the income statement or value of the net equity are minimal.

Maire Tecnimont S.p.A.
218
INTEREST RATE RISK
The Company is exposed to interest rate risk in relation to debt service costs.
The residual risk on the variable rate debt is in part mitigated by the fact that Group cash deposits are remunerated at interest rates indexed to the same debt parameter (Euribor).
DEFAULT AND DEBT COVENANT RISK
This concerns the possibility that loan contracts include clauses permitting the lending Banks to request immediate repayment on the occurrence of certain events, resulting therefore in a liquidity risk.
The loan issued on December 28, 2015 for Euro 350 million to the subsidiary Tecnimont is subject to covenants based on market practice, calculated on the Consolidated Financial Statements of the Maire Tecnimont Group. Specifically, the financial covenants of the loan concern the ratio between the net financial position and net equity, as well as between the net financial position and EBITDA.
Maire Tecnimont is currently not aware of any default situations regarding the above-mentioned covenants.
DERIVATIVE INSTRUMENTS AND HEDGE ACCOUNTING
The company utilizes derivative instruments to hedge against movements in the Maire Tecnimont share price, in view of the implementation of a buy-back program.
Maire Tecnimont S.p.A therefore subscribed to two cash-settled Total Return Equity Swap (TRES) derivative instruments, undertaken to hedge against movements in the Maire Tecnimont share price.
The TRES derivative instruments are not considered as hedge instruments for hedge accounting purposes and therefore are measured in accordance with IAS 39 as a fair value derivative through P&L.
Fair value calculation
The fair value of financial instruments is represented by the current market price or, in their absence the application of appropriate financial valuation models which take into consideration all the factors adopted by market operators and the prices obtained in a real market transaction.
In particular, the fair value of the interest rate swaps is measured discounting the expected cash flows, while the fair value of currency forward contracts is determined on the basis of the forward exchange rate at the reference date and the differential rates between the currencies.
IFRS 7 requires that the classification of financial instruments valued at fair value is determined based on the quality of the input sources used in the valuation of the fair value. The IFRS 7 classification implies the following hierarchy:
• Level 1: fair value calculation according to active market prices. Group instruments do not fall within this category;
• Level 2: fair value measurement according to market prices or similar assets or through measurement techniques for which all significant factors are directly or indirectly based on observable market data. Group instruments fall within this category.

219
• Level 3: fair value measurement according to valuation models whose input is not based on observable market data (“unobservable inputs”). Currently, no instruments whose value is based on models with inputs not directly based on observable market data are in place.
For all derivative instruments used by the Company, the fair value is calculated according to measurement techniques based on observable market parameters (“Level 2”).
CLASSIFICATION OF THE FINANCIAL INSTRUMENTS
As required by IFRS 7, we report the type of financial instruments present in the financial statements, with indication of the accounting policies applied.
At 31/12/2016
Loans and Receivables at amortized
cost
Assets at fair value
through P&L held-for-trading
Hedging derivatives
Assets held-to-maturity
Financial assets
available-for-sale
Total (in Euro thousands)
Other non-current assets 1,100 1,100
Other non-current financ ial assets
45,361 45,361
Trade receivables 58,302 58,302
Financial instruments – Derivatives
1.150*
1,150
Other current assets 3,465 3,465
Cash and cash equiva lents 298 298
Total 108,526 1,150 109,676
*“Level 2” of Fair-Value
At 31/12/2015
(in Euro thousands) Loans and
Receivables at amortized cost
Assets at fair value
through P&L held-for-trading
Hedging derivative
s
Assets held-to-maturity
Financial assets
available-for-sale
Total
Other non-current assets 1,100 1,100
Trade receivables 34,054 34,054
Other financ ia l assets 33,738 33,738
Other current assets 17,678 17,678
Cash and cash equiva lents 303 303
Total 86,873 86,873

Maire Tecnimont S.p.A.
220
At 31/12/2016
Liabilities at amortized
cost
Liabilities at fair value through P&L held-for-trading
Hedging derivatives
Total
(in Euro thousands)
Other non-current financ ial liabilities 419,763 419,763
Short-term debt 4,702 4,702
Trade payables 27,400
27,400
Other current liabilities 4,553 4,553
Total 456,418
456,418
At 31/12/2015
(in Euro thousands) Liabilities at amortized
cost
Liabilit ies at fair value through P&L held-for-
trading
Hedging derivatives
Total
Financ ial debt - non-current portion 2,929 2,929
Other non-current financ ia l liabilities 395,092 395,092
Short-term debt 7,485 7,485
Trade payables 19,777 19,777
Other current liabilities 8,114 8,114
Total 433,397 433,397
The book value of financial assets and liabilities substantially coincides with their fair value.
46. Independent Audit Firm fees
The following table, prepared pursuant to Article 149 of the Consob Issuers’ Regulations, reports the payments made in 2016 for services carried out by the audit firm.
Type of service Provider Recipient Fees 2016
(in Euro thousands)
Audit Pricewaterhousecoopers
S.p.A. Maire Tecnimont S.p.A. 199
Certification services (*) Pricewaterhousecoopers
S.p.A. Maire Tecnimont S.p.A. 4
The fees do not include VAT, exp enses and any Consob oversight contribution repayments
(*) Certif ication services include the signing of tax declarations .

221
47. Significant non-recurring events and operations
In 2016, the Company did not execute any significant non-recurring operations in accordance with Consob Communication No. DEM/6064293 of July 28, 2006.
48. Transactions relating to atypical or unusual operations
In accordance with Consob Communication of July 28, 2006 No. DEM/6064293, the Company did not undertake any atypical and/or unusual operations, as defined in the communication.
49. Subsequent events at December 31, 2016
For significant events following year-end, reference should be made to the accompanying Directors’ Report.
Maire Tecnimont S.p.A.
222
50. Statement on the financial statements as per Article 154-bis, paragraph 5 of Legislative Decree No. 58/98 and subsequent amendments and supplements
1. The undersigned Pierroberto Folgiero, as “Chief Executive Officer” and Dario Michelangeli as “Executive for Financial Reporting” of MAIRE TECNIMONT S.p.A. declare, and also in consideration of Article 154-bis, paragraphs 3 and 4, of Legislative Decree No. 58 of February 24, 1998:
• the adequacy in relation to the characteristics of the company and
• the effective application of the administrative and accounting procedures for the compilation of the financial statements at December 31, 2016.
2. In addition, we certify that the financial statements:
• are drawn up in conformity with the applicable international accounting standards recognized by the European Union in accordance with Regulation (CE) No. 1606/2002 of the European Parliament and the Commission of July 19, 2002;
• correspond to the underlying accounting documents and records;
• provide a true and correct representation of the balance sheet, financial situation and result for the year of the Issuer.
3. The Directors’ Report includes a reliable analysis on the performance and operating result, as well as the situation of the issuer, together with a description of the principal risks and uncertainties to which it is exposed.
This statement is provided also in accordance with Article 154-bis, paragraph 2 of Legislative Decree No. 58 of February 24, 1998.
Milan, March 15, 2017
The Chief Executive Officer The Executive for Financial Reporting
Pierroberto Folgiero Dario Michelangeli
223
51. Board of Directors proposal
Dear Shareholders,
we consider that the financial statements of the company have been exhaustively outlined and we trust in your approval of the presentation and policies adopted for the 2016 financial statements and invite you to approve them together with the proposal to allocate the net income of Euro 9,531,489.41 as follows:
• to Shareholders, as dividend for shares in circulation at the coupon date, in the amount
of Euro 0.031 per share, for a total of Euro 9,531,489.41;
• we also propose the partial distribution of the extraordinary reserve for an amount of Euro 18,882,568.09 and thereby resulting in a total dividend distribution of Euro 28,414,057.50, based on Euro 0.093 per share.
The amount of proposed dividend corresponds to one-third of the consolidated net income for 2016. The Board of Directors considers that this amount adequately remunerates shareholders and permits in addition capital strengthening which is indispensable to operate competitively on the international markets.
You are also invited to approve the proposal for the payment of a dividend for each share in circulation at the coupon date of May 2, 2017 (ex date), with payment on May 4, 2017 (payment date). The shareholders of Maire Tecnimont S.p.A. on May 3, 2017 (record date) have the right to receive a dividend.
Milan, March 15, 2017
The Board of Directors
The Chairman

Maire Tecnimont S.p.A.
224
Report of the Board of
Statutory Auditors

225
52. Report of Board of Statutory Auditors

Maire Tecnimont S.p.A.
226

227
Maire Tecnimont S.p.A.
228

229

Maire Tecnimont S.p.A.
230

231

Maire Tecnimont S.p.A.
232

233

Maire Tecnimont S.p.A.
234

235

Maire Tecnimont S.p.A.
236
Report of the
Independent Auditors on
the Consolidated
Financial Statements

237
53. Report of the Independent Auditors on the Consolidated Financial Statements

Maire Tecnimont S.p.A.
238

239

Maire Tecnimont S.p.A.
240
Report of the
Independent Auditors on
the Financial Statements

241
54. Report of the Independent Auditors on the Financial Statements

Maire Tecnimont S.p.A.
242

243