2016 annual report of the lake ontario management unit 17.01.pdf · lake ontario fish communities....
TRANSCRIPT

Lake Ontario Fish Communities and Fisheries:
2016 Annual Report of the Lake Ontario Management Unit

Cover Photos:
(Left) MNRF’s “Ontario Explorer” departing the Toronto Harbour, July 17, 2016
(Right top) “Ontario Explorer” docked at the Glenora Fisheries Station, March 28, 2016
(Right bottom) LOMU field crew trap netting Bay of Quinte Walleye for egg collection activities

LAKE ONTARIO FISH COMMUNITIES AND FISHERIES:
2016 ANNUAL REPORT OF THE LAKE ONTARIO
MANAGEMENT UNIT
Prepared for the Great Lakes Fishery Commission 2017 Lake Committee Meetings
YPSILANTI, MI, USA
March 20-24, 2017
© 2017, Queen’s Printer for Ontario Printed in Picton, Ontario, Canada
March 2017
Report ISSN 1201-8449
Please cite this report as follows:
Ontario Ministry of Natural Resources and Forestry. 2017. Lake Ontario Fish Communities and Fisheries: 2016 Annual Report of the Lake Ontario Management Unit. Ontario Ministry of Natural Resources and Forestry, Picton, Ontario, Canada.
This report is available online at:
http://www.glfc.org/lakecom/loc/mgmt_unit/index.html


TABLE OF CONTENTS Foreword ........................................................................................................................................... v
1. Index Fishing Projects 1.1 Ganaraska Fishway Rainbow Trout Assessment .................................................................. 1
1.2 Lake Ontario and Bay of Quinte Fish Community Index Gill Netting ................................ 4
1.3 Lake Ontario and Bay of Quinte Fish Community Index Trawling ................................... 30
1.4 Lake Ontario Nearshore Community Index Netting .......................................................... 51
1.5 Lake-wide Hydroacoustic Assessment of Prey Fish .......................................................... 62
1.6 St. Lawrence River Fish Community Index Netting—Lake St. Francis ............................ 68
1.7 Credit River Chinook Salmon Spawning Index ................................................................. 71
1.8 Juvenile Atlantic Salmon Parr Survey ................................................................................ 72
1.9 Credit River Atlantic Salmon Smolt Survey ...................................................................... 75
1.10 Juvenile Chinook Production ........................................................................................... 78
1.11 Lake Ontario Spring Prey Fish Trawling ......................................................................... 81
1.12 Lake Ontario Fall Benthic Prey Fish Trawling ................................................................ 85
2. Recreational Fishery 2.1 Fisheries Management Zone 20 Council (FMZ20) / Volunteer Angling Clubs ................. 88
2.2 Western Lake Ontario Boat Angling Fishery ..................................................................... 89
2.3 Lake Ontario Volunteer Angler Diary Program ................................................................. 92
2.4 Bay of Quinte Ice Angling Survey ..................................................................................... 95
2.5 Bay of Quinte Volunteer Walleye Angler Diary Program ................................................. 97
3. Commercial Fishery 3.1 Lake Ontario and St. Lawrence River Commercial Fishing Liaison Committee ............. 101
3.2 Quota and Harvest Summary ............................................................................................ 102
3.3 Lake Whitefish Commercial Catch Sampling .................................................................. 114
4. Age and Growth Summary ........................................................................................ 117
5. Contaminant Monitoring ............................................................................................. 119
6. Stocking Program
6.1 Stocking Summary ........................................................................................................... 121
6.2 Net Pens ............................................................................................................................ 128
7. Stock Status
7.1 Chinook Salmon ............................................................................................................... 130
7.2 Rainbow Trout .................................................................................................................. 134
7.3 Lake Whitefish ................................................................................................................. 136
7.4 Walleye ............................................................................................................................. 139
7.5 Northern Pike .................................................................................................................. 142
7.6 Pelagic Prey fish—Alewife, Smelt ................................................................................... 144
7.7 Benthic Prey fish—Round Goby, Slimy Sculpin, Deepwater Sculpin ............................. 148
8. Species Rehabilitation
8.1 Introduction ...................................................................................................................... 152

8.2 Atlantic Salmon Restoration ............................................................................................ 153
8.3 American Eel Restoration ................................................................................................ 154
8.4 Deepwater Cisco Restoration ........................................................................................... 160
8.5 Lake Trout Restoration ..................................................................................................... 162
8.6 Round Whitefish-Spawning Population Study ................................................................. 167
8.7 Hamilton Harbour Walleye Reintroduction ..................................................................... 168
8.8 Lake Sturgeon .................................................................................................................. 172
9. Research Activities
9.1 Bloater restoration: Using acoustic telemetry to understand post-stocking
behaviour ........................................................................................................................ 174
9.2 Understanding depth and temperature preference of Lake Ontario salmonids
using novel pop-off data storage tags ......................................................................... 176
9.3 An interactive tool for assessing the energetic demand of stocked predators in
Lake Ontario .................................................................................................................. 180
9.4 Comparative Ecology of Juvenile Salmonids in Lake Ontario ............................... 182
9.5 Station 81: Long-term monitoring at the base of Lake Ontario’s food web. ................... 185
9.6 Understanding the vulnerability of the Great Lakes and inland lakes of Ontario to
invasive species spread and establishment ....................................................................... 187
9.7 Development of new fishway counting technology ........................................................ 189
10. Partnerships 10.1 Walleye Spawn Collection ............................................................................................. 191
10.2 Observations of aquatic invasive species in Lake Ontario ............................................. 194
11. Environmental Indicators
11.1 Water Temperature ......................................................................................................... 197
11.2 Wind ............................................................................................................................... 199
11.3 Water Clarity .................................................................................................................. 201
11.4 Tributary Water Flow ..................................................................................................... 202
12. Staff 2016............................................................................................................................. 207
13. Operational Field and Lab Schedule 2016.................................................. 209
14. Publications 2016 .......................................................................................................... 211

Lake Ontario Fish Communities and Fisheries: 2016 Annual Report of the Lake Ontario Management Unit
Foreword
The Lake Ontario Management Unit (LOMU) and the Lake Ontario research staff from the
Applied Research and Monitoring Section are pleased to provide the 2016 Annual Report of monitoring,
assessment, research and management activities.
Lake Ontario fisheries are managed by the Lake Ontario Committee, consisting of the Ontario
Ministry of Natural Resources and Forestry (MNRF) in partnership with New York State, under the
auspices of the Great Lakes Fishery Commission. The Lake Ontario Fish Community Objectives (2013)
provide bi-national fisheries management direction to protect and restore native species and to maintain
sustainable fisheries. Our many partners include: New York State Department of Environmental
Conservation (NYSDEC), Fisheries and Oceans Canada (DFO), the U.S. Fish and Wildlife Service
(USFWS), U.S. Geological Survey (USGS) and many other Ontario provincial ministries and
conservation authorities and U.S. state and federal agencies, universities and non-government partners.
Lake Ontario, Bay of Quinte, and St. Lawrence River ecosystems have changed over the last two
centuries in response to the pressures of industrial development, land settlement and agricultural
practices, fishing, pollution, loss of native species, and the introduction of new species. Long-term
fisheries and aquatic monitoring, assessment and research programs help understand these changes and
support informed management decisions. These decisions need to consider the ecological realities that
shape the fishery, such as the natural capacity of the lake to produce fish, the decline or recovery of
native species, the impact of non-native species, changes to fish habitat, and climate change, along with
social and economic objectives.
Management highlights from 2016 include the development of an Atlantic Salmon Restoration
Program: Five Year Implementation Strategy 2016/2020, the release of Fishing in Your Backyard - An
Urban Recreational Fisheries Strategy for the Lake Ontario Northwest Waterfront and the creation of a
bi-national (Ontario/New York State) stakeholder forum. Management Unit staff participated in several
public events including the Toronto Sportsmen’s Show, Cottage Life Show, Belleville Cops Kids
Fishing and Hamilton Harbour Fun Fishing events. The Management Unit partnered with the Port Credit
Salmon and Trout Association to deliver the second Lake Ontario Salmon Symposium in Port Credit
Ontario. Three public meetings were held in Port Hope, Port Credit and Whitby, as well, Management
Unit staff attended several Angling Club meetings as invited speakers. The MNRF fish culture program
and partners produced and stocked more than 2 million fish into Lake Ontario.
The 2016 Lake Unit assessment program included twelve index fishing programs, four
recreational angler surveys, commercial fishery assessment and the age interpretation of 2,807 fish.
Assessment program additions in 2016 included: expansion of the off-shore large vessel trawling
program to include Alewife, and other pelagic prey fish, monitoring in the spring; and acquisition of a
new video fish counter to assess adult Atlantic Salmon returning to Lake Ontario tributaries. The
assessment program continues to evolve, building on a strong base of long-term monitoring while
developing new tools, techniques and expertise.
v

The Lake Ontario Research Program under Dr. Tim Johnson (Aquatic Monitoring and Research
Section) continues to contribute new knowledge and tools to the Lake Ontario Management Team.
Included in this report is an update on stocked Bloater behavior using acoustic telemetry; a modelling
tool to support fish stocking decisions, research into trout and salmon movement and habitat use using
pop-off data storage tags, and research into juvenile salmonid diets.
We would like to express our sincere appreciation to the many partners and volunteers who
contributed to the successful delivery of LOMU initiatives. Special thanks to: Aurora, Peterborough and
Kemptville MNRF District offices for their ongoing cooperation and collaboration; the Credit Valley
Conservation, Toronto Region Conservation and Ganaraska Region Conservation Authorities for
helping to plan and deliver several key programs; and the Ontario Federation of Anglers and Hunters
and the many other partners committed to the Lake Ontario Atlantic Salmon restoration program. Work
with University of Windsor and Queen’s University is ongoing and should provide unique insight into
Lake Ontario fisheries. LOMU gratefully acknowledges the important contribution of the Lake Ontario
Commercial Fishery Liaison Committee, the Fisheries Management Zone 20 Council (FMZ20)
members, the Ringwood hatchery partnership with the Metro East Anglers, Chinook Net Pen
Committee, Muskies Canada, the Ganaraska River Fishway Volunteers, and the participants in the
angler diary and assessment programs.
Our team of skilled and committed staff and partners delivered an exemplary program of over
forty field, laboratory and analytical projects that will provide long-term benefits to the citizens of
Ontario. We are pleased to share the important information about the activities and findings of the Lake
Ontario Management Unit from 2016.
Andy Todd
Lake Ontario Manager
613-476-3147
For more detailed information or copies of this report please contact:
Lake Ontario Management Unit
Ontario Ministry of Natural Resources and Forestry
R.R. #4, 41 Hatchery Lane
Picton, ON K0K 2T0 CAN
Telephone: (613) 476-2400
FAX: (613) 476-7131
This Annual Report is available online at: http://www.glfc.org/lakecom/loc/mgmt_unit/index.html
vi

Section 1. Index Fishing Projects
The number of Rainbow Trout “running-
up” the Ganaraska River during spring to spawn
has been estimated at the fishway on Corbett
Dam, Port Hope, ON since 1974. Prior to 1987,
the Rainbow Trout counts at the fishway were
based completely on hand lifts and visual counts.
Since 1987, fish counts were made with a Pulsar
Model 550 electronic fish counter. Based on
visual counts the electronic counter is about
85.5% efficient, and the complete size of the run
has been estimated accordingly. In years where no
observations were made, the run was estimated
with virtual population analysis. The counter is
usually operated from mid to late March until
early May. In 2016, the fish counter was installed
on March 11th, 2016 and ran until May 9th, 2016.
In 2016, the Rainbow Trout run in the Ganaraska
River was estimated at 4,987 fish, below the
average for the previous 10 years (7,192 fish on
average from 2006 to 2015). From 2009 to 2013,
the Rainbow Trout run in the Ganaraska River
increased. Since 2013, the Rainbow Trout run in
the Ganaraska River has declined. The total
1
1. Index Fishing Projects
1.1 Ganaraska Fishway Rainbow Trout Assessment
M.J. Yuille, Lake Ontario Management Unit
FIG. 1.1.1. Estimated and observed run of Rainbow Trout at the Ganaraska River fishway at Port Hope, Ontario during spring 1974-2016.
0
5000
10000
15000
20000
Nu
mb
er
of
fis
h
1975
1980
1985
1990
1995
2000
2005
2010
2015
Estimated
Observed
estimated run size from 2016 is down 25% from
2015 and down 59% from the peak in 2013 (Fig.
1.1.1 and Table 1.1.1 ).
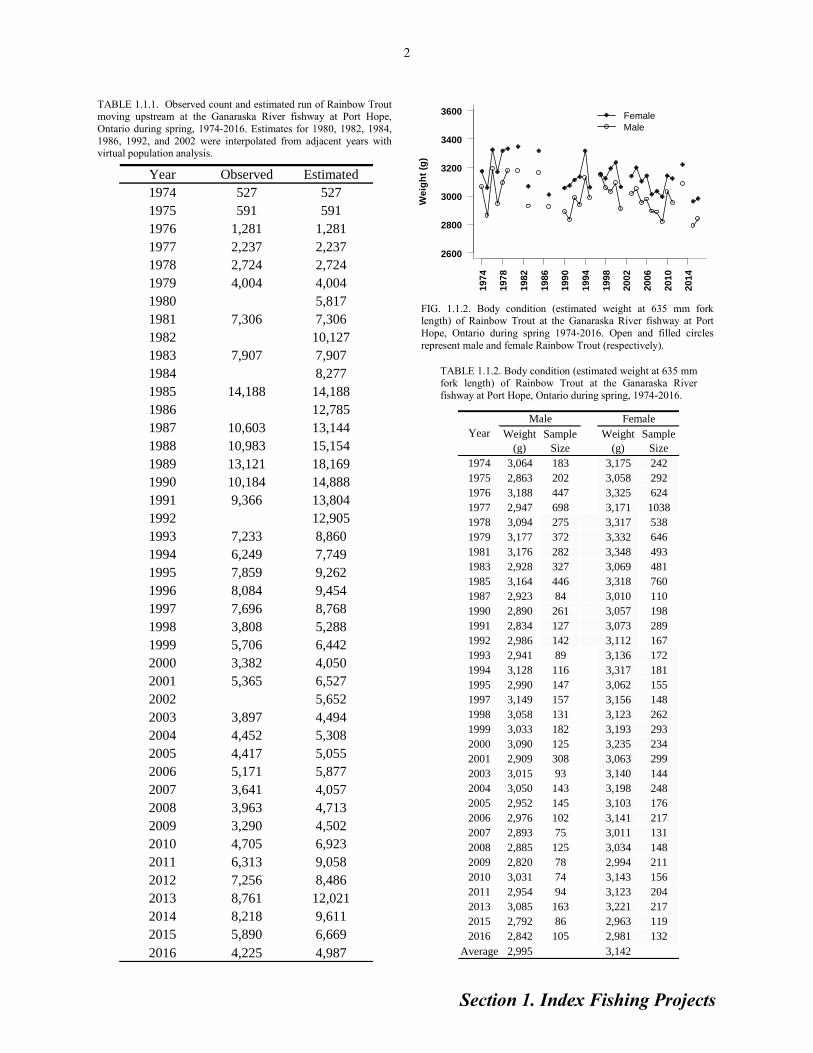
Rainbow Trout were measured and
weighed during the spawning run in most years
since 1974. Rainbow Trout body condition was
determined as the estimated weight of a 635 mm
fork length (25 inch) fish. In 2016, the condition
of male (2,842 g) and female (2,981 g) Rainbow
Trout were slightly higher than in 2015, however,
male and female condition is 3% lower than the
previous 10-year average (Fig 1.1.2 and Table
1.1.2).
The proportion of Rainbow Trout with
Lamprey marks in the Ganaraska River has been
reported since 1974. In 2016, 27% of fish had
Lamprey marks (wound or scar), representing a
7% increase from 2015 (Fig. 1.1.3). Despite this
recent increase, lamprey wounds on Ganaraska
River Rainbow Trout in 2016 is below the
previous 10 year average (38%; Table 1.1.3).
Section 1. Index Fishing Projects
2
TABLE 1.1.1. Observed count and estimated run of Rainbow Trout
moving upstream at the Ganaraska River fishway at Port Hope,
Ontario during spring, 1974-2016. Estimates for 1980, 1982, 1984,
1986, 1992, and 2002 were interpolated from adjacent years with virtual population analysis.
FIG. 1.1.2. Body condition (estimated weight at 635 mm fork length) of Rainbow Trout at the Ganaraska River fishway at Port
Hope, Ontario during spring 1974-2016. Open and filled circles
represent male and female Rainbow Trout (respectively).
2600
2800
3000
3200
3400
3600
We
igh
t (g
)
1974
1978
1982
1986
1990
1994
1998
2002
2006
2010
2014
Female
Male
Year Observed Estimated
1974 527 527
1975 591 591
1976 1,281 1,281
1977 2,237 2,237
1978 2,724 2,724
1979 4,004 4,004
1980 5,817
1981 7,306 7,306
1982 10,127
1983 7,907 7,907
1984 8,277
1985 14,188 14,188
1986 12,785
1987 10,603 13,144
1988 10,983 15,154
1989 13,121 18,169
1990 10,184 14,888
1991 9,366 13,804
1992 12,905
1993 7,233 8,860
1994 6,249 7,749
1995 7,859 9,262
1996 8,084 9,454
1997 7,696 8,768
1998 3,808 5,288
1999 5,706 6,442
2000 3,382 4,050
2001 5,365 6,527
2002 5,652
2003 3,897 4,494
2004 4,452 5,308
2005 4,417 5,055
2006 5,171 5,877
2007 3,641 4,057
2008 3,963 4,713
2009 3,290 4,502
2010 4,705 6,923
2011 6,313 9,058
2012 7,256 8,486
2013 8,761 12,021
2014 8,218 9,611
2015 5,890 6,669
2016 4,225 4,987
Weight
(g)
Sample
Size
Weight
(g)
Sample
Size
1974 3,064 183 3,175 242
1975 2,863 202 3,058 292
1976 3,188 447 3,325 624
1977 2,947 698 3,171 1038
1978 3,094 275 3,317 538
1979 3,177 372 3,332 646
1981 3,176 282 3,348 493
1983 2,928 327 3,069 481
1985 3,164 446 3,318 760
1987 2,923 84 3,010 110
1990 2,890 261 3,057 198
1991 2,834 127 3,073 289
1992 2,986 142 3,112 167
1993 2,941 89 3,136 172
1994 3,128 116 3,317 181
1995 2,990 147 3,062 155
1997 3,149 157 3,156 148
1998 3,058 131 3,123 262
1999 3,033 182 3,193 293
2000 3,090 125 3,235 234
2001 2,909 308 3,063 299
2003 3,015 93 3,140 144
2004 3,050 143 3,198 248
2005 2,952 145 3,103 176
2006 2,976 102 3,141 217
2007 2,893 75 3,011 131
2008 2,885 125 3,034 148
2009 2,820 78 2,994 211
2010 3,031 74 3,143 156
2011 2,954 94 3,123 204
2013 3,085 163 3,221 217
2015 2,792 86 2,963 119
2016 2,842 105 2,981 132
Average 2,995 3,142
Male Female
Year
TABLE 1.1.2. Body condition (estimated weight at 635 mm fork length) of Rainbow Trout at the Ganaraska River
fishway at Port Hope, Ontario during spring, 1974-2016.

Section 1. Index Fishing Projects
3
TABLE 1.1.3. Lamprey marks on Rainbow Trout in spring 1974-2016, at the Ganaraska River fishway, at Port Hope, Ontario. Since 1990, A1 and A2 marks were called wounds and the remainder
of marks were called scars to fit with historical classification.
FIG. 1.1.3. Trend in lamprey marks on Rainbow Trout during the spring 1974-2016, at the Ganaraska River fishway at Port Hope, Ontario. Since 1990, A1 and A2 marks (King and Edsall 1979) were
called wounds and the remainder of marks were called scars to fit with historical classification.
King, E.L. Jr. and Edsall, T.A. 1979. Illustrated field guide for the classification of sea lamprey attack marks on great lakes lake trout. GLFC Special Publication 79-1.
YearWounds/
fish
Scars/
fish
Marks/
fish
% with
wounds
% with
scars
% with
marks
Sample
Size
1974 0.083 0.676 0.759 7.0 33.2 37 527
1975 0.095 0.725 0.820 8.0 37.2 40 599
1976 0.090 0.355 0.445 6.6 23.3 28 1280
1977 0.076 0.178 0.254 6.4 13.5 18 2242
1978 0.097 0.380 0.476 8.1 28.4 34 2722
1979 0.122 0.312 0.434 10.3 22.8 30 3926
1981 0.516 36 5489
1983 0.113 0.456 0.569 9.7 33.4 39 833
1985 0.040 0.154 0.193 3.7 11.5 14 1256
1990 0.030 0.071 0.101 2.8 5.8 8 466
1991 0.026 0.076 0.103 2.4 6.4 8 419
1992 0.079 0.117 0.197 6.3 11.1 17 315
1993 0.077 0.126 0.203 6.9 11.5 17 261
1994 0.044 0.141 0.185 4.0 12.4 15 298
1995 0.036 0.026 0.063 3.6 2.6 6 303
1996 0.028 0.025 0.053 2.8 2.5 5 396
1997 0.035 0.132 0.167 3.5 10.3 13 311
1998 0.075 0.092 0.168 6.8 8.5 13 400
1999 0.057 0.157 0.214 5.5 12.4 16 477
2000 0.091 0.191 0.283 8.0 16.9 24 361
2001 0.118 0.138 0.257 10.0 12.5 19 608
2003 0.063 0.134 0.197 5.9 10.9 16 238
2004 0.227 0.316 0.543 17.6 25.0 38 392
2005 0.231 0.433 0.664 17.1 33.6 41 321
2006 0.282 0.379 0.661 22.6 30.1 45 319
2007 0.199 0.534 0.733 15.5 39.3 49 206
2008 0.274 0.682 0.956 18.6 43.8 51 274
2009 0.256 0.377 0.633 20.4 29.8 42 289
2010 0.134 0.394 0.528 10.4 31.2 38 231
2011 0.124 0.235 0.359 10.7 21.8 30 298
2013 0.229 0.071 0.300 17.4 6.8 22 380
2015 0.058 0.238 0.296 4.9 16.5 20 206
2016 0.075 0.280 0.356 7.5 21.8 27 239
Mark
s /
fis
h0.0
0.2
0.4
0.6
0.8
1.0
1990
1995
2000
2005
2010
2015
Scars
Wounds

Section 1. Index Fishing Projects
4
1.2 Lake Ontario and Bay of Quinte Fish Community Index Gill Netting J. A. Hoyle, Lake Ontario Management Unit
The Lake Ontario and Bay of Quinte annual
gill netting program is used to monitor the
abundance and biological characteristics of a
diversity of warm, cool and cold-water fish
species. Data from the program are used to help
manage local commercial and recreational
fisheries as well as for tracking long-term changes
in the aquatic ecosystem.
Gill net sampling areas are shown in Fig.
1.2.1 and the basic sampling design is
summarized in Table 1.2.1. Included in the
design are fixed, single-depth sites and depth-
stratified sampling areas. In 2016, each site or
area was visited from one to three times within
specified time-frames, and with one to three gill
net gangs set during each visit.
The annual index gill netting field work
occurs during the summer months. Summer was
FIG. 1.2.1. Map of north eastern Lake Ontario. Shown are eastern Lake Ontario and Bay of Quinte fish community index gill netting sites.
chosen based on an understanding of water
temperature stability, fish movement/migration
patterns, fish growth patterns, and logistical
considerations. The time-frames for completion
of field work varies among sampling sites/areas
(Table 1.2.1). This increases the probability of
encountering a wide-range of water temperatures
across the depth ranges sampled, both seasonally
and by geographic area.
In 2016, several additional gill net
sampling locations were sampled. This included
sites that had been sampled in the past but not for
several decades; these additional sites were EB01,
EB03, EB04, and EB05 in the Kingston Basin of
eastern Lake Ontario, and Trenton, Belleville, and
Deseronto in the upper Bay of Quinte. Also, two
extra sampling depths (40 and 50 m) were added
to the three deep-water depth-stratified sampling
transects in the open waters of Lake Ontario;

Section 1. Index Fishing Projects
5
TABLE. 1.2.1. Sampling design of the Lake Ontario fish community index gill netting program (Lake Ontario) including geographic and depth stratification, number of visits, number of replicate gill net gangs set during each visit (by gill net length), and the time-frame for completion of
visits. Also shown is the year in which gill netting at a particular area/site was initiated and the number of prior years that netting has occurred.
Replicates Site location (approx)
Region name Area name Design
Site
name
Depth
(m) Visits 465' 500'
Latitude
(dec deg)
Longitude
(dec deg)
Visits x
Replicates Time-frame
Start-up
year
Number
years
Northwest Port Credit Depth stratified PC08 7.5 1 2 43.5362 -79.5810 2 Jul 1-Jul 31 2014 3
Northwest Port Credit Depth stratified PC13 12.5 1 2 43.5278 -79.5698 2 Jul 1-Jul 31 2014 3
Northwest Port Credit Depth stratified PC18 17.5 1 2 43.5258 -79.5632 2 Jul 1-Jul 31 2014 3
Northwest Port Credit Depth stratified PC23 22.5 1 2 43.5243 -79.5598 2 Jul 1-Jul 31 2014 3
Northwest Port Credit Depth stratified PC28 27.5 1 2 43.5222 -79.5553 2 Jul 1-Jul 31 2014 3
Northwest Port Credit Depth stratified PC40 40 1 3 43.5448 -79.4960 3 Jul 1-Jul 31 2016 1
Northwest Port Credit Depth stratified PC50 50 1 3 43.5415 -79.4790 3 Jul 1-Jul 31 2016 1
Northwest Port Credit Depth stratified 0060 60 1 3 43.5355 -79.4640 3 Jul 1-Jul 31 2014 3
Northwest Port Credit Depth stratified 0080 80 1 3 43.5267 -79.4205 3 Jul 1-Jul 31 2014 3
Northwest Port Credit Depth stratified 0100 100 1 3 43.5218 -79.3665 3 Jul 1-Jul 31 2014 3
Northwest Port Credit Depth stratified 0140 140 1 3 43.4975 -79.1452 3 Jul 1-Jul 31 2014 3
Central Cobourg Depth stratified CB08 7.5 2 2 43.9498 -78.1952 4 Jul 1-Sep 15 2010 7
Central Cobourg Depth stratified CB13 12.5 2 2 43.9420 -78.1912 4 Jul 1-Sep 15 2010 7
Central Cobourg Depth stratified CB18 17.5 2 2 43.9367 -78.1897 4 Jul 1-Sep 15 2010 7
Central Cobourg Depth stratified CB23 22.5 2 2 43.9302 -78.1847 4 Jul 1-Sep 15 2010 7
Central Cobourg Depth stratified CB28 27.5 2 2 43.9238 -78.1857 4 Jul 1-Sep 15 2010 7
Central Cobourg Depth stratified CB40 40 1 3 43.9090 -78.1572 3 Jul 1-Jul 31 2016 1
Central Cobourg Depth stratified CB50 50 1 3 43.8832 -78.1540 3 Jul 1-Jul 31 2016 1
Central Cobourg Depth stratified 0060 60 1 3 43.8817 -78.1448 3 Jul 1-Jul 31 2014 3
Central Cobourg Depth stratified 0080 80 1 3 43.8020 -78.1405 3 Jul 1-Jul 31 2014 3
Central Cobourg Depth stratified 0100 100 1 3 43.7692 -78.1213 3 Jul 1-Jul 31 2014 3
Central Cobourg Depth stratified 0140 140 1 3 43.7175 -78.0953 3 Jul 1-Jul 31 2014 3
Northeast Brighton Depth stratified BR08 7.5 2 2 43.9925 -77.6763 4 Aug 1-Sep 15 1988 29
Northeast Brighton Depth stratified BR13 12.5 2 2 43.9852 -77.6785 4 Aug 1-Sep 15 1988 29
Northeast Brighton Depth stratified BR18 17.5 2 2 43.9790 -77.6800 4 Aug 1-Sep 15 1988 29
Northeast Brighton Depth stratified BR23 22.5 2 2 43.9600 -77.6717 4 Aug 1-Sep 15 1988 29
Northeast Brighton Depth stratified BR28 27.5 2 2 43.9397 -77.6727 4 Aug 1-Sep 15 1988 29
Northeast Middle Ground Fixed site MG05 5 2 2 44.0152 -77.6453 4 Aug 1-Sep 15 1979 38
Northeast Wellington Depth stratified WE08 7.5 2 2 43.9372 -77.3353 4 Aug 1-Sep 15 1988 29
Northeast Wellington Depth stratified WE13 12.5 2 2 43.9240 -77.3380 4 Aug 1-Sep 15 1988 29
Northeast Wellington Depth stratified WE18 17.5 2 2 43.9193 -77.3377 4 Aug 1-Sep 15 1988 29
Northeast Wellington Depth stratified WE23 22.5 2 2 43.8965 -77.3417 4 Aug 1-Sep 15 1988 29
Northeast Wellington Depth stratified WE28 27.5 2 2 43.8913 -77.3445 4 Aug 1-Sep 15 1988 29
Northeast Rocky Point Depth stratified RP08 7.5 2 2 43.9177 -76.8740 4 Jul 21-Sep 15 1988 29
Northeast Rocky Point Depth stratified RP13 12.5 2 2 43.9103 -76.8693 4 Jul 21-Sep 15 1988 29
Northeast Rocky Point Depth stratified RP18 17.5 2 2 43.9008 -76.8735 4 Jul 21-Sep 15 1988 29
Northeast Rocky Point Depth stratified RP23 22.5 2 2 43.8863 -76.9452 4 Jul 21-Sep 15 1988 29
Northeast Rocky Point Depth stratified RP28 27.5 2 2 43.8793 -76.8592 4 Jul 21-Sep 15 1988 29
Northeast Rocky Point Depth stratified 0040 40 1 3 43.8515 -76.8400 3 Jul 1-Jul 31 2016 1
Northeast Rocky Point Depth stratified 0050 50 1 3 43.8348 -76.8400 3 Jul 1-Jul 31 2016 1
Northeast Rocky Point Depth stratified 0060 60 1 3 43.8178 -76.8400 3 Jul 1-Jul 31 1997 20
Northeast Rocky Point Depth stratified 0080 80 1 3 43.7668 -76.8400 3 Jul 1-Jul 31 1997 20
Northeast Rocky Point Depth stratified 0100 100 1 3 43.7443 -76.8400 3 Jul 1-Jul 31 1997 20
Northeast Rocky Point Depth stratified 0140 140 1 3 43.6862 -76.8000 3 Jul 1-Jul 31 1997 20
Kingston Basin Flatt Point Depth stratified FP08 7.5 2 2 43.9447 -76.9985 4 Jul 1-Jul 31 1986 31
Kingston Basin Flatt Point Depth stratified FP13 12.5 2 2 43.9457 -76.9870 4 Jul 1-Jul 31 1986 31
Kingston Basin Flatt Point Depth stratified FP18 17.5 2 2 43.9517 -76.9587 4 Jul 1-Jul 31 1986 31
Kingston Basin Flatt Point Depth stratified FP23 22.5 2 2 43.9577 -76.9250 4 Jul 1-Jul 31 1986 31
Kingston Basin Flatt Point Depth stratified FP28 27.5 2 2 43.9582 -76.8897 4 Jul 1-Jul 31 1986 31
Kingston Basin Grape Island Depth stratified GI08 7.5 2 2 44.0940 -76.7902 4 Jul 1-Jul 31 1986 31
Kingston Basin Grape Island Depth stratified GI13 12.5 2 2 44.0880 -76.7868 4 Jul 1-Jul 31 1986 31
Kingston Basin Grape Island Depth stratified GI18 17.5 2 2 44.0803 -76.7965 4 Jul 1-Jul 31 1986 31
Kingston Basin Grape Island Depth stratified GI23 22.5 2 2 44.0668 -76.7815 4 Jul 1-Jul 31 1986 31
Kingston Basin Grape Island Depth stratified GI28 27.5 2 2 44.0637 -76.7860 4 Jul 1-Jul 31 1986 31
Kingston Basin Melville Shoal Depth stratified MS08 7.5 2 2 44.1707 -76.5853 4 Jul 1-Jul 31 1986 31
Kingston Basin Melville Shoal Depth stratified MS13 12.5 2 2 44.1665 -76.5817 4 Jul 1-Jul 31 1986 31
Kingston Basin Melville Shoal Depth stratified MS18 17.5 2 2 44.1543 -76.5762 4 Jul 1-Jul 31 1986 31
Kingston Basin Melville Shoal Depth stratified MS23 22.5 2 2 44.1392 -76.5707 4 Jul 1-Jul 31 1986 31
Kingston Basin Melville Shoal Depth stratified MS28 27.5 2 2 44.1310 -76.5720 4 Jul 1-Jul 31 1986 31
Kingston Basin Eastern Basin Fixed site EB01 31 3 3 44.0665 -76.7757 9
Jun 20-Jul 17; Jul 18-Aug
14; Aug 15 Sep 9 2016 1
Kingston Basin Eastern Basin Fixed site EB02 30 3 3 44.0533 -76.8397 9
Jun 20-Jul 17; Jul 18-Aug
14; Aug 15 Sep 9 1968 49
Kingston Basin Eastern Basin Fixed site EB03 25 3 3 43.9712 -76.8232 9
Jun 20-Jul 17; Jul 18-Aug
14; Aug 15 Sep 9 2016 1
Kingston Basin Eastern Basin Fixed site EB04 27 3 3 43.9910 -76.6092 9
Jun 20-Jul 17; Jul 18-Aug
14; Aug 15 Sep 9 2016 1
Kingston Basin Eastern Basin Fixed site EB05 29 3 3 44.0000 -76.6665 9
Jun 20-Jul 17; Jul 18-Aug
14; Aug 15 Sep 9 2016 1
Kingston Basin Eastern Basin Fixed site EB06 30 3 3 44.0360 -76.7040 9
Jun 20-Jul 17; Jul 18-Aug
14; Aug 15 Sep 9 1968 49

Section 1. Index Fishing Projects
Rocky Point, Cobourg and Port Credit. Sampling
at all these additional sites will help better assess
fish distribution patterns.
Monofilament gill nets with standardized
specifications are used (monofilament mesh
replaced multifilament in 1992; only catches from
1992-present are tabulated below). Each gill net
gang consists of a graded-series of ten
monofilament gill net panels of mesh sizes from
38 mm (1½ in) to 152 mm (6 in) stretched mesh
at 13 mm (½ in) intervals, arranged in sequence.
However, a standard gill net gang may consist of
one of two possible configurations. Either, all
ten mesh sizes (panels) are 15.2 m (50 ft) in
length (total gang length is 152.4 m (500 ft)), or,
the 38 mm (1½ in) mesh size (panel) is 4.6 m (15
ft) in length and the remaining mesh sizes are
15.2 m (50 ft) each in length (total gang length is
141.7 m (465 ft)) (see Table 1.2.1). Note that use
of the shorter 38 mm gill net panel is related to
the processing time required to deal with large
numbers of small fish (e.g., Alewife and Yellow
Perch) caught in this small mesh size. Gill net
gangs are connected in series (i.e., cork lines and
lead lines attached), but are separated by a 15.2 m
(50 ft) spacer to minimize "leading" of fish. The
152 mm (6 in) end of one gang is connected to the
38 mm (1 ½ in) gang of the adjoining gang. The
entire gill net strap (all joined gangs) is set within
2.5 m of the site depth listed in Table 1.2.1. Gill
net set duration usually ranges from 18-24 hr but
can be up to three days for the deep-water Lake
Ontario sites (40-140 m) at Rocky Point, Cobourg
and Port Credit.
Catches were summed across the ten mesh
sizes from 1½-6 inch. In the case where the 38
mm mesh size used was 4.6 m in length, the catch
in this mesh was adjusted (i.e., multiplied by
15.2/4.6) prior to summing the ten mesh sizes.
Therefore, all reported catches represent the total
catch in a 152.4 m (500 ft) gang of gill net.
In 2016, 314 gill net samples were made
from 21-Jun to 7-Sep. Thirty-five different
species and over 50,000 individual fish were
caught. About 85% of the observed catch was
alewife (Table 1.2.2). Species-specific gill net
catch summaries are shown by geographic area/
site in Tables 1.2.3-1.2.24.
Selected biological information is also
presented below for Lake Whitefish and Walleye.
Lake Ontario
Northeast (Brighton, Wellington and Rocky Point)
and Kingston Basin (Melville Shoal, Grape Island
and Flatt Point) Nearshore Areas (Tables 1.2.3-
1.2.8 inclusive)
Six depth-stratified sampling areas
(Melville Shoal, Grape Island, Flat Point, Rocky
6
TABLE. 1.2.1 (continued). Sampling design of the Lake Ontario fish community index gill netting program (Bay of Quinte) including geographic and depth stratification, number of visits, number of replicate gill net gangs set during each visit (by gill net length), and the time-
frame for completion of visits. Also shown is the year in which gill netting at a particular area/site was initiated and the number of prior years
that netting has occurred.
Replicates Site location (approx)
Region name Area Name Design
Site
name
Depth
(m) Visits 465' 500'
Latitude
(dec deg)
Longitude
(dec deg)
Visits x
Replicates Time-frame
Start-up
year
Number
years
Bay of Quinte Conway Depth stratified CO08 7.5 2 2 44.1097 -76.9108 4 Jul 21-Aug 21 1972 45
Bay of Quinte Conway Depth stratified CO13 12.5 2 2 44.1080 -76.9103 4 Jul 21-Aug 21 1972 45
Bay of Quinte Conway Depth stratified CO20 20 2 2 44.1065 -76.9097 4 Jul 21-Aug 21 1972 45
Bay of Quinte Conway Depth stratified CO30 30 2 2 44.1218 -76.9043 4 Jul 21-Aug 21 1972 45
Bay of Quinte Conway Depth stratified CO45 45 2 2 44.1147 -76.9023 4 Jul 21-Aug 21 1972 45
Bay of Quinte Hay Bay Depth stratified HB08 7.5 3 2 44.1090 -77.0298 6
Jun 15-Jul 15 (1 visit);
Jul 21-Aug 21 (2 visits) 1959 58
Bay of Quinte Hay Bay Depth stratified HB13 12.5 3 2 44.0950 -77.0697 6
Jun 15-Jul 15 (1 visit);
Jul 21-Aug 21 (2 visits) 1959 58
Bay of Quinte Deseronto Fixed site DE05 5 2 2 44.1725 -77.0565 4
Jun 15-Jul 15 (1 visit);
Jul 21-Aug 21 (1 visit) 2016 1
Bay of Quinte Big Bay Fixed site BB05 5 4 2 44.1527 -77.2230 8
Jun 15-Jul 15 (1 visit);
Jul 21-Aug 21 (3 visits) 1972 45
Bay of Quinte Belleville Fixed site BE05 5 2 2 44.1523 -77.3413 4
Jun 15-Jul 15 (1 visit);
Jul 21-Aug 21 (1 visit) 2016 1
Bay of Quinte Trenton Fixed site TR05 5 2 2 44.1060 -77.5105 4
Jun 15-Jul 15 (1 visit);
Jul 21-Aug 21 (1 visit) 2016 1

Section 1. Index Fishing Projects
7
Point, Wellington and Brighton) that employ a
common and balanced sampling design were used
here to provide a broad picture of the warm, cool
and coldwater fish community inhabiting the open
-coastal waters out to about 30 m water depth in
the eastern half of Lake Ontario. Results were
summarized and presented graphically (Fig. 1.2.2)
to illustrate abundance trends of the most
abundant fish species.
Many species showed peak abundance
levels in the early 1990s followed by dramatic
abundance decline. Alewife, the most common
species caught, has occurred at very high
abundance levels the last few years until 2014
when abundance declined precipitously. Alewife
abundance increased in 2015 and again in 2016.
Yellow Perch remained at a very low level of
abundance in 2016. Lake Trout abundance
declined in 2016. In 2014, Round Goby
abundance declined to its lowest level since 2004,
and remained low in 2015 but increased in 2016.
Walleye catch declined in 2016. Lake Whitefish
remain at a very low abundance level. Rock Bass,
Smallmouth Bass, Chinook Salmon and Brown
Trout abundance all declined in 2016.
Middle Ground (Table 1.2.9)
Middle Ground represents one of our
longest running gill netting locations. Seven
species were caught at Middle Ground in 2016.
Yellow Perch dominated the catch. Walleye and
White Sucker abundance increased in 2016.
Kingston Basin—Deep Sites (EB02 and EB06;
Tables 1.2.10 and 1.2.11)
Two single-depth sites (EB02 and EB06)
are used to monitor long-term trends in the deep
water fish community the Kingston Basin.
Results were summarized and presented
graphically (Fig. 1.2.3) to illustrate abundance
trends of the most abundant species (Alewife,
Lake Trout, Lake Whitefish, Yellow Perch,
Rainbow Smelt, Cisco, Chinook Salmon and
Round Goby). Alewife catches were variable
with high catches in some years, 1998-1999,
2010, 2012 and 2016. Lake Trout, Lake
Whitefish, Rainbow Smelt, and Cisco abundance
Species
Observed
catch
Standard
catch
Mean
weight
(g)
Lake Sturgeon 3 3 401
Longnose Gar 133 133 2,166
Bowfin 1 1 3,415
Alewife 43,000 87,081 35
Gizzard Shad 596 596 62
Coho Salmon 5 5 3,732
Chinook Salmon 52 57 2,851
Rainbow Trout 3 3 1,123
Brown Trout 27 27 3,053
Lake Trout 519 534 3,443
Lake Whitefish 46 46 778
Cisco 85 90 408
Rainbow Smelt 3 5 25
Northern Pike 16 16 3,550
Longnose Sucker 1 1 997
White Sucker 164 169 553
Shorthead Redhorse 4 4 574
Greater Redhorse 1 1 2,136
Common Carp 5 5 6,392
Golden Shiner 16 16 36
Brown Bullhead 11 11 304
Channel Catfish 6 6 835
Burbot 6 6 2,861
White Perch 925 925 73
White Bass 15 15 281
Rock Bass 56 70 60
Pumpkinseed 53 53 51
Bluegill 35 35 39
Smallmouth Bass 30 32 962
Black crappie 1 1 38
Yellow Perch 3,315 4,008 49
Walleye 407 407 1,577
Round Goby 142 409 40
Freshwater Drum 386 386 1,177
Deepwater Sculpin 53 53 35
TABLE 1.2.2. Species-specific total gill net catch in 2016 from 21-
Jun to 7-Sep. “Standard catch” is the observed catch expanded to
represent the catch in a 50 ft panel length of 1 1/2 inch mesh size in
cases where only 15 ft was used. A total of 314 gill nets were set and 35 species comprising 50,120 fish were caught.

Section 1. Index Fishing Projects
8
TA
BL
E 1
.2.3
. S
pec
ies-
spec
ific
cat
ch p
er g
illn
et s
et a
t B
rig
hto
n i
n N
orth
east
ern
La
ke O
nta
rio
, 199
2-2
016
. A
nnu
al c
atch
es a
re a
ver
ages
fo
r 1
-3 g
illn
et g
angs
set
at e
ach
of
5 d
epth
s (
7.5
, 1
2.5
, 17
.5,
22.5
and
27
.5 m
) du
rin
g e
ach o
f 1
-3 v
isit
s du
rin
g s
um
mer
. M
ean c
atch
es f
or
199
2-2
000 a
nd 2
00
1-2
010 t
ime-
per
iod
s ar
e sh
ow
n i
n b
old
. T
he
tota
l nu
mb
er o
f sp
ecie
s ca
ught
and g
illn
ets
set
each
yea
r
are
ind
icat
ed.
19
92
-20
00
mea
n2
00
12
00
22
00
32
00
42
00
52
00
62
00
72
00
82
00
92
01
0
20
01
-20
10
mea
n2
01
12
01
22
01
32
01
42
01
52
01
6
Bo
wfi
n-
-
-
-
-
-
-
-
-
-
-
-
-
-
-
-
-
0.0
5
Ale
wif
e3
4.8
2
49
.58
1
07
.40
3
1.8
1
22
.39
4
1.2
7
72
.52
3
.52
8
9.1
7
20
9.8
1
67
.05
6
9.4
5
30
7.7
4
13
8.3
6
29
5.2
5
70
.48
3
43
.08
1
91
.56
Giz
zard
Shad
0.4
4
-
-
-
-
-
-
-
-
-
0.1
5
0
.02
-
-
0.0
5
-
-
0
.20
Co
ho
Sal
mo
n0
.00
-
-
-
-
-
-
-
-
-
-
-
-
-
-
-
-
-
Chin
oo
k S
alm
on
0.7
4
0
.10
0.3
5
1.2
5
0
.45
0.4
2
0
.20
0.6
2
0.3
0
0
.05
0
.71
0.4
4
0
.83
0
.10
-
0.2
0
-
0.2
0
Rai
nb
ow
Tro
ut
-
-
-
-
-
-
-
-
-
-
-
-
-
-
0
.10
-
-
-
Bro
wn T
rout
0.1
2
-
-
0.3
5
0
.20
0.0
5
0
.15
0.1
0
0.3
0
0
.15
1
.25
0.2
6
0
.60
0
.50
0
.15
0
.10
0.2
0
0.2
0
Lak
e T
rout
5.2
2
1
.30
1.0
5
0.4
0
0
.95
0.1
5
0
.30
0.0
5
-
0.0
5
0.1
0
0
.44
0.1
5
0.2
0
0.1
0
0.8
5
0
.57
1
.09
Lak
e W
hit
efis
h0
.42
0.0
5
-
0.0
5
-
-
-
-
-
-
-
0
.01
-
-
-
-
-
-
Cis
co (
Lak
e H
erri
ng)
0.1
2
-
-
0.0
5
-
0
.10
0.1
0
0
.05
0
.25
0.0
5
-
0.0
6
0
.05
-
0.0
5
0.0
5
0
.10
0
.55
Ro
und
Whit
efis
h1
.19
-
0.2
5
0.0
5
0
.05
-
-
-
-
-
-
0.0
4
-
-
-
-
-
-
Rai
nb
ow
Sm
elt
0.1
1
-
-
-
-
-
-
-
-
-
0.1
0
0
.01
0.2
2
-
0
.05
-
-
-
No
rther
n P
ike
0.0
8
-
-
0.0
5
-
0
.10
-
0.2
0
0.0
5
0
.05
-
0
.05
0.0
5
-
-
0.1
5
0
.30
-
Whit
e S
uck
er0
.41
-
0.1
0
-
0.0
5
0
.15
0.0
5
0
.10
-
-
0.0
5
0
.05
0.0
5
-
-
0.1
5
-
0.3
5
Lak
e C
hub
-
-
-
-
-
-
-
-
0.1
7
-
-
0.0
2
-
-
-
-
-
-
Co
mm
on C
arp
0.1
2
-
-
0.0
5
-
-
-
-
-
-
-
0
.01
-
-
-
-
-
0.0
5
Bro
wn B
ull
hea
d0
.10
0.5
2
0
.20
0
.85
0.2
7
0
.35
-
0.2
5
0.2
2
0
.05
-
0
.27
-
-
-
0
.17
-
-
Chan
nel
Cat
fish
0.0
1
-
-
-
-
-
-
-
-
-
-
-
-
-
-
-
-
-
Am
eric
an E
el0
.00
-
-
-
-
-
-
-
-
-
-
-
-
-
-
-
-
-
Burb
ot
0.0
5
0
.05
-
-
-
-
0
.05
0.0
5
-
-
-
0
.02
-
-
-
0
.05
0.0
5
0.0
5
Whit
e P
erch
0.0
3
-
-
-
-
-
-
-
-
-
-
-
-
-
-
-
-
-
Ro
ck B
ass
0.8
8
-
0
.32
0
.63
0.7
6
0
.32
0.1
5
0
.32
0
.80
0.3
3
0.3
3
0
.39
-
1
.65
-
0.2
2
0
.05
0
.47
Pum
pkin
seed
0.0
1
-
-
-
-
-
-
-
-
-
-
-
-
-
-
-
-
-
Sm
allm
outh
Bas
s0
.00
-
-
-
-
-
-
-
-
-
0
.05
0.0
1
-
-
-
-
-
-
Yel
low
Per
ch1
5.6
4
-
0.5
0
0.5
0
0
.33
1.1
6
2
.99
1.5
7
4.8
3
0
.17
0
.17
1.2
2
-
1.9
8
2.3
6
0.1
7
-
1.5
4
Wal
leye
0.4
4
-
0
.15
0
.25
0.5
0
0
.20
0.0
5
0
.75
0
.10
-
0
.10
0.2
1
-
0.4
3
0.0
5
0.1
5
0
.10
0
.45
Ro
und
Go
by
-
-
-
0
.17
0.1
7
4
.45
1.9
8
0
.63
1
.70
1.3
2
0.9
9
1
.14
1.2
1
2.3
1
0.9
9
0.1
7
1
.82
3
.30
Fre
shw
ater
Dru
m0
.17
-
-
0
.15
0.1
0
-
0
.05
0.0
5
-
-
-
0
.04
-
-
-
-
-
-
To
tal
catc
h6
1
5
2
1
10
37
26
49
79
8
9
8
2
12
71
74
31
1
1
46
29
9
7
3
3
46
20
0
Num
ber
of
spec
ies
13
6
9
1
5
1
2
1
2
1
2
1
4
11
10
1
2
1
1
9
8
1
0
13
9
1
4
Num
ber
of
sets
20
20
2
0
2
0
2
0
2
0
2
0
20
20
2
0
2
0
10
2
0
20
20
2
0

Section 1. Index Fishing Projects
TA
BL
E 1
.2.4
. S
pec
ies-
spec
ific
cat
ch p
er g
illn
et s
et a
t W
elli
ng
ton
in
No
rth
ea
ster
n L
ak
e O
nta
rio
, 19
92-2
016
. A
nn
ual
cat
ches
are
aver
ages
for
1-3
gil
lnet
gan
gs
set
at e
ach
of
5 d
epth
s (
7.5
, 12
.5,
17.5
, 22
.5 a
nd
27
.5 m
) du
rin
g e
ach
of
1-3
vis
its
du
rin
g s
um
mer
. M
ean
cat
ches
for
19
92
-200
0 a
nd
200
1-2
010
tim
e-p
erio
ds
are
show
n i
n b
old
. T
he
tota
l n
um
ber
of
spec
ies
cau
ght
and
gil
lnet
s se
t ea
ch
yea
r ar
e in
dic
ated
.
9
19
92
-20
00
mea
n2
00
12
00
22
00
32
00
42
00
52
00
62
00
72
00
82
00
92
01
0
20
01
-20
10
mea
n2
01
12
01
22
01
32
01
42
01
52
01
6
Ale
wif
e1
7.2
5
20
.85
5
0.5
8
62
.26
3
8.2
3
83
.22
1
37
.33
1
.54
79
.05
4
47
.66
2
15
.85
1
13
.66
47
5.4
2
14
0.7
4
46
0.7
2
99
.79
2
45
.34
1
04
.95
Giz
zard
Shad
0.0
2
-
-
-
-
-
-
-
-
-
-
-
-
-
-
-
-
-
Chin
oo
k S
alm
on
0.3
3
0
.10
0.2
0
0
.35
1.2
0
0
.10
0.2
0
0.3
5
0
.45
-
0
.10
0
.31
0.6
5
-
0
.15
0
.15
0.1
5
0.2
5
Rai
nb
ow
Tro
ut
-
-
-
-
-
-
-
-
-
-
0.0
5
0.0
1
-
-
-
-
-
-
Bro
wn T
rout
0.1
1
0
.15
0.3
0
0
.15
0.4
0
0
.15
-
0
.10
0.4
0
0
.45
1
.55
0
.37
0.6
0
0.8
0
0.4
0
0.0
5
0
.15
0
.30
Lak
e T
rout
7.5
8
2
.40
2.2
0
0
.85
1.8
5
0
.45
0.7
0
0.4
0
0
.05
0.2
5
0.1
0
0.9
3
0
.25
0
.40
0
.05
0
.20
-
0
.05
Lak
e W
hit
efis
h0
.61
0.1
0
0
.05
-
-
-
-
-
-
-
-
0
.02
0.3
5
-
-
0.2
0
-
0.0
5
Cis
co0
.11
-
-
-
-
-
0.0
5
-
-
0.0
5
0.0
5
0.0
2
0
.05
-
-
-
-
0.2
0
Ro
und
Whit
efis
h0
.06
-
-
-
-
-
-
-
-
-
-
-
-
-
-
-
-
-
Rai
nb
ow
Sm
elt
0.0
7
-
-
-
-
-
-
-
0.0
5
0
.10
0
.17
0
.03
0.0
5
0.1
0
-
0
.05
-
0
.17
No
rther
n P
ike
0.0
1
-
-
0
.05
-
-
-
-
-
-
-
0
.01
0.0
5
-
0
.05
-
-
-
Whit
e S
uck
er0
.05
-
-
-
0.1
7
-
-
0.0
5
-
-
-
0
.02
-
-
-
-
-
-
Gre
ater
Red
ho
rse
-
-
-
0.0
5
-
-
-
-
-
-
-
0.0
1
-
-
-
-
-
-
Lak
e C
hub
0.0
3
-
-
-
-
-
-
-
-
-
-
-
-
-
-
-
-
-
Co
mm
on C
arp
0.0
2
-
-
-
-
0
.05
-
-
-
-
-
0
.01
-
-
-
-
-
-
Bro
wn B
ull
hea
d0
.00
0.0
5
0
.10
-
0.0
5
0
.15
-
-
-
-
-
0
.04
-
-
-
-
-
-
Burb
ot
0.2
3
0
.10
0.2
5
0
.05
0.0
5
-
0
.10
-
0
.05
-
0
.05
0
.07
-
0
.10
-
0.0
5
-
0.1
5
Whit
e P
erch
0.0
0
-
-
-
-
-
-
-
-
-
-
-
-
-
-
-
-
-
Ro
ck B
ass
0.3
5
0
.17
-
0.5
2
0
.10
0.0
5
-
-
0.5
8
-
-
0
.14
-
-
0.0
5
-
-
0
.10
Sm
allm
outh
Bas
s0
.03
-
-
-
-
-
-
-
-
-
-
-
0
.05
-
-
-
-
-
Yel
low
Per
ch3
1.0
0
12
.67
6
.22
17
.96
1
0.3
1
14
.51
7
.25
2
3.4
8
17
.65
2
5.8
7
1
4.1
1
1
5.0
0
2.4
7
19
.87
11
.71
16
.80
7
.50
2
6.9
5
Wal
leye
0.3
6
-
0
.10
0.2
0
0
.25
0.2
0
0
.10
0
.10
-
-
0
.05
0
.10
0.0
5
-
0
.10
0
.05
-
0
.05
Ro
und
Go
by
-
-
-
0.3
3
0
.99
25
.92
1
8.3
9
2
.03
11
.50
1
.16
6
.94
6
.73
3.3
5
2.9
7
3.3
0
0.3
3
2
.53
2
.64
Fre
shw
ater
Dru
m0
.25
-
0.0
5
-
0
.05
0.0
5
-
-
-
-
-
0.0
2
-
0.1
0
-
-
-
-
To
tal
catc
h5
8
3
7
6
0
8
3
5
4
1
25
1
64
28
11
0
47
6
2
39
13
7
48
3
1
65
47
7
1
18
2
56
13
6
Num
ber
of
spec
ies
11
9
10
11
12
11
8
8
9
7
11
1
0
1
2
8
9
10
5
1
2
Num
ber
of
sets
20
20
20
20
20
20
2
0
2
0
2
0
20
2
0
10
2
0
20
20
2
0

Section 1. Index Fishing Projects
TA
BL
E 1
.2.5
. S
pec
ies-
spec
ific
cat
ch p
er g
illn
et s
et a
t R
ock
y P
oin
t (n
earsh
ore s
ites
on
ly)
in N
orth
east
ern
Lak
e O
nta
rio
, 1
992-2
01
6.
An
nu
al c
atch
es a
re a
ver
ages
for
1-3
gil
lnet
gan
gs
set
at e
ach o
f 5
dep
ths
( 7.5
, 12
.5,
17.5
, 22
.5 a
nd 2
7.5
m)
du
rin
g e
ach o
f 2
-3 v
isit
s d
uri
ng s
um
mer
. M
ean c
atch
es f
or
19
92
-2000
an
d 2
001-2
010 t
ime-
per
iod
s ar
e sh
ow
n i
n b
old
. T
he
tota
l nu
mb
er o
f sp
ecie
s ca
ught
and
gil
lnet
s se
t ea
ch y
ear
are
ind
icat
ed.
10
19
92
-20
00
mea
n2
00
12
00
22
00
32
00
42
00
52
00
62
00
72
00
82
00
92
01
0
20
01
-20
10
mea
n2
01
12
01
22
01
32
01
42
01
52
01
6
Ale
wif
e1
31
.93
10
5.4
2
14
1.6
1
86
.90
1
55
.51
2
93
.30
1
42
.82
1
35
.36
2
31
.74
1
76
.68
6
62
.38
2
13
.17
53
0.4
0
12
7.8
4
51
2.0
7
19
2.7
4
13
5.4
3
22
5.9
2
Chin
oo
k S
alm
on
0.2
3
-
0.1
0
0.2
5
0
.55
0
.15
0
.27
0
.10
0
.15
-
0.7
0
0.2
3
0
.20
-
0.2
5
0.1
5
0.0
5
0.4
3
Rai
nb
ow
Tro
ut
-
-
-
-
-
-
0.0
5
-
-
-
-
0.0
1
-
-
0
.05
-
-
-
Atl
anti
c S
alm
on
0.0
2
-
-
-
-
-
-
-
-
-
-
-
-
-
-
-
-
-
Bro
wn T
rout
0.0
9
-
1.2
0
0.0
5
0
.25
0
.25
0
.45
0
.10
0
.50
-
0.8
0
0.3
6
1
.55
1
.10
0
.95
0
.05
0
.15
0
.15
Lak
e T
rout
5.4
0
1
.67
0
.80
0
.10
0.6
0
-
0
.47
0
.05
0
.25
0
.05
0
.32
0
.43
1.3
5
4.1
0
0.7
5
1.9
0
1.1
0
0.4
0
Lak
e W
hit
efis
h0
.69
0.0
5
-
0
.30
0.1
0
0.0
5
0.1
0
0.0
5
0.2
5
0.4
5
-
0
.14
0.1
0
0.3
0
0.1
0
0.1
0
-
-
Cis
co0
.07
-
-
-
-
-
-
-
-
-
-
-
0
.05
-
-
-
-
0
.05
Chub
-
0.1
7
-
-
-
-
-
-
-
-
-
0.0
2
-
-
-
-
-
-
Rai
nb
ow
Sm
elt
0.0
3
-
-
-
-
-
-
-
0
.17
-
-
0
.02
-
-
-
-
-
-
Whit
e S
uck
er0
.04
0.0
5
-
-
-
-
-
0.0
5
-
-
-
0
.01
-
-
-
-
-
-
Lak
e C
hub
0.1
1
-
0.1
7
-
-
-
-
0
.05
-
-
-
0.0
2
-
-
-
-
-
-
Co
mm
on C
arp
0.0
1
-
-
-
0
.10
0
.05
-
-
-
-
-
0.0
2
-
-
-
-
-
-
Bro
wn B
ull
hea
d-
-
-
-
0
.05
-
-
-
-
-
-
0
.01
-
-
-
-
-
-
Chan
nel
Cat
fish
-
-
-
-
-
-
-
-
-
0
.05
-
0.0
1
-
-
-
-
-
-
Sto
nec
at0
.01
0.7
0
0.1
7
0.0
5
-
0.1
0
0.0
5
0.2
7
-
-
-
0
.13
-
-
-
-
-
-
Burb
ot
0.2
8
0
.15
0
.35
0
.10
0.0
5
0.3
0
-
-
-
-
0.0
5
0.1
0
-
-
-
0.0
5
-
0
.05
Whit
e P
erch
-
-
-
-
-
-
-
-
-
-
-
-
-
-
0
.05
Ro
ck B
ass
0.3
1
0
.32
0
.53
0
.87
0.0
5
0.3
5
0.5
5
0.6
3
0.8
6
0.3
2
0.8
6
0.5
3
0
.05
0
.73
0
.48
0
.27
0
.98
0
.17
Sm
allm
outh
Bas
s1
.05
0.7
0
0.6
5
0.6
7
0
.80
0
.42
0
.42
0
.52
0
.55
0
.15
0
.50
0
.54
0.2
0
0.5
3
0.3
7
0.1
0
0.1
0
0.7
7
Yel
low
Per
ch0
.06
-
-
-
-
0
.17
0
.81
0
.88
0
.22
0
.33
1
.75
0
.42
0.6
0
0.6
6
-
-
-
0
.17
Wal
leye
0.6
7
-
0.2
5
0.1
0
0
.80
1
.60
0
.65
0
.85
0
.65
0
.15
0
.45
0
.55
0.1
0
0.2
0
0.7
0
1.1
0
1.1
5
0.2
0
Ro
und
Go
by
-
-
-
-
-
2
.15
8
.48
7
1.2
5
9
.50
2
8.2
6
1
5.9
3
1
3.5
6
6.5
4
7.6
0
13
.88
4.5
1
0.8
3
7.0
7
Fre
shw
ater
Dru
m0
.19
0.1
0
0.0
5
0.0
5
0
.30
-
0.1
0
-
0
.20
0
.15
0
.15
0
.11
-
-
-
-
-
-
To
tal
catc
h1
41
1
09
14
6
8
9
1
59
29
9
1
55
21
0
2
45
20
7
6
84
23
0
54
1
1
43
53
0
2
01
14
0
2
35
Num
ber
of
spec
ies
10
10
1
1
11
12
1
2
13
1
3
12
1
0
11
1
2
1
1
9
1
1
10
8
11
Num
ber
of
sets
20
2
0
20
20
2
0
20
2
0
20
2
0
20
2
0
10
2
0
20
2
0
20

Section 1. Index Fishing Projects
11
TA
BL
E 1
.2.6
. S
pec
ies-
spec
ific
cat
ch p
er g
illn
et s
et a
t F
latt
Po
int
in t
he
Kin
gst
on
Ba
sin
of
La
ke O
nta
rio
, 19
92-2
016
. A
nnu
al c
atch
es a
re a
ver
ages
for
1-3
gil
lnet
gan
gs
set
at e
ach o
f 5 d
epth
s (
7.5
, 1
2.5
, 17
.5,
22
.5 a
nd
27
.5 m
) du
rin
g e
ach
of
2-3
vis
its
du
rin
g s
um
mer
. M
ean
cat
ches
for
1992
-20
00
and
200
1-2
010
tim
e-p
erio
ds
are
show
n i
n b
old
. T
he
tota
l n
um
ber
of
spec
ies
cau
gh
t an
d g
illn
ets
set
each
yea
r ar
e in
dic
ated
.
19
92
-20
00
mea
n2
00
12
00
22
00
32
00
42
00
52
00
62
00
72
00
82
00
92
01
0
20
01
-20
10
mea
n2
01
12
01
22
01
32
01
42
01
52
01
6
Lak
e S
turg
eon
0.0
1
-
-
0.0
5
-
-
-
-
-
-
-
0
.01
-
-
-
-
-
-
Ale
wif
e7
8.1
8
45
.97
5
.17
6
.87
1
01
.38
1
41
.78
2
03
.18
1
40
.02
2
97
.45
3
05
.56
6
20
.72
1
86
.81
90
8.1
7
81
8.6
0
33
7.4
3
11
.57
2
93
.48
4
87
.80
Chin
oo
k S
alm
on
0.1
6
-
-
-
0
.35
0
.05
-
0.1
0
-
-
0.0
5
0.0
6
0
.05
0
.15
-
-
-
-
Rai
nb
ow
tro
ut
-
-
-
-
-
-
-
-
-
-
-
-
-
0.1
5
Bro
wn T
rout
0.0
2
0
.10
-
-
-
-
0.1
0
-
0
.10
0
.05
0
.10
0
.05
0.5
5
0.5
5
0.2
0
0.0
5
-
-
Lak
e T
rout
10
.72
2
.47
0.7
5
1.2
5
0.9
8
0.8
8
0.3
0
1.2
2
0.9
2
2.0
7
1.0
0
1.1
8
1
.95
0
.60
2
.20
2
.45
0.7
0
0.7
2
Lak
e W
hit
efis
h4
.17
4.6
0
2
.72
0
.85
2
.80
0
.55
0
.20
1
.30
0
.75
0
.15
0
.25
1
.42
0.2
5
0.9
5
0.2
0
0.0
5
0
.42
0
.35
Cis
co (
Lak
e H
erri
ng)
0.8
3
-
-
0.1
0
-
0
.05
-
-
-
-
-
0.0
2
-
0.0
5
0.0
5
-
-
0
.15
Co
reg
on
us
sp.
0.0
0
0
.05
-
-
-
-
-
-
-
-
-
0
.01
-
-
-
-
-
-
Rai
nb
ow
Sm
elt
0.2
2
-
-
-
-
-
0
.05
-
0.0
5
-
0
.10
0
.02
-
-
-
-
-
-
No
rther
n P
ike
0.0
8
0
.10
-
-
0.0
5
0.1
5
0.0
5
0.0
5
0.2
5
0.1
5
0.1
0
0.0
9
0
.10
0
.10
-
0.0
5
0
.65
0
.15
Whit
e S
uck
er0
.98
0.4
5
0
.45
0
.70
1
.00
0
.60
0
.35
0
.20
0
.50
0
.05
0
.20
0
.45
0.3
0
0.2
5
-
-
0
.05
-
Bro
wn B
ull
hea
d0
.05
-
0.0
5
0.0
5
0.0
5
0.0
5
-
0
.05
-
-
-
0.0
3
-
-
-
-
-
-
Sto
nec
at-
0
.05
0.0
5
-
-
-
-
-
-
-
-
0.0
1
-
-
-
-
-
-
Burb
ot
0.0
2
0
.10
-
-
-
-
-
-
-
-
-
0
.01
-
-
-
-
-
-
Whit
e P
erch
0.0
2
-
-
0.1
0
-
-
-
-
-
-
-
0
.01
-
-
-
-
-
-
Ro
ck B
ass
0.8
7
0
.53
0.0
5
0.0
5
0.2
2
-
0
.70
0
.25
0
.27
0
.05
-
0.2
1
0
.73
0
.52
0
.17
-
0
.17
-
Sm
allm
outh
Bas
s0
.06
-
0.1
0
0.0
5
-
-
-
-
-
-
-
0
.02
-
0
.05
-
-
-
0
.05
Yel
low
Per
ch2
2.7
0
5.2
4
5
.02
8
.62
4
1.3
5
2
9.8
3
5
1.5
1
2
0.5
3
5
.77
5
.06
1
2.1
7
1
8.5
1
9.5
8
2.3
2
0.2
2
1.1
6
1
.75
2
.97
Wal
leye
0.1
0
-
-
-
-
0.0
5
0.0
5
0.0
5
0.1
0
0.1
5
0.2
5
0.0
7
0
.10
0
.10
-
-
0.1
5
0.1
0
Ro
und
Go
by
-
-
-
-
0.9
9
4.9
6
12
.26
8.1
8
1.7
0
0.5
0
2.8
1
3.1
4
1
.49
3
.97
0
.17
-
0
.50
0
.99
Fre
shw
ater
Dru
m0
.08
-
-
-
-
-
-
-
-
-
-
-
0
.05
-
-
-
-
0.0
5
To
tal
catc
h1
19
6
0
1
4
19
1
49
17
9
2
69
17
2
3
08
31
4
6
38
21
2
92
3
8
28
34
1
1
5
2
98
49
3
Num
ber
of
spec
ies
10
11
9
1
1
10
1
1
11
1
1
11
1
0
11
1
1
1
2
14
8
6
9
1
0
Num
ber
of
sets
20
20
2
0
20
2
0
20
2
0
20
2
0
20
2
0
20
2
0
20
20
2
0
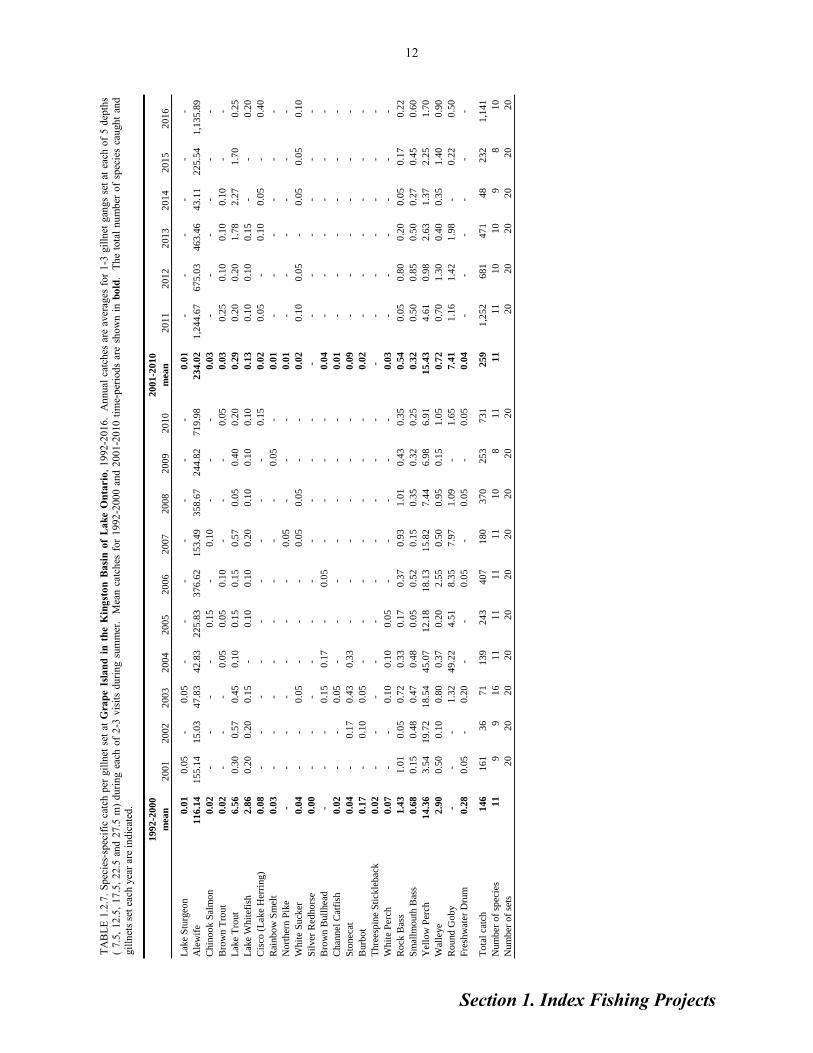
Section 1. Index Fishing Projects
TA
BL
E 1
.2.7
. S
pec
ies-
spec
ific
cat
ch p
er g
illn
et s
et a
t G
rap
e I
sla
nd
in
th
e K
ing
sto
n B
asi
n o
f L
ak
e O
nta
rio
, 1
992-2
01
6.
An
nu
al c
atch
es a
re a
ver
ages
for
1-3
gil
lnet
gan
gs
set
at e
ach
of
5 d
epth
s (
7.5
, 12
.5,
17
.5,
22.5
and 2
7.5
m)
du
rin
g e
ach o
f 2
-3 v
isit
s du
rin
g s
um
mer
. M
ean c
atch
es f
or
19
92
-2000
and 2
00
1-2
010 t
ime-
per
iod
s ar
e sh
ow
n i
n b
old
. T
he
tota
l nu
mb
er o
f sp
ecie
s ca
ugh
t an
d
gil
lnet
s se
t ea
ch y
ear
are
ind
icat
ed.
12
19
92
-20
00
mea
n2
00
12
00
22
00
32
00
42
00
52
00
62
00
72
00
82
00
92
01
0
20
01
-20
10
mea
n2
01
12
01
22
01
32
01
42
01
52
01
6
Lak
e S
turg
eon
0.0
1
0
.05
-
0
.05
-
-
-
-
-
-
-
0.0
1
-
-
-
-
-
-
Ale
wif
e1
16
.14
15
5.1
4
15
.03
4
7.8
3
42
.83
2
25
.83
3
76
.62
1
53
.49
3
58
.67
2
44
.82
7
19
.98
2
34
.02
1,2
44
.67
6
75
.03
4
63
.46
4
3.1
1
22
5.5
4
1,1
35
.89
Chin
oo
k S
alm
on
0.0
2
-
-
-
-
0.1
5
-
0
.10
-
-
-
0.0
3
-
-
-
-
-
-
Bro
wn T
rout
0.0
2
-
-
-
0.0
5
0
.05
0
.10
-
-
-
0.0
5
0.0
3
0
.25
0
.10
0
.10
0
.10
-
-
Lak
e T
rout
6.5
6
0
.30
0
.57
0.4
5
0
.10
0.1
5
0.1
5
0.5
7
0.0
5
0.4
0
0.2
0
0.2
9
0
.20
0
.20
1
.78
2
.27
1.7
0
0.2
5
Lak
e W
hit
efis
h2
.86
0.2
0
0.2
0
0
.15
-
0.1
0
0.1
0
0.2
0
0.1
0
0.1
0
0.1
0
0.1
3
0
.10
0
.10
0
.15
-
-
0.2
0
Cis
co (
Lak
e H
erri
ng)
0.0
8
-
-
-
-
-
-
-
-
-
0
.15
0
.02
0.0
5
-
0
.10
0
.05
-
0
.40
Rai
nb
ow
Sm
elt
0.0
3
-
-
-
-
-
-
-
-
0.0
5
-
0
.01
-
-
-
-
-
-
No
rther
n P
ike
-
-
-
-
-
-
-
0
.05
-
-
-
0.0
1
-
-
-
-
-
-
Whit
e S
uck
er0
.04
-
-
0
.05
-
-
-
0.0
5
0.0
5
-
-
0.0
2
0
.10
0
.05
-
0.0
5
0
.05
0
.10
Sil
ver
Red
ho
rse
0.0
0
-
-
-
-
-
-
-
-
-
-
-
-
-
-
-
-
-
Bro
wn B
ull
hea
d-
-
-
0.1
5
0
.17
-
0
.05
-
-
-
-
0
.04
-
-
-
-
-
-
Chan
nel
Cat
fish
0.0
2
-
-
0.0
5
-
-
-
-
-
-
-
0
.01
-
-
-
-
-
-
Sto
nec
at0
.04
-
0
.17
0.4
3
0
.33
-
-
-
-
-
-
0.0
9
-
-
-
-
-
-
Burb
ot
0.1
7
-
0.1
0
0
.05
-
-
-
-
-
-
-
0.0
2
-
-
-
-
-
-
Thre
esp
ine
Sti
ckle
bac
k0
.02
-
-
-
-
-
-
-
-
-
-
-
-
-
-
-
-
-
Whit
e P
erch
0.0
7
-
-
0.1
0
0
.10
0.0
5
-
-
-
-
-
0
.03
-
-
-
-
-
-
Ro
ck B
ass
1.4
3
1
.01
0
.05
0.7
2
0
.33
0.1
7
0.3
7
0.9
3
1.0
1
0.4
3
0.3
5
0.5
4
0
.05
0
.80
0
.20
0
.05
0.1
7
0.2
2
Sm
allm
outh
Bas
s0
.68
0.1
5
0.4
8
0
.47
0.4
8
0
.05
0
.52
0
.15
0
.35
0
.32
0
.25
0
.32
0.5
0
0.8
5
0.5
0
0.2
7
0
.45
0
.60
Yel
low
Per
ch1
4.3
6
3.5
4
19
.72
1
8.5
4
45
.07
1
2.1
8
1
8.1
3
1
5.8
2
7
.44
6
.98
6
.91
1
5.4
3
4.6
1
0.9
8
2.6
3
1.3
7
2
.25
1
.70
Wal
leye
2.9
0
0
.50
0
.10
0.8
0
0
.37
0.2
0
2.5
5
0.5
0
0.9
5
0.1
5
1.0
5
0.7
2
0
.70
1
.30
0
.40
0
.35
1.4
0
0.9
0
Ro
und
Go
by
-
-
-
1
.32
49
.22
4
.51
8
.35
7
.97
1
.09
-
1.6
5
7.4
1
1
.16
1
.42
1
.98
-
0
.22
0
.50
Fre
shw
ater
Dru
m0
.28
0.0
5
-
0.2
0
-
-
0.0
5
-
0
.05
-
0.0
5
0.0
4
-
-
-
-
-
-
To
tal
catc
h1
46
1
61
36
71
13
9
24
3
4
07
18
0
3
70
25
3
7
31
25
9
1,2
52
68
1
4
71
48
23
2
1
,14
1
Num
ber
of
spec
ies
11
9
9
1
6
1
1
1
1
11
1
1
10
8
11
1
1
1
1
1
0
10
9
8
10
Num
ber
of
sets
20
2
0
2
0
2
0
2
0
20
2
0
20
2
0
20
2
0
2
0
20
2
0
2
0
20

Section 1. Index Fishing Projects
13
TA
BL
E 1
.2.8
. S
pec
ies-
spec
ific
cat
ch p
er g
illn
et s
et a
t M
elv
ille
Sh
oa
l in
th
e K
ing
sto
n B
asi
n o
f L
ak
e O
nta
rio
, 1
992-2
016
. A
nn
ual
cat
ches
are
aver
ages
for
1-3
gil
lnet
gan
gs
set
at e
ach
of
5 d
epth
s (
7.5
, 12
.5,
17
.5,
22.5
and 2
7.5
m)
du
rin
g e
ach o
f 2
-3 v
isit
s du
rin
g s
um
mer
. M
ean c
atch
es f
or
19
92
-2000
and 2
00
1-2
010 t
ime-
per
iod
s ar
e sh
ow
n i
n b
old
. T
he
tota
l nu
mb
er o
f sp
ecie
s ca
ugh
t an
d
gil
lnet
s se
t ea
ch y
ear
are
ind
icat
ed.
19
92
-20
00
mea
n2
00
12
00
22
00
32
00
42
00
52
00
62
00
72
00
82
00
92
01
0
20
01
-20
10
mea
n2
01
12
01
22
01
32
01
42
01
52
01
6
Lak
e S
turg
eon
0.0
1
-
-
-
-
-
-
-
-
-
-
-
-
-
-
-
-
0.0
5
Ale
wif
e7
1.6
3
40
.83
3
9.1
9
14
.14
8
2.4
1
17
7.3
8
19
5.6
4
83
.04
1
34
.66
4
96
.46
6
20
.85
1
88
.46
66
6.7
0
22
3.1
8
55
3.6
3
93
.28
1
70
.89
8
05
.59
Giz
zard
Shad
0.0
0
-
-
-
-
-
-
-
-
-
-
-
-
-
-
-
-
-
Chin
oo
k S
alm
on
0.0
3
-
-
-
-
-
-
-
-
-
-
-
-
-
-
-
-
0.0
5
Rai
nb
ow
Tro
ut
-
-
-
-
-
-
-
0.0
5
-
-
-
0.0
1
-
-
-
-
-
-
Bro
wn T
rout
-
-
-
-
-
-
0
.05
-
0
.10
-
0.1
5
0.0
3
0
.05
0
.05
-
0.0
5
-
-
Lak
e T
rout
3.5
4
0
.10
0.0
5
0
.05
0.0
5
-
0.0
5
0.0
5
0
.10
0
.40
0
.15
0
.10
1.0
2
0.1
0
0.3
5
1.0
0
0
.55
0
.20
Lak
e W
hit
efis
h1
.59
0.1
0
0
.20
0.3
0
-
-
-
0
.05
-
-
-
0
.07
-
-
-
-
-
-
Cis
co0
.04
-
-
-
-
-
-
-
-
-
0.2
0
0.0
2
0
.05
0
.05
-
0.0
5
0
.27
0
.38
Co
reg
on
us
sp.
0.0
4
-
-
-
-
-
-
-
-
-
-
-
-
-
-
-
-
-
Rai
nb
ow
Sm
elt
0.0
8
-
-
-
-
-
-
-
0
.17
-
0.0
5
0.0
2
-
-
-
-
-
-
No
rther
n P
ike
0.0
7
0
.10
0.1
0
0
.05
-
-
-
-
-
0
.10
0
.10
0
.05
-
-
-
-
0
.05
0
.05
Whit
e S
uck
er0
.03
0.0
5
-
0
.05
-
-
-
-
-
-
-
0
.01
-
-
-
-
-
-
Gre
ater
Red
ho
rse
0.0
1
-
-
-
-
-
-
-
-
-
-
-
-
-
-
-
-
-
Mo
xost
om
a s
p.
0.0
4
-
-
-
-
-
-
-
-
-
-
-
-
-
-
-
-
-
Co
mm
on C
arp
0.0
2
-
-
0
.05
0.1
0
-
-
-
0
.05
-
-
0
.02
-
-
-
-
-
-
Chan
nel
Cat
fish
0.1
5
-
-
0
.05
-
-
-
-
-
-
-
0
.01
-
-
-
-
-
-
Sto
nec
at0
.03
0.3
3
0
.43
-
-
0.5
0
-
-
-
-
-
0.1
3
-
-
-
-
-
-
Burb
ot
0.1
0
-
-
-
0
.05
-
-
-
-
-
-
0
.01
-
-
-
-
-
-
Whit
e P
erch
0.2
0
-
-
-
-
-
-
-
-
-
-
-
-
-
-
-
-
-
Ro
ck B
ass
1.8
8
1
.99
0.9
8
1
.33
2.2
5
1
.84
1
.82
1
.72
3.1
6
0.8
0
1.2
8
1.7
2
1
.20
1
.89
0
.42
1
.99
1.5
1
1.0
2
Pum
pkin
seed
-
0.1
7
-
-
-
-
-
-
-
-
-
0.0
2
-
-
-
-
-
-
Sm
allm
outh
Bas
s0
.53
0.4
2
0
.25
0.4
0
0
.27
0.1
5
0.2
0
0.5
7
0
.70
0
.25
0
.60
0
.38
0.4
0
1.0
0
-
0
.87
0.1
0
0.2
0
Yel
low
Per
ch2
8.7
6
12
.57
2
6.5
7
20
.20
4
9.7
2
16
.14
44
.66
38
.74
1
8.7
5
9
.75
2
5.9
7
2
6.3
1
10
.38
8.8
2
3.9
2
12
.58
6
.03
6
.11
Wal
leye
8.7
3
4
.63
3.9
0
3
.50
5.0
8
4
.45
5
.25
7
.30
4.5
5
7.5
0
12
.45
5.8
6
1
0.1
0
7
.05
0
.55
1
1.7
0
7.0
0
6.9
5
Ro
und
Go
by
-
-
-
-
9.0
2
9
.80
5
.34
4
.84
2.1
8
1.1
6
0.5
0
3.2
8
0
.71
1
.16
1
.16
-
0
.50
-
Fre
shw
ater
Dru
m0
.09
0.0
5
-
0
.05
-
-
-
0.2
2
-
-
0
.10
0
.04
0.0
5
-
-
-
0.0
5
-
To
tal
catc
h1
18
6
1
7
2
4
0
1
49
2
10
25
3
1
37
1
64
51
6
6
62
22
7
69
1
2
43
56
0
1
22
1
87
82
1
Num
ber
of
spec
ies
12
12
9
12
9
7
8
10
10
8
12
1
0
1
0
9
6
8
10
1
0
Num
ber
of
sets
20
20
20
20
20
2
0
20
20
2
0
20
2
0
20
2
0
20
20
2
0

Section 1. Index Fishing Projects
FIG. 1.2.2. Abundance trends for the most common species caught in gill nets at six depth-stratified transects (nearshore out to 30 m) in northeastern Lake Ontario (Melville Shoal, Grape Island, Flatt Point, Rocky Point, Wellington and Brighton; see Fig. 1.2.1). Annual catch per
gill net values were corrected (covariate) for the overall mean observed water temperature (14.3 oC). Dotted lines show 3-yr running averages
(two years for first and last years graphed).
14

Section 1. Index Fishing Projects
TA
BL
E 1
.2.9
. S
pec
ies-
spec
ific
cat
ch p
er g
ill
net
set
at
Mid
dle
Gro
un
d i
n N
orth
east
ern
La
ke O
nta
rio
, 1
992-2
016 (
no s
amp
lin
g i
n 2
01
2).
A
nnu
al c
atch
es a
re a
ver
ages
for
2 g
ill
net
gan
gs
set
du
rin
g
each
of
1-3
vis
its
du
rin
g s
um
mer
. M
ean
cat
ches
for
1992
-200
0 a
nd 2
00
1-2
010
tim
e-p
erio
ds
are
show
n i
n b
old
. T
he
tota
l nu
mb
er o
f sp
ecie
s ca
ugh
t an
d g
ill
net
s se
t ea
ch y
ear
are
indic
ated
.
15
19
92
-20
00
mea
n2
00
12
00
22
00
32
00
42
00
52
00
62
00
72
00
82
00
92
01
0
20
01
-20
10
mea
n2
01
12
01
22
01
32
01
42
01
52
01
6
Lo
ngno
se G
ar-
-
-
0
.25
-
-
-
-
-
-
-
0
.03
-
-
-
-
-
Ale
wif
e3
.61
0.8
3
0
.83
-
-
-
-
-
0
.83
8.2
6
3
.30
1.4
0
1
90
.83
3
9.9
0
23
.96
5
6.1
7
-
Giz
zard
Shad
0.3
9
-
-
-
-
0
.50
-
0
.25
-
-
0.2
5
0
.10
-
-
-
-
-
Bro
wn T
rout
0.1
1
-
-
-
-
-
0
.25
-
0
.25
0.5
0
0
.25
0.1
3
0
.25
-
-
-
-
Lak
e T
rout
0.9
0
-
-
-
-
-
0
.25
-
-
-
-
0
.03
-
-
-
-
-
No
rther
n P
ike
0.3
4
-
-
0
.50
-
0.2
5
0
.25
1
.50
1.0
0
1
.25
0.2
5
0
.50
1.2
5
1.2
5
2
.00
1.0
0
0
.50
Whit
e S
uck
er1
.40
1.5
0
3
.08
-
2.0
8
0
.75
1.2
5
4.0
0
2
.25
1.0
0
5
.83
2.1
7
3
.25
-
-
0
.25
3.6
5
Co
mm
on C
arp
0.4
1
0
.50
-
0.7
5
0
.50
-
-
-
-
-
-
0
.18
-
-
-
0
.25
0.7
5
Bro
wn B
ull
hea
d1
.42
2.0
0
0
.50
2.1
5
0
.25
1.5
8
0
.83
0
.75
0.2
5
-
-
0
.83
0.2
5
-
-
-
-
Whit
e P
erch
0.0
8
-
-
-
-
-
-
-
-
-
-
-
-
0
.50
-
-
-
Ro
ck B
ass
1.4
7
1
.08
0.2
5
0
.50
0.7
5
0
.50
-
1
.08
-
-
0.2
5
0
.44
-
0
.25
-
-
1.6
5
Pum
pkin
seed
0.1
8
-
-
-
-
-
-
-
-
-
-
-
-
-
-
-
-
Blu
egil
l0
.06
-
-
-
-
-
-
-
-
-
-
-
0
.25
-
-
-
-
Sm
allm
outh
Bas
s0
.02
-
-
-
0.2
5
-
-
0.2
5
-
-
-
0
.05
-
-
-
-
-
Lar
gem
outh
Bas
s0
.06
-
-
-
-
-
-
-
-
-
-
-
-
-
-
-
-
Yel
low
Per
ch5
6.6
8
43
.38
6
0.9
0
25
.86
6
8.1
2
29
.34
1
05
.73
2
9.2
6
44
.35
2
2.6
5
13
.64
4
4.3
2
68
.09
80
.52
2
5.5
3
43
.78
7
5.9
9
Wal
leye
2.4
4
0
.25
0.5
0
1
.00
0.5
0
0
.75
1.2
5
3.5
0
0
.75
0.7
5
0
.25
0.9
5
0
.25
0
.50
2.3
3
-
4
.00
Fre
shw
ater
Dru
m0
.57
-
0.2
5
-
3
.00
0.2
5
-
0.5
0
-
0
.50
-
0.4
5
-
-
-
-
0.2
5
To
tal
catc
h7
0
5
0
6
6
3
1
7
5
3
4
1
10
41
50
35
24
52
26
4
1
23
5
4
1
01
8
7
Num
ber
of
spec
ies
8
7
7
7
8
8
7
9
7
7
8
8
8
6
4
5
7
Num
ber
of
sets
4
4
4
4
4
4
4
4
4
4
4
- 4
4
4
4

Section 1. Index Fishing Projects
TA
BL
E 1
.2.1
0.
Sp
ecie
s-sp
ecif
ic c
atch
per
gil
lnet
set
at
EB
02 i
n t
he
Kin
gst
on
Ba
sin
of
La
ke O
nta
rio
, 19
92-2
01
6.
An
nual
cat
ches
are
aver
ages
for
3-8
gil
lnet
gan
gs
set
du
rin
g e
ach
of
2-3
vis
its
du
rin
g s
um
mer
. M
ean
cat
ches
for
199
2-2
000
and
20
01-2
01
0 t
ime-
per
iod
s ar
e sh
ow
n i
n b
old
. T
he
tota
l n
um
ber
of
spec
ies
cau
ght
and
gil
lnet
s se
t ea
ch y
ear
are
ind
icat
ed.
19
92
-20
00
mea
n2
00
12
00
22
00
32
00
42
00
52
00
62
00
72
00
82
00
92
01
0
20
01
-20
10
mea
n2
01
12
01
22
01
32
01
42
01
52
01
6
Sea
Lam
pre
y0
.01
-
-
-
-
-
-
-
-
-
-
-
-
-
-
-
-
-
Lak
e S
turg
eon
0.0
1
-
-
-
-
-
-
-
-
-
-
-
-
-
-
-
-
-
Ale
wif
e4
0.0
0
17
.83
0
.25
0
.25
8
.67
1
.75
4
.50
3
.25
2
.92
7
.46
1
57
.00
2
0.3
9
2.4
5
60
.75
9
.13
1
.50
1
5.2
1
35
6.8
8
Chin
oo
k S
alm
on
0.0
5
0
.25
-
0
.04
0
.04
-
-
0
.04
-
0.1
3
0.0
8
0.0
6
-
0.1
3
0
.04
-
0.1
7
0
.11
Rai
nb
ow
Tro
ut
-
-
-
-
-
-
-
-
-
-
-
-
0
.04
-
-
-
-
-
Atl
anti
c S
alm
on
-
-
-
-
-
-
-
-
0.0
4
-
-
0.0
0
-
-
-
-
-
-
Bro
wn T
rout
0.0
2
0
.08
-
-
-
-
-
-
0.0
4
-
0
.21
0
.03
0.0
4
-
-
-
0.0
8
-
Lak
e T
rout
20
.57
1
.58
0.7
5
1.5
4
0.8
8
0.4
2
1.5
0
2.0
8
3.5
8
2.3
3
1.6
3
1.6
3
2
.10
0
.88
2.3
8
4.1
7
4.8
8
1
.78
Lak
e W
hit
efis
h3
.76
0.2
5
0
.42
0
.08
0
.17
-
0.2
5
0.1
7
0.4
6
0.0
8
0.0
4
0.1
9
0
.13
-
-
0.1
3
-
-
Cis
co0
.20
-
-
-
0.0
4
-
-
-
-
-
0
.21
0
.03
0.0
4
-
0.0
8
-
0
.21
1.0
0
Rai
nb
ow
Sm
elt
0.5
6
-
-
-
0
.04
0
.04
0
.08
0
.04
-
0.1
7
0.1
7
0.0
5
-
-
0.0
4
-
0
.04
-
Burb
ot
0.0
5
0
.08
-
-
-
-
-
-
-
-
-
0
.01
-
-
-
-
-
-
Tro
ut-
per
ch0
.01
-
-
-
-
-
-
-
-
-
-
-
-
-
-
-
-
-
Whit
e P
erch
0.0
2
-
-
-
-
-
-
-
-
-
-
-
-
-
-
-
-
-
Ro
ck B
ass
-
-
-
-
-
-
-
-
-
-
0.0
4
0.0
0
-
-
-
-
-
-
Sm
allm
outh
Bas
s-
-
-
-
-
-
-
-
-
0.0
4
-
0
.00
-
-
-
-
0
.04
-
Yel
low
Per
ch0
.09
-
0.2
8
0.0
4
2.9
2
0.5
0
0.7
1
0.1
7
0.4
2
0.1
3
0.2
5
0.5
4
0
.04
0
.13
0.0
4
-
0
.04
0.2
2
Wal
leye
0.0
4
-
-
-
0
.04
-
-
-
0.0
4
-
-
0.0
1
-
-
-
-
-
-
Ro
und
Go
by
-
-
-
-
0.1
3
0.0
4
0.1
7
0.0
8
-
-
0.0
4
0.0
5
-
-
0.0
4
0.0
4
-
-
Fre
shw
ater
Dru
m0
.01
-
-
-
-
-
-
-
-
-
-
-
-
-
-
-
-
-
Scu
lpin
sp
.0
.01
-
-
-
-
-
-
-
-
-
-
-
-
-
-
-
-
-
To
tal
catc
h6
5
2
0
2
2
1
3
3
7
6
8
10
1
60
23
5
6
2
1
2
6
2
1
3
60
Num
ber
of
spec
ies
7
6
4
5
9
5
6
7
7
7
10
7
7
4
7
4
8
5
Num
ber
of
sets
12
12
2
4
24
2
4
24
2
4
24
2
4
24
2
4
16
24
2
4
24
9
16

Section 1. Index Fishing Projects
TA
BL
E 1
.2.1
1.
Sp
ecie
s-sp
ecif
ic c
atch
per
gil
lnet
set
at
EB
06 i
n t
he K
ing
sto
n B
asi
n o
f L
ak
e O
nta
rio
, 1
992-2
01
6.
An
nual
cat
ches
are
aver
ages
for
3-8
gil
lnet
gan
gs
set
du
rin
g e
ach
of
2-3
vis
its
du
rin
g s
um
mer
. M
ean
cat
ches
for
199
2-2
000
and
20
01-2
01
0 t
ime-
per
iod
s ar
e sh
ow
n i
n b
old
. T
he
tota
l n
um
ber
of
spec
ies
cau
ght
and
gil
lnet
s se
t ea
ch y
ear
are
ind
icat
ed.
19
92
-20
00
mea
n2
00
12
00
22
00
32
00
42
00
52
00
62
00
72
00
82
00
92
01
0
20
01
-20
10
mea
n2
01
12
01
22
01
32
01
42
01
52
01
6
Sea
Lam
pre
y0
.01
-
-
-
-
-
-
-
-
-
-
-
-
-
-
-
-
-
Lak
e S
turg
eon
0.0
1
-
-
-
-
-
-
-
-
-
-
-
-
-
-
-
-
-
Ale
wif
e2
8.5
0
15
.67
0
.58
0
.79
2
.79
1
.88
2
.46
6
.44
1
1.2
5
1.2
9
75
.88
1
1.9
0
17
.96
1
3.1
9
13
.75
1
.46
1
.08
3
3.7
8
Chin
oo
k S
alm
on
0.0
2
-
-
-
-
0.0
8
-
-
0.0
4
-
-
0.0
1
0
.08
0.1
9
0
.08
-
-
0.1
1
Rai
nb
ow
Tro
ut
-
-
-
-
-
-
-
0
.04
-
-
-
0.0
0
-
-
0
.04
-
-
-
Bro
wn T
rout
-
-
0.0
8
-
-
0.0
4
-
0
.08
0
.04
0.0
4
0.0
4
0
.03
-
0.1
3
-
-
0.0
4
-
Lak
e T
rout
21
.88
1
.58
2.3
3
2.0
4
2.7
9
2.0
4
2.4
6
2.6
3
3.3
8
2
.96
4
.96
2.7
2
3
.29
4.4
4
4
.13
4.0
8
5.0
4
4.1
1
Lak
e W
hit
efis
h6
.36
0.5
8
0
.42
0
.25
2
.54
0
.29
0
.33
0
.42
1
.79
0.4
6
0.9
2
0
.80
0.9
2
0
.75
0.5
0
0
.13
0
.17
0
.11
Cis
co0
.03
-
-
-
-
-
-
-
-
-
-
-
-
0
.19
0.1
7
-
0.5
0
0.1
1
Rai
nb
ow
Sm
elt
0.5
2
-
-
-
-
-
0
.04
-
-
0.0
4
-
0.0
1
0
.04
0.0
6
0
.04
-
-
-
Co
mm
on C
arp
-
-
-
-
0.0
4
-
-
-
-
-
-
0.0
0
-
-
-
-
-
-
Am
eric
an E
el0
.01
-
-
-
-
-
-
-
-
-
-
-
-
-
-
-
-
-
Burb
ot
0.1
3
0
.17
0.0
8
0.0
4
0.0
4
-
-
-
-
-
-
0.0
3
-
-
-
-
-
-
Whit
e P
erch
0.0
1
-
-
0.0
4
-
-
-
-
-
-
-
0
.00
-
-
-
-
-
-
Yel
low
Per
ch-
-
-
0.0
4
-
-
-
-
0.2
1
-
-
0.0
3
-
-
-
-
-
-
Wal
leye
0.0
1
-
-
-
-
-
0
.04
-
-
-
-
0
.00
0.0
4
-
-
-
-
-
Ro
und
Go
by
-
-
-
-
-
0
.04
0
.13
0
.26
-
-
0.0
8
0
.05
0.1
7
-
-
-
-
-
To
tal
catc
h5
7
1
8
4
3
8
4
5
10
1
7
5
82
16
23
19
19
6
7
38
Num
ber
of
spec
ies
6
4
5
6
5
6
6
6
6
5
5
5
7
7
7
3
5
5
Num
ber
of
sets
12
12
2
4
24
2
4
24
2
4
24
24
2
4
2
4
1
6
2
4
2
4
24
2
4
17

Section 1. Index Fishing Projects
18
FIG. 1.2.3. Abundance trends (annual means) for the most common species caught in gill nets at the Kingston Basin deep sites, in eastern Lake Ontario (EB02 and EB06; see Fig. 1.2.1). Dotted lines show 3-yr running averages (two years for first and last years graphed).

Section 1. Index Fishing Projects
19
declined throughout the 1990s and remained low
during the years that followed except that Lake
Trout appears to be increasing gradually in recent
years and Cisco abundance increased during 2010
-2016. Chinook Salmon catches were relatively
high in 2016. No Round Goby were caught in the
past two years.
Kingston Basin (additional gill netting in 2016;
Table 1.2.12)
Three additional Kingston Basin deep gill
net sampling sites were netted in 2016; EB01,
EB03, EB04 and EB05). The sampling included
a seasonal component (Jun-Sep). Together, along
with EB02 and EB06), this netting provided a
more complete description of the Kingston Basin
deep-water fish community (Table 1.2.12).
Overall, the dominant species were Alewife, Lake
Trout, Cisco, and Lake Whitefish; of note,
Alewife catches were highest in July.
Lakewide Depth Stratified Transects (Rocky
Point, Cobourg, Port Credit; Tables 1.2.13-
1.2.15)
In 2016, for the third consecutive year,
three lakewide depth-stratified gill net transects,
spanning a wide depth range (7.5-140 m), were
sampled. Smallmouth Bass, Rock Bass, Yellow
Perch, and White Perch were caught only in the
east at Rocky Point. Coho Salmon, Rainbow
Trout and Gizzard Shad were caught only in
central Lake Ontario at Cobourg. Longnose
Sucker was caught only in the west at Port Credit.
Rocky Point—Deep Sites (Table 1.2.16)
Ten species have been captured at the
Rocky Point deep sampling sites since 1997.
Alewife and Lake Trout were the two most
abundant species. Lake Trout abundance was
relatively stable from 1997-2002, declined
significantly through 2004 and recovered in the
years following. Round Goby appeared for the
first time in 2012 (at the 60 m site) and were
captured again in 2015 and 2016. Unlike
Cobourg and Port Credit deep gill net sites (see
below), Deepwater Sculpin had never been caught
in the Rocky Point gill net sites until 2015 but
none was captured in 2016.
Cobourg (Tables 1.2.17 and 1.2.18)
Nearshore sites (7.5-27.5 m): Alewife
dominated the catch at the Cobourg nearshore
sites but the salmonid fish community was also
well represented (Table 1.2.17). Twelve species
were caught in 2016. Alewife catch declined
significantly from 2010-2014 but increased in
2015 and again in 2016.
Deep sites (40-140 m): The deep sites at
Cobourg were sampled again in 2016 and with the
additional depths (40 and 50 m) four species were
caught: Alewife, Lake Trout, Cisco and
Deepwater Sculpin. Alewife abundance was low
in 2016 (Table 1.2.18).
Port Credit (Tables 1.2.19 and 1.2.20)
Port Credit was sampled for the first time in
2014 and sampling occurred again in 2015 and in
2016 with two additional deep sampling depths
added (40 and 50 m).
Nearshore sites (7.5-27.5 m): Six species
were caught in 2016. Alewife dominated the
catch. Other species caught included Round
Goby, Lake Trout, White Sucker, Chinook
Salmon and Longnose Sucker (Table 1.2.19).
Deep Sites (40-140 m): Five species were
caught at the Port Credit deep sites: Alewife, Lake
Trout, Deepwater Sculpin, Chinook Salmon and
Burbot (Table 1.2.20).
Bay of Quinte (Conway, Hay Bay and Big Bay;
Tables 1.2.21-1.2.23 inclusive)
Three sites are used to monitor long-term
trends in the Bay of Quinte fish community. Big
Bay is a single-depth site; Hay Bay has two
depths and Conway five depths. Average summer
catch for the three sites are summarized
graphically in Fig. 1.2.4 to illustrate abundance
trends of the most abundant species from 1992-
2016. Yellow Perch abundance peaked in 1998,
declined gradually through 2013, and increased

Section 1. Index Fishing Projects
20
TA
BL
E 1
.2.1
2. .
Sp
ecie
s-sp
ecif
ic c
atch
per
gil
lnet
set
at
six s
ites
(EB
01
, E
B02
, E
B03
, E
B04
, E
B0
5,
EB
06
) in
th
e K
ingst
on
Ba
sin
of
La
ke O
nta
rio
, 20
16
. C
atch
es a
re a
ver
ages
fo
r 3
gil
lnet
gan
gs
set
du
rin
g e
ach
of
3 v
isit
s du
rin
g s
um
mer
. T
he
tota
l num
ber
of
spec
ies
cau
gh
t an
d g
illn
ets
set
each
yea
r ar
e in
dic
ated
.
Sp
ecie
sJu
nJu
lA
ug
Jun
Jul
Aug
Jun
Jul
Aug
Jun
Jul
Sep
Jun
Jul
Sep
Jun
Jul
Sep
Lak
e S
turg
eon
-
-
-
-
-
-
-
0.3
3
-
-
-
-
-
-
-
-
-
-
Ale
wif
e4
6.6
7
42
5.3
3
3.3
3
1.3
3
1,0
60
.97
8
.33
2
9.6
7
31
1.6
7
4.3
3
37
.67
1
58
.39
1
.00
4
49
.37
5
.67
0
.67
1
0.0
0
81
.67
9
.67
Chin
oo
k S
alm
on
-
-
-
-
-
0
.33
-
-
-
-
-
-
-
-
-
-
0.3
3
-
Bro
wn T
rout
-
-
-
-
-
-
-
-
-
-
-
-
-
-
0.3
3
-
-
-
Lak
e T
rout
5.1
7
1
.33
6
.33
3
.00
1
.00
1
.33
6
.00
4.0
0
5.3
3
4.6
7
1
.00
1
.33
1
.33
1
.00
0
.67
9
.33
0.3
3
2
.67
Lak
e W
hit
efis
h-
1
.00
1
.67
-
-
-
-
-
-
0
.67
0.6
7
0.3
3
-
-
-
-
-
0
.33
Cis
co-
-
1.3
3
-
-
3
.00
-
-
0.3
3
-
1.3
3
2.0
0
-
-
2.0
0
-
-
0.3
3
Ro
ck B
ass
-
-
-
-
-
-
-
-
-
-
-
-
0.3
3
-
-
-
-
-
Yel
low
Per
ch0
.33
-
-
-
0
.67
-
-
-
-
-
-
-
0.3
3
0.3
3
-
-
-
-
Wal
leye
-
-
0
.67
-
-
-
-
-
-
-
-
-
-
-
-
-
-
-
Ro
und
Go
by
-
-
-
-
-
-
-
-
-
-
-
-
4.3
3
-
0
.33
-
-
-
To
tal
catc
h5
24
28
13
41
06
31
33
63
16
10
43
16
15
45
67
41
98
21
3
Num
ber
of
spec
ies
33
52
34
23
33
44
53
52
34
Num
ber
of
sets
33
33
33
33
33
33
33
33
33
EB
06
EB
01
EB
02
EB
03
EB
04
EB
05

Section 1. Index Fishing Projects
21
TABLE 1.2.13. Species-specific catch per gillnet set at Rocky Point in northeastern Lake Ontario by site
depth, 2016. Catches are averages for 2 or 3 gill net gangs during each of 1 or 2 visits during summer. The
total number of species caught and number of gill nets set are indicated.
Site depth (m) 7.5 12.5 17.5 22.5 27.5 40 50 60 80 100 140
Alewife 168.70 128.22 120.78 386.61 325.27 26.67 5.67 24.67 49.00 144.33 3.00
Chinook Salmon 0.00 0.00 1.65 0.00 0.50 0.00 0.00 0.00 0.00 0.00 0.00
Brown Trout 0.00 0.00 0.00 0.50 0.25 0.00 0.00 0.00 0.00 0.00 0.00
Lake Trout 0.00 0.00 0.00 0.00 2.00 2.33 13.67 13.33 9.00 3.67 2.00
Lake Whitefish 0.00 0.00 0.00 0.00 0.00 2.00 0.33 0.00 0.00 0.00 0.00
Cisco 0.00 0.00 0.00 0.25 0.00 0.00 0.00 0.00 0.00 0.00 0.00
Burbot 0.00 0.00 0.00 0.25 0.00 0.00 0.00 0.00 0.00 0.00 0.00
White Perch 0.00 0.00 0.00 0.00 0.00 0.33 0.00 0.00 0.00 0.00 0.00
Rock Bass 0.00 0.83 0.00 0.00 0.00 0.00 0.00 0.00 0.00 0.00 0.00
Smallmouth Bass 3.00 0.83 0.00 0.00 0.00 0.00 0.00 0.00 0.00 0.00 0.00
Yellow Perch 0.00 0.83 0.00 0.00 0.00 0.00 0.00 0.00 0.00 0.00 0.00
Walleye 0.75 0.25 0.00 0.00 0.00 0.00 0.00 0.00 0.00 0.00 0.00
Round Goby 0.83 0.83 0.00 18.17 15.54 1.33 0.00 0.00 0.00 0.00 0.00
Total catch 173 132 122 406 344 33 20 38 58 148 5
Number of species 4 6 2 5 5 5 3 2 2 2 2
Number of sets 4 4 4 4 4 3 3 3 3 3 3
Northeast (Rocky Point)
TABLE 1.2.14. Species-specific catch per gillnet set at Cobourg in north central Lake Ontario by site depth, 2016. Catches are averages for 2 or 3 gill net gangs during each of 1 or 2 visits during summer. The total number of species
caught and number of gill nets set are indicated.
TABLE 1.2.15. Species-specific catch per gillnet set at Port Credit in northwestern Lake Ontario by site depth, 2016. Catches are averages for 2 or 3 gill net gangs during each of 1 or 2 visits during summer. The total number of species
caught and number of gill nets set are indicated.
Site depth (m) 7.5 12.5 17.5 22.5 27.5 40 50 60 80 100 140
Alewife 159.43 350.93 374.16 182.76 289.98 77.67 15.00 39.33 1.33 3.00 1.67
Gizzard shad 0.25 0.00 0.00 0.00 0.00 0.00 0.00 0.00 0.00 0.00 0.00
Coho salmon 0.00 0.00 0.25 0.75 0.25 0.00 0.00 0.00 0.00 0.00 0.00
Chinook salmon 0.25 0.50 1.00 4.50 2.25 0.00 0.00 0.00 0.00 0.00 0.00
Rainbow trout 0.00 0.25 0.25 0.00 0.00 0.00 0.00 0.00 0.00 0.00 0.00
Brown trout 1.75 0.75 0.00 0.75 0.00 0.00 0.00 0.00 0.00 0.00 0.00
Lake trout 0.00 0.00 0.00 0.00 0.50 9.33 4.33 3.33 0.67 1.00 0.00
Lake whitefish 0.00 0.00 0.00 0.00 0.25 0.00 0.00 0.00 0.00 0.00 0.00
Cisco 0.00 0.00 0.00 0.25 0.00 0.00 0.00 0.00 0.00 1.00 0.00
White sucker 0.00 0.25 0.00 0.00 0.00 0.00 0.00 0.00 0.00 0.00 0.00
Walleye 0.25 0.25 0.00 0.00 0.00 0.00 0.00 0.00 0.00 0.00 0.00
Round goby 2.48 5.21 1.65 0.83 0.83 0.00 0.00 0.00 0.00 0.00 0.00
Deepwater sculpin 0.00 0.00 0.00 0.00 0.00 0.00 0.00 0.00 0.00 0.33 5.00
Total catch 164 358 377 190 294 87 19 43 2 5 7
Number of species 6 7 5 6 6 2 2 2 2 4 2
Number of sets 4 4 4 4 4 3 3 3 3 3 3
North Central (Cobourg)
Site depth (m) 7.5 12.5 17.5 22.5 27.5 40 50 60 80 100 140
Alewife 375.09 177.33 292.13 117.80 209.87 1.67 3.00 4.67 9.67 1.67 5.33
Chinook salmon 0.00 0.00 0.50 0.00 0.00 0.33 0.00 0.00 0.00 0.00 0.00
Lake trout 0.00 0.00 0.50 0.50 0.00 5.67 3.33 2.33 2.00 3.00 1.33
Longnose sucker 0.00 0.50 0.00 0.00 0.00 0.00 0.00 0.00 0.00 0.00 0.00
White sucker 0.00 1.00 0.00 0.00 0.00 0.00 0.00 0.00 0.00 0.00 0.00
Burbot 0.00 0.00 0.00 0.00 0.00 0.33 0.00 0.00 0.00 0.00 0.00
Round goby 4.96 1.65 5.46 4.96 11.57 0.00 0.00 0.00 0.00 0.00 0.00
Deepwater sculpin 0.00 0.00 0.00 0.00 0.00 0.00 0.00 0.00 0.00 0.33 12.00
Total catch 380 180 299 123 221 8 6 7 12 5 19
Number of species 2 4 4 3 2 4 2 2 2 3 3
Number of sets 4 4 4 4 4 3 3 3 3 3 3
Northwest (Port Credit)

Section 1. Index Fishing Projects
22
TA
BL
E 1
.2.1
6.
Sp
ecie
s-sp
ecif
ic c
atch
per
gil
lnet
set
at
Ro
ck
y P
oin
t (d
eep
sit
es
on
ly)
in n
orth
ea
stern
La
ke O
nta
rio
, 1
997-2
01
6 (
no s
amp
lin
g i
n 2
006
, 200
7 o
r 2
010
).
An
nual
cat
ches
are
aver
ages
fo
r 2
or
3 g
illn
et g
angs
set
at e
ach
of
up t
o 6
dep
ths
(40
, 5
0,
60,
80
, 10
0 o
r 1
40
m)
du
rin
g e
ach o
f 2 v
isit
s du
rin
g e
arly
-su
mm
er.
Mea
n c
atch
es f
or
1997
-20
00 a
nd 2
00
1-2
010
tim
e-p
erio
ds
are
show
n i
n
bold
. T
he
tota
l n
um
ber
of
spec
ies
caugh
t an
d g
illn
ets
set
each
yea
r ar
e in
dic
ated
.
19
97
-20
00
mea
n2
00
12
00
22
00
32
00
42
00
52
00
62
00
72
00
82
00
92
01
0
20
01
-20
10
mea
n2
01
12
01
22
01
32
01
42
01
52
01
6
Ale
wif
e4
.69
12
.25
0
.38
9
.21
1
4.4
6
1.8
3
23
.92
4
0.6
7
14
.67
3
5.1
3
2.5
8
13
.50
4
1.4
6
62
.71
4
2.2
2
Lak
e T
rout
5.0
5
6
.81
6.2
5
4.1
7
2.1
7
1
.83
1
.46
1.8
8
3
.51
2.4
2
2
.00
5
.92
1.4
6
4
.00
7.3
3
Lak
e W
hit
efis
h0
.50
0.1
3
-
0.0
8
-
0.0
8
0.2
5
0
.50
0.1
5
0
.13
-
0
.67
0.6
7
0
.29
0.3
9
Cis
co (
Lak
e H
erri
ng)
0.1
3
-
0
.13
0
.08
0
.21
-
-
-
0
.06
-
-
-
0
.04
0.0
4
-
Co
reg
on
us
sp.
-
-
-
-
-
-
-
-
-
-
-
-
-
0.0
4
-
Rai
nb
ow
Sm
elt
0.4
1
-
0
.19
-
-
-
0
.08
0.0
8
0
.05
0.0
8
-
0.0
8
0
.13
-
-
Burb
ot
0.0
9
-
-
-
0
.04
-
-
-
0
.01
-
-
-
-
-
-
Whit
e P
erch
-
-
-
-
-
-
-
-
-
-
-
-
-
-
0.0
6
Ro
und
Go
by
-
-
-
-
-
-
-
-
-
-
0
.08
-
-
0
.04
0.2
2
Sli
my S
culp
in0
.08
0.0
6
-
0.0
4
0.0
4
-
0.0
8
-
0
.03
-
-
-
-
-
-
Dee
pw
ater
Scu
lpin
-
-
-
-
-
-
-
-
-
-
-
-
-
0.0
4
-
To
tal
catc
h1
1
1
9
7
14
1
7
4
26
43
18
38
5
2
0
4
4
6
7
5
0
Num
ber
of
spec
ies
6
4
4
5
5
3
5
4
4
4
3
4
5
6
5
Num
ber
of
sets
16
16
2
4
24
24
-
- 2
4
2
4
-
24
12
1
2
2
4
2
4
1
8

Section 1. Index Fishing Projects
23
TABLE 1.2.18. Species-specific catch per gill net set at
Cobourg (deep sites only) in northeastern Lake Ontario,
1997, 1998, and 2014-2016. Annual catches are averages for 2
or 3 gill net gangs set at each of 4-6 depths ( 40, 50, 60, 80, 100 and 140 m) during each of 1-2 visits during summer. The total
number of species caught and gill nets set each year are
indicated. 2010 2011 2012 2013 2014 2015 2016
Alewife 351.96 196.13 56.77 23.78 7.48 136.71 271.45
Gizzard Shad - - - - - - 0.05
Coho Salmon - - 0.10 - 0.05 - 0.25
Chinook Salmon 0.68 2.05 1.82 0.44 0.40 0.20 1.70
Rainbow Trout 0.51 0.25 0.80 0.05 - - 0.10
Brown Trout 0.13 0.65 0.50 0.42 0.25 0.40 0.65
Lake Trout 0.37 0.05 - 1.26 0.70 0.37 0.10
Lake Whitefish - 0.05 - - - - 0.05
Cisco - - - - - - 0.05
Round Whitefish 0.07 0.05 - - - - -
Rainbow Smelt - 0.33 - - - - -
White Sucker 0.10 0.37 0.50 0.26 0.15 0.20 0.05
Greater Redhorse - - 0.10 - - - -
Burbot - - - - 0.05 - -
Smallmouth Bass - 0.05 - - - - -
Yellow Perch 0.33 - 0.10 - - - -
Walleye 0.03 - 0.40 - 0.05 0.10 0.10
Round Goby 2.20 9.91 3.30 0.40 0.17 1.65 2.20
Freshwater Drum - 0.05 0.10 - - - -
Total catch 356 210 65 27 9 140 277
Number of species 10 12 11 7 9 7 12
Number of sets 30 20 10 19 20 20 20
TABLE 1.2.17. Species-specific catch per gill net set at Cobourg
(nearshore sites only) in northeastern Lake Ontario, 2010-2016. Annual
catches are averages for 2 gill net gangs set at each of 5 depths (7.5, 12.5,
17.5, 22.5 and 27.5 m) during each of 1-3 visits during summer. The total number of species caught and gill nets set each year are indicated.
1997 1998 2014 2015 2016
Alewife 67.16 42.75 29.75 171.50 23.00
Brown Trout - - 0.08 - -
Lake Trout 0.50 0.88 0.17 0.42 3.11
Cisco (Lake Herring) - 0.13 - - 0.17
Rainbow Smelt 2.88 0.50 - - -
Slimy Sculpin 0.06 - - - -
Deepwater Sculpin - - 3.67 0.25 0.89
Total catch 71 44 30 172 26
Number of species 4 4 4 3 4
Number of sets 16 16 12 12 18
TABLE 1.2.19. Species-specific catch per gill net set at Port Credit
(nearshore sites only) in northwestern Lake Ontario, 2014-2016.
Annual catches are averages for 2 gillnet gangs set at each of 5
depths ( 7.5, 12.5, 17.5, 22.5 and 27.5 m) during summer. The total number of species caught and gillnets set each year are indicated.
TABLE 1.2.20. Species-specific catch per gill net set at Port Credit
(deep sites only) in northwestern Lake Ontario, 2014-2016.
Annual catches are averages for 3 gillnet gangs set at each of 4-6
depths (40, 50, 60, 80, 100, and 140 m) during summer. The total number of species caught and gillnets set each year are indicated.
2014 2015 2016
Alewife 24.12 358.58 234.44
Chinook Salmon 0.10 0.20 0.10
Atlantic Salmon - 0.10 -
Brown Trout - 0.10 -
Lake Trout 1.20 0.80 0.20
Longnose Sucker - 0.20 0.10
White Sucker 0.20 1.50 0.20
Round Goby - 1.32 5.72
Total catch 26 361 235
Number of species 4 8 6
Number of sets 10 10 10
2014 2015 2016
Alewife 79.92 7.33 4.33
Chinook Salmon - - 0.06
Lake Trout 1.17 1.42 2.94
Burbot - - 0.06
Deepwater Sculpin 2.00 1.42 2.06
Total catch 83 10 9
Number of species 3 3 5
Number of sets 12 12 18
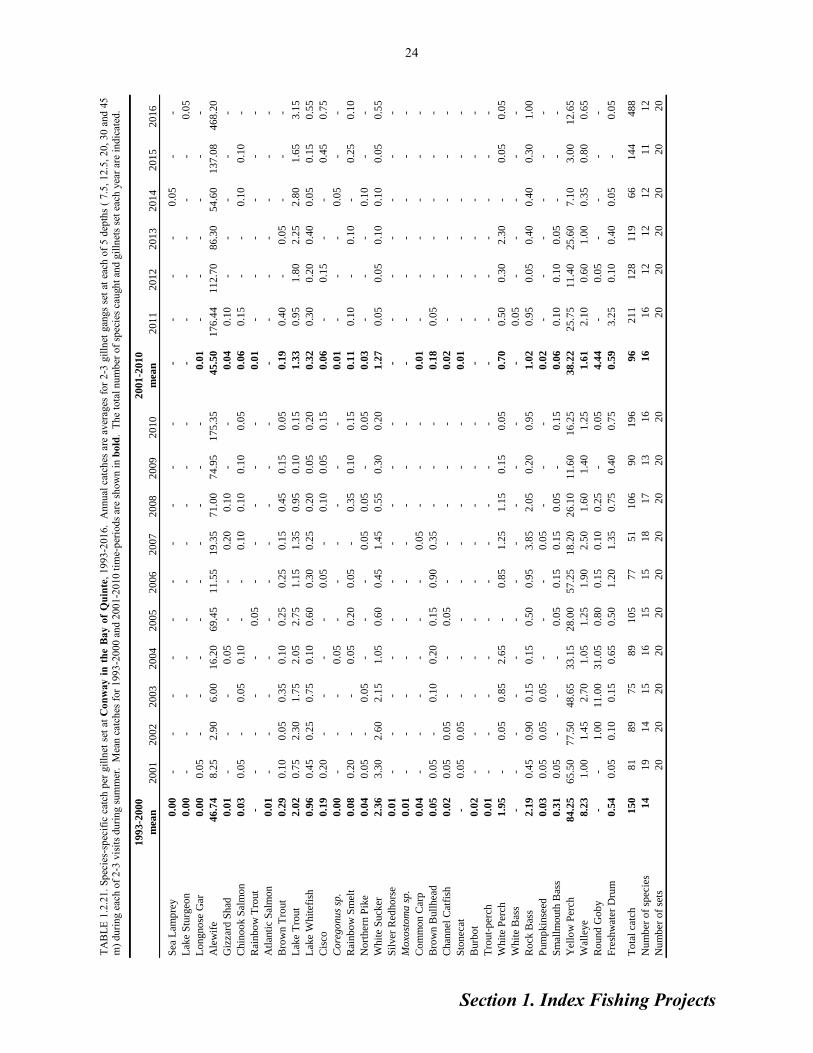
Section 1. Index Fishing Projects
TA
BL
E 1
.2.2
1.
Sp
ecie
s-sp
ecif
ic c
atch
per
gil
lnet
set
at
Co
nw
ay
in
th
e B
ay o
f Q
uin
te,
19
93-2
01
6.
An
nu
al c
atch
es a
re a
ver
ages
for
2-3
gil
lnet
gan
gs
set
at e
ach o
f 5
dep
ths
( 7
.5,
12.5
, 2
0,
30
and 4
5
m)
du
rin
g e
ach o
f 2-3
vis
its
du
rin
g s
um
mer
. M
ean
cat
ches
for
199
3-2
000
an
d 2
00
1-2
010
tim
e-p
erio
ds
are
show
n i
n b
old
. T
he
tota
l nu
mb
er o
f sp
ecie
s ca
ugh
t an
d g
illn
ets
set
each
yea
r ar
e in
dic
ated
.
24
19
93
-20
00
mea
n2
00
12
00
22
00
32
00
42
00
52
00
62
00
72
00
82
00
92
01
0
20
01
-20
10
mea
n2
01
12
01
22
01
32
01
42
01
52
01
6
Sea
Lam
pre
y0
.00
-
-
-
-
-
-
-
-
-
-
-
-
-
-
0
.05
-
-
Lak
e S
turg
eon
0.0
0
-
-
-
-
-
-
-
-
-
-
-
-
-
-
-
-
0
.05
Lo
ngno
se G
ar0
.00
0.0
5
-
-
-
-
-
-
-
-
-
0.0
1
-
-
-
-
-
-
Ale
wif
e4
6.7
4
8.2
5
2
.90
6.0
0
1
6.2
0
69
.45
1
1.5
5
19
.35
7
1.0
0
74
.95
1
75
.35
4
5.5
0
17
6.4
4
11
2.7
0
86
.30
5
4.6
0
13
7.0
8
46
8.2
0
Giz
zard
Shad
0.0
1
-
-
-
0
.05
-
-
0.2
0
0
.10
-
-
0
.04
0.1
0
-
-
-
-
-
Chin
oo
k S
alm
on
0.0
3
0
.05
-
0.0
5
0
.10
-
-
0.1
0
0
.10
0.1
0
0
.05
0
.06
0.1
5
-
-
0
.10
0.1
0
-
Rai
nb
ow
Tro
ut
-
-
-
-
-
0.0
5
-
-
-
-
-
0.0
1
-
-
-
-
-
-
Atl
anti
c S
alm
on
0.0
1
-
-
-
-
-
-
-
-
-
-
-
-
-
-
-
-
-
Bro
wn T
rout
0.2
9
0
.10
0.0
5
0
.35
0.1
0
0
.25
0.2
5
0
.15
0.4
5
0
.15
0.0
5
0.1
9
0
.40
-
0.0
5
-
-
-
Lak
e T
rout
2.0
2
0
.75
2.3
0
1
.75
2.0
5
2
.75
1.1
5
1
.35
0.9
5
0
.10
0.1
5
1.3
3
0
.95
1
.80
2
.25
2.8
0
1
.65
3
.15
Lak
e W
hit
efis
h0
.96
0.4
5
0
.25
0.7
5
0
.10
0.6
0
0
.30
0.2
5
0
.20
0.0
5
0
.20
0
.32
0.3
0
0.2
0
0.4
0
0
.05
0.1
5
0.5
5
Cis
co0
.19
0.2
0
-
-
-
-
0
.05
-
0.1
0
0
.05
0.1
5
0.0
6
-
0.1
5
-
-
0.4
5
0.7
5
Co
reg
on
us
sp.
0.0
0
-
-
-
0
.05
-
-
-
-
-
-
0
.01
-
-
-
0.0
5
-
-
Rai
nb
ow
Sm
elt
0.0
8
0
.20
-
-
0.0
5
0
.20
0.0
5
-
0
.35
0.1
0
0
.15
0
.11
0.1
0
-
0
.10
-
0.2
5
0.1
0
No
rther
n P
ike
0.0
4
0
.05
-
0.0
5
-
-
-
0
.05
0.0
5
-
0
.05
0
.03
-
-
-
0.1
0
-
-
Whit
e S
uck
er2
.36
3.3
0
2
.60
2.1
5
1
.05
0.6
0
0
.45
1.4
5
0
.55
0.3
0
0
.20
1
.27
0.0
5
0.0
5
0.1
0
0
.10
0.0
5
0.5
5
Sil
ver
Red
ho
rse
0.0
1
-
-
-
-
-
-
-
-
-
-
-
-
-
-
-
-
-
Mo
xost
om
a s
p.
0.0
1
-
-
-
-
-
-
-
-
-
-
-
-
-
-
-
-
-
Co
mm
on C
arp
0.0
4
-
-
-
-
-
-
0
.05
-
-
-
0
.01
-
-
-
-
-
-
Bro
wn B
ull
hea
d0
.05
0.0
5
-
0
.10
0.2
0
0
.15
0.9
0
0
.35
-
-
-
0
.18
0.0
5
-
-
-
-
-
Chan
nel
Cat
fish
0.0
2
0
.05
0.0
5
-
-
0
.05
-
-
-
-
-
0
.02
-
-
-
-
-
-
Sto
nec
at-
0
.05
0.0
5
-
-
-
-
-
-
-
-
0.0
1
-
-
-
-
-
-
Burb
ot
0.0
2
-
-
-
-
-
-
-
-
-
-
-
-
-
-
-
-
-
Tro
ut-
per
ch0
.01
-
-
-
-
-
-
-
-
-
-
-
-
-
-
-
-
-
Whit
e P
erch
1.9
5
-
0
.05
0.8
5
2
.65
-
0.8
5
1
.25
1.1
5
0
.15
0.0
5
0.7
0
0
.50
0
.30
2
.30
-
0.0
5
0.0
5
Whit
e B
ass
-
-
-
-
-
-
-
-
-
-
-
-
0
.05
-
-
-
-
-
Ro
ck B
ass
2.1
9
0
.45
0.9
0
0
.15
0.1
5
0
.50
0.9
5
3
.85
2.0
5
0
.20
0.9
5
1.0
2
0
.95
0
.05
0
.40
0.4
0
0
.30
1
.00
Pum
pkin
seed
0.0
3
0
.05
0.0
5
0
.05
-
-
-
0.0
5
-
-
-
0.0
2
-
-
-
-
-
-
Sm
allm
outh
Bas
s0
.31
0.0
5
-
-
-
0
.05
0.1
5
0
.15
0.0
5
-
0
.15
0
.06
0.1
0
0.1
0
0.0
5
-
-
-
Yel
low
Per
ch8
4.2
5
65
.50
7
7.5
0
48
.65
3
3.1
5
28
.00
5
7.2
5
18
.20
2
6.1
0
11
.60
1
6.2
5
3
8.2
2
25
.75
11
.40
25
.60
7
.10
3.0
0
12
.65
Wal
leye
8.2
3
1
.00
1.4
5
2
.70
1.0
5
1
.25
1.9
0
2
.50
1.6
0
1
.40
1.2
5
1.6
1
2
.10
0
.60
1
.00
0.3
5
0
.80
0
.65
Ro
und
Go
by
-
-
1.0
0
1
1.0
0
31
.05
0
.80
0.1
5
0
.10
0.2
5
-
0
.05
4
.44
-
0
.05
-
-
-
-
Fre
shw
ater
Dru
m0
.54
0.0
5
0
.10
0.1
5
0
.65
0.5
0
1
.20
1.3
5
0
.75
0.4
0
0
.75
0
.59
3.2
5
0.1
0
0.4
0
0
.05
-
0
.05
To
tal
catc
h1
50
8
1
8
9
7
5
8
9
1
05
7
7
5
1
1
06
9
0
1
96
96
21
1
1
28
11
9
66
14
4
4
88
Num
ber
of
spec
ies
14
19
14
15
16
15
15
18
17
13
16
1
6
1
6
12
1
2
1
2
1
1
12
Num
ber
of
sets
20
20
20
20
20
20
20
20
20
20
2
0
20
2
0
2
0
2
0
20

Section 1. Index Fishing Projects
TA
BL
E 1
.2.2
2.
Sp
ecie
s-sp
ecif
ic c
atch
per
gil
lnet
set
at
Hay
Bay
in
th
e B
ay
of
Qu
inte
, 199
2-2
016
. A
nnual
cat
ches
are
aver
ages
for
1-3
gil
lnet
gan
gs
set
at e
ach
of
2 d
epth
s (7
.5 a
nd
12
.5 m
) du
rin
g
each
of
1-3
vis
its
du
rin
g s
um
mer
. M
ean
cat
ches
for
1992
-200
0 a
nd 2
00
1-2
010
tim
e-p
erio
ds
are
show
n i
n b
old
. T
he
tota
l nu
mb
er o
f sp
ecie
s ca
ugh
t an
d g
illn
ets
set
each
yea
r ar
e in
dic
ated
.
25
19
92
-20
00
mea
n2
00
12
00
22
00
32
00
42
00
52
00
62
00
72
00
82
00
92
01
0
20
01
-20
10
mea
n2
01
12
01
22
01
32
01
42
01
52
01
6
Sea
Lam
pre
y-
-
-
-
-
-
-
-
0.1
3
-
-
0.0
1
-
-
-
-
-
-
Lak
e S
turg
eon
0.0
1
-
-
-
-
-
-
-
-
-
-
-
-
-
-
-
-
-
Lo
ngno
se G
ar-
-
-
-
-
-
-
0
.13
-
-
-
0.0
1
-
-
-
-
-
-
Ale
wif
e8
.33
19
.25
8.1
3
-
1
.25
0.2
5
7.5
0
3
.75
0
.13
9.7
5
2
8.7
5
7
.88
12
.00
5
.38
3.7
5
4
.88
13
.13
5
7.2
5
Giz
zard
Shad
0.7
1
-
0.2
5
-
-
-
0.5
0
0
.13
0
.13
-
-
0
.10
-
0.3
8
5
.38
-
1.2
5
-
Chin
oo
k S
alm
on
0.0
4
-
-
-
-
-
-
-
-
-
-
-
-
0
.13
-
-
0.1
3
-
Rai
nb
ow
tro
ut
-
-
-
-
-
-
-
-
-
-
-
-
-
-
-
-
-
0.0
8
Bro
wn T
rout
0.0
1
-
-
-
-
-
-
-
-
-
-
-
-
-
-
-
-
-
Lak
e T
rout
0.1
2
-
-
0
.25
-
-
-
-
-
-
-
0.0
3
-
-
-
-
-
0
.33
Lak
e W
hit
efis
h0
.06
0.1
3
-
-
-
-
-
-
-
-
-
0
.01
-
-
-
-
-
0.0
8
Cis
co (
Lak
e H
erri
ng)
3.7
9
1
.00
0
.13
-
0.1
3
-
-
0.1
3
-
0.1
3
1
0.2
5
1
.18
0.3
8
0
.25
-
-
-
0.4
2
Co
reg
on
us
sp.
0.0
4
-
-
-
-
-
-
-
0.1
3
-
-
0.0
1
-
-
-
-
-
-
Rai
nb
ow
Sm
elt
0.1
9
-
0.2
5
-
-
-
0.1
3
-
-
0.3
8
-
0.0
8
-
-
-
-
0
.13
-
No
rther
n P
ike
1.0
0
0
.88
0
.13
0
.38
-
0
.50
0
.38
1.1
3
1.0
0
0
.50
3.0
0
0.7
9
0
.38
0.1
3
-
0
.25
0.1
3
0
.67
Whit
e S
uck
er6
.12
5.6
3
2.8
8
2.2
5
6.1
3
1
.50
1
.75
1.3
8
2.5
0
4
.25
8.7
5
3.7
0
2
.25
2.7
5
0
.88
5.3
8
3
.38
3.9
2
Riv
er R
edho
rse
-
-
-
-
-
-
-
0.1
3
-
-
-
0
.01
-
-
-
-
-
-
Co
mm
on C
arp
0.2
3
-
-
-
-
-
-
-
-
-
-
-
-
-
0
.13
-
-
-
Go
lden
Shin
er-
-
-
-
-
-
-
-
-
-
-
-
-
0
.25
0.1
3
-
0
.50
1.3
3
Sp
ott
ail
Shin
er0
.01
-
-
-
-
-
-
0.1
3
-
-
-
0
.01
-
-
-
-
-
-
Bro
wn B
ull
hea
d0
.94
0.8
8
0.1
3
0.2
5
0.2
5
0
.38
0
.88
0.3
8
0.5
0
-
-
0.3
6
-
-
-
0
.25
0.1
3
-
Chan
nel
Cat
fish
0.0
1
-
-
0
.13
0
.13
-
-
-
-
-
-
0
.03
-
-
-
-
-
-
Burb
ot
0.0
4
-
-
-
-
-
-
-
-
-
-
-
-
-
-
-
-
-
Whit
e P
erch
11
.00
0
.50
5
.38
8
.38
1
4.5
0
0.1
3
30
.13
1
6.2
5
2
0.7
5
9.3
8
1
.75
1
0.7
1
4.0
0
7
.88
55
.63
1
.00
0.6
3
2
.92
Whit
e b
ass
-
-
-
-
-
-
-
-
-
-
-
-
-
0.1
3
-
-
-
0
.25
Ro
ck B
ass
0.0
3
-
-
-
-
-
-
-
0.1
3
-
-
0.0
1
-
-
-
-
-
-
Pum
pkin
seed
0.8
6
1
.13
1
.00
0
.63
2
.13
0.3
8
0.6
3
0
.75
0
.75
0.7
5
0
.75
0
.89
0.7
5
-
-
0
.50
-
0.0
8
Blu
egil
l-
-
-
-
-
-
-
-
-
-
-
-
0
.13
-
-
-
-
-
Sm
allm
outh
Bas
s0
.10
0.1
3
0.1
3
-
-
-
-
-
-
-
-
0.0
3
-
-
-
-
-
-
Bla
ck C
rap
pie
-
-
-
-
-
-
-
-
-
-
-
-
-
-
0.1
3
-
-
0
.08
Yel
low
Per
ch1
54
.09
14
4.1
3
11
2.1
3
11
0.5
0
86
.00
1
42
.75
6
4.0
0
10
2.0
0
98
.88
8
1.6
3
21
0.0
0
11
5.2
0
9
4.6
3
35
.75
6
.13
53
.50
3
7.2
5
11
3.5
8
Wal
leye
4.3
9
2
.50
3
.75
2
.75
2
.13
0.8
8
1.7
5
2
.50
1
.13
2.7
5
2
.00
2
.21
1.5
0
1
.25
2.8
8
2
.13
0.7
5
2
.00
Ro
und
Go
by
-
-
0
.25
0
.25
0
.25
0.1
3
-
-
-
-
-
0.0
9
-
-
-
-
-
-
Fre
shw
ater
Dru
m1
.08
0.2
5
3.1
3
1.2
5
6.6
3
2
.50
8
.25
1.0
0
0.8
8
1
.00
0.7
5
2.5
6
0
.25
0.6
3
3
.88
2.7
5
0
.13
0.4
2
To
tal
catc
h1
93
1
76
13
8
1
27
12
0
14
9
1
16
1
30
12
7
11
1
26
6
1
46
1
16
5
5
7
9
7
1
5
8
1
83
Num
ber
of
spec
ies
14
12
1
4
11
1
1
1
0
11
14
1
3
1
0
9
12
10
11
8
9
11
12
Num
ber
of
sets
8
8
8
8
8
8
8
8
8
4
8
8
8
8
8
12

Section 1. Index Fishing Projects
TA
BL
E 1
.2.2
3.
Sp
ecie
s-sp
ecif
ic c
atch
per
gil
lnet
set
at
Big
Bay
in
th
e B
ay
of
Qu
inte
, 1
992-2
01
6.
Ann
ual
cat
ches
are
aver
ages
for
2 g
illn
et g
angs
set
du
rin
g e
ach
of
2-4
vis
its
du
rin
g s
um
mer
. M
ean
catc
hes
for
199
2-2
000
and
20
01-2
01
0 t
ime-
per
iod
s ar
e sh
ow
n i
n b
old
. T
he
tota
l n
um
ber
of
spec
ies
cau
ght
and
gil
lnet
s se
t ea
ch y
ear
are
ind
icat
ed.
26
19
92
-20
00
mea
n2
00
12
00
22
00
32
00
42
00
52
00
62
00
72
00
82
00
92
01
0
20
01
-20
10
mea
n2
01
12
01
22
01
32
01
42
01
52
01
6
Lak
e S
turg
eon
0.0
2
-
-
-
-
-
-
-
-
-
-
-
-
-
-
-
-
-
Lo
ngno
se G
ar1
.39
1.0
0
1.0
0
0.1
7
1.0
0
1.5
0
3.0
0
0.3
3
2.5
0
3.7
7
6.5
0
2
.08
2.3
3
3
.83
1
2.8
3
0
.17
1.6
7
3
.63
Ale
wif
e0
.70
-
0
.88
1
.67
3
.17
-
0.7
5
-
1
.00
2
.67
1
.00
1.1
1
0
.50
0.5
0
0.1
7
2.1
7
2
.17
2.3
8
Giz
zard
Shad
7.2
3
2
.13
6
.63
2
.00
0
.17
4
2.1
7
0
.25
1
.00
3
.67
-
3.3
3
6
.13
88
.50
1
0.8
3
-
-
1.5
0
3
.75
Lak
e W
hit
efis
h-
-
-
-
-
-
-
-
-
-
-
-
-
0.1
7
-
-
-
-
No
rther
n P
ike
0.6
8
0
.13
0
.13
-
0.1
7
0.1
7
0.5
0
0.1
7
-
-
-
0.1
3
-
-
-
-
-
0
.25
Mo
oney
e0
.04
-
-
-
-
-
-
-
-
-
-
-
-
-
-
-
-
-
Whit
e S
uck
er7
.30
3.5
0
9.2
5
2.3
3
5.3
3
2.5
0
5.0
0
2.5
0
4.3
3
3.3
3
3.6
7
4
.18
4.0
0
7
.00
5
.50
3
.50
7.0
0
4
.13
Sil
ver
Red
ho
rse
-
-
-
-
-
-
-
-
-
-
0
.17
0.0
2
-
-
-
-
-
-
Sho
rthea
d R
edho
rse
-
-
-
-
-
-
-
-
-
-
-
-
-
-
-
-
-
0
.13
Mo
xost
om
a s
p.
0.0
4
0
.13
-
0.1
7
-
-
-
-
-
-
-
0.0
3
-
-
-
-
-
-
Co
mm
on C
arp
0.3
0
-
-
0
.17
0
.17
-
-
-
-
-
-
0.0
3
-
-
-
-
-
-
Bro
wn B
ull
hea
d6
.72
6.7
5
5.5
0
1.8
3
2.3
3
0.8
3
2.0
0
0.8
3
0.6
7
0.6
7
-
2.1
4
0
.17
0.5
0
1.1
7
0.3
3
0
.67
0.5
0
Chan
nel
Cat
fish
0.3
7
-
0.1
3
-
0
.17
-
0.2
5
-
-
0.1
7
-
0.0
7
-
-
0.1
7
0.1
7
-
0
.50
Burb
ot
0.0
4
-
-
-
-
-
-
-
-
-
-
-
-
-
-
-
-
-
Whit
e P
erch
90
.12
2
2.0
0
3
6.3
8
5
9.8
3
1
30
.50
7
9.5
0
1
96
.75
1
19
.00
1
27
.50
1
23
.17
9
2.0
0
98
.66
9
1.8
3
13
8.0
0
14
4.1
7
17
.17
3
5.6
7
76
.75
Whit
e B
ass
0.0
8
-
0.1
3
-
-
-
-
0.1
7
0.1
7
-
-
0
.05
-
0.1
7
-
0
.33
0.5
0
1
.38
Ro
ck B
ass
0.2
6
-
-
-
-
0
.17
-
-
-
-
-
0
.02
-
-
0
.17
-
0
.83
-
Pum
pkin
seed
3.9
7
1
7.0
0
8
.25
0
.83
4
.33
0
.33
3
.25
0
.50
1
.00
0
.67
0
.17
3.6
3
0
.83
1.0
0
2.5
0
0.6
7
0
.50
1.6
3
Blu
egil
l0
.57
7.1
3
3.7
5
0.5
0
0.3
3
2.5
0
6.5
0
5.3
3
3.1
7
5.5
5
6.6
7
4
.14
6.8
3
1
.17
1
1.3
3
4
.33
11
.83
0
.63
Sm
allm
outh
Bas
s1
.11
0.5
0
-
-
-
-
0.5
0
-
-
0.1
7
-
0.1
2
-
-
-
-
-
-
Lar
gem
outh
Bas
s0
.02
-
-
-
-
-
0
.25
-
-
-
0.1
7
0
.04
-
-
-
-
-
-
Bla
ck C
rap
pie
0.1
1
0
.25
0
.38
0
.33
0
.17
0
.17
2
.25
1
.00
0
.33
-
-
0.4
9
-
-
-
-
-
-
Yel
low
Per
ch1
38
.65
19
0.6
3
18
2.8
8
11
5.3
3
10
9.6
7
10
3.0
0
11
9.0
0
16
.50
63
.00
12
9.5
4
43
.17
1
07
.27
47
.17
1
7.6
7
2
6.6
7
7
1.6
7
59
.00
3
9.6
3
Wal
leye
16
.88
4
.50
7
.63
6
.50
8
.00
5
.83
1
0.7
5
5
.33
9
.17
8
.00
1
0.8
3
7.6
5
6
.33
5.1
7
17
.17
6.3
3
5
.33
7.2
5
Ro
und
Go
by
-
-
-
0.3
3
0.3
3
0.5
0
-
-
-
-
-
0.1
2
-
-
-
-
-
-
Fre
shw
ater
Dru
m1
5.5
0
21
.25
7.3
8
7.3
3
7.3
3
9.5
0
19
.75
11
.33
6.5
0
8.6
7
4.8
3
1
0.3
9
5.5
0
3
.33
5
.33
4
.83
10
.33
2
8.3
8
To
tal
catc
h2
92
2
77
27
0
1
99
27
3
2
49
37
1
1
64
22
3
2
86
17
3
24
8
25
4
18
9
2
27
11
2
13
7
17
1
Num
ber
of
spec
ies
15
14
1
5
16
1
7
14
1
6
13
1
3
12
1
2
1
4
1
1
1
2
12
1
2
1
3
1
4
Num
ber
of
sets
8
8
6
6
6
4
6
6
6
6
6
6
6
6
6
8

Section 1. Index Fishing Projects
27
FIG
. 1
.2.4
. A
bund
ance
tre
nd
s (a
nnual
mea
ns)
for
the
most
com
mon s
pec
ies
cau
gh
t in
gil
l n
ets
at t
hre
e ar
eas
in t
he
Bay
of
Qu
inte
(C
on
way
, H
ay B
ay a
nd
Big
Bay
; se
e F
ig.
1.2
.1).
D
ott
ed l
ines
sh
ow
3-y
r ru
nn
ing a
ver
ages
(tw
o y
ears
for
firs
t an
d l
ast
yea
rs g
rap
hed
).
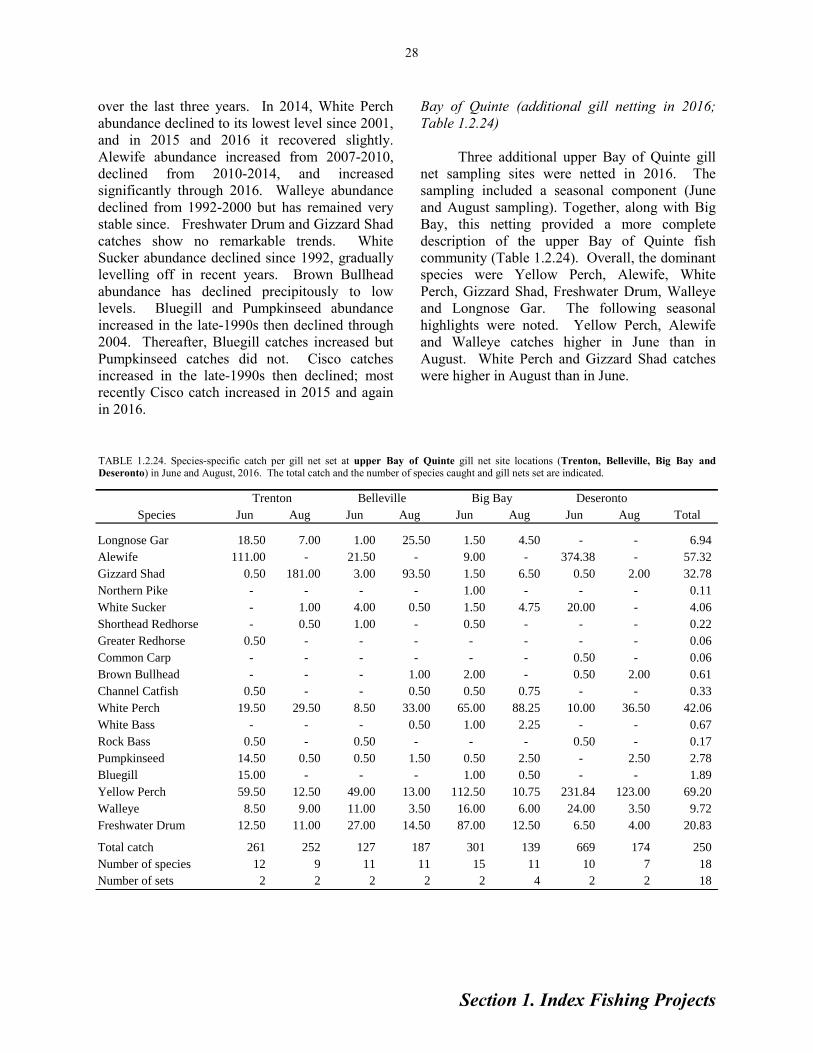
Section 1. Index Fishing Projects
28
over the last three years. In 2014, White Perch
abundance declined to its lowest level since 2001,
and in 2015 and 2016 it recovered slightly.
Alewife abundance increased from 2007-2010,
declined from 2010-2014, and increased
significantly through 2016. Walleye abundance
declined from 1992-2000 but has remained very
stable since. Freshwater Drum and Gizzard Shad
catches show no remarkable trends. White
Sucker abundance declined since 1992, gradually
levelling off in recent years. Brown Bullhead
abundance has declined precipitously to low
levels. Bluegill and Pumpkinseed abundance
increased in the late-1990s then declined through
2004. Thereafter, Bluegill catches increased but
Pumpkinseed catches did not. Cisco catches
increased in the late-1990s then declined; most
recently Cisco catch increased in 2015 and again
in 2016.
Bay of Quinte (additional gill netting in 2016;
Table 1.2.24)
Three additional upper Bay of Quinte gill
net sampling sites were netted in 2016. The
sampling included a seasonal component (June
and August sampling). Together, along with Big
Bay, this netting provided a more complete
description of the upper Bay of Quinte fish
community (Table 1.2.24). Overall, the dominant
species were Yellow Perch, Alewife, White
Perch, Gizzard Shad, Freshwater Drum, Walleye
and Longnose Gar. The following seasonal
highlights were noted. Yellow Perch, Alewife
and Walleye catches higher in June than in
August. White Perch and Gizzard Shad catches
were higher in August than in June.
TABLE 1.2.24. Species-specific catch per gill net set at upper Bay of Quinte gill net site locations (Trenton, Belleville, Big Bay and
Deseronto) in June and August, 2016. The total catch and the number of species caught and gill nets set are indicated.
Species Jun Aug Jun Aug Jun Aug Jun Aug Total
Longnose Gar 18.50 7.00 1.00 25.50 1.50 4.50 - - 6.94
Alewife 111.00 - 21.50 - 9.00 - 374.38 - 57.32
Gizzard Shad 0.50 181.00 3.00 93.50 1.50 6.50 0.50 2.00 32.78
Northern Pike - - - - 1.00 - - - 0.11
White Sucker - 1.00 4.00 0.50 1.50 4.75 20.00 - 4.06
Shorthead Redhorse - 0.50 1.00 - 0.50 - - - 0.22
Greater Redhorse 0.50 - - - - - - - 0.06
Common Carp - - - - - - 0.50 - 0.06
Brown Bullhead - - - 1.00 2.00 - 0.50 2.00 0.61
Channel Catfish 0.50 - - 0.50 0.50 0.75 - - 0.33
White Perch 19.50 29.50 8.50 33.00 65.00 88.25 10.00 36.50 42.06
White Bass - - - 0.50 1.00 2.25 - - 0.67
Rock Bass 0.50 - 0.50 - - - 0.50 - 0.17
Pumpkinseed 14.50 0.50 0.50 1.50 0.50 2.50 - 2.50 2.78
Bluegill 15.00 - - - 1.00 0.50 - - 1.89
Yellow Perch 59.50 12.50 49.00 13.00 112.50 10.75 231.84 123.00 69.20
Walleye 8.50 9.00 11.00 3.50 16.00 6.00 24.00 3.50 9.72
Freshwater Drum 12.50 11.00 27.00 14.50 87.00 12.50 6.50 4.00 20.83
Total catch 261 252 127 187 301 139 669 174 250
Number of species 12 9 11 11 15 11 10 7 18
Number of sets 2 2 2 2 2 4 2 2 18
Trenton Belleville Big Bay Deseronto

Section 1. Index Fishing Projects
29
TABLE 1.2.25. Age distribution of 45 Lake Whitefish sampled from summer index gill nets, by region, during 2016. Also shown are mean fork length and mean weight.
TABLE 1.2.26. Age distribution of 406 Walleye sampled from summer index gill nets, by region, 2016. Also shown are mean fork length, mean weight, mean GSI (females), and percent mature (females). GSI = gonadal somatic index calculated for females only as log10(gonad
weight + 1)/log10(weight). Note that a GSI greater than approximately 0.25 indicates a mature female.
Species Highlights
Lake Whitefish
Fourty-five Lake Whitefish were caught
and were interpreted for age in the 2016 index gill
nets (Table 1.2.25). Fish ranged in age from 1-26
years but most fish (89%) were 10 years old or
less. Eight (18%) whitefish were from the 2013
year-class and seven (16%) were from the 2012
year-class.
Walleye
Four hundred and six Walleye were caught
and interpreted for age in the 2016 index gill nets
(Table 1.2.26). One hundred and eighty-seven
(87%) of 214 Walleye caught in the Bay of
Quinte gill nets were age 1-4 years. In the
Kingston Basin nearshore gill nets, 90% (145) of
the 161 Walleye were age-5 or greater. Age-2
walleye from the 2014 year-class were prominent
in the age distribution.
1 2 3 4 5 6 7 8 9 10 11 12 13 14 15 16 17 18 20 22 24
Region 2015 2014 2013 2012 2011 2010 2009 2008 2007 2006 2005 2004 2003 2002 2001 2000 1999 1998 1996 1994 1992 Total
Central 1 1 2
Northeast 3 3 2 2 2 1 1 14
Middle Ground 7 5 1 1 1 15
Kingston Basin 13 1 2 12 8 3 22 21 10 14 9 20 1 7 1 8 3 2 1 3 161
Bay of Quinte 48 105 21 13 13 6 3 4 1 214
Total aged 58 126 23 16 27 15 7 28 21 12 16 9 21 1 7 1 9 3 2 1 3 406
Mean fork length
(mm) 211 307 437 471 507 554 583 600 617 631 647 615 632 590 640 639 631 619 634 580 630
Mean weight (g) 100 315 976 1262 1777 2197 2562 3017 3258 3592 3697 3232 3562 3047 3835 3455 3582 3426 3148 2991 3423
Mean GSI
(females) 0.05 0.13 0.25 0.30 0.32 0.35 0.42 0.39 0.38 0.44 0.42 0.34 0.38 0.26 0.39 0.38 0.30 0.26
% mature 0 5 50 71 82 80 100 89 74 88 93 80 92 100 80 100 100 100
Age / Year-class
1 2 3 4 5 6 7 8 9 10 12 13 22 24 26
Region 2015 2014 2013 2012 2011 2010 2009 2008 2007 2006 2004 2003 1994 1992 1990 Total
Central 1 1
Northeast 1 4 1 1 1 8
Kingston Basin (deep) 2 1 1 3 3 1 1 1 13
Kingston Basin (nearshore) 1 1 1 2 1 1 1 1 1 1 11
Bay of Quinte 2 7 1 1 1 12
Total aged 2 4 8 7 1 5 6 3 1 3 1 1 1 1 1 45
Mean fork length (mm) 181 218 259 366 380 390 433 415 416 492 516 451 460 602 585
Mean weight (g) 55 122 193 585 613 731 970 782 867 1589 1881 1012 1232 3192 2588
Age / Year-class

Section 1. Index Fishing Projects
30
Bottom trawling has been used to monitor
the relative abundance of small fish species and
the young of large-bodied species in the fish
community since the 1960s. After some initial
experimentation with different trawl
specifications, two trawl configurations (one for
the Bay of Quinte and one for Lake Ontario) were
routinely employed (see trawl specifications
Table 1.3.1).
In the Kingston Basin of eastern Lake
Ontario, six sites, ranging in depth from about 20
to 35 m, were visited about four times annually up
until 1992 when three sites were dropped. From
1992 to 2015, three visits were made to each of
three sites annually, and four replicate ½ mile
trawls are made during each visit. After 1995, a
deep water site was added outside the Kingston
Basin, south of Rocky Point (visited twice
annually with a trawling distance of 1 mile; about
100 m water depth), to give a total of four Lake
sites (Fig. 1.3.1). In 2014, a second trawl site/
depth was added at Rocky Point (60 m) and two
trawl sites at each of Cobourg and Port Credit (60
3/4 Western (Poly) 3/4 Yankee Standard No. 35
(Bay Trawl) (Lake Trawl)
Head Rope Length (m) 14.24 12
Foot Rope Length (m) 19 17.5
Side Brail Height (m) 2 1.9
Mesh Size (front) 4" knotted black poly 3.5" knotted green nylon
Twine Type (middle) 3" knotted black poly 2.5" knotted nylon
Before Codend 2" knotted black poly 2" knotted nylon
1.5" knotted black nylon (chafing gear)
1" knotted black nylon
Codend Mesh Size 0.5" knotted white nylon 0.5" knotless white nylon
Remarks: Fishing height 2.0 m Fishing height 1.9 m
FISHNET gear dimensions FISHNET gear dimensions
as per Casselman 92/06/08 as per Casselman 92/06/08
GRLEN:length of net N/A N/A
GRHT:funnel opening height 2.25 m 2.3 m
GRWID:intake width 6.8 m 9.9 m
GRCOL:1 wt,2 bl,3 gn 2 7 (discoloured)
GRMAT:1 nylon,2 ploypr. 2 1
GRYARN:1 mono,2 multi 2 2
GRKNOT:1 knotless,2 knots 2 2
TABLE 1.3.1. Bottom trawl specifications used in Eastern Lake Ontario and Bay of Quinte Fish Community sampling.
and 100 m depths at both locations). In 2015, the
Lake Ontario trawling was expanded significantly
to include several more sampling depths at each
of Rocky Point, Cobourg, and Port Credit. In
2016 the three Kingston Basin sites that were
dropped in 1992 were added back in to the
sampling design, and trawling was not done at
Cobourg or Port Credit. [Note that these sites
were sampled in spring and fall prey fish
assessments (see Section 1.11 and 1.12)]. In the
Bay of Quinte, six fixed-sites, ranging in depth
from about 4 to 21 m, are visited annually on two
or three occasions during mid to late-summer.
Four replicate ¼ mile trawls are made during each
visit to each site. The 2016 bottom trawl sampling
design is shown in Table 1.3.2.
Thirty species and over 72,000 fish were
caught in 78 bottom trawls in 2016 (20-Jun to 7-
Sep, Table 1.3.3). Alewife (27%), Gizzard Shad
(18%), Round Goby (18%) and Yellow Perch
(15%), collectively made up 86% of the catch by
number. Species-specific catches in the 2016
1.3 Lake Ontario and Bay of Quinte Fish Community Index Trawling J. A. Hoyle, Lake Ontario Management Unit

Section 1. Index Fishing Projects
31
FIG. 1.3.1. Map of north eastern Lake Ontario. Shown are eastern Lake Ontario and Bay of Quinte fish community index bottom trawling site locations.
Area name Site name
Depth
(m) Visits*
Replicates x
distance
Latitude
(dec deg)
Longitude
(dec deg)
Visits
x reps Time-frame
Start-up
year
Number
years
Kingston Basin EB01 30 3 1 x 1/2 mile 44.06267 -76.79483 3 Jun 20-Sep 9 1972
Kingston Basin EB02 30 3 1 x 1/2 mile 44.04733 -76.85667 3 Jun 20-Sep 9 1972 45
Kingston Basin EB03 21 3 1 x 1/2 mile 43.95533 -76.74350 3 Jun 20-Sep 9 1972 45
Kingston Basin EB04 35 3 1 x 1/2 mile 43.95733 -76.62083 3 Jun 20-Sep 9 1972
Kingston Basin EB05 33 3 1 x 1/2 mile 44.01733 -76.59383 3 Jun 20-Sep 9 1972
Kingston Basin EB06 35 3 1 x 1/2 mile 43.99050 -76.64167 3 Jul 1-Aug 30 1972 45
Rocky Point 0060 60 1 1 x 1/2 mile 43.82817 -76.85083 1 July 2014 3
Rocky Point 0080 80 1 1 x 1/2 mile 43.77117 -76.81450 1 July 2015 2
Rocky Point 0090 90 1 1 x 1/2 mile 43.75567 -76.82150 1 July 2015 2
Rocky Point 0100 100 1 1 x 1/2 mile 43.74033 -76.81467 1 July 1997 20
Rocky Point 0110 110 1 1 x 1/2 mile 43.72250 -76.82367 1 July 2015 2
Rocky Point 0120 120 1 1 x 1/2 mile 43.71017 -76.82283 1 July 2015 2
Rocky Point 0130 130 1 1 x 1/2 mile 43.69550 -76.82367 1 July 2015 2
Rocky Point 0140 140 1 1 x 1/2 mile 43.68417 -76.83050 1 July 2015 2
Bay of Quinte BQ11 4 2 4 x 1/4 mile 44.09750 -77.52117 8 Aug 1-Sep 15 1972 45
Bay of Quinte BQ12 5 2 4 x 1/4 mile 44.15350 -77.33350 8 Aug 1-Sep 15 1972 45
Bay of Quinte BQ13 5 2 4 x 1/4 mile 44.16067 -77.22633 8 Aug 1-Sep 15 1972 45
Bay of Quinte BQ14 5 2 4 x 1/4 mile 44.16833 -77.05700 8 Aug 1-Sep 15 1972 45
Bay of Quinte BQ15 5 2 4 x 1/4 mile 44.10983 -77.02367 8 Aug 1-Sep 15 1972 45
Bay of Quinte BQ17 21 2 4 x 1/4 mile 44.10783 -76.90550 8 Aug 1-Sep 15 1972 45
Site location (approx)
TABLE 1.3.2. Sampling design of the Lake Ontario fish community index bottom trawling program including geographic stratification, number of visits, number of replicate trawls made during each visit, and the time-frame for completion of visits.
Also shown is the year in which bottom trawling at a particular area was initiated and the number of years that trawling has
occurred. Note that in 2016 a fourth visit was made to EB03 (Sep) and 4 replicate trawls were conducted.
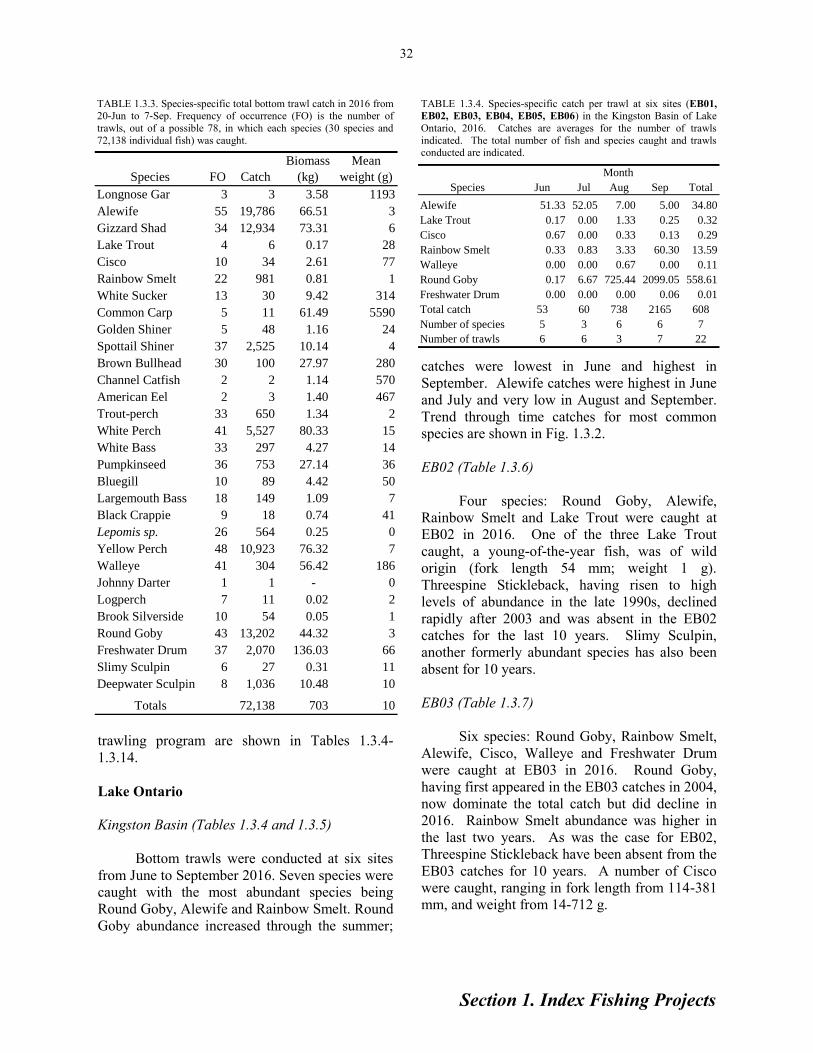
Section 1. Index Fishing Projects
32
TABLE 1.3.3. Species-specific total bottom trawl catch in 2016 from
20-Jun to 7-Sep. Frequency of occurrence (FO) is the number of
trawls, out of a possible 78, in which each species (30 species and
72,138 individual fish) was caught.
trawling program are shown in Tables 1.3.4-
1.3.14.
Lake Ontario
Kingston Basin (Tables 1.3.4 and 1.3.5)
Bottom trawls were conducted at six sites
from June to September 2016. Seven species were
caught with the most abundant species being
Round Goby, Alewife and Rainbow Smelt. Round
Goby abundance increased through the summer;
Species FO Catch
Biomass
(kg)
Mean
weight (g)
Longnose Gar 3 3 3.58 1193
Alewife 55 19,786 66.51 3
Gizzard Shad 34 12,934 73.31 6
Lake Trout 4 6 0.17 28
Cisco 10 34 2.61 77
Rainbow Smelt 22 981 0.81 1
White Sucker 13 30 9.42 314
Common Carp 5 11 61.49 5590
Golden Shiner 5 48 1.16 24
Spottail Shiner 37 2,525 10.14 4
Brown Bullhead 30 100 27.97 280
Channel Catfish 2 2 1.14 570
American Eel 2 3 1.40 467
Trout-perch 33 650 1.34 2
White Perch 41 5,527 80.33 15
White Bass 33 297 4.27 14
Pumpkinseed 36 753 27.14 36
Bluegill 10 89 4.42 50
Largemouth Bass 18 149 1.09 7
Black Crappie 9 18 0.74 41
Lepomis sp. 26 564 0.25 0
Yellow Perch 48 10,923 76.32 7
Walleye 41 304 56.42 186
Johnny Darter 1 1 - 0
Logperch 7 11 0.02 2
Brook Silverside 10 54 0.05 1
Round Goby 43 13,202 44.32 3
Freshwater Drum 37 2,070 136.03 66
Slimy Sculpin 6 27 0.31 11
Deepwater Sculpin 8 1,036 10.48 10
Totals 72,138 703 10
catches were lowest in June and highest in
September. Alewife catches were highest in June
and July and very low in August and September.
Trend through time catches for most common
species are shown in Fig. 1.3.2.
EB02 (Table 1.3.6)
Four species: Round Goby, Alewife,
Rainbow Smelt and Lake Trout were caught at
EB02 in 2016. One of the three Lake Trout
caught, a young-of-the-year fish, was of wild
origin (fork length 54 mm; weight 1 g).
Threespine Stickleback, having risen to high
levels of abundance in the late 1990s, declined
rapidly after 2003 and was absent in the EB02
catches for the last 10 years. Slimy Sculpin,
another formerly abundant species has also been
absent for 10 years.
EB03 (Table 1.3.7)
Six species: Round Goby, Rainbow Smelt,
Alewife, Cisco, Walleye and Freshwater Drum
were caught at EB03 in 2016. Round Goby,
having first appeared in the EB03 catches in 2004,
now dominate the total catch but did decline in
2016. Rainbow Smelt abundance was higher in
the last two years. As was the case for EB02,
Threespine Stickleback have been absent from the
EB03 catches for 10 years. A number of Cisco
were caught, ranging in fork length from 114-381
mm, and weight from 14-712 g.
Species Jun Jul Aug Sep Total
Alewife 51.33 52.05 7.00 5.00 34.80
Lake Trout 0.17 0.00 1.33 0.25 0.32
Cisco 0.67 0.00 0.33 0.13 0.29
Rainbow Smelt 0.33 0.83 3.33 60.30 13.59
Walleye 0.00 0.00 0.67 0.00 0.11
Round Goby 0.17 6.67 725.44 2099.05 558.61
Freshwater Drum 0.00 0.00 0.00 0.06 0.01
Total catch 53 60 738 2165 608
Number of species 5 3 6 6 7
Number of trawls 6 6 3 7 22
Month
TABLE 1.3.4. Species-specific catch per trawl at six sites (EB01,
EB02, EB03, EB04, EB05, EB06) in the Kingston Basin of Lake
Ontario, 2016. Catches are averages for the number of trawls
indicated. The total number of fish and species caught and trawls conducted are indicated.

Section 1. Index Fishing Projects
TA
BL
E 1
.3.5
. S
pec
ies-
spec
ific
cat
ch p
er t
raw
l at
six
sit
es (
EB
01
, E
B02
, E
B0
3,
EB
04,
EB
05,
EB
06
) b
y m
onth
in t
he
Kin
gst
on B
asin
of
Lak
e O
nta
rio,
20
16
. C
atch
es a
re a
ver
ages
for
1 t
o 4
tra
wls
d
uri
ng e
ach
of
3 o
r 4
vis
its
du
rin
g s
um
mer
. T
he
tota
l n
um
ber
of
fish
and
sp
ecie
s ca
ugh
t an
d t
raw
ls c
on
du
cted
are
ind
icat
ed.
Sp
ecie
sJu
nJu
lA
ug
Jun
Jul
Au
gJu
nJu
lA
ug
Sep
Jun
Jul
Sep
Jun
Jul
Sep
Jun
Jul
Sep
To
tal
Ale
wif
e1
21
.00
02
.00
00
.00
00
.00
03
10
.27
82
0.0
00
72
.00
00
.00
01
.00
06
.00
01
.00
00
.00
01
4.0
00
11
0.0
00
0.0
00
0.0
00
4.0
00
0.0
00
0.0
00
34
.80
4
Lak
e T
rou
t1
.00
00
.00
01
.00
00
.00
00
.00
03
.00
00
.00
00
.00
00
.00
00
.00
00
.00
00
.00
00
.00
00
.00
00
.00
01
.00
00
.00
00
.00
00
.00
00
.31
6
Cis
co0
.00
00
.00
00
.00
00
.00
00
.00
00
.00
04
.00
00
.00
01
.00
00
.50
00
.00
00
.00
00
.00
00
.00
00
.00
00
.00
00
.00
00
.00
00
.00
00
.28
9
Rai
nb
ow
Sm
elt
0.0
00
0.0
00
4.0
00
0.0
00
2.0
00
3.0
00
1.0
00
2.0
00
3.0
00
23
6.2
01
0.0
00
0.0
00
1.0
00
0.0
00
1.0
00
1.0
00
1.0
00
0.0
00
3.0
00
13
.59
0
Wal
leye
0.0
00
0.0
00
0.0
00
0.0
00
0.0
00
0.0
00
0.0
00
0.0
00
2.0
00
0.0
00
0.0
00
0.0
00
0.0
00
0.0
00
0.0
00
0.0
00
0.0
00
0.0
00
0.0
00
0.1
05
Ro
un
d G
ob
y0
.00
07
.00
01
20
6.5
41
0.0
00
32
.00
04
57
.07
81
.00
00
.00
05
12
.69
91
46
.49
60
.00
01
.00
01
64
6.8
61
0.0
00
0.0
00
52
43
.71
40
.00
00
.00
01
35
9.1
43
55
8.6
07
Fre
shw
ater
Dru
m0
.00
00
.00
00
.00
00
.00
00
.00
00
.00
00
.00
00
.00
00
.00
00
.25
00
.00
00
.00
00
.00
00
.00
00
.00
00
.00
00
.00
00
.00
00
.00
00
.01
3
To
tal
catc
h1
22
91
21
20
34
44
83
78
25
20
38
91
11
66
21
10
15
24
65
01
36
26
08
Nu
mb
er o
f sp
ecie
s2
23
03
44
15
51
13
11
32
02
7
Nu
mb
er o
f tr
awls
11
11
11
11
14
11
11
11
11
12
2
EB
06
EB
01
EB
02
EB
03
EB
04
EB
05
33

Section 1. Index Fishing Projects
0
50
0
10
00
15
00
20
00
25
00
19
92
19
94
19
96
19
98
20
00
20
02
20
04
20
06
20
08
20
10
20
12
20
14
20
16
Catch per Trawl
Ale
wif
e
0
30
0
60
0
90
0
12
00
15
00
18
00
19
92
19
94
19
96
19
98
20
00
20
02
20
04
20
06
20
08
20
10
20
12
20
14
20
16
Catch per Trawl
Rain
bo
w S
melt
0
20
0
40
0
60
0
80
0
10
00
19
92
19
94
19
96
19
98
20
00
20
02
20
04
20
06
20
08
20
10
20
12
20
14
20
16
Catch per Trawl
Ro
un
d G
ob
y
0
20
0
40
0
60
0
80
0
19
92
19
94
19
96
19
98
20
00
20
02
20
04
20
06
20
08
20
10
20
12
20
14
20
16
Catch per Trawl
Tro
ut-
perc
h
0
20
0
40
0
60
0
19
92
19
94
19
96
19
98
20
00
20
02
20
04
20
06
20
08
20
10
20
12
20
14
20
16
Catch per Trawl
Th
rees
pin
e S
tickle
back
0
50
10
0
15
0
20
0
25
0
19
92
19
94
19
96
19
98
20
00
20
02
20
04
20
06
20
08
20
10
20
12
20
14
20
16
Catch per Trawl
Slim
y S
cu
lpin
01234567
19
92
19
94
19
96
19
98
20
00
20
02
20
04
20
06
20
08
20
10
20
12
20
14
20
16
Catch per Trawl
Jo
hn
ny D
art
er
0.0
0.5
1.0
1.5
2.0
199
21
99
41
99
61
99
82
00
02
00
22
00
42
00
62
00
82
01
02
01
22
01
42
01
6
Catch per Trawl
Lake T
rou
t
0
20
40
60
80
10
0
12
0
14
0
16
0
18
0
20
0
19
92
19
94
19
96
19
98
20
00
20
02
20
04
20
06
20
08
20
10
20
12
20
14
20
16
Catch per TrawlS
po
ttail S
hin
er
0.0
0.4
0.8
1.2
19
92
19
94
19
96
19
98
20
00
20
02
20
04
20
06
20
08
20
10
20
12
20
14
20
16
Catch per Trawl
Cis
co
05
10
15
20
25
19
92
19
94
19
96
19
98
20
00
20
02
20
04
20
06
20
08
20
10
20
12
20
14
20
16
Catch per Trawl
Lake W
hit
efi
sh
0.0
0.1
0.2
0.3
0.4
19
92
19
94
19
96
19
98
20
00
20
02
20
04
20
06
20
08
20
10
20
12
20
14
20
16
Catch per Trawl
Yello
w P
erc
h
FIG
. 1
.3.2
. A
bu
nd
ance
tre
nd
s (a
nnu
al m
ean
s) f
or
the
most
com
mon
sp
ecie
s ca
ught
in b
ott
om
tra
wls
at
thre
e to
six
sit
es i
n t
he
Kin
gst
on
Bas
in,
east
ern
Lak
e O
nta
rio (
EB
01
, E
B0
2,
EB
03,
EB
04
, E
B05
, E
B06
); s
ee F
ig.
1.3
.1).
Dott
ed l
ines
sh
ow
3-y
r ru
nn
ing a
ver
ages
(tw
o y
ears
for
firs
t an
d l
ast
yea
rs g
rap
hed
).
34

Section 1. Index Fishing Projects
TA
BL
E 1
.3.6
. S
pec
ies-
spec
ific
cat
ch p
er t
raw
l (1
2 m
in d
ura
tion;
1/2
mil
e) b
y y
ear
in t
he
fish
com
mun
ity i
ndex
bott
om
tra
wli
ng p
rogra
m d
uri
ng s
um
mer
at
EB
02,
Kin
gst
on
Bas
in,
Lak
e O
nta
rio.
Cat
ches
are
th
e m
ean
num
ber
of
fish
ob
serv
ed f
or
the
num
ber
of
traw
ls i
ndic
ated
. T
ota
l ca
tch
and
nu
mb
er o
f sp
ecie
s ca
ught
are
indic
ated
.
35
Sp
ecie
s
19
92
-20
00
mea
n2
00
12
00
22
00
32
00
42
00
52
00
62
00
72
00
82
00
92
01
0
20
01
-20
10
mea
n2
01
12
01
22
01
32
01
42
01
52
01
6
Ale
wif
e1
22
0.3
79
20
3.3
97
20
.91
71
9.5
00
27
.10
00
.00
00
.41
71
1.0
00
0.6
67
72
.42
94
64
.09
78
1.9
52
1.6
67
24
.29
12
88
.14
32
.67
04
4.4
20
11
0.0
90
Rai
nb
ow
Tro
ut
0.0
19
0.0
00
0.0
00
0.0
00
0.0
00
0.0
00
0.0
00
0.0
00
0.0
00
0.0
00
0.0
00
0.0
00
0.0
00
0.0
00
0.0
00
0.0
00
0.0
00
0.0
00
Lak
e T
rout
0.2
02
0.0
00
0.0
83
0.0
83
0.0
00
0.5
83
0.1
67
0.5
83
0.5
00
0.0
00
0.1
67
0.2
17
0.0
00
0.3
33
0.3
33
0.1
70
0.7
50
1.0
00
Lak
e W
hit
efis
h3
.20
30
.16
70
.00
00
.58
30
.40
00
.25
00
.00
00
.16
70
.00
00
.25
00
.00
00
.18
20
.00
00
.08
30
.00
00
.00
00
.00
00
.00
0
Cis
co (
Lak
e H
erri
ng)
0.3
62
0.0
00
0.0
00
0.0
00
0.0
00
0.0
00
0.0
00
0.0
00
0.0
00
0.0
00
0.0
00
0.0
00
0.0
00
0.0
00
0.0
00
0.0
00
0.0
80
0.0
00
Co
reg
on
us
sp.
0.0
06
0.0
00
0.0
00
0.0
00
0.0
00
0.0
00
0.0
00
0.0
00
0.0
00
0.0
00
0.0
00
0.0
00
0.0
00
0.0
00
0.0
00
0.0
00
0.0
00
0.0
00
Rai
nb
ow
Sm
elt
44
0.9
50
29
.66
77
.91
70
.91
75
.00
01
9.7
50
28
.75
03
.58
35
.66
71
14
.41
61
4.6
67
23
.03
31
.08
31
0.3
33
3.9
17
8.8
30
2.9
20
1.6
70
Em
eral
d S
hin
er0
.00
90
.00
00
.00
00
.00
00
.00
00
.00
00
.00
00
.00
00
.00
00
.00
00
.00
00
.00
00
.00
00
.00
00
.00
00
.00
00
.00
00
.00
0
Burb
ot
0.0
09
0.0
00
0.0
00
0.0
00
0.0
00
0.0
00
0.0
00
0.0
00
0.0
00
0.0
00
0.0
00
0.0
00
0.0
00
0.0
00
0.0
00
0.0
00
0.0
00
0.0
00
Thre
esp
ine
Sti
ckle
bac
k1
3.3
95
18
.75
03
4.4
17
49
.50
06
.20
09
.00
00
.16
70
.00
00
.00
00
.00
00
.00
01
1.8
03
0.0
00
0.0
00
0.0
00
0.0
00
0.0
00
0.0
00
Tro
ut-
per
ch4
.67
50
.25
00
.00
00
.16
70
.00
00
.00
00
.00
00
.00
00
.00
00
.00
00
.00
00
.04
20
.00
00
.00
00
.00
00
.00
00
.00
00
.00
0
Yel
low
Per
ch0
.01
90
.00
00
.00
00
.00
00
.70
00
.33
30
.08
30
.00
00
.00
00
.00
00
.08
30
.12
00
.00
00
.16
70
.00
00
.00
00
.00
00
.00
0
Wal
leye
0.0
56
0.0
00
0.0
00
0.0
00
0.0
00
0.0
00
0.0
00
0.0
00
0.0
00
0.0
00
0.0
83
0.0
08
0.0
00
0.0
00
0.0
00
0.0
00
0.0
00
0.0
00
Johnny D
arte
r0
.07
70
.00
00
.00
00
.00
00
.40
00
.00
00
.00
00
.00
00
.00
00
.00
00
.00
00
.04
00
.00
00
.00
00
.00
00
.00
00
.00
00
.00
0
Ro
und
Go
by
0.0
00
0.0
00
0.0
00
0.0
83
25
0.1
00
24
.83
34
0.0
83
11
9.7
50
26
.66
71
69
.90
71
43
.93
37
7.5
36
8.0
83
77
.14
42
8.5
00
31
.08
07
6.3
10
16
3.0
30
Scu
lpin
sp
.0
.04
60
.00
00
.00
00
.00
00
.00
00
.00
00
.00
00
.00
00
.00
00
.00
00
.00
00
.00
00
.00
00
.00
00
.00
00
.00
00
.00
00
.00
0
Sli
my S
culp
in2
.08
40
.41
70
.66
74
4.0
83
74
.90
00
.75
00
.16
70
.00
00
.00
00
.00
00
.00
01
2.0
98
0.0
00
0.0
00
0.0
00
0.0
00
0.0
00
0.0
00
Dee
pw
ater
Scu
lpin
0.0
00
0.0
00
0.0
00
0.0
00
0.0
00
0.0
00
0.0
00
0.0
00
0.0
00
0.0
00
0.0
00
0.0
00
0.0
00
0.0
00
0.0
00
0.0
00
0.6
70
0.0
00
To
tal
catc
h1
68
52
53
64
11
53
65
56
70
13
53
43
57
62
32
07
11
11
23
21
43
12
52
76
Num
ber
of
spec
ies
96
58
87
75
44
66
36
44
64
Num
ber
of
traw
ls1
21
21
21
01
21
21
21
21
21
21
21
21
21
21
23
Yea
r

Section 1. Index Fishing Projects
36
TA
BL
E 1
.3.7
. S
pec
ies-
spec
ific
cat
ch p
er t
raw
l (1
2 m
in d
ura
tion;
1/2
mil
e) b
y y
ear
in t
he
fish
com
mun
ity i
ndex
bott
om
tra
wli
ng p
rogra
m d
uri
ng s
um
mer
at
EB
03,
Kin
gst
on
Bas
in,
Lak
e O
nta
rio.
Cat
ches
are
th
e m
ean
num
ber
of
fish
ob
serv
ed f
or
the
num
ber
of
traw
ls i
ndic
ated
. T
ota
l ca
tch
and
nu
mb
er o
f sp
ecie
s ca
ught
are
indic
ated
.
Sp
ecie
s
19
92
-20
00
mea
n2
00
12
00
22
00
32
00
42
00
52
00
62
00
72
00
82
00
92
01
0
20
01
-20
10
mea
n2
01
12
01
22
01
32
01
42
01
52
01
6
Ale
wif
e7
04
.46
35
7.3
75
21
.37
58
.00
01
68
.38
51
4.8
33
15
.25
03
3.9
17
15
6.3
39
0.0
00
0.2
50
47
.57
20
.12
53
3.2
92
75
.50
04
3.1
30
1.8
80
13
.86
0
Giz
zard
Shad
0.0
00
0.0
00
0.0
00
0.0
00
0.0
00
0.0
00
0.0
00
0.2
50
0.0
00
0.0
00
0.0
00
0.0
25
0.0
00
0.0
00
0.0
00
0.0
00
0.0
00
0.0
00
Chin
oo
k S
alm
on
0.0
14
0.0
00
0.0
00
0.0
00
0.0
00
0.6
67
0.0
00
0.0
00
0.0
00
0.0
00
0.0
00
0.0
67
0.0
00
0.0
00
0.0
00
0.0
00
0.1
30
0.0
00
Lak
e T
rout
0.8
47
0.0
00
0.0
00
0.0
00
0.0
00
0.0
00
0.0
00
0.2
50
0.0
00
0.0
83
0.0
00
0.0
33
0.0
00
0.0
00
0.1
25
0.0
00
0.0
00
0.0
00
Lak
e W
hit
efis
h1
4.4
12
0.0
00
0.0
00
43
.93
82
.33
35
0.0
00
3.0
00
1.4
17
0.0
00
0.0
83
4.6
67
10
.54
40
.12
50
.00
00
.00
00
.00
00
.38
00
.00
0
Cis
co0
.29
20
.00
00
.00
00
.00
00
.00
00
.00
00
.00
00
.00
00
.00
00
.00
00
.00
00
.00
00
.12
50
.00
00
.00
00
.00
01
.50
01
.00
0
Rai
nb
ow
Sm
elt
51
7.4
19
20
.00
02
07
.51
11
09
.24
51
.91
72
5.6
67
20
.62
52
1.5
00
0.2
50
11
.58
32
17
.94
76
3.6
24
30
.75
03
.25
01
11
.50
02
0.6
30
34
3.8
30
13
5.8
30
Whit
e S
uck
er0
.09
30
.00
00
.00
00
.00
00
.00
00
.00
00
.00
00
.08
30
.00
00
.00
00
.00
00
.00
80
.00
00
.00
00
.00
00
.00
00
.00
00
.00
0
Co
mm
on C
arp
0.1
30
0.0
00
0.0
00
0.0
00
0.0
00
0.0
00
0.0
00
0.0
00
0.0
00
0.0
00
0.0
00
0.0
00
0.0
00
0.0
00
0.0
00
0.0
00
0.0
00
0.0
00
Sp
ott
ail
Shin
er4
2.4
56
0.0
00
0.0
00
0.0
00
0.0
00
0.0
00
0.0
00
0.0
00
0.0
00
0.2
50
0.0
83
0.0
33
0.3
75
0.0
00
0.0
00
0.1
30
0.0
00
0.0
00
Am
eric
an E
el0
.05
60
.00
00
.00
00
.00
00
.00
00
.00
00
.00
00
.00
00
.00
00
.00
00
.00
00
.00
00
.00
00
.00
00
.00
00
.00
00
.00
00
.00
0
Bro
ok S
tick
leb
ack
0.0
09
0.0
00
0.0
00
0.0
00
0.0
00
0.0
00
0.0
00
0.0
00
0.0
00
0.0
00
0.0
00
0.0
00
0.0
00
0.0
00
0.0
00
0.0
00
0.0
00
0.0
00
Thre
esp
ine
Sti
ckle
bac
k3
2.8
94
67
.37
56
80
.28
74
59
.42
12
78
1.7
54
11
6.0
83
8.5
00
0.0
00
0.0
00
0.0
00
0.0
00
41
1.3
42
0.0
00
0.0
00
0.0
00
0.0
00
0.0
00
0.0
00
Tro
ut-
per
ch6
89
.17
11
75
.00
05
92
.21
25
6.2
98
25
5.1
61
3.4
17
3.7
50
0.4
17
0.0
00
0.0
00
0.0
00
10
8.6
25
0.1
25
0.0
00
0.0
00
0.0
00
0.0
00
0.0
00
Whit
e P
erch
0.0
32
0.0
00
0.0
00
0.0
00
0.0
00
0.0
00
0.0
00
0.0
00
0.0
00
0.0
00
0.0
00
0.0
00
0.0
00
0.0
00
0.0
00
0.0
00
0.0
00
0.0
00
Pum
pkin
seed
0.0
00
0.0
00
0.0
00
0.0
00
0.0
00
0.0
00
0.0
00
0.0
00
0.0
00
0.0
00
0.0
83
0.0
08
0.0
00
0.0
00
0.0
00
0.0
00
0.0
00
0.0
00
Sm
allm
outh
Bas
s0
.01
40
.00
00
.00
00
.00
00
.00
00
.00
00
.00
00
.00
00
.00
00
.00
00
.00
00
.00
00
.00
00
.00
00
.00
00
.00
00
.00
00
.00
0
Lar
gem
outh
Bas
s0
.00
00
.00
00
.00
00
.00
00
.00
00
.00
00
.00
00
.00
00
.00
00
.00
00
.08
30
.00
80
.00
00
.00
00
.00
00
.00
00
.00
00
.00
0
Yel
low
Per
ch0
.09
30
.00
00
.00
00
.62
50
.08
30
.00
00
.50
00
.16
70
.12
50
.00
00
.00
00
.15
00
.00
00
.00
00
.00
00
.00
00
.13
00
.00
0
Wal
leye
0.2
36
0.0
00
0.0
00
0.0
63
0.0
00
0.0
00
0.1
25
0.0
00
0.0
00
0.4
17
0.0
00
0.0
60
0.2
50
0.2
50
0.0
00
0.0
00
0.0
00
0.2
90
Johnny D
arte
r0
.87
50
.00
00
.00
09
.87
53
2.8
33
0.1
67
0.0
00
0.0
00
0.0
00
0.0
00
0.0
00
4.2
88
0.0
00
0.0
00
0.0
00
0.0
00
0.0
00
0.0
00
Ro
und
Go
by
0.0
00
0.0
00
0.0
00
0.0
00
0.3
33
73
2.4
49
85
0.4
48
91
0.4
09
11
00
.40
92
55
2.1
95
10
79
.94
47
22
.61
92
32
2.4
65
96
0.9
45
41
0.8
00
19
68
.92
01
30
9.4
90
15
7.1
00
Fre
shw
ater
Dru
m0
.04
60
.00
00
.00
00
.00
00
.08
30
.00
00
.12
50
.00
00
.12
50
.00
00
.00
00
.03
30
.00
00
.25
00
.00
00
.00
00
.50
00
.14
0
Scu
lpin
sp
.0
.19
40
.00
00
.00
00
.00
00
.00
00
.00
00
.00
00
.00
00
.00
00
.00
00
.00
00
.00
00
.00
00
.00
00
.00
00
.00
00
.00
00
.00
0
Mo
ttle
d S
culp
in0
.00
00
.00
00
.00
00
.68
80
.00
00
.00
00
.00
00
.00
00
.00
00
.00
00
.00
00
.06
90
.00
00
.00
00
.00
00
.00
00
.00
00
.00
0
Sli
my S
culp
in0
.37
00
.00
00
.25
06
.75
01
0.8
33
0.0
83
0.0
00
0.0
00
0.0
00
0.0
00
0.0
00
1.7
92
0.0
00
0.0
00
0.0
00
0.0
00
0.0
00
0.0
00
To
tal
catc
h2
00
43
20
15
02
69
53
25
49
43
90
29
68
12
57
25
65
13
03
13
71
23
54
99
85
98
20
33
16
58
30
8
Num
ber
of
spec
ies
10
45
10
10
99
95
67
78
54
48
6
Num
ber
of
traw
ls8
81
61
21
28
12
81
21
28
78
88
7
Yea
r

Section 1. Index Fishing Projects
TA
BL
E 1
.3.8
. S
pec
ies-
spec
ific
cat
ch p
er t
raw
l (1
2 m
in d
ura
tion;
1/2
mil
e) b
y y
ear
in t
he
fish
com
mun
ity i
ndex
bott
om
tra
wli
ng p
rogra
m d
uri
ng s
um
mer
at
EB
06,
Kin
gst
on
Bas
in,
Lak
e O
nta
rio.
Cat
ches
are
th
e m
ean
num
ber
of
fish
ob
serv
ed f
or
the
num
ber
of
traw
ls i
ndic
ated
. T
ota
l ca
tch
and
nu
mb
er o
f sp
ecie
s ca
ught
are
indic
ated
.
37
Sp
ecie
s
19
92
-20
00
mea
n2
00
12
00
22
00
32
00
42
00
52
00
62
00
72
00
82
00
92
01
0
20
01
-20
10
mea
n2
01
12
01
22
01
32
01
42
01
52
01
6
Ale
wif
e8
5.6
31
5.5
83
0.2
50
0.0
83
1.2
50
0.4
17
8.0
00
0.9
17
0.6
67
10
.83
31
.08
32
.90
80
.66
70
.62
50
.58
30
.00
00
.00
01
.33
0
Lak
e T
rout
0.6
11
0.0
83
0.0
83
0.0
83
0.0
83
0.0
00
0.0
00
0.0
00
0.0
00
0.0
00
0.0
00
0.0
33
0.0
00
0.1
25
0.0
00
0.0
00
0.2
50
0.0
00
Lak
e W
hit
efis
h4
.54
60
.00
00
.16
70
.16
70
.25
00
.00
00
.00
00
.08
30
.00
00
.00
00
.08
30
.07
50
.00
00
.00
00
.00
00
.00
00
.08
00
.00
0
Cis
co (
Lak
e H
erri
ng)
0.0
28
0.0
00
0.0
00
0.0
00
0.0
00
0.0
00
0.0
00
0.0
00
0.0
00
0.0
00
0.0
00
0.0
00
0.0
00
0.0
00
0.0
00
0.0
00
0.0
00
0.0
00
Rai
nb
ow
Sm
elt
74
3.7
01
21
.41
76
.75
00
.25
02
5.0
83
14
2.5
83
23
.91
70
.58
31
.00
03
.50
07
3.1
67
29
.82
51
8.9
17
11
2.9
33
8.7
50
0.3
30
0.0
00
1.3
30
Thre
esp
ine
Sti
ckle
bac
k7
.72
22
.58
34
7.7
50
11
.41
77
.50
01
3.9
17
1.0
83
0.0
00
0.0
00
0.0
00
0.0
00
8.4
25
0.0
00
0.0
00
0.0
00
0.0
00
0.0
00
0.0
00
Tro
ut-
per
ch0
.99
10
.00
00
.00
00
.00
00
.00
00
.00
00
.00
00
.00
00
.00
00
.00
00
.00
00
.00
00
.00
00
.00
00
.00
00
.00
00
.00
00
.00
0
Yel
low
Per
ch0
.01
90
.00
00
.00
00
.00
00
.00
00
.00
00
.00
00
.00
00
.00
00
.00
00
.00
00
.00
00
.00
00
.00
00
.00
00
.00
00
.00
00
.00
0
Johnny D
arte
r0
.00
00
.00
00
.00
00
.00
00
.33
30
.00
00
.00
00
.00
00
.00
00
.00
00
.00
00
.03
30
.00
00
.00
00
.00
00
.00
00
.00
00
.00
0
Ro
und
Go
by
0.0
00
0.0
00
0.0
00
0.0
00
0.0
00
0.0
00
5.0
00
82
.93
41
.66
78
.66
78
77
.91
49
7.6
18
1.9
17
20
0.4
16
20
8.9
49
0.3
30
0.0
80
45
3.0
50
Scu
lpin
sp
.0
.00
90
.00
00
.00
00
.00
00
.00
00
.00
00
.00
00
.00
00
.00
00
.00
00
.00
00
.00
00
.00
00
.00
00
.00
00
.00
00
.00
00
.00
0
Sli
my S
culp
in0
.08
30
.08
30
.00
03
.58
33
99
.18
31
5.7
50
0.2
50
0.0
00
0.0
00
0.5
00
1.5
00
42
.08
50
.00
00
.12
50
.16
70
.00
00
.00
00
.00
0
Dee
pw
ater
Scu
lpin
0.0
00
0.0
00
0.0
00
0.0
00
0.0
00
0.0
00
0.0
00
0.0
00
0.0
00
0.0
83
0.1
67
0.0
25
0.0
00
0.0
00
0.0
00
0.0
00
2.0
00
0.0
00
To
tal
catc
h8
43
30
55
16
43
41
73
38
85
32
49
54
18
12
23
14
21
81
24
56
Num
ber
of
spec
ies
65
56
74
54
35
65
35
42
43
Num
ber
of
traw
ls1
21
21
21
21
21
21
21
21
21
21
28
12
12
12
3
Yea
r

Section 1. Index Fishing Projects
38
EB06 (Table 1.3.8)
Four species: Round Goby, Alewife and
Rainbow Smelt were caught at EB06 in 2016.
Rocky Point (Tables 1.3.9 and 1.3.10)
Three species: Deepwater Sculpin, Slimy
Sculpin, and Rainbow Smelt were caught at
Rocky Point in 2016. Deepwater Sculpin were
most common at 100 to 120 m water depth while
Slimy Sculpin were most abundant at 90 m.
Bay of Quinte
Conway (Table 1.3.11)
Ten species were caught at Conway in
2016. The most abundant species were Round
Goby, Alewife, Yellow Perch, Cisco and White
Sucker.
Hay Bay (Table 1.3.12)
Thirteen species were caught at Hay Bay in
2016. The most abundant species were Alewife,
Gizzard Shad, Yellow Perch, White Perch and
White Bass.
Deseronto (Table 1.3.13)
Eighteen species were caught at Deseronto
in 2016. The most abundant species were
Alewife, Yellow Perch, Gizzard Shad, White
Perch, Spottail Shiner and Pumpkinseed.
Big Bay (Table 1.3.14)
Nineteen species were caught at Big Bay in
2016. The most abundant species were Gizzard
Shad, Yellow Perch, White Perch, Alewife and
Freshwater Drum. Three American Eel were
caught. These were the first Eel caught at Big
Bay since 2002.
Belleville (Table 1.3.15)
Nineteen species were caught at Belleville
in 2016. White Perch, Freshwater Drum, Yellow
Perch and Spottail Shiner and were the most
abundant species in the catch.
Trenton (Table 1.3.16)
Seventeen species were caught at Trenton
in 2016. The most abundant species were Yellow
Perch, Alewife, White Perch, Largemouth Bass,
Gizzard Shad and Round Goby.
Species Trends (Fig. 1.3.3)
Bottom trawl results were summarized
across the six Bay of Quinte sites and presented
graphically to illustrate abundance trends for
major species in Fig. 1.3.3. All species show
significant abundance changes over the long-term.
The most abundant species remain White Perch,
Yellow Perch, Alewife and Gizzard Shad. White
Perch abundance declined significantly in 2014,
remained low in 2015, and increased in 2016.
Yellow Perch remain abundant. Alewife
abundance declined in 2015 but was very high in
2016. Most centrarchid species are currently at
moderate to high levels of abundance as are
Gizzard Shad, Spottail Shiner, Round Goby,
Trout-perch, and Cisco. Species currently at low
abundance levels relative to past levels include
Brown Bullhead, Rainbow Smelt, White Sucker,
Lake Whitefish, Johnny Darter and American Eel.
Species Highlights
Catches of age-0 fish in 2016 for selected
species and locations are shown in Tables 1.3.17-
1.3.21 for Lake Whitefish, Cisco, Yellow Perch
and Walleye respectively.
TABLE 1.3.9. Species-specific catch per trawl (adjusted to 12 min
duration; 1/2 mile) in the fish community index bottom trawling
program during summer at Rocky Point (multiple water depths),
Lake Ontario, 2016. Catches are the mean number of fish observed for the number of trawls indicated. Total catch and number of spe-
cies caught are indicated.
Site depth (m) 60 80 90 100 110 120 130 140
Rainbow Smelt 0 1 3 3 3 0 0 0
Slimy Sculpin 3 2 12 5 4 1 0 0
Deepwater Sculpin 2 21 75 256 222 236 89 135
Total catch 5 24 90 264 229 237 89 135
Number of species 5 4 4 4 4 3 4 3
Number of trawls 2 4 4 4 4 4 4 4
Site depth (m)

Section 1. Index Fishing Projects
TA
BL
E 1
.3.1
0.
Sp
ecie
s-sp
ecif
ic c
atch
per
tra
wl
(ad
just
ed t
o 1
2 m
in d
ura
tion
; 1/2
mil
e) b
y y
ear
in t
he
fish
com
mu
nit
y i
nd
ex b
ott
om
tra
wli
ng p
rogra
m d
uri
ng s
um
mer
at
Rock
y P
oin
t, 1
00 m
dep
th
on
ly),
ea
ster
n L
ake
On
tari
o.
Cat
ches
are
th
e m
ean
num
ber
of
fish
ob
serv
ed f
or
the
nu
mb
er o
f tr
awls
in
dic
ated
. T
ota
l ca
tch
and
nu
mb
er o
f sp
ecie
s ca
ugh
t ar
e in
dic
ated
. N
o s
amp
lin
g i
n 2
006
, 20
10
.
39
Sp
ecie
s
19
97
-20
00
mea
n2
00
12
00
22
00
32
00
42
00
52
00
62
00
72
00
82
00
92
01
0
20
01
-20
10
mea
n2
01
12
01
22
01
32
01
42
01
52
01
6
Ale
wif
e2
.06
32
.75
00
.37
51
.50
05
.75
00
.12
56
.87
51
.50
00
.37
52
.40
60
.50
00
.00
08
4.5
00
13
.00
01
14
.50
00
.00
0
Lak
e T
rout
0.0
63
0.5
00
0.0
00
0.0
00
0.1
25
0.0
00
0.0
00
0.1
25
0.0
00
0.0
94
0.2
50
0.0
00
0.0
00
0.0
00
0.0
00
0.0
00
Lak
e W
hit
efis
h0
.09
40
.00
00
.12
50
.00
00
.00
00
.00
00
.00
00
.00
00
.00
00
.01
60
.00
00
.00
00
.00
00
.00
00
.00
00
.00
0
Rai
nb
ow
Sm
elt
20
0.5
00
90
.62
53
7.6
25
4.1
25
11
.37
55
.50
02
.25
07
.25
06
.75
02
0.6
88
5.5
00
5.5
00
11
.50
03
.33
32
.00
03
.00
0
Thre
esp
ine
Sti
ckle
bac
k0
.00
00
.00
00
.00
00
.00
00
.12
50
.12
50
.00
00
.00
00
.00
00
.03
10
.00
00
.00
00
.00
00
.00
00
.00
00
.00
0
Ro
ck B
ass
0.0
00
0.0
00
0.0
00
0.0
00
0.0
00
0.0
00
0.0
00
0.0
00
0.0
00
0.0
00
0.0
00
0.0
00
0.0
00
0.1
67
0.0
00
0.0
00
Ro
und
Go
by
0.0
00
0.0
00
0.0
00
0.0
00
0.0
00
0.0
00
0.0
00
0.0
00
0.0
00
0.0
00
0.0
00
0.0
00
0.0
00
0.1
67
0.0
00
0.0
00
Sli
my S
culp
in5
.62
51
.25
00
.12
52
.25
09
5.7
50
14
.25
02
4.7
50
8.8
75
5.0
00
19
.03
12
.25
00
.00
01
2.0
00
8.0
00
7.5
00
5.0
00
Dee
pw
ater
Scu
lpin
0.0
00
0.0
00
0.0
00
0.0
00
0.0
00
0.1
25
0.7
50
0.2
50
0.1
25
0.1
56
7.5
00
1.5
00
6.0
00
3.8
33
10
5.0
00
25
6.0
00
To
tal
catc
h2
08
95
38
81
13
20
35
18
12
42
16
71
14
29
22
92
64
Num
ber
of
spec
ies
34
43
55
45
44
52
46
43
Num
ber
of
traw
ls4
44
44
04
44
04
12
64
1
Yea
r
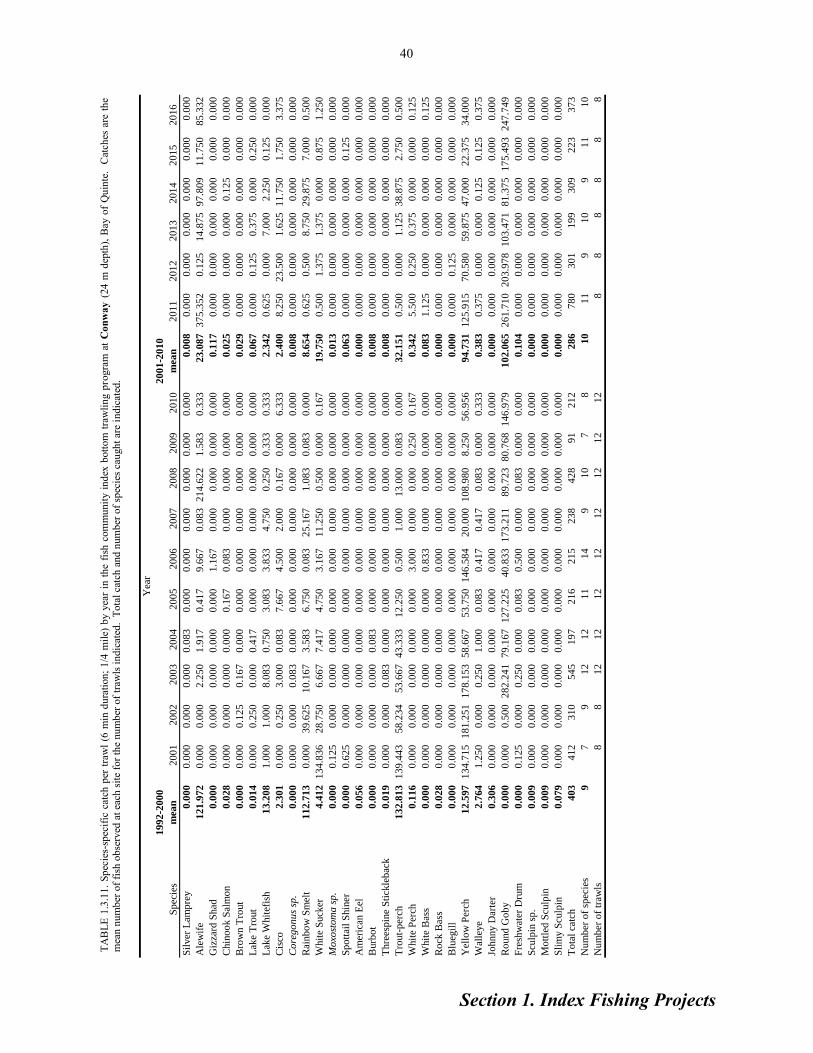
Section 1. Index Fishing Projects
TA
BL
E 1
.3.1
1.
Sp
ecie
s-sp
ecif
ic c
atch
per
tra
wl
(6 m
in d
ura
tion
; 1
/4 m
ile)
by y
ear
in t
he
fish
com
mu
nit
y i
nd
ex b
ott
om
tra
wli
ng p
rogra
m a
t C
on
wa
y (
24 m
dep
th),
Bay
of
Qu
inte
. C
atch
es a
re t
he
mea
n n
um
ber
of
fish
ob
serv
ed a
t ea
ch s
ite
for
the
nu
mb
er o
f tr
awls
in
dic
ated
. T
ota
l ca
tch
and
num
ber
of
spec
ies
cau
gh
t ar
e in
dic
ated
.
40
Sp
ecie
s
19
92
-20
00
mea
n2
00
12
00
22
00
32
00
42
00
52
00
62
00
72
00
82
00
92
01
0
20
01
-20
10
mea
n2
01
12
01
22
01
32
01
42
01
52
01
6
Sil
ver
Lam
pre
y0
.00
00
.00
00
.00
00
.00
00
.08
30
.00
00
.00
00
.00
00
.00
00
.00
00
.00
00
.00
80
.00
00
.00
00
.00
00
.00
00
.00
00
.00
0
Ale
wif
e1
21
.97
20
.00
00
.00
02
.25
01
.91
70
.41
79
.66
70
.08
32
14
.62
21
.58
30
.33
32
3.0
87
37
5.3
52
0.1
25
14
.87
59
7.8
09
11
.75
08
5.3
32
Giz
zard
Shad
0.0
00
0.0
00
0.0
00
0.0
00
0.0
00
0.0
00
1.1
67
0.0
00
0.0
00
0.0
00
0.0
00
0.1
17
0.0
00
0.0
00
0.0
00
0.0
00
0.0
00
0.0
00
Chin
oo
k S
alm
on
0.0
28
0.0
00
0.0
00
0.0
00
0.0
00
0.1
67
0.0
83
0.0
00
0.0
00
0.0
00
0.0
00
0.0
25
0.0
00
0.0
00
0.0
00
0.1
25
0.0
00
0.0
00
Bro
wn T
rout
0.0
00
0.0
00
0.1
25
0.1
67
0.0
00
0.0
00
0.0
00
0.0
00
0.0
00
0.0
00
0.0
00
0.0
29
0.0
00
0.0
00
0.0
00
0.0
00
0.0
00
0.0
00
Lak
e T
rout
0.0
14
0.0
00
0.2
50
0.0
00
0.4
17
0.0
00
0.0
00
0.0
00
0.0
00
0.0
00
0.0
00
0.0
67
0.0
00
0.1
25
0.3
75
0.0
00
0.2
50
0.0
00
Lak
e W
hit
efis
h1
3.2
08
1.0
00
1.0
00
8.0
83
0.7
50
3.0
83
3.8
33
4.7
50
0.2
50
0.3
33
0.3
33
2.3
42
0.6
25
0.0
00
7.0
00
2.2
50
0.1
25
0.0
00
Cis
co2
.30
10
.00
00
.25
03
.00
00
.08
37
.66
74
.50
02
.00
00
.16
70
.00
06
.33
32
.40
08
.25
02
3.5
00
1.6
25
11
.75
01
.75
03
.37
5
Co
reg
on
us
sp.
0.0
00
0.0
00
0.0
00
0.0
83
0.0
00
0.0
00
0.0
00
0.0
00
0.0
00
0.0
00
0.0
00
0.0
08
0.0
00
0.0
00
0.0
00
0.0
00
0.0
00
0.0
00
Rai
nb
ow
Sm
elt
11
2.7
13
0.0
00
39
.62
51
0.1
67
3.5
83
6.7
50
0.0
83
25
.16
71
.08
30
.08
30
.00
08
.65
40
.62
50
.50
08
.75
02
9.8
75
7.0
00
0.5
00
Whit
e S
uck
er4
.41
21
34
.83
62
8.7
50
6.6
67
7.4
17
4.7
50
3.1
67
11
.25
00
.50
00
.00
00
.16
71
9.7
50
0.5
00
1.3
75
1.3
75
0.0
00
0.8
75
1.2
50
Mo
xost
om
a s
p.
0.0
00
0.1
25
0.0
00
0.0
00
0.0
00
0.0
00
0.0
00
0.0
00
0.0
00
0.0
00
0.0
00
0.0
13
0.0
00
0.0
00
0.0
00
0.0
00
0.0
00
0.0
00
Sp
ott
ail
Shin
er0
.00
00
.62
50
.00
00
.00
00
.00
00
.00
00
.00
00
.00
00
.00
00
.00
00
.00
00
.06
30
.00
00
.00
00
.00
00
.00
00
.12
50
.00
0
Am
eric
an E
el0
.05
60
.00
00
.00
00
.00
00
.00
00
.00
00
.00
00
.00
00
.00
00
.00
00
.00
00
.00
00
.00
00
.00
00
.00
00
.00
00
.00
00
.00
0
Burb
ot
0.0
00
0.0
00
0.0
00
0.0
00
0.0
83
0.0
00
0.0
00
0.0
00
0.0
00
0.0
00
0.0
00
0.0
08
0.0
00
0.0
00
0.0
00
0.0
00
0.0
00
0.0
00
Thre
esp
ine
Sti
ckle
bac
k0
.01
90
.00
00
.00
00
.08
30
.00
00
.00
00
.00
00
.00
00
.00
00
.00
00
.00
00
.00
80
.00
00
.00
00
.00
00
.00
00
.00
00
.00
0
Tro
ut-
per
ch1
32
.81
31
39
.44
35
8.2
34
53
.66
74
3.3
33
12
.25
00
.50
01
.00
01
3.0
00
0.0
83
0.0
00
32
.15
10
.50
00
.00
01
.12
53
8.8
75
2.7
50
0.5
00
Whit
e P
erch
0.1
16
0.0
00
0.0
00
0.0
00
0.0
00
0.0
00
3.0
00
0.0
00
0.0
00
0.2
50
0.1
67
0.3
42
5.5
00
0.2
50
0.3
75
0.0
00
0.0
00
0.1
25
Whit
e B
ass
0.0
00
0.0
00
0.0
00
0.0
00
0.0
00
0.0
00
0.8
33
0.0
00
0.0
00
0.0
00
0.0
00
0.0
83
1.1
25
0.0
00
0.0
00
0.0
00
0.0
00
0.1
25
Ro
ck B
ass
0.0
28
0.0
00
0.0
00
0.0
00
0.0
00
0.0
00
0.0
00
0.0
00
0.0
00
0.0
00
0.0
00
0.0
00
0.0
00
0.0
00
0.0
00
0.0
00
0.0
00
0.0
00
Blu
egil
l0
.00
00
.00
00
.00
00
.00
00
.00
00
.00
00
.00
00
.00
00
.00
00
.00
00
.00
00
.00
00
.00
00
.12
50
.00
00
.00
00
.00
00
.00
0
Yel
low
Per
ch1
2.5
97
13
4.7
15
18
1.2
51
17
8.1
53
58
.66
75
3.7
50
14
6.5
84
20
.00
01
08
.98
08
.25
05
6.9
56
94
.73
11
25
.91
57
0.5
80
59
.87
54
7.0
00
22
.37
53
4.0
00
Wal
leye
2.7
64
1.2
50
0.0
00
0.2
50
1.0
00
0.0
83
0.4
17
0.4
17
0.0
83
0.0
00
0.3
33
0.3
83
0.3
75
0.0
00
0.0
00
0.1
25
0.1
25
0.3
75
Johnny D
arte
r0
.30
60
.00
00
.00
00
.00
00
.00
00
.00
00
.00
00
.00
00
.00
00
.00
00
.00
00
.00
00
.00
00
.00
00
.00
00
.00
00
.00
00
.00
0
Ro
und
Go
by
0.0
00
0.0
00
0.5
00
28
2.2
41
79
.16
71
27
.22
54
0.8
33
17
3.2
11
89
.72
38
0.7
68
14
6.9
79
10
2.0
65
26
1.7
10
20
3.9
78
10
3.4
71
81
.37
51
75
.49
32
47
.74
9
Fre
shw
ater
Dru
m0
.00
00
.12
50
.00
00
.25
00
.00
00
.08
30
.50
00
.00
00
.08
30
.00
00
.00
00
.10
40
.00
00
.00
00
.00
00
.00
00
.00
00
.00
0
Scu
lpin
sp
.0
.00
90
.00
00
.00
00
.00
00
.00
00
.00
00
.00
00
.00
00
.00
00
.00
00
.00
00
.00
00
.00
00
.00
00
.00
00
.00
00
.00
00
.00
0
Mo
ttle
d S
culp
in0
.00
90
.00
00
.00
00
.00
00
.00
00
.00
00
.00
00
.00
00
.00
00
.00
00
.00
00
.00
00
.00
00
.00
00
.00
00
.00
00
.00
00
.00
0
Sli
my S
culp
in0
.07
90
.00
00
.00
00
.00
00
.00
00
.00
00
.00
00
.00
00
.00
00
.00
00
.00
00
.00
00
.00
00
.00
00
.00
00
.00
00
.00
00
.00
0
To
tal
catc
h4
03
41
23
10
54
51
97
21
62
15
23
84
28
91
21
22
86
78
03
01
19
93
09
22
33
73
Num
ber
of
spec
ies
97
91
21
21
11
49
10
78
10
11
91
09
11
10
Num
ber
of
traw
ls8
81
21
21
21
21
21
21
21
28
88
88
8
Yea
r

Section 1. Index Fishing Projects
41
TA
BL
E 1
.3.1
2.
Sp
ecie
s-sp
ecif
ic c
atch
per
tra
wl
(6 m
in d
ura
tion;
1/4
mil
e) b
y y
ear
in t
he
fish
com
munit
y i
nd
ex b
ott
om
tra
wli
ng p
rogra
m a
t H
ay B
ay (
7 m
dep
th),
Bay
of
Qu
inte
. C
atch
es a
re t
he
mea
n
nu
mb
er o
f fi
sh o
bse
rved
for
the
nu
mber
of
traw
ls i
nd
icat
ed.
Tota
l ca
tch a
nd
nu
mb
er o
f sp
ecie
s ca
ught
are
ind
icat
ed.
Sp
ecie
s
19
92
-20
00
mea
n2
00
12
00
22
00
32
00
42
00
52
00
62
00
72
00
82
00
92
01
0
20
01
-20
10
mea
n2
01
12
01
22
01
32
01
42
01
52
01
6
Ale
wif
e2
04
.14
95
66
.14
32
1.1
25
1.7
50
67
.06
77
2.0
97
39
4.5
07
69
5.3
31
63
1.7
10
71
3.1
36
96
7.9
99
41
3.0
86
56
1.6
76
53
0.9
46
36
0.9
90
49
8.7
96
41
1.0
86
13
64
.53
9
Giz
zard
Shad
10
.15
32
.62
50
.12
50
.00
00
.12
50
.00
00
.37
50
.12
57
.00
00
.75
04
.00
01
.51
31
.37
51
00
.15
93
.25
00
.00
02
4.8
75
11
7.9
00
Lak
e W
hit
efis
h0
.01
90
.00
00
.00
00
.00
00
.00
00
.00
00
.00
00
.00
00
.00
00
.00
00
.00
00
.00
00
.00
00
.00
00
.00
00
.00
00
.00
00
.00
0
Cis
co0
.05
61
.00
00
.00
00
.00
00
.00
00
.00
00
.00
00
.00
00
.00
00
.00
00
.00
00
.10
00
.00
00
.00
00
.00
00
.12
50
.00
00
.00
0
Rai
nb
ow
Sm
elt
3.9
58
0.0
00
0.0
00
0.0
00
0.0
00
0.0
00
0.1
25
0.0
00
0.3
75
0.0
00
0.0
00
0.0
50
0.0
00
0.0
00
0.0
00
0.0
00
0.0
00
0.0
00
No
rther
n P
ike
0.0
69
0.0
00
0.0
00
0.1
25
0.0
00
0.0
00
0.0
00
0.1
25
0.0
00
0.1
25
0.0
00
0.0
38
0.0
00
0.0
00
0.0
00
0.2
50
0.0
00
0.0
00
Whit
e S
uck
er3
.57
93
.50
00
.12
55
.87
58
.25
00
.00
00
.62
54
.87
53
.00
00
.00
03
.62
52
.98
84
.37
52
.12
53
.62
53
.25
02
.12
50
.00
0
Co
mm
on C
arp
0.3
43
0.2
50
0.0
00
0.0
00
0.0
00
0.8
75
0.0
00
0.0
00
0.7
50
0.1
25
0.0
00
0.2
00
0.0
00
0.1
25
0.0
00
0.0
00
0.0
00
0.0
00
Go
lden
Shin
er0
.00
00
.00
00
.00
00
.00
00
.00
00
.00
00
.00
00
.00
00
.00
00
.12
50
.00
00
.01
30
.00
00
.37
50
.12
50
.00
00
.12
56
.00
0
Co
mm
on S
hin
er0
.00
00
.00
00
.00
00
.00
00
.00
00
.00
00
.12
50
.00
00
.00
00
.00
00
.00
00
.01
30
.00
00
.00
00
.00
00
.00
00
.00
00
.00
0
Fat
hea
d M
inno
w0
.00
00
.00
00
.00
00
.00
00
.00
00
.00
00
.00
00
.00
00
.00
00
.00
00
.00
00
.00
00
.00
00
.00
00
.12
50
.00
00
.00
00
.00
0
Bro
wn B
ull
hea
d1
5.0
46
32
.75
01
5.7
50
8.0
00
10
.37
51
0.5
00
15
.00
08
.87
50
.75
03
.50
02
.50
01
0.8
00
0.2
50
1.7
50
5.3
75
2.1
25
1.5
00
0.7
50
Chan
nel
Cat
fish
0.0
28
0.0
00
0.0
00
0.0
00
0.0
00
0.0
00
0.0
00
0.0
00
0.0
00
0.0
00
0.0
00
0.0
00
0.1
25
0.0
00
0.1
25
0.0
00
0.0
00
0.0
00
Am
eric
an E
el1
.57
90
.00
00
.00
00
.00
00
.00
00
.00
00
.00
00
.00
00
.00
00
.00
00
.00
00
.00
00
.00
00
.00
00
.00
00
.00
00
.00
00
.00
0
Burb
ot
0.0
23
0.0
00
0.0
00
0.0
00
0.0
00
0.0
00
0.0
00
0.0
00
0.0
00
0.0
00
0.0
00
0.0
00
0.0
00
0.0
00
0.0
00
0.0
00
0.0
00
0.0
00
Tro
ut-
per
ch6
5.1
25
5.7
50
2.7
50
3.7
50
77
.50
01
.75
03
.00
05
9.5
00
6.6
25
3.7
50
4.3
75
16
.87
52
2.8
75
1.1
25
6.2
50
4.6
25
25
.37
50
.25
0
Whit
e P
erch
94
.66
69
.25
01
32
.57
31
4.7
50
49
5.3
40
24
.62
55
04
.18
72
7.5
00
16
3.7
57
16
7.7
04
54
.87
51
59
.45
67
3.2
81
57
.75
02
71
.75
20
.87
57
.25
02
7.5
00
Whit
e B
ass
0.1
85
0.0
00
0.0
00
1.7
50
0.1
25
0.1
25
1.3
75
1.3
75
0.8
75
0.5
00
2.0
00
0.8
13
9.5
00
0.2
50
0.0
00
0.1
25
1.6
25
9.7
50
Sunfi
sh0
.05
60
.00
00
.00
00
.00
00
.00
00
.00
00
.00
00
.00
00
.00
00
.00
00
.00
00
.00
00
.00
00
.00
00
.00
00
.00
00
.00
00
.00
0
Ro
ck B
ass
0.0
28
0.0
00
0.0
00
0.0
00
0.1
25
0.0
00
0.0
00
0.0
00
0.0
00
0.0
00
0.1
25
0.0
25
0.0
00
0.1
25
0.0
00
0.0
00
0.0
00
0.0
00
Pum
pkin
seed
10
.23
11
9.6
25
11
.87
50
.75
04
.62
51
.12
54
4.5
00
11
.37
58
.62
50
.25
01
3.2
50
11
.60
00
.87
52
.50
04
.00
02
.75
00
.87
54
.62
5
Blu
egil
l0
.00
00
.00
00
.00
00
.00
00
.00
00
.00
00
.00
00
.12
53
.62
50
.12
50
.25
00
.41
30
.12
50
.37
50
.12
50
.00
00
.00
00
.00
0
Sm
allm
outh
Bas
s0
.00
00
.00
01
.25
00
.00
00
.00
00
.00
00
.00
00
.00
00
.00
00
.00
00
.00
00
.12
50
.00
00
.00
00
.00
00
.00
00
.00
00
.00
0
Lar
gem
outh
Bas
s0
.00
00
.25
01
.75
00
.00
00
.00
00
.00
00
.00
00
.00
00
.37
51
.37
52
.12
50
.58
81
.00
01
.25
00
.12
50
.00
00
.00
00
.00
0
Bla
ck C
rap
pie
0.0
00
0.0
00
0.0
00
0.0
00
0.0
00
1.3
75
0.8
75
0.0
00
0.0
00
0.0
00
0.0
00
0.2
25
0.5
00
0.0
00
0.1
25
0.0
00
12
.62
52
.00
0
Lep
om
is s
p.
0.0
00
0.0
00
0.0
00
0.0
00
0.0
00
13
.37
50
.00
00
.00
00
.00
00
.00
00
.00
01
.33
80
.00
00
.00
00
.00
00
.00
00
.00
00
.00
0
Yel
low
Per
ch3
72
.61
77
26
.62
08
56
.87
91
19
.20
35
51
.88
42
78
.67
05
80
.86
19
06
.70
41
38
.06
71
46
.06
52
06
.69
54
51
.16
51
4.1
25
61
.50
09
6.1
30
27
4.9
87
21
2.8
39
11
7.3
55
Wal
leye
7.3
33
7.1
25
3.2
50
1.7
50
3.1
25
4.1
25
7.1
25
8.5
00
13
.37
55
.00
08
.50
06
.18
87
.75
03
.37
53
.25
07
.00
01
0.5
00
2.5
00
Johnny D
arte
r0
.07
90
.00
01
.75
00
.00
00
.00
00
.00
00
.00
00
.12
50
.00
00
.00
00
.00
00
.18
80
.00
00
.00
00
.00
00
.12
50
.00
00
.00
0
Lo
gp
erch
0.0
46
0.2
50
0.0
00
0.0
00
0.1
25
0.3
75
0.2
50
1.2
50
0.2
50
0.2
50
0.1
25
0.2
88
0.0
00
0.0
00
0.0
00
0.0
00
0.2
50
0.0
00
Bro
ok S
ilver
sid
e0
.00
00
.00
00
.00
00
.00
00
.00
00
.00
00
.00
00
.00
00
.00
00
.00
00
.87
50
.08
80
.00
00
.37
50
.12
50
.00
00
.00
00
.00
0
Ro
und
Go
by
0.0
00
0.1
25
1.2
50
14
.25
03
.50
04
0.1
25
6.0
00
17
.12
51
1.3
75
1.6
25
2.3
75
9.7
75
0.1
25
3.5
00
0.8
75
2.1
25
7.3
75
0.0
00
Fre
shw
ater
Dru
m2
.77
34
.37
54
.87
56
.87
51
0.5
00
16
.37
53
9.1
25
6.0
00
5.0
00
5.1
25
11
.12
51
0.9
38
8.2
50
6.2
50
11
.87
52
.37
53
.25
05
.37
5
Sli
my S
culp
in0
.00
90
.00
00
.00
00
.00
00
.00
00
.00
00
.00
00
.00
00
.00
00
.00
00
.00
00
.00
00
.00
00
.00
00
.00
00
.00
00
.00
00
.00
0
To
tal
catc
h7
92
13
80
10
55
17
91
23
34
66
15
98
17
49
99
61
05
01
28
51
09
97
06
77
47
68
80
07
22
16
59
Num
ber
of
spec
ies
15
16
15
13
15
14
17
17
18
18
18
16
17
19
19
15
16
13
Num
ber
of
traw
ls8
88
88
88
88
88
88
88
8
Yea
r

Section 1. Index Fishing Projects
42
TA
BL
E 1
.3.1
3.
Sp
ecie
s-sp
ecif
ic c
atch
per
tra
wl
(6 m
in d
ura
tion;
1/4
mil
e) b
y y
ear
in t
he
fish
com
mun
ity i
nd
ex b
ott
om
tra
wli
ng p
rogra
m a
t D
ese
ron
to (
5 m
dep
th),
Bay
of
Quin
te.
Cat
ches
are
th
e m
ean
nu
mb
er o
f fi
sh o
bse
rved
for
the
nu
mb
er o
f tr
awls
ind
icat
ed. T
ota
l ca
tch
and
nu
mb
er o
f sp
ecie
s ca
ugh
t ar
e in
dic
ated
.
Sp
ecie
s
19
92
-20
00
mea
n2
00
12
00
22
00
32
00
42
00
52
00
62
00
72
00
82
00
92
01
0
20
01
-20
10
mea
n2
01
12
01
22
01
32
01
42
01
52
01
6
Lo
ngno
se G
ar0
.01
40
.00
00
.00
00
.00
00
.00
00
.00
00
.00
00
.00
00
.00
00
.00
00
.00
00
.00
00
.00
00
.00
00
.00
00
.00
00
.00
00
.00
0
Ale
wif
e1
20
.59
01
80
.07
44
7.6
25
27
7.4
03
55
.38
05
4.2
19
10
6.2
70
10
37
.63
12
17
.12
31
6.2
50
44
7.0
62
24
3.9
03
10
17
.11
53
32
.36
41
09
9.8
88
51
1.0
81
14
1.9
88
70
1.0
81
Giz
zard
Shad
54
.32
43
2.0
00
20
.87
51
1.8
75
1.3
75
22
.00
06
2.1
00
29
.25
01
09
.38
74
7.5
39
20
.50
03
5.6
90
53
.00
04
53
.24
26
7.7
65
0.1
25
73
.12
53
04
.87
3
Rai
nb
ow
Sm
elt
0.0
28
0.0
00
0.0
00
0.0
00
0.0
00
0.0
00
0.0
00
0.0
00
0.0
00
0.0
00
0.0
00
0.0
00
0.0
00
0.0
00
0.0
00
0.0
00
0.0
00
0.0
00
No
rther
n P
ike
0.0
28
0.0
00
0.0
00
0.1
25
0.0
00
0.0
00
0.0
00
0.0
00
0.0
00
0.0
00
0.0
00
0.0
13
0.0
00
0.0
00
0.0
00
0.0
00
0.1
25
0.0
00
Whit
e S
uck
er1
.02
80
.62
50
.37
51
.25
01
.25
00
.12
50
.37
50
.37
50
.62
52
.62
50
.12
50
.77
51
.37
50
.37
54
.87
54
.00
01
.75
00
.37
5
Lak
e C
hub
0.0
00
0.1
25
0.0
00
0.0
00
0.0
00
0.0
00
0.0
00
0.0
00
0.0
00
0.0
00
0.0
00
0.0
13
0.0
00
0.0
00
0.0
00
0.0
00
0.0
00
0.0
00
Co
mm
on C
arp
0.2
78
0.0
00
0.0
00
0.0
00
0.0
00
0.1
25
0.0
00
0.0
00
0.0
00
0.0
00
0.1
25
0.0
25
0.3
75
0.0
00
0.0
00
0.0
00
0.0
00
0.0
00
Em
eral
d S
hin
er0
.00
00
.00
00
.00
00
.00
00
.00
00
.00
00
.00
00
.00
00
.00
00
.00
00
.00
00
.00
00
.00
01
.12
50
.00
00
.00
00
.00
00
.00
0
Sp
ott
ail
Shin
er2
9.1
94
25
.25
02
5.0
00
35
.62
51
.50
01
8.8
75
54
.75
02
8.7
50
10
4.1
25
38
.62
51
8.0
00
35
.05
04
0.2
50
25
.62
52
9.2
50
12
6.3
75
69
.50
01
24
.06
4
Bro
wn B
ull
hea
d2
4.2
50
69
.25
01
0.6
25
21
.50
03
7.0
00
12
.50
01
1.6
25
18
.12
52
.50
04
.00
01
.00
01
8.8
13
1.2
50
5.6
25
27
.58
01
3.2
50
2.8
75
4.6
25
Chan
nel
Cat
fish
0.0
83
0.0
00
0.0
00
0.0
00
0.1
25
0.2
50
0.1
25
0.0
00
0.0
00
0.0
00
0.0
00
0.0
50
0.0
00
0.0
00
0.1
25
0.1
25
0.0
00
0.0
00
Icta
luru
s sp
.0
.00
00
.12
50
.00
00
.00
00
.00
00
.00
00
.00
00
.00
00
.00
00
.00
00
.00
00
.01
30
.00
00
.00
00
.00
00
.00
00
.00
00
.00
0
Am
eric
an E
el0
.86
10
.00
00
.12
50
.00
00
.00
00
.00
00
.00
00
.00
00
.00
00
.00
00
.00
00
.01
30
.00
00
.25
00
.12
50
.00
00
.00
00
.00
0
Tro
ut-
per
ch3
5.1
25
4.7
50
7.5
00
0.1
25
4.5
00
6.0
00
12
.37
51
8.3
75
55
0.2
79
22
6.8
43
1.7
50
83
.25
05
8.8
75
4.2
50
12
2.9
86
6.0
00
16
5.8
95
16
.00
0
Whit
e P
erch
27
3.1
79
10
.25
01
94
.88
23
06
.26
53
07
6.1
79
23
7.6
16
79
4.0
71
22
6.2
16
29
8.1
29
81
1.7
13
25
.25
05
98
.05
76
58
.17
52
76
.43
93
41
.36
62
7.2
50
24
.62
52
04
.58
3
Whit
e B
ass
0.4
03
0.0
00
0.0
00
0.5
00
1.6
25
1.2
50
4.2
50
0.3
75
0.0
00
1.2
50
0.2
50
0.9
50
4.5
00
0.7
50
0.0
00
0.1
25
4.0
00
16
.50
0
Sunfi
sh0
.12
50
.37
50
.00
00
.00
00
.00
00
.00
01
.37
50
.00
00
.12
50
.00
00
.00
00
.18
80
.00
00
.00
00
.00
00
.00
00
.00
00
.00
0
Ro
ck B
ass
0.0
14
0.1
25
1.7
50
0.2
50
0.0
00
0.0
00
0.0
00
0.0
00
0.0
00
0.5
00
0.2
50
0.2
88
0.0
00
0.1
25
0.2
50
0.0
00
0.1
25
0.0
00
Pum
pkin
seed
15
.04
21
18
.09
51
7.5
00
67
.50
01
9.5
00
14
.75
01
5.5
00
19
.12
51
1.5
00
30
.50
01
1.0
00
32
.49
72
6.0
00
3.7
50
9.3
75
36
.50
02
8.0
00
63
.25
0
Blu
egil
l0
.01
40
.50
00
.12
54
.50
00
.00
00
.12
50
.87
50
.37
50
.00
00
.25
01
.25
00
.80
02
.75
03
.87
51
.75
00
.12
50
.25
00
.37
5
Sm
allm
outh
Bas
s0
.50
00
.50
00
.12
51
.00
01
.25
00
.62
50
.25
00
.00
00
.00
00
.25
00
.00
00
.40
00
.12
50
.00
00
.00
00
.00
00
.00
00
.00
0
Lar
gem
outh
Bas
s0
.08
30
.00
01
.12
50
.00
00
.25
01
.12
52
.12
50
.00
00
.12
50
.37
52
.75
00
.78
82
.37
51
.75
05
.50
00
.00
00
.12
57
.00
0
Bla
ck C
rap
pie
0.0
28
0.1
25
0.6
25
0.1
25
0.0
00
1.7
50
1.3
75
4.8
75
0.0
00
3.3
75
0.1
25
1.2
38
0.1
25
0.6
25
2.8
75
0.2
50
6.2
50
0.1
25
Lep
om
is s
p.
0.0
00
0.0
00
0.0
00
0.0
00
0.0
00
48
3.7
34
0.0
00
1.0
00
0.2
50
0.0
00
1.8
75
48
.68
60
.00
00
.00
03
.25
00
.25
00
.25
08
.00
0
Yel
low
Per
ch3
20
.93
44
12
.72
05
55
.43
76
83
.48
01
52
.14
91
03
1.2
09
63
8.5
09
10
87
.35
85
31
.79
52
19
.33
16
6.2
31
53
7.8
22
14
66
.89
41
26
.91
62
47
.84
34
25
.71
59
67
.42
46
56
.15
4
Wal
leye
17
.48
61
2.5
00
2.8
75
7.5
00
15
.12
55
.00
05
.25
09
.87
51
9.8
75
15
.87
51
.87
59
.57
51
1.8
75
4.8
75
3.5
00
22
.37
51
8.8
75
14
.75
0
Johnny D
arte
r0
.40
30
.62
50
.00
00
.00
00
.00
00
.00
00
.00
00
.00
00
.00
00
.00
00
.00
00
.06
30
.00
00
.00
00
.00
00
.25
00
.62
50
.00
0
Lo
gp
erch
0.2
78
1.0
00
0.1
25
0.3
75
0.0
00
3.6
25
0.1
25
0.7
50
2.8
75
23
.62
50
.25
03
.27
52
.87
50
.00
00
.12
51
.50
02
.00
00
.12
5
Bro
ok S
ilver
sid
e0
.30
60
.00
00
.00
00
.00
00
.00
00
.75
00
.00
00
.00
00
.00
00
.00
03
.00
00
.37
50
.12
52
.75
00
.12
50
.00
00
.00
00
.62
5
Ro
und
Go
by
0.0
00
1.2
50
11
.50
01
6.1
25
20
.62
51
17
.30
54
.62
54
.25
04
.50
02
.75
01
.62
51
8.4
56
1.6
25
13
.87
52
.00
00
.37
51
0.7
50
6.8
75
Fre
shw
ater
Dru
m9
.11
11
6.5
00
1.8
75
15
.37
51
5.6
25
8.2
50
22
.00
02
4.0
00
10
.12
51
1.5
00
0.8
75
12
.61
37
.37
57
.12
51
0.3
75
2.6
25
2.2
50
10
.25
0
To
tal
catc
h9
04
88
79
00
14
51
34
03
20
21
17
38
25
11
18
63
14
57
60
51
68
43
35
71
26
61
98
11
17
81
52
12
14
0
Num
ber
of
spec
ies
16
20
19
19
16
21
20
16
15
19
20
19
20
20
20
18
20
18
Num
ber
of
traw
ls8
88
88
88
88
88
88
88
8
Yea
r

Section 1. Index Fishing Projects
43
TA
BL
E 1
.3.1
4.
Sp
ecie
s-sp
ecif
ic c
atch
per
tra
wl
(6 m
in d
ura
tion;
1/4
mil
e) b
y y
ear
in t
he
fish
com
mu
nit
y i
nd
ex b
ott
om
tra
wli
ng p
rogra
m a
t B
ig B
ay
(5
m d
epth
), B
ay o
f Q
uin
te.
Cat
ches
are
th
e m
ean
nu
mb
er o
f fi
sh o
bse
rved
for
the
nu
mber
of
traw
ls i
nd
icat
ed.
Tota
l ca
tch a
nd
nu
mb
er o
f sp
ecie
s ca
ught
are
ind
icat
ed.
Sp
ecie
s
19
92
-20
00
mea
n2
00
12
00
22
00
32
00
42
00
52
00
62
00
72
00
82
00
92
01
0
20
01
-20
10
mea
n2
01
12
01
22
01
32
01
42
01
52
01
6
Lo
ngno
se G
ar0
.11
10
.00
00
.00
00
.00
00
.00
00
.00
00
.00
00
.25
00
.00
00
.00
00
.00
00
.02
50
.00
00
.00
00
.00
00
.00
00
.00
00
.25
0
Ale
wif
e3
3.4
95
0.0
00
22
4.9
52
0.0
00
40
7.5
16
35
.75
01
3.0
00
0.3
75
19
0.2
82
37
.87
53
32
.82
91
24
.25
85
2.0
55
12
2.4
72
31
3.0
93
10
0.9
31
36
.50
01
20
.41
4
Giz
zard
Shad
22
8.1
79
0.0
00
52
.25
02
3.2
50
58
.37
52
5.8
75
2.2
50
2.2
50
68
.74
50
.00
06
6.2
22
29
.92
25
2.2
50
82
.73
23
.37
50
.12
59
9.6
96
11
12
.49
1
Rai
nb
ow
Sm
elt
0.0
39
0.0
00
0.0
00
0.0
00
0.0
00
0.0
00
0.0
00
0.0
00
0.0
00
0.0
00
0.0
00
0.0
00
0.0
00
0.0
00
0.0
00
0.0
00
0.0
00
0.0
00
No
rther
n P
ike
0.0
56
0.0
00
0.1
25
0.0
00
0.0
00
0.0
00
0.0
00
0.0
00
0.0
00
0.0
00
0.0
00
0.0
13
0.0
00
0.0
00
0.0
00
0.0
00
0.0
00
0.0
00
Whit
e S
uck
er4
.03
10
.75
02
.87
51
.12
51
.37
50
.87
50
.12
50
.37
50
.37
50
.62
53
.75
01
.22
52
.50
02
.00
01
.25
02
.87
50
.50
01
.62
5
Mo
xost
om
a s
p.
0.0
07
0.0
00
0.0
00
0.0
00
0.0
00
0.0
00
0.0
00
0.0
00
0.0
00
0.0
00
0.0
00
0.0
00
0.0
00
0.0
00
0.0
00
0.0
00
0.0
00
0.0
00
Co
mm
on C
arp
0.5
45
0.2
50
0.0
00
0.5
00
0.3
75
0.2
50
0.8
75
0.1
25
0.3
75
0.0
00
1.0
00
0.3
75
1.3
75
0.3
75
0.1
25
0.0
00
0.0
00
0.5
00
Em
eral
d S
hin
er0
.04
20
.00
00
.00
00
.00
00
.00
00
.00
00
.00
00
.00
00
.00
00
.00
00
.00
00
.00
00
.00
00
.00
00
.00
00
.00
00
.00
00
.00
0
Sp
ott
ail
Shin
er1
6.0
69
12
.12
56
3.6
25
8.8
75
20
.25
05
6.2
50
18
.62
51
5.3
75
10
.62
51
9.5
00
37
.62
52
6.2
88
53
.75
09
2.7
50
11
.00
08
2.7
28
43
.75
05
2.6
25
Bro
wn B
ull
hea
d2
9.5
70
16
.37
53
2.6
25
38
.00
02
3.7
50
12
.12
55
4.6
25
9.7
50
8.7
50
3.0
00
4.7
50
20
.37
54
.25
01
.87
56
.37
57
.87
51
.37
52
.62
5
Chan
nel
Cat
fish
0.1
51
0.0
00
0.1
25
0.0
00
0.0
00
0.1
25
0.3
75
0.0
00
0.0
00
0.0
00
0.0
00
0.0
63
0.0
00
0.0
00
0.1
25
0.5
00
0.1
25
0.2
50
Icta
luru
s sp
.0
.00
00
.37
50
.00
00
.00
00
.00
00
.00
00
.00
00
.00
00
.00
00
.00
00
.00
00
.03
80
.00
00
.00
00
.00
00
.00
00
.00
00
.00
0
Am
eric
an E
el0
.33
70
.12
50
.12
50
.00
00
.00
00
.00
00
.00
00
.00
00
.00
00
.00
00
.00
00
.02
50
.00
00
.00
00
.00
00
.00
00
.00
00
.37
5
Tro
ut-
per
ch2
3.3
20
1.3
75
9.1
25
5.0
00
3.1
25
21
.62
52
1.0
00
14
.00
06
5.8
75
67
.75
04
5.6
25
25
.45
08
6.7
50
40
.87
56
4.2
50
64
3.9
90
71
.87
54
6.0
00
Whit
e P
erch
44
6.6
56
18
.25
07
93
.23
71
45
.12
51
49
9.0
98
55
4.6
16
12
52
.31
83
63
.56
74
56
.72
91
11
7.1
16
19
0.7
86
63
9.0
84
15
52
.35
42
40
.16
45
40
.93
93
4.2
50
52
.25
02
11
.33
0
Whit
e B
ass
1.2
21
0.0
00
2.1
25
0.0
00
0.2
50
2.6
25
3.8
75
0.2
50
0.7
50
8.2
50
0.3
75
1.8
50
2.3
75
0.3
75
0.7
50
0.6
25
1.7
50
1.2
50
Sunfi
sh1
.70
85
0.0
00
0.0
00
0.0
00
0.0
00
0.0
00
25
.25
00
.00
09
.75
00
.00
00
.00
08
.50
00
.00
00
.00
00
.00
00
.00
00
.00
00
.00
0
Ro
ck B
ass
0.0
00
0.0
00
0.1
25
0.0
00
0.0
00
0.0
00
0.0
00
0.0
00
0.0
00
0.0
00
0.0
00
0.0
13
0.0
00
0.0
00
0.0
00
0.0
00
0.0
00
0.0
00
Pum
pkin
seed
18
.61
28
3.8
75
64
.12
56
7.6
25
36
.62
53
.75
06
.87
51
.87
55
.75
01
2.1
25
5.8
75
28
.85
01
0.2
50
4.5
00
16
.25
02
.12
55
.87
52
3.1
25
Blu
egil
l1
.93
01
24
.87
51
3.6
25
14
.62
50
.75
09
.62
56
.75
01
6.0
00
3.8
75
10
.37
54
.25
02
0.4
75
13
.00
03
.25
02
.12
52
.25
01
3.6
25
10
.37
5
Sm
allm
outh
Bas
s0
.03
20
.12
50
.25
00
.00
00
.00
00
.00
00
.00
00
.00
00
.00
00
.00
00
.00
00
.03
80
.00
00
.00
00
.00
00
.00
00
.00
00
.00
0
Lar
gem
outh
Bas
s0
.00
00
.00
00
.25
00
.00
00
.25
00
.00
00
.00
00
.00
00
.12
51
.50
01
.62
50
.37
50
.12
59
.50
01
.00
00
.00
00
.00
00
.00
0
Bla
ck C
rap
pie
0.3
56
0.6
25
0.5
00
0.3
75
0.3
75
1.0
00
2.6
25
0.2
50
0.1
25
0.2
50
0.0
00
0.6
13
0.0
00
0.0
00
0.0
00
0.0
00
0.6
25
0.1
25
Lep
om
is s
p.
0.0
00
0.0
00
66
.62
50
.00
00
.00
01
06
0.4
43
0.0
00
4.1
25
56
.48
14
1.5
00
17
0.4
65
13
9.9
64
0.5
00
59
.62
55
.25
01
0.7
50
49
.25
01
8.2
50
Yel
low
Per
ch6
2.9
98
38
1.1
25
15
3.4
63
10
7.6
50
20
0.2
66
90
.62
39
9.3
95
33
.75
06
60
.64
31
97
.79
01
84
.25
82
10
.89
64
35
.50
11
21
.07
18
2.6
25
57
7.7
28
16
4.4
61
32
1.1
34
Wal
leye
10
.48
57
.50
06
.12
51
9.2
50
16
.87
56
.50
08
.12
58
.75
02
8.1
25
10
.75
07
.25
01
1.9
25
26
.75
01
1.0
00
4.1
25
23
.37
51
8.2
50
10
.00
0
Johnny D
arte
r0
.03
71
.25
00
.25
00
.00
00
.00
00
.00
00
.00
00
.00
00
.00
00
.00
00
.00
00
.15
00
.00
00
.00
00
.00
00
.00
00
.00
00
.00
0
Lo
gp
erch
0.0
53
0.1
25
0.0
00
0.2
50
0.0
00
0.0
00
0.1
25
0.2
50
3.2
50
2.2
50
0.0
00
0.6
25
0.1
25
0.0
00
0.1
25
3.1
25
0.0
00
0.0
00
Bro
ok S
ilver
sid
e0
.06
90
.00
00
.00
00
.00
00
.00
00
.00
00
.12
50
.00
00
.00
00
.00
00
.37
50
.05
00
.00
01
.12
50
.62
50
.00
00
.25
01
.50
0
Ro
und
Go
by
0.0
00
0.0
00
0.1
25
1.3
75
15
.75
09
.50
04
.75
05
0.4
23
1.1
25
0.6
25
0.3
75
8.4
05
0.7
50
1.6
25
0.6
25
0.3
75
1.2
50
0.0
00
Fre
shw
ater
Dru
m1
0.8
94
21
.75
02
4.3
75
9.0
00
15
.62
51
25
.52
01
78
.46
51
39
.36
11
4.6
25
11
.62
55
1.5
00
59
.18
51
5.7
50
31
.50
02
2.7
50
4.1
25
6.3
75
90
.20
1
To
tal
catc
h8
91
72
11
51
14
42
23
01
20
17
17
00
66
11
58
61
54
31
10
91
35
92
31
08
27
10
77
14
98
56
82
02
4
Num
ber
of
spec
ies
17
17
22
15
17
17
20
18
19
16
17
18
17
17
19
15
16
19
Num
ber
of
traw
ls8
88
88
88
88
88
88
88
8
Yea
r

Section 1. Index Fishing Projects
44
TA
BL
E 1
.3.1
5.
Sp
ecie
s-sp
ecif
ic c
atch
per
tra
wl
(6 m
in d
ura
tion
; 1/4
mil
e) b
y y
ear
in t
he
fish
com
mun
ity i
nd
ex b
ott
om
tra
wli
ng p
rogra
m a
t B
elle
vil
le (
5 m
dep
th),
Bay
of
Qu
inte
. C
atch
es a
re t
he
mea
n n
um
ber
of
fish
ob
serv
ed f
or
the
nu
mb
er o
f tr
awls
ind
icat
ed. T
ota
l ca
tch
and
nu
mb
er o
f sp
ecie
s ca
ugh
t ar
e in
dic
ated
.
Sp
ecie
s
19
92
-20
00
mea
n2
00
12
00
22
00
32
00
42
00
52
00
62
00
72
00
82
00
92
01
0
20
01
-20
10
mea
n2
01
12
01
22
01
32
01
42
01
52
01
6
Sea
Lam
pre
y0
.01
40
.00
00
.00
00
.00
00
.00
00
.00
00
.00
00
.00
00
.00
00
.00
00
.00
00
.00
00
.00
00
.00
00
.00
00
.00
00
.00
00
.00
0
Lo
ngno
se G
ar0
.00
00
.00
00
.00
00
.00
00
.00
00
.00
00
.00
00
.00
00
.00
00
.00
06
.00
00
.60
00
.00
00
.00
00
.00
00
.00
00
.00
00
.12
5
Ale
wif
e9
2.0
34
0.2
50
82
.37
50
.12
51
1.5
00
13
.87
59
.75
00
.12
53
4.8
75
78
.78
25
9.8
21
29
.14
81
28
.25
02
4.7
50
27
2.4
38
0.0
00
65
.02
62
7.0
00
Giz
zard
Shad
26
6.4
40
99
.20
42
34
.37
54
6.0
29
58
1.8
93
50
.57
18
8.3
27
73
.31
83
26
.99
23
21
.44
15
00
.84
92
32
.30
09
20
.84
37
08
.15
11
01
1.1
84
0.0
00
20
4.7
67
72
.88
4
Rai
nb
ow
Sm
elt
0.1
11
0.0
00
0.0
00
0.0
00
0.0
00
0.0
00
0.0
00
0.0
00
0.0
00
0.0
00
0.0
00
0.0
00
0.0
00
0.0
00
0.0
00
0.0
00
0.0
00
0.0
00
No
rther
n P
ike
0.1
11
0.0
00
0.0
00
0.0
00
0.0
00
0.0
00
0.0
00
0.0
00
0.0
00
0.0
00
0.0
00
0.0
00
0.0
00
0.0
00
0.0
00
0.0
00
0.0
00
0.0
00
Mo
oney
e0
.01
40
.00
00
.00
00
.00
00
.00
00
.00
00
.00
00
.00
00
.00
00
.00
00
.00
00
.00
00
.00
00
.00
00
.00
00
.00
00
.00
00
.00
0
Whit
e S
uck
er2
.64
80
.37
50
.37
50
.50
00
.12
50
.00
00
.75
00
.25
00
.25
00
.12
50
.62
50
.33
80
.12
50
.00
00
.37
50
.25
00
.00
00
.25
0
Co
mm
on C
arp
0.3
19
0.1
25
0.1
25
0.6
25
0.0
00
0.5
00
0.6
25
0.2
50
0.1
25
1.0
00
1.5
00
0.4
88
0.0
00
0.3
75
0.1
25
0.1
25
0.0
00
0.8
75
Sp
ott
ail
Shin
er7
1.5
84
10
.62
52
1.5
00
4.7
50
3.8
75
13
.25
02
3.8
75
3.7
50
17
.37
53
3.3
75
8.1
25
14
.05
02
6.7
50
2.7
50
13
.50
09
.25
06
.12
57
6.5
57
Bro
wn B
ull
hea
d1
7.8
24
32
.00
01
0.8
75
5.3
75
17
.87
51
5.0
00
14
.87
59
.37
56
.00
02
.75
06
.25
01
2.0
38
1.2
50
1.1
25
1.2
50
2.3
75
4.0
00
3.1
25
Chan
nel
Cat
fish
0.0
69
0.0
00
0.1
25
0.1
25
0.0
00
0.3
75
0.0
00
0.0
00
0.0
00
0.0
00
0.0
00
0.0
63
0.0
00
0.2
50
0.0
00
0.0
00
0.0
00
0.0
00
Am
eric
an E
el0
.19
40
.00
00
.00
00
.00
00
.00
00
.00
00
.00
00
.00
00
.00
00
.00
00
.00
00
.00
00
.00
00
.00
00
.00
00
.00
00
.12
50
.00
0
Burb
ot
0.0
14
0.0
00
0.0
00
0.0
00
0.0
00
0.0
00
0.0
00
0.0
00
0.0
00
0.0
00
0.0
00
0.0
00
0.0
00
0.0
00
0.0
00
0.0
00
0.0
00
0.0
00
Tro
ut-
per
ch7
8.5
32
13
.00
05
.50
01
2.7
50
14
.37
59
.75
04
.00
01
4.2
50
19
.00
03
2.1
25
18
.62
51
4.3
38
32
.00
02
2.2
50
39
.12
53
8.8
75
21
.62
51
8.0
00
Whit
e P
erch
30
6.9
00
6.6
25
15
4.6
25
16
5.0
15
19
30
.12
94
76
.08
78
80
.66
03
38
.96
98
45
.07
71
60
1.6
55
10
4.2
85
65
0.3
13
39
4.5
88
50
.12
52
49
4.6
25
24
.37
54
5.2
50
17
5.1
35
Whit
e B
ass
1.5
09
0.1
25
3.0
00
1.6
25
3.6
25
2.0
00
6.0
00
0.2
50
1.0
00
13
.37
53
.87
53
.48
81
3.7
50
0.7
50
2.0
00
1.8
75
29
.75
09
.12
5
Sunfi
sh4
.47
24
8.1
25
0.0
00
14
.62
50
.00
00
.00
01
4.5
00
0.0
00
42
.12
50
.00
00
.00
01
1.9
38
0.0
00
0.0
00
0.0
00
0.0
00
0.0
00
0.0
00
Ro
ck B
ass
0.2
36
0.0
00
0.0
00
0.0
00
0.0
00
0.0
00
0.0
00
0.0
00
0.0
00
0.0
00
0.0
00
0.0
00
0.1
25
0.0
00
0.0
00
0.0
00
0.1
25
0.0
00
Pum
pkin
seed
26
.42
22
1.7
50
5.1
25
1.8
75
4.1
25
1.7
50
1.1
25
0.8
75
0.5
00
0.2
50
0.3
75
3.7
75
0.5
00
0.1
25
0.3
75
0.1
25
0.5
00
0.5
00
Blu
egil
l1
3.4
31
0.2
50
0.5
00
0.1
25
0.0
00
0.3
75
1.2
50
1.8
75
0.0
00
0.0
00
0.6
25
0.5
00
0.3
75
0.0
00
0.1
25
3.6
25
0.0
00
0.3
75
Sm
allm
outh
Bas
s0
.29
60
.12
50
.12
50
.00
00
.00
00
.00
00
.00
00
.00
00
.00
00
.00
00
.00
00
.02
50
.00
00
.00
00
.00
00
.00
00
.00
00
.00
0
Lar
gem
outh
Bas
s0
.15
70
.12
50
.37
50
.25
00
.62
50
.37
50
.00
00
.12
50
.62
50
.00
01
.50
00
.40
00
.37
50
.37
53
.87
50
.00
00
.00
00
.87
5
Bla
ck C
rap
pie
3.3
89
0.3
75
0.0
00
0.0
00
0.2
50
0.1
25
2.0
00
0.3
75
0.2
50
0.1
25
0.0
00
0.3
50
0.0
00
0.0
00
0.0
00
0.0
00
0.0
00
0.0
00
Lep
om
is s
p.
0.0
14
0.0
00
88
.37
50
.00
02
.37
54
09
.72
00
.25
05
.12
59
.00
01
7.8
75
29
3.9
90
82
.67
11
3.3
75
30
.62
55
.62
53
1.2
50
20
.50
02
8.6
25
Yel
low
Per
ch1
16
.49
43
7.8
75
53
.25
01
4.2
50
66
.25
04
7.3
75
14
.62
57
8.7
50
21
4.7
29
44
.37
53
00
.51
38
7.1
99
63
7.0
39
21
.75
04
0.7
50
68
1.1
56
16
8.7
11
95
.84
7
Wal
leye
13
.35
25
.37
50
.75
08
.50
02
.62
52
.00
02
.75
08
.62
51
8.1
25
3.5
00
10
.37
56
.26
38
.75
03
.50
00
.75
01
8.6
25
6.3
75
7.8
75
Johnny D
arte
r1
.48
11
2.5
00
2.1
25
0.1
25
0.0
00
0.0
00
0.0
00
0.0
00
0.0
00
0.0
00
0.0
00
1.4
75
0.0
00
0.0
00
0.0
00
0.1
25
0.2
50
0.0
00
Lo
gp
erch
0.3
47
0.2
50
0.5
00
0.1
25
0.1
25
0.1
25
0.0
00
0.7
50
1.0
00
1.0
00
0.2
50
0.4
13
0.1
25
0.0
00
0.0
00
1.5
00
0.6
25
0.2
50
Bro
ok S
ilver
sid
e0
.13
90
.00
00
.50
00
.00
00
.00
00
.00
01
.25
00
.00
00
.00
00
.00
08
.50
01
.02
50
.12
52
.00
00
.00
00
.00
00
.00
04
.12
5
Ro
und
Go
by
0.0
00
0.0
00
1.6
25
67
.00
04
7.2
50
60
.25
07
.12
55
3.8
75
8.6
25
30
.50
05
.87
52
8.2
13
1.2
50
6.5
00
1.2
50
7.0
00
39
.37
57
.00
0
Fre
shw
ater
Dru
m2
3.4
12
16
3.7
50
58
.25
02
0.8
75
4.3
75
21
4.7
77
87
.00
08
30
.17
52
5.0
00
31
.00
05
3.3
75
14
8.8
58
13
.87
51
7.6
25
9.2
50
11
.25
02
7.7
50
15
1.5
97
Scu
lpin
sp
.0
.01
90
.00
00
.00
00
.00
00
.00
00
.00
00
.00
00
.00
00
.00
00
.00
00
.00
00
.00
00
.00
00
.00
00
.00
00
.00
00
.00
00
.00
0
To
tal
catc
h1
04
24
53
72
43
65
26
91
13
18
11
61
14
21
15
71
22
13
13
85
13
30
21
93
89
33
89
78
32
64
16
80
Num
ber
of
spec
ies
18
19
21
19
16
18
17
18
17
16
19
18
18
16
16
15
16
19
Num
ber
of
traw
ls8
88
88
88
88
88
88
88
8
Yea
r

Section 1. Index Fishing Projects
TA
BL
E 1
.3.1
6.
Sp
ecie
s-sp
ecif
ic c
atch
per
tra
wl
(6 m
in d
ura
tion
; 1
/4 m
ile)
by y
ear
in t
he
fish
com
mun
ity i
nd
ex b
ott
om
tra
wli
ng p
rogra
m a
t T
ren
ton
(4
m d
epth
), B
ay o
f Q
uin
te.
Cat
ches
are
th
e m
ean
nu
mb
er o
f fi
sh o
bse
rved
for
the
nu
mber
of
traw
ls i
nd
icat
ed.
Tota
l ca
tch a
nd
nu
mb
er o
f sp
ecie
s ca
ught
are
ind
icat
ed.
45
Sp
ecie
s
19
92
-20
00
mea
n2
00
12
00
22
00
32
00
42
00
52
00
62
00
72
00
82
00
92
01
0
20
01
-20
10
mea
n2
01
12
01
22
01
32
01
42
01
52
01
6
Ale
wif
e6
6.9
11
14
9.2
97
98
.61
11
74
.13
78
.62
55
08
.87
01
26
.63
92
4.5
00
8.7
50
11
2.3
75
26
.87
51
23
.86
84
9.5
00
86
.63
93
54
.15
25
6.7
54
44
.25
09
6.8
52
Giz
zard
Shad
16
5.2
99
4.1
25
6.3
75
22
.25
00
.00
03
0.3
75
23
.37
51
.37
53
8.5
00
5.7
50
84
.23
42
1.6
36
25
.62
57
0.0
00
4.1
25
0.0
00
55
.36
68
.62
5
Rai
nb
ow
Sm
elt
0.0
56
0.0
00
0.0
00
0.0
00
0.0
00
0.0
00
0.0
00
0.0
00
0.0
00
0.0
00
0.0
00
0.0
00
0.0
00
0.0
00
0.0
00
0.0
00
0.0
00
0.0
00
No
rther
n P
ike
0.0
69
0.0
00
0.0
00
0.0
00
0.0
00
0.1
25
0.0
00
0.0
00
0.0
00
0.0
00
0.0
00
0.0
13
0.0
00
0.0
00
0.0
00
0.0
00
0.0
00
0.0
00
Mo
oney
e0
.05
60
.00
00
.00
00
.00
00
.00
00
.00
00
.00
00
.00
00
.00
00
.00
00
.00
00
.00
00
.00
00
.00
00
.00
00
.00
00
.00
00
.00
0
Whit
e S
uck
er3
.00
00
.50
01
.62
50
.62
51
.12
51
.87
52
.12
52
.12
50
.37
50
.50
00
.75
01
.16
30
.62
51
.62
50
.00
00
.12
58
.87
50
.25
0
Sho
rthea
d R
edho
rse
0.0
00
0.0
00
0.0
00
0.0
00
0.0
00
0.0
00
0.0
00
0.0
00
0.0
00
0.0
00
0.0
00
0.0
00
0.0
00
0.0
00
0.0
00
0.0
00
0.1
25
0.0
00
Min
no
w0
.01
40
.00
00
.00
00
.00
00
.00
00
.00
00
.00
00
.00
00
.00
00
.00
00
.00
00
.00
00
.00
00
.00
00
.00
00
.00
00
.00
00
.00
0
Co
mm
on C
arp
0.2
78
0.0
00
0.2
50
0.0
00
0.0
00
0.0
00
0.2
50
0.0
00
0.0
00
0.0
00
0.1
25
0.0
63
0.1
25
0.0
00
0.0
00
0.0
00
0.0
00
0.0
00
Sp
ott
ail
Shin
er8
8.4
67
21
7.4
25
60
.87
56
0.8
75
1.2
50
24
.50
04
1.7
50
0.0
00
76
.00
01
48
.41
01
20
.06
17
5.1
15
15
8.4
81
18
9.6
16
5.8
75
1.0
00
86
.87
33
.62
5
Bro
wn B
ull
hea
d2
6.4
31
10
.62
53
.50
04
.25
01
.12
58
.75
03
.75
04
.50
01
.37
50
.87
51
.50
04
.02
52
.37
53
.87
50
.12
51
.12
53
.50
01
.37
5
Chan
nel
Cat
fish
0.2
36
0.0
00
0.0
00
0.0
00
0.0
00
0.0
00
0.0
00
0.0
00
0.0
00
0.0
00
0.0
00
0.0
00
0.0
00
0.1
25
0.0
00
0.1
25
0.0
00
0.0
00
Am
eric
an E
el0
.25
00
.00
00
.00
00
.00
00
.00
00
.00
00
.00
00
.00
00
.00
00
.00
00
.00
00
.00
00
.00
00
.00
00
.00
00
.00
00
.00
00
.00
0
Ban
ded
Kil
lifi
sh0
.00
00
.00
00
.00
00
.00
00
.00
00
.00
00
.00
00
.00
00
.00
00
.00
00
.12
50
.01
30
.00
00
.00
00
.00
00
.00
00
.00
00
.00
0
Burb
ot
0.0
00
0.1
25
0.0
00
0.0
00
0.0
00
0.0
00
0.0
00
0.0
00
0.0
00
0.0
00
0.0
00
0.0
13
0.0
00
0.0
00
0.0
00
0.0
00
0.0
00
0.0
00
Tro
ut-
per
ch2
7.1
39
0.5
00
0.5
00
0.0
00
0.0
00
0.1
25
0.1
25
0.0
00
0.2
50
1.6
25
1.5
00
0.4
63
3.2
50
1.7
50
0.0
00
2.7
50
1.2
50
0.5
00
Whit
e P
erch
32
1.1
16
54
.25
01
9.8
75
24
0.0
32
80
.77
72
79
.01
83
88
.31
22
9.8
75
33
.75
06
69
.31
31
6.2
50
18
1.1
45
26
1.9
00
36
1.8
91
27
.12
50
.25
01
1.1
25
72
.24
4
Whit
e B
ass
0.4
03
0.0
00
0.1
25
0.0
00
0.0
00
0.0
00
1.2
50
0.1
25
0.0
00
0.8
75
0.1
25
0.2
50
1.6
25
0.2
50
0.0
00
0.0
00
5.1
25
0.3
75
Sunfi
sh1
3.7
64
33
.25
00
.00
02
2.3
75
0.0
00
0.0
00
11
.50
00
.00
00
.87
50
.00
00
.00
06
.80
00
.00
00
.00
00
.00
00
.00
00
.00
00
.00
0
Ro
ck B
ass
0.8
89
0.6
25
0.6
25
0.1
25
0.0
00
0.5
00
2.2
50
0.0
00
1.2
50
2.8
75
2.2
50
1.0
50
4.0
00
0.3
75
0.5
00
1.7
50
1.8
75
0.0
00
Pum
pkin
seed
86
.35
38
4.7
50
32
.25
08
8.8
87
56
.79
44
6.7
50
20
.00
07
7.5
22
14
3.7
90
66
.25
06
2.2
50
67
.92
46
7.0
62
40
.12
51
18
.61
72
0.0
00
63
.87
52
.62
5
Blu
egil
l0
.75
01
.12
50
.50
01
.50
00
.87
50
.37
53
.87
55
.25
02
.62
50
.62
55
.12
52
.18
81
1.8
75
1.0
00
3.8
75
2.5
00
1.6
25
0.0
00
Sm
allm
outh
Bas
s0
.55
60
.37
50
.25
00
.50
00
.50
00
.12
50
.00
00
.00
00
.12
50
.25
00
.00
00
.21
30
.12
50
.00
00
.25
00
.00
00
.00
00
.00
0
Lar
gem
outh
Bas
s2
.23
62
.37
52
.87
54
.62
50
.12
56
.62
54
.25
00
.12
56
.37
52
.75
06
.87
53
.70
01
4.1
25
11
.25
05
.50
00
.12
55
.50
01
0.7
50
Bla
ck C
rap
pie
1.6
81
0.1
25
0.0
00
0.0
00
0.0
00
0.0
00
0.0
00
0.0
00
0.0
00
0.0
00
0.0
00
0.0
13
0.0
00
0.0
00
0.0
00
0.0
00
0.0
00
0.0
00
Lep
om
is s
p.
0.7
64
0.0
00
64
.79
60
.00
00
.00
05
9.7
50
10
.25
00
.00
01
7.0
00
0.6
25
7.1
25
15
.95
52
4.8
75
6.5
00
3.1
25
5.0
00
10
.25
01
5.6
25
Yel
low
Per
ch3
17
.77
22
00
.63
82
39
.01
45
44
.69
41
86
.46
53
40
.86
81
30
.13
95
84
.82
57
69
.63
51
09
5.3
67
33
5.2
95
44
2.6
94
11
69
.50
42
78
.56
58
92
.89
55
25
.09
81
00
9.4
64
14
0.8
27
Wal
leye
9.7
64
9.6
25
3.6
25
10
.50
01
.50
01
.87
50
.75
04
.75
07
.37
56
.12
52
.12
54
.82
58
.00
09
.00
00
.00
01
6.0
00
24
.75
02
.25
0
Johnny D
arte
r5
.45
82
.50
07
.25
07
.62
50
.37
50
.00
00
.00
00
.00
00
.00
00
.00
00
.00
01
.77
50
.25
00
.25
00
.00
00
.12
50
.00
00
.12
5
Lo
gp
erch
3.0
97
2.0
00
0.0
00
15
.25
04
.25
05
2.7
50
0.6
25
5.6
25
23
.37
53
2.3
75
6.8
75
14
.31
32
4.3
75
4.7
50
2.6
25
48
.75
01
2.2
50
1.0
00
Bro
ok S
ilver
sid
e0
.00
00
.00
00
.00
00
.25
00
.00
00
.00
00
.00
00
.12
50
.00
00
.00
00
.12
50
.05
00
.12
50
.00
00
.00
00
.00
00
.00
00
.50
0
Ro
und
Go
by
0.0
00
0.0
00
0.0
00
2.8
75
8.5
00
13
.12
55
.25
00
.75
01
2.3
75
34
.12
57
.37
58
.43
81
8.7
50
12
.12
51
.87
51
9.7
50
32
.62
57
.00
0
Fre
shw
ater
Dru
m1
1.9
31
6.7
50
3.6
25
2.0
00
0.3
75
4.1
25
4.8
75
9.5
00
1.5
00
4.8
75
1.3
75
3.9
00
2.1
25
1.1
25
0.0
00
1.5
00
3.0
00
1.2
50
To
tal
catc
h1
15
57
81
54
71
20
33
53
13
81
78
17
51
11
45
21
86
68
89
82
18
49
10
81
14
21
70
31
38
23
66
Num
ber
of
spec
ies
20
20
18
19
15
18
19
15
18
18
20
18
21
19
13
17
18
17
Num
ber
of
traw
ls8
88
88
88
88
88
88
88
8
Yea
r

Section 1. Index Fishing Projects
46
FIG
. 1
.3.3
. A
bun
dan
ce t
ren
ds
(annu
al m
ean
s) f
or
the
most
com
mon
sp
ecie
s ca
ught
in b
ott
om
tra
wls
at
six s
ites
in
th
e B
ay o
f Q
uin
te (
Con
way
, H
ay B
ay,
Des
eron
to,
Big
Bay
, B
elle
vil
le a
nd
Tre
nto
n;
see
Fig
. 1
.3.1
). V
alu
es s
how
n h
ere
are
3-y
r ru
nn
ing a
ver
ages
(tw
o y
ears
for
firs
t an
d l
ast
yea
rs g
rap
hed
).
0
20
0
40
0
60
0
80
0
10
00
12
00
14
00 1
99
21
99
41
99
61
99
82
00
02
00
22
00
42
00
62
00
82
01
02
012
20
14
20
16
Catch per Trawl
Wh
ite P
erc
h
0
10
0
20
0
30
0
40
0
50
0
60
0
70
0 19
92
19
94
19
96
19
98
20
00
20
02
20
04
20
06
20
08
20
10
20
12
20
14
20
16
Catch per Trawl
Yello
w P
erc
h
0
50
10
0
15
0
20
0
25
0
30
0
35
0
40
0
45
0 19
92
19
94
19
96
19
98
20
00
20
02
20
04
20
06
20
08
20
10
20
12
20
14
20
16
Catch per Trawl
Ale
wif
e
0
50
10
0
15
0
20
0
25
0
30
0
35
0
40
0 19
92
19
94
19
96
19
98
20
00
20
02
20
04
20
06
20
08
20
10
20
12
20
14
20
16
Catch per Trawl
Giz
zard
Sh
ad
0
20
40
60
80
10
0
12
0
14
0
16
0
18
0 19
92
19
94
19
96
19
98
20
00
20
02
20
04
20
06
20
08
20
10
20
12
20
14
20
16
Catch per Trawl
Tro
ut-
perc
h
0
10
20
30
40
50
60
70
80
90 1
99
21
99
41
99
61
99
82
00
02
00
22
00
42
00
62
00
82
01
02
01
22
01
42
01
6
Catch per Trawl
Sp
ott
ail S
hin
er
0
20
40
60
80
10
0
12
0 19
92
19
94
19
96
19
98
20
00
20
02
20
04
20
06
20
08
20
10
20
12
20
14
20
16
Catch per Trawl
Pu
mp
kin
seed
0
20
40
60
80
10
0
12
0
14
0
16
0
18
0 19
92
19
94
19
96
19
98
20
00
20
02
20
04
20
06
20
08
20
10
20
12
20
14
20
16
Catch per TrawlF
resh
wate
r D
rum
0
10
20
30
40
50
60
70 1
99
21
99
41
99
61
99
82
00
02
00
22
00
42
00
62
00
82
01
02
01
22
01
42
01
6
Catch per Trawl
Ro
un
d G
ob
y
05
10
15
20
25
30
35 1
99
21
99
41
99
61
99
82
00
02
00
22
00
42
00
62
00
82
01
02
01
22
01
42
01
6
Catch per Trawl
Bro
wn
Bu
llh
ead
0
20
40
60
80
10
0
12
0 19
92
19
94
19
96
19
98
20
00
20
02
20
04
20
06
20
08
20
10
20
12
20
14
20
16
Catch per Trawl
Rain
bo
w S
melt
05
10
15
20
25
30 1
99
21
99
41
99
61
99
82
00
02
00
22
00
42
00
62
00
82
01
02
01
22
01
42
01
6
Catch per Trawl
Walleye

Section 1. Index Fishing Projects
47
FIG
. 1
.3.3
(co
nti
nu
ed).
Ab
und
ance
tre
nd
s fo
r th
e m
ost
com
mon
sp
ecie
s ca
ught
in b
ott
om
tra
wls
at
six s
ites
in
th
e B
ay o
f Q
uin
te (
Con
way
, H
ay B
ay,
Des
eron
to,
Big
Bay
, B
elle
vil
le a
nd
Tre
nto
n;
see
Fig
. 1
.3.1
). V
alu
es s
how
n h
ere
are
3-y
r ru
nn
ing a
ver
ages
(tw
o y
ears
for
firs
t an
d l
ast
yea
rs g
rap
hed
).
05
10
15
20
25 1
99
21
99
41
99
61
99
82
00
02
00
22
00
42
00
62
00
82
01
02
01
22
01
42
01
6
Catch per Trawl
Wh
ite
Su
ck
er
05
10
15
20
25 1
99
21
99
41
99
61
99
82
00
02
00
22
00
42
00
62
00
82
01
02
01
22
01
42
01
6
Catch per Trawl
Blu
eg
ill
02468
10
12 1
99
21
99
41
99
61
99
82
00
02
00
22
00
42
00
62
00
82
01
02
01
22
01
42
01
6
Catch per Trawl
Lo
gp
erc
h
012345 19
92
19
94
19
96
19
98
20
00
20
02
20
04
20
06
20
08
20
10
20
12
20
14
20
16
Catch per Trawl
La
rge
mo
uth
Ba
ss
012345678 19
92
19
94
19
96
19
98
20
00
20
02
20
04
20
06
20
08
20
10
20
12
20
14
20
16
Catch per Trawl
Wh
ite
Bas
s
01234 19
92
19
94
19
96
19
98
20
00
20
02
20
04
20
06
20
08
20
10
20
12
20
14
20
16
Catch per Trawl
La
ke
Wh
itefi
sh
01234567 19
92
19
94
19
96
19
98
20
00
20
02
20
04
20
06
20
08
20
10
20
12
20
14
20
16
Catch per Trawl
Jo
hn
ny D
art
er
01234 19
92
19
94
19
96
19
98
20
00
20
02
20
04
20
06
20
08
20
10
20
12
20
14
20
16
Catch per Trawl
Cis
co
012345 19
92
19
94
19
96
19
98
20
00
20
02
20
04
20
06
20
08
20
10
20
12
20
14
20
16
Catch per Trawl
Bla
ck
Cra
pp
ie
0.0
0.2
0.4
0.6
0.8
1.0
19
92
19
94
19
96
19
98
20
00
20
02
20
04
20
06
20
08
20
10
20
12
20
14
20
16
Catch per Trawl
Ro
ck
Ba
ss
0.0
0.1
0.2
0.3
0.4
0.5
0.6
0.7
0.8
19
92
19
94
19
96
19
98
20
00
20
02
20
04
20
06
20
08
20
10
20
12
20
14
20
16
Catch per Trawl
Co
mm
on
Ca
rp
0.0
0.3
0.6
0.9
1.2
1.5
1.8
2.1
2.4
19
92
19
94
19
96
19
98
20
00
20
02
20
04
20
06
20
08
20
10
20
12
20
14
20
16
Catch per Trawl
Bro
ok
Silve
rsid
e

Section 1. Index Fishing Projects
48
TABLE 1.3.17. Mean catch-per-trawl of age-0 Lake Whitefish at two sites, Conway in the lower Bay of Quinte and EB03 near Timber
Island in eastern Lake Ontario, 1992-2016. Four replicate trawls on
each of two to four visits during August and early September were made at each site. Distances of each trawl drag were 1/4 mile for
Conway and 1/2 mile for EB03.
TABLE 1.3.18. Mean catch-per-trawl of age-0 Cisco at Conway in the lower Bay of Quinte, 1992-2016. Four replicate trawls on each
of two to four visits during August and early September were made
at the Conway site. Distances of each trawl drag was 1/4 mile.
Not a single age-0 Lake Whitefish was
caught in 2016 (Table 1.3.17). Except for the
2003 and 2005 year-classes, age-0 Lake Whitefish
catches have been low for more than a decade.
By way of contrast, Lake Whitefish abundance
measured at older ages suggests less variation in
year-class strength over the same time-period.
For example, the 2004 year-class figures
prominently, relative to the 2003 and 2005 year-
classes, in both index gill net surveys (Section
1.2) and the commercial harvest (Section 3.2).
Age-0 Cisco catches at Conway in 2016
were moderate relative to recent years (Table
1.3.18).
Age-0 catches of Yellow Perch were high
in 2016 (Table 1.3.19). Following two poor year-
classes in 2012 and 2013, the last three year-
classes of Yellow Perch were high.
Following two exceptionally strong year-
classes in 2014 and 2015, the age-0 Walleye
catches in 2016 were low to moderate (Tables
1.3.20 and 1.3.21).
Round Goby first appeared in bottom trawl
catches in the Bay of Quinte in 2001 and in the
Conway N
EB03
(Timber
Island) N
1992 23.4 8 0.9 12
1993 3.1 8 4.7 12
1994 40.5 8 79.7 8
1995 27.1 8 17.1 8
1996 2.6 8 0.8 8
1997 5.1 8 6.0 8
1998 0.4 8 0.0 8
1999 0.0 8 0.0 8
2000 0.4 8 0.0 8
2001 0.1 8 0.0 8
2002 0.1 8 0.0 8
2003 8.1 12 44.9 16
2004 0.0 12 2.1 12
2005 2.8 12 49.8 12
2006 2.4 12 3.6 8
2007 0.8 12 0.3 12
2008 0.1 12 0.0 8
2009 0.3 12 0.1 12
2010 0.3 12 4.7 12
2011 0.1 8 0.0 8
2012 0.0 8 0.0 8
2013 7.0 8 0.0 8
2014 2.3 8 0.0 8
2015 0.1 8 0.4 8
2016 0.0 8 0.0 5
Conway N
1992 0.0 8
1993 1.5 8
1994 7.7 8
1995 1.3 8
1996 0.0 8
1997 0.0 8
1998 0.1 8
1999 0.0 8
2000 0.0 8
2001 0.0 8
2002 0.1 8
2003 2.8 12
2004 0.1 12
2005 7.2 12
2006 4.5 12
2007 2.0 12
2008 0.2 12
2009 0.0 12
2010 6.3 12
2011 8.3 8
2012 23.3 8
2013 1.5 8
2014 11.6 8
2015 1.8 8
2016 3.0 8

Section 1. Index Fishing Projects
TABLE 1.3.19. Mean catch-per-trawl of age-0 Yellow Perch at six Bay of Quinte sites, 1992-2016. Four replicate trawls on each of two to three visits during August and early September were made at each site. Distance of each trawl drag was 1/4 mile.
49
Trenton Belleville Big Bay Deseronto Hay Bay Conway Mean
Number
of trawls
1992 3.1 1.3 0.4 0.1 0.5 0.0 0.9 48
1993 203.7 14.0 0.4 36.3 1.6 0.3 42.7 48
1994 526.6 50.6 10.3 101.5 29.3 6.9 120.8 48
1995 730.4 101.1 9.5 764.5 268.9 0.0 312.4 48
1996 2.6 2.9 4.3 2.5 8.5 0.1 3.5 48
1997 302.0 4.0 36.0 135.0 526.0 0.0 167.2 48
1998 13.1 14.0 11.5 0.1 2.9 0.0 7.0 48
1999 24.5 7.0 4.9 638.7 900.3 0.0 262.6 48
2000 0.0 5.8 5.4 0.8 6.0 0.3 3.0 48
2001 158.0 27.6 16.8 71.8 127.0 0.0 66.9 48
2002 0.0 0.3 9.2 141.8 241.1 0.0 65.4 48
2003 228.5 3.8 0.9 9.2 1.6 0.5 40.8 52
2004 0.0 0.9 4.5 8.4 18.0 0.0 5.3 52
2005 202.8 37.5 24.8 444.7 61.9 0.0 128.6 52
2006 3.8 3.5 51.7 532.8 306.0 0.2 149.7 52
2007 284.3 70.9 29.6 883.5 776.0 0.1 340.7 52
2008 123.8 153.4 114.5 263.6 12.4 0.0 111.3 52
2009 101.3 29.8 130.2 81.1 14.3 0.0 59.4 52
2010 216.8 280.3 167.0 34.6 148.8 0.0 141.2 52
2011 729.7 582.4 382.3 1216.8 4.8 1.7 486.3 53
2012 72.5 16.8 103.6 31.5 38.1 0.1 43.8 48
2013 6.1 8.6 49.5 22.8 9.7 0.0 16.1 48
2014 330.1 223.2 449.3 98.7 48.1 0.0 191.6 48
2015 171.6 83.4 124.3 670.0 224.3 0.0 212.3 48
2016 54.4 92.3 296.4 378.6 36.0 0.0 142.9 48
Kingston Basin of eastern Lake Ontario in 2003.
The species was caught at all Bay of Quinte
trawling sites by 2003, peaking in abundance, at
each site, between 2003 and 2005. Catches have
been quite variable since but remain high. Round
Goby catches in the Kingston Basin increased and
remain high in 2016.

Section 1. Index Fishing Projects
50
TABLE 1.3.20. Mean catch-per-trawl of age-0 Walleye at six Bay of Quinte sites, 1992-2016. Four
replicate trawls on each of two to three visits during August and early September were made at each
site. Distance of each trawl drag was 1/4 mile.
TABLE 1.3.21. Age distribution of 268 Walleye sampled from summer bottom trawls, Bay of Quinte, 2016. Also shown are mean fork length and mean weight. Fish of less than 150 mm fork length were assigned an age of 0, fish between 150 and 290 mm were aged using scales; and
those over 290 mm fork length were aged using otoliths.
Year Trenton Belleville
Big
Bay Deseronto
Hay
Bay Conway Mean
Number
of trawls
1992 6.8 12.4 14.0 37.9 6.1 0.8 13.0 48
1993 8.8 16.0 5.0 11.3 1.1 11.9 9.0 48
1994 17.0 21.0 15.0 23.8 11.5 12.5 16.8 48
1995 14.1 8.3 2.6 8.3 5.5 0.9 6.6 48
1996 4.3 7.6 4.9 1.1 0.0 1.1 3.2 48
1997 2.8 7.6 6.1 0.3 0.1 0.0 2.8 48
1998 0.1 0.4 0.6 0.1 0.0 0.0 0.2 48
1999 1.1 0.4 0.4 1.4 9.1 0.1 2.1 48
2000 0.0 3.8 1.0 0.0 0.1 0.0 0.8 48
2001 9.5 4.5 4.8 6.8 3.3 0.1 4.8 48
2002 0.0 0.0 1.1 0.1 0.0 0.0 0.2 48
2003 10.3 8.3 16.8 1.9 0.4 0.0 6.3 52
2004 0.0 0.6 11.4 1.4 0.9 0.0 2.4 52
2005 0.8 1.4 3.8 1.8 1.1 0.0 1.5 52
2006 0.0 1.0 3.0 2.8 5.9 0.3 2.1 52
2007 4.1 6.1 5.4 5.6 5.6 0.2 4.5 52
2008 5.5 17.6 20.5 14.6 12.4 0.0 11.8 52
2009 2.5 2.3 7.6 1.0 2.9 0.0 2.7 52
2010 1.4 4.6 4.5 1.0 3.6 0.0 2.5 52
2011 6.1 8.6 24.5 8.0 4.0 0.1 8.6 52
2012 6.4 2.5 7.1 0.3 0.1 0.0 2.7 48
2013 0.0 0.0 1.0 0.3 0.6 0.0 0.3 48
2014 15.4 18.5 21.0 20.4 6.4 0.0 13.6 44
2015 21.1 5.6 16.6 13.5 7.0 0.0 10.6 48
2016 0.9 5.5 4.9 2.4 0.1 0.0 2.3 48
Age (years) 0 1 2 3 4 5 6 7 8 9 10 13 Total
Year-class 2016 2015 2014 2013 2012 2011 2010 2009 2008 2007 2006 2003
Number 74 112 70 2 3 1 1 1 1 1 1 1 268
Mean fork length (mm) 127 214 317 405 453 486 528 501 545 644 551 628
Mean weight (g) 19 99 336 754 1081 1268 1660 1384 1919 3478 2114 2981

Section 1. Index Fishing Projects
The nearshore community index netting
program (NSCIN) was initiated on the upper Bay
of Quinte (Trenton to Deseronto), West Lake and
Weller’s Bay in 2001, and was expanded to
include the middle and lower reaches of the Bay
of Quinte (Deseronto to Lake Ontario) in 2002.
In 2006, the NSCIN program was conducted on
Hamilton Harbour and the Toronto Harbour area
thanks to partnerships developed with Fisheries
and Oceans Canada and the Toronto and Region
Conservation Authority. NSCIN was further
expanded to other Lake Ontario nearshore areas in
subsequent years (Table 1.4.1).
The NSCIN protocol uses 6-foot trap nets
and is designed to evaluate the abundance and
other biological attributes of fish species that
inhabit the littoral area. Suitable trap net sites are
chosen from randomly selected UTM grids that
contain shoreline in the nearshore area netted.
Ecosystem (i.e., Index of Biotic Integrity or IBI)
and fish community (e.g., proportion of piscivore
biomass or PPB) level measures have been
developed to assess relative health of Lake
Ontario’s nearshore areas. These assessments are
particularly useful to monitor the on-going status
of impaired fish communities in Lake Ontario
51
1.4 Lake Ontario Nearshore Community Index Netting J. A. Hoyle, Lake Ontario Management Unit
TABLE. 1.4.1. Annual NSCIN trap net schedule for Lake Ontario nearshore areas, 2001-2016. The numbers of trap net samples at each area in each year are indicated.
Areas of Concern (AOCs) such as Hamilton and
Toronto Harbours.
In 2016, NSCIN projects were completed at
three nearshore areas: Hamilton Harbour, Toronto
Harbour, and the upper Bay of Quinte (Fig. 1.4.1).
Hamilton Harbour (partnership project with
Fisheries and Oceans Canada)
Twenty-four trap net sites were sampled on
Hamilton Harbour from Aug 2-11 with water
temperatures ranging from 22.0-26.5oC (Table
1.4.2). More than 12,000 fish comprising 23
species were captured (Table 1.4.3). The most
abundant species by number were Brown
Bullhead (8,149), White Perch (2,661), Bluegill
(416), Channel Catfish (311), Walleye (111), and
Common Carp (104). One American Eel was
captured; total length of the eel was 846 mm and
weight was 2,327 g.
The age distribution and mean length by
age-class of selected species are shown in Tables
1.4.4 and 1.4.5. Abundance trends for all species
are presented in Table 1.4.6 and graphically for
selected species in Fig. 1.4.2. Of particular note
Year
Hamilton
Harbour
Toronto
Islands
Presquille
Bay
Weller's
Bay
West
Lake
East
Lake
Prince
Edward
Bay Upper Middle Lower
North
Channel
Kingston
2016 24 24 36
2015 24 16 24 36
2014 24 23 36
2013 24 16 24 36
2012 24 24 36
2011 36 29 7
2010 24 24 36
2009 27 36 30 18 25
2008 24 12 24 36
2007 24 18 18 36
2006 19 24
Bay of Quinte

Section 1. Index Fishing Projects
52
TABLE 1.4.2. Survey information for the 2016 NSCIN trap net program on Hamilton Harbour, Toronto Harbour and the upper Bay of Quinte. Shown for each embayment are the survey dates, the range of observed surface water temperatures, the total number of trap net lifts, and the
number of trap net lifts broken down by target sampling depth, and observed substrate and cover types.
FIG. 1.4.1. Map of Lake Ontario indicating NSCIN trap net locations in Hamilton Harbour, Toronto Harbour and the upper Bay of Quinte, 2016.
Hamilton Harbour Toronto Harbour Upper Bay of Quinte
Survey dates Aug 2-11 Sep 6-15 Sep 6-23
Water temperature range (oC) 22.0-26.5 15.7-23.8 20.3-24.1
No. of trap net lifts 24 24 36
No. of lifts by depth:
Target (2-2.5 m) 3 9 10
> Target 7 14 17
< Target 14 1 9
No. of lifts by substrate type:
Hard 2 1 14
Soft 22 23 22
No. of lifts by degree of cover:
None 0 1 9
1-25% 8 13 16
26-75% 10 9 9
76-100% 6 1 2

Section 1. Index Fishing Projects
TA
BL
E 1
.4.3
. S
pec
ies-
spec
ific
cat
ch i
n t
he
2016 N
SC
IN t
rap
net
pro
gra
m i
n H
amil
ton H
arb
ou
r, T
oro
nto
Har
bou
r an
d t
he
up
per
Bay
of
Quin
te.
Sta
tist
ics
show
n
incl
ud
e ar
ithm
etic
and g
eom
etri
c m
ean c
atch
-per
-tra
p n
et (
CU
E),
per
cen
t re
lati
ve
stan
dar
d e
rror
of
mea
n l
og1
0(c
atch
+1
), %
RS
E =
10
0*S
E/m
ean,
and m
ean f
ork
or
tota
l le
ngth
(m
m).
A
tota
l of
30
sp
ecie
s w
ere
cau
ght.
53
Sp
ecie
s
Ari
thm
etic
mea
n
Geo
met
ric
mea
n
Rel
ativ
e
stan
dar
d
erro
r (%
)
Mea
n
len
gth
(mm
)
Ari
thm
etic
mea
n
Geo
met
ric
mea
n
Rel
ativ
e
stan
dar
d
erro
r (%
)
Mea
n
len
gth
(mm
)
Ari
thm
etic
mea
n
Geo
met
ric
mea
n
Rel
ativ
e
stan
dar
d
erro
r (%
)
Mea
n
len
gth
(mm
)
Lo
ngn
ose
Gar
0.7
50
0.5
31
24
0.0
83
0.0
59
69
0.5
00
0.2
34
40
Bo
wfi
n1
.33
30
.91
92
00
.54
20
.32
13
70
.75
00
.43
72
7
Ale
wif
e0
.54
20
.25
14
8
Giz
zard
Sh
ad1
.70
80
.77
82
94
.04
20
.94
43
21
.50
00
.65
12
7
Rai
nb
ow
Tro
ut
0.0
83
0.0
59
69
No
rth
ern
Pik
e0
.54
20
.42
12
41
.50
00
.98
62
00
.52
80
.36
52
4
Qu
illb
ack
0.0
42
0.0
29
10
0
Wh
ite
Su
cker
0.0
42
0.0
29
10
02
.58
30
.98
82
70
.61
10
.31
13
3
Sil
ver
Red
ho
rse
0.1
94
0.1
14
50
Sh
ort
hea
d R
edh
ors
e0
.02
80
.01
91
00
Gre
ater
Red
ho
rse
0.3
06
0.1
67
44
Riv
er R
edh
ors
e0
.47
20
.26
83
4
Go
ldfi
sh3
.45
81
.59
32
10
.25
00
.10
97
6
Co
mm
on
Car
p4
.33
32
.61
11
54
.79
22
.84
91
40
.16
70
.12
23
8
Go
lden
Sh
iner
0.1
11
0.0
71
58
Fal
lfis
h0
.02
80
.01
91
00
Ru
dd
3.9
58
2.1
54
19
Bro
wn
Bu
llh
ead
33
9.5
42
49
.42
71
11
60
.37
52
3.4
71
13
3.9
44
2.2
63
13
Ch
ann
el C
atfi
sh1
2.9
58
3.8
49
18
0.1
25
0.0
91
55
1.0
28
0.3
73
37
Am
eric
an E
el0
.04
20
.02
91
00
0.0
42
0.0
29
10
00
.08
30
.05
17
2
Wh
ite
Per
ch1
10
.87
55
1.1
61
80
.04
20
.02
91
00
2.5
83
0.7
54
28
Wh
ite
Bas
s0
.50
00
.36
42
80
.27
80
.18
43
6
Ro
ck B
ass
3.3
33
1.6
91
21
8.7
08
3.5
48
17
2.2
50
1.3
57
15
Pu
mp
kin
seed
0.6
67
0.4
04
32
15
.91
73
.83
02
02
5.0
56
12
.40
07
Blu
egil
l1
7.3
33
7.1
89
15
1.4
58
0.4
61
44
57
.52
82
9.8
06
6
Sm
allm
ou
th B
ass
0.0
83
0.0
59
69
0.1
67
0.0
91
73
0.1
67
0.0
92
58
Lar
gem
ou
th B
ass
0.1
67
0.1
09
57
0.5
42
0.1
75
67
2.4
17
1.5
95
13
Bla
ck C
rap
pie
0.5
83
0.4
04
29
0.1
67
0.0
91
73
3.4
44
2.0
26
13
Yel
low
Per
ch0
.58
30
.46
32
23
.83
31
.31
02
83
.86
12
.19
11
3
Wal
leye
4.6
25
1.4
30
25
0.3
33
0.1
89
50
1.6
11
1.0
02
17
Fre
shw
ater
Dru
m1
.33
30
.54
13
70
.75
00
.48
82
80
.72
20
.42
82
6
Car
assi
us
Au
ratu
s x
Cyp
rin
us
Car
pio
0.2
50
0.1
61
48
No
tro
pis
hyb
rid
s0
.04
20
.02
91
00
To
tal
catc
h p
er n
et5
09
20
71
10
Nu
mb
er o
f sp
ecie
s2
32
42
6
Nu
mb
er o
f n
ets
24
24
36
To
tal
catc
h
12
,21
6
4,9
67
3,9
66
Ham
ilto
n H
arb
ou
rT
oro
nto
Har
bo
ur
Up
per
Bay
of
Qu
inte

Section 1. Index Fishing Projects
54
Tab
le
1.4
.4.
Age
dis
trib
uti
on
of
sele
cted
sp
ecie
s ca
ugh
t in
H
amil
ton
Har
bou
r,
Toro
nto
H
arb
ou
r an
d t
he
upp
er B
ay o
f Q
uin
te,
20
16
.
Tab
le
1.4
.5.
Mea
n
fork
le
ngth
(m
m)
of
sele
cted
sp
ecie
s ca
ught
in
Ham
ilto
n
Har
bou
r,
Toro
nto
Har
bou
r an
d t
he
upp
er B
ay o
f Q
uin
te, 20
16
.
01
23
45
67
89
11
13
01
23
45
67
89
11
13
Lo
cati
on
Sp
ecie
s2
01
62
01
52
01
42
01
32
01
22
01
12
01
02
00
92
00
82
00
72
00
52
00
3L
oca
tio
nS
pec
ies
20
16
20
15
20
14
20
13
20
12
20
11
20
10
20
09
20
08
20
07
20
05
20
03
Ham
ilto
n H
arb
ou
rH
amil
ton
Har
bo
ur
No
rth
ern
Pik
e2
24
31
No
rth
ern
Pik
e4
71
59
95
68
74
78
00
Wh
ite
Bas
s1
34
3W
hit
e B
ass
28
13
07
30
43
41
Pu
mp
kin
seed
11
31
Pu
mp
kin
seed
11
71
26
13
2
Blu
egil
l6
13
45
11
Blu
egil
l1
05
12
11
33
16
01
81
19
0
Sm
allm
ou
th B
ass
2S
mal
lmo
uth
Bas
s3
99
Lar
gem
ou
th B
ass
21
1L
argem
ou
th B
ass
20
23
90
39
8
Bla
ck C
rap
pie
12
2B
lack
Cra
pp
ie1
41
18
9
Yel
low
Per
ch2
46
1Y
ello
w P
erch
15
11
68
22
22
25
Wal
leye
31
Wal
leye
51
6
To
ron
to H
arb
ou
rT
oro
nto
Har
bo
ur
No
rth
ern
Pik
e5
11
63
12
31
No
rth
ern
Pik
e3
96
54
86
79
72
66
32
77
17
76
69
0
Pu
mp
kin
seed
11
13
6P
um
pkin
seed
12
71
35
13
9
Blu
egil
l3
43
2B
lueg
ill
10
01
35
13
81
48
Sm
allm
ou
th B
ass
11
11
1S
mal
lmo
uth
Bas
s1
93
30
03
28
36
6
Lar
gem
ou
th B
ass
11
Lar
gem
ou
th B
ass
23
62
83
47
0
Bla
ck C
rap
pie
31
Bla
ck C
rap
pie
19
22
36
Yel
low
Per
ch1
41
85
1Y
ello
w P
erch
16
11
94
22
02
21
23
0
Up
per
Bay
of
Qu
inte
Up
per
Bay
of
Qu
inte
No
rth
ern
Pik
e2
84
12
1N
ort
her
n P
ike
46
75
66
68
87
40
57
77
54
Pu
mp
kin
seed
99
94
Pu
mp
kin
seed
12
91
42
15
41
60
Blu
egil
l2
61
36
5B
lueg
ill
10
11
24
14
11
67
15
9
Sm
allm
ou
th B
ass
11
12
1S
mal
lmo
uth
Bas
s3
29
34
94
15
45
94
39
Lar
gem
ou
th B
ass
51
58
31
21
Lar
gem
ou
th B
ass
13
91
97
26
72
93
38
54
12
42
4
Bla
ck C
rap
pie
19
94
Bla
ck C
rap
pie
18
02
23
26
2
Yel
low
Per
ch1
51
08
25
1Y
ello
w P
erch
13
21
55
18
92
17
19
22
37
24
4
Wal
leye
61
41
13
21
11
Wal
leye
25
13
71
45
54
27
53
35
24
60
95
77
58
9
Age
(yea
rs)
/ Y
ear-
clas
sA
ge
(yea
rs)
/ Y
ear-
clas
s

Section 1. Index Fishing Projects
55
TA
BL
E 1
.4.6
. S
pec
ies-
spec
ific
abun
dan
ce t
ren
ds
(mea
n c
atch
per
tra
p n
et)
in H
amil
ton
Har
bou
r, T
oro
nto
Har
bou
r an
d t
he
upp
er B
ay o
f Q
uin
te.
An
nu
al t
ota
l ca
tch p
er n
et l
ift,
nu
mb
er o
f n
et s
ets,
an
d n
um
ber
of
spec
ies
are
also
ind
icat
ed.
Sp
ecie
s2
00
62
00
82
01
02
01
22
01
42
01
52
01
62
00
62
00
72
01
02
01
22
01
42
01
62
00
72
00
82
00
92
01
02
01
12
01
22
01
32
01
42
01
52
01
6
Lo
ngn
ose
Gar
0.4
7
0.7
1
0.2
8
0.6
7
0
.17
0
.54
0
.75
0
.17
0.0
4
0.1
7
0
.08
2
.92
0.3
6
0.4
4
1
.56
0.5
0
2.0
8
0
.19
1.4
2
2
.22
0.5
0
Sp
ott
ed G
ar0
.04
Bo
wfi
n0
.58
1
.17
2
.42
1
.17
1.5
4
0.8
3
1.3
3
0.3
3
0
.08
0.4
6
0.4
2
0.1
3
0
.54
0
.92
1.1
1
0.5
0
0
.81
0.7
5
0.5
0
0
.92
1.3
1
0
.53
0.7
5
Ale
wif
e0
.04
0.7
1
13
.75
3.7
9
4
.58
0.4
2
9.5
0
17
.91
0
.54
Giz
zard
Sh
ad3
.42
0
.50
2
.38
2
.13
1.2
1
0.3
3
1.7
1
2.7
1
0
.42
0.0
4
1.0
8
0.3
5
4
.04
0
.39
1.0
0
0.0
6
0
.64
0.1
4
0.3
3
0
.06
0.2
5
0
.58
1.5
0
Ch
ino
ok S
alm
on
0.0
8
Rai
nb
ow
Tro
ut
0.0
5
0.0
4
0.0
4
0.0
8
Atl
anti
c S
alm
on
0.0
4
Bro
wn
Tro
ut
0.0
4
0.0
4
0
.08
0
.13
Lak
e T
rou
t0
.05
Co
reg
on
us
sp.
0.2
5
No
rth
ern
Pik
e1
.11
1
.08
1
.08
0
.29
0.2
5
0.5
4
0.5
4
1.1
7
0
.83
1.3
8
1.2
5
1.0
0
1
.50
0
.44
0.3
3
0.2
8
0
.83
0.7
8
0.5
3
0
.28
0.2
8
0
.28
0.5
3
Mu
skel
lun
ge
0.0
4
0.0
3
Su
cker
s0
.05
Qu
illb
ack
0.0
4
0.0
8
0.0
4
0.0
3
0
.03
Wh
ite
Su
cker
0.1
1
0.2
1
0.4
6
0.2
9
2
.17
0
.63
0
.04
4
.17
3.8
3
2
.29
1
.13
1
.17
2.5
8
0.4
4
0
.92
0
.64
0.4
4
0
.42
0
.72
0.8
6
0
.72
0.2
5
0
.61
Big
mo
uth
Bu
ffal
o0
.05
0
.04
0
.04
Sil
ver
Red
ho
rse
0.0
4
0.0
4
0
.64
0.5
0
1.4
4
0
.44
0.1
7
0.4
7
0
.83
0.4
7
0
.11
0.1
9
Sh
ort
hea
d R
edh
ors
e0
.11
0
.04
0
.25
0
.04
0.1
9
0
.33
0
.36
0.0
6
0
.19
0
.08
0.3
1
0
.17
0.1
1
0
.03
Gre
ater
Red
ho
rse
0.0
8
0.0
4
0.0
8
0.0
6
0
.44
0
.28
0.8
3
0
.11
0.1
4
0
.31
Riv
er R
edh
ors
e0
.11
0.4
4
0.0
3
0
.14
0
.08
0.1
4
0
.03
0.4
7
Bla
ck B
uff
alo
0.0
4
Min
no
w0
.04
Go
ldfi
sh0
.32
0
.92
2
.71
0
.88
0.5
8
1.0
8
3.4
6
0.0
4
0
.04
0
.25
Co
mm
on
Car
p4
.47
3
.92
2
.20
1
.21
2.2
5
2.3
8
4.3
3
1.5
8
2
.50
4.7
5
3.6
7
2.0
0
4
.79
0
.19
0.2
2
0.1
9
0
.33
0.2
2
0.4
7
0
.25
0.2
5
0
.11
0.1
7
Go
lden
Sh
iner
0.2
2
0.0
6
0
.14
0
.03
0.0
6
0
.11
Fal
lfis
h0
.03
Ru
dd
0.0
4
0
.38
3
.96
Bla
ck B
ull
hea
d0
.05
Bro
wn
Bu
llh
ead
38
0.7
9
18
9.3
3
48
2.6
7
76
.25
2
51
.71
7
53
.79
3
39
.54
3
2.6
3
14
.79
8
.42
1
98
.00
7
1.6
5
16
0.3
8
7.2
5
6
.42
2
.56
10
.56
1
3.6
9
7
.11
15
.28
6
.08
5.7
5
3
.94
Ch
ann
el C
atfi
sh3
4.8
4
1
5.9
2
8
.00
1
4.1
7
49
.58
11
.25
12
.96
0.0
4
0
.17
0
.08
0
.04
0.1
3
0.7
2
0
.81
0
.28
0.5
3
0
.58
0
.31
0.0
6
0
.53
0.1
9
1
.03
Am
eric
an E
el0
.08
0
.13
0
.04
0
.09
0.0
4
0.1
1
0.0
3
0
.44
0.2
8
0
.03
0.0
8
Wh
ite
Per
ch4
8.4
2
3
4.8
8
8
4.3
8
6
9.9
2
16
9.2
9
13
2.0
4
11
0.8
8
0.0
4
0
.25
0
.92
0
.04
0.0
4
4.6
1
4
.31
3
.86
1.6
9
3
.75
3
.58
19
.42
0
.19
0.3
1
2
.58
Wh
ite
Bas
s2
.00
1
.75
1
.46
0
.29
0.7
5
0.5
8
0.5
0
0.3
3
0
.04
0
.04
0
.22
0.0
3
0
.14
0
.17
0
.08
0.0
8
0
.28
Ro
ck B
ass
0.5
8
1.0
8
1.4
8
1.1
7
2
.00
1
.04
3
.33
0
.33
1.1
3
2
.58
4
.75
1
.78
8.7
1
4.8
3
3
.97
3
.89
2.4
4
4
.50
1
.08
7.9
7
4
.92
2.5
0
2
.25
Gre
en S
un
fish
0.0
5
Pu
mp
kin
seed
0.6
8
1.1
3
3.3
3
2.0
4
1
.00
0
.67
7
.29
16
.29
7
.67
1
2.7
5
2
.48
15
.92
18
.61
1
8.1
4
2
3.4
2
29
.08
3
7.5
3
2
8.1
1
14
.72
1
5.2
5
50
.33
2
5.0
6
Blu
egil
l4
.05
3
.21
9
.08
1
4.4
2
14
.96
3.4
2
17
.33
0.5
4
3
.96
1.1
3
2.0
4
0.8
7
1
.46
6
3.9
2
15
9.1
1
71
.75
6
1.5
0
13
6.0
3
74
.92
5
3.5
6
75
.81
6
2.8
9
57
.53
Sm
allm
ou
th B
ass
0.1
1
0.1
3
0.0
8
0.0
4
0
.04
0.0
8
0.0
8
0.0
9
0
.17
0
.11
0.9
2
0.5
6
0
.44
0.4
7
0.1
4
0
.47
0.0
3
0
.06
0.1
7
Lar
gem
ou
th B
ass
0.2
6
0.1
7
0.3
3
0.2
5
0
.13
0
.08
0
.17
1
.08
1.2
5
1
.38
5
.00
0
.61
0.5
4
4.5
3
5
.39
4
.33
4.2
5
1
0.3
9
2
.72
4.3
3
3
.58
3.3
3
2
.42
Bla
ck C
rap
pie
2.3
2
0.1
7
0.4
2
0.5
8
0
.08
0
.58
0
.83
0.4
2
0
.13
1
.13
0
.70
0.1
7
12
.92
1
7.3
3
1
0.0
3
7.5
3
8
.64
4
.78
11
.36
5
.36
4.2
2
3
.44
Yel
low
Per
ch0
.11
0
.63
4
.16
0
.25
1.0
8
0.7
1
0.5
8
1.0
8
5
.96
2.6
3
20
.63
2.1
7
3
.83
4
.72
7.0
0
2.6
4
6
.11
6.2
5
1.3
1
2
.69
4.9
4
3
.75
3.8
6
Wal
leye
1.0
5
0.1
7
0.0
4
2.4
6
2.0
4
4.6
3
0.3
8
0
.08
0.0
9
0
.33
1
.61
2.5
0
1.7
5
2
.53
2.3
6
1.4
4
7
.56
1.3
3
0
.94
1.6
1
Ro
un
d G
ob
y0
.05
Fre
shw
ater
Dru
m1
.37
1
.71
1
.24
0
.33
1.0
8
1.8
8
1.3
3
1.0
8
1
.29
0.8
3
0.6
3
0.8
3
0
.75
1
.25
1.1
7
1.8
9
1
.97
1.6
7
2.1
9
0
.94
0.9
4
0
.97
0.7
2
Car
assi
us
aura
tus
x
Cyp
rin
us
carp
io0
.25
No
tro
pis
hyb
rid
s0
.04
To
tal
catc
h4
88
25
9
6
09
18
7
50
3
9
28
50
9
6
0
57
35
2
63
10
5
20
7
1
31
2
33
13
1
13
4
23
0
1
33
1
44
1
24
1
40
1
10
Nu
mb
er o
f n
et l
ifts
19
2
4
24
24
24
2
4
24
2
4
24
24
2
4
24
24
3
6
3
6
36
36
36
3
6
3
6
3
6
3
6
3
6
Nu
mb
er o
f sp
ecie
s2
8
25
2
2
21
25
2
3
23
2
4
16
20
2
0
24
24
2
2
2
4
23
21
25
2
5
2
4
2
3
2
5
2
6
Ham
ilto
n H
arb
ou
rT
oro
nto
Har
bo
ur
Up
per
Bay
of
Qu
inte

Section 1. Index Fishing Projects
56
FIG. 1.4.2. Abundance trends for selected species caught in nearshore trap nets in Hamilton Harbour, Toronto Harbour and the upper Bay of Quinte. Values shown are annual arithmetic means.
0.0
0.5
1.0
1.5
2.0
2006 2008 2010 2012 2014 2015 2016 2006 2007 2010 2012 2014 2016 2007 2008 2009 2010 2011 2012 2013 2014 2015 2016
Hamilton Harbour Toronto Harbour Upper Bay of Quinte
Ca
tch
pe
r tr
ap
ne
t Northern pike
0
200
400
600
800
2006 2008 2010 2012 2014 2015 2016 2006 2007 2010 2012 2014 2016 2007 2008 2009 2010 2011 2012 2013 2014 2015 2016
Hamilton Harbour Toronto Harbour Upper Bay of Quinte
Ca
tch
pe
r tr
ap
ne
t Brown bullhead
0
10
20
30
40
50
60
2006 2008 2010 2012 2014 2015 2016 2006 2007 2010 2012 2014 2016 2007 2008 2009 2010 2011 2012 2013 2014 2015 2016
Hamilton Harbour Toronto Harbour Upper Bay of Quinte
Ca
tch
pe
r tr
ap
ne
t Channel catfish
0.0
0.1
0.2
0.3
0.4
0.5
2006 2008 2010 2012 2014 2015 2016 2006 2007 2010 2012 2014 2016 2007 2008 2009 2010 2011 2012 2013 2014 2015 2016
Hamilton Harbour Toronto Harbour Upper Bay of Quinte
Ca
tch
pe
r tr
ap
ne
t American eel
0
50
100
150
200
2006 2008 2010 2012 2014 2015 2016 2006 2007 2010 2012 2014 2016 2007 2008 2009 2010 2011 2012 2013 2014 2015 2016
Hamilton Harbour Toronto Harbour Upper Bay of Quinte
Ca
tch
pe
r tr
ap
ne
t White perch
0
10
20
30
40
50
60
2006 2008 2010 2012 2014 2015 2016 2006 2007 2010 2012 2014 2016 2007 2008 2009 2010 2011 2012 2013 2014 2015 2016
Hamilton Harbour Toronto Harbour Upper Bay of Quinte
Ca
tch
pe
r tr
ap
ne
t Pumpkinseed

Section 1. Index Fishing Projects
57
FIG. 1.4.2. (continued) Abundance trends for selected species caught in nearshore trap nets in Hamilton Harbour, Toronto Harbour and the upper Bay of Quinte. Values shown are annual arithmetic means.
0
50
100
150
200
2006 2008 2010 2012 2014 2015 2016 2006 2007 2010 2012 2014 2016 2007 2008 2009 2010 2011 2012 2013 2014 2015 2016
Hamilton Harbour Toronto Harbour Upper Bay of Quinte
Catc
h p
er
trap
net Bluegill
0.0
0.2
0.4
0.6
0.8
1.0
2006 2008 2010 2012 2014 2015 2016 2006 2007 2010 2012 2014 2016 2007 2008 2009 2010 2011 2012 2013 2014 2015 2016
Hamilton Harbour Toronto Harbour Upper Bay of Quinte
Catc
h p
er
trap
net Smallmouth bass
0
2
4
6
8
10
12
2006 2008 2010 2012 2014 2015 2016 2006 2007 2010 2012 2014 2016 2007 2008 2009 2010 2011 2012 2013 2014 2015 2016
Hamilton Harbour Toronto Harbour Upper Bay of Quinte
Catc
h p
er
trap
net Largemouth bass
0
5
10
15
20
2006 2008 2010 2012 2014 2015 2016 2006 2007 2010 2012 2014 2016 2007 2008 2009 2010 2011 2012 2013 2014 2015 2016
Hamilton Harbour Toronto Harbour Upper Bay of Quinte
Catc
h p
er
trap
net Black crappie
0
5
10
15
20
25
2006 2008 2010 2012 2014 2015 2016 2006 2007 2010 2012 2014 2016 2007 2008 2009 2010 2011 2012 2013 2014 2015 2016
Hamilton Harbour Toronto Harbour Upper Bay of Quinte
Catc
h p
er
trap
net Yellow perch
0
2
4
6
8
2006 2008 2010 2012 2014 2015 2016 2006 2007 2010 2012 2014 2016 2007 2008 2009 2010 2011 2012 2013 2014 2015 2016
Hamilton Harbour Toronto Harbour Upper Bay of Quinte
Catc
h p
er
trap
net Walleye

Section 1. Index Fishing Projects
58
was the strong showing of age-4 Walleye from
the 2012 Walleye stocking event (see Section 8.7)
and the absence of Walleye from stocking events
in the following years.
Toronto Harbour (partnership project with
Fisheries and Oceans Canada)
Twenty-four trap net sites were sampled on
Toronto Harbour from Sep 6-15 with water
temperatures ranging from 15.7-23.8oC (Table
1.4.2). Nearly 5,000 fish comprising 24 species
were captured (Table 1.4.3). The most abundant
species by number were Brown Bullhead (3,849),
Pumpkinseed (382), Rock Bass (209) and
Common Carp (115). One American Eel was
captured; total length of the eel was 740 mm and
weight was 936 g.
Upper Bay of Quinte
Thirty-six trap net sites were sampled on
the upper Bay of Quinte from Sep 6-23 with water
temperatures ranging from 20.3-24.1oC (Table
1.4.2). Nearly 4,000 fish comprising 26 species
were captured (Table 1.4.3). The most abundant
species by number were Bluegill (2,071),
Pumpkinseed (902), Brown Bullhead (142),
Yellow Perch (139), Black Crappie (124) and
White Perch (93). Three American Eel were
caught. The eel were 666, 768 and 915 mm total
length and weighed 637, 1,242 and 1,807 g in
weight, respectively.
FIG. 1.4.3. Proportion of total fish community biomass represented by piscivore species (PPB) in the nearshore trap net surveys in five sheltered Lake Ontario embayments (2006-2016). A PPB>0.2 is indicative of a balanced trophic structure (depicted by a dashed line). Piscivore
species included Longnose Gar, Bowfin, Northern Pike, Smallmouth Bass, Largemouth Bass, and Walleye. Error bars are +-2SE.
Northern Pike abundance declined from
2001-2009, increased significantly in 2010,
declined from 2010-2013, remained steady until
2015, then increased in 2016. Brown Bullhead
and Channel Catfish remained at low abundance.
American Eel abundance increased in 2016
compared to 2015 but remained below the high
abundance levels of 2013 and 2014. White Perch
abundance was unusually high in 2013 but very
few were caught in 2014 (7) and 2015 (11). In
2016, 93 were caught. Pumpkinseed abundance
increased in 2015 and deceased in 2016. Bluegill
abundance was similar to recent years.
Smallmouth Bass abundance increased in 2016.
Largemouth Bass decreased slightly in 2016.
Black Crappie abundance declined in 2014, 2015
and again in 2016 compared to 2013. Yellow
Perch abundance remained steady. Walleye
abundance, having been unusually high in 2013,
declined in 2014 and 2015, and increased in 2016
(Table 1.4.6 and Fig. 1.4.2).
Ecosystem Health Indices
Indices have been developed based on the
NSCIN trap netting to evaluate ecosystem health
in Lake Ontario nearshore areas. The degree of
exposure of the nearshore area sampled to Lake
Ontario (e.g., highly sheltered embayments vs.
those broadly exposed to the open waters of Lake
Ontario) influences the ecosystem health indices.
Therefore, indices are presented separately for
sheltered and exposed embayments (Figs. 1.4.3 to
1.4.6).
0.0
0.1
0.2
0.3
0.4
0.5
0.6
HamiltonHarbour
Weller's Bay West Lake East Lake Bay of Quinte(upper)
Bay of Quinte(middle)
PP
B
Sheltered Embayments
Target PPB > 0.2

Section 1. Index Fishing Projects
59
FIG. 1.4.5. Index of biotic integrity (IBI), as a measure of ecosystem health, in the nearshore trap net surveys in five sheltered Lake Ontario embayments (2006-2016). IBI classes can be described as follows: 0-20 very poor, 20-40 poor, 40-60 fair, 60-80 good, and 80-100 excellent
ecosystem health. Error bars are +-2SE.
0.0
0.1
0.2
0.3
0.4
0.5
0.6
TorontoHarbour
Presqu'ile Bay Prince EdwardBay
PP
BExposed Embayments
Target PPB >0.2
0
20
40
60
80
100
HamiltonHarbour
Weller's Bay West Lake East Lake Bay of Quinte(upper)
Bay of Quinte(middle)
IBI
Sheltered Embayments
Good
Fair
Poor
Excellent
Very Poor
Piscivore Biomass
A proportion of the fish community
biomass comprised of piscivores (PPB) greater
than 0.20 reflects a healthy trophic structure. The
PPBs in 2016 were 0.13, 0.18 and 0.28 in
Hamilton Harbour, Toronto Harbour, and the
upper Bay of Quinte, respectively. The PPB at
Hamilton Harbour remained significantly below
both 0.2 and that of other sheltered Lake Ontario
FIG. 1.4.4. Proportion of total fish community biomass represented
by piscivore species (PPB) in the nearshore trap net surveys in three
exposed Lake Ontario embayments (2006-2016). A PPB>0.2 is
indicative of a balanced trophic structure (depicted by a dashed line). Piscivore species included Longnose Gar, Bowfin, Northern Pike,
Smallmouth Bass, Largemouth Bass, and Walleye. Error bars are +-
2SE.
embayments (Fig. 1.4.3). The PPB at Toronto
Harbour was just below the target value and that
of other exposed Lake Ontario embayments (Fig.
1.4.4). PPB at the upper Bay of Quinte was well
above the target value.
Index of Biotic Integrity
The index of biotic integrity (IBI) is a
measure of ecosystem health. IBI classes can be
described as follows: 0-20 very poor, 20-40 poor,
40-60 fair, 60-80 good, and 80-100 excellent
ecosystem health. The IBIs were 47 (fair), 46
(fair) and 71 (good) in Hamilton Harbour,
Toronto Harbour and the upper Bay of Quinte,
respectively. The IBI at Hamilton Harbour
remained significantly below those of other
sheltered Lake Ontario embayments, while the
IBI at the upper Bay of Quinte was similar to
values at other Lake Ontario sheltered nearshore
areas (Fig. 1.4.5). Toronto Harbour IBI was
lower than other exposed embayments, (Fig
1.4.6).
Trap Net and Electrofishing Comparison
Electrofishing sampling was conducted in
conjunction with trap net sampling at selected
upper Bay of Quinte locations (20 of 36 sites).
The standard Fisheries and Oceans 100 m transect

Section 1. Index Fishing Projects
60
0
20
40
60
80
100
TorontoHarbour
Presqu'ile Bay Prince EdwardBay
IBI
Exposed Embayments
Good
Fair
Poor
Excellent
Very Poor
FIG. 1.4.6. Index of biotic integrity (IBI), as a measure of
ecosystem health, in the nearshore trap net surveys in three exposed
Lake Ontario embayments (2006-2016). IBI classes can be
described as follows: 0-20 very poor, 20-40 poor, 40-60 fair, 60-80 good, and 80-100 excellent ecosystem health. Error bars are +-2SE.
sampling electrofishing protocol was used. Catch
comparison by the two gear types is shown in
Table 1.4.7. A total of 32 species were caught; 26
by electrofishing and 25 by trap net sampling.
Seven unique species were captured by
electrofishing and six unique species by trap nets.
A total of 784 fish were caught by electrofishing
and 2,043 fish were caught by the trap nets.
The most common species caught by
electrofishing were Yellow Perch, Brook
Silverside, Gizzard shad, Bluegill and
Largemouth Bass, and for the trap nets were
Bluegill, Pumpkinseed, Yellow Perch, Black
Crappie and Largemouth Bass. Electrofishing
sampling caught more small fish species such as
cyprinids. Trap nets caught more centrarchids.
Between gear differences in species composition
were also reflected in the size distribution of fish
caught in the two gear types; electrofishing gear
tended to catch smaller-sized fish and trap net
gear tended to catch more medium-sized fish (Fig.
1.3.7).
FIG. 1.4.7. Species-specific catch-per-unit-effort for boat
electrofishing and trap netting gear types in the upper Bay of Quinte
in 2016 for the 20 sites that were sampled by both gear types. A total
of 32 species was caught by the two gear types.
Species E-Fish Trap Net
Longnose Gar 0.15 0.70
Bowfin 0.05 0.90
Alewife 1.00 -
Gizzard Shad 4.15 2.25
Northern Pike 0.15 0.40
White Sucker 0.20 0.25
Shorthead Redhorse - 0.05
Greater Redhorse - 0.20
River Redhorse - 0.55
Common Carp 0.30 0.15
Golden Shiner 0.15 0.20
Common Shiner 0.10 -
Spottail Shiner 0.65 -
Bluntnose Minnow 0.25 -
Fallfish - 0.05
Brown Bullhead 0.45 2.40
Channel Catfish - 1.60
American Eel 0.20 0.10
White Perch 0.40 2.25
White Bass 0.05 0.30
Rock Bass 0.75 3.15
Pumpkinseed 1.00 14.85
Bluegill 2.90 56.50
Smallmouth Bass 0.05 0.15
Largemouth Bass 2.00 3.40
Black Crappie - 4.50
Lepomis sp. 0.65 -
Yellow Perch 13.75 5.10
Walleye 1.05 1.40
Logperch 0.80 -
Brook Silverside 7.95 -
Freshwater Drum 0.05 0.75
Number species 26 25
Unique species 7 6
Common species 19 19
Total fish caught 784 2,043
Gear type

Section 1. Index Fishing Projects
FIG. 1.4.7. Size distribution of the fish caught during boat electrofishing and trap netting gear types in the upper Bay of Quinte in 2016 for the 20 sites that were sampled by both gear types.
0.0
0.1
10 50 90 130 170 210 250 290 330 370 410 450 490 530 570 610 650 690 730 770 810 850 890 930 970
Pro
po
rtio
n o
f c
atc
h
Fork length (mm)
Trap Netting
Electrofishing
61

Section 1. Index Fishing Projects
62
Hydroacoustic assessments of Lake Ontario
prey fish have been conducted since 1991 with a
standardized mid-summer hydroacoustic survey
implemented in 1997. The survey is conducted
jointly by the Ontario Ministry of Natural
Resources and Forestry (OMNRF), the New York
State Department of Environmental Conservation
(NYSDEC) and the US Geological Survey
(USGS). Results from the hydroacoustic survey
complement information obtained in spring
bottom trawl surveys; provides whole-lake indices
of abundance; and describes midsummer
distribution of pelagic prey fish species.
The index survey consists of five, north-
south, shore-to-shore transects in the main lake,
and one transect in the Kingston Basin (Fig.
1.5.1). Hydroacoustic data were collected
beginning at approximately one hour after sunset
from 10m of depth on one shore and running to
10m of depth on the opposite shore at or until
approximately one hour before sunrise. Since
2005, transects have been randomly selected
annually from within 15 km corridors. The
corridor approach was adopted to include a
random component to the survey while
accommodating logistical constraints such as
suitable ports. A dogleg at the southern portions
of transects 3, 4 and 5 is used to increase the
length of the transect that occurs in less than 100
m of water along the southern shore which has a
much steeper slope than the northern shore.
Temperature profiles were conducted at multiple
intervals along each transect.
Since 1997, annual hydroacoustic survey
index values have been calculated with slightly
different methods (e.g., varying target strength
thresholds, and species partitioning methods) and
different analytical software, which has also
evolved enabling more sophisticated approaches
(e.g., noise filtering). In the 2015 report,
historical data were re-analyzed using a
standardized approach to target strength
thresholds for Alewife and Rainbow Smelt, noise
filtering and species partitioning. Acoustic data
can distinguish between position and sizes of
targets but not species. Historical midwater
trawling data (2000 to 2004) showed a thermal
separation between the two primary species of
interest, Alewife and Rainbow Smelt. Midwater
tows in depths where water temperatures were
9°C or warmer were dominated by catches of
Alewife (95% total catch weight of prey fish
species) whereas tows in depths at temperatures
below 9°C captured mostly Rainbow Smelt
(84%).
In addition to the standard index transects
additional sampling effort has also been regularly
conducted throughout the survey. Recently there
was a focus on upward looking acoustics to
quantify the relative proportion of the Alewife
that occurred in the near surface portion of the
water column unable to be measured by
traditional down-looking acoustics. In 2016, two
additional projects were conducted to broaden the
scope of the summer acoustic survey. Generally,
the cross-lake transects sample lake depths in
proportion to their overall area in the lake,
however shallower depths, less than 30 m have
FIG. 1.5.1. The Lake Ontario Lake-wide prey fish survey uses cross-lake hydroacoustic transects. Transect corridors are logistically
constrained but utilize a random starting point within the corridor for
each annual survey.
1.5 Lake-wide Hydroacoustic Assessment of Prey Fish J. P. Holden, Lake Ontario Management Unit
M. J. Connerton, New York State Department of Environmental Conservation, Cape Vincent
Fisheries Station
B. C. Weidel, Unites States Geological Service, Oswego
T1T2
T3
T4
T5

Section 1. Index Fishing Projects
63
been underrepresented (Fig. 1.5.2). Additional
transects were added to increase the shallow
depths as well as look at the variability in the area
where the thermocline intersects bottom where
fish density has historically been highly variable.
Sampling at depths from 0-20 meters was still
underrepresented relative to lake area and will
require more targeted sampling in the future.
Midwater trawling was also conducted in eastern
portions of Lake Ontario by NYSDEC and USGS
in 2016 in an effort to expand assessment of
native Coregonid species (Cisco and Bloater). All
transect paths are plotted in Fig. 1.5.3. Midwater
trawls conducted in 2016 show some mixing of
Alewife and Rainbow Smelt, which may be a
result of net contamination from warmer
temperatures or variable fishing depths
throughout the tow duration; the historical
assumption of thermal separation (Fig. 1.5.4) of
Alewife and Rainbow Smelt is still supported
with these catches. Biological samples from
midwater trawls suggest that the previous upper
target strength level is generally too high based on
the size distribution within the catch and has the
potential to incorrectly categorize large species,
like Cisco, that were abundant at several
transects, as either Alewife or Rainbow Smelt.
Based on an analysis of the length frequency
distribution based on trawl catches of Cisco (Fig.
1.5.5) and the published relationship between fish
size and target strength, the maximum target
strength defining Alewife and Rainbow Smelt
was lowered to -39 dB and historical index values
recalculated (Table 1.5.1). Catches of Cisco in
2016 appear to be limited geographically to
eastern portions of the lake and by depth (less
FIG. 1.5.2. Distribution of survey depths (based on 500 m intervals) in the traditional survey transects and including the additional
nearshore transect relative to lake area by depth.
0.00
0.05
0.10
0.15
0 50 100 150 200 250
Bottom Depth (m)
Pro
po
rtio
n
Lake Area Survey Survey + Additional
FIG. 1.5.3. Spatial coverage of acoustic data collected in 2016. Transects are categorized based the analysis to which each
contributed. FIG. 1.5.5. Length frequency of Cisco caught in midwater tows.
FIG. 1.5.4. Proportion of Alewife and Rainbow Smelt weight contributing to the total catch weight within each midwater trawl.
0.00
0.25
0.50
0.75
1.00
0.00 0.25 0.50 0.75 1.00
Proportion Alewife in Catch
Pro
po
rtio
n S
me
lt in
Ca
tch
0
20
40
60
200 300 400
Length (mm)
Co
un
t

Section 1. Index Fishing Projects
than 100 m); therefore the index for Cisco in 2016
is reported as fish per hectare based on acoustic
analysis of the transects where Cisco were
captured rather than as a whole lake index until
additional future sampling and analyses
establishes their geographic extent throughout the
lake
Comparisons of Alewife biomass estimates
between acoustics and spring bottom trawls show
that surveys are correlated but that acoustic
estimates of Alewife are lower. Vertical gillnets
and towed up-looking acoustics show that a large
proportion (on average 50%) of Alewife occupy
the near-surface portion of the water column (<4
m depth) and are not detectable with the down-
looking transducer used in the survey. While a
significant proportion of the Alewife biomass is
detected in this portion of the water column, the
conversion still does not reconcile the difference
between bottom trawl and acoustics population
estimates. The values for Alewife reported here
do not include a conversion factor to account for
this unmeasured biomass and thus should be
treated as an index of abundance between years
and not as a whole lake population estimate.
Alewife abundance in 2016 increased
relative to 2015 estimates (Fig. 1.5.6). The
increase in population is likely explained by
increases in the age-1 population of Alewife.
Differences between target strength distribution
over the most recent years, where recruitment to
age 1 in 2014 and 2015 was low, supports this
assumption (Fig. 1.5.7, see also Section 7.6).
Alewife were spatially distributed throughout the
lake (Fig. 1.5.8) but showed a bimodal
distribution with bottom depth (Fig. 1.5.9).
Distribution of Alewife during the survey
however, varies from year to year and no
Parameter Specification
Sounder BioSonics DT-X
Transducer Frequency 120 kHZ split beam
Ping Rate 1 ping per second
Pulse Width 0.4 milliseconds
Analytical Software Echoview (version 7.1)
Alewife target threshold range -50 to -39dB, water temp. > 9°C
Rainbow Smelt target threshold range -52 to -39dB, water temp. =< 9°C
Cisco target threshold range -39 to -30dB, all water temps.
TABLE 1.5.1. Acoustic parameter settings and target strength thresholds used for the 2016 survey.
FIG. 1.5.6. Abundance index (in millions of fish) of yearling-and-older Alewife from 1997-2016. Summer acoustic estimates were not
conducted in 1999 and 2010.
0
500
1000
1500
2000
2000 2005 2010 2015
Year
Po
pu
lati
on
In
de
x
2014 2015 2016
0e+00
1e+08
2e+08
3e+08
-60 -50 -40 -30 -60 -50 -40 -30 -60 -50 -40 -30
TS
Ta
rge
tCo
un
t
FIG. 1.5.7. Lake-wide estimates of Alewife partitioned by target
strength in 1 dB bins for surveys conducted from 2014 to 2016.
consistent spatial trend has been found. Research
to explain their distribution is ongoing. The
additional shallow transects resulted in a
marginally higher population estimate (663
million, 95% confidence interval 601 – 729
million), but this was not statistically different
than the standard population estimate (578
64

Section 1. Index Fishing Projects
65
FIG. 1.5.8. Relative distribution of Alewife determined by acoustics (fish/ha) observed during the hydroacoustic survey in July 2016.
Points are scaled to reflect observed density (fish/ha).
million, 95% confidence interval 501 – 664
million). The size distribution (inferred by target
strength distribution) does not indicate differences
in size structure (Fig. 1.5.10).
Rainbow Smelt abundance in 2016
decreased relative to 2015 estimates (Fig. 1.5.11).
The highest densities of Rainbow Smelt were
distributed along the southern shore (Fig.1.5.12).
The highest concentrations of Rainbow Smelt
were found over bottom depths shallower than 75
m (Fig. 1.5.13). Midwater trawl catches support
this limited distribution (Fig. 1.5.14).
Cisco were infrequently caught during
previous midwater trawling efforts (2000-2004).
Further analysis is required to determine whether
low catches during that time period are a function
of spatial coverage of those surveys or low
abundance and is not the primary focus of this
report. Catches of Cisco were geographically
0
2000
4000
6000
0 50 100 150 200
Bottom Depth
De
ns
ity
In
de
x
FIG. 1.5.9. Relative distribution of Alewife (fish/ha) in proportion to Lake bottom depth of the 500 m portion of the transect.
FIG. 1.5.10. Relative frequency distribution of the size of Alewife, inferred by target strength, between the regular survey cross lake
transects and the targeted nearshore transects.
0.000
0.025
0.050
0.075
-60 -50 -40 -30
Target Strength (dB)
Pe
rce
nta
ge
Fre
qu
en
cy
Shallow Transects
FIG. 1.5.11. Abundance (in millions of fish) of yearling-and-older Rainbow Smelt from 1997-2016. Summer acoustic estimates were
not conducted in 1999 and 2010
0
250
500
750
1000
1250
2000 2005 2010 2015
Year
Po
pu
lati
on
In
de
x
FIG. 1.5.12. Relative distribution of Rainbow Smelt (fish/ha) observed during the hydroacoustic survey in July 2016. Points are
scaled to reflect observed density (fish/ha).

Section 1. Index Fishing Projects
66
FIG. 1.5.13. Relative distribution of Rainbow Smelt determined by acoustics (fish/ha) in proportion to lake bottom depth of the 500 m
portion of the transect.
confined to the transects along the eastern shore
of Lake Ontario (Fig 1.5.15). Both acoustic
estimates and midwater trawls suggest peak
abundance within a fairly narrow depth range (25
and 50 m; Fig. 1.5.16 and 1.5.17). These depths
are representative of water temperatures in the 10-
15°C range, which is consistent with temperatures
where Cisco are commonly caught in Community
Index Gill Netting (Fig. 1.5.18, see also Section
1.2 for methods and sites). Mean catch per trawl
is more variable between transects (Fig. 1.5.19)
than what the acoustic densities suggest (Fig.
1.5.20). Acoustic estimates however have the
benefit of greater spatial range and the ability to
sample the entire water column simultaneously.
Despite those differences, overall density
estimates between methods provide similar
results. Midwater trawl catches estimate a density
0
1000
2000
3000
0 50 100 150 200
Bottom Depth
De
ns
ity
In
de
x
FIG. 1.5.14. Relative catch of Rainbow Smelt (fish/10 min tow) relative to lake bottom depth where midwater tow occurred.
FIG. 1.5.15. Paired acoustic data collection and midwater trawls were conducted in the eastern portion of Lake Ontario. Filled points
indicate tows were Cisco were caught.
FIG. 1.5.16. Relative distribution of Cisco within the water column determined by acoustics (fish/ha). Data have been exported from
acoustic software in 5 m depth bins and then horizontally jittered for
plotting.
FIG. 1.5.17. Relative catch of Cisco (fish/10 min tow) relative to lake bottom depth where midwater tow occurred.
0
250
500
750
1000
25 50 75 100
Depth in Water Column
De
ns
ity
(fi
sh
/ha
)
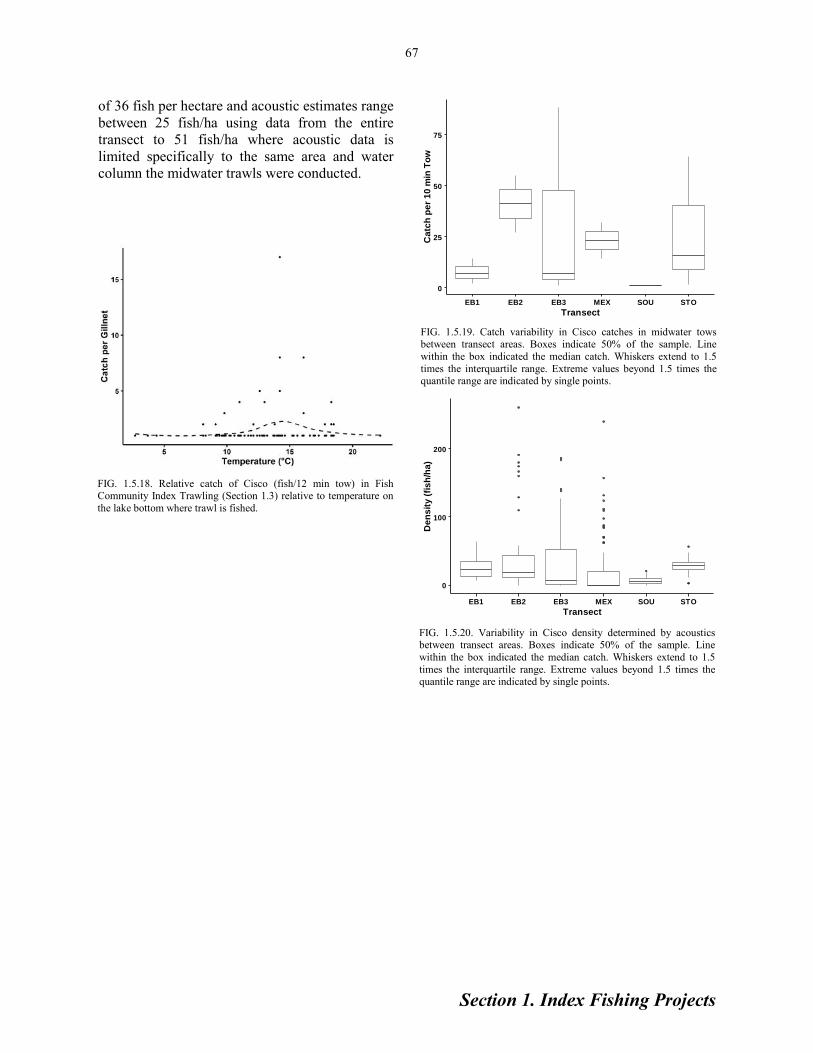
Section 1. Index Fishing Projects
67
of 36 fish per hectare and acoustic estimates range
between 25 fish/ha using data from the entire
transect to 51 fish/ha where acoustic data is
limited specifically to the same area and water
column the midwater trawls were conducted.
FIG. 1.5.18. Relative catch of Cisco (fish/12 min tow) in Fish Community Index Trawling (Section 1.3) relative to temperature on
the lake bottom where trawl is fished.
FIG. 1.5.19. Catch variability in Cisco catches in midwater tows
between transect areas. Boxes indicate 50% of the sample. Line
within the box indicated the median catch. Whiskers extend to 1.5
times the interquartile range. Extreme values beyond 1.5 times the quantile range are indicated by single points.
FIG. 1.5.20. Variability in Cisco density determined by acoustics between transect areas. Boxes indicate 50% of the sample. Line
within the box indicated the median catch. Whiskers extend to 1.5
times the interquartile range. Extreme values beyond 1.5 times the quantile range are indicated by single points.
0
25
50
75
EB1 EB2 EB3 MEX SOU STO
Transect
Ca
tch
pe
r 1
0 m
in T
ow
0
100
200
EB1 EB2 EB3 MEX SOU STO
Transect
De
ns
ity
(fi
sh
/ha
)

Section 1. Index Fishing Projects
Every other year in early fall, the Lake
Ontario Management Unit conducts an index
gillnet survey in Lake St. Francis. The catches are
used to estimate fish abundance and measure
biological attributes. Structures and tissues are
collected for age determination, stomach content
analyses, contaminant analyses and pathological
examination. The survey is part of a larger effort
to monitor changes in the fish communities in
four distinct sections of the St. Lawrence River:
Thousand Islands, Middle Corridor, Lake St.
Lawrence and Lake St. Francis. This is
coordinated with New York Department of
Environmental Conservation (NYSDEC) to
provide comprehensive assessment of fisheries
resources in the upper St. Lawrence River.
68
In 2016, the survey was conducted during
the period of September 6th to 19th. Thirty-six
nets were deployed, using standard multi-panel
gillnets with monofilament meshes ranging from
1 ½ to 6 inches at half-inch increments. The nets
were fished for approximately 24 hours. In total,
544 fish were caught, which included 20 different
fish species (Table 1.6.1). The average number of
fish per set was 15.11, down 66% from 2014. The
number of fish per set continued to decline from
the record high in 2008 and is well below the
1984 – 2016 average for the survey (Fig. 1.6.1).
The diversity of species is the highest observed in
this survey. The dominant species in the catch
continued to be Yellow Perch (62% of the catch),
followed by Rock Bass (18%; Fig. 1.6.2). In
2016, a Lake Sturgeon was caught and released in
1.6 St. Lawrence River Fish Community Index Netting—Lake St. Francis
M.J. Yuille, Lake Ontario Management Unit
TABLE 1.6.1. Summary of catches per standard gillnet set in the Lake St. Francis Fish Community Index Netting Program, 1984 - 2016. All catches prior to 2002 were adjusted by a factor of 1.58 to be comparable to the new netting standard initiated in 2002. No survey was conducted
in 1996.
1984 1986 1988 1990 1992 1994 1998 2000 2002 2004 2006 2008 2010 2012 2014 2016
Lake Sturgeon -- -- -- -- -- -- -- 0.04 -- 0.03 -- 0.03 -- -- -- 0.03
Longnose Gar -- 0.23 0.09 -- 0.66 0.26 0.14 0.13 0.40 -- 0.06 -- -- 0.22 -- 0.28
Bowfin 0.04 -- -- -- -- -- -- -- -- -- -- -- -- -- -- --
Alewife 0.04 -- -- -- -- -- -- -- 0.03 0.06 0.22 -- -- -- -- --
Salvelinus sp. -- -- 0.04 -- -- -- -- -- -- -- -- -- -- -- -- --
Northern Pike 4.18 3.93 4.44 3.82 4.13 3.91 3.71 3.34 1.23 1.45 1.67 1.08 0.31 0.19 0.31 0.14
Muskellunge -- -- 0.04 -- -- -- -- -- -- 0.06 -- -- -- -- 0.03 --
White Sucker 1.71 2.17 1.01 1.71 1.41 1.67 1.99 1.63 0.74 1.06 0.97 1.94 1.56 1.17 1.25 0.56
Moxostoma sp. -- -- 0.04 0.18 0.04 0.09 0.18 0.09 -- -- 0.11 0.19 0.14 0.33 0.08 0.10
Common Carp 0.13 -- -- 0.09 -- -- -- -- 0.09 -- 0.25 0.03 -- -- -- --
Golden Shiner -- -- -- -- -- 0.04 -- -- 0.03 -- -- -- -- -- -- 0.06
Creek Chub -- -- -- 0.09 -- -- 0.09 -- -- -- -- -- -- -- -- --
Fallfish -- -- -- 0.40 -- -- -- -- -- -- -- -- -- -- -- 0.03
Brown Bullhead 1.14 1.27 0.62 1.36 0.70 0.44 0.95 3.25 0.54 1.38 2.81 1.97 0.56 0.25 0.14 0.03
Rock Bass 3.52 3.48 2.81 1.36 2.15 2.11 2.58 1.85 2.26 2.17 5.69 7.89 7.03 3.94 2.97 2.72
Pumpkinseed 4.97 1.72 0.84 0.75 1.49 1.76 1.54 1.06 0.41 0.41 0.89 1.50 0.06 0.33 0.17 0.17
Bluegill -- -- -- -- -- -- 0.05 0.04 0.10 -- -- -- 0.06 -- -- 0.03
Smallmouth Bass 0.88 0.63 0.26 0.26 0.62 0.62 1.40 0.44 1.02 0.59 1.17 1.67 0.44 0.47 0.67 0.28
Largemouth Bass 0.04 -- 0.09 0.09 -- 0.04 0.09 0.13 0.20 -- 0.61 0.31 0.33 1.53 -- 0.69
Black Crappie 0.04 0.09 0.04 0.04 0.09 0.13 -- 0.09 0.07 -- -- -- -- -- -- 0.08
Yellow Perch 21.45 16.32 20.88 16.57 15.83 13.72 11.89 9.36 6.49 7.45 16.36 31.03 30.83 20.64 16.67 9.36
Walleye 0.48 0.45 0.97 0.35 0.35 0.26 0.36 0.31 0.16 0.41 0.39 1.08 1.58 0.78 0.81 0.47
Freshwater Drum -- -- -- -- -- -- -- -- 0.04 -- -- -- -- -- -- 0.03
All Species 38.64 30.30 32.18 25.72 27.48 25.06 24.96 21.76 13.81 15.04 31.19 48.89 42.89 30.03 23.10 15.06
Count of Species 13 10 14 13 11 13 13 14 16 11 14 13 12 14 12 20

Section 1. Index Fishing Projects
69
the fish community index gill nets; the last Lake
Sturgeon caught in this program was in 2008
(Table 1.6.1).
Species Highlights
Catches of Yellow Perch continued to
decline from peak levels seen previously in 2008
and 2010 (Fig. 1.6.3). Current Yellow Perch catch
per net (9.36 fish per net) is below the 1984 –
2016 survey average (20.20 fish per net; Table
1.6.1). An increase in the catch of large fish (>
220 mm) observed in 2008 has been followed by
continued decline from 2010 to 2016 (Fig. 1.6.3).
The catch per net of large fish in 2016 (1.64 fish
per net) was comparable to 2014 (1.88 fish per
net; Fig. 1.6.3) and was one of the lowest
observed in the time series. Yellow Perch catch in
2016 contained fish from age-2 to age-9 with age-
4 fish representing 45% of the total catch (Fig.
1.6.4).
The centrarchids are represented by six
species in Lake St. Francis: Rock Bass,
Pumpkinseed, Bluegill, Smallmouth Bass,
Largemouth Bass and Black Crappie (Fig. 1.6.5
and 1.6.6). While Rock Bass remain the most
abundant of the centrarchids, catches in 2016
were 54% of the previous decade. Smallmouth
Bass catches declined in the 2016 catch and are
currently 64% below the previous 10 year average
(Fig. 1.6.5). Growth as determined by mean
length of age-1 Smallmouth Bass (164 mm in
2016) declined 9% below the long-term average
(180 mm, 1998 to 2016), however age-5 mean
fork length (401 mm) continues to remain above
the long-term average (373 mm; Fig. 1.6.6).
Pumpkinseed catches were unchanged from 2014
to 2016 (Fig. 1.6.5). Bluegill, Largemouth Bass
and Black Crappie were historically at much
lower levels than the former three species, and
FIG. 1.6.2. Species composition in the 2016 Lake St. Francis community index gill netting program.
FIG. 1.6.3. Catches of small (<=220 mm total length) and large (> 220 mm total length) Yellow Perch in the Lake St. Francis
community index netting program, 1984 – 2016. Survey was not
conducted in 1996.
FIG. 1.6.4. Age distribution (bars) and mean fork length at age (mm) of Yellow Perch caught in Lake St. Francis, 2016.
FIG. 1.6.1. Average catch per standard gillnet set of all species combined, Lake St. Francis, 1984 – 2016. Survey was not conducted
in 1996.
1985
1990
1995
2000
2005
2010
2015
0
20
40
60
80
Catc
h p
er
sta
nd
ard
gil
lnet
Northern pike
1%
Other
14%
Smallmouth bass
2%
Rock bass
18%
Walleye
3%
Yellow perch
62%
1984
1986
1988
1990
1992
1994
1996
1998
2000
2002
2004
2006
2008
2010
2012
2014
2016
Catc
h p
er
sta
nd
ard
gil
lnet
0
10
20
30
40
Large
Small
0 1 2 3 4 5 6 7 8 9
Nu
mb
er
of
Fis
h
Fo
rk L
en
gth
(m
m)
Age
0
10
20
30
40
50
60
70
0 1 2 3 4 5 6 7 8 9
100
150
200
250
300
350
400

Section 1. Index Fishing Projects
70
FIG. 1.6.6. Mean fork length (mm) of age-1 (square), age-3 (triangle) and age-5 (circle) Smallmouth Bass from 1998 to 2016.
Dashed lines represent the average fork length from 1998 to 2016 for
the aforementioned ages.
FIG. 1.6.7. Black crappie (circle), Bluegill (triangle) and Largemouth Bass (square) catches per standard gillnet set in Lake St.
Francis, 1984 – 2016.
FIG. 1.6.8. Catches of small (<= 500 mm total length) and large (> 500 mm total length) Northern Pike in the Lake St. Francis
community index gill netting program, 1984 – 2016. Survey was not
conducted in 1996.
remain so. While Largemouth Bass appear to
have peaked in 2012 catches, none were caught in
the following 2014 survey. In 2016, Largemouth
Bass CUE was above the previous 10 year
average (Fig. 1.6.7).
In 2016, catches of Northern Pike were the
lowest in the 1984 – 2016 time series (Fig. 1.6.8).
A total of five Northern Pike were caught in 2016,
ranging in from age-2 to age-9 (Fig. 1.6.9).
Catches of small fish (≤ 500 mm) continue to
remain low; in 2016 only a single small Northern
Pike was caught. Northern Pike abundances have
been in decline since the early 1990s and are
currently at the lowest levels observed in the 32
year time series. No Muskellunge were caught in
2016.
FIG. 1.6.5. Rock Bass (circle), Pumpkinseed (triangle) and Smallmouth Bass (square) catches per standard gillnet set in Lake St.
Francis, 1984 - 2016.
1985
1990
1995
2000
2005
2010
2015
0
2
4
6
8
10
12
Ca
tch
pe
r s
tan
da
rd g
illn
et
Rock bass
Pumpkinseed
Smallmouth bass
1985
1990
1995
2000
2005
2010
2015
0.0
0.5
1.0
1.5
2.0
2.5
3.0
Catc
h p
er
sta
nd
ard
gil
lnet
Black crappie
Bluegill
Largemouth bass
1984
1986
1988
1990
1992
1994
1996
1998
2000
2002
2004
2006
2008
2010
2012
2014
2016
Catc
h p
er
sta
nd
ard
gil
lnet
0
1
2
3
4
5
Large
Small
0 1 2 3 4 5 6 7 8 9
Age
Nu
mb
er
of
Fis
h
Fo
rk L
en
gth
(m
m)
0
1
2
3
0 1 2 3 4 5 6 7 8 9
200
400
600
800
1000
FIG. 1.6.9. Age distribution (bars) and mean fork length (circles) at age of Northern Pike caught in Lake St. Francis, 2016.

Section 1. Index Fishing Projects
71
The Credit River, below the Kraft Dam in
Streetsville, has been the long-term sampling site
for Chinook Salmon gamete collection. Chinook
Salmon are captured during the fall spawning run
at the beginning of October using electrofishing
gear. LOMU staff have utilized the spawn
collections to index growth, condition and
lamprey marking of Chinook Salmon.
Weight and otoliths are collected from fish
used in the spawn collection, which has the
potential to be biased toward larger fish. To
obtain a representative length sample of the
spawning run, 50 fish per day were randomly
selected, measured and checked for clips prior to
fish being sorted for spawn collection and detailed
sampling. Detailed sampling included collecting
data on length, weight, fin clips, coded-wire tag
(CWT), lamprey marks and a subsample also had
otoliths collected for age determination.
Samples for the 2016 Chinook Salmon
index were taken on October 4–6 and 11–14.
Detailed sampling occurred on 461 Chinook
Salmon, 48 fish were sampled for the
representative length sample and no Chinook
Salmon were observed with an adipose fin clip.
In 2016, the mean length of age-3 females
(867 mm) and males (875 mm) increased from
2015 and are 2% and 4% below the long term
average of 883 mm and 906 mm, respectively
(Fig. 1.7.1). Length of age-2 females (742 mm)
declined from 2015 and is now 6% below the long
term mean of 791 mm. Length of age-2 males
(726 mm) also declined from 2015 and is now
14% below the peak length observed in 2013 (841
mm) and 9% below the average length (796 mm)
for the time series (1989-2016).
The estimated weight (based on a log-log
regression) of a 900 mm (total length) Chinook
Salmon is used as an index of condition. In 2016,
female condition was comparable to 2015, while
the condition of males increased (Fig. 1.7.2).
Female condition in 2016 (7,832 g) is comparable
to the average condition from 2003 to 2016 (7,738
g). Male condition (7,964 g) increased and is
currently 8% above the average condition
between 2003 and 2016. It should be noted that
the absolute difference between maximum and
minimum condition for female (1995 and 2007)
and male (1995 and 2005) Chinook Salmon in
this time series is 1,433 g and 1,149 g
(respectively).
FIG. 1.7.1. Mean total length of age-2 and age-3 Chinook Salmon by sex, caught for spawn collection in the Credit River during the fall
spawning run (approximately first week of October), 1989-2016.
FIG. 1.7.2. Condition index as the mean weight of a 900 mm (total length) Chinook Salmon in the Credit River during the spawning run
(approximately first week of October), 1989-2016.
1.7 Credit River Chinook Salmon Spawning Index
M.J. Yuille and J.P. Holden, Lake Ontario Management Unit
1990 1995 2000 2005 2010 2015
700
800
900
1000
1100
Fo
rk L
en
gth
(m
m)
Age-2 Female
Age-2 Male
Age-3 Female
Age-3 Male
6.0
6.5
7.0
7.5
8.0
8.5
9.0
Weig
ht
(kg
)
1989
1991
1993
1995
1997
1999
2001
2003
2005
2007
2009
2011
2013
2015
Female
Male

Section 1. Index Fishing Projects
In 2016, Atlantic Salmon spring fingerlings
(average 2 g) were stocked in the Credit River and
its tributaries (Section 6) to restore self-sustaining
populations (Section 8.2). The purpose of this
survey was to evaluate growth and survival of
Atlantic Salmon parr stocked as spring fingerlings
and, in conjunction with smolt surveys (Section
1.9) evaluate the relative contribution of each
river reach to the smolt migration.
Atlantic Salmon parr were surveyed at six
reaches in the Credit River and Black Creek
(Table 1.8.1) during October 2016, after most of
the year’s growth was complete, and when fish
size (>98 mm) indicates potential smolting.
Atlantic Salmon were captured by electrofishing.
Largely, other species were released upon
capture, and were not generally recorded.
Biological information (length, weight) was
72
1.8 Juvenile Atlantic Salmon Parr Survey
M.D. Desjardins, Lake Ontario Management Unit
collected on all Atlantic Salmon captured and fish
were tagged with half-duplex passive integrated
transponder (PIT) tags at all sites. Two thousand
one hundred and sixty-seven (2,167) PIT tags
were implanted into the body cavity of Atlantic
Salmon parr (Table 1.8.2). Larger PIT tags (23
mm) were used on fish >108 mm. Smaller PIT
tags (12 mm) were used on fish <108 and >68
mm. A piece of caudal or adipose fin was clipped
from all Atlantic Salmon for genetic
determination of strain, and provided a secondary
mark. The smallest fish (<67 mm) were not PIT-
tagged but these fish could be recognized on
recapture by the fin clip used for a genetic
sample. Repeat sampling occurred at three
reaches to obtain population and density
estimates. Eighty-three (83) tagged/marked
Atlantic Salmon were recaptured generally at the
same location (Table 1.8.2) as originally tagged.
TABLE 1.8.1. TABLE 1.8.1. Location of stocked river reaches with geo-coordinates (downstream end) and dimensions of sampling sites in the Credit River, 2016. Reach numbers (1-4) indicate relative watershed position with 1 denoting the furthest upstream reach and subsequent
numbers increasing progressively downstream. Sites marked with an asterisk (*) were not stocked in 2016 but were sampled to examine fish
movement.
TABLE 1.8.2. Number of applied and recaptured PIT tags by location and Atlantic Salmon age-group in 2016. Recaptures do not include fish tagged in previous years
Sub-watershed Reach Latitude Longitude
Stream
length (m)
Stream
width (m)
Area
sampled
(m2)
Days
sampled
1 - Meadow (Forks Prov. Park) 43° 48.75' 80° 00.87' 432 8.7 3737 2
2 - Stuck truck (Forks Prov. Park) * 43° 48.61' 80° 00.29' 363 11.6 4200 1
3 - Brimstone (Forks Prov. Park) 43° 48.17' 79° 59.71' 564 12.6 7106 2
4 - Ellies (Forks o' Credit Rd.) * 43° 48.28' 79° 59.51' 314 15.7 4930 1
West Credit Belfountain C.A. 43° 47.82' 80° 00.41' 320 10.8 3443 2
BlackCreek 6th Line 43° 37.91' 79° 57.03' 349 7.3 2530 1
Upper Credit
Mainstem
Number of
PIT tags
Not
tagged Recaptured
Number of
PIT tags
Not
tagged Recaptured
Total
number
Meadow (Forks Prov. Park) 425 5 19 68 3 3 523
Stuck truck (Forks Prov. Park) 17 41 2 60
Brimstone (Forks Prov. Park) 664 11 13 106 5 5 804
Ellies (Forks o' Credit Rd.) 6 15 2 23
Belfountain C.A. 597 14 34 71 1 9 726
6th Line 144 15 13 172
Total 1,853 45 66 314 13 17 2,308
Reach
Age 0 Age 1 and older

Section 1. Index Fishing Projects
73
TABLE 1.8.3. Mean fork length and weight of sampled Atlantic Salmon by location and age group in 2016.
Twelve additional fish were recaptured from the
previous years (2015) tagging efforts.
The size (fork length and weight) of age-0
stocked spring fingerling Atlantic Salmon (Table
1.8.3) following approximately five months of
growth continues to be low relative to previous
years. Average size of Atlantic Salmon at 6th line,
Brimstone, and at the Belfountain CA were
amongst the smallest recorded since the beginning
of the monitoring program. The Meadow site
(Forks Provincial Park) was the only stocking
location where more than one-half of the stocked
Atlantic Salmon are likely to smolt in 2017.
Delayed smoltification at the remaining sites may
result in higher than anticipated densities
following next year’s stocking events and fewer
smolts produced in subsequent years.
It is noteworthy to mention data collected
from two stream sections that were not stocked in
2016 (Ellies and Stuck truck). Fish found at these
locations were likely displaced from upstream
stocked reaches. Density of YOY Atlantic
Salmon were very low at these sites (23 fish
collected from roughly 9,000 m-2 of sampled
habitat) however their mean size was larger than
those captured at the nearest upstream stocked
reach. Size distributions also indicate a higher
proportion of smolts from these locations in 2017
(Table 1.8.3). Data from these locations also
confirm the theory that stocked fish stray little
from initial stocking locations.
Overall, the decline in the size of YOY
Atlantic Salmon continues despite efforts since
2014 to reduce the total density and biomass of
stocked fish at each site (Table 1.8.4) while the
density of stocked fingerlings, measured the
following fall after five months of stream life,
continue to meet assessment and recovery targets
of 0.05-0.50 fish m-2 (Table 1.8.5).
TABLE 1.8.4. Estimated population size, density, and biomass of Age-0 Atlantic salmon at spring fingerling stocking locations in the Credit River in 2016.
Length
(mm)
Weight
(g)
Length
(mm)
Weight
(g)
Meadow (Forks Prov. Park) 101.3 11.8 139.1 30.7
Stuck truck (Forks Prov. Park) 103.8 12.3 141.0 31.4
Brimstone (Forks Prov. Park) 90.8 8.3 138.9 29.9
Ellies (Forks o' Credit Rd.) 99.2 11.7 146.3 37.5
Belfountain C.A. 85.1 6.9 131.3 24.8
6th Line 83.4 6.6 143.8 33.2
Age 1 and older
59
80
24
67
9
14
Reach
Age 0
% expected to
smolt in 2017
Reach
Age/size
(mm) Number
Lower
95% CI
Upper
95% CI
Density
(No. m-2
)
Biomass
(g m-2
)
Meadow (Forks Prov. Park) Age 0 <98 1,002 536 1,790 0.27 2.17
Age 0 >98 1,398 810 2,354 0.37 5.41
Brimstone (Forks Prov. Park) Age 0 <98 5,247 2,972 8,992 0.82 5.77
Age 0 >98 1,354 550 2,708 0.21 2.70
West Credit Belfountain CA Age 0 <98 2,586 1,848 3,607 0.75 4.81
Age 0 >98 248 89 489 0.07 0.83

Section 1. Index Fishing Projects
TABLE 1.8.5. 2012-2016 trends in stocked Atlantic Salmon size / biomass at the time of stocking (May) vs size of electrofished Atlantic
Salmon (October) and the likelihood of smolting for upper Credit River Main-stem stocking locations. Data for sites in reaches 1-4 as been
pooled due to inconsistences of annual stocking.
Year Stocked size (g) Stocked biomass (g) Fall size (g) % smolt
2012 1.5 152,508 19.3 67
2013 2.02 242,295 16.3 77
2014 3.22 331,311 11.4 63
2015* 2.79 247,745 9.6 42
2016 2 90,229 10.03 42
* indicates year when the reduction of stocked biomass was initiated
May October
74

Section 1. Index Fishing Projects
Monitoring Atlantic Salmon throughout
their life cycle is critical to the success of the
Lake Ontario Atlantic Salmon Restoration
Program and this information is necessary to
choose ‘best’ management strategies in the future.
Collecting information while salmon are “out-
migrating” to Lake Ontario is an important
fisheries reference point, because it represents the
outcome of stream-life and allows biologists to
compare stream and lake survival. This is
particularly important for the restoration program
as it is implementing a stocking strategy that is
exploring the use of three stocked life stages
(spring fingerlings, fall fingerlings, and spring
yearlings), and three strains (LeHave, Sebago, and
Lac St. Jean). Assessing the relative contribution/
survival of the strains and life stages will allow
for the optimization of the stocking program in
the future and in turn improve the chances for
restoration.
In 2016, the Lake Ontario Management
Unit and Credit Valley Conservation conducted
the sixth year of out-migrant sampling on the
Credit River using a Rotary Screw Trap. The trap
was deployed on April 11 soon after the stocking
of spring yearling Atlantic Salmon which
occurred on April 6 and 7 at Terra Cotta and
Norval. Daily trap sampling occurred for the
next 66 days until trap removal on June 16. In
2016, 2,851 fish representing 22 species were
collected (Table 1.9.1.). Atlantic Salmon catches
in 2016 were high, second only to catches in 2015
(Table 1.9.2.). As in 2015, these high catches are
likely due to the close alignment of the dates of
yearling stocking (April 6) and the
commencement of trapping (April 11).
Tissues from 417 Atlantic Salmon were
submitted to MNRF – Aquatic Research and
Monitoring Section for genetic analysis to
determine strain assignment and parentage (life-
stage stocked). The proportion of each strain and
life-stage caught in 2016 reflects the amounts of
each stocked. The most numerous strain caught
across all life-stages was LaHave (85%) (Table
75
1.9.2.). This strain made up 80% of the spring
fingerlings stocked in 2015 and 100% of the
spring yearlings stocked in 2016. When
examined across the six years of sampling (2011-
2016) the catches of Sebago and LaHave are
similar comprising 45% and 47% respectively of
the catch in years when stocking efforts are
comparable between the strains. The Lac St. Jean
strain does not represent a significant proportion
of the smolt catch in any year, however, this strain
was stocked only recently and not in numbers that
are comparable to the other strains.
TABLE 1.9.1. List of species collected using the Rotary Screw Trap during 2016.
1.9 Credit River Atlantic Salmon Smolt Survey
M.D. Desjardins, Lake Ontario Management Unit
Species Catch
Chinook Salmon 1,858
Atlantic Salmon 417
Common Shiner 331
Rainbow Darter 49
Sea lamprey 35
Stonecat 28
Blacknose dace 27
Rainbow Trout 27
Longnose Dace 23
Bluntnose Minnow 15
River Chub 6
Coho Salmon 6
Fathead Minnow 5
White Sucker 5
Hornyhead Chub 4
Golden Shiner 3
Brook Stickleback 3
Creek Chub 3
Johnny Darter 2
Fantail Darter 2
Northern Hog Sucker 1
Emerald Shiner 1
Total 2,851

Section 1. Index Fishing Projects
76
Once again, the poorest performing life-
stage appears to be fall fingerlings. Since the
onset of sampling fall fingerlings have never
made up more than ten percent of the catch (Table
1.9.2). The most abundant life-stage was spring
yearlings. This is the second sampling season
where that life-stage dominated the catch at 55%.
Prior to 2015, the most abundant life-stage was
spring fingerlings (Table 1.9.2). This shift in
catch composition reflects changes to the spring
yearling stocking strategy that came out of
findings of the 2014 Atlantic Salmon Science
Workshop. The workshop called for the
production of larger spring yearlings to improve
their performance. An artifact of producing larger
yearlings is a later stocking date. Yearling
stocking shifted from mid-march (2011-2013) to
early April (2015-2016). Stocking now occurs
immediately prior to the commencement of
sampling. The fact that yearling catches were low
prior to this timing shift likely indicates that
spring yearlings out-migrate soon after stocking
and during the years when stocking was early
(mid-march), the bulk of the yearling out-
migration occurred prior to trap deployment.
TABLE 1.9.2. Composition of the out-migrant catch 2011-2016 by stocked life-stage and strain.
Since 2015, catches are bimodal with an early
peak reflecting spring yearling out-migration (mid
April) and a later peak (early May) reflecting
spring fingerling out-migration (Fig. 1.9.1).
Overall, the performance of spring fingerling and
spring yearling life-stages seems to be
comparable now that the yearling stocking
window has changed (Table 1.9.2).
Of interest is the relative abundance of
unassigned individuals. These are wild caught
fish that cannot be traced back to hatchery mating
records. Their abundance has been increasing
accounting for over one third of the catch in most
years after 2014. The recent increase also seems
to be skewed toward Sebago strain unassigned
fish. It is important to note that Sebago strain
Atlantic Salmon are stocked by New York State
and these fish are encountered in Ontario
tributaries. Wild crosses between New York and
Ontario stocked Sebago strain would produce the
unassigned classification; however, the high
proportion of these fish in our assessments seems
questionable and deserves more detailed
assessment.
Year
Days
sampled
Atlantic
Salmon
catch Strain Fall fingerling
Spring
fingerling
Spring
yearling Unassigned
Ambiguous
strain
LaHave 18 150 27 17
Sebago
LaHave 2 87 2 20
Sebago 4 124 12
LaHave 9 107 29 20
Sebago 2 59 26
LaHave 12 67 29 19
Sebago 6 30 4 99
Lac St. Jean 12 20
LaHave 30 23 246 15
Sebago 1 11 158 214
Lac St. Jean 1 3 6
LaHave 4 44 207 67
Sebago 14 17
Lac St. Jean 4
Totals 373 2328 101 723 722 532 91
2015 71 798
20
2013 52 2274
2014 51 351
20
2011 51 227
2016
Parentage
66 417
22
2012 82 30825

Section 1. Index Fishing Projects
77
FIG. 1.9.1. Timing of the Atlantic Salmon catch 2011-2016. Catches have been pooled (2011-2014) and (2015-2016) to display the shift in catch following the implementation of stocking changes initiated in the spring of 2014. Note that high water events in 2014 delayed sampling
until late April in that year.
0
20
40
60
80
100
120
140
160
2015 - 2016
2011-2014
Date
NumberCau
ght
Yearling Stocking Date 2011-2013
Yearling Stocking Date 2015-2016

Section 1. Index Fishing Projects
by Shelter Valley Creek (3.25 g/m2) and
Ganaraska River (0.94 g/m2; Table 1.10.1).
Chinook Salmon parr/smolts will be
collected in the spring over the next two years to
establish the micro-chemical baseline for the
otoliths. Results will be made available in the
following years.
Year to year variability in abundance of
Chinook Salmon in Lake Ontario streams is still
not well understood. Moreover, a widespread
increase in Chinook Salmon abundance across
streams may be consistent with ecosystem
changes in Lake Ontario over the last 20 years.
Assessment of naturalized Chinook Salmon
production in streams should provide additional
insights into wild and naturalized fish production.
Additionally, this program is providing essential
baseline information for the development of a new
assessment technique that will aid in estimating
Chinook Salmon natural production in Lake
Ontario.
In recent years, the Lake Ontario Chinook
Salmon Mass Marking Study indicated 40-60% of
the Chinook Salmon in Lake Ontario originated
from agency stocking programs and the remainder
were of naturalized origin. In addition, many
naturalized Chinook Salmon have been collected
during electrofishing programs conducted in Lake
Ontario tributaries. In 2014, a program was
initiated to assess naturalized production of
juvenile Chinook Salmon in Lake Ontario
streams. This program was based on previous
surveys conducted during spring 1997 to 2000.
In 2016, modifications to the survey
resulted in the sampling of six Lake Ontario
tributaries, which included: Bronte Creek,
Oakville Creek, Duffins Creek, Wilmot Creek,
Ganaraska River and Shelter Valley Creek. While
the over-arching objectives of the juvenile
Chinook assessment program remained intact
(quantifying naturalized Chinook Salmon
production), modifications were made to the
program to allow for the development of a new
assessment tool known as otolith microchemistry.
Once refined, this technique may be used to
distinguish between stocked and naturalized fish
based on the chemical composition of the otolith,
allowing us to track the contribution of
naturalized fish to the Lake Ontario recreational
fishery without the need of fin clips.
During 2016, juvenile Chinook Salmon
were surveyed by electrofishing in six Lake
Ontario tributaries (Table 1.10.1). The survey
took place over three days spanning May 10-12,
2016. With the exception of Oakville Creek, only
one site was visited per tributary (Tables 1.10.1
and 1.10.2).
Estimated catches of age-0 Chinook
Salmon were highest in Wilmot Creek (1,573.80
fish/site); approximately 5X higher than the
Ganaraska River (279.57 fish/site) and Shelter
Valley Creek (249.40 fish/site; Figure 1.10.1 and
Table 1.10.1). Wilmot Creek had the highest age-
0 Chinook Salmon biomass (8.83 g/m2) followed
78
1.10 Juvenile Chinook Assessment M.J. Yuille, Lake Ontario Management Unit
TABLE 1.10.1. Location, sampling date site dimensions and abundance estimates (number, linear density (fish/m) and biomass
(g/m2)) of age-0 Chinook Salmon in six Lake Ontario tributaries in
2016. The abundance was estimated for each species at each site using: N = catch + (catch / (1/(1-0.2617)*mean weight*0.27116)-1).
The spatial coordinates are at the downstream end of each site.
Bronte Creek
BN04 43° 24.35' 79° 44.47' May 10 12.70 108.00 143.81 1.33 0.14
Oakville Creek
OA02 43° 27.62' 79° 45.16' May 10 17.66 35.00 17.10 0.49 0.04
OA06 43° 27.19' 79° 41.54' May 10 8.00 55.00 11.07 0.20 0.03
Duffins Creek
DU06 43° 51.21' 79° 03.74' May 11 14.02 62.00 101.57 1.64 0.16
Wilmot Creek
WMA10 43° 54.81' 78° 36.60' May 11 8.38 28.70 1573.80 54.84 8.83
Ganaraska River
GN10 43° 59.36' 78° 19.72' May 11 15.50 26.00 279.57 10.75 0.94
Shelter Valley Cr.
SE09 44° 00.04' 77° 59.70' May 12 6.47 16.00 249.40 15.59 3.25
Site length
(m)
Estimated
no. No./m g/m
2Site Latitude Longitude DateSite width
(m)

Section 1. Index Fishing Projects
TA
BL
E 1
.10
.2. C
atch
by s
pec
ies
of
fish
in L
ake
On
tari
o t
rib
uta
ries
du
rin
g e
lect
rofi
shin
g s
urv
eys
in 2
016
.
79
Age-
01
+A
ge-
01
+A
ge-
01
+A
ge-
01
+
Bro
nte
Cre
ek
BN
04
May
10
1--
--4
8--
----
----
--1
2--
61
2--
----
37
--1
03
19
17
----
Oa
kvil
le C
reek
OA
02
May
10
----
--6
----
----
----
10
----
11
3--
--1
3--
4--
12
14
----
OA
06
May
10
----
--4
----
----
----
----
----
----
----
----
----
----
--
Du
ffin
s C
reek
DU
06
May
11
----
--3
4--
--1
1--
----
----
--1
--4
34
91
1--
6--
29
--
Wil
mo
t C
reek
WM
10
May
11
----
--5
22
----
18
----
3--
----
----
----
5--
----
----
--1
6
Ga
na
rask
a R
iver
GN
10
May
11
--1
--9
3--
--1
1--
1--
--4
6--
----
11
17
1--
----
----
----
Sh
elte
r V
all
ey C
r.
SE
09
May
12
----
--8
3--
--2
0--
15
----
----
----
----
----
----
----
----
Hornyhead chub
River chub
Dat
eSea lamprey
Coho salmon
Chinook salmon
Rainbow trout
Sit
e
Mottled sculpin
Blacknose dace
Fathead minnow
Common shiner
Longnose dace
Creek chub
Stonecat
Pugnose shiner
Rock bass
Rainbow darter
Fantail darter
Johnny darter
Atlantic salmon
White sucker
Carps and minnows
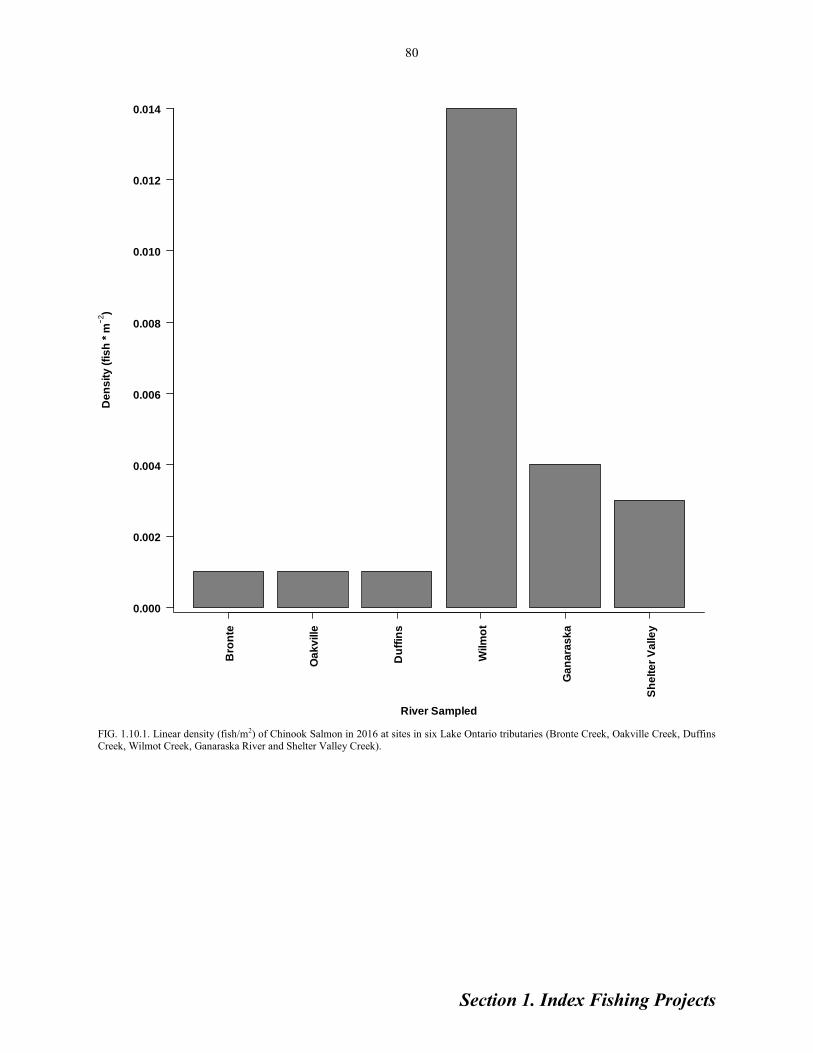
Section 1. Index Fishing Projects
FIG. 1.10.1. Linear density (fish/m2) of Chinook Salmon in 2016 at sites in six Lake Ontario tributaries (Bronte Creek, Oakville Creek, Duffins Creek, Wilmot Creek, Ganaraska River and Shelter Valley Creek).
80
0.000
0.002
0.004
0.006
0.008
0.010
0.012
0.014D
en
sit
y (
fis
h *
m2)
River Sampled
Bro
nte
Oa
kv
ille
Du
ffin
s
Wilm
ot
Ga
na
ras
ka
Sh
elt
er
Va
lle
y

Section 1. Index Fishing Projects
81
Since 1978 the New York State Department
of Environmental Conservation (NYSDEC) and
the U.S. Geological Survey (USGS) have
annually conducted 100-120 bottom trawl tows,
primarily in US waters in early spring, to provide
an index of Alewife abundance as well as
biological attributes such as age distribution and
body condition. As the dominant prey species in
Lake Ontario, understanding Alewife abundance
and age structure is important for assessing
predator/prey balance and establishing safe
stocking levels of predator species (i.e. Chinook
Salmon and Lake Trout).
In 2016, the Ontario Ministry of Natural
Resources and Forestry (OMNRF) joined the
spring trawl survey for the first time, and an
additional 46 Canadian sites were sampled.
1.11 Lake Ontario Spring Prey Fish Trawling
J.P. Holden, M.J. Yuille, J.A. Hoyle Lake Ontario Management Unit, MNRF
M.G. Walsh, B.C. Weidel Lake Ontario Biological Station, USGS
M.J. Connerton Cape Vincent Fisheries Station, NYSDEC
Trawling at Hamilton and Toronto (shallow sandy
sites) was conducted by the USGS, while deep
Toronto sites, Oshawa, Cobourg, Prince Edward
County and in the Kingston Basin were sampled
by OMNRF (Fig. 1.11.1). A total of 188 sites
conducted throughout the lake were sampled in
2016 (46 in Canadian waters, 142 in US waters)
spanning bottom depths from 8-225m (25-743 ft.)
between April 19th and May 10th.
As a whole, the survey generally samples
depths in proportion to the lake area (Fig. 1.11.2)
however there are differences in how those
samples are distributed between jurisdictions (Fig.
1.11.3). The south shore has well distributed
coverage as most depths between 8-200m can be
surveyed at each transect. Bottom trawling along
the north shore is less uniform due to a lack of
FIG. 1.11.1. Geographic distribution of trawl sites conducted by MNRF, USGS and NYSDEC.

Section 1. Index Fishing Projects
82
suitable trawl sites at shallower depths. Attempts
to trawl at depths shallower than 80 m at the
current sites have consistently resulted in snags
and torn trawl nets. Depths greater than 80 m,
however, tend to be more bottom trawl friendly
and thus there is an emphasis on conducting
trawls at those depths along the north shore.
During the day, in early spring, most Lake
Ontario Alewife are found near the lake bottom in
the warmer, deeper water (75 m – 150 m) thus
trawl sites in depths greater than 80 m provide
suitable index sites for Alewife. Additionally,
shallow tows (<40 m) in Ontario waters occur
disproportionately in the Kingston Basin. Efforts
continue to seek suitable trawl locations along the
north shore portion of the main lake utilizing new
technology such as side-scan sonar.
0.00
0.05
0.10
0.15
20 40 60 80 100 120 140 160 180 200 220 240 260
Upper Depth Limit (m)
Pro
po
rtio
nLake Area Trawl Sites
FIG. 1.11.2. Depth distribution of trawl sites relative to the lake area
at depth.
0
5
10
15
20
20 40 60 80 100 120 140 160 180 240
Upper Depth Limit (m)
To
ws
CA US
FIG. 1.11.3. Comparison of depth distribution of trawls conducted in US and Canadian water.
All vessels followed a standardized trawl
protocol that utilized a polypropylene mesh
bottom trawl referred to as “3N1” (see Table
1.11.1 for trawl dimensions) equipped with rubber
discs that elevate the footrope off bottom to
minimize catches of dreissenid mussels.
NYSDEC and USGS vessels used USA Jet
slotted, metal, cambered trawl doors (1.22m x
0.75m), while OMNRF used comparable
Thyborne doors to spread the trawl. Trawl
mensuration gear was used to record door spread,
bottom time and headrope depth. A target of 10
min tow time was set for the survey as was a
standardized 3:1 warp to bottom depth ratio.
Species diversity varied between sites and
depths (Fig. 1.11.4). Overall 20 different fish
species were captured in the survey however 12
species were caught in five or fewer trawls.
Rainbow Smelt, Alewife and Round Goby were
the most commonly encountered species
occurring in 47%, 41% and 36%, of the trawls,
respectively. The ten most common species are
listed in Table 1.11.2.
Spatial distribution of abundance is
presented in Fig. 1.11.5. Alewife density is
significantly higher than the other species (10-
100x greater) and is presented with a different
scale to maintain spatial trends. Rainbow Smelt
and Round Goby abundance appears higher along
Component Description
Headrope length 20 m
Footrope length 22 m
Codend mesh 15.2 mm knotless nylon
Gear height 3.5 m
Fishing width 7 m
Cookie sweep
description
Composed of 100 mm
diameter rubber discs that sit
0.3 m below the footrope
Door weight 125 kg
Door area 0.93 m2
Door height 1.2 m
TABLE 1.11.1. Gear specifications for the polypropylene mesh bottom trawl referred to as “3N1”, and equipped with rubber discs
that elevate the footrope off bottom to minimize catches of dreissenid
mussels.

Section 1. Index Fishing Projects
the south shore whereas Alewife seemed to have a
patchy distribution throughout the lake. The
higher abundance of Rainbow Smelt and Round
Goby along the south shore may be related to
available trawl sites in optimum depths (i.e. <100
m). Rainbow Smelt and to a lesser degree Round
Goby, have abundances in depths shallower than
100 m (Fig. 1.11.6) and the number of sites
trawled in those depths is greater on the south
shore. Alewife catches peak between 80-100 m
and while Deepwater Sculpin abundance peaks
between 120-150 m there is generally an
increasing trend with depth.
FIG. 1.11.4. Species diversity per trawl site. Points are scaled to number of species caught ranging from 1 to 10 species at the most diverse site.
Species
Number of
Trawl Sites
Percentage
of Sites
Rainbow smelt 90 48%
Alewife 78 41%
Round goby 68 36%
Deepwater sculpin 51 27%
Lake trout 46 24%
Slimy sculpin 28 15%
Threespine stickleback 19 10%
Yellow perch 15 8%
Lake whitefish 5 3%
Spottail shiner 4 2%
TABLE 1.11.2. Ten most common species caught during the 2016 spring bottom trawl survey.
83

Section 1. Index Fishing Projects
0
2
4
0.0
0.1
0.2
0.3
0.4
0.00
0.03
0.06
0.09
0.000
0.002
0.004
0.006
0.000
0.025
0.050
0.075
Ale
wR
bS
mR
Go
by
SlS
cu
lD
wS
cu
l
0 50 100 150 200
Fishing Depth
De
nsity (
fish
/m2)
FIG. 1.11.5.Relative density (fish/m2) of common species (Alewife, Rainbow Smelt, Round Goby, Slimy Sculpin and Deepwater
Sculpin) catches throughout the survey area.
FIG. 1.11.6. Relative density (fish/m2) of common prey species (Alewife, Rainbow Smelt, Round Goby, Slimy Sculpin and
Deepwater Sculpin) by trawl depth.
84

Section 1. Index Fishing Projects
85
1.12 Lake Ontario Fall Benthic Prey Fish Assessment J.P. Holden, M.J. Yuille, J.A. Hoyle, Lake Ontario Management Unit, MNRF
B.C. Weidel, Lake Ontario Biological Station, USGS
M.J. Connerton, Cape Vincent Fisheries Station, NYSDEC
The Lake Ontario offshore prey fish
community was once a diverse mix of pelagic and
benthic fish but by the 1970s the only native fish
species that remained abundant was Slimy
Sculpin. Recent invasions of dressenid mussels
and Round Goby have further changed the
offshore fish community. The Lake Ontario Fall
Benthic Prey Fish Assessment provides an index
of how prey fish abundance, distribution and
species composition has been altered through time
due to environmental change and species
invasions.
A benthic prey fish assessment in the main
basin of Lake Ontario has typically only been
conducted by the US Geological Survey (USGS).
The historical survey assessed prey fish along six
southern-shore, US transects in depths from 8 -
150 m. However, the restricted geographic and
depth coverage prevented this survey from
adequately informing important benthic prey fish
dynamics at a whole-lake scale, including
monitoring the reappearance of Deepwater
Sculpin. In 2015, this program was expanded to
include additional trawl sites conducted by
OMNRF and New York Department of
Environmental Conservation (NYSDEC). This
section will emphasize lake wide results. Species
specific results are reported in the Status of
Stocks section of this report (Section 7).
The 2016 survey consisted of 142 trawls
conducted from October 3-19 throughout the
entire lake (Fig. 1.12.1). As a whole, the survey
FIG. 1.12.1. Geographic distribution of trawl sites conducted by MNRF, USGS and NYSDEC.

Section 1. Index Fishing Projects
86
generally samples depths in proportion to the lake
area (Fig. 1.12.2) however there are differences in
how those samples are distributed between
jurisdictions (Fig. 1.12.3). Shallow tows (<40m)
in Ontario waters are largely confined to the
Kingston Basin. Efforts continue to find suitable
trawl locations along the north shore portion of
the main lake to improve the spatial coverage of
this survey.
All vessels used a similar trawl (3/4
Yankee Standard, see Section 1.3 for
specifications) however doors and warp ratios
varied between vessels. Depth loggers were used
on USGS and OMNRF trawls to provide
estimates of true bottom time in order to
standardize catches to area swept.
FIG. 1.12.2. Depth distribution of trawl sites relative to the lake area at depth.
TABLE 1.12.1. Percentage of trawls in which the ten most common species occurred.
Species diversity varied between sites (Fig.
1.12.4). Overall 34 different fish species were
captured in the survey however 20 species were
encountered in five or fewer trawls. Alewife was
the most common species encountered in catches
(86% of trawls) followed by Round Goby (71%),
Rainbow Smelt (61%), Deepwater Sculpin (44%)
and Slimy Sculpin (33%) (Table 1.12.1).
Spatial distribution of abundance is
presented in Fig 1.12.5. Alewife and Round
Goby densities were highest and are consistently
found throughout the lake. Both Alewife and
Rainbow Smelt are thought to be mostly pelagic
(suspended) at this time of the year, so this
benthic survey may not accurately reflect their
distribution and density. Bottom depth has a
strong effect on species abundance. Round Goby
occupy depths shallower than Slimy Sculpin
which are shallower than Deepwater Sculpin (Fig.
1.12.6).
0.00
0.05
0.10
0.15
20 40 60 80 100 120 140 160 180 200 220 240 260
Upper Depth Limit (m)
Pro
po
rtio
n
Lake Area Trawl Sites
0
5
10
15
20
20 40 60 80 100 120 140 160 180 200 220 240
Upper Depth Limit (m)
To
ws
CA US
FIG. 1.12.3. Comparison of depth distribution of trawls conducted in US and Canadian water.
Species % Trawl Sites
Alewife 86
Round Goby 70
Rainbow Smelt 61
Deepwater Sculpin 44
Slimy Sculpin 33
Yellow Perch 16
Lake Trout 15
Gizzard Shad 9
Brown Bullhead 8
Spottail Shiner 8

Section 1. Index Fishing Projects
FIG. 1.12.5. Relative density (fish/m2) of the most common species (Alewife, Rainbow Smelt, Round Goby, Slimy Sculpin and
Deepwater Sculpin) catches throughout the survey area
FIG. 1.12.6. Relative density (fish/m2) of common prey species (Alewife, Rainbow Smelt, Round Goby, Slimy Sculpin and
Deepwater Sculpin) by trawl depth.
87
FIG. 1.12.4. Species diversity per trawl site. Points are scaled to number of species caught ranging from 1 to 10 species at the most diverse site.
0.0
0.5
1.0
1.5
0.00
0.03
0.06
0.0
0.5
1.0
1.5
0.00
0.02
0.04
0.00
0.05
0.10
Ale
wR
bS
mR
Go
by
SlS
cu
lD
wS
cu
l
0 50 100 150 200
Fishing Depth
De
nsity (
fish
/m2)

Section 2. Recreational Fishery
Fisheries Management Zone 20 (FMZ20)
Council provides recommendations to the Lake
Ontario Manager regarding the management of
the Lake Ontario recreational fishery. The FMZ
20 Council has spent many hours reviewing
information, attending meetings, listening to
issues, discussing options and providing advice.
In 2016, the Council provided a great deal of
discussion and input on the question of
appropriate stocking levels of predatory fishes
(specifically, Chinook Salmon and Lake Trout),
in light of back-to-back weaker than anticipated
Alewife year-classes in 2013 and 2014 (Section
7.6). This has required participation in several
face-to-face meetings as well as some council
members representing Ontario at a bi-national
forum with stakeholders from New York State. In
April, a Trout and Salmon Symposium was held
in Port Credit, that was very well attended, and co
-hosted by MNRF’s Lake Ontario Management
Unit and the Port Credit Trout and Salmon
Association.
Many of our volunteer clubs (council-
affiliated and others) also help with the physical
delivery of several management programs.
Multiple clubs help with the planning and
88
implementation of Lake Ontario’s net pen rearing
initiatives for Chinook Salmon (Section 6.2).
Others help with the annual delivery of our
stocking program through the operation of
community based hatcheries. The Napanee Rod
and Gun Club helps MNRF meet its stocking
targets by rearing Brown Trout. The Credit River
Anglers stock Rainbow Trout and Coho Salmon.
The Metro- East Anglers, through their operation
of the Ringwood hatchery, help the province meet
its Rainbow Trout, Brown Trout, Atlantic
Salmon, and Coho Salmon targets. Volunteers at
the Ganaraska River-Corbett Dam Fishway spend
many hours ensuring the fishway is operating
properly, installing and maintaining the fish
counter, helping to assess the spring Rainbow
Trout population, and helping with fall Chinook
Salmon egg collection. Numerous anglers / clubs
also participate regularly by supplying catch and
harvest information in our volunteer angler diary
programs.
2. Recreational Fishery 2.1 Fisheries Management Zone 20 Council (FMZ20) / Volunteer Angling Clubs C. Lake, Lake Ontario Management Unit

Section 2. Recreational Fishery
89
2.2 Western Lake Ontario Boat Angling Fishery M. J. Yuille and N.J. Jakobi, Lake Ontario Management Unit
Stocking of Coho Salmon and Chinook
Salmon by New York State and Ontario in the late
1960s created an angling fishery for salmon and
trout in Lake Ontario. Rainbow Trout, Atlantic
Salmon, Brown Trout and Lake Trout were lake
stocked (see Section 6.1, 8.2, 8.5) creating a
world-class fishery. Significant natural
reproduction of Rainbow Trout and Chinook
Salmon has further added to the quality of angling
in Lake Ontario. OMNRF has surveyed this
fishery in most years since 1977. This survey
provides the only statistics for this fishery in
Ontario waters and is the primary source for
biological monitoring of salmon and trout in the
Ontario waters of Lake Ontario. We have relied
on catch rates to index the abundance of these
salmon and trout populations. Moreover, this
survey has provided a broad geographic and
seasonal array of biological samples.
This fishery was monitored at boat launch
ramps during April to the end of August from the
Niagara River to Wellington (Fig. 2.2.1). The
survey design was similar to most previous
surveys in the past three decades. The survey was
temporally and spatially stratified by month and
sectors (respectively, Fig. 2.2.1). Catch, harvest
and effort information were obtained through
angler interviews at selected high-effort ramps
(one in each sector) after fishing trips were
completed. Fishing effort was monitored by
counting boat trailers at all ramps on a weekly
basis. We limited interviews to the Niagara and
Hamilton sectors in April and May, as past
surveys indicated effort was sparse elsewhere
during these months. Anglers were surveyed in all
sectors from June to August. Fishery statistics for
marina-based anglers were estimated based on the
2011 marina based fishery scaled to the 2016
ramp based fishery.
FIG. 2.2.1. Spatial stratification of OMNRF Western Lake Ontario Angler Survey. Kingston Basin was not surveyed in 2016.

Section 2. Recreational Fishery
Angling statistics for the salmon and trout
fishery in the Ontario waters of Lake Ontario for
1977 to 2016 are provided in Table 2.2.1. Angling
effort in 2016 (353, 945 angler-hrs; Fig. 2.2.2) has
not varied greatly since 1994 (Fig. 2.2.2). The
catches of Chinook Salmon remain high in 2016,
however catches of Rainbow Trout and Coho
Salmon declined significantly since the last
survey in 2013 (Table 2.2.1; Fig. 2.2.3). Chinook
Salmon dominated the catch (49,779), followed
by Rainbow Trout (18,109), Lake Trout (6,814)
and Coho Salmon (5,746). Together they
represented about 97% of the total catch of all
species. Of the six aforementioned salmon and
trout species, anglers primarily targeted Chinook
Salmon (77% of angling effort), followed by
Rainbow Trout (49%) and Coho Salmon (20%;
Fig. 2.2.3). Catch rates for the time series from
1977-2016 show major shifts in salmon and trout
populations and the quality of angling in Lake
Ontario (Fig. 2.2.3). In 2016, catch rates for
Chinook Salmon were higher than the previous
survey in 2013, while catch rates for Rainbow
Trout in 2016 were significantly lower than 2013
(Fig. 2.2.4).
Chinook
Salmon
Rainbow
Trout
Coho
Salmon
Atlantic
Salmon
Brown
Trout
Lake
Trout
Chinook
Salmon
Rainbow
Trout
Coho
Salmon
Atlantic
Salmon
Brown
Trout
Lake
Trout Rod-hr Angler-hr
1977 4,047 NA 72,718 -- NA NA 3,972 NA 72,586 -- NA NA 465,137 465,137
1978 1,928 2,109 97,924 -- 450 72 1,892 2,096 97,746 -- 450 72 418,895 418,895
1980 1,774 5,769 79,326 -- 86 317 1,774 5,756 79,129 -- 86 273 656,086 656,086
1982 2,730 5,435 74,854 -- 129 1,512 2,447 4,126 66,998 -- 129 1,172 744,802 744,802
1983 23,303 21,774 16,049 -- 1,566 4,627 17,083 17,190 13,546 -- 1,190 3,537 534,473 534,473
1984 41,764 43,774 12,867 -- 5,224 9,259 32,906 35,627 10,458 -- 3,991 6,242 444,448 444,448
1985 187,686 98,471 34,203 3,432 7,032 42,147 125,322 83,530 22,239 569 4,108 25,305 1,157,073 1,157,073
1986 268,877 100,824 43,294 1,843 2,831 24,775 157,675 73,377 29,200 187 1,471 9,013 1,363,082 1,363,082
1987 155,796 62,565 27,380 455 2,905 21,225 108,024 44,977 12,262 124 1,399 8,391 1,215,219 1,215,219
1988 112,289 96,008 27,983 1,382 5,542 9,307 74,606 73,561 16,180 140 3,100 3,012 1,233,013 1,233,013
1989 103,796 52,545 15,082 721 3,029 11,868 71,025 35,230 11,315 491 1,548 3,856 1,010,516 1,010,516
1990 94,786 84,229 15,906 1,628 2,817 12,201 60,701 67,529 10,516 162 1,040 2,832 1,112,047 1,112,047
1991 99,841 57,281 17,643 471 7,151 41,277 66,079 38,712 14,574 68 3,119 6,843 1,082,287 1,082,287
1992 69,959 26,742 3,222 2,516 4,010 7,891 50,182 18,381 1,826 413 1,761 2,997 1,012,822 1,012,822
1993 111,852 51,733 6,845 1,238 2,174 6,332 64,444 28,738 4,643 288 1,208 3,434 836,572 836,572
1994 66,031 25,227 2,254 203 3,983 13,623 38,170 14,382 1,517 129 2,251 5,443 601,325 601,325
1995 34,791 15,998 1,525 168 1,929 10,603 20,387 9,743 765 139 1,068 3,937 498,743 498,743
1997 43,566 7,077 2,777 35 1,003 10,427 23,890 3,979 1,453 19 619 2,113 508,297 508,297
1998 40,723 25,075 3,541 480 1,204 1,831 25,841 16,766 2,257 316 508 540 473,105 440,653
1999 47,899 26,080 3,669 120 953 7,331 27,542 18,616 3,529 30 387 1,114 593,233 469,117
2000 46,612 9,405 2,095 20 1,502 4,638 27,352 5,284 1,228 12 527 857 588,006 453,065
2001 40,140 16,683 2,689 60 1,508 3,008 18,525 10,828 1,596 0 787 387 505,616 369,407
2002 29,699 10,876 1,702 0 555 445 15,054 7,341 1,442 0 247 94 500,372 366,549
2003 44,500 7,176 2,145 24 914 2,216 15,843 4,437 1,763 12 240 528 411,011 286,384
2004 42,298 4,583 1,288 29 570 2,290 17,263 3,570 1,177 5 135 364 366,349 259,584
2005 42,711 16,154 1,254 83 221 1,214 18,601 15,667 694 83 66 75 474,114 333,952
2008 43,584 25,169 2,310 114 1,522 1,397 11,880 20,730 1,843 14 957 38 521,586 340,255
2011 39,172 25,588 7,128 456 1,392 1,756 17,820 16,185 5,078 254 1,159 642 443,548 293,952
2012 50,063 40,603 18,110 340 926 8,004 19,032 26,616 12,419 48 626 585 509,060 319,576
2013 37,413 33,027 8,424 103 1,121 14,477 16,024 23,115 8,773 12 431 532 539,185 345,568
2016 49,779 18,109 5,746 670 388 6,814 24,434 12,271 3,920 457 77 805 591,014 353,945
Catch Harvest Effort
Year
TABLE. 2.2.1. Angling statistics for the salmon and trout fishery in the Ontario waters of Lake Ontario (excluding Kingston Basin), 1977 to 2016. Anglers were only allowed to fish with one rod prior to 1998.
90

Section 2. Recreational Fishery
FIG. 2.2.2. Fishing effort (angler hours and rod hours) in the Ontario waters of Lake Ontario (excluding Kingston Basin), 1977 to 2016.
Anglers were only allowed to fish with one rod prior to 1998.
0
500
1000
1500
Eff
ort
(h
rs X
10
00
)
19
80
19
85
19
90
19
95
20
00
20
05
20
10
20
15
0
250
500
750
1000
1250
1500
Angler-hr
Rod-hr
Co
ho
Ch
ino
ok
Ra
inb
ow
Atl
an
tic
Bro
wn
La
ke
0
20
40
60
80
100
Pro
po
rtio
n o
f T
ota
l E
ffo
rt
(an
gle
r-h
rs)
FIG. 2.2.3. The proportion of angling effort (angler hours) for specific salmon and trout species relative to the total estimated
angling effort in 2016.
0.0
0.1
0.2
0.3
0.4
Ca
tch
ra
te (
fis
h p
er
an
gle
r-h
r)
19
80
19
85
19
90
19
95
20
00
20
05
20
10
20
15
Total
Chinook Salmon
Rainbow Trout
FIG. 2.2.4. The catch rate (number of fish per angler hour) of salmon and trout in the Ontario waters of Lake Ontario (excluding Kingston
Basin), 1977 to 2016.
91

Section 2. Recreational Fishery
92
2.3 Lake Ontario Volunteer Angler Diary Program M. J. Yuille, Lake Ontario Management Unit
A mass-marking and tag monitoring study
was initiated in 2008 by NYSDEC and OMNRF
to determine the origin (stocked or wild),
distribution, and movement of Chinook Salmon in
Lake Ontario (see Section 2.2). All Chinook
Salmon stocked into Lake Ontario from 2008-
2011 were marked with an adipose fin clip and a
portion were also tagged with a coded-wire tags.
Lake Ontario anglers have been contributing to
the collection of data on Lake Ontario salmonids,
including these marked Chinook Salmon, through
a volunteer diary program. Since 2011, anglers
have participated in a volunteer diary program
reporting catch, biological and fin clip
information on Chinook Salmon from their annual
fishing trips. In 2014, the angler diary program
expanded to collect catch and effort information
as well as biological information on all Lake
Ontario salmonid species (Coho Salmon, Chinook
Salmon, Rainbow Trout, Atlantic Salmon, Brown
Trout and Lake Trout) caught. This information
was collected again in 2016.
In 2016, 15 boats (anglers originating from
Ontario and Québec, Fig. 2.3.1) participated in the
program; a decrease of four participants from
2015. Anglers participating in the diary program
fished from April to October out of ports
spanning from the Niagara River to Wellington,
providing good temporal and spatial distribution
of fishery information (see Section 2.2, Fig.
2.2.1). Of all participants, 53% were affiliated
with an angling club and 13% were charter boat
operators. In 2016, anglers made 286 fishing trips
and recorded data on 1,078 Lake Ontario
salmonids (Tables 2.3.1 and 2.3.2). Anglers were
asked to record location (nearest port), disposition
(kept or released), fish lengths and weights as
well as examine every salmonid landed for fin
clips.
Of the five salmonid species, Chinook
Salmon were targeted most frequently and
represented the highest catch in 2016 (Fig. 2.3.2
and Tables 2.3.1, 2.3.2 and 2.3.3). Similar to
FIG. 2.3.1. Geographical distribution of participants in the 2016 Lake Ontario Volunteer Angler Diary program. Image courtesy of Google Earth.

Section 2. Recreational Fishery
93
TABLE 2.3.1. Distribution of angler catches and targets (in brackets) for the six Lake Ontario salmonid species across seven months (April –
September 2016) as reported in the 2016 Lake Ontario Angler Diary Program.
TABLE. 2.3.2. Distribution of angler catch and targets (in brackets) for the six Lake Ontario salmonid species across six sector locations as reported in the 2016 Lake Ontario Angler Diary Program. See Section 2.2 Fig. 2.2.1 for a map of the six defined areas.
FIG. 2.3.2. Proportion of species sought (a) and caught (b) from all 286 trips recorded in the 15 Lake Ontario Volunteer angler diaries
submitted to the Lake Ontario Management Unit. Species labels
include Coho Salmon (Coho), Chinook Salmon (Chinook), Rainbow Trout (Rainbow), Atlantic Salmon (Atlantic), Brown Trout (Brown)
and Lake Trout (Lake).
MonthNumber of
Trips
Coho
Salmon
Chinook
Salmon
Rainbow
Trout
Atlantic
Salmon
Brown
Trout
Lake
TroutTotal
April 8 1 (3) 0 (7) 1 (3) -- 6 (7) 6 (4) 14 (24)
May 34 19 (11) 53 (31) 9 (5) 1 (0) 0 (2) 23 (7) 105 (56)
June 51 13 (14) 121 (50) 22 (14) -- 0 (6) 10 (10) 166 (94)
July 110 43 (37) 385 (110) 57 (51) 4 (1) 0 (24) 17 (10) 506 (233)
August 70 6 (16) 161 (69) 57 (28) 2 (1) 2 (15) 14 (7) 242 (136)
September 13 0 (2) 31 (13) 10 (4) -- 0 (1) 4 (2) 45 (22)
Total 286 82 (83) 751 (280) 156 (105) 7 (2) 8 (55) 74 (40) 1,078 (565)
2016 Lake Ontario Angler Diary
SectorNumber of
trips
Coho
Salmon
Chinook
Salmon
Rainbow
Trout
Atlantic
Salmon
Brown
Trout
Lake
TroutTotal
Brighton-Wellington 64 1 (4) 214 (63) 6 (8) -- 0 (6) 23 (4) 244 (85)
Whitby-Cobourg 57 11 (39) 129 (57) 12 (52) -- 0 (32) 1 (7) 153 (187)
East Toronto 2 -- 7 (2) 5 (0) -- -- 1 (0) 13 (2)
West Toronto -- -- -- -- -- -- -- --
Hamilton 94 45 (25) 253 (90) 88 (26) 4 (0) 3 (4) 28 (17) 421 (162)
Niagara 67 25 (15) 139 (66) 44 (18) 3 (2) 5 (13) 21 (12) 237 (126)
Undefined 2 11 (39) 129 (57) 12 (52) -- 0 (32) 1 (7) 153 (187)
Total 286 82 (83) 751 (280) 156 (105) 7 (2) 8 (55) 74 (40) 1,078 (565)
2016 Lake Ontario Angler Diary
0
20
40
60
80
100
Pro
p.
So
ug
ht (a)
0
20
40
60
80
100
Co
ho
Ch
ino
ok
Ra
inb
ow
Atla
ntic
Bro
wn
La
ke
Pro
p.
Ca
ug
ht (b)
2014, Rainbow Trout were the second most
frequently targeted and caught species in 2016
(Fig. 2.3.2, Tables 2.3.1 and 2.3.2).
In 2016, Brown Trout had the highest
percent harvest (88% of catch) followed by Coho
Salmon (61%), Rainbow Trout (60%), Chinook
Salmon (45%) and Lake Trout (19%) (Fig. 2.3.3).
No clips were observed on any Coho or Atlantic
Salmon caught. Thirty percent of Lake Trout, 3%
of Chinook Salmon and 2% of Rainbow Trout
caught had fin clips (Fig. 2.3.4).
Seasonal and geographical catch summaries
are provided in Tables 2.3.1 and 2.3.2
(respectively). Most angling trips were recorded
in July and August (63% combined) and
originated predominantly from Hamilton, Niagara
and Brighton-Wellington sectors (79% of trips).
Chinook Salmon were predominantly caught in
July and August (73% of catch) and in the
Hamilton and Whitby-Cobourg sectors (62%

Section 2. Recreational Fishery
94
generously volunteered their time to collect
marking and biological information for this
program. Participants that gave permission for
their names to appear in this report include:
Herman Baughman, Dan Brown, Bill Cuthill,
Blair Cyr, Richard Dew, Al van Dusen , Gene
Frederick, Ken Herrington, Jean-Marie LaFleche,
Jack Laki, Andrew Lalonde, Jean Morneau, Al
Oleksuik, Paul Paulin, Stan Smaggas, Shane
Thombs and Bob Warner.
combined). Most Rainbow Trout were caught in
July and August (73% combined) and in the
Niagara and Hamilton sectors (84% combined).
Lastly, Lake Trout were predominantly caught in
the Hamilton, Niagara and Brighton-Wellington
sectors (97% of catch) evenly distributed
throughout the April to September season (Table
2.3.1).
We would like to thank all Lake Ontario
Volunteer Angler Diary participants who
FIG. 2.3.4. Percent composition of unclipped (grey) vs clipped (white) for each salmonid species (Coho Salmon (Coho), Chinook
Salmon (Chinook), Rainbow Trout (Rainbow) Atlantic Salmon
(Atlantic), Brown Trout (Brown) and Lake Trout (Lake)) reported in the 2016 Lake Ontario Angler Diary Program..
FIG. 2.3.3. Percent released (grey) and harvested (white) for each salmonid species (Coho Salmon (Coho), Chinook Salmon (Chinook),
Rainbow Trout (Rainbow) Atlantic Salmon (Atlantic), Brown Trout
(Brown) and Lake Trout (Lake)) reported in the 2016 Lake Ontario Angler Diary Program.
Co
ho
Ch
ino
ok
Ra
inb
ow
Atla
ntic
Bro
wn
La
ke
0
20
40
60
80
100
Pe
rce
nt
Re
lea
se
:Ha
rve
st
Co
ho
Ch
ino
ok
Ra
inb
ow
Atla
ntic
Bro
wn
La
ke
0
20
40
60
80
100
Pe
rce
nt
Un
cli
pp
ed
:Cli
pp
ed
TABLE 2.3.3. Annual angler participation and spatial distribution of Chinook Salmon captured in the Lake Ontario Volunteer Angler Diary
Program, 2011-2016. See Section 2.2 Fig. 2.2.1 for a map of the six defined areas.
Survey
Year
Number of
volunteer
anglers
Number of
trips Niagara Hamilton
West
Toronto
East
Toronto
Whitby-
Cobourg
Brighton-
Wellington Undefined
Total
catch
2011 26 626 757 19 370 120 309 635 47 2,257
2012 31 645 676 195 367 39 324 488 147 2,236
2013 21 424 246 145 84 24 105 331 10 945
2014 26 474 376 183 32 4 38 193 3 829
2015 19 435 116 331 51 48 222 130 59 957
2016 15 301 139 253 -- 7 129 214 129 871
Total 138 2,905 2,310 1,126 904 242 1,127 1,991 395 6,267
Chinook Salmon caught

Section 2. Recreational Fishery
95
Only the ice-fishing component of the Bay
of Quinte recreational angling fishery was
monitored in 2016; the open-water fishery was
not surveyed. The ice-fishing survey was
previously surveyed in 2014. The ice-fishing
survey was conducted from Trenton in the west to
east of Glenora (Fig. 2.4.1). Angling effort was
measured using aerial counts of anglers and huts
(two days per week: one weekday and one
weekend day). An on-ice angling component to
the survey was also planned but poor ice
conditions prevented this component of the
survey from being completed. Total angling
effort was estimated based on the proportion of
aerial counts, per survey strata, in 2016 (Table
2.4.1) compared to 2014 and assuming only eight
weeks of fishing in 2016 compared to eleven
weeks in 2014. Similarly, catch and harvest per
unit effort estimates from 2014 were applied to
the 2016 effort estimate to obtain an estimate of
Walleye catch and harvest in the 2016 ice fishery.
Ice conditions were very poor. Sixteen
aerial flights were conducted from Jan 14-Mar 1,
2016 (Table 2.4.1). The maximum number of ice-
huts counted during aerial flights was 338 huts
(January 23); while the maximum number of on-
ice anglers observed was 237 (January 30).
Figure 2.4.2 and Table 2.4.2 summarize ice-
fishing survey results for 1993-2016. The 2016
survey estimated a total of 61,333 hours of ice-
fishing effort. An estimated 6,524 and 4,430
Walleye were caught and harvested, respectively.
2.4 Bay of Quinte Ice Angling Survey J. A. Hoyle, Lake Ontario Management Unit
FIG. 2.4.1. Map of the Bay of Quinte showing angling survey areas from Trenton in the west to east of Glenora.
TABLE 2.4.1. Aerial angler (on-ice) and hut (portable and permanent) counts by date and day type for 16 aerial flights during
winter 2016.
Date Day type On-ice
Portable
hut
Permanent
hut
Total
count
Jan-14 Weekday 8 7 - 15
Jan-20 Weekday 24 37 7 68
Jan-23 Weekend 76 300 38 414
Jan-25 Weekday 42 43 35 120
Jan-30 Weekend 237 151 24 412
Jan-31 Weekend 48 28 20 96
Feb-05 Weekday 1 1 1 3
Feb-06 Weekend 26 6 2 34
Feb-11 Weekday - 4 5 9
Feb-13 Weekend 4 48 18 70
Feb-14 Weekend 15 57 23 95
Feb-17 Weekday 6 15 27 48
Feb-21 Weekend 66 55 26 147
Feb-22 Weekday 80 34 31 145
Feb-28 Weekend 92 58 24 174
Mar-01 Weekday 9 14 3 26
46 54 18 117
Angling mode
Average

Section 2. Recreational Fishery
96
TABLE 2.4.2. Bay of Quinte ice angling fishery statistics, 1982-2016, including angling effort (angler hours), walleye catch and harvest rates (number of fish per hour), walleye catch and harvest (number of
fish), and the mean weight (kg) of harvested walleye. *2016 Walleye catch and harvest values were
estimated based on 2014 catch and harvest rates.
Effort Catch rate
Harvest
rate Catch Harvest
Mean
weight
(kg)
1982 80,129 0.103 8,223 1.209
1984 108,024 0.091 9,869 1.924
1986 143,960 0.165 23,768 2.272
1988 163,669 0.045 7,416 2.198
1989 175,119 0.145 0.109 25,458 19,147 1.738
1990 164,916
1991 194,088 0.212 0.165 41,204 32,111 1.909
1992 327,546 0.172 0.132 56,494 43,343 1.388
1993 271,088 0.079 0.055 21,326 14,816 1.603
1994 300,049 0.104 0.029 31,060 8,557 2.239
1995 215,518 0.134 0.081 28,939 17,445 1.900
1996 392,602 0.149 0.053 58,468 20,972 1.563
1997 220,263 0.192 0.103 42,315 22,631 1.563
1998 117,602 0.095 0.052 11,167 6,089 2.327
1999 140,363 0.166 0.109 23,293 15,285 2.300
2000 139,047 0.072 0.066 9,949 9,240 2.359
2001 77,074 0.013 0.012 982 938 2.546
2002 37,129 0.070 0.066 2,601 2,468 2.358
2003 16,237 0.020 0.004 321 70 3.391
2004 79,767 0.105 0.051 8,413 4,075 1.668
2005 58,091 0.059 0.034 3,450 1,947 1.879
2007 99,368 0.176 0.114 17,480 11,313 1.008
2009 128,415 0.114 0.083 14,666 10,695 1.607
2013 141,660 0.084 0.062 11,943 8,716 1.374
2014 204,283 0.097 0.069 19,740 14,044 1.439
2016 61,333 0.097* 0.069* 5,927 4,216
Walleye Anglers
-
100,000
200,000
300,000
400,000
-
10,000
20,000
30,000
40,000
50,000
60,000
1989 1992 1995 1998 2001 2004 2007 2010 2013 2016
An
glin
g e
ffort (h
ou
rs)
Wa
lle
ye
catc
h
Released
Harvested
Effort
FIG. 2.4.2. Bay of Quinte ice angling fishery statistics, 1989-2016, including angling effort (angler hours), and walleye catch and harvest (number of fish).

Section 2. Recreational Fishery
A volunteer angler diary program was
conducted during fall 2016 on the Bay of Quinte.
The diary program focused on the popular fall
recreational fishery for “trophy” Walleye,
primarily on the middle and lower reaches of Bay
of Quinte. This was the fifth year of the diary
program. Anglers that volunteered to participate
were given a personal diary and asked to record
information about their daily fishing trips and
catch (see Fig. 2.5.1). A total of 13 diaries were
returned as of February 2017. We thank all
volunteer anglers for participating in the program.
A map showing the distribution of volunteer
addresses of origin is shown in Fig. 2.5.2.
Objectives of the diary program included:
engage and encourage angler involvement
in monitoring the fishery;
characterize fall Walleye angling effort,
catch, and harvest (including geographic
distribution);
characterize the size distribution of
Walleye caught (kept and released);
characterize species catch composition.
Two of the 13 returned diaries reported
zero fishing trips. The number of fishing trips
reported in each of the remaining 11 diaries
ranged from two to 20 trips. Fishing trips were
reported for 59 out of a possible 100 calendar
days from Sep 3 to Dec 11, 2016. There were
from one to four volunteer angler boats fishing on
each of the 59 days, and a total of 93 trip reports
targeted at Walleye; 33 charter boat trips and 60
non-charter boat trips (Table 2.5.1). Of the 93
97
FIG. 2.5.1. Volunteer angler diary used to record information about daily fishing trips and catch.
2.5 Bay of Quinte Volunteer Walleye Angler Diary Program
J. A. Hoyle, Lake Ontario Management Unit

Section 2. Recreational Fishery
trips, 71 (76%) were made on Locations 2 and 3,
the middle and lower reaches of the Bay of Quinte
(see Fig. 2.5.1). The overall average fishing trip
duration was 7.2 hours for charter boats and 4.3
hours for non-charter boats, and the average
numbers of anglers per boat trip were 4.7 and 1.8
for charter and non-charter boats, respectively
(Table 2.5.1). In Location 3, where two lines are
permitted, most anglers used two lines (1.9 rods
per angler on average).
Fishing Effort
A total of 1,602 angler hours of fishing
effort was reported by volunteer anglers (Table
2.5.2). The seasonal pattern of fishing effort is
shown in Fig. 2.5.3. Most fishing effort occurred
in Location 2 (48%; middle Bay) (Fig. 2.5.4).
Location 4 showed increased fishing effort
compared to previous years.
Catch
Eight species and a total of 261 fish were
reported caught by volunteer anglers. The
number of Walleye caught was 184; 112 (61%)
kept and 72 (39%) released (Table 2.5.3). The
next most abundant species caught was
Freshwater Drum (38) followed by Northern Pike
(19), White Perch (11), and White Bass (5).
Fishing Success
The overall fishing success for Walleye in
fall 2016 was 2.0 Walleye per boat trip or 0.115
fish per angler hour of fishing (Table 2.5.2). Fifty
98
FIG. 2.5.2. Map showing the distribution of volunteer addresses of origin. Image courtesy of Google Earth.
Table 2.5.1. Reported total number of boat trips, average trip duration, and average number of anglers per trip for charter and non-
charter Walleye fishing trips during fall 2012-2016 on the Bay of
Quinte.
Year Trip type
Total
number
of boat
trips
Average
trip
duration
(hours)
Average
number of
anglers per
trip
2012 Charter 121 7.7 4.4
Non-charter 137 5.6 2.3
2013 Charter 72 7.4 4.0
Non-charter 83 4.9 2.1
2014 Charter 123 7.5 4.4
Non-charter 87 5.3 2.3
2015 Charter 118 7.5 4.3
Non-charter 117 5.3 2.0
2106 Charter 33 7.2 4.7
Non-charter 60 4.3 1.8

Section 2. Recreational Fishery
99
Table 2.5.2. Reported total number of diaries (with at least one
reported fishing trip), boat trips and effort, total angler effort, total
number of Walleye caught, harvested, and released, average number
of Walleye caught per boat fishing trip, average number of Walleye caught per boat hour, average number of Walleye caught per angler
hour, and the "skunk" rate (percentage of trips with no Walleye
catch) for Walleye fishing trips during fall 2012-2016 on the Bay of Quinte.
TABLE 2.5.3. Number of fish, by species, reported caught (kept and released) by volunteer anglers during the fall Walleye diary program, 2012-2016.
FIG. 2.5.3. Seasonal breakdown (summarized by first and second half of each month from the first half of Sep to the first half of Dec)
of fishing effort (boat trips and angler hours) reported by volunteer
Walleye anglers during fall 2016 on the Bay of Quinte.
-
50
100
150
200
250
300
350
400
0
5
10
15
20
25
30
1 2 1 2 1 2 1
Sep Oct Nov Dec
An
gle
r effo
rt (ho
urs
)
Bo
at
trip
s
Boat trips (93)
Angler effort (1,602 hours)
FIG. 2.5.4. Geographic breakdown of fishing effort (boat trips and
angler hours) reported by volunteer Walleye anglers during fall 2016
on the Bay of Quinte.
0
100
200
300
400
500
600
700
800
900
-
10
20
30
40
50
60
Upper Bay Middle Bay Lower Bay Other
An
gle
r effo
rt (ho
urs
)
Bo
at
trip
s
Boat trips (93)
Angler effort (1,602 hours)
Statistic 2012 2013 2014 2015 2016
Number of diaries 22 19 20 22 11
Number of boat trips 258 155 210 235 93
Boat effort (hours) 1,694 941 1,375 1,506 498
Angler effort (hours) 5,915 3,093 5,164 5,266 1,602
Catch 542 574 682 436 184
Harvest 291 307 336 285 112
Released 251 267 346 151 72
Fish per boat trip 2.1 3.7 3.3 1.9 2.0
Fish per boat trip 0.320 0.610 0.496 0.289 0.370
Fish per angler hour 0.092 0.186 0.132 0.083 0.115
"Skunk rate" 36% 19% 27% 34% 44%
Year
Species Kept Released Kept Released Kept Released Kept Released Kept Released
Longnose Gar 0 0 0 0 0 0 0 0 0 1
Chinook Salmon 0 1 0 0 0 2 0 0 0 0
Rainbow Trout 0 0 0 0 0 3 0 0 0 0
Brown Trout 1 0 0 0 0 1 1 0 0 0
Lake Trout 0 1 0 0 0 4 3 10 0 1
Lake Whitefish 0 1 0 0 0 0 0 0 0 0
Northern Pike 1 47 4 20 2 36 2 14 1 18
White Perch 0 0 0 12 0 0 1 0 0 11
White Bass 0 0 0 3 0 7 9 5 0 5
Morone sp. 1 15 0 0 0 0 0 0 0 0
Sunfish 0 0 0 0 0 0 0 2 0 0
Smallmouth Bass 0 0 0 3 1 2 0 1 1 1
Largemouth Bass 0 0 0 0 0 0 0 0 0 0
Yellow Perch 4 32 2 6 0 0 1 0 0 0
Walleye 292 252 307 267 338 350 285 151 112 72
Freshwater Drum 1 43 0 25 1 53 8 81 0 38
2012 2013 2014 2015 2016
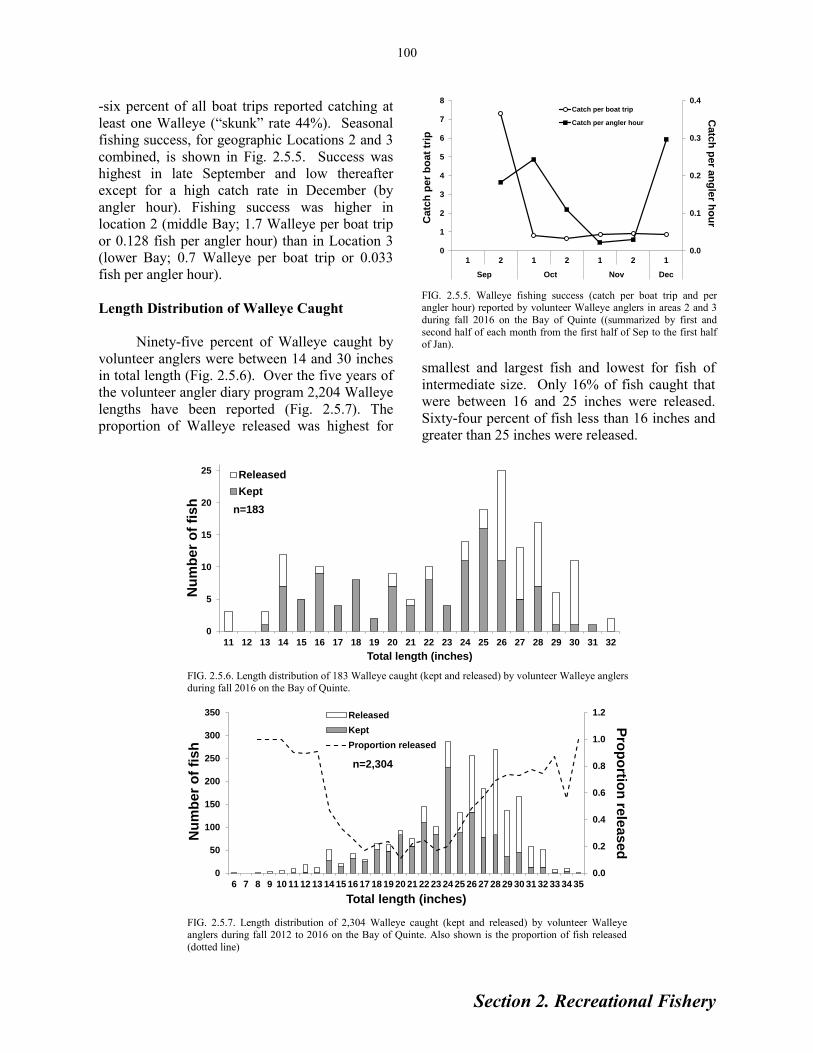
Section 2. Recreational Fishery
100
FIG. 2.5.5. Walleye fishing success (catch per boat trip and per angler hour) reported by volunteer Walleye anglers in areas 2 and 3
during fall 2016 on the Bay of Quinte ((summarized by first and
second half of each month from the first half of Sep to the first half
of Jan).
0.0
0.1
0.2
0.3
0.4
0
1
2
3
4
5
6
7
8
1 2 1 2 1 2 1
Sep Oct Nov Dec
Catc
h p
er a
ng
ler h
ou
rCatc
h p
er
bo
at
trip
Catch per boat trip
Catch per angler hour
FIG. 2.5.6. Length distribution of 183 Walleye caught (kept and released) by volunteer Walleye anglers during fall 2016 on the Bay of Quinte.
-six percent of all boat trips reported catching at
least one Walleye (“skunk” rate 44%). Seasonal
fishing success, for geographic Locations 2 and 3
combined, is shown in Fig. 2.5.5. Success was
highest in late September and low thereafter
except for a high catch rate in December (by
angler hour). Fishing success was higher in
location 2 (middle Bay; 1.7 Walleye per boat trip
or 0.128 fish per angler hour) than in Location 3
(lower Bay; 0.7 Walleye per boat trip or 0.033
fish per angler hour).
Length Distribution of Walleye Caught
Ninety-five percent of Walleye caught by
volunteer anglers were between 14 and 30 inches
in total length (Fig. 2.5.6). Over the five years of
the volunteer angler diary program 2,204 Walleye
lengths have been reported (Fig. 2.5.7). The
proportion of Walleye released was highest for
0
5
10
15
20
25
11 12 13 14 15 16 17 18 19 20 21 22 23 24 25 26 27 28 29 30 31 32
Nu
mb
er
of
fis
h
Total length (inches)
Released
Kept
n=183
smallest and largest fish and lowest for fish of
intermediate size. Only 16% of fish caught that
were between 16 and 25 inches were released.
Sixty-four percent of fish less than 16 inches and
greater than 25 inches were released.
0.0
0.2
0.4
0.6
0.8
1.0
1.2
0
50
100
150
200
250
300
350
6 7 8 9 10 11 12 13 14 15 16 17 18 19 20 21 22 23 24 25 26 27 28 29 30 31 32 33 34 35
Total length (inches)
Pro
po
rtion
rele
ased
Nu
mb
er
of
fish
Released
Kept
Proportion released
n=2,304
FIG. 2.5.7. Length distribution of 2,304 Walleye caught (kept and released) by volunteer Walleye anglers during fall 2012 to 2016 on the Bay of Quinte. Also shown is the proportion of fish released
(dotted line)

Section 3. Commercial Fishery
101
3. Commercial Fishery 3.1 Lake Ontario and St. Lawrence River Commercial Fishing Liaison Committee A. Mathers, Lake Ontario Management Unit
The Lake Ontario and St. Lawrence River
Commercial Fishery Liaison Committee (LOLC)
consists of Ontario Commercial Fishing License
holders that are appointed to represent each of the
quota zones, as well as representatives of the
Ontario Commercial Fisheries’ Association, and
MNRF. This committee provides advice to the
Lake Ontario Manager on issues related to
management of the commercial fishery and
provides a forum for dialogue between the MNRF
and the commercial industry.
The committee met once during 2016. One
of the topics of discussion was the expansion of
the American Eel trap and transport program
(Section 8.3) to include a fall season. Other
notable topics of discussion at the LOLC meeting
included status of fish stocks, licence restrictions,
quota and harvest levels for Yellow Perch, Lake
Whitefish, Northern Pike and Walleye, as well as
the quota ‘pool’ system.

Section 3. Commercial Fishery
Lake Ontario supports a commercial fish
industry; the commercial harvest comes primarily
from the Canadian waters of Lake Ontario east of
Brighton (including the Bay of Quinte, East and
West Lakes) and the St. Lawrence River (Fig.
3.2.1). Commercial harvest statistics for 2016
were obtained from the commercial fish harvest
information system (CFHIS) which is managed,
in partnership, by the Ontario Commercial
Fisheries Association (OCFA) and MNRF.
Commercial quota, harvest and landed value
statistics for Lake Ontario, the St. Lawrence River
and East and West Lakes, for 2016, are shown in
Tables 3.2.1 (base quota), 3.2.2 (issued quota),
3.2.3 (harvest) and 3.2.4 (landed value).
The total harvest of all species was 438,826
lb ($632,677) in 2016, up 72,121lb (20%) from
2015. The harvest (landed value) for Lake
FIG. 3.2.1. Map of Lake Ontario and the St. Lawrence River showing commercial fishing quota zones in Canadian waters.
Ontario, the St. Lawrence River, and East and
West Lakes was 335,452 lb ($509,585), 73,935 lb
($101,263), and 29,439 lb ($34,683), respectively
(Fig. 3.2.2 and Fig. 3.2.3). Yellow Perch, Lake
Whitefish, Sunfish and Walleye were the
dominant species in the harvest for Lake Ontario.
Yellow Perch was dominant in the St. Lawrence
River. Sunfish was the dominant fish in East and
West Lakes.
Major Fishery Trends
Harvest and landed value trends for Lake
Ontario and the St. Lawrence River are shown in
Fig. 3.2.4 and Fig. 3.2.5. Having declined in the
early 2000s, commercial harvest appeared to have
stabilized over the 2003-2013 time-period at
about 400,000 lb and 150,000 lb for Lake Ontario
(Fig. 3.2.4) and the St. Lawrence River (Fig.
102
3.2 Quota and Harvest Summary J. A. Hoyle, Lake Ontario Management Unit

Section 3. Commercial Fishery
TABLE 3.2.1. Commercial fish base quota (lb), by quota zone, in the Canadian waters of Lake Ontario and the St. Lawrence River, East and
West Lakes (two Lake Ontario embayments), 2016.
TABLE 3.2.2. Commercial fish issued quota (lb), by quota zone, in the Canadian waters of Lake Ontario and the St. Lawrence River, East and
West Lakes (two Lake Ontario embayments), 2016.
TABLE 3.2.3. Commercial harvest (lb), by quota zone, for fish species harvested from the Canadian waters of Lake Ontario and the St. Lawrence River, East and West Lakes (two Lake Ontario embayments), 2016.
103
East Lake West Lake
Species 1-1 1-2 1-3 1-4 1-8 1-5 2-5 1-7 1 1
Lake
Ontario
St.
Lawrence
River Total
Black Crappie 4,540 3,000 14,824 1,100 2,800 14,170 17,590 4,840 3,100 9,850 26,264 36,600 75,814
Bowfin 0 0 0 0 500 0 0 0 0 0 500 0 500
Brown Bullhead 0 0 0 0 0 0 0 0 0 0 0 0 0
Lake Whitefish 6,549 97,745 12,307 18,282 208 0 0 0 0 0 135,091 0 135,091
Sunfish 28,130 0 0 0 0 0 0 0 14,600 18,080 28,130 0 60,810
Walleye 4,210 34,431 0 9,452 800 0 0 0 0 0 48,893 0 48,893
Yellow Perch 28,472 114,778 80,742 100,936 10,400 55,181 66,251 18,048 1,120 3,536 335,328 139,480 479,464
Total 71,901 249,954 107,873 129,770 14,708 69,351 83,841 22,888 18,820 31,466 574,206 176,080 800,572
Lake Ontario St. Lawrence River Base Quota by Waterbody
East Lake West Lake
Species 1-1 1-2 1-3 1-4 1-8 1-5 2-5 1-7 1 1
Lake
Ontario
St.
Lawrence
River Total
Black Crappie 2,820 1,500 11,738 650 1,400 7,085 8,795 4,840 3,100 9,850 18,108 20,720 51,778
Bowfin 0 0 0 0 500 0 0 0 0 0 500 0 500
Brown Bullhead 0 0 0 0 0 0 0 0 0 0 0 0 0
Lake Whitefish 360 150,654 6,593 5,681 104 0 0 0 0 0 163,392 0 163,392
Sunfish 28,130 0 0 0 0 0 0 0 14,600 18,080 28,130 0 60,810
Walleye 1,371 14,903 0 32,219 400 0 0 0 0 0 48,893 0 48,893
Yellow Perch 15,644 60,664 70,788 80,482 5,200 31,150 42,069 18,048 1,120 3,536 232,778 91,267 328,702
Total 48,325 227,721 89,119 119,032 7,604 38,235 50,864 22,888 18,820 31,466 491,801 111,987 654,075
Lake Ontario St. Lawrence River Issued Quota by Waterbody
East
Lake
West
Lake
Species 1-1 1-2 1-3 1-4 1-8 1-5 2-5 1-7 1 1
Lake
Ontario
St.
Lawrence
River
All
Waterbodies
Black Crappie 487 4 5,421 18 0 2,076 568 201 3 2,195 5,930 2,845 10,973
Bowfin 340 0 1,756 29 0 4,569 1,282 234 191 254 2,125 6,085 8,655
Brown Bullhead 13 35 10,014 73 0 149 1,056 14,256 196 24 10,135 15,461 25,816
Common Carp 362 737 2,052 1,587 0 13 0 0 151 328 4,738 13 5,230
Freshwater Drum 4 94 5,304 11,848 0 0 0 0 0 0 17,250 0 17,250
Cisco 3 213 2,692 802 0 1 0 0 0 33 3,710 1 3,744
Lake Whitefish 356 90,521 4,201 474 0 0 0 0 0 0 95,552 0 95,552
Northern Pike 4,015 1,109 17,038 1,742 0 2,692 0 0 813 2,043 23,904 2,692 29,452
Rock Bass 588 386 3,651 1,301 0 555 777 308 950 1,218 5,926 1,640 9,734
Sunfish 2,040 5 31,788 274 0 2,015 641 464 9,401 8,287 34,107 3,120 54,915
Walleye 985 1,644 0 22,748 0 0 0 0 0 0 25,377 0 25,377
White Bass 0 296 129 6,160 0 0 0 0 0 3 6,585 0 6,588
White Perch 6 72 1,370 607 0 33 0 0 224 1,030 2,055 33 3,342
White Sucker 528 1,412 7,877 2,076 0 140 0 0 670 122 11,893 140 12,825
Yellow Perch 1,751 6,066 41,953 36,395 0 9,528 15,348 17,029 472 831 86,165 41,905 129,373
Total 11,478 102,594 135,246 86,134 0 21,771 19,672 32,492 13,071 16,368 335,452 73,935 438,826
St. Lawrence RiverLake Ontario Totals
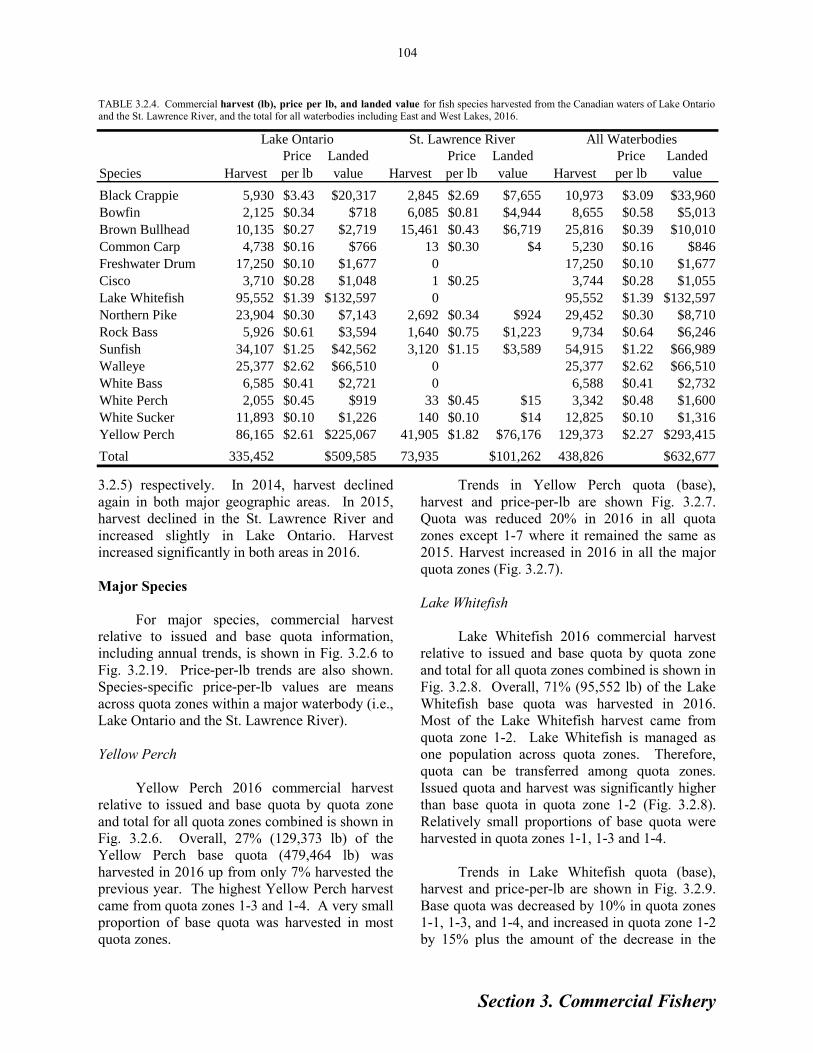
Section 3. Commercial Fishery
104
Trends in Yellow Perch quota (base),
harvest and price-per-lb are shown Fig. 3.2.7.
Quota was reduced 20% in 2016 in all quota
zones except 1-7 where it remained the same as
2015. Harvest increased in 2016 in all the major
quota zones (Fig. 3.2.7).
Lake Whitefish
Lake Whitefish 2016 commercial harvest
relative to issued and base quota by quota zone
and total for all quota zones combined is shown in
Fig. 3.2.8. Overall, 71% (95,552 lb) of the Lake
Whitefish base quota was harvested in 2016.
Most of the Lake Whitefish harvest came from
quota zone 1-2. Lake Whitefish is managed as
one population across quota zones. Therefore,
quota can be transferred among quota zones.
Issued quota and harvest was significantly higher
than base quota in quota zone 1-2 (Fig. 3.2.8).
Relatively small proportions of base quota were
harvested in quota zones 1-1, 1-3 and 1-4.
Trends in Lake Whitefish quota (base),
harvest and price-per-lb are shown in Fig. 3.2.9.
Base quota was decreased by 10% in quota zones
1-1, 1-3, and 1-4, and increased in quota zone 1-2
by 15% plus the amount of the decrease in the
3.2.5) respectively. In 2014, harvest declined
again in both major geographic areas. In 2015,
harvest declined in the St. Lawrence River and
increased slightly in Lake Ontario. Harvest
increased significantly in both areas in 2016.
Major Species
For major species, commercial harvest
relative to issued and base quota information,
including annual trends, is shown in Fig. 3.2.6 to
Fig. 3.2.19. Price-per-lb trends are also shown.
Species-specific price-per-lb values are means
across quota zones within a major waterbody (i.e.,
Lake Ontario and the St. Lawrence River).
Yellow Perch
Yellow Perch 2016 commercial harvest
relative to issued and base quota by quota zone
and total for all quota zones combined is shown in
Fig. 3.2.6. Overall, 27% (129,373 lb) of the
Yellow Perch base quota (479,464 lb) was
harvested in 2016 up from only 7% harvested the
previous year. The highest Yellow Perch harvest
came from quota zones 1-3 and 1-4. A very small
proportion of base quota was harvested in most
quota zones.
TABLE 3.2.4. Commercial harvest (lb), price per lb, and landed value for fish species harvested from the Canadian waters of Lake Ontario
and the St. Lawrence River, and the total for all waterbodies including East and West Lakes, 2016.
Species Harvest
Price
per lb
Landed
value Harvest
Price
per lb
Landed
value Harvest
Price
per lb
Landed
value
Black Crappie 5,930 $3.43 $20,317 2,845 $2.69 $7,655 10,973 $3.09 $33,960
Bowfin 2,125 $0.34 $718 6,085 $0.81 $4,944 8,655 $0.58 $5,013
Brown Bullhead 10,135 $0.27 $2,719 15,461 $0.43 $6,719 25,816 $0.39 $10,010
Common Carp 4,738 $0.16 $766 13 $0.30 $4 5,230 $0.16 $846
Freshwater Drum 17,250 $0.10 $1,677 0 17,250 $0.10 $1,677
Cisco 3,710 $0.28 $1,048 1 $0.25 3,744 $0.28 $1,055
Lake Whitefish 95,552 $1.39 $132,597 0 95,552 $1.39 $132,597
Northern Pike 23,904 $0.30 $7,143 2,692 $0.34 $924 29,452 $0.30 $8,710
Rock Bass 5,926 $0.61 $3,594 1,640 $0.75 $1,223 9,734 $0.64 $6,246
Sunfish 34,107 $1.25 $42,562 3,120 $1.15 $3,589 54,915 $1.22 $66,989
Walleye 25,377 $2.62 $66,510 0 25,377 $2.62 $66,510
White Bass 6,585 $0.41 $2,721 0 6,588 $0.41 $2,732
White Perch 2,055 $0.45 $919 33 $0.45 $15 3,342 $0.48 $1,600
White Sucker 11,893 $0.10 $1,226 140 $0.10 $14 12,825 $0.10 $1,316
Yellow Perch 86,165 $2.61 $225,067 41,905 $1.82 $76,176 129,373 $2.27 $293,415
Total 335,452 $509,585 73,935 $101,262 438,826 $632,677
St. Lawrence River All WaterbodiesLake Ontario

Section 3. Commercial Fishery
FIG. 3.2.2. Pie-charts showing breakdown of 2016 commercial harvest by species (% by weight) for Lake Ontario (quota zones 1-1,
1-2, 1-3, 1-4 and 1-8), the St. Lawrence River (quota zones 1-5, 2-5
and 1-7), and for East and West Lakes combined.
FIG. 3.2.3. Pie-charts showing breakdown of 2016 commercial harvest by species (% by landed value) for Lake Ontario (quota
zones 1-1, 1-2, 1-3, 1-4 and 1-8), the St. Lawrence River (quota
zones 1-5, 2-5 and 1-7), and for East and West Lakes combined.
105
other three zones. These base quota adjustments
reflected variation in annual harvest performance
among the quota zones. In 2016, an additional
20% of base quota was issued to a “pool” on
November 1.
Seasonal whitefish harvest and biological
attributes (e.g., size and age structure) information
are reported in Section 3.3. Lake Whitefish price-
per-lb declined somewhat in 2016 from peak
levels the previous two years.
Walleye
Walleye 2016 commercial harvest relative
to issued and base quota by quota zone and total
for all quota zones combined is shown in Fig.
3.2.10. Walleye harvest increased in 2016.
Overall, 52% (25,377 lb) of the Walleye base
quota (48,893 lb) was harvested. The highest
Walleye harvest came from quota zone 1-4. Very
small proportions of base quota were harvested in
quota zones 1-1 and 1-2. Walleye (like Lake
Lake Whitefish28%
Yellow Perch26%
Sunfish10%
Walleye8%
Northern Pike7% Freshwater Drum
5%White Sucker
4% Brown Bullhead3%
White Bass2%
Black Crappie2%
Other5%
Other12%
Lake Ontario
Total harvest: 335,452 lb
Yellow Perch44%
Lake Whitefish26%
Walleye13%
Sunfish8% Black Crappie
4%
Northern Pike1%
Rock Bass1%
White Bass1%
Brown Bullhead1%
Freshwater Drum0%
Other1%
Other3%
Lake Ontario
Total value: $509,585
Yellow Perch57%
Brown Bullhead21%
Bowfin8%
Sunfish4%
Black Crappie4% Northern Pike
4%
Rock Bass2%
White Sucker0%
White Perch0%
Common Carp0%
Other0%
St. Lawrence River
Total harvest: 73,935 lb
Yellow Perch75%
Black Crappie8%
Brown Bullhead7%
Bowfin5%
Sunfish3% Rock Bass
1%
Northern Pike1%
White Perch0%
White Sucker0%
Common Carp0%
Other0%
Other0%
St. Lawrence River
Total value $101,263
Sunfish60%
Northern Pike10%
Black Crappie7%
Rock Bass7%
Yellow Perch4%
White Perch4%
White Sucker3%
Common Carp2%
Bowfin2%
Brown Bullhead1%
Other0%
Other5%
East Lake and West Lake
Total harvest: 29,439 lb
Sunfish62%
Black Crappie20%
Yellow Perch9%
Rock Bass4%
Northern Pike2%
White Perch2%
Bowfin1%
Brown Bullhead0%
White Sucker0%
Common Carp0%
Other0%
Other0%
East Lake and West Lake
Total value: $34,683

Section 3. Commercial Fishery
106
FIG. 3.2.4. Total commercial fishery harvest and value for Lake Ontario (Quota Zones 1-1, 1-2, 1-3 ,1-4 and 1-8) 1993-2016.
FIG. 3.2.5. Total commercial fishery harvest and value for the St. Lawrence River (Quota Zones 1-5, 2-5 and 1-7), 1993-2016.
Whitefish) is managed as one fish population
across quota zones. Therefore, quota can be
transferred among quota zones 1-1, 1-2 and 1-4.
In 2016, this resulted in issued quota and harvest
being considerably higher than base quota in
quota zone 1-4 (Fig. 3.2.10).
Trends in Walleye quota (base), harvest
and price-per-lb are shown in Fig. 3.2.11. Quota
has remained constant since the early 2000s (just
under 50,000 lb for all quota zones combined).
Walleye price-per-lb has been trending higher for
the last number of years.
Black Crappie
Black Crappie 2016 commercial harvest
relative to issued and base quota by quota zone
$0
$200,000
$400,000
$600,000
$800,000
$1,000,000
$1,200,000
$1,400,000
$1,600,000
-
200,000
400,000
600,000
800,000
1,000,000
1,200,000
1,400,000
1,600,000
1993 1995 1997 1999 2001 2003 2005 2007 2009 2011 2013 2015
Va
lue
($)
Ha
rve
st
(lb
)Lake Ontario
Harvest
Value
$0
$50,000
$100,000
$150,000
$200,000
$250,000
$300,000
$350,000
$400,000
$450,000
$500,000
-
50,000
100,000
150,000
200,000
250,000
300,000
350,000
400,000
450,000
500,000
1993 1995 1997 1999 2001 2003 2005 2007 2009 2011 2013 2015
Va
lue
($)
Ha
rve
st
(lb
)
St. Lawrence River
Harvest
Value

Section 3. Commercial Fishery
FIG. 3.2.6. Yellow Perch commercial harvest relative to issued and base quota (total for all quota zones combined; left panel) and by quota zone (right panel), 2016.
FIG. 3.2.7. Commercial base quota, harvest and price-per-lb for Yellow Perch in Quota Zones 1-2, 1-3, 1-4, 1-5, 2-5 and 1-7, 1993-2016.
107
0
20,000
40,000
60,000
80,000
100,000
120,000
140,000
1-1 1-2 1-3 1-4 1-8 1-5 2-5 1-7 EastLake
WestLake
Lake Ontario St. Lawrence River Inland LakesH
arv
est/
Qu
ota
(lb
)
Yellow Perch
Base Quota
Issued Quota
Harvest
129,373
0
100,000
200,000
300,000
400,000
500,000
600,000
Total
Harv
est/
Qu
ota
(lb
)
Yellow Perch
27%
39%
0.00
0.50
1.00
1.50
2.00
2.50
3.00
-
20,000
40,000
60,000
80,000
100,000
120,000
140,000
160,000
180,000
200,000
1993 1995 1997 1999 2001 2003 2005 2007 2009 2011 2013 2015
Pric
e p
er lb
($)
Qu
ota
or
Harv
est
(lb
)
Quota Zone 1-2 Yellow Perch
Harvest Quota Price-per-lb
0.00
0.50
1.00
1.50
2.00
2.50
3.00
-
20,000
40,000
60,000
80,000
100,000
120,000
1993 1995 1997 1999 2001 2003 2005 2007 2009 2011 2013 2015
Pric
e p
er lb
($)
Qu
ota
or
Harv
est
(lb
)
Quota Zone 1-3 Yellow Perch
Harvest Quota Price-per-lb
0.00
0.50
1.00
1.50
2.00
2.50
3.00
-
20,000
40,000
60,000
80,000
100,000
120,000
140,000
1993 1995 1997 1999 2001 2003 2005 2007 2009 2011 2013 2015
Pric
e p
er lb
($)
Qu
ota
or
Harv
est
(lb
)
Quota Zone 1-4 Yellow Perch
Harvest Quota Price-per-lb
0.00
0.50
1.00
1.50
2.00
2.50
3.00
-
10,000
20,000
30,000
40,000
50,000
60,000
70,000
80,000
1993 1995 1997 1999 2001 2003 2005 2007 2009 2011 2013 2015
Pric
e p
er lb
($)
Qu
ota
or
Ha
rve
st (l
b)
Quota Zone 1-5 Yellow Perch
Harvest Quota Price-per-lb
0.00
0.50
1.00
1.50
2.00
2.50
3.00
-
20,000
40,000
60,000
80,000
100,000
120,000
1993 1995 1997 1999 2001 2003 2005 2007 2009 2011 2013 2015
Pric
e p
er lb
($)
Qu
ota
or
Harv
est
(lb
)
Quota Zone 2-5 Yellow Perch
Harvest Quota Price-per-lb
0.00
0.50
1.00
1.50
2.00
2.50
3.00
-
5,000
10,000
15,000
20,000
25,000
30,000
1993 1995 1997 1999 2001 2003 2005 2007 2009 2011 2013 2015
Pric
e p
er lb
($)
Qu
ota
or
Harv
est
(lb
)
Quota Zone 1-7 Yellow Perch
Harvest Quota Price-per-lb
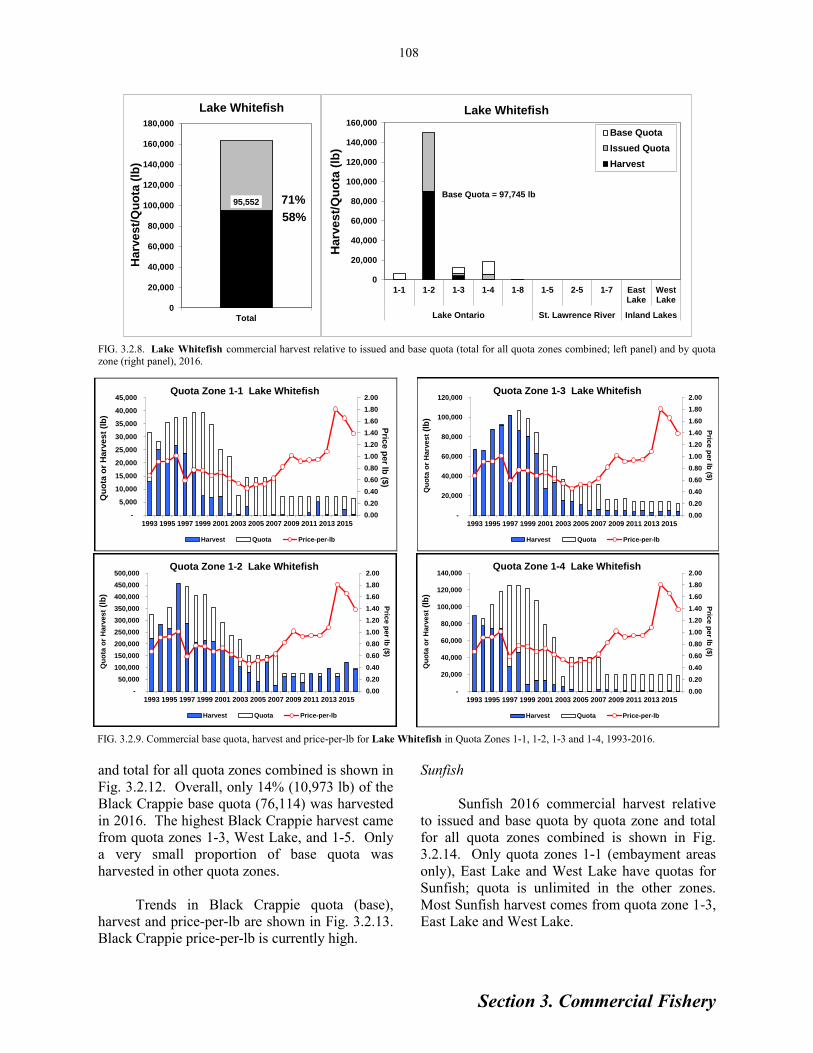
Section 3. Commercial Fishery
FIG. 3.2.8. Lake Whitefish commercial harvest relative to issued and base quota (total for all quota zones combined; left panel) and by quota zone (right panel), 2016.
FIG. 3.2.9. Commercial base quota, harvest and price-per-lb for Lake Whitefish in Quota Zones 1-1, 1-2, 1-3 and 1-4, 1993-2016.
108
Sunfish
Sunfish 2016 commercial harvest relative
to issued and base quota by quota zone and total
for all quota zones combined is shown in Fig.
3.2.14. Only quota zones 1-1 (embayment areas
only), East Lake and West Lake have quotas for
Sunfish; quota is unlimited in the other zones.
Most Sunfish harvest comes from quota zone 1-3,
East Lake and West Lake.
and total for all quota zones combined is shown in
Fig. 3.2.12. Overall, only 14% (10,973 lb) of the
Black Crappie base quota (76,114) was harvested
in 2016. The highest Black Crappie harvest came
from quota zones 1-3, West Lake, and 1-5. Only
a very small proportion of base quota was
harvested in other quota zones.
Trends in Black Crappie quota (base),
harvest and price-per-lb are shown in Fig. 3.2.13.
Black Crappie price-per-lb is currently high.
0
20,000
40,000
60,000
80,000
100,000
120,000
140,000
160,000
1-1 1-2 1-3 1-4 1-8 1-5 2-5 1-7 EastLake
WestLake
Lake Ontario St. Lawrence River Inland Lakes
Harv
est/
Qu
ota
(lb
)
Lake Whitefish
Base Quota
Issued Quota
Harvest
Base Quota = 97,745 lb95,552
0
20,000
40,000
60,000
80,000
100,000
120,000
140,000
160,000
180,000
Total
Harv
est/
Qu
ota
(lb
)
Lake Whitefish
58%
71%
0.00
0.20
0.40
0.60
0.80
1.00
1.20
1.40
1.60
1.80
2.00
-
50,000
100,000
150,000
200,000
250,000
300,000
350,000
400,000
450,000
500,000
1993 1995 1997 1999 2001 2003 2005 2007 2009 2011 2013 2015
Pric
e p
er lb
($)
Qu
ota
or
Harv
est
(lb
)
Quota Zone 1-2 Lake Whitefish
Harvest Quota Price-per-lb
0.00
0.20
0.40
0.60
0.80
1.00
1.20
1.40
1.60
1.80
2.00
-
5,000
10,000
15,000
20,000
25,000
30,000
35,000
40,000
45,000
1993 1995 1997 1999 2001 2003 2005 2007 2009 2011 2013 2015
Pric
e p
er lb
($)
Qu
ota
or
Harv
es
t (l
b)
Quota Zone 1-1 Lake Whitefish
Harvest Quota Price-per-lb
0.00
0.20
0.40
0.60
0.80
1.00
1.20
1.40
1.60
1.80
2.00
-
20,000
40,000
60,000
80,000
100,000
120,000
1993 1995 1997 1999 2001 2003 2005 2007 2009 2011 2013 2015
Pric
e p
er lb
($)
Qu
ota
or
Harv
est
(lb
)
Quota Zone 1-3 Lake Whitefish
Harvest Quota Price-per-lb
0.00
0.20
0.40
0.60
0.80
1.00
1.20
1.40
1.60
1.80
2.00
-
20,000
40,000
60,000
80,000
100,000
120,000
140,000
1993 1995 1997 1999 2001 2003 2005 2007 2009 2011 2013 2015
Pric
e p
er lb
($)
Qu
ota
or
Harv
est
(lb
)
Quota Zone 1-4 Lake Whitefish
Harvest Quota Price-per-lb

Section 3. Commercial Fishery
FIG. 3.2.10. Walleye commercial harvest relative to issued and base quota (total for all quota zones combined; left panel) and by quota zone (right panel), 2016.
FIG. 3.2.11. Commercial base quota, harvest and price-per-lb for Walleye in Quota Zones 1-1, 1-2 and 1-4, 1993-2016.
109
Fig. 3.2.16. Quota was removed in quota zones 1-
1, East Lake and West Lake in 2016 and is now
unlimited in all zones. Highest Brown Bullhead
harvest came from quota zone 1-7.
Trends in Brown Bullhead quota (base),
harvest and price-per-lb are shown in Fig. 3.2.17.
With the exception of quota zone 1-7, current
harvest levels are extremely low relative to past
levels.
Northern Pike
Northern Pike 2016 commercial harvest by
quota zone is shown in Fig. 3.2.18. Highest pike
harvest came from quota zone 1-3.
Trends in Northern Pike harvest and price-
per-lb are shown in Fig. 3.2.19. In 2016, harvest
increased in all quota zones except 1-4 and 1-5.
Trends in Sunfish quota (base), harvest and
price-per-lb are shown in Fig. 3.2.15. In 2016,
harvest increased in quota zone 1-3. Sunfish price
-per-lb is currently high.
Brown Bullhead
Brown Bullhead 2016 commercial harvest
relative to issued and base quota by quota zone
and total for all quota zones combined is shown in
0
5,000
10,000
15,000
20,000
25,000
30,000
35,000
40,000
1-1 1-2 1-3 1-4 1-8 1-5 2-5 1-7 EastLake
WestLake
Lake Ontario St. Lawrence River Inland LakesH
arv
es
t/Q
uo
ta (
lb)
Walleye
Base Quota
Issued Quota
Harvest
Base Quota = 9452 lb
25,377
0
10,000
20,000
30,000
40,000
50,000
60,000
Total
Ha
rve
st/
Qu
ota
(lb
)
Walleye
52%
0.00
0.50
1.00
1.50
2.00
2.50
3.00
-
1,000
2,000
3,000
4,000
5,000
6,000
7,000
8,000
1993 1995 1997 1999 2001 2003 2005 2007 2009 2011 2013 2015
Pric
e p
er lb
($)
Qu
ota
or
Harv
es
t (l
b)
Quota Zone 1-1 Walleye
Harvest Quota Price-per-lb
0.00
0.50
1.00
1.50
2.00
2.50
3.00
-
10,000
20,000
30,000
40,000
50,000
60,000
70,000
1993 1995 1997 1999 2001 2003 2005 2007 2009 2011 2013 2015
Pric
e p
er lb
($)
Qu
ota
or
Harv
est (l
b)
Quota Zone 1-2 Walleye
Harvest Quota Price-per-lb
0.00
0.50
1.00
1.50
2.00
2.50
3.00
-
5,000
10,000
15,000
20,000
25,000
30,000
1993 1995 1997 1999 2001 2003 2005 2007 2009 2011 2013 2015
Pric
e p
er lb
($)
Qu
ota
or
Harv
est
(lb
)
Quota Zone 1-4 Walleye
Harvest Quota Price-per-lb

Section 3. Commercial Fishery
FIG. 3.2.12. Black Crappie commercial harvest relative to issued and base quota (total for all quota zones combined; left panel) and by quota zone (right panel), 2016.
FIG. 3.2.13. Commercial base quota, harvest and price-per-lb for Black Crappie in Quota Zones 1-1, 1-3, 1-5, 2-5, 1-7 and West Lake, 1993-2016.
110
0
2,000
4,000
6,000
8,000
10,000
12,000
14,000
16,000
18,000
20,000
1-1 1-2 1-3 1-4 1-8 1-5 2-5 1-7 EastLake
WestLake
Lake Ontario St. Lawrence River Inland LakesH
arv
est/
Qu
ota
(lb
)
Black Crappie
Base Quota
Issued Quota
Harvest
10,973
0
10,000
20,000
30,000
40,000
50,000
60,000
70,000
80,000
Total
Harv
est/
Qu
ota
(lb
)
Black Crappie
21%
14%
0.00
0.50
1.00
1.50
2.00
2.50
3.00
3.50
4.00
-
500
1,000
1,500
2,000
2,500
3,000
3,500
4,000
4,500
5,000
1993 1995 1997 1999 2001 2003 2005 2007 2009 2011 2013 2015
Pric
e p
er lb
($)
Qu
ota
or
Harv
es
t (l
b)
Quota Zone 1-1 Black Crappie
Harvest Quota Price-per-lb
0.00
0.50
1.00
1.50
2.00
2.50
3.00
3.50
4.00
-
2,000
4,000
6,000
8,000
10,000
12,000
14,000
16,000
18,000
1993 1995 1997 1999 2001 2003 2005 2007 2009 2011 2013 2015
Pric
e p
er lb
($)
Qu
ota
or
Harv
est
(lb
)
Quota Zone 1-3 Black Crappie
Harvest Quota Price-per-lb
0.00
0.50
1.00
1.50
2.00
2.50
3.00
-
5,000
10,000
15,000
20,000
25,000
30,000
35,000
1993 1995 1997 1999 2001 2003 2005 2007 2009 2011 2013 2015
Pric
e p
er lb
($)
Qu
ota
or
Harv
est (l
b)
Quota Zone 1-5 Black Crappie
Harvest Quota Price-per-lb
0.00
0.50
1.00
1.50
2.00
2.50
3.00
-
5,000
10,000
15,000
20,000
25,000
30,000
1993 1995 1997 1999 2001 2003 2005 2007 2009 2011 2013 2015
Pric
e p
er lb
($)
Qu
ota
or
Harv
es
t (l
b)
Quota Zone 2-5 Black Crappie
Harvest Quota Price-per-lb
0.00
0.50
1.00
1.50
2.00
2.50
3.00
-
1,000
2,000
3,000
4,000
5,000
6,000
7,000
1993 1995 1997 1999 2001 2003 2005 2007 2009 2011 2013 2015
Pric
e p
er lb
($)
Qu
ota
or
Harv
es
t (l
b)
Quota Zone 1-7 Black Crappie
Harvest Quota Price-per-lb
0.00
0.50
1.00
1.50
2.00
2.50
3.00
3.50
4.00
-
2,000
4,000
6,000
8,000
10,000
12,000
1993 1995 1997 1999 2001 2003 2005 2007 2009 2011 2013 2015
Pric
e p
er lb
($)
Qu
ota
or
Harv
est
(lb
)
Quota Zone West Lake Black Crappie
Harvest Quota Price-per-lb

Section 3. Commercial Fishery
FIG. 3.2.14. Sunfish commercial harvest relative to issued and base quota for quota zones 1-1, East Lake and West Lake, 2016. The remaining quota zones have unlimited quota.
FIG. 3.2.15. Commercial base quota, harvest and price-per-lb for Sunfish in Quota Zones 1-1, 1-3, 1-4, 1-5, 2-5 and 1-7, East Lake and West Lake, 1993-2016.
111
0.00
0.20
0.40
0.60
0.80
1.00
1.20
1.40
-
5,000
10,000
15,000
20,000
25,000
30,000
1993 1995 1997 1999 2001 2003 2005 2007 2009 2011 2013P
rice
pe
r lb ($
)
Qu
ota
or
Ha
rve
st
(lb
)
Quota Zone 1-1 Sunfish
Harvest Quota Price-per-lb
0.00
0.20
0.40
0.60
0.80
1.00
1.20
1.40
-
10,000
20,000
30,000
40,000
50,000
60,000
70,000
80,000
90,000
100,000
1993 1995 1997 1999 2001 2003 2005 2007 2009 2011 2013
Pric
e p
er lb
($)H
arv
est
(lb
)
Quota Zone 1-3 Sunfish
Harvest Price-per-lb
0.00
0.20
0.40
0.60
0.80
1.00
1.20
1.40
-
200
400
600
800
1,000
1,200
1,400
1,600
1,800
2,000
1993 1995 1997 1999 2001 2003 2005 2007 2009 2011 2013
Pric
e p
er lb
($)H
arv
est
(lb
)
Quota Zone 1-4 Sunfish
Harvest Price-per-lb
0.00
0.20
0.40
0.60
0.80
1.00
1.20
1.40
1.60
-
10,000
20,000
30,000
40,000
50,000
60,000
70,000
80,000
1993 1995 1997 1999 2001 2003 2005 2007 2009 2011 2013
Pric
e p
er lb
($)H
arv
est (l
b)
Quota Zone 1-5 Sunfish
Harvest Price-per-lb
0.00
0.20
0.40
0.60
0.80
1.00
1.20
1.40
1.60
-
5,000
10,000
15,000
20,000
25,000
30,000
1993 1995 1997 1999 2001 2003 2005 2007 2009 2011 2013
Pric
e p
er lb
($)H
arv
est
(lb
)
Quota Zone 1-7 Sunfish
Harvest Price-per-lb
0.00
0.20
0.40
0.60
0.80
1.00
1.20
1.40
-
2,000
4,000
6,000
8,000
10,000
12,000
14,000
16,000
18,000
1993 1995 1997 1999 2001 2003 2005 2007 2009 2011 2013
Pric
e p
er lb
($)
Qu
ota
or
Harv
est
(lb
)
East Lake Sunfish
Harvest Quota Price-per-lb
0.00
0.20
0.40
0.60
0.80
1.00
1.20
1.40
-
5,000
10,000
15,000
20,000
25,000
1993 1995 1997 1999 2001 2003 2005 2007 2009 2011 2013
Pric
e p
er lb
($)
Qu
ota
or
Harv
est
(lb
)
West Lake Sunfish
Harvest Quota Price-per-lb
0
5,000
10,000
15,000
20,000
25,000
30,000
35,000
1-1 1-2 1-3 1-4 1-8 1-5 2-5 1-7 EastLake
WestLake
Lake Ontario St. Lawrence River Inland LakesH
arv
est/
Qu
ota
(lb
)
Sunfish
Base Quota
Issued Quota
Harvest
0.00
0.20
0.40
0.60
0.80
1.00
1.20
1.40
1.60
-
5,000
10,000
15,000
20,000
25,000
30,000
35,000
1993 1995 1997 1999 2001 2003 2005 2007 2009 2011 2013
Pric
e p
er lb
($)H
arv
est
(lb
)
Quota Zone 2-5 Sunfish
Harvest Price-per-lb
0.00
0.20
0.40
0.60
0.80
1.00
1.20
1.40
-
5,000
10,000
15,000
20,000
25,000
30,000
1993 1995 1997 1999 2001 2003 2005 2007 2009 2011 2013 2015P
rice
pe
r lb ($
)
Qu
ota
or
Ha
rve
st
(lb
)
Quota Zone 1-1 Sunfish
Harvest Quota Price-per-lb
0.00
0.20
0.40
0.60
0.80
1.00
1.20
1.40
-
10,000
20,000
30,000
40,000
50,000
60,000
70,000
80,000
90,000
100,000
199319951997199920012003200520072009201120132015
Pric
e p
er lb
($)H
arv
est
(lb
)
Quota Zone 1-3 Sunfish
Harvest Price-per-lb
0.00
0.20
0.40
0.60
0.80
1.00
1.20
1.40
-
200
400
600
800
1,000
1,200
1,400
1,600
1,800
2,000
1993 1995 1997 1999 2001 2003 2005 2007 2009 2011 2013 2015
Pric
e p
er lb
($)H
arv
est
(lb
)
Quota Zone 1-4 Sunfish
Harvest Price-per-lb
0.00
0.20
0.40
0.60
0.80
1.00
1.20
1.40
1.60
-
10,000
20,000
30,000
40,000
50,000
60,000
70,000
80,000
1993 1995 1997 1999 2001 2003 2005 2007 2009 2011 2013 2015
Pric
e p
er lb
($)H
arv
est (l
b)
Quota Zone 1-5 Sunfish
Harvest Price-per-lb
0.00
0.20
0.40
0.60
0.80
1.00
1.20
1.40
1.60
-
5,000
10,000
15,000
20,000
25,000
30,000
1993 1995 1997 1999 2001 2003 2005 2007 2009 2011 2013 2015
Pric
e p
er lb
($)H
arv
est
(lb
)
Quota Zone 1-7 Sunfish
Harvest Price-per-lb
0.00
0.20
0.40
0.60
0.80
1.00
1.20
1.40
-
2,000
4,000
6,000
8,000
10,000
12,000
14,000
16,000
18,000
1993 1995 1997 1999 2001 2003 2005 2007 2009 2011 2013 2015
Pric
e p
er lb
($)
Qu
ota
or
Harv
est
(lb
)
East Lake Sunfish
Harvest Quota Price-per-lb
0.00
0.20
0.40
0.60
0.80
1.00
1.20
1.40
-
5,000
10,000
15,000
20,000
25,000
1993 1995 1997 1999 2001 2003 2005 2007 2009 2011 2013 2015
Pric
e p
er lb
($)
Qu
ota
or
Harv
est
(lb
)
West Lake Sunfish
Harvest Quota Price-per-lb
0.00
0.20
0.40
0.60
0.80
1.00
1.20
1.40
1.60
-
5,000
10,000
15,000
20,000
25,000
30,000
35,000
1993 1995 1997 1999 2001 2003 2005 2007 2009 2011 2013 2015
Pric
e p
er lb
($)H
arv
est
(lb
)
Quota Zone 2-5 Sunfish
Harvest Price-per-lb

Section 3. Commercial Fishery
FIG. 3.2.16. Brown Bullhead commercial harvest relative to issued and base quota for quota zones 1-1, East Lake and West Lake, 2016. The remaining quota zones have unlimited quota.
FIG. 3.2.17. Commercial base quota, harvest and price-per-lb for Brown Bullhead in Quota Zones 1-1, 1-3, 1-4, 1-5, 2-5 and 1-7, East Lake and West Lake, 1993-2016.
112
0
2,000
4,000
6,000
8,000
10,000
12,000
14,000
16,000
1-1 1-2 1-3 1-4 1-8 1-5 2-5 1-7 EastLake
WestLake
Lake Ontario St. Lawrence River Inland LakesH
arv
es
t/Q
uo
ta (
lb)
Brown Bullhead
0.00
0.05
0.10
0.15
0.20
0.25
0.30
0.35
0.40
0.45
0.50
-
10,000
20,000
30,000
40,000
1993 1995 1997 1999 2001 2003 2005 2007 2009 2011 2013 2015P
rice
per lb
($)
Qu
ota
or
Harv
es
t (l
b)
Quota Zone 1-1 Brown Bullhead
Harvest Quota Price-per-lb
0.00
0.05
0.10
0.15
0.20
0.25
0.30
0.35
0.40
0.45
0.50
-
20,000
40,000
60,000
80,000
100,000
120,000
140,000
160,000
180,000
1993 1995 1997 1999 2001 2003 2005 2007 2009 2011 2013 2015
Pric
e p
er lb
($)
Harv
est
(lb
)
Quota Zone 1-3 Brown Bullhead
Harvest Price-per-lb
0.00
0.05
0.10
0.15
0.20
0.25
0.30
0.35
0.40
0.45
0.50
-
1,000
2,000
3,000
4,000
5,000
6,000
7,000
8,000
9,000
10,000
1993 1995 1997 1999 2001 2003 2005 2007 2009 2011 2013 2015
Pric
e p
er lb
($)H
arv
est (l
b)
Quota Zone 1-4 Brown Bullhead
Harvest Price-per-lb
0.00
0.10
0.20
0.30
0.40
0.50
0.60
-
10,000
20,000
30,000
40,000
50,000
60,000
1993 1995 1997 1999 2001 2003 2005 2007 2009 2011 2013 2015
Pric
e p
er lb
($)H
arv
est (l
b)
Quota Zone 1-5 Brown Bullhead
Harvest Price-per-lb
0.00
0.10
0.20
0.30
0.40
0.50
0.60
-
5,000
10,000
15,000
20,000
25,000
30,000
35,000
40,000
45,000
1993 1995 1997 1999 2001 2003 2005 2007 2009 2011 2013 2015
Pric
e p
er lb
($)H
arv
est
(lb
)
Quota Zone 2-5 Brown Bullhead
Harvest Price-per-lb
0.00
0.10
0.20
0.30
0.40
0.50
0.60
-
10,000
20,000
30,000
40,000
50,000
60,000
70,000
80,000
90,000
1993 1995 1997 1999 2001 2003 2005 2007 2009 2011 2013 2015
Pric
e p
er lb
($)
Qu
ota
or
Harv
est
(lb
)
Quota Zone 1-7 Brown Bullhead
Harvest Quota Price-per-lb
0.00
0.05
0.10
0.15
0.20
0.25
0.30
0.35
0.40
0.45
0.50
-
2,000
4,000
6,000
8,000
10,000
12,000
14,000
16,000
1993 1995 1997 1999 2001 2003 2005 2007 2009 2011 2013 2015
Pric
e p
er lb
($)
Qu
ota
or
Harv
est
(lb
)
East Lake Brown Bullhead
Harvest Quota Price-per-lb
0.00
0.05
0.10
0.15
0.20
0.25
0.30
0.35
0.40
0.45
0.50
-
5,000
10,000
15,000
20,000
25,000
30,000
1993 1995 1997 1999 2001 2003 2005 2007 2009 2011 2013 2015
Pric
e p
er lb
($)
Qu
ota
or
Harv
est
(lb
)
West Lake Brown Bullhead
Harvest Quota Price-per-lb

Section 3. Commercial Fishery
FIG. 3.2.18. Northern Pike commercial harvest by quota zone, 2016. In quota zones 2-5 and 1-7 no harvest is permitted; all other zones have unlimited quota.
FIG. 3.2.19. Commercial base quota, harvest and price-per-lb for Northern Pike in Quota Zones 1-1, 1-2, 1-3, 1-4, and 1-5, East Lake
and West Lake, 1993-2016.
113
0
2,000
4,000
6,000
8,000
10,000
12,000
14,000
16,000
18,000
1-1 1-2 1-3 1-4 1-8 1-5 2-5 1-7 EastLake
WestLake
Lake Ontario St. Lawrence River Inland LakesH
arv
es
t (l
b)
Northern Pike
Base Quota
Issued Quota
Harvest
0.00
0.05
0.10
0.15
0.20
0.25
0.30
0.35
-
1,000
2,000
3,000
4,000
5,000
6,000
7,000
8,000
1993 1995 1997 1999 2001 2003 2005 2007 2009 2011 2013 2015P
rice
per lb
($)
Qu
ota
or
Harv
es
t (l
b)
Quota Zone 1-1 Northern Pike
Harvest Price-per-lb
0.00
0.05
0.10
0.15
0.20
0.25
0.30
0.35
-
500
1,000
1,500
2,000
2,500
3,000
3,500
4,000
1993 1995 1997 1999 2001 2003 2005 2007 2009 2011 2013 2015
Pric
e p
er lb
($)
Qu
ota
or
Ha
rve
st (l
b)
Quota Zone 1-2 Northern Pike
Harvest Price-per-lb
0.00
0.05
0.10
0.15
0.20
0.25
0.30
0.35
-
5,000
10,000
15,000
20,000
25,000
30,000
1993 1995 1997 1999 2001 2003 2005 2007 2009 2011 2013 2015
Pric
e p
er lb
($)
Qu
ota
or
Harv
est
(lb
)
Quota Zone 1-3 Northern Pike
Harvest Price-per-lb
0.00
0.05
0.10
0.15
0.20
0.25
0.30
0.35
-
500
1,000
1,500
2,000
2,500
3,000
3,500
4,000
4,500
5,000
1993 1995 1997 1999 2001 2003 2005 2007 2009 2011 2013 2015
Pric
e p
er lb
($)
Qu
ota
or
Harv
est
(lb
)
Quota Zone 1-4 Northern Pike
Harvest Price-per-lb
0.00
0.05
0.10
0.15
0.20
0.25
0.30
0.35
0.40
-
2,000
4,000
6,000
8,000
10,000
12,000
14,000
1993 1995 1997 1999 2001 2003 2005 2007 2009 2011 2013 2015
Pric
e p
er lb
($)
Qu
ota
or
Ha
rve
st (l
b)
Quota Zone 1-5 Northern Pike
Harvest Quota Price-per-lb
0.00
0.05
0.10
0.15
0.20
0.25
0.30
0.35
-
500
1,000
1,500
2,000
2,500
3,000
1993 1995 1997 1999 2001 2003 2005 2007 2009 2011 2013 2015
Pric
e p
er lb
($)
Qu
ota
or
Harv
est
(lb
)
East Lake Northern Pike
Harvest Quota Price-per-lb
0.00
0.05
0.10
0.15
0.20
0.25
0.30
0.35
-
1,000
2,000
3,000
4,000
5,000
6,000
7,000
8,000
1993 1995 1997 1999 2001 2003 2005 2007 2009 2011 2013 2015
Pric
e p
er lb
($)
Qu
ota
or
Harv
est
(lb
)
West Lake Northern Pike
Harvest Quota Price-per-lb

Section 3. Commercial Fishery
114
Sampling of commercially harvested Lake
Whitefish for biological information occurs
annually. While total Lake Whitefish harvest can
be determined from commercial fish Daily Catch
Reports (DCRs; see Section 3.2), biological
sampling of the catch is necessary to breakdown
total harvest into size and age-specific harvest.
Age-specific harvest data can then be used in
catch-age modeling to estimate population size
and mortality schedule.
Commercial Lake Whitefish harvest and
fishing effort by gear type, month and quota zone
for 2016 is reported in Table 3.3.1. Most of the
harvest was taken in gill nets, 96% by weight; 4%
of the harvest was taken in impoundment gear.
Ninety-five percent of the gill net harvest
occurred in quota zone 1-2. Forty-six percent of
the gill net harvest in quota zone 1-2 was taken in
November. In quota zone 1-3 most impoundment
gear harvest and effort occurred in October (Table
3.3.1).
Cumulative daily commercial Lake
Whitefish harvest relative to quota ‘milestones’ is
shown in Fig. 3.3.1. About 47,000 lbs were
harvested before November 1, the date on which
an additional 20% of base quota was issued to the
“pool”.
Biological sampling focused on the
November spawning-time gill net fishery on the
south shore of Prince Edward County (quota zone
1-2), and the October/November spawning-time
impoundment gear fishery in the Bay of Quinte
(quota zone 1-3). The Lake Whitefish sampling
design involves obtaining large numbers of length
tally measurements and a smaller length-stratified
sub-sample for more detailed biological sampling
for the lake (quota zone 1-2) and bay (quota zone
1-3) spawning stocks. Whitefish length and age
distribution information is presented in (Fig. 3.3.2
and Fig. 3.3.3). In total, fork length was
measured for 2,476 fish and age was interpreted
using otoliths for 263 fish (Table 3.3.2, Fig. 3.3.2
TABLE 3.3.1. Lake Whitefish harvest (lbs) and fishing effort (yards of gill net or number of impoundment nets) by gear type, month and quota zone. Harvest and effort value in bold italic represent months and quota zones where whitefish biological samples were collected.
3.3 Lake Whitefish Commercial Catch Sampling J. A. Hoyle, Lake Ontario Management Unit
Gear type Month 1-1 1-2 1-3 1-4 1-1 1-2 1-3 1-4
Gill net Jan 128 1,000
Feb
Mar 646 154 5,200 1,400
Apr 293 3,200
May 2,617 5 12,000 480
Jun 8,291 24,130
Jul 17,189 44,520
Aug 7,514 24,760
Sep 6,871 26,080
Oct 3,951 8,000
Nov 356 42,393 39 3,000 31,300 280
Dec 756 117 5,300 1,280
Impoundment Mar 27 77
Apr 3 12
May 3 4 18 3
Jun 5 2
Sep 7 4
Oct 174 20 26 17
Nov 4,044 173
Harvest (lbs) Effort (number of yards or nets)

Section 3. Commercial Fishery
115
TABLE 3.3.2. Age-specific vital statistics of Lake Whitefish sampled and harvested including number aged, number measured for length, and proportion by number of fish sampled, harvest by number and weight (kg), and mean weight (kg) and fork length (mm) of the harvest for quota
zones 1-2 and 1-3, 2016.
Age
(years)
Number
aged
Number
lengthed Proportion Number
Weight
(kg)
Mean
weight
(kg)
Mean
length
(mm)
Age
(years)
Number
aged
Number
lengthed Proportion Number
Weight
(kg)
Mean
weight
(kg)
Mean
length
(mm)
1 - - 0.000 - - 1 - - 0.000 - -
2 1 1 0.001 22 9 0.400 2 0 7 0.008 15 3 0.200
3 - - 0.000 - - 3 1 14 0.015 30 7 0.247 304
4 9 27 0.017 577 419 0.727 405 4 2 11 0.012 23 10 0.453 364
5 3 8 0.005 177 134 0.755 404 5 9 66 0.072 140 103 0.735 401
6 18 272 0.173 5,861 5,684 0.970 441 6 13 62 0.068 131 80 0.611 386
7 11 260 0.166 5,605 5,617 1.002 446 7 32 160 0.176 341 276 0.808 415
8 8 149 0.095 3,221 2,966 0.921 440 8 47 271 0.299 578 521 0.902 433
9 6 83 0.053 1,801 2,331 1.294 499 9 6 20 0.022 44 33 0.766 412
10 20 397 0.254 8,569 12,049 1.406 499 10 13 91 0.100 194 226 1.163 468
11 13 134 0.086 2,897 4,308 1.487 514 11 10 66 0.073 142 175 1.239 474
12 4 24 0.015 511 696 1.363 516 12 3 16 0.017 34 50 1.484 506
13 13 119 0.076 2,558 3,922 1.533 516 13 11 61 0.067 129 212 1.643 525
14 5 51 0.032 1,092 1,336 1.223 492 14 - - 0.000 - -
15 4 10 0.006 214 364 1.703 519 15 3 27 0.029 57 67 1.188 488
16 4 4 0.003 86 153 1.770 16 - - 0.000 - -
17 5 12 0.007 248 444 1.791 528 17 1 3 0.003 6 9 1.417 521
18 4 4 0.003 86 153 1.770 18 2 5 0.006 11 21 1.845 561
19 2 2 0.001 43 76 1.770 19 - - 0.000 - -
20 2 2 0.001 43 76 1.770 20 2 7 0.008 15 24 1.628 537
21 2 2 0.001 43 76 1.770 21 - - 0.000 - -
22 - - 0.000 - - 22 - - 0.000 - -
23 1 7 0.004 144 255 1.770 535 23 3 12 0.013 25 43 1.759 564
24 - - 0.000 - - 24 2 6 0.006 12 23 1.980 576
25 - - 0.000 - - 25 1 5 0.005 10 22 2.262 598
26 - - 0.000 - - 26 - - 0.000 - -
27 - - 0.000 - - 27 - - 0.000 - -
28 - - 0.000 - - 28 - - 0.000 - -
29 - - 0.000 - - 29 - - 0.000 - -
30 - - 0.000 - - 30 - - 0.000 - -
Total 135 1,566 1 33,800 41,060 Total 161 909 1 1,936 1,906
Weighted
mean 1.215
Weighted
mean 0.984
Quota zone 1-2 (Lake stock) Quota zone 1-3 (Bay stock)
Sampled Harvested Sampled Harvested
-
20,000
40,000
60,000
80,000
100,000
120,000
140,000
160,000
01-Jan 01-Feb 01-Mar 01-Apr 01-May 01-Jun 01-Jul 01-Aug 01-Sep 01-Oct 01-Nov 01-Dec
Ha
rve
st
(lb
)
Lake Whitefish Harvest (lb)
Base quota 135,091 lb
Total harvest 95,552 lb
Issued quota 163,392 lb
FIG. 3.3.1. Cumulative daily commercial Lake Whitefish harvest (2016) relative to quota ‘milestones’.

Section 3. Commercial Fishery
and 3.3.3).
Lake Ontario Gill Net Fishery (quota zone 1-2)
The mean fork length and age of Lake
Whitefish harvested during the gill net fishery in
quota zone 1-2 were 479 mm and 9.1 years
respectively (Fig. 3.3.2). Fish ranged from ages 4
-23 years. The most abundant age-classes in the
fishery were aged 6-11 years which together
comprised 83% of the harvest by number (80% by
weight).
Bay of Quinte November Impoundment Gear
Fishery (quota zone 1-3)
Mean fork length and age were 446 mm
and 8.9 years, respectively (Fig. 3.3.3). Fish
ranged from ages 2-25 years. The most abundant
age-classes in the fishery were aged 5-11 years
which together comprised 81% of the harvest by
number (74% by weight).
116
Condition
Lake Whitefish (Bay of Quinte and Lake
Ontario spawning stocks; sexes combined)
relative weight (see Rennie et al. 2008) is shown
in Fig. 3.3.4. Condition declined markedly in
1994 and remained low but stable.
FIG. 3.3.4. Lake Whitefish (Lake Ontario and Bay of Quinte spawning stocks and sexes combined) relative weight (see 1Rennie
et al. 2008), 1990-2016. 1Rennie, M.D. and R. Verdon. 2008. Development and evaluation of condition
indices for the Lake Whitefish. N. Amer. J. Fish. Manage. 28:1270-1293.
60
70
80
90
100
1990 1993 1996 1999 2002 2005 2008 2011 2014
Rela
tive w
eig
ht
(%)
Body Condition
Bay Stock
Lake Stock
FIG. 3.3.2. Size and age distribution (by number) of Lake
Whitefish sampled in quota zone 1-2 during the 2016 commercial
catch sampling program.
FIG. 3.3.3. Size and age distribution (by number) of Lake
Whitefish sampled in quota zone 1-3 during the 2016 commercial
catch sampling program.
0.00
0.02
0.04
0.06
0.08
0.10
0.12
0.14
240 270 300 330 360 390 420 450 480 510 540 570 600
Pro
po
rtio
n o
f h
arv
est
Fork length (mm)
Quota Zone 1-2 (Lake Stock)
Mean fork length =479 mm(n = 1567)
0.00
0.05
0.10
0.15
0.20
0.25
0.30
1 3 5 7 9 11 13 15 17 19 21 23 25 27 29
Pro
po
rtio
n o
f h
arv
est
Age (years)
Quota Zone 1-2 (Lake Stock)
Mean age = 9.1 years(n = 101)
0.00
0.02
0.04
0.06
0.08
0.10
0.12
240 270 300 330 360 390 420 450 480 510 540 570 600
Pro
po
rtio
n o
f h
arv
est
Fork length (mm)
Quota Zone 1-3 (Bay Stock)
Mean fork length =446 mm(n = 909)
0.00
0.05
0.10
0.15
0.20
0.25
0.30
0.35
1 3 5 7 9 11 13 15 17 19 21 23 25 27 29
Pro
po
rtio
n o
f h
arv
est
Age (years)
Quota Zone 1-3 (Bay Stock)
Mean age = 8.9 years(n = 162)

Section 4. Age and Growth Summary
Biological sampling of fish from Lake
Ontario Management Unit field projects routinely
involves collecting and archiving structures used
for such purposes as age interpretation and
validation, origin determination (e.g. stocked
versus wild), life history characteristics and other
features of fish growth. Coded wire tags,
117
embedded in the nose of fish prior to stocking, are
sometimes employed to uniquely identify
individual fish (e.g., to determine stocking
location and year, when recovered). In 2016, a
total of 2,807 structures were processed from 11
different field projects (Table 4.1) and interpreted
from 14 different fish species (Table 4.2)
TABLE 4.1. Project-specific summary of age and growth structures interpreted for age (n=2,807) in support of 11 different Lake Ontario Man-agement Unit field projects, 2016 (CWT, Code Wire Tags).
4. Age and Growth Summary S. Kranzl and J. A. Hoyle, Lake Ontario Management Unit
continued
continued Project Species Structure n
Rainbow Trout Scales 121
Lake Ontario and Bay of Quinte Community Index Gillnetting
Northern Pike Cleithra 16
Walleye Otoliths 407
Lake Whitefish Otoliths 46
Lake Trout Otoliths 530
Chinook CWT 39
Lake Trout CWT 137
Lake Ontario and Bay of Quinte Community Index Trawling
Walleye Otoliths 68
Walleye Scales 128
Cisco Otoliths 9Hamilton Harbour Nearshore
Community Index Netting
Northern Pike Cleithra 12
White Bass Scales 11
Pumpkinseed Scales 15
Bluegill Scales 29
Smallmouth Bass Scales 2
Largemouth Bass Scales 4
Black Crappie Scales 13
Yellow Perch Scales 13
Walleye Otoliths 31
Northern Pike Cleithra 18
Pumpkinseed Scales 31
Bluegill Scales 32
Smallmouth Bass Scales 6
Largemouth Bass Scales 35
Black Crappie Scales 32
Yellow Perch Scales 32
Walleye Otoliths 30
Ganaraska Rainbow Trout Assessment
Upper Bay of Quinte Nearshore Community Index Netting
Northern Pike Cleithra 31
Pumpkinseed Scales 30
Bluegill Scales 13
Smallmouth Bass Scales 4
Largemouth Bass Scales 3
Black Crappie Scales 4
Yellow Perch Scales 29
Northern Pike Cleithra 5
Smallmouth Bass Scales 10
Yellow Perch Scales 140
Walleye Otoliths 17
Chinook Salmon Otoliths 137
Chinook Salmon Otoliths 200
Chinook Salmon Otoliths 70
Commercial Catch Sampling
Lake Whitefish Otoliths 267
Total 2,807
Ganaraska Chinook Assessment and Egg Collection
Credit River Chinook Assessment and Egg Collection
Western Lake Ontario Creel
Lake St. Francis
Toronto Nearshore Community Index Netting
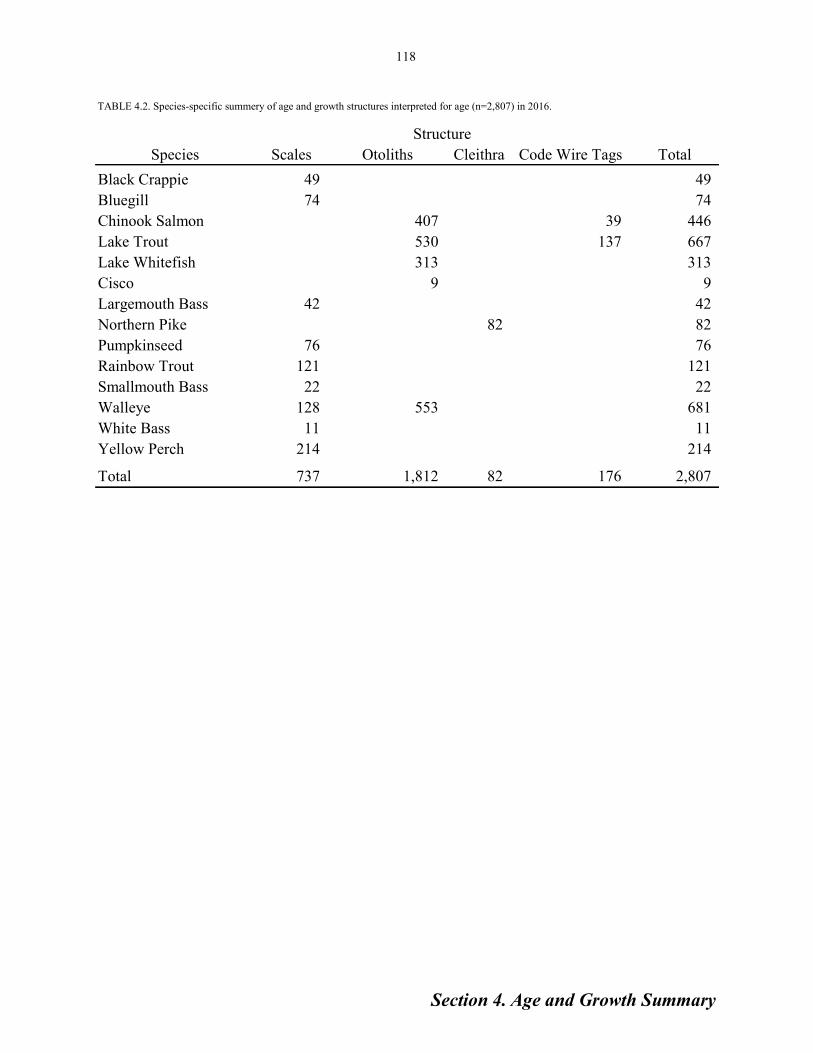
Section 4. Age and Growth Summary
118
TABLE 4.2. Species-specific summery of age and growth structures interpreted for age (n=2,807) in 2016.
Species Scales Otoliths Cleithra Code Wire Tags Total
Black Crappie 49 49
Bluegill 74 74
Chinook Salmon 407 39 446
Lake Trout 530 137 667
Lake Whitefish 313 313
Cisco 9 9
Largemouth Bass 42 42
Northern Pike 82 82
Pumpkinseed 76 76
Rainbow Trout 121 121
Smallmouth Bass 22 22
Walleye 128 553 681
White Bass 11 11
Yellow Perch 214 214
Total 737 1,812 82 176 2,807
Structure

Section 5. Contaminant Monitoring
Lake Ontario Management Unit (LOMU)
cooperates annually with several agencies to collect
fish samples for contaminant testing. In 2016, 293
contaminant samples were collected for Ontario’s
Ministry of the Environment and Climate Change
(MOECC) Guide to Eating Ontario Fish program
(Table 5.1). Samples were primarily collected using
existing fisheries assessment programs on Lake
Ontario, Bay of Quinte and the St. Lawrence. Fig. 5.1
is a map showing locations (“Blocks”) for contaminant
sample collections.
A summary of the number of fish samples
collected by species, for contaminant analysis by the
MOECC from 2000 to 2016 is shown in Table 5.2.
119
TABLE 5.1. Number of fish samples provided to MOECC for contaminant analysis, by region and species, 2016.
5. Contaminant Monitoring S. Kranzl and J. A. Hoyle, Lake Ontario Management Unit
Region Block Species Total
Hamilton Harbour 3 Walleye 30
Northern Pike 8
Smallmouth Bass 2
White Perch 4
Common Carp 10
Toronto Offshore 4 Lake Trout 10
White Sucker 2
Toronto Waterfront 4a Gizzard Shad 6
Northern Pike 10
Yellow Perch 9
White Sucker 8
Pumpkinseed 9
Smallmouth Bass 4
Freshwater Drum 10
Northwest Lake Ontario 6 Lake Trout 8
(Cobourg) White Sucker 1
Gizzard Shad 1
Walleye 2
Northeast Lake Ontario 8 Lake Whitefish 8
(Rocky Point, Wellington, Walleye 10
Brighton) Yellow Perch 10
White Sucker 10
Common Carp 4
Lake Trout 10
Northern Pike 2
Smallmouth Bass 10
Freshwater Drum 1
Lake St. Francis 15 Smallmouth Bass 9
Walleye 14
Yellow Perch 20
Northern Pike 4
Rock Bass 20
Pumpkinseed 6
Freshwater Drum 1
Largemouth Bass 20
Total 293
3. Hamilton Harbour – harbour area 4. Toronto Offshore Area – open water from east of Clark-son Harbour to Scarborough Bluffs 4a. Toronto Waterfront Area – nearshore area from the west side of Humber Bay Park to the east side of Ashbridg-es Bay Park (including Toronto Islands) 6. Northwestern Lake Ontario – from east of Scarborough Bluffs to Colborne 8. Northeastern Lake Ontario – from east of Colborne to south of the area from Main Duck Island across to Point Traverse 15. Lake St. Francis – St. Lawrence River from down-stream of the Moses Saunders Dam to Quebec border
FIG. 5.1. Map showing locations (“Blocks”) for contaminant sample collections.

Section 5. Contaminant Monitoring
120
TABLE 5.2. Summary of the number of fish samples collected, by species, for contaminant analysis by the MOECC, 2000 - 2016.
Year
Species 2000 2001 2002 2003 2004 2005 2006 2007 2008 2009 2010 2011 2012 2013 2014 2015 2016
Black Crappie 20 20 3 20 20 20 29 35 2 14
Bluegill 26 20 10 23 102 88 40 40 3 10
Brown Bullhead 40 44 40 25 30 33 40 68 63 56 81 34 78 53 52
Brown Trout 40 3 20 31 22 6 29 34 34 12 20 6 10 1
Channel Catfish 20 20 7 23 17 8 15 20 4 10
Chinook Salmon 40 3 16 48 29 1 36 39 1 21 6 19 2
Coho Salmon 1 3
Common Carp 7 14
Freshwater Drum 43 16 13 2 32 20 37 42 2 12
Gizzard Shad 7
Lake Herring 18
Lake Trout 42 54 38 17 46 20 33 13 18 20 49 10 28
Lake Whitefish 20 20 17 19 8
Largemouth Bass 4 25 28 20 9 8 89 26 40 28 55 20 11 7 18 20
Northern Pike 53 39 60 22 40 22 94 35 28 31 20 34 47 16 18 24
Pumpkinseed 60 25 57 8 11 23 78 92 105 19 43 31 14 15
Rainbow Smelt 3
Rainbow Trout 40 37 28 20 37 20 29 20 21 20 33 1 22 20
Rock Bass 36 30 38 11 21 27 30 20 40 42 80 5 24 20
Silver Redhorse 1
Smallmouth Bass 20 87 22 21 28 35 23 39 40 31 58 15 19 20 20 25
Walleye 42 51 40 61 30 62 98 61 40 70 71 24 73 59 67 56
White Bass 20
White Perch 40 40 40 14 21 20 35 20 7 40 8 11 4
White Sucker 1 25 7 21
Yellow Perch 20 60 66 58 75 40 86 90 60 91 80 20 44 81 22 20 39
Total 180 445 546 473 482 303 450 628 702 677 589 509 327 545 319 310 293

Section 6. Stocking Program
In 2016, OMNRF stocked approximately
2.3 million salmon and trout into Lake Ontario
(Table 6.1.1; Fig. 6.1.1). This number of fish
equaled approximately 42,600 kilograms of
biomass added to the Lake (Fig. 6.1.1). Fig. 6.1.2
shows stocking trends in the Ontario waters of
Lake Ontario from 1968 to 2016. Table 6.1.2
provides detailed information on fish stocking for
2016.
Approximately 533,000 Chinook Salmon
spring fingerlings were stocked at various
locations to provide put-grow-and-take fishing
opportunities. NYSDEC stocked an additional
60,000 Chinook in the Niagara River to
compensate for an unforeseen production shortfall
in Ontario. These fish are not reported here, so
the total number stocked for 2016 appears slightly
lower than normal. All Chinook Salmon for the
Lake Ontario program were produced at
Normandale Fish Culture Station. About 225,000
(42% of total stocking) Chinook Salmon were
held in pens at eight sites in Lake Ontario for a
short period of time prior to stocking. This
ongoing project is being done in partnership with
121
FIG. 6.1.1. Top panel: number of fish stocked into the Ontario waters of Lake Ontario (excluding fry and eggs in 2016. Total =
2,315,687. Bottom panel: biomass of fish stocked into the Ontario
waters of Lake Ontario (excluding fry and eggs in 2016. Total = 43,552 kg.
TABLE 6.1.1. Fish stocked into the Ontario waters of Lake Ontario for 2016, and targets for 2017.
6. Stocking Program 6.1 Stocking Summary C. Lake , Lake Ontario Management Unit
local angler and community groups. It is hoped
that pen-imprinting will help improve returns of
mature adults to these areas in the fall, thereby
enhancing local near shore and tributary fishing
opportunities. See section 6.2 for a detailed
report of the 2016 net pen program.
Atlantic Salmon were stocked in support of
an ongoing program to restore self-sustaining
populations of this native species to the Lake

Section 6. Stocking Program
122
FIG
. 6
.1.2
. T
ren
ds
in s
alm
on
and
tro
ut
stock
ing i
n O
nta
rio w
ater
s of
Lak
e O
nta
rio, 1
968
-20
16
.

Section 6. Stocking Program
123
Ontario basin (Section 8.2). Approximately
417,000 Atlantic Salmon of various life stages
were stocked in 2016 into various tributaries
including: Credit River, Duffins Creek and
Cobourg Brook. New for 2016, the Ganaraska
River was also stocked with advanced life stages
(spring yearlings and older), with the goal of
establishing a fishery. OMNRF is working
cooperatively with the Ontario Federation of
Anglers and Hunters and a network of other
partners to plan and deliver this phase of Atlantic
Salmon restoration, including setting stocking
targets to help meet program objectives. Atlantic
Salmon are produced at both OMNRF and partner
facilities. Three Atlantic Salmon brood stocks
from different source populations in Nova Scotia,
Quebec and Maine are currently housed at
OMNRF’s Harwood and Normandale Fish
Culture Stations. All fish have been genotyped to
facilitate follow-up assessment on stocked fish
and their progeny in the wild.
Over 500,000 Lake Trout spring yearlings
were stocked in the spring of 2016 as part of an
established, long-term rehabilitation program,
supporting of the Lake Trout Stocking Plan
(Section 8.5). Three strains, originating from
Seneca Lake, Slate Islands and Michipicoten
Island are stocked as part of our annual target. An
additional number of Lake Trout (173,000) were
stocked in the fall of 2016 as fall fingerlings.
This was done in order to meet new Lake Trout
stocking targets in 2017 more quickly.
Approximately 160,000 Bloater were
stocked in 2016. This small relative of the Lake
Whitefish was an important prey item for Lake
Trout until the late 1950’s when both species
were extirpated. A coordinated program
involving staff from the US and Canada resulted
in the initial stocking of approximately 15,000
Bloater being stocked in 2013. MNRF Fish
Culture Section staff continue to work with our
partner agencies to advance our understanding of
the complicated process of rearing Bloater. See
section 8.4 for a detailed description of this
restoration effort.
Rainbow Trout (143,000) and Brown Trout
(218,000) were stocked at various locations to
support shore and boat fisheries. Community
hatcheries contribute to the stocking of both of
these species – see Table 6.1.2 for details. Coho
Salmon were produced by stocking partner Metro
East Anglers (approximately 50,000 fall
fingerlings). Coho Salmon and Rainbow Trout
were also produced by the Credit River Angler’s
Association, but data were not submitted to
MNRF.
Walleye were once again stocked into
Hamilton Harbour in an effort to establish native,
predatory fish to help in the recovery of the fish
community, which is currently dominated by
Channel Catfish and Brown Bullhead.
Approximately 168,000 Walleye fry were stocked
in the spring of 2016, followed by over 115,000
fry stocked in July.
OMNR remains committed to providing
diverse fisheries in Lake Ontario and its
tributaries, based on wild and stocked fish, as
appropriate. Detailed information about
OMNRF’s 2016 stocking activities is found in
Table 6.1.2.
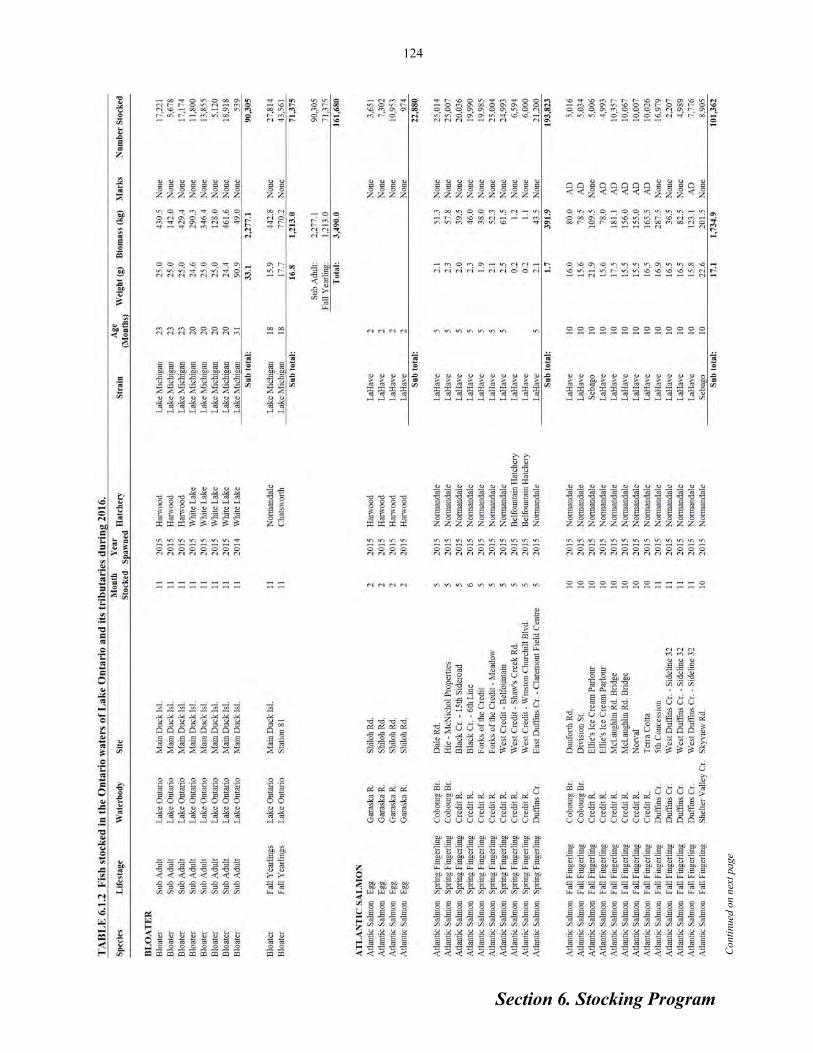
Section 6. Stocking Program
124
Con
tinued
on
nex
t pa
ge

Section 6. Stocking Program
125
Con
tinued
on
nex
t pa
ge

Section 6. Stocking Program
126
Con
tinued
on
nex
t pa
ge

Section 6. Stocking Program
127

Section 6. Stocking Program
6.2 Chinook Salmon Net Pen Imprinting Project C. Lake, Lake Ontario Management Unit
The net pen is a floating enclosure that is
tied to a pier or other nearshore structure, and is
used to temporarily house and acclimatize young
Chinook Salmon prior to their release. The fish
are held in the net pens for approximately 4-5
weeks, and are managed by local angler groups,
who monitor the health of the fish and ensure the
fish are fed and the pens are cleaned regularly.
Several of the clubs also use the net pens as an
outreach tool, involving their local community
during delivery and/or release of the fish.
Compared to fish released directly from the
hatchery, net pen fish are larger, survive better
and may have a greater degree of site fidelity, or
imprinting, to the stocking site based on marking
experiments conducted by the New York
Department of Environmental Conservation
(NYSDEC). As a result of their time in the net
pens as young fish, it is hoped that mature fish
will return to the area and provide a quality near
shore fall fishery for anglers.
Net pens were first used in the Ontario
waters of Lake Ontario in 2003, when pens were
installed in Barcovan and Wellington. Beginning
in 2008, the program expanded west across a
number of locations. The program has evolved
over the years, with some sites dropped while
other sites have been added or expanded. A
thorough review of the history of the program was
described in the 2014 Annual Report.
2016 Net Pen Program
A total of 224,933 Chinook Salmon were
held at 8 sites (17 net pens) in 2016. This
represents 42% of the total number stocked
(533,123; Fig. 6.2.1a). Overall, fish growth and
health was reported as good, with few mortalities.
Fish were delivered to the pens at 3.8g and
weighed 9.45g when released 33 days later
(average values across all pen sites). Table 6.2.1
shows site-specific details on fish size, duration of
penning, and numbers released. Combination
temperature/dissolved oxygen data loggers were
deployed into one net pen per site so that the
health and growth of the fish can be better
understood. Degree days, a metric that
incorporates site temperature and length of time in
the pen, was calculated and included in Table
6.2.1. Examining degree days helps make
between-site comparisons easier when looking at
fish growth.
The net pen program has increased
considerably over the years, with more net pen
FIG. 6.2.1 a) Number of Chinook Salmon released (2003-2016) from net pens versus those stocked traditionally (Ontario data only; New York data not shown); b) Average density (g/l) of Chinook Salmon held per net pen. The guideline of 32 g/l is represented by the dashed line.
128
a) b)

Section 6. Stocking Program
sites and a greater percentage of Chinook Salmon
allocated to the program. In order to ensure good
fish health and growth, a maximum density of 32
g/l (grams of fish per liter of water) is used as a
guide. The volume of the standard net pen is 4000
liters, so the maximum number of 8.0 g fish that
should be held in an individual net pen is 16,000.
TABLE. 6.2.1. Summary data of the 2016 Chinook Salmon net pen program.
129
The Ontario program has taken a
conservative approach, generally stocking a
maximum of 15,000 fish in a pen. Fig.6.2.1b
shows the average density of fish (at time of
release) in the net pens, with the guideline (32 g/l)
denoted by the horizontal dotted line. The average
net pen density has been below the guideline
every year, but has increased in recent years.

Section 7. Stock Status
Chinook salmon were stocked in Lake
Ontario beginning in 1968 to suppress an over-
abundant Alewife population, provide a
recreational fishery and restore predator-prey
balance to the fish community. At present
Chinook Salmon are the most sought after species
in the main basin recreational fishery, which is
supported by a mix of stocked and naturalized
fish. Salmon returning to rivers to spawn also
support important shore and tributary fisheries.
In 2016, Chinook Salmon represented 12%
of the total number of fish stocked and 6% of total
biomass stocked into Lake Ontario by MNRF
(Section 6.1). Ontario’s Chinook Salmon stocking
levels have remained relatively constant since
1985 (500,000 fish target) (Fig. 7.1.1), however
cuts to NY stocking rates were agreed upon
during lake wide cuts in 1996. Despite recent
stable stocking levels, Chinook Salmon CUE in
the Fish Community Index Gill Netting has been
variable, but 2016 showed an increase relative to
2015 (Fig.7.1.2). CUE in 2016 gill nets marks the
first increase in Chinook Salmon catches since
2011 (Fig.7.1.2).
Chinook Salmon mark and tag monitoring
data were reported from five Lake Ontario
Management Unit (LOMU) surveys: i) Western
130
Lake Ontario Boat Angling Survey (Section 2.2),
ii) Chinook Salmon Angling Tournament and
Derby Sampling, iii) Lake Ontario Volunteer
Angler Diary Program (Section 2.3), iv) Eastern
Lake Ontario and Bay of Quinte Fish Community
Index Gill Netting (Section 1.2) and v) Credit
River Chinook Salmon Spawning Index (Section
1.7). Gill nets caught small Chinook Salmon and
complement the angler programs that caught
larger fish (Fig. 7.1.3). 2016 officially marks the
end of the Chinook Salmon CWT study. In
general, the maximum age of a Lake Ontario
Chinook Salmon is 4 years. The last stocking
event related to the Mark and Tag program was in
2011, thus all fish associated with this program
left the Lake Ontario ecosystem in the fall of
2015. New York State Department of
Environmental Conservation (NYSDEC) will be
collaborating with the Lake Ontario Management
Unit in writing a final report on the Chinook
Salmon CWT study in the near future. Currently,
NYSDEC has been stocking Chinook and Coho
7. Stock Status 7.1 Chinook Salmon M. J. Yuille and J. P. Holden, Lake Ontario Management Unit
FIG 7.1.1. Number of Chinook Salmon stocked by New York State Department of Environmental Conservation (NYSDEC) and MNRF
from 1968 – 2016 (Section 6.1).
FIG. 7.1.2. Number of Chinook Salmon caught per gill net (CUE) from the Fish Community Index Gill Netting Program (see Section
1.2) from 1992 – 2016.
1970 1980 1990 2000 2010
0
500
1000
1500
2000
2500
3000
3500
Fis
h S
toc
ke
d (
X 1
00
0)
NYSDEC
OMNRF
0.00
0.25
0.50
0.75
1.00
2000 2010
YEAR
CU
E

Section 7. Stock Status
131
Salmon with adipose clips and CWTs to assess
the effectiveness of net pen stocking. Anglers that
observed fish with an adipose fin clip in 2016
were likely catching fish associated with this
NYSDEC program. Note that Coho Salmon
stocked by MNRF, via Metro East Anglers, also
have adipose clips but do not have CWTs. CWTs
collected from the Chinook Salmon Mark and Tag
program from 2009 to 2015 showed a mixed
population of Chinook Salmon (natural vs.
stocked and New York vs. Ontario fish)
originating from geographically widespread
stocking locations. The mark and tag monitoring
program confirmed that Chinook Salmon returns
to the Credit River tend to originate from fish
stocked in the Credit River with a few strays from
Bronte Creek stocking locations.
Catch per unit effort (CUE), total catch and
total harvest is assessed by the Western Lake
Ontario Boat Fishery (Section 2.2). In 2016, total
effort increased slightly from 2013 (Fig. 7.1.4)
and total catch and harvest were 8% and 9%
above the mean through 1997 to 2016 (Fig. 7.1.5).
Release rates in both the Western Lake Ontario
Boat Fishery and the Lake Ontario Volunteer
Angler Program (Section 2.3) have generally
increased through time (Sections 2.2 and 2.3). In
2016, the release rates in the Western Lake
Ontario Boat Fishery declined to 50% from the
2004 to 2016 average of 59%. Chinook Salmon
release rates reported in the Lake Ontario
Volunteer Angler Program were lower in 2016
(55%) compared to 2015 (68%) and 2014 (65%).
FIG 7.1.3. Size distribution (fork length in mm) of Chinook Salmon caught (a) in the Fish Community Index Gill Netting Program from 1992 – 2016 (Section 1.2) and (b) by anglers in the Western Lake Ontario Angler Survey from 1995 to 2016.
FIG 7.1.4. Catch rate (CUE) of Chinook Salmon and annual total effort (rod-hrs) in the Ontario waters of Lake Ontario (excluding the
Eastern Basin), 1977 to 2016.
Nu
mb
er
of
Fis
h
0 200 400 600 800 1000 1200
0
500
1000
1500
2000 (a)
Fork Length (mm)
Nu
mb
er
of
Fis
h
0 200 400 600 800 1000 1200
0
50
100
150
200 (b)
1980 1990 2000 2010
0.00
0.05
0.10
0.15
0.20
CU
E (
No
./A
ng
-hr)
0
40
80
120
160
Eff
ort
(R
od
-hr
X 1
0,0
00
)
CUE
Effort

Section 7. Stock Status
The condition of Lake Ontario Chinook
Salmon has been evaluated through three separate
LOMU programs: i) Credit River Chinook
Salmon Spawning Assessment (Section 1.7), ii)
Chinook Salmon Tournament Sampling and iii)
Western Lake Ontario Angler Survey (Section
2.2). Chinook Salmon in the Credit River index
have a lower condition relative to fish sampled in
the lake during mid-summer when condition
should be at a maximum. Chinook Salmon
condition, evaluated using data from the Credit
River Chinook Spawning Index Program (Section
1.7) has declined since 1989 (Fig. 7.1.6). In 2012,
Credit River Chinook Salmon condition was the
lowest in the time series. Since 2012, Chinook
Salmon condition in the Credit River has
increased. In contrast, these overall trends were
not observed in either the Western Lake Ontario
Boat Fishery or the tournament sampling (Fig.
7.1.6). Despite the decline in Chinook Salmon
condition from 2011 to 2013 in the Western Lake
Ontario Boat Fishery, the 2016 condition index
increased and is above the long-term 1995 to
2016 average. A similar decline in condition was
observed in Chinook Salmon sampled in
tournaments; however the condition declines
observed in the angler survey and tournament
sampling are subtle relative to observations in the
Credit River condition index (Fig. 7.1.6).
The Lake Ontario Management Unit
continued to sample Chinook Salmon on the
Ganaraska River in 2016 with the goal of
diversifying Chinook Salmon egg collection
sources. In contrast to the Credit River, where
132
adult returns are predominantly stocked fish, adult
Chinook Salmon returning to the Ganaraska River
to spawn are naturalized. In contrast to
observations in 2015, the average fork length of
adults returning to the Ganaraska River was lower
than those returning to the Credit River.
Condition of the Chinook Salmon returning to the
Ganaraska River in 2016 was slightly lower than
2015 and remained below Chinook Salmon
condition on the Credit River. In 2016, average
weight and length of adult Chinook Salmon
returning to the Credit River declined for the third
year in a row (see Section 1.7, Fig. 1.7.1). Despite
this decline in overall size, the condition of these
returning fish has either remained stable (females)
or increased (males) since 2012 (see Section 1.7,
Fig. 1.7.2).
Using Chinook Salmon otoliths, in-year
growth was calculated by measuring the distance
from the last annuli to the outer edge of the
otolith. Chinook Salmon experienced exceptional
in-year growth from 2010 to 2012, followed by a
sharp decline in 2013 (Fig. 7.1.7). In 2014,
Chinook Salmon growth was the second lowest in
the time series, increasing from 2013 levels
(lowest in the 2006-2014 time series), however it
remains below the average growth from 2008
(Fig. 7.1.7). In-year growth was determined to be
correlated with summer water temperatures
(Section 11.1).
Mean summer temperatures for Lake
Ontario were above the long-term average in
2016; a sharp contrast to the 2014 and 2015
FIG 7.1.5. Number of Chinook Salmon caught (closed circle) and harvested (open circle) annually in the Ontario waters of Lake
Ontario (excluding he Eastern Basin), 1977 to 2016. Dashed line
represents the mean catch and harvest from 1997 to 2016.
FIG 7.1.6. Condition index of Chinook Salmon from Credit River Spawning Index (circle), Western Basin Angling Survey (square)
and the Salmon Tournament Sampling (triangle) from 1989 – 2016.
Condition index is the predicted weight (based on a log-log
regression) of a 900 mm total length Chinook Salmon.
1995 2000 2005 2010 2015
6.5
7.0
7.5
8.0
8.5
9.0
9.5
10.0
We
igh
t (k
g)
Credit River Spawning Index
Western Basin Angler Survey
Salmon Tournament Sampling

Section 7. Stock Status
FIG. 7.1.7. Mean in-year growth determined by otolith measurements of age-2 and age-3 Chinook Salmon collected during
the Credit River Spawning Index (Section 1.7).
2008 2009 2010 2011 2012 2013 2014
Year
Below
Average
Above
Salm
on
Gro
wth
seasons, which marked the coldest mean summer
water temperatures recorded since 2002 (see
Section 11.1). In addition, the winter of 2016 was
significantly less severe compared to the previous
two years (see Section 11.1). While, these two
factors may not be the driving force behind
Chinook Salmon growth and condition and catch
per unit effort in the recreational fishery, they
likely have a significant contribution, as cooler
temperatures are associated with lower metabolic
activity and growth.
133

Section 7. Stock Status
The Lake Ontario fish community is a mix
of non-native and remaining native species.
Rainbow Trout, a non-native species, was
intentionally introduced to Lake Ontario in 1968
and has since become naturalized (naturally
reproducing fish). Rainbow Trout are the primary
target for tributary anglers, who take advantage of
the seasonal staging and spawning runs of this
species and are the second most sought-after
species in the Ontario waters of the Lake Ontario
offshore salmon and trout fishery. In addition, the
spring and fall spawning runs attract high
numbers of tourists to local tributaries to watch
these fish jump at fishways and barriers along
their spawning migration. For all of these reasons,
Rainbow Trout are not only ecologically
important to Lake Ontario but recreationally and
economically important as well.
The OMNRF stocks only Ganaraska River
strain Rainbow Trout into Lake Ontario. Rainbow
Trout represent 6.1% of all fish stocked by
number and 6.1% of the biomass into Lake
Ontario by the OMNRF. In 2016, 143,698
Rainbow Trout were stocked, slightly below the
2007 to 2016 average of 164,560 (Fig. 7.2.1).
The spring spawning run of Rainbow Trout
in the Ganaraska River has been estimated at the
fishway at Port Hope since 1974 (see Section
1.1). In 2016, the Rainbow Trout run in the
Ganaraska River declined to 4,987 from 6,669 in
134
2015 and remains below the previous 10 year
average (7,103 fish from 2007 – 2016; Fig. 7.2.2).
The Lake Ontario ecosystem has changed
dramatically during this time series (e.g.,
phosphorus abatement, dreissenid mussel
invasion, round goby invasion). During this time
period (1974 to 2016), Rainbow Trout condition
has declined (Fig. 7.2.3a). With the exceptions of
1994 and 1996, the highest condition values
occurred in the 1970’s, prior to invasion of Zebra
Mussels, Quagga Mussels and Round Goby.
Condition declined through the 1980’s to a low
point in 1987. From 1990 to 2016, the long-term
trend shows slight decline in relative weight. Data
on Rainbow Trout condition over the past 10
years are the most informative for the current
population (Fig. 7.2.3b). Rainbow Trout condition
declined to a low in 2008 then has increased up to
2013, the highest in the whole time series since
1997. In 2015, Rainbow Trout condition declined
significantly, to the lowest point since 1986.
Rainbow Trout condition has remained
unchanged from 2015 to 2016 (Fig. 7.2.3b).
After a sharp increase in catch per unit
effort (CUE) from 1979 to 1984 (the highest in
the 34 year time series), the CUE declined until
2004 in the Western Lake Ontario Boat Fishery
(Fig. 7.2.4). After 2004 (the lowest CUE
since1982), the CUE steadily increased to 2013.
The Lake Ontario Management Unit, did not
7.2 Rainbow Trout M. J. Yuille , Lake Ontario Management Unit
FIG 7.2.1. Number of Rainbow Trout stocked by New York State Department of Environmental Conservation (NYSDEC) and
OMNRF from 1968 – 2016 (see Section 6.1).
FIG 7.2.2. Estimated run of Rainbow Trout at the Ganaraska River fishway at Port Hope, Ontario from 1974 – 2016.
1970 1980 1990 2000 2010
0
500
1000
1500
Fis
h S
toc
ke
d (
X 1
00
0)
NYSDEC
OMNRF
0
5000
10000
15000
20000
Nu
mb
er
of
fish
1975
1980
1985
1990
1995
2000
2005
2010
2015
Estimated
Observed

Section 7. Stock Status
135
evaluate the Western Lake Ontario Boat Fishery
in 2014 or 2015, but Rainbow Trout CUE in 2016
showed a significant decline, falling below the
average CUE for both the full time series (1977-
2016) and the past 10 years (2007 to 2016; Fig.
7.2.4). Effort in this fishery has remained fairly
stable since 1994 (Fig. 7.2.4). Total numbers of
Rainbow Trout caught and harvested in the
Western Lake Ontario Boat Fishery naturally
followed the same trends found in CUE with total
harvest generally lower than total catch (Fig.
7.2.5).
In the fall of 2014, New York anglers
reported and New York State Department of
Environmental Conservation (NYSDEC)
observed disoriented Rainbow Trout in the
Salmon River, New York. After hearing these
reports, the Lake Ontario Management Unit
actively searched for distressed and disoriented
Rainbow Trout in Lake Ontario tributaries,
however, none were observed. Tissues from
distressed Rainbow Trout collected by NYSDEC
contained low levels of Thiamine (Vitamin B1).
Despite not observing distressed Rainbow Trout
in Ontario, it remains uncertain if low Thiamine
levels are having an impact on Rainbow Trout in
Canadian waters.
While the condition of Rainbow Trout in
2016 has not declined from 2015, the number of
fish passing through the Ganaraska Fishway
during the spring spawning run continued to
decline (Figs. 7.2.2 and 7.2.3, see also Section
1.1). It is unknown whether these declines are
related to the Thiamine issues observed in 2014 in
New York, a result of lower than average seasonal
summer temperatures in 2014 and 2015 (Section
11.1), more severe winters in 2013-2014 and 2014
-2015 (see Section 11.1), or below average flows
during the spawning runs (Section 11.4), but it is
likely the combination of multiple factors.
FIG 7.2.3. Relative weight of Rainbow Trout sampled at the Ganaraska River fishway at Port Hope, Ontario for (a) the whole
time series 1974 – 2016 and (b) a 10 year average (2007 – 2016; see
Section 1.1).
FIG 7.2.4. Catch rate (CUE) of Rainbow Trout and total effort (rod-hrs) in the Ontario waters of Lake Ontario (excluding Kingston
Basin), 1977 – 2016.
FIG 7.2.5. Number of Rainbow Trout caught (closed circle) and harvested (open circle) annually by the boat fishery in the Ontario
waters of Lake Ontario (excluding Kingston Basin), 1978 – 2016.
The dashed line represents the mean catch and harvest from 2000 to 2016.
Rela
tive C
on
dit
ion
85
90
95
100
105
110
115
1975
1980
1985
1990
1995
2000
2005
2010
2015
(a)
Rela
tive C
on
dit
ion
85
90
95
100
105
110
115
2007
2008
2009
2010
2011
2012
2013
2014
2015
2016
(b)
1980 1990 2000 2010
0.02
0.04
0.06
0.08
0.10
CU
E (
No
./A
ng
-hr)
0
40
80
120
160
Eff
ort
(R
od
-hr
X 1
0,0
00
)
CUE
Effort

Section 7. Stock Status
Lake Whitefish is a prominent member of
the eastern Lake Ontario cold-water fish
community and an important component of the
local commercial fishery. Two major spawning
stocks are recognized in Canadian waters: one
spawning in the Bay of Quinte and the other in
Lake Ontario proper along the south shore of
Prince Edward County. A third spawning area is
Chaumont Bay in New York State waters of
eastern Lake Ontario.
Commercial Fishery
Lake Whitefish commercial quota and
harvest increased from the mid-1980s through the
mid-1990s, declined through to the mid-2000s
then stabilized at a relatively low level (Fig.
7.3.1). Quota and harvest averaged 120,000 lb
and 80,000 lb respectively, over the 2008-2016
time-period. In 2016, base quota was 135,091 lb,
136
7.3 Lake Whitefish J. A. Hoyle, Lake Ontario Management Unit
FIG. 7.3.2. Lake Whitefish commercial harvest by quota zone, 1993-2016.
FIG. 7.3.1. Lake Whitefish commercial quota and harvest, 1984-2016.
FIG. 7.3.3. Commercial Lake Whitefish gill net fishing effort (top panel), harvest (middle panel), and harvest-per-unit-effort (HUE;
bottom panel) in quota zone 1-2, 1993-2016. “Spawn” includes
November and December, and “Other” includes January through October.
issued quota was 163,392 lb and the harvest was
95,552 lb (Section 3.2). In recent years, most of
the harvest occurs in quota zone 1-2, eastern Lake
Ontario (Fig. 7.3.2). Here, most of the harvest
occurs at spawning time in November and early
December (Fig. 7.3.3). Although harvest at other
times of the year is less than at spawning time,
considerable gill net fishing effort does occur.
Highest harvest rates (HUE) occur at spawning
time.
The age distribution of Lake Whitefish
harvested is comprised of many age-classes (Fig.
7.3.4). Most fish are age-5 to age-13.
Abundance
Lake Whitefish abundance is assessed in a
number of programs. Summer gill net sampling is
used to assess relative abundance of juvenile and
0
50,000
100,000
150,000
200,000
250,000
300,000
350,000
400,000
450,000
1993 1995 1997 1999 2001 2003 2005 2007 2009 2011 2013 2015
Eff
ort
(ya
rds
)
EffortSpawn
Other
0
50,000
100,000
150,000
200,000
250,000
300,000
350,000
400,000
1993 1995 1997 1999 2001 2003 2005 2007 2009 2011 2013 2015
Ha
rve
st
(lb
)
HarvestSpawn
Other
0.0
0.2
0.4
0.6
0.8
1.0
1.2
1.4
1.6
1993 1995 1997 1999 2001 2003 2005 2007 2009 2011 2013 2015
HU
E
HUE Spawn
Other
-
100,000
200,000
300,000
400,000
500,000
600,000
700,000
1993 1995 1997 1999 2001 2003 2005 2007 2009 2011 2013 2015
Harv
est
(lb
)
1-1
1-2
1-3
1-4
-
100,000
200,000
300,000
400,000
500,000
600,000
700,000
800,000
900,000
1984 1987 1990 1993 1996 1999 2002 2005 2008 2011 2014
Qu
ota
or
Ha
rve
st
(lb
)
Year
Lake Whitefish Quota and Harvest
Quota
Harvest

Section 7. Stock Status
adult fish in eastern Lake Ontario (Fig. 7.3.5, and
see Section 1.2). Young-of-the-year (YOY)
abundance is assessed in bottom trawls (Section
1.3) at Conway (lower Bay of Quinte) and Timber
Island (EB03 in eastern Lake Ontario) (Fig.
7.3.5). Lake Whitefish abundance, like
commercial harvest, has been stable at a relatively
low level for the last decade. Young-of-the-year
catches have been variable.
Growth
Trends in length-at-age for Lake Whitefish
caught during summer assessment gill nets for age
-2, age-3, and age-10 (males and females) fish are
shown in Fig. 7.3.6. Generally, fork length-at-age
declined during the 1990s then stabilized in the
early 2000s.
Condition
Trends in Lake Whitefish condition during
summer and fall are shown in Fig. 7.3.7.
Condition was high from 1990-1994, declined
through 1996. Condition then increased to
intermediate levels for Lake Whitefish sampled
during summer but condition remained low for
fish sampled during fall.
FIG. 7.3.4. Lake Whitefish age distributions (by number) in the 2016 quota zones 1-2 (upper panel) and 1-3 (lower panel) fall commercial
fisheries.
FIG. 7.3.5. Lake Whitefish commercial harvest (upper panel). Lake Whitefish abundance in eastern Lake Ontario assessment gill nets,
1958-2016 (sub-adult and adult; middle panel) and bottom trawls,
1972-2016 (young-of-the-year; lower panel).
137
FIG. 7.3.6. Trends in Lake Whitefish fork length-at-age for age-2, age-3, age-10 males and females, caught in summer assessment gill
nets, 1992-2016.
Overall Status
Following severe decline in abundance,
commercial harvest, growth and condition, during
the 1990s, the eastern Lake Ontario Lake
Whitefish population appears to have stabilized at
a much reduced but stable level of abundance, and
condition.
0.0
0.5
1.0
1.5
2.0
2.5
3.0
1958 1963 1968 1973 1978 1983 1988 1993 1998 2003 2008 2013
Ca
tch
pe
r g
ill n
et
Sub-adult and Adult Lake Whitefish (Assessment Gill Nets)
0
100
200
300
400
500
600
700
1958 1963 1968 1973 1978 1983 1988 1993 1998 2003 2008 2013
Co
mm
erc
ial h
arv
es
t (x
10
00
lb
)
Commercial Harvest
0
20
40
60
80
1958 1963 1968 1973 1978 1983 1988 1993 1998 2003 2008 2013
Ca
tch
pe
r tr
aw
l
Young of the year (Assessment Trawls)
0
100
200
300
400
500
600
1992 1995 1998 2001 2004 2007 2010 2013 2016
Fo
rk len
gth
(m
m)
Year
Age-2
Age-3
Age-10 Male
Age-10 Female
0.00
0.05
0.10
0.15
0.20
0.25
0.30
1 3 5 7 9 11 13 15 17 19 21 23 25 27 29
Pro
po
rtio
n o
f h
arv
es
t
Age (years)
Quota Zone 1-2 (Lake Stock)
Mean age = 9.1 years(n = 101)
0.00
0.05
0.10
0.15
0.20
0.25
0.30
0.35
1 3 5 7 9 11 13 15 17 19 21 23 25 27 29
Pro
po
rtio
n o
f h
arv
es
t
Age (years)
Quota Zone 1-3 (Bay Stock)
Mean age = 8.9 years(n = 162)
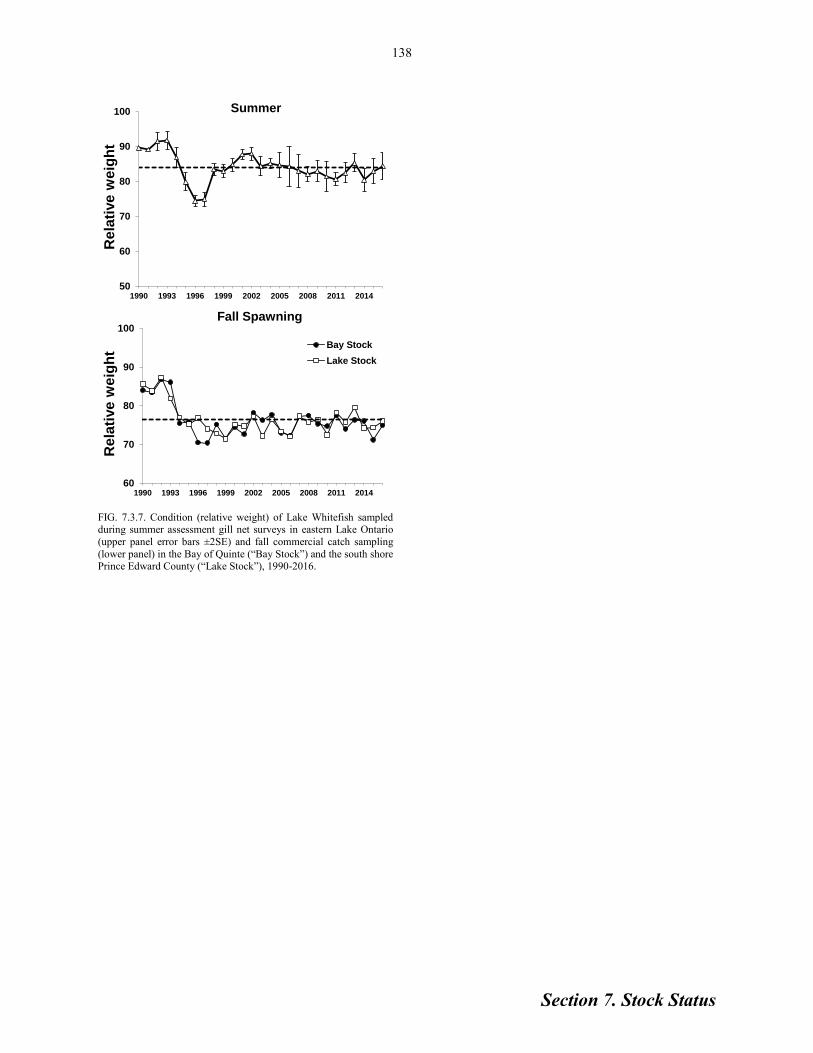
Section 7. Stock Status
FIG. 7.3.7. Condition (relative weight) of Lake Whitefish sampled during summer assessment gill net surveys in eastern Lake Ontario
(upper panel error bars ±2SE) and fall commercial catch sampling
(lower panel) in the Bay of Quinte (“Bay Stock”) and the south shore
Prince Edward County (“Lake Stock”), 1990-2016.
138
60
70
80
90
100
1990 1993 1996 1999 2002 2005 2008 2011 2014
Re
lati
ve w
eig
ht
Fall Spawning
Bay Stock
Lake Stock
50
60
70
80
90
100
1990 1993 1996 1999 2002 2005 2008 2011 2014
Re
lati
ve w
eig
ht
Summer

Section 7. Stock Status
Walleye is the Bay of Quinte fish
community’s primary top piscivore and of major
interest to both commercial (Section 3.2) and
recreational fisheries (Section 2.4). The Walleye
population in the Bay of Quinte and eastern Lake
Ontario is managed as a single large stock. The
Walleye’s life history-specific movement and
migration patterns between the bay and the lake
determines the seasonal distribution patterns of
the fisheries. Understanding Walleye distribution
is also crucial to interpret summer assessment
netting results (Sections 1.2 and 1.3). After
spawning in April, mature Walleye migrate from
the Bay of Quinte toward eastern Lake Ontario to
spend the summer months. These mature fish
return back “up” the bay in the fall to over-winter.
Immature Walleye generally remain in the bay
year-round.
Recreational Fishery
The recreational fishery consists of a winter
ice-fishery and a three season (spring/summer/
139
fall) open-water fishery. Most Walleye harvest
by the recreational fishery occurs in the upper and
middle reaches of the Bay of Quinte during the
winter ice-fishery (Fig. 7.4.1) and the spring/early
summer open-water fishery. All sizes of fish are
caught during winter while mostly juvenile fish
(age-2 and age-3) are caught during spring and
summer. A popular “trophy” Walleye fishery
occurs each fall based on the large, migrating fish
in the middle and lower reaches of the Bay of
Quinte at that time (see Section 2.5). Trends in
the open-water fishery are shown in Fig. 7.4.2
(see also Section 2.4). Annual Walleye angling
effort and catch (ice and open-water fisheries
combined) has been relatively stable averaging
about 330,000 hours and 55,000 fish during the
last decade.
Commercial Fishery
Walleye harvest by the commercial fishery
is highly regulated and restricted. No commercial
Walleye harvest is permitted in the upper and
middle reaches of the bay (Trenton to Glenora).
A relatively modest Walleye commercial quota
7.4 Walleye J. A. Hoyle, Lake Ontario Management Unit
FIG. 7.4.2. Bay of Quinte recreational angling effort and walleye catch (released and harvested) during the open-water fishery, 1988-
2014. No data for 2007, 2009-2011, or 2013-2014.
FIG. 7.4.1. Bay of Quinte recreational angling effort and walleye catch (released and harvested) during the winter ice-fishery, 1988-
2015. No data for 2006, 2008, 2010-2012 or 2015.
FIG. 7.4.4. Walleye commercial harvest by quota zone, 1993-2016.
FIG. 7.4.3. Walleye commercial quota and harvest, 1993-2016.
-
10,000
20,000
30,000
40,000
1993 1995 1997 1999 2001 2003 2005 2007 2009 2011 2013 2015
Harv
est
(lb
)
1-1 1-2 1-4
-
10,000
20,000
30,000
40,000
50,000
60,000
70,000
80,000
90,000
1993 1995 1997 1999 2001 2003 2005 2007 2009 2011 2013 2015
Qu
ota
or
Ha
rve
st
(lb
)
Harvest Quota
-
50,000
100,000
150,000
200,000
250,000
300,000
350,000
400,000
-
10,000
20,000
30,000
40,000
50,000
60,000
1988 1991 1994 1997 2000 2003 2006 2009 2012 2015
An
glin
g e
ffort (h
ou
rs)
Wa
lle
ye
ca
tch
(n
um
be
r)
Released
Harvested
Effort
-
100,000
200,000
300,000
400,000
500,000
600,000
700,000
-
50,000
100,000
150,000
200,000
250,000
300,000
350,000
1988 1991 1994 1997 2000 2003 2006 2009 2012 2015
An
glin
g e
ffort (h
ou
rs)
Wall
eye c
atc
h (
nu
mb
er)
Released
Harvested
Effort

Section 7. Stock Status
140
FIG. 7.4.7. Young-of-the-year Walleye catch per trawl in the Bay of Quinte, 1972-2016.
0
5
10
15
20
1972 1976 1980 1984 1988 1992 1996 2000 2004 2008 2012 2016
Catc
h p
er
traw
l
Year-class
(48,546 lbs; Fig. 7.4.3) is allocated in the lower
Bay of Quinte and Lake Ontario with additional
seasonal, gear, and fish-size restrictions. The
commercial harvest of Walleye was 25,377 lbs in
2016. Commercial Walleye harvest has shifted
location from quota zone 1-2 to 1-4 over the last
decade (Fig. 7.4.4). This shift has likely resulted
in smaller, younger Walleye being harvested but
this has not been measured.
Annual Harvest
Total annual Walleye harvest in the
recreational and commercial fisheries (by number
and weight) over the last decade (2007-2016) is
given in Table 7.4.1. The recreational fishery
takes about 80% of the annual harvest with the
open-water component of the recreational fishery
making up 58% (by number) of total annual
harvest.
Abundance
Walleye abundance is assessed in a number
of programs. Summer gill net sampling (Section
1.2) is used to assess relative abundance of
juvenile (Bay of Quinte) and adult (eastern Lake
Ontario) fish (Fig. 7.4.5). Fig. 7.4.6 shows the
2015 Walleye age distribution in these two
geographic areas. Young-of-the-year (YOY)
abundance is assessed in Bay of Quinte bottom
trawls (Fig. 7.4.7; Section 1.3).
Except for an unusually high catch in 2013,
juvenile abundance in the Bay of Quinte has been
relatively stable since 2001 (Fig. 7.4.5). In
eastern Lake Ontario index gill nets, after an
unusually low catch in 2013, Walleye abundance
in eastern Lake Ontario increased to a level
FIG. 7.4.5. Walleye abundance in summer gill nets in the Bay of Quinte, 1958-2016 (upper panel) and eastern Lake Ontario, 1978-
2016 (lower panel).
similar to that observed in the previous few years
(Fig. 7.4.5). The 2014 catch of YOY Walleye in
bottom trawls was the highest since 1994 (Fig.
7.4.7) and the 2015 year-class was also very large.
The 2016 year-class was of moderate strength.
These recent year-classes foreshadow continued
stability in the Walleye population and fisheries.
Growth
Walleye length-at-age for age-2 and age-3
TABLE 7.4.1. Mean annual Walleye harvest by major fishery over the last decade (2007-2016).
0
20
40
60
80
100
1 2 3 4 5 6 7 8 9 10 11 12 13 14 15 16 17 18 20 22 24
Nu
mb
er
of
Fis
h
Age (years)
Bay of Quinte
0
20
40
60
80
100
1 2 3 4 5 6 7 8 9 10 11 12 13 14 15 16 17 18 20 22 24
Nu
mb
er
of
Fis
h
Age (years)
Lake Ontario
FIG. 7.4.6. Walleye age distribution in 2016 summer gill nets in the
Bay of Quinte (upper panel) and eastern Lake Ontario (lower panel).
0
10
20
30
1958 1962 1966 1970 1974 1978 1982 1986 1990 1994 1998 2002 2006 2010 2014
Ca
tch
pe
r g
ill n
et
Bay of Quinte
0
10
20
30
1958 1962 1966 1970 1974 1978 1982 1986 1990 1994 1998 2002 2006 2010 2014
Ca
tch
pe
r g
ill n
et Eastern Lake Ontario
Pounds
of fish
Number
of fish
% by
weight
% by
number
Commercial 23,080 9,232 22% 20%
Recreational
Open-water Angling 52,548 26,051 50% 58%
Ice Angling 29,393 9,814 28% 22%
Total 105,021 45,097 100% 100%
Annual Walleye Harvest

Section 7. Stock Status
FIG. 7.4.10. Walleye abundance (mean annual number of fish per trap net) in 13 geographic nearshore areas of Lake Ontario and the St. Lawrence River arranged from west (Hamilton Harbour) to east (Lake St. Francis). Catches are annual means for all sampling from 2006-2010
and 2001-2016 time-periods with individual areas having been sampled from one to ten years over the eleven year time-period.
juvenile fish and age-10 mature fish (males and
females separated) is shown in Fig. 7.4.8. Length
-at-age increased for juvenile (age-2 and 3) fish in
2000 and remained stable since. For mature fish
(age-10), length-at-age has remained stable with
females being larger than males.
Condition
Walleye condition (relative weight) is
shown in Fig. 7.4.9. Condition has remained
stable in Bay of Quinte fish (immature) and
showed an increasing trend in Lake Ontario
(mature fish) until 2014 when condition declined
sharply; condition increased in 2015 and held
steady in 2016.
Other Walleye Populations
The Bay of Quinte/eastern Lake Ontario
Walleye population is the largest on Lake
141
FIG. 7.4.8. Trends in Walleye fork length-at-age for age-2, age-3,
age-10 males and females, caught in summer assessment gill nets,
1992-2016.
FIG. 7.4.9. Trends in Walleye condition (relative weight), caught in summer assessment gill nets, 1992-2016.
0
100
200
300
400
500
600
700
1992 1995 1998 2001 2004 2007 2010 2013 2016
Fo
rk l
en
gth
(m
m)
Age-2
Age-3
Age-10 Male
Age-10 Female
Ontario; smaller populations exist in other
nearshore areas of the lake and St. Lawrence
River. Walleye in these other areas are regularly
assessed with a standard trap net program
(Nearshore Community Index Netting; see
Section 1.4). Mean (2006-2016) Walleye trap net
catches in 13 geographic nearshore areas are
shown in Fig. 7.4.10. Highest Walleye abundance
occurs in the Bay of Quinte, East Lake, West
Lake, Weller’s Bay and Hamilton Harbour.
Walleye abundance increased in Hamilton
Harbour following 2012 Walleye stocking efforts
(see Section 8.7).
Overall Status
The overall status of Lake Ontario Walleye
is good. The Bay of Quinte/eastern Lake Ontario
population did decline during the 1990s but
stabilized at levels that still supports a high
quality fishery.
80
85
90
95
100
105
110
1992 1995 1998 2001 2004 2007 2010 2013 2016
Re
lati
ve w
eig
ht
(Wr)
Year
Walleye Condition
Bay of Quinte
Lake Ontario
0
1
2
3
4
5
HamiltonHarbour
TorontoHarbour
Presqu'ileBay
Weller'sBay
WestLake
East Lake PrinceEdward
Bay
UpperBay ofQuinte
MiddleBay ofQuinte
LowerBay ofQuinte
NorthChannelKingston
ThousandIslands
Lake St.Francis
Fis
h p
er
tra
p n
et 2006-2010
2011-2016

Section 7. Stock Status
142
7.5 Northern Pike M. Hanley, Lake Ontario Management Unit
Northern Pike (Esox lucius) are a cool-
water piscivore which are native to Lake Ontario
and the St. Lawrence River. They are most often
associated with shallow, weedy areas of lakes and
rivers and are classified as ambush predators.
Northern Pike are popular sportfish in Lake
Ontario and the St. Lawrence River. In addition,
they have been permitted as a harvested species in
the commercial fishery in the Bay of Quinte and
the Eastern Basin of Lake Ontario beginning in
the fall of 2006 (see Section 3.2). Northern Pike
are an indicator species of water-level changes, as
flooding in the spring initiates spawning due to
improved access to nursery habitat in flooded
marshes and weedy shallow bays. Additionally,
water levels determine offspring survival and
subsequent recruitment. Years with high water
levels that are maintained for a long period of
time are associated with strong year-classes of
Northern Pike.
In assessment gear, Northern Pike are most
often encountered during the Nearshore
Community Index Netting (NSCIN) program (see
Section 1.4). The NSCIN program began in 2001
and is performed annually in the Upper Bay of
Quinte. Additionally, this program is undertaken
in various other locations in Lake Ontario and the
St. Lawrence River on a yearly rotating basis (see
Section 1.4). Catch per unit effort (CUE) of
Northern Pike in NSCIN nets in the Upper Bay of
Quinte from 2013-2015 (0.28 pike/net) had
remained at half of the long term average (0.56
pike/net), but in 2016, CUE (0.53 pike/net) came
very close to this long-term average (Fig. 7.5.1).
A target catch rate of 0.69 fish/net in the NSCIN
program was set in the Bay of Quinte Fisheries
Management Plan (BQFMP) to provide an index
identifying changes in abundance. Similar to
recent years, the CUE of pike in Upper Bay of
Quinte NSCIN nets did not reach this target (Fig.
7.5.1).
Other locations around Lake Ontario and
the St. Lawrence River are also used in the
NSCIN program to assess fish communities
throughout the system. In 2016, the Toronto
Waterfront and Hamilton Harbor locations were
sampled in addition to the Upper Bay of Quinte.
These two Areas of Concern (AOCs) have been
chosen as sampling locations every second year
since 2006 to determine species composition and
abundance in these high profile AOCs. Northern
Pike are often caught in Hamilton Harbour and
Toronto Harbour NSCIN trap nets so these
locations were used to compare average CUE and
average length of pike captured in the Upper Bay
of Quinte (Fig. 7.5.2). In comparing the three
locations, Toronto Waterfront trap nets capture
the most pike and the largest pike when compared
to the other two locations. The Upper Bay of
Quinte captures the smallest and fewest pike,
while Hamilton Harbor is an intermediate type
between the two (Fig. 7.5.2).
Northern Pike are captured in the gill nets
used in the Community Index Netting Program in
the Lake St. Francis region of the St. Lawrence
River (see Section 1.6). Catch per standard gill
net in 2016 was lower than in 2014 and shows a
continued decline in CUE in this area (Fig. 7.5.3).
Pike captured from gill nets are predominantly
large fish (>500 mm) and very few small fish
FIG. 7.5.1. Northern Pike abundance in the Upper Bay of Quinte Nearshore Community Index Netting program 2001-2016 (no
netting in 2006). The dotted line indicates the long-term CUE
average and the solid line represents the BQFMP target CUE.

Section 7. Stock Status
143
(<500 mm) are caught (Fig.7.5.3).
Annual harvest of Northern Pike in
commercial fishery nets in Lake Ontario was
higher in 2016 compared to the two previous
years (Fig. 7.5.4). This trend is consistent with the
CUE increase seen in the NSCIN trap nets in the
Upper Bay of Quinte. As has been the case in
previous years, the majority, 71.3%, of Northern
Pike harvest was reported in the Bay of Quinte,
with only 28.7% of the total harvest reported from
all other areas in Lake Ontario (see Section 3.2).
FIG. 7.5.2. Mean length and mean catch in Nearshore Community Index Netting Program of Northern Pike in three different locations.
Each point represents the mean length and CUE of Northern Pike
through time at each location. Error bars are ±1 standard error.
FIG. 7.5.3.Catch per unit effort of Northern Pike in Community Index gill nets in Lake St. Francis from 1984-2016. Each bar is
divided into small (<500 mm) and large (>500 mm) Northern Pike
CUE.
FIG. 7.5.4. Annual harvest (lbs) of Northern Pike in commercial fishery nets in Lake Ontario, including the Bay of Quinte, from 2006
-2016.

Section 7. Stock Status
144
7.6 Pelagic Prey Fish
J.P. Holden, M.J. Yuille, J.A. Hoyle Lake Ontario Management Unit
B.C. Weidel, M.G. Walsh Lake Ontario Biological Station, USGS
M.J. Connerton Cape Vincent Fisheries Station, NYSDEC
Alewife
Alewife are the dominant prey fish in Lake
Ontario and are the primary prey item for
important pelagic predators (e.g., Chinook
Salmon, Rainbow Trout) as well as other
recreationally important species such as Walleye
and Lake Trout. It is important to monitor
Alewife abundance because significant declines in
their abundances in Lakes Huron and Michigan
lead to concurrent declines in Alewife-dependent
species, such as Chinook Salmon. However,
having Alewife as the principal prey item can lead
to a thiamine deficiency in fish that eat Alewife,
which has been linked to undesirable outcomes
like reproductive failure in Lake Trout as well as
Early Mortality Syndrome (EMS).
The stock status of Alewife as it relates to
predator-prey balance in Lake Ontario requires a
whole-lake assessment. Acoustic estimates
(Section 1.7) are used in conjunction with
estimates derived from the New York State
Department of Environmental Conservation
(NYSDEC) and U.S. Geological Survey (USGS)
spring bottom trawl program that included MNRF
participation for the first time in 2016 (Section
1.11). Index values between acoustic and spring
bottom trawls show differences in year over year
trends. The acoustic index increased in 2016
whereas the bottom trawl index declined (Fig.
7.6.1). While comparisons of these two indices
are ongoing, the difference between the trends in
2016 is most likely related to the sensitivity of
each index to the abundance of age-1 fish. A more
comprehensive analysis of the entire spring trawl
time series is reported in the New York Annual
Report.
Conducting spring trawls lake-wide in 2016
provided several new insights to Alewife
assessment. In contrast to a more even
distribution in the summer (see Section 1.5, Fig.
1.5.8), Alewife are distributed off-shore
FIG. 7.6.1. Alewife abundance through time in the Spring Trawling Index (Age 2 and older Alewife per 10 min trawl ) and the MNRF/
NYSDEC Acoustic survey (whole lake index of Age 1 and older
Alewife, in millions ). Acoustic estimates were not conducted in
1999 and 2010.
0
500
1000
1500
2000
0
1000
2000
3000
4000
Aco
ustic
Sp
ring
Tra
wl
2000 2005 2010 2015
Year
Re
lati
ve
Ab
un
da
nc
e
FIG. 7.6.2. Spatial differences in relative abundance of yearling (age-1) and adult (age-2+) caught in the spring trawl program (Section
1.11). Triangles indicate trawls that did not catch any Alewife.
Circles are scaled relative to the number of Alewife in a 10 min trawl.

Section 7. Stock Status
145
(generally depths > 70m) at the time bottom
trawling was conducted (Fig. 7.6.2). Yearling
(age-1) Alewife appear to have had a more patchy
distribution in 2016 compared to adult Alewife.
Of particular note was a single tow near Toronto
that caught over 40,000 adult Alewife. The size
distribution of Alewife throughout the lake
however shows a similar pattern of low
abundance of Alewife in the 100 to 150mm (TL)
size range which represents the 2013 and 2014
cohorts (Fig. 7.6.3).
The Fish Community Index Gill Netting
(Section 1.2) and Trawling programs (Section
1.3) provide localized trends but may not reflect
whole lake abundance trends due to the relatively
restricted geographical area of these surveys. A
comparison of Acoustics, Trawling and Gill
Netting shows little synchrony in abundance
trends (Fig. 7.6.4) however neither Fish
Community Index Gill Netting nor Trawling are
specifically designed to index Alewife. Of note is
the increasing trend observed in gill nets, which is
not evident in the trawl programs. This trend is
reflective of a change in Alewife size rather than
absolute abundance. Index gill nets are limited in
the size of mesh that effectively target small fish
and are selective for only the largest Alewife,
FIG. 7.6.4. Alewife trend in abundance between acoustic assessment (Section 1.5), gill nets (Section 1.2) and trawls (Section 1.3). Note
that each program provides a relative index on a different scale. The
acoustic index is an index of whole-lake population (in millions). Gill nets are indexed as kg per 24hr net set. Trawls are indexed as kg
per 12 min. tow.
which make up small proportion of the total
population. The trend, while not reflective of
general lake wide abundance, does indicate an
increase in abundance of the largest Alewife. This
may indicate a change in growth or proportional
size structure of the population.
Differences between geographic regions
sampled in Fish Community Index trawling
highlight how Alewife occupy these areas during
the summer months. Data from the past five years
(2011 to 2016) is presented in aggregate to
increase sample size. Shallow depths have the
highest catch numbers (fish/trawl) of Alewife
(Fig. 7.6.5) but are generally sampling small,
often young-of-year (age-0) Alewife (Fig. 7.6.6)
and are generally confined to the Bay of Quinte
(Fig. 7.6.7). Biomass (kg/trawl) is variable with
depth (Fig. 7.6.8) but depths shallower than 50m
tend to have the highest density.
FIG. 7.6.3. Comparison of the size distribution (TL, mm) of Alewife captured in Spring Bottom trawling (Section 1.11) in Canadian (CA)
and American (US) waters in 2016.
500
1000
1500
0
2
4
6
0
500
1000
1500
Aco
ustic
Gill N
et
Tra
wl
2000 2010
Year
Re
lati
ve
Ab
un
da
nc
e

Section 7. Stock Status
Fish body condition quantifies on average
how fat or thin individual fish are within a
population. Changes in condition may indicate
increased competition for food, reduced
availability of food, changes in environmental
conditions or a combination of these factors.
Alewife condition is indexed as the predicted
weight (based on a log-log regression) of a
137mm (TL) fish (Fig. 7.6.9). Recent years (since
2009) have shown greater variability in year to
year changes in condition. The condition index
for 2016 was the second highest of the time series
and the four highest years have all occurred since
2009.
Fig. 7.6.5. Relative abundance (N/10 min tow) of Alewife for each
depth sampled in Fish Community Index Trawling (Section 1.3)
from 2011 to 2016. Symbols indicate the geographic area of the
survey where the depth was sampled (BQ = Bay of Quinte, Lake = Main Lake Basin, KBasin = Kingston Basin).
FIG. 7.6.6. Mean size of Alewife for each depth sampled in Fish Community Index Trawling (Section 1.3) from 2011 to 2016.
Symbols indicate the geographic area of the survey where the depth
was sampled (BQ = Bay of Quinte, Lake = Main Lake Basin, KBasin = Kingston Basin).
146
FIG. 7.6.7. Mean size of Alewife for each area sampled (BQ = Bay
of Quinte, Lake = Main Lake Basin, KBasin = Kingston Basin) in
Fish Community Index Trawling (Section 1.3) from 2011 to 2016.
0
3
6
9
0 50 100
Bottom Depth (m)
N (
x 1
00
0)
pe
r T
raw
l
ZONE
BQ
KBasin
Lake
0
20
40
BQ KBasin Lake
Zone
Me
an
We
igh
t (g
)
FIG. 7.6.8. Relative density (kg/12 min tow) of Alewife for each depth sampled in Fish Community Index Trawling (Section 1.3)
from 2011 to 2016. Symbols indicate the geographic area of the
survey where the depth was sampled (BQ = Bay of Quinte, Lake = Main Lake Basin, KBasin = Kingston Basin).
0
10
20
30
40
50
0 50 100
Bottom Depth (m)
Kg
pe
r T
raw
l
ZONE
BQ
KBasin
Lake
18
21
24
27
2000 2010
Year
Co
nd
itio
n In
de
x
FIG. 7.6.9. Alewife condition, represented as the predicted weight (g, based on a log-log regression) of a 137 mm (total length) Alewife
from the Fish Community Index trawls in the Kingston Basin only
conducted in mid-summer.
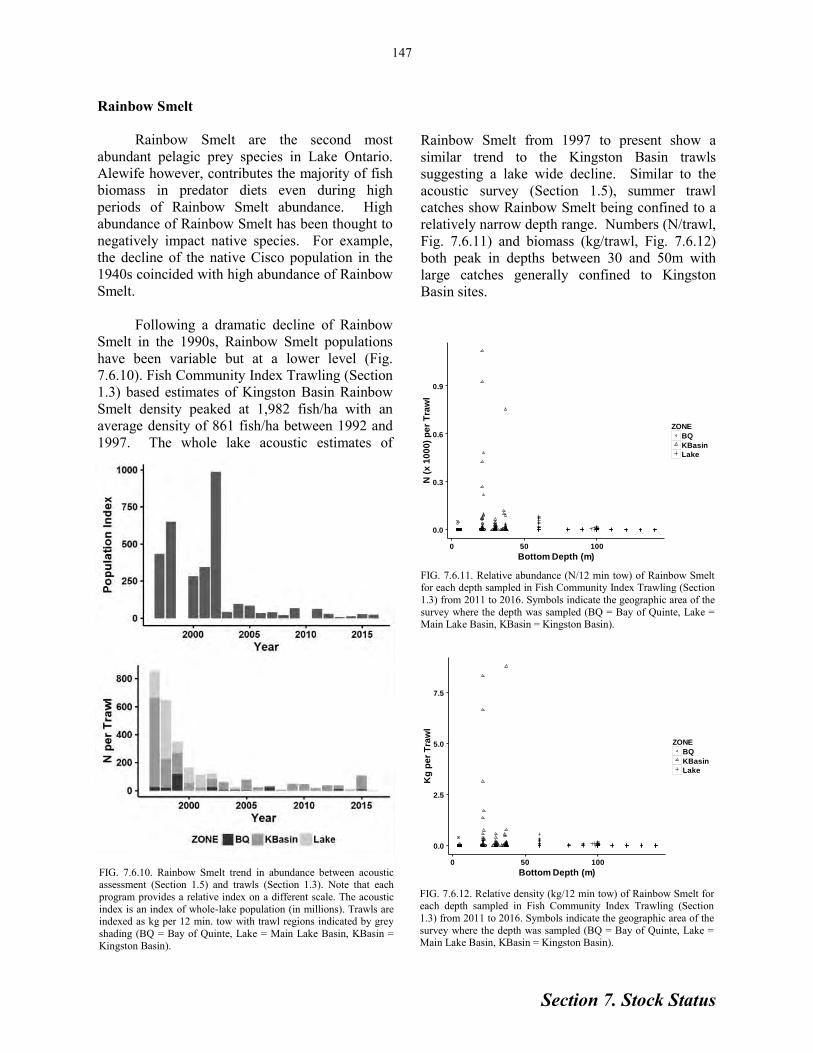
Section 7. Stock Status
Rainbow Smelt
Rainbow Smelt are the second most
abundant pelagic prey species in Lake Ontario.
Alewife however, contributes the majority of fish
biomass in predator diets even during high
periods of Rainbow Smelt abundance. High
abundance of Rainbow Smelt has been thought to
negatively impact native species. For example,
the decline of the native Cisco population in the
1940s coincided with high abundance of Rainbow
Smelt.
Following a dramatic decline of Rainbow
Smelt in the 1990s, Rainbow Smelt populations
have been variable but at a lower level (Fig.
7.6.10). Fish Community Index Trawling (Section
1.3) based estimates of Kingston Basin Rainbow
Smelt density peaked at 1,982 fish/ha with an
average density of 861 fish/ha between 1992 and
1997. The whole lake acoustic estimates of
FIG. 7.6.11. Relative abundance (N/12 min tow) of Rainbow Smelt for each depth sampled in Fish Community Index Trawling (Section
1.3) from 2011 to 2016. Symbols indicate the geographic area of the
survey where the depth was sampled (BQ = Bay of Quinte, Lake = Main Lake Basin, KBasin = Kingston Basin).
147
FIG. 7.6.12. Relative density (kg/12 min tow) of Rainbow Smelt for each depth sampled in Fish Community Index Trawling (Section
1.3) from 2011 to 2016. Symbols indicate the geographic area of the
survey where the depth was sampled (BQ = Bay of Quinte, Lake = Main Lake Basin, KBasin = Kingston Basin).
FIG. 7.6.10. Rainbow Smelt trend in abundance between acoustic assessment (Section 1.5) and trawls (Section 1.3). Note that each
program provides a relative index on a different scale. The acoustic
index is an index of whole-lake population (in millions). Trawls are indexed as kg per 12 min. tow with trawl regions indicated by grey
shading (BQ = Bay of Quinte, Lake = Main Lake Basin, KBasin =
Kingston Basin).
Rainbow Smelt from 1997 to present show a
similar trend to the Kingston Basin trawls
suggesting a lake wide decline. Similar to the
acoustic survey (Section 1.5), summer trawl
catches show Rainbow Smelt being confined to a
relatively narrow depth range. Numbers (N/trawl,
Fig. 7.6.11) and biomass (kg/trawl, Fig. 7.6.12)
both peak in depths between 30 and 50m with
large catches generally confined to Kingston
Basin sites.
0.0
0.3
0.6
0.9
0 50 100
Bottom Depth (m)
N (
x 1
00
0)
pe
r T
raw
lZONE
BQ
KBasin
Lake
0.0
2.5
5.0
7.5
0 50 100
Bottom Depth (m)
Kg
pe
r T
raw
l
ZONE
BQ
KBasin
Lake

Section 7. Stock Status
FIG. 7.7.1. Relative abundance (N/12 min tow) of Round Goby in Fish Community Index Trawling (Section 1.3) from 1992 to 2016.
Symbols indicate the geographic area of the survey where the trawls
were conducted (BQ = Bay of Quinte, KBasin = Kingston Basin).
FIG. 7.7.2. Relative abundance (N/tow) of Round Goby for each depth sampled in Spring Prey Fish Trawling (‘Spring’, Section 1.11),
Fish Community Index Trawling (‘Summer’, Section 1.3) and Fall
Benthic Prey Fish Trawling (‘Fall’, Section 1.12) in 2016. Y-axis ranges vary due to differences in trawling gear and tow times.
148
7.7 Benthic Prey Fish
J.P. Holden, M.J. Yuille, J.A. Hoyle Lake Ontario Management Unit
B.C. Weidel Lake Ontario Biological Station, USGS
M.J. Connerton Cape Vincent Fisheries Station, NYSDEC
general catch observations are appropriate at this
time. There is a shift to deeper waters between
summer and fall in trawl programs (Fig. 7.7.2).
The most notable observation is that Round Goby
were rarely caught during the spring survey. The
trawl configuration we used catches Round Goby
frequently when used in US waters. The sites used
in the spring are also the same trawl sites used in
the fall suggesting it is not purely a habitat issue.
Shallow sites (<80 m) along the north shore of
Lake Ontario have a large number of boulders and
attempts to trawl many of these sites have resulted
in snagged or torn nets. Also, Canadian trawl sites
were sampled to maximum depth of 140 m. It is
possible that Round Goby are occupying these
areas where the trawl survey is not currently
sampling. Future work to identify suitable trawl
sites and alternative methods to sample boulder
rich areas is ongoing.
Round Goby
Round Goby were first documented in Lake
Ontario in 1998 and have since become a
dominant species in the nearshore and offshore
benthic fish community. Round Goby are
nearshore residents during summer, but migrate to
depths up to 150 m during winter, where for half
of the year, it also fills a major component of the
offshore benthic fish community. Round Goby eat
dreissenid mussels extensively, but their prey in
offshore waters also includes freshwater shrimp
(Mysis diluviana) and other invertebrates.
Since first detected in Fish Community
Index Trawling in 2003 (Section 1.3) Round
Goby abundance increased to peak levels in 2010
and has subsequently decreased (Fig. 7.7.1).
Abundance in 2016 increased in both the Bay of
Quinte (BQ) and Kingston Basin (KBasin) trawl
sites. The addition of a fall trawl survey in 2015
(Section 1.11) and spring trawling in 2016
(Section 1.10) allows for a seasonal comparison
of depth movement. Trawl gear (net and doors)
and tow durations differ between programs, so
only comparisons on relative distribution and
0
250
500
750
2000 2010
Year
N p
er
Tra
wl
ZONE BQ KBasin
0
10
20
30
0
250
500
750
1000
1250
0
1000
2000
3000
4000
5000
Sp
ring
Su
mm
er
Fa
ll
0 50 100 150
Bottom Depth (m)
Ca
tch
Pe
r T
raw
l

Section 7. Stock Status
FIG. 7.7.3. Annual mean weight of Round Goby caught in Fish Community Index Trawling (Section 1.3) from 2004 to 2016. Bay of
Quinte (BQ, circles) and Kingston Basin (KBasin, triangles) catches
are reported separately.
FIG. 7.7.4. Relative abundance (N/12 min tow) of Slimy Sculpin in Fish Community Index Trawling (Section 1.3) from 1992 to 2016.
Symbols indicate the geographic area of the survey where the trawls
were conducted (BQ = Bay of Quinte, KBasin = Kingston Basin, Lake = Main Basin).
149
Additional trawl programs in the spring
(Section 1.11) and fall (Section 1.12) have an
emphasis on the offshore habitats and provide
greater insight to the abundance and distribution
of the species. Slimy Sculpin catches in the 2016
fall trawl program show that the distribution is
concentrated in offshore sites around the 100 m
depth contour (Fig. 7.7.5).
The additional main lake trawl transects
and depths added to Fish Community Index
Trawling (Section 1.3) in 2014 show a similar
trend with depth with additional observations at
60m (Fig. 7.7.6 and Fig. 7.7.7). The majority of
the sites shallower than 60 m occur within the
Kingston Basin and the Bay of Quinte; while the
main basin sites shallower than 80 m are
When first detected, the mean size of
Round Goby was quite large. As they became
established, recruitment increased, predator
species began to utilize them as prey and the
mean size declined to relatively stable level since
2010 (Fig. 7.7.3). There is no clear difference in
the size between the Bay of Quinte and the
Kingston Basin suggesting similar recruitment,
survival and predation in both areas. The mean
size observed in both the Bay of Quinte and the
Kingston Basin decreased in 2016 however the
decrease was greater in Kingston Basin.
Slimy Sculpin
By the 1970s, the once diverse native prey
base had largely collapsed with Slimy Sculpin
being one of the last remaining offshore native
prey species. Historically, Slimy Sculpin would
have been the primary prey item for Lake Trout
and even as recently as the mid-1990s this species
was second only to Alewife as the most abundant
prey item consumed by Lake Trout (Section 8.5,
Fig. 8.5.10). The offshore depths that are the core
habitat for Slimy Sculpin however have
historically not been well represented in Fish
Community Index Trawling (Section 1.3) and
catches have typically been quite low (Fig. 7.7.4).
2
4
6
8
2004 2007 2010 2013 2016
Year
Me
an
We
igh
t (g
)
ZONE
BQ
KBasin
0.0
0.3
0.6
0.9
2000 2010
Year
N p
er
Tra
wl
ZONE BQ KBasin Lake
FIG. 7.7.5. Spatial differences in relative abundance in Slimy Sculpin
caught in the Fall Benthic Prey Fish Trawl (Section 1.12) in 2016.
Open circles indicate tows that caught zero Slimy Sculpin. Filled circles are scaled by catch per trawl. The dotted line indicates the 100

Section 7. Stock Status
150
underrepresented in Canadian trawl programs.
While the relative biomass peaks around 100m,
individual fish size increases with depth (Fig.
7.7.8).
Deepwater Sculpin
Deepwater Sculpin were once abundant in
the main basin of Lake Ontario. By the 1970s,
Lake Ontario’s native fish stocks, including
Deepwater Sculpin, had been pushed to near
extinction. After 1972, Deepwater Sculpin had
not been detected in Lake Ontario until 1996,
when one was caught in Fish Community Index
Trawling (Fig. 7.7.9; Section 1.3).
FIG. 7.7.6. Relative abundance (N/12 min tow) of Slimy Sculpin for each depth sampled in Fish Community Index Trawling (‘Summer’,
Section 1.3) from 2011 to 2016. Symbols indicate the geographic
area of the survey where the trawls were conducted (BQ = Bay of Quinte, KBasin = Kingston Basin, Lake = Main Basin).
Since 1996, no Deepwater Sculpin were
collected in Fish Community Index programs
until 2005, when they were collected in the trawls
at Rocky Point. As recently as 2013, catches
FIG. 7.7.7. Relative biomass (kg/12 min tow) of Slimy Sculpin for each depth sampled in Fish Community Index Trawling (‘Summer’,
Section 1.3) from 2011 to 2016. Symbols indicate the geographic
area of the survey where the trawls were conducted (BQ = Bay of Quinte, KBasin = Kingston Basin, Lake = Main Basin).
FIG. 7.7.8. Mean size of Slimy Sculpin for each depth sampled in Fish Community Index Trawling (Section 1.3) from 2011 to 2016.
FIG. 7.7.9. Relative abundance (N/12 min tow) of Deepwater Sculpin in Fish Community Index Gill Nets (top panel, Section 1.2)
and Trawling (bottom panel, Section 1.3) from 2010 to 2016. Gill net
relative abundance is reported as fish per net set and Trawl relative abundance is fish per 12 min tow. Symbols on trawl plot indicate
whether the relative abundance uses only the historic sampling sites
(circles, Rocky Point 60 and 100 m and EB sites) or includes all the sites in recently modified to the sampling protocol (triangles, see
Section 1.3 for details).
0
50
100
150
200
0 50 100
Bottom Depth (m)
N p
er
Tra
wl
ZONE
BQ
KBasin
Lake
0.00
0.25
0.50
0.75
1.00
1.25
0 50 100
Bottom Depth (m)
Kg
pe
r T
raw
l
ZONE
BQ
KBasin
Lake
10
20
0 50 100
Bottom Depth (m)
Me
an
We
igh
t (g
)
0.000
0.005
0.010
0.015
0.020
0
50
100
150
Gill N
et
Tra
wl
2010 2012 2014 2016
Year
Re
lati
ve
Ab
un
da
nc
e
Historic New Depths

Section 7. Stock Status
151
remained relatively low in index gillnets and
trawls. Catches increased first in gillnets in 2013
followed by increased catchs in trawls during
2015. Main lake assessment sites were expanded
in 2014 to include offshore sites at Cobourg and
Port Credit. Subsequently in 2015, the offshore
trawl protocol reduced sampling at the 60 and 100
m sites in favour of adding additional trawl sites
at 10 m depth increments out to 140 m. This
approach parallels the approach utilized in the fall
trawl program (added in 2016, Section 1.12) and
the spring trawl program (added in 2016, Section
1.11). The addition of these sites has increased the
index of abundance for the time series, however,
the increasing trend is still evident when restricted
to the traditional 60 and 100 m Rocky Points sites
(Fig. 7.7.9, bottom panel).
The additional depths sampled beyond 100
m have increased our understanding of the
abundance, distribution and population
demographics of Lake Ontario Deepwater
Sculpin. Deepwater Sculpin are occasionally
caught in Kingston Basin but the core of
Deepwater Sculpin habitat is in depths greater
than 100m (Fig. 7.7.10). The historic 100 m
Rocky Point site is on the shallow edge of the
depths that Deepwater Sculpin inhabit with
abundance and biomass increasing with depth
(Fig. 7.7.11 and Fig. 7.7.12). Both total biomass
and mean size increase with depth (Fig. 7.7.13).
FIG. 7.7.10. Spatial differences in relative abundance in Deepwater Sculpin caught in the Fall Benthic Prey Fish Trawl (Section 1.12) in
2016. Open circles indicate tows that caught zero Slimy Sculpin.
Filled circles are scaled by catch per trawl. The dotted line indicates the 100m bathymetric contour.
FIG. 7.7.11. Relative abundance (N/12 min tow) of Deepwater
Sculpin for each depth sampled in Fish Community Index Trawling
(‘Summer’, Section 1.3) from 2011 to 2016. Symbols indicate the
geographic area of the survey where the trawls were conducted (BQ = Bay of Quinte, KBasin = Kingston Basin, Lake = Main Basin).
FIG. 7.7.12. Relative biomass (kg/12 min tow) of Deepwater Sculpin for each depth sampled in Fish Community Index Trawling
(‘Summer’, Section 1.3) from 2011 to 2016. Symbols indicate the
geographic area of the survey where the trawls were conducted (BQ = Bay of Quinte, KBasin = Kingston Basin, Lake = Main Basin).
0
5
10
15
20
0 50 100
Bottom Depth (m)
Kg
pe
r T
raw
l
ZONE
BQ
KBasin
Lake
0.0
0.2
0.4
0.6
0 50 100
Bottom Depth (m)
N (
x 1
00
0)
pe
r T
raw
l
ZONE
BQ
KBasin
Lake
FIG. 7.7.13. Mean size of Slimy Sculpin for each depth sampled in Fish Community Index Trawling (Section 1.3) from 2011 to 2016.
0
10
20
30
40
0 50 100
Bottom Depth (m)
Me
an
We
igh
t (g
)

Section 8. Species Rehabilitation
OMNRF works with many partners—
government agencies, non-government
organizations and interested individuals at local,
provincial and national levels—to monitor,
protect and restore the biological diversity of fish
species in the Lake Ontario basin (including the
lower Niagara River and the St. Lawrence River
downstream to the Quebec-Ontario border).
Native species restoration is the center piece of
LOMU's efforts to restore the biodiversity of
Lake Ontario.
The sections following describe the
planning and efforts to restore Atlantic Salmon,
American Eel, Bloater, Lake Trout, Walleye,
Round Whitefish and Lake Sturgeon. Some of
these species have been extirpated while others
were once common but are now considered rare,
at least in some locations in the lake. Successful
restoration of these native species would be a
significant milestone in improving Ontario’s
biodiversity and help to address Ontario’s
commitments under the GLFC’s Fish Community
Objectives and commitments identified in the
Great Lakes Water Quality Agreement.
152
8. Species Rehabilitation 8.1 Introduction A. Mathers, Lake Ontario Management Unit
Section 8. Species Rehabilitation
153
Atlantic Salmon were extirpated from Lake
Ontario by the late 1800s, primarily as a result of
the loss of spawning and nursery habitat in
streams. As a top predator, they played a key
ecological role in the offshore fish community.
They were also a valued resource for aboriginal
communities and early Ontario settlers. As such,
Atlantic Salmon are recognized as an important
part Ontario’s natural and cultural heritage.
Originating as a small stocking program in
1987, the Lake Ontario Atlantic Salmon
Restoration Program has developed into a
significant partnership combining the efforts of
the Ministry of Natural Resources and Forestry
(MNRF), the Ontario Federation of Anglers and
Hunters (OFAH), and many corporate and
community partners. Since 2006, significant
progress has been made through enhancements in
fish production, community involvement,
research and assessment, and habitat
enhancement. However, progress toward some
program benchmarks has not kept pace.
Specifically, the program has failed to generate
sufficient numbers of returning adult fish to
achieve program goals.
In 2015, the program steering committee
developed a revised five-year plan (2016-2020)
with new priorities and performance measures to
accelerate restoration with emphasis on improving
adult returns. Plan priorities include: enhancing
program delivery and review, optimizing fish
culture practices, prioritizing habitat issues,
developing fish passage strategies (e.g., Cobourg
Creek); and creating a recreation tributary fishery
in the Ganaraska River.
Highlights of progress made in 2016,
include the formation of watershed specific
habitat teams. Habitat issues have been
prioritized and strategies drafted for each “best-
bet” watershed. Barrier mitigation options are
being investigated on Cobourg Brook and fish
way efficiency studies are being considered on
other tributaries. The Ganaraska River was
stocked with yearling Atlantic Salmon (Section
6.3) to create a future recreational fishery and a
new “state of the art” fish counter /camera has
been installed in the fish way on Corbett’s Dam.
This new technology will vastly improve our
ability to monitor returning adult salmon (Section
9.9). Scoping for the placement of an additional
counter /camera is underway for the Streetsville
Dam on the Credit River.
8.2 Atlantic Salmon Restoration M.D. Desjardins, Lake Ontario Management Unit

Section 8. Species Rehabilitation
154
8.3 American Eel Restoration M. Hanley and A. Mathers, Lake Ontario Management Unit
Background
The American Eel (Anguilla rostrata) was
historically an important predator in the nearshore
fish community of Lake Ontario and the upper St.
Lawrence River (LO-SLR). They also functioned
as an important component of the LO-SLR
commercial fishery during the latter part of the
20th century, and are highly valued by indigenous
peoples. American Eel abundance declined in the
LO-SLR system as a result of the cumulative
effects of eel mortality during downstream
migration due to hydro-electric turbines, reduced
access to habitat imposed by man-made barriers
to upstream migration, commercial harvesting,
contaminants, and loss of habitat.
By 2004, American Eel abundance had
declined to levels that warranted closure of all
commercial and recreational fisheries for eel in
Ontario to protect those that remained. In 2007,
American Eel was identified as Endangered under
Ontario’s Endangered Species Act (ESA). In
2012, the Committee on the Status of Endangered
Wildlife in Canada (COSEWIC) recommended
that American Eel be identified as Threatened
under the Canadian Species at Risk Act. These
events led to additional efforts to protect and
restore the American Eel. This section describes
the current status of American Eel in LO-SLR, as
well as actions taken by the Lake Ontario
Management Unit and its partners to reverse the
decline of American Eel populations in Lake
Ontario and the St. Lawrence River.
Indices of Eel Abundance
Moses Saunders Eel Ladder Operation
The largest barriers to both upstream and
downstream migration of American Eels are
power dams in the St. Lawrence River. One of
these dams, the Moses Saunders Dam, is located
on the upper St. Lawrence River between
Cornwall, Ontario and Massena, New York. In
1974, an eel ladder was put in place on the
Ontario portion of the dam (R.H. Saunders
Hydroelectric Dam) in order to aid in the
upstream passage of American Eel. The
maintenance and operation of the ladder has been
maintained and upgraded through collaborations
between OMNRF and Ontario Power Generation
(OPG) in the years since, and OPG took full
responsibility of the operation and maintenance of
the ladder in 2007.
In 2016, the Saunders eel ladder was in
operation 24 hours a day from June 15 to October
15. Over the course of these four months, passive
integrated transponder (PIT) tag readers and an
electronic fish counter were used to monitor the
use of the ladder and quantify the number of eels
passing upstream. The PIT tag reader and counter
operated 98-100% of the time and when they
were not in operation, any eels passing through
were kept in a collection tank and were manually
counted in order to collect all data. In 2016, a
total of 6,192 eels successfully passed through the
OPG eel ladder (Fig. 8.3.1). This number
represents the lowest recorded number of eels
passed in the last six years. The majority of eels
passed through the ladder during a six week
period from early July to late August and most
(96.9%) moved through during hours of darkness
from 22:00 to 06:00.
The number of eels passed through the
OPG ladder was approximately equal to the
number of eels that passed through a second eel
ladder on the New York portion of the Moses
Saunders Dam (Moses Ladder) ,where 6,262 eels
successfully exited the Moses Ladder. The Moses
Ladder has been in operation since 2006 and has
been maintained by the New York Power
Authority (NYPA). Historically, the NYPA ladder
passed more eels than the OPG ladder with
approximately 3,500 more eels travelling through
the Moses Ladder in 2015.

Section 8. Species Rehabilitation
Lake Ontario and Upper St. Lawrence River
Assessment programs
In 2016, the abundance of larger “yellow”
eels in the LO-SLR was measured with several
assessment programs. Bottom trawling in the Bay
of Quinte has been conducted since 1972 as part
of the fish community index program. The
average catch of American Eel in 511 trawls
conducted (June-September at sites upstream of
Glenora) between 1972 and 1996 was 2.0 eels per
trawl. No eels were captured in the 360 trawls
conducted between 2003 and 2011 and either zero
or one eel was captured during the bottom trawls
conducted annually between 2012 and 2016.
Nearshore trap netting was conducted using
the NSCIN fish community index protocol (see
Section 1.4). During 2016, one eel was captured
in 24 nets set in Hamilton Harbor, one eel was
captured in 24 nets set in Toronto Harbor, and
three eels were captured in 36 nets set in the
Upper Bay of Quinte.
The combined number of eels that passed
through both ladders (12,454 eels) was the lowest
since 2004 when only the OPG ladder was in
operation, but overall combined eel numbers
exiting both ladders have increased since 2001.
However, the number of eels ascending the
ladders in 2016 is less than 2% of the level of
recruitment identified as a long-term indicator in
the Lake Ontario Fish Community Objectives for
American Eel (FCO 1.3; at least one million eels
ascending the ladders annually).
A sub-sample of eels was collected from
the OPG ladder and biological characteristics
were measured during 2016. The average length
(403.2 ± 74.9 mm, n=559, range: 221-630 mm)
and average weight (94.9g ± 56.2 g, n=559,
range: 11-307 g) was similar for what has been
observed in recent years with a trend for slightly
larger fish in the last three years. These values are
also similar to the average length (428.9 mm,
n=515) and weight (117.2 g, n=515) recorded
from the NYPA ladder.
155
FIG. 8.3.1. Total number of eels ascending the eel ladders at the Moses-Saunders Dam, Cornwall, Ontario from 1974-2015. During 1996, the ladder operated however no counts were made.
0
200000
400000
600000
800000
1000000
1200000
1400000
1974 1978 1982 1986 1990 1994 1998 2002 2006 2010 2014
To
tal
nu
mb
er
of
ee
ls
Moses (NY)
Saunders (ON)
0
10000
20000
30000
40000
50000
60000
1996199920022005200820112014

Section 8. Species Rehabilitation
Tail Water Survey
In 2016, surveys were conducted by OPG
to collect dead eels in the Canadian water from
the tailwater of the Moses-Saunders Dam. The
surveys followed standardized routes, which
extended approximately 10 km downstream of the
dam along the Canadian shoreline. Tailwater
surveys were conducted twice a week on each
Tuesday and Friday from June 3 to September 30,
2016. Investigators working in a boat searched the
specified area for dead and injured American Eels
that were floating or submerged along or near the
shoreline. In 2016, a total of 64 eels were
collected during 35 surveys. OPG observed an
average of 2.0 eels per day while NYPA observed
1.1 eels per day (Fig. 8.3.2). The average length
of whole eels (n=19) collected by OPG was 845 ±
135 mm (mean ± SD) (Fig. 8.3.3). American Eels
were observed during 27 of the 35 survey days
and 72% of the collections in 2016 occurred in
August and September. Most eels (92%) were
collected when water temperatures were greater
than or equal to 20°C.
Restoration Efforts
Effectiveness Monitoring of Stocked Eels
In one component of the OPG Action Plan
for Offsetting Turbine Mortality of American Eel,
over 4 million glass eels were stocked into the LO
-SLR between 2006 and 2010. All stocked eels
were purchased from commercial fisheries in
Nova Scotia and were marked with
oxytetracycline to distinguish them from eels that
migrated naturally. Prior to stocking, health
screening for a wide variety of fish pathogens
(including Anguillicolodes crassus) was
conducted at the Atlantic Veterinary College. As
prescribed in the current Action Plan, eels have
not been stocked since 2010.
DFO and OPG have collaborated to
monitor the effectiveness of American Eel
stocking through the electrofishing of pre-
established transects in the St. Lawrence River
(Jones Creek, Grenadier Island, and Rockport)
and the Bay of Quinte (Deseronto, Big Bay, and
Hay Bay). In the spring of 2016, 160 transects
were sampled in these areas and a total of 326
eels were enumerated. Of the 326 American Eels
observed or netted, 102 were captured, 31 were
measured and weighed before being released, and
71 were sacrificed for age, growth, and origin
assessment.
Density estimates have fallen
approximately 50% in the St. Lawrence River and
25% in the Bay of Quinte since the peak density
in 2013 (Fig. 8.3.4). In 2016, density estimates
remained similar to 2015 in both the St. Lawrence
River (79.3 ± 12.3 eels/ha) and the Bay of Quinte
(96.0 ± 18.3 eels/ha). The decline in overall
density is not surprising as natural recruitment
remains low, stocking has not occurred since
2010, and the number of eels out-migrating is
increasing. Biomass estimates have increased for
the Bay of Quinte (51.1 ± 8.4 kg/ha), but
156
0
5
10
15
20
25
30
0
20
40
60
80
100
120
140
2007 2009 2011 2013 2015
Ag
e (
ye
ars
)
Le
ng
th (
cm
)
Length (cm)
Age (yrs)
FIG. 8.3.3. Length (mean ± standard deviation) and age (mean ± standard deviation) of eels collected in the tail-waters of the Moses-
Saunders Dam 2007-2016
0
5
10
15
20
2000 2003 2006 2009 2012 2015
Av
era
ge
nu
mb
er
pe
r d
ay NYPA
OPG Method 1
OPG Method 2
FIG. 8.3.2. Average number of eels observed per day in the tail-waters of the Moses-Saunders Dam 2000-2016. Note that the OPG
sampling methodology and route changed in 2007.

Section 8. Species Rehabilitation
Ministère des Forêts, de la Faune et des Parcs
(MFFP). LOMU staff assisted OPG in the
collection of eels captured in local commercial
fisheries and transport of these fish from LO-SLR
to Lac St. Louis (a section of the St. Lawrence
River below all barriers to downstream
migration). During 2008-2014, only eels collected
during the spring commercial fishery were
included in T&T. In 2015 and 2016, eels collected
during the fall commercial fishery in areas
upstream of the dam were also included in the
T&T project in an effort to increase the numbers
of eels transported.
A total of 2,211 large yellow eels (583 and
105 from Lake St. Francis in the spring and fall
respectively, and 527 and 996 from above the
Moses-Saunders Dam during the spring and fall
respectively) were released into Lac St. Louis
immediately downstream of the Beauharnois
Hydroelectric Dam as part of the T&T program
(Fig. 8.3.6). During release, all T&T eels were
observed to be in good health and swam away
from the release site and down towards the
substrate. The mortality of large yellow eels
during the spring capture phase of the program
has been low with only three eels dying in 2016.
During the fall T&T, the mortality was high
during the first week with 44 mortalities.
However, this was attributed to high water
temperatures and only four additional eels died
during the remaining three weeks once the water
temperature cooled.
decreased for the St. Lawrence River (34.2 ± 5.1
kg/ha) (Fig. 8.3.5). Mean capture length was
similar in all areas again in 2016. Mean length has
increase in the upper St. Lawrence River by 30
mm in the past three years. An increase of 180
mm in mean length has been observed in the Bay
of Quinte over the same time period. The large
increase in mean length in the Bay of Quinte has
brought the size of eels in this area to that of the
St. Lawrence River. The absence of new recruits
(either through stocking or natural recruitment) is
notable in the relatively high mean capture
lengths.
Of the 71 eels that were sacrificed, ages
were obtained from 70 (32 from the St. Lawrence
River and 38 from the Bay of Quinte). For the
first time, no eels from the 2007 stocked year-
class were captured, and for the fourth year in a
row no eels from the 2006 stocking event were
collected. Given the current growth rates, it is
estimated that the majority of stocked eels will
out-migrate within the next five years.
Trap and Transport
Safe downstream passage past hydro
turbines during the eel’s spawning migration is an
obstacle to restoration of eel that is identified in
the OPG Action Plan. “Trap and
Transport” (T&T) of large yellow eels was
initiated in 2008 as an OPG pilot project to
investigate this alternative for mitigating mortality
of eels in the turbines at the Saunders
Hydroelectric Dam. The project also involved
local commercial fishers and the Québec
157
FIG. 8.3.5. Mean biomass (mean kg per hectare ± standard error) of eels captured in the Upper St. Lawrence River and the Bay of Quinte
using electrofishing from 2009-2016. Sampling took place in the
spring and fall from 2009-2011 and only in the spring from 2012-2016.
FIG. 8.3.4. Mean eels per hectare ± standard error of stocked American eel enumerated in spring transects, by study area.
0
50
100
150
200
250
2009 2010 2011 2012 2013 2014 2015 2016
Mea
n d
ensi
ty (
eels
/ha)
Upper St Lawrence River
Bay of Quinte
0
10
20
30
40
50
60
70
2009 2010 2011 2012 2013 2014 2015 2016
Me
an b
iom
ass
(kg
/ha)
Upper St Lawrence River
Bay of Quinte

Section 8. Species Rehabilitation
MFFP Silver Eel Fishery Monitoring
To monitor the long-term survival,
condition, maturation, and migration of the
transported yellow eels, staff from MFFP
attempted to recover eels tagged during previous
years’ T&T in the silver eel fishery in the St.
Lawrence River estuary. MFFP staff sampled 11,
017 eels (89.9% of the total harvest) from the
silver eel fishery during the fall of 2016. A total
of 26 PIT tagged eels were detected from this
sample. Two of these originated from T&T
operations in the St. Lawrence watershed and
were both transferred in 2011. It should be noted
that T&T eels have not been PIT tagged since
2012 with the exception of the eels that also
received an acoustic tag (see below).
Results of this survey suggest that after
four years, over 75% of the transported eels have
migrated towards the spawning ground. The T&T
project continued to demonstrate that, where
abundant, large yellow eels can be caught, held
for brief periods, and transported successfully
with limited mortality and no behavioural or
physical consequence.
Acoustic Telemetry to Track Movement
In the fall of 2015 and the spring and fall of
2016, 92 eels collected in the T&T program were
implanted with acoustic tags and released into the
Bay of Quinte. Acoustic tags are small, sound-
emitting devices that are used to track fish
movement. The tag is identified by a submerged,
stationary receiver when the fish swims past it.
158
Acoustic tags were surgically implanted into the
abdominal cavity of the eels with 13 eels tagged
in the fall of 2015, 39 eels tagged in the spring of
2016, and 40 eels tagged in the fall of 2016. In the
Bay of Quinte, 43 receivers have been placed in
14 arrays throughout the Bay and into the Eastern
Basin of Lake Ontario in order to track
movements. Additional receivers were placed
above the Iroquois Dam and in Quebec at the
Beauharnois Hydro Dam to detect eels moving
downstream.
To date, all eels have been detected, but it
is presumed that three eels have died (Table
8.3.1). Of the 92 eels tagged, 70 have left the Bay
of Quinte, 31 have been identified at the Iroquois
Dam, and seven have been identified at
Beauharnois (Table 8.3.1). In addition, four of the
12 eels from the 2015 fall tagging session that left
the Bay of Quinte were detected by receivers in
the estuary of the St. Lawrence River. Eels that
are tagged and released in the fall leave the Bay
of Quinte much more quickly than those tagged in
the spring and make their way to Iroquois in half
the time. Eels that were released in the spring
took an average of 11 ± 7.3 weeks (mean ± SD) to
leave the Bay of Quinte, while eels tagged in the
fall left the bay in an average of 2 ± 1.6 weeks
(mean ± SD). Eels released in the spring took an
average of 56 ± 30.1 days (mean ± SD) to reach
Iroquois after leaving the Bay of Quinte, while
those released in the fall reached Iroquois an
average of 24 ± 15.2 days (mean ± SD) after
leaving the Bay. Additionally, movement seems
to take place predominantly at night, where 68%
of detections were collected in darkness, defined
as the time between one hour after sunset and one
hour before sunrise.
Future work in this area is focused on
VEMCO Positioning Information at the Iroquois
Dam. If there is a particular path through the dam
that the eels tend to favor, this information could
be used to aid their passage. Preliminary analysis
shows that GPS locations were identified for 26
of the 31 detected. Twenty-two eels had multiple
locations (up to 9) determined. Twenty of these
eels moved at night and only 2 of the eels were
headed towards the eastern third of the dam (Fig.
8.3.7). Additionally, it is of interest to gather FIG. 8.3.6. Total number of eels collected in the Trap and Transport program from 2008-2016. Each total is divided into the locations at
which the eels were captured in commercial fishery nets.
0
500
1000
1500
2000
2500
2008 2009 2010 2011 2012 2013 2014 2015 2016
Nu
mb
er
of
Eels
Fall LO-SLR
Spring LO-SLR
Fall LSF
Spring LSF

Section 8. Species Rehabilitation
estimates on the survival of eels during their
passage through the dam and so these estimates
will be part of the work planned for 2017.
Eel Passage Research Center
Since 2013, the Eel Passage Research
Center (EPRC) has conducted research to
evaluate potential techniques to concentrate out-
migrating eels for downstream transport around
turbines at Moses-Saunders and Beauharnois
Hydroelectric Dams to mitigate mortality in
turbines. EPRC is coordinated by Electric Power
Research Institute and primary funders of the
research include OPG, Hydro Quebec, and the
United States Fish and Wildlife Service (through
a funding arrangement from NYPA). Four
research projects were undertaken or completed
during 2016:
Fate Fall 2015 Spring 2016 Fall 2016 Total
# Tags 13 39 40 92
Dead Eels 0 2 1 3
Still in BQ 1 9 9 19
Left BQ 12 28 30 70
Iroquois Detection - 12 19 31
Quebec Detection 7 - - 7
TABLE 8.3.1. Fate of tags implanted in American Eels.
laboratory studies of eel behavior in
response to various behavioral cues
recent research on the effect of light on out-
migrating eels and recent advancements in
lighting technology
computational fluid dynamics model
development for Iroquois control dam and
Beauharnois approach channel
Assessment of three sonar technologies to
study downstream migrating American Eel
approach and behavior at Iroquois Dam and
Beauharnois Power Canal.
Future Work
In 2017, many of the projects described
above will continue. The OPG and DFO
monitoring of the effectiveness of American Eel
stocking will be undertaken again in the spring of
2017. The OPG and OMNRF trap and transport
program is scheduled again for spring and fall
2017. At the Moses-Saunders Dam, the tailwater
surveys and the operation of the eel ladder will
also occur again in 2017.
Restoration of American Eel in Lake
Ontario and the St. Lawrence River has been
identified as a Fish Community Objective for
Lake Ontario. The abundance of eels moving into
the system via the ladders at the Moses-Saunders
Dam and the number of mature eels leaving the
system are much lower than the FCO long-term
indicators. However, the mortality rate of eels
migrating downstream towards the spawning
grounds has decreased as a result of the Trap and
Transport project. In addition, a collaborative
effort to develop methods of reducing mortality of
eels during their downstream migration has been
initiated. Although the Fish Community Objective
related to American Eels has not been achieved,
the activities summarized in this report show that
some progress has been made.
159
FIG. 8.3.7. Image of Iroquois Water Control Structure in the upper St. Lawrence River. Lines represent the track of tagged eels (as
detected by acoustic receivers) during September to December 2016.
Locations of the eels were calculated from receiver data by VPS (https://vemco.com/products/vps/).

Section 8. Species Rehabilitation
Prior to the mid-1950s, Lake Ontario was
home to a very diverse assemblage of deepwater
ciscoes including Bloater (Coregonus hoyi), Kiyi
(C. kiyi), and Shortnose Cisco (C. reighardi).
Currently, only the Lake Herring (C. artedi)
remains in Lake Ontario. Re-establishing self-
sustaining populations of Bloater in Lake Ontario
is the focus of a cooperative, international effort
between the Ontario Ministry of Natural
Resources and Forestry (OMNRF), the New York
State Department of Environmental Conservation
(NYSDEC), the U.S. Fish and Wildlife Service
(USFWS), the U.S. Geological Survey (USGS)
and the Great Lakes Fishery Commission
(GLFC). The Lake Ontario Committee has set a
goal to establish a self-sustaining population of
Bloater in Lake Ontario within 25 years. The
objectives and strategies for the establishment of
Bloater are specified in a draft strategic plan,
which is currently under review. The plan
addresses: sources of gametes, culture facilities,
culture capacity, stocking, detection of wild fish,
increasing our understanding of ecological
consequences, research needs, and public
education.
Potential long-term benefits of restoring
Bloater include: restoring historical food web
structure and function in Lake Ontario, increasing
the diversity of the prey fish community,
increasing resistance of the food web to new
species invasions, increasing production of
salmon and trout by reducing thiaminase impacts
of a diet based on Alewife and Rainbow Smelt,
and supporting a small commercial fishery.
Potential risks associated with the reintroduction
of Bloater relate to the unpredictability of food
web interactions in an evolving Lake Ontario
ecosystem. Accepting some risk and uncertainty,
doing the necessary science to increase
understanding and minimize risk, and adapting
management strategies accordingly are
prerequisites for successful restoration of Bloater
in Lake Ontario.
In November 2016, the OMNRF
successfully released 161,680 Bloater (90,305 sub
-adults and 71,375 fall yearlings) into the eastern
basin of Lake Ontario. The stocked fish were
released near Main Duck Island in the St.
Lawrence Channel. This location was chosen
based on assumed habitat suitability as well as to
support the Aquatic Research and Monitoring
Section’s (ARMS) acoustic telemetry project. A
large acoustic array has been assembled and
maintained in this area by ARMS in order to track
the movements of Bloater (see Section 9.1).
OMNRF sampled 155 individual Bloaters
from the stocking event. Length, weight, and sex
were recorded for each individual. Of the 155
fish, 47.7% were male (74 individuals) and 52.3%
were female (81 individuals). The average fork
length of the Bloaters sampled was 151.83 mm
and there was no statistical difference in length
between males and females (ANOVA, F(1) =
0.33, p=0.57). The average weight of fish was
37.09 g, and again no statistical difference was
found between the average weight of males and
females (ANOVA, F(1) = 1.20, p=0.27). The
length-weight relationship for these Bloater is
found in Fig. 8.4.1.
The re-introduction of Bloater to Lake
Ontario is consistent with bi-national
commitments to diversify the offshore prey fish
community, increase and restore native fish
biodiversity, and restore historical ecosystem
structure and function. Continued collection of
eggs from the wild and development of a cultured
brood stock will result in more fish being stocked
in future years. A key restoration goal with this
program is to be able to stock 500,000 fish per
year. To help achieve this goal, broodstock
development continues at White Lake Fish
Culture Station.
160
8.4 Deepwater Cisco Restoration C. Lake and M. Hanley, Lake Ontario Management Unit

Section 8. Species Rehabilitation
161
FIG. 8.4.1. Length-weight relationship of the Bloater that were sampled by OMNRF during the 2016 stocking event (n=155). Average length and weight of the fish was 151.83 mm and 37.09 g respectively.

Section 8. Species Rehabilitation
162
Lake Trout were extirpated in Lake Ontario in
the 1950s. The loss of this top predator and valued
commercial species caused both ecological and
economic damage. Rehabilitation of Lake Trout in
Lake Ontario began in the 1970s with Sea Lamprey
control and stocking of hatchery fish. The first joint
Canada/U.S. plan outlining the objectives and
strategies for the rehabilitation efforts was formulated
in 1983 (referred to henceforth as ‘the strategy’), and
revisions in 1990, 1998, and most recently in 2014
were made to evaluate the methodology and the
progress of rehabilitation. The two objectives of the
strategy are: 1) increase abundance of stocked adult
Lake Trout to a level allowing for significant natural
reproduction and 2) improve production of wild
offspring and their recruitment to adult stock.
Prior to 1996, Lake Trout were monitored with
a targeted bi-national Lake Trout netting program.
Since 1996, in Canadian waters of Lake Ontario the
Lake Trout targets have been evaluated based on
catches in a subsample of sites in the Fish Community
Index Gill Netting (Section 1.2). Relative abundance
is tracked across three areas of the survey: Kingston
Basin (Grape Island, Melville Shoal, EB02, EB06, and
Flatt Point), Main Lake (Rocky Point, Brighton and
Wellington), and Deep Main Lake (Rocky Point deep
sites) at sites where the water temperature on lake
bottom is below 12°C. Pre-1996 indices back to 1992
from the Fish Community Index Gill Netting (Section
1.2) have been added to the current status report.
Lake Trout abundance experienced a significant
period of decline that began in the early 1990s and
reached a low point in 2005 (Fig. 8.5.1). Since 2005,
FIG. 8.5.1. Catch per unit effort of mature Lake Trout by area. Inset shows mean trend of the three areas combined since 2005.
8.5 Lake Trout Restoration J. P. Holden and M. J. Yuille, Lake Ontario Management Unit
B. Metcalfe, Aquatic Research and Monitoring Section
there has been a gradual increase in the relative
abundance of adult Lake Trout, although catches are
still well below those seen in the 1990s. During 2016,
abundance marginally decreased in the Kingston Basin
and Main Lake, while the abundance in the Deep Main
Lake increased from 2015 catches. Overall, there is
still an increasing trend in catch. The strategy
specifically identifies the abundance of female Lake
Trout greater than 4,000 g as an important indicator of
the health of the spawning stock. The current catch per
unit effort (CUE, number per 24 hr gill net set) is on an
increasing trend since 2005; however, it has been
relatively stable since 2013 and decreased in Kingston
Basin sites (Lake Deep Excluded Index) (Fig. 8.5.2).
Survival of juvenile Lake Trout was identified
as one factor contributing to the decline in abundance.
Catches of age-3 fish per half million fish stocked is
used as an index of juvenile survival. Survival to age-
3 of the 2013 cohort (sampled in 2016) is well below
the target of 1.5 identified in the strategy (Fig. 8.5.3).
This index has become increasingly variable in recent
years.
As a measure of improved production of wild
offspring and recruitment to the adult life stage, the
strategy sets a target of wild fish to levels greater than
observed between 1994 and 2011 (Ontario target =
13.6 wild fish per 100 standard gill net sets). The
occurrence of wild Lake Trout is measured through
catches of fish that do not bear hatchery fin clips (i.e.,
unclipped). Stable isotope analysis suggested that
more than 90% of unclipped fish were of wild origin.
Catches of wild Lake Trout decreased in 2016 and
FIG. 8.5.2. Relative abundance of mature female Lake Trout greater than 4000 g. Trend is present with and without Lake Deep sites as
they were not conducted in all years.
1995 2000 2005 2010 20150
10
20
30
40
50
60
Year
Ca
tch
pe
r G
ill N
et
Kingston BasinLakeLake Deep
2004 2006 2008 2010 2012 2014 2016
1.0
1.5
2.0
1995 2000 2005 2010 20150.0
0.5
1.0
1.5
2.0
2.5
3.0
YearYear
Ca
tch
pe
r G
ill
Ne
t All Zones
Lake DeepExcluded

Section 8. Species Rehabilitation
163
remains below target (Fig. 8.5.4). Ages of unclipped
Lake Trout captured between 2005 and 2016 were
interpreted through examination of otoliths and
determined that several cohorts were present. Year
class strength was assessed based on multiple years of
catches and showed several strong year classes
between 1998 and 2003 (Fig. 8.5.5).
Catches of small Lake Trout in the Fish
Community Index Trawling (Section 1.3) are generally
low but can provide some additional insight on wild
recruitment. Small numbers of wild young-of-year
(YOY) fish have been occurring more frequently in
recent years and 2016 is the highest combined catch of
wild age-0 and age-1 fish in the time series (Fig. 8.5.6).
The effectiveness of Sea Lamprey control is
monitored through the number of A1 wounds (fresh
with no healing) observed on Lake Trout. The strategy
sets a target of less than two A1 wounds per 100 Lake
Trout. The target has been consistently met since 1996
with the exception of 2012 (Fig. 8.5.7).
The strategy also calls for Ontario to continue
stocking 500,000 Lake Trout yearlings annually to
increase adult biomass to levels that would facilitate
natural reproduction. Ontario stocks three strains of
Lake Trout to maximize genetic diversity and develop
a strain that is well adapted to present conditions in
Lake Ontario. In 2016, a total of 502,249 Lake Trout
yearlings were stocked in addition to 173,208 fall
fingerlings spread across all basins of the lake. A
breakdown of Lake Trout stocking numbers, locations
and strains is included in Table 6.1.2.
Since 1998, Lake Trout stocked by MNRF have
been clipped with multiple fin clips (an adipose clip
and one other), and contain no coded wire tags (CWT).
US stocked fish have continued to use only adipose
clips paired with CWT. This difference in marking
allows for an evaluation of fish straying. In 2016, of
the 519 Lake Trout sampled in the Fish Community
Index Gill Netting (Section 1.2), 183 Lake Trout were
caught with only an adipose clip, and of these, 121 had
a CWT recovered. This suggests that at least 23%, but
as much as 35% of Lake Trout caught in Ontario
waters originated from New York stocking. Catch
location and stocking origin sites are mapped in Fig.
8.5.8. Of particular note, one Lake Trout captured near
Amherst Island had been stocked in Lake Erie.
FIG. 8.5.3. Catch per unit effort (CUE) of age-3 Lake Trout standardized to 500,000 stocked. The Lake Trout Management
Strategy target has established a target CUE = 1.5.
FIG. 8.5.4. Catch of unclipped Lake Trout per 100 standardized nets. Dotted line indicates Lake Trout Management Strategy target of
13.7 fish per 100 standardized nets.
FIG. 8.5.5. Proportional year class strength of unclipped Lake Trout captured in the Fish Community Index Gill Netting (Section 1.2)
caught between 2005 and 2016.
FIG. 8.5.6. Catches of age-0 and age-1 Lake Trout in the Fish Community Index Trawling (Section 1.3). Catches are standardized
to a 32 trawl program.
0.00
0.25
0.50
0.75
1.00
2000 2005 2010
COHORT
IND
EX
1995 2000 2005 2010 20150
5
10
15
20
25
Year
Ca
tch
pe
r 1
00
Ne
ts
0.0
0.5
1.0
1.5
1995 2000 2005 2010
Cohort
Pro
po
rtio
na
l Y
ea
r C
las
s S
tre
ng
th
1992 1997 2002 2007 2012
Age-1Age-0
Year
0
1
2
3
4
Year
Sta
nd
ard
ized
Catc
h

Section 8. Species Rehabilitation
164
The body condition of Lake Trout is reported as
the predicted weight, based on a log-log regression, of
a 680 mm (fork length) Lake Trout. While below the
peak condition index observed in 2011 and 2013, Lake
Trout condition in 2016 remains above the average for
the time series (1992-2016; Fig. 8.5.9). A long term
analysis of diet items from adult lake trout (>450mm
TL) shows that Alewife are the most consumed diet
item by weight (Fig 8.5.10). Since their establishment
in Lake Ontario, Round Goby have displaced Slimy
Sculpin in Lake Trout diets. Rainbow Smelt are
commonly consumed but their importance varies
among years. Other prey such as darter and shiner
species are consumed in relatively small proportion
compared to Alewife, Rainbow Smelt, Round Goby
and historically Slimy Sculpin.
Catch and harvest of Lake Trout in the
recreational fishery is assessed through the Western
Lake Ontario Boat Angling Survey (Section 2.2). The
estimated recreational catch of Lake Trout in the
Ontario waters of Lake Ontario was 6,814 fish in 2016;
a significant decline (47%) from the previous 2013
catch estimate (Fig. 8.5.11). Harvest in 2016 (12% of
catch) was higher than 2013 (4% of catch), but remains
just below the average harvest rate since 2000 (15% of
catch; Fig. 8.5.12). Of the salmon and trout species
targeted in Lake Ontario, Lake Trout was the third
most frequently caught species behind Chinook
Salmon and Rainbow Trout, although the majority of
the catch in 2016 (99%) was isolated in the western
end of Lake Ontario (Niagara and Hamilton Areas;
Fig. 2.3.2). Of the Lake Trout sampled by creel
technicians, it was determined that the majority of fish
were of hatchery origin (89%) and 78% were stocked
in U.S. waters (based on clip data). An angler survey
was last conducted in the Kingston Basin in 1992 and
suggested that Lake Trout catches were 3.5 times
higher in the Kingston Basin compared to catches
observed in the Western Lake Ontario Boat Angling
Survey. Scaling the 2016 western basin harvest to
account for Kingston Basin harvest results in 3,667
Lake Trout per year being harvested, which is below
the strategy’s maximum recommended harvest of
5,000 fish from Ontario waters.
The Lake Ontario Volunteer Angler Diary
Program (Section 2.3) provides additional information
FIG. 8.5.7. Sea Lamprey scarring rate. Dotted line indicates the Lake Trout Management Strategy target of a maximum of two A1
wounds (fresh with no healing) per 100 Lake Trout.
FIG. 8.5.8. Catch and generalized origin location of US stocked Lake Trout captured in Fish Community Index Gill Netting (Section
1.2) gill net sets. Black circles indicate the catch location. Open
circles indicate the generalized stocking area. The single grey triangle indicates a Lake Trout captured that was initially stocked in
Lake Erie.
FIG. 8.5.9. Lake Trout Condition Index is the predicted weight of a 680 mm (fork length) Lake Trout. Error bar indicate the 95%
confidence intervals.
1995 2000 2005 2010 20150
1
2
3
4
5
6
Year
Wo
un
din
g R
ate
(Sca
rs p
er
10
0 f
ish
)
A1A2
FIG. 8.5.10. Diet composition (percent composition by weight) of Lake Trout captured in Fish Community Index Gill Netting (Section
1.2) gill net sets.
1995 2000 2005 2010 20153.5
4.0
4.5
5.0
5.5
Year
We
igh
t (k
g)
of
a
68
0m
m (
FL
) fi
sh
0
25
50
75
100
2000 2010
YEAR
Pe
rce
nt
Co
mp
os
itio
nb
y W
eig
ht
Alew RbSme Other RGoby SlScul
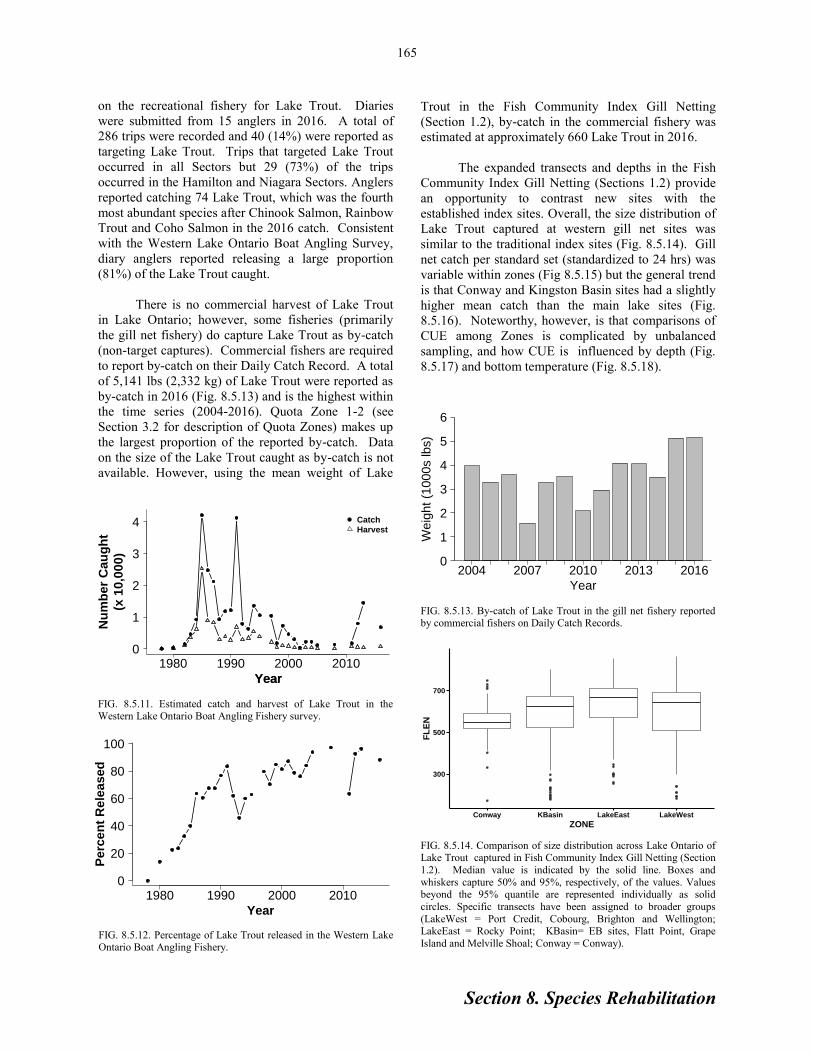
Section 8. Species Rehabilitation
165
on the recreational fishery for Lake Trout. Diaries
were submitted from 15 anglers in 2016. A total of
286 trips were recorded and 40 (14%) were reported as
targeting Lake Trout. Trips that targeted Lake Trout
occurred in all Sectors but 29 (73%) of the trips
occurred in the Hamilton and Niagara Sectors. Anglers
reported catching 74 Lake Trout, which was the fourth
most abundant species after Chinook Salmon, Rainbow
Trout and Coho Salmon in the 2016 catch. Consistent
with the Western Lake Ontario Boat Angling Survey,
diary anglers reported releasing a large proportion
(81%) of the Lake Trout caught.
There is no commercial harvest of Lake Trout
in Lake Ontario; however, some fisheries (primarily
the gill net fishery) do capture Lake Trout as by-catch
(non-target captures). Commercial fishers are required
to report by-catch on their Daily Catch Record. A total
of 5,141 lbs (2,332 kg) of Lake Trout were reported as
by-catch in 2016 (Fig. 8.5.13) and is the highest within
the time series (2004-2016). Quota Zone 1-2 (see
Section 3.2 for description of Quota Zones) makes up
the largest proportion of the reported by-catch. Data
on the size of the Lake Trout caught as by-catch is not
available. However, using the mean weight of Lake
FIG. 8.5.12. Percentage of Lake Trout released in the Western Lake Ontario Boat Angling Fishery.
FIG. 8.5.11. Estimated catch and harvest of Lake Trout in the Western Lake Ontario Boat Angling Fishery survey.
Trout in the Fish Community Index Gill Netting
(Section 1.2), by-catch in the commercial fishery was
estimated at approximately 660 Lake Trout in 2016.
The expanded transects and depths in the Fish
Community Index Gill Netting (Sections 1.2) provide
an opportunity to contrast new sites with the
established index sites. Overall, the size distribution of
Lake Trout captured at western gill net sites was
similar to the traditional index sites (Fig. 8.5.14). Gill
net catch per standard set (standardized to 24 hrs) was
variable within zones (Fig 8.5.15) but the general trend
is that Conway and Kingston Basin sites had a slightly
higher mean catch than the main lake sites (Fig.
8.5.16). Noteworthy, however, is that comparisons of
CUE among Zones is complicated by unbalanced
sampling, and how CUE is influenced by depth (Fig.
8.5.17) and bottom temperature (Fig. 8.5.18).
1980 1990 2000 20100
1
2
3
4
Year
Nu
mb
er
Ca
ug
ht
(x 1
0,0
00
)
Year
CatchHarvest
1980 1990 2000 20100
20
40
60
80
100
Perc
en
t R
ele
ased
Year
FIG. 8.5.13. By-catch of Lake Trout in the gill net fishery reported by commercial fishers on Daily Catch Records.
FIG. 8.5.14. Comparison of size distribution across Lake Ontario of Lake Trout captured in Fish Community Index Gill Netting (Section
1.2). Median value is indicated by the solid line. Boxes and
whiskers capture 50% and 95%, respectively, of the values. Values beyond the 95% quantile are represented individually as solid
circles. Specific transects have been assigned to broader groups
(LakeWest = Port Credit, Cobourg, Brighton and Wellington; LakeEast = Rocky Point; KBasin= EB sites, Flatt Point, Grape
Island and Melville Shoal; Conway = Conway).
300
500
700
Conway KBasin LakeEast LakeWest
ZONE
FL
EN
2004 2007 2010 2013 2016
Year
Weig
ht (1
000
s lbs)
0
1
2
3
4
5
6
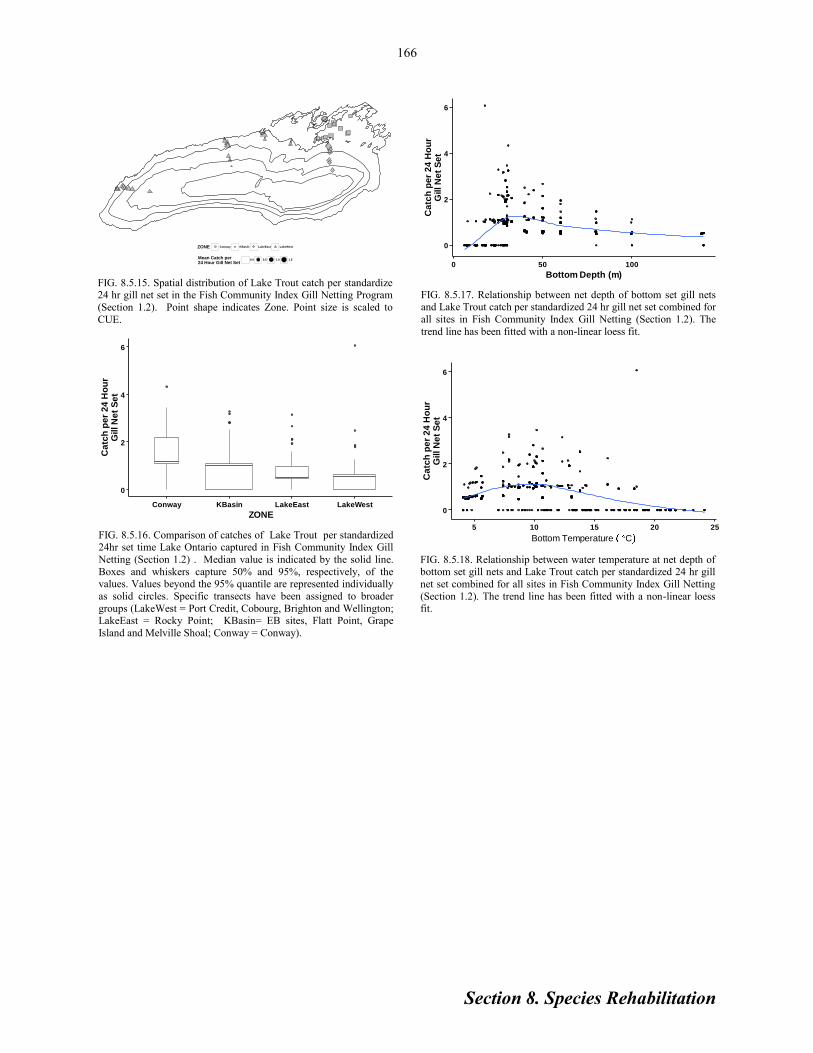
Section 8. Species Rehabilitation
166
FIG. 8.5.15. Spatial distribution of Lake Trout catch per standardize 24 hr gill net set in the Fish Community Index Gill Netting Program
(Section 1.2). Point shape indicates Zone. Point size is scaled to
CUE.
ZONE Conway KBasin LakeEast LakeWest
Mean Catch per24 Hour Gill Net Set
0.0 0.5 1.0 1.5
FIG. 8.5.16. Comparison of catches of Lake Trout per standardized 24hr set time Lake Ontario captured in Fish Community Index Gill
Netting (Section 1.2) . Median value is indicated by the solid line.
Boxes and whiskers capture 50% and 95%, respectively, of the values. Values beyond the 95% quantile are represented individually
as solid circles. Specific transects have been assigned to broader
groups (LakeWest = Port Credit, Cobourg, Brighton and Wellington; LakeEast = Rocky Point; KBasin= EB sites, Flatt Point, Grape
Island and Melville Shoal; Conway = Conway).
FIG. 8.5.18. Relationship between water temperature at net depth of
bottom set gill nets and Lake Trout catch per standardized 24 hr gill
net set combined for all sites in Fish Community Index Gill Netting
(Section 1.2). The trend line has been fitted with a non-linear loess fit.
FIG. 8.5.17. Relationship between net depth of bottom set gill nets and Lake Trout catch per standardized 24 hr gill net set combined for
all sites in Fish Community Index Gill Netting (Section 1.2). The
trend line has been fitted with a non-linear loess fit.
0
2
4
6
Conway KBasin LakeEast LakeWest
ZONE
Ca
tch
pe
r 2
4 H
ou
rG
ill N
et
Se
t
0
2
4
6
0 50 100
Bottom Depth (m)
Ca
tch
pe
r 2
4 H
ou
rG
ill N
et
Se
t
0
2
4
6
5 10 15 20 25
Bottom Temperature C
Ca
tch
pe
r 2
4 H
ou
rG
ill N
et
Se
t

Section 8. Species Rehabilitation
The genetic stock structure of Round
Whitefish (Prosopium cylindraceum) in Lake
Ontario was assessed to test for the potential
presence of cryptic stocks in Ontario waters.
Historical and contemporary samples collected
from Round Whitefish from three locations in
Lake Ontario (Darlington, Pickering, and Peter
Rock, Fig. 8.6.1) during fall spawning were
analyzed using microsatellite DNA markers.
8.6 Round Whitefish Spawning Population Study
J. Wood, C. Wilson, Aquatic Research and Monitoring Section
J. A. Hoyle, Lake Ontario Management Unit
Individual-based analyses of multilocus
genotypes failed to identify significant genetic
differences or discrete genetic populations among
Round Whitefish from the different sampling
locations. Results of this study will help inform
ongoing management of this native coregonid
species. A final report on this work is available
online at: http://www.ontla.on.ca/library/
repository/mon/30010/337012.pdf
167
FIG. 8.6.1. Map of Lake Ontario showing locations (Pickering, Darlington, and Peter Rock) of Round Whitefish tissue sample collections.

Section 8. Species Rehabilitation
168
TABLE 8.7.1. Walleye stocked into Hamilton Harbour, 1993-2015 and target for 2016*.
Past Restoration Efforts
Walleye declined in Hamilton Harbour in
the early 1900s and were not observed in various
fish surveys conducted during the mid-1900s.
Walleye were reintroduced in Hamilton Harbour
through adult transfer and spring fingerling
stocking of Bay of Quinte strain in the 1990s
(Table 8.7.1). This initial stocking effort was part
of the local Remedial Action Plan (RAP)
objective to increase top predators in the
Hamilton Harbour fish community. All Walleye
subsequently caught in trap net assessments
during 2006 and 2008 had DNA showing Bay of
Quinte origin, consistent with the 1990s stocking
program. Walleye abundance declined and
disappeared from the trap net surveys between
2006 and 2012 (Fig. 8.7.1).
Current Restoration Efforts
Since 2012, Walleye stocking has been
conducted annually and included a variety
Walleye life-stages (Table 8.7.1). In 2016,
100,000 1-month (stocked on May 25) old fry and
8.7 Hamilton Harbour Walleye Reintroduction
J. A. Hoyle, Lake Ontario Management Unit
J. L. Brooks, Carleton University, Ottawa
D. T. Reddick, Fisheries & Oceans Canada, CCIW, Burlington
115,722 summer fingerlings (June 30) were
stocked.
Monitoring and Assessment
Nearshore Fish Community Index Trap Netting
(NSCIN)
NSCIN was conducted on Hamilton
Harbour in August 2016 (see Section 1.4). A
mean catch of 4.6 Walleye per trap net was
observed (Fig. 8.7.1). This exceeds the
FIG. 8.7.1. Walleye catch (number of fish per trap net lift) for years indicated.
0
1
2
3
4
2006 2008 2010 2012 2014 2015 2016
Fis
h p
er
tra
p n
et
Year
Restoration target
Year Month Life-StageMean
weight (g)
Number of
fishSource
1993 October adult 600 185 transferred from Bay of Quinte
1994 October adult 1,500 129 transferred from Bay of Quinte
1997 October adult 900 130 transferred from Bay of Quinte
1998 September adult 1,364 120 transferred from Bay of Quinte
1999 July 3-months 0.5 6,000 White Lake FCS (Bay of Quinte strain)
2012 July 3-months 1.0 100,000 White Lake FCS (Bay of Quinte strain)
2012 November adult 1,500 74 White Lake FCS (Bay of Quinte strain)
2013 July 3-months 0.5 10,000 White Lake FCS (Bay of Quinte strain)
2014 June Swim-up fry n/a 950,000 White Lake FCS (Bay of Quinte strain)
2015 May Swim-up fry n/a 1,017,625 White Lake FCS (Bay of Quinte strain)
2015 July 3-months 0.3 52,963 White Lake FCS (Bay of Quinte strain)
2016 May Swim-up fry n/a 168,000 White Lake FCS (Bay of Quinte strain)
2016 June 3-months 0.45 115,722 White Lake FCS (Bay of Quinte strain)

Section 8. Species Rehabilitation
restoration target of 2 fish per net established
prior to commencement of the 2012 Walleye
stocking initiative. The mean catch of 4.6 fish per
net also compares favourably to that from other
Lake Ontario and St. Lawrence River nearshore
areas (see Section 1.4 and Section 7.4). Fourteen
of the 24 trap net sets in Hamilton Harbour caught
at least one Walleye (Fig. 8.7.2). Walleye were
captured throughout Hamilton Harbour where
suitable trap net sampling locations were located.
Largest catches occurred at a trap net in the
extreme west end of the harbour (n=59) and in
two nets set at an extreme east end location (n=17
and 9).
Age was interpreted (otoliths) for a random
sample of 31 of the 111 Walleye caught. These 31
fish ranged in length from 474 to 571 mm fork
length. All were age-4 and likely from the 2012
stocking event. Walleye caught ranged in size
from 470-610 mm fork length (mean 534 mm;
Fig. 8.7.3). Comparing the size of the 4-year-old
fish with the length distribution of all 111 fish
caught suggested that all but one of the Walleye
were age-4. A single larger, presumably older,
Walleye (fork length 610 mm) was also caught.
Results of the 2012 Walleye stocking continue to
be very successful. Subsequent stocking events
have been less successful to date.
Seventeen of 22 males and eight of nine
female Walleye were judged to be mature in
August 2016 and capable of spawning in spring
2017. As in 2015, some of the Walleye caught in
2016 were provided to Fisheries and Oceans staff
for an acoustic tagging study.
Spawning Assessment
In April 2016, Fisheries and Oceans (DFO)
completed the first walleye spawning assessment
in Hamilton Harbour to determine if the stocked
walleye population would be attempting to spawn,
as a successful cohort was approaching the
appropriate age and size to reproduce.
Electrofishing was used to sample along the
shoreline in 1-3 m water depth, beginning a half-
hour after dark until 01:00am EST. Water clarity
prevented visual observation for walleye
congregations, so 1000 second transects were
FIG. 8.7.2. Map of Hamilton Harbour showing number of Walleye caught, in August 2016, at each trap net location. A total of 111
Walleye were captured. Map courtesy of Google Earth.
used to locate congregations of walleye. Due to
time constraints, sampling was focused on the
eastern shoreline south of Indian Creek along
Eastport Drive to the Port Authority cells, along
the western shore south of the Desjardin Canal to
Bayfront Park boat ramp, and along the south
shore from the Bayfront boat ramp to Macassa
Bay, and within the Ottawa street slip. Water
temperatures ranged from 6.8 and 11.1 oC at all
locations except the Ottawa Street slip which was
15 oC, due to the warm water outflow from the
steel mill.
Walleye were captured along all shorelines.
A total of 56 walleye were observed, 49 of which
were captured for non-lethal sampling purposes
(Table 8.7.2). Of the 49 fish captured, 2 were ripe
females, and 48 were ripe males. Despite differing
weather conditions and variable water
temperatures, walleye congregations were located
at the same general sites, both nights of sampling
along the eastern shoreline, suggesting spawning
behaviour. These fish ranged in length from 420
to 620 mm fork length (Fig. 8.7.3). One large
male walleye above the size range expected was
captured along the western shore with a total
length of 650 mm and a weight of 3960 g.
Acoustic Tagging Study
Acoustic biotelemetry allows continual,
year-round, monitoring of fish locations.
Beginning in summer 2015, 50 sexually mature
169
1
1 0+27
0
0
0
0
17+90
1 0
2 0
1
0
59 2
0
1
Hamilton Harbour 2016Lake
Ontario3
5

Section 8. Species Rehabilitation
FIG. 8.7.3. Size distribution of Walleye caught during NSCIN trap net surveys conducted in Hamilton Harbour in August of 2014, 2015 and 2016, and during the Walleye spawning assessment in April 2016.
170
0.0
0.2
0.4
0.6
0.8
300 320 340 360 380 400 420 440 460 480 500 520 540 560 580 600 620 640 660 680 700
Fis
h p
er
tra
p n
et
Fork length (mm)
2014 (August)
0.0
0.1
0.2
0.3
0.4
0.5
300 320 340 360 380 400 420 440 460 480 500 520 540 560 580 600 620 640 660 680 700
Fis
h p
er
tra
p n
et
Fork length (mm)
2015 (August)
0
5
10
15
20
300 320 340 360 380 400 420 440 460 480 500 520 540 560 580 600 620 640 660 680 700
Nu
mb
er
of
fis
h
Fork length (mm)
2016 (April)
0.0
0.2
0.4
0.6
0.8
1.0
300 320 340 360 380 400 420 440 460 480 500 520 540 560 580 600 620 640 660 680 700
Fis
h p
er
tra
p n
et
Fork length (mm)
2016 (August)
Walleye have been captured during the OMNRF’s
trap netting and DFO’s electro-fishing efforts and
internally tagged with acoustic transmitters (V13
transmitters, 13 mm diameter, 48 mm length, 3-
year battery, Vemco ™, Halifax, NS). Fixed
acoustic biotelemetry receivers (Fig. 8.7.4) have
been placed throughout and adjacent to the
Harbour to determine seasonal residency patterns
of Walleye, with a particular focus on identifying
aggregation areas during the spawning season.
Receivers were downloaded in October
2016 and have shown some interesting
preliminary results. Of the first 25 tags deployed
in 2015, 17 survived the tagging process and 16
of these remained within the boundaries of
Hamilton Harbour throughout the spring (2016)
spawning period. Six of these individuals had
exited the Harbour, east through the canal,
towards the end of September (2016). Hamilton
Harbour experiences hypoxia and anoxia issues,
particularly during the stratification period during
the summer, therefore we suspect this may have
‘pushed’ the Walleye out of the area. Of the 25
Walleye tagged in the summer of 2016, 23
survived, and eight of these also exited the
harbour in late August, potentially for the same
reason. The receiver download in April, 2017 will

Section 8. Species Rehabilitation
Location
Sampling
period Fish observed Fish captured
Total
sampling time
Eastern shore Night 1 11 9 4027 seconds
Night 2 26 23 4129 seconds
Western shore Night 1 Not Sampled Not Sampled Not Sampled
Night 2 9 7 3018 seconds
Southern shore Night 1 1 1 1963 seconds
Night 2 9 9 2034 seconds
Total All Nights 56 49 15171
TABLE 8.7.2. Electrofishing sampling summary for the April 2016
Walleye spawning assessment in Hamilton Harbour.
determine if these Walleye had returned after the
fall breakdown of the harbour’s thermal
stratification. Fig. 8.7.1 shows the interpolated
hourly points for the initial 17 walleye (deployed
in 2015) movements from fall 2015 to summer
2016.
Concluding Remarks
An adequate level of top fish predators,
such as Walleye, helps to achieve a balanced
trophic structure in the fish community, and also
complements local remedial action to improve
water quality and restore fish habitat in Hamilton
Harbour. All indications to date are that the 2012
Walleye stocking effort in Hamilton Harbour was
highly successful in terms of survival and growth
rates. An ongoing plan is in place to monitor
contaminant levels for the Hamilton Harbour
Walleye. To help further evaluate stocking
success, local anglers are encouraged to report on
any Walleye caught in Hamilton Harbour. The
next trap net survey is planned for 2018.
Spawning assessment and acoustic biotelemetry
studies are on-going. Of particular interest,
moving forward, is identification of Walleye
survival “bottlenecks” during early life history
stages.
FIG. 8.7.4. Interpolated points of 17 walleye (Sander vitreus) positions per hour between October 2015 and October 2016. Crosses illustrate acoustic receiver locations. It is important to note that tagged walleye may be using the coastal areas on
the outside of this array perimeter, however, the type of interpolation we have used repositions their location within this
outer boundary.
171

Section 8. Species Rehabilitation
8.8 Lake Sturgeon
C. Lake and M. Hanley, Lake Ontario Management Unit
Lake Sturgeon (Acipenser fulvescens) were
a key component of the fish community in Lake
Ontario and the Upper St. Lawrence River in the
past, but are now listed as threatened under the
Endangered Species Act (ESA) in this area. As is
outlined in the recovery strategy (RS) for Lake
Sturgeon “the recovery goal for Lake Sturgeon in
Ontario is to maintain existing Lake Sturgeon
populations throughout their current range and
where feasible, to restore, rehabilitate or re-
establish, self-sustaining Lake Sturgeon
populations which are viable in the long term
within their current habitat and/or within habitats
they have historically occupied, in a manner
consistent with maintaining ecosystem integrity
and function.” For more information on the RS of
Lake Sturgeon, please visit http://files.ontario.ca/
environment-and-energy/species-at-risk/
stdprod_086034.pdf.
In order to achieve the goals set out in the
RS for Lake Sturgeon, more information is
needed related to the current distribution and
abundance. LOMU aims to add to this knowledge
through tagging and tracking adult Lake Sturgeon.
Through the use of acoustic tags, information on
movement and habitat use of Lake Sturgeon in the
Bay of Quinte will be collected, which will help
to address key knowledge gaps identified in the
RS and will contribute to the continued
rehabilitation of this species.
Queen’s University, with MNRF
assistance, deployed 16 acoustic receiver arrays in
the Bay of Quinte and Eastern Lake Ontario
during early summer 2015. Arrays were installed
to monitor movements of Smallmouth and
Largemouth Bass, however, they also allow
monitoring of any species fitted with a compatible
tag. Information on movements of Lake Sturgeon
(as they are highly migratory) would address
knowledge gaps identified in ESA RS’s and
assists in the development of actions that will
promote their recovery. A better understanding of
how Lake Sturgeon fit into the existing fish
community in the Bay of Quinte, would help
evaluate the potential use of stocking to
reintroduce sturgeon into others areas and help
identify important habitats to inform restoration
efforts. Acoustic tagging has significant
advantages over traditional techniques in
addressing these knowledge gaps for Lake
Sturgeon. Monitoring the movements of adult
Lake Sturgeon could contribute to the knowledge
needed to properly identify areas that are suitable
for the restoration of Lake Sturgeon in waters
they have formerly occupied and are capable of
providing habitat requirements for all life history
stages.
From May 16 to May 27, 2016, hook lines
were deployed in the Trent River in order to
capture adult Lake Sturgeon for implantation of
acoustic tags. Hook-lines were set downstream of
the dam in the Trent River over a distance of
approximately 1.3 kilometers (Fig. 8.8.1). Circle
hooks were attached to each main line at
approximately 1 m intervals and were baited with
salted or unsalted alewife or chicken hearts. Each
main line had between 13-36 individual hooks
(average = 20), adjusted as required by site. The
hook lines were anchored at each end with chain
anchors and were left for approximately 24 hours.
In addition to the use of hook lines, electrofishing
was done throughout the survey area in an effort
to capture Lake Sturgeon. During the survey
period, electrofishing was conducted on six days
for a total of 164.7 minutes (avg. 27.46 min/day).
Unfortunately over the course of the two
week field season, no Lake Sturgeon were
captured. The hook-lines had very little non-
target species by-catch; only 1 Freshwater Drum
was captured on this gear. While electrofishing, a
number of species were captured. The most
predominantly captured species included various
Redhorse species, Longnose Gar, Common Carp,
American Eel, and various sunfishes.
Muskellunge, Walleye, and Smallmouth Bass
were also captured, but in lower incidences than
the other species listed above.
172

Section 8. Species Rehabilitation
FIG. 8.8.1. Locations of hook-lines deployed in the Trent River in 2016
173

Section 9. Research Activities
9.1 Bloater Restoration: Using Acoustic Telemetry to Understand Post-stocking Behaviour
Project leads: Tim Johnson (OMNRF-ARMS),
Aaron Fisk, Scott Colborne (Great Lakes Institute
for Environmental Research, University of
Windsor), Eddie Halfyard (The Nova Scotia
Salmon Association)
Collaborators: Lake Ontario Management Unit,
New York State Department of Environmental
Conservation
Funding: Great Lakes Protection Act / Canada-
Ontario Agreement, Great Lakes Fish and
Wildlife Restoration Act, Great Lakes Fisheries
Commission
Historically, a diverse assemblage of
Deepwater Ciscoes (5 species), including Bloater
(Coregonus hoyi), inhabited Lake Ontario. Since
that time, only the shallow water form (C. artedi)
remains. OMNRF and New York State
Department of Environmental Conservation have
jointly developed a plan to re-establish a self-
sustaining Deepwater Cisco population with a
target to stock 500,000 juvenile Bloater annually
(see Section 8.4). One question requiring
investigation is what will happen to the stocked
fish after introduction. Do hatchery fish survive
in the wild? How does survival change over time?
Do they quickly disperse or do they stay close to
their stocking site? Do they school closely
together and move as a group? What is their
seasonal habitat use and occupied depth and
temperature? Answering these questions using
acoustic telemetry is the focus of this research.
This update provides initial analyses of data
obtained between November 2015 and May 2016;
the next scheduled download of the receivers is in
May 2017.
In November of 2015 we tagged 70
yearling Bloater (mean length 174 mm) with
either Vemco V7- or V9-69 kHz tags, and
released those fish, along with ~1,700 untagged
yearlings and ~38,000 untagged fingerlings into
the centre of a pre-established acoustic array in
eastern Lake Ontario (Fig. 9.1.1). The receiver
174
array (n=80 Vemco VR2W 69 kHz receivers)
detected 68 of the 70 tagged Bloater, amounting
to 577,361 detections over the 6 ½ months.
November, the month of release, had the highest
number of detections, followed by May (the
month of recovery) with lower numbers of
detections during the winter months (Fig. 9.1.2).
Initially, the highest number of detections
was near the point of release, but within 1.2 days
Bloater were detected in the northern portion of
the St. Lawrence channel, representing the
maximum extent of the array (linear distance 13.6
km from point of release). We estimate that 55%
9. Research Activities
FIG. 9.1.1. Acoustic receiver layout in the St Lawrence Channel of eastern Lake Ontario used to assess post-stocking behaviour and
survival of Bloater, Coregonus hoyi. The array consists of eighty 69
kHz receivers. The star indicates the point of release, while the cir-cles indicate receivers that were downloaded in May 2016 to assess
initial post-stocking behaviour.
FIG. 9.1.2. Monthly sum of detections (bars) and number of unique
Bloaters detected per month (numbers within bars).

Section 9. Research Activities
175
of the tagged Bloater emigrated from the array
(average 12.9 ± 31.8 days post release, range 0.4
to 189.9 d). Bloater appear to have largely
emigrated along the long-axis of the channel, with
about half of the fish moving toward the Lake
Ontario main basin. Preliminary analyses suggest
the stocked Bloater were more likely to occur
where other Bloater were detected , suggestive of
a schooling behaviour characteristic of wild
populations. At the time that the array was
downloaded (6 ½ months post-release), eight tags
(12%) were actively moving within the array. If
we exclude the individuals that emigrated from
the array (for which we are unable to assign fate),
six-month survival would be estimated at 26%
(8/31). More unique tags were detected in May
(n=23) than in any month other than November
when the Bloater were released, suggesting that
some fish returned to the array in May – further
substantiating our interpretation that some of the
Bloater survived beyond the 6 ½ month study
period.
All receivers downloaded in May were re-
deployed, along with 23 additional receivers to
continue to track the behaviour and survival of
stocked Bloater. In November 2016,
161,680 Bloater (see Section 8.4) were stocked by
MNRF including 24 tagged fish. Half of these
tagged Bloater contained V9 detection tags used
in 2015, while the other half contained V9-pt tags
which report on the depth and temperature of the
fish as it moves through the array. This
information will further our understanding of
factors influencing the behaviour and distribution
of Bloater. Additional funding from the Great
Lakes Fishery Commission will enable us to tag
additional Bloater in 2017 and 2018, while also
collecting in situ environmental and biological
data further informing our knowledge of Bloater
ecology and their potential to re-establish in Lake
Ontario.
With support from Ontario’s Great Lakes
Protection Act and NYSDEC, we tagged 30 adult
Lake Trout on spawning shoals in the vicinity of
our array, with the hope that we will learn more
about the interaction between Bloater and Lake
Trout; a predator that historically preyed upon
Bloater in Lake Ontario. We expect to tag more
Lake Trout and sub-adult Chinook Salmon in
2017 and will report on all three species in future
Annual Reports.

Section 9. Research Activities
176
In the first year of the study, 2014, we
attached 22 pDSTs to trout and salmon in Lake
Ontario, with the tags programmed to record
depth and temperature every 70 s before popping
off the fish after one year. Recovery of these tags
has relied on tags being found and returned by the
public – a $100 reward has been offered as an
incentive. Among the 22 fish tagged in 2014, six
tags were recovered (27%) – among these six, the
longest interval between tagging and tag recapture
was 466 days. Among 56 fish we tagged in 2015
(scheduled pop off in summer or fall 2016), 15
have thus far been returned to us (27%), although
we expect a few more of these tags to be found in
the spring and/or summer of 2017. In our final
year of tagging (2016), we deployed an additional
40 tags, which are not scheduled to pop off until
July 2017. In total, we have tagged 118 fish with
33 tags recovered at the time of writing (Table
9.2.1). The tags recovered in each year have been
a mixture of: a) fish caught by anglers with tags
still attached (n=7), b) tags found on shore,
popped-off as scheduled (n=11), c) tags found on
shore, popped/broken off prematurely (n=2), and
d) tags found on shore with the bridle still
attached, indicating the fish likely died at some
point after release (n=13, all hatchery fish) (Fig
9.2.1).
The most obvious trend that appears when
visually examining the data for each fish is a
remarkable variation within and among
individuals in vertical distribution and behaviour
(Fig. 9.2.2). For instance, some individuals will
exhibit strong diel (day-night) vertical movement
patterns while other individuals show little or no
diel behaviour (Fig. 9.2.2).
9.2 Understanding Depth and Temperature Preference of Lake Ontario Salmonids Using Novel Pop-off Data Storage Tags
Project leads: Tim Johnson (OMNRF-ARMS),
Aaron Fisk, Graham Raby, Tom Stewart (Great
Lakes Institute for Environmental Research,
University of Windsor)
Collaborators: New York State Department of
Environmental Conservation
Funding: Great Lakes Protection Plan / Canada-
Ontario Agreement, Great Lakes Fisheries
Commission
Lake Ontario contains six salmonid species,
with potential for inter-species competition for
food resources. Recreational fisheries for Chinook
Salmon (Oncorhynchus tshawytscha) and
Rainbow Trout (Oncorhynchus mykiss) are
sometimes perceived to be in conflict with efforts
to rehabilitate Atlantic Salmon (Salmo salar) and
Lake Trout (Salvelinus namaycush), owing to
concerns about competition for food and
spawning habitat. Understanding the movement,
behaviour, and habitat preferences of these
species in a large and ever-changing ecosystem
like Lake Ontario is not an easy task. Pop-off
data storage tags (pDST) became available for
freshwater fish for the first time in 2013 and
provide an opportunity to collect new and
unprecedented information on depth and
temperature of fishes in the wild. These pDST
record data at specified time intervals and then
release from the fish on a programmed date,
floating to the surface where they can be
recovered.
TABLE. 9.2.1. Number of fish tagged and tags recovered, by species in Lake Ontario between 2014 and 2016. Days elapsed is the range of days between when then fish was released and the tag recovered. Linear distance is the straight line distance from the point of release of the tagged
fish and the reported location where the tag was found, and should not be viewed as an indicator of fish movement.
Number tagged Number recovered Days elapsed Linear distance (km)
Chinook 32 9 60 - 437 23 - 260
Lake Trout – wild 40 6 102 - 580 Apr-66
Lake Trout – hatchery 10 4 --- ---
Atlantic – wild 1 0 --- ---
Atlantic – hatchery 20 9 --- ---
Rainbow Trout 10 3 24 - 46 108 - 278
Brown Trout 5 2 67 - 467 Oct-45

Section 9. Research Activities
177
FIG. 9.2.1. Maps of release and recapture locations for pDSTs for Chinook Salmon (upper left), Lake Trout (upper right) and Rainbow and Brown Trout (combined, lower) in Lake Ontario 2014-16. The numbers shown above (or adjacent to) each recapture point (the large symbols)
indicates the number of days between release and recapture of the tag/fish. “Bridle” refers to the plastic components used to externally attach to
the fish via plastic monofilament lines running through the dorsal musculature.
FIG. 9.2.2. Depth distribution for two different Chinook Salmon during the month of July 2015. The dark bands represent nighttime, while the
white bands represent daytime.

Section 9. Research Activities
178
As expected, some differences among
species emerge (Fig. 9.2.3). The two species for
which we have the greatest number of returned
tags are Chinook and Lake Trout (nine and six
respectively, among Charter-caught fish). These
show clear differentiation in thermal and vertical
habitat use at most times of the year. In general,
Lake Trout seem to be much less active than
Chinook in terms of vertical movements, often
staying within 1-2 m of the same depth for an
entire day, whereas Chinook frequently undergo
vertical movements of 10-20 m or more. Median
depth for Chinook ranged between ~10-20 m
during the summer fishing months (May through
September), whereas the median depth for Lake
Trout was ~20-40 m, although, there was some
overlap in the depth distribution for the two
species in most of these months (Fig. 9.2.3a). As
expected, Rainbow Trout and especially Brown
Trout appear to be more surface oriented than
either Chinook Salmon or Lake Trout, but we
have very few tags on which to base these
generalizations at this point (Fig. 9.2.3a). One
between-species difference that is very clear from
the tags we have been able to retrieve so far is the
enormous divergence in vertical behaviour and
thermal experience between Chinook Salmon and
Lake Trout during the winter (Fig. 9.2.3a and b).
Chinook Salmon primarily occupied waters in the
4-5 °C range, while Lake Trout were mostly
confined to the 0-4 °C range. More interestingly,
Chinook appear to forage very actively in the
winter and in the deeper parts of the lake, based
on the enormous depth ranges (Fig. 9.2.3a)
exhibited by fish on a monthly, daily, and even
hourly basis (for an example of this behaviour see
Fig. 9.2.4).
FIG. 9.2.3.Species comparison of depth (upper) and temperature (lower) distributions by month. The numbers along the bottom of each plot indicate the number of unique fish represented in the dataset for each month. The centre-line in the boxplots shows the median value, the upper
and lower ends of each box represent the 75th and 25th percentiles, respectively, and the whiskers show either the maximum/minimum value or
1.5 times the inter-quartile range (the length of the box), whichever is closer to the median. In most cases, additional values are shown beyond the whiskers (i.e., beyond 1.5× the inter-quartile range). Traces for each tag were manually inspected and data removed after the tag released
from the fish or after the time the fish was caught. Likewise, the first 10 days of each tag’s data was trimmed off to allow the fish a ‘recovery’
period following capture and tagging.

Section 9. Research Activities
FIG. 9.2.4.4 Depth and temperature data for one week in February 2016 for a Chinook salmon in Lake Ontario. The top line corresponds to the left axis (depth), while the (virtually-flat) bottom line corresponds to temperature (right axis). Daytime is marked by white vertical bands, while
nighttime is marked with grey bands. Date (year-month-day) and time are shown on the x-axis.
Given that 28 more tags are scheduled to
release from fish in 2017 and that a few more
already-released tags may be found and returned
throughout 2017, analyses of these data aimed at
quantifying interspecific, seasonal, and diel
differences in depth and temperature will not be
finalized until early 2018. The data collected
through this study will be used to provide never
before seen detail of the temperature and
behaviour of these trout and salmon species in
Lake Ontario. Such information can be used to
drive bioenergetic models to understand growth
rate potential and food consumption rates, as well
as an improved understanding of the potential
resource overlap among multiple species.
Modelled results will help us better understand
the interaction amongst predators and between
predators and their food, as well as how species
may respond to climatic and other environmental
changes.
179

Section 9. Research Activities
180
9.3 An Interactive Tool for Assessing the Energetic Demand of Stocked Predators in Lake Ontario
Project Leads: Jeff Buckley & Tim Johnson
(OMNRF-ARMS)
Partners: Lake Ontario Management Unit, New
York State Department of Environmental
Conservation, United States Geological Survey.
Funding: OMNRF-ARMS base
Lake Ontario and its tributaries provide
world-class angling opportunities and fuel a multi
-million dollar recreational fishery. Alewife, the
most abundant prey fish species in Lake Ontario,
is a major prey item for these salmon and trout
species; however, each salmon and trout species
utilizes this prey resource differently throughout
their life histories. As changes to stocking levels
occur and the effectiveness of net pen stocking is
better understood, the Lake Ontario Committee
expressed interest in developing a tool, modeling
the effects of different stocking scenarios on prey
availability. In response, an interactive tool was
developed to visualize how different stocking
scenarios (total numbers stocked and which
species) could affect the total consumption of
prey species (specifically Alewife). The outputs
from these models will aid lake managers in
stocking decisions with the ultimate goal of
maintaining predator-prey balance in Lake
Ontario.
The tool uses an underlying bioenergetics
model based on the diet, physiology, and survival
of predator species. The tool uses input stocking
numbers for six predator species: Chinook
Salmon (Oncorhynchus tshawytscha), Coho
FIG. 9.3.1. User interface for the primary predator energy demand tool. Bar graph shows the total annual consumption by stocked predators. Past consumption is based on historic stocking data. Future consumption is updated in real time with slider inputs of stocking numbers for each
species/year.

Section 9. Research Activities
181
FIG. 9.3.2. Secondary user interface for the predator energy demand tool. Graph shows total consumption by Chinook salmon (a) and Lake Trout (b). User selects a species and inputs two stocking scenarios. Output figure shows predicted change in consumption for each scenario
(white and black area graphs) over the following decade given a consistent use of input stocking numbers.
Salmon (O. kisutch), Atlantic Salmon (Salmo
salar), Lake Trout (Salvelinus namaycush),
Rainbow Trout (O. mykiss), and Brown Trout
(Salmo trutta). With these data it calculates the
total annual consumption for each predator. The
tool requires no previous knowledge of
bioenergetics models, but allows managers to
easily use them to model effects of different
predator stocking scenarios.
Fig. 9.3.1 shows the primary user interface
of the tool. Users can set individual stocking
levels for each predator up to five years into the
future. The bioenergetics model output is
translated into a simple timeline showing the
expected predator demand, which includes past
consumption based on historic stocking data, and
expected consumption up to 10 years into the
future.
The tool also contains a secondary interface
that allows the user to visualize the change in
consumption for a predator species given different
long-term, consistent, stocking levels. For
example, Fig. 9.3.2a shows the reduction in
consumption by stocked Chinook Salmon when a
25% reduction from current stocking numbers is
applied for the next five years. Fig. 9.3.2b shows
how the same decrease in Lake Trout stocking
over the next five years would affect
consumption. Despite a decrease in stocking by
an equal proportion of fish in both scenarios, a
decrease in Chinook is expected to result in a
substantially larger decrease in prey consumption
as individual Chinook Salmon eat a significantly
larger amount of prey than Lake Trout over their
lifetime.
(b)
(a)

Section 9. Research Activities
182
9.4 Comparative Ecology of Juvenile Salmonids in Lake Ontario Project leads: Changhai Zhu & Tim Johnson
(OMNRF-ARMS)
Collaborators: Lake Ontario Management Unit,
Toronto and Region Conservation Authority, New
York State Department of Environmental
Conservation
Funding: Great Lakes Protection Act / Canada-
Ontario Agreement
Lake Ontario contains two native (Atlantic
Salmon (Salmo salar) and Lake Trout (Salvelinus
namaycush)) and four introduced salmonid
species (Chinook Salmon (Oncohynchus
tshawytscha), Coho Salmon (O. kisutch), Brown
Trout (Salmo trutta), and Rainbow Trout (O.
mykiss)). These fish species are important both
ecologically and economically. Adult salmonids
function as top predators in the Lake Ontario fish
community and support a large recreational
fishery. While the stream dwelling juvenile life
stage and lake dwelling adult life stage have both
been well studied, very little is known about the
ecology of these fish at the juvenile life stage
when they first exit natal streams and begin their
lake dwelling phase. This transition from lotic to
lentic habitats likely bring with it new challenges
(e.g., possibly different food resources, fish
community inhabitants, and fish community
interactions) that may influence their success later
in life. Improved understanding of this life stage
could provide valuable insight into the ecology of
these species and improve our knowledge of fish
production. To address this knowledge gap we
collected diet and stable isotope samples from
lake dwelling juvenile fish throughout the course
of three summers (2012-2014) largely from
Canadian waters of Lake Ontario. With these
data we explored ecological differences in
morphology, feeding, and trophic position
amongst juvenile salmonid species during the first
year of their residency in Lake Ontario. We
utilized a variety of metrics to build a cohesive
ecological story. Length/weight relationships and
body size were used to approximate growth rates.
Stomach contents and stable isotopes were used to
examine variation in diet composition as well as
niche space occupancy and overlap among
juvenile salmonids. Additionally, energy density
was used as a measure of overall well-being. By
using this suite of metrics, our interpretation of
inter- and intra-specific differences in growth and
diet was robust, and provided greater confidence
in ascribing differences to intrinsic and
environmental variability in the nearshore of Lake
Ontario.
Between May 2012 and October 2014, a
total of 1,881 salmonids were collected from over
30 different locations across Lake Ontario (Fig.
9.4.1). Multiple sampling gears (e.g., small-mesh
gillnets, beach seines, electrofishing) were used to
target juvenile salmonids. Using break-point
analysis on our entire catch we determined that
FIG. 9.4.1. Map of Lake Ontario and sampling sites. Size of diamonds are related to the number of fish sampled at each
location. Very small: < 20, small: 20-49, medium: 50 – 99, large: > 100.

Section 9. Research Activities
183
the transition to piscivory (a diet composed
entirely of prey fish) was essentially complete in
fish >320mm in length. Thus, we termed fish
<320 mm “juveniles” and limited our analysis to
these 449 individual fish. We further subdivided
the juveniles into three size groups based on the
level of piscivory that was observed. Fish less
than 100 mm consumed no fish and were
classified as small. Fish between 100-200 mm
showed some evidence of piscivory and were
classified as medium. Fish larger than 200 mm
exhibited a high degree of piscivory and were
classified as large.
While all salmonid species generally
exhibited isometric growth (weight increased as
the cube of length), Lake Trout and Brown Trout
were slightly heavier at a given length than the
other species. Diet compositions suggested this
may be due to their tendency to shift to a diet
dominated by prey fish at a smaller size compared
to the other salmonid species.
Stomach contents were fairly uniform and
similar amongst species within the small size
category (Fig. 9.4.2). All salmonid species
underwent a diet shift from predominantly aquatic
insects when they were small to predominantly
fish as they grew larger. As a species, Rainbow
Trout has the most diverse diets, with
invertebrates continuing to contribute prominently
in all size categories.
Energy density (J·g-1 body mass) increased
throughout the year (even after controlling for
increases in fish size). From an ecological
perspective, this suggested that prey availability
was likely not limiting in terms of quality or
quantity since fish were able to exceed the caloric
intake necessary to support basic metabolic
functions. Amongst the five species, Brown
Trout had higher energy densities than all others
(except for Atlantic Salmon, which were assumed
to be of recent hatchery origin based on isotopic
signatures). The high proportion of prey fish in
Brown Trout diets likely contributed to their
elevated energy densities.
Overlap of isotopically derived niche space
was high and generally indicated that the juvenile
salmonids occupied a similar trophic level and
that they derived their energy from similar
sources (Fig. 9.4.3). That said, Lake Trout and
Brown Trout had the most unique isotopic niches
although the differences were not statistically
significant. In the case of Lake Trout this could
have been due to their unique life history at this
age (i.e., juvenile Lake Trout do not have a stream
dwelling life stage, and occupy habitats further
offshore than the other species). In the case of
Brown Trout the uniqueness of the niche is more
difficult to explain and may simply be a spurious
result of the inclusion of some fish of suspected
recent hatchery origin.
Overall, the five salmonid species appear to
have similar growth rates, condition, diets, and
utilize similar resources. The differences that
were observed tended to be in individual metrics
(e.g., diet composition) rather than across all traits
for a given species suggesting that none of the
salmonid species greatly differed from the others
in terms of diets, resources consumed, energy
FIG. 9.4.2. Proportion by volume of prey items found in stomachs of juvenile salmonids in three size classes: a) <100 mm fork length, b)
100-200 mm fork length, and c) 200-320 mm fork length.
(a)
(b)
(c)

Section 9. Research Activities
stores, or growth and development. These results
suggest that at this life stage, all of the salmonid
species present in Lake Ontario have the potential
to use and consume similar resources.
FIG. 9.4.3. 50% probability ellipses for juvenile salmonid stable isotope signatures.
184

Section 9. Research Activities
185
9.5 Station 81: Long-term Monitoring at the Base of Lake Ontario’s Food Web
Project leads: Carolina Taraborelli & Jeff
Buckley (OMNRF-ARMS)
Collaborators: Lake Ontario Management Unit,
Fisheries and Oceans Canada
Funding: OMNRF-ARMS base, Great Lakes
Protection Act / Canada-Ontario Agreement
Lower trophic levels, including algae and
zooplankton, fill an essential role in the Lake
Ontario food web. These biological communities
are the primary source of food to many important
prey fish species. Therefore, an understanding of
the lower trophic levels aids in the management of
larger piscivorous species.
Long-term monitoring is an important tool
in understanding how changes in the physical and
chemical condition of a lake affect the food web.
Beginning in 1981, Fisheries and Oceans Canada
(DFO) began reporting on the lower trophic
levels, as well as physical and chemical condition
of Lake Ontario at Station 81 (Fig. 9.5.1).
Sampling continued each summer until 1995
when the program was cancelled. Data collected
through this monitoring program culminated in a
report that demonstrated the response of lower
trophic levels to the large decrease in
phosphorous loadings in the lake and the initial
establishment of dreissenid mussels (Johannsson
et al. 1998).
In 2007, OMNRF’s Aquatic Research and
Monitoring Section reinstated the long-term
monitoring program at Station 81 in collaboration
with the Lake Ontario Management Unit and
DFO.
Station 81 is located in the centre of the
eastern basin of Lake Ontario (44º 01.02’ N, 76º
40.23’ W; Fig. 9.5.1). In 2016, samples were
collected bi-weekly from May 10th to October
19th. Data collected included profiles of
temperature, dissolved oxygen, chlorophyll-a (an
index of the amount of algae), Secchi depth
(transparency), water samples for nutrient
analysis, and samples describing the
phytoplankton and zooplankton communities.
In 2016, stratification of the water column
was first observed on June 14th and was last
observed on October 3rd. Secchi depth varied
between 5 m and 18.5 m, with a mean of 8.7 m.
Mean daily water temperature ranged from 6.1˚ C
to 23.2˚ C, with the highest average
temperature observed on August 8. Nutrient,
phytoplankton, and zooplankton samples are
currently being analysed.
Since 1981, an overall trend of increasing
mean annual water temperature has been observed
at Station 81 (Fig. 9.5.2). The lowest mean annual
temperature was in 1982 (12.5˚ C), while the
highest annual temperature was observed in 2012
(16.2˚ C).
FIG. 9.5.1. Map of Lake Ontario showing location of Station 81.
FIG. 9.5.2. Mean annual epilimnetic water temperature from 1981 to 2016. Daily water temperature was calculated as the mean
temperature of the water column from the surface to the thermocline,
or to 20 m depth if no thermocline existed. Annual means were seasonally weighted between April 1 and October 31. Trend line is
the least-squares linear regression of water temperature over time.

Section 9. Research Activities
Finally, long-term monitoring of the lake’s
tiniest biota can give us insight into how the
lake’s chemical and physical conditions influence
the lake’s biotic communities. Average annual
chlorophyll a levels and average annual primary
productivity levels (estimates of the lake’s
capacity to produce “fish food”) have declined
since the 1970s in response to reduced nutrient
levels in the lake. Both have, however, been
relatively constant over the past decade (Fig.
9.5.3).
Johannsson, O. E., Millard, E. S., Ralph, K. M., Myles, D. D., Graham, D. M., Taylor, W. D., Allen, R. E. The changing pelagia of
Lake Ontario (1981 to 1995): A report of the DFO long-term
biomonitoring (bioindex) program. Can. Tech. Rep. Fish. Aquat. Sci. No. 2243: i-ix+278pp.
FIG. 9.5.3. a) Average annual chlorophyll a levels; and, b) average annual Primary Productivity levels measured at Station 81 (May -
Oct.). Bars represent means with standard errors.
(a)
(b)
186

Section 9. Research Activities
9.6 Understanding the Vulnerability of the Great Lakes and Ontario’s Inland Lakes to Invasive Species Spread and Establishment
Project leads: Jeff Buckley, Graham Mushet &
Tim Johnson (MNRF-ARMS), Len Hunt & Allison
Bannister (MNRF-CNFER), Andrew Drake
(DFO)
Funding: Great Lakes Protection Act / Canada-
Ontario Agreement, Natural Heritage Policy
Section
Invasive species pose a threat to the
function and diversity of aquatic communities.
Over 200 species of fish, plants, and invertebrates
are currently listed as potential aquatic invaders of
Ontario and neighbouring jurisdictions in Canada
and the U.S. Here we report on our continued
progress to undertake on a vulnerability
assessment of Ontario and the Great Lakes to the
spread and establishment of aquatic invasive
species.
This project investigates both human
facilitation of the introduction and spread of
invasive species, as well as the environmental
factors that mediate their survival and
establishment. Previous work focusing on human
dimensions examines how metrics of attraction
and accessibility of lakes can define likely
pathways of invasive species spread. For
example, the size and location of towns and the
quality and locations of destination lakes can
influence the likelihood of aquatic invasive
species arrival through recreational boating. More
recent research has focused on assessing how the
thermal habitat of inland lakes will change over
time due to climate change as well as determining
habitat suitability for invasive species in the Great
Lakes.
Climate change will affect the habitat of
aquatic species as rising temperatures and
changes in precipitation may increase access to
new habitat for warm water species, while
reducing or shifting habitat northward for cool
and cold water species. Previously, Minns and
Shuter (2012) developed a seasonal temperature
model (STM) to determine temperature
187
characteristics of inland lakes in Ontario. The
STM is used to estimate the volume of discrete
thermal bins (i.e. 8-12°C) present in a lake given
local climatic conditions and morphological
characteristics of the lake. We applied the STM to
lakes sampled through Ontario’s Broad-Scale
Monitoring program using climate projection data
from three climate scenarios and three time
periods.
Lakes will see a significant decrease in cold
water habitat (8-20°C), and complementary
increases in warm water habitat (>25°C), with
longer-term and more severe scenarios resulting
in the greatest amount of change (Fig. 9.6.1).
Modification of the STM was required to
accommodate high temperatures predicted for the
long-term (2071-2100) time period and in the
minimal climate change mitigation scenario
(rcp85).
For the Great Lakes, habitat data for fish,
invertebrates, and plants have been collected in
the form of basin-wide geospatial layers (e.g.,
depth, temperature, relative exposure, light
attenuation), and preliminary habitat suitability
models have been developed to identify areas in
the Great Lakes that provide optimal habitat for
potential invasive species.
An initial grouping of species and
subsequent habitat suitability analysis has been
generated for invasive fish. Taxa were first
divided into thermal guilds (cold, cool, warm)
(Fig. 9.6.2a). These thermal guilds were then
further divided into predominantly offshore or
predominantly nearshore species. Wind and wave
exposure were applied as a third criterion as they
are also important determinants of fish habitat,
and because they tend to correlate with other
important variables such as substrate and
submerged aquatic vegetation cover. Suitability
scores were determined by computing the
geometric mean of suitability scores representing
habitat preference assigned to ranges of the
environmental variables.
An example habitat suitability analysis for
a warm-water, nearshore fish that prefers low-
energy environments indicated that Lake Erie,
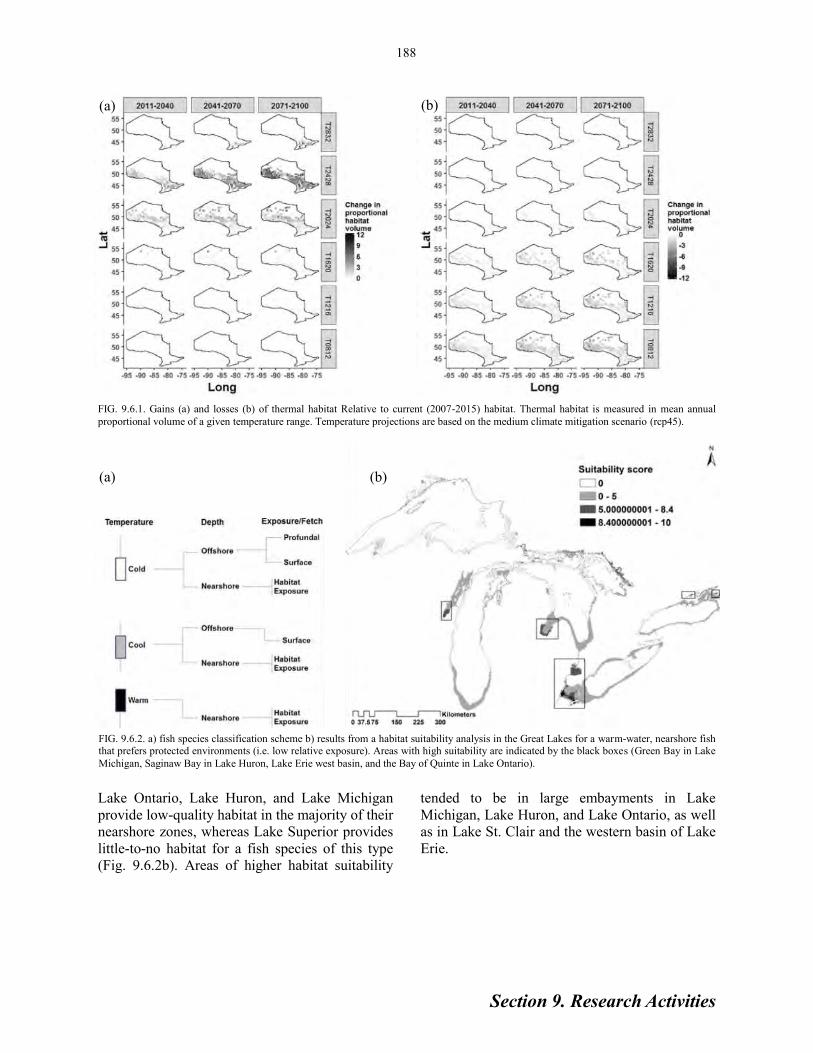
Section 9. Research Activities
Lake Ontario, Lake Huron, and Lake Michigan
provide low-quality habitat in the majority of their
nearshore zones, whereas Lake Superior provides
little-to-no habitat for a fish species of this type
(Fig. 9.6.2b). Areas of higher habitat suitability
188
tended to be in large embayments in Lake
Michigan, Lake Huron, and Lake Ontario, as well
as in Lake St. Clair and the western basin of Lake
Erie.
FIG. 9.6.2. a) fish species classification scheme b) results from a habitat suitability analysis in the Great Lakes for a warm-water, nearshore fish that prefers protected environments (i.e. low relative exposure). Areas with high suitability are indicated by the black boxes (Green Bay in Lake
Michigan, Saginaw Bay in Lake Huron, Lake Erie west basin, and the Bay of Quinte in Lake Ontario).
FIG. 9.6.1. Gains (a) and losses (b) of thermal habitat Relative to current (2007-2015) habitat. Thermal habitat is measured in mean annual
proportional volume of a given temperature range. Temperature projections are based on the medium climate mitigation scenario (rcp45).
(a) (b)
(b) (a)

Section 9. Research Activities
9.7 Development of New Fishway Counting Technology
N.J. Jakobi and M.J. Yuille, Lake Ontario
Management Unit
Lake Ontario is home to a multi-million
dollar recreational salmon and trout fishery and its
tributaries provide spawning habitat to several
migratory salmon and trout species (e.g., Chinook
Salmon, Coho Salmon, Rainbow Trout and
Brown Trout). In addition, LOMU is working to
restore Atlantic Salmon to Lake Ontario.
Understanding migration timings and patterns of
these species is critical to evaluate the success of
restoration efforts and to determine potential
overlap between species when using essential
spawning and nursery areas. Monitoring and
counting these fish during their spawning
migration provides LOMU with an index of the
species population status in the lake proper.
In the spring of 2016, LOMU acquired the
Riverwatcher Fish Counting system by VAKI
(Fig. 9.7.1) to assist in identifying adult Atlantic
Salmon returning to spawn in the Ganaraska
River. The new counter will augment the current
resistivity counter that has been traditionally used
on the Ganaraska fishway (Corbett Dam, Port
Hope, Ontario) for enumerating the spring
Rainbow Trout spawning run (see Section 1.1.1).
The Riverwatcher Fish Counting system
automatically counts fish as they pass through the
counting tunnel and records both a silhouette
image and short high resolution video for each
individual fish (Fig. 9.7.2). These features enable
the user to identify species, sex, size and
presence/absence of fin clips. The system also
records water temperatures and estimates the total
length of each fish from the silhouette image. The
ability to identify the species of each fish passing
through the Ganaraska Fishway will allow LOMU
staff to determine whether any of the recently
stocked Atlantic Salmon (see Section 6.1 and 8.2)
have returned to spawn.
With the assistance of the Ganaraska River
fishway volunteer group and OMNRF
FIG. 9.7.1. The VAKI Riverwatcher fish counter.
FIG. 9.7.2. Silhouette and video image collected by the Riverwatcher fish counter to assist with species identification and length.
189
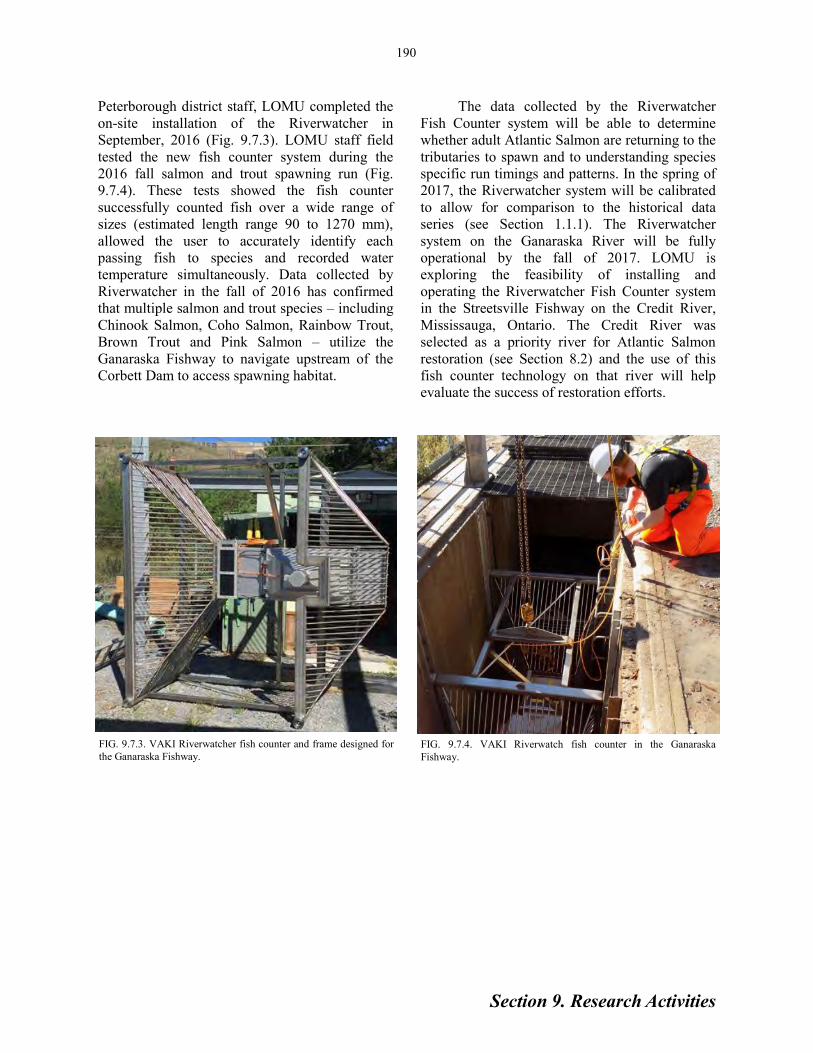
Section 9. Research Activities
Peterborough district staff, LOMU completed the
on-site installation of the Riverwatcher in
September, 2016 (Fig. 9.7.3). LOMU staff field
tested the new fish counter system during the
2016 fall salmon and trout spawning run (Fig.
9.7.4). These tests showed the fish counter
successfully counted fish over a wide range of
sizes (estimated length range 90 to 1270 mm),
allowed the user to accurately identify each
passing fish to species and recorded water
temperature simultaneously. Data collected by
Riverwatcher in the fall of 2016 has confirmed
that multiple salmon and trout species – including
Chinook Salmon, Coho Salmon, Rainbow Trout,
Brown Trout and Pink Salmon – utilize the
Ganaraska Fishway to navigate upstream of the
Corbett Dam to access spawning habitat.
The data collected by the Riverwatcher
Fish Counter system will be able to determine
whether adult Atlantic Salmon are returning to the
tributaries to spawn and to understanding species
specific run timings and patterns. In the spring of
2017, the Riverwatcher system will be calibrated
to allow for comparison to the historical data
series (see Section 1.1.1). The Riverwatcher
system on the Ganaraska River will be fully
operational by the fall of 2017. LOMU is
exploring the feasibility of installing and
operating the Riverwatcher Fish Counter system
in the Streetsville Fishway on the Credit River,
Mississauga, Ontario. The Credit River was
selected as a priority river for Atlantic Salmon
restoration (see Section 8.2) and the use of this
fish counter technology on that river will help
evaluate the success of restoration efforts.
FIG. 9.7.3. VAKI Riverwatcher fish counter and frame designed for
the Ganaraska Fishway. FIG. 9.7.4. VAKI Riverwatch fish counter in the Ganaraska
Fishway.
190

Section 10. Partnerships
191
In April 2016 the Lake Ontario
Management Unit (LOMU) worked in
conjunction with MNRF’s White Lake Fish
Culture Station (FCS) to collect Bay of Quinte
Walleye gametes. Similar projects were
conducted in spring 2013-2015. In 2016, trap
nets were set at six sites (Fig. 10.1.1, Table
10.1.1): Sherman’s Point, Trumpour Point, three
locations on the “high shore” Prince Edward
County, and Indian Point. The trap nets were set
beginning on April 5 in shoreline areas thought to
be inhabited by Walleye that were staging to
spawn. Netting took place from April 5-19.
Water temperature ranged from 3.4-7.9 oC over
this time period. Walleye, in spawning condition,
were brought by boat to the Glenora Fisheries
Station. White Lake FCS staff collected gametes
from 19 Walleye families. Approximately three
million eggs were collected and transferred to the
White Lake FCS.
Walleye gametes collected in 2016 will be
used to supply walleye fingerlings for stocking in
inland lakes. The 2016 spawn collection will also
provide wild gametes for restoration Walleye
stocking in Hamilton Harbour.
Twenty-one species and a total of 839 fish
including 78 Walleye were caught in 2016 (Table
10.1.2). Other commonly caught species
included: Cisco (223), Yellow Perch (122), White
Sucker (107), Northern Pike (52), Largemouth
Bass (51), Black Crappie (45), Pumpkinseed (43),
Bluegill (39), and Brown Bullhead (33). Catches
10. Partnerships 10.1 Walleye Spawn Collection J.A. Hoyle, Lake Ontario Management Unit
FIG. 10.1.1. Map of Bay of Quinte showing trap net locations for the 2016 Walleye spawn collection. Also shown is the location of a water temperature logger. Map courtesy of Google Earth.

Section 10. Partnerships
192
TABLE 10.1.1. Location and sampling information for the Bay of Quinte Walleye egg collection program, 2016.
TABLE 10.1.2. Summary of fish captured (21 species) at six locations during the Bay of Quinte Walleye egg collection program, 2016.

Section 10. Partnerships
in 2016 are compared with those in 2014 and
2015 in Table 10.1.3. A total of 23 species was
caught in the last three years.
The size distribution of 94 Walleye
measured for fork length is shown in Fig. 10.1.2.
Walleye sex (male, female, immature) and state of
maturity information is shown in Table 10.1.4.
Water temperature was recorded
continuously at a Long Reach shoreline site near
Sherman’s Point (Fig. 10.1.1). Water temperature
increased to about 6 oC in late March then
declined and remained lower for a period of time
before increasing again after mid-April (Fig.
10.1.3).
TABLE 10.1.3. Summary of fish captured (23 species)
during the Walleye egg collection program , April 2014,
2015 and 2016.
0
5
10
15
20
25
30
380 420 460 500 540 580 620 660 700 740
Co
un
t o
f fi
sh
Fork length category (mm)
Male Female Unknown
FIG. 10.1.2. Size distribution of (10 mm fork length categories) of 94 Walleye caught and measured during the egg collection program,
April 2016. Totals: 41 males, 41 females and 12 unknown sex.
TABLE 10.1.4. Sex and gonad classification (based on external characteristics) for 94 Walleye caught and sampled during the 2016
Walleye egg collection program.
FIG. 10.1.3. Mean daily water temperature (recorded at 1 hour intervals) at 1 m depth, east side of Long Reach near Sherman’s
Point, March 18-April 30, 2016.
193

Section 10. Partnerships
194
10.2 Observations of Aquatic Invasive Species in Lake Ontario M. Hanley, Lake Ontario Management Unit
The Lake Ontario Management Unit
continues to monitor both Lake Ontario and the
Bay of Quinte for invading aquatic species. In
2016, eDNA sampling was completed as a means
to monitor the area for Asian Carp. In addition a
report of a Tench (Tinca tinca) was received from
the St. Lawrence River.
Continued monitoring of Lake Ontario for
Asian Carp through eDNA sampling
Asian carps are a collection of carp native
to China and Southern Russia which includes
Grass, Bighead, Silver, and Black Carp. Asian
carps were introduced in the United States in the
1960s and 1970s in an effort to control algae and
zooplankton in aquaculture ponds. They have
since become established in the Mississippi River
Basin and throughout the eastern United States. In
parts of the Mississippi River, they have been
successful in replacing native species. There is
concern that these species may become
established in the Great Lakes due to their affinity
for cool to moderate water temperatures. The
nearshore Great Lakes region is similar to their
native range and has been identified as suitable
Asian carp habitat through risk assessment.
Asian carp pose a threat to the Great Lakes
due to their large size, their high fecundity, and
their ability to consume large amounts of aquatic
plants, algae, and plankton. These factors have led
to concerns for the impacts of Asian carp on
native species in Lake Ontario. Asian carps
weight two to four kg but can weigh up to 40 kg
and grow to more than a metre in length They are
able to grow more than 25 cm in their first year
alone. Asian carp are able to eat 20% of their
body weight in plankton each day and reproduce
very rapidly. For these reasons, there is concern
that Asian carps could compete with native fish
species in Lake Ontario if they were to become
established. Bighead and Silver carp consume
zooplankton and phytoplankton respectively
while Grass carp eat aquatic plants and Black carp
eat freshwater snails and mussels. Grass carp are
able to eliminate large areas of aquatic plants that
are important as fish food and as spawning and
nursery habitats. Black carp could reduce the
abundance of native snails and mussels as well as
other invertebrates. Bighead and Silver carp could
consume large amounts of the plankton biomass
available as food for native fish species. All Asian
carps can also compete directly with native fish
for space and habitat.
Fisheries and Oceans Canada (DFO), under
its Asian Carp Program, conducts early detection
surveillance activities to detect Asian carps in the
Canadian waters of the Great Lakes basin as soon
as possible after potential arrival and before a
population could establish. A co-ordinated
response system to evaluate any observations of
Asian carp has also been established between
DFO and MNRF. Conservation Authorities have
also participated in these response activities. All
these agencies conduct fisheries assessment and
sampling activities in Lake Ontario. This type of
lake-wide assessment, along with commercial
fishers, also contribute to our ability to detect this
invasive species.
Although eight Grass Carp were captured
in Lake Ontario in 2015, in 2016 no Asian carp
were detected through netting methods completed
by DFO in the Canadian Waters of Lake Ontario.
In addition to the Asian carp targeted netting
efforts of DFO and OMNRF electrofishing and
netting methods, OMNRF monitors Lake Ontario
and the Bay of Quinte for Asian carps using
environmental DNA (eDNA). eDNA sampling
detects DNA shed from fish species and uses
various genetic markers to identify which fish
species left behind the DNA sample. In this
monitoring program, the water samples collected
in each area are assessed for the presence of the
genetic markers of each of the four species of
Asian carps listed above. In aquatic environments,
eDNA is diluted and distributed by currents and
other hydrological processes, lasting about 7–21

Section 10. Partnerships
days, depending on environmental conditions.
LOMU staff collected water samples during the
weeks of August 29 to September 2 and
September 5 to September 9, 2016 following
MNRF’s eDNA monitoring and surveillance
standard operating procedures (Wilson et al.,
2014). During these two weeks, 17 sites were
sampled; locations within West Lake, East Lake,
Presqu’ile Bay, Weller’s Bay, Trenton, Salmon
River, Muscote Bay, and Marysville Creek were
all surveyed (FIG. 10.2.1). The number of
locations where a water sample was collected
within each site is outlined in TABLE 10.2.1.
Water samples were filtered at OMNRF Aquatic
Research and Monitoring Section Genetics
Laboratory or at the Lake Ontario Management
Unit. No genetic markers from any of the four
species of Asian carps were detected at any of the
sampled sites.
Wilson, C., J. Bronnenhuber, M.Boothroyd, C.Smith, and K. Wozney. 2014. Environmental DNA
(eDNA) monitoring and surveillance: field and laboratory standard
operating procedures. OMNRF Aquatic Research Series 2014-05.
Capture of Tench in the St. Lawrence River
On September 23, 2016, the Lake Ontario
Management Unit (LOMU) received a report of a
possible Tench (Tinca tinca), an invasive fish,
that was caught in Lake St. Francis near
Bainsville, Ontario by a commercial fisher (FIG.
10.2.2). Using a photograph, the fish was
identified as a Tench by MNRF (FIG. 10.2.3).
The identity was confirmed by a professor at the
University of Toronto that is conducting research
on Tench. The fish was frozen and shipped to
LOMU for further identification and biological
sampling and the stomach will be given to McGill
University for further study. The Tench was male,
395 mm long and weighed 1,111 g.
Tench are a member of the Cyprinidae
(carps and minnows) family and are usually 20-25
cm long and can reach a maximum size of 70 cm.
They are dark olive to pale golden tan with a
white to bronze belly and reddish-orange eyes.
Their fins are dark and rounded with no bony
spines and the scales are small and embedded in
thick skin. The mouth is narrow and there is a
small barbel at each corner. Male Tench are easily
identifiable by a thick, fleshy, and flattened
Site
Number of
locations sampled
within the site
Location
of filtering
West Lake 3 ARMS
East Lake 3 ARMS
Presqu'ile Bay 3 LOMU
Weller's Bay 2 LOMU
Trenton 3 LOMU
Salmon River 1 LOMU
Muscote Bay 1 LOMU
Marysville Creek 1 LOMU
FIG. 10.2.1. Locations of Asian Carp eDNA sampling in 2016.
TABE 10.2.1. The number of locations within a site where water samples were collected, and the location of filtering.
second ray on their pelvic fins where females do
not possess a thickened second ray.
Tench are native to Europe and Western Asia.
To date, a wild population of Tench is not known
to occur in any Ontario waters. A population of
Tench was found in an isolated farm pond near
Orangeville, Ontario in 2014. This population
was eradicated through actions taken by MNRF
and the landowner in fall 2014 and spring 2015.
Monitoring activities in the pond and adjacent
streams have continued in 2016 to ensure that the
project was a success. In Canada the fish is found
only in the Columbia watershed in British
Columbia and the Richelieu River in Quebec. It is
well established in the United States, particularly
in the Mississippi River watershed. The
195
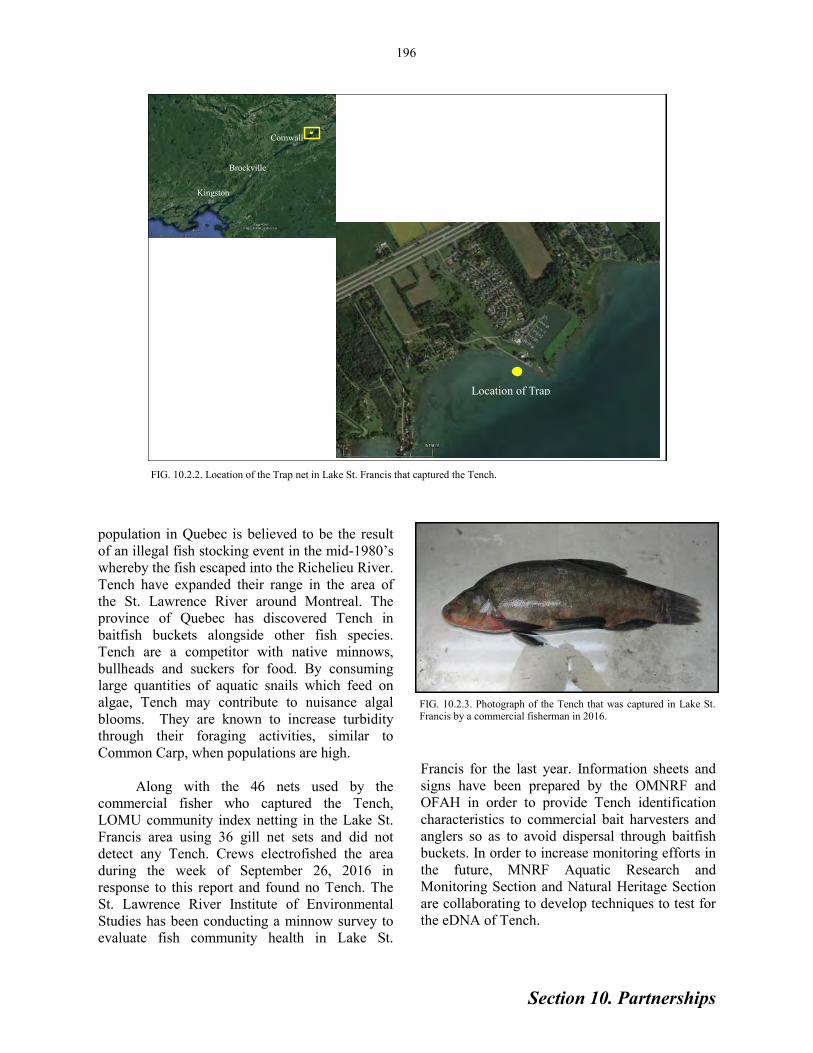
Section 10. Partnerships
population in Quebec is believed to be the result
of an illegal fish stocking event in the mid-1980’s
whereby the fish escaped into the Richelieu River.
Tench have expanded their range in the area of
the St. Lawrence River around Montreal. The
province of Quebec has discovered Tench in
baitfish buckets alongside other fish species.
Tench are a competitor with native minnows,
bullheads and suckers for food. By consuming
large quantities of aquatic snails which feed on
algae, Tench may contribute to nuisance algal
blooms. They are known to increase turbidity
through their foraging activities, similar to
Common Carp, when populations are high.
Along with the 46 nets used by the
commercial fisher who captured the Tench,
LOMU community index netting in the Lake St.
Francis area using 36 gill net sets and did not
detect any Tench. Crews electrofished the area
during the week of September 26, 2016 in
response to this report and found no Tench. The
St. Lawrence River Institute of Environmental
Studies has been conducting a minnow survey to
evaluate fish community health in Lake St.
Kingston
Brockville
Cornwall
Location of Trap
FIG. 10.2.2. Location of the Trap net in Lake St. Francis that captured the Tench.
Francis for the last year. Information sheets and
signs have been prepared by the OMNRF and
OFAH in order to provide Tench identification
characteristics to commercial bait harvesters and
anglers so as to avoid dispersal through baitfish
buckets. In order to increase monitoring efforts in
the future, MNRF Aquatic Research and
Monitoring Section and Natural Heritage Section
are collaborating to develop techniques to test for
the eDNA of Tench.
FIG. 10.2.3. Photograph of the Tench that was captured in Lake St. Francis by a commercial fisherman in 2016.
196
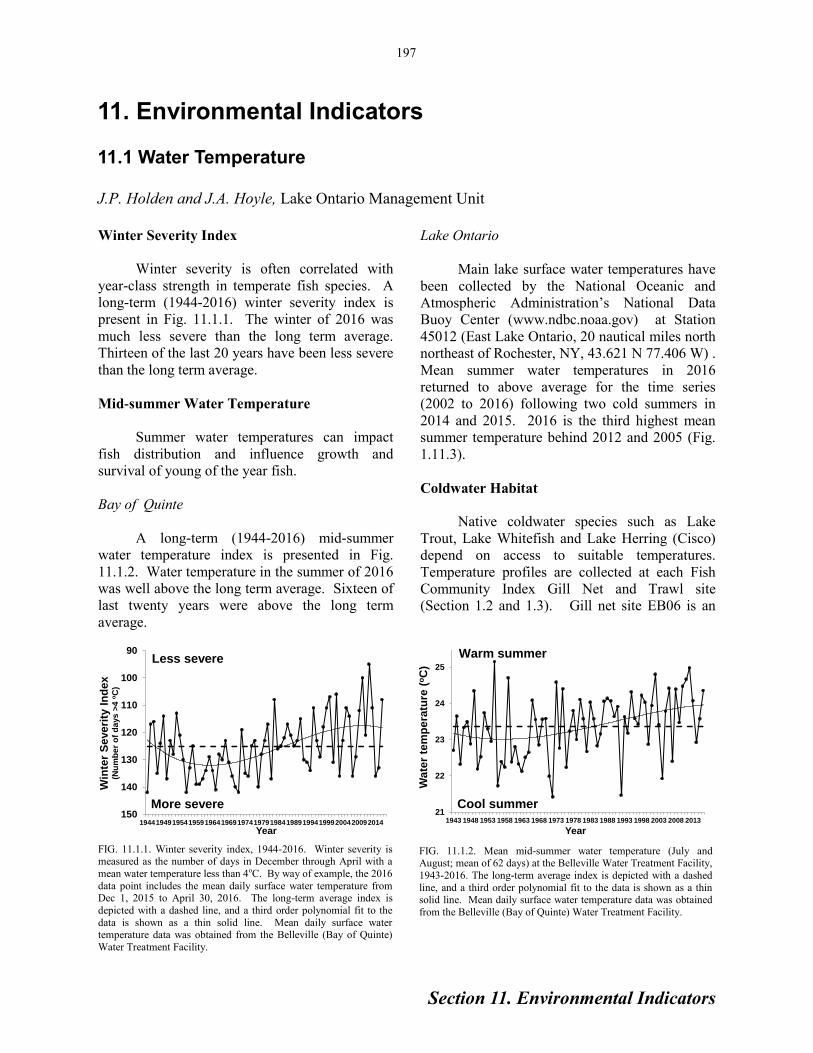
Section 11. Environmental Indicators
197
Winter Severity Index
Winter severity is often correlated with
year-class strength in temperate fish species. A
long-term (1944-2016) winter severity index is
present in Fig. 11.1.1. The winter of 2016 was
much less severe than the long term average.
Thirteen of the last 20 years have been less severe
than the long term average.
Mid-summer Water Temperature
Summer water temperatures can impact
fish distribution and influence growth and
survival of young of the year fish.
Bay of Quinte
A long-term (1944-2016) mid-summer
water temperature index is presented in Fig.
11.1.2. Water temperature in the summer of 2016
was well above the long term average. Sixteen of
last twenty years were above the long term
average.
11. Environmental Indicators 11.1 Water Temperature J.P. Holden and J.A. Hoyle, Lake Ontario Management Unit
Lake Ontario
Main lake surface water temperatures have
been collected by the National Oceanic and
Atmospheric Administration’s National Data
Buoy Center (www.ndbc.noaa.gov) at Station
45012 (East Lake Ontario, 20 nautical miles north
northeast of Rochester, NY, 43.621 N 77.406 W) .
Mean summer water temperatures in 2016
returned to above average for the time series
(2002 to 2016) following two cold summers in
2014 and 2015. 2016 is the third highest mean
summer temperature behind 2012 and 2005 (Fig.
1.11.3).
Coldwater Habitat
Native coldwater species such as Lake
Trout, Lake Whitefish and Lake Herring (Cisco)
depend on access to suitable temperatures.
Temperature profiles are collected at each Fish
Community Index Gill Net and Trawl site
(Section 1.2 and 1.3). Gill net site EB06 is an
FIG. 11.1.1. Winter severity index, 1944-2016. Winter severity is measured as the number of days in December through April with a
mean water temperature less than 4oC. By way of example, the 2016
data point includes the mean daily surface water temperature from Dec 1, 2015 to April 30, 2016. The long-term average index is
depicted with a dashed line, and a third order polynomial fit to the
data is shown as a thin solid line. Mean daily surface water temperature data was obtained from the Belleville (Bay of Quinte)
Water Treatment Facility.
FIG. 11.1.2. Mean mid-summer water temperature (July and August; mean of 62 days) at the Belleville Water Treatment Facility,
1943-2016. The long-term average index is depicted with a dashed
line, and a third order polynomial fit to the data is shown as a thin solid line. Mean daily surface water temperature data was obtained
from the Belleville (Bay of Quinte) Water Treatment Facility.
21
22
23
24
25
1943 1948 1953 1958 1963 1968 1973 1978 1983 1988 1993 1998 2003 2008 2013
Wate
r te
mp
era
ture
(oC
)
Year
Warm summer
Cool summer
90
100
110
120
130
140
150194419491954195919641969197419791984198919941999200420092014
Win
ter
Se
ve
rity
In
dex
(Nu
mb
er
of
da
ys
>4
oC
)
Year
Less severe
More severe
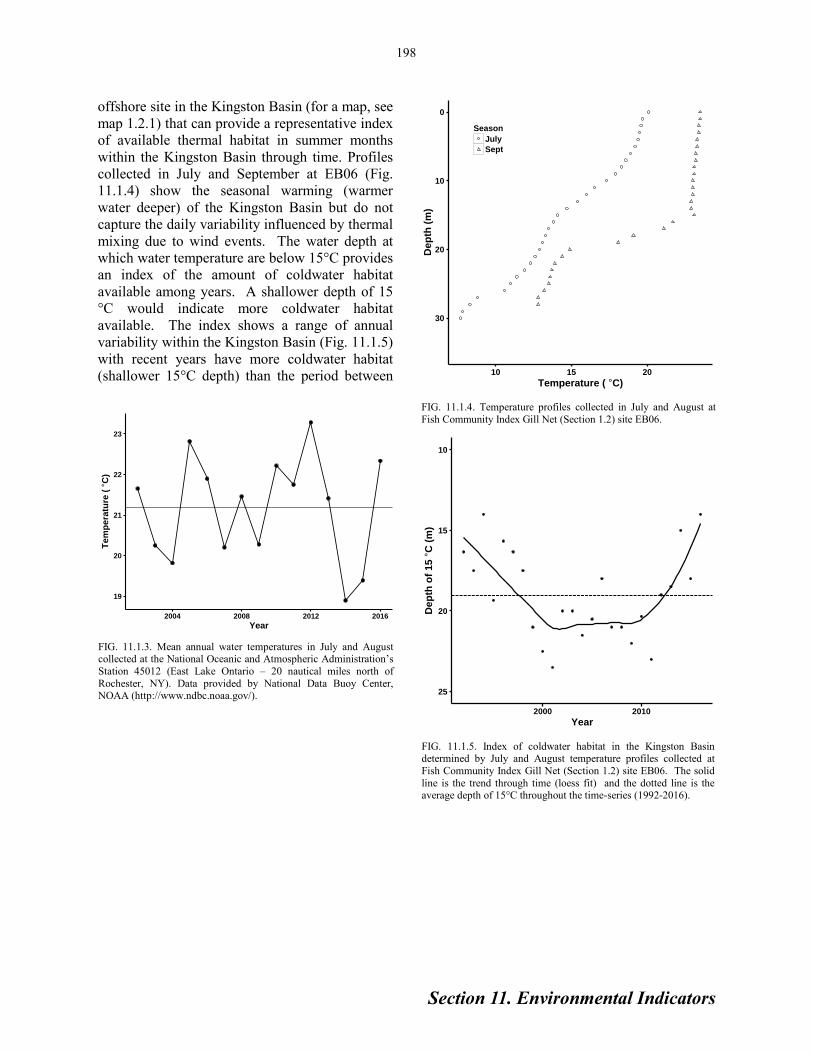
Section 11. Environmental Indicators
198
offshore site in the Kingston Basin (for a map, see
map 1.2.1) that can provide a representative index
of available thermal habitat in summer months
within the Kingston Basin through time. Profiles
collected in July and September at EB06 (Fig.
11.1.4) show the seasonal warming (warmer
water deeper) of the Kingston Basin but do not
capture the daily variability influenced by thermal
mixing due to wind events. The water depth at
which water temperature are below 15°C provides
an index of the amount of coldwater habitat
available among years. A shallower depth of 15
°C would indicate more coldwater habitat
available. The index shows a range of annual
variability within the Kingston Basin (Fig. 11.1.5)
with recent years have more coldwater habitat
(shallower 15°C depth) than the period between
FIG. 11.1.4. Temperature profiles collected in July and August at
Fish Community Index Gill Net (Section 1.2) site EB06.
FIG. 11.1.5. Index of coldwater habitat in the Kingston Basin determined by July and August temperature profiles collected at
Fish Community Index Gill Net (Section 1.2) site EB06. The solid
line is the trend through time (loess fit) and the dotted line is the average depth of 15°C throughout the time-series (1992-2016).
FIG. 11.1.3. Mean annual water temperatures in July and August collected at the National Oceanic and Atmospheric Administration’s
Station 45012 (East Lake Ontario – 20 nautical miles north of
Rochester, NY). Data provided by National Data Buoy Center, NOAA (http://www.ndbc.noaa.gov/).
19
20
21
22
23
2004 2008 2012 2016
Year
Te
mp
era
ture
( °
C)
0
10
20
30
10 15 20
Temperature ( °C)
De
pth
(m
)
Season
July
Sept
10
15
20
25
2000 2010
Year
Dep
th o
f 15 °
C (
m)

Section 11. Environmental Indicators
199
11.2 Wind
M.J. Yuille and J.P. Holden, Lake Ontario Management Unit
National Oceanic and Atmospheric
Administration (NOAA) records multiple weather
variables using a variety of weather buoys
deployed throughout Lake Ontario. Buoy data are
available through the National Data Buoy Center
webpage hosted by NOAA (http://
www.ndbc.noaa.gov/). The Rochester weather
buoy (Station 45012, East Lake Ontario, 20
nautical miles north northeast of Rochester, NY,
43.621 N 77.406 W) records several
environmental variables, including wind direction
and velocity (m·s-1). Wind direction and velocity
can affect both the Lake Ontario ecosystem (e.g.,
thermal mixing, fish distribution) and the
recreational fishery (e.g., total angler effort and
the distribution of effort on Lake Ontario).
Two indices were developed to provide a
wind index on Lake Ontario from 2002 – 2016
(Fig. 11.2.1). Small Craft Wind Warnings are
issued for Lake Ontario by Environment Canada
when wind velocities measure 20 – 33 knots
(http://weather.gc.ca/marine/). The Small Craft
Index represents the total number of hours from
July 1st to August 31st each year, where the wind
velocity was greater than or equal to 20 knots.
This index shows that since 2007, the years 2010,
2011 and 2014 had higher than average small
craft warnings (Fig. 11.2.1a). The number of
small craft warning hours increased from 2015 to
2016, but the total number of hours in July and
August remained below the long-term average
(Fig. 11.2.1a). A second index, the East Wind
Index, was calculated to determine the total
number of hours between July 1st and August
31st, each year, that an eastern wind
predominated (Fig. 11.2.1b). This index shows
that 2016 had the highest incidences of east winds
since 2007; well above the long-term average
(Fig. 11.2.2).
Lastly, wind direction and velocity have
been summarized for the months of July and
August from 2014 – 2016 (Fig. 11.2.2). These
analyses show the seasonal and annual variability
in wind patterns on Lake Ontario. While,
southwestern winds generally predominate
through July and August (Fig. 11.2.2), the
variability that exists may impact the Lake
Ontario ecosystem as well as the recreational
fishery.
FIG. 11.2.1. : Lake Ontario wind as characterized by the Small Craft Index (a) and East Wind Index (b). The Small Craft Index represents
the total number of hours from July 1 to August 31 each year where
the wind velocity was ≥ 20 knots. The East Wind Index represents the number of hours from July 1st to August 31st each year that an
eastern wind predominated. Data provided by National Data Buoy
Center, NOAA (http://www.ndbc.noaa.gov/).
Sm
all
Cra
ft I
nd
ex
0
10
20
30
40
50(a)
20
02
20
03
20
04
20
05
20
06
20
07
20
08
20
09
20
10
20
11
20
12
20
13
20
14
20
15
20
16
Ea
st
Win
d I
nd
ex
0
100
200
300
400(b)

Section 11. Environmental Indicators
200
FIG. 11.2.2. Wind direction and velocity represented as a proportional frequency of occurrence for July and August in 2014 – 2016. Wind velocities of 0 – 1 knots are light grey, 1 – 2 knots are medium grey and > 2 knots are dark grey. Data provided by National Data Buoy
Center, NOAA (http://www.ndbc.noaa.gov/).
July August
2014
Frequency of counts by wind direction (%)
W
S
N
E
5%
10%
15%
20%
25%
30%
mean = 0.372
calm = 0%
0 to 1 1 to 2 2 to 4
(m s1)
Frequency of counts by wind direction (%)
W
S
N
E
5%
10%
15%
20%
25%
mean = 0.43
calm = 0%
0 to 1 1 to 2 2 to 4
(m s1)
2015
Frequency of counts by wind direction (%)
W
S
N
E
5%
10%
15%
20%
25%
30%
35%
40%
mean = 0.253
calm = 0%
0 to 1 1 to 2 2 to 4
(m s1)
Frequency of counts by wind direction (%)
W
S
N
E
5%
10%
15%
20%
25%
30%
35%
40%
mean = 0.427
calm = 0%
0 to 1 1 to 2 2 to 4
(m s1)
2016
Frequency of counts by wind direction (%)
W
S
N
E
5%
10%
15%
20%
25%
30%
35%
40%
mean = 0.391
calm = 0%
0 to 1 1 to 2 2 to 4
(m s1)
Frequency of counts by wind direction (%)
W
S
N
E
2%
4%
6%
8%
10%
12%
14%
16%
18%
20%
mean = 0.382
calm = 4.7%
0 to 1 1 to 2 2 to 4
(m s1)

Section 11. Environmental Indicators
201
11.3 Water Clarity J.P. Holden, Lake Ontario Management Unit
Summer Water Transparency
Water clarity is measured using a Secchi
disk at each Fish Community Index Gill Netting
site. The maximum depth the Secchi disk can be
observed is an index of water clarity. Mean
annual water clarity varies between the Bay of
Quinte, Kingston Basin and the eastern portion of
Lake Ontario (measured at Rocky Point gill net
sites). Bay of Quinte Secchi depths are generally
lower (less clear) than main lake sites and have
been stable since the early 2000s. Mean Secchi
FIG. 11.3.1. Mean annual water clarity determined by Secchi disk readings collected at Fish Community Index Gill Net sites in June, July and August.
depth in the Bay of Quinte was deeper in 2016
(2.1 m) compared to 2015 (1.5 m) but within the
expected range for the time series. Kingston Basin
and Rocky Point had a mean Secchi depth
shallower in 2016 (KB = 7.0 m, RP = 7.6) than in
2015 (KB=8.1 m, RP = 9.8 m). The 2016 values
are more consistent with the long term trend
compared to the low values observed in 2014 and
2015.
BQ KB RP
0
5
10
15
2000 2010 2000 2010 2000 2010
YEAR
Secch
i D
ep
th (
m)

Section 11. Environmental Indicators
202
11.4 Tributary Water Flow T. Peat, Lake Ontario Management Unit
Stream flow is defined as the rate at which
a specific volume of water travels through a
specific point in a stream. Stream flow is typically
influenced by a number of different natural (e.g.,
runoff from rain and snow melt, ground-water
discharge, sedimentation, etc.) and human-
induced factors (e.g., river flow restrictions, water
withdrawals, construction, land use changes, etc.),
which cause many rivers to exhibit unpredictable
and large variations in flow dynamics throughout
a given year. The Water Survey of Canada (WSC)
operates in partnership with the provincial
governments, territories, and other agencies, to
provide standardized hydrometric data on stream
flow for over 2,800 active hydrometric gauges
across Canada. Data from these hydrometric
gauges are available online through the Water
office webpage hosted by Environment Canada
(http://wateroffice.ec.gc.ca/index_e.html). For the
purposes of this report, we used discharge data
(m3/s) from the following stations: Streetsville
Dam, Credit River, Mississauga; Ganaraska River
above Dale, Port Hope; Moira River, Foxboro;
Salmon River, Shannonville Ontario (see Table
11.4.1).
Migratory salmon and trout (e.g., Chinook
Salmon and Rainbow Trout) utilize Lake Ontario
tributaries to spawn and for critical nursery
habitat. Spawning runs of these migratory fish are
affected by changes in tributary discharge.
Consequently, information on the flow regimes of
major Lake Ontario tributaries is necessary to
provide better insight as to when spawning runs
of these migratory fish species occur. Here, we
examined daily flow data and the central flow
timing (i.e., the date at which half the annual
discharge has been exceeded), to compare annual
stream flow to historical averages.
The average annual discharge (7.11 m3∙s-1)
for the Credit River at Streetsville Dam in 2016
was well below the time-series average (Fig.
11.4.1). The central flow Julian day date in 2016
was 105 indicating that flows occurred early
relative to the 10-year average (134). During
2016, spring flow was high during the middle of
March at the Streetsville Dam and later peaked at
the end of March and early April (Fig. 11.4.2).
The fall flow regime in 2016 at the Streetsville
Dam was lower and less variable than that
observed in 2014 and 2015 (Fig. 11.4.2) with very
little flow occurring for much of the season
except slight peaks occurring during early
September and early November.
The average annual discharge (3.05 m3∙s-1)
for the Ganaraska River above Dale in 2016 was
below the time-series average (Fig. 11.4.3). The
central flow Julian day date in 2016 was 117
indicating that flows occurred early relative to the
10-year average (135). During 2016, spring flow
was lower and less variable than previous years
with increased flows occurring at the start of
April (Fig. 11.4.4). The fall flow regime in 2016
for the Ganaraska River was lower than that
observed in 2014 and 2015 (Fig. 11.4.4) with very
little flow occurring for the majority of the
season.
TABLE 11.4.1. Geographic information of four Lake Ontario tributaries used in the stream flow analysis including river name, station ID, latitude and longitudes (Degrees Decimal Minutes), and the gross drainage area (km2) for each tributary.
River Station ID Latitude Longitude Gross Drainage Area (km2)
Credit 02HB029 44o34.933 N 79
o42.517 W 774.24
Ganaraska 02HD012 43o59.450 N 78
o16.683 W 241.87
Moira 02HL001 44o15.217 N 77
o25.117 W 2594.93
Salmon 02HM003 44o12.433 N 77
o12.550 W 906.73

Section 11. Environmental Indicators
203
The average annual discharge (26.68 m3∙s-1)
for the Moira River near Foxboro, Ontario in
2016 was below the time series average (Fig.
11.4.5). The central flow Julian day date in 2016
was 83 indicating that flows occurred early
relative to the 10-year average (106). High spring
flow occurred earlier on in the season when
compared to previous years (early March) and
remained high until late April (Fig. 11.4.6).
Similar to all the other tributaries we examined,
fall flows were virtually absent for the entire fall
season (Fig. 11.4.6).
FIG. 11.4.1. Average annual discharge (m3∙s-1) for the Credit River, Streetsville Dam, Ontario from 2006 to 2016. The horizontal line represents the historical average discharge. Data is available online through the Wateroffice webpage hosted by Environment Canada (http://
wateroffice.ec.gc.ca/index_e.html).
FIG. 11.4.2. Spring (left panel) and fall (right panel) discharge for the Credit River, Streetsville Dam, Ontario from 2014 to 2016. Data is available online through the Wateroffice webpage hosted by Environment Canada (http://wateroffice.ec.gc.ca/index_e.html).
Lastly, the average annual discharge (9.80
m3∙s-1) for the Salmon River at Shannonville,
Ontario in 2016 was well below the time series
average (Fig. 11.4.7). The central flow Julian day
date in 2016 was 79 indicating that flows
occurred early relative to the 10-year average
(106). High spring flow occurred earlier on in the
season when compared to previous years and was
highest during the start of April 2016 (Fig.
11.4.8). Unlike previous years, fall flows
remained low with little to no flow occurring
throughout the entire season (Fig. 11.4.8).

Section 11. Environmental Indicators
204
FIG. 11.4.3. Average annual discharge (m3∙s-1) for the Ganaraska River, Dale, Ontario from 2003 to 2016. The horizontal line represents the historical average discharge. Data is available online through the Wateroffice webpage hosted by Environment Canada (http://
wateroffice.ec.gc.ca/index_e.html).
FIG. 11.4.4. Spring (left panel) and fall (right panel) discharge for the Ganaraska River, Dale, Ontario from 2014 to 2016. Data is available
online through the Wateroffice webpage hosted by Environment Canada (http://wateroffice.ec.gc.ca/index_e.html).

Section 11. Environmental Indicators
205
FIG. 11.4.5. Average annual flow (m3∙s-1) for the Moira River, Foxboro, Ontario from 2003 to 2016. The horizontal line represents the historical average discharge. Data is available online through the Wateroffice webpage hosted by Environment Canada (http://wateroffice.ec.gc.ca/
index_e.html).
FIG. 11.4.6. Spring (left panel) and fall (right panel) discharge for the Moira River, Foxboro, Ontario from 2014 to 2016. Data is available
online through the Wateroffice webpage hosted by Environment Canada (http://wateroffice.ec.gc.ca/index_e.html).

Section 11. Environmental Indicators
206
FIG. 11.4.7. Average annual flow (m3∙s-1) for the Salmon River, Shannonville, Ontario 2003 to 2016. The horizontal line represents the historical average discharge. Data is available online through the Wateroffice webpage hosted by Environment Canada (http://
wateroffice.ec.gc.ca/index_e.html).
FIG. 11.4.8. Spring (left panel) and fall (right panel) discharge for the Salmon River, Shannonville, Ontario from 2014 to 2016. Data is available
online through the Wateroffice webpage hosted by Environment Canada (http://wateroffice.ec.gc.ca/index_e.html).

Section 12. Staff 2016
207
Glenora Fisheries Station, 41 Hatchery Lane, Picton, ON KOK 2TO
Tel: 613-476-2400 Fax: 613-476-7131
PROVINCIAL SERVICES DIVISION
Fish and Wildlife Service Branch
Lake Ontario Management Unit
Andy Todd Lake Manager
Dawn Young Administrative Assistant
Alastair Mathers Assessment Supervisor
Colin Lake Lead Management Biologist
Jake LaRose Lake Ontario COA Coordinator
Marc Desjardins Management Biologist
Jim Hoyle Assessment Biologist
Jeremy Holden Assessment Biologist
Mike Yuille Assessment Biologist
Mary Hanley Lake Ontario Aquatic Ecologist Intern
Changhai Zhu Project Support Biologist
Steve McNevin Operations Supervisor
Sonya Kranzl Operations Coordinator, Senior Base Operations Technician
Kelly Sarley Support Services/Data Technician
Jon Chicoine Vessel Master
Nina Jakobi Management Project Biologist, Great Lakes Technician
Ben Maynard Great Lakes Technician
Alan McIntosh Boat Captain
Tim Dale Great Lakes Fisheries Technician
Scott Brown Great Lakes Fisheries Technician
Steve Wingrove Great Lakes Fisheries Technician
Ron Green Great Lakes Fisheries Technician
Tyson Scholz Great Lakes Fisheries Technician
Daniel Jang Great Lakes Fisheries Technician
Tom Staton Great Lakes Fisheries Technician
Kody Adams Great Lakes Fisheries Technician
Tyler Peat Great Lakes Fisheries Technician
Daniel Hoyle Great Lakes Fisheries Technician
Aaron Law Great Lakes Fisheries Technician
Jake Gibson Great Lakes Fisheries Technician, Student Fisheries Technician
Camden Moir Student Fisheries Technician
Maeghan Brennan Student Fisheries Technician
Stacey Doyle Student Fisheries Technician
Alyssa Herron Student Fisheries Technician
Enforcement Branch
Jeff Fabian Conservation Officer
Victor Miller Enforcement Manager, Peterborough
12. Staff 2016

Section 12. Staff 2016
208
Science and Research Branch
Aquatic Research and Monitoring Section
Dr. Tim Johnson Research Scientist
Brent Metcalfe Research Biologist
Carolina Taraborelli Project Biologist (Food Webs)
Jeff Buckley Research Intern, Project Biologist (Invasive Species)
Shannon Fera Project Biologist (Invasive Species)
Graham Mushet Project Biologist (Invasive Species)
Changhai Zhu Project Biologist (Juvenile Salmonids)
Megan Murphy Student Research Technician
Shelsey Taylor Co-op Intern
Tyson Scholz Research Technician

Section 13. Field and Lab Schedule 2016
209
13
. O
per
ati
on
al
Fie
ld an
d L
ab
S
ched
ule
, 201
6
(SP
A =
Spec
ial
Purp
ose
Acc
ount;
CO
A =
Can
ada
Onta
rio A
gre
emen
t; T
RC
A =
Toro
nto
and R
egio
n C
on
serv
atio
n A
uth
ori
ty;
OP
G =
Onta
rio P
ow
er G
ener
atio
n;
GL
FC
= G
reat
Lak
es F
ish
erie
s C
om
mis
sio
n).
Conti
nued
on n
ext
pa
ge
Pro
ject
Lea
d
Op
erat
ion
al
Lea
d
Fu
nd
ing
So
urc
e
Ho
yle
McN
evin
SP
A
McN
evin
Kra
nzl
SP
A
Lak
eK
ran
zlS
PA
Yu
ille
May
nar
dS
PA
McN
evin
Kra
nzl
SP
A
To
dd
McN
evin
SP
A
Des
jard
ins
Cla
yto
nC
OA
McN
evin
Kra
nzl
SP
A
Ho
yle
Red
dic
kD
FO
Yu
ille
Kra
nzl
SP
A
Lak
eJa
ko
bi
SP
A
Lak
eC
hic
oin
eS
PA
Ho
lden
Dal
eC
RF
McN
evin
Kra
nzl
SP
A
Dr.
Jo
hn
son
Tar
abo
rell
iS
PA
Mat
her
sH
anle
yO
PG
Joh
nso
nM
ayn
ard
CO
A/S
PA
McN
evin
Kra
nzl
SP
A
Yu
ille
Jako
bi
SP
A
Yu
ille
Jako
bi
SP
A
Lak
eM
ayn
ard
CO
A
Tu
fts
McI
nto
shS
PA
Ho
yle
Kra
nzl
SP
A
Ho
yle
Kra
nzl
SP
A
Ho
yle
Kra
nzl
SP
A
Ho
lden
Ch
ico
ine
CO
A
McN
evin
Kra
nzl
SP
A
To
dd
Jako
bi
SP
A
Ch
ino
ok S
alm
on
Bay
of
Qu
inte
Ice
An
gli
ng S
urv
eyD
ec-F
ebW
alle
ye
and
Per
ch
Fis
h C
on
tam
inan
t S
amp
lin
gA
pr-
Dec
Sp
ort
Fis
h
Ch
ino
ok S
alm
on
To
urn
amen
t S
amp
lin
g
Ap
r-S
ept
Ch
ino
ok S
alm
on
Cre
dit
Riv
er A
tlan
tic
Sal
mo
n S
mo
lt S
urv
ey (
Ro
tary
Scr
ew T
rap
)M
ar-J
un
Atl
anti
c S
alm
on
Ch
ino
ok S
alm
on
Net
Pen
sA
pr
Ch
ino
ok S
alm
on
Juven
ile
Ch
ino
ok S
alm
on
Wal
leye
Egg C
oll
ecti
on
Mar
-Ap
r
Ap
r
Juven
ile
Ch
ino
ok S
alm
on
Ass
essm
ent
(Ele
ctro
fish
ing)
May
Fie
ld a
nd
Lab
Pro
ject
sD
ates
Sp
ecie
s A
sses
sed
, M
on
ito
red
or
Sto
cked
Gan
aras
ka
Fis
hw
ay R
ain
bo
w T
rou
t A
sses
smen
tM
ar-A
pr
Rai
nb
ow
Tro
ut
Juven
ile
Lak
e T
rou
t
St
81
- O
ffsh
ore
Ben
tho
s an
d Z
oo
pla
nkto
n S
urv
eyM
ay-O
ctL
ow
er F
oo
d W
eb
Ham
ilto
n H
arb
ou
r W
alle
ye
Sp
awn
ing S
urv
eill
ance
Mar
-Ap
rW
alle
ye
Lak
e O
nta
rio
Sp
rin
g P
rey f
ish
Tra
wli
ng S
urv
eyA
pr
Ale
wif
e/S
mel
t
Pu
bli
c O
utr
each
- T
oro
nto
Sp
ort
smen
's S
ho
wM
arP
ub
lic
Ou
trea
ch/E
du
cati
on
Gan
aras
ka
Riv
er C
hin
oo
k S
alm
on
Mar
kin
g P
rogra
mM
ar
Pu
bli
c O
utr
each
- C
ott
age
Lif
e S
ho
wA
pr
Pu
bli
c O
utr
each
/Ed
uca
tio
n
Pu
bli
c O
utr
each
- L
ake
On
tari
o S
alm
on
Sym
po
siu
mA
pr
Fis
h C
om
mu
nit
y
Tre
nt
Riv
er L
ake
Stu
rgeo
n S
urv
ey /
Aco
ust
ic T
aggin
gM
ayL
ake
Stu
rgeo
n
Pu
bli
c O
utr
each
- B
elle
vil
le C
op
s fo
r K
ids
Fis
hin
g D
ayJu
nP
ub
lic
Ou
trea
ch/E
du
cati
on
Pu
bli
c O
utr
each
/Ed
uca
tio
n
Dee
pw
ater
Cis
co A
cou
stic
Tel
emet
ry R
esea
rch
Pro
gra
m P
rogra
mJu
nD
eep
wat
er C
isco
Sp
rin
g A
mer
ican
Eel
Tra
p a
nd
Tra
nsf
erA
pr-
Jun
Am
eric
an E
el
Was
tern
Bas
in S
alm
on
an
d T
rou
t C
reel
Ap
r-S
ept
Sal
mo
nid
Sp
ecie
s
Wal
leye
Lak
e T
rou
t T
ug S
tock
ing
Qu
een
s U
niv
ersi
ty -
Bay
of
Qu
inte
Aco
ust
ic R
ecei
ver
Pro
gra
mJu
n-O
ctL
argem
ou
th /
Sm
allm
ou
th B
ass
Eas
tern
Lak
e O
nta
rio
an
d B
ay o
f Q
uin
te C
om
mu
nit
y I
nd
ex N
etti
ng
Jun
-Sep
Fis
h C
om
mu
nit
y
Wes
tern
Lak
e O
nta
rio
Co
mm
un
ity I
nd
ex N
etti
ng
July
Pre
y F
ish
Co
mm
un
ity
Au
gP
ub
lic
Ou
trea
ch/E
du
cati
on
Eas
tern
Lak
e O
nta
rio
an
d B
ay o
f Q
uin
te I
nd
ex T
raw
lin
gJu
n-S
epF
ish
Co
mm
un
ity
Lak
e-w
ide
Hyd
roac
ou
stic
Ass
essm
ent
of
Pre
y f
ish
July
Asi
an G
rass
Car
p E
mer
gen
cy R
esp
on
seJu
ly-S
ept
Gra
ss C
arp
Pu
bli
c O
utr
each
- H
amit
on
Har
bo
ur
Kid
s F
ish
ing D
ay

Section 13. Field and Lab Schedule 2016
210
13
. O
per
ati
on
al
Fie
ld a
nd
Lab
Sch
edu
le, 2016
(co
nti
nued
fro
m p
revi
ous
page)
Ho
yle
May
nar
dC
OA
Ho
yle
May
nar
dC
OA
Ho
yle
Ad
ams
CO
A
Ho
yle
Kra
nzl
SP
A
Yu
ille
Sch
olz
CO
A
McN
evin
Han
ley
SP
A/C
OA
Yu
ille
May
nar
dS
PA
Lak
eK
ran
zlS
PA
Mat
her
sM
cNev
inO
PG
Ho
lden
Ch
ico
ine
CO
A
Yu
ille
Sch
olz
SP
A
Des
jard
ins
Jan
gC
OA
Ho
yle
Bro
wn
SP
A
Mu
ltip
leK
ran
zlS
PA
Lak
eC
hic
oin
eS
PA
Joh
nso
nC
hic
oin
eC
OA
/SP
AD
eep
wat
er C
isco
Res
earc
h A
cou
stic
Tel
emet
ry S
tock
ing
No
vD
eep
wat
er C
isco
Dee
pw
ater
Cis
co R
esto
rati
on
Sto
ckin
gN
ov
Dee
pw
ater
Cis
co
To
ron
to H
arb
ou
r N
ears
ho
re C
om
mu
nit
y I
nd
exS
ept
Nea
rsh
ore
Fis
h C
om
mu
nit
y
Gra
ss C
arp
Gan
aras
ka
Ch
ino
ok S
alm
on
Ass
essm
ent
and
Egg C
oll
ecti
on
Sep
tC
hin
oo
k S
alm
on
Fal
l A
mer
ican
Eel
Tra
p a
nd
Tra
nsf
erS
ept-
Oct
Am
eric
an E
el
Age
and
Gro
wth
(L
ab)
Yea
r-R
ou
nd
Mu
ltip
le S
pec
ies
Lak
e O
nta
rio
Fal
l B
enth
ic P
rey F
ish
Tra
wli
ng S
urv
eyS
ept-
Oct
Ro
un
d G
ob
y/S
lim
y
Scu
lpin
/Dee
pw
ater
Scu
lpin
Co
mm
erci
al C
atch
Sam
pli
ng
Oct
-No
vL
ake
Wh
itef
ish
Up
per
Bay
Nea
rsh
ore
Co
mm
un
ity I
nd
ex N
etti
ng
Sep
tN
ears
ho
re F
ish
Co
mm
un
ity
Lak
e S
t. F
ran
cis
Co
mm
un
ity I
nd
ex N
etti
ng
Sep
tF
ish
Co
mm
un
ity
eDN
A A
sian
Gra
ss C
arp
Su
rvei
llan
ce
Cre
dit
Riv
er C
hin
oo
k S
alm
on
Ass
essm
ent
and
Egg C
oll
ecti
on
Oct
Ch
ino
ok S
alm
on
Cre
dit
Riv
er J
uven
ile
Atl
anti
c S
alm
on
Ele
ctro
fish
ing
Oct
Juven
ile
Atl
anti
c S
alm
on
Sep
t
Bo
at E
lect
rofi
shin
g -
Bay
of
Qu
inte
Sep
tN
ears
ho
re F
ish
Co
mm
un
ity
Ham
ilto
n H
arb
ou
r N
ears
ho
re C
om
mu
nit
y I
nd
exA
ug
Nea
rsh
ore
Fis
h C
om
mu
nit
y
Atl
anti
c S
alm
on
Mar
kin
g P
rogra
mS
ept
Atl
anti
c S
alm
on
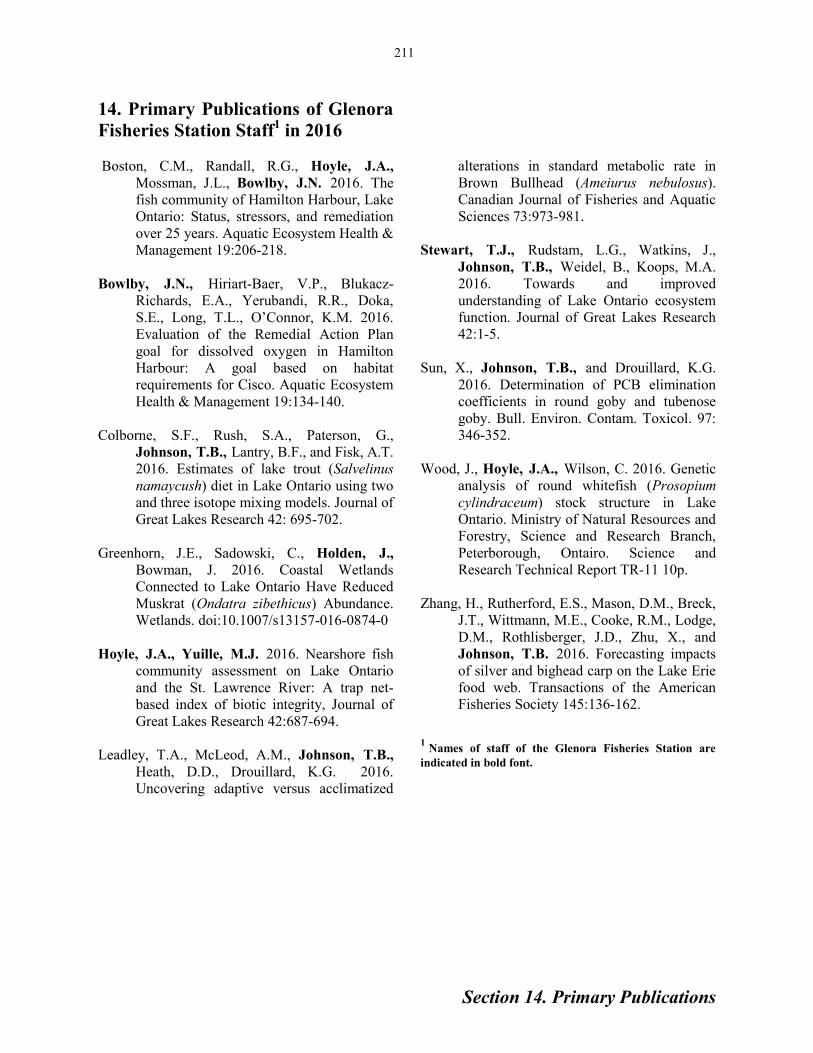
Section 14. Primary Publications
211
14. Primary Publications of Glenora
Fisheries Station Staff1 in 2016
Boston, C.M., Randall, R.G., Hoyle, J.A.,
Mossman, J.L., Bowlby, J.N. 2016. The
fish community of Hamilton Harbour, Lake
Ontario: Status, stressors, and remediation
over 25 years. Aquatic Ecosystem Health &
Management 19:206-218.
Bowlby, J.N., Hiriart-Baer, V.P., Blukacz-
Richards, E.A., Yerubandi, R.R., Doka,
S.E., Long, T.L., O’Connor, K.M. 2016.
Evaluation of the Remedial Action Plan
goal for dissolved oxygen in Hamilton
Harbour: A goal based on habitat
requirements for Cisco. Aquatic Ecosystem
Health & Management 19:134-140.
Colborne, S.F., Rush, S.A., Paterson, G.,
Johnson, T.B., Lantry, B.F., and Fisk, A.T.
2016. Estimates of lake trout (Salvelinus
namaycush) diet in Lake Ontario using two
and three isotope mixing models. Journal of
Great Lakes Research 42: 695-702.
Greenhorn, J.E., Sadowski, C., Holden, J.,
Bowman, J. 2016. Coastal Wetlands
Connected to Lake Ontario Have Reduced
Muskrat (Ondatra zibethicus) Abundance.
Wetlands. doi:10.1007/s13157-016-0874-0
Hoyle, J.A., Yuille, M.J. 2016. Nearshore fish
community assessment on Lake Ontario
and the St. Lawrence River: A trap net-
based index of biotic integrity, Journal of
Great Lakes Research 42:687-694.
Leadley, T.A., McLeod, A.M., Johnson, T.B.,
Heath, D.D., Drouillard, K.G. 2016.
Uncovering adaptive versus acclimatized
alterations in standard metabolic rate in
Brown Bullhead (Ameiurus nebulosus).
Canadian Journal of Fisheries and Aquatic
Sciences 73:973-981.
Stewart, T.J., Rudstam, L.G., Watkins, J.,
Johnson, T.B., Weidel, B., Koops, M.A.
2016. Towards and improved
understanding of Lake Ontario ecosystem
function. Journal of Great Lakes Research
42:1-5.
Sun, X., Johnson, T.B., and Drouillard, K.G.
2016. Determination of PCB elimination
coefficients in round goby and tubenose
goby. Bull. Environ. Contam. Toxicol. 97:
346-352.
Wood, J., Hoyle, J.A., Wilson, C. 2016. Genetic
analysis of round whitefish (Prosopium
cylindraceum) stock structure in Lake
Ontario. Ministry of Natural Resources and
Forestry, Science and Research Branch,
Peterborough, Ontairo. Science and
Research Technical Report TR-11 10p.
Zhang, H., Rutherford, E.S., Mason, D.M., Breck,
J.T., Wittmann, M.E., Cooke, R.M., Lodge,
D.M., Rothlisberger, J.D., Zhu, X., and
Johnson, T.B. 2016. Forecasting impacts
of silver and bighead carp on the Lake Erie
food web. Transactions of the American
Fisheries Society 145:136-162.
1 Names of staff of the Glenora Fisheries Station are
indicated in bold font.


50968 (0.1 k P.R., 17 03 21) ISSN 1201-8449