2016 athena software ors srs dr.scott miller · can be implemented by behavioral health care...
TRANSCRIPT

penelope case management software
OUTCOMES RATING SCALE/ SESSION RATING SCALE INFORMATION PACKAGE
athena software

Athena has partnered with the International Center for Clinical Excellence and ACE Health to integrate Dr. Scott Miller’s Feedback Informed Treatment (FIT) / Partners for Change Outcome Management System (PCOMS) into Penelope.
These tools provide an easy to implement, evidence-based, client-centred way to measure client engagement and progress in treatment.
With just a few clicks on a computer screen or portable device such as an iPad, clients provide valuable feedback on their current wellbeing and satisfaction with each session / with their therapist. This ongoing data is contrasted anonymously against a large dataset to determine statistically validated trajectories of change (the Expected Treatment Response) to help evaluate the effectiveness of treatment.
driving clinical Excellence.
IMPROVE ENGAGEMENT
continual Feedback.
IMPROVE ACCOUNTABLITY FOR
OUTCOMES
identify High Performing clinicians.INTERNATIONAL CENTER
FOR CLINICAL EXCELLENCE
Dr. Scott Miller, PhD
47% DECREASE IN DROPOUT
RATES
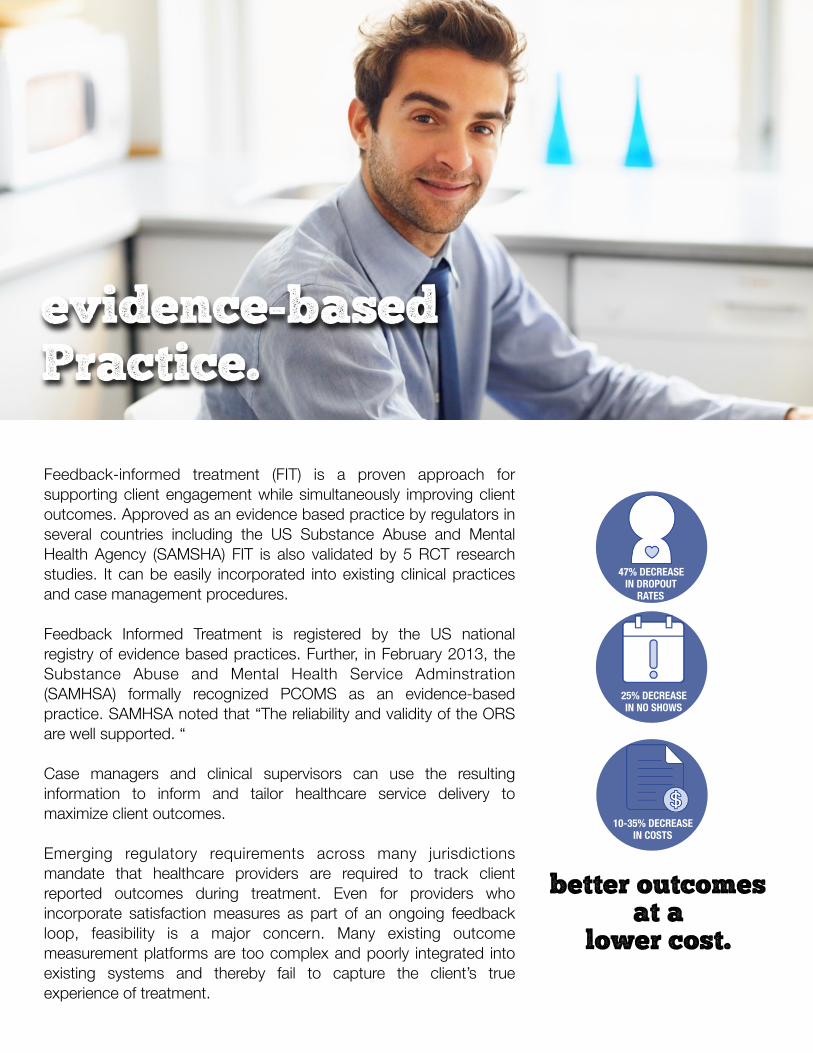
evidence-based Practice.
Feedback-informed treatment (FIT) is a proven approach for supporting client engagement while simultaneously improving client outcomes. Approved as an evidence based practice by regulators in several countries including the US Substance Abuse and Mental Health Agency (SAMSHA) FIT is also validated by 5 RCT research studies. It can be easily incorporated into existing clinical practices and case management procedures.
Feedback Informed Treatment is registered by the US national registry of evidence based practices. Further, in February 2013, the Substance Abuse and Mental Health Service Adminstration (SAMHSA) formally recognized PCOMS as an evidence-based practice. SAMHSA noted that “The reliability and validity of the ORS are well supported. “
Case managers and clinical supervisors can use the resulting information to inform and tailor healthcare service delivery to maximize client outcomes.
Emerging regulatory requirements across many jurisdictions mandate that healthcare providers are required to track client reported outcomes during treatment. Even for providers who incorporate satisfaction measures as part of an ongoing feedback loop, feasibility is a major concern. Many existing outcome measurement platforms are too complex and poorly integrated into existing systems and thereby fail to capture the client’s true experience of treatment.
25% DECREASE IN NO SHOWS
10-35% DECREASE IN COSTS
better outcomes at a
lower cost.

an easy way to integrate Outcomes measures.
Penelope’s integration of Dr. Scott Miller’s Feedback Informed Treatment tools is seamless, providing real time Expected Treatment Response reporting directly within the client’s service files in Penelope.
The Expected Treatment Response (ETR) is calculated based on comparisons with over 600,000 completed forms, over 100,000 unique episodes of care and the work of over 2,500 clinicians around the world. You will be able to instantly see compare and contrast the client’s self-reported outcomes against the context of a large data set.
As Dr. Scott Miller notes, “Although the math is complicated, the idea is not: therapists and clients can compare outcomes from session to session to the benchmark provided by the ETR. If too much or too little progress were being made, client and therapist could discuss what changes might be made to the services being offered in order to insure more effective or durable progress.”
Penelope provides clear visual feedback to the client and therapist by displaying the client’s self-reported outcomes ratings within a green zone (successful), yellow zone (mixed results) or red (unsuccessful).
expected Trajectory of Change vs. Actual
CLIENT INPUT
ANONYMOUS COMPARISON AGAINST
LARGE DATA SET

ORS/ SRS measures.
The Partners for Change Outcome Management System (PCOMS) is a client feedback program for improving the treatment outcomes of adults and children participating in a behavioral health care intervention. PCOMS is designed to improve the retention of participants in treatment and to assist them in reaching reliable and clinically significant change. The program can be implemented by behavioral health care therapists as part of any behavioral health care intervention.
PCOMS, which is integrated into each treatment session, consists of two brief scales that measure robust predictors of therapeutic success. The Outcome Rating Scale (ORS) assesses the client's therapeutic progress and the client's perceived benefit of treatment while the Session Rating Scale (SRS) assesses the client's perception of the client-therapist alliance.
The therapist administers the ORS at the beginning of the treatment session, and the SRS is administered toward the end of the session. Client ratings for both measures are discussed on a session-by-session basis to maintain the client's engagement in treatment, optimize the client-therapist alliance, and provide a means for transitioning into the treatment session by focusing on client-identified concerns. If client ratings are very low, the therapist may choose to modify the type and amount of treatment.
OUTCOME RATING SCALE
robust predictors of Therapeutic
Success.
SESSION RATING SCALE
CHILD OUTCOME RATING SCALE
YOUNG CHILD OUTCOME
SCALE
CHILD SESSION RATING SCALE
GROUP SESSION RATING SCALE

Outcomes Reporting.
ORS MEASURES SELF AUDIT REPORT / MY ORS MEASURES SELF AUDIT REPORT
This report assists practitioners and their supervisors in ensuring that the ORS/SRS assessments are completed for each appt. In this report, practitioners are considered to be 'on track' (coded as green) if they complete initial ORS and SRS assessments at least 95% of the time within initial service appts. and if they complete progress ORS and SRS assessments at least 90% of the time in subsequent appts. This report is broken out by practitioner and service. Within the selected date range and for each practitioner and service, the number of assessments completed and the proportion of events with assessments are displayed along with the zone (colour code) indicating whether the proportion is on track (green), needs monitoring (yellow) or needs follow-up (red). This report can also be run by practitioners for their own clients and by supervisors for their subordinate workers.
ORS MEASURES CLIENT LIST WITH FLAGS REPORT
This report provides practitioners and their supervisors with a list of clients by practitioner and service that have completed at least one initial and one progress ORS assessment, with their initial ORS score, the last ORS score, and the raw change between with initial and last scores. The colour-coded zones for the last score represent the colour-coded zones provided by the OpenFIT algorithms that indicate whether a client's service outcomes are on track (green), need monitoring (yellow) or need a follow-up (red).
MY ORS MEASURES CLIENT LIST WITH FLAGS REPORT
This report provides practitioners and their supervisors with a list of clients by practitioner and service that have completed at least one initial and one progress ORS assessment, with their initial ORS score, the last ORS score, and the raw change between with initial and last scores. The colour-coded zones for the last score represent the colour-coded zones provided by the OpenFIT algorithms that indicate whether a client's service outcomes are on track (green), need monitoring (yellow) or need a follow-up (red). This report can be run by practitioners for their own clients and by supervisors for their subordinate workers (as indicated by the 'reports to' field in the worker profile).
ORS MEASURES ROLLING AVERAGE REPORT
This report displays statistics about the average changes in ORS scores within a selected timeframe. The report can be run for one to many services/service classes and practitioners (depending on user authorizations). Statistics can be grouped by case service, primary worker or main presenting issue (the first service file level presenting issue) and optionally sub grouped by the same parameters. For example, the report can be run for all practitioners within a case service or for all case services by practitioner.

About Dr. Scott Miller.
Scott D. Miller, Ph.D. is the founder of the International Center for Clinical Excellence an international consortium of clinicians, researchers, and educators dedicated to promoting excellence in behavioral health services. Dr. Miller conducts workshops and training in the United States and abroad, helping hundreds of agencies and organizations, both public and private, to achieve superior results. He is one of a handful of “invited faculty” whose work, thinking, and research is featured at the prestigious “Evolution of Psychotherapy Conference.” His humorous and engaging presentation style and command of the research literature consistently inspires practitioners, administrators, and policy makers to make effective changes in service delivery.
Scott is the author of numerous articles and books, including Escape from Babel: Toward a Unifying Language for Psychotherapy Practice (with Barry Duncan and Mark Hubble [Norton, 1997]), The Heart and Soul of Change (with Mark Hubble and Barry Duncan [APA Press, 1999, 2010]), The Heroic Client: A Revolutionary Way to Improve Effectiveness through Client-Directed, Outcome-Informed Therapy (with Barry Duncan [Jossey-Bass, 2000], and Jacqueline Sparks [Revised, 2004]), Staying on Top and Keeping the Sand Out of your Pants: The Surfer’s Guide to the Good Life (with Mark Hubble and Seth Houdeshell [HCI Books, 2003]) and the forthcoming Achieving Clinical Excellence in Behavioral Health: Empirical Lessons from the Field’s Most Effective Practitioners (with Mark Hubble and William Andrews). Click here to access his current and complete curriculum vitae.
15 YEAR TRACK RECORD OF EVIDENCE BASED OUTCOMES
MEASURES
ESTIMATED THAT ORS/ SRS ARE IMPLEMENTED WITH
APPROXIMATELY 100,000 CLIENTS EACH YEAR AROUND THE WORLD
ORS/ SRS USED BY THOUSANDS OF BEHAVIOURAL HEALTH CARE PROFESSIONALS IN ALL 50 US
STATES AND 20 COUNTRIES ON 5 CONTINENTS

Page � of �8 8
penelope case management software
athena software
www.athenasoftware.net [email protected]
33 Dupont Street East Waterloo, Ontario Canada N2J 2G8
NORTH AMERICA 1.866.806.6014 AUSTRALIA 02 8005 8037 UK 020 3239 1689 NZ 027 228 0105 FAX 519.570.3147