2016 capital market assumptions - sellwood consulting … · introduction sellwood consulting...
TRANSCRIPT

2016CapitalMarketAssumptionsFebruary2016
TABLEOFCONTENTS
TABLEOFCONTENTS............................................................................................................................................................2
INTRODUCTION.......................................................................................................................................................................3
INFLATION.................................................................................................................................................................................7
FIXEDINCOME..........................................................................................................................................................................8
CashEquivalents...............................................................................................................................................................11
Low‐DurationFixedIncome........................................................................................................................................12
CoreFixedIncome............................................................................................................................................................13
Non‐CoreFixedIncome..................................................................................................................................................14
Core‐PlusFixedIncome.................................................................................................................................................16
Long‐DurationFixedIncome.......................................................................................................................................16
USTreasuryInflationProtectedSecurities(TIPS).............................................................................................17
EQUITY.......................................................................................................................................................................................19
USLarge‐CapEquity........................................................................................................................................................20
USSmall/Mid‐CapEquity..............................................................................................................................................22
USEquity..............................................................................................................................................................................22
Non‐USLarge‐CapEquity..............................................................................................................................................23
Non‐USSmall‐CapEquity..............................................................................................................................................24
EmergingMarketsEquity..............................................................................................................................................24
Non‐USEquity....................................................................................................................................................................25
ALTERNATIVES......................................................................................................................................................................26
RealEstate...........................................................................................................................................................................26
DiversifiedInflation‐Related........................................................................................................................................27
MarketableAlternatives................................................................................................................................................28
Non‐MarketableAlternatives......................................................................................................................................28
RISK.............................................................................................................................................................................................29
CORRELATIONCOEFFICIENTS........................................................................................................................................33
SOURCES...................................................................................................................................................................................35
1

INTRODUCTIONSellwoodConsultingupdatesitscapitalmarketsassumptionsonanannualbasis.Our2016assumptionsreflectinformationasofDecember31,2015,unlessotherwisenoted.Thisreportdocumentsourprocessforcreatingthesecapitalmarketsassumptions,andweprovidedetailedmethodologyforeach.Severalover‐archingprinciples,however,informallofouranalysis:
1. Webelievethatforward‐lookingcapitalmarketassumptionsareanimportant,butfarfromtheonlyimportant,inputforproperlyconstructingportfolios.Greatcareshouldbetakennottorelyonlyonmean‐varianceanalysiswhenconstructingportfolios.Generallyspeaking,ananalysisthatreliesonlyonmean‐varianceanalysiswillover‐allocatetoassetswithinsignificantlysuperiorrisk/returnestimates,andassetsthatarelessliquidorlessfrequentlypriced.
2. Ourassumptionsareforward‐lookinginnatureandreflectaten‐yearhorizon.Theyareappropriateforanalysisofportfolioswithlong‐term(10yearorgreater)horizons.Forportfolioswithshorterhorizons,alternatemethodsofanalysisshouldbeemployed.
3. Wepurposefullyusedifferentmethodstoestimatereturnandrisk.Thefirstpartofthispaperexplainsthedifferentmethodsweemploytoestimatethefuturereturnofeachindividualassetclass.Laterinthepaper,weexplainamorestandardizedapproachtoestimatingfutureriskofthesameassetclasses.
4. Ourreturnassumptionsutilizeabuild‐upapproachbasedonthecurrentvaluesoftheindividualdriversofexpectedreturnthatareuniquetoeachassetclass.
5. Forassetclasseswherethemarketprovidesacurrentviewofforward‐lookingreturns,ourassumptionsheavilyweightthemarketview.
6. Wherepossible,allofourreturnassumptionsincorporatecurrentvaluations.Wherewehaveidentifiedacurrentvaluationanditslong‐termmean,ourestimatesconsidera50%reversionfromthecurrentvaluationleveltoitslong‐termmeanovertheprospectiveten‐yearperiod.
7. Ourassumptionsarepresentedinnominalterms.Wherewehaveusedhistoricalreturnsinourinputanalysis,wehavealwaystransformedthemtoreal,after‐inflation,returns,soastostripouthistoricalinflation.Attheendofthebuild‐upprocess,whereappropriate,weaddthemarket’scurrentmeasureofforward‐lookinginflationbacktotheassumptionstocreatenominalforward‐lookingreturnassumptions.
8. Ourbasereturncalculationsareofandforcompoundreturns.Aftercalculatingacompoundreturnandariskassumption,wecombinethetwomathematicallytocalculate
2
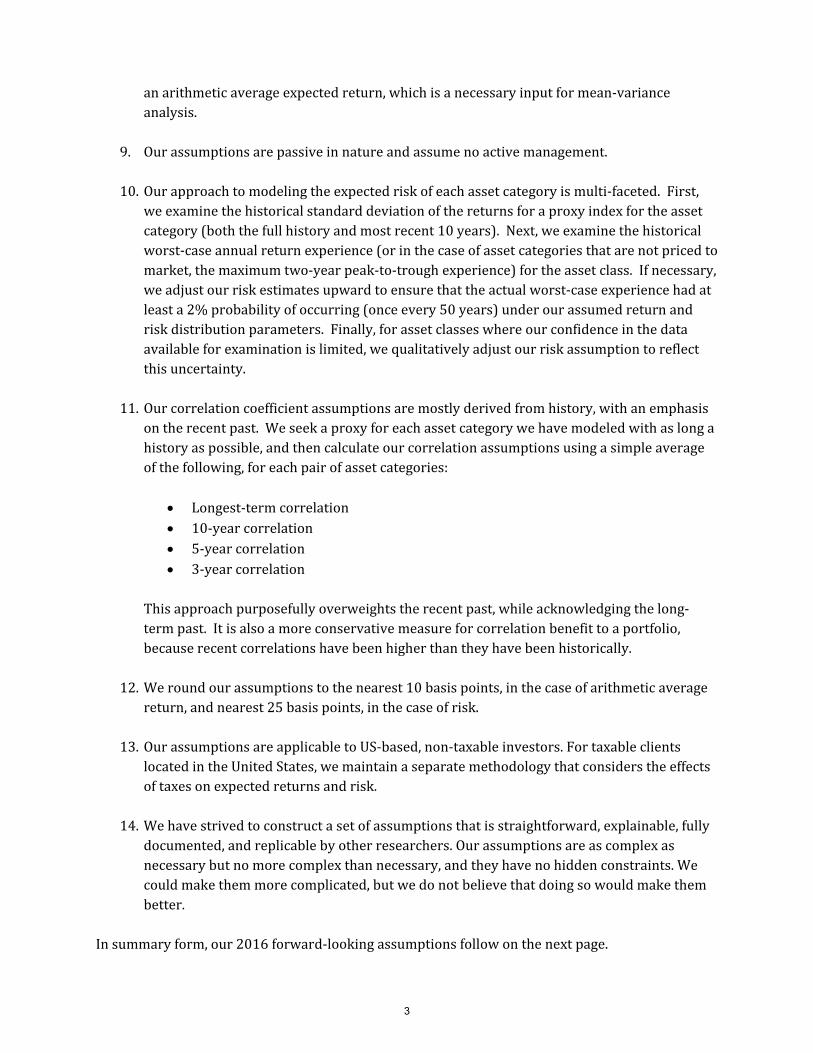
anarithmeticaverageexpectedreturn,whichisanecessaryinputformean‐varianceanalysis.
9. Ourassumptionsarepassiveinnatureandassumenoactivemanagement.
10. Ourapproachtomodelingtheexpectedriskofeachassetcategoryismulti‐faceted.First,weexaminethehistoricalstandarddeviationofthereturnsforaproxyindexfortheassetcategory(boththefullhistoryandmostrecent10years).Next,weexaminethehistoricalworst‐caseannualreturnexperience(orinthecaseofassetcategoriesthatarenotpricedtomarket,themaximumtwo‐yearpeak‐to‐troughexperience)fortheassetclass.Ifnecessary,weadjustourriskestimatesupwardtoensurethattheactualworst‐caseexperiencehadatleasta2%probabilityofoccurring(onceevery50years)underourassumedreturnandriskdistributionparameters.Finally,forassetclasseswhereourconfidenceinthedataavailableforexaminationislimited,wequalitativelyadjustourriskassumptiontoreflectthisuncertainty.
11. Ourcorrelationcoefficientassumptionsaremostlyderivedfromhistory,withanemphasis
ontherecentpast.Weseekaproxyforeachassetcategorywehavemodeledwithaslongahistoryaspossible,andthencalculateourcorrelationassumptionsusingasimpleaverageofthefollowing,foreachpairofassetcategories:
Longest‐termcorrelation 10‐yearcorrelation 5‐yearcorrelation 3‐yearcorrelation
Thisapproachpurposefullyoverweightstherecentpast,whileacknowledgingthelong‐termpast.Itisalsoamoreconservativemeasureforcorrelationbenefittoaportfolio,becauserecentcorrelationshavebeenhigherthantheyhavebeenhistorically.
12. Weroundourassumptionstothenearest10basispoints,inthecaseofarithmeticaveragereturn,andnearest25basispoints,inthecaseofrisk.
13. OurassumptionsareapplicabletoUS‐based,non‐taxableinvestors.FortaxableclientslocatedintheUnitedStates,wemaintainaseparatemethodologythatconsiderstheeffectsoftaxesonexpectedreturnsandrisk.
14. Wehavestrivedtoconstructasetofassumptionsthatisstraightforward,explainable,fullydocumented,andreplicablebyotherresearchers.Ourassumptionsareascomplexasnecessarybutnomorecomplexthannecessary,andtheyhavenohiddenconstraints.Wecouldmakethemmorecomplicated,butwedonotbelievethatdoingsowouldmakethembetter.
Insummaryform,our2016forward‐lookingassumptionsfollowonthenextpage.
3
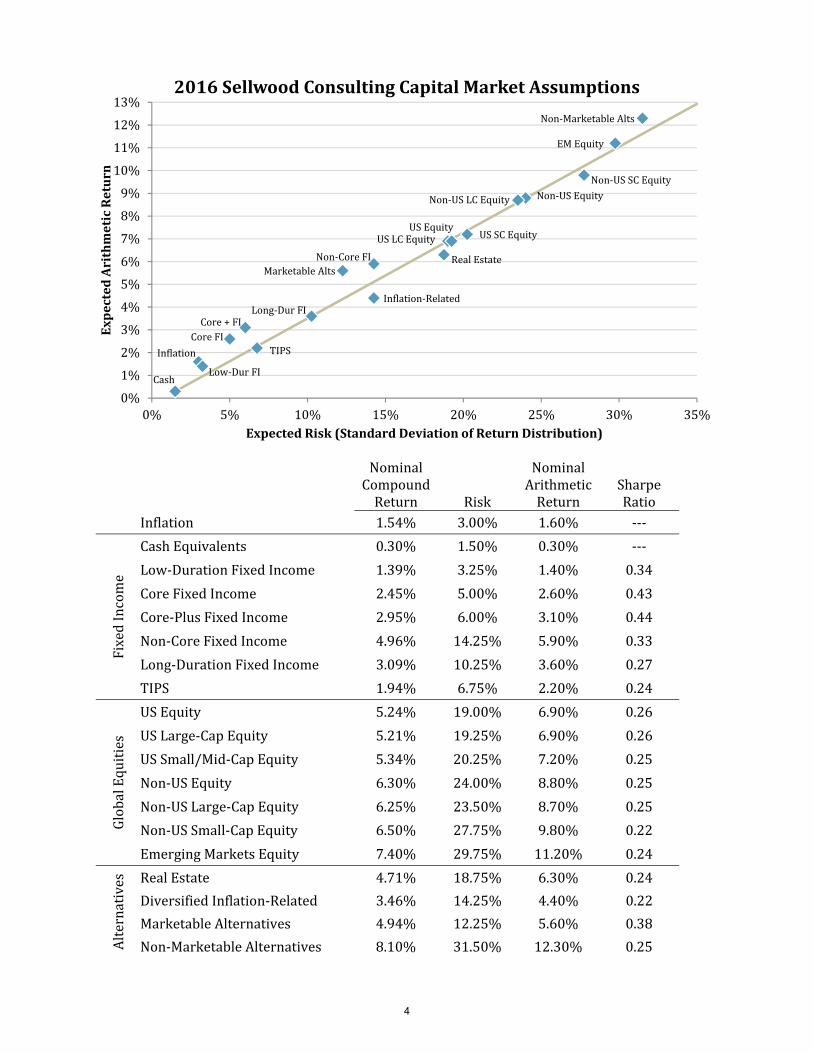
NominalCompoundReturn Risk
NominalArithmeticReturn
SharpeRatio
Inflation 1.54% 3.00% 1.60% ‐‐‐
FixedIncome
CashEquivalents 0.30% 1.50% 0.30% ‐‐‐
Low‐DurationFixedIncome 1.39% 3.25% 1.40% 0.34
CoreFixedIncome 2.45% 5.00% 2.60% 0.43
Core‐PlusFixedIncome 2.95% 6.00% 3.10% 0.44
Non‐CoreFixedIncome 4.96% 14.25% 5.90% 0.33
Long‐DurationFixedIncome 3.09% 10.25% 3.60% 0.27
TIPS 1.94% 6.75% 2.20% 0.24
GlobalEquities
USEquity 5.24% 19.00% 6.90% 0.26
USLarge‐CapEquity 5.21% 19.25% 6.90% 0.26
USSmall/Mid‐CapEquity 5.34% 20.25% 7.20% 0.25
Non‐USEquity 6.30% 24.00% 8.80% 0.25
Non‐USLarge‐CapEquity 6.25% 23.50% 8.70% 0.25
Non‐USSmall‐CapEquity 6.50% 27.75% 9.80% 0.22
EmergingMarketsEquity 7.40% 29.75% 11.20% 0.24
Alternatives RealEstate 4.71% 18.75% 6.30% 0.24
DiversifiedInflation‐Related 3.46% 14.25% 4.40% 0.22
MarketableAlternatives 4.94% 12.25% 5.60% 0.38
Non‐MarketableAlternatives 8.10% 31.50% 12.30% 0.25
Inflation
CashLow‐DurFI
CoreFICore+FI
Non‐CoreFI
Long‐DurFI
TIPS
USEquityUSLCEquity USSCEquity
Non‐USEquityNon‐USLCEquity
Non‐USSCEquity
EMEquity
RealEstate
Inflation‐Related
MarketableAlts
Non‐MarketableAlts
0%
1%
2%
3%
4%
5%
6%
7%
8%
9%
10%
11%
12%
13%
0% 5% 10% 15% 20% 25% 30% 35%
ExpectedArithmeticReturn
ExpectedRisk(StandardDeviationofReturnDistribution)
2016SellwoodConsultingCapitalMarketAssumptions
4
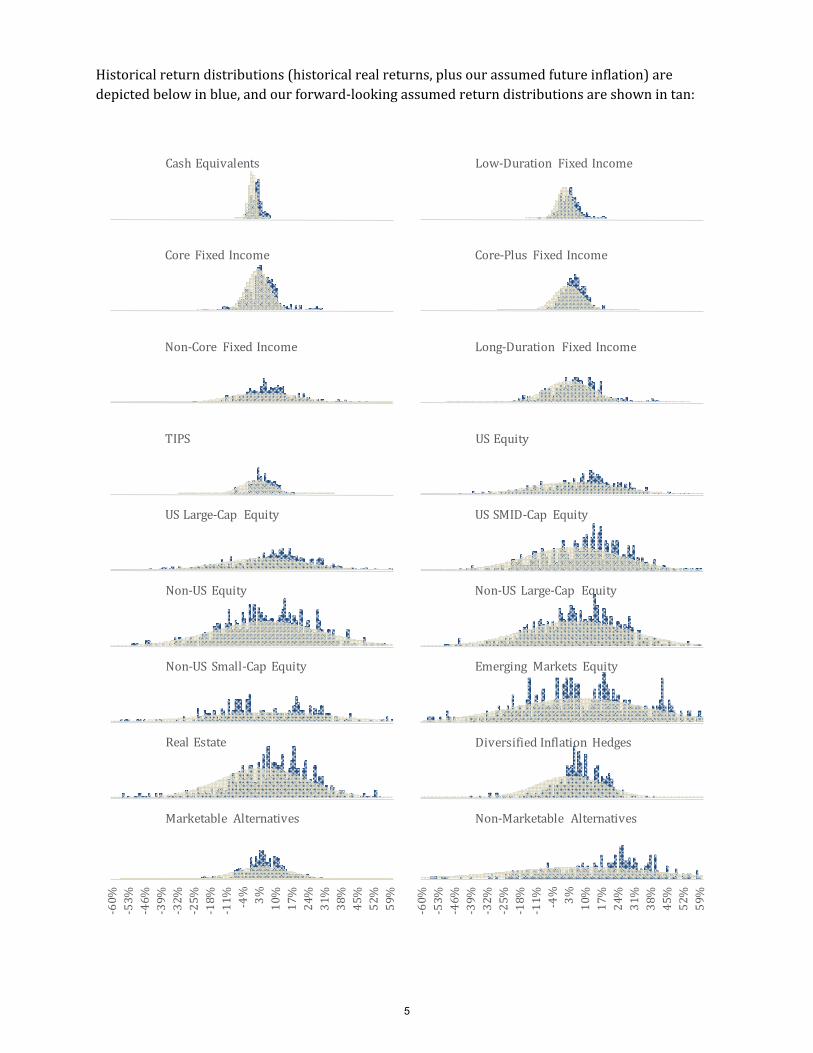
Historicalreturndistributions(historicalrealreturns,plusourassumedfutureinflation)aredepictedbelowinblue,andourforward‐lookingassumedreturndistributionsareshownintan:
CashEquivalents Low‐Duration FixedIncome
Core FixedIncome Core‐Plus FixedIncome
Non‐Core FixedIncome Long‐Duration FixedIncome
TIPS USEquity
USLarge‐Cap Equity USSMID‐Cap Equity
Non‐US Equity Non‐US Large‐Cap Equity
Non‐US Small‐Cap Equity Emerging Markets Equity
RealEstate DiversifiedInflation Hedges
‐60%
‐53%
‐46%
‐39%
‐32%
‐25%
‐18%
‐11% ‐4%3%
10%17%24%31%38%45%52%59%
Marketable Alternatives
‐60%
‐53%
‐46%
‐39%
‐32%
‐25%
‐18%
‐11% ‐4%3%
10%17%24%31%38%45%52%59%
Non‐Marketable Alternatives
5
INFLATION
Modeled:USCPI‐UInflationCompoundReturn:1.54%
ArithmeticAverageReturn:1.60%Risk:3.00%
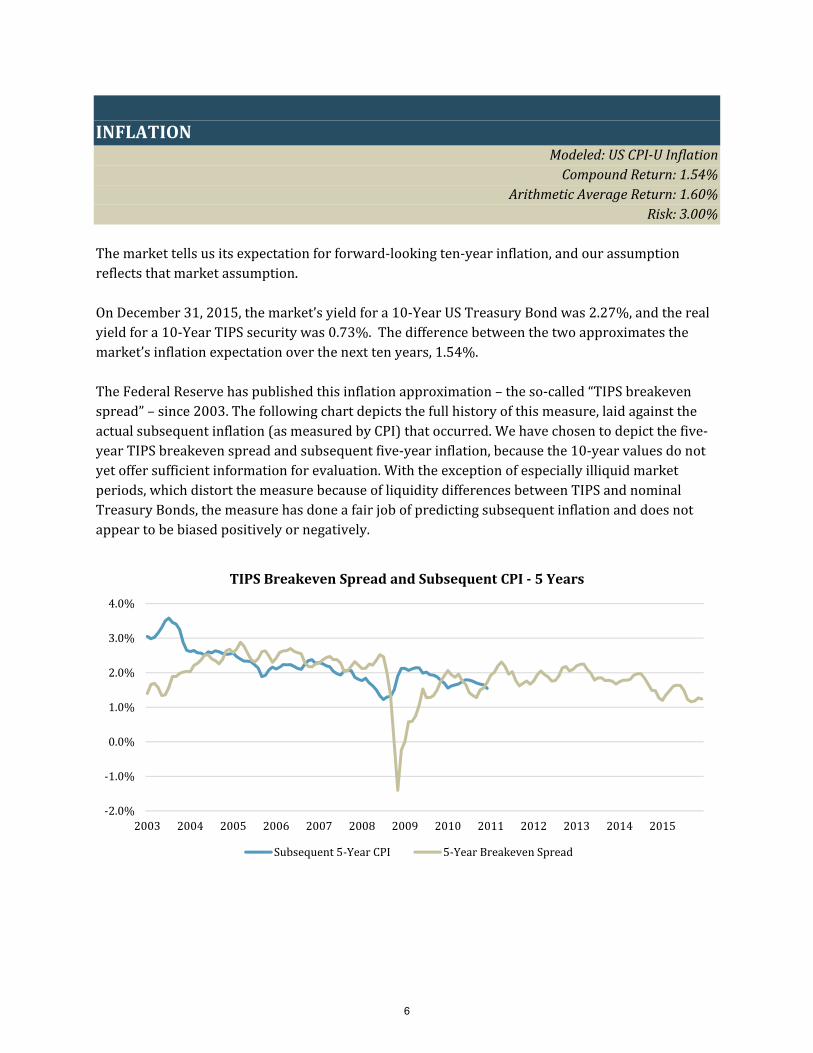
Themarkettellsusitsexpectationforforward‐lookingten‐yearinflation,andourassumptionreflectsthatmarketassumption.OnDecember31,2015,themarket’syieldfora10‐YearUSTreasuryBondwas2.27%,andtherealyieldfora10‐YearTIPSsecuritywas0.73%.Thedifferencebetweenthetwoapproximatesthemarket’sinflationexpectationoverthenexttenyears,1.54%.TheFederalReservehaspublishedthisinflationapproximation–theso‐called“TIPSbreakevenspread”–since2003.Thefollowingchartdepictsthefullhistoryofthismeasure,laidagainsttheactualsubsequentinflation(asmeasuredbyCPI)thatoccurred.Wehavechosentodepictthefive‐yearTIPSbreakevenspreadandsubsequentfive‐yearinflation,becausethe10‐yearvaluesdonotyetoffersufficientinformationforevaluation.Withtheexceptionofespeciallyilliquidmarketperiods,whichdistortthemeasurebecauseofliquiditydifferencesbetweenTIPSandnominalTreasuryBonds,themeasurehasdoneafairjobofpredictingsubsequentinflationanddoesnotappeartobebiasedpositivelyornegatively.
‐2.0%
‐1.0%
0.0%
1.0%
2.0%
3.0%
4.0%
2003 2004 2005 2006 2007 2008 2009 2010 2011 2012 2013 2014 2015
TIPSBreakevenSpreadandSubsequentCPI‐ 5Years
Subsequent5‐YearCPI 5‐YearBreakevenSpread
6
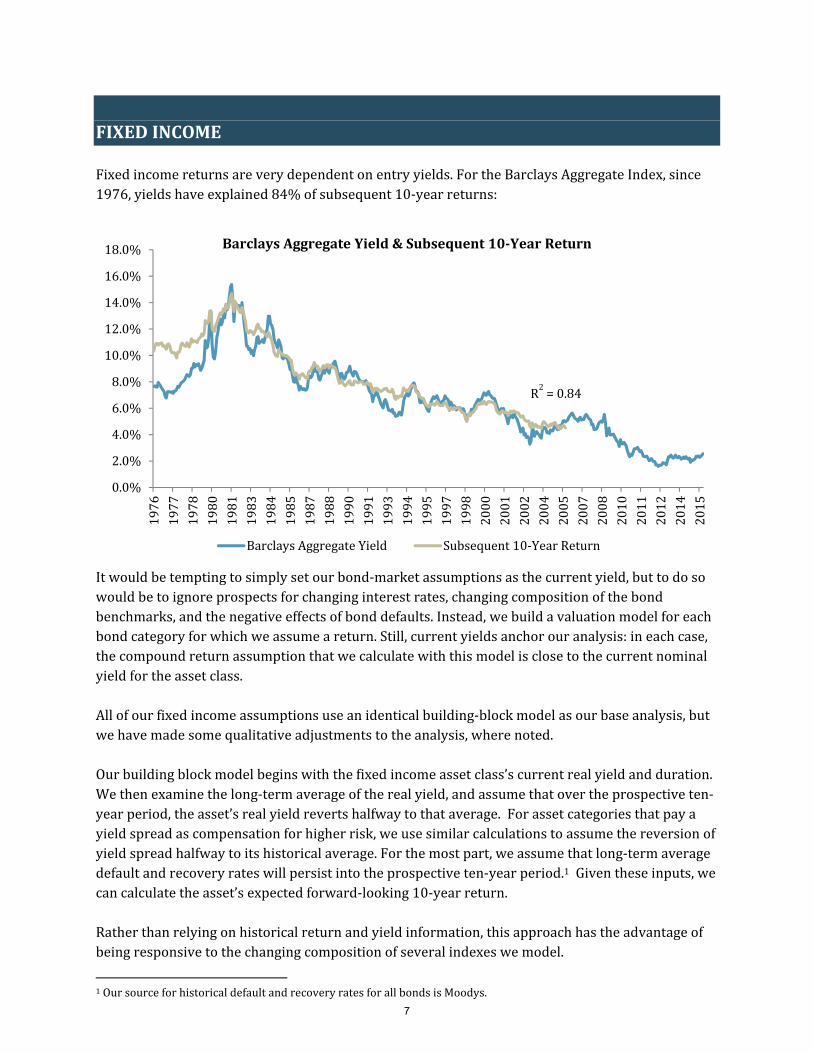
FIXEDINCOMEFixedincomereturnsareverydependentonentryyields.FortheBarclaysAggregateIndex,since1976,yieldshaveexplained84%ofsubsequent10‐yearreturns:
Itwouldbetemptingtosimplysetourbond‐marketassumptionsasthecurrentyield,buttodosowouldbetoignoreprospectsforchanginginterestrates,changingcompositionofthebondbenchmarks,andthenegativeeffectsofbonddefaults.Instead,webuildavaluationmodelforeachbondcategoryforwhichweassumeareturn.Still,currentyieldsanchorouranalysis:ineachcase,thecompoundreturnassumptionthatwecalculatewiththismodelisclosetothecurrentnominalyieldfortheassetclass.Allofourfixedincomeassumptionsuseanidenticalbuilding‐blockmodelasourbaseanalysis,butwehavemadesomequalitativeadjustmentstotheanalysis,wherenoted.Ourbuildingblockmodelbeginswiththefixedincomeassetclass’scurrentrealyieldandduration.Wethenexaminethelong‐termaverageoftherealyield,andassumethatovertheprospectiveten‐yearperiod,theasset’srealyieldrevertshalfwaytothataverage.Forassetcategoriesthatpayayieldspreadascompensationforhigherrisk,weusesimilarcalculationstoassumethereversionofyieldspreadhalfwaytoitshistoricalaverage.Forthemostpart,weassumethatlong‐termaveragedefaultandrecoveryrateswillpersistintotheprospectiveten‐yearperiod.1Giventheseinputs,wecancalculatetheasset’sexpectedforward‐looking10‐yearreturn.Ratherthanrelyingonhistoricalreturnandyieldinformation,thisapproachhastheadvantageofbeingresponsivetothechangingcompositionofseveralindexeswemodel.
1OursourceforhistoricaldefaultandrecoveryratesforallbondsisMoodys.
0.0%
2.0%
4.0%
6.0%
8.0%
10.0%
12.0%
14.0%
16.0%
18.0%
1976
1977
1978
1980
1981
1983
1984
1985
1987
1988
1990
1991
1993
1994
1995
1997
1998
2000
2001
2002
2004
2005
2007
2008
2010
2011
2012
2014
2015
BarclaysAggregateYield&Subsequent10‐YearReturn
BarclaysAggregateYield Subsequent10‐YearReturn
R2=0.84
7
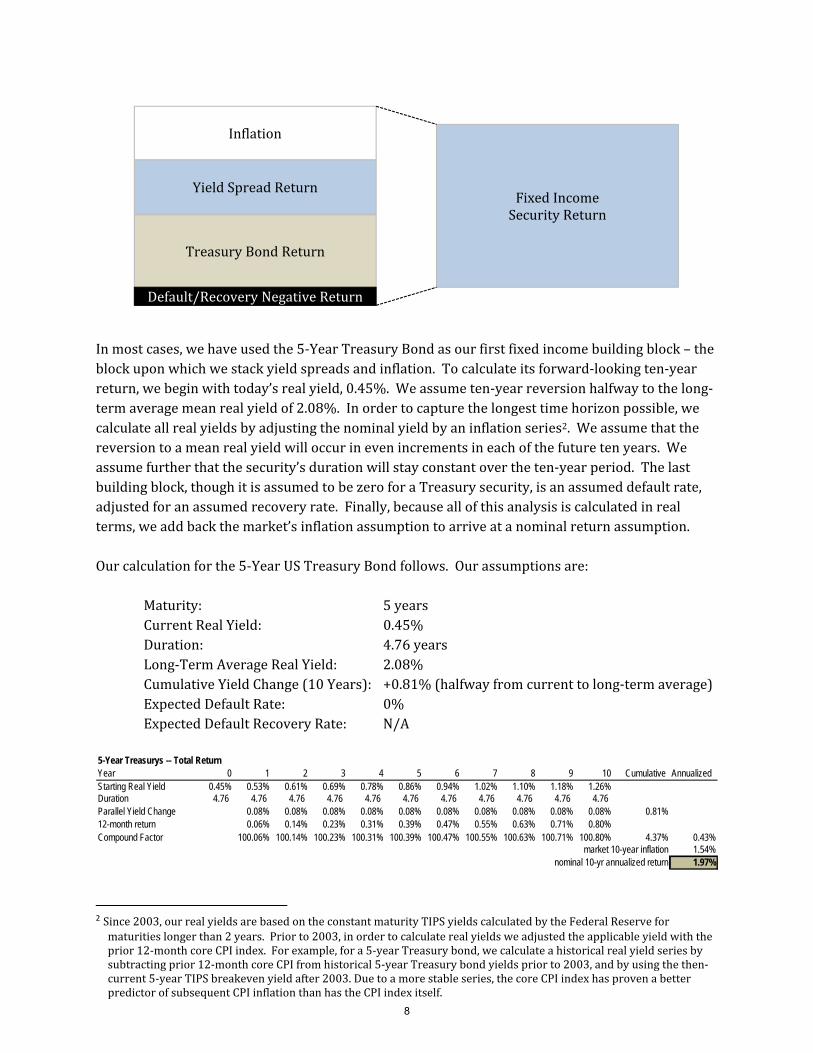
Inmostcases,wehaveusedthe5‐YearTreasuryBondasourfirstfixedincomebuildingblock–theblockuponwhichwestackyieldspreadsandinflation.Tocalculateitsforward‐lookingten‐yearreturn,webeginwithtoday’srealyield,0.45%.Weassumeten‐yearreversionhalfwaytothelong‐termaveragemeanrealyieldof2.08%.Inordertocapturethelongesttimehorizonpossible,wecalculateallrealyieldsbyadjustingthenominalyieldbyaninflationseries2.Weassumethatthereversiontoameanrealyieldwilloccurinevenincrementsineachofthefuturetenyears.Weassumefurtherthatthesecurity’sdurationwillstayconstantovertheten‐yearperiod.Thelastbuildingblock,thoughitisassumedtobezeroforaTreasurysecurity,isanassumeddefaultrate,adjustedforanassumedrecoveryrate.Finally,becauseallofthisanalysisiscalculatedinrealterms,weaddbackthemarket’sinflationassumptiontoarriveatanominalreturnassumption.Ourcalculationforthe5‐YearUSTreasuryBondfollows.Ourassumptionsare:
Maturity: 5yearsCurrentRealYield: 0.45%Duration: 4.76yearsLong‐TermAverageRealYield: 2.08%CumulativeYieldChange(10Years): +0.81%(halfwayfromcurrenttolong‐termaverage)ExpectedDefaultRate: 0%ExpectedDefaultRecoveryRate: N/A
2 Since2003,ourrealyieldsarebasedontheconstantmaturityTIPSyieldscalculatedbytheFederalReserveformaturitieslongerthan2years.Priorto2003,inordertocalculaterealyieldsweadjustedtheapplicableyieldwiththeprior12‐monthcoreCPIindex.Forexample,fora5‐yearTreasurybond,wecalculateahistoricalrealyieldseriesbysubtractingprior12‐monthcoreCPIfromhistorical5‐yearTreasurybondyieldspriorto2003,andbyusingthethen‐current5‐yearTIPSbreakevenyieldafter2003.Duetoamorestableseries,thecoreCPIindexhasprovenabetterpredictorofsubsequentCPIinflationthanhastheCPIindexitself.
TreasuryBondReturn
YieldSpreadReturn
Inflation
Default/Recovery NegativeReturn
FixedIncomeSecurityReturn
5-Year Treasurys -- Total ReturnYear 0 1 2 3 4 5 6 7 8 9 10 Cumulative AnnualizedStarting Real Yield 0.45% 0.53% 0.61% 0.69% 0.78% 0.86% 0.94% 1.02% 1.10% 1.18% 1.26%Duration 4.76 4.76 4.76 4.76 4.76 4.76 4.76 4.76 4.76 4.76 4.76 Parallel Yield Change 0.08% 0.08% 0.08% 0.08% 0.08% 0.08% 0.08% 0.08% 0.08% 0.08% 0.81%12-month return 0.06% 0.14% 0.23% 0.31% 0.39% 0.47% 0.55% 0.63% 0.71% 0.80%Compound Factor 100.06% 100.14% 100.23% 100.31% 100.39% 100.47% 100.55% 100.63% 100.71% 100.80% 4.37% 0.43%
market 10-year inflation 1.54%nominal 10-yr annualized return 1.97%
8
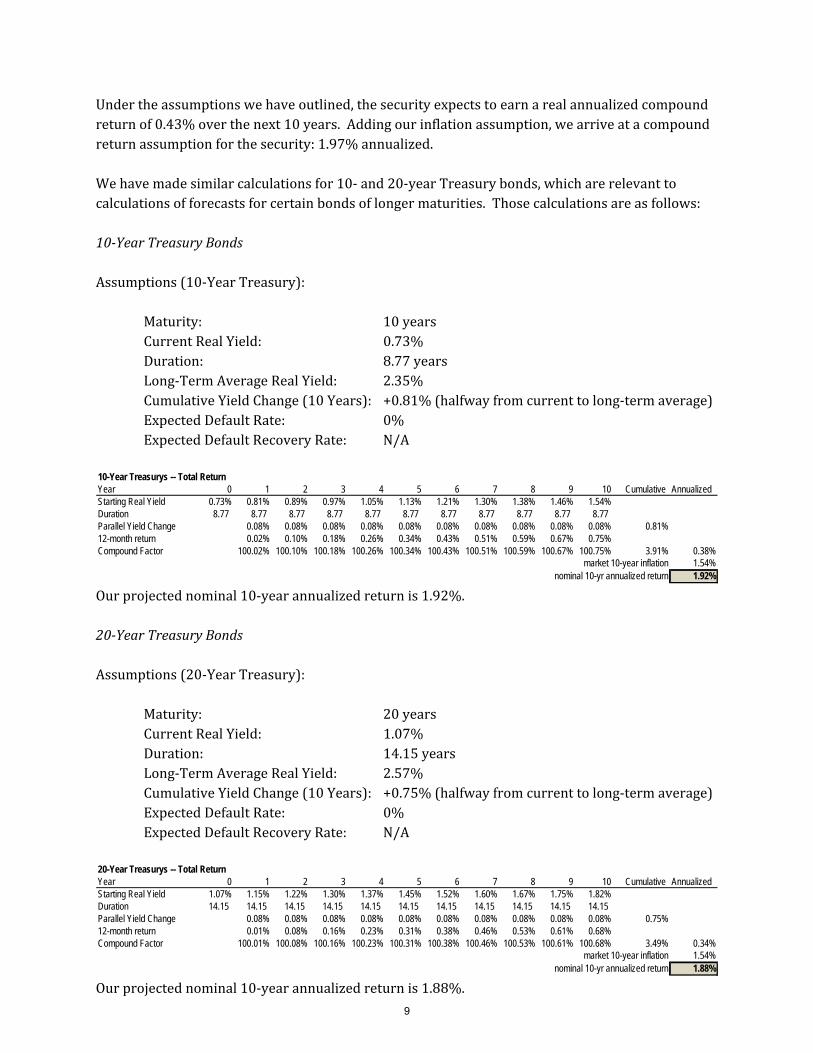
Undertheassumptionswehaveoutlined,thesecurityexpectstoearnarealannualizedcompoundreturnof0.43%overthenext10years.Addingourinflationassumption,wearriveatacompoundreturnassumptionforthesecurity:1.97%annualized.Wehavemadesimilarcalculationsfor10‐and20‐yearTreasurybonds,whicharerelevanttocalculationsofforecastsforcertainbondsoflongermaturities.Thosecalculationsareasfollows:10‐YearTreasuryBondsAssumptions(10‐YearTreasury):
Maturity: 10yearsCurrentRealYield: 0.73%Duration: 8.77yearsLong‐TermAverageRealYield: 2.35%CumulativeYieldChange(10Years): +0.81%(halfwayfromcurrenttolong‐termaverage)ExpectedDefaultRate: 0%ExpectedDefaultRecoveryRate: N/A
Ourprojectednominal10‐yearannualizedreturnis1.92%.20‐YearTreasuryBondsAssumptions(20‐YearTreasury):
Maturity: 20yearsCurrentRealYield: 1.07%Duration: 14.15yearsLong‐TermAverageRealYield: 2.57%CumulativeYieldChange(10Years): +0.75%(halfwayfromcurrenttolong‐termaverage)ExpectedDefaultRate: 0%ExpectedDefaultRecoveryRate: N/A
Ourprojectednominal10‐yearannualizedreturnis1.88%.
10-Year Treasurys -- Total ReturnYear 0 1 2 3 4 5 6 7 8 9 10 Cumulative AnnualizedStarting Real Yield 0.73% 0.81% 0.89% 0.97% 1.05% 1.13% 1.21% 1.30% 1.38% 1.46% 1.54%Duration 8.77 8.77 8.77 8.77 8.77 8.77 8.77 8.77 8.77 8.77 8.77 Parallel Yield Change 0.08% 0.08% 0.08% 0.08% 0.08% 0.08% 0.08% 0.08% 0.08% 0.08% 0.81%12-month return 0.02% 0.10% 0.18% 0.26% 0.34% 0.43% 0.51% 0.59% 0.67% 0.75%Compound Factor 100.02% 100.10% 100.18% 100.26% 100.34% 100.43% 100.51% 100.59% 100.67% 100.75% 3.91% 0.38%
market 10-year inflation 1.54%nominal 10-yr annualized return 1.92%
20-Year Treasurys -- Total ReturnYear 0 1 2 3 4 5 6 7 8 9 10 Cumulative AnnualizedStarting Real Yield 1.07% 1.15% 1.22% 1.30% 1.37% 1.45% 1.52% 1.60% 1.67% 1.75% 1.82%Duration 14.15 14.15 14.15 14.15 14.15 14.15 14.15 14.15 14.15 14.15 14.15 Parallel Yield Change 0.08% 0.08% 0.08% 0.08% 0.08% 0.08% 0.08% 0.08% 0.08% 0.08% 0.75%12-month return 0.01% 0.08% 0.16% 0.23% 0.31% 0.38% 0.46% 0.53% 0.61% 0.68%Compound Factor 100.01% 100.08% 100.16% 100.23% 100.31% 100.38% 100.46% 100.53% 100.61% 100.68% 3.49% 0.34%
market 10-year inflation 1.54%nominal 10-yr annualized return 1.88%
9
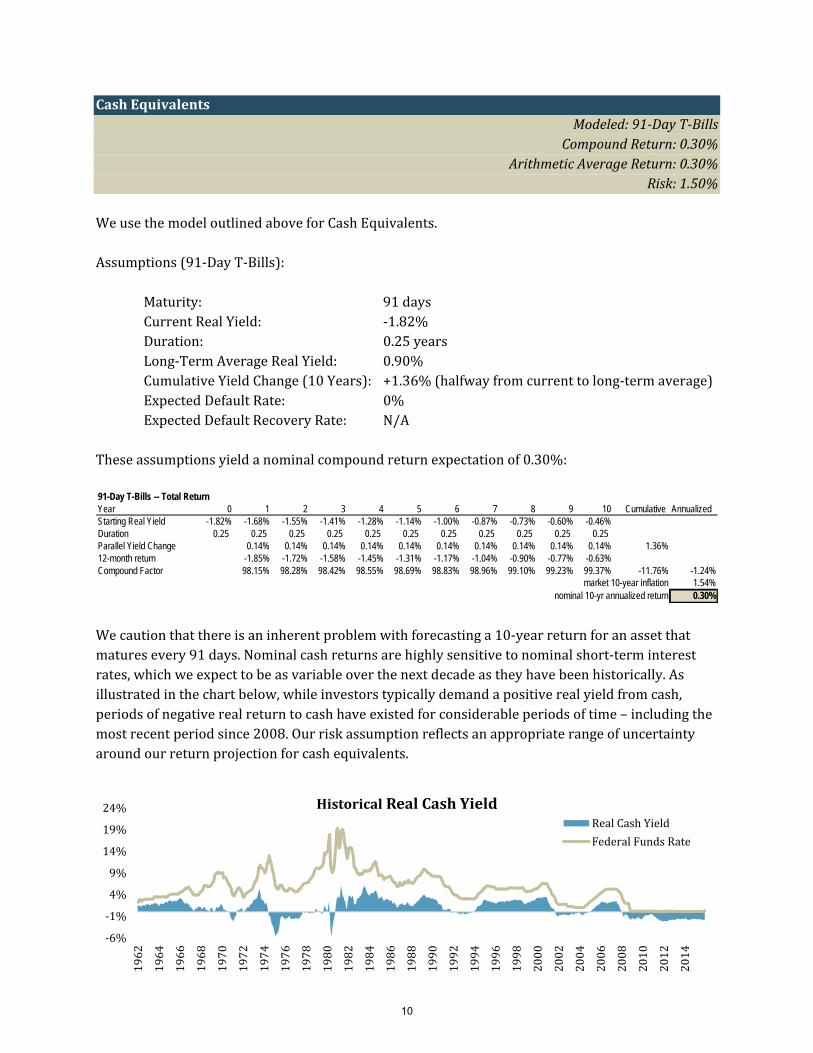
CashEquivalentsModeled:91‐DayT‐Bills
CompoundReturn:0.30%ArithmeticAverageReturn:0.30%
Risk:1.50%WeusethemodeloutlinedaboveforCashEquivalents.Assumptions(91‐DayT‐Bills):
Maturity: 91daysCurrentRealYield: ‐1.82%Duration: 0.25yearsLong‐TermAverageRealYield: 0.90%CumulativeYieldChange(10Years): +1.36%(halfwayfromcurrenttolong‐termaverage)ExpectedDefaultRate: 0%ExpectedDefaultRecoveryRate: N/A
Theseassumptionsyieldanominalcompoundreturnexpectationof0.30%:
Wecautionthatthereisaninherentproblemwithforecastinga10‐yearreturnforanassetthatmaturesevery91days.Nominalcashreturnsarehighlysensitivetonominalshort‐terminterestrates,whichweexpecttobeasvariableoverthenextdecadeastheyhavebeenhistorically.Asillustratedinthechartbelow,whileinvestorstypicallydemandapositiverealyieldfromcash,periodsofnegativerealreturntocashhaveexistedforconsiderableperiodsoftime–includingthemostrecentperiodsince2008.Ourriskassumptionreflectsanappropriaterangeofuncertaintyaroundourreturnprojectionforcashequivalents.
91-Day T-Bills -- Total ReturnYear 0 1 2 3 4 5 6 7 8 9 10 Cumulative AnnualizedStarting Real Yield -1.82% -1.68% -1.55% -1.41% -1.28% -1.14% -1.00% -0.87% -0.73% -0.60% -0.46%Duration 0.25 0.25 0.25 0.25 0.25 0.25 0.25 0.25 0.25 0.25 0.25 Parallel Yield Change 0.14% 0.14% 0.14% 0.14% 0.14% 0.14% 0.14% 0.14% 0.14% 0.14% 1.36%12-month return -1.85% -1.72% -1.58% -1.45% -1.31% -1.17% -1.04% -0.90% -0.77% -0.63%Compound Factor 98.15% 98.28% 98.42% 98.55% 98.69% 98.83% 98.96% 99.10% 99.23% 99.37% -11.76% -1.24%
market 10-year inflation 1.54%nominal 10-yr annualized return 0.30%
‐6%
‐1%
4%
9%
14%
19%
24%
1962
1964
1966
1968
1970
1972
1974
1976
1978
1980
1982
1984
1986
1988
1990
1992
1994
1996
1998
2000
2002
2004
2006
2008
2010
2012
2014
Historical RealCashYieldRealCashYield
FederalFundsRate
10
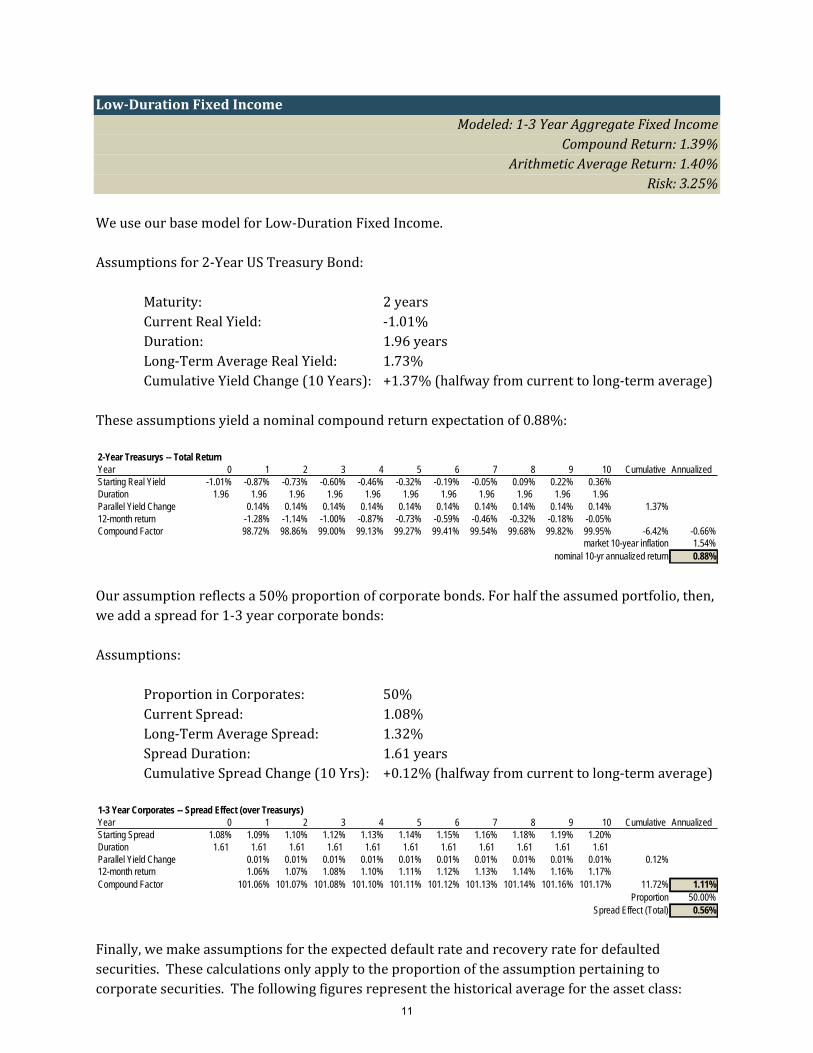
Low‐DurationFixedIncomeModeled:1‐3YearAggregateFixedIncome
CompoundReturn:1.39%ArithmeticAverageReturn:1.40%
Risk:3.25%WeuseourbasemodelforLow‐DurationFixedIncome.Assumptionsfor2‐YearUSTreasuryBond:
Maturity: 2yearsCurrentRealYield: ‐1.01%Duration: 1.96yearsLong‐TermAverageRealYield: 1.73%CumulativeYieldChange(10Years): +1.37%(halfwayfromcurrenttolong‐termaverage)
Theseassumptionsyieldanominalcompoundreturnexpectationof0.88%:
Ourassumptionreflectsa50%proportionofcorporatebonds.Forhalftheassumedportfolio,then,weaddaspreadfor1‐3yearcorporatebonds:Assumptions:
ProportioninCorporates: 50%CurrentSpread: 1.08%Long‐TermAverageSpread: 1.32%SpreadDuration: 1.61yearsCumulativeSpreadChange(10Yrs): +0.12%(halfwayfromcurrenttolong‐termaverage)
Finally,wemakeassumptionsfortheexpecteddefaultrateandrecoveryratefordefaultedsecurities.Thesecalculationsonlyapplytotheproportionoftheassumptionpertainingtocorporatesecurities.Thefollowingfiguresrepresentthehistoricalaveragefortheassetclass:
2-Year Treasurys -- Total ReturnYear 0 1 2 3 4 5 6 7 8 9 10 Cumulative AnnualizedStarting Real Yield -1.01% -0.87% -0.73% -0.60% -0.46% -0.32% -0.19% -0.05% 0.09% 0.22% 0.36%Duration 1.96 1.96 1.96 1.96 1.96 1.96 1.96 1.96 1.96 1.96 1.96 Parallel Yield Change 0.14% 0.14% 0.14% 0.14% 0.14% 0.14% 0.14% 0.14% 0.14% 0.14% 1.37%12-month return -1.28% -1.14% -1.00% -0.87% -0.73% -0.59% -0.46% -0.32% -0.18% -0.05%Compound Factor 98.72% 98.86% 99.00% 99.13% 99.27% 99.41% 99.54% 99.68% 99.82% 99.95% -6.42% -0.66%
market 10-year inflation 1.54%nominal 10-yr annualized return 0.88%
1-3 Year Corporates -- Spread Effect (over Treasurys) Year 0 1 2 3 4 5 6 7 8 9 10 Cumulative AnnualizedStarting Spread 1.08% 1.09% 1.10% 1.12% 1.13% 1.14% 1.15% 1.16% 1.18% 1.19% 1.20%Duration 1.61 1.61 1.61 1.61 1.61 1.61 1.61 1.61 1.61 1.61 1.61 Parallel Yield Change 0.01% 0.01% 0.01% 0.01% 0.01% 0.01% 0.01% 0.01% 0.01% 0.01% 0.12%12-month return 1.06% 1.07% 1.08% 1.10% 1.11% 1.12% 1.13% 1.14% 1.16% 1.17%Compound Factor 101.06% 101.07% 101.08% 101.10% 101.11% 101.12% 101.13% 101.14% 101.16% 101.17% 11.72% 1.11%
Proportion 50.00%Spread Effect (Total) 0.56%
11
Assumptions:
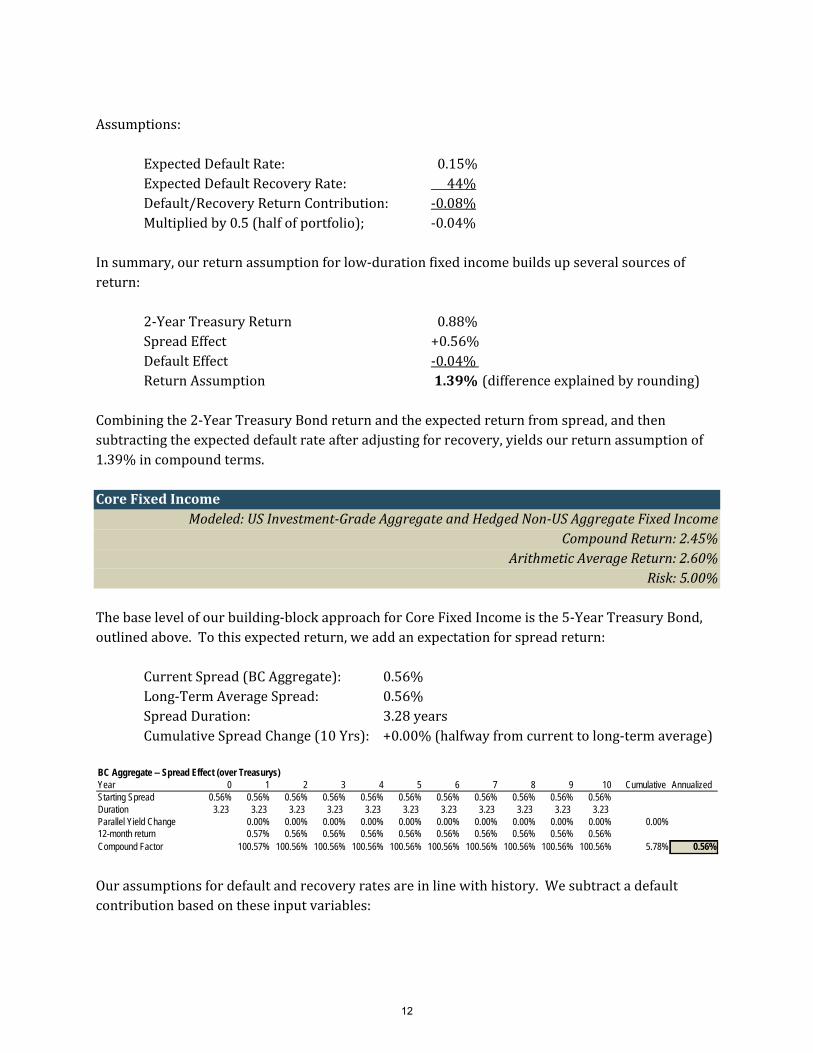
ExpectedDefaultRate: 0.15%ExpectedDefaultRecoveryRate: 44%Default/RecoveryReturnContribution: ‐0.08%Multipliedby0.5(halfofportfolio); ‐0.04%
Insummary,ourreturnassumptionforlow‐durationfixedincomebuildsupseveralsourcesofreturn:
2‐YearTreasuryReturn 0.88%SpreadEffect +0.56%DefaultEffect ‐0.04%ReturnAssumption 1.39%(differenceexplainedbyrounding)
Combiningthe2‐YearTreasuryBondreturnandtheexpectedreturnfromspread,andthensubtractingtheexpecteddefaultrateafteradjustingforrecovery,yieldsourreturnassumptionof1.39%incompoundterms.CoreFixedIncome
Modeled:USInvestment‐GradeAggregateandHedgedNon‐USAggregateFixedIncomeCompoundReturn:2.45%
ArithmeticAverageReturn:2.60%Risk:5.00%
Thebaselevelofourbuilding‐blockapproachforCoreFixedIncomeisthe5‐YearTreasuryBond,outlinedabove.Tothisexpectedreturn,weaddanexpectationforspreadreturn:
CurrentSpread(BCAggregate): 0.56%Long‐TermAverageSpread: 0.56%SpreadDuration: 3.28yearsCumulativeSpreadChange(10Yrs): +0.00%(halfwayfromcurrenttolong‐termaverage)
Ourassumptionsfordefaultandrecoveryratesareinlinewithhistory.Wesubtractadefaultcontributionbasedontheseinputvariables:
BC Aggregate -- Spread Effect (over Treasurys) Year 0 1 2 3 4 5 6 7 8 9 10 Cumulative AnnualizedStarting Spread 0.56% 0.56% 0.56% 0.56% 0.56% 0.56% 0.56% 0.56% 0.56% 0.56% 0.56%Duration 3.23 3.23 3.23 3.23 3.23 3.23 3.23 3.23 3.23 3.23 3.23 Parallel Yield Change 0.00% 0.00% 0.00% 0.00% 0.00% 0.00% 0.00% 0.00% 0.00% 0.00% 0.00%12-month return 0.57% 0.56% 0.56% 0.56% 0.56% 0.56% 0.56% 0.56% 0.56% 0.56%Compound Factor 100.57% 100.56% 100.56% 100.56% 100.56% 100.56% 100.56% 100.56% 100.56% 100.56% 5.78% 0.56%
12
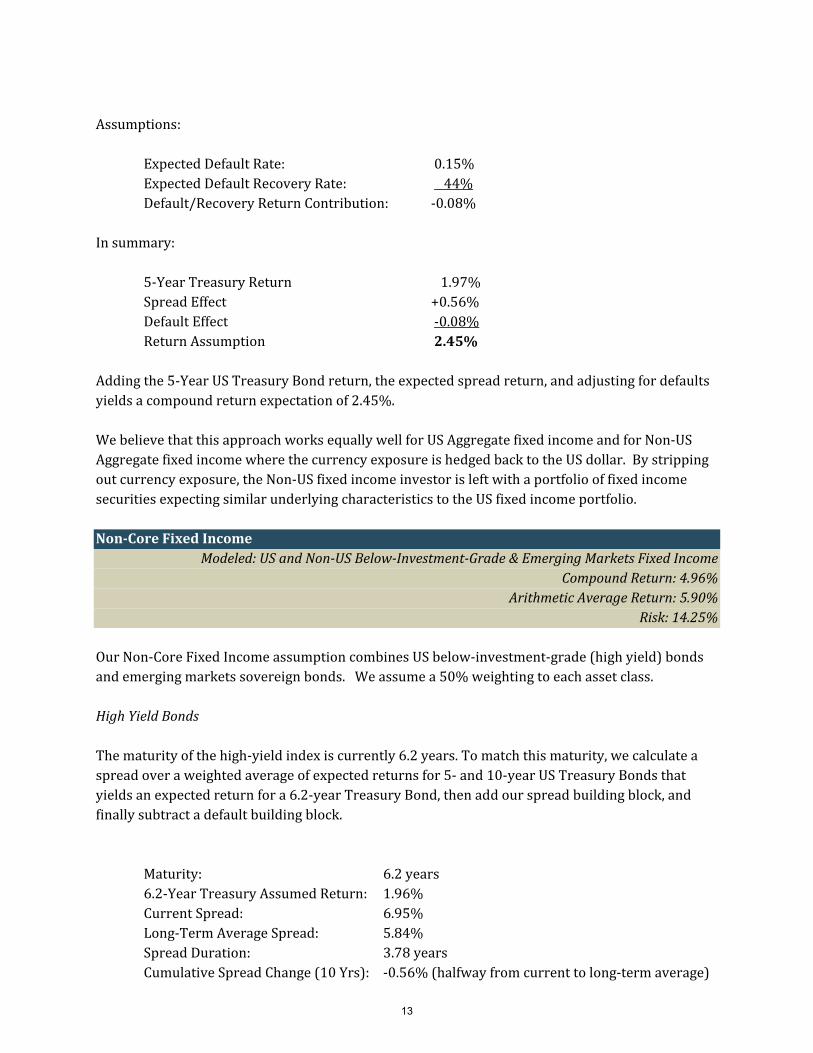
Assumptions:
ExpectedDefaultRate: 0.15%ExpectedDefaultRecoveryRate: 44%Default/RecoveryReturnContribution: ‐0.08%
Insummary:
5‐YearTreasuryReturn 1.97% SpreadEffect +0.56%DefaultEffect ‐0.08% ReturnAssumption 2.45%
Addingthe5‐YearUSTreasuryBondreturn,theexpectedspreadreturn,andadjustingfordefaultsyieldsacompoundreturnexpectationof2.45%.WebelievethatthisapproachworksequallywellforUSAggregatefixedincomeandforNon‐USAggregatefixedincomewherethecurrencyexposureishedgedbacktotheUSdollar.Bystrippingoutcurrencyexposure,theNon‐USfixedincomeinvestorisleftwithaportfoliooffixedincomesecuritiesexpectingsimilarunderlyingcharacteristicstotheUSfixedincomeportfolio.Non‐CoreFixedIncome
Modeled:USandNon‐USBelow‐Investment‐Grade&EmergingMarketsFixedIncomeCompoundReturn:4.96%
ArithmeticAverageReturn:5.90%Risk:14.25%
OurNon‐CoreFixedIncomeassumptioncombinesUSbelow‐investment‐grade(highyield)bondsandemergingmarketssovereignbonds.Weassumea50%weightingtoeachassetclass.HighYieldBondsThematurityofthehigh‐yieldindexiscurrently6.2years.Tomatchthismaturity,wecalculateaspreadoveraweightedaverageofexpectedreturnsfor5‐and10‐yearUSTreasuryBondsthatyieldsanexpectedreturnfora6.2‐yearTreasuryBond,thenaddourspreadbuildingblock,andfinallysubtractadefaultbuildingblock.
Maturity: 6.2years6.2‐YearTreasuryAssumedReturn: 1.96%CurrentSpread: 6.95%Long‐TermAverageSpread: 5.84%SpreadDuration: 3.78yearsCumulativeSpreadChange(10Yrs): ‐0.56%(halfwayfromcurrenttolong‐termaverage)
13
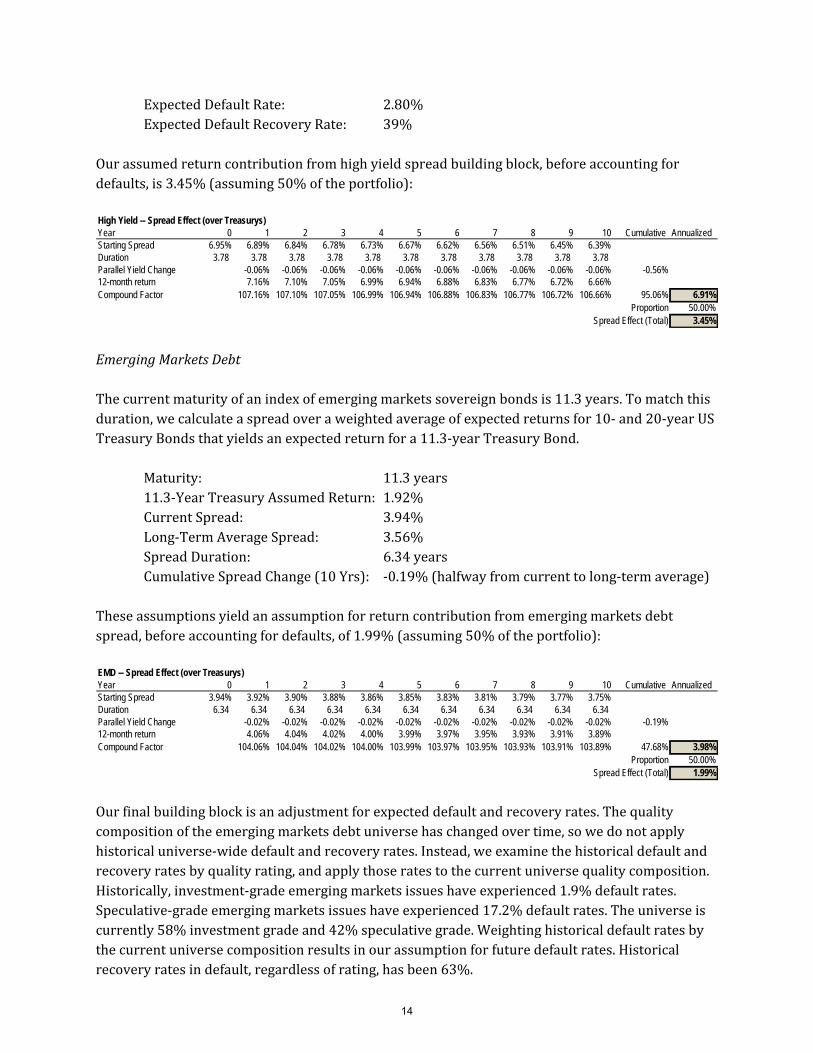
ExpectedDefaultRate: 2.80% ExpectedDefaultRecoveryRate: 39%
Ourassumedreturncontributionfromhighyieldspreadbuildingblock,beforeaccountingfordefaults,is3.45%(assuming50%oftheportfolio):
EmergingMarketsDebtThecurrentmaturityofanindexofemergingmarketssovereignbondsis11.3years.Tomatchthisduration,wecalculateaspreadoveraweightedaverageofexpectedreturnsfor10‐and20‐yearUSTreasuryBondsthatyieldsanexpectedreturnfora11.3‐yearTreasuryBond.
Maturity: 11.3years11.3‐YearTreasuryAssumedReturn: 1.92%CurrentSpread: 3.94%Long‐TermAverageSpread: 3.56%SpreadDuration: 6.34yearsCumulativeSpreadChange(10Yrs): ‐0.19%(halfwayfromcurrenttolong‐termaverage)
Theseassumptionsyieldanassumptionforreturncontributionfromemergingmarketsdebtspread,beforeaccountingfordefaults,of1.99%(assuming50%oftheportfolio):
Ourfinalbuildingblockisanadjustmentforexpecteddefaultandrecoveryrates.Thequalitycompositionoftheemergingmarketsdebtuniversehaschangedovertime,sowedonotapplyhistoricaluniverse‐widedefaultandrecoveryrates.Instead,weexaminethehistoricaldefaultandrecoveryratesbyqualityrating,andapplythoseratestothecurrentuniversequalitycomposition.Historically,investment‐gradeemergingmarketsissueshaveexperienced1.9%defaultrates.Speculative‐gradeemergingmarketsissueshaveexperienced17.2%defaultrates.Theuniverseiscurrently58%investmentgradeand42%speculativegrade.Weightinghistoricaldefaultratesbythecurrentuniversecompositionresultsinourassumptionforfuturedefaultrates.Historicalrecoveryratesindefault,regardlessofrating,hasbeen63%.
High Yield -- Spread Effect (over Treasurys) Year 0 1 2 3 4 5 6 7 8 9 10 Cumulative AnnualizedStarting Spread 6.95% 6.89% 6.84% 6.78% 6.73% 6.67% 6.62% 6.56% 6.51% 6.45% 6.39%Duration 3.78 3.78 3.78 3.78 3.78 3.78 3.78 3.78 3.78 3.78 3.78 Parallel Yield Change -0.06% -0.06% -0.06% -0.06% -0.06% -0.06% -0.06% -0.06% -0.06% -0.06% -0.56%12-month return 7.16% 7.10% 7.05% 6.99% 6.94% 6.88% 6.83% 6.77% 6.72% 6.66%Compound Factor 107.16% 107.10% 107.05% 106.99% 106.94% 106.88% 106.83% 106.77% 106.72% 106.66% 95.06% 6.91%
Proportion 50.00%Spread Effect (Total) 3.45%
EMD -- Spread Effect (over Treasurys)Year 0 1 2 3 4 5 6 7 8 9 10 Cumulative AnnualizedStarting Spread 3.94% 3.92% 3.90% 3.88% 3.86% 3.85% 3.83% 3.81% 3.79% 3.77% 3.75%Duration 6.34 6.34 6.34 6.34 6.34 6.34 6.34 6.34 6.34 6.34 6.34 Parallel Yield Change -0.02% -0.02% -0.02% -0.02% -0.02% -0.02% -0.02% -0.02% -0.02% -0.02% -0.19%12-month return 4.06% 4.04% 4.02% 4.00% 3.99% 3.97% 3.95% 3.93% 3.91% 3.89%Compound Factor 104.06% 104.04% 104.02% 104.00% 103.99% 103.97% 103.95% 103.93% 103.91% 103.89% 47.68% 3.98%
Proportion 50.00%Spread Effect (Total) 1.99%
14
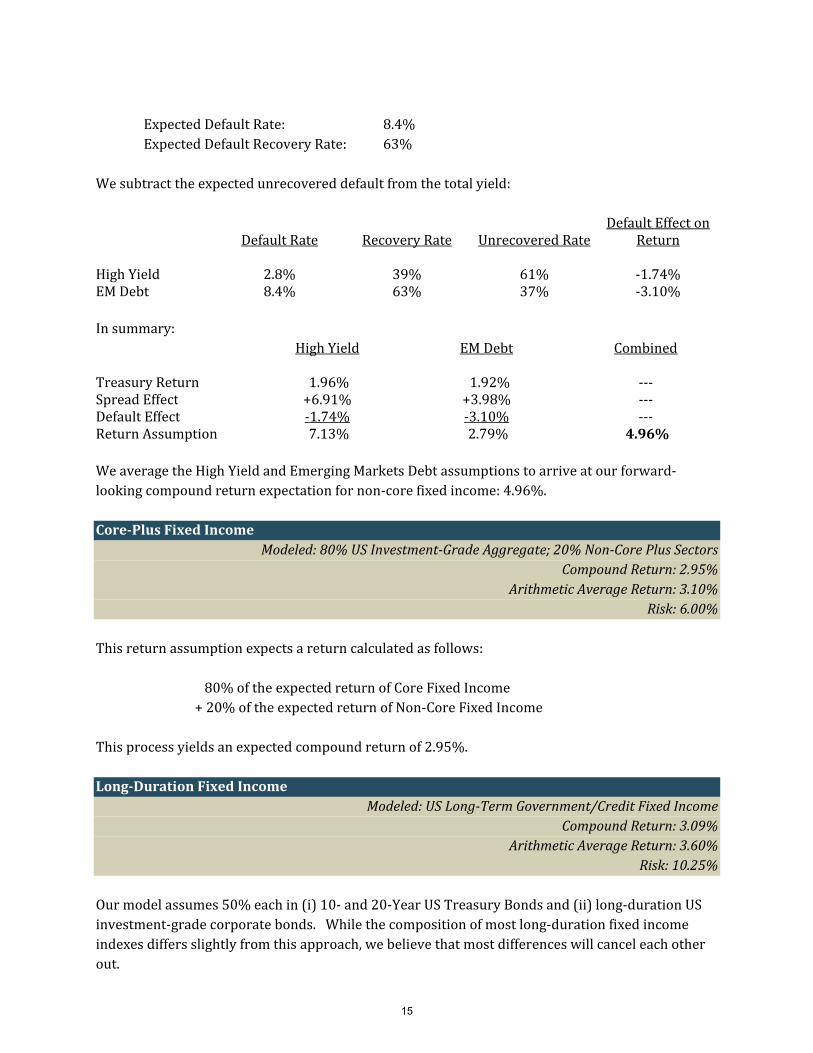
ExpectedDefaultRate: 8.4% ExpectedDefaultRecoveryRate: 63%
Wesubtracttheexpectedunrecovereddefaultfromthetotalyield:
DefaultRate RecoveryRate UnrecoveredRate
DefaultEffectonReturn
HighYield 2.8% 39% 61% ‐1.74%EMDebt 8.4% 63% 37% ‐3.10%Insummary: HighYield EMDebt Combined
TreasuryReturn 1.96% 1.92% ‐‐‐SpreadEffect +6.91% +3.98% ‐‐‐DefaultEffect ‐1.74% ‐3.10% ‐‐‐ReturnAssumption 7.13% 2.79% 4.96%WeaveragetheHighYieldandEmergingMarketsDebtassumptionstoarriveatourforward‐lookingcompoundreturnexpectationfornon‐corefixedincome:4.96%.Core‐PlusFixedIncome
Modeled:80%USInvestment‐GradeAggregate;20%Non‐CorePlusSectorsCompoundReturn:2.95%
ArithmeticAverageReturn:3.10%Risk:6.00%
Thisreturnassumptionexpectsareturncalculatedasfollows:
80%oftheexpectedreturnofCoreFixedIncome +20%oftheexpectedreturnofNon‐CoreFixedIncomeThisprocessyieldsanexpectedcompoundreturnof2.95%.Long‐DurationFixedIncome
Modeled:USLong‐TermGovernment/CreditFixedIncomeCompoundReturn:3.09%
ArithmeticAverageReturn:3.60%Risk:10.25%
Ourmodelassumes50%eachin(i)10‐and20‐YearUSTreasuryBondsand(ii)long‐durationUSinvestment‐gradecorporatebonds.Whilethecompositionofmostlong‐durationfixedincomeindexesdiffersslightlyfromthisapproach,webelievethatmostdifferenceswillcanceleachotherout.
15
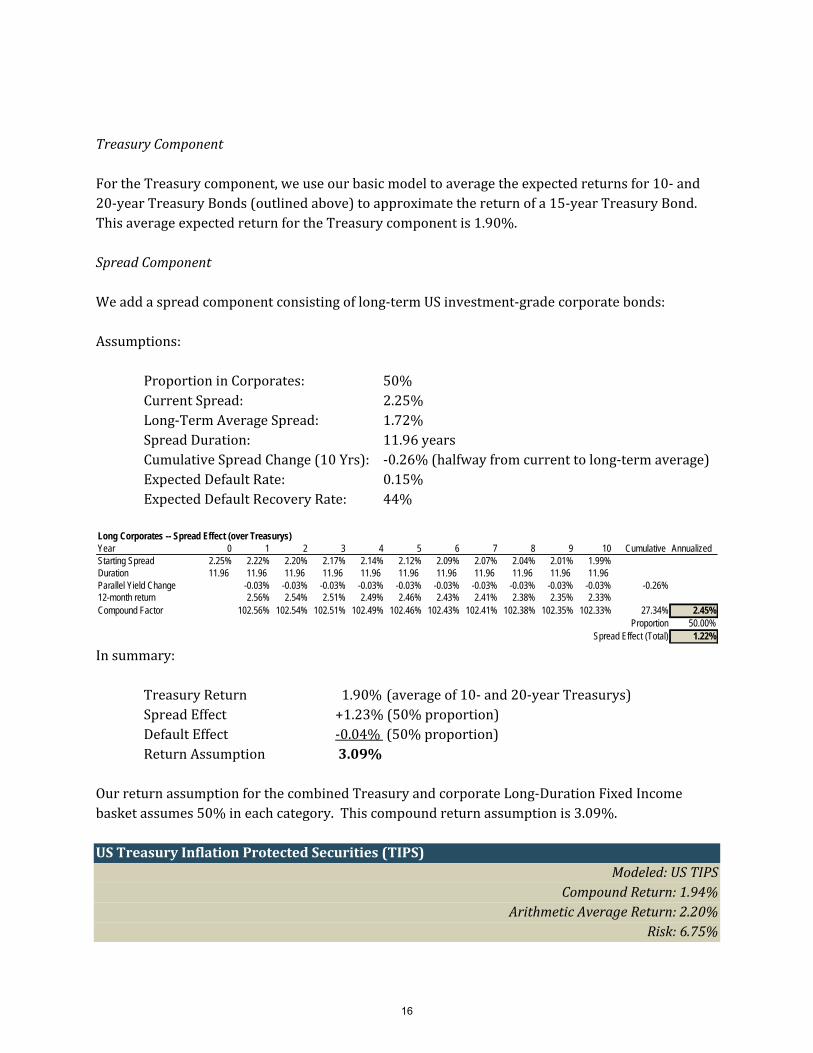
TreasuryComponentFortheTreasurycomponent,weuseourbasicmodeltoaveragetheexpectedreturnsfor10‐and20‐yearTreasuryBonds(outlinedabove)toapproximatethereturnofa15‐yearTreasuryBond.ThisaverageexpectedreturnfortheTreasurycomponentis1.90%.SpreadComponentWeaddaspreadcomponentconsistingoflong‐termUSinvestment‐gradecorporatebonds:Assumptions:
ProportioninCorporates: 50%CurrentSpread: 2.25%Long‐TermAverageSpread: 1.72%SpreadDuration: 11.96yearsCumulativeSpreadChange(10Yrs): ‐0.26%(halfwayfromcurrenttolong‐termaverage)ExpectedDefaultRate: 0.15% ExpectedDefaultRecoveryRate: 44%
Insummary:
TreasuryReturn 1.90%(averageof10‐and20‐yearTreasurys)SpreadEffect +1.23%(50%proportion)DefaultEffect ‐0.04%(50%proportion)ReturnAssumption 3.09%
OurreturnassumptionforthecombinedTreasuryandcorporateLong‐DurationFixedIncomebasketassumes50%ineachcategory.Thiscompoundreturnassumptionis3.09%.USTreasuryInflationProtectedSecurities(TIPS)
Modeled:USTIPSCompoundReturn:1.94%
ArithmeticAverageReturn:2.20%Risk:6.75%
Long Corporates -- Spread Effect (over Treasurys) Year 0 1 2 3 4 5 6 7 8 9 10 Cumulative AnnualizedStarting Spread 2.25% 2.22% 2.20% 2.17% 2.14% 2.12% 2.09% 2.07% 2.04% 2.01% 1.99%Duration 11.96 11.96 11.96 11.96 11.96 11.96 11.96 11.96 11.96 11.96 11.96 Parallel Yield Change -0.03% -0.03% -0.03% -0.03% -0.03% -0.03% -0.03% -0.03% -0.03% -0.03% -0.26%12-month return 2.56% 2.54% 2.51% 2.49% 2.46% 2.43% 2.41% 2.38% 2.35% 2.33%Compound Factor 102.56% 102.54% 102.51% 102.49% 102.46% 102.43% 102.41% 102.38% 102.35% 102.33% 27.34% 2.45%
Proportion 50.00%Spread Effect (Total) 1.22%
16
GiventhatthefirstUSTIPSissuancewasin1997,wearehesitanttorelyonany“long‐term”yieldorspreadaveragestofurthermodeltheassetclass.Instead,wemodelaproxyfortheBarclaysUSTIPSIndex,whichcurrentlyhasamaturityof8.5years.Aportfolioof30%5‐yearTreasuryBonds,and70%10‐yearTreasurybondsresultsinahypotheticalTreasurybondwith8.5‐yearmaturity.Assumingourinflationexpectationof1.54%peryearfortheprospective10‐yearperiod,theexpectedTIPSreturnissimplyaweightedaverageofourreturnexpectationsforthenominal10‐yearand5‐yearTreasurybonds.Applyingtheseweightstoourreturnprojectionsforthosebondsresultsina10‐yearTIPSreturnassumptionof1.94%:
(30%x1.97%)+(70%x1.92%)=1.94%.
17
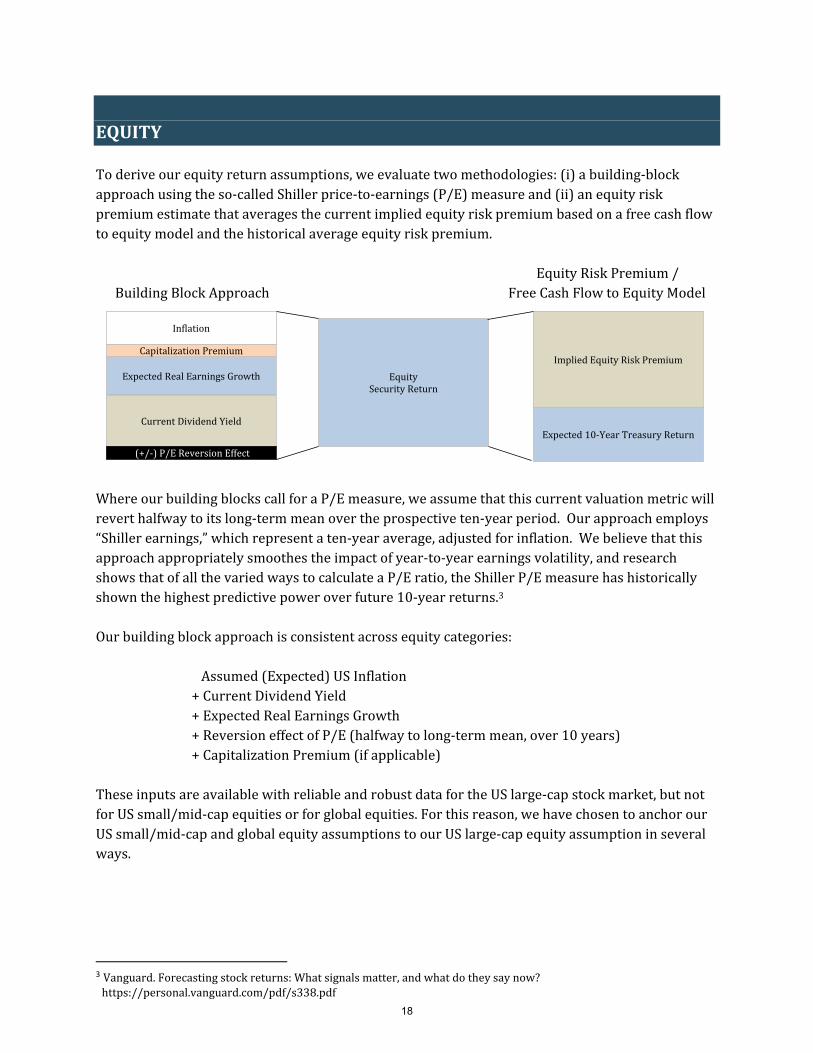
EQUITYToderiveourequityreturnassumptions,weevaluatetwomethodologies:(i)abuilding‐blockapproachusingtheso‐calledShillerprice‐to‐earnings(P/E)measureand(ii)anequityriskpremiumestimatethataveragesthecurrentimpliedequityriskpremiumbasedonafreecashflowtoequitymodelandthehistoricalaverageequityriskpremium. EquityRiskPremium/BuildingBlockApproachFreeCashFlowtoEquityModel
WhereourbuildingblockscallforaP/Emeasure,weassumethatthiscurrentvaluationmetricwillreverthalfwaytoitslong‐termmeanovertheprospectiveten‐yearperiod.Ourapproachemploys“Shillerearnings,”whichrepresentaten‐yearaverage,adjustedforinflation.Webelievethatthisapproachappropriatelysmoothestheimpactofyear‐to‐yearearningsvolatility,andresearchshowsthatofallthevariedwaystocalculateaP/Eratio,theShillerP/Emeasurehashistoricallyshownthehighestpredictivepoweroverfuture10‐yearreturns.3Ourbuildingblockapproachisconsistentacrossequitycategories:
Assumed(Expected)USInflation+CurrentDividendYield+ExpectedRealEarningsGrowth+ReversioneffectofP/E(halfwaytolong‐termmean,over10years)+CapitalizationPremium(ifapplicable)
TheseinputsareavailablewithreliableandrobustdatafortheUSlarge‐capstockmarket,butnotforUSsmall/mid‐capequitiesorforglobalequities.Forthisreason,wehavechosentoanchorourUSsmall/mid‐capandglobalequityassumptionstoourUSlarge‐capequityassumptioninseveralways.
3 Vanguard.Forecastingstockreturns:Whatsignalsmatter,andwhatdotheysaynow?https://personal.vanguard.com/pdf/s338.pdf
CurrentDividendYield
ExpectedReal EarningsGrowth
Inflation
(+/‐)P/EReversionEffect
EquitySecurityReturn
CapitalizationPremiumImpliedEquityRiskPremium
Expected10‐Year TreasuryReturn
18
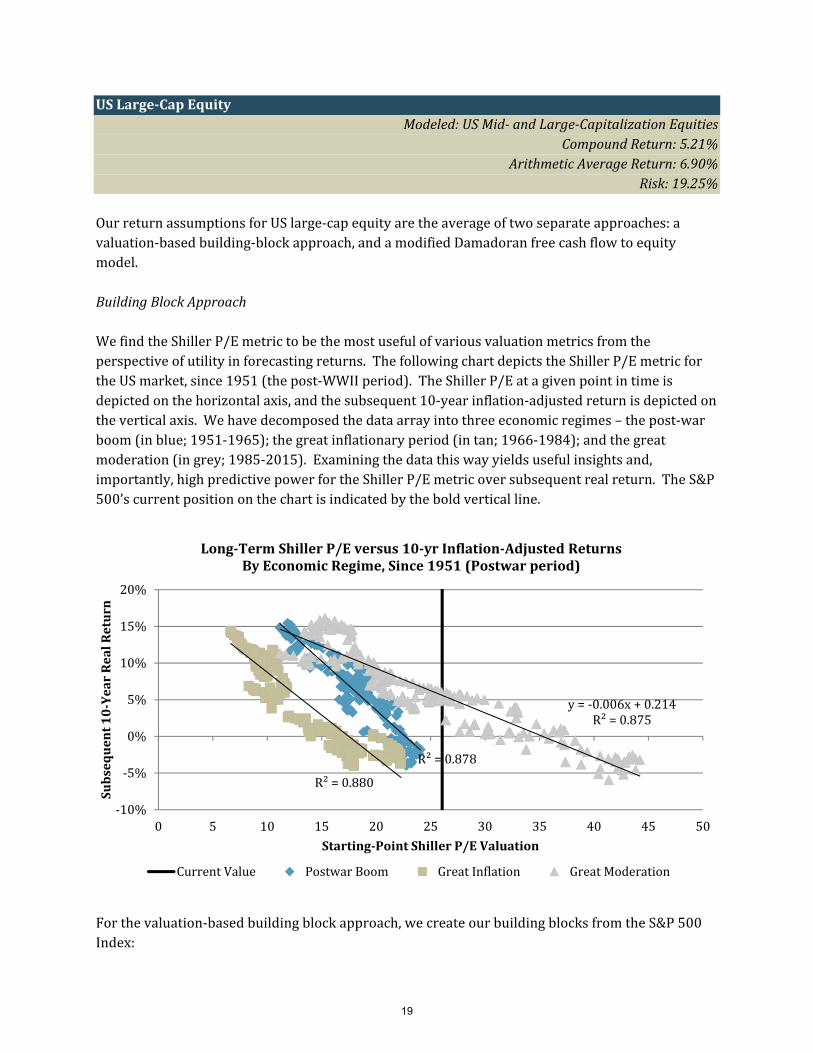
USLarge‐CapEquityModeled:USMid‐andLarge‐CapitalizationEquities
CompoundReturn:5.21%ArithmeticAverageReturn:6.90%
Risk:19.25%OurreturnassumptionsforUSlarge‐capequityaretheaverageoftwoseparateapproaches:avaluation‐basedbuilding‐blockapproach,andamodifiedDamadoranfreecashflowtoequitymodel.BuildingBlockApproachWefindtheShillerP/Emetrictobethemostusefulofvariousvaluationmetricsfromtheperspectiveofutilityinforecastingreturns.ThefollowingchartdepictstheShillerP/EmetricfortheUSmarket,since1951(thepost‐WWIIperiod).TheShillerP/Eatagivenpointintimeisdepictedonthehorizontalaxis,andthesubsequent10‐yearinflation‐adjustedreturnisdepictedontheverticalaxis.Wehavedecomposedthedataarrayintothreeeconomicregimes–thepost‐warboom(inblue;1951‐1965);thegreatinflationaryperiod(intan;1966‐1984);andthegreatmoderation(ingrey;1985‐2015).Examiningthedatathiswayyieldsusefulinsightsand,importantly,highpredictivepowerfortheShillerP/Emetricoversubsequentrealreturn.TheS&P500’scurrentpositiononthechartisindicatedbytheboldverticalline.
Forthevaluation‐basedbuildingblockapproach,wecreateourbuildingblocksfromtheS&P500Index:
R²=0.878
R²=0.880
y=‐0.006x+0.214R²=0.875
‐10%
‐5%
0%
5%
10%
15%
20%
0 5 10 15 20 25 30 35 40 45 50
Subsequent10‐YearRealReturn
Starting‐PointShillerP/EValuation
Long‐TermShillerP/Eversus10‐yrInflation‐AdjustedReturnsByEconomicRegime,Since1951(Postwarperiod)
CurrentValue PostwarBoom GreatInflation GreatModeration
19
1.54% Inflation 2.11% CurrentDividendYield 1.74% Long‐TermCompoundAverageRealEarningsGrowth(Since1871) WemeasureexpectedP/Ereversionhalfwaytolong‐termmean: ShillerP/E Current 26.06
Long‐TermAverage 16.65 AnnualReversionEffect ‐2.19% (halfwaytolong‐termaverage)
ThebuildingblocksapproachresultsinanexpectedcompoundreturnforUSLarge‐CapEquityof3.20%.ThisapproachrepresentshalfofourcalculationforLarge‐CapUSEquity.EquityRiskPremium/DiscountedFreeCashFlowModelFortheimpliedequityriskpremium,wereferenceandmodifyadiscountedfreecashflowmodelcreatedbyProfessorAswathDamodaranoftheSternSchoolofBusiness4thatusesafreecashflowtoequityapproachtoaccountfordividendsaswellasstockbuybacks.Ourmodifiedfree‐cash‐flow‐to‐equitymodelemploysseveralinputvariables:Beginning(current)S&P500level= 2043.94Baseyearfreecashflowtoequity,S&P500= $106.095ExpectedS&P500earningsgrowthovernext5years= 4.80%6ExpectedS&P500earningsgrowthforyears5‐10= 1.92%7WeapplyastandarddiscountedcashflowmethodologytothesevariablesandsolvefortherateofgrowththatmakesthediscountedforecastedvalueoftheS&P500identicaltotoday’svalue.
2043.94106.09 1.0480
1106.09 1.0480
1106.09 1.0480
1106.09 1.0480
1106.09 1.0480
1106.09 1.0480 1.0192
0.0192 1
SolvingforryieldstheexpectednominalreturnfortheS&P500overthenext10years,undertheseassumptions.Thatrateofreturnis7.92%.Subtractingourassumed10‐YearTreasuryreturnof1.92%resultsinanexpectedequityriskpremiumof6.00%.Thisimpliedequityriskpremiumishigherthanwhathistoryhasdelivered.Tocorrectforthis,weaveragethecurrentimpliedforward‐lookingequityriskpremium(6.00%)andthelong‐termhistoricalgeometricaveragerealizedequityriskpremium(4.60%)toderiveanequityrisk
4 http://pages.stern.nyu.edu/~adamodar/ 52015S&P500Dividends=$42.66+buybacks=$63.43.6I/B/E/Sanalystconsensusearningsgrowthoverthenextyearis5.55%.Historically,theI/B/E/Sconsensusanalystforecasthasoverstatedsubsequentactualearningsgrowthby15.6%.Wereduceourassumptionforearningsgrowthby13.5%(1‐(1/1.155))accordingly.
7 Ourforecastedreturnforthe10‐yearTreasuryBond,asaproxyfortheten‐yearrisk‐freerate.
20
premiumestimateof5.30%forUSLarge‐CapEquity.Substitutingthisassumedequityriskpremiumintothemodelresultsinareturnestimateof7.22%.Averagingtheexpectedreturnsgeneratedbythebuilding‐blocksapproachandthediscountedfreecashflowmodelyieldsanexpectedcompoundreturnof5.21%.USSmall/Mid‐CapEquity
Modeled:USSmall‐andMid‐CapitalizationEquitiesCompoundReturn:5.34%
ArithmeticAverageReturn:7.20%Risk:20.25%
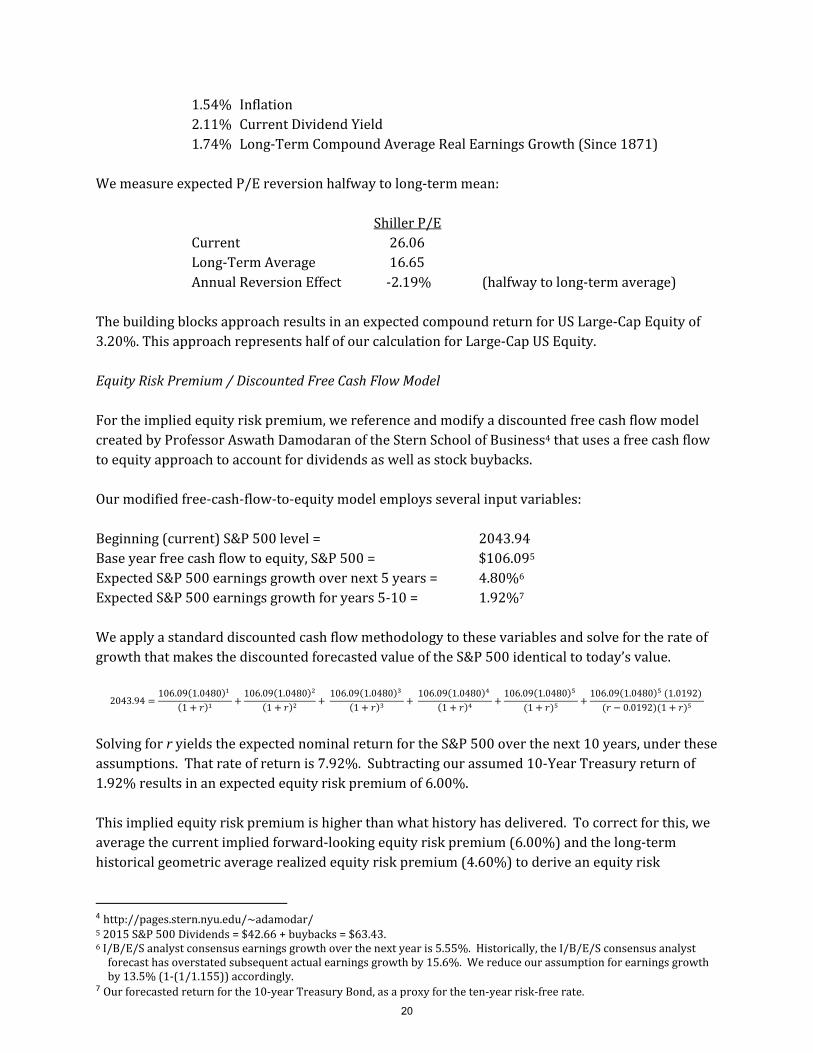
ToourUSLarge‐CapEquityassumption,weaddasmall/mid‐capcompoundreturnpremium.Historically,small‐capsecuritieshaveexperiencedareturnpremiumof0.25%annualized.USsmall‐capstockshavealsohistoricallytradedatahigheraveragevaluationthanUSlarge‐capstocks–inaratioofapproximately1.2:1,asindicatedbythehorizontallineinthefollowingchart.Thecurrentvaluationpremium,asindicatedbytheblueline,ishigheratapproximately1.5.
Whilewearedisinclinedtoreadtoomuchintothisvaluationmetric,givenitslimitedhistory(since1979),wedousethisvaluationinsighttoreduceourexpectationforsmall‐capreturnpremiumbyhalf.Assuch,weadd0.125%toourlarge‐capequityassumptiontoyieldacompoundreturnassumptionforUSsmall/mid‐capequitysecuritiesof5.34%.USEquity
Modeled:USEquities,AllCapitalizationsCompoundReturn:5.24%
ArithmeticAverageReturn:6.90%Risk:19.00%
OurreturnassumptionforUSEquityisintendedtomodeltheentireUSequitymarket.Itassumesthecurrentweightingoflarge‐andsmall/mid‐capitalizationequitiesintheUSequitymarket–81%
0.7
0.9
1.1
1.3
1.5
1.7
1.9
1988
1989
1990
1991
1992
1993
1994
1995
1996
1997
1998
1999
1999
2000
2001
2002
2003
2004
2005
2006
2007
2008
2009
2010
2010
2011
2012
2013
2014
2015
RatioofUSSmall‐CaptoUSLarge‐CapShillerP/E
RelativeValue AverageRelativeValue
21
large,and19%small/mid8.TheseweightsareappliedtotheunderlyingUSLarge‐CapandUSSmall/Mid‐CapEquityassumptionstoyield5.24%incompoundterms:
(81%x5.21%)+(19%x5.34%)=5.24%.
Non‐USLarge‐CapEquityModeled:Non‐USLarge‐CapitalizationEquities,DevelopedandEmerging
CompoundReturn:6.25%ArithmeticAverageReturn:8.70%
Risk:23.50%Webuildseparateassumptionsfordevelopedandemergingnon‐USmarkets,andthenweighthemaccordingtocurrentmarketweightstoconstructourNon‐USLarge‐CapEquityassumption,whichisintendedtomodelequitiesofbothdevelopedandemergingmarkets.Becauseofdatalimitations,wehavereliedlessonactualhistoricalexperienceforinternationalmarketsthanwehaveonqualitativeadjustmentstomorerobustUSmarketdata.Fordevelopedmarkets,ourassumedbuildingblocksareasfollows: 1.54% Inflation 3.17% CurrentDividendYield 1.35% CompoundAverageRealEarningsGrowth(Since1988) WemeasureexpectedP/Ereversionhalfwaytolong‐termmean: ShillerP/E Current 14.10
Long‐TermAverage 13.709 AnnualReversionEffect ‐0.12%(halfwaytolong‐termaverage)
Thisapproachyieldsanexpectedcompoundreturnfordeveloped‐marketsnon‐USlarge‐capitalizationequitiesof5.94%.Ouremergingmarketsequityapproachisdetailedbelow.Itscompoundreturnassumptionis7.40%.Developedmarketscurrentlycomprise79%,andemergingmarkets21%,ofthenon‐UStotalequitymarketcapitalization.Applyingthoseweightstoourdevelopedandemergingmarketsassumptionsyieldsanon‐USlarge‐capitalizationcompoundreturnassumptionof6.25%.
8Russell,http://www.russell.com/indexes/documents/US_Indexes_comparison.pdf.9OverthelongestcommonperiodforwhichwehavebothUS(S&P500)andDevelopedNon‐US(MSCIEAFE)earningsseries(since1995),EAFEhastradedatanaveragevaluationlevelapproximately82.6%oftheleveloftheS&P500.Weapplythisfractiontoourassumptionforthelong‐termP/EofUSlarge‐capitalizationstockstoarriveatourassumedlong‐termaveragevaluationleveltowhichweexpectnon‐USlarge‐capitalizationstockstorevert.
22
Non‐USSmall‐CapEquityModeled:Non‐USSmall‐CapitalizationEquities,DevelopedandEmerging
CompoundReturn:6.50%ArithmeticAverageReturn:9.80%
Risk:27.75%
ToourNon‐USLarge‐CapEquityassumption,weaddacompoundreturnpremiumbuildingblockof0.25%,thesameundiscountedhistoricalpremiumweusedforUSsmall‐capequities.Thisyieldsacompoundreturnassumptionof6.50%.Givenverylimiteddatafornon‐USsmall‐capitalizationequities,wearenotinclinedtomakeavaluationadjustmentbasedonreversiontoanaverage.EmergingMarketsEquity
Modeled:EmergingMarketsEquityCompoundReturn:7.40%
ArithmeticAverageReturn:11.20%Risk:29.75%
Ourassumedbuildingblocksareasfollows: 1.54% Inflation 2.81% CurrentDividendYield 1.32% RealEarningsGrowth10WemeasureexpectedP/Ereversionhalfwaytolong‐termmean: ShillerP/E Current 10.50
Long‐TermAverage 14.7011 Annualreversioneffect1.74% (halfwaytolong‐termaverage)
AddingthisP/Ereversionmeasuretotheotherbuildingblocksyieldsanexpectedcompoundreturnof7.40%.
10Overthelongestcommonperiodforwhichwehavedataondeveloped(MSCIEAFE)andemerging(MSCIEM)marketsearnings(1995),theemergingmarketshaveaveraged98%oftheearningsgrowthrateofdevelopedmarkets.Weapplythisproportiontoourassumedlong‐termearningsgrowthratefordevelopedmarketstoyieldanassumedemergingmarketsearningsgrowthrateof1.32%.
11Since1995,thelongestdataseriesavailablefornon‐USmarketearnings,theaverageShillerP/Eratioforemergingmarketshasbeen19.8.Wenotethattheperiodsince1995hasgloballybeenaperiodofhighervaluationsthanhavehistoricallybeenexperienced.Forthisreason,wedonotassumethatemergingmarketsearningswillreverttotherelativelyhighlevel–instead,weassumethatemergingmarketswillcommandanaverageP/Eratio1.00higherthandevelopednon‐USmarketswill.
23
Non‐USEquityModeled:Non‐USEquities,AllRegions&Capitalizations
CompoundReturn:6.30%ArithmeticAverageReturn:8.80%
Risk:24.00%OurreturnassumptionforNon‐USEquityisintendedtomodeltheentireNon‐USequitymarket.Itassumesthecurrentweightingoflarge‐capandsmall‐capmarketsequitiesintheinternationalequitymarket–80%large‐capand20%small‐cap.TheseweightsareappliedtotheunderlyingNon‐USLarge‐CapEquityandNon‐USSmall‐CapEquityassumptions.Thisweightingyieldsacompoundreturnassumptionof6.30%:
(80%x6.25%)+(20%x6.50%)=6.30%.
24
ALTERNATIVESAlternativeassetsshareacommonelementofnoteasilybeingmodeledwithpublic‐marketindexproxies.Aswell,wearemorereluctanttorelyontheirlong‐termhistory,givengrowthinassetsallocatedtosuchstrategiesoverthelastseveraldecadesandthedynamicnatureofstrategiesemployed.RealEstate
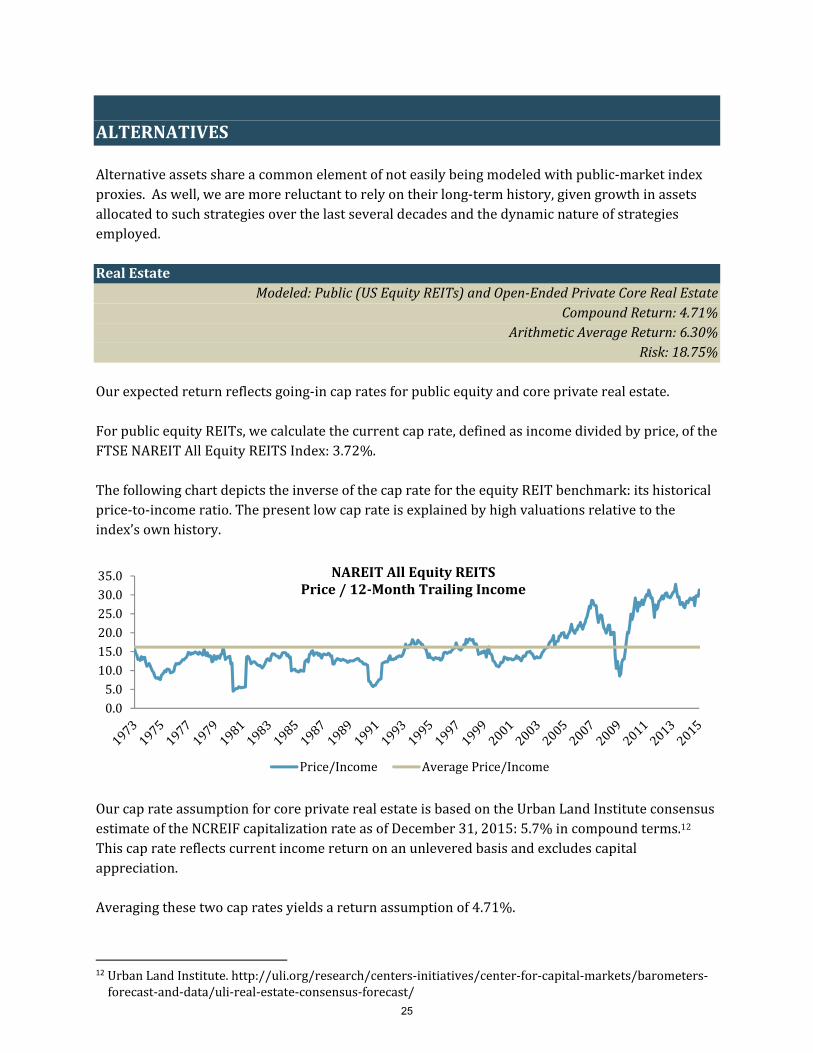
Modeled:Public(USEquityREITs)andOpen‐EndedPrivateCoreRealEstateCompoundReturn:4.71%
ArithmeticAverageReturn:6.30%Risk:18.75%
Ourexpectedreturnreflectsgoing‐incapratesforpublicequityandcoreprivaterealestate.ForpublicequityREITs,wecalculatethecurrentcaprate,definedasincomedividedbyprice,oftheFTSENAREITAllEquityREITSIndex:3.72%.ThefollowingchartdepictstheinverseofthecapratefortheequityREITbenchmark:itshistoricalprice‐to‐incomeratio.Thepresentlowcaprateisexplainedbyhighvaluationsrelativetotheindex’sownhistory.
OurcaprateassumptionforcoreprivaterealestateisbasedontheUrbanLandInstituteconsensusestimateoftheNCREIFcapitalizationrateasofDecember31,2015:5.7%incompoundterms.12Thiscapratereflectscurrentincomereturnonanunleveredbasisandexcludescapitalappreciation.Averagingthesetwocapratesyieldsareturnassumptionof4.71%.
12 UrbanLandInstitute.http://uli.org/research/centers‐initiatives/center‐for‐capital‐markets/barometers‐forecast‐and‐data/uli‐real‐estate‐consensus‐forecast/
0.05.010.015.020.025.030.035.0 NAREITAllEquityREITS
Price/12‐MonthTrailingIncome
Price/Income AveragePrice/Income
25
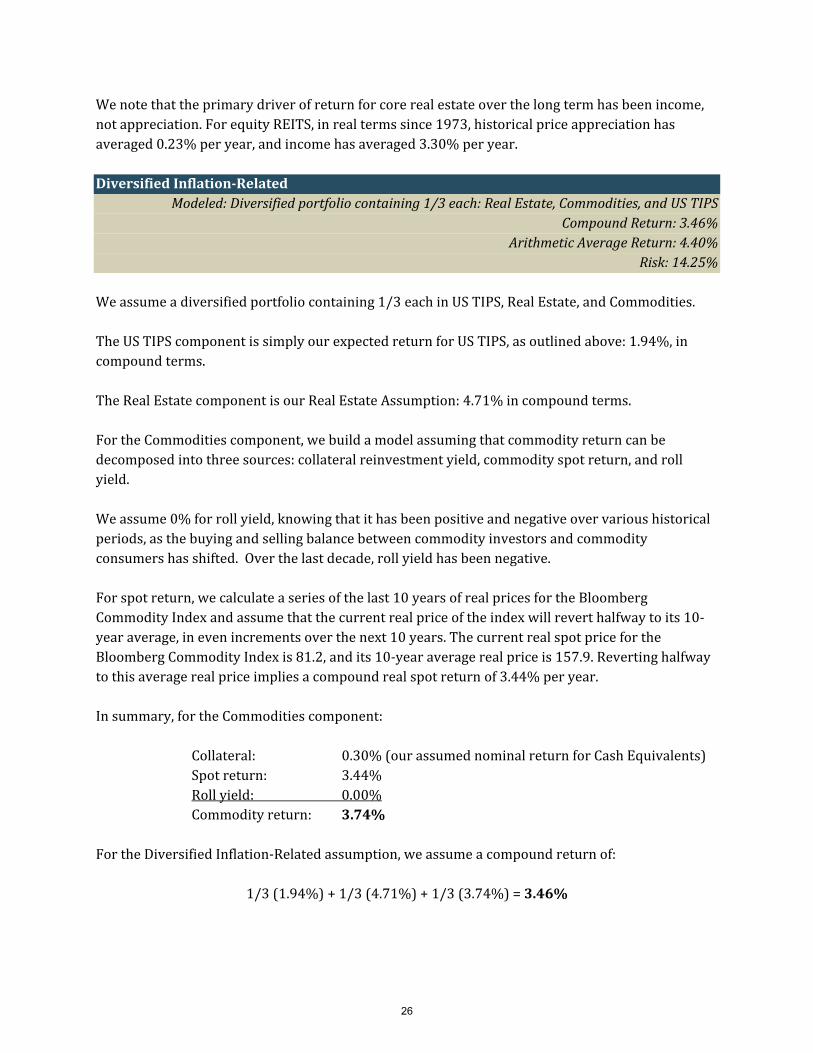
Wenotethattheprimarydriverofreturnforcorerealestateoverthelongtermhasbeenincome,notappreciation.ForequityREITS,inrealtermssince1973,historicalpriceappreciationhasaveraged0.23%peryear,andincomehasaveraged3.30%peryear.DiversifiedInflation‐Related
Modeled:Diversifiedportfoliocontaining1/3each:RealEstate,Commodities,andUSTIPSCompoundReturn:3.46%
ArithmeticAverageReturn:4.40%Risk:14.25%
Weassumeadiversifiedportfoliocontaining1/3eachinUSTIPS,RealEstate,andCommodities.TheUSTIPScomponentissimplyourexpectedreturnforUSTIPS,asoutlinedabove:1.94%,incompoundterms.TheRealEstatecomponentisourRealEstateAssumption:4.71%incompoundterms.FortheCommoditiescomponent,webuildamodelassumingthatcommodityreturncanbedecomposedintothreesources:collateralreinvestmentyield,commodityspotreturn,androllyield.Weassume0%forrollyield,knowingthatithasbeenpositiveandnegativeovervarioushistoricalperiods,asthebuyingandsellingbalancebetweencommodityinvestorsandcommodityconsumershasshifted.Overthelastdecade,rollyieldhasbeennegative.Forspotreturn,wecalculateaseriesofthelast10yearsofrealpricesfortheBloombergCommodityIndexandassumethatthecurrentrealpriceoftheindexwillreverthalfwaytoits10‐yearaverage,inevenincrementsoverthenext10years.ThecurrentrealspotpricefortheBloombergCommodityIndexis81.2,andits10‐yearaveragerealpriceis157.9.Revertinghalfwaytothisaveragerealpriceimpliesacompoundrealspotreturnof3.44%peryear.Insummary,fortheCommoditiescomponent: Collateral: 0.30%(ourassumednominalreturnforCashEquivalents) Spotreturn: 3.44% Rollyield: 0.00% Commodityreturn: 3.74%FortheDiversifiedInflation‐Relatedassumption,weassumeacompoundreturnof:
1/3(1.94%)+1/3(4.71%)+1/3(3.74%)=3.46%
26
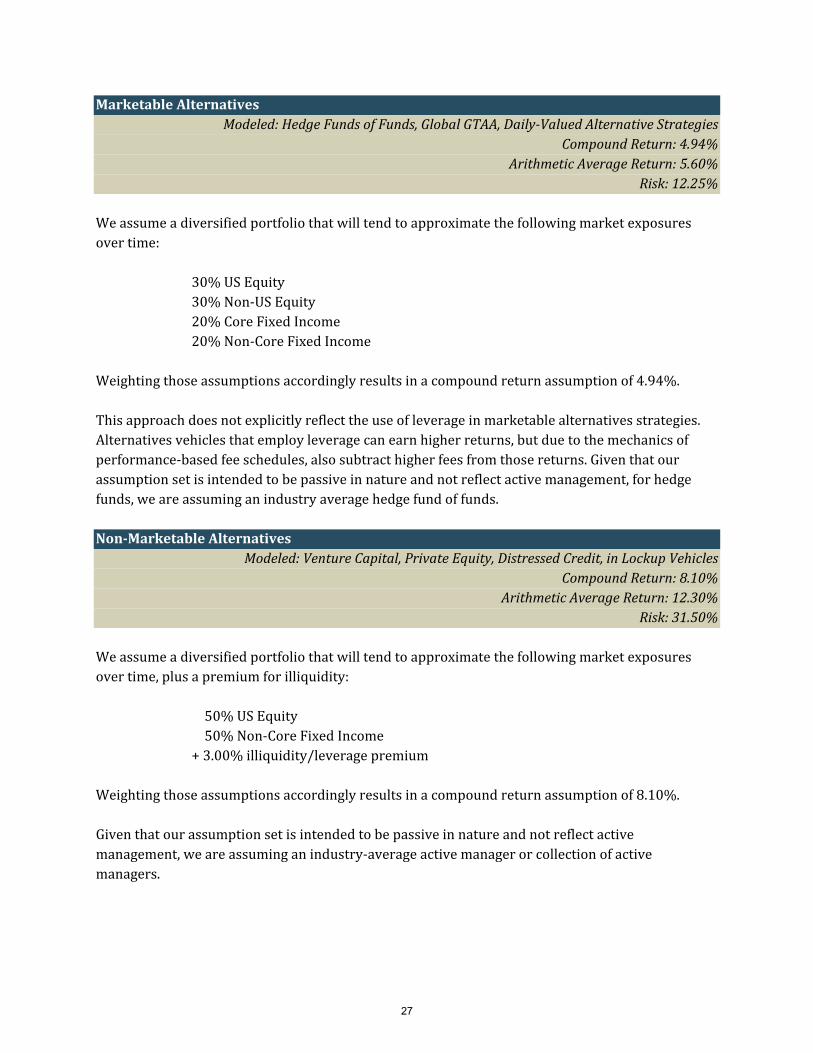
MarketableAlternativesModeled:HedgeFundsofFunds,GlobalGTAA,Daily‐ValuedAlternativeStrategies
CompoundReturn:4.94%ArithmeticAverageReturn:5.60%
Risk:12.25%Weassumeadiversifiedportfoliothatwilltendtoapproximatethefollowingmarketexposuresovertime: 30%USEquity 30%Non‐USEquity 20%CoreFixedIncome 20%Non‐CoreFixedIncomeWeightingthoseassumptionsaccordinglyresultsinacompoundreturnassumptionof4.94%.Thisapproachdoesnotexplicitlyreflecttheuseofleverageinmarketablealternativesstrategies.Alternativesvehiclesthatemployleveragecanearnhigherreturns,butduetothemechanicsofperformance‐basedfeeschedules,alsosubtracthigherfeesfromthosereturns.Giventhatourassumptionsetisintendedtobepassiveinnatureandnotreflectactivemanagement,forhedgefunds,weareassuminganindustryaveragehedgefundoffunds.Non‐MarketableAlternatives
Modeled:VentureCapital,PrivateEquity,DistressedCredit,inLockupVehiclesCompoundReturn:8.10%
ArithmeticAverageReturn:12.30%Risk:31.50%
Weassumeadiversifiedportfoliothatwilltendtoapproximatethefollowingmarketexposuresovertime,plusapremiumforilliquidity: 50%USEquity 50%Non‐CoreFixedIncome +3.00%illiquidity/leveragepremiumWeightingthoseassumptionsaccordinglyresultsinacompoundreturnassumptionof8.10%.Giventhatourassumptionsetisintendedtobepassiveinnatureandnotreflectactivemanagement,weareassuminganindustry‐averageactivemanagerorcollectionofactivemanagers.
27
RISKOurriskassumptionsaremostlyderivedfromhistory,butwehaveenhancedhistoricalmetricswithqualitativeoverlaysinseveralassetcategories.Foreachassetcategory,webeganbyexaminingthefollowinghistoricalannualreturns:Inflation USCPICashEquivalents 91‐DayT‐BillsLow‐DurationFixedIncome Barclays1‐3YearGovernment/CreditCoreFixedIncome BarclaysUSAggregateNon‐CoreFixedIncome 50%MLHighYieldMasterII,50%JPMorganEMBIbackto1994;
100%MLHighYieldMasterIIbefore1994Long‐DurationFixedIncome BarclaysLongGovernment/CreditTIPS BarclaysUSTIPSUSEquity Russell3000backto1979;S&P500before1979USLarge‐CapEquity Russell1000backto1979;S&P500before1979USSmall‐CapEquity Russell2000Non‐USEquity MSCIACWIexUSIMIbackto1994;MSCIEAFEbefore1994Non‐USLarge‐CapEquity MSCIACWIexUSbackto2001;MSCIEAFEbefore2001Non‐USSmall‐CapEquity MSCIACWIexUSSmallCapEmergingMarketsEquity MSCIEmergingMarketsRealEstate FTSENAREIT,NCREIFProperty,andNCREIFODCE(separately)DiversifiedInflation‐Related 1/3each:FTSENAREIT,BarclaysUSTIPS,BloombergCommodityMarketableAlternatives HFRIFundofFunds;and30%ourUSEquityseries,30%ourNon‐US
Equityseries,20%ourCoreFixedIncomeseries,and20%ourNon‐CoreFixedIncomeseries(separately)
Non‐MarketableAlternatives Averageof2xourUSEquityseriesand2xourNon‐CoreFixedIncomeseries
Ineachcase,wecalculatedthelongest‐termstandarddeviationofreturnspossibleforthecategory.Then,wecalculatedthestandarddeviationofannualreturnsoverthelasttenyears.Theaverageofthesetwofiguresrepresentsourbase‐caseriskassumption.Next,weexaminedtheworstannualreturnforeachproxyindex,goingbackasfaraspossibleintohistory.Weassumedthisreturnastheworst‐casescenario.Insomecases,thenormalreturndistributionimpliedbyourreturnandriskassumptionssuggestedthattheworst‐casescenariohadlessthana2%probability(1in50years)ofoccurring.Inthosecases,weadjustedourriskassumptionupwarduntiltheworst‐casescenariohadatleasta2%probabilityofoccurringunderourassumednormalreturndistribution.Toperformthisprobabilityanalysisforprivaterealestate,weexaminedrollingtwo‐yearperiodstoaccountforthefactthatdeclines,asmeasuredbyappraisalsandilliquidity,occurmoreslowlythaninpublicmarkets.
28

Finally,basedonthisanalysisandourqualitativeassessmentofthequalityandlongevityofourreturndata,wemadeseveralqualitativeadjustments,wherenoted.Theresultsofthisriskanalysisfollow.Thefollowingtabledepictsactualstandarddeviationsofannualreturn,measuredinthelongterm(asfarbackashistorywillallow),forthelasttenyears,andtheaverageofthosetwofigures.AddingorsubtractingourqualitativeadjustmentresultsintheRiskAssumptionatthefarright.
LongTerm 10Years AverageQualitativeAdjustment
RiskAssumption(Rounded)
Inflation 4.94% 1.21% 3.08% 0.00% 3.00%
CashEquivalents 3.26% 1.93% 2.59% ‐1.00% 1.50%
Low‐DurationFixedIncome 4.57% 2.14% 3.36% 0.00% 3.25%
CoreFixedIncome 6.89% 3.06% 4.98% 0.00% 5.00%
Core‐PlusFixedIncome 5.41% 4.43% 4.92% 1.00% 6.00%
Non‐CoreFixedIncome 12.98% 15.65% 14.31% 0.00% 14.25%
Long‐DurationFixedIncome 11.16% 9.47% 10.32% 0.00% 10.25%
TIPS 6.30% 7.15% 6.72% 0.00% 6.75%
USEquity 17.42% 19.57% 18.50% 0.50% 19.00%
USLarge‐CapEquity 17.47% 19.51% 18.49% 0.75% 19.25%
USSmall/Mid‐CapEquity 18.44% 21.82% 20.13% 0.00% 20.25%
Non‐USEquity 22.98% 24.77% 23.88% 0.00% 24.00%
Non‐USLarge‐CapEquity 22.50% 24.40% 23.45% 0.00% 23.50%
Non‐USSmall‐CapEquity 26.11% 30.23% 28.17% ‐0.50% 27.75%
EmergingMarketsEquity 34.73% 36.42% 35.58% ‐5.75% 29.75%
RealEstate 19.08% 22.92% 21.00% ‐2.25% 18.75%
DiversifiedInflation‐Related 12.74% 15.12% 13.93% 0.25% 14.25%
MarketableAlternatives 10.05% 10.02% 10.04% 2.11% 12.25%
Non‐MarketableAlternatives 30.40% 32.55% 31.48% 0.00% 31.50%
StandardDeviationofReturns
29
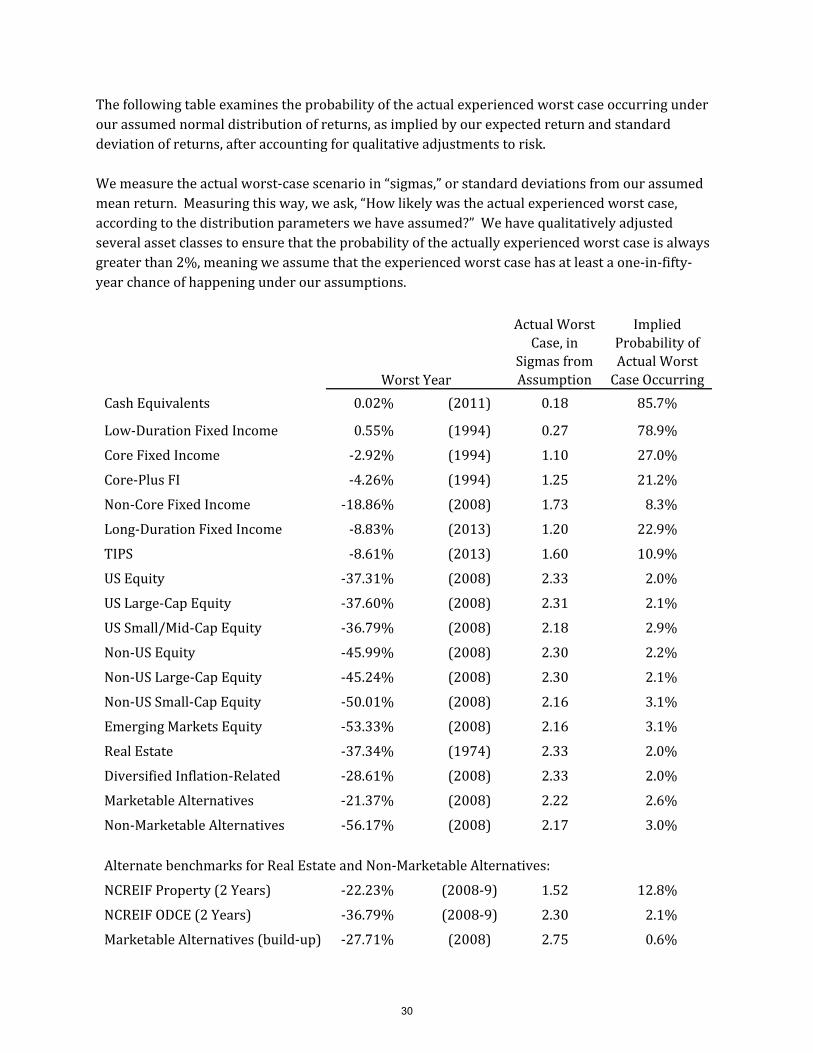
Thefollowingtableexaminestheprobabilityoftheactualexperiencedworstcaseoccurringunderourassumednormaldistributionofreturns,asimpliedbyourexpectedreturnandstandarddeviationofreturns,afteraccountingforqualitativeadjustmentstorisk.Wemeasuretheactualworst‐casescenarioin“sigmas,”orstandarddeviationsfromourassumedmeanreturn.Measuringthisway,weask,“Howlikelywastheactualexperiencedworstcase,accordingtothedistributionparameterswehaveassumed?”Wehavequalitativelyadjustedseveralassetclassestoensurethattheprobabilityoftheactuallyexperiencedworstcaseisalwaysgreaterthan2%,meaningweassumethattheexperiencedworstcasehasatleastaone‐in‐fifty‐yearchanceofhappeningunderourassumptions.
ActualWorstCase,in
SigmasfromAssumption
ImpliedProbabilityofActualWorstCaseOccurring
CashEquivalents 0.02% (2011) 0.18 85.7%
Low‐DurationFixedIncome 0.55% (1994) 0.27 78.9%
CoreFixedIncome ‐2.92% (1994) 1.10 27.0%
Core‐PlusFI ‐4.26% (1994) 1.25 21.2%
Non‐CoreFixedIncome ‐18.86% (2008) 1.73 8.3%
Long‐DurationFixedIncome ‐8.83% (2013) 1.20 22.9%
TIPS ‐8.61% (2013) 1.60 10.9%
USEquity ‐37.31% (2008) 2.33 2.0%
USLarge‐CapEquity ‐37.60% (2008) 2.31 2.1%
USSmall/Mid‐CapEquity ‐36.79% (2008) 2.18 2.9%
Non‐USEquity ‐45.99% (2008) 2.30 2.2%
Non‐USLarge‐CapEquity ‐45.24% (2008) 2.30 2.1%
Non‐USSmall‐CapEquity ‐50.01% (2008) 2.16 3.1%
EmergingMarketsEquity ‐53.33% (2008) 2.16 3.1%
RealEstate ‐37.34% (1974) 2.33 2.0%
DiversifiedInflation‐Related ‐28.61% (2008) 2.33 2.0%
MarketableAlternatives ‐21.37% (2008) 2.22 2.6%
Non‐MarketableAlternatives ‐56.17% (2008) 2.17 3.0%
AlternatebenchmarksforRealEstateandNon‐MarketableAlternatives:
NCREIFProperty(2Years) ‐22.23% (2008‐9) 1.52 12.8%
NCREIFODCE(2Years) ‐36.79% (2008‐9) 2.30 2.1%
MarketableAlternatives(build‐up) ‐27.71% (2008) 2.75 0.6%
WorstYear
30
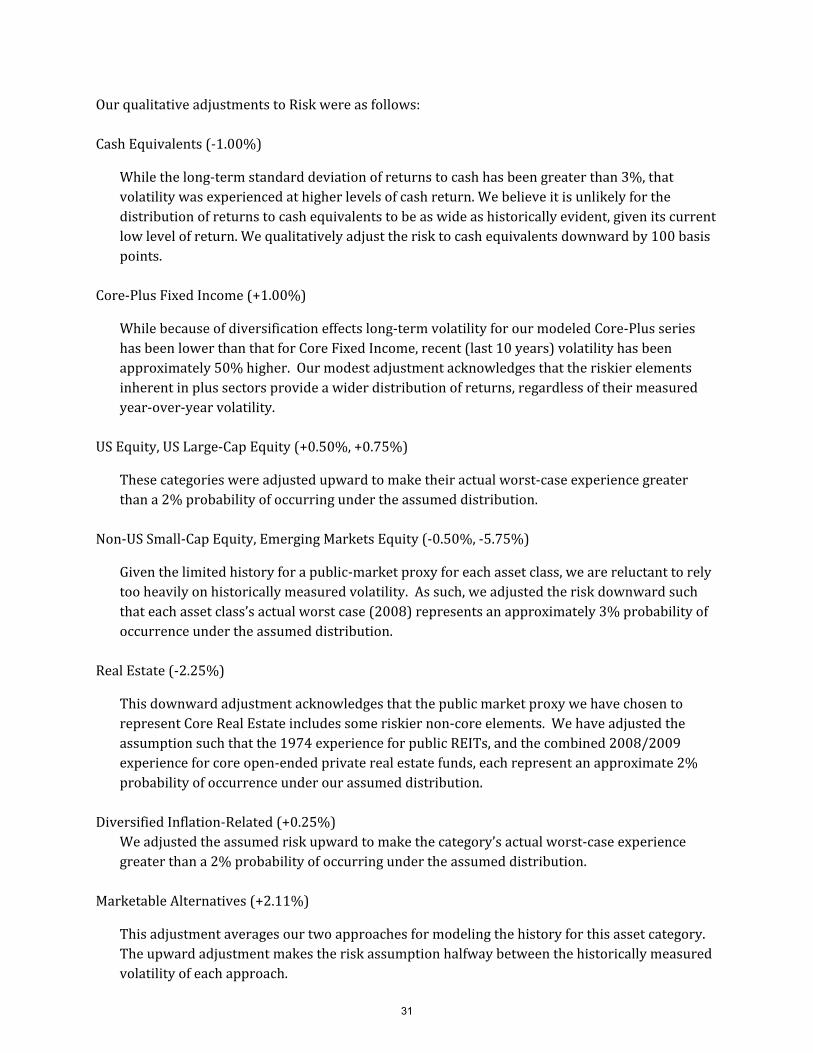
OurqualitativeadjustmentstoRiskwereasfollows:CashEquivalents(‐1.00%)
Whilethelong‐termstandarddeviationofreturnstocashhasbeengreaterthan3%,thatvolatilitywasexperiencedathigherlevelsofcashreturn.Webelieveitisunlikelyforthedistributionofreturnstocashequivalentstobeaswideashistoricallyevident,givenitscurrentlowlevelofreturn.Wequalitativelyadjusttherisktocashequivalentsdownwardby100basispoints.
Core‐PlusFixedIncome(+1.00%)
Whilebecauseofdiversificationeffectslong‐termvolatilityforourmodeledCore‐PlusserieshasbeenlowerthanthatforCoreFixedIncome,recent(last10years)volatilityhasbeenapproximately50%higher.Ourmodestadjustmentacknowledgesthattheriskierelementsinherentinplussectorsprovideawiderdistributionofreturns,regardlessoftheirmeasuredyear‐over‐yearvolatility.
USEquity,USLarge‐CapEquity(+0.50%,+0.75%)
Thesecategorieswereadjustedupwardtomaketheiractualworst‐caseexperiencegreaterthana2%probabilityofoccurringundertheassumeddistribution.
Non‐USSmall‐CapEquity,EmergingMarketsEquity(‐0.50%,‐5.75%)
Giventhelimitedhistoryforapublic‐marketproxyforeachassetclass,wearereluctanttorelytooheavilyonhistoricallymeasuredvolatility.Assuch,weadjustedtheriskdownwardsuchthateachassetclass’sactualworstcase(2008)representsanapproximately3%probabilityofoccurrenceundertheassumeddistribution.
RealEstate(‐2.25%)
ThisdownwardadjustmentacknowledgesthatthepublicmarketproxywehavechosentorepresentCoreRealEstateincludessomeriskiernon‐coreelements.Wehaveadjustedtheassumptionsuchthatthe1974experienceforpublicREITs,andthecombined2008/2009experienceforcoreopen‐endedprivaterealestatefunds,eachrepresentanapproximate2%probabilityofoccurrenceunderourassumeddistribution.
DiversifiedInflation‐Related(+0.25%)Weadjustedtheassumedriskupwardtomakethecategory’sactualworst‐caseexperiencegreaterthana2%probabilityofoccurringundertheassumeddistribution.
MarketableAlternatives(+2.11%)
Thisadjustmentaveragesourtwoapproachesformodelingthehistoryforthisassetcategory.Theupwardadjustmentmakestheriskassumptionhalfwaybetweenthehistoricallymeasuredvolatilityofeachapproach.
31
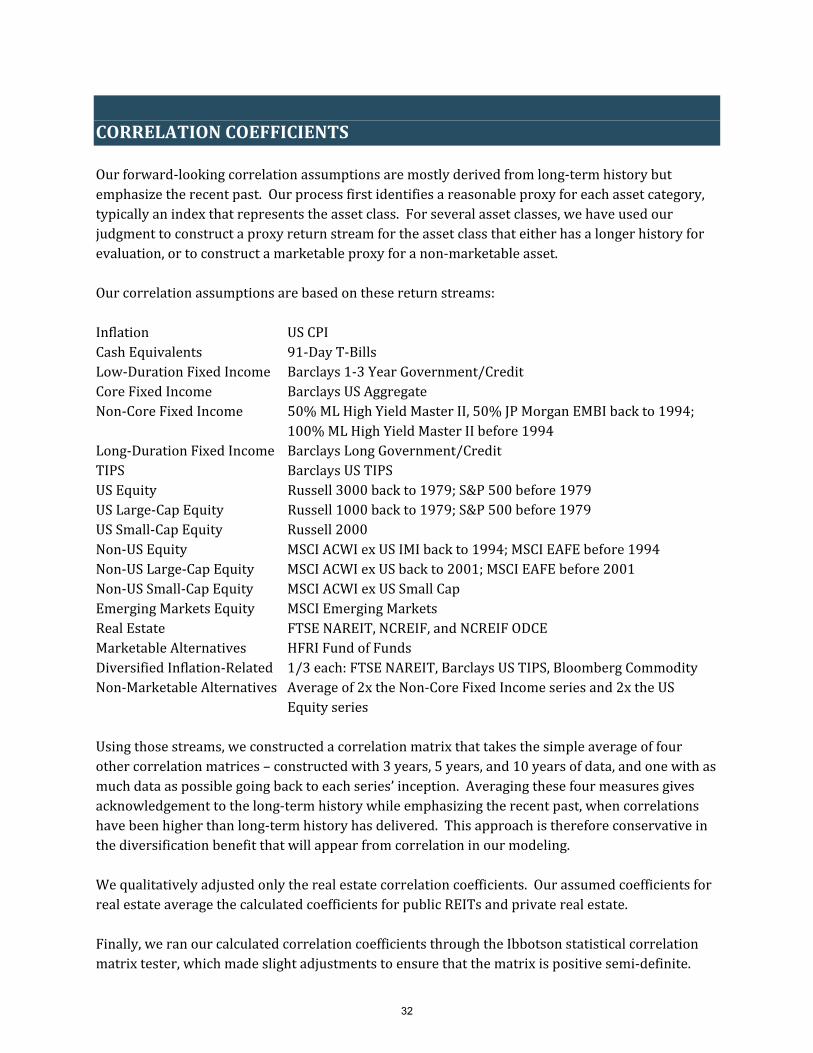
CORRELATIONCOEFFICIENTSOurforward‐lookingcorrelationassumptionsaremostlyderivedfromlong‐termhistorybutemphasizetherecentpast.Ourprocessfirstidentifiesareasonableproxyforeachassetcategory,typicallyanindexthatrepresentstheassetclass.Forseveralassetclasses,wehaveusedourjudgmenttoconstructaproxyreturnstreamfortheassetclassthateitherhasalongerhistoryforevaluation,ortoconstructamarketableproxyforanon‐marketableasset.Ourcorrelationassumptionsarebasedonthesereturnstreams:Inflation USCPICashEquivalents 91‐DayT‐BillsLow‐DurationFixedIncome Barclays1‐3YearGovernment/CreditCoreFixedIncome BarclaysUSAggregateNon‐CoreFixedIncome 50%MLHighYieldMasterII,50%JPMorganEMBIbackto1994;
100%MLHighYieldMasterIIbefore1994Long‐DurationFixedIncome BarclaysLongGovernment/CreditTIPS BarclaysUSTIPSUSEquity Russell3000backto1979;S&P500before1979USLarge‐CapEquity Russell1000backto1979;S&P500before1979USSmall‐CapEquity Russell2000Non‐USEquity MSCIACWIexUSIMIbackto1994;MSCIEAFEbefore1994Non‐USLarge‐CapEquity MSCIACWIexUSbackto2001;MSCIEAFEbefore2001Non‐USSmall‐CapEquity MSCIACWIexUSSmallCapEmergingMarketsEquity MSCIEmergingMarketsRealEstate FTSENAREIT,NCREIF,andNCREIFODCEMarketableAlternatives HFRIFundofFundsDiversifiedInflation‐Related 1/3each:FTSENAREIT,BarclaysUSTIPS,BloombergCommodityNon‐MarketableAlternatives Averageof2xtheNon‐CoreFixedIncomeseriesand2xtheUS
EquityseriesUsingthosestreams,weconstructedacorrelationmatrixthattakesthesimpleaverageoffourothercorrelationmatrices–constructedwith3years,5years,and10yearsofdata,andonewithasmuchdataaspossiblegoingbacktoeachseries’inception.Averagingthesefourmeasuresgivesacknowledgementtothelong‐termhistorywhileemphasizingtherecentpast,whencorrelationshavebeenhigherthanlong‐termhistoryhasdelivered.Thisapproachisthereforeconservativeinthediversificationbenefitthatwillappearfromcorrelationinourmodeling.Wequalitativelyadjustedonlytherealestatecorrelationcoefficients.OurassumedcoefficientsforrealestateaveragethecalculatedcoefficientsforpublicREITsandprivaterealestate.Finally,weranourcalculatedcorrelationcoefficientsthroughtheIbbotsonstatisticalcorrelationmatrixtester,whichmadeslightadjustmentstoensurethatthematrixispositivesemi‐definite.
32
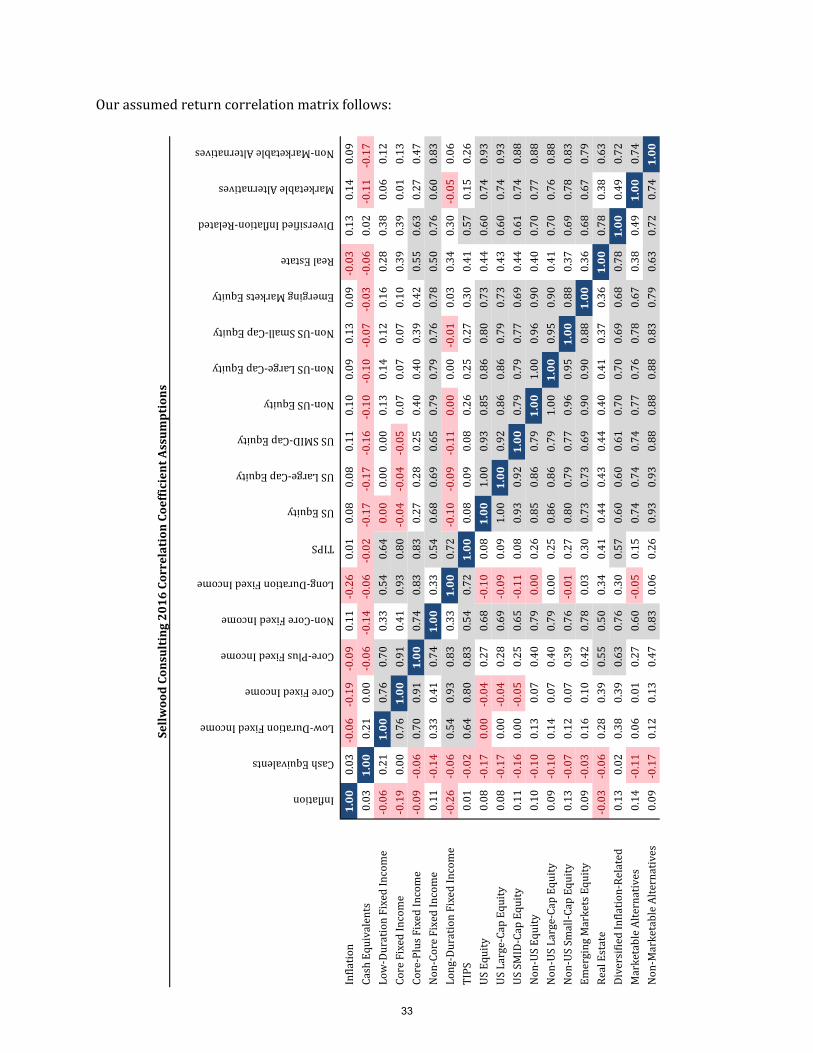
Ourassumedreturncorrelationmatrixfollows:
Inflation
CashEquivalents
Low‐DurationFixedIncome
CoreFixedIncome
Core‐PlusFixedIncome
Non‐CoreFixedIncome
Long‐DurationFixedIncome
TIPS
USEquity
USLarge‐CapEquity
USSMID‐CapEquity
Non‐USEquity
Non‐USLarge‐CapEquity
Non‐USSmall‐CapEquity
EmergingMarketsEquity
RealEstate
DiversifiedInflation‐Related
MarketableAlternatives
Non‐MarketableAlternatives
Inflation
1.00
0.03‐0.06‐0.19‐0.090.11‐0.260.01
0.08
0.08
0.11
0.10
0.09
0.13
0.09‐0.030.13
0.14
0.09
CashEquivalents
0.031.00
0.21
0.00‐0.06‐0.14‐0.06‐0.02‐0.17‐0.17‐0.16‐0.10‐0.10‐0.07‐0.03‐0.060.02‐0.11‐0.17
Low‐DurationFixedIncome
‐0.060.211.00
0.76
0.70
0.33
0.54
0.64
0.00
0.00
0.00
0.13
0.14
0.12
0.16
0.28
0.38
0.06
0.12
CoreFixedIncome
‐0.190.00
0.761.00
0.91
0.41
0.93
0.80‐0.04‐0.04‐0.050.07
0.07
0.07
0.10
0.39
0.39
0.01
0.13
Core‐PlusFixedIncome
‐0.09‐0.060.70
0.911.00
0.74
0.83
0.83
0.27
0.28
0.25
0.40
0.40
0.39
0.42
0.55
0.63
0.27
0.47
Non‐CoreFixedIncome
0.11‐0.140.33
0.41
0.741.00
0.33
0.54
0.68
0.69
0.65
0.79
0.79
0.76
0.78
0.50
0.76
0.60
0.83
Long‐DurationFixedIncome
‐0.26‐0.060.54
0.93
0.83
0.331.00
0.72‐0.10‐0.09‐0.110.00
0.00‐0.010.03
0.34
0.30‐0.050.06
TIPS
0.01‐0.020.64
0.80
0.83
0.54
0.721.00
0.08
0.09
0.08
0.26
0.25
0.27
0.30
0.41
0.57
0.15
0.26
USEquity
0.08‐0.170.00‐0.040.27
0.68‐0.100.081.00
1.00
0.93
0.85
0.86
0.80
0.73
0.44
0.60
0.74
0.93
USLarge‐CapEquity
0.08‐0.170.00‐0.040.28
0.69‐0.090.09
1.001.00
0.92
0.86
0.86
0.79
0.73
0.43
0.60
0.74
0.93
USSM
ID‐CapEquity
0.11‐0.160.00‐0.050.25
0.65‐0.110.08
0.93
0.921.00
0.79
0.79
0.77
0.69
0.44
0.61
0.74
0.88
Non‐USEquity
0.10‐0.100.13
0.07
0.40
0.79
0.00
0.26
0.85
0.86
0.791.00
1.00
0.96
0.90
0.40
0.70
0.77
0.88
Non‐USLarge‐CapEquity
0.09‐0.100.14
0.07
0.40
0.79
0.00
0.25
0.86
0.86
0.79
1.001.00
0.95
0.90
0.41
0.70
0.76
0.88
Non‐USSm
all‐CapEquity
0.13‐0.070.12
0.07
0.39
0.76‐0.010.27
0.80
0.79
0.77
0.96
0.951.00
0.88
0.37
0.69
0.78
0.83
EmergingMarketsEquity
0.09‐0.030.16
0.10
0.42
0.78
0.03
0.30
0.73
0.73
0.69
0.90
0.90
0.881.00
0.36
0.68
0.67
0.79
RealEstate
‐0.03‐0.060.28
0.39
0.55
0.50
0.34
0.41
0.44
0.43
0.44
0.40
0.41
0.37
0.361.00
0.78
0.38
0.63
DiversifiedInflation‐Related
0.13
0.02
0.38
0.39
0.63
0.76
0.30
0.57
0.60
0.60
0.61
0.70
0.70
0.69
0.68
0.781.00
0.49
0.72
MarketableAlternatives
0.14‐0.110.06
0.01
0.27
0.60‐0.050.15
0.74
0.74
0.74
0.77
0.76
0.78
0.67
0.38
0.491.00
0.74
Non‐MarketableAlternatives
0.09‐0.170.12
0.13
0.47
0.83
0.06
0.26
0.93
0.93
0.88
0.88
0.88
0.83
0.79
0.63
0.72
0.741.00
SellwoodConsulting2016CorrelationCoefficientAssumptions
33

SOURCESWearegratefultoseveralsourcesforouranalysis.Theywere:FRED,TheSt.LouisFedFederalReserveEconomicData
http://research.stlouisfed.org/fred2/
FTSENAREIThttps://www.reit.com/data‐research/reit‐indexes/ftse‐nareit‐us‐real‐estate‐index‐historical‐values‐returns
ProfessorAswathDamodaran,SternSchoolofBusiness http://pages.stern.nyu.edu/~adamodar/New_Home_Page/datafile/implpr.html
http://papers.ssrn.com/sol3/papers.cfm?abstract_id=2581517
ResearchAffiliateshttp://www.researchaffiliates.com
Blackrock http://www.blackrock.com
PIMCO http://www.pimco.com
Standard&Poors http://www.standardandpoors.com
UrbanLandInstitutehttp://uli.org/research/centers‐initiatives/center‐for‐capital‐markets/barometers‐forecast‐and‐data/uli‐real‐estate‐consensus‐forecast/
MorganStanleyCapitalInternationalhttp://www.msci.com/
Moodyshttps://www.moodys.com/researchdocumentcontentpage.aspx?docid=PBC_151031https://www.moodys.com/researchdocumentcontentpage.aspx?docid=PBC_154805
Russellhttp://www.russell.com/indexes/documents/US_Indexes_comparison.pdf
ProfessorRobertShillerhttp://www.econ.yale.edu/~shiller/data.htm
Vanguardhttps://personal.vanguard.com/pdf/s338.pdf
ThisworkislicensedunderaCreativeCommonsAttribution‐NoDerivatives4.0InternationalLicense.Toviewacopyofthislicense,visithttp://creativecommons.org/licenses/by‐nd/4.0/.
34