2016 - home.komatsu · pdf filekomatsu’s awazu plant, in cooperation with ishikawa...
TRANSCRIPT

Environmental Report Digest2016
Editorial Policy
● The Environmental Report Digest 2016 is a digest regarding environmental activities, based on content from the “Environmental Report” and “Data” from the website.
● As part of the initiatives in the environmental �eld, we have presented the new main initiatives or representative activities.● The content of the “Environmental Report” and “Data” can be viewed on our website, as well as (1) general information, such as pol-
icies and general rules, (2) information on ongoing activities and initiatives, and (3) a comprehensive disclosure of detailed and related information.
● Each item of the “Environmental Report” and “Data” on this website indicates that it has received an independent practitioner’s assurance. Website: http://www.komatsu.com/CompanyInfo/csr/
Scope of This Report●Komatsu (parent company) manufacturing facilities, speci�cally the following eight plants
The Awazu Plant, the Kanazawa Plant [including the Kanazawa-Daiichi Plant and the Kanazawa-Daini Plant], the Osaka Plant [including the Rokko Plant], the Ibaraki Plant and the Oyama Plant [including Komatsu Cummins Engine Co., Ltd., Industrial Power Alliance Ltd. and GIGAPHOTON, Inc.], the Koriyama Plant, and the Shonan Plant [including KELK Ltd.], the Tochigi Plant.Komatsu Group manufacturing facilities in Japan, speci�cally the above eight plants and the following four business unitsKomatsu Castex Ltd., Komatsu Cabtec Co., Ltd., Komatsu NTC Ltd. and Komatsu House Ltd.
●Komatsu Group manufacturing facilities outside Japan, speci�cally the following 20 plantsKomatsu America Corp.,[Chattanooga Manufacturing Operation], [Peoria Manufacturing Operation], [Newberry Manufacturing Operation], Komatsu do Brasil Ltda., Hensley Industries, Inc. (The Americas), Komatsu UK Ltd., Komatsu Hanomag GmbH (Germany), Komatsu Mining Germany GmbH, Komatsu Manufacturing Rus, LLC, Komatsu Italia Manufacturing S.p.A (Italy), Komatsu Forest AB (Sweden), PT Komatsu Indonesia Tbk, PT Komatsu Undercarriage Indonesia, Bangkok Komatsu Co., Ltd., Komatsu India Pvt. Ltd., Komatsu Shantui Construction Machinery Co., Ltd., Komatsu (Changzhou) Construction Machinery Corporation, Komatsu (Changzhou) Foundry Corp., Komatsu (Shandong) Construction Machinery Corp, and Komatsu Undercarriage China Corp.Komatsu Group manufacturing facilities including outside Japan: All of the 32 above-mentioned of�ces are shown.
Period CoveredThis report principally covers data for the period from April 2015 to the end of March 2016, with some information from after April 2016.
■ Message from Top Management … 2■Special Story ……………………………… 3■Pursuing Environmental Management … 5■Mitigating Climate Change ………… 14■Promoting Recycling …………………… 19■Biodiversity ………………………………… 21
■Environmental Risk Management … 22■ Recent External Commendations and
Evaluations on Komatsu’s Environmental Conservation and Social Activities ……… 24
■Site Data (Japan) ………………………… 25■Site Data (Overseas) …………………… 29■ Environmental Education and
Environmental Accounting ………… 30
Contents
Environmental Report Digest 20161
Endeavors for the Environment based on ESG
ESG, which we have been working on for a long time, will increase in importance more and more in the future. In the Mid-term Management Plan “Together We Innovate GEMBA Worldwide” beginning in April 2016, ESG is considered a priority area in our endeavors.
Within this plan, we have set environmental objectives based on the spirit of Komatsu Way, to make the most of our competi-tive strength in manufacturing products so that Komatsu be comes an indispensable presence for our customers. In terms of CO2 emissions during the life cycle of construction equipment, prelim-inary calculations show that approximately 90% of all emissions over the life cycle is emitted from the construction equipment being used at the workplace (Gemba) of the customers, so it is clear that reduction of these emissions is vital. From this, we have set a target to reduce CO2 emissions in the use of Komatsu prod-ucts by 25% per workload by the year 2025.
Furthermore, by making the most of Komatsu’s strength in product manufacturing, we will set high target rates for the reduction of CO2 in production and proactively work towards achieving these goals.
Endeavors for Environmental Issues based on Innovation
As a part of Komatsu’s endeavors to reduce CO2 emissions when customers are using construction equipment, we have approached the issue from the three points of “Dantotsu Products”, “Dantotsu Services” and “Dantotsu Solutions”. As a Dantotsu Product, we introduced the �rst hybrid hydraulic
excavator to the market world-wide in 2008, and as a Dantotsu Service, we have recommended a fuel-ef�cient method of driving based on KOMTRAX. “Smart Construction,” which began in Japan in February 2015, is a “Dantotsu Solution” by Komatsu that makes the safety and high productivity of the “Gemba of the Future” a reality through the automation of equipment operation by ICT construction equipment and by using ICT technology to connect all data involved in a construction site, such as measure-ment data, design data, and work progress. The ef�ciency of construction equipment operation will be increased dramatically and, as a result, the amount of CO2 emissions per workload will be greatly reduced. By spreading these innovations, Komatsu will contribute to solving the environmental issues of the con-struction sites (Gemba).
Endeavors for Environmental Issues of the Manufacturing Sites through Strengthening Competitiveness in Product Manufacturing
Activities to cut electricity use in half within Komatsu’s domes-tic plants have been progressing, and we were able to achieve a major reduction in the amount of electricity purchased by FY2015. Going forward̶together with our business partners̶we will promote innovations in the manufacturing sites using “Connectivity” through IoT, achieve even higher levels of energy conservation, and strengthen our competitiveness in product manufacturing, as we continue to work on �nding solutions to environmental issues.
July 2016
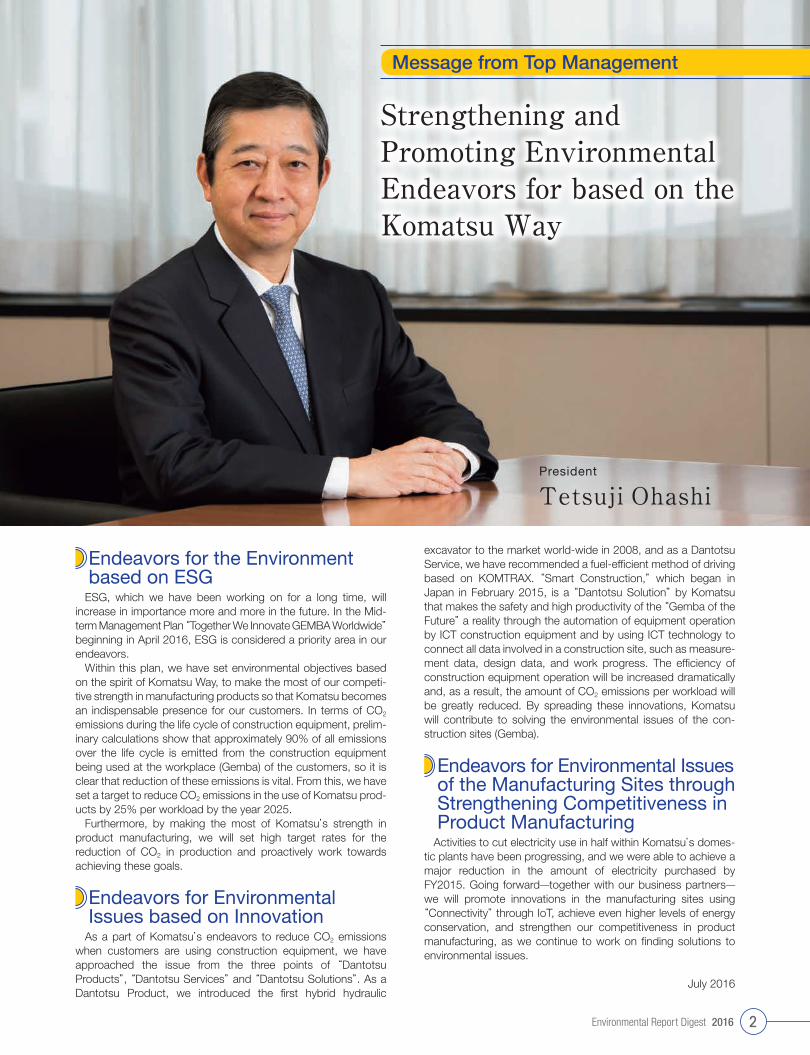
President
Tetsuji Ohashi
Strengthening and Promoting Environmental Endeavors for based on the Komatsu Way
Message from Top Management
Environmental Report Digest 2016 2

Komatsu’s Awazu Plant, in cooperation with Ishikawa Prefecture’s KAGA Forest Association, has taken the unused timber pro-duced by forest thinning from the local forestry industry to be used as biomass chip fuel. By doing so not only is the Komatsu Awazu Plant reducing the amount of electricity and oil purchased and decreasing its CO2 emissions, it is also contributing to the vitalization of the local forestry and other indigenous industries, as part of its aim to promote activities that build up the local region.
Taking into consideration the electrical power condition after the Great East Japan Earthquake in 2011, Komatsu has been promoting activities that will result in halving the amount of elec-tricity used. The Awazu Plant in Ishikawa Prefecture constructed a cutting-edge assembly plant and incorporated various ener-gy-saving and energy-creating measures in order to aspire to the goal of decreasing its electricity purchase for the new plant by over 90%. One such measure considered was the use of renew-able energy, and the decision was made to make use of electricity and heat energy supplied by biomass cogeneration. With the aim of contributing to the vitalization of the local forestry industry by purchasing the necessary woodchip fuel from local foresters, in February 2014 the Awazu Plant entered into the “Comprehensive Collaboration Agreement regarding the Forestry Industry” with the Ishikawa Prefecture and the Ishikawa Prefecture Forestry Cooperative Federation. Based on this cooperative relationship, the deployment of the biomass cogeneration system has pro-gressed at Komatsu and the KAGA Forest Association has started up a woodchip fuel business to supply it to the Komatsu Awazu Plant.
As a part of this effort, the local industries have developed a woodchip manufacturing machine with even better manufacturing
capabilities, which has made the more stable production of woodchips possible. In this way, the energy-saving and ener-gy-creating efforts of the Awazu Plant has lead to cooperation with the local manufacturing industries and the vitalization of the local industries.
Komatsu’s Biomass Cogeneration System
The Biomass Cogeneration System that Komatsu deployed this time produces high-pressure steam by burning chip fuel in a steam boiler. The energy of that steam is then used to �rst, create compressed air with a steam compressor; next, electricity is gen-erated by a steam-electric generator; then �nally, the heat exchanger changes it to hot or cold water for heating and cool-ing. With this system, it has become possible to use the heat produced by the steam boiler in a highly ef�cient way. And, though heat use ef�ciency using the steam electricity generation alone is usually 15 to 20%, by using the heat effectively for things other than electricity generation, a high heat use ef�ciency of approximately 70% can be achieved, leading to a reduction in energy cost.
The Biomass Cogeneration System of the Awazu Plant has gone into full-scale operation since April 2015, and by using it for electricity, compressed air, hot and cool energy, a savings of approximately 1,400MWh of purchased electricity and approxi-mately 800 kiloliters of oil is expected annually.
Woodchip Production by the KAGA Forest Association
As a result of these efforts, the KAGA Forest Association has taken this opportunity to begin a new business of producing woodchips from materials such as listing and unused lumber from forest thinning. They cooperated with Komatsu’s local busi-ness partner to develop a new woodchip production machine. The new machine has been able to achieve more stable opera-tion compared to previous models, and has made it possible to get a steady supply (7,000 tons/year) of woodchips.
In addition, Ishikawa Prefecture is expecting that there will be a decrease in damage from heavy rains and �ooding due to reduced �ood wood diffusion, as well as damage from harmful wildlife being prevented, as a result of the forests being cleared of unused lumber from forest thinning and residue materials being left in the forest.
Examples of Woody Biomass Use Model
Supply ofwoodchips
Kaga Forestry Association
Forest Thinning
Turned into woodchips at the plant
Logging unused timberfrom forest thinning
Hauling
Komatsu Awazu PlantBiomass Cogeneration (electricity generation + thermal usage)
Used by woody biomass boiler to generate and supply electricity and used for air conditioning inside plant
Biomass energy supply building
IshikawaPrefecture
● Coordination to start a business● Support for deploying woodchip producing machinery and boilers
Contributions to the Local Region through Forestry-�Using�Biomass�Energy�from��Unused�Timber�from�Forest�Thinning-
Spec ia l S tor y
Environmental Report Digest 20163

Woodchips Production by the KAGA Forest Association
Woodchips Production Building and Lumber for Woodchips
Newly Developed Woodchips Production Machine
Woodchip Product
Contributing to Society/Local Regions through Core Business
It is hoped that the activities and efforts introduced thus far can provide the following effects, and contribute to Komatsu’s goal of solving problems facing society and the local regions through Komatsu’s core business.
(1) Contributing to the vitalization of local forestry (Business of turning unused materials into woodchips)
(2) Energy cost reduction and decrease in CO2 emissions for Komatsu (Implementation of high ef�ciency Biomass Co-generation System)
(3) Contributing to the vitalization of local businesses (new sales of the woodchip production machine)
(4) Contributing to sustaining a healthy natural environment and regional revitalization based on cooperating with the local government.
Komatsu will provide support to the local forestry and farming with the technology and know-how that it has developed, and hopes to continue contributing to building up the local region and the vitalization of entire local industries.
Biomass Cogeneration System
Biomass BoilerChips Burned
Amount of Heat by chips inputApproximately 4,700kWh
Input of ChipsApproximately 1,200kg/h
(2台)
Hot and Cold Water SupplyUsed for heating and
cooling within the plantPower output equivalent
approximately 2,900kWh
Compressed Air SupplyUsed as power for plant machinery/
fastening power for bolts
Power Output equivalent to 75kWh
③Steam for Heat Exchange⇒converted to hot and cold
water for air conditioning
① Steam TypeCompressor
Amount of heat usedapproximately 3,200kWhHeat use efficiencyapproximately 70%
②Steam Type PowerGenerator (Two)
SteamGenerated
Use of ExhaustSteam
Use of ExhaustSteam
Steam that has lostit’s heat after use
goes back tothe boileras low-temperature
water
Electricity SupplyUsed for powering, lighting,
and air conditioning the assembly plant
Power output of 210kWh
Voic
e
- Beauti�cation of the Mountains by Effective Utilization of Unused Materials -Effective utilization of the listing and timber from forest thinning that had been left neglected was one of the problems of the forest association. This production of woodchips makes effective use of unused materials and thereby cleans up the mountains, which in turn makes the forest owners happy, and is therefore considered a very good thing. Hereon, we would like to keep promoting ef�ciency and improving the revenue aspect to aim for sustainable forestry.
KAGA Forest AssociationNata Plant Deputy General
Plant Manager
Kensaku Tanaka
Environmental Report Digest 2016 4

In line with the Komatsu Earth Environment Charter revised in 2010, the Komatsu Group embarks on global initiatives across business areas guided by the fundamental principles of
(1) Contributions to Realization of Sustainable Society,(2) Simultaneous Realization of Environmental and Economic
Performance, and(3) Observance of Corporate Social Responsibility.
In recognition of the fact that our business activities affect the environment on a regional and global level, we, at Komatsu, have placed the focus on the following four key areas:
1) Climate Change2) Establishment of a Sound Material-Cycle Society3) Conservation of Air, Water and Other Natural Resources as
well as Management of Chemical Substances4) Biodiversity
Komatsu promotes environmentally-friendly activities throughout the entire Group to realize its vision of “What Komatsu Can Do and What It Must Do” for the environment and sustainable development.
Pursuing Environmental Management
Komatsu’s Relationship with the Environment
Relationship of the Komatsu Group’s Business Activities with the Environment
Development● Environment & Economy● LCA design● Medium-term targets for
development ofenvironmental technology
● Provision of environmentally-friendly products and services● Creation and operation of a transaction network for used
components (parts), information on “Reman” sales, etc.
Logistics● CO2 reductions
in logistics● Improvement of
transport ef�ciency● Improvement of
packing material
Sales and After-sales Services● Activities based on health and safety
and environmental guidelines
Use● Reduction of environmental
impacts during the productusage stage
● Provision of solutions forcustomers’ environmentalactivities
● Promotion of fuel-ef�cientoperation
● Product support throughuse of ICT
Reduce
Recycle
Recycling of materials(outsourcing)
Proper disposal of waste(outsourcing)
Used vehicles
Disassembly
UseCO2
NOX
Sales, Rentals, andAfter-sales Services
Sales andafter-sales service
agents
Sales andafter-salesservice agents
Communicationssatellite
ProductsProducts
Localcommunity
Procurement ofMaterials● Green procurement
Businessassociates
Customers
Komatsuemployees
Komatsuemployees
Komatsuemployees
Manufacturing
Reuse
Reuse
● Mitigation of climate change(energy conservation)
● Effective utilization of resources(zero emissions)
● Environmental risk management● Elimination of the use of
hazardous chemical substances● Termination of use of organic
chlorinated cleaning solvents● Correspondence to biodiversity
Particulatematter
Recovery
Reuse of parts
Reuse of products
Remanufacturing of usedcomponents (parts) (“Reman” business)
Environmental Report Digest 20165
Komatsu Earth Environment Charter (June 2010 revision)
〈Corporate Principles〉1. Contributions to Realization of Sustainable Society
Mankind must not only promote the further growth of a rich and comfortable society but also pass down this indispensable environment of our planet earth to future generations in a sound and healthy condition.
We, at the Komatsu Group, de�ne environmental conservation efforts as one of the highest priority management tasks, and endeavor to contribute to the sustainable growth of society by integrating advanced technologies into environmental conserva-tion efforts in all our business activities. This is represented by our hybrid construction equipment which features a substantial reduction of CO2 emissions while in operation and by our superior manufacturing.
2. Simultaneous Realization of Environmental and Economic PerformanceWe are committed to improving both environmental performance and economic ef�ciency, as a group of companies working
toward superior manufacturing for customer satisfaction. To this end, we constantly take up the challenge of advancing technol-ogies to develop creative products that improve both environmental performance throughout the product’s life cycle and the product’s economic performance at the same time.
3. Observance of Corporate Social ResponsibilityEach company of the Komatsu Group promotes environmental conservation by not only complying with the applicable laws
and regulations of the concerned host community, region and country but also by establishing its voluntary standards which consider global and local environmental concerns. Each company of the Group also strives to ful�ll its corporate social respon-sibility by actively participating in local environmental conservation programs and thereby promoting close-knit communication with local communities, while striving to become a company trusted by all Komatsu stakeholders.
〈Guidelines for Corporate Activity〉1. Basic Stances on Earth Environmental Problems
We, at the Komatsu Group, work for sustainable society and earth environment through our global business operations by addressing the following four environmental problems with the stances discussed below.
1)Climate ChangeWe will reduce the use of energy and emissions of greenhouse gas in all phases of our business activities ranging from research and development, procurement, production and logistics to sales and service as well as in the total life cycle of our products and services.
2)Establishment of a Sound Material-Cycle SocietyThrough our business processes, we work to minimize the use of natural resources, such as materials and water, promote their re-use or recycle them as much as possible, and expand Zero Emissions from our manufacturing activities around the world. At the same time we ensure the thorough management of waste materials in all our business domains, including our suppliers and distributors. We also continuously work to increase the recyclability rate of products at the time of disposal.
3)Conservation of Air, Water and Other Environments as well as Management of Chemical SubstancesWe comply with not only local laws and regulations but also with our established standards concerning the conservation of water quality, prevention of air pollution, noise and vibrations.As much as possible, we also ensure the thorough management of chemical substances for use in our business activities, while continuously reducing the use of potentially harmful chemical substances or replacing them with alternative sub-stances for discontinuation of their use.
4)BiodiversityWe recognize biodiversity as one of the important issues concerning the earth environment, evaluate, understand and ana-lyze impact on it in all our business domains, and work on our tasks according to the criteria of the highest impact and/or the most effective actions.
2. Framework of Global, Group-wide Environmental Management SystemThe Komatsu Head Of�ce, as well as the manufacturing facilities and main companies of the Komatsu Group, already with ISO
certi�cations, will work to maintain and improve their environmental management system, while other manufacturing facilities and suppliers will also work to establish their environmental management systems and reduce their environmental impact.
The Komatsu Environmental Committee develops environmental action plans and common guidelines for the Komatsu Group. Based on these Group-wide plans and guidelines, each division or company sets up its own mid- to long-term targets, develops and implements speci�c action plans, reviews them regularly and works to continuously improve them.
3. Environmental Education and CommunicationWe believe that it is important to enhance the environmental awareness of each and every employee and thereby actively
promote environmental awareness and education programs for all employees.We will gather environment-related information concerning not only our manufacturing facilities but also other related entities,
such as major af�liated companies and suppliers, and strive to disclose such information, thereby facilitating proactive commu-nication with all our stakeholders, such as customers, employees, local communities and suppliers and further expanding the content of environmental communication.
Environmental Report Digest 2016 6
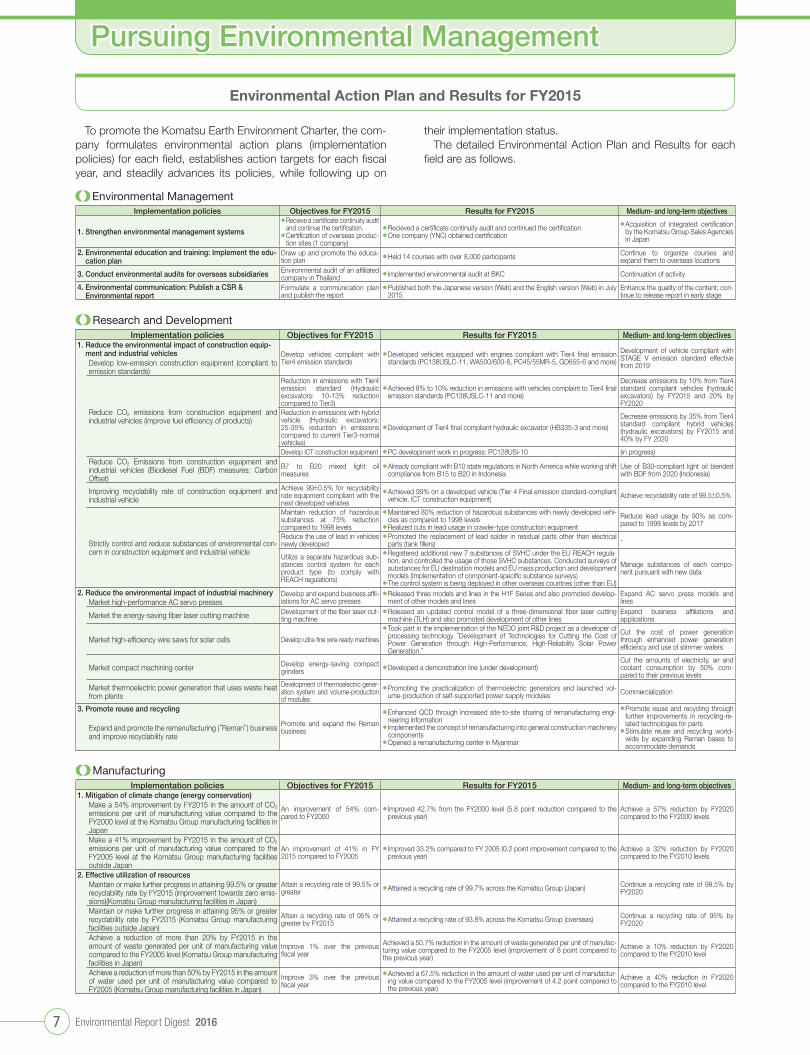
Pursuing Environmental Management
Implementation policies Objectives for FY2015 Results for FY2015 Medium- and long-term objectives1. Reduce the environmental impact of construction equip-
ment and industrial vehicles Develop vehicles compliant with Tier4 emission standards
● Developed vehicles equipped with engines compliant with Tier4 �nal emission standards (PC138USLC-11, WA500/600-8, PC45/55MR-5, GD655-6 and more)
Development of vehicle compliant with STAGE V emission standard effective from 2019Develop low-emission construction equipment (compliant to
emission standards)
Reduce CO2 emissions from construction equipment and industrial vehicles (improve fuel ef�ciency of products)
Reduction in emissions with Tier4 emission standard (Hydraulic excavators: 10-13% reduction compared to Tier3)
● Achieved 8% to 10% reduction in emissions with vehicles complaint to Tier4 �nal emission standards (PC138USLC-11 and more)
Decrease emissions by 10% from Tier4 standard compliant vehicles (hydraulic excavators) by FY2015 and 20% by FY2020
Reduction in emissions with hybrid vehicle (Hydraulic excavators: 25-35% reduction in emissions compared to current Tier3-normal vehicles)
● Development of Tier4 �nal compliant hydraulic excavator (HB335-3 and more)
Decrease emissions by 35% from Tier4 standard compliant hybrid vehicles (hydraulic excavators) by FY2015 and 40% by FY 2020
Develop ICT construction equipment ● PC development work in progress: PC128USi-10 (in progress)Reduce CO2 Emissions from construction equipment and industrial vehicles (Biodiesel Fuel (BDF) measures: Carbon Offset)
B7 to B20 mixed light oil measures
● Already compliant with B10 state regulations in North America while working shift compliance from B15 to B20 in Indonesia
Use of B30-compliant light oil blended with BDF from 2020 (Indonesia)
Improving recyclability rate of construction equipment and industrial vehicle
Achieve 99±0.5% for recyclability rate equipment compliant with the next developed vehicles
● Achieved 99% on a developed vehicle (Tier 4 Final emission standard-compliant vehicle, ICT construction equipment) Achieve recyclability rate of 99.5±0.5%
Strictly control and reduce substances of environmental con-cern in construction equipment and industrial vehicle
Maintain reduction of hazardous substances at 75% reduction compared to 1998 levels
● Maintained 80% reduction of hazardous substances with newly developed vehi-cles as compared to 1998 levels
● Realized cuts in lead usage in crawler-type construction equipment
Reduce lead usage by 90% as com-pared to 1998 levels by 2017
Reduce the use of lead in vehicles newly developed
● Promoted the replacement of lead solder in residual parts other than electrical parts (tank �llers) -
Utilize a separate hazardous sub-stances control system for each product type (to comply with REACH regulations)
● Registered additional new 7 substances of SVHC under the EU REACH regula-tion, and controlled the usage of those SVHC substances. Conducted surveys of substances for EU destination models and EU mass production and development models (Implementation of component-speci�c substance surveys)
● The control system is being deployed in other overseas countries (other than EU)
Manage substances of each compo-nent pursuant with new data
2. Reduce the environmental impact of industrial machinery Develop and expand business af�l-iations for AC servo presses
● Released three models and lines in the H1F Series and also promoted develop-ment of other models and lines
Expand AC servo press models and linesMarket high-performance AC servo presses
Market the energy-saving �ber laser cutting machine Development of the �ber laser cut-ting machine
● Released an updated control model of a three-dimensional �ber laser cutting machine (TLH) and also promoted development of other lines
Expand business af�liations and applications
Market high-ef�ciency wire saws for solar cells Develop ultra-�ne wire-ready machines
● Took part in the implementation of the NEDO joint R&D project as a developer of processing technology “Development of Technologies for Cutting the Cost of Power Generation through High-Performance, High-Reliability Solar Power Generation.”
Cut the cost of power generation through enhanced power generation ef�ciency and use of slimmer wafers
Market compact machining center Develop energy-saving compact grinders
● Developed a demonstration line (under development)Cut the amounts of electricity, air and coolant consumption by 50% com-pared to their previous levels
Market thermoelectric power generation that uses waste heat from plants
Development of thermoelectric gener-ation system and volume-production of modules
● Promoting the practicalization of thermoelectric generators and launched vol-ume-production of self-supported power supply modules Commercialization
3. Promote reuse and recycling
Promote and expand the Reman business
● Enhanced QCD through increased site-to-site sharing of remanufacturing engi-neering information
● Implemented the concept of remanufacturing into general construction machinery components
● Opened a remanufacturing center in Myanmar
● Promote reuse and recycling through further improvements in recycling-re-lated technologies for parts
● Stimulate reuse and recycling world-wide by expanding Reman bases to accommodate demands
Expand and promote the remanufacturing (“Reman”) business and improve recyclability rate
Research and Development
Environmental ManagementImplementation policies Objectives for FY2015 Results for FY2015 Medium- and long-term objectives
1. Strengthen environmental management systems
● Recieve a certi�cate continuity audit and continue the certi�cation.
● Certi�cation of overseas produc-tion sites (1 company)
● Recieved a certi�cate continuity audit and continued the certi�cation● One company (YNC) obtained certi�cation
● Acquisition of integrated certi�cation by the Komatsu Group Sales Agencies in Japan
2. Environmental education and training: Implement the edu-cation plan
Draw up and promote the educa-tion plan
● Held 14 courses with over 8,000 participants Continue to organize courses and expand them to overseas locations
3. Conduct environmental audits for overseas subsidiaries Environmental audit of an af�liated company in Thailand
● Implemented environmental audit at BKC Continuation of activity
4. Environmental communication: Publish a CSR & Environmental report
Formulate a communication plan and publish the report
● Published both the Japanese version (Web) and the English version (Web) in July 2015
Enhance the quality of the content; con-tinue to release report in early stage
To promote the Komatsu Earth Environment Charter, the com-pany formulates environmental action plans (implementation policies) for each �eld, establishes action targets for each �scal year, and steadily advances its policies, while following up on
their implementation status.The detailed Environmental Action Plan and Results for each
�eld are as follows.
ManufacturingImplementation policies Objectives for FY2015 Results for FY2015 Medium- and long-term objectives
1. Mitigation of climate change (energy conservation)
An improvement of 54% com-pared to FY2000
● Improved 42.7% from the FY2000 level (5.8 point reduction compared to the previous year)
Achieve a 57% reduction by FY2020 compared to the FY2000 levels
Make a 54% improvement by FY2015 in the amount of CO2 emissions per unit of manufacturing value compared to the FY2000 level at the Komatsu Group manufacturing facilities in JapanMake a 41% improvement by FY2015 in the amount of CO2 emissions per unit of manufacturing value compared to the FY2005 level at the Komatsu Group manufacturing facilities outside Japan
An improvement of 41% in FY 2015 compared to FY2005
● Improved 33.2% compared to FY 2005 (0.2 point improvement compared to the previous year)
Achieve a 32% reduction by FY2020 compared to the FY2010 levels
2. Effective utilization of resourcesAttain a recycling rate of 99.5% or greater
● Attained a recycling rate of 99.7% across the Komatsu Group (Japan) Continue a recycling rate of 99.5% by FY2020
Maintain or make further progress in attaining 99.5% or greater recyclability rate by FY2015 (improvement towards zero emis-sions)(Komatsu Group manufacturing facilities in Japan)Maintain or make further progress in attaining 95% or greater recyclability rate by FY2015 (Komatsu Group manufacturing facilities outside Japan)
Attain a recycling rate of 95% or greater by FY2015
● Attained a recycling rate of 93.8% across the Komatsu Group (overseas) Continue a recycling rate of 95% by FY2020
Achieve a reduction of more than 20% by FY2015 in the amount of waste generated per unit of manufacturing value compared to the FY2005 level (Komatsu Group manufacturing facilities in Japan)
Improve 1% over the previous �scal year
Achieved a 50.7% reduction in the amount of waste generated per unit of manufac-turing value compared to the FY2005 level (improvement of 8 point compared to the previous year)
Achieve a 10% reduction by FY2020 compared to the FY2010 level
Achieve a reduction of more than 50% by FY2015 in the amount of water used per unit of manufacturing value compared to FY2005 (Komatsu Group manufacturing facilities in Japan)
Improve 3% over the previous �scal year
● Achieved a 67.5% reduction in the amount of water used per unit of manufactur-ing value compared to the FY2005 level (improvement of 4.2 point compared to the previous year)
Achieve a 40% reduction in FY2020 compared to the FY2010 level
Environmental Action Plan and Results for FY2015
Environmental Report Digest 20167
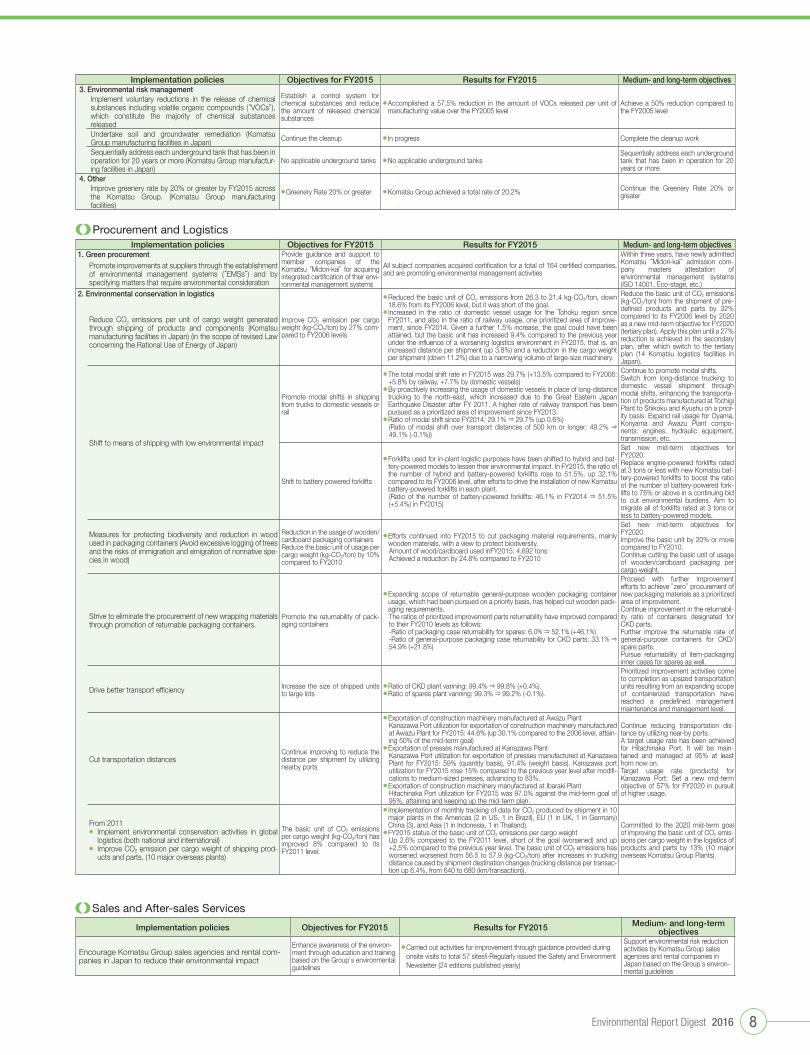
Implementation policies Objectives for FY2015 Results for FY2015 Medium- and long-term objectives3. Environmental risk management
Establish a control system for chemical substances and reduce the amount of released chemical substances
● Accomplished a 57.5% reduction in the amount of VOCs released per unit of manufacturing value over the FY2005 level
Achieve a 50% reduction compared to the FY2005 level
Implement voluntary reductions in the release of chemical substances including volatile organic compounds (“VOCs”), which constitute the majority of chemical substances releasedUndertake soil and groundwater remediation (Komatsu Group manufacturing facilities in Japan) Continue the cleanup ● In progress Complete the cleanup work
Sequentially address each underground tank that has been in operation for 20 years or more (Komatsu Group manufactur-ing facilities in Japan)
No applicable underground tanks ● No applicable underground tanksSequentially address each underground tank that has been in operation for 20 years or more
4. Other
● Greenery Rate 20% or greater ● Komatsu Group achieved a total rate of 20.2% Continue the Greenery Rate 20% or greater
Improve greenery rate by 20% or greater by FY2015 across the Komatsu Group. (Komatsu Group manufacturing facilities)
Implementation policies Objectives for FY2015 Results for FY2015 Medium- and long-term objectives1. Green procurement Provide guidance and support to
member companies of the Komatsu “Midori-kai” for acquiring integrated certi�cation of their envi-ronmental management systems
All subject companies acquired certi�cation for a total of 164 certi�ed companies, and are promoting environmental management activities
Within three years, have newly admitted Komatsu “Midori-kai” admission com-pany masters attestation of environmental management systems (ISO 14001, Eco-stage, etc.)
Promote improvements at suppliers through the establishment of environmental management systems (“EMSs”) and by specifying matters that require environmental consideration
2. Environmental conservation in logistics
Improve CO2 emission per cargo weight (kg-CO2/ton) by 27% com-pared to FY2006 levels
● Reduced the basic unit of CO2 emissions from 26.3 to 21.4 kg-CO2/ton, down 18.6% from its FY2006 level, but it was short of the goal.
● Increased in the ratio of domestic vessel usage for the Tohoku region since FY2011, and also in the ratio of railway usage, one prioritized area of improve-ment, since FY2014. Given a further 1.5% increase, the goal could have been attained, but the basic unit has increased 9.4% compared to the previous year under the in�uence of a worsening logistics environment in FY2015, that is, an increased distance per shipment (up 3.8%) and a reduction in the cargo weight per shipment (down 11.2%) due to a narrowing volume of large-size machinery.
Reduce the basic unit of CO2 emissions (kg-CO2/ton) from the shipment of pre-de�ned products and parts by 32% compared to its FY2006 level by 2020 as a new mid-term objective for FY2020 (tertiary plan). Apply this plan until a 27% reduction is achieved in the secondary plan, after which switch to the tertiary plan (14 Komatsu logistics facilities in Japan).
Reduce CO2 emissions per unit of cargo weight generated through shipping of products and components (Komatsu manufacturing facilities in Japan) (in the scope of revised Law concerning the Rational Use of Energy of Japan)
Shift to means of shipping with low environmental impact
Promote modal shifts in shipping from trucks to domestic vessels or rail
● The total modal shift rate in FY2015 was 29.7% (+13.5% compared to FY2006: +5.8% by railway, +7.7% by domestic vessels)
● By proactively increasing the usage of domestic vessels in place of long-distance trucking to the north-east, which increased due to the Great Eastern Japan Earthquake Disaster after FY 2011. A higher rate of railway transport has been pursued as a prioritized area of improvement since FY2013.
● Ratio of modal shift since FY2014: 29.1% ⇒ 29.7% (up 0.6%)(Ratio of modal shift over transport distances of 500 km or longer: 49.2% ⇒ 49.1% (-0.1%))
Continue to promote modal shifts.Switch from long-distance trucking to domestic vessel shipment through modal shifts, enhancing the transporta-tion of products manufactured at Tochigi Plant to Shikoku and Kyushu on a prior-ity basis. Expand rail usage for Oyama, Koriyama and Awazu Plant compo-nents: engines, hydraulic equipment, transmission, etc.
Shift to battery powered forklifts
● Forklifts used for in-plant logistic purposes have been shifted to hybrid and bat-tery-powered models to lessen their environmental impact. In FY2015, the ratio of the number of hybrid and battery-powered forklifts rose to 51.5%, up 32.1% compared to its FY2006 level, after efforts to drive the installation of new Komatsu battery-powered forklifts in each plant.(Ratio of the number of battery-powered forklifts: 46.1% in FY2014 ⇒ 51.5% (+5.4%) in FY2015)
Set new mid-term objectives for FY2020.Replace engine-powered forklifts rated at 3 tons or less with new Komatsu bat-tery-powered forklifts to boost the ratio of the number of battery-powered fork-lifts to 75% or above in a continuing bid to cut environmental burdens. Aim to migrate all of forklifts rated at 3 tons or less to battery-powered models.
Measures for protecting biodiversity and reduction in wood used in packaging containers (Avoid excessive logging of trees and the risks of immigration and emigration of nonnative spe-cies in wood)
Reduction in the usage of wooden/cardboard packaging containersReduce the basic unit of usage per cargo weight (kg-CO2/ton) by 10% compared to FY2010
● Efforts continued into FY2015 to cut packaging material requirements, mainly wooden materials, with a view to protect biodiversity.Amount of wood/cardboard used inFY2015: 4,692 tons Achieved a reduction by 24.8% compared to FY2010
Set new mid-term objectives for FY2020.Improve the basic unit by 20% or more compared to FY2010.Continue cutting the basic unit of usage of wooden/cardboard packaging per cargo weight.
Strive to eliminate the procurement of new wrapping materials through promotion of returnable packaging containers.
Promote the returnability of pack-aging containers
● Expanding scope of returnable general-purpose wooden packaging container usage, which had been pursued on a priority basis, has helped cut wooden pack-aging requirements.The ratios of prioritized improvement parts returnability have improved compared to their FY2010 levels as follows:-Ratio of packaging case returnability for spares: 6.0% ⇒ 52.1% (+46.1%)-Ratio of general-purpose packaging case returnability for CKD parts: 33.1% ⇒ 54.9% (+21.8%)
Proceed with further improvement efforts to achieve ”zero” procurement of new packaging materials as a prioritized area of improvement.Continue improvement in the returnabil-ity ratio of containers designated for CKD parts.Further improve the returnable rate of general-purpose containers for CKD/spare parts.Pursue returnability of item-packaging inner cases for spares as well.
Drive better transport ef�ciency Increase the size of shipped units to large lots
● Ratio of CKD plant vanning: 99.4% ⇒ 99.8% (+0.4%).● Ratio of spares plant vanning: 99.3% ⇒ 99.2% (-0.1%).
Prioritized improvement activities come to completion as upsized transportation units resulting from an expanding scope of containerized transportation have reached a prede�ned management maintenance and management level.
Cut transportation distancesContinue improving to reduce the distance per shipment by utilizing nearby ports
● Exportation of construction machinery manufactured at Awazu PlantKanazawa Port utilization for exportation of construction machinery manufactured at Awazu Plant for FY2015: 44.6% (up 30.1% compared to the 2006 level, attain-ing 50% of the mid-term goal)
● Exportation of presses manufactured at Kanazawa PlantKanazawa Port utilization for exportation of presses manufactured at Kanazawa Plant for FY2015: 59% (quantity basis), 91.4% (weight basis). Kanazawa port utilization for FY2015 rose 15% compared to the previous year level after modi�-cations to medium-sized presses, advancing to 83%.
● Exportation of construction machinery manufactured at Ibaraki PlantHitachinaka Port utilization for FY2015 was 97.0% against the mid-term goal of 95%, attaining and keeping up the mid-term plan.
Continue reducing transportation dis-tance by utilizing near-by ports.A target usage rate has been achieved for Hitachinaka Port. It will be main-tained and managed at 95% at least from now on.Target usage rate (products) for Kanazawa Port: Set a new mid-term objective of 57% for FY2020 in pursuit of higher usage.
From 2011● Implement environmental conservation activities in global
logistics (both national and international)● Improve CO2 emission per cargo weight of shipping prod-
ucts and parts. (10 major overseas plants)
The basic unit of CO2 emissions per cargo weight (kg-CO2/ton) has improved 8% compared to its FY2011 level.
● Implementation of monthly tracking of data for CO2 produced by shipment in 10 major plants in the Americas (2 in US, 1 in Brazil), EU (1 in UK, 1 in Germany) China (3), and Asia (1 in Indonesia, 1 in Thailand).
● FY2015 status of the basic unit of CO2 emissions per cargo weightUp 2.6% compared to the FY2011 level, short of the goal (worsened) and up +2.5% compared to the previous year level. The basic unit of CO2 emissions has worsened worsened from 56.5 to 57.9 (kg-CO2/ton) after increases in trucking distance caused by shipment destination changes (trucking distance per transac-tion up 6.4%, from 640 to 680 (km/transaction)).
Committed to the 2020 mid-term goal of improving the basic unit of CO2 emis-sions per cargo weight in the logistics of products and parts by 13% (10 major overseas Komatsu Group Plants).
Procurement and Logistics
Implementation policies Objectives for FY2015 Results for FY2015 Medium- and long-term objectives
Encourage Komatsu Group sales agencies and rental com-panies in Japan to reduce their environmental impact
Enhance awareness of the environ-ment through education and training based on the Group’s environmental guidelines
● Carried out activities for improvement through guidance provided during onsite visits to total 57 sites§·Regularly issued the Safety and Environment Newsletter (24 editions published yearly)
Support environmental risk reduction activities by Komatsu Group sales agencies and rental companies in Japan based on the Group’s environ-mental guidelines
Sales and After-sales Services
Environmental Report Digest 2016 8
Pursuing Environmental Management
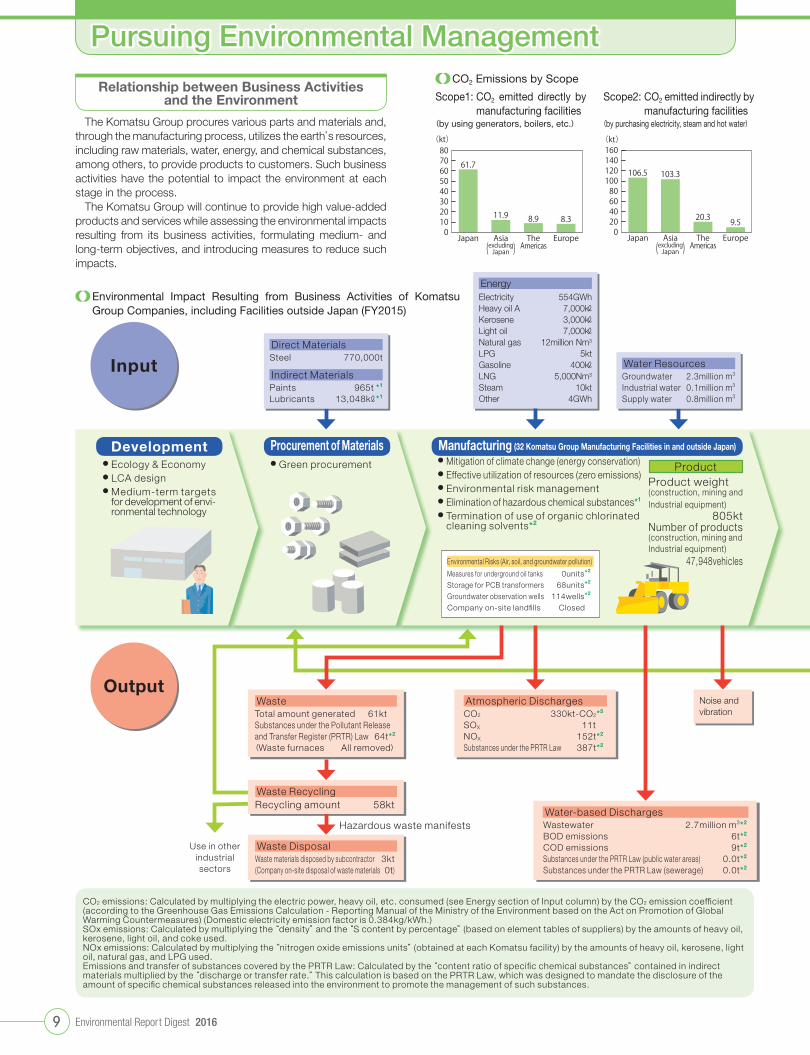
Relationship between Business Activities and the Environment
The Komatsu Group procures various parts and materials and, through the manufacturing process, utilizes the earth’s resources, including raw materials, water, energy, and chemical substances, among others, to provide products to customers. Such business activities have the potential to impact the environment at each stage in the process.
The Komatsu Group will continue to provide high value-added products and services while assessing the environmental impacts resulting from its business activities, formulating medium- and long-term objectives, and introducing measures to reduce such impacts.
Environmental Impact Resulting from Business Activities of Komatsu Group Companies, including Facilities outside Japan (FY2015)
CO2 emissions: Calculated by multiplying the electric power, heavy oil, etc. consumed (see Energy section of Input column) by the CO2 emission coef�cient (according to the Greenhouse Gas Emissions Calculation - Reporting Manual of the Ministry of the Environment based on the Act on Promotion of Global Warming Countermeasures) (Domestic electricity emission factor is 0.384kg/kWh.)SOx emissions: Calculated by multiplying the “density” and the “S content by percentage” (based on element tables of suppliers) by the amounts of heavy oil, kerosene, light oil, and coke used.NOx emissions: Calculated by multiplying the “nitrogen oxide emissions units” (obtained at each Komatsu facility) by the amounts of heavy oil, kerosene, light oil, natural gas, and LPG used.Emissions and transfer of substances covered by the PRTR Law: Calculated by the “content ratio of speci�c chemical substances” contained in indirect materials multiplied by the “discharge or transfer rate.” This calculation is based on the PRTR Law, which was designed to mandate the disclosure of the amount of speci�c chemical substances released into the environment to promote the management of such substances.
Procurement of Materials● Green procurement
Manufacturing (32 Komatsu Group Manufacturing Facilities in and outside Japan)● Mitigation of climate change (energy conservation)● Effective utilization of resources (zero emissions)● Environmental risk management● Elimination of hazardous chemical substances*1
● Termination of use of organic chlorinated cleaning solvents*2
Development● Ecology & Economy● LCA design● Medium-term targets
for development of envi-ronmental technology
Water ResourcesGroundwater 2.3million m3
Industrial water 0.1million m3
Supply water 0.8million m3
EnergyElectricity 554GWhHeavy oil A 7,000kℓKerosene 3,000kℓLight oil 7,000kℓNatural gas 12million Nm3
LPG 5ktGasoline 400kℓLNG 5,000Nm3
Steam 10ktOther 4GWh
Direct MaterialsSteel 770,000t
Indirect MaterialsPaints 965t *1
Lubricants 13,048kℓ*1
Atmospheric DischargesCO2 330kt-CO2*5
SOX 11tNOX 152t*2
Substances under the PRTR Law 387t*2
Environmental Risks (Air, soil, and groundwater pollution)
Measures for underground oil tanks 0units*2
Storage for PCB transformers 68units*2
Groundwater observation wells 114wells*2
Company on-site land�lls Closed
Noise and vibration
Hazardous waste manifestsWater-based DischargesWastewater 2.7million m3*2
BOD emissions 6t*2
COD emissions 9t*2
Substances under the PRTR Law (public water areas) 0.0t*2
Substances under the PRTR Law (sewerage) 0.0t*2
WasteTotal amount generated 61ktSubstances under the Pollutant Releaseand Transfer Register (PRTR) Law 64t*2
(Waste furnaces All removed)
Waste RecyclingRecycling amount 58kt
Waste DisposalWaste materials disposed by subcontractor 3kt(Company on-site disposal of waste materials 0t)
ProductProduct weight(construction, mining and Industrial equipment)
805ktNumber of products(construction, mining and Industrial equipment)
47,948vehicles
Use in otherindustrial sectors
Input
Output
106.5 103.3
20.3 9.5020406080100120140160
Japan Asia(excluding)Japan
TheAmericas
Europe
(kt)
61.7
11.9 8.9 8.301020304050607080
Japan Asia(excluding)Japan
TheAmericas
Europe
(kt)
Scope1: CO2 emitted directly by manufacturing facilities
(by using generators, boilers, etc.)
Scope2: CO2 emitted indirectly by manufacturing facilities
(by purchasing electricity, steam and hot water)
CO2 Emissions by Scope
Environmental Report Digest 20169

Coverage of Data*1: 8 Komatsu manufacturing facilities in
Japan*2: 12 Komatsu Group manufacturing facili-
ties in Japan*3: Logistics of business sites in Japan
However, this excludes data from the Awazu Distribution Center, Hokkaido Parts Distribution Center, and Kyushu Parts Distribution Center
*4: Sales agencies and rental companies in Japan (Komatsu Construction Equipment Sales and Service Japan Ltd., Komatsu Rental Ltd. and Komatsu Forklift Japan Ltd.) were added
*5: Including the usage of forklifts in the premises of a factory
EnergyElectricity 16.5GWh*4
Kerosene 600kℓ*4
etc.
Indirect Materials, Oils
EnergyFuel
Indirect Materials, OilsEnergyFuel, electricity
Recovery and Disassembly● Promotion of “Reman,”
in which used compo-nents (parts) are recov-ered, remanufactured, and supp l i ed back t o the market
Use● Reduction of environ-
mental impact during the product usage stage
● Provision of solutions for customers’ envi-ronmental activities
● Promotion of fuel-ef�-cient operation
Sales and After-sales Services● Provision of environmental-
l y - f r i end ly p roducts and services
● Creation and operation of atransact ion network for usedcomponents (parts)
Logistics( )
EnergyLight oil 21,167kℓ
PackagingSteel 1,409t*3
Resins 46t*3
Wood, cardboard 4,692t*3
Atmospheric DischargesCO2 62.1kt-CO2
Atmospheric DischargesCO2 8.5kt-CO2*4
Atmospheric DischargesCO2
Returnable pallets
Waste oilproducts Noise and
vibration
Wastedisposal
Use in other industrial sectors
Hazardous waste manifests
Recycling conducted at oil manufacturers
Atmospheric DischargesCO2 14,935kt-CO2
NOX, diesel particu-late matter
● CO2 reductions in logistics● Improvement of transport
ef�ciency● Imp rovemen t o f pack i ng
materials
Note:K o m a t s u h a s b e -gun to include parts of overseas data to the amount energy used and emissions by logistics.
Scope of energy and CO2 data of logistics●Komatsu (parent company) facilities, speci�cally the following fourteen plants
The Awazu Plant, the Osaka Plant, the Rokko Plant, the Ibaraki Plant, the Tochigi Plant, the Kanazawa Plant, the Shonan Plant, the Oya-ma Plant, the Koriyma Plant, and Komatsu Logistics Corp (Parts Logistics Division) (The Kanto Parts Distribution Center, the Kansai Parts Distribution Center, the Awazu Parts Distribution Center, the Hokkaido Parts Distribution Center, the Kyusyu Parts Distribution Center).
● Komatsu Group manufacturing facilities in Japan, speci�cally the above fourteen plants and the following one busi-ness unitKomatsu Castex Ltd.
●Komatsu Group manufacturing facilities outside Japan, speci�cally the following ten plantsKomatsu America Corp.,[Chattanooga Manufacturing Operation], [Peoria Manufacturing Operation], Komatsu do Brasil Ltda., Komatsu UK Ltd., Komatsu Mining Germany GmbH, Komatsu Shantui Construction Machinery Co., Ltd., Komatsu (Changzhou) Construction Machinery Corporation, Komatsu (Changzhou) Foundry Corp., Komatsu (Shandong) Construction Machinery Corp, PT Komatsu Indonesia Tbk, Bangkok Komatsu Co., Ltd..
Energy Water Resources Waste
3.7
1.7
0.80.4
0
1
2
3
4
5
Japan Asia(excluding)Japan
TheAmericas
Europe
(million GJ)
2.58
0.510.08 0.05
0
1
2
3
4
Japan Asia(excluding)Japan
TheAmericas
Europe
(million m3)
19.9
1.9
6.9
0.4
0
10
20
30
12.7
0.1
18.5
0.6
Disposal amountRecycled amount
Japan Asia(excluding)Japan
TheAmericas
Europe
(kt)
CO2
168.2
115.2
29.2 17.80
50
100
150
200
Japan Asia(excluding)Japan
TheAmericas
Europe
(kt)
Environmental Impact Indicators by Region
25 Komatsu Group Logistics Facilities in and outside Japan
Reuse of productsReuse of parts
Recycling of materials (outsourcing)
Environmental Report Digest 2016 10

Pursuing Environmental Management
Sales and after-sales service
Procurement Division
Development
Manufacturing
The executive body to study and review ba-sic policies, plans, and strategies, hold de-liberations involved in top-priority corporate affairs, and present these to the Board of Directors. This committee consists of the standing executive directors.
This committee has ultimate authority for ap-proving Komatsu’s environmental conser-vation measures. Its meetings are held bian-nually. Its mission includes formulating speci�c environmental action plans based on the Guidelines for Corporate Activity of the Komatsu Earth Environment Charter and de-termining Komatsu Group’s overall direction in environmental conservation. Chaired by an executive of�cer in charge of environmental management, it consists of executive of�cers responsible for individual divisions.
Chaired by an executive of�cer in charge of environmental management, this meeting is attended by of�cers responsible for safety and environmental management in Komatsu manufacturing facilities both in and outside Japan. Meeting every two years as a rule, it provides a platform to implement policies and measures formulated by the Earth Envi-ronment Committee and to exchange infor-mation related to environmental conserva-tion worldwide.
: Person in charge of environmental management
Liaison Council (Rental division in Japan)
Liaison Council (After-sales service divisionin Japan)
Procurement Control Manager Meeting
Environment Technology Working Groups
Environment Promotion Team
Logistics Manager Liaison Council
Environment Management Personnel Liaison Council
Utility Sectional Committee
Research and development divisions
Manufacturing divisions
Sales and after-sales services divisions
Business units
Af�liated companies
Manufacturing facilities outside Japan
Environmental Management Conferencefor Manufacturing Facilities outside Japan
Af�liated Companies’Environmental Management Conference
Komatsu Japanese Dealer Meeting
Procurement Meeting
Development Meeting
Corporate level control division (Environmental Affairs Department)
Manufacturing Facility EnvironmentManagement Committee
Logistics Planning Meeting
Manufacturing Technology Meeting
Board of Directors
President and CEO
Global Safety and EnvironmentalAffairs Meeting
Strategy Review Committee
Earth Environment Committee
The highest executive body to consider top-priority matters and make decisions on management policies of the Komatsu Group.
Komatsu has implemented a Group-wide initiative to acquire ISO14001 certi�cation, an international standard for environmental management systems. The objective is to enhance management quality by strengthening systematic steps towards environmental conservation.
Since 1997, several manufacturing facilities both inside Japan and abroad received certi�cation. In FY2005, the four plants belonging to Komatsu Ltd. (the parent company), the Awazu, Osaka, Mooka, and Oyama Plants, acquired integrated certi�ca-tion. As the second step, in FY2007 Komatsu added its major af�liates in Japan and yet-to-be-certi�ed non-manufacturing facili-ties – notably the Head Of�ce – to the above four plants, with integrated certi�cation attained by the Group in Japan in May 2008.
Upon completing the March 2012 recerti�cation, the KOMATSU Way Global Institute and Komatsu NTC Ltd. were included in the integrated certi�cation. The Group conducted the recerti�cation quali�cation again in March 2015, and will continue to work on improving the quality of management in Japan.
In FY2013 “Komatsu (Shandong) Construction Ma-chinery Corp.”, “Komatsu Man ufacturing Rus. LLC”, and “Hensley Lingfeng Co., Ltd (China)” acquired certi�cation, and in FY2014 “Cabtec (Thailand)” acquired certifi-cation as well.
In FY2015, Yida Nippei Tool Corporation (YNC) also acquired certi�cation and we were able to achieve the goal of having 100% of our overseas production facili-ties certi�ed.
ISO14001 Integrated Certi�cation
Organizational Chart of the Environmental Management Structure
Acquiring ISO14001
Environmental Report Digest 201611

FY2015). Also, the “Safety and Environment Newsletter”, pub-lished for the purpose of providing information related to environment for sales agencies and rental companies, reached its 10th anniversary of publication in 2015 (�rst issue released in November 2005) and has been effective in raising awareness levels at the sales points.
Furthermore, we are implementing a waste management system at the sales agencies in order to promote appropriate management of industrial waste. In addition to management of the electronic manifest, by managing disposal service contract and permits in a uni�ed system, we are working on decreasing the number of man-hours used, as well as providing a central-ized, effective waste management.
Komatsu Construction Equipment Sales has already put the system in place, and we are planning to gradually introduce this system in the other sales and rental agencies.
As a result of the above activities, environmental awareness is higher at sales agencies and rental companies, leading to various improvement activities.
Setting Mid- and Long-Term Objectives
While long-term objectives for CO2 reduction was being set for the world at COP21 in 2015, in order to contribute to the climate change measures as Komatsu, we set medium- and long-term objectives (2020, 2030) and determined to begin in FY2016 to take action based on these objectives.
In looking at CO2 generated in the life cycle of construction equipment products, we found that CO2 emissions during con-struction equipment use makes up approximately 90% of total emissions. Therefore, this time we are working on reducing CO2 emissions over the entire life cycle of construction equipment, and have set fuel ef�ciency goals for construction equipment products that are to be achieved by 2030.
In terms of CO2 reduction for domestic production̶considering the electricity situation that resulted from the Great Eastern Japan Earthquake in 2011̶we have set increasingly stringent objec-tives. Also, for production, in addition to the targets set for CO2 reduction, we set targets for our domestic and overseas factories regarding the amounts of waste generated and the amounts of water input, in order to promote ef�cient use of resources. And we set medium-term targets up to 2030 for CO2 in logistics.
Area Object Application Index Base Year
New Objectives(Reduction Rate)
2020年 2030年
Production
CO2
Japan Improvement rate per unit of production 2000 57% 65%
Overseas Improvement rate per unit of production 2010 32% 40%
WasteJapan Improvement rate per
unit of production 2010 10% 20%
Overseas Improvement rate per unit of production 2010 10% 20%
WaterJapan Improvement rate per
unit of production 2010 40% 50%
Overseas Improvement rate per unit of production 2010 10% 20%
Logistics
CO2
Japan Improvement rate per unit of logistics 2006 32% 39%
Overseas Improvement rate per unit of logistics 2011 13% 22%
Construction
Machinery P
roducts
CO2
Hybrid Hydraulic Excavator
Fuel Consumption Reduction Rate 2007
40% 45%
Normal Hydraulic Excavator
(non-hybrid)
20% 25%
Environmental Inspection
Environmental Inspection of affiliate companies in Thailand
Since 2010, we have been conducting com-pliance risk inspections of our overseas af�liate companies.
In 2015, we conduct-ed an inspection of BKC in Thailand. Komatsu’s corporate headquarters department created a check sheet based on the local environmental laws, and with the support of the person in charge of environmental matters for the main plant(KCX) in Japan, we conducted an inspection of the conditions of environmental ac-tivities and the compliance to legal regulations. In this way, we are working to reduce the environmental risks and improve the level of the on-site person in charge of environmental issues and of the auditor.
We will continue to do follow-ups to the inspection as well as conduct environmental inspections of af�liate companies in other regions.
Past Environment Inspections2007 China
2008 ―2009 Thailand and Indonesia
2010 India
2011 Brazil
2012 Russia and Czech Republic
2013 United States
2014 United States and Brazil
2015 Thailand
Promoting Environmental Activities at Group Sales and Rental Agencies
Komatsu supports the environmental activities of forklift sales agencies as well as construction machinery and rental companies through edu-cation and guidance.
The “Environmental Guide lines for Sales Agencies” deployed for sales and rental agen-c ies compr ises of guide lines and standards pertaining to environmental issues that are of direct relevance to operations at sales agencies and rental compa-nies (such as waste treatment, waste-oil treatment, oil-and-grease management, and treatment of wastewater from vehicle washing).
Komatsu works jointly with their counterparts at various com-panies by visiting the sites of various sales agencies and rental companies to ensure compliance with the “Environmental Guidelines for Sales Agencies” as well as inspecting sites, realities, and actual products to implement support activities such as super-vising the sites and proposing remedial actions that are tailored to each location (implemented at a total of 57 locations in
Environmental Inspection at BKC
Environment Education for Dealer Association New Employee Education
Environmental Report Digest 2016 12
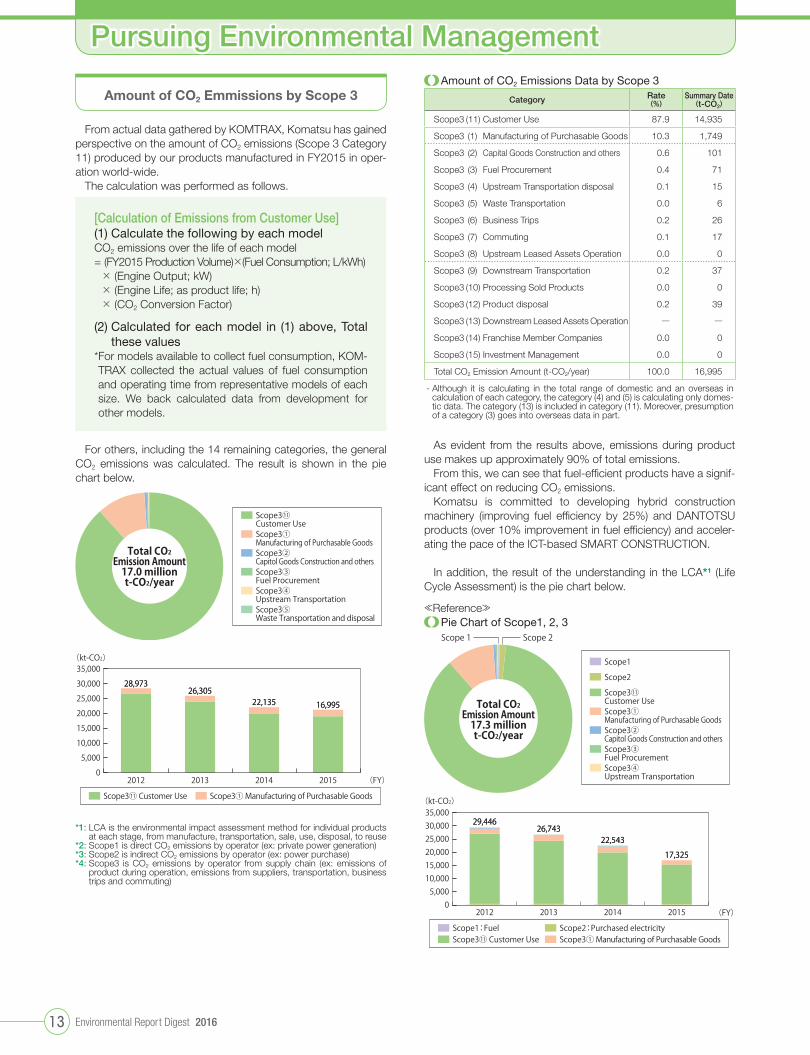
Amount of CO2 Emissions Data by Scope 3
Category Rate(%)
Summary Date(t-CO2)
Scope3 (11) Customer Use 87.9 14,935
Scope3 (1) Manufacturing of Purchasable Goods 10.3 1,749
Scope3 (2) Capital Goods Construction and others 0.6 101
Scope3 (3) Fuel Procurement 0.4 71
Scope3 (4) Upstream Transportation disposal 0.1 15
Scope3 (5) Waste Transportation 0.0 6
Scope3 (6) Business Trips 0.2 26
Scope3 (7) Commuting 0.1 17
Scope3 (8) Upstream Leased Assets Operation 0.0 0
Scope3 (9) Downstream Transportation 0.2 37
Scope3 (10) Processing Sold Products 0.0 0
Scope3 (12) Product disposal 0.2 39
Scope3 (13) Downstream Leased Assets Operation ― ―
Scope3 (14) Franchise Member Companies 0.0 0
Scope3 (15) Investment Management 0.0 0
Total CO2 Emission Amount (t-CO2/year) 100.0 16,995
- Although it is calculating in the total range of domestic and an overseas in calculation of each category, the category (4) and (5) is calculating only domes-tic data. The category (13) is included in category (11). Moreover, presumption of a category (3) goes into overseas data in part.
As evident from the results above, emissions during product use makes up approximately 90% of total emissions.
From this, we can see that fuel-ef�cient products have a signif-icant effect on reducing CO2 emissions.
Komatsu is committed to developing hybrid construction machinery (improving fuel ef�ciency by 25%) and DANTOTSU products (over 10% improvement in fuel ef�ciency) and acceler-ating the pace of the ICT-based SMART CONSTRUCTION.
In addition, the result of the understanding in the LCA*1 (Life Cycle Assessment) is the pie chart below.
≪Reference≫Pie Chart of Scope1, 2, 3
Scope 2Scope 1
Scope3④Upstream Transportation
Scope3③Fuel Procurement
Scope3②Capitol Goods Construction and others
Scope3①Manufacturing of Purchasable Goods
Scope3⑪Customer Use
Scope2
Scope1
Total CO2Emission Amount
17.3 milliont-CO2/year
29,44629,44626,74326,743
2012 2013 2015
17,32517,325
2014
22,54322,543
05,000
10,00015,00020,00025,00030,00035,000
(kt-CO2)
(FY)
Scope3① Manufacturing of Purchasable GoodsScope3⑪ Customer UseScope1:Fuel Scope2:Purchased electricity
Amount of CO2 Emmissions by Scope 3
From actual data gathered by KOMTRAX, Komatsu has gained perspective on the amount of CO2 emissions (Scope 3 Category 11) produced by our products manufactured in FY2015 in oper-ation world-wide.
The calculation was performed as follows.
[Calculation of Emissions from Customer Use](1) Calculate the following by each modelCO2 emissions over the life of each model= (FY2015 Production Volume)×(Fuel Consumption; L/kWh) × (Engine Output; kW)× (Engine Life; as product life; h) × (CO2 Conversion Factor)
(2) Calculated for each model in (1) above, Total these values
* For models available to collect fuel consumption, KOM-TRAX collected the actual values of fuel consumption and operating time from representative models of each size. We back calculated data from development for other models.
For others, including the 14 remaining categories, the general CO2 emissions was calculated. The result is shown in the pie chart below.
Total CO2Emission Amount
17.0 milliont-CO2/year
Scope3⑤Waste Transportation and disposal
Scope3④Upstream Transportation
Scope3③Fuel Procurement
Scope3②Capitol Goods Construction and others
Scope3①Manufacturing of Purchasable Goods
Scope3⑪Customer Use
0
5,000
10,000
15,000
20,000
25,000
30,000
35,000
2012 2013 2014
26,30526,30522,13522,135
2015
16,99516,995
28,97328,973
(kt-CO2)
(FY)
Scope3① Manufacturing of Purchasable GoodsScope3⑪ Customer Use
*1: LCA is the environmental impact assessment method for individual products at each stage, from manufacture, transportation, sale, use, disposal, to reuse
*2: Scope1 is direct CO2 emissions by operator (ex: private power generation)*3: Scope2 is indirect CO2 emissions by operator (ex: power purchase)*4: Scope3 is CO2 emissions by operator from supply chain (ex: emissions of
product during operation, emissions from suppliers, transportation, business trips and commuting)
Pursuing Environmental Management
Environmental Report Digest 201613
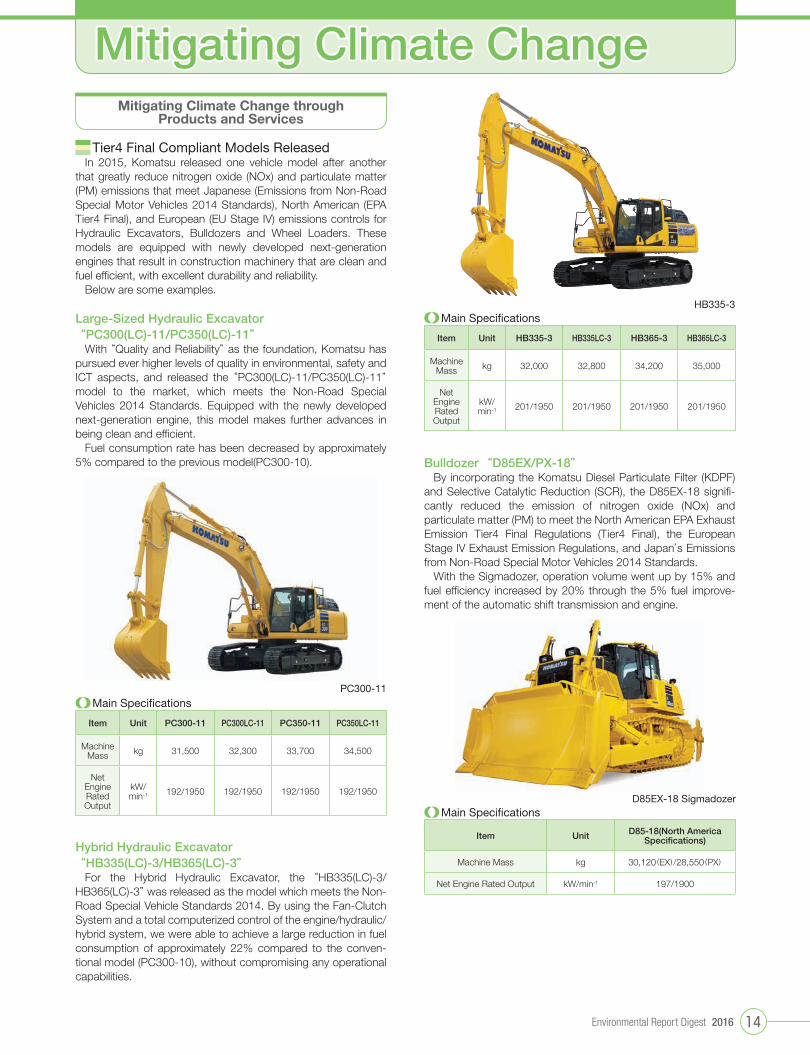
Mitigating Climate Change through Products and Services
Tier4 Final Compliant Models ReleasedIn 2015, Komatsu released one vehicle model after another
that greatly reduce nitrogen oxide (NOx) and particulate matter (PM) emissions that meet Japanese (Emissions from Non-Road Special Motor Vehicles 2014 Standards), North American (EPA Tier4 Final), and European (EU Stage IV) emissions controls for Hydraulic Excavators, Bulldozers and Wheel Loaders. These models are equipped with newly developed next-generation engines that result in construction machinery that are clean and fuel ef�cient, with excellent durability and reliability.
Below are some examples.
Large-Sized Hydraulic Excavator “PC300(LC)-11/PC350(LC)-11”
With “Quality and Reliability” as the foundation, Komatsu has pursued ever higher levels of quality in environmental, safety and ICT aspects, and released the “PC300(LC)-11/PC350(LC)-11” model to the market, which meets the Non-Road Special Vehicles 2014 Standards. Equipped with the newly developed next-generation engine, this model makes further advances in being clean and ef�cient.
Fuel consumption rate has been decreased by approximately 5% compared to the previous model(PC300-10).
PC300-11
Main Speci�cations
Item Unit PC300-11 PC300LC-11 PC350-11 PC350LC-11
Machine Mass kg 31,500 32,300 33,700 34,500
Net Engine Rated Output
kW/min-1 192/1950 192/1950 192/1950 192/1950
Hybrid Hydraulic Excavator“HB335(LC)-3/HB365(LC)-3”
For the Hybrid Hydraulic Excavator, the “HB335(LC)-3/HB365(LC)-3” was released as the model which meets the Non-Road Special Vehicle Standards 2014. By using the Fan-Clutch System and a total computerized control of the engine/hydraulic/hybrid system, we were able to achieve a large reduction in fuel consumption of approximately 22% compared to the conven-tional model (PC300-10), without compromising any operational capabilities.
HB335-3Main Speci�cations
Item Unit HB335-3 HB335LC-3 HB365-3 HB365LC-3
Machine Mass kg 32,000 32,800 34,200 35,000
Net Engine Rated Output
kW/min-1 201/1950 201/1950 201/1950 201/1950
Bulldozer “D85EX/PX-18”By incorporating the Komatsu Diesel Particulate Filter (KDPF)
and Selective Catalytic Reduction (SCR), the D85EX-18 signi�-cantly reduced the emission of nitrogen oxide (NOx) and particulate matter (PM) to meet the North American EPA Exhaust Emission Tier4 Final Regulations (Tier4 Final), the European Stage IV Exhaust Emission Regulations, and Japan’s Emissions from Non-Road Special Motor Vehicles 2014 Standards.
With the Sigmadozer, operation volume went up by 15% and fuel ef�ciency increased by 20% through the 5% fuel improve-ment of the automatic shift transmission and engine.
D85EX-18 SigmadozerMain Speci�cations
Item Unit D85-18(North America Speci�cations)
Machine Mass kg 30,120(EX)/28,550(PX)
Net Engine Rated Output kW/min-1 197/1900
Mitigating Climate Change
Environmental Report Digest 2016 14

PC128USi-10Main Speci�cations
Item Unit PC128USi-10
Machine Mass kg 13,300
Net Engine Rated Output kW/min-1 69.7/2050
Bulldozer “D65PXi-18”The D65PXi-18, by incorporating the Komatsu Diesel
Particulate Filter (KDPF) and the Selective Catalytic Reduction (SCR), signi�cantly reduced the emission of nitrogen oxide (NOx) and particulate matter (PM) to meet the North American EPA Exhaust Emission Tier4 Final Regulations (Tier4 Final), the European Stage IV Exhaust Emission Regulations, and Japan’s Emissions from Non-Road Special Motor Vehicles 2014 Standards.
By combining cutting edge ICT and vehicle control technology, this model is equipped with both the automatic blade control for heavy excavation and land preparation work, and the mapping display capabilities to verify the work progress.
D65PXi-18
Main Speci�cations
Item Unit D65PXi-18(North America Speci�cations)
Machine Mass kg 22,600
Net Engine Rated Output kW/min-1 162/1950
Wheel Loader “WA380-8”*1
The WA380-8, by incorporating the Komatsu Diesel Particulate Filter (KDPF) and Selective Catalytic Reduction (SCR), signi�-cantly reduced the emission of nitrogen oxide (NOx) and particulate matter (PM) to meet the North American EPA Exhaust Emission Tier4 Final Regulations (Tier4 Final), the European Stage IV Exhaust Emission Regulations, and Japan’s Emissions from Non-Road Special Motor Vehicles 2014 Standards.
Fuel consumption rate decreased by approximately 3% com-pared to the previous model.
WA380-8*1: For North America, Europe, and Japan
Main Speci�cations
Item Unit WA380-8(North America Speci�cations)
Machine Mass kg 18,455
Net Engine Rated Output kW/min-1 142/2100
The ICT Construction Equipment Expansion Series
The SMART CONSTRUCTION initiative unveiled in January 2015 makes use of ICT (Information Communication Technology) for automatic control of the bulldozer’s blade or for semi auto-matic control of the hydraulic excavator by measuring terrain data and comparing 3D design data with information on the operating equipment’s location. This dramatically improves the ef�ciency of construction, which results in reducing the fuel con-sumption of construction (decrease in CO2 emissions). In-house testing results show a decrease in fuel consumption of approxi-mately 30% for the ICT Hydraulic Excavator “PC200i-10” and approximately 25% for the ICT Bulldozer “D61PXi -23”.
The representative models of ICT construction equipment to be used in the SMART CONSTRUCTION initiative unveiled in 2015 as follows.
ICT Hydraulic Excavator “PC128USi-10”*1
This machine is an ICT Hydraulic Excavator series expansion model which follows the Medium-sized ICT Hydraulic Excavator “PC200i-10” introduced in October 2014.
This excavator is like the “US Series” hydraulic excavator with rearward minimum-swing-radius, mounted with the same ICT components as the “PC200i-10,” and will be the main machine to introduce computer-aided construction to a broad range of construction sites such as road construction for small-scale developments, plumbing construction, and small-scale land development construction.*1: For Japan (Introduction starting from Komatsu Rental and Komatsu Group’s
rental companies.)
Mitigating Climate Change
Environmental Report Digest 201615
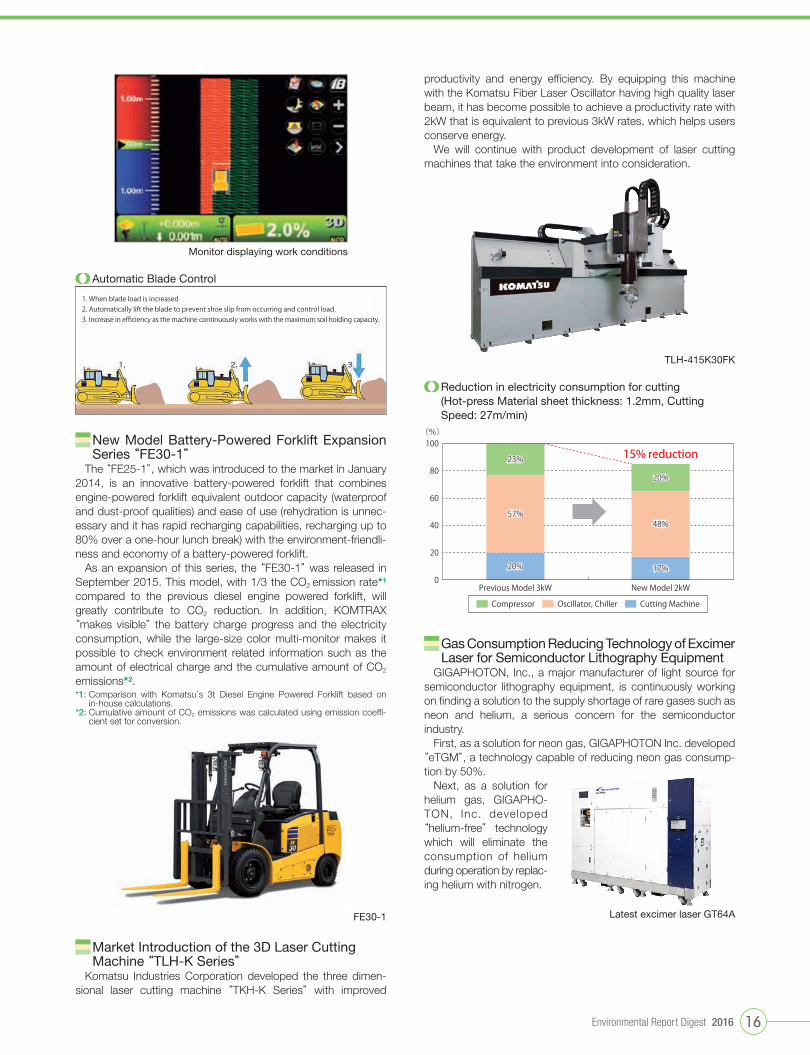
productivity and energy ef�ciency. By equipping this machine with the Komatsu Fiber Laser Oscillator having high quality laser beam, it has become possible to achieve a productivity rate with 2kW that is equivalent to previous 3kW rates, which helps users conserve energy.
We will continue with product development of laser cutting machines that take the environment into consideration.
TLH-415K30FK
Reduction in electricity consumption for cutting (Hot-press Material sheet thickness: 1.2mm, Cutting Speed: 27m/min)
(%)
20% 17%
57%48%
23%
20%
0
20
40
60
80
100
Previous Model 3kW New Model 2kW
Compressor Oscillator, Chiller Cutting Machine
15% reduction
Gas Consumption Reducing Technology of Excimer Laser for Semiconductor Lithography Equipment
GIGAPHOTON, Inc., a major manufacturer of light source for semiconductor lithography equipment, is continuously working on �nding a solution to the supply shortage of rare gases such as neon and helium, a serious concern for the semiconductor industry.
First, as a solution for neon gas, GIGAPHOTON Inc. developed “eTGM”, a technology capable of reducing neon gas consump-tion by 50%.
Next, as a solution for helium gas, GIGAPHO-TON, Inc. developed “he lium-free” technology which will eliminate the consumption of helium during operation by replac-ing helium with nitrogen.
Latest excimer laser GT64A
Monitor displaying work conditions
Automatic Blade Control
1. When blade load is increased2. Automatically lift the blade to prevent shoe slip from occurring and control load.3. Increase in efficiency as the machine continuously works with the maximum soil holding capacity.
New Model Battery-Powered Forklift Expansion Series “FE30-1”
The “FE25-1”, which was introduced to the market in January 2014, is an innovative battery-powered forklift that combines engine-powered forklift equivalent outdoor capacity (waterproof and dust-proof qualities) and ease of use (rehydration is unnec-essary and it has rapid recharging capabilities, recharging up to 80% over a one-hour lunch break) with the environment-friendli-ness and economy of a battery-powered forklift.
As an expansion of this series, the “FE30-1” was released in September 2015. This model, with 1/3 the CO2 emission rate*1 compared to the previous diesel engine powered forklift, will greatly contribute to CO2 reduction. In addition, KOMTRAX “makes visible” the battery charge progress and the electricity consumption, while the large-size color multi-monitor makes it possible to check environment related information such as the amount of electrical charge and the cumulative amount of CO2 emissions*2.*1: Comparison with Komatsu’s 3t Diesel Engine Powered Forklift based on
in-house calculations.*2: Cumulative amount of CO2 emissions was calculated using emission coef�-
cient set for conversion.
FE30-1
Market Introduction of the 3D Laser Cutting Machine “TLH-K Series”
Komatsu Industries Corporation developed the three dimen-sional laser cutting machine “TKH-K Series” with improved
Environmental Report Digest 2016 16
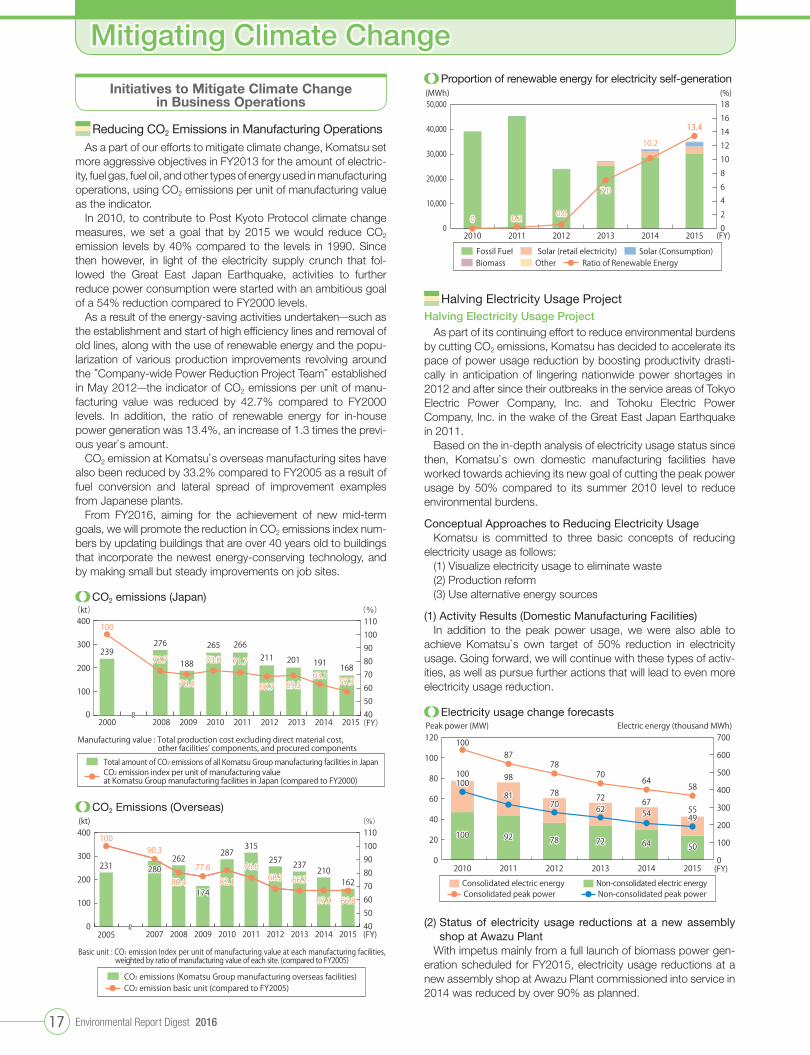
Proportion of renewable energy for electricity self-generation(%)(MWh)
0
2
4
6
8
10
12
14
16
18
0
10,000
20,000
30,000
40,000
50,000
2010 2011 2012 2013 2014 2015 (FY)
0 0.2 0.6
7.0
10.2
13.4
Solar (Consumption) Solar (retail electricity)Fossil FuelBiomass Other Ratio of Renewable Energy
Halving Electricity Usage ProjectHalving Electricity Usage Project
As part of its continuing effort to reduce environmental burdens by cutting CO2 emissions, Komatsu has decided to accelerate its pace of power usage reduction by boosting productivity drasti-cally in anticipation of lingering nationwide power shortages in 2012 and after since their outbreaks in the service areas of Tokyo Electric Power Company, Inc. and Tohoku Electric Power Company, Inc. in the wake of the Great East Japan Earthquake in 2011.
Based on the in-depth analysis of electricity usage status since then, Komatsu’s own domestic manufacturing facilities have worked towards achieving its new goal of cutting the peak power usage by 50% compared to its summer 2010 level to reduce environmental burdens.
Conceptual Approaches to Reducing Electricity UsageKomatsu is committed to three basic concepts of reducing
electricity usage as follows:(1) Visualize electricity usage to eliminate waste (2) Production reform (3) Use alternative energy sources
(1) Activity Results (Domestic Manufacturing Facilities) In addition to the peak power usage, we were also able to
achieve Komatsu’s own target of 50% reduction in electricity usage. Going forward, we will continue with these types of activ-ities, as well as pursue further actions that will lead to even more electricity usage reduction.
Electricity usage change forecasts
(FY)
100 92 78 72 64 50
10087
7870
6458100
8170 62 54 49
100 98
78 72 6755
0
100
200
300
400
500
600
700
0
20
40
60
80
100
120
2010 2011 2012 2013 2014 2015
Electric energy (thousand MWh)Peak power (MW)
Non-consolidated peak powerConsolidated peak powerNon-consolidated electric energyConsolidated electric energy
(2) Status of electricity usage reductions at a new assembly shop at Awazu Plant
With impetus mainly from a full launch of biomass power gen-eration scheduled for FY2015, electricity usage reductions at a new assembly shop at Awazu Plant commissioned into service in 2014 was reduced by over 90% as planned.
Initiatives to Mitigate Climate Change in Business Operations
Reducing CO2 Emissions in Manufacturing OperationsAs a part of our efforts to mitigate climate change, Komatsu set
more aggressive objectives in FY2013 for the amount of electric-ity, fuel gas, fuel oil, and other types of energy used in man u facturing operations, using CO2 emissions per unit of manufacturing value as the indicator.
In 2010, to contribute to Post Kyoto Protocol climate change measures, we set a goal that by 2015 we would reduce CO2 emission levels by 40% compared to the levels in 1990. Since then however, in light of the electricity supply crunch that fol-lowed the Great East Japan Earthquake, activities to further reduce power consumption were started with an ambitious goal of a 54% reduction compared to FY2000 levels.
As a result of the energy-saving activities undertaken̶such as the establishment and start of high ef�ciency lines and removal of old lines, along with the use of renewable energy and the popu-larization of various production improvements revolving around the “Company-wide Power Reduction Project Team” established in May 2012̶the indicator of CO2 emissions per unit of manu-facturing value was reduced by 42.7% compared to FY2000 levels. In addition, the ratio of renewable energy for in-house power generation was 13.4%, an increase of 1.3 times the previ-ous year’s amount.
CO2 emission at Komatsu’s overseas manufacturing sites have also been reduced by 33.2% compared to FY2005 as a result of fuel conversion and lateral spread of improvement examples from Japanese plants.
From FY2016, aiming for the achievement of new mid-term goals, we will promote the reduction in CO2 emissions index num-bers by updating buildings that are over 40 years old to buildings that incorporate the newest energy-conserving technology, and by making small but steady improvements on job sites.
CO2 emissions (Japan)
Manufacturing value : Total production cost excluding direct material cost, other facilities’ components, and procured components
CO2 emission index per unit of manufacturing value at Komatsu Group manufacturing facilities in Japan (compared to FY2000)
Total amount of CO2 emissions of all Komatsu Group manufacturing facilities in Japan
239276
188
265 266211 201
100
72.7
70.4
73.0 71.7
68.7 69.3
19163.1
2000 2008 2009 2010 2011 2012 2013 2014 2015
168
57.3
405060708090100110
0
100
200
300
400
(FY)
(kt) (%)
CO2 Emissions (Overseas)
(FY)
(kt) (%)
405060708090100110
0
100
200
300
400
2005 2007 2008 2009 2010 2011 2012 2013 2014 2015
66.8
162
231
100
280262
174
287315
257 237210
Basic unit : CO2 emission Index per unit of manufacturing value at each manufacturing facilities, weighted by ratio of manufacturing value of each site. (compared to FY2005)
CO2 emission basic unit (compared to FY2005)CO2 emissions (Komatsu Group manufacturing overseas facilities)
82.1
90.3
80.4
77.6 76.668.2 66.7
67.0
Mitigating Climate Change
Environmental Report Digest 201617
plants in the Hokuriku district.In addition to the usual construction equipment products pro-
duced at the Awazu plant, from FY2014, the press products produced at the Kanazawa plant are also being managed and improved by using the Kanazawa Port usage rate as an index.
In FY2015, the Kanazawa Port usage rate for press products was greatly improved.
Kanazawa Port Usage Rate
4641
50
100
68
83
100
45
2014 2015
(%)
0
20
40
60
80
100
120
(FY)
Large-size Press
Construction Equipment Products
Medium-size PressSmall-size Press
[Main Improvements]1) Medium-size Press: Use of RORO ships 2) Large-size/Medium-size Press: Use of conventional ship char-
ter by combining loads 3) In September 2015, the full operation of Murphy Service
started for the �rst time on the Japan Sea side of Honshu, and also for the �rst time a large-size RORO ship called at Kanazawa port. This meant that if the right load size could be arranged, a large-size RORO ships could be used instead of the conventional ships.
(At the �rst time port call of the large-size RORO ship 1,700 tons of Komatsu’s large-size press was sent out to North America and Mexico.)
Press Units being loaded onboard Loading onboard
Tug MasterMuaphy
Trailer
(2) Effects of the Kanazawa Port Usage Rate Improving (compared to FY2014)
1) Reduction in land transport by truck trailer shipment: 350km/trip (compared to use of Kobe Port)
2) Improvement in Basic Unit of CO2 Emissions per Cargo Weight (kg-CO2/ton): 5.9⇒4.4 (△24.5%)
3) Reduction in Total CO2: △25 (t-CO2/year)
CO2 Improvement in Overseas Transport (Use of Natural Gas Truck/Trailer)
At BKC(Thailand), a part of Komatsu’s overseas group compa-nies, the use of low environmental impact transport vehicles called NGVs (Natural Gas Vehicle) has become increas-ingly pervasive, with the NGV usage rate increasing to 51.1%. The resulting CO2 reduction has reached 282t-CO2 cumulatively (FY2012 ~ FY2015).
NGV Truck (Natural Gas Vehicle)
Saving in electricity purchases at the new assembly plant (in terms of the FY2010 output)
FY2010result
Energysaving
Productivityimprovement
Creation FY2015result
(MWh/year)
0
2,000
4,000
6,00035.0%
cut
27.0%cut
28.1%cut
90.1%cut from
the FY2010record
Reduction CO2 Emissions in LogisticsLower CO2 Emissions for Global Transport (Basic Unit of CO2 Emissions per Cargo Weight: kg-CO2/ton)
In 2011, Komatsu began improving its assessment of CO2 emissions from logistics operations for its 10 major international business locations.
Combined with the improvements that were started in domes-tic locations from 2006, we have now implemented improvements in logistic operations on a globally consolidated basis at all 25 business locations.
Domestic improvements include decreasing transportation dis-tance through ef�cient use of the Kanazawa and Hitachi Naka Ports, and the expansion of coastal shipping to handle the long distance transport to the Tohoku area, which has been increas-ing since 2011. From FY2014, the expansion of railway use has been added to priority action items to improve the modal shift trend. As a result of continuing these initiatives in FY2015, we achieved a 2.6% improvement in basic units compared to the previous year. However, domestic CO2 emissions basic units worsened by 9.4% overall, largely due to an increase in average transport distance resulting from the decrease in overseas export loads and large model loads, as well as the basic unit �uctuation affected by the decrease in logistics ef�ciency.
In overseas, the U.S. alone showed a 1.5% improvements in logistics ef�ciency in basic units compared to the previous year, while the overall overseas results showed basic units of CO2 emissions deteriorating by 2.5%, being greatly affected by the load reduction due to the major production decrease in China and Asia.
Global Shipment CO2 Emissions Volume and CO2 Emissions Per Cargo Weight
27,788 21,852 25,341 23,347
55,574
38,456 36,114
24,716
34,984
24,568 27,540 25,650
2.63 1.98 2.07 1.95
-4.0-3.0-2.0-1.00.01.02.03.04.05.06.0
0
20,000
40,000
60,000
80,000
2006 2012 2013 2014
(t-CO2)
2012 2013 2014 2015OverseasOverseas
2011Overseas Overseas OverseasJapan Japan Japan Japan
2.14
2015Japan
20,457
21,993
5.65 5.53 5.83 5.65 5.79
14,749
(10Kg-CO2/t)
(FY)
■ JapanKomatsu: 14 business sitesGroup: 1 business sites
■ OverseasGroup: 10 business sites
Scope of aggregatecalculation for CO2
CO2 basic unit per international cargo weight
CO2 basic unit per Komatsu cargo weight
Group (Japan) CO2 emission
Komatsu CO2 emission
Group (Overseas) CO2 emission
CO2 Improvement for Domestic Transport(Increase in Coastal Port Usage Rate)(1) Increase in Kanazawa Port Usage Rate
(Condition of Press Products) In order to decrease domestic land transport distance, we are
working on improving the usage rate of the local port̶Kanazawa Port̶for export products produced at the Awazu and Kanazawa
Environmental Report Digest 2016 18

Promoting RecyclingPromoting the Reman
Remanufacturing Business
In our Reman business, the Komatsu Group remanufactures used engines, transmissions, and other key components (parts) of construction and mining equipment into “remanned” compo-nents that have the same high quality as newly manufactured components. We then put these components back on the market. The Group is promoting the Reman business at 12 Reman Centers around the world.
Promoting the Reman Business to the WorldReman, an abbreviation for remanufacturing, offers the follow-
ing advantages to customers:●Quality and performance that is the same as new components ●Lower cost for “remanned” components ● Reduced idle time for construction equipment because of
adequate inventory of “remanned” components ● Resource conservation and waste reduction through reuse
and recycling of components.
As the global center, Komatsu established PT Komatsu Reman Indonesia (KRI), which supplies parts, such as engines and transmissions for large-size construction machinery, and PT Komatsu Indonesia (KI), which supplies hydraulic cylinders. Komatsu also established another global center, Komatsu Reman Center Chile (KRCC), which provides components for electric dump trucks.
Additionally, Komatsu established PT KOMATSU REMANU-FACTURING ASIA (KRA) in Indonesia to recycle all components of large-size construction machinery exclusively for the Indone-sian market. For countries that are not part of our global supply chains (China, Russia, India and Brazil), we have established indi-vidual Reman Centers, and in April 2015 the 12th Reman Center was established in Myanmar.
The Myanmar (KMM) Reman Center established in April 2015
Global Reman Factories Regional Reman Factories Distributor Rebuild Center Regional Reman Center Overseas affiliates
KRIKI
KRCC
Engines and Transmissions Wheel Motors Oil Pressure Cylinders
Reman Factories and Centers map
Providing Reman-related InformationThe Komatsu Group has set up “Reman-Net” as a network for
Komatsu Reman Centers around the world. The Group is actively using this network to develop Reman operations for reuse and recycling of components at the global level.
IC tags and two-dimensional bar codes are used to manage each item’s remanufacturing history, and to track quality and durability information. This important information is reported to the Group, to help develop components with optimal service life.
Future StepsTo further increase the reuse rate of used components, the
Komatsu Group is reducing the number of disposed parts by:●Developing parts for remanufacturing, oversized parts, etc● Developing recycling-related technologies (assessment and
measurement for reuse, remanufacturing worn-out parts, cleaning, heat treatment, etc.)
to reduce waste components, and thereby further increase reuse and recycling activities.
Changes in Reman Sales (base FY2004 = 100)index(%)
(FY)2004 2005 2007 2008 2009 2011 201220102006 2013 20152014
100100112112
160160 168168156156
239239250250
200200
137137
270270
304304
349349
80100120140160180200220240260280300320340360380
Reman Process
1 Inspection upon receipt 2 High-pressure cleaning 3 Disassembly 4 Component inspection 5 Component cleaning 6 Component remanufacturing
7 Assembly 8 Performance Testing 9 Painting 10 Performance inspection 11 Factory shipment
Environmental Report Digest 201619
Effective Utilization of Resources in Manufacturing Operations (Waste)
In tandem with reducing the amount of waste produced during manufacturing operations, Komatsu is working on “zero emissions” activities, which is the use of waste materials as resources. Starting in FY2011, we set new mid-term goals for the recycling rate and for the amount of waste generated per unit in the manufacturing oper-ations in Japan, and we are working toward those goals.
For the manufacturing operations in Japan, the de�nition of “zero emissions” was set at a target recycling rate of above 99.5% to raise the level of recycling. The recycling rate for the manufacturing operations in Japan for FY2015 was 99.7%, achieving the goal (over 99.5%) ahead of schedule for 5 years in a row.
Also, in terms of the recycling rate, the overseas manufacturing facilities have also set a mid-term goal of a target rate of over 95%, and have been promoting the effective utilization of waste materials. The recycle rate for overseas manufacturing facilities has increased up to 93.7% in FY2015.
For the manufacturing operation in Japan, Komatsu decided to reduce the amount of waste materials generated per unit of man-ufacturing value in FY2015 by over 20%, compared to the FY2005 level. As a result of strict adherence to the separation of waste materials and increased conversion of waste materials to resources, the amount of waste materials generated per unit has been reduced by 50.7% compared to the FY2005 level. Starting in FY2016, a goal has also been set for the amount of waste materials generated per unit of manufacturing value for overseas manufacturing facilities.
This year, Komatsu will strive to be even more thorough in adhering to the waste materials separation policy and promote activities that will help achieve its mid-term goals.
Amount of Waste Generated (Data coverage: Komatsu Ltd.and the Komatsu Group manufacturing facilities in Japan)
(FY)2005 2006 2007 2008 2009 2010 2011 2012 2013 2014 2015
(%)
Tota
l em
issio
ns o
f was
te
(kt/year)
Recy
clin
g ra
te/In
dex
0
5
10
15
20
25
30
35
40
0
20
40
60
80
100
29.8 33.0 34.1
14.0 19.6 19.9
15.9 17.1 15.3 12.8
29.8
99.2 99.2 99.2 99.0 99.1 99.0 99.7 99.6 99.5 99.6 99.7
95.989.6
59.4
61.2 61.1 58.766.7
57.349.3
100 99.8
Waste disposal amount Index per unit of manufacturing value Recycling rate
Amount of Waste Generated (Data coverage: The Komatsu Group manufacturing facilities in overseas)
(%)(kt/year)
(FY)2005 2006 2007 2008 2009 2010 2011 2012 2013 2014 2015
Recy
clin
g ra
te
0
20
40
60
80
100
0
20
40
60
80
100
120
Tota
l em
issio
ns o
f was
te 98.585.3 83.3
55.1
93.8
102.3 97.8
84.2
67.785.6
29.0
45.6
69.4
82.574.9
85.1
84.0 83.6
89.8
91.4 93.8
48.2
Recycling rateWaste disposal amountAmount recycled
Effective Utilization of Resources in Manufacturing Operations (Water Resources)
In FY2014, Komatsu set a new medium-term target of achiev-ing “a 50% or greater reduction in the amount of water used per unit of manufacturing by FY2015, compared to the FY2005 level”. An effort has been made to save the consumption of underground water at Komatsu facilities located in the Hokuriku District, which are major users of underground water. The Company has achieved reductions in the amount of water used per unit of manufacturing by 67.5% compared to the FY2005 level, through the reuse of water during processing and the elim-ination of wasteful day-to-day practices.
In particular, Komatsu Cabtec Co., Ltd. eliminated its ground-water consumption̶which was used for cooling̶by installing a chiller in every facility.
Komatsu will continue efforts to save water resources to achieve its medium-term goals.
Amount of Water Resources Used and Index Per Units of Manufacturing Value (Data coverage: Komatsu Ltd. and the
Komatsu Group manufacturing facilities in Japan)
10010093.093.0 89.889.8
82.482.4 87.787.7
62.762.754.654.6 53.653.6
47.147.136.736.7 32.5
0
2
4
6
8
10
12
2005 2006 2007 2008 2009 2010 2011 2012 2013 2014 2015
(million m3)
(FY)
(%)
0
20
40
60
80
100
120
Supply waterIndex per unit of manufacturing value
Industrial waterGroundwater
TO P I C S
Komatsu Defense Systems Division was awarded the 2015 Energy Conservation Award (Energy Conservation Case Category) Chairman Prize of Energy Conservation Center, Japan (ECCJ) sponsored by the ECCJ.The Energy Conservation Award is awarded once a year for the purpose of contributing to the spreading of energy conservation consciousness, promoting the use of energy conserving products, development of energy conserving industries and the building of an energy conserving society. This was the �rst time Komatsu won this award.The theme of this year’s award was “Improving energy conservation of electrical forge furnaces in forge plants by super-insulation”. By super-insulating the elec-trical heating furnace used in the hot forging process, the consumption of electricity was reduced by 23% (reduction amount 590Mwh). By using a thermo-graph to accurately identify the heat dissipation points of the furnace wall and by working with the laminate structure of the insulation materials, the insulating capabilities were signi�cantly increased to ef�ciently achieve a large decrease in electricity consumption.We aim to work towards ever higher levels of achievement by continuously mak-ing improvements in the �eld.
Receiving the Energy Conservation Award (Energy Conservation Case Category)
“Chairman Prize of ECCJ”
Thermography Measurements Award Ceremony
Environmental Report Digest 2016 20
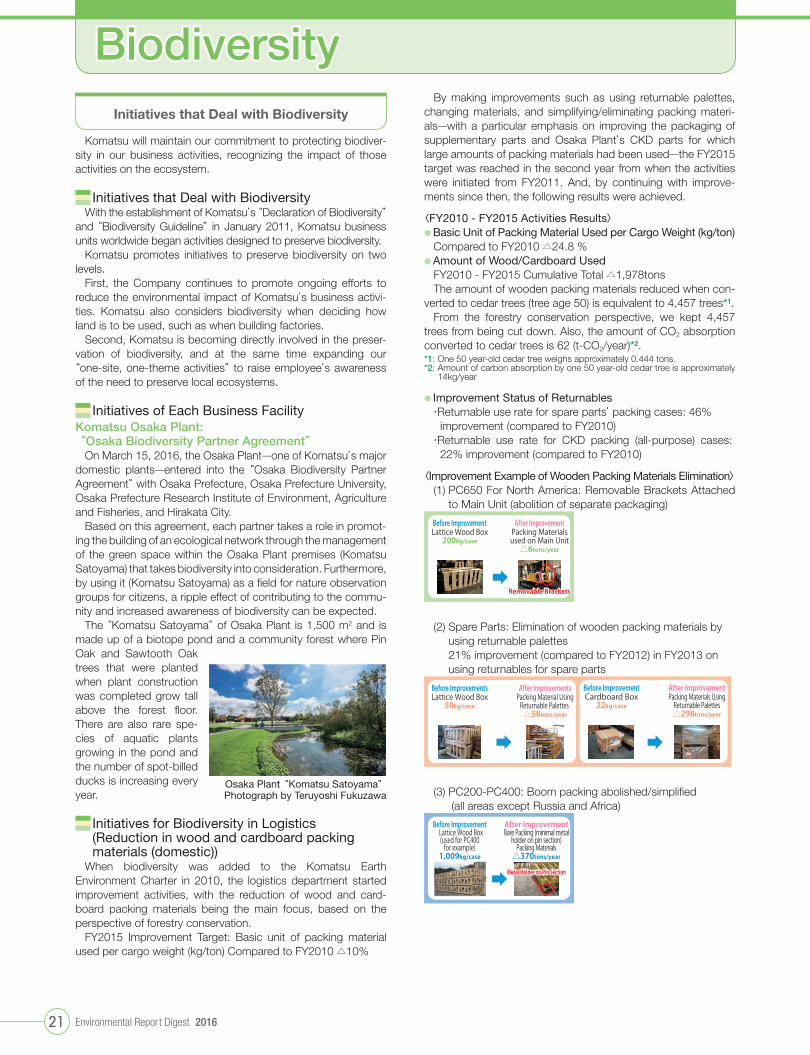
Initiatives that Deal with Biodiversity
Komatsu will maintain our commitment to protecting biodiver-sity in our business activities, recognizing the impact of those activities on the ecosystem.
Initiatives that Deal with BiodiversityWith the establishment of Komatsu’s “Declaration of Biodiversity”
and “Biodiversity Guideline” in January 2011, Komatsu business units worldwide began activities designed to preserve biodiversity.
Komatsu promotes initiatives to preserve biodiversity on two levels.
First, the Company continues to promote ongoing efforts to reduce the environmental impact of Komatsu’s business activi-ties. Komatsu also considers biodiversity when deciding how land is to be used, such as when building factories.
Second, Komatsu is becoming directly involved in the preser-vation of biodiversity, and at the same time expanding our “one-site, one-theme activities” to raise employee’s awareness of the need to preserve local ecosystems.
Initiatives of Each Business FacilityKomatsu Osaka Plant: “Osaka Biodiversity Partner Agreement”
On March 15, 2016, the Osaka Plant̶one of Komatsu’s major domestic plants̶entered into the “Osaka Biodiversity Partner Agreement” with Osaka Prefecture, Osaka Prefecture University, Osaka Prefecture Research Institute of Environment, Agriculture and Fisheries, and Hirakata City.
Based on this agreement, each partner takes a role in promot-ing the building of an ecological network through the management of the green space within the Osaka Plant premises (Komatsu Satoyama) that takes biodiversity into consideration. Furthermore, by using it (Komatsu Satoyama) as a �eld for nature observation groups for citizens, a ripple effect of contributing to the commu-nity and increased awareness of biodiversity can be expected.
The “Komatsu Satoyama” of Osaka Plant is 1,500 m2 and is made up of a biotope pond and a community forest where Pin Oak and Sawtooth Oak trees that were planted when plant construction was completed grow tall above the forest �oor. There are also rare spe-cies of aquatic plants growing in the pond and the number of spot-billed ducks is increasing every year.
Initiatives for Biodiversity in Logistics (Reduction in wood and cardboard packing materials (domestic))
When biodiversity was added to the Komatsu Earth Environment Charter in 2010, the logistics department started improvement activities, with the reduction of wood and card-board packing materials being the main focus, based on the perspective of forestry conservation.
FY2015 Improvement Target: Basic unit of packing material used per cargo weight (kg/ton) Compared to FY2010 △10%
Osaka Plant“Komatsu Satoyama”Photograph by Teruyoshi Fukuzawa
By making improvements such as using returnable palettes, changing materials, and simplifying/eliminating packing materi-als̶with a particular emphasis on improving the packaging of supplementary parts and Osaka Plant’s CKD parts for which large amounts of packing materials had been used̶the FY2015 target was reached in the second year from when the activities were initiated from FY2011. And, by continuing with improve-ments since then, the following results were achieved.
〈FY2010 - FY2015 Activities Results〉● Basic Unit of Packing Material Used per Cargo Weight (kg/ton)
Compared to FY2010 △24.8 %●Amount of Wood/Cardboard Used
FY2010 - FY2015 Cumulative Total △1,978tonsThe amount of wooden packing materials reduced when con-
verted to cedar trees (tree age 50) is equivalent to 4,457 trees*1.From the forestry conservation perspective, we kept 4,457
trees from being cut down. Also, the amount of CO2 absorption converted to cedar trees is 62 (t-CO2/year)*2.*1: One 50 year-old cedar tree weighs approximately 0.444 tons.*2: Amount of carbon absorption by one 50 year-old cedar tree is approximately
14kg/year
● Improvement Status of Returnables・ Returnable use rate for spare parts’ packing cases: 46%
improvement (compared to FY2010)・ Returnable use rate for CKD packing (all-purpose) cases:
22% improvement (compared to FY2010)
〈Improvement Example of Wooden Packing Materials Elimination〉(1) PC650 For North America: Removable Brackets Attached
to Main Unit (abolition of separate packaging)
Before ImprovementLattice Wood Box
200kg/case
After ImprovementPacking Materialsused on Main Unit
△6tons/year
Removable Brackets
(2) Spare Parts: Elimination of wooden packing materials by using returnable palettes 21% improvement (compared to FY2012) in FY2013 on using returnables for spare parts
Before ImprovementCardboard Box
22kg/case
After ImprovementPacking Materials Using
Returnable Palettes△298tons/year
Before ImprovementsLattice Wood Box
50kg/case
After ImprovementsPacking Material Using
Returnable Palettes △58tons/year
(3) PC200-PC400: Boom packing abolished/simpli�ed (all areas except Russia and Africa)
Metal Holder on Pin Section
Before Improvement Lattice Wood Box
(used for PC400for example)
1,009kg/case
After ImprovementBare Packing (minimal metal
holder on pin section) Packing Materials
△370tons/year
Biodiversity
Environmental Report Digest 201621
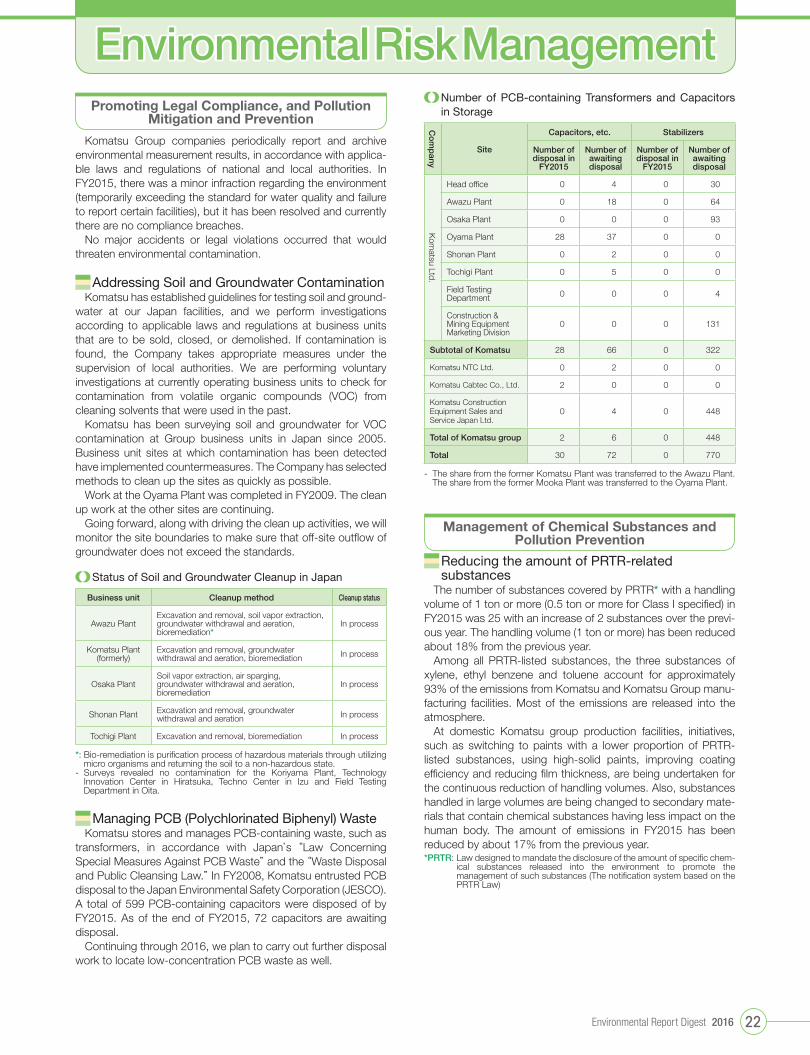
Promoting Legal Compliance, and Pollution Mitigation and Prevention
Komatsu Group companies periodically report and archive environmental measurement results, in accordance with applica-ble laws and regulations of national and local authorities. In FY2015, there was a minor infraction regarding the environment (temporarily exceeding the standard for water quality and failure to report certain facilities), but it has been resolved and currently there are no compliance breaches.
No major accidents or legal violations occurred that would threaten environmental contamination.
Addressing Soil and Groundwater ContaminationKomatsu has established guidelines for testing soil and ground-
water at our Japan facilities, and we perform investigations according to applicable laws and regulations at business units that are to be sold, closed, or demolished. If contamination is found, the Company takes appropriate measures under the supervision of local authorities. We are performing voluntary investigations at currently operating business units to check for contamination from volatile organic compounds (VOC) from cleaning solvents that were used in the past.
Komatsu has been surveying soil and groundwater for VOC contamination at Group business units in Japan since 2005. Business unit sites at which contamination has been detected have implemented countermeasures. The Company has selected methods to clean up the sites as quickly as possible.
Work at the Oyama Plant was completed in FY2009. The clean up work at the other sites are continuing.
Going forward, along with driving the clean up activities, we will monitor the site boundaries to make sure that off-site out�ow of groundwater does not exceed the standards.
Status of Soil and Groundwater Cleanup in Japan
Business unit Cleanup method Cleanup status
Awazu PlantExcavation and removal, soil vapor extraction, groundwater withdrawal and aeration, bioremediation*
In process
Komatsu Plant(formerly)
Excavation and removal, groundwater withdrawal and aeration, bioremediation In process
Osaka PlantSoil vapor extraction, air sparging, groundwater withdrawal and aeration, bioremediation
In process
Shonan Plant Excavation and removal, groundwater withdrawal and aeration In process
Tochigi Plant Excavation and removal, bioremediation In process
*: Bio-remediation is puri�cation process of hazardous materials through utilizing micro organisms and returning the soil to a non-hazardous state.
- Surveys revealed no contamination for the Koriyama Plant, Technology Innovation Center in Hiratsuka, Techno Center in Izu and Field Testing Department in Oita.
Managing PCB (Polychlorinated Biphenyl) WasteKomatsu stores and manages PCB-containing waste, such as
transformers, in accordance with Japan’s “Law Concerning Special Measures Against PCB Waste” and the “Waste Disposal and Public Cleansing Law.” In FY2008, Komatsu entrusted PCB disposal to the Japan Environmental Safety Corporation (JESCO). A total of 599 PCB-containing capacitors were disposed of by FY2015. As of the end of FY2015, 72 capacitors are awaiting disposal.
Continuing through 2016, we plan to carry out further disposal work to locate low-concentration PCB waste as well.
Number of PCB-containing Transformers and Capacitors in Storage
Co
mp
any
Site
Capacitors, etc. Stabilizers
Number of disposal in
FY2015
Number of awaiting disposal
Number of disposal in
FY2015
Number of awaiting disposal
Kom
atsu Ltd.
Head of�ce 0 4 0 30
Awazu Plant 0 18 0 64
Osaka Plant 0 0 0 93
Oyama Plant 28 37 0 0
Shonan Plant 0 2 0 0
Tochigi Plant 0 5 0 0
Field Testing Department 0 0 0 4
Construction & Mining Equipment Marketing Division
0 0 0 131
Subtotal of Komatsu 28 66 0 322
Komatsu NTC Ltd. 0 2 0 0
Komatsu Cabtec Co., Ltd. 2 0 0 0
Komatsu Construction Equipment Sales and Service Japan Ltd.
0 4 0 448
Total of Komatsu group 2 6 0 448
Total 30 72 0 770
- The share from the former Komatsu Plant was transferred to the Awazu Plant. The share from the former Mooka Plant was transferred to the Oyama Plant.
Management of Chemical Substances and Pollution Prevention
Reducing the amount of PRTR-related substances
The number of substances covered by PRTR* with a handling volume of 1 ton or more (0.5 ton or more for Class I speci�ed) in FY2015 was 25 with an increase of 2 substances over the previ-ous year. The handling volume (1 ton or more) has been reduced about 18% from the previous year.
Among all PRTR-listed substances, the three substances of xylene, ethyl benzene and toluene account for approximately 93% of the emissions from Komatsu and Komatsu Group manu-facturing facilities. Most of the emissions are released into the atmosphere.
At domestic Komatsu group production facilities, initiatives, such as switching to paints with a lower proportion of PRTR-listed substances, using high-solid paints, improving coating ef�ciency and reducing �lm thickness, are being undertaken for the continuous reduction of handling volumes. Also, substances handled in large volumes are being changed to secondary mate-rials that contain chemical substances having less impact on the human body. The amount of emissions in FY2015 has been reduced by about 17% from the previous year.*PRTR: Law designed to mandate the disclosure of the amount of speci�c chem-
ical substances released into the environment to promote the management of such substances (The noti�cation system based on the PRTR Law)
Environmental Risk Management
Environmental Report Digest 2016 22

Environmental Risk ManagementReducing the amount of VOC released
The majority of VOC emissions are from VOC contained in paint such as Ethylbenzene and Xylene.
The amount of emissions in FY2015 has been reduced by about 18% from the previous year by switching to paints having a less content of volatile matter, migrating to paints having a higher coating ef�ciency and so on.
Further improvement efforts continue in pursuit of further reductions.
Komatsu Cabtec Co., Ltd.’s New Painting Line
Names of Class I Designated Chemical Substances and the AmountsReleased and Transferred from Komatsu Group Manufacturing Facilities in Japan(handling 1 ton or more, or 0.5 ton or more for Class I Speci�ed Chemical Substances) (applicable PRTR substances from April 2010) (Unit: t)
Number under the PRTR Law
Name Amounthandled
Amount released Amount transferred Chemically transformed
or eliminated
Amount Contained
in Products
Air Water Soil Buried Sewage Waste
412 Manganese and its compounds 319.3 0.5 0.0 ― ― ― 7.5 ― 311.3
80 Xylene 231.9 170.4 ― ― ― ― 18.4 42.6 0.5
53 Ethylbenzene 155.4 126.5 ― ― ― ― 12.9 15.6 0.4
87 Chromium and chromium (III) compounds 102.2 0.0 ― ― ― ― 1.0 ― 101.2
438 Methylna phthalene 96.5 0.5 ― ― ― ― ― 96.0 ―300 Toluene 76.4 60.1 ― ― ― ― 10.2 6.1 ―296 1,2,4-trimethyl benzene 55.6 18.7 ― ― ― ― 1.9 35.0 0.1
453 Molybdenum and its compounds 30.7 ― ― ― ― ― 0.0 ― 30.6
448 Methylenebis (4,1 phenylene) = diisocyanate 23.1 ― ― ― ― ― 0.0 22.5 0.5
308 Nickel 14.2 0.0 ― ― ― ― 0.0 ― 14.2
297 1,3,5-trimethyl benzene 8.7 4.1 ― ― ― ― 0.5 4.1 ―88 Chromium (VI) compounds*1 *2 8.5 0.0 ― ― ― ― 2.1 ― 0.0
321 Vanadium compounds 8.1 ― ― ― ― ― 0.0 ― 8.1
207 2,6-Di-tert-butyl-4-methylphenol 7.8 ― 0.0 ― ― ― 0.7 0.0 7.0
132 Cobalt and its compounds 6.1 0.0 ― ― ― ― 0.8 ― 5.4
277 Triethylamine 6.0 1.2 ― ― ― ― 0.0 4.8 ―460 Tricresyl phosphate 3.3 0.0 ― ― ― ― 0.0 ― 3.3
188 N,N-dicyclohe xylamine 3.2 0.3 0.0 ― ― ― 2.6 0.2 0.1
258 1,3,5,7-tetraaza tricyclo[3, 3,1,1(3,7)] decane*3 3.1 ― ― ― ― ― 0.0 1.6 1.6
349 Phenol*3 3.1 0.0 ― ― ― ― 0.0 3.1 0.0
392 n-hexane 2.4 1.0 ― ― ― ― 0.0 1.4 ―302 Naphthalene 2.2 1.0 ― ― ― ― 0.5 0.7 ―83 Isopropyl benzene 2.0 1.4 ― ― ― ― 0.1 0.4 ―71 Ferric chloride 1.2 0.0 ― ― ― ― 1.2 ― ―1 Zinc compounds (water- soluble) 1.1 0.0 ― ― ― ― 0.3 ― 0.8
*1: During chrome plating, chromium (VI) compounds become chromium compounds. Therefore, the amount transferred and the amount contained in products are entered as chromium and chromium(III) compounds.
*2: PRTR Class I Speci�ed Chemical Substances*3: Although the amount contained is below the amount that requires registration with the PRTR, we report the data because the amount released exceeds one ton.
Atmosphericdischarge33.1%
Nickel 1.2%Other 2.4%
Xylene 3.7%Other 5.2%
Ethylbenzene 10.9%
Toluene 5.1%
Methylnaphthalene 8.2%
1,2,4-Trimethylbenzene 3.0%
Other 2.5%
Manganese andits compounds26.7%
Chromium andits compounds 8.7%
Molybdenum andits compounds 2.6%
Xylene 1.6%Ethylbenzene 1.1%Toluene 0.9%
Manganese andits compounds 0.6%
Other1.0%
Xylene 14.6%
Adherence toproducts41.6%
Transferred(waste)5.2%
Note: Substances handled in quantities of 1 ton or more
Chemicallytransformed or
eliminated20.1%
(t)
402
2.9
4.0
2.3
690570 575
2.4
525
5.2 5.0
2.9 2.8
463
2.4
2014
1,400
1,200
1,000
800
0
3
6
5
4
600
400 1
2
0(FY)
Note: Substances handled in quantities of 1 ton or more
2006 2007 2008 2009 2011 2012 20132010
1,214 9771,288
(kg/million yen)
Index per Unit of Manufacturing ValuePRTR emissions
386
2.0
2015
564 833
1,453 1,321
991
59.4
816
61.8
803
100
78.8
47.6
51.359.9
50.5
685
2,000
1,500
1,000
0
30
120
90
60
500
0
(t) (%)
2005 2008 2009 2011 20122010 2013 2014 2015
Index per Unit of Manufacturing Value(Compared to FY2005)Amount of VOC Released
(FY)
42.5
559
Breakdown of the Amount of PRTR-related Substances (Released and Transferred from
Komatsu Group Manufacturing Facilities in Japan)
Amount of PRTR-related Substances (Releasedfrom Komatsu Group Manufacturing
Facilities in Japan)
Amount of VOC (Released from Komatsu Group Manufacturing
Facilities in Japan)
Environmental Report Digest 201623

Reducing the Use of Substances of Environmental Concern and Complying with the EU REACH Regulation
Recent External Commendations and Evaluations onKomatsu’s Environmental Conservation and Social Activities
Komatsu has been making efforts from an early stage to reduce the use of asbestos, lead, and other substances of environmen-tal concern. In FY1999, Komatsu created its own list of banned substances and substances approved for use only in limited cir-cumstances (Refer to “Substances of Environmental Concern Banned or to Be Reduced for Use in Products”), which was based in part on the chemical substances banned under Japan’s Law Concerning the Examination and Regulation of Manufacture of Chemical Substances Control, as well as regulations in other countries.
In addition, Komatsu has begun comprehensive control of sub-stances of environmental concern. Recently, in compliance with REACH*1, Komatsu began revising its listing of substances des-ignated as approved for limited use, “to be reduced,” and “banned.” Through the cooperation of suppliers, the Company has initiated a system to strengthen control of substances of environmental concern in its products. This system has been deployed in Japan and Europe, and is also being implemented in other overseas subsidiaries.
By using this system, we identify SVHC (substances of very high concern) in vehicles currently in production and in newly
developed vehicles. Furthermore, we also regularly check for new SVHCs to be added to the list.
There are currently 168 SVHCs registered, but more are added on a bi-yearly basis. In future, it is said that the number of SVHC will increase up to 1,500. Komatsu has devised a work�ow to monitor control of these substances.
Control System for Substances of Environmental Concern
Design
Procurement
Sending informationon technical drawings
Sendingsurvey forms
Sendingcompleted
surveys
● Supplier surveymanagement
● Inputting speci�cations of substances ofenvironmental concern contained in products
Database forparts subjected
to surveys
Control systemfor substances ofenvironmental concern
● Generating summary formodel under development
● Checking for targetedsubstances upon partsregistration
● Checking for targetedsubstances upon releaseof technical drawings
● Responding to survey results● Summarizing information
on targeted substances SupplierB
SupplierA
Table listingsubstances ofenvironmental
concern
Table of parts
CAD system(technical drawings)
Substances of Environmental Concern Banned orto Be Reduced for Use in Products
Rank Number Chemical Substance
Banned 14●Hexavalent Chromium ●Cadmium ●Mercury ●PBB/PBDE ●Tri-substituted Organostannic Compounds●PCB ●Asbestos ●Speci�ed CFCs/Alternative CFCs (HCFC) ●Trichloroethylene●Triethanolamine ●Hexachlorobenzene ●PFOS (Per�uorooctanesulfates)
To be reduced(Subject tolimited use)
17
●Lead ●Arsenic ●Selenium ●Alternative CFCs (HFC)●Speci�ed phthalate ester (DEHP/DBP/BBP/DIBP)*2
●Speci�ed Brominated Flame Retardents (HBCDD)/ Speci�ed Chlorinated Flame Retardents (TCEP)●Polycyclic Aromatic Hydrocarbons (PAH) ●RCF (Fire-Resistant Ceramic Fibers) (Alumina and Scilica Types)●Methanol ●DZ ●BNST ●DOTE*3 ●UV327*3
Substances ofVery HighConcern
(SVHC) underthe EU REACH
Reguleation
(168)*4Komatsu is subject to control the following substances, which might be used in Komatsu products.●DEHP/DBP/BBP/DIBP ●HBCDD/DBDE/Trisphosphates (2-Chloroethyl)●RCF ●Speci�ed Lead Compounds (SOC 4) ●DOTE ●UV327
*1: REACH: EU regulations for Registration, Evaluation, Authorization and Restriction of Chemicals*2: Diethylhexyl phthalate, dibutyl phthalate, benzyl butyl phthalate, diisobutyl phthalate*3: Review for stricter limits due to regulatory trends.*4: The number of substances registered up until December, 2015 (progressively updated). Includes materials that are not contained in Komatsu construction equipment.
2015
September Selected for inclusion in the Dow Jones Sustainability Indices (World and Asia Paci�c)
November Selected by CDP as “Leading Company for Climate Change Information Disclosure”
2016
January Ranked 10th (out of 705 companies) in the Manufacturing Sector in Nihon Keizai Shimbun’s 19th Environmental Management Survey
February Defense Systems Division awarded the Energy Conservation Center, Japan’s “Energy Conservation Prize (Case Category) Energy Conservation Center Chairman’s Award”
February Komatsu Environmental Report Digest 2015 awarded the “19th Environmental Communication Award --Excellence Award” from the Global Environment Forum of the Ministry of the Environment
Environmental Report Digest 2016 24

Environmental Data by Manufacturing Facility in Japan
Overview
Manufacturing facility Awazu Plant (established in 1938) Kanazawa Plant (established in 2007) Osaka Plant (established in 1952) Ibaraki Plant (established in 2007) Oyama Plant (established in 1962) Koriyama Plant (established in 1994) Shonan Plant (established in 1966)
Location Komatsu, Ishikawa Prefecture Kanazawa, Ishikawa Prefecture Hirakata, Osaka Prefecture Hitachinaka, Ibaraki Prefecture Oyama, Tochigi Prefecture Koriyama, Fukushima Prefecture Hiratsuka, Kanagawa Prefecture
Main products
Small and medium-sized bulldozers, small hydraulic excavators, small and medium-sized wheel loaders, motor graders, armored vehi-cles, etc.
Ultra-large hydraulic excavators, large presses, medium presses
Large bulldozers, medium-and large-sized hydraulic excavators, mobile crushers/recy-clers/tub grinders (crushers, soil stabilizers, tub grinders, etc.)
Large wheel loaders, dump trucksEngines for construction/industrial machinery, diesel generators, hydraulic equipment, axle, excimer lasers, etc.
Hydraulic cylinders, swivel joints, gear pumps
Control equipment for construction and min-ing equipment, hybrid components Thermoelectric modules, temperature control equipment, etc.
Site/Green Landscape (1,000 m2) 700/85 134/30 575/80 350/71 591/126 297/153 69/14
Number of employees 2,926 646 2,614 862 3,170 425 1,015
Date of ISO14001 certi�cation acquisition September 1997 May 2007 July 1997 May 2007 May 1997 July 2002 March 2000*The number of employees includes those working for Komatsu af�liates on the premises.*The number of employees as of the end of March 2016.
Majo
r Perfo
rmance
Environmental impact* Refer to the Data on Environmental Impact Resulting from Business Activities for details on the methods used to calculate amounts.
* Total emissions of waste are expressed as a composite of the amount recycled (excluding valuables) and the amount disposed.
* Recycling rate is calculated by dividing the amount recycled (including valuables) by the amount generated (including valuables).
* Total emissions of BOD and COD are calcu-lated by multiplying the average concentration by the amount of wastewater.
Item Actual value Item Actual value Item Actual value Item Actual value Item Actual value Item Actual value Item Actual valueTotal CO2 emissions 30,838 t-CO2 Total CO2 emissions 1,407 t-CO2 Total CO2 emissions 22,509 t-CO2 Total CO2 emissions 3,402 t-CO2 Total CO2 emissions 41,683 t-CO2 Total CO2 emissions 7,752 t-CO2 Total CO2 emissions 3,547 t-CO2
NOx total amount 75,907 kg NOx total amount ― kg NOx total amount 1,685 kg NOx total amount 606 kg NOx total amount 22,182 kg NOx total amount 41,322 kg NOx total amount ― kgSOx total amount 4,804 kg SOx total amount 0 kg SOx total amount 0 kg SOx total amount 2 kg SOx total amount 18 kg SOx total amount 1,696 kg SOx total amount 0 kgTotal emissions of waste 1,380 t Total emissions of waste 110 t Total emissions of waste 1,077 t Total emissions of waste 321 t Total emissions of waste 1,545 t Total emissions of waste 790 t Total emissions of waste 145 tAmount recycled 1,379 t Amount recycled 110 t Amount recycled 1,075 t Amount recycled 321 t Amount recycled 1,545 t Amount recycled 790 t Amount recycled 145 tRecycling rate 99.9% Recycling rate 100% Recycling rate 99.9% Recycling rate 100% Recycling rate 100% Recycling rate 100% Recycling rate 100%BOD emissions 1,055 kg BOD emissions 38 kg BOD emissions 459 kg BOD emissions 2,831 kg BOD emissions 2,108 kg BOD emissions 53 kg BOD emissions 1,883 kgCOD emissions 1,804 kg COD emissions 124 kg COD emissions 1,196 kg COD emissions ― kg COD emissions 3,023 kg COD emissions 152 kg COD emissions ― kgWastewater 599,417 m3 Wastewater 34,965 m3 Wastewater 181,011 m3 Wastewater 23,262 m3 Wastewater 356,300 m3 Wastewater 11,851 m3 Wastewater 35,093 m3
Output of in-house power generation 14,590 MWh Output of in-house
power generation 623 MWh Output of in-house power generation 4,800 MWh Output of in-house
power generation 641 MWh Output of in-house power generation 9,063 MWh Output of in-house
power generation 4,386 MWh Output of in-house power generation 258 MWh
Energy consumption* The heat energy conversion factor is cal-culated in keeping with Greenhouse Gas Emissions Calculation - Reporting Manual, which is based on the act on Promotion of Global Warming Countermeasures.
Item Actual consumption
Converted to calorie equivalents (GJ) Item Actual
consumptionConverted to calorie
equivalents (GJ) Item Actual consumption
Converted to calorie equivalents (GJ) Item Actual
consumptionConverted to calorie
equivalents (GJ) Item Actual consumption
Converted to calorie equivalents (GJ) Item Actual
consumptionConverted to calorie
equivalents (GJ) Item Actual consumption
Converted to calorie equivalents (GJ)
Electricity 39,289 MWh 381,996 Electricity 3,616 MWh 35,256 Electricity 38,025 MWh 369,263 Electricity 6,238 MWh 60,860 Electricity 56,307 MWh 548,675 Electricity 8,807 MWh 85,124 Electricity 8,671 MWh 85,532Heavy oil A 4,029 kℓ 157,543 Heavy oil A 0 kℓ 0 Heavy oil A 52 kℓ 2,029 Heavy oil A 0 kℓ 0 Heavy oil A 33 kℓ 1,286 Heavy oil A 1,084 kℓ 42,384 Heavy oil A 0 kℓ 0Kerosene 12 kℓ 430 Kerosene 0 kℓ 0 Kerosene 8 kℓ 296 Kerosene 2 kℓ 57 Kerosene 1,402 kℓ 51,457 Kerosene 0 kℓ 0 Kerosene 0 kℓ 0Light oil 413 kℓ 15,760 Light oil 1 kℓ 33 Light oil 430 kℓ 16,439 Light oil 353 kℓ 13,495 Light oil 4,243 kℓ 162,086 Light oil 6 kℓ 232 Light oil 35 kℓ 1,345Town gas 0 Nkm3 0 Town gas 0 Nkm3 0 Town gas 3,234 Nkm3 135,519 Town gas 0 Nkm3 0 Town gas 2,620 Nkm3 109,757 Town gas 0 Nkm3 0 Town gas 63 Nkm3 2,636LPG 1,208 t 60,647 LPG 5 t 273 LPG 34 t 1,719 LPG 26 t 1,302 LPG 34 t 1,692 LPG 469 t 23,534 LPG 0 t 0Other 1,454 Other 0 Other 1,153 Other 0 Other 785 Other 5 156 Other 0Total 617,830 Total 35,562 Total 526,417 Total 75,713 Total 875,739 Total 151,430 Total 89,513
Water consumption
Item Actual value Item Actual value Item Actual value Item Actual value Item Actual value Item Actual value Item Actual valueGroundwater 404,300 m3 Groundwater 27,922 m3 Groundwater 21,934 m3 Groundwater 0 m3 Groundwater 395,100 m3 Groundwater 0 m3 Groundwater 0 m3
Industrial water 0 m3 Industrial water 0 m3 Industrial water 0 m3 Industrial water 0 m3 Industrial water 0 m3 Industrial water 2,736 m3 Industrial water 0 m3
Supply water 81,549 m3 Supply water 7,043 m3 Supply water 94,942 m3 Supply water 23,212 m3 Supply water 1,672 m3 Supply water 19,140 m3 Supply water 35,093 m3
Total 485,849 m3 Total 34,965 m3 Total 116,876 m3 Total 23,212 m3 Total 396,772 m3 Total 21,876 m3 Total 35,093 m3
Co
mp
liance Co
nditio
ns to M
ajor R
egulatio
ns
Air Item Unit Facility Regulated
valueActual value Facility Regulated
valueActual value Facility Regulated
valueActual value Facility Regulated
valueActual value Facility Regulated
valueActual value Facility Regulated
valueActual value Facility Regulated
valueActual value
Nitrogen oxides (NOx) ppm Boiler 180 100 N/A ― ― Boiler 150 23 Diesel engine 100 63* Diesel engine 950 940 Cogeneration engine 760 652 N/A ― ―ppm Diesel engine 950 760 Metal furnace 180 56 Gas turbine 70 15ppm Paint drying furnace 230 13ppm Gas engine 600 21
Sulfur oxides (SOx) ― K-value regulation 17.5 2.53 K-value regulation 9 0.05 K-value regulation 7.0 0.38 K-value regulation 11.5 0.76Soot and dust g/m3N Boiler 0.3 0.054 N/A ― ― Boiler 0.05 0.002 Diesel engine 0.1 0.014 Diesel engine 0.1 0.03 Cogeneration engine 0.1 0.036 N/A ― ―
g/m3N Diesel engine 0.1 0.034 Metal furnace 0.1 0.024 Gas turbine 0.05 0.001g/m3N Paint drying furnace 0.1 0.005g/m3N
*Regulated values are in accordance with the Air Pollution Control Law and local regulations.
Wastew
ater
Item
Regulated value according to the Water Pollution
Control Law
Regulated value
Actual valueRegulated
value
Actual valueRegulated
value
Actual value Regulatedvalue
(Sewage Water Law)
Actual valueRegulated
value
Actual valueRegulated
value
Actual value Regulatedvalue
(Sewage Water Law)
Actual value
Maximum Minimum Average Maximum Minimum Average Maximum Minimum Average Maximum Minimum Average Maximum Minimum Average Maximum Minimum Average Maximum Minimum Average
pH 5.8~8.6 5.8~8.6 7.2 6.4 6.7 5.0~9.0 8.2 6.4 7.1 5.8~8.6 7.5 7 7.2 5~9 8.9 7.8 8.5 5.8~8.6 7.3 7 7.2 5.8~8.6 7.4 6.9 7.2 5~9 8.6 7.4 8.0BOD (Biochemical oxygen demand) 160mg/ℓ 80 2.3 ND 1.3 80 1.6 1.1 1.4 35 11 ND 2.5 600 210 42 122 25 18 1.2 5.9 40 10 1.1 4.5 600 170 1 34
COD (Chemical Oxygen Demand) 160mg/ℓ 80 5.1 ND 2.5 80 9 1.1 3.2 35 11 3.6 6.6 ― ― ― ― 25 13.6 3 8.5 40 19 5.9 12.8 ― ― ― ―
Suspended solids (SS) 200mg/ℓ 120 3.0 ND 1.5 120 4.2 2.0 3.0 70 7 ND 2.4 600 440 24 187 50 23 2.4 8.1 70 6.6 2.5 4.0 600 190 ND 25Mineral oils 5mg/ℓ 5 ND ND ND 5 ND ND ND 5 ND ND ND 5 ND ND ND 5 ND ND ND 1 0.7 ND 0.5 5 ND ND NDCopper 3mg/ℓ 3 ND ND ND 3 ND ND ND 3 ND ND ND ― ― ― ― 3 0.2 ND 0.1 2 ND ND ― 3 0.05 ND 0.05Zinc 2mg/ℓ 2 0.17 ND 0.09 2 1.5 1.1 1.3 2 ND ND ND ― ― ― ― 2 0.1 ND 0.1 2 0.05 0.05 ― 2 0.32 ND 0.13Nitrogen 120mg/ℓ 120 3.9 1.6 3.0 120 0.2 0.04 0.1 120 37 5.4 17.9 ― ― ― ― 20 9.9 1.1 5.1 120 8.2 8.2 ― ― ― ― ―Phosphorus 16mg/ℓ 16 0.31 0.01 0.13 16 4.8 0.03 2.4 16 0.16 0.02 0.07 ― ― ― ― 2 0.4 0.1 0.3 16 2.4 2.4 ― ― ― ― ―Cadmium 0.03mg/ℓ 0.03 ND ND ND 0.03 ND ND ND 0.003 ND ND ND ― ― ― ― 0.03 ND ND ND 0.03 ND ND ― 0.03 ND ND NDLead 0.1mg/ℓ 0.1 ND ND ND 0.1 ND ND ND 0.01 ND ND ND ― ― ― ― 0.1 ND ND ND 0.1 ND ND ND 0.1 ND ND NDChromium (VI) 0.5mg/ℓ 0.5 ND ND ND 0.5 ND ND ND 0.05 ND ND ND ― ― ― ― 0.1 ND ND ND 0.2 ND ND ND 0.5 ND ND NDTrichloroethylene 0.1mg/ℓ 0.1 ND ND ND 0.1 ND ND ND 0.01 ND ND ND ― ― ― ― 0.1 ND ND ND 0.1 ND ND ― 0.1 ND ND NDTetrachloroethylene 0.1mg/ℓ 0.1 ND ND ND 0.1 ND ND ND 0.01 ND ND ND ― ― ― ― 0.1 ND ND ND 0.1 ND ND ― 0.1 ND ND NDDichloromethane 0.2mg/ℓ 0.2 ND ND ND 0.2 ND ND ND 0.02 ND ND ND ― ― ― ― ― ― ― ― 0.2 ND ND ― 0.2 ND ND ND1,1,1-trichloroethane 3mg/ℓ 3 ND ND ND 3 ND ND ND 1 ND ND ND ― ― ― ― 3 ND ND ND 3 ND ND ― 3 ND ND ND
* Regulated values are in accordance with the Water Pollution Control Law, Sewerage Law and local regulations.
* ND (“not detected”) indicates a value below the lower limit of detection.
* ND is considered to be the lower limit of detection when calculating the average.
* Other items are con�rmed to be below the regulated value.
* Data for the Kanazawa Plant include data for the Kanazawa Dai-ichi and Dai-ni Plant.
* Data for the Osaka Plant include data for the Rokko Plant.
* Data for the Shonan Plant include data for KELK Ltd.(excluding GIGAPHOTON, Inc)
Environmental Report Digest 201625

Overview
Manufacturing facility Awazu Plant (established in 1938) Kanazawa Plant (established in 2007) Osaka Plant (established in 1952) Ibaraki Plant (established in 2007) Oyama Plant (established in 1962) Koriyama Plant (established in 1994) Shonan Plant (established in 1966)
Location Komatsu, Ishikawa Prefecture Kanazawa, Ishikawa Prefecture Hirakata, Osaka Prefecture Hitachinaka, Ibaraki Prefecture Oyama, Tochigi Prefecture Koriyama, Fukushima Prefecture Hiratsuka, Kanagawa Prefecture
Main products
Small and medium-sized bulldozers, small hydraulic excavators, small and medium-sized wheel loaders, motor graders, armored vehi-cles, etc.
Ultra-large hydraulic excavators, large presses, medium presses
Large bulldozers, medium-and large-sized hydraulic excavators, mobile crushers/recy-clers/tub grinders (crushers, soil stabilizers, tub grinders, etc.)
Large wheel loaders, dump trucksEngines for construction/industrial machinery, diesel generators, hydraulic equipment, axle, excimer lasers, etc.
Hydraulic cylinders, swivel joints, gear pumps
Control equipment for construction and min-ing equipment, hybrid components Thermoelectric modules, temperature control equipment, etc.
Site/Green Landscape (1,000 m2) 700/85 134/30 575/80 350/71 591/126 297/153 69/14
Number of employees 2,926 646 2,614 862 3,170 425 1,015
Date of ISO14001 certi�cation acquisition September 1997 May 2007 July 1997 May 2007 May 1997 July 2002 March 2000*The number of employees includes those working for Komatsu af�liates on the premises.*The number of employees as of the end of March 2016.
Majo
r Perfo
rmance
Environmental impact* Refer to the Data on Environmental Impact Resulting from Business Activities for details on the methods used to calculate amounts.
* Total emissions of waste are expressed as a composite of the amount recycled (excluding valuables) and the amount disposed.
* Recycling rate is calculated by dividing the amount recycled (including valuables) by the amount generated (including valuables).
* Total emissions of BOD and COD are calcu-lated by multiplying the average concentration by the amount of wastewater.
Item Actual value Item Actual value Item Actual value Item Actual value Item Actual value Item Actual value Item Actual valueTotal CO2 emissions 30,838 t-CO2 Total CO2 emissions 1,407 t-CO2 Total CO2 emissions 22,509 t-CO2 Total CO2 emissions 3,402 t-CO2 Total CO2 emissions 41,683 t-CO2 Total CO2 emissions 7,752 t-CO2 Total CO2 emissions 3,547 t-CO2
NOx total amount 75,907 kg NOx total amount ― kg NOx total amount 1,685 kg NOx total amount 606 kg NOx total amount 22,182 kg NOx total amount 41,322 kg NOx total amount ― kgSOx total amount 4,804 kg SOx total amount 0 kg SOx total amount 0 kg SOx total amount 2 kg SOx total amount 18 kg SOx total amount 1,696 kg SOx total amount 0 kgTotal emissions of waste 1,380 t Total emissions of waste 110 t Total emissions of waste 1,077 t Total emissions of waste 321 t Total emissions of waste 1,545 t Total emissions of waste 790 t Total emissions of waste 145 tAmount recycled 1,379 t Amount recycled 110 t Amount recycled 1,075 t Amount recycled 321 t Amount recycled 1,545 t Amount recycled 790 t Amount recycled 145 tRecycling rate 99.9% Recycling rate 100% Recycling rate 99.9% Recycling rate 100% Recycling rate 100% Recycling rate 100% Recycling rate 100%BOD emissions 1,055 kg BOD emissions 38 kg BOD emissions 459 kg BOD emissions 2,831 kg BOD emissions 2,108 kg BOD emissions 53 kg BOD emissions 1,883 kgCOD emissions 1,804 kg COD emissions 124 kg COD emissions 1,196 kg COD emissions ― kg COD emissions 3,023 kg COD emissions 152 kg COD emissions ― kgWastewater 599,417 m3 Wastewater 34,965 m3 Wastewater 181,011 m3 Wastewater 23,262 m3 Wastewater 356,300 m3 Wastewater 11,851 m3 Wastewater 35,093 m3
Output of in-house power generation 14,590 MWh Output of in-house
power generation 623 MWh Output of in-house power generation 4,800 MWh Output of in-house
power generation 641 MWh Output of in-house power generation 9,063 MWh Output of in-house
power generation 4,386 MWh Output of in-house power generation 258 MWh
Energy consumption* The heat energy conversion factor is cal-culated in keeping with Greenhouse Gas Emissions Calculation - Reporting Manual, which is based on the act on Promotion of Global Warming Countermeasures.
Item Actual consumption
Converted to calorie equivalents (GJ) Item Actual
consumptionConverted to calorie
equivalents (GJ) Item Actual consumption
Converted to calorie equivalents (GJ) Item Actual
consumptionConverted to calorie
equivalents (GJ) Item Actual consumption
Converted to calorie equivalents (GJ) Item Actual
consumptionConverted to calorie
equivalents (GJ) Item Actual consumption
Converted to calorie equivalents (GJ)
Electricity 39,289 MWh 381,996 Electricity 3,616 MWh 35,256 Electricity 38,025 MWh 369,263 Electricity 6,238 MWh 60,860 Electricity 56,307 MWh 548,675 Electricity 8,807 MWh 85,124 Electricity 8,671 MWh 85,532Heavy oil A 4,029 kℓ 157,543 Heavy oil A 0 kℓ 0 Heavy oil A 52 kℓ 2,029 Heavy oil A 0 kℓ 0 Heavy oil A 33 kℓ 1,286 Heavy oil A 1,084 kℓ 42,384 Heavy oil A 0 kℓ 0Kerosene 12 kℓ 430 Kerosene 0 kℓ 0 Kerosene 8 kℓ 296 Kerosene 2 kℓ 57 Kerosene 1,402 kℓ 51,457 Kerosene 0 kℓ 0 Kerosene 0 kℓ 0Light oil 413 kℓ 15,760 Light oil 1 kℓ 33 Light oil 430 kℓ 16,439 Light oil 353 kℓ 13,495 Light oil 4,243 kℓ 162,086 Light oil 6 kℓ 232 Light oil 35 kℓ 1,345Town gas 0 Nkm3 0 Town gas 0 Nkm3 0 Town gas 3,234 Nkm3 135,519 Town gas 0 Nkm3 0 Town gas 2,620 Nkm3 109,757 Town gas 0 Nkm3 0 Town gas 63 Nkm3 2,636LPG 1,208 t 60,647 LPG 5 t 273 LPG 34 t 1,719 LPG 26 t 1,302 LPG 34 t 1,692 LPG 469 t 23,534 LPG 0 t 0Other 1,454 Other 0 Other 1,153 Other 0 Other 785 Other 5 156 Other 0Total 617,830 Total 35,562 Total 526,417 Total 75,713 Total 875,739 Total 151,430 Total 89,513
Water consumption
Item Actual value Item Actual value Item Actual value Item Actual value Item Actual value Item Actual value Item Actual valueGroundwater 404,300 m3 Groundwater 27,922 m3 Groundwater 21,934 m3 Groundwater 0 m3 Groundwater 395,100 m3 Groundwater 0 m3 Groundwater 0 m3
Industrial water 0 m3 Industrial water 0 m3 Industrial water 0 m3 Industrial water 0 m3 Industrial water 0 m3 Industrial water 2,736 m3 Industrial water 0 m3
Supply water 81,549 m3 Supply water 7,043 m3 Supply water 94,942 m3 Supply water 23,212 m3 Supply water 1,672 m3 Supply water 19,140 m3 Supply water 35,093 m3
Total 485,849 m3 Total 34,965 m3 Total 116,876 m3 Total 23,212 m3 Total 396,772 m3 Total 21,876 m3 Total 35,093 m3
Co
mp
liance Co
nditio
ns to M
ajor R
egulatio
ns
Air Item Unit Facility Regulated
valueActual value Facility Regulated
valueActual value Facility Regulated
valueActual value Facility Regulated
valueActual value Facility Regulated
valueActual value Facility Regulated
valueActual value Facility Regulated
valueActual value
Nitrogen oxides (NOx) ppm Boiler 180 100 N/A ― ― Boiler 150 23 Diesel engine 100 63* Diesel engine 950 940 Cogeneration engine 760 652 N/A ― ―ppm Diesel engine 950 760 Metal furnace 180 56 Gas turbine 70 15ppm Paint drying furnace 230 13ppm Gas engine 600 21
Sulfur oxides (SOx) ― K-value regulation 17.5 2.53 K-value regulation 9 0.05 K-value regulation 7.0 0.38 K-value regulation 11.5 0.76Soot and dust g/m3N Boiler 0.3 0.054 N/A ― ― Boiler 0.05 0.002 Diesel engine 0.1 0.014 Diesel engine 0.1 0.03 Cogeneration engine 0.1 0.036 N/A ― ―
g/m3N Diesel engine 0.1 0.034 Metal furnace 0.1 0.024 Gas turbine 0.05 0.001g/m3N Paint drying furnace 0.1 0.005g/m3N
*Regulated values are in accordance with the Air Pollution Control Law and local regulations.
Wastew
ater
Item
Regulated value according to the Water Pollution
Control Law
Regulated value
Actual valueRegulated
value
Actual valueRegulated
value
Actual value Regulatedvalue
(Sewage Water Law)
Actual valueRegulated
value
Actual valueRegulated
value
Actual value Regulatedvalue
(Sewage Water Law)
Actual value
Maximum Minimum Average Maximum Minimum Average Maximum Minimum Average Maximum Minimum Average Maximum Minimum Average Maximum Minimum Average Maximum Minimum Average
pH 5.8~8.6 5.8~8.6 7.2 6.4 6.7 5.0~9.0 8.2 6.4 7.1 5.8~8.6 7.5 7 7.2 5~9 8.9 7.8 8.5 5.8~8.6 7.3 7 7.2 5.8~8.6 7.4 6.9 7.2 5~9 8.6 7.4 8.0BOD (Biochemical oxygen demand) 160mg/ℓ 80 2.3 ND 1.3 80 1.6 1.1 1.4 35 11 ND 2.5 600 210 42 122 25 18 1.2 5.9 40 10 1.1 4.5 600 170 1 34
COD (Chemical Oxygen Demand) 160mg/ℓ 80 5.1 ND 2.5 80 9 1.1 3.2 35 11 3.6 6.6 ― ― ― ― 25 13.6 3 8.5 40 19 5.9 12.8 ― ― ― ―
Suspended solids (SS) 200mg/ℓ 120 3.0 ND 1.5 120 4.2 2.0 3.0 70 7 ND 2.4 600 440 24 187 50 23 2.4 8.1 70 6.6 2.5 4.0 600 190 ND 25Mineral oils 5mg/ℓ 5 ND ND ND 5 ND ND ND 5 ND ND ND 5 ND ND ND 5 ND ND ND 1 0.7 ND 0.5 5 ND ND NDCopper 3mg/ℓ 3 ND ND ND 3 ND ND ND 3 ND ND ND ― ― ― ― 3 0.2 ND 0.1 2 ND ND ― 3 0.05 ND 0.05Zinc 2mg/ℓ 2 0.17 ND 0.09 2 1.5 1.1 1.3 2 ND ND ND ― ― ― ― 2 0.1 ND 0.1 2 0.05 0.05 ― 2 0.32 ND 0.13Nitrogen 120mg/ℓ 120 3.9 1.6 3.0 120 0.2 0.04 0.1 120 37 5.4 17.9 ― ― ― ― 20 9.9 1.1 5.1 120 8.2 8.2 ― ― ― ― ―Phosphorus 16mg/ℓ 16 0.31 0.01 0.13 16 4.8 0.03 2.4 16 0.16 0.02 0.07 ― ― ― ― 2 0.4 0.1 0.3 16 2.4 2.4 ― ― ― ― ―Cadmium 0.03mg/ℓ 0.03 ND ND ND 0.03 ND ND ND 0.003 ND ND ND ― ― ― ― 0.03 ND ND ND 0.03 ND ND ― 0.03 ND ND NDLead 0.1mg/ℓ 0.1 ND ND ND 0.1 ND ND ND 0.01 ND ND ND ― ― ― ― 0.1 ND ND ND 0.1 ND ND ND 0.1 ND ND NDChromium (VI) 0.5mg/ℓ 0.5 ND ND ND 0.5 ND ND ND 0.05 ND ND ND ― ― ― ― 0.1 ND ND ND 0.2 ND ND ND 0.5 ND ND NDTrichloroethylene 0.1mg/ℓ 0.1 ND ND ND 0.1 ND ND ND 0.01 ND ND ND ― ― ― ― 0.1 ND ND ND 0.1 ND ND ― 0.1 ND ND NDTetrachloroethylene 0.1mg/ℓ 0.1 ND ND ND 0.1 ND ND ND 0.01 ND ND ND ― ― ― ― 0.1 ND ND ND 0.1 ND ND ― 0.1 ND ND NDDichloromethane 0.2mg/ℓ 0.2 ND ND ND 0.2 ND ND ND 0.02 ND ND ND ― ― ― ― ― ― ― ― 0.2 ND ND ― 0.2 ND ND ND1,1,1-trichloroethane 3mg/ℓ 3 ND ND ND 3 ND ND ND 1 ND ND ND ― ― ― ― 3 ND ND ND 3 ND ND ― 3 ND ND ND
* Regulated values are in accordance with the Water Pollution Control Law, Sewerage Law and local regulations.
* ND (“not detected”) indicates a value below the lower limit of detection.
* ND is considered to be the lower limit of detection when calculating the average.
* Other items are con�rmed to be below the regulated value.
* Data for the Kanazawa Plant include data for the Kanazawa Dai-ichi and Dai-ni Plant.
* Data for the Osaka Plant include data for the Rokko Plant.
* Data for the Shonan Plant include data for KELK Ltd.(excluding GIGAPHOTON, Inc)
Environmental Report Digest 2016 26
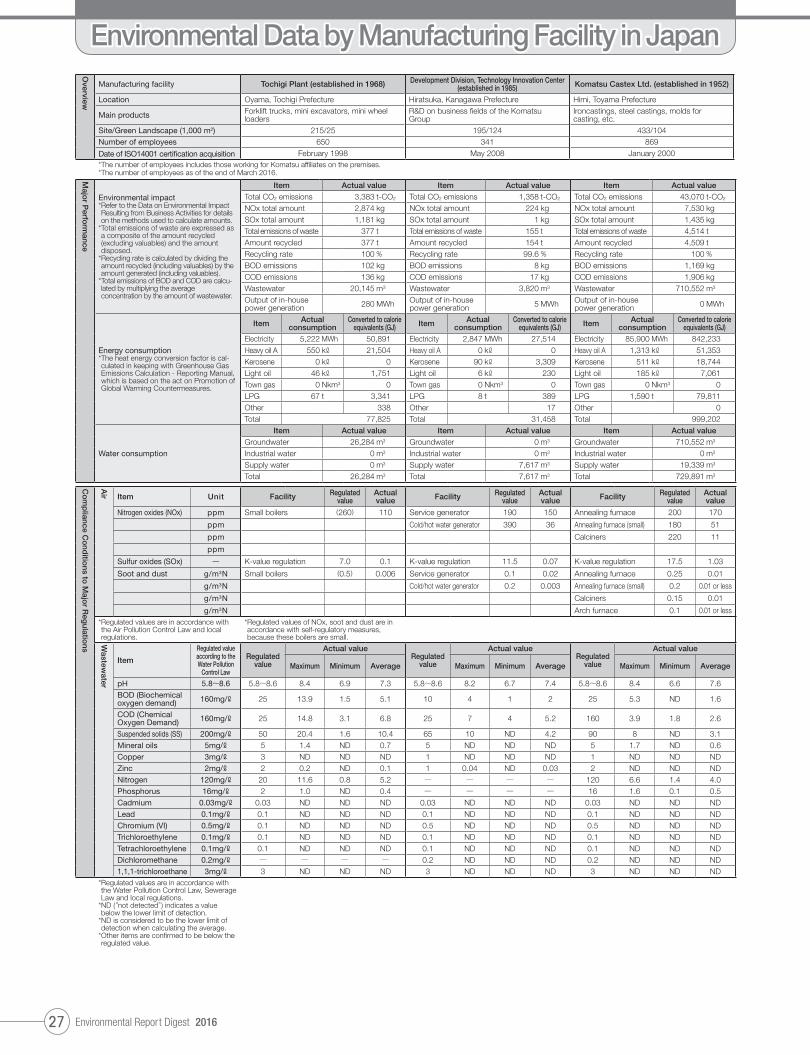
Environmental Data by Manufacturing Facility in Japan
Overview
Manufacturing facility Tochigi Plant (established in 1968) Development Division, Technology Innovation Center (established in 1985) Komatsu Castex Ltd. (established in 1952)
Location Oyama, Tochigi Prefecture Hiratsuka, Kanagawa Prefecture Himi, Toyama Prefecture
Main products Forklift trucks, mini excavators, mini wheel loaders
R&D on business �elds of the Komatsu Group
Ironcastings, steel castings, molds for casting, etc.
Site/Green Landscape (1,000 m2) 215/25 195/124 433/104Number of employees 650 341 869
Date of ISO14001 certi�cation acquisition February 1998 May 2008 January 2000* The number of employees includes those working for Komatsu af�liates on the premises.* The number of employees as of the end of March 2016.
Majo
r Perfo
rmance
Environmental impact* Refer to the Data on Environmental Impact Resulting from Business Activities for details on the methods used to calculate amounts.
* Total emissions of waste are expressed as a composite of the amount recycled (excluding valuables) and the amount disposed.
* Recycling rate is calculated by dividing the amount recycled (including valuables) by the amount generated (including valuables).
* Total emissions of BOD and COD are calcu-lated by multiplying the average concentration by the amount of wastewater.
Item Actual value Item Actual value Item Actual valueTotal CO2 emissions 3,383 t-CO2 Total CO2 emissions 1,358 t-CO2 Total CO2 emissions 43,070 t-CO2
NOx total amount 2,874 kg NOx total amount 224 kg NOx total amount 7,530 kgSOx total amount 1,181 kg SOx total amount 1 kg SOx total amount 1,435 kgTotal emissions of waste 377 t Total emissions of waste 155 t Total emissions of waste 4,514 tAmount recycled 377 t Amount recycled 154 t Amount recycled 4,509 tRecycling rate 100% Recycling rate 99.6% Recycling rate 100%BOD emissions 102 kg BOD emissions 8 kg BOD emissions 1,169 kgCOD emissions 136 kg COD emissions 17 kg COD emissions 1,906 kgWastewater 20,145 m3 Wastewater 3,820 m3 Wastewater 710,552 m3
Output of in-house power generation 280 MWh Output of in-house
power generation 5 MWh Output of in-house power generation 0 MWh
Energy consumption* The heat energy conversion factor is cal-culated in keeping with Greenhouse Gas Emissions Calculation - Reporting Manual, which is based on the act on Promotion of Global Warming Countermeasures.
Item Actual consumption
Converted to calorie equivalents (GJ) Item Actual
consumptionConverted to calorie
equivalents (GJ) Item Actual consumption
Converted to calorie equivalents (GJ)
Electricity 5,222 MWh 50,891 Electricity 2,847 MWh 27,514 Electricity 85,900 MWh 842,233Heavy oil A 550 kℓ 21,504 Heavy oil A 0 kℓ 0 Heavy oil A 1,313 kℓ 51,353Kerosene 0 kℓ 0 Kerosene 90 kℓ 3,309 Kerosene 511 kℓ 18,744Light oil 46 kℓ 1,751 Light oil 6 kℓ 230 Light oil 185 kℓ 7,061Town gas 0 Nkm3 0 Town gas 0 Nkm3 0 Town gas 0 Nkm3 0LPG 67 t 3,341 LPG 8 t 389 LPG 1,590 t 79,811Other 338 Other 17 Other 0Total 77,825 Total 31,458 Total 999,202
Water consumption
Item Actual value Item Actual value Item Actual valueGroundwater 26,284 m3 Groundwater 0 m3 Groundwater 710,552 m3
Industrial water 0 m3 Industrial water 0 m3 Industrial water 0 m3
Supply water 0 m3 Supply water 7,617 m3 Supply water 19,339 m3
Total 26,284 m3 Total 7,617 m3 Total 729,891 m3
Co
mp
liance Co
nditio
ns to M
ajor R
egulatio
ns
Air Item Unit Facility Regulated
valueActualvalue Facility Regulated
valueActualvalue Facility Regulated
valueActualvalue
Nitrogen oxides (NOx) ppm Small boilers (260) 110 Service generator 190 150 Annealing furnace 200 170
ppm Cold/hot water generator 390 36 Annealing furnace (small) 180 51
ppm Calciners 220 11
ppm
Sulfur oxides (SOx) ― K-value regulation 7.0 0.1 K-value regulation 11.5 0.07 K-value regulation 17.5 1.03
Soot and dust g/m3N Small boilers (0.5) 0.006 Service generator 0.1 0.02 Annealing furnace 0.25 0.01
g/m3N Cold/hot water generator 0.2 0.003 Annealing furnace (small) 0.2 0.01 or less
g/m3N Calciners 0.15 0.01
g/m3N Arch furnace 0.1 0.01 or less* Regulated values are in accordance with the Air Pollution Control Law and local regulations.
* Regulated values of NOx, soot and dust are in accordance with self-regulatory measures, because these boilers are small.
Wastew
ater
Item
Regulated value according to the Water Pollution
Control Law
Regulatedvalue
Actual valueRegulated
value
Actual valueRegulated
value
Actual value
Maximum Minimum Average Maximum Minimum Average Maximum Minimum Average
pH 5.8~8.6 5.8~8.6 8.4 6.9 7.3 5.8~8.6 8.2 6.7 7.4 5.8~8.6 8.4 6.6 7.6BOD (Biochemical oxygen demand) 160mg/ℓ 25 13.9 1.5 5.1 10 4 1 2 25 5.3 ND 1.6
COD (Chemical Oxygen Demand) 160mg/ℓ 25 14.8 3.1 6.8 25 7 4 5.2 160 3.9 1.8 2.6
Suspended solids (SS) 200mg/ℓ 50 20.4 1.6 10.4 65 10 ND 4.2 90 8 ND 3.1Mineral oils 5mg/ℓ 5 1.4 ND 0.7 5 ND ND ND 5 1.7 ND 0.6Copper 3mg/ℓ 3 ND ND ND 1 ND ND ND 1 ND ND NDZinc 2mg/ℓ 2 0.2 ND 0.1 1 0.04 ND 0.03 2 ND ND NDNitrogen 120mg/ℓ 20 11.6 0.8 5.2 ― ― ― ― 120 6.6 1.4 4.0Phosphorus 16mg/ℓ 2 1.0 ND 0.4 ― ― ― ― 16 1.6 0.1 0.5Cadmium 0.03mg/ℓ 0.03 ND ND ND 0.03 ND ND ND 0.03 ND ND NDLead 0.1mg/ℓ 0.1 ND ND ND 0.1 ND ND ND 0.1 ND ND NDChromium (VI) 0.5mg/ℓ 0.1 ND ND ND 0.5 ND ND ND 0.5 ND ND NDTrichloroethylene 0.1mg/ℓ 0.1 ND ND ND 0.1 ND ND ND 0.1 ND ND NDTetrachloroethylene 0.1mg/ℓ 0.1 ND ND ND 0.1 ND ND ND 0.1 ND ND NDDichloromethane 0.2mg/ℓ ― ― ― ― 0.2 ND ND ND 0.2 ND ND ND1,1,1-trichloroethane 3mg/ℓ 3 ND ND ND 3 ND ND ND 3 ND ND ND
* Regulated values are in accordance with the Water Pollution Control Law, Sewerage Law and local regulations.
* ND (“not detected”) indicates a value below the lower limit of detection.
* ND is considered to be the lower limit of detection when calculating the average.
* Other items are con�rmed to be below the regulated value.
Environmental Report Digest 201627
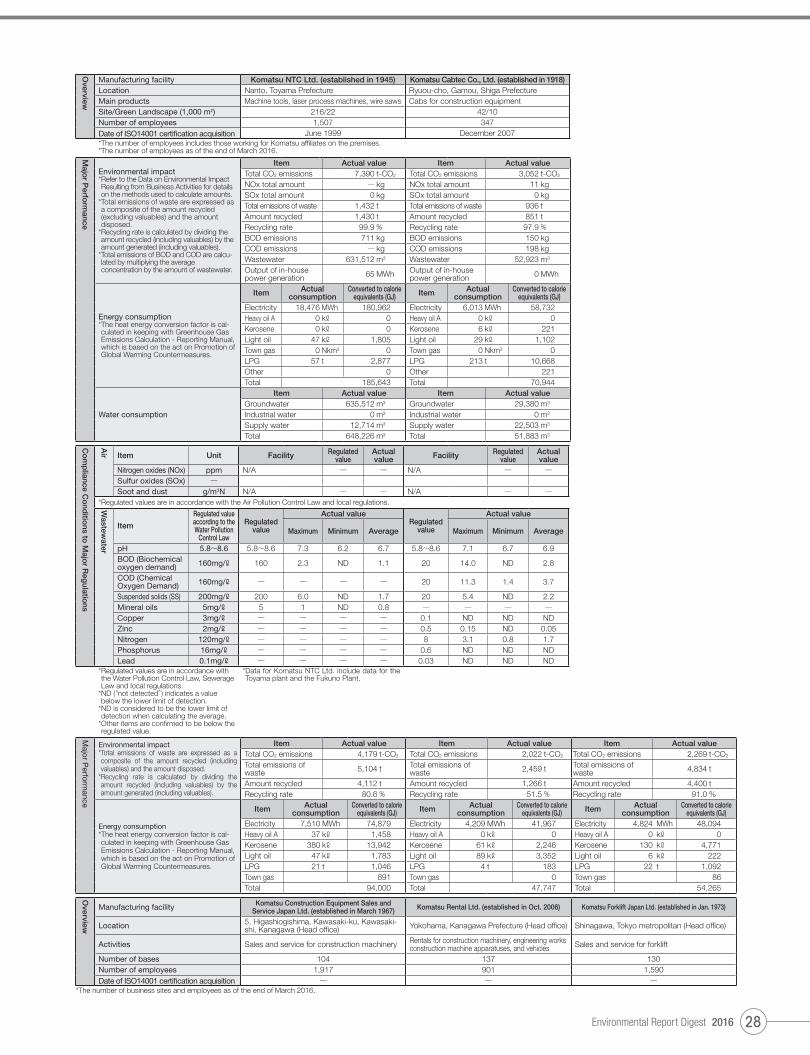
Major P
erformance
Environmental impact* Total emissions of waste are expressed as a composite of the amount recycled (including valuables) and the amount disposed.
* Recycling rate is calculated by dividing the amount recycled (including valuables) by the amount generated (including valuables).
Item Actual value Item Actual value Item Actual valueTotal CO2 emissions 4,179 t-CO2 Total CO2 emissions 2,022 t-CO2 Total CO2 emissions 2,269 t-CO2
Total emissions of waste 5,104 t Total emissions of
waste 2,459 t Total emissions of waste 4,834 t
Amount recycled 4,112 t Amount recycled 1,266 t Amount recycled 4,400 tRecycling rate 80.6% Recycling rate 51.5% Recycling rate 91.0 %
Energy consumption* The heat energy conversion factor is cal-culated in keeping with Greenhouse Gas Emissions Calculation - Reporting Manual, which is based on the act on Promotion of Global Warming Countermeasures.
Item Actual consumption
Converted to calorie equivalents (GJ) Item Actual
consumptionConverted to calorie
equivalents (GJ) Item Actual consumption
Converted to calorie equivalents (GJ)
Electricity 7,510 MWh 74,879 Electricity 4,209 MWh 41,967 Electricity 4,824 MWh 48,094Heavy oil A 37 kℓ 1,458 Heavy oil A 0 kℓ 0 Heavy oil A 0 kℓ 0Kerosene 380 kℓ 13,942 Kerosene 61 kℓ 2,246 Kerosene 130 kℓ 4,771Light oil 47 kℓ 1,783 Light oil 89 kℓ 3,352 Light oil 6 kℓ 222LPG 21 t 1,046 LPG 4 t 183 LPG 22 t 1,092Town gas 891 Town gas 0 Town gas 86Total 94,000 Total 47,747 Total 54,265
Overview
Manufacturing facility Komatsu NTC Ltd. (established in 1945) Komatsu Cabtec Co., Ltd. (established in 1918)Location Nanto, Toyama Prefecture Ryuou-cho, Gamou, Shiga PrefectureMain products Machine tools, laser process machines, wire saws Cabs for construction equipmentSite/Green Landscape (1,000 m2) 216/22 42/10Number of employees 1,507 347Date of ISO14001 certi�cation acquisition June 1999 December 2007* The number of employees includes those working for Komatsu af�liates on the premises.* The number of employees as of the end of March 2016.
Majo
r Perfo
rmance
Environmental impact* Refer to the Data on Environmental Impact Resulting from Business Activities for details on the methods used to calculate amounts.
* Total emissions of waste are expressed as a composite of the amount recycled (excluding valuables) and the amount disposed.
* Recycling rate is calculated by dividing the amount recycled (including valuables) by the amount generated (including valuables).
* Total emissions of BOD and COD are calcu-lated by multiplying the average concentration by the amount of wastewater.
Item Actual value Item Actual valueTotal CO2 emissions 7,390 t-CO2 Total CO2 emissions 3,052 t-CO2
NOx total amount ― kg NOx total amount 11 kgSOx total amount 0 kg SOx total amount 0 kgTotal emissions of waste 1,432 t Total emissions of waste 936 tAmount recycled 1,430 t Amount recycled 851 tRecycling rate 99.9% Recycling rate 97.9%BOD emissions 711 kg BOD emissions 150 kgCOD emissions ― kg COD emissions 198 kgWastewater 631,512 m3 Wastewater 52,923 m3
Output of in-house power generation 65 MWh Output of in-house
power generation 0 MWh
Energy consumption* The heat energy conversion factor is cal-culated in keeping with Greenhouse Gas Emissions Calculation - Reporting Manual, which is based on the act on Promotion of Global Warming Countermeasures.
Item Actual consumption
Converted to calorie equivalents (GJ) Item Actual
consumptionConverted to calorie
equivalents (GJ)Electricity 18,476 MWh 180,962 Electricity 6,013 MWh 58,732Heavy oil A 0 kℓ 0 Heavy oil A 0 kℓ 0Kerosene 0 kℓ 0 Kerosene 6 kℓ 221Light oil 47 kℓ 1,805 Light oil 29 kℓ 1,102Town gas 0 Nkm3 0 Town gas 0 Nkm3 0LPG 57 t 2,877 LPG 213 t 10,668Other 0 Other 221Total 185,643 Total 70,944
Water consumption
Item Actual value Item Actual valueGroundwater 635,512 m3 Groundwater 29,380 m3
Industrial water 0 m3 Industrial water 0 m3
Supply water 12,714 m3 Supply water 22,503 m3
Total 648,226 m3 Total 51,883 m3
Co
mp
liance Co
nditio
ns to M
ajor R
egulatio
ns
Air Item Unit Facility Regulated
valueActualvalue Facility Regulated
valueActualvalue
Nitrogen oxides (NOx) ppm N/A ― ― N/A ― ―Sulfur oxides (SOx) ―Soot and dust g/m3N N/A ― ― N/A ― ―
*Regulated values are in accordance with the Air Pollution Control Law and local regulations.
Wastew
ater
Item
Regulated valueaccording to the Water Pollution
Control Law
Regulatedvalue
Actual valueRegulated
value
Actual value
Maximum Minimum Average Maximum Minimum Average
pH 5.8~8.6 5.8~8.6 7.3 6.2 6.7 5.8~8.6 7.1 6.7 6.9BOD (Biochemical oxygen demand) 160mg/ℓ 160 2.3 ND 1.1 20 14.0 ND 2.8
COD (Chemical Oxygen Demand) 160mg/ℓ ― ― ― ― 20 11.3 1.4 3.7
Suspended solids (SS) 200mg/ℓ 200 6.0 ND 1.7 20 5.4 ND 2.2Mineral oils 5mg/ℓ 5 1 ND 0.8 ― ― ― ―Copper 3mg/ℓ ― ― ― ― 0.1 ND ND NDZinc 2mg/ℓ ― ― ― ― 0.5 0.15 ND 0.05Nitrogen 120mg/ℓ ― ― ― ― 8 3.1 0.8 1.7Phosphorus 16mg/ℓ ― ― ― ― 0.6 ND ND NDLead 0.1mg/ℓ ― ― ― ― 0.03 ND ND ND
* Regulated values are in accordance with the Water Pollution Control Law, Sewerage Law and local regulations.
* ND (“not detected”) indicates a value below the lower limit of detection.
* ND is considered to be the lower limit of detection when calculating the average.
* Other items are con�rmed to be below the regulated value.
* Data for Komatsu NTC Ltd. include data for the Toyama plant and the Fukuno Plant.
Overview
Manufacturing facility Komatsu Construction Equipment Sales and Service Japan Ltd. (established in March 1967) Komatsu Rental Ltd. (established in Oct. 2006) Komatsu Forklift Japan Ltd. (established in Jan. 1973)
Location 5, Higashiogishima, Kawasaki-ku, Kawasaki-shi, Kanagawa (Head of�ce) Yokohama, Kanagawa Prefecture (Head of�ce) Shinagawa, Tokyo metropolitan (Head of�ce)
Activities Sales and service for construction machinery Rentals for construction machinery, engineering works construction machine apparatuses, and vehicles Sales and service for forklift
Number of bases 104 137 130Number of employees 1,917 901 1,590Date of ISO14001 certi�cation acquisition ― ― ―
*The number of business sites and employees as of the end of March 2016.
Environmental Report Digest 2016 28

Environmental Data by Manufacturing Facility outside Japan
Asia
Overview Manufacturing facilities
KCCM KCF KSD KUCC
Komatsu (Changzhou) Construction Machinery Corp.
Komatsu (Changzhou) Foundry Corp.
Komatsu (Shandong) Construction Machinery Corp.
Komatsu Undercarriage China Corp.
Location Jiangsu, China Jiangsu, China Shandong, China Shandong, China
Main productsWheel loaders, hydraulic excavators
Iron castings and foundry molds for construction and casting parts
Mini construction equipment, hydraulic equip-ment and casting parts
Crawler type for construction machinery
Number of employees 529 244 1,134
Energy consum
ption
Electricity (MWh) 5,317 14,623 19,562 23,754
Heavy oil, light oil, et al. (kℓ) 117 37 173 44.2
Natural gas (thousand m3) ― ― ― ―
LPG, et al. (t) 86(LNG)
1,276(LPG・LNG・Steam)
3,959(LNG・Steam)
807(LNG)
Total energy consumption (GJ) 62,131 155,054 251,924 282,343
CO2 (t-CO2) 4,664 11,836 17,572 20,493
Water consumption (t) 36,700 38,485 126,859 79,033
Total emissions of waste (t) 404 5,287 1,849 3,360
Date of ISO14001 certi�cation acquisition September 2000 December 1999 September 2013 December 2011
The Americas Europe
Overview Manufacturing facilities
CMO PMO NMO KDB Hensley KUK KOHAG KMG
Komatsu America Corp.Komatsu do Brasil Ltda.
HensleyIndustries, Inc. Komatsu UK Ltd. Komatsu
Hanomag GmbHKomatsu Mining Germany GmbH
Chattanooga Manufacturing Operation
Peoria Manufacturing Operation
Newberry Manufacturing Operation
Location Tennessee, U.S.A. Illinois, U.S.A. South Carolina,
U.S.A. São Paulo, Brazil Texas, U.S.A. Birtley, United Kingdom
Hannover, Germany
Düsseldorf, Germany
Main productsHydraulic exca-vators, motor graders
Large wheel load-ers, large dump trucks
Utility equipment (small construc-tion equipment)
Hydraulic exca-vators, bulldozers
Buckets, teeth and edges
Hydraulic excavators Wheel loaders
Ultra-large hydraulic excavators
Number of employees 1,640 844 410 318 500 626
Energy consum
ption
Electricity (MWh) 8,061 12,920* 2,381 15,448 22,845 5,120 5,305 5,641
Heavy oil, light oil, et al. (kℓ) ― 66 ― 78 63 64 ― 36
Natural gas (thousand m3) 125 1,389 34 0 2,146 788 836 937
LPG, et al. (t) ― 21(LPG) ― 20
(LPG)68
(LPG) ― 2,235*(District heating)
14(LPG)
Total energy consumption (GJ) 85,123 185,025 25,012 175,910 314,898 95,771 86,347 91,865
CO2 (t-CO2) 4,845 3,000 1,424 2,249 17,661 4,267 4,068 4,287
Water consumption (t) 16,746 15,489 1,980 17,164 25,324 10,187 11,071 6,895
Total emissions of waste (t) 1,097 1,760 31 3,821 15,100 1,302 1,604 2,185
Date of ISO14001 certi�cation acquisition April 1998 March 2002 March 2004 January 2002 November 2009 December 1998 September 2000 July 2002
* Electricity of a renew-able source is used.
*Unit:MWh
Europe Asia
Overview
Manufacturing facilities
KIM KFAB KMR KI KUI BKC KIPL KSC
Komatsu Italia Manufacturing S.p.A
Komatsu Forest AB
Komatsu Manufacturing Rus, LLC
PT Komatsu Indonesia Tbk
PT Komatsu Undercarriage Indonesia
Bangkok Komatsu Co., Ltd.
Komatsu India Pvt.
Komatsu Shantui Construction Machinery Co., Ltd.
Location Este (PD), Italy Umeå, Sweden Yaroslavl, Russia Jakarta, Indonesia West Java, Indonesia Chonburi, Thailand Chennai, India Shandong, China
Main productsUtility equipment (small construc-tion equipment)
Forestry equipment
Hydraulic excavators
Hydraulic exca-vators, bulldozers, wheel loaders
Components for construction equipment, crawler type for construction machinery, pins
Hydraulic exca-vators, castiron parts
Dump trucks Hydraulic excavators
Number of employees 329 579 229 1,043 742 784 339 678
Energy consum
ption
Electricity (MWh) 3,032 2,541 2,764 15,712 35,570 20,925 3,023 3,612
Heavy oil, light oil, et al. (kℓ) ― 29 26 212 436 128 293 26
Natural gas (thousand m3) 390 ― 966 1,041 513 ― ― ―
LPG, et al. (t) ― 1,978*(District heating) ― 150
(LPG)234
(LPG)151
(LPG) ― 5,808(LNG・Steam)
Total energy consumption (GJ) 45,196 29,487 68,101 214,507 404,236 221,152 41,447 62,162
CO2 (t-CO2) 2,028 287 2,891 13,943 27,552 11,983 3,600 3,525
Water consumption (t) 11,612 3,825 9,447 45,261 56,266 32,454 32,117 58,305
Total emissions of waste (t) 1,118 263 793 1,508 3,583 2,582 195 345
Date of ISO14001 certi�cation acquisition November 2001 October 2003 January 2014 June 2000 October 2008 September 2001 January 2010 December 2000
*Unit:MWh
Notes 1. All data, except the number of employees, were derived from performances of all manufacturing facilities during FY2015. The number of employees was based on the companies’ data as of March 31, 2016.
2. Conversion to CO2 and total energy consumption were based on statistical data of each region, country, and that of IEA for 2015. 3. Total emissions of waste are expressed as a composite of the amount recycled and the amount disposed.
Environmental Report Digest 201629

Environmental Education and Environmental AccountingCourses in Environmental Education and Training in Japan (excluding general environmental courses)
Komatsu and Komatsu Group manufacturing facilities in Japan (including the Research Division, Field Testing Department)
Organizer No. Course name TargetParticipants
FY2012 FY2013 FY2014 FY2015
Head Of�ce
1 Advanced environmental education (held every two years) Environmental specialists (Komatsu and af�liates) ― 19 ― 21
2 Overview of the ISO14000 series Managers (Komatsu, af�liates, and business associates) 72 80 53 ―
3 ISO14001 Standards Amendment (2015 Revision) Stakeholders regarding ISO14001 amandment ― ― ― 281
4 Training of internal auditors / Refresher courses Environmental auditors (Komatsu, af�liates, and busi-ness associates) 380 177 35 ―
5 Development and manufacturing (introductory) Development and manufacturing staff (for second-year employees) 248 300 341 334
6 Environmental training for manufacturing engineers
Assistant foremen/ foremen/ manufacturing engineers/ stu-dents of Komatsu Institute of Technology 160 152 242 252
7 Training new employees New Employees (Komatsu and af�liates) 354 391 261 333
8 Lectures on the environment, experience-oriented education Komatsu Group employees 1,316 1,408 1,527 2,729
9 Education to refresh environmental understanding (e-Learning) Komatsu Group managers and employees 153 193 154 181
10 Newly appointed manager training Komatsu Group newly appointed managers ― ― 155 168
Divisions overseeing environmental management at plants
1 Education in the basics of auditing Managers and employees 221 257 100 1852 Overview of the ISO14000 series Managers and employees 183 645 1,464 9963 Training of internal auditors Environmental auditors 38 16 38 284 Training new employees New Employees 940 1,107 700 1,6185 Regulatory education and personnel exchange Employees (and other participants) 1,066 3,274 1,245 467
6 Specialist training Environmental conservation practitioners (persons involved in regulatory affairs, etc.) 2,561 616 355 428
In addition to the education and training courses listed above, Komatsu also held courses dealing with environmental issues intended for sales agents.
Environmental Costs (Investments and expenses)Komatsu and Komatsu Group manufacturing facilities in Japan (excluding Komatsu House Ltd., including Technology Innovation Center)
Category
Investment ExpensesFY2014 FY2015 FY2014 FY2015
Investment*1
(millions of yen)Investment*1
(millions of yen) Contents Expenses*1
(millions of yen)Expenses*1
(millions of yen) Contents
1. Business area cost 1,297 1,586 2,858 2,603① Pollution prevention cost
365 235
● Investment for installation and conver-sion of pollution mitigation/prevention facilities installation of air pollution con-trol equipment, etc.
730 673
● Cost of maintaining equipment for mitigation/pre-vention of air and water pollution and for noise and vibration prevention (labor and depreciation costs)
② Global environmental conser-vation cost
899 1,164
● Investment for implementing energy conservation measures installation of energy-saving air conditioners, heat-treating furnace energy saving facilities, etc.
1,348 1,106● Cost of maintaining energy conservation facilities,
such as cogeneration systems (labor and depreci-ation costs)
③ Resource circulation cost 33 187 ● Investment for reducing the volume of waste materials (recycling facilities, etc.) 780 825 ● Waste material processing cost
2. Upstream/downstream cost 9 9 ● Additional investment needed to pro-vide eco-friendly product services 152 288 ● Reduction of the environmental impact of
mass-production units
3. Administration cost 91 25 ● Investment for beautifying manufactur-ing sites 787 731
● Cost of maintaining environmental management systems
● Cost of creating green spaces and beautifying manufacturing sites
4. R&D cost 303 281 ● Investment in research facilities for reduction of environmental impact 21,513 21,514
● Cost of R&D activities to reduce the environmental impact of products
● Cost of R&D activities to develop environmental-ly-friendly construction equipment
5. Social activity cost 0 0 13 10
6. Environmental remediation cost 0 0 253 123
● Cost of conducting surveys and remedial counter-measures related to soil and groundwater contamination
● PCB disposal costsTotal 1,699 1,901 25,576 25,270
*1: All �gures are rounded off to the nearest million yen.
Effects on Society*1
Environmental impact reduction effects Tangible bene�ts● Environmental impact reduction resulting
from on-site recycling methods● Environmental impact reduction resulting
from product operation● Waste components reduction resulting
from “Reman” business
● Reduction of expenses for processing waste materials
● Savings in operating and maintenance costs
● Reduction of repair costs
*1: Concerning the effects on society derived from product use by customers, the major items of qualitative information are shown here as a reference.
Number of Persons Having Environment-related Certi�cateKomatsu and Komatsu Group manufacturing facilities in Japan (including the Research Division, Field Testing Department)
Certi�cate nameNumber of persons with certi�cate*
FY2012 FY2013 FY2014 FY2015Pollution control administrators 230(33) 241(33) 249(33) 247(31)Energy administrators 45(10) 45(10) 50(10) 41(9)Environmental management system auditors 4 5 4 4
*Figures in parentheses indicate the number of of�cers required.
Environmental EffectsKomatsu and Komatsu Group manufacturing facilities in Japan
(excluding Komatsu House Ltd., including Technology Innovation Center)
Environmental impact reduction effectsItems of envi-
ronmental impact
Reduction amount(t/year)
Rate of year-on-year
changes (%)CO2 emissions -22,680 -11.9Water consumption -420,422 -14.0Waste materials generation -2,504 -16.4
Komatsu and Komatsu Group manufacturing facilities in Japan (excluding Komatsu House Ltd., including Technology Innovation Center)
Economic bene�tsTangible bene�ts
Avoidance bene�ts of environmental risks*2 Contribution to pro�ts*2
Type Monetary value*1
(millions of yen) Major activities
Energy conservation 511 ● Energy conversion, etc.● In FY2015, there were
no major accidents or legal infractions that would contaminate the environment.
● No litigation costs were required in Japan during FY2015.
● Proceeds from mobile recycling equipment
● Proceeds from value added due to reduced environmental impact of products (engines)
Resource conservation 3Waste materials reduction 533 ● Promotion of recycling through thor-
oughgoing sortingGain on sale of valuables 213 ● Reuse of furnace slag for roadbed
materialsOther 2Total 1,262
*1: Figures are rounded off to the nearest million yen.*2: Komatsu used statements instead of numeral �gures to describe the “Avoidance bene�ts of environmental risks” and the “Contribution to pro�ts.” The company will further develop concepts and ways to
understand effects in these categories. The sales amounts of businesses for content presented in “Contributions to pro�ts” in FY2015 are as follows:● Mobile recycling equipment business: 15billion yen● Engine business: 1,220 billion yen (Total for intra-Group sales from the Engine Business Division)
Environmental Report Digest 2016 30

Komatsu Ltd.Environmental Affairs Department2-3-6, Akasaka, Minato-ku, Tokyo107-8414, Japanhttp://www.komatsu.com/CompanyInfo/csr/
Komatsu welcomes your comments. E-mail: [email protected]
Environmental Affairs Department TEL: +81-3-5561-2646 FAX: +81-3-5561-2780
HEER160916
Environmental Report Digest2016