2016 population estimates villages and townships by · pdf filebalance of geneva township...
TRANSCRIPT

Research Office A State Affiliate of the U.S. Census Bureau
2016 Population Estimates: Cities, Villages and Townships by County May, 2017

The following report contains the 2016 Subcounty Resident Population Estimates produced by the U.S. Census Bureau. The estimates are produced annually and reflect the population on July 1, 2016 and adjustments to prior years.
Subcounty areas consist of incorporated places, such as cities and villages, and townships. The subcounty areas are geographically updated by the Census Bureau each year to reflect legal boundary changes reported in the Bureaus’ Boundary and Annexation Survey. This subcounty estimates report reflects the governmental hierarchy as reported to the Census Bureau by the local governmental entities.
The subcounty estimates are created by developing population estimates for households and group quarters separately then combining them to calculate the resident population. These numbers are controlled to the current published county-level estimate. The county-level estimates are created using an administrative record based component of change method which updates the latest census figure using data on births, deaths and migration.
In Ohio, all three of the subcounty areas – cities, villages, and townships can cross county boundaries, which are reflected in the individual county pages. For example, the city of Columbus is reported in Franklin, Delaware and Fairfield Counties, while the total population of the city is reported in 2016 Population Estimates – Whole Places. Also, there are three townships, Canaan, Fairfield, and Perry, with published counts in multiple counties as reported to the Census Bureau. These are identified in the individual county footnotes.
For a more detailed methodology, visit the U.S. Census Bureaus’ site.
https://www.census.gov/programs-surveys/popest/technical-documentation/methodology.html

Adams County2016 Population Estimates For Cities, Villages, and Townships
Estimates Average AnnualEstimate Estimate Base Rate of Change
Name 7/1/16 7/1/15 4/1/10 (a) From 2010 (b)
Adams County 27,907 28,016 28,554 -0.4%
Cherry Fork village 155 156 156 -0.1%Manchester village 1,978 1,984 2,023 -0.4%Peebles village 1,753 1,760 1,795 -0.4%Rome village 94 94 94 0.0%Seaman village 910 913 930 -0.3%West Union village 3,180 3,191 3,249 -0.3%Winchester village 1,028 1,032 1,044 -0.2%Balance of Adams County 18,809 18,886 19,263 -0.4%
Bratton township 1,408 1,415 1,453 -0.5%Brush Creek township 1,185 1,191 1,222 -0.5%Franklin township 1,101 1,106 1,129 -0.4%Green township 631 634 651 -0.5% Rome village 94 94 94 0.0% Balance of Green township 537 540 557 -0.6%Jefferson township 1,019 1,024 1,048 -0.4%Liberty township 1,915 1,923 1,965 -0.4% West Union village (pt.) 2 2 2 0.0% Balance of Liberty township 1,913 1,921 1,963 -0.4%Manchester township 2,007 2,013 2,052 -0.4% Manchester village (pt.) 1,975 1,981 2,020 -0.4% Balance of Manchester township 32 32 32 0.0%Meigs township 3,829 3,844 3,918 -0.4% Peebles village 1,753 1,760 1,795 -0.4% Balance of Meigs township 2,076 2,084 2,123 -0.4%Monroe township 665 668 686 -0.5%Oliver township 1,293 1,298 1,318 -0.3%Scott township 2,128 2,135 2,178 -0.4% Seaman village (pt.) 901 904 921 -0.4% Balance of Scott township 1,227 1,231 1,257 -0.4%Sprigg township 1,824 1,831 1,871 -0.4% Manchester village (pt.) 3 3 3 0.0% Balance of Sprigg township 1,821 1,828 1,868 -0.4%Tiffin township 5,431 5,452 5,556 -0.4% West Union village (pt.) 3,178 3,189 3,247 -0.3% Balance of Tiffin township 2,253 2,263 2,309 -0.4%Wayne township 1,309 1,312 1,308 0.0% Cherry Fork village 155 156 156 -0.1% Seaman village (pt.) 9 9 9 0.0% Balance of Wayne township 1,145 1,147 1,143 0.0%Winchester township 2,162 2,170 2,199 -0.3% Winchester village 1,028 1,032 1,044 -0.2% Balance of Winchester township 1,134 1,138 1,155 -0.3%
n.a. - Could not calculate. Division by zero.
(a) Used for calculating average annual rate of change. (b) Average annual rate of change from April 1, 2010 to July 1, 2016.
Source: Population Estimates Division, U.S. Census Bureau. Prepared by: Office of Research, Ohio Development Services Agency.
Population

Allen County2016 Population Estimates For Cities, Villages, and Townships
Estimates Average AnnualEstimate Estimate Base Rate of Change
Name 7/1/16 7/1/15 4/1/10 (a) From 2010 (b)
Allen County 103,742 104,210 106,326 -0.4%
Beaverdam village 374 373 385 -0.5%Bluffton village (pt.) 4,012 4,019 4,031 -0.1% Also located in Hancock CountyCairo village 532 537 552 -0.6%Delphos city (pt.) 3,928 3,950 3,936 0.0% Also located in Van Wert CountyElida village 1,842 1,849 1,882 -0.3%Harrod village 412 414 419 -0.3%Lafayette village 416 421 439 -0.9%Lima city 37,414 37,599 38,639 -0.5%Spencerville village 2,190 2,206 2,225 -0.3%Balance of Allen County 52,622 52,842 53,818 -0.4%
Amanda township 2,073 2,063 2,079 0.0%American township 14,095 14,150 14,407 -0.3% Elida village 1,842 1,849 1,882 -0.3% Balance of American township 12,253 12,301 12,525 -0.4%Auglaize township 2,693 2,711 2,783 -0.5% Harrod village 412 414 419 -0.3% Balance of Auglaize township 2,281 2,297 2,364 -0.6%Bath township 9,516 9,574 9,805 -0.5%Jackson township 2,931 2,956 3,057 -0.7% Lafayette village 416 421 439 -0.9% Balance of Jackson township 2,515 2,535 2,618 -0.6%Lima city 37,414 37,599 38,639 -0.5%Marion township 6,823 6,823 6,705 0.3% Delphos city (pt.) 3,928 3,950 3,936 0.0% Balance of Marion township 2,895 2,873 2,769 0.7%Monroe township 2,140 2,159 2,226 -0.6% Cairo village 532 537 552 -0.6% Balance of Monroe township 1,608 1,622 1,674 -0.6%Perry township 3,424 3,445 3,540 -0.5%Richland township 6,245 6,253 6,288 -0.1% Beaverdam village 374 373 385 -0.5% Bluffton village (pt.) 4,012 4,019 4,031 -0.1% Balance of Richland township 1,859 1,861 1,872 -0.1%Shawnee township 12,144 12,202 12,449 -0.4%Spencer township 3,006 3,028 3,067 -0.3% Spencerville village 2,190 2,206 2,225 -0.3% Balance of Spencer township 816 822 842 -0.5%Sugar Creek township 1,238 1,247 1,281 -0.5%
n.a. - Could not calculate. Division by zero.
(a) Used for calculating average annual rate of change. (b) Average annual rate of change from April 1, 2010 to July 1, 2016.
Source: Population Estimates Division, U.S. Census Bureau. Prepared by: Office of Research, Ohio Development Services Agency.
Population

Ashland County2016 Population Estimates For Cities, Villages, and Townships
Estimates Average AnnualEstimate Estimate Base Rate of Change
Name 7/1/16 7/1/15 4/1/10 (a) From 2010 (b)
Ashland County 53,652 53,380 53,139 0.2%
Ashland city 20,489 20,377 20,363 0.1%Bailey Lakes village 375 375 373 0.1%Hayesville village 470 465 451 0.7%Jeromesville village 550 552 561 -0.3%Loudonville village (pt.) 2,582 2,577 2,589 0.0% Also located in Holmes CountyMifflin village 139 139 138 0.1%Perrysville village 725 726 728 -0.1%Polk village 341 340 336 0.2%Savannah village 409 408 412 -0.1%Balance of Ashland County 27,572 27,421 27,188 0.2%
Ashland city 20,489 20,377 20,363 0.1%Clear Creek township 2,333 2,320 2,277 0.4% Bailey Lakes village 375 375 373 0.1% Savannah village 409 408 412 -0.1% Balance of Clear Creek township 1,549 1,537 1,492 0.6%Green township 3,638 3,624 3,624 0.1% Loudonville village (pt.) 1,079 1,077 1,081 0.0% Perrysville village 725 726 728 -0.1% Balance of Green township 1,834 1,821 1,815 0.2%Hanover township 2,354 2,351 2,377 -0.2% Loudonville village (pt.) 1,503 1,500 1,508 -0.1% Balance of Hanover township 851 851 869 -0.3%Jackson township 3,965 3,949 3,890 0.3% Polk village 341 340 336 0.2% Balance of Jackson township 3,624 3,609 3,554 0.3%Lake township 708 701 690 0.4%Mifflin township 1,161 1,157 1,136 0.3% Mifflin village 139 139 138 0.1% Balance of Mifflin township 1,022 1,018 998 0.4%Milton township 2,416 2,400 2,368 0.3%Mohican township 2,009 2,010 2,033 -0.2% Jeromesville village 550 552 561 -0.3% Balance of Mohican township 1,459 1,458 1,472 -0.1%Montgomery township 2,714 2,696 2,696 0.1%Orange township 2,566 2,540 2,523 0.3%Perry township 1,988 1,987 1,990 0.0%Ruggles township 948 935 905 0.7%Sullivan township 2,554 2,541 2,513 0.3%Troy township 1,125 1,125 1,132 -0.1%Vermillion township 2,684 2,667 2,622 0.4% Hayesville village 470 465 451 0.7% Balance of Vermillion township 2,214 2,202 2,171 0.3%
n.a. - Could not calculate. Division by zero.
(a) Used for calculating average annual rate of change. (b) Average annual rate of change from April 1, 2010 to July 1, 2016.
Source: Population Estimates Division, U.S. Census Bureau. Prepared by: Office of Research, Ohio Development Services Agency.
Population

Ashtabula County2016 Population Estimates For Cities, Villages, and Townships
Estimates Average AnnualEstimate Estimate Base Rate of Change
Name 7/1/16 7/1/15 4/1/10 (a) From 2010 (b)
Ashtabula County 98,231 98,544 101,488 -0.5%
Andover village 1,114 1,117 1,143 -0.4%Ashtabula city 18,311 18,404 19,125 -0.7%Conneaut city 12,708 12,722 12,836 -0.2%Geneva city 6,016 6,033 6,207 -0.5%Geneva-on-the-Lake village 1,206 1,211 1,254 -0.6%Jefferson village 3,023 3,032 3,116 -0.5%North Kingsville village 2,828 2,837 2,918 -0.5%Orwell village 1,601 1,605 1,659 -0.6%Roaming Shores village 1,472 1,475 1,508 -0.4%Rock Creek village 517 519 533 -0.5%Balance of Ashtabula County 49,435 49,589 51,189 -0.6%
Andover township 2,653 2,661 2,740 -0.5% Andover village 1,114 1,117 1,143 -0.4% Balance of Andover township 1,539 1,544 1,597 -0.6%Ashtabula township 20,032 20,133 20,939 -0.7% Ashtabula city (pt.) 14,586 14,669 15,287 -0.7% Balance of Ashtabula township 5,446 5,464 5,652 -0.6%Austinburg township 2,131 2,137 2,192 -0.5%Cherry Valley township 917 920 955 -0.6%Colebrook township 952 955 992 -0.7%Conneaut city 12,708 12,722 12,836 -0.2%Denmark township 913 916 951 -0.7%Dorset township 816 819 848 -0.6%Geneva township 10,719 10,754 11,100 -0.6% Geneva city 6,016 6,033 6,207 -0.5% Geneva-on-the-Lake village 1,206 1,211 1,254 -0.6% Balance of Geneva township 3,497 3,510 3,639 -0.6%Harpersfield township 2,609 2,617 2,697 -0.5%Hartsgrove township 1,550 1,555 1,597 -0.5%Jefferson township 5,097 5,113 5,253 -0.5% Jefferson village 3,023 3,032 3,116 -0.5% Balance of Jefferson township 2,074 2,081 2,137 -0.5%Kingsville township 1,722 1,726 1,777 -0.5%Lenox township 1,397 1,401 1,449 -0.6%Monroe township 2,286 2,293 2,378 -0.6%Morgan township 2,109 2,116 2,171 -0.5% Roaming Shores village (pt.) 614 616 631 -0.4% Rock Creek village 517 519 533 -0.5% Balance of Morgan township 978 981 1,007 -0.5%New Lyme township 1,074 1,077 1,116 -0.6%North Kingsville village 2,828 2,837 2,918 -0.5%Orwell township 2,998 3,006 3,107 -0.6% Orwell village 1,601 1,605 1,659 -0.6% Balance of Orwell township 1,397 1,401 1,448 -0.6%Pierpont township 1,242 1,246 1,290 -0.6%Plymouth township 1,898 1,903 1,955 -0.5%Richmond township 898 901 936 -0.7%
Continued
Population

Ashtabula County2016 Population Estimates For Cities, Villages, and Townships
Estimates Average AnnualEstimate Estimate Base Rate of Change
Name 7/1/16 7/1/15 4/1/10 (a) From 2010 (b)
Rome township 1,767 1,770 1,813 -0.4% Roaming Shores village (pt.) 858 859 877 -0.3% Balance of Rome township 909 911 936 -0.5%Saybrook township 9,577 9,604 9,874 -0.5% Ashtabula city (pt.) 3,725 3,735 3,838 -0.5% Balance of Saybrook township 5,852 5,869 6,036 -0.5%Sheffield township 1,587 1,592 1,640 -0.5%Trumbull township 1,368 1,372 1,409 -0.5%Wayne township 600 601 630 -0.8%Williamsfield township 1,576 1,583 1,645 -0.7%Windsor township 2,207 2,214 2,280 -0.5%
n.a. - Could not calculate. Division by zero.
(a) Used for calculating average annual rate of change. (b) Average annual rate of change from April 1, 2010 to July 1, 2016.
Source: Population Estimates Division, U.S. Census Bureau. Prepared by: Office of Research, Ohio Development Services Agency.
Population

Athens County2016 Population Estimates For Cities, Villages, and Townships
Estimates Average AnnualEstimate Estimate Base Rate of Change
Name 7/1/16 7/1/15 4/1/10 (a) From 2010 (b)
Athens County 66,186 65,699 64,772 0.3%
Albany village 891 886 844 0.9%Amesville village 157 157 156 0.1%Athens city 25,341 24,920 23,838 1.0%Buchtel village (pt.) 538 540 542 -0.1% Also located in Hocking CountyChauncey village 1,036 1,037 1,038 0.0%Coolville village 492 493 494 -0.1%Glouster village 1,793 1,795 1,793 0.0%Jacksonville village 482 484 484 -0.1%Nelsonville city 5,299 5,193 5,394 -0.3%Trimble village 395 397 401 -0.2%Balance of Athens County 29,762 29,797 29,788 0.0%
Alexander township 2,817 2,820 2,814 0.0% Albany village (pt.) 24 24 22 1.4% Balance of Alexander township 2,793 2,796 2,792 0.0%Ames township 1,194 1,195 1,188 0.1% Amesville village 157 157 156 0.1% Balance of Ames township 1,037 1,038 1,032 0.1%Athens township 31,976 31,564 30,466 0.8% Athens city (pt.) 25,046 24,628 23,548 1.0% Balance of Athens township 6,930 6,936 6,918 0.0%Bern township 568 569 569 0.0%Canaan township 1,679 1,677 1,672 0.1% Athens city (pt.) 295 292 290 0.3% Balance of Canaan township 1,384 1,385 1,382 0.0%Carthage township 1,514 1,517 1,525 -0.1%Dover township 3,611 3,615 3,612 0.0% Chauncey village 1,036 1,037 1,038 0.0% Balance of Dover township 2,575 2,578 2,574 0.0%Lee township 2,771 2,768 2,720 0.3% Albany village (pt.) 867 862 822 0.9% Balance of Lee township 1,904 1,906 1,898 0.1%Lodi township 1,430 1,431 1,428 0.0%Rome township 1,315 1,318 1,324 -0.1%Trimble township 4,478 4,486 4,494 -0.1% Glouster village 1,793 1,795 1,793 0.0% Jacksonville village 482 484 484 -0.1% Trimble village 395 397 401 -0.2% Balance of Trimble township 1,808 1,810 1,816 -0.1%Troy township 2,599 2,603 2,618 -0.1% Coolville village 492 493 494 -0.1% Balance of Troy township 2,107 2,110 2,124 -0.1%Waterloo township 2,573 2,577 2,580 0.0%York township 7,661 7,559 7,762 -0.2% Buchtel village (pt.) 538 540 542 -0.1% Nelsonville city 5,299 5,193 5,394 -0.3% Balance of York township 1,824 1,826 1,826 0.0%
n.a. - Could not calculate. Division by zero.
(a) Used for calculating average annual rate of change. (b) Average annual rate of change from April 1, 2010 to July 1, 2016.
Source: Population Estimates Division, U.S. Census Bureau. Prepared by: Office of Research, Ohio Development Services Agency.
Population

Auglaize County2016 Population Estimates For Cities, Villages, and Townships
Estimates Average AnnualEstimate Estimate Base Rate of Change
Name 7/1/16 7/1/15 4/1/10 (a) From 2010 (b)
Auglaize County 45,894 45,847 45,949 0.0%
Buckland village 231 231 233 -0.1%Cridersville village 1,818 1,826 1,852 -0.3%Minster village 2,857 2,842 2,807 0.3%New Bremen village 2,968 2,961 2,978 -0.1%New Knoxville village 866 866 879 -0.2%St. Marys city 8,230 8,260 8,332 -0.2%Uniopolis village 220 220 222 -0.1%Wapakoneta city 9,816 9,815 9,867 -0.1%Waynesfield village 834 829 847 -0.2%Balance of Auglaize County 18,054 17,997 17,932 0.1%
Clay township 812 816 817 -0.1%Duchouquet township 14,409 14,412 14,499 -0.1% Cridersville village 1,818 1,826 1,852 -0.3% Wapakoneta city (pt.) 9,721 9,719 9,771 -0.1% Balance of Duchouquet township 2,870 2,867 2,876 0.0%German township 3,731 3,726 3,748 -0.1% New Bremen village (pt.) 2,894 2,887 2,903 0.0% Balance of German township 837 839 845 -0.2%Goshen township 593 552 529 1.8%Jackson township 3,715 3,699 3,649 0.3% Minster village 2,857 2,842 2,807 0.3% New Bremen village (pt.) 74 74 75 -0.2% Balance of Jackson township 784 783 767 0.4%Logan township 1,115 1,114 1,113 0.0% Buckland village 231 231 233 -0.1% Balance of Logan township 884 883 880 0.1%Moulton township 1,699 1,700 1,694 0.0% Wapakoneta city (pt.) 40 40 40 0.0% Balance of Moulton township 1,659 1,660 1,654 0.0%Noble township 1,718 1,709 1,716 0.0% St. Marys city (pt.) 509 510 511 -0.1% Balance of Noble township 1,209 1,199 1,205 0.1%Pusheta township 1,328 1,335 1,301 0.3% Wapakoneta city (pt.) 55 56 56 -0.3% Balance of Pusheta township 1,273 1,279 1,245 0.4%St. Marys township 10,874 10,900 11,015 -0.2% St. Marys city (pt.) 7,721 7,750 7,821 -0.2% Balance of St. Marys township 3,153 3,150 3,194 -0.2%Salem township 489 490 498 -0.3%Union township 1,915 1,911 1,902 0.1% Uniopolis village 220 220 222 -0.1% Balance of Union township 1,695 1,691 1,680 0.1%Washington township 1,854 1,856 1,874 -0.2% New Knoxville village 866 866 879 -0.2% Balance of Washington township 988 990 995 -0.1%Wayne township 1,642 1,627 1,594 0.5% Waynesfield village 834 829 847 -0.2% Balance of Wayne township 808 798 747 1.3%
n.a. - Could not calculate. Division by zero.
(a) Used for calculating average annual rate of change. (b) Average annual rate of change from April 1, 2010 to July 1, 2016.
Source: Population Estimates Division, U.S. Census Bureau. Prepared by: Office of Research, Ohio Development Services Agency.
Population

Belmont County2016 Population Estimates For Cities, Villages, and Townships
Estimates Average AnnualEstimate Estimate Base Rate of Change
Name 7/1/16 7/1/15 4/1/10 (a) From 2010 (b)
Belmont County 68,673 69,039 70,402 -0.4%
Barnesville village 4,111 4,133 4,203 -0.4%Bellaire village 4,170 4,184 4,275 -0.4%Belmont village 442 444 451 -0.3%Bethesda village 1,241 1,246 1,257 -0.2%Bridgeport village 1,791 1,798 1,839 -0.4%Brookside village 597 599 614 -0.4%Fairview village (pt.) 0 0 0 n.a. Also located in Guernsey CountyFlushing village 861 864 881 -0.4%Holloway village 323 325 336 -0.6%Martins Ferry city 6,756 6,782 6,912 -0.4%Morristown village 297 299 301 -0.2%Powhatan Point village 1,566 1,572 1,592 -0.3%St. Clairsville city 5,109 5,111 5,187 -0.2%Shadyside village 3,662 3,676 3,746 -0.4%Wilson village (pt.) 37 37 37 0.0% Also located in Monroe CountyYorkville village (pt.) 451 452 464 -0.5% Also located in Jefferson CountyBalance of Belmont County 37,259 37,517 38,307 -0.4%
Colerain township 4,164 4,192 4,279 -0.4%Flushing township 1,964 1,974 2,016 -0.4% Flushing village 861 864 881 -0.4% Holloway village 323 325 336 -0.6% Balance of Flushing township 780 785 799 -0.4%Goshen township 3,065 3,080 3,132 -0.3% Belmont village 442 444 451 -0.3% Bethesda village 1,241 1,246 1,257 -0.2% Balance of Goshen township 1,382 1,390 1,424 -0.5%Kirkwood township 380 384 396 -0.7% Fairview village (pt.) 0 0 0 n.a. Balance of Kirkwood township 380 384 396 -0.7%Mead township 5,823 5,852 5,976 -0.4% Shadyside village (pt.) 3,624 3,637 3,707 -0.4% Balance of Mead township 2,199 2,215 2,269 -0.5%Pease township 13,936 14,002 14,304 -0.4% Bridgeport village 1,791 1,798 1,839 -0.4% Brookside village 597 599 614 -0.4% Martins Ferry city 6,756 6,782 6,912 -0.4% Yorkville village (pt.) 451 452 464 -0.5% Balance of Pease township 4,341 4,371 4,475 -0.5%Pultney township 8,566 8,610 8,791 -0.4% Bellaire village 4,170 4,184 4,275 -0.4% Shadyside village (pt.) 38 39 39 -0.4% Balance of Pultney township 4,358 4,387 4,477 -0.4%Richland township 14,696 14,766 14,975 -0.3% St. Clairsville city 5,109 5,111 5,187 -0.2% Balance of Richland township 9,587 9,655 9,788 -0.3%
Continued
Population

Belmont County2016 Population Estimates For Cities, Villages, and Townships
Estimates Average AnnualEstimate Estimate Base Rate of Change
Name 7/1/16 7/1/15 4/1/10 (a) From 2010 (b)
Smith township 1,480 1,491 1,538 -0.6%Somerset township 1,202 1,211 1,245 -0.6%Union township 2,224 2,239 2,292 -0.5% Morristown village 297 299 301 -0.2% Balance of Union township 1,927 1,940 1,991 -0.5%Warren township 5,854 5,888 5,996 -0.4% Barnesville village 4,111 4,133 4,203 -0.4% Balance of Warren township 1,743 1,755 1,793 -0.5%Washington township 501 505 517 -0.5%Wayne township 690 694 709 -0.4% Wilson village (pt.) 37 37 37 0.0% Balance of Wayne township 653 657 672 -0.5%Wheeling township 1,641 1,652 1,698 -0.5%York township 2,487 2,499 2,538 -0.3% Powhatan Point village 1,566 1,572 1,592 -0.3% Balance of York township 921 927 946 -0.4%
n.a. - Could not calculate. Division by zero.
(a) Used for calculating average annual rate of change. (b) Average annual rate of change from April 1, 2010 to July 1, 2016.
Source: Population Estimates Division, U.S. Census Bureau. Prepared by: Office of Research, Ohio Development Services Agency.
Population

Brown County2016 Population Estimates For Cities, Villages, and Townships
Estimates Average AnnualEstimate Estimate Base Rate of Change
Name 7/1/16 7/1/15 4/1/10 (a) From 2010 (b)
Brown County 43,759 43,825 44,843 -0.4%
Aberdeen village 1,602 1,604 1,638 -0.4%Fayetteville village 324 324 330 -0.3%Georgetown village 4,376 4,395 4,493 -0.4%Hamersville village 520 523 546 -0.8%Higginsport village 244 244 251 -0.5%Mount Orab village 3,548 3,562 3,693 -0.6%Ripley village 1,713 1,714 1,749 -0.3%Russellville village 528 531 554 -0.8%Sardinia village (pt.) 952 953 982 -0.5% Also located in Highland CountyBalance of Brown County 29,952 29,975 30,607 -0.3%
Byrd township 717 719 739 -0.5%Clark township 3,032 3,038 3,121 -0.5% Hamersville village 520 523 546 -0.8% Balance of Clark township 2,512 2,515 2,575 -0.4%Eagle township 1,315 1,316 1,344 -0.3%Franklin township 1,630 1,630 1,654 -0.2% Georgetown village (pt.) 3 3 3 0.0% Balance of Franklin township 1,627 1,627 1,651 -0.2%Green township 3,516 3,527 3,645 -0.6% Mount Orab village (pt.) 1,691 1,701 1,780 -0.8% Balance of Green township 1,825 1,826 1,865 -0.3%Huntington township 2,685 2,690 2,761 -0.4% Aberdeen village 1,602 1,604 1,638 -0.4% Balance of Huntington township 1,083 1,086 1,123 -0.6%Jackson township 1,549 1,550 1,576 -0.3%Jefferson township 1,386 1,389 1,434 -0.5% Russellville village 528 531 554 -0.8% Balance of Jefferson township 858 858 880 -0.4%Lewis township 2,633 2,635 2,697 -0.4% Higginsport village 244 244 251 -0.5% Balance of Lewis township 2,389 2,391 2,446 -0.4%Perry township 4,648 4,649 4,728 -0.3% Fayetteville village 324 324 330 -0.3% Balance of Perry township 4,324 4,325 4,398 -0.3%Pike township 4,125 4,131 4,244 -0.5% Mount Orab village (pt.) 1,222 1,227 1,275 -0.7% Balance of Pike township 2,903 2,904 2,969 -0.4%Pleasant township 5,604 5,623 5,745 -0.4% Georgetown village (pt.) 4,373 4,392 4,490 -0.4% Balance of Pleasant township 1,231 1,231 1,255 -0.3%Scott township 1,275 1,276 1,298 -0.3%Sterling township 4,333 4,337 4,435 -0.4% Mount Orab village (pt.) 635 634 638 -0.1% Balance of Sterling township 3,698 3,703 3,797 -0.4%
Continued
Population

Brown County2016 Population Estimates For Cities, Villages, and Townships
Estimates Average AnnualEstimate Estimate Base Rate of Change
Name 7/1/16 7/1/15 4/1/10 (a) From 2010 (b)
Union township 3,013 3,015 3,068 -0.3% Ripley village 1,713 1,714 1,749 -0.3% Balance of Union township 1,300 1,301 1,319 -0.2%Washington township 2,298 2,300 2,354 -0.4% Sardinia village (pt.) 952 953 982 -0.5% Balance of Washington township 1,346 1,347 1,372 -0.3%
n.a. - Could not calculate. Division by zero.
(a) Used for calculating average annual rate of change. (b) Average annual rate of change from April 1, 2010 to July 1, 2016.
Source: Population Estimates Division, U.S. Census Bureau. Prepared by: Office of Research, Ohio Development Services Agency.
Population

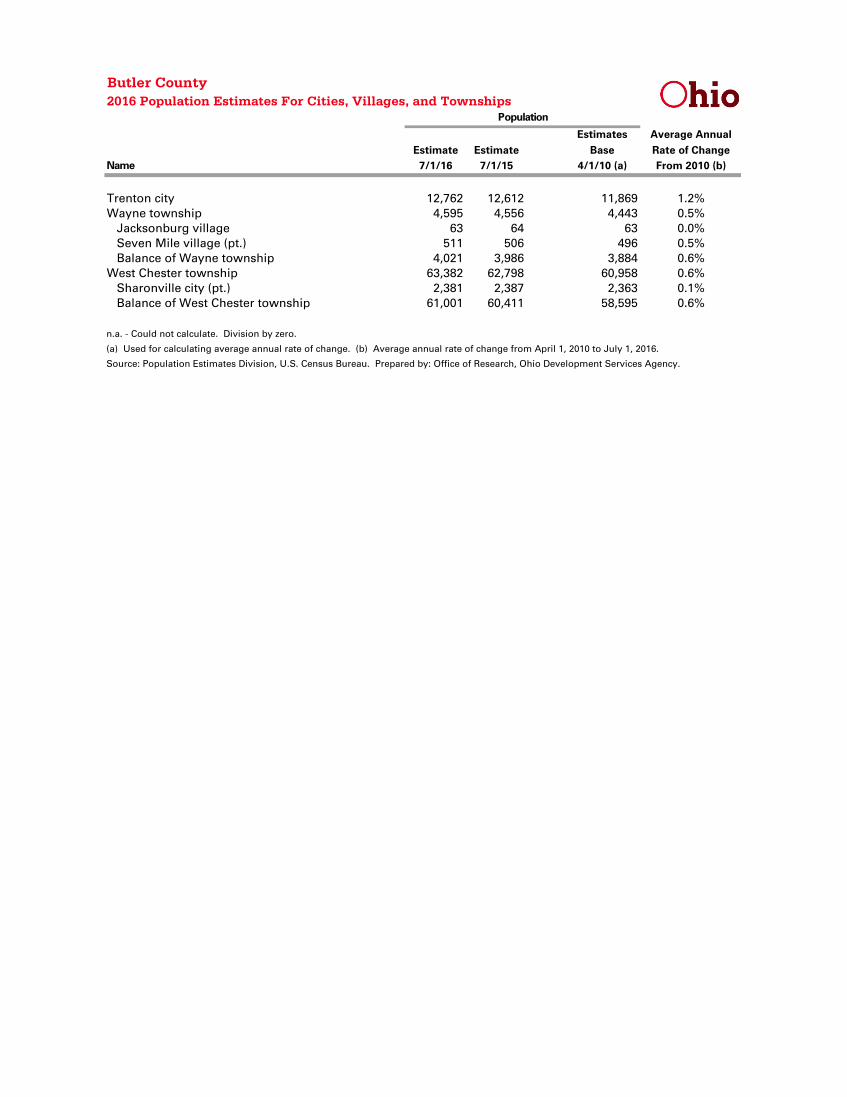
Butler County2016 Population Estimates For Cities, Villages, and Townships
Estimates Average AnnualEstimate Estimate Base Rate of Change
Name 7/1/16 7/1/15 4/1/10 (a) From 2010 (b)
Butler County 377,537 375,459 368,135 0.4%
College Corner village (pt.) 196 194 191 0.4% Also located in Preble CountyFairfield city (pt.) 42,617 42,672 42,508 0.0% Also located in Hamilton CountyHamilton city 62,127 62,262 62,272 0.0%Jacksonburg village 63 64 63 0.0%Middletown city (pt.) 46,064 45,953 45,994 0.0% Also located in Warren CountyMillville village 725 720 708 0.4%Monroe city (pt.) 13,331 13,221 12,322 1.3% Also located in Warren CountyNew Miami village 2,321 2,302 2,249 0.5%Oxford city 22,341 22,075 21,377 0.7%Seven Mile village 772 765 751 0.4%Sharonville city (pt.) 2,381 2,387 2,363 0.1% Also located in Hamilton CountySomerville village 283 283 281 0.1%Trenton city 12,762 12,612 11,869 1.2%Balance of Butler County 171,554 169,949 165,187 0.6%
Fairfield city (pt.) 42,617 42,672 42,508 0.0%Fairfield township 22,386 22,175 21,526 0.6%Hamilton city 62,127 62,262 62,272 0.0%Hanover township 8,580 8,506 8,296 0.5% Millville village (pt.) 184 184 183 0.1% Balance of Hanover township 8,396 8,322 8,113 0.6%Lemon township 14,856 14,736 13,875 1.1% Monroe city (pt.) 12,499 12,396 11,557 1.3% Balance of Lemon township 2,357 2,340 2,318 0.3%Liberty township 38,813 38,438 37,259 0.7% Monroe city (pt.) 832 825 765 1.4% Balance of Liberty township 37,981 37,613 36,494 0.6%Madison township 8,715 8,640 8,448 0.5%Middletown city (pt.) 46,064 45,953 45,994 0.0%Milford township 3,670 3,641 3,550 0.5% Somerville village 283 283 281 0.1% Balance of Milford township 3,387 3,358 3,269 0.6%Morgan township 5,698 5,648 5,515 0.5%Oxford township 24,706 24,418 23,661 0.7% College Corner village (pt.) 196 194 191 0.4% Oxford city 22,341 22,075 21,377 0.7% Balance of Oxford township 2,169 2,149 2,093 0.6%Reily township 2,718 2,694 2,624 0.6%Ross township 8,707 8,628 8,406 0.6% Millville village (pt.) 541 536 525 0.5% Balance of Ross township 8,166 8,092 7,881 0.6%St. Clair township 7,141 7,082 6,931 0.5% New Miami village 2,321 2,302 2,249 0.5% Seven Mile village (pt.) 261 259 255 0.4% Balance of St. Clair township 4,559 4,521 4,427 0.5%
Continued
Population
Butler County2016 Population Estimates For Cities, Villages, and Townships
Estimates Average AnnualEstimate Estimate Base Rate of Change
Name 7/1/16 7/1/15 4/1/10 (a) From 2010 (b)
Trenton city 12,762 12,612 11,869 1.2%Wayne township 4,595 4,556 4,443 0.5% Jacksonburg village 63 64 63 0.0% Seven Mile village (pt.) 511 506 496 0.5% Balance of Wayne township 4,021 3,986 3,884 0.6%West Chester township 63,382 62,798 60,958 0.6% Sharonville city (pt.) 2,381 2,387 2,363 0.1% Balance of West Chester township 61,001 60,411 58,595 0.6%
n.a. - Could not calculate. Division by zero.
(a) Used for calculating average annual rate of change. (b) Average annual rate of change from April 1, 2010 to July 1, 2016.
Source: Population Estimates Division, U.S. Census Bureau. Prepared by: Office of Research, Ohio Development Services Agency.
Population

Carroll County2016 Population Estimates For Cities, Villages, and Townships
Estimates Average AnnualEstimate Estimate Base Rate of Change
Name 7/1/16 7/1/15 4/1/10 (a) From 2010 (b)
Carroll County 27,669 27,790 28,836 -0.7%
Carrollton village 3,135 3,149 3,247 -0.6%Dellroy village 342 343 356 -0.6%Leesville village 154 154 158 -0.4%Magnolia village (pt.) 259 260 266 -0.4% Also located in Stark CountyMalvern village 1,153 1,160 1,191 -0.5%Minerva village (pt.) 1,736 1,737 1,776 -0.4% Also located in Columbiana County Also located in Stark CountySherrodsville village 297 297 304 -0.4%Balance of Carroll County 20,593 20,690 21,538 -0.7%
Augusta township 1,549 1,557 1,619 -0.7%Brown township 7,650 7,678 7,935 -0.6% Malvern village 1,153 1,160 1,191 -0.5% Minerva village (pt.) 1,736 1,737 1,776 -0.4% Balance of Brown township 4,761 4,781 4,968 -0.7%Center township 4,487 4,508 4,664 -0.6% Carrollton village 3,135 3,149 3,247 -0.6% Balance of Center township 1,352 1,359 1,417 -0.7%East township 807 811 843 -0.7%Fox township 995 999 1,041 -0.7%Harrison township 2,374 2,384 2,478 -0.7%Lee township 1,034 1,039 1,087 -0.8%Loudon township 961 965 1,009 -0.8%Monroe township 1,989 1,998 2,072 -0.7% Dellroy village 342 343 356 -0.6% Sherrodsville village (pt.) 45 45 46 -0.4% Balance of Monroe township 1,602 1,610 1,670 -0.7%Orange township 1,290 1,293 1,339 -0.6% Leesville village 154 154 158 -0.4% Sherrodsville village (pt.) 252 252 258 -0.4% Balance of Orange township 884 887 923 -0.7%Perry township 948 953 996 -0.8%Rose township 1,470 1,479 1,537 -0.7% Magnolia village (pt.) 259 260 266 -0.4% Balance of Rose township 1,211 1,219 1,271 -0.8%Union township 931 937 977 -0.8%Washington township 1,184 1,189 1,239 -0.7%
n.a. - Could not calculate. Division by zero.
(a) Used for calculating average annual rate of change. (b) Average annual rate of change from April 1, 2010 to July 1, 2016.
Source: Population Estimates Division, U.S. Census Bureau. Prepared by: Office of Research, Ohio Development Services Agency.
Population

Champaign County2016 Population Estimates For Cities, Villages, and Townships
Estimates Average AnnualEstimate Estimate Base Rate of Change
Name 7/1/16 7/1/15 4/1/10 (a) From 2010 (b)
Champaign County 38,747 38,998 40,097 -0.5%
Christiansburg village 500 504 526 -0.8%Mechanicsburg village 1,593 1,599 1,644 -0.5%Mutual village 101 102 104 -0.5%North Lewisburg village 1,439 1,446 1,490 -0.6%St. Paris village 2,016 2,025 2,084 -0.5%Urbana city 11,425 11,551 11,863 -0.6%Woodstock village 299 301 305 -0.3%Balance of Champaign County 21,374 21,470 22,081 -0.5%
Adams township 1,068 1,073 1,110 -0.6%Concord township 1,382 1,388 1,422 -0.5%Goshen township 3,585 3,600 3,696 -0.5% Mechanicsburg village 1,593 1,599 1,644 -0.5% Balance of Goshen township 1,992 2,001 2,052 -0.5%Harrison township 907 911 932 -0.4%Jackson township 2,532 2,545 2,625 -0.6% Christiansburg village 500 504 526 -0.8% St. Paris village (pt.) 208 209 214 -0.5% Balance of Jackson township 1,824 1,832 1,885 -0.5%Johnson township 3,407 3,422 3,525 -0.5% St. Paris village (pt.) 1,808 1,816 1,870 -0.5% Balance of Johnson township 1,599 1,606 1,655 -0.5%Mad River township 2,743 2,755 2,821 -0.4%Rush township 2,535 2,547 2,613 -0.5% North Lewisburg village 1,439 1,446 1,490 -0.6% Woodstock village 299 301 305 -0.3% Balance of Rush township 797 800 818 -0.4%Salem township 2,461 2,471 2,539 -0.5% Urbana city (pt.) 150 150 154 -0.4% Balance of Salem township 2,311 2,321 2,385 -0.5%Union township 2,140 2,150 2,210 -0.5% Mutual village 101 102 104 -0.5% Balance of Union township 2,039 2,048 2,106 -0.5%Urbana township 14,239 14,380 14,795 -0.6% Urbana city (pt.) 11,275 11,401 11,709 -0.6% Balance of Urbana township 2,964 2,979 3,086 -0.6%Wayne township 1,748 1,756 1,809 -0.5%
n.a. - Could not calculate. Division by zero.
(a) Used for calculating average annual rate of change. (b) Average annual rate of change from April 1, 2010 to July 1, 2016.
Source: Population Estimates Division, U.S. Census Bureau. Prepared by: Office of Research, Ohio Development Services Agency.
Population

Clark County2016 Population Estimates For Cities, Villages, and Townships
Estimates Average AnnualEstimate Estimate Base Rate of Change
Name 7/1/16 7/1/15 4/1/10 (a) From 2010 (b)
Clark County 134,786 135,815 138,333 -0.4%
Catawba village 263 264 268 -0.3%Clifton village (pt.) 47 47 48 -0.3% Also located in Greene CountyDonnelsville village 298 300 304 -0.3%Enon village 2,386 2,400 2,415 -0.2%New Carlisle city 5,649 5,685 5,785 -0.4%North Hampton village 468 471 478 -0.3%South Charleston village 1,647 1,659 1,693 -0.4%South Vienna village 376 379 384 -0.3%Springfield city 59,087 59,618 60,608 -0.4%Tremont City village 367 370 375 -0.3%Balance of Clark County 64,198 64,622 65,975 -0.4%
Bethel township 18,015 18,136 18,512 -0.4% Donnelsville village 298 300 304 -0.3% New Carlisle city (pt.) 5,632 5,668 5,768 -0.4% Balance of Bethel township 12,085 12,168 12,440 -0.5%German township 7,239 7,293 7,487 -0.5% Tremont City village 367 370 375 -0.3% Balance of German township 6,872 6,923 7,112 -0.5%Green township 2,731 2,747 2,798 -0.4% Clifton village (pt.) 47 47 48 -0.3% Balance of Green township 2,684 2,700 2,750 -0.4%Harmony township 3,468 3,492 3,577 -0.5% South Vienna village 376 379 384 -0.3% Balance of Harmony township 3,092 3,113 3,193 -0.5%Madison township 2,471 2,488 2,543 -0.5% South Charleston village 1,647 1,659 1,693 -0.4% Balance of Madison township 824 829 850 -0.5%Mad River township 10,901 10,968 11,156 -0.4% Enon village 2,386 2,400 2,415 -0.2% Balance of Mad River township 8,515 8,568 8,741 -0.4%Moorefield township 12,184 12,255 12,436 -0.3%Pike township 3,625 3,652 3,741 -0.5% New Carlisle city (pt.) 17 17 17 0.0% North Hampton village 468 471 478 -0.3% Balance of Pike township 3,140 3,164 3,246 -0.5%Pleasant township 3,142 3,163 3,238 -0.5% Catawba village 263 264 268 -0.3% Balance of Pleasant township 2,879 2,899 2,970 -0.5%Springfield city 59,087 59,618 60,608 -0.4%Springfield township 11,923 12,003 12,237 -0.4%
n.a. - Could not calculate. Division by zero.
(a) Used for calculating average annual rate of change. (b) Average annual rate of change from April 1, 2010 to July 1, 2016.
Source: Population Estimates Division, U.S. Census Bureau. Prepared by: Office of Research, Ohio Development Services Agency.
Population

Clermont County2016 Population Estimates For Cities, Villages, and Townships
Estimates Average AnnualEstimate Estimate Base Rate of Change
Name 7/1/16 7/1/15 4/1/10 (a) From 2010 (b)
Clermont County 203,022 201,791 197,363 0.5%
Amelia village 4,957 4,925 4,801 0.5%Batavia village 1,650 1,641 1,613 0.4%Bethel village 2,779 2,763 2,705 0.4%Chilo village 64 63 63 0.3%Felicity village 824 821 816 0.2%Loveland city (pt.) 2,051 2,025 1,941 0.9% Also located in Hamilton County Also located in Warren CountyMilford city (pt.) 6,877 6,862 6,680 0.5% Also located in Hamilton CountyMoscow village 187 186 185 0.2%Neville village 101 101 100 0.2%New Richmond village 2,653 2,639 2,591 0.4%Newtonsville village 364 363 361 0.1%Owensville village 819 814 794 0.5%Williamsburg village 2,554 2,539 2,484 0.4%Balance of Clermont County 177,142 176,049 172,229 0.5%
Batavia township 23,952 23,805 23,280 0.5% Amelia village (pt.) 1,714 1,704 1,665 0.5% Batavia village 1,650 1,641 1,613 0.4% Balance of Batavia township 20,588 20,460 20,002 0.5%Franklin township 4,244 4,224 4,188 0.2% Chilo village 64 63 63 0.3% Felicity village 824 821 816 0.2% Balance of Franklin township 3,356 3,340 3,309 0.2%Goshen township 15,812 15,728 15,505 0.3%Jackson township 3,057 3,038 2,980 0.4%Loveland city (pt.) 2,051 2,025 1,941 0.9%Miami township 42,146 41,871 40,848 0.5%Milford city (pt.) 6,877 6,862 6,680 0.5%Monroe township 7,932 7,895 7,823 0.2%Ohio township 5,287 5,262 5,192 0.3% New Richmond village (pt.) 2,653 2,639 2,591 0.4% Balance of Ohio township 2,634 2,623 2,601 0.2%Pierce township 14,810 14,714 14,349 0.5% Amelia village (pt.) 3,243 3,221 3,136 0.5% New Richmond village (pt.) 0 0 0 n.a. Balance of Pierce township 11,567 11,493 11,213 0.5%Stonelick township 6,064 6,027 5,890 0.5% Owensville village 819 814 794 0.5% Balance of Stonelick township 5,245 5,213 5,096 0.5%Tate township 9,627 9,569 9,362 0.4% Bethel village 2,779 2,763 2,705 0.4% Balance of Tate township 6,848 6,806 6,657 0.5%Union township 47,967 47,647 46,417 0.5%Washington township 2,313 2,303 2,278 0.2% Moscow village 187 186 185 0.2% Neville village 101 101 100 0.2% Balance of Washington township 2,025 2,016 1,993 0.3%
Continued
Population

Clermont County2016 Population Estimates For Cities, Villages, and Townships
Estimates Average AnnualEstimate Estimate Base Rate of Change
Name 7/1/16 7/1/15 4/1/10 (a) From 2010 (b)
Wayne township 4,971 4,946 4,890 0.3% Newtonsville village 364 363 361 0.1% Balance of Wayne township 4,607 4,583 4,529 0.3%Williamsburg township 5,912 5,875 5,740 0.5% Williamsburg village 2,554 2,539 2,484 0.4% Balance of Williamsburg township 3,358 3,336 3,256 0.5%
n.a. - Could not calculate. Division by zero.
(a) Used for calculating average annual rate of change. (b) Average annual rate of change from April 1, 2010 to July 1, 2016.
Source: Population Estimates Division, U.S. Census Bureau. Prepared by: Office of Research, Ohio Development Services Agency.
Population

Clinton County2016 Population Estimates For Cities, Villages, and Townships
Estimates Average AnnualEstimate Estimate Base Rate of Change
Name 7/1/16 7/1/15 4/1/10 (a) From 2010 (b)
Clinton County 41,902 41,852 42,037 -0.1%
Blanchester village (pt.) 4,256 4,241 4,243 0.0% Also located in Warren CountyClarksville village 547 546 548 0.0%Lynchburg village (pt.) 2 2 2 0.0% Also located in Highland CountyMartinsville village 453 452 463 -0.3%Midland village 316 315 315 0.1%New Vienna village 1,204 1,205 1,224 -0.3%Port William village 255 254 254 0.1%Sabina village 2,537 2,537 2,564 -0.2%Wilmington city 12,425 12,454 12,520 -0.1%Balance of Clinton County 19,907 19,846 19,904 0.0%
Adams township 2,093 2,085 2,091 0.0%Chester township 1,973 1,966 1,967 0.0%Clark township 2,099 2,094 2,120 -0.2% Lynchburg village (pt.) 2 2 2 0.0% Martinsville village 453 452 463 -0.3% Balance of Clark township 1,644 1,640 1,655 -0.1%Green township 2,452 2,450 2,473 -0.1% New Vienna village 1,204 1,205 1,224 -0.3% Balance of Green township 1,248 1,245 1,249 0.0%Jefferson township 1,398 1,394 1,399 0.0% Midland village 316 315 315 0.1% Balance of Jefferson township 1,082 1,079 1,084 0.0%Liberty township 1,070 1,068 1,067 0.0% Port William village 255 254 254 0.1% Balance of Liberty township 815 814 813 0.0%Marion township 5,411 5,393 5,394 0.1% Blanchester village (pt.) 4,256 4,241 4,243 0.0% Balance of Marion township 1,155 1,152 1,151 0.1%Richland township 3,549 3,547 3,573 -0.1% Sabina village 2,537 2,537 2,564 -0.2% Balance of Richland township 1,012 1,010 1,009 0.0%Union township 3,092 3,082 3,085 0.0%Vernon township 2,985 2,976 2,994 0.0% Clarksville village 547 546 548 0.0% Balance of Vernon township 2,438 2,430 2,446 -0.1%Washington township 2,132 2,124 2,133 0.0%Wayne township 716 714 716 0.0%Wilmington city 12,425 12,454 12,520 -0.1%Wilson township 507 505 505 0.1%
n.a. - Could not calculate. Division by zero.
(a) Used for calculating average annual rate of change. (b) Average annual rate of change from April 1, 2010 to July 1, 2016.
Source: Population Estimates Division, U.S. Census Bureau. Prepared by: Office of Research, Ohio Development Services Agency.
Population

Columbiana County2016 Population Estimates For Cities, Villages, and Townships
Estimates Average AnnualEstimate Estimate Base Rate of Change
Name 7/1/16 7/1/15 4/1/10 (a) From 2010 (b)
Columbiana County 103,685 104,683 107,841 -0.6%
Columbiana city (pt.) 5,604 5,638 5,725 -0.3% Also located in Mahoning CountyEast Liverpool city 10,743 10,857 11,212 -0.7%East Palestine village 4,533 4,581 4,718 -0.6%Hanoverton village 397 401 408 -0.4%Leetonia village 1,885 1,906 1,959 -0.6%Lisbon village 2,699 2,728 2,819 -0.7%Minerva village (pt.) 2 2 2 0.0% Also located in Stark County Also located in Carroll CountyNew Waterford village 1,191 1,199 1,238 -0.6%Rogers village 231 233 237 -0.4%Salem city (pt.) 11,943 12,013 12,291 -0.5% Also located in Mahoning CountySalineville village 1,250 1,265 1,310 -0.7%Summitville village 132 133 135 -0.4%Washingtonville village (pt.) 428 434 453 -0.9% Also located in Mahoning CountyWellsville village 3,374 3,414 3,541 -0.8%Balance of Columbiana County 59,273 59,879 61,793 -0.7%
Butler township 3,462 3,499 3,614 -0.7%Center township 6,047 6,111 6,313 -0.7% Lisbon village (pt.) 2,667 2,696 2,786 -0.7% Balance of Center township 3,380 3,415 3,527 -0.7%East Liverpool city 10,743 10,857 11,212 -0.7%Elkrun township 4,579 4,606 4,687 -0.4% Lisbon village (pt.) 32 32 33 -0.5% Balance of Elkrun township 4,547 4,574 4,654 -0.4%Fairfield township * 9,629 9,697 9,890 -0.4% Columbiana city (pt.) 5,578 5,612 5,698 -0.3% Leetonia village (pt.) 95 96 98 -0.5% Balance of Fairfield township 3,956 3,989 4,094 -0.5%Franklin township 799 808 834 -0.7% Summitville village 132 133 135 -0.4% Balance of Franklin township 667 675 699 -0.7%Hanover township 3,536 3,577 3,704 -0.7% Hanoverton village 397 401 408 -0.4% Balance of Hanover township 3,139 3,176 3,296 -0.8%Knox township 4,232 4,279 4,434 -0.7%Liverpool township 3,855 3,898 4,030 -0.7%Madison township 3,056 3,088 3,196 -0.7%Middleton township 3,443 3,481 3,613 -0.8% Rogers village 231 233 237 -0.4% Balance of Middleton township 3,212 3,248 3,376 -0.8%Perry township * 16,349 16,461 16,850 -0.5% Salem city (pt.) 11,943 12,013 12,291 -0.5% Balance of Perry township 4,406 4,448 4,559 -0.5%St. Clair township 7,635 7,716 7,956 -0.7%
Continued
Population

Columbiana County2016 Population Estimates For Cities, Villages, and Townships
Estimates Average AnnualEstimate Estimate Base Rate of Change
Name 7/1/16 7/1/15 4/1/10 (a) From 2010 (b)
Salem township 5,259 5,318 5,484 -0.7% Leetonia village (pt.) 1,790 1,810 1,861 -0.6% Salem city (pt.) 0 0 0 n.a. Washingtonville village (pt.) 428 434 453 -0.9% Balance of Salem township 3,041 3,074 3,170 -0.7%Unity township 9,546 9,643 9,957 -0.7% Columbiana city (pt.) 26 26 27 -0.6% East Palestine village 4,533 4,581 4,718 -0.6% New Waterford village 1,191 1,199 1,238 -0.6% Balance of Unity township 3,796 3,837 3,974 -0.7%Washington township 2,156 2,181 2,265 -0.8% Salineville village 1,250 1,265 1,310 -0.7% Balance of Washington township 906 916 955 -0.8%Wayne township 780 788 814 -0.7%Wellsville village 3,374 3,414 3,541 -0.8%West township 3,161 3,195 3,307 -0.7% Minerva village (pt.) 2 2 2 0.0% Balance of West township 3,159 3,193 3,305 -0.7%Yellow Creek township 2,044 2,066 2,140 -0.7%
* - Fairfield and Perry Township are also located in Mahoning County.n.a. - Could not calculate. Division by zero.
(a) Used for calculating average annual rate of change. (b) Average annual rate of change from April 1, 2010 to July 1, 2016.
Source: Population Estimates Division, U.S. Census Bureau. Prepared by: Office of Research, Ohio Development Services Agency.
Population

Coshocton County2016 Population Estimates For Cities, Villages, and Townships
Estimates Average AnnualEstimate Estimate Base Rate of Change
Name 7/1/16 7/1/15 4/1/10 (a) From 2010 (b)
Coshocton County 36,602 36,587 36,898 -0.1%
Baltic village (pt.) 0 0 0 n.a. Also located in Tuscarawas County Also located in Holmes CountyConesville village 336 337 347 -0.5%Coshocton city 11,189 11,163 11,216 0.0%Nellie village 132 132 131 0.1%Plainfield village 171 168 157 1.4%Warsaw village 674 675 682 -0.2%West Lafayette village 2,292 2,292 2,320 -0.2%Balance of Coshocton County 21,808 21,820 22,045 -0.2%
Adams township 783 784 791 -0.2%Bedford township 557 558 564 -0.2%Bethlehem township 1,115 1,115 1,123 -0.1%Clark township 576 577 586 -0.3%Coshocton city 11,189 11,163 11,216 0.0%Crawford township 1,851 1,851 1,858 -0.1% Baltic village (pt.) 0 0 0 n.a. Balance of Crawford township 1,851 1,851 1,858 -0.1%Franklin township 1,213 1,214 1,229 -0.2% Conesville village 336 337 347 -0.5% Balance of Franklin township 877 877 882 -0.1%Jackson township 1,925 1,926 1,947 -0.2%Jefferson township 1,486 1,488 1,500 -0.1% Nellie village 132 132 131 0.1% Warsaw village 674 675 682 -0.2% Balance of Jefferson township 680 681 687 -0.2%Keene township 1,674 1,672 1,690 -0.2%Lafayette township 4,029 4,030 4,081 -0.2% West Lafayette village 2,292 2,292 2,320 -0.2% Balance of Lafayette township 1,737 1,738 1,761 -0.2%Linton township 653 651 646 0.2% Plainfield village 171 168 157 1.4% Balance of Linton township 482 483 489 -0.2%Mill Creek township 920 921 932 -0.2%Monroe township 517 518 525 -0.2%Newcastle township 468 467 475 -0.2%Oxford township 1,511 1,512 1,527 -0.2%Perry township 699 699 711 -0.3%Pike township 626 627 635 -0.2%Tiverton township 440 441 449 -0.3%Tuscarawas township 1,843 1,844 1,864 -0.2%Virginia township 587 588 596 -0.2%Washington township 752 753 760 -0.2%White Eyes township 1,188 1,188 1,193 -0.1%
n.a. - Could not calculate. Division by zero.
(a) Used for calculating average annual rate of change. (b) Average annual rate of change from April 1, 2010 to July 1, 2016.
Source: Population Estimates Division, U.S. Census Bureau. Prepared by: Office of Research, Ohio Development Services Agency.
Population

Crawford County2016 Population Estimates For Cities, Villages, and Townships
Estimates Average AnnualEstimate Estimate Base Rate of Change
Name 7/1/16 7/1/15 4/1/10 (a) From 2010 (b)
Crawford County 42,083 42,330 43,785 -0.6%
Bucyrus city 11,903 11,973 12,371 -0.6%Chatfield village 188 188 189 -0.1%Crestline village (pt.) 4,421 4,447 4,613 -0.7% Also located in Richland CountyGalion city (pt.) 10,143 10,208 10,583 -0.7% Also located in Richland County Also located in Morrow CountyNew Washington village 931 937 968 -0.6%North Robinson village 199 199 205 -0.5%Tiro village 272 273 280 -0.5%Balance of Crawford County 14,026 14,105 14,576 -0.6%
Auburn township 768 773 795 -0.6% Tiro village 272 273 280 -0.5% Balance of Auburn township 496 500 515 -0.6%Bucyrus city 11,903 11,973 12,371 -0.6%Bucyrus township 797 802 835 -0.7%Chatfield township 701 705 724 -0.5% Chatfield village 188 188 189 -0.1% Balance of Chatfield township 513 517 535 -0.7%Cranberry township 1,518 1,529 1,580 -0.6% New Washington village 931 937 968 -0.6% Balance of Cranberry township 587 592 612 -0.7%Crestline village (pt.) 4,421 4,447 4,613 -0.7%Dallas township 471 473 485 -0.5%Galion city (pt.) 10,141 10,206 10,581 -0.7%Holmes township 1,276 1,284 1,329 -0.6%Jackson township 369 371 380 -0.5% Galion city (pt.) 2 2 2 0.0% Balance of Jackson township 367 369 378 -0.5%Jefferson township 1,521 1,530 1,576 -0.6% Galion city (pt.) 0 0 0 n.a. North Robinson village (pt.) 59 59 61 -0.5% Balance of Jefferson township 1,462 1,471 1,515 -0.6%Liberty township 1,315 1,323 1,369 -0.6%Lykens township 627 632 661 -0.8%Polk township 2,003 2,004 2,054 -0.4%Sandusky township 446 448 459 -0.5%Texas township 373 374 384 -0.5%Tod township 644 649 677 -0.8%Vernon township 793 799 832 -0.8%Whetstone township 1,996 2,008 2,080 -0.7% North Robinson village (pt.) 140 140 144 -0.4% Balance of Whetstone township 1,856 1,868 1,936 -0.7%
n.a. - Could not calculate. Division by zero.
(a) Used for calculating average annual rate of change. (b) Average annual rate of change from April 1, 2010 to July 1, 2016.
Source: Population Estimates Division, U.S. Census Bureau. Prepared by: Office of Research, Ohio Development Services Agency.
Population

Cuyahoga County2016 Population Estimates For Cities, Villages, and Townships
Estimates Average AnnualEstimate Estimate Base Rate of Change
Name 7/1/16 7/1/15 4/1/10 (a) From 2010 (b)
Cuyahoga County 1,249,352 1,255,025 1,280,109 -0.4%
Bay Village city 15,328 15,391 15,651 -0.3%Beachwood city 11,707 11,754 11,953 -0.3%Bedford city 12,665 12,738 13,074 -0.5%Bedford Heights city 10,555 10,618 10,757 -0.3%Bentleyville village 858 856 864 -0.1%Berea city 18,859 18,863 19,093 -0.2%Bratenahl village 1,164 1,170 1,197 -0.4%Brecksville city 13,425 13,431 13,659 -0.3%Broadview Heights city 19,197 19,216 19,397 -0.2%Brooklyn city 10,828 10,892 11,169 -0.5%Brooklyn Heights village 1,521 1,529 1,543 -0.2%Brook Park city 18,691 18,796 19,212 -0.4%Chagrin Falls township 4,115 4,140 4,224 -0.4% Chagrin Falls village 3,995 4,019 4,104 -0.4% Balance of Chagrin Falls township 120 121 120 0.0%Cleveland city 385,809 387,812 396,697 -0.4%Cleveland Heights city 44,633 44,931 46,238 -0.6%Cuyahoga Heights village 612 617 638 -0.7%East Cleveland city 17,220 17,332 17,844 -0.6%Euclid city 47,360 47,643 48,905 -0.5%Fairview Park city 16,332 16,396 16,826 -0.5%Garfield Heights city 27,905 28,078 28,849 -0.5%Gates Mills village 2,231 2,233 2,270 -0.3%Glenwillow village 920 925 923 -0.1%Highland Heights city 8,397 8,390 8,345 0.1%Highland Hills village 961 963 1,130 -2.6%Hunting Valley village 597 600 589 0.2% Also located in Geauga CountyIndependence city 7,114 7,131 7,125 0.0%Lakewood city 50,279 50,621 52,131 -0.6%Linndale village 176 176 179 -0.3%Lyndhurst city 13,605 13,681 14,001 -0.5%Maple Heights city 22,478 22,615 23,138 -0.5%Mayfield village 3,387 3,400 3,460 -0.3%Mayfield Heights city 18,731 18,827 19,155 -0.4%Middleburg Heights city 15,608 15,686 15,946 -0.3%Moreland Hills village 3,306 3,305 3,320 -0.1%Newburgh Heights village 2,079 2,095 2,167 -0.7%North Olmsted city 31,817 31,982 32,713 -0.4%North Randall village 1,002 1,007 1,027 -0.4%North Royalton city 30,247 30,290 30,444 -0.1%Oakwood village 3,660 3,678 3,661 0.0%Olmsted township 13,168 13,230 13,518 -0.4%Olmsted Falls city 8,890 8,882 9,024 -0.2%Orange village 3,271 3,274 3,323 -0.3%Parma city 79,425 79,882 81,601 -0.4%Parma Heights city 20,123 20,232 20,718 -0.5%
Continued
Population

Cuyahoga County2016 Population Estimates For Cities, Villages, and Townships
Estimates Average AnnualEstimate Estimate Base Rate of Change
Name 7/1/16 7/1/15 4/1/10 (a) From 2010 (b)
Pepper Pike city 6,198 6,200 5,979 0.6%Richmond Heights city 10,421 10,462 10,557 -0.2%Rocky River city 20,264 20,360 20,213 0.0%Seven Hills city 11,655 11,682 11,812 -0.2%Shaker Heights city 27,448 27,627 28,448 -0.6%Solon city 23,003 23,027 23,348 -0.2%South Euclid city 21,658 21,779 22,295 -0.5%Strongsville city 44,631 44,632 44,750 0.0%University Heights city 13,126 13,195 13,539 -0.5%Valley View village 2,005 2,010 2,034 -0.2%Walton Hills village 2,298 2,244 2,281 0.1%Warrensville Heights city 13,236 13,229 13,542 -0.4%Westlake city 32,293 32,407 32,729 -0.2%Woodmere village 860 863 884 -0.4%
n.a. - Could not calculate. Division by zero.
(a) Used for calculating average annual rate of change. (b) Average annual rate of change from April 1, 2010 to July 1, 2016.
Source: Population Estimates Division, U.S. Census Bureau. Prepared by: Office of Research, Ohio Development Services Agency.
Population

Darke County2016 Population Estimates For Cities, Villages, and Townships
Estimates Average AnnualEstimate Estimate Base Rate of Change
Name 7/1/16 7/1/15 4/1/10 (a) From 2010 (b)
Darke County 51,778 52,100 52,959 -0.4%
Ansonia village 1,133 1,142 1,174 -0.6%Arcanum village 2,062 2,079 2,122 -0.5%Bradford village (pt.) 769 775 794 -0.5% Also located in Miami CountyBurkettsville village (pt.) 91 87 74 3.4% Also located in Mercer CountyCastine village 127 128 130 -0.4%Gettysburg village 647 613 513 3.8%Gordon village 207 208 212 -0.4%Greenville city 12,836 12,943 13,227 -0.5%Hollansburg village 221 223 227 -0.4%Ithaca village 133 134 136 -0.4%New Madison village 1,066 1,024 892 2.9%New Weston village 133 134 136 -0.4%North Star village 230 232 236 -0.4%Osgood village 294 297 302 -0.4%Palestine village 195 196 200 -0.4%Pitsburg village 378 381 388 -0.4%Rossburg village 196 197 201 -0.4%Union City village 1,620 1,632 1,666 -0.4%Versailles village 2,608 2,631 2,687 -0.5%Wayne Lakes village 700 705 718 -0.4%Yorkshire village 122 116 96 3.9%Balance of Darke County 26,010 26,223 26,828 -0.5%
Adams township 3,481 3,472 3,441 0.2% Bradford village (pt.) 769 775 794 -0.5% Gettysburg village 647 613 513 3.8% Balance of Adams township 2,065 2,084 2,134 -0.5%Allen township 1,084 1,088 1,098 -0.2% Burkettsville village (pt.) 91 87 74 3.4% New Weston village 133 134 136 -0.4% Rossburg village 196 197 201 -0.4% Balance of Allen township 664 670 687 -0.5%Brown township 2,009 2,025 2,073 -0.5% Ansonia village 1,133 1,142 1,174 -0.6% Balance of Brown township 876 883 899 -0.4%Butler township 1,489 1,501 1,535 -0.5% Castine village 127 128 130 -0.4% New Madison village (pt.) 187 189 192 -0.4% Balance of Butler township 1,175 1,184 1,213 -0.5%Franklin township 1,201 1,211 1,241 -0.5%Greenville township 17,106 17,247 17,613 -0.5% Greenville city 12,836 12,943 13,227 -0.5% Balance of Greenville township 4,270 4,304 4,386 -0.4%Harrison township 2,384 2,353 2,255 0.9% Hollansburg village 221 223 227 -0.4% New Madison village (pt.) 879 835 700 3.7% Balance of Harrison township 1,284 1,295 1,328 -0.5%
Continued
Population

Darke County2016 Population Estimates For Cities, Villages, and Townships
Estimates Average AnnualEstimate Estimate Base Rate of Change
Name 7/1/16 7/1/15 4/1/10 (a) From 2010 (b)
Jackson township 2,788 2,809 2,876 -0.5% Union City village 1,620 1,632 1,666 -0.4% Balance of Jackson township 1,168 1,177 1,210 -0.6%Liberty township 1,037 1,045 1,071 -0.5% Palestine village 195 196 200 -0.4% Balance of Liberty township 842 849 871 -0.5%Mississinawa township 725 731 752 -0.6%Monroe township 1,683 1,697 1,735 -0.5% Pitsburg village 378 381 388 -0.4% Balance of Monroe township 1,305 1,316 1,347 -0.5%Neave township 2,264 2,282 2,330 -0.5% Wayne Lakes village 700 705 718 -0.4% Balance of Neave township 1,564 1,577 1,612 -0.5%Patterson township 1,353 1,357 1,365 -0.1% Osgood village 294 297 302 -0.4% Yorkshire village 122 116 96 3.9% Balance of Patterson township 937 944 967 -0.5%Richland township 813 819 841 -0.5%Twin township 3,944 3,976 4,060 -0.5% Arcanum village 2,062 2,079 2,122 -0.5% Gordon village 207 208 212 -0.4% Ithaca village 133 134 136 -0.4% Balance of Twin township 1,542 1,555 1,590 -0.5%Van Buren township 1,425 1,436 1,469 -0.5%Wabash township 864 872 887 -0.4% North Star village 230 232 236 -0.4% Balance of Wabash township 634 640 651 -0.4%Washington township 1,282 1,292 1,325 -0.5%Wayne township 4,356 4,393 4,489 -0.5% Versailles village 2,608 2,631 2,687 -0.5% Balance of Wayne township 1,748 1,762 1,802 -0.5%York township 490 494 503 -0.4%
n.a. - Could not calculate. Division by zero.
(a) Used for calculating average annual rate of change. (b) Average annual rate of change from April 1, 2010 to July 1, 2016.
Source: Population Estimates Division, U.S. Census Bureau. Prepared by: Office of Research, Ohio Development Services Agency.
Population
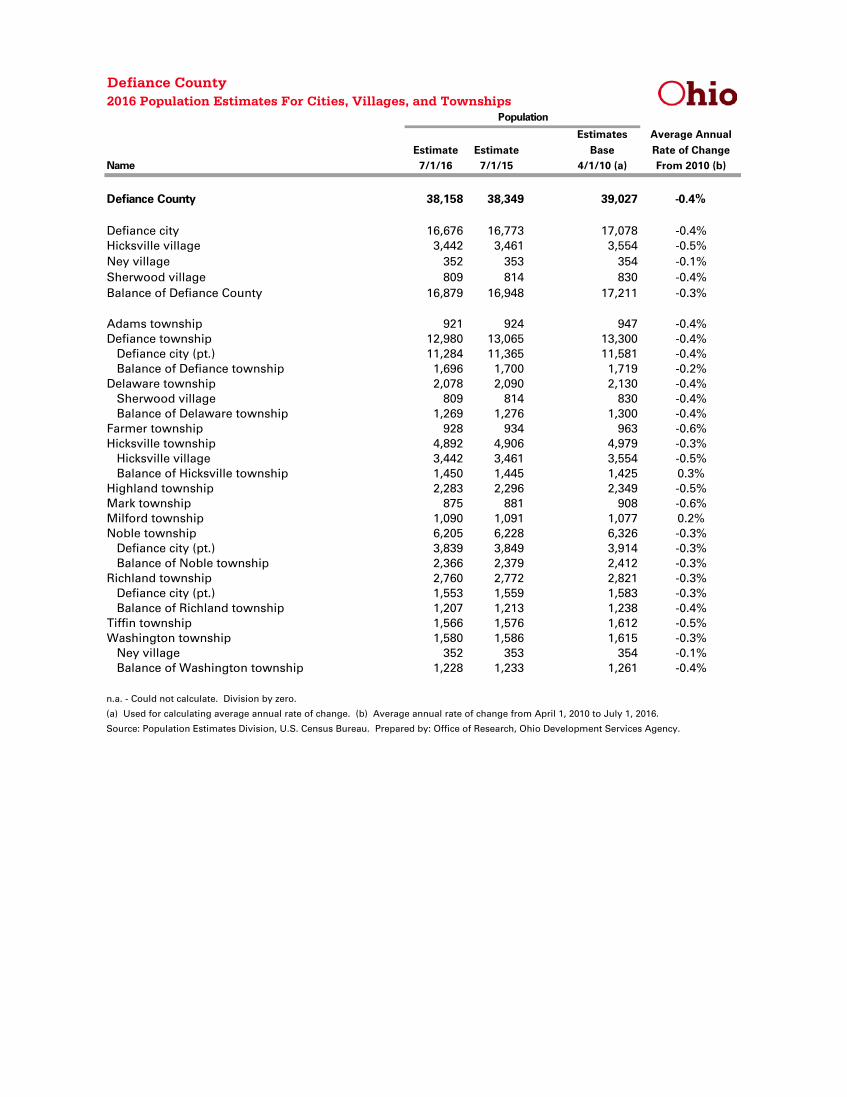
Defiance County2016 Population Estimates For Cities, Villages, and Townships
Estimates Average AnnualEstimate Estimate Base Rate of Change
Name 7/1/16 7/1/15 4/1/10 (a) From 2010 (b)
Defiance County 38,158 38,349 39,027 -0.4%
Defiance city 16,676 16,773 17,078 -0.4%Hicksville village 3,442 3,461 3,554 -0.5%Ney village 352 353 354 -0.1%Sherwood village 809 814 830 -0.4%Balance of Defiance County 16,879 16,948 17,211 -0.3%
Adams township 921 924 947 -0.4%Defiance township 12,980 13,065 13,300 -0.4% Defiance city (pt.) 11,284 11,365 11,581 -0.4% Balance of Defiance township 1,696 1,700 1,719 -0.2%Delaware township 2,078 2,090 2,130 -0.4% Sherwood village 809 814 830 -0.4% Balance of Delaware township 1,269 1,276 1,300 -0.4%Farmer township 928 934 963 -0.6%Hicksville township 4,892 4,906 4,979 -0.3% Hicksville village 3,442 3,461 3,554 -0.5% Balance of Hicksville township 1,450 1,445 1,425 0.3%Highland township 2,283 2,296 2,349 -0.5%Mark township 875 881 908 -0.6%Milford township 1,090 1,091 1,077 0.2%Noble township 6,205 6,228 6,326 -0.3% Defiance city (pt.) 3,839 3,849 3,914 -0.3% Balance of Noble township 2,366 2,379 2,412 -0.3%Richland township 2,760 2,772 2,821 -0.3% Defiance city (pt.) 1,553 1,559 1,583 -0.3% Balance of Richland township 1,207 1,213 1,238 -0.4%Tiffin township 1,566 1,576 1,612 -0.5%Washington township 1,580 1,586 1,615 -0.3% Ney village 352 353 354 -0.1% Balance of Washington township 1,228 1,233 1,261 -0.4%
n.a. - Could not calculate. Division by zero.
(a) Used for calculating average annual rate of change. (b) Average annual rate of change from April 1, 2010 to July 1, 2016.
Source: Population Estimates Division, U.S. Census Bureau. Prepared by: Office of Research, Ohio Development Services Agency.
Population

Delaware County2016 Population Estimates For Cities, Villages, and Townships
Estimates Average AnnualEstimate Estimate Base Rate of Change
Name 7/1/16 7/1/15 4/1/10 (a) From 2010 (b)
Delaware County 196,463 192,884 174,189 1.9%
Ashley village 1,500 1,472 1,330 1.9%Columbus city (pt.) 8,131 7,990 7,271 1.8% Also located in Fairfield County Also located in Franklin CountyDelaware city 38,643 38,028 34,756 1.7%Dublin city (pt.) 4,459 4,403 4,010 1.7% Also located in Franklin County Also located in Union CountyGalena village 665 664 650 0.4%Ostrander village 695 680 640 1.3%Powell city 12,810 12,636 11,498 1.7%Shawnee Hills village 769 753 677 2.1%Sunbury village 5,216 5,102 4,395 2.8%Westerville city (pt.) 8,425 8,318 7,773 1.3% Also located in Franklin CountyBalance of Delaware County 115,150 112,838 101,189 2.1%
Ashley village 1,500 1,472 1,330 1.9%Berkshire township 3,438 3,379 3,077 1.8% Galena village 665 664 650 0.4% Sunbury village (pt.) 4 4 4 0.0% Balance of Berkshire township 2,769 2,711 2,423 2.2%Berlin township 7,383 7,230 6,498 2.1% Delaware city (pt.) 2 2 2 0.0% Balance of Berlin township 7,381 7,228 6,496 2.1%Brown township 1,609 1,576 1,416 2.1% Delaware city (pt.) 0 0 0 n.a. Balance of Brown township 1,609 1,576 1,416 2.1%Columbus city (pt.) 5,250 5,170 4,748 1.6%Concord township 10,448 10,229 9,297 1.9% Dublin city (pt.) 0 0 0 n.a. Balance of Concord township 10,448 10,229 9,297 1.9%Delaware city (pt.) 38,134 37,525 34,297 1.7%Delaware township 2,649 2,596 2,333 2.1% Delaware city (pt.) 409 403 366 1.8% Balance of Delaware township 2,240 2,193 1,967 2.1%Dublin city (pt.) 4,459 4,403 4,010 1.7%Genoa township 26,481 25,912 23,104 2.2% Westerville city (pt.) 0 0 0 n.a. Balance of Genoa township 26,481 25,912 23,104 2.2%Harlem township 4,482 4,392 3,956 2.0%Kingston township 2,464 2,412 2,156 2.2%Liberty township 29,222 28,831 26,154 1.8% Delaware city (pt.) 98 98 91 1.2% Powell city 12,810 12,636 11,498 1.7% Balance of Liberty township 16,314 16,097 14,565 1.8%Marlboro township 317 310 279 2.1%
Continued
Population

Delaware County2016 Population Estimates For Cities, Villages, and Townships
Estimates Average AnnualEstimate Estimate Base Rate of Change
Name 7/1/16 7/1/15 4/1/10 (a) From 2010 (b)
Orange township 30,111 29,461 26,258 2.2% Columbus city (pt.) 2,881 2,820 2,523 2.1% Westerville city (pt.) 7 7 7 0.0% Balance of Orange township 27,223 26,634 23,728 2.2%Oxford township 1,122 1,099 989 2.0%Porter township 2,192 2,146 1,923 2.1%Radnor township 1,754 1,718 1,540 2.1%Scioto township 3,391 3,319 3,003 2.0% Ostrander village 695 680 640 1.3% Balance of Scioto township 2,696 2,639 2,363 2.1%Shawnee Hills village 769 753 677 2.1%Sunbury village (pt.) 5,212 5,098 4,391 2.8%Thompson township 777 762 682 2.1%Trenton township 2,496 2,443 2,190 2.1%Troy township 2,385 2,337 2,115 1.9% Delaware city (pt.) 0 0 0 n.a. Balance of Troy township 2,385 2,337 2,115 1.9%Westerville city (pt.) 8,418 8,311 7,766 1.3%
n.a. - Could not calculate. Division by zero.
(a) Used for calculating average annual rate of change. (b) Average annual rate of change from April 1, 2010 to July 1, 2016.
Source: Population Estimates Division, U.S. Census Bureau. Prepared by: Office of Research, Ohio Development Services Agency.
Population

Erie County2016 Population Estimates For Cities, Villages, and Townships
Estimates Average AnnualEstimate Estimate Base Rate of Change
Name 7/1/16 7/1/15 4/1/10 (a) From 2010 (b)
Erie County 75,107 75,471 77,079 -0.4%
Bay View village 607 612 632 -0.6%Bellevue city (pt.) 2 2 2 0.0% Also located in Sandusky County Also located in Huron CountyBerlin Heights village 713 712 714 0.0%Castalia village 827 831 850 -0.4%Huron city 6,977 7,013 7,148 -0.4%Kelleys Island village 310 311 312 -0.1%Milan village (pt.) 986 990 1,004 -0.3% Also located in Huron CountySandusky city 25,006 25,180 25,919 -0.6%Vermilion city (pt.) 4,622 4,637 4,742 -0.4% Also located in Lorain CountyBalance of Erie County 35,057 35,183 35,756 -0.3%
Bellevue city (pt.) 2 2 2 0.0%Berlin township 3,650 3,658 3,723 -0.3% Berlin Heights village 713 712 714 0.0% Balance of Berlin township 2,937 2,946 3,009 -0.4%Florence township 2,392 2,404 2,448 -0.4%Groton township 1,393 1,402 1,427 -0.4%Huron township 10,561 10,592 10,709 -0.2% Huron city 6,977 7,013 7,148 -0.4% Balance of Huron township 3,584 3,579 3,561 0.1%Kelleys Island village 310 311 312 -0.1%Margaretta township 5,848 5,877 5,980 -0.4% Bay View village 607 612 632 -0.6% Castalia village 827 831 850 -0.4% Balance of Margaretta township 4,414 4,434 4,498 -0.3%Milan township 3,539 3,542 3,594 -0.2% Milan village (pt.) 986 990 1,004 -0.3% Balance of Milan township 2,553 2,552 2,590 -0.2%Oxford township 1,189 1,195 1,201 -0.2%Perkins township 11,815 11,866 12,077 -0.4%Sandusky city 25,006 25,180 25,919 -0.6%Vermilion city (pt.) 4,622 4,637 4,742 -0.4%Vermilion township 4,780 4,805 4,945 -0.5%
n.a. - Could not calculate. Division by zero.
(a) Used for calculating average annual rate of change. (b) Average annual rate of change from April 1, 2010 to July 1, 2016.
Source: Population Estimates Division, U.S. Census Bureau. Prepared by: Office of Research, Ohio Development Services Agency.
Population

Fairfield County2016 Population Estimates For Cities, Villages, and Townships
Estimates Average AnnualEstimate Estimate Base Rate of Change
Name 7/1/16 7/1/15 4/1/10 (a) From 2010 (b)
Fairfield County 152,597 151,326 146,177 0.7%
Amanda village 740 740 740 0.0%Baltimore village 2,973 2,970 2,973 0.0%Bremen village 1,434 1,431 1,420 0.2%Buckeye Lake village (pt.) 15 15 15 0.0% Also located in Licking CountyCanal Winchester city (pt.) 872 867 829 0.8% Also located in Franklin CountyCarroll village 521 519 524 -0.1%Columbus city (pt.) 10,396 10,262 9,744 1.0% Also located in Delaware County Also located in Franklin CountyLancaster city 39,848 39,725 38,762 0.4%Lithopolis village (pt.) 1,387 1,305 1,061 4.4% Also located in Franklin CountyMillersport village 1,049 1,048 1,044 0.1%Pickerington city (pt.) 19,994 19,657 18,206 1.5% Also located in Franklin CountyPleasantville village 958 958 960 0.0%Reynoldsburg city (pt.) 932 926 910 0.4% Also located in Licking County Also located in Franklin CountyRushville village 311 310 307 0.2%Stoutsville village 558 559 565 -0.2%Sugar Grove village 432 430 426 0.2%Tarlton village (pt.) 0 0 0 n.a. Also located in Pickaway CountyThurston village 597 597 604 -0.2%West Rushville village 137 136 135 0.2%Balance of Fairfield County 69,443 68,871 66,952 0.6%
Amanda township 2,810 2,784 2,703 0.6% Amanda village 740 740 740 0.0% Balance of Amanda township 2,070 2,044 1,963 0.9%Berne township 5,186 5,158 5,097 0.3% Sugar Grove village 432 430 426 0.2% Balance of Berne township 4,754 4,728 4,671 0.3%Bloom township 9,085 8,917 8,467 1.1% Canal Winchester city (pt.) 412 408 375 1.5% Carroll village (pt.) 12 12 12 0.0% Lithopolis village (pt.) 1,378 1,296 1,052 4.4% Balance of Bloom township 7,283 7,201 7,028 0.6%Clearcreek township 4,055 4,052 4,079 -0.1% Stoutsville village 558 559 565 -0.2% Tarlton village (pt.) 0 0 0 n.a. Balance of Clearcreek township 3,497 3,493 3,514 -0.1%Columbus city (pt.) 10,396 10,262 9,744 1.0%Greenfield township 5,757 5,703 5,566 0.5% Carroll village (pt.) 509 507 512 -0.1% Lancaster city (pt.) 4 4 4 0.0% Balance of Greenfield township 5,244 5,192 5,050 0.6%
Continued
Population

Fairfield County2016 Population Estimates For Cities, Villages, and Townships
Estimates Average AnnualEstimate Estimate Base Rate of Change
Name 7/1/16 7/1/15 4/1/10 (a) From 2010 (b)
Hocking township 5,220 5,181 4,677 1.8% Lancaster city (pt.) 0 0 0 n.a. Balance of Hocking township 5,220 5,181 4,677 1.8%Lancaster city (pt.) 39,844 39,721 38,758 0.4%Liberty township 8,130 8,069 7,920 0.4% Baltimore village (pt.) 2,970 2,967 2,970 0.0% Balance of Liberty township 5,160 5,102 4,950 0.7%Madison township 1,668 1,668 1,681 -0.1%Pleasant township 6,193 6,175 6,075 0.3% Lancaster city (pt.) 0 0 0 n.a. Pleasantville village (pt.) 564 565 571 -0.2% Balance of Pleasant township 5,629 5,610 5,504 0.4%Richland township 2,253 2,245 2,196 0.4% Rushville village 311 310 307 0.2% West Rushville village 137 136 135 0.2% Balance of Richland township 1,805 1,799 1,754 0.5%Rush Creek township 3,986 3,970 3,894 0.4% Bremen village 1,434 1,431 1,420 0.2% Balance of Rush Creek township 2,552 2,539 2,474 0.5%Violet township 41,040 40,486 38,489 1.0% Canal Winchester city (pt.) 460 459 454 0.2% Lithopolis village (pt.) 9 9 9 0.0% Pickerington city (pt.) 19,994 19,657 18,206 1.5% Reynoldsburg city (pt.) 932 926 910 0.4% Balance of Violet township 19,645 19,435 18,910 0.6%Walnut township 6,974 6,935 6,831 0.3% Baltimore village (pt.) 3 3 3 0.0% Buckeye Lake village (pt.) 15 15 15 0.0% Millersport village 1,049 1,048 1,044 0.1% Pleasantville village (pt.) 394 393 389 0.2% Thurston village 597 597 604 -0.2% Balance of Walnut township 4,916 4,879 4,776 0.5%
n.a. - Could not calculate. Division by zero.
(a) Used for calculating average annual rate of change. (b) Average annual rate of change from April 1, 2010 to July 1, 2016.
Source: Population Estimates Division, U.S. Census Bureau. Prepared by: Office of Research, Ohio Development Services Agency.
Population

Fayette County2016 Population Estimates For Cities, Villages, and Townships
Estimates Average AnnualEstimate Estimate Base Rate of Change
Name 7/1/16 7/1/15 4/1/10 (a) From 2010 (b)
Fayette County 28,676 28,646 29,028 -0.2%
Bloomingburg village 913 916 938 -0.4%Jeffersonville village 1,184 1,184 1,203 -0.3%Milledgeville village 113 113 114 -0.1%New Holland village (pt.) 106 106 107 -0.2% Also located in Pickaway CountyOcta village 58 59 59 -0.3%Washington Court House city 14,144 14,097 14,194 -0.1%Balance of Fayette County 12,158 12,171 12,413 -0.3%
Concord township 884 884 901 -0.3%Green township 518 518 532 -0.4%Jasper township 730 731 745 -0.3% Milledgeville village 113 113 114 -0.1% Octa village (pt.) 44 45 45 -0.4% Balance of Jasper township 573 573 586 -0.4%Jefferson township 2,587 2,590 2,636 -0.3% Jeffersonville village 1,184 1,184 1,203 -0.3% Octa village (pt.) 14 14 14 0.0% Balance of Jefferson township 1,389 1,392 1,419 -0.3%Madison township 1,096 1,098 1,122 -0.4%Marion township 751 751 766 -0.3% New Holland village (pt.) 106 106 107 -0.2% Balance of Marion township 645 645 659 -0.3%Paint township 1,923 1,929 1,975 -0.4% Bloomingburg village (pt.) 913 916 938 -0.4% Balance of Paint township 1,010 1,013 1,037 -0.4%Perry township 1,018 1,018 1,039 -0.3%Union township 3,663 3,667 3,731 -0.3% Bloomingburg village (pt.) 0 0 0 n.a. Balance of Union township 3,663 3,667 3,731 -0.3%Washington Court House city 14,144 14,097 14,194 -0.1%Wayne township 1,362 1,363 1,387 -0.3%
n.a. - Could not calculate. Division by zero.
(a) Used for calculating average annual rate of change. (b) Average annual rate of change from April 1, 2010 to July 1, 2016.
Source: Population Estimates Division, U.S. Census Bureau. Prepared by: Office of Research, Ohio Development Services Agency.
Population

Franklin County2016 Population Estimates For Cities, Villages, and Townships
Estimates Average AnnualEstimate Estimate Base Rate of Change
Name 7/1/16 7/1/15 4/1/10 (a) From 2010 (b)
Franklin County 1,264,518 1,250,269 1,163,529 1.3%
Bexley city 13,669 13,653 13,054 0.7%Brice village 121 120 116 0.7%Canal Winchester city (pt.) 7,033 6,959 6,288 1.8% Also located in Fairfield CountyColumbus city (pt.) 841,563 831,792 771,851 1.4% Also located in Delaware County Also located in Fairfield CountyDublin city (pt.) 38,622 38,224 34,996 1.6% Also located in Union County Also located in Delaware CountyGahanna city 34,956 34,584 33,233 0.8%Grandview Heights city 7,628 7,267 6,518 2.5%Grove City city 39,721 39,212 35,615 1.8%Groveport city 5,552 5,539 5,362 0.6%Harrisburg village (pt.) 335 333 321 0.7% Also located in Pickaway CountyHilliard city 34,905 33,650 28,225 3.5%Lithopolis village (pt.) 42 42 40 0.8% Also located in Fairfield CountyLockbourne village (pt.) 248 247 238 0.7% Also located in Pickaway CountyMarble Cliff village 671 639 569 2.7%Minerva Park village 1,312 1,309 1,272 0.5%New Albany city (pt.) 10,199 9,749 7,725 4.5% Also located in Licking CountyObetz village 4,811 4,765 4,542 0.9%Pickerington city (pt.) 75 75 72 0.7% Also located in Fairfield CountyReynoldsburg city (pt.) 27,424 27,255 26,178 0.7% Also located in Licking County Also located in Fairfield CountyRiverlea village 565 563 547 0.5%Upper Arlington city 34,997 34,897 33,684 0.6%Urbancrest village 984 983 960 0.4%Valleyview village 628 628 616 0.3%Westerville city (pt.) 30,560 30,217 28,494 1.1% Also located in Delaware CountyWhitehall city 18,736 18,690 18,134 0.5%Worthington city 14,528 14,489 13,570 1.1%Balance of Franklin County 94,633 94,388 91,309 0.6%
Bexley city 13,669 13,653 13,054 0.7%Blendon township 9,205 9,184 8,909 0.5% Minerva Park village 1,312 1,309 1,272 0.5% Balance of Blendon township 7,893 7,875 7,637 0.5%Brown township 2,345 2,340 2,267 0.5% Hilliard city (pt.) 49 49 47 0.7% Balance of Brown township 2,296 2,291 2,220 0.5%Clinton township 4,085 4,078 3,978 0.4%Columbus city (pt.) 841,563 831,792 771,851 1.4%
Continued
Population

Franklin County2016 Population Estimates For Cities, Villages, and Townships
Estimates Average AnnualEstimate Estimate Base Rate of Change
Name 7/1/16 7/1/15 4/1/10 (a) From 2010 (b)
Dublin city (pt.) 38,622 38,224 34,996 1.6%Franklin township 10,254 10,237 9,961 0.5% Valleyview village 628 628 616 0.3% Balance of Franklin township 9,626 9,609 9,345 0.5%Grandview Heights city 7,628 7,267 6,518 2.5%Hamilton township 8,571 8,519 8,204 0.7% Groveport city (pt.) 0 0 0 n.a. Lockbourne village (pt.) 248 247 238 0.7% Obetz village (pt.) 3,843 3,798 3,594 1.1% Balance of Hamilton township 4,480 4,474 4,372 0.4%Jackson township 45,118 44,553 40,588 1.7% Grove City city (pt.) 39,717 39,208 35,611 1.8% Urbancrest village 984 983 960 0.4% Balance of Jackson township 4,417 4,362 4,017 1.5%Jefferson township 11,166 11,139 10,797 0.5% Gahanna city (pt.) 4 4 4 0.0% Reynoldsburg city (pt.) 769 766 738 0.7% Balance of Jefferson township 10,393 10,369 10,055 0.5%Madison township 25,079 24,958 23,561 1.0% Canal Winchester city (pt.) 7,033 6,959 6,288 1.8% Groveport city (pt.) 5,552 5,539 5,362 0.6% Lithopolis village (pt.) 42 42 40 0.8% Obetz village (pt.) 968 967 948 0.3% Pickerington city (pt.) 75 75 72 0.7% Balance of Madison township 11,409 11,376 10,851 0.8%Marble Cliff village 671 639 569 2.7%Mifflin township 37,528 37,153 35,741 0.8% Gahanna city (pt.) 34,952 34,580 33,229 0.8% Balance of Mifflin township 2,576 2,573 2,512 0.4%Norwich township 38,261 36,998 31,475 3.2% Hilliard city (pt.) 34,268 33,015 27,614 3.5% Balance of Norwich township 3,993 3,983 3,861 0.5%Perry township 3,738 3,730 3,618 0.5%Plain township 12,109 11,654 9,572 3.8% New Albany city (pt.) 10,199 9,749 7,725 4.5% Balance of Plain township 1,910 1,905 1,847 0.5%Pleasant township 6,854 6,842 6,674 0.4% Grove City city (pt.) 4 4 4 0.0% Harrisburg village (pt.) 335 333 321 0.7% Balance of Pleasant township 6,515 6,505 6,349 0.4%Prairie township 17,172 17,134 16,617 0.5%Sharon township 16,907 16,863 15,882 1.0% Riverlea village 565 563 547 0.5% Worthington city 14,528 14,489 13,570 1.1% Balance of Sharon township 1,814 1,811 1,765 0.4%Truro township 28,132 27,963 26,871 0.7% Brice village 121 120 116 0.7% Reynoldsburg city (pt.) 26,655 26,489 25,440 0.7% Balance of Truro township 1,356 1,354 1,315 0.5%
Continued
Population

Franklin County2016 Population Estimates For Cities, Villages, and Townships
Estimates Average AnnualEstimate Estimate Base Rate of Change
Name 7/1/16 7/1/15 4/1/10 (a) From 2010 (b)
Upper Arlington city 34,997 34,897 33,684 0.6%Washington township 1,548 1,545 1,514 0.4% Hilliard city (pt.) 588 586 564 0.7% Balance of Washington township 960 959 950 0.2%Westerville city (pt.) 30,560 30,217 28,494 1.1%Whitehall city 18,736 18,690 18,134 0.5%
n.a. - Could not calculate. Division by zero.
(a) Used for calculating average annual rate of change. (b) Average annual rate of change from April 1, 2010 to July 1, 2016.
Source: Population Estimates Division, U.S. Census Bureau. Prepared by: Office of Research, Ohio Development Services Agency.
Population

Fulton County2016 Population Estimates For Cities, Villages, and Townships
Estimates Average AnnualEstimate Estimate Base Rate of Change
Name 7/1/16 7/1/15 4/1/10 (a) From 2010 (b)
Fulton County 42,514 42,477 42,698 -0.1%
Archbold village 4,335 4,337 4,330 0.0%Delta village 3,136 3,128 3,105 0.2%Fayette village 1,267 1,270 1,279 -0.2%Lyons village 558 558 566 -0.2%Metamora village 615 618 627 -0.3%Swanton village (pt.) 3,764 3,767 3,741 0.1% Also located in Lucas CountyWauseon city 7,395 7,320 7,313 0.2%Balance of Fulton County 21,444 21,479 21,737 -0.2%
Amboy township 1,815 1,822 1,846 -0.3% Metamora village 615 618 627 -0.3% Balance of Amboy township 1,200 1,204 1,219 -0.3%Chesterfield township 994 998 1,012 -0.3%Clinton township 9,631 9,552 9,555 0.1% Wauseon city 7,395 7,320 7,313 0.2% Balance of Clinton township 2,236 2,232 2,242 0.0%Dover township 1,551 1,554 1,577 -0.3%Franklin township 725 728 743 -0.4%Fulton township 3,197 3,200 3,182 0.1% Swanton village (pt.) 1,709 1,708 1,666 0.4% Balance of Fulton township 1,488 1,492 1,516 -0.3%German township 6,442 6,443 6,443 0.0% Archbold village 4,335 4,337 4,330 0.0% Balance of German township 2,107 2,106 2,113 0.0%Gorham township 2,220 2,225 2,256 -0.3% Fayette village 1,267 1,270 1,279 -0.2% Balance of Gorham township 953 955 977 -0.4%Pike township 1,824 1,827 1,854 -0.3%Royalton township 1,493 1,496 1,519 -0.3% Lyons village 558 558 566 -0.2% Balance of Royalton township 935 938 953 -0.3%Swan Creek township 8,544 8,545 8,566 0.0% Delta village (pt.) 709 695 638 1.7% Swanton village (pt.) 2,055 2,059 2,075 -0.2% Balance of Swan Creek township 5,780 5,791 5,853 -0.2%York township 4,078 4,087 4,145 -0.3% Delta village (pt.) 2,427 2,433 2,467 -0.3% Balance of York township 1,651 1,654 1,678 -0.3%
n.a. - Could not calculate. Division by zero.
(a) Used for calculating average annual rate of change. (b) Average annual rate of change from April 1, 2010 to July 1, 2016.
Source: Population Estimates Division, U.S. Census Bureau. Prepared by: Office of Research, Ohio Development Services Agency.
Population

Gallia County2016 Population Estimates For Cities, Villages, and Townships
Estimates Average AnnualEstimate Estimate Base Rate of Change
Name 7/1/16 7/1/15 4/1/10 (a) From 2010 (b)
Gallia County 30,015 30,110 30,946 -0.5%
Centerville village 102 102 103 -0.2%Cheshire village 131 131 132 -0.1%Crown City village 405 407 420 -0.6%Gallipolis village 3,462 3,488 3,648 -0.8%Rio Grande village 856 854 834 0.4%Vinton village 216 216 217 -0.1%Balance of Gallia County 24,843 24,912 25,592 -0.5%
Addison township 2,140 2,146 2,211 -0.5%Cheshire township 969 971 993 -0.4% Cheshire village 131 131 132 -0.1% Balance of Cheshire township 838 840 861 -0.4%Clay township 1,819 1,824 1,874 -0.5%Gallipolis township 4,875 4,905 5,098 -0.7% Gallipolis village 3,462 3,488 3,648 -0.8% Balance of Gallipolis township 1,413 1,417 1,450 -0.4%Green township 5,483 5,496 5,627 -0.4%Greenfield township 479 481 495 -0.5%Guyan township 1,130 1,134 1,169 -0.5% Crown City village 405 407 420 -0.6% Balance of Guyan township 725 727 749 -0.5%Harrison township 1,023 1,027 1,061 -0.6%Huntington township 1,402 1,406 1,447 -0.5% Vinton village 216 216 217 -0.1% Balance of Huntington township 1,186 1,190 1,230 -0.6%Morgan township 1,364 1,369 1,407 -0.5%Ohio township 1,086 1,090 1,125 -0.6%Perry township 1,542 1,547 1,595 -0.5%Raccoon township 2,207 2,207 2,220 -0.1% Centerville village 102 102 103 -0.2% Rio Grande village 856 854 834 0.4% Balance of Raccoon township 1,249 1,251 1,283 -0.4%Springfield township 3,560 3,569 3,662 -0.5%Walnut township 936 938 962 -0.4%
n.a. - Could not calculate. Division by zero.
(a) Used for calculating average annual rate of change. (b) Average annual rate of change from April 1, 2010 to July 1, 2016.
Source: Population Estimates Division, U.S. Census Bureau. Prepared by: Office of Research, Ohio Development Services Agency.
Population

Geauga County2016 Population Estimates For Cities, Villages, and Townships
Estimates Average AnnualEstimate Estimate Base Rate of Change
Name 7/1/16 7/1/15 4/1/10 (a) From 2010 (b)
Geauga County 94,060 94,095 93,410 0.1%
Aquilla village 340 340 340 0.0%Burton village 1,459 1,459 1,452 0.1%Chardon city 5,192 5,193 5,148 0.1%Hunting Valley village (pt.) 118 118 118 0.0% Also located in Cuyahoga CountyMiddlefield village 2,711 2,712 2,690 0.1%South Russell village 3,819 3,828 3,822 0.0%Balance of Geauga County 80,421 80,445 79,840 0.1%
Auburn township 6,516 6,515 6,443 0.2%Bainbridge township 11,509 11,508 11,392 0.2%Burton township 4,444 4,445 4,419 0.1% Burton village 1,459 1,459 1,452 0.1% Balance of Burton township 2,985 2,986 2,967 0.1%Chardon city 5,192 5,193 5,148 0.1%Chardon township 4,622 4,622 4,591 0.1%Chester township 10,341 10,343 10,256 0.1%Claridon township 3,211 3,212 3,205 0.0% Aquilla village 340 340 340 0.0% Balance of Claridon township 2,871 2,872 2,865 0.0%Hambden township 4,657 4,662 4,661 0.0%Hunting Valley village (pt.) 118 118 118 0.0%Huntsburg township 3,677 3,678 3,645 0.1%Middlefield village 2,711 2,712 2,690 0.1%Middlefield township 4,487 4,490 4,480 0.0%Montville township 2,007 2,007 1,990 0.1%Munson township 6,684 6,683 6,614 0.2%Newbury township 5,586 5,589 5,542 0.1%Parkman township 4,166 4,168 4,136 0.1%Russell township 5,235 5,237 5,188 0.1%South Russell village 3,819 3,828 3,822 0.0%Thompson township 2,273 2,276 2,269 0.0%Troy township 2,805 2,809 2,801 0.0%
n.a. - Could not calculate. Division by zero.
(a) Used for calculating average annual rate of change. (b) Average annual rate of change from April 1, 2010 to July 1, 2016.
Source: Population Estimates Division, U.S. Census Bureau. Prepared by: Office of Research, Ohio Development Services Agency.
Population

Greene County2016 Population Estimates For Cities, Villages, and Townships
Estimates Average AnnualEstimate Estimate Base Rate of Change
Name 7/1/16 7/1/15 4/1/10 (a) From 2010 (b)
Greene County 164,765 164,036 161,577 0.3%
Beavercreek city 46,376 46,172 45,182 0.4%Bellbrook city 7,128 7,096 6,943 0.4%Bowersville village 307 306 312 -0.3%Cedarville village 4,134 4,174 3,985 0.6%Centerville city (pt.) 2 2 2 0.0% Also located in Montgomery CountyClifton village (pt.) 105 104 104 0.2% Also located in Clark CountyFairborn city 33,780 33,548 32,838 0.5%Jamestown village 2,030 2,024 1,993 0.3%Kettering city (pt.) 470 469 467 0.1% Also located in Montgomery CountySpring Valley village 484 484 479 0.2%Xenia city 26,238 26,140 25,671 0.4%Yellow Springs village 3,680 3,675 3,487 0.9%Balance of Greene County 40,031 39,842 40,114 0.0%
Bath township 40,118 39,756 39,398 0.3% Fairborn city (pt.) 32,549 32,327 31,651 0.4% Balance of Bath township 7,569 7,429 7,747 -0.4%Beavercreek township 53,559 53,318 52,160 0.4% Beavercreek city 46,376 46,172 45,182 0.4% Fairborn city (pt.) 1,231 1,221 1,187 0.6% Balance of Beavercreek township 5,952 5,925 5,791 0.4%Bellbrook city 7,128 7,096 6,943 0.4%Caesarscreek township 1,162 1,157 1,137 0.3%Cedarville township 5,684 5,717 5,500 0.5% Cedarville village 4,134 4,174 3,985 0.6% Balance of Cedarville township 1,550 1,543 1,515 0.4%Jefferson township 1,268 1,263 1,254 0.2% Bowersville village 307 306 312 -0.3% Balance of Jefferson township 961 957 942 0.3%Kettering city (pt.) 470 469 467 0.1%Miami township 5,006 4,996 4,790 0.7% Clifton village (pt.) 105 104 104 0.2% Yellow Springs village 3,680 3,675 3,487 0.9% Balance of Miami township 1,221 1,217 1,199 0.3%New Jasper township 2,628 2,619 2,568 0.4%Ross township 766 763 750 0.3% Jamestown village (pt.) 0 0 0 n.a. Balance of Ross township 766 763 750 0.3%Silvercreek township 3,817 3,805 3,738 0.3% Jamestown village (pt.) 2,030 2,024 1,993 0.3% Balance of Silvercreek township 1,787 1,781 1,745 0.4%Spring Valley township 2,617 2,609 2,577 0.2% Spring Valley village 484 484 479 0.2% Balance of Spring Valley township 2,133 2,125 2,098 0.3%
Continued
Population

Greene County2016 Population Estimates For Cities, Villages, and Townships
Estimates Average AnnualEstimate Estimate Base Rate of Change
Name 7/1/16 7/1/15 4/1/10 (a) From 2010 (b)
Sugarcreek township 8,266 8,228 8,043 0.4% Centerville city (pt.) 2 2 2 0.0% Balance of Sugarcreek township 8,264 8,226 8,041 0.4%Xenia city 26,238 26,140 25,671 0.4%Xenia township 6,038 6,100 6,581 -1.4%
n.a. - Could not calculate. Division by zero.
(a) Used for calculating average annual rate of change. (b) Average annual rate of change from April 1, 2010 to July 1, 2016.
Source: Population Estimates Division, U.S. Census Bureau. Prepared by: Office of Research, Ohio Development Services Agency.
Population

Guernsey County2016 Population Estimates For Cities, Villages, and Townships
Estimates Average AnnualEstimate Estimate Base Rate of Change
Name 7/1/16 7/1/15 4/1/10 (a) From 2010 (b)
Guernsey County 39,063 39,269 40,091 -0.4%
Byesville village 2,382 2,397 2,446 -0.4%Cambridge city 10,433 10,475 10,638 -0.3%Cumberland village 356 358 364 -0.4%Fairview village (pt.) 81 82 83 -0.4% Also located in Belmont CountyLore City village 318 319 325 -0.3%Old Washington village 271 272 277 -0.3%Pleasant City village 437 440 447 -0.4%Quaker City village 491 494 502 -0.4%Salesville village 126 127 129 -0.4%Senecaville village 449 451 457 -0.3%Balance of Guernsey County 23,719 23,854 24,423 -0.5%
Adams township 1,992 2,003 2,047 -0.4%Cambridge township 14,273 14,335 14,569 -0.3% Cambridge city (pt.) 10,427 10,469 10,632 -0.3% Balance of Cambridge township 3,846 3,866 3,937 -0.4%Center township 1,766 1,775 1,816 -0.4% Lore City village (pt.) 100 100 102 -0.3% Balance of Center township 1,666 1,675 1,714 -0.5%Jackson township 5,067 5,099 5,222 -0.5% Byesville village 2,382 2,397 2,446 -0.4% Cambridge city (pt.) 6 6 6 0.0% Balance of Jackson township 2,679 2,696 2,770 -0.5%Jefferson township 75 76 77 -0.4%Knox township 552 555 566 -0.4%Liberty township 909 914 938 -0.5%Londonderry township 708 712 730 -0.5%Madison township 884 888 913 -0.5%Millwood township 1,386 1,394 1,425 -0.4% Quaker City village 491 494 502 -0.4% Salesville village 126 127 129 -0.4% Balance of Millwood township 769 773 794 -0.5%Monroe township 720 724 743 -0.5%Oxford township 778 783 805 -0.5% Fairview village (pt.) 81 82 83 -0.4% Balance of Oxford township 697 701 722 -0.6%Richland township 2,030 2,040 2,080 -0.4% Lore City village (pt.) 96 96 98 -0.3% Senecaville village 449 451 457 -0.3% Balance of Richland township 1,485 1,493 1,525 -0.4%Spencer township 1,039 1,044 1,068 -0.4% Cumberland village 356 358 364 -0.4% Balance of Spencer township 683 686 704 -0.5%Valley township 2,200 2,215 2,268 -0.5% Pleasant City village 437 440 447 -0.4% Balance of Valley township 1,763 1,775 1,821 -0.5%
Continued
Population

Guernsey County2016 Population Estimates For Cities, Villages, and Townships
Estimates Average AnnualEstimate Estimate Base Rate of Change
Name 7/1/16 7/1/15 4/1/10 (a) From 2010 (b)
Washington township 440 443 450 -0.4%Westland township 2,015 2,026 2,070 -0.4%Wheeling township 667 672 693 -0.6%Wills township 1,562 1,571 1,611 -0.5% Lore City village (pt.) 122 123 125 -0.4% Old Washington village 271 272 277 -0.3% Balance of Wills township 1,169 1,176 1,209 -0.5%
n.a. - Could not calculate. Division by zero.
(a) Used for calculating average annual rate of change. (b) Average annual rate of change from April 1, 2010 to July 1, 2016.
Source: Population Estimates Division, U.S. Census Bureau. Prepared by: Office of Research, Ohio Development Services Agency.
Population

Hamilton County2016 Population Estimates For Cities, Villages, and Townships
Estimates Average AnnualEstimate Estimate Base Rate of Change
Name 7/1/16 7/1/15 4/1/10 (a) From 2010 (b)
Hamilton County 809,099 807,748 802,368 0.1%
Addyston village 936 937 938 0.0%Amberley village 3,604 3,599 3,585 0.1%Arlington Heights village 739 740 745 -0.1%Blue Ash city 12,228 12,160 12,114 0.1%Cheviot city 8,283 8,297 8,375 -0.2%Cincinnati city 298,800 298,654 296,946 0.1%Cleves village 3,400 3,386 3,289 0.5%Deer Park city 5,674 5,683 5,736 -0.2%Elmwood Place village 2,180 2,180 2,188 -0.1%Evendale village 2,767 2,767 2,767 0.0%Fairfax village 1,701 1,703 1,699 0.0%Fairfield city (pt.) 0 0 0 n.a. Also located in Butler CountyForest Park city 18,671 18,677 18,719 0.0%Glendale village 2,157 2,153 2,155 0.0%Golf Manor village 3,579 3,583 3,611 -0.1%Greenhills village 3,588 3,594 3,615 -0.1%Harrison city 11,048 10,663 9,914 1.7%Lincoln Heights village 3,354 3,357 3,286 0.3%Lockland village 3,430 3,426 3,449 -0.1%Loveland city (pt.) 9,865 9,758 9,348 0.9% Also located in Clermont County Also located in Warren CountyMadeira city 9,049 8,978 8,726 0.6%Mariemont village 3,430 3,426 3,403 0.1%Milford city (pt.) 29 29 29 0.0% Also located in Clermont CountyMontgomery city 10,582 10,508 10,251 0.5%Mount Healthy city 6,030 6,038 6,098 -0.2%Newtown village 2,678 2,680 2,672 0.0%North Bend village 861 860 857 0.1%North College Hill city 9,322 9,332 9,397 -0.1%Norwood city 19,876 19,915 19,207 0.5%Reading city 10,317 10,326 10,385 -0.1%St. Bernard village 4,348 4,354 4,368 -0.1%Sharonville city (pt.) 11,380 11,381 11,197 0.3% Also located in Butler CountySilverton village 4,760 4,766 4,781 -0.1%Springdale city 11,205 11,183 11,223 0.0%Terrace Park village 2,273 2,265 2,251 0.2%The Village of Indian Hill city 5,823 5,812 5,785 0.1%Woodlawn village 3,292 3,293 3,294 0.0%Wyoming city 8,517 8,494 8,437 0.2%Balance of Hamilton County 289,323 288,791 287,528 0.1%
Amberley village 3,604 3,599 3,585 0.1%Anderson township 43,807 43,716 43,446 0.1%Arlington Heights village 739 740 745 -0.1%Blue Ash city 12,228 12,160 12,114 0.1%Cheviot city 8,283 8,297 8,375 -0.2%
Continued
Population

Hamilton County2016 Population Estimates For Cities, Villages, and Townships
Estimates Average AnnualEstimate Estimate Base Rate of Change
Name 7/1/16 7/1/15 4/1/10 (a) From 2010 (b)
Cincinnati city 298,800 298,654 296,946 0.1%Colerain township 58,924 58,809 58,499 0.1%Columbia township 4,551 4,545 4,532 0.1%Crosby township 2,758 2,754 2,767 -0.1% Harrison city (pt.) 31 29 29 1.1% Balance of Crosby township 2,727 2,725 2,738 -0.1%Deer Park city 5,674 5,683 5,736 -0.2%Delhi township 29,612 29,562 29,510 0.1%Elmwood Place village 2,180 2,180 2,188 -0.1%Evendale village 2,767 2,767 2,767 0.0%Fairfax village 1,701 1,703 1,699 0.0%Fairfield city (pt.) 0 0 0 n.a.Forest Park city 18,671 18,677 18,719 0.0%Glendale village 2,157 2,153 2,155 0.0%Golf Manor village 3,579 3,583 3,611 -0.1%Green township 58,783 58,672 58,374 0.1%Greenhills village 3,588 3,594 3,615 -0.1%Harrison township 15,170 14,786 14,070 1.2% Harrison city (pt.) 11,017 10,634 9,885 1.7% Balance of Harrison township 4,153 4,152 4,185 -0.1%Lincoln Heights village 3,354 3,357 3,286 0.3%Lockland village 3,430 3,426 3,449 -0.1%Loveland city (pt.) 9,865 9,758 9,348 0.9%Madeira city 9,049 8,978 8,726 0.6%Mariemont village 3,430 3,426 3,403 0.1%Miami township 15,939 15,904 15,757 0.2% Addyston village 936 937 938 0.0% Cleves village (pt.) 3,397 3,383 3,286 0.5% North Bend village 861 860 857 0.1% Balance of Miami township 10,745 10,724 10,676 0.1%Milford city 29 29 29 0.0%Montgomery city 10,582 10,508 10,251 0.5%Mount Healthy city 6,030 6,038 6,098 -0.2%Newtown village 2,678 2,680 2,672 0.0%North College Hill city 9,322 9,332 9,397 -0.1%Norwood city 19,876 19,915 19,207 0.5%Reading city 10,317 10,326 10,385 -0.1%St. Bernard village 4,348 4,354 4,368 -0.1%Sharonville city 11,380 11,381 11,197 0.3%Silverton village 4,760 4,766 4,781 -0.1%Springdale city 11,205 11,183 11,223 0.0%Springfield township 36,532 36,469 36,305 0.1%Sycamore township 19,307 19,275 19,200 0.1%Symmes township 14,844 14,807 14,683 0.2%Terrace Park village 2,273 2,265 2,251 0.2%The Village of Indian Hill city 5,823 5,812 5,785 0.1%Whitewater township 5,341 5,338 5,383 -0.1% Cleves village (pt.) 3 3 3 0.0% Balance of Whitewater township 5,338 5,335 5,380 -0.1%Woodlawn village 3,292 3,293 3,294 0.0%Wyoming city 8,517 8,494 8,437 0.2%
n.a. - Could not calculate. Division by zero.
(a) Used for calculating average annual rate of change. (b) Average annual rate of change from April 1, 2010 to July 1, 2016.
Source: Population Estimates Division, U.S. Census Bureau. Prepared by: Office of Research, Ohio Development Services Agency.
Population

Hancock County2016 Population Estimates For Cities, Villages, and Townships
Estimates Average AnnualEstimate Estimate Base Rate of Change
Name 7/1/16 7/1/15 4/1/10 (a) From 2010 (b)
Hancock County 75,872 75,734 74,789 0.2%
Arcadia village 600 601 599 0.0%Arlington village 1,463 1,466 1,465 0.0%Benton Ridge village 296 297 297 -0.1%Bluffton village (pt.) 170 171 171 -0.1% Also located in Allen CountyFindlay city 41,422 41,382 41,184 0.1%Fostoria city (pt.) 2,906 2,915 2,931 -0.1% Also located in Wood County Also located in Seneca CountyJenera village 220 221 221 -0.1%McComb village 1,654 1,658 1,649 0.0%Mount Blanchard village 487 489 489 -0.1%Mount Cory village 203 204 204 -0.1%Rawson village 568 569 572 -0.1%Van Buren village 385 368 324 2.8%Vanlue village 361 362 362 0.0%Balance of Hancock County 25,137 25,031 24,321 0.5%
Allen township 2,589 2,577 2,532 0.4% Van Buren village 385 368 324 2.8% Balance of Allen township 2,204 2,209 2,208 0.0%Amanda township 1,031 1,034 1,022 0.1% Vanlue village 361 362 362 0.0% Balance of Amanda township 670 672 660 0.2%Arlington village 1,463 1,466 1,465 0.0%Biglick township 1,102 1,104 1,105 0.0%Blanchard township 1,117 1,120 1,121 -0.1% Benton Ridge village 296 297 297 -0.1% Balance of Blanchard township 821 823 824 -0.1%Cass township 1,004 1,001 992 0.2%Delaware township 1,309 1,307 1,282 0.3% Mount Blanchard village 487 489 489 -0.1% Balance of Delaware township 822 818 793 0.6%Eagle township 1,158 1,144 1,083 1.1%Findlay city 41,422 41,382 41,184 0.1%Jackson township 1,084 1,079 1,072 0.2%Liberty township 7,129 7,082 6,678 1.1%Madison township 835 837 838 -0.1%Marion township 2,980 2,934 2,763 1.2%Orange township 1,349 1,352 1,356 -0.1% Bluffton village (pt.) 170 171 171 -0.1% Balance of Orange township 1,179 1,181 1,185 -0.1%Pleasant township 2,470 2,476 2,468 0.0% McComb village 1,654 1,658 1,649 0.0% Balance of Pleasant township 816 818 819 -0.1%Portage township 698 699 687 0.3%Union township 1,777 1,781 1,785 -0.1% Mount Cory village 203 204 204 -0.1% Rawson village 568 569 572 -0.1% Balance of Union township 1,006 1,008 1,009 0.0%
Continued
Population

Hancock County2016 Population Estimates For Cities, Villages, and Townships
Estimates Average AnnualEstimate Estimate Base Rate of Change
Name 7/1/16 7/1/15 4/1/10 (a) From 2010 (b)
Van Buren township 931 926 915 0.3% Jenera village 220 221 221 -0.1% Balance of Van Buren township 711 705 694 0.4%Washington township 4,424 4,433 4,441 -0.1% Arcadia village 600 601 599 0.0% Fostoria city (pt.) 2,906 2,915 2,931 -0.1% Balance of Washington township 918 917 911 0.1%
n.a. - Could not calculate. Division by zero.
(a) Used for calculating average annual rate of change. (b) Average annual rate of change from April 1, 2010 to July 1, 2016.
Source: Population Estimates Division, U.S. Census Bureau. Prepared by: Office of Research, Ohio Development Services Agency.
Population
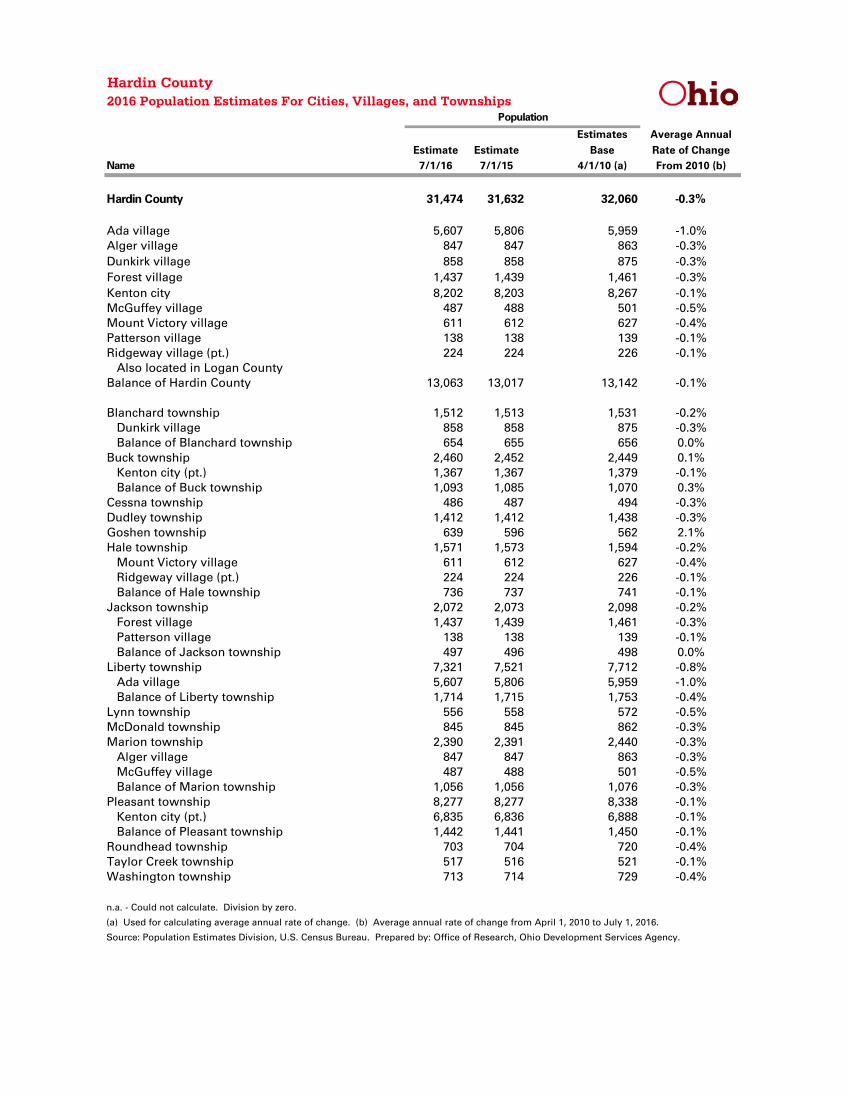
Hardin County2016 Population Estimates For Cities, Villages, and Townships
Estimates Average AnnualEstimate Estimate Base Rate of Change
Name 7/1/16 7/1/15 4/1/10 (a) From 2010 (b)
Hardin County 31,474 31,632 32,060 -0.3%
Ada village 5,607 5,806 5,959 -1.0%Alger village 847 847 863 -0.3%Dunkirk village 858 858 875 -0.3%Forest village 1,437 1,439 1,461 -0.3%Kenton city 8,202 8,203 8,267 -0.1%McGuffey village 487 488 501 -0.5%Mount Victory village 611 612 627 -0.4%Patterson village 138 138 139 -0.1%Ridgeway village (pt.) 224 224 226 -0.1% Also located in Logan CountyBalance of Hardin County 13,063 13,017 13,142 -0.1%
Blanchard township 1,512 1,513 1,531 -0.2% Dunkirk village 858 858 875 -0.3% Balance of Blanchard township 654 655 656 0.0%Buck township 2,460 2,452 2,449 0.1% Kenton city (pt.) 1,367 1,367 1,379 -0.1% Balance of Buck township 1,093 1,085 1,070 0.3%Cessna township 486 487 494 -0.3%Dudley township 1,412 1,412 1,438 -0.3%Goshen township 639 596 562 2.1%Hale township 1,571 1,573 1,594 -0.2% Mount Victory village 611 612 627 -0.4% Ridgeway village (pt.) 224 224 226 -0.1% Balance of Hale township 736 737 741 -0.1%Jackson township 2,072 2,073 2,098 -0.2% Forest village 1,437 1,439 1,461 -0.3% Patterson village 138 138 139 -0.1% Balance of Jackson township 497 496 498 0.0%Liberty township 7,321 7,521 7,712 -0.8% Ada village 5,607 5,806 5,959 -1.0% Balance of Liberty township 1,714 1,715 1,753 -0.4%Lynn township 556 558 572 -0.5%McDonald township 845 845 862 -0.3%Marion township 2,390 2,391 2,440 -0.3% Alger village 847 847 863 -0.3% McGuffey village 487 488 501 -0.5% Balance of Marion township 1,056 1,056 1,076 -0.3%Pleasant township 8,277 8,277 8,338 -0.1% Kenton city (pt.) 6,835 6,836 6,888 -0.1% Balance of Pleasant township 1,442 1,441 1,450 -0.1%Roundhead township 703 704 720 -0.4%Taylor Creek township 517 516 521 -0.1%Washington township 713 714 729 -0.4%
n.a. - Could not calculate. Division by zero.
(a) Used for calculating average annual rate of change. (b) Average annual rate of change from April 1, 2010 to July 1, 2016.
Source: Population Estimates Division, U.S. Census Bureau. Prepared by: Office of Research, Ohio Development Services Agency.
Population

Harrison County2016 Population Estimates For Cities, Villages, and Townships
Estimates Average AnnualEstimate Estimate Base Rate of Change
Name 7/1/16 7/1/15 4/1/10 (a) From 2010 (b)
Harrison County 15,307 15,424 15,862 -0.6%
Adena village (pt.) 121 122 123 -0.3% Also located in Jefferson CountyBowerston village 383 384 398 -0.6%Cadiz village 3,242 3,267 3,353 -0.5%Deersville village 78 78 79 -0.2%Freeport village 351 355 369 -0.8%Harrisville village 231 232 235 -0.3%Hopedale village 926 930 950 -0.4%Jewett village 668 674 692 -0.6%New Athens village 312 314 328 -0.8%Scio village 739 745 763 -0.5%Balance of Harrison County 8,256 8,323 8,572 -0.6%
Archer township 297 300 311 -0.7%Athens township 481 484 503 -0.7% New Athens village 312 314 328 -0.8% Balance of Athens township 169 170 175 -0.6%Cadiz township 3,563 3,591 3,689 -0.6% Cadiz village 3,242 3,267 3,353 -0.5% Balance of Cadiz township 321 324 336 -0.7%Franklin township 586 590 603 -0.5% Deersville village 78 78 79 -0.2% Balance of Franklin township 508 512 524 -0.5%Freeport township 711 718 745 -0.7% Freeport village 351 355 369 -0.8% Balance of Freeport township 360 363 376 -0.7%German township 777 783 805 -0.6%Green township 1,827 1,837 1,887 -0.5% Hopedale village 926 930 950 -0.4% Balance of Green township 901 907 937 -0.6%Monroe township 1,151 1,158 1,198 -0.6% Bowerston village 383 384 398 -0.6% Balance of Monroe township 768 774 800 -0.7%Moorefield township 388 392 403 -0.6%North township 1,654 1,667 1,717 -0.6% Scio village 739 745 763 -0.5% Balance of North township 915 922 954 -0.7%Nottingham township 312 315 324 -0.6%Rumley township 1,422 1,434 1,471 -0.5% Jewett village 668 674 692 -0.6% Balance of Rumley township 754 760 779 -0.5%Short Creek township 1,060 1,068 1,090 -0.4% Adena village (pt.) 121 122 123 -0.3% Harrisville village 231 232 235 -0.3% Balance of Short Creek township 708 714 732 -0.5%Stock township 462 466 478 -0.5%Washington township 616 621 638 -0.6%
n.a. - Could not calculate. Division by zero.
(a) Used for calculating average annual rate of change. (b) Average annual rate of change from April 1, 2010 to July 1, 2016.
Source: Population Estimates Division, U.S. Census Bureau. Prepared by: Office of Research, Ohio Development Services Agency.
Population
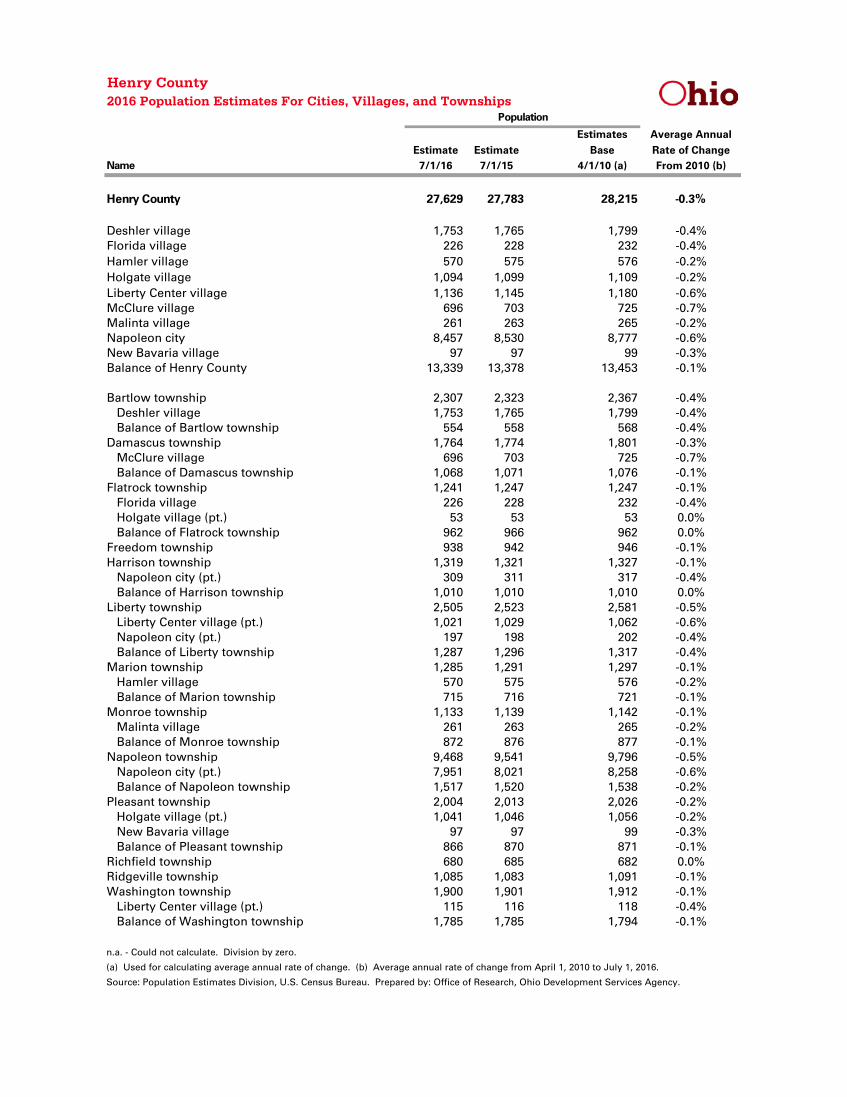
Henry County2016 Population Estimates For Cities, Villages, and Townships
Estimates Average AnnualEstimate Estimate Base Rate of Change
Name 7/1/16 7/1/15 4/1/10 (a) From 2010 (b)
Henry County 27,629 27,783 28,215 -0.3%
Deshler village 1,753 1,765 1,799 -0.4%Florida village 226 228 232 -0.4%Hamler village 570 575 576 -0.2%Holgate village 1,094 1,099 1,109 -0.2%Liberty Center village 1,136 1,145 1,180 -0.6%McClure village 696 703 725 -0.7%Malinta village 261 263 265 -0.2%Napoleon city 8,457 8,530 8,777 -0.6%New Bavaria village 97 97 99 -0.3%Balance of Henry County 13,339 13,378 13,453 -0.1%
Bartlow township 2,307 2,323 2,367 -0.4% Deshler village 1,753 1,765 1,799 -0.4% Balance of Bartlow township 554 558 568 -0.4%Damascus township 1,764 1,774 1,801 -0.3% McClure village 696 703 725 -0.7% Balance of Damascus township 1,068 1,071 1,076 -0.1%Flatrock township 1,241 1,247 1,247 -0.1% Florida village 226 228 232 -0.4% Holgate village (pt.) 53 53 53 0.0% Balance of Flatrock township 962 966 962 0.0%Freedom township 938 942 946 -0.1%Harrison township 1,319 1,321 1,327 -0.1% Napoleon city (pt.) 309 311 317 -0.4% Balance of Harrison township 1,010 1,010 1,010 0.0%Liberty township 2,505 2,523 2,581 -0.5% Liberty Center village (pt.) 1,021 1,029 1,062 -0.6% Napoleon city (pt.) 197 198 202 -0.4% Balance of Liberty township 1,287 1,296 1,317 -0.4%Marion township 1,285 1,291 1,297 -0.1% Hamler village 570 575 576 -0.2% Balance of Marion township 715 716 721 -0.1%Monroe township 1,133 1,139 1,142 -0.1% Malinta village 261 263 265 -0.2% Balance of Monroe township 872 876 877 -0.1%Napoleon township 9,468 9,541 9,796 -0.5% Napoleon city (pt.) 7,951 8,021 8,258 -0.6% Balance of Napoleon township 1,517 1,520 1,538 -0.2%Pleasant township 2,004 2,013 2,026 -0.2% Holgate village (pt.) 1,041 1,046 1,056 -0.2% New Bavaria village 97 97 99 -0.3% Balance of Pleasant township 866 870 871 -0.1%Richfield township 680 685 682 0.0%Ridgeville township 1,085 1,083 1,091 -0.1%Washington township 1,900 1,901 1,912 -0.1% Liberty Center village (pt.) 115 116 118 -0.4% Balance of Washington township 1,785 1,785 1,794 -0.1%
n.a. - Could not calculate. Division by zero.
(a) Used for calculating average annual rate of change. (b) Average annual rate of change from April 1, 2010 to July 1, 2016.
Source: Population Estimates Division, U.S. Census Bureau. Prepared by: Office of Research, Ohio Development Services Agency.
Population

Highland County2016 Population Estimates For Cities, Villages, and Townships
Estimates Average AnnualEstimate Estimate Base Rate of Change
Name 7/1/16 7/1/15 4/1/10 (a) From 2010 (b)
Highland County 43,029 43,018 43,600 -0.2%
Greenfield village (pt.) 4,589 4,584 4,632 -0.1% Also located in Ross CountyHighland village 254 254 254 0.0%Hillsboro city 6,580 6,574 6,604 -0.1%Leesburg village 1,298 1,293 1,316 -0.2%Lynchburg village (pt.) 1,482 1,477 1,491 -0.1% Also located in Clinton CountyMowrystown village 353 352 362 -0.4%Sardinia village (pt.) 0 0 0 n.a. Also located in Brown CountySinking Spring village 131 131 131 0.0%Balance of Highland County 28,342 28,353 28,810 -0.3%
Brushcreek township 1,341 1,342 1,368 -0.3% Sinking Spring village 131 131 131 0.0% Balance of Brushcreek township 1,210 1,211 1,237 -0.4%Clay township 1,401 1,400 1,427 -0.3%Concord township 1,393 1,392 1,415 -0.3%Dodson township 2,583 2,578 2,611 -0.2% Lynchburg village (pt.) 1,482 1,477 1,491 -0.1% Balance of Dodson township 1,101 1,101 1,120 -0.3%Fairfield township 3,706 3,701 3,762 -0.2% Highland village 254 254 254 0.0% Leesburg village 1,298 1,293 1,316 -0.2% Balance of Fairfield township 2,154 2,154 2,192 -0.3%Hamer township 671 672 684 -0.3%Jackson township 1,100 1,100 1,103 0.0%Liberty township 10,165 10,159 10,245 -0.1% Hillsboro city 6,580 6,574 6,604 -0.1% Balance of Liberty township 3,585 3,585 3,641 -0.2%Madison township 6,681 6,677 6,723 -0.1% Greenfield village (pt.) 4,589 4,584 4,632 -0.1% Balance of Madison township 2,092 2,093 2,091 0.0%Marshall township 1,006 1,007 1,032 -0.4%New Market township 1,863 1,864 1,893 -0.3%Paint township 4,465 4,471 4,592 -0.4%Penn township 1,389 1,389 1,414 -0.3%Salem township 798 799 784 0.3%Union township 2,028 2,029 2,061 -0.3%Washington township 1,094 1,094 1,119 -0.4%Whiteoak township 1,345 1,344 1,367 -0.3% Mowrystown village 353 352 362 -0.4% Sardinia village (pt.) 0 0 0 n.a. Balance of Whiteoak township 992 992 1,005 -0.2%
n.a. - Could not calculate. Division by zero.
(a) Used for calculating average annual rate of change. (b) Average annual rate of change from April 1, 2010 to July 1, 2016.
Source: Population Estimates Division, U.S. Census Bureau. Prepared by: Office of Research, Ohio Development Services Agency.
Population

Hocking County2016 Population Estimates For Cities, Villages, and Townships
Estimates Average AnnualEstimate Estimate Base Rate of Change
Name 7/1/16 7/1/15 4/1/10 (a) From 2010 (b)
Hocking County 28,340 28,474 29,375 -0.6%
Buchtel village (pt.) 15 15 15 0.0% Also located in Athens CountyLaurelville village 510 513 525 -0.5%Logan city 7,085 7,104 7,111 -0.1%Murray City village 438 440 453 -0.5%Balance of Hocking County 20,292 20,402 21,271 -0.8%
Benton township 786 790 803 -0.3%Falls township 11,562 11,605 11,728 -0.2% Logan city (pt.) 6,460 6,476 6,485 -0.1% Balance of Falls township 5,102 5,129 5,243 -0.4%Good Hope township 1,356 1,364 1,395 -0.5%Green township 3,184 3,202 3,265 -0.4% Logan city (pt.) 625 628 626 0.0% Balance of Green township 2,559 2,574 2,639 -0.5%Laurel township 1,144 1,149 1,166 -0.3%Marion township 2,402 2,415 2,462 -0.4%Perry township 2,491 2,504 2,560 -0.4% Laurelville village 510 513 525 -0.5% Balance of Perry township 1,981 1,991 2,035 -0.4%Salt Creek township 1,174 1,181 1,210 -0.5%Starr township 1,514 1,523 1,560 -0.5%Ward township 1,474 1,481 1,932 -4.2% Buchtel village (pt.) 15 15 15 0.0% Murray City village 438 440 453 -0.5% Balance of Ward township 1,021 1,026 1,464 -5.6%Washington township 1,253 1,260 1,294 -0.5%
n.a. - Could not calculate. Division by zero.
(a) Used for calculating average annual rate of change. (b) Average annual rate of change from April 1, 2010 to July 1, 2016.
Source: Population Estimates Division, U.S. Census Bureau. Prepared by: Office of Research, Ohio Development Services Agency.
Population

Holmes County2016 Population Estimates For Cities, Villages, and Townships
Estimates Average AnnualEstimate Estimate Base Rate of Change
Name 7/1/16 7/1/15 4/1/10 (a) From 2010 (b)
Holmes County 43,936 43,939 42,366 0.6%
Baltic village (pt.) 147 147 144 0.3% Also located in Tuscarawas County Also located in Coshocton CountyGlenmont village 290 289 269 1.2%Holmesville village 406 406 372 1.4%Killbuck village 925 925 852 1.3%Loudonville village (pt.) 60 60 55 1.4% Also located in Ashland CountyMillersburg village 3,165 3,157 3,032 0.7%Nashville village 180 180 163 1.6%Balance of Holmes County 38,763 38,775 37,479 0.5%
Berlin township 4,402 4,404 4,250 0.6%Clark township 4,229 4,230 4,083 0.6% Baltic village (pt.) 147 147 144 0.3% Balance of Clark township 4,082 4,083 3,939 0.6%Hardy township 5,993 5,986 5,773 0.6% Millersburg village 3,165 3,157 3,032 0.7% Balance of Hardy township 2,828 2,829 2,741 0.5%Killbuck township 2,081 2,081 1,975 0.8% Killbuck village 925 925 852 1.3% Balance of Killbuck township 1,156 1,156 1,123 0.5%Knox township 1,152 1,152 1,117 0.5% Nashville village (pt.) 42 42 38 1.6% Balance of Knox township 1,110 1,110 1,079 0.5%Mechanic township 3,234 3,234 3,127 0.5%Monroe township 1,637 1,637 1,580 0.6%Paint township 4,291 4,291 4,134 0.6%Prairie township 3,123 3,125 3,003 0.6% Holmesville village 406 406 372 1.4% Balance of Prairie township 2,717 2,719 2,631 0.5%Richland township 1,337 1,336 1,284 0.6% Glenmont village 290 289 269 1.2% Balance of Richland township 1,047 1,047 1,015 0.5%Ripley township 2,407 2,409 2,340 0.5%Salt Creek township 4,420 4,421 4,260 0.6%Walnut Creek township 3,954 3,955 3,818 0.6%Washington township 1,676 1,678 1,622 0.5% Loudonville village (pt.) 60 60 55 1.4% Nashville village (pt.) 138 138 125 1.6% Balance of Washington township 1,478 1,480 1,442 0.4%
n.a. - Could not calculate. Division by zero.
(a) Used for calculating average annual rate of change. (b) Average annual rate of change from April 1, 2010 to July 1, 2016.
Source: Population Estimates Division, U.S. Census Bureau. Prepared by: Office of Research, Ohio Development Services Agency.
Population

Huron County2016 Population Estimates For Cities, Villages, and Townships
Estimates Average AnnualEstimate Estimate Base Rate of Change
Name 7/1/16 7/1/15 4/1/10 (a) From 2010 (b)
Huron County 58,439 58,366 59,626 -0.3%
Bellevue city (pt.) 3,559 3,562 3,673 -0.5% Also located in Erie County Also located in Sandusky CountyGreenwich village 1,425 1,427 1,476 -0.6%Milan village (pt.) 357 357 363 -0.3% Also located in Erie CountyMonroeville village 1,370 1,370 1,400 -0.3%New London village 2,376 2,379 2,461 -0.6%North Fairfield village 534 536 560 -0.8%Norwalk city 16,838 16,800 17,013 -0.2%Plymouth village (pt.) 880 881 909 -0.5% Also located in Richland CountyWakeman village 1,032 1,031 1,047 -0.2%Willard city 6,060 6,061 6,236 -0.5%Balance of Huron County 24,008 23,962 24,488 -0.3%
Bellevue city (pt.) 3,559 3,562 3,673 -0.5%Bronson township 1,963 1,961 1,973 -0.1%Clarksfield township 1,601 1,599 1,625 -0.2%Fairfield township 1,168 1,169 1,218 -0.7% North Fairfield village 534 536 560 -0.8% Balance of Fairfield township 634 633 658 -0.6%Fitchville township 1,024 1,025 1,056 -0.5%Greenfield township 1,420 1,392 1,374 0.5%Greenwich village 1,425 1,427 1,476 -0.6%Greenwich township 1,035 1,034 1,044 -0.1%Hartland township 1,079 1,080 1,112 -0.5%Lyme township 839 836 853 -0.3%New Haven township 2,535 2,538 2,621 -0.5% Plymouth village (pt.) 880 881 909 -0.5% Balance of New Haven township 1,655 1,657 1,712 -0.5%New London township 3,162 3,164 3,268 -0.5% New London village 2,376 2,379 2,461 -0.6% Balance of New London township 786 785 807 -0.4%Norwalk city 16,838 16,800 17,013 -0.2%Norwalk township 3,470 3,473 3,590 -0.5% Milan village (pt.) 357 357 363 -0.3% Balance of Norwalk township 3,113 3,116 3,227 -0.6%Norwich township 1,057 1,051 1,070 -0.2%Peru township 1,071 1,072 1,105 -0.5%Richmond township 1,073 1,074 1,102 -0.4%Ridgefield township 2,299 2,295 2,329 -0.2% Monroeville village 1,370 1,370 1,400 -0.3% Balance of Ridgefield township 929 925 929 0.0%Ripley township 999 995 1,024 -0.4%
Continued
Population

Huron County2016 Population Estimates For Cities, Villages, and Townships
Estimates Average AnnualEstimate Estimate Base Rate of Change
Name 7/1/16 7/1/15 4/1/10 (a) From 2010 (b)
Sherman township 511 508 510 0.0%Townsend township 1,594 1,594 1,623 -0.3%Wakeman township 2,657 2,656 2,731 -0.4% Wakeman village 1,032 1,031 1,047 -0.2% Balance of Wakeman township 1,625 1,625 1,684 -0.6%Willard city 6,060 6,061 6,236 -0.5%
n.a. - Could not calculate. Division by zero.
(a) Used for calculating average annual rate of change. (b) Average annual rate of change from April 1, 2010 to July 1, 2016.
Source: Population Estimates Division, U.S. Census Bureau. Prepared by: Office of Research, Ohio Development Services Agency.
Population

Jackson County2016 Population Estimates For Cities, Villages, and Townships
Estimates Average AnnualEstimate Estimate Base Rate of Change
Name 7/1/16 7/1/15 4/1/10 (a) From 2010 (b)
Jackson County 32,505 32,546 33,224 -0.3%
Coalton village 472 474 479 -0.2%Jackson city 6,320 6,324 6,397 -0.2%Oak Hill village 1,511 1,513 1,551 -0.4%Wellston city 5,554 5,562 5,663 -0.3%Balance of Jackson County 18,648 18,673 19,134 -0.4%
Bloomfield township 1,107 1,108 1,139 -0.5%Coal township 1,928 1,932 1,974 -0.4% Coalton village 472 474 479 -0.2% Balance of Coal township 1,456 1,458 1,495 -0.4%Franklin township 2,091 2,093 2,129 -0.3%Hamilton township 596 598 614 -0.5%Jackson city 6,320 6,324 6,397 -0.2%Jackson township 1,271 1,273 1,313 -0.5%Jefferson township 3,498 3,503 3,597 -0.4% Oak Hill village (pt.) 890 890 912 -0.4% Balance of Jefferson township 2,608 2,613 2,685 -0.5%Liberty township 1,781 1,782 1,819 -0.3%Lick township 2,596 2,599 2,661 -0.4%Madison township 2,128 2,133 2,187 -0.4% Oak Hill village (pt.) 621 623 639 -0.5% Balance of Madison township 1,507 1,510 1,548 -0.4%Milton township 1,001 1,002 1,028 -0.4%Scioto township 1,869 1,872 1,921 -0.4%Washington township 765 765 782 -0.4%Wellston city 5,554 5,562 5,663 -0.3%
n.a. - Could not calculate. Division by zero.
(a) Used for calculating average annual rate of change. (b) Average annual rate of change from April 1, 2010 to July 1, 2016.
Source: Population Estimates Division, U.S. Census Bureau. Prepared by: Office of Research, Ohio Development Services Agency.
Population

Jefferson County2016 Population Estimates For Cities, Villages, and Townships
Estimates Average AnnualEstimate Estimate Base Rate of Change
Name 7/1/16 7/1/15 4/1/10 (a) From 2010 (b)
Jefferson County 66,704 67,327 69,709 -0.7%
Adena village (pt.) 604 610 636 -0.8% Also located in Harrison CountyAmsterdam village 483 488 511 -0.9%Bergholz village 632 638 664 -0.8%Bloomingdale village 196 197 202 -0.5%Dillonvale village 634 640 665 -0.8%Empire village 277 281 299 -1.2%Irondale village 359 363 384 -1.1%Mingo Junction village 3,302 3,332 3,454 -0.7%Mount Pleasant village 451 456 478 -0.9%New Alexandria village 263 266 272 -0.5%Rayland village 396 398 417 -0.8%Richmond village 455 460 481 -0.9%Smithfield village 830 837 867 -0.7%Steubenville city 18,072 18,258 18,659 -0.5%Stratton village 274 278 294 -1.1%Tiltonsville village 1,312 1,323 1,372 -0.7%Toronto city 4,851 4,893 5,091 -0.8%Wintersville village 3,774 3,804 3,924 -0.6%Yorkville village (pt.) 587 592 615 -0.7% Also located in Belmont CountyBalance of Jefferson County 28,952 29,213 30,424 -0.8%
Brush Creek township 412 417 438 -1.0%Cross Creek township 7,994 8,060 8,345 -0.7% New Alexandria village (pt.) 242 244 250 -0.5% Wintersville village (pt.) 2,777 2,798 2,884 -0.6% Balance of Cross Creek township 4,975 5,018 5,211 -0.7%Island Creek township 10,057 10,146 10,549 -0.8% Toronto city (pt.) 2,891 2,916 3,029 -0.7% Wintersville village (pt.) 997 1,006 1,040 -0.7% Balance of Island Creek township 6,169 6,224 6,480 -0.8%Knox township 4,425 4,467 4,670 -0.9% Empire village 277 281 299 -1.2% Stratton village (pt.) 242 246 261 -1.2% Toronto city (pt.) 1,960 1,977 2,062 -0.8% Balance of Knox township 1,946 1,963 2,048 -0.8%Mount Pleasant township 2,247 2,269 2,368 -0.8% Dillonvale village (pt.) 490 495 516 -0.8% Mount Pleasant village 451 456 478 -0.9% Balance of Mount Pleasant township 1,306 1,318 1,374 -0.8%Ross township 684 691 721 -0.8%Salem township 2,995 3,023 3,148 -0.8% Richmond village 455 460 481 -0.9% Balance of Salem township 2,540 2,563 2,667 -0.8%Saline township 1,277 1,289 1,353 -0.9% Irondale village 359 363 384 -1.1% Stratton village (pt.) 32 32 33 -0.5% Balance of Saline township 886 894 936 -0.9%
Continued
Population

Jefferson County2016 Population Estimates For Cities, Villages, and Townships
Estimates Average AnnualEstimate Estimate Base Rate of Change
Name 7/1/16 7/1/15 4/1/10 (a) From 2010 (b)
Smithfield township 3,306 3,336 3,473 -0.8% Adena village (pt.) 604 610 636 -0.8% Dillonvale village (pt.) 144 145 149 -0.5% Smithfield village 830 837 867 -0.7% Balance of Smithfield township 1,728 1,744 1,821 -0.8%Springfield township 2,243 2,265 2,367 -0.9% Amsterdam village 483 488 511 -0.9% Bergholz village 632 638 664 -0.8% Balance of Springfield township 1,128 1,139 1,192 -0.9%Steubenville city 18,072 18,258 18,659 -0.5%Steubenville township 4,129 4,166 4,319 -0.7% Mingo Junction village 3,302 3,332 3,454 -0.7% Balance of Steubenville township 827 834 865 -0.7%Warren township 4,036 4,069 4,232 -0.8% Rayland village 396 398 417 -0.8% Tiltonsville village 1,312 1,323 1,372 -0.7% Yorkville village (pt.) 587 592 615 -0.7% Balance of Warren township 1,741 1,756 1,828 -0.8%Wayne township 2,134 2,152 2,232 -0.7% Bloomingdale village 196 197 202 -0.5% Balance of Wayne township 1,938 1,955 2,030 -0.7%Wells township 2,693 2,719 2,835 -0.8% New Alexandria village (pt.) 21 22 22 -0.7% Balance of Wells township 2,672 2,697 2,813 -0.8%
n.a. - Could not calculate. Division by zero.
(a) Used for calculating average annual rate of change. (b) Average annual rate of change from April 1, 2010 to July 1, 2016.
Source: Population Estimates Division, U.S. Census Bureau. Prepared by: Office of Research, Ohio Development Services Agency.
Population

Knox County2016 Population Estimates For Cities, Villages, and Townships
Estimates Average AnnualEstimate Estimate Base Rate of Change
Name 7/1/16 7/1/15 4/1/10 (a) From 2010 (b)
Knox County 60,814 60,973 60,930 0.0%
Centerburg village 2,113 2,050 1,773 2.8%Danville village 1,010 1,017 1,044 -0.5%Fredericktown village 2,466 2,485 2,493 -0.2%Gambier village 2,423 2,435 2,391 0.2%Gann village 122 123 125 -0.4%Martinsburg village 232 233 237 -0.3%Mount Vernon city 16,620 16,713 16,988 -0.3%Utica village (pt.) 20 20 20 0.0% Also located in Licking CountyBalance of Knox County 35,808 35,897 35,859 0.0%
Berlin township 1,710 1,712 1,738 -0.3%Brown township 2,033 2,035 1,862 1.4%Butler township 1,123 1,132 1,171 -0.7%Clay township 1,551 1,562 1,604 -0.5% Martinsburg village 232 233 237 -0.3% Balance of Clay township 1,319 1,329 1,367 -0.6%Clinton township 2,751 2,771 2,826 -0.4%College township 2,767 2,779 2,731 0.2% Gambier village 2,423 2,435 2,391 0.2% Balance of College township 344 344 340 0.2%Fredericktown village 2,466 2,485 2,493 -0.2%Harrison township 813 817 806 0.1%Hilliar township 4,078 4,004 3,715 1.5% Centerburg village 2,113 2,050 1,773 2.8% Balance of Hilliar township 1,965 1,954 1,942 0.2%Howard township 5,724 5,715 5,612 0.3%Jackson township 953 961 988 -0.6%Jefferson township 633 639 633 0.0%Liberty township 1,725 1,719 1,714 0.1%Middlebury township 1,311 1,311 1,278 0.4%Milford township 1,784 1,786 1,772 0.1%Miller township 1,015 1,016 1,006 0.1%Monroe township 2,030 2,053 2,165 -1.0%Morgan township 1,105 1,102 1,094 0.2% Utica village (pt.) 20 20 20 0.0% Balance of Morgan township 1,085 1,082 1,074 0.2%Morris township 2,031 2,037 2,049 -0.1%Mount Vernon city 16,620 16,713 16,988 -0.3%Pike township 1,506 1,514 1,532 -0.3%Pleasant township 1,618 1,622 1,606 0.1%Union township 2,570 2,588 2,651 -0.5% Danville village 1,010 1,017 1,044 -0.5% Gann village 122 123 125 -0.4% Balance of Union township 1,438 1,448 1,482 -0.5%Wayne township 897 900 896 0.0%
n.a. - Could not calculate. Division by zero.
(a) Used for calculating average annual rate of change. (b) Average annual rate of change from April 1, 2010 to July 1, 2016.
Source: Population Estimates Division, U.S. Census Bureau. Prepared by: Office of Research, Ohio Development Services Agency.
Population

Lake County2016 Population Estimates For Cities, Villages, and Townships
Estimates Average AnnualEstimate Estimate Base Rate of Change
Name 7/1/16 7/1/15 4/1/10 (a) From 2010 (b)
Lake County 228,614 229,262 230,050 -0.1%
Eastlake city 18,134 18,272 18,620 -0.4%Fairport Harbor village 3,059 3,075 3,116 -0.3%Grand River village 399 401 406 -0.3%Kirtland city 6,773 6,802 6,861 -0.2%Kirtland Hills village 639 640 646 -0.2%Lakeline village 222 223 226 -0.3%Madison village 3,148 3,160 3,184 -0.2%Mentor city 46,732 46,894 47,159 -0.1%Mentor-on-the-Lake city 7,371 7,399 7,443 -0.2%North Perry village 882 885 893 -0.2%Painesville city 19,691 19,773 19,530 0.1%Perry village 1,618 1,625 1,635 -0.2%Timberlake village 650 656 675 -0.6%Waite Hill village 452 457 471 -0.7%Wickliffe city 12,689 12,719 12,752 -0.1%Willoughby city 22,769 22,590 22,231 0.4%Willoughby Hills city 9,482 9,489 9,486 0.0%Willowick city 14,087 14,148 14,175 -0.1%Balance of Lake County 59,817 60,054 60,541 -0.2%
Concord township 18,066 18,128 18,201 -0.1%Eastlake city 18,134 18,272 18,620 -0.4%Kirtland city 6,773 6,802 6,861 -0.2%Kirtland Hills village 639 640 646 -0.2%Lakeline village 222 223 226 -0.3%Leroy township 3,219 3,231 3,253 -0.2%Madison township 18,577 18,659 18,884 -0.3% Madison village 3,148 3,160 3,184 -0.2% North Perry village (pt.) 6 6 6 0.0% Balance of Madison township 15,423 15,493 15,694 -0.3%Mentor city 46,732 46,894 47,159 -0.1%Mentor-on-the-Lake city 7,371 7,399 7,443 -0.2%Painesville city 19,691 19,773 19,530 0.1%Painesville township 20,173 20,258 20,438 -0.2% Fairport Harbor village 3,059 3,075 3,116 -0.3% Grand River village 399 401 406 -0.3% Balance of Painesville township 16,715 16,782 16,916 -0.2%Perry township 8,888 8,924 8,999 -0.2% North Perry village (pt.) 876 879 887 -0.2% Perry village 1,618 1,625 1,635 -0.2% Balance of Perry township 6,394 6,420 6,477 -0.2%Timberlake village 650 656 675 -0.6%Waite Hill village 452 457 471 -0.7%Wickliffe city 12,689 12,719 12,752 -0.1%Willoughby city 22,769 22,590 22,231 0.4%Willoughby Hills city 9,482 9,489 9,486 0.0%Willowick city 14,087 14,148 14,175 -0.1%
n.a. - Could not calculate. Division by zero.
(a) Used for calculating average annual rate of change. (b) Average annual rate of change from April 1, 2010 to July 1, 2016.
Source: Population Estimates Division, U.S. Census Bureau. Prepared by: Office of Research, Ohio Development Services Agency.
Population

Lawrence County2016 Population Estimates For Cities, Villages, and Townships
Estimates Average AnnualEstimate Estimate Base Rate of Change
Name 7/1/16 7/1/15 4/1/10 (a) From 2010 (b)
Lawrence County 60,872 61,042 62,448 -0.4%
Athalia village 369 369 373 -0.2%Chesapeake village 725 728 745 -0.4%Coal Grove village 2,141 2,147 2,165 -0.2%Hanging Rock village 218 219 221 -0.2%Ironton city 10,891 10,921 11,129 -0.3%Proctorville village 556 558 574 -0.5%South Point village 3,938 3,930 3,958 -0.1%Balance of Lawrence County 42,034 42,170 43,283 -0.5%
Aid township 851 854 875 -0.4%Decatur township 703 706 726 -0.5%Elizabeth township 2,868 2,880 2,969 -0.6%Fayette township 8,993 9,009 9,194 -0.4% South Point village (pt.) 2,553 2,548 2,566 -0.1% Balance of Fayette township 6,440 6,461 6,628 -0.5%Hamilton township 1,724 1,731 1,772 -0.4% Hanging Rock village 218 219 221 -0.2% Ironton city (pt.) 822 825 845 -0.4% Balance of Hamilton township 684 687 706 -0.5%Lawrence township 2,500 2,509 2,579 -0.5%Mason township 1,070 1,075 1,116 -0.7%Perry township 6,815 6,827 6,973 -0.4% Coal Grove village (pt.) 4 4 4 0.0% South Point village (pt.) 1,385 1,382 1,392 -0.1% Balance of Perry township 5,426 5,441 5,577 -0.4%Rome township 8,662 8,686 8,892 -0.4% Athalia village 369 369 373 -0.2% Balance of Rome township 8,293 8,317 8,519 -0.4%Symmes township 444 447 462 -0.6%Union township 8,850 8,876 9,086 -0.4% Chesapeake village 725 728 745 -0.4% Proctorville village 556 558 574 -0.5% Balance of Union township 7,569 7,590 7,767 -0.4%Upper township 15,093 15,135 15,418 -0.3% Coal Grove village (pt.) 2,137 2,143 2,161 -0.2% Ironton city (pt.) 10,069 10,096 10,284 -0.3% Balance of Upper township 2,887 2,896 2,973 -0.5%Washington township 232 232 239 -0.5%Windsor township 2,067 2,075 2,147 -0.6%
n.a. - Could not calculate. Division by zero.
(a) Used for calculating average annual rate of change. (b) Average annual rate of change from April 1, 2010 to July 1, 2016.
Source: Population Estimates Division, U.S. Census Bureau. Prepared by: Office of Research, Ohio Development Services Agency.
Population

Licking County2016 Population Estimates For Cities, Villages, and Townships
Estimates Average AnnualEstimate Estimate Base Rate of Change
Name 7/1/16 7/1/15 4/1/10 (a) From 2010 (b)
Licking County 172,198 170,759 166,492 0.5%
Alexandria village 530 527 514 0.5%Buckeye Lake village (pt.) 2,751 2,738 2,729 0.1% Also located in Fairfield CountyGranville village 5,771 5,709 5,669 0.3%Gratiot village (pt.) 136 135 133 0.4% Also located in Muskingum CountyHanover village 1,162 1,147 913 3.9%Hartford village 405 403 397 0.3%Heath city 10,625 10,536 10,282 0.5%Hebron village 2,402 2,384 2,336 0.4%Johnstown village 4,970 4,931 4,644 1.1%Kirkersville village 535 532 525 0.3%New Albany city (pt.) 161 152 126 4.0% Also located in Franklin CountyNewark city 49,134 48,742 47,561 0.5%Pataskala city 15,458 15,324 14,938 0.5%Reynoldsburg city (pt.) 9,093 9,010 8,823 0.5% Also located in Fairfield County Also located in Franklin CountySt. Louisville village 379 376 371 0.3%Utica village (pt.) 2,171 2,156 2,125 0.3% Also located in Knox CountyBalance of Licking County 66,515 65,957 64,406 0.5%
Bennington township 1,744 1,728 1,687 0.5%Bowling Green township 1,793 1,777 1,733 0.5%Burlington township 1,264 1,254 1,223 0.5%Eden township 1,282 1,271 1,248 0.4%Etna township 16,862 16,717 16,372 0.5% Kirkersville village (pt.) 0 0 0 n.a. Reynoldsburg city (pt.) 8,303 8,228 8,064 0.5% Balance of Etna township 8,559 8,489 8,308 0.5%Fallsbury township 1,002 995 981 0.3%Franklin township 2,195 2,176 2,118 0.6%Granville township 10,047 9,948 9,798 0.4% Granville village 5,771 5,709 5,669 0.3% Balance of Granville township 4,276 4,239 4,129 0.6%Hanover township 3,006 2,976 2,726 1.6% Hanover village (pt.) 1,103 1,088 865 4.0% Balance of Hanover township 1,903 1,888 1,861 0.4%Harrison township 7,893 7,824 7,608 0.6% Kirkersville village (pt.) 535 532 525 0.3% Balance of Harrison township 7,358 7,292 7,083 0.6%Hartford township 1,474 1,463 1,428 0.5% Hartford village 405 403 397 0.3% Balance of Hartford township 1,069 1,060 1,031 0.6%Heath city 10,625 10,536 10,282 0.5%Hopewell township 1,388 1,377 1,357 0.4% Gratiot village (pt.) 136 135 133 0.4% Balance of Hopewell township 1,252 1,242 1,224 0.4%
Continued
Population

Licking County2016 Population Estimates For Cities, Villages, and Townships
Estimates Average AnnualEstimate Estimate Base Rate of Change
Name 7/1/16 7/1/15 4/1/10 (a) From 2010 (b)
Jersey township 2,880 2,847 2,752 0.7% New Albany city (pt.) 161 152 126 4.0% Balance of Jersey township 2,719 2,695 2,626 0.6%Liberty township 2,441 2,421 2,356 0.6%Licking township 4,792 4,754 4,647 0.5%McKean township 1,569 1,557 1,523 0.5%Madison township 3,324 3,296 3,207 0.6% Hanover village (pt.) 59 59 48 3.4% Balance of Madison township 3,265 3,237 3,159 0.5%Mary Ann township 2,159 2,143 2,117 0.3%Monroe township 7,360 7,301 6,953 0.9% Johnstown village 4,970 4,931 4,644 1.1% Balance of Monroe township 2,390 2,370 2,309 0.6%Newark city 49,134 48,742 47,561 0.5%Newark township 2,030 2,014 1,960 0.6%Newton township 3,331 3,302 3,227 0.5% St. Louisville village 379 376 371 0.3% Balance of Newton township 2,952 2,926 2,856 0.5%Pataskala city 15,458 15,324 14,938 0.5%Perry township 1,651 1,638 1,601 0.5%Reynoldsburg city (pt.) 790 782 759 0.6%St. Albans township 2,514 2,494 2,435 0.5% Alexandria village 530 527 514 0.5% Balance of St. Albans township 1,984 1,967 1,921 0.5%Union township 9,014 8,949 8,793 0.4% Buckeye Lake village (pt.) 2,751 2,738 2,729 0.1% Hebron village 2,402 2,384 2,336 0.4% Balance of Union township 3,861 3,827 3,728 0.6%Washington township 3,176 3,153 3,102 0.4% Utica village (pt.) 2,171 2,156 2,125 0.3% Balance of Washington township 1,005 997 977 0.5%
n.a. - Could not calculate. Division by zero.
(a) Used for calculating average annual rate of change. (b) Average annual rate of change from April 1, 2010 to July 1, 2016.
Source: Population Estimates Division, U.S. Census Bureau. Prepared by: Office of Research, Ohio Development Services Agency.
Population

Logan County2016 Population Estimates For Cities, Villages, and Townships
Estimates Average AnnualEstimate Estimate Base Rate of Change
Name 7/1/16 7/1/15 4/1/10 (a) From 2010 (b)
Logan County 45,165 45,348 45,854 -0.2%
Belle Center village 807 809 813 -0.1%Bellefontaine city 13,172 13,225 13,370 -0.2%De Graff village 1,266 1,273 1,287 -0.3%Huntsville village 431 433 431 0.0%Lakeview village 1,055 1,058 1,072 -0.3%Quincy village 695 698 706 -0.3%Ridgeway village (pt.) 110 111 112 -0.3% Also located in Hardin CountyRushsylvania village 512 513 516 -0.1%Russells Point village 1,370 1,376 1,391 -0.2%Valley Hi village 203 204 212 -0.7%West Liberty village 1,788 1,793 1,805 -0.2%West Mansfield village 674 677 682 -0.2%Zanesfield village 194 195 197 -0.2%Balance of Logan County 22,888 22,983 23,260 -0.3%
Bloomfield township 423 425 430 -0.3%Bokescreek township 1,315 1,322 1,334 -0.2% Ridgeway village (pt.) 110 111 112 -0.3% West Mansfield village (pt.) 646 649 654 -0.2% Balance of Bokescreek township 559 562 568 -0.3%Harrison township 2,061 2,069 2,087 -0.2% Bellefontaine city (pt.) 448 450 454 -0.2% Balance of Harrison township 1,613 1,619 1,633 -0.2%Jefferson township 2,887 2,898 2,912 -0.1% Bellefontaine city (pt.) 628 629 625 0.1% Valley Hi village (pt.) 40 41 39 0.4% Zanesfield village 194 195 197 -0.2% Balance of Jefferson township 2,025 2,033 2,051 -0.2%Lake township 12,339 12,390 12,534 -0.3% Bellefontaine city (pt.) 11,717 11,765 11,902 -0.3% Balance of Lake township 622 625 632 -0.3%Liberty township 3,392 3,403 3,434 -0.2% Bellefontaine city (pt.) 379 381 389 -0.4% West Liberty village (pt.) 1,788 1,793 1,805 -0.2% Balance of Liberty township 1,225 1,229 1,240 -0.2%McArthur township 1,995 2,003 2,016 -0.2% Huntsville village 431 433 431 0.0% Balance of McArthur township 1,564 1,570 1,585 -0.2%Miami township 2,314 2,325 2,351 -0.3% De Graff village (pt.) 1,042 1,047 1,059 -0.3% Quincy village 695 698 706 -0.3% Balance of Miami township 577 580 586 -0.2%Monroe township 1,709 1,714 1,739 -0.3% Valley Hi village (pt.) 163 163 173 -0.9% West Liberty village (pt.) 0 0 0 n.a. Balance of Monroe township 1,546 1,551 1,566 -0.2%Perry township 976 981 992 -0.3% West Mansfield village (pt.) 28 28 28 0.0% Balance of Perry township 948 953 964 -0.3%
Continued
Population

Logan County2016 Population Estimates For Cities, Villages, and Townships
Estimates Average AnnualEstimate Estimate Base Rate of Change
Name 7/1/16 7/1/15 4/1/10 (a) From 2010 (b)
Pleasant township 1,126 1,133 1,145 -0.3% De Graff village (pt.) 224 226 228 -0.3% Balance of Pleasant township 902 907 917 -0.3%Richland township 2,453 2,461 2,482 -0.2% Belle Center village 807 809 813 -0.1% Balance of Richland township 1,646 1,652 1,669 -0.2%Rushcreek township 2,192 2,199 2,221 -0.2% Rushsylvania village 512 513 516 -0.1% Balance of Rushcreek township 1,680 1,686 1,705 -0.2%Stokes township 4,516 4,535 4,611 -0.3% Lakeview village 1,055 1,058 1,072 -0.3% Russells Point village (pt.) 0 0 0 n.a. Balance of Stokes township 3,461 3,477 3,539 -0.4%Union township 806 810 819 -0.3%Washington township 3,537 3,553 3,607 -0.3% Russells Point village (pt.) 1,370 1,376 1,391 -0.2% Balance of Washington township 2,167 2,177 2,216 -0.4%Zane township 1,124 1,127 1,140 -0.2%
n.a. - Could not calculate. Division by zero.
(a) Used for calculating average annual rate of change. (b) Average annual rate of change from April 1, 2010 to July 1, 2016.
Source: Population Estimates Division, U.S. Census Bureau. Prepared by: Office of Research, Ohio Development Services Agency.
Population

Lorain County2016 Population Estimates For Cities, Villages, and Townships
Estimates Average AnnualEstimate Estimate Base Rate of Change
Name 7/1/16 7/1/15 4/1/10 (a) From 2010 (b)
Lorain County 306,365 305,213 301,356 0.3%
Amherst city 12,078 12,081 12,004 0.1%Avon city 22,805 22,547 21,191 1.2%Avon Lake city 23,659 23,457 22,581 0.7%Elyria city 53,715 53,796 54,539 -0.2%Grafton village 6,223 6,171 6,636 -1.0%Kipton village 242 242 243 -0.1%LaGrange village 2,146 2,133 2,103 0.3%Lorain city 63,730 63,668 64,099 -0.1%North Ridgeville city 32,983 32,485 29,466 1.8%Oberlin city 8,331 8,355 8,286 0.1%Rochester village 181 181 182 -0.1%Sheffield village 4,089 4,025 3,983 0.4%Sheffield Lake city 9,004 9,028 9,137 -0.2%South Amherst village 1,693 1,697 1,705 -0.1%Vermilion city (pt.) 5,787 5,783 5,844 -0.2% Also located in Erie CountyWellington village 4,866 4,854 4,807 0.2%Balance of Lorain County 54,833 54,710 54,550 0.1%
Amherst city 12,078 12,081 12,004 0.1%Amherst township 6,845 6,842 6,853 0.0% South Amherst village (pt.) 1,116 1,120 1,125 -0.1% Balance of Amherst township 5,729 5,722 5,728 0.0%Avon city 22,805 22,547 21,191 1.2%Avon Lake city 23,659 23,457 22,581 0.7%Brighton township 904 903 915 -0.2%Brownhelm township 7,677 7,642 7,618 0.1% Vermilion city (pt.) 5,787 5,783 5,844 -0.2% Balance of Brownhelm township 1,890 1,859 1,774 1.0%Camden township 1,652 1,654 1,667 -0.1% Kipton village 242 242 243 -0.1% Balance of Camden township 1,410 1,412 1,424 -0.2%Carlisle township 7,438 7,435 7,497 -0.1%Columbia township 7,277 7,231 7,040 0.5%Eaton township 5,868 5,832 5,748 0.3%Elyria city 53,715 53,796 54,539 -0.2%Elyria township 3,204 3,215 3,265 -0.3%Grafton village 6,223 6,171 6,636 -1.0%Grafton township 2,838 2,841 2,833 0.0%Henrietta township 1,852 1,852 1,861 -0.1%Huntington township 1,336 1,324 1,341 -0.1%LaGrange township 6,180 6,174 6,164 0.0% LaGrange village 2,146 2,133 2,103 0.3% Balance of LaGrange township 4,034 4,041 4,061 -0.1%Lorain city 63,730 63,668 64,099 -0.1%New Russia township 2,526 2,521 2,523 0.0% South Amherst village (pt.) 577 577 580 -0.1% Balance of New Russia township 1,949 1,944 1,943 0.0%North Ridgeville city 32,983 32,485 29,466 1.8%Oberlin city 8,331 8,355 8,286 0.1%
Continued
Population

Lorain County2016 Population Estimates For Cities, Villages, and Townships
Estimates Average AnnualEstimate Estimate Base Rate of Change
Name 7/1/16 7/1/15 4/1/10 (a) From 2010 (b)
Penfield township 1,799 1,791 1,789 0.1%Pittsfield township 1,618 1,610 1,581 0.4%Rochester township 794 797 799 -0.1% Rochester village 181 181 182 -0.1% Balance of Rochester township 613 616 617 -0.1%Sheffield village 4,089 4,025 3,983 0.4%Sheffield township 3,672 3,681 3,718 -0.2%Sheffield Lake city 9,004 9,028 9,137 -0.2%Wellington township 6,268 6,255 6,222 0.1% Wellington village 4,866 4,854 4,807 0.2% Balance of Wellington township 1,402 1,401 1,415 -0.1%
n.a. - Could not calculate. Division by zero.
(a) Used for calculating average annual rate of change. (b) Average annual rate of change from April 1, 2010 to July 1, 2016.
Source: Population Estimates Division, U.S. Census Bureau. Prepared by: Office of Research, Ohio Development Services Agency.
Population
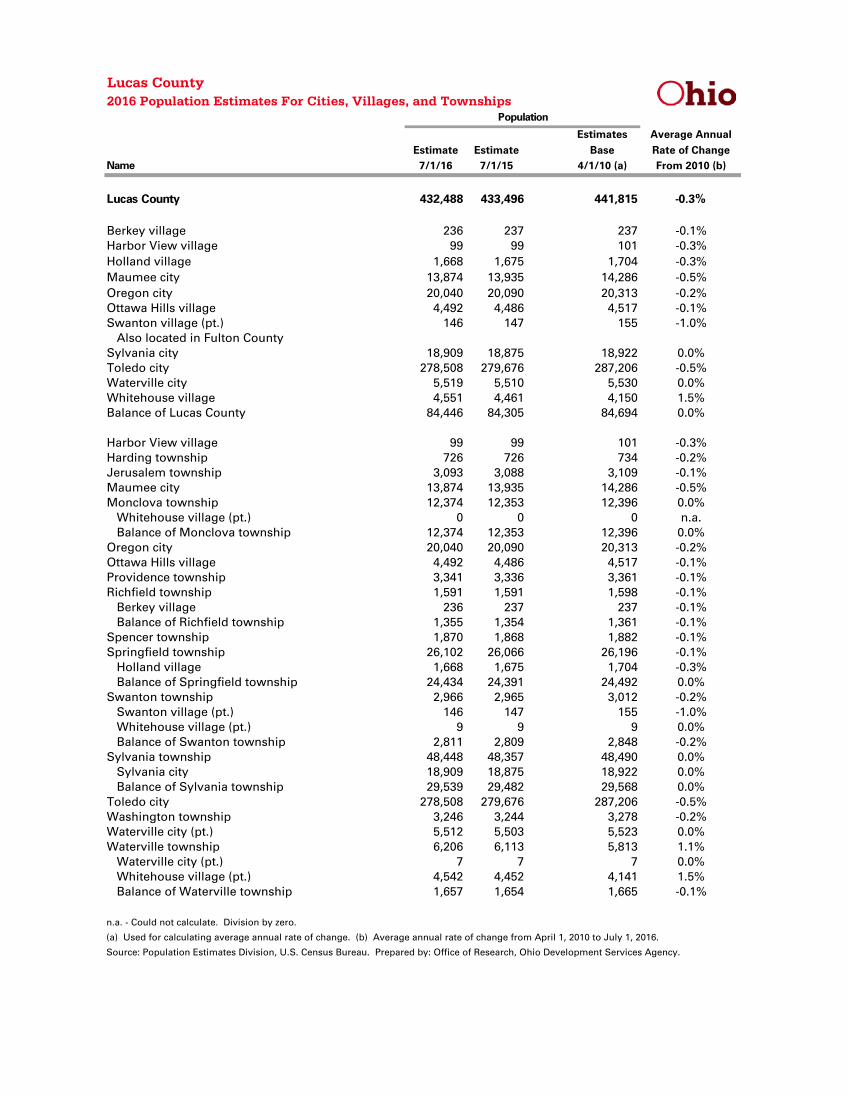
Lucas County2016 Population Estimates For Cities, Villages, and Townships
Estimates Average AnnualEstimate Estimate Base Rate of Change
Name 7/1/16 7/1/15 4/1/10 (a) From 2010 (b)
Lucas County 432,488 433,496 441,815 -0.3%
Berkey village 236 237 237 -0.1%Harbor View village 99 99 101 -0.3%Holland village 1,668 1,675 1,704 -0.3%Maumee city 13,874 13,935 14,286 -0.5%Oregon city 20,040 20,090 20,313 -0.2%Ottawa Hills village 4,492 4,486 4,517 -0.1%Swanton village (pt.) 146 147 155 -1.0% Also located in Fulton CountySylvania city 18,909 18,875 18,922 0.0%Toledo city 278,508 279,676 287,206 -0.5%Waterville city 5,519 5,510 5,530 0.0%Whitehouse village 4,551 4,461 4,150 1.5%Balance of Lucas County 84,446 84,305 84,694 0.0%
Harbor View village 99 99 101 -0.3%Harding township 726 726 734 -0.2%Jerusalem township 3,093 3,088 3,109 -0.1%Maumee city 13,874 13,935 14,286 -0.5%Monclova township 12,374 12,353 12,396 0.0% Whitehouse village (pt.) 0 0 0 n.a. Balance of Monclova township 12,374 12,353 12,396 0.0%Oregon city 20,040 20,090 20,313 -0.2%Ottawa Hills village 4,492 4,486 4,517 -0.1%Providence township 3,341 3,336 3,361 -0.1%Richfield township 1,591 1,591 1,598 -0.1% Berkey village 236 237 237 -0.1% Balance of Richfield township 1,355 1,354 1,361 -0.1%Spencer township 1,870 1,868 1,882 -0.1%Springfield township 26,102 26,066 26,196 -0.1% Holland village 1,668 1,675 1,704 -0.3% Balance of Springfield township 24,434 24,391 24,492 0.0%Swanton township 2,966 2,965 3,012 -0.2% Swanton village (pt.) 146 147 155 -1.0% Whitehouse village (pt.) 9 9 9 0.0% Balance of Swanton township 2,811 2,809 2,848 -0.2%Sylvania township 48,448 48,357 48,490 0.0% Sylvania city 18,909 18,875 18,922 0.0% Balance of Sylvania township 29,539 29,482 29,568 0.0%Toledo city 278,508 279,676 287,206 -0.5%Washington township 3,246 3,244 3,278 -0.2%Waterville city (pt.) 5,512 5,503 5,523 0.0%Waterville township 6,206 6,113 5,813 1.1% Waterville city (pt.) 7 7 7 0.0% Whitehouse village (pt.) 4,542 4,452 4,141 1.5% Balance of Waterville township 1,657 1,654 1,665 -0.1%
n.a. - Could not calculate. Division by zero.
(a) Used for calculating average annual rate of change. (b) Average annual rate of change from April 1, 2010 to July 1, 2016.
Source: Population Estimates Division, U.S. Census Bureau. Prepared by: Office of Research, Ohio Development Services Agency.
Population
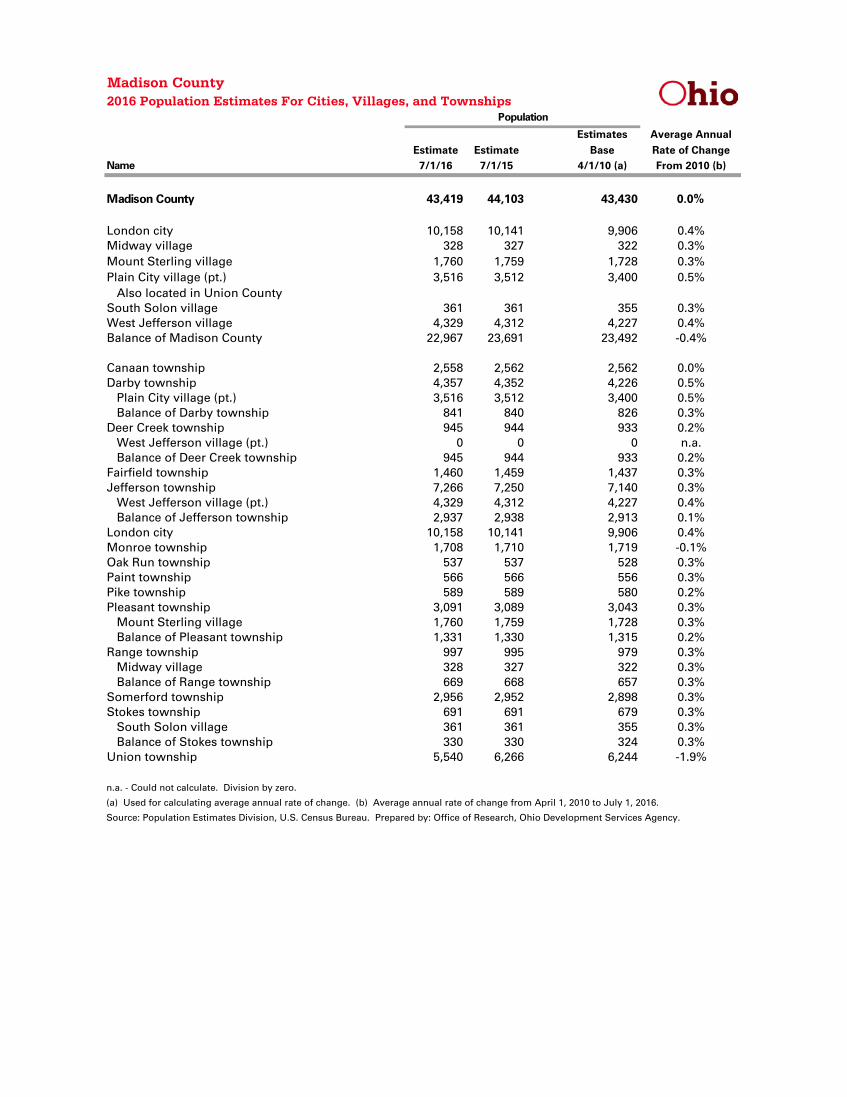
Madison County2016 Population Estimates For Cities, Villages, and Townships
Estimates Average AnnualEstimate Estimate Base Rate of Change
Name 7/1/16 7/1/15 4/1/10 (a) From 2010 (b)
Madison County 43,419 44,103 43,430 0.0%
London city 10,158 10,141 9,906 0.4%Midway village 328 327 322 0.3%Mount Sterling village 1,760 1,759 1,728 0.3%Plain City village (pt.) 3,516 3,512 3,400 0.5% Also located in Union CountySouth Solon village 361 361 355 0.3%West Jefferson village 4,329 4,312 4,227 0.4%Balance of Madison County 22,967 23,691 23,492 -0.4%
Canaan township 2,558 2,562 2,562 0.0%Darby township 4,357 4,352 4,226 0.5% Plain City village (pt.) 3,516 3,512 3,400 0.5% Balance of Darby township 841 840 826 0.3%Deer Creek township 945 944 933 0.2% West Jefferson village (pt.) 0 0 0 n.a. Balance of Deer Creek township 945 944 933 0.2%Fairfield township 1,460 1,459 1,437 0.3%Jefferson township 7,266 7,250 7,140 0.3% West Jefferson village (pt.) 4,329 4,312 4,227 0.4% Balance of Jefferson township 2,937 2,938 2,913 0.1%London city 10,158 10,141 9,906 0.4%Monroe township 1,708 1,710 1,719 -0.1%Oak Run township 537 537 528 0.3%Paint township 566 566 556 0.3%Pike township 589 589 580 0.2%Pleasant township 3,091 3,089 3,043 0.3% Mount Sterling village 1,760 1,759 1,728 0.3% Balance of Pleasant township 1,331 1,330 1,315 0.2%Range township 997 995 979 0.3% Midway village 328 327 322 0.3% Balance of Range township 669 668 657 0.3%Somerford township 2,956 2,952 2,898 0.3%Stokes township 691 691 679 0.3% South Solon village 361 361 355 0.3% Balance of Stokes township 330 330 324 0.3%Union township 5,540 6,266 6,244 -1.9%
n.a. - Could not calculate. Division by zero.
(a) Used for calculating average annual rate of change. (b) Average annual rate of change from April 1, 2010 to July 1, 2016.
Source: Population Estimates Division, U.S. Census Bureau. Prepared by: Office of Research, Ohio Development Services Agency.
Population

Mahoning County2016 Population Estimates For Cities, Villages, and Townships
Estimates Average AnnualEstimate Estimate Base Rate of Change
Name 7/1/16 7/1/15 4/1/10 (a) From 2010 (b)
Mahoning County 230,008 231,767 238,807 -0.6%
Alliance city (pt.) 35 35 36 -0.4% Also located in Stark CountyBeloit village 920 931 978 -1.0%Campbell city 7,923 7,992 8,235 -0.6%Canfield city 7,284 7,341 7,530 -0.5%Columbiana city (pt.) 653 658 672 -0.5% Also located in Columbiana CountyCraig Beach village 1,135 1,144 1,173 -0.5%Lowellville village 1,105 1,115 1,155 -0.7%New Middletown village 1,562 1,576 1,621 -0.6%Poland village 2,459 2,480 2,555 -0.6%Salem city (pt.) 4 4 4 0.0% Also located in Columbiana CountySebring village 4,256 4,291 4,411 -0.6%Struthers city 10,293 10,384 10,713 -0.6%Washingtonville village (pt.) 337 339 348 -0.5% Also located in Columbiana CountyYoungstown city (pt.) 64,301 64,702 66,968 -0.6% Also located in Trumbull CountyBalance of Mahoning County 127,741 128,775 132,408 -0.6%
Austintown township 35,491 35,770 36,713 -0.5%Beaver township 6,470 6,521 6,709 -0.6% Columbiana city (pt.) 6 6 6 0.0% Balance of Beaver township 6,464 6,515 6,703 -0.6%Berlin township 2,067 2,085 2,153 -0.7%Boardman township 39,497 39,813 40,889 -0.6% Poland village (pt.) 7 7 7 0.0% Balance of Boardman township 39,490 39,806 40,882 -0.6%Campbell city 7,923 7,992 8,235 -0.6%Canfield township 15,643 15,764 16,164 -0.5% Canfield city 7,284 7,341 7,530 -0.5% Balance of Canfield township 8,359 8,423 8,634 -0.5%Coitsville township 1,335 1,347 1,392 -0.7%Ellsworth township 2,136 2,154 2,219 -0.6%Fairfield township * 647 652 666 -0.5% Columbiana city (pt.) 647 652 666 -0.5%Goshen township 3,095 3,123 3,243 -0.7%Green township 3,403 3,431 3,532 -0.6% Washingtonville village (pt.) 337 339 348 -0.5% Balance of Green township 3,066 3,092 3,184 -0.6%Jackson township 2,031 2,049 2,112 -0.6%Lowellville village 1,105 1,115 1,155 -0.7%Milton township 3,595 3,624 3,728 -0.6% Craig Beach village 1,135 1,144 1,173 -0.5% Balance of Milton township 2,460 2,480 2,555 -0.6%New Middletown village 1,562 1,576 1,621 -0.6%Perry township * 4 4 4 0.0% Salem city (pt.) 4 4 4 0.0%
Continued
Population

Mahoning County2016 Population Estimates For Cities, Villages, and Townships
Estimates Average AnnualEstimate Estimate Base Rate of Change
Name 7/1/16 7/1/15 4/1/10 (a) From 2010 (b)
Poland township 14,438 14,555 14,960 -0.6% Poland village (pt.) 2,452 2,473 2,548 -0.6% Balance of Poland township 11,986 12,082 12,412 -0.6%Sebring village 4,256 4,291 4,411 -0.6%Smith township 4,298 4,341 4,515 -0.8% Alliance city (pt.) 35 35 36 -0.4% Beloit village 920 931 978 -1.0% Balance of Smith township 3,343 3,375 3,501 -0.7%Springfield township 6,418 6,474 6,705 -0.7%Struthers city 10,293 10,384 10,713 -0.6%Youngstown city (pt.) 64,301 64,702 66,968 -0.6%
* - Fairfield and Perry Township are also located in Columbiana County.n.a. - Could not calculate. Division by zero.
(a) Used for calculating average annual rate of change. (b) Average annual rate of change from April 1, 2010 to July 1, 2016.
Source: Population Estimates Division, U.S. Census Bureau. Prepared by: Office of Research, Ohio Development Services Agency.
Population

Marion County2016 Population Estimates For Cities, Villages, and Townships
Estimates Average AnnualEstimate Estimate Base Rate of Change
Name 7/1/16 7/1/15 4/1/10 (a) From 2010 (b)
Marion County 65,096 65,232 66,501 -0.3%
Caledonia village 551 556 582 -0.9%Green Camp village 361 363 374 -0.6%La Rue village 710 716 747 -0.8%Marion city 36,310 36,305 36,828 -0.2%Morral village 379 383 399 -0.8%New Bloomington village 488 493 520 -1.0%Prospect village 1,060 1,068 1,109 -0.7%Waldo village 323 325 339 -0.8%Balance of Marion County 24,914 25,023 25,603 -0.4%
Big Island township 1,146 1,155 1,199 -0.7%Bowling Green township 620 625 650 -0.8%Claridon township 2,769 2,782 2,742 0.2% Caledonia village 551 556 582 -0.9% Balance of Claridon township 2,218 2,226 2,160 0.4%Grand township 385 387 391 -0.2%Grand Prairie township 1,526 1,534 1,590 -0.7%Green Camp township 1,127 1,135 1,177 -0.7% Green Camp village 361 363 374 -0.6% Balance of Green Camp township 766 772 803 -0.8%Marion township 43,894 43,940 44,749 -0.3% Marion city 36,310 36,305 36,828 -0.2% Balance of Marion township 7,584 7,635 7,921 -0.7%Montgomery township 2,222 2,241 2,335 -0.8% La Rue village 710 716 747 -0.8% New Bloomington village 488 493 520 -1.0% Balance of Montgomery township 1,024 1,032 1,068 -0.7%Pleasant township 4,619 4,634 4,782 -0.6%Prospect township 2,034 2,044 2,091 -0.4% Prospect village 1,060 1,068 1,109 -0.7% Balance of Prospect township 974 976 982 -0.1%Richland township 1,602 1,605 1,635 -0.3%Salt Rock township 646 651 673 -0.7% Morral village 379 383 399 -0.8% Balance of Salt Rock township 267 268 274 -0.4%Scott township 472 477 498 -0.9%Tully township 937 920 854 1.5%Waldo township 1,097 1,102 1,135 -0.5% Waldo village 323 325 339 -0.8% Balance of Waldo township 774 777 796 -0.4%
n.a. - Could not calculate. Division by zero.
(a) Used for calculating average annual rate of change. (b) Average annual rate of change from April 1, 2010 to July 1, 2016.
Source: Population Estimates Division, U.S. Census Bureau. Prepared by: Office of Research, Ohio Development Services Agency.
Population

Medina County2016 Population Estimates For Cities, Villages, and Townships
Estimates Average AnnualEstimate Estimate Base Rate of Change
Name 7/1/16 7/1/15 4/1/10 (a) From 2010 (b)
Medina County 177,221 176,334 172,333 0.4%
Brunswick city 34,756 34,711 34,278 0.2%Chippewa Lake village 734 729 710 0.5%Creston village (pt.) 91 92 92 -0.2% Also located in Wayne CountyGloria Glens Park village 439 436 425 0.5%Lodi village 2,820 2,806 2,753 0.4%Medina city 26,261 26,365 26,666 -0.2%Rittman city (pt.) 114 114 115 -0.1% Also located in Wayne CountySeville village 2,382 2,369 2,305 0.5%Spencer village 774 769 753 0.4%Wadsworth city 23,136 22,788 21,555 1.1%Westfield Center village 1,157 1,148 1,116 0.6%Balance of Medina County 84,557 84,007 81,565 0.6%
Brunswick city 34,756 34,711 34,278 0.2%Brunswick Hills township 10,248 10,179 9,875 0.6%Canaan township * 91 92 92 -0.2% Creston village (pt.) 91 92 92 -0.2%Chatham township 2,339 2,325 2,261 0.5%Chippewa Lake village 734 729 710 0.5%Gloria Glens Park village 439 436 425 0.5%Granger township 4,605 4,576 4,447 0.6%Guilford township 3,306 3,285 3,196 0.5%Harrisville township 1,884 1,872 1,823 0.5%Hinckley township 7,924 7,873 7,644 0.6%Homer township 1,508 1,501 1,462 0.5%Lafayette township 5,774 5,737 5,580 0.5% Medina city (pt.) 4 4 4 0.0% Balance of Lafayette township 5,770 5,733 5,576 0.5%Litchfield township 3,366 3,344 3,250 0.6%Liverpool township 5,307 5,273 5,127 0.6%Lodi village 2,820 2,806 2,753 0.4%Medina city (pt.) 26,206 26,316 26,632 -0.3%Medina township 8,884 8,823 8,545 0.6%Montville township 11,646 11,565 11,205 0.6%Rittman city (pt.) 114 114 115 -0.1%Seville village (pt.) 2,382 2,369 2,305 0.5%Sharon township 5,292 5,259 5,112 0.6%Spencer village 774 769 753 0.4%Spencer township 2,017 2,003 1,944 0.6%Wadsworth city 23,136 22,788 21,555 1.1%Wadsworth township 4,351 4,324 4,201 0.6%Westfield township 2,577 2,562 2,489 0.6% Creston village (pt.) 0 0 0 n.a. Seville village (pt.) 0 0 0 n.a. Balance of Westfield township 2,577 2,562 2,489 0.6%
Continued
Population
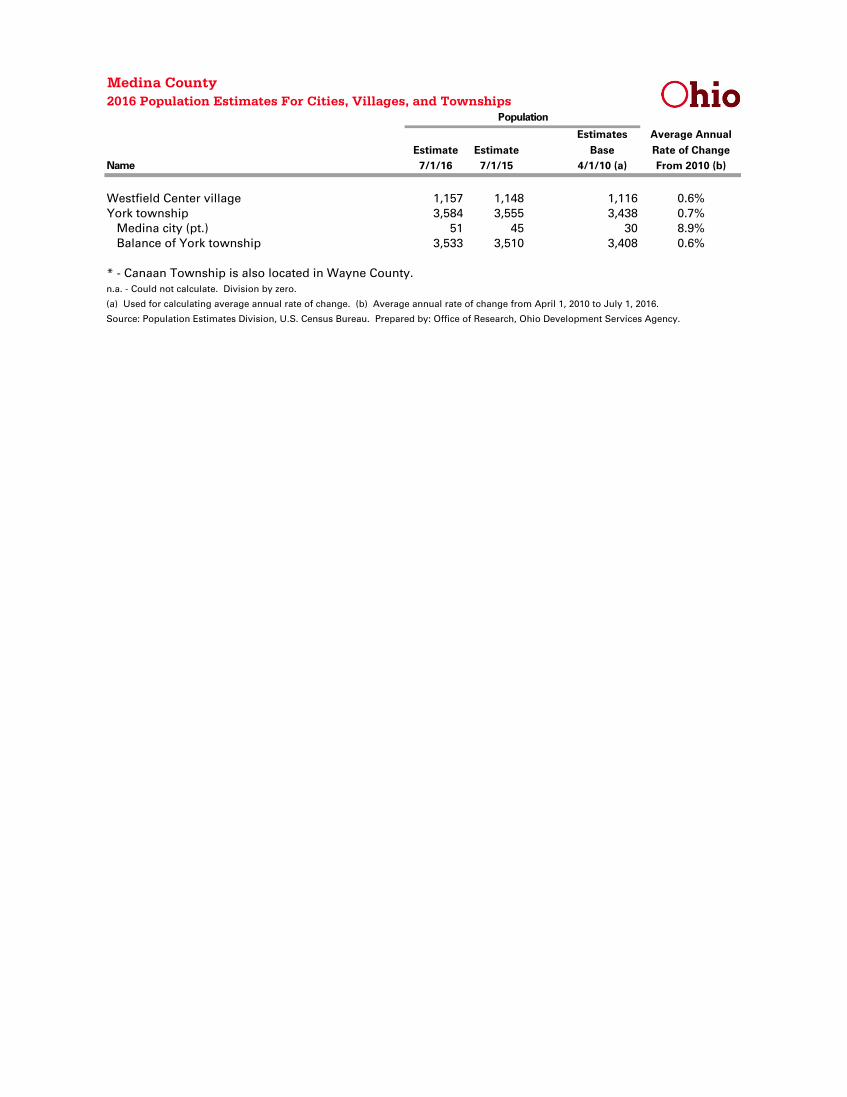
Medina County2016 Population Estimates For Cities, Villages, and Townships
Estimates Average AnnualEstimate Estimate Base Rate of Change
Name 7/1/16 7/1/15 4/1/10 (a) From 2010 (b)
Westfield Center village 1,157 1,148 1,116 0.6%York township 3,584 3,555 3,438 0.7% Medina city (pt.) 51 45 30 8.9% Balance of York township 3,533 3,510 3,408 0.6%
* - Canaan Township is also located in Wayne County.n.a. - Could not calculate. Division by zero.
(a) Used for calculating average annual rate of change. (b) Average annual rate of change from April 1, 2010 to July 1, 2016.
Source: Population Estimates Division, U.S. Census Bureau. Prepared by: Office of Research, Ohio Development Services Agency.
Population

Meigs County2016 Population Estimates For Cities, Villages, and Townships
Estimates Average AnnualEstimate Estimate Base Rate of Change
Name 7/1/16 7/1/15 4/1/10 (a) From 2010 (b)
Meigs County 23,125 23,203 23,767 -0.4%
Middleport village 2,465 2,474 2,529 -0.4%Pomeroy village 1,814 1,820 1,852 -0.3%Racine village 658 661 675 -0.4%Rutland village 378 380 393 -0.6%Syracuse village 817 819 826 -0.2%Balance of Meigs County 16,993 17,049 17,492 -0.5%
Bedford township 1,314 1,319 1,355 -0.5%Chester township 2,438 2,444 2,496 -0.4%Columbia township 1,166 1,169 1,189 -0.3%Lebanon township 936 939 967 -0.5%Letart township 653 656 675 -0.5%Olive township 1,748 1,753 1,800 -0.5%Orange township 1,035 1,038 1,071 -0.5%Rutland township 2,280 2,288 2,353 -0.5% Rutland village 378 380 393 -0.6% Balance of Rutland township 1,902 1,908 1,960 -0.5%Salem township 1,016 1,021 1,051 -0.5%Salisbury township 6,196 6,217 6,352 -0.4% Middleport village 2,465 2,474 2,529 -0.4% Pomeroy village 1,814 1,820 1,852 -0.3% Balance of Salisbury township 1,917 1,923 1,971 -0.4%Scipio township 1,276 1,281 1,318 -0.5%Sutton township 3,067 3,078 3,140 -0.4% Racine village 658 661 675 -0.4% Syracuse village 817 819 826 -0.2% Balance of Sutton township 1,592 1,598 1,639 -0.5%
n.a. - Could not calculate. Division by zero.
(a) Used for calculating average annual rate of change. (b) Average annual rate of change from April 1, 2010 to July 1, 2016.
Source: Population Estimates Division, U.S. Census Bureau. Prepared by: Office of Research, Ohio Development Services Agency.
Population

Mercer County2016 Population Estimates For Cities, Villages, and Townships
Estimates Average AnnualEstimate Estimate Base Rate of Change
Name 7/1/16 7/1/15 4/1/10 (a) From 2010 (b)
Mercer County 40,909 40,947 40,814 0.0%
Burkettsville village (pt.) 168 169 170 -0.2% Also located in Darke CountyCelina city 10,324 10,374 10,407 -0.1%Chickasaw village 298 299 290 0.4%Coldwater village 4,505 4,481 4,427 0.3%Fort Recovery village 1,437 1,438 1,444 -0.1%Mendon village 648 651 662 -0.3%Montezuma village 159 160 161 -0.2%Rockford village 1,102 1,107 1,120 -0.3%St. Henry village 2,513 2,512 2,427 0.6%Balance of Mercer County 19,755 19,756 19,706 0.0%
Black Creek township 606 601 612 -0.2%Butler township 6,467 6,441 6,345 0.3% Coldwater village 4,505 4,481 4,427 0.3% Balance of Butler township 1,962 1,960 1,918 0.4%Celina city (pt.) 11 11 11 0.0%Center township 1,072 1,077 1,086 -0.2%Dublin township 2,131 2,136 2,138 -0.1% Rockford village 1,102 1,107 1,120 -0.3% Balance of Dublin township 1,029 1,029 1,018 0.2%Franklin township 2,257 2,263 2,285 -0.2% Montezuma village 159 160 161 -0.2% Balance of Franklin township 2,098 2,103 2,124 -0.2%Gibson township 1,996 2,000 2,005 -0.1% Fort Recovery village (pt.) 1,052 1,052 1,051 0.0% Balance of Gibson township 944 948 954 -0.2%Granville township 4,181 4,172 4,030 0.6% Burkettsville village (pt.) 168 169 170 -0.2% St. Henry village 2,513 2,512 2,427 0.6% Balance of Granville township 1,500 1,491 1,433 0.7%Hopewell township 1,029 1,034 1,033 -0.1%Jefferson township 13,043 13,099 13,155 -0.1% Celina city (pt.) 10,313 10,363 10,396 -0.1% Balance of Jefferson township 2,730 2,736 2,759 -0.2%Liberty township 898 902 918 -0.4%Marion township 3,012 3,006 2,970 0.2% Chickasaw village 298 299 290 0.4% Balance of Marion township 2,714 2,707 2,680 0.2%Recovery township 1,600 1,607 1,621 -0.2% Fort Recovery village (pt.) 385 386 393 -0.3% Balance of Recovery township 1,215 1,221 1,228 -0.2%Union township 1,395 1,393 1,415 -0.2% Mendon village 648 651 662 -0.3% Balance of Union township 747 742 753 -0.1%Washington township 1,211 1,205 1,190 0.3%
n.a. - Could not calculate. Division by zero.
(a) Used for calculating average annual rate of change. (b) Average annual rate of change from April 1, 2010 to July 1, 2016.
Source: Population Estimates Division, U.S. Census Bureau. Prepared by: Office of Research, Ohio Development Services Agency.
Population
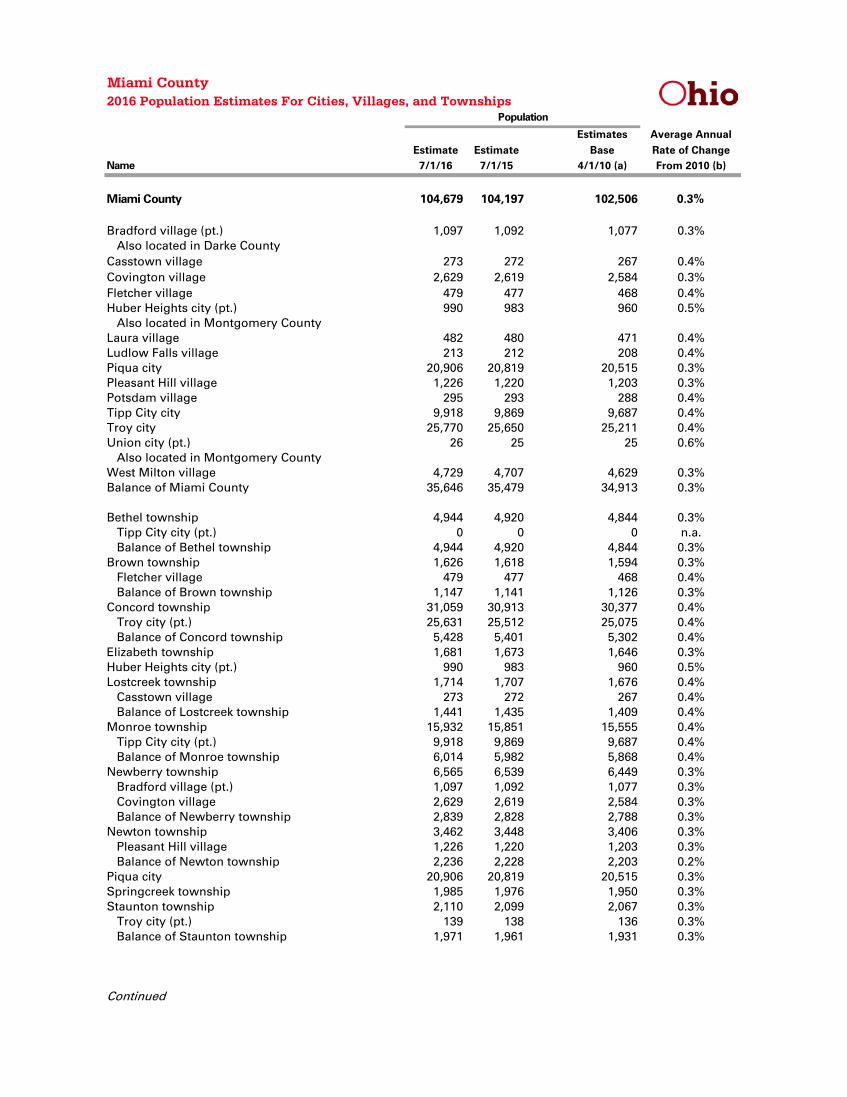
Miami County2016 Population Estimates For Cities, Villages, and Townships
Estimates Average AnnualEstimate Estimate Base Rate of Change
Name 7/1/16 7/1/15 4/1/10 (a) From 2010 (b)
Miami County 104,679 104,197 102,506 0.3%
Bradford village (pt.) 1,097 1,092 1,077 0.3% Also located in Darke CountyCasstown village 273 272 267 0.4%Covington village 2,629 2,619 2,584 0.3%Fletcher village 479 477 468 0.4%Huber Heights city (pt.) 990 983 960 0.5% Also located in Montgomery CountyLaura village 482 480 471 0.4%Ludlow Falls village 213 212 208 0.4%Piqua city 20,906 20,819 20,515 0.3%Pleasant Hill village 1,226 1,220 1,203 0.3%Potsdam village 295 293 288 0.4%Tipp City city 9,918 9,869 9,687 0.4%Troy city 25,770 25,650 25,211 0.4%Union city (pt.) 26 25 25 0.6% Also located in Montgomery CountyWest Milton village 4,729 4,707 4,629 0.3%Balance of Miami County 35,646 35,479 34,913 0.3%
Bethel township 4,944 4,920 4,844 0.3% Tipp City city (pt.) 0 0 0 n.a. Balance of Bethel township 4,944 4,920 4,844 0.3%Brown township 1,626 1,618 1,594 0.3% Fletcher village 479 477 468 0.4% Balance of Brown township 1,147 1,141 1,126 0.3%Concord township 31,059 30,913 30,377 0.4% Troy city (pt.) 25,631 25,512 25,075 0.4% Balance of Concord township 5,428 5,401 5,302 0.4%Elizabeth township 1,681 1,673 1,646 0.3%Huber Heights city (pt.) 990 983 960 0.5%Lostcreek township 1,714 1,707 1,676 0.4% Casstown village 273 272 267 0.4% Balance of Lostcreek township 1,441 1,435 1,409 0.4%Monroe township 15,932 15,851 15,555 0.4% Tipp City city (pt.) 9,918 9,869 9,687 0.4% Balance of Monroe township 6,014 5,982 5,868 0.4%Newberry township 6,565 6,539 6,449 0.3% Bradford village (pt.) 1,097 1,092 1,077 0.3% Covington village 2,629 2,619 2,584 0.3% Balance of Newberry township 2,839 2,828 2,788 0.3%Newton township 3,462 3,448 3,406 0.3% Pleasant Hill village 1,226 1,220 1,203 0.3% Balance of Newton township 2,236 2,228 2,203 0.2%Piqua city 20,906 20,819 20,515 0.3%Springcreek township 1,985 1,976 1,950 0.3%Staunton township 2,110 2,099 2,067 0.3% Troy city (pt.) 139 138 136 0.3% Balance of Staunton township 1,971 1,961 1,931 0.3%
Continued
Population

Miami County2016 Population Estimates For Cities, Villages, and Townships
Estimates Average AnnualEstimate Estimate Base Rate of Change
Name 7/1/16 7/1/15 4/1/10 (a) From 2010 (b)
Union township 10,072 10,027 9,867 0.3% Laura village 482 480 471 0.4% Ludlow Falls village 213 212 208 0.4% Potsdam village 295 293 288 0.4% West Milton village 4,729 4,707 4,629 0.3% Balance of Union township 4,353 4,335 4,271 0.3%Union city (pt.) 26 25 25 0.6%Washington township 1,607 1,599 1,575 0.3%
n.a. - Could not calculate. Division by zero.
(a) Used for calculating average annual rate of change. (b) Average annual rate of change from April 1, 2010 to July 1, 2016.
Source: Population Estimates Division, U.S. Census Bureau. Prepared by: Office of Research, Ohio Development Services Agency.
Population

Monroe County2016 Population Estimates For Cities, Villages, and Townships
Estimates Average AnnualEstimate Estimate Base Rate of Change
Name 7/1/16 7/1/15 4/1/10 (a) From 2010 (b)
Monroe County 14,210 14,391 14,642 -0.5%
Antioch village 85 86 86 -0.2%Beallsville village 393 398 409 -0.6%Clarington village 373 379 385 -0.5%Graysville village 77 78 78 -0.2%Jerusalem village 159 161 161 -0.2%Lewisville village 174 176 176 -0.2%Miltonsburg village 43 43 43 0.0%Stafford village 80 81 81 -0.2%Wilson village (pt.) 87 88 88 -0.2% Also located in Belmont CountyWoodsfield village 2,320 2,347 2,381 -0.4%Balance of Monroe County 10,419 10,554 10,754 -0.5%
Adams township 607 615 625 -0.5%Benton township 325 330 338 -0.6%Bethel township 334 339 347 -0.6%Center township 3,552 3,592 3,647 -0.4% Woodsfield village 2,320 2,347 2,381 -0.4% Balance of Center township 1,232 1,245 1,266 -0.4%Franklin township 412 418 427 -0.6% Stafford village 80 81 81 -0.2% Balance of Franklin township 332 337 346 -0.7%Green township 432 438 447 -0.5%Jackson township 462 468 477 -0.5%Lee township 988 1,001 1,023 -0.6%Malaga township 1,037 1,049 1,061 -0.4% Jerusalem village (pt.) 106 107 107 -0.2% Miltonsburg village 43 43 43 0.0% Balance of Malaga township 888 899 911 -0.4%Ohio township 980 991 1,004 -0.4%Perry township 438 444 451 -0.5% Antioch village 85 86 86 -0.2% Balance of Perry township 353 358 365 -0.5%Salem township 971 985 1,001 -0.5% Clarington village 373 379 385 -0.5% Balance of Salem township 598 606 616 -0.5%Seneca township 466 472 484 -0.6%Summit township 632 641 650 -0.4% Lewisville village 174 176 176 -0.2% Balance of Summit township 458 465 474 -0.5%Sunsbury township 1,283 1,299 1,325 -0.5% Beallsville village 393 398 409 -0.6% Jerusalem village (pt.) 53 54 54 -0.3% Wilson village (pt.) 87 88 88 -0.2% Balance of Sunsbury township 750 759 774 -0.5%Switzerland township 447 453 462 -0.5%
Continued
Population

Monroe County2016 Population Estimates For Cities, Villages, and Townships
Estimates Average AnnualEstimate Estimate Base Rate of Change
Name 7/1/16 7/1/15 4/1/10 (a) From 2010 (b)
Washington township 496 503 511 -0.5% Graysville village 77 78 78 -0.2% Balance of Washington township 419 425 433 -0.5%Wayne township 348 353 362 -0.6%
n.a. - Could not calculate. Division by zero.
(a) Used for calculating average annual rate of change. (b) Average annual rate of change from April 1, 2010 to July 1, 2016.
Source: Population Estimates Division, U.S. Census Bureau. Prepared by: Office of Research, Ohio Development Services Agency.
Population

Montgomery County2016 Population Estimates For Cities, Villages, and Townships
Estimates Average AnnualEstimate Estimate Base Rate of Change
Name 7/1/16 7/1/15 4/1/10 (a) From 2010 (b)
Montgomery County 531,239 531,567 535,136 -0.1%
Brookville city 5,895 5,895 5,884 0.0%Carlisle village (pt.) 201 202 203 -0.2% Also located in Warren CountyCenterville city (pt.) 23,815 23,855 23,992 -0.1% Also located in Greene CountyClayton city 13,160 13,158 13,209 -0.1%Dayton city 140,489 140,575 141,869 -0.2%Englewood city 13,502 13,517 13,465 0.0%Farmersville village 1,001 1,002 1,009 -0.1%Germantown city 5,486 5,488 5,535 -0.1%Huber Heights city (pt.) 37,029 37,017 37,142 0.0% Also located in Miami CountyKettering city (pt.) 54,836 54,990 55,694 -0.2% Also located in Greene CountyMiamisburg city 19,968 20,014 20,181 -0.2%Moraine city 6,353 6,364 6,307 0.1%New Lebanon village 3,971 3,974 3,995 -0.1%Oakwood city 8,999 9,033 9,202 -0.4%Phillipsburg village 553 553 557 -0.1%Riverside city 24,981 24,991 25,201 -0.1%Springboro city (pt.) 1,264 1,250 1,207 0.7% Also located in Warren CountyTrotwood city 24,331 24,325 24,434 -0.1%Union city (pt.) 6,580 6,505 6,415 0.4% Also located in Miami CountyVandalia city 15,058 15,090 15,248 -0.2%Verona village (pt.) 78 78 79 -0.2% Also located in Preble CountyWest Carrollton city 12,935 12,965 13,143 -0.3%Balance of Montgomery County 110,754 110,726 111,165 -0.1%
Butler township 7,845 7,845 7,879 -0.1% Union city (pt.) 38 38 38 0.0% Balance of Butler township 7,807 7,807 7,841 -0.1%Clay township 8,801 8,804 8,847 -0.1% Brookville city (pt.) 4,599 4,600 4,594 0.0% Phillipsburg village 553 553 557 -0.1% Verona village (pt.) 78 78 79 -0.2% Balance of Clay township 3,571 3,573 3,617 -0.2%Clayton city 13,160 13,158 13,209 -0.1%Dayton city 140,489 140,575 141,869 -0.2%Englewood city 13,502 13,517 13,465 0.0%German township 8,366 8,369 8,431 -0.1% Carlisle village (pt.) 0 0 0 n.a. Germantown city 5,486 5,488 5,535 -0.1% Balance of German township 2,880 2,881 2,896 -0.1%Harrison township 22,229 22,238 22,398 -0.1%Huber Heights city (pt.) 37,029 37,017 37,142 0.0%
Continued
Population

Montgomery County2016 Population Estimates For Cities, Villages, and Townships
Estimates Average AnnualEstimate Estimate Base Rate of Change
Name 7/1/16 7/1/15 4/1/10 (a) From 2010 (b)
Jackson township 6,294 6,297 6,335 -0.1% Farmersville village 1,001 1,002 1,009 -0.1% New Lebanon village (pt.) 2,630 2,631 2,641 -0.1% Balance of Jackson township 2,663 2,664 2,685 -0.1%Jefferson township 6,675 6,663 6,627 0.1%Kettering city (pt.) 54,836 54,990 55,694 -0.2%Miami township 50,454 50,477 50,722 -0.1% Carlisle village (pt.) 201 202 203 -0.2% Miamisburg city 19,968 20,014 20,181 -0.2% Springboro city (pt.) 1,264 1,250 1,207 0.7% Balance of Miami township 29,021 29,011 29,131 -0.1%Moraine city 6,353 6,364 6,307 0.1%Oakwood city 8,999 9,033 9,202 -0.4%Perry township 5,965 5,967 5,999 -0.1% Brookville city (pt.) 1,296 1,295 1,290 0.1% New Lebanon village (pt.) 1,341 1,343 1,354 -0.2% Balance of Perry township 3,328 3,329 3,355 -0.1%Riverside city 24,981 24,991 25,201 -0.1%Trotwood city 24,331 24,325 24,434 -0.1%Union city (pt.) 6,542 6,467 6,377 0.4%Vandalia city 15,058 15,090 15,248 -0.2%Washington township 56,395 56,415 56,607 -0.1% Centerville city (pt.) 23,815 23,855 23,992 -0.1% Balance of Washington township 32,580 32,560 32,615 0.0%West Carrollton city 12,935 12,965 13,143 -0.3%
n.a. - Could not calculate. Division by zero.
(a) Used for calculating average annual rate of change. (b) Average annual rate of change from April 1, 2010 to July 1, 2016.
Source: Population Estimates Division, U.S. Census Bureau. Prepared by: Office of Research, Ohio Development Services Agency.
Population
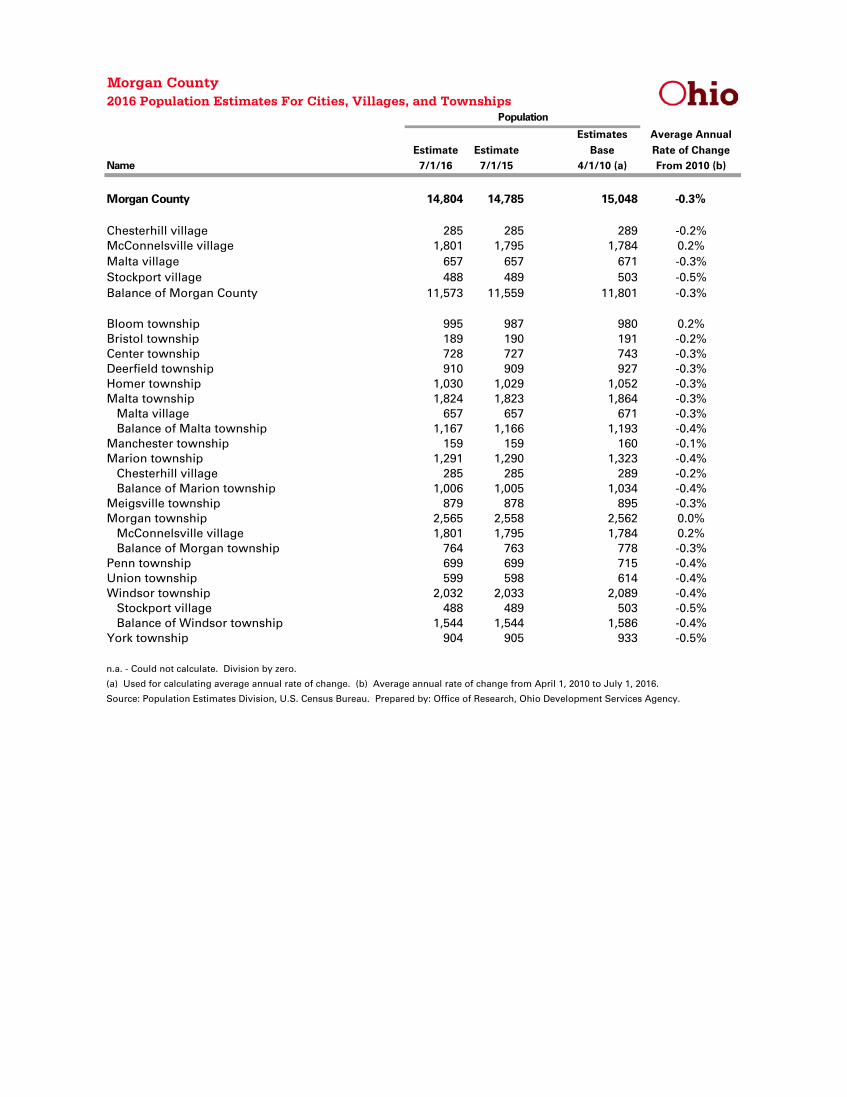
Morgan County2016 Population Estimates For Cities, Villages, and Townships
Estimates Average AnnualEstimate Estimate Base Rate of Change
Name 7/1/16 7/1/15 4/1/10 (a) From 2010 (b)
Morgan County 14,804 14,785 15,048 -0.3%
Chesterhill village 285 285 289 -0.2%McConnelsville village 1,801 1,795 1,784 0.2%Malta village 657 657 671 -0.3%Stockport village 488 489 503 -0.5%Balance of Morgan County 11,573 11,559 11,801 -0.3%
Bloom township 995 987 980 0.2%Bristol township 189 190 191 -0.2%Center township 728 727 743 -0.3%Deerfield township 910 909 927 -0.3%Homer township 1,030 1,029 1,052 -0.3%Malta township 1,824 1,823 1,864 -0.3% Malta village 657 657 671 -0.3% Balance of Malta township 1,167 1,166 1,193 -0.4%Manchester township 159 159 160 -0.1%Marion township 1,291 1,290 1,323 -0.4% Chesterhill village 285 285 289 -0.2% Balance of Marion township 1,006 1,005 1,034 -0.4%Meigsville township 879 878 895 -0.3%Morgan township 2,565 2,558 2,562 0.0% McConnelsville village 1,801 1,795 1,784 0.2% Balance of Morgan township 764 763 778 -0.3%Penn township 699 699 715 -0.4%Union township 599 598 614 -0.4%Windsor township 2,032 2,033 2,089 -0.4% Stockport village 488 489 503 -0.5% Balance of Windsor township 1,544 1,544 1,586 -0.4%York township 904 905 933 -0.5%
n.a. - Could not calculate. Division by zero.
(a) Used for calculating average annual rate of change. (b) Average annual rate of change from April 1, 2010 to July 1, 2016.
Source: Population Estimates Division, U.S. Census Bureau. Prepared by: Office of Research, Ohio Development Services Agency.
Population

Morrow County2016 Population Estimates For Cities, Villages, and Townships
Estimates Average AnnualEstimate Estimate Base Rate of Change
Name 7/1/16 7/1/15 4/1/10 (a) From 2010 (b)
Morrow County 35,036 35,091 34,827 0.1%
Cardington village 2,062 2,066 2,046 0.1%Chesterville village 230 231 228 0.1%Edison village 446 447 437 0.3%Fulton village 261 261 258 0.2%Galion city (pt.) 0 0 0 n.a. Also located in Richland County Also located in Crawford CountyMarengo village 346 346 342 0.2%Mount Gilead village 3,671 3,679 3,660 0.0%Sparta village 163 163 161 0.2%Balance of Morrow County 27,857 27,898 27,695 0.1%
Bennington township 3,108 3,114 3,102 0.0% Marengo village 346 346 342 0.2% Balance of Bennington township 2,762 2,768 2,760 0.0%Canaan township 963 965 963 0.0%Cardington township 3,130 3,133 3,095 0.2% Cardington village (pt.) 2,042 2,046 2,026 0.1% Balance of Cardington township 1,088 1,087 1,069 0.3%Chester township 1,927 1,914 1,872 0.5% Chesterville village 230 231 228 0.1% Balance of Chester township 1,697 1,683 1,644 0.5%Congress township 2,713 2,718 2,701 0.1%Franklin township 1,618 1,623 1,617 0.0%Galion city (pt.) 0 0 0 n.a.Gilead township 6,142 6,156 6,112 0.1% Edison village 446 447 437 0.3% Mount Gilead village 3,671 3,679 3,660 0.0% Balance of Gilead township 2,025 2,030 2,015 0.1%Harmony township 2,618 2,623 2,626 0.0%Lincoln township 2,080 2,082 2,063 0.1% Cardington village (pt.) 20 20 20 0.0% Fulton village 261 261 258 0.2% Balance of Lincoln township 1,799 1,801 1,785 0.1%North Bloomfield township 1,867 1,871 1,863 0.0%Perry township 1,934 1,939 1,942 -0.1%Peru township 1,514 1,518 1,513 0.0%South Bloomfield township 1,782 1,784 1,752 0.3% Sparta village 163 163 161 0.2% Balance of South Bloomfield township 1,619 1,621 1,591 0.3%Troy township 1,133 1,136 1,129 0.1%Washington township 1,300 1,304 1,300 0.0%Westfield township 1,207 1,211 1,177 0.4%
n.a. - Could not calculate. Division by zero.
(a) Used for calculating average annual rate of change. (b) Average annual rate of change from April 1, 2010 to July 1, 2016.
Source: Population Estimates Division, U.S. Census Bureau. Prepared by: Office of Research, Ohio Development Services Agency.
Population

Muskingum County2016 Population Estimates For Cities, Villages, and Townships
Estimates Average AnnualEstimate Estimate Base Rate of Change
Name 7/1/16 7/1/15 4/1/10 (a) From 2010 (b)
Muskingum County 86,068 86,305 86,086 0.0%
Adamsville village 122 122 120 0.3%Dresden village 1,683 1,690 1,547 1.4%Frazeysburg village 1,296 1,300 1,306 -0.1%Fultonham village 178 179 176 0.2%Gratiot village (pt.) 87 87 86 0.2% Also located in Licking CountyNew Concord village 2,355 2,332 2,477 -0.8%Norwich village 104 104 103 0.2%Philo village 733 736 737 -0.1%Roseville village (pt.) 764 768 768 -0.1% Also located in Perry CountySouth Zanesville village 1,974 1,984 1,995 -0.2%Zanesville city 25,465 25,556 25,472 0.0%Balance of Muskingum County 51,307 51,447 51,299 0.0%
Adams township 531 535 541 -0.3%Blue Rock township 675 678 677 0.0%Brush Creek township 1,323 1,328 1,331 -0.1%Cass township 1,623 1,628 1,606 0.2% Dresden village (pt.) 122 122 109 1.8% Balance of Cass township 1,501 1,506 1,497 0.0%Clay township 1,091 1,096 1,091 0.0% Roseville village (pt.) 764 768 768 -0.1% Balance of Clay township 327 328 323 0.2%Falls township 8,195 8,204 8,155 0.1%Harrison township 1,610 1,617 1,623 -0.1% Philo village 733 736 737 -0.1% Balance of Harrison township 877 881 886 -0.2%Highland township 827 830 830 -0.1% New Concord village (pt.) 2 2 2 0.0% Balance of Highland township 825 828 828 -0.1%Hopewell township 3,088 3,098 3,098 -0.1% Gratiot village (pt.) 87 87 86 0.2% Balance of Hopewell township 3,001 3,011 3,012 -0.1%Jackson township 2,391 2,397 2,400 -0.1% Frazeysburg village 1,296 1,300 1,306 -0.1% Balance of Jackson township 1,095 1,097 1,094 0.0%Jefferson township 1,950 1,960 1,834 1.0% Dresden village (pt.) 1,561 1,568 1,438 1.3% Balance of Jefferson township 389 392 396 -0.3%Licking township 2,332 2,338 2,320 0.1%Madison township 420 421 425 -0.2%Meigs township 178 178 180 -0.2%Monroe township 539 542 547 -0.2%Muskingum township 4,549 4,560 4,521 0.1%Newton township 5,342 5,361 5,363 -0.1% Fultonham village 178 179 176 0.2% South Zanesville village (pt.) 45 45 44 0.4% Balance of Newton township 5,119 5,137 5,143 -0.1%
Continued
Population

Muskingum County2016 Population Estimates For Cities, Villages, and Townships
Estimates Average AnnualEstimate Estimate Base Rate of Change
Name 7/1/16 7/1/15 4/1/10 (a) From 2010 (b)
Perry township 2,647 2,642 2,635 0.1%Rich Hill township 453 454 454 0.0%Salem township 846 849 849 -0.1% Adamsville village 122 122 120 0.3% Balance of Salem township 724 727 729 -0.1%Salt Creek township 1,120 1,125 1,120 0.0%Springfield township 5,592 5,613 5,609 0.0% South Zanesville village (pt.) 1,929 1,939 1,951 -0.2% Balance of Springfield township 3,663 3,674 3,658 0.0%Union township 4,274 4,257 4,395 -0.4% New Concord village (pt.) 2,353 2,330 2,475 -0.8% Norwich village 104 104 103 0.2% Balance of Union township 1,817 1,823 1,817 0.0%Washington township 4,281 4,296 4,291 0.0%Wayne township 4,726 4,742 4,719 0.0%Zanesville city 25,465 25,556 25,472 0.0%
n.a. - Could not calculate. Division by zero.
(a) Used for calculating average annual rate of change. (b) Average annual rate of change from April 1, 2010 to July 1, 2016.
Source: Population Estimates Division, U.S. Census Bureau. Prepared by: Office of Research, Ohio Development Services Agency.
Population

Noble County2016 Population Estimates For Cities, Villages, and Townships
Estimates Average AnnualEstimate Estimate Base Rate of Change
Name 7/1/16 7/1/15 4/1/10 (a) From 2010 (b)
Noble County 14,294 14,325 14,645 -0.4%
Batesville village 98 98 101 -0.5%Belle Valley village 216 217 223 -0.5%Caldwell village 1,705 1,708 1,748 -0.4%Dexter City village 126 126 129 -0.4%Sarahsville village 166 166 171 -0.5%Summerfield village 244 245 254 -0.6%Balance of Noble County 11,739 11,765 12,019 -0.4%
Beaver township 751 751 767 -0.3% Batesville village 98 98 101 -0.5% Balance of Beaver township 653 653 666 -0.3%Brookfield township 96 96 99 -0.5%Buffalo township 795 795 815 -0.4%Center township 1,082 1,083 1,110 -0.4% Caldwell village (pt.) 9 9 9 0.0% Sarahsville village 166 166 171 -0.5% Balance of Center township 907 908 930 -0.4%Elk township 322 323 333 -0.5%Enoch township 425 427 440 -0.6% Dexter City village (pt.) 5 5 5 0.0% Balance of Enoch township 420 422 435 -0.6%Jackson township 508 510 528 -0.6% Dexter City village (pt.) 36 36 37 -0.4% Balance of Jackson township 472 474 491 -0.6%Jefferson township 271 272 281 -0.6% Dexter City village (pt.) 71 71 73 -0.4% Balance of Jefferson township 200 201 208 -0.6%Marion township 644 647 671 -0.7% Summerfield village 244 245 254 -0.6% Balance of Marion township 400 402 417 -0.7%Noble township 2,058 2,064 2,118 -0.5% Belle Valley village 216 217 223 -0.5% Balance of Noble township 1,842 1,847 1,895 -0.5%Olive township 5,769 5,779 5,852 -0.2% Caldwell village (pt.) 1,696 1,699 1,739 -0.4% Dexter City village (pt.) 14 14 14 0.0% Balance of Olive township 4,059 4,066 4,099 -0.2%Seneca township 461 463 479 -0.6%Sharon township 330 331 342 -0.6%Stock township 312 313 325 -0.7%Wayne township 470 471 485 -0.5%
n.a. - Could not calculate. Division by zero.
(a) Used for calculating average annual rate of change. (b) Average annual rate of change from April 1, 2010 to July 1, 2016.
Source: Population Estimates Division, U.S. Census Bureau. Prepared by: Office of Research, Ohio Development Services Agency.
Population

Ottawa County2016 Population Estimates For Cities, Villages, and Townships
Estimates Average AnnualEstimate Estimate Base Rate of Change
Name 7/1/16 7/1/15 4/1/10 (a) From 2010 (b)
Ottawa County 40,636 40,859 41,434 -0.3%
Clay Center village 315 318 276 2.1%Elmore village (pt.) 1,380 1,389 1,410 -0.3% Also located in Sandusky CountyGenoa village 2,284 2,297 2,336 -0.4%Marblehead village 879 884 903 -0.4%Oak Harbor village 2,737 2,745 2,759 -0.1%Port Clinton city 5,945 5,976 6,056 -0.3%Put-in-Bay village 135 135 138 -0.4%Rocky Ridge village 405 409 417 -0.5%Balance of Ottawa County 26,556 26,706 27,139 -0.3%
Allen township 3,764 3,784 3,780 -0.1% Clay Center village 315 318 276 2.1% Balance of Allen township 3,449 3,466 3,504 -0.3%Bay township 1,419 1,427 1,458 -0.4%Benton township 2,591 2,608 2,641 -0.3% Rocky Ridge village 405 409 417 -0.5% Balance of Benton township 2,186 2,199 2,224 -0.3%Carroll township 2,092 2,104 2,135 -0.3%Catawba Island township 3,517 3,537 3,599 -0.4%Clay township 4,962 4,989 5,058 -0.3% Genoa village 2,284 2,297 2,336 -0.4% Balance of Clay township 2,678 2,692 2,722 -0.3%Danbury township 5,018 5,050 5,167 -0.5% Marblehead village 879 884 903 -0.4% Balance of Danbury township 4,139 4,166 4,264 -0.5%Erie township 1,188 1,195 1,221 -0.4%Harris township 2,962 2,980 3,024 -0.3% Elmore village (pt.) 1,380 1,389 1,410 -0.3% Balance of Harris township 1,582 1,591 1,614 -0.3%Portage township 1,264 1,270 1,291 -0.3%Port Clinton city 5,945 5,976 6,056 -0.3%Put-in-Bay township 620 623 633 -0.3% Put-in-Bay village 135 135 138 -0.4% Balance of Put-in-Bay township 485 488 495 -0.3%Salem township 5,294 5,316 5,371 -0.2% Oak Harbor village 2,737 2,745 2,759 -0.1% Balance of Salem township 2,557 2,571 2,612 -0.3%
n.a. - Could not calculate. Division by zero.
(a) Used for calculating average annual rate of change. (b) Average annual rate of change from April 1, 2010 to July 1, 2016.
Source: Population Estimates Division, U.S. Census Bureau. Prepared by: Office of Research, Ohio Development Services Agency.
Population

Paulding County2016 Population Estimates For Cities, Villages, and Townships
Estimates Average AnnualEstimate Estimate Base Rate of Change
Name 7/1/16 7/1/15 4/1/10 (a) From 2010 (b)
Paulding County 18,865 18,973 19,616 -0.6%
Antwerp village 1,681 1,692 1,736 -0.5%Broughton village 116 117 120 -0.5%Cecil village 184 185 188 -0.3%Grover Hill village 381 383 402 -0.9%Haviland village 211 212 215 -0.3%Latty village 187 188 193 -0.5%Melrose village 266 268 275 -0.5%Oakwood village 593 592 613 -0.5%Paulding village 3,479 3,495 3,605 -0.6%Payne village 1,153 1,159 1,194 -0.6%Scott village (pt.) 115 116 119 -0.5% Also located in Van Wert CountyBalance of Paulding County 10,499 10,566 10,956 -0.7%
Auglaize township 1,382 1,392 1,454 -0.8%Benton township 1,005 1,010 1,046 -0.6% Payne village (pt.) 363 365 375 -0.5% Balance of Benton township 642 645 671 -0.7%Blue Creek township 759 763 781 -0.5% Haviland village 211 212 215 -0.3% Scott village (pt.) 115 116 119 -0.5% Balance of Blue Creek township 433 435 447 -0.5%Brown township 2,045 2,055 2,134 -0.7% Melrose village 266 268 275 -0.5% Oakwood village 593 592 613 -0.5% Balance of Brown township 1,186 1,195 1,246 -0.8%Carryall township 2,874 2,891 2,980 -0.6% Antwerp village 1,681 1,692 1,736 -0.5% Balance of Carryall township 1,193 1,199 1,244 -0.7%Crane township 1,353 1,363 1,420 -0.8% Cecil village 184 185 188 -0.3% Balance of Crane township 1,169 1,178 1,232 -0.8%Emerald township 768 773 789 -0.4% Paulding village (pt.) 0 0 0 n.a. Balance of Emerald township 768 773 789 -0.4%Harrison township 1,403 1,410 1,459 -0.6% Payne village (pt.) 790 794 819 -0.6% Balance of Harrison township 613 616 640 -0.7%Jackson township 1,724 1,734 1,795 -0.6% Broughton village 116 117 120 -0.5% Paulding village (pt.) 794 798 822 -0.6% Balance of Jackson township 814 819 853 -0.7%Latty township 984 990 1,017 -0.5% Grover Hill village 381 383 402 -0.9% Balance of Latty township 603 607 615 -0.3%
Continued
Population

Paulding County2016 Population Estimates For Cities, Villages, and Townships
Estimates Average AnnualEstimate Estimate Base Rate of Change
Name 7/1/16 7/1/15 4/1/10 (a) From 2010 (b)
Paulding township 3,874 3,892 4,022 -0.6% Latty village 187 188 193 -0.5% Paulding village (pt.) 2,685 2,697 2,783 -0.6% Balance of Paulding township 1,002 1,007 1,046 -0.7%Washington township 694 700 719 -0.6%
n.a. - Could not calculate. Division by zero.
(a) Used for calculating average annual rate of change. (b) Average annual rate of change from April 1, 2010 to July 1, 2016.
Source: Population Estimates Division, U.S. Census Bureau. Prepared by: Office of Research, Ohio Development Services Agency.
Population

Perry County2016 Population Estimates For Cities, Villages, and Townships
Estimates Average AnnualEstimate Estimate Base Rate of Change
Name 7/1/16 7/1/15 4/1/10 (a) From 2010 (b)
Perry County 35,927 35,952 36,039 0.0%
Corning village 571 574 582 -0.3%Crooksville village 2,497 2,505 2,534 -0.2%Glenford village 176 176 173 0.3%Hemlock village 156 156 155 0.1%Junction City village 805 808 819 -0.3%New Lexington village 4,722 4,735 4,758 -0.1%New Straitsville village 711 714 722 -0.2%Rendville village 36 36 36 0.0%Roseville village (pt.) 1,084 1,088 1,092 -0.1% Also located in Muskingum CountyShawnee village 643 646 655 -0.3%Somerset village 1,463 1,465 1,481 -0.2%Thornville village 997 998 995 0.0%Balance of Perry County 22,066 22,051 22,037 0.0%
Bearfield township 1,655 1,660 1,677 -0.2%Clayton township 1,539 1,543 1,565 -0.3%Coal township 1,021 1,024 1,042 -0.3% New Straitsville village 711 714 722 -0.2% Balance of Coal township 310 310 320 -0.5%Harrison township 5,168 5,187 5,240 -0.2% Crooksville village 2,497 2,505 2,534 -0.2% Roseville village (pt.) 1,084 1,088 1,092 -0.1% Balance of Harrison township 1,587 1,594 1,614 -0.3%Hopewell township 2,418 2,405 2,399 0.1% Glenford village 176 176 173 0.3% Balance of Hopewell township 2,242 2,229 2,226 0.1%Jackson township 2,809 2,820 2,856 -0.3% Junction City village 805 808 819 -0.3% Balance of Jackson township 2,004 2,012 2,037 -0.3%Madison township 1,350 1,354 1,377 -0.3%Monday Creek township 716 719 727 -0.2%Monroe township 1,470 1,476 1,502 -0.3% Corning village 571 574 582 -0.3% Rendville village 36 36 36 0.0% Balance of Monroe township 863 866 884 -0.4%Pike township 6,862 6,880 6,923 -0.1% New Lexington village 4,722 4,735 4,758 -0.1% Balance of Pike township 2,140 2,145 2,165 -0.2%Pleasant township 835 839 846 -0.2%Reading township 4,394 4,384 4,370 0.1% Somerset village 1,463 1,465 1,481 -0.2% Balance of Reading township 2,931 2,919 2,889 0.2%Salt Lick township 1,240 1,245 1,262 -0.3% Hemlock village 156 156 155 0.1% Shawnee village 643 646 655 -0.3% Balance of Salt Lick township 441 443 452 -0.4%
Continued
Population

Perry County2016 Population Estimates For Cities, Villages, and Townships
Estimates Average AnnualEstimate Estimate Base Rate of Change
Name 7/1/16 7/1/15 4/1/10 (a) From 2010 (b)
Thorn township 4,450 4,416 4,253 0.7% Thornville village 997 998 995 0.0% Balance of Thorn township 3,453 3,418 3,258 0.9%
n.a. - Could not calculate. Division by zero.
(a) Used for calculating average annual rate of change. (b) Average annual rate of change from April 1, 2010 to July 1, 2016.
Source: Population Estimates Division, U.S. Census Bureau. Prepared by: Office of Research, Ohio Development Services Agency.
Population
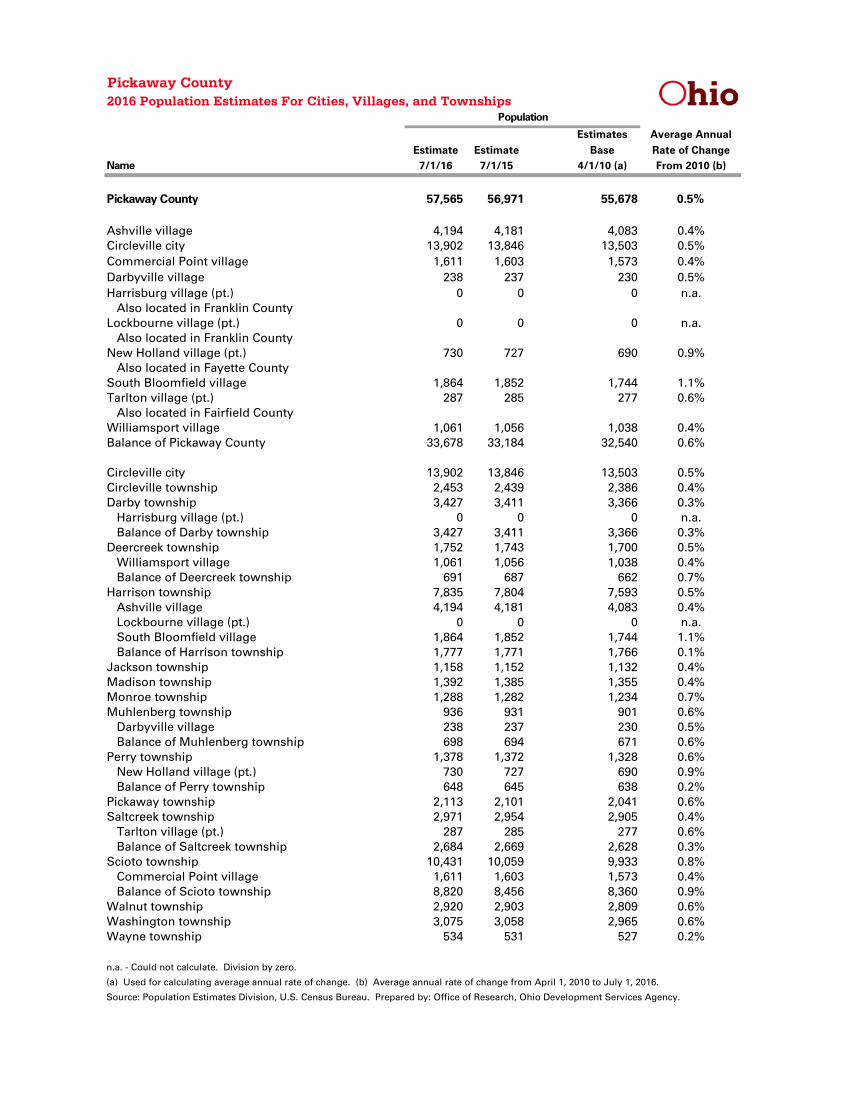
Pickaway County2016 Population Estimates For Cities, Villages, and Townships
Estimates Average AnnualEstimate Estimate Base Rate of Change
Name 7/1/16 7/1/15 4/1/10 (a) From 2010 (b)
Pickaway County 57,565 56,971 55,678 0.5%
Ashville village 4,194 4,181 4,083 0.4%Circleville city 13,902 13,846 13,503 0.5%Commercial Point village 1,611 1,603 1,573 0.4%Darbyville village 238 237 230 0.5%Harrisburg village (pt.) 0 0 0 n.a. Also located in Franklin CountyLockbourne village (pt.) 0 0 0 n.a. Also located in Franklin CountyNew Holland village (pt.) 730 727 690 0.9% Also located in Fayette CountySouth Bloomfield village 1,864 1,852 1,744 1.1%Tarlton village (pt.) 287 285 277 0.6% Also located in Fairfield CountyWilliamsport village 1,061 1,056 1,038 0.4%Balance of Pickaway County 33,678 33,184 32,540 0.6%
Circleville city 13,902 13,846 13,503 0.5%Circleville township 2,453 2,439 2,386 0.4%Darby township 3,427 3,411 3,366 0.3% Harrisburg village (pt.) 0 0 0 n.a. Balance of Darby township 3,427 3,411 3,366 0.3%Deercreek township 1,752 1,743 1,700 0.5% Williamsport village 1,061 1,056 1,038 0.4% Balance of Deercreek township 691 687 662 0.7%Harrison township 7,835 7,804 7,593 0.5% Ashville village 4,194 4,181 4,083 0.4% Lockbourne village (pt.) 0 0 0 n.a. South Bloomfield village 1,864 1,852 1,744 1.1% Balance of Harrison township 1,777 1,771 1,766 0.1%Jackson township 1,158 1,152 1,132 0.4%Madison township 1,392 1,385 1,355 0.4%Monroe township 1,288 1,282 1,234 0.7%Muhlenberg township 936 931 901 0.6% Darbyville village 238 237 230 0.5% Balance of Muhlenberg township 698 694 671 0.6%Perry township 1,378 1,372 1,328 0.6% New Holland village (pt.) 730 727 690 0.9% Balance of Perry township 648 645 638 0.2%Pickaway township 2,113 2,101 2,041 0.6%Saltcreek township 2,971 2,954 2,905 0.4% Tarlton village (pt.) 287 285 277 0.6% Balance of Saltcreek township 2,684 2,669 2,628 0.3%Scioto township 10,431 10,059 9,933 0.8% Commercial Point village 1,611 1,603 1,573 0.4% Balance of Scioto township 8,820 8,456 8,360 0.9%Walnut township 2,920 2,903 2,809 0.6%Washington township 3,075 3,058 2,965 0.6%Wayne township 534 531 527 0.2%
n.a. - Could not calculate. Division by zero.
(a) Used for calculating average annual rate of change. (b) Average annual rate of change from April 1, 2010 to July 1, 2016.
Source: Population Estimates Division, U.S. Census Bureau. Prepared by: Office of Research, Ohio Development Services Agency.
Population

Pike County2016 Population Estimates For Cities, Villages, and Townships
Estimates Average AnnualEstimate Estimate Base Rate of Change
Name 7/1/16 7/1/15 4/1/10 (a) From 2010 (b)
Pike County 28,160 28,206 28,702 -0.3%
Beaver village 441 441 449 -0.3%Piketon village 2,189 2,191 2,182 0.1%Waverly village 4,365 4,368 4,406 -0.1%Balance of Pike County 21,165 21,206 21,665 -0.4%
Beaver township 1,336 1,339 1,369 -0.4% Beaver village (pt.) 122 122 125 -0.4% Balance of Beaver township 1,214 1,217 1,244 -0.4%Benton township 1,623 1,627 1,669 -0.4%Camp Creek township 951 953 979 -0.5%Jackson township 1,179 1,182 1,209 -0.4%Marion township 1,442 1,444 1,467 -0.3% Beaver village (pt.) 319 319 324 -0.2% Balance of Marion township 1,123 1,125 1,143 -0.3%Mifflin township 1,262 1,265 1,298 -0.4%Newton township 1,907 1,910 1,958 -0.4%Pebble township 2,496 2,502 2,553 -0.4%Pee Pee township 7,794 7,801 7,886 -0.2% Waverly village 4,365 4,368 4,406 -0.1% Balance of Pee Pee township 3,429 3,433 3,480 -0.2%Perry township 999 1,001 1,026 -0.4%Scioto township 1,238 1,241 1,269 -0.4%Seal township 3,367 3,371 3,394 -0.1% Piketon village 2,189 2,191 2,182 0.1% Balance of Seal township 1,178 1,180 1,212 -0.5%Sunfish township 1,270 1,273 1,307 -0.5%Union township 1,296 1,297 1,318 -0.3%
n.a. - Could not calculate. Division by zero.
(a) Used for calculating average annual rate of change. (b) Average annual rate of change from April 1, 2010 to July 1, 2016.
Source: Population Estimates Division, U.S. Census Bureau. Prepared by: Office of Research, Ohio Development Services Agency.
Population

Portage County2016 Population Estimates For Cities, Villages, and Townships
Estimates Average AnnualEstimate Estimate Base Rate of Change
Name 7/1/16 7/1/15 4/1/10 (a) From 2010 (b)
Portage County 161,921 162,042 161,421 0.0%
Aurora city 15,876 15,819 15,546 0.3%Brady Lake village 461 463 466 -0.2%Garrettsville village 2,323 2,332 2,338 -0.1%Hiram village 1,195 1,262 1,406 -2.6%Kent city 30,071 29,777 28,906 0.6%Mantua village 1,019 1,024 1,030 -0.2%Mogadore village (pt.) 1,004 1,008 1,014 -0.2% Also located in Summit CountyRavenna city 11,533 11,605 11,723 -0.3%Streetsboro city 16,272 16,289 16,029 0.2%Sugar Bush Knolls village 177 178 179 -0.2%Tallmadge city (pt.) 287 288 290 -0.2% Also located in Summit CountyWindham village 2,202 2,211 2,223 -0.2%Balance of Portage County 79,501 79,786 80,271 -0.2%
Atwater township 2,700 2,712 2,740 -0.2%Aurora city 15,876 15,819 15,546 0.3%Brady Lake village 461 463 466 -0.2%Brimfield township 10,354 10,385 10,385 0.0%Charlestown township 1,768 1,776 1,814 -0.4%Deerfield township 2,781 2,792 2,822 -0.2%Edinburg township 2,578 2,585 2,586 0.0%Franklin township 5,478 5,498 5,518 -0.1%Freedom township 2,805 2,815 2,846 -0.2%Garrettsville village 2,323 2,332 2,338 -0.1%Hiram village 1,195 1,262 1,406 -2.6%Hiram township 2,404 2,410 2,411 0.0%Kent city 30,071 29,777 28,906 0.6%Mantua village 1,019 1,024 1,030 -0.2%Mantua township 4,788 4,806 4,828 -0.1%Mogadore village 1,004 1,008 1,014 -0.2%Nelson township 3,085 3,099 3,137 -0.3%Palmyra township 2,907 2,915 2,919 -0.1%Paris township 1,729 1,734 1,744 -0.1%Randolph township 5,242 5,261 5,301 -0.2%Ravenna city 11,533 11,605 11,723 -0.3%Ravenna township 9,014 9,056 9,191 -0.3%Rootstown township 8,147 8,175 8,209 -0.1%Shalersville township 5,625 5,642 5,667 -0.1%Streetsboro city 16,272 16,289 16,029 0.2%Suffield township 6,282 6,302 6,304 -0.1%Sugar Bush Knolls village 177 178 179 -0.2%Tallmadge city 287 288 290 -0.2%Windham village 2,202 2,211 2,223 -0.2%Windham township 1,814 1,823 1,849 -0.3%
n.a. - Could not calculate. Division by zero.
(a) Used for calculating average annual rate of change. (b) Average annual rate of change from April 1, 2010 to July 1, 2016.
Source: Population Estimates Division, U.S. Census Bureau. Prepared by: Office of Research, Ohio Development Services Agency.
Population

Preble County2016 Population Estimates For Cities, Villages, and Townships
Estimates Average AnnualEstimate Estimate Base Rate of Change
Name 7/1/16 7/1/15 4/1/10 (a) From 2010 (b)
Preble County 41,247 41,367 42,270 -0.4%
Camden village 1,963 1,973 2,044 -0.6%College Corner village (pt.) 215 214 216 -0.1% Also located in Butler CountyEaton city 8,211 8,228 8,409 -0.4%Eldorado village 498 499 509 -0.3%Gratis village 858 860 881 -0.4%Lewisburg village 1,765 1,772 1,820 -0.5%New Paris village 1,574 1,580 1,629 -0.5%Verona village (pt.) 406 407 415 -0.4% Also located in Montgomery CountyWest Alexandria village 1,344 1,349 1,379 -0.4%West Elkton village 193 193 197 -0.3%West Manchester village 464 465 474 -0.3%Balance of Preble County 23,756 23,827 24,297 -0.4%
Dixon township 555 557 567 -0.3%Eaton city 8,211 8,228 8,409 -0.4%Gasper township 3,847 3,855 3,909 -0.3%Gratis township 4,317 4,328 4,408 -0.3% Gratis village 858 860 881 -0.4% West Elkton village 193 193 197 -0.3% Balance of Gratis township 3,266 3,275 3,330 -0.3%Harrison township 4,474 4,489 4,594 -0.4% Lewisburg village 1,765 1,772 1,820 -0.5% Verona village (pt.) 406 407 415 -0.4% Balance of Harrison township 2,303 2,310 2,359 -0.4%Israel township 1,143 1,145 1,169 -0.4% College Corner village (pt.) 215 214 216 -0.1% Balance of Israel township 928 931 953 -0.4%Jackson township 1,164 1,168 1,190 -0.4%Jefferson township 3,217 3,227 3,309 -0.5% New Paris village 1,574 1,580 1,629 -0.5% Balance of Jefferson township 1,643 1,647 1,680 -0.4%Lanier township 3,767 3,779 3,853 -0.4% West Alexandria village (pt.) 857 860 876 -0.4% Balance of Lanier township 2,910 2,919 2,977 -0.4%Monroe township 2,202 2,210 2,258 -0.4% Eldorado village 498 499 509 -0.3% West Manchester village 464 465 474 -0.3% Balance of Monroe township 1,240 1,246 1,275 -0.4%Somers township 3,852 3,870 3,992 -0.6% Camden village 1,963 1,973 2,044 -0.6% Balance of Somers township 1,889 1,897 1,948 -0.5%Twin township 2,720 2,728 2,790 -0.4% West Alexandria village (pt.) 487 489 503 -0.5% Balance of Twin township 2,233 2,239 2,287 -0.4%Washington township 1,778 1,783 1,822 -0.4%
n.a. - Could not calculate. Division by zero.
(a) Used for calculating average annual rate of change. (b) Average annual rate of change from April 1, 2010 to July 1, 2016.
Source: Population Estimates Division, U.S. Census Bureau. Prepared by: Office of Research, Ohio Development Services Agency.
Population

Putnam County2016 Population Estimates For Cities, Villages, and Townships
Estimates Average AnnualEstimate Estimate Base Rate of Change
Name 7/1/16 7/1/15 4/1/10 (a) From 2010 (b)
Putnam County 34,056 34,038 34,497 -0.2%
Belmore village 145 145 148 -0.3%Cloverdale village 165 165 168 -0.3%Columbus Grove village 2,086 2,084 2,144 -0.4%Continental village 1,121 1,123 1,157 -0.5%Dupont village 300 300 317 -0.9%Fort Jennings village 484 481 488 -0.1%Gilboa village 184 184 187 -0.3%Glandorf village 1,007 1,007 992 0.2%Kalida village 1,564 1,557 1,537 0.3%Leipsic village 2,032 2,035 2,095 -0.5%Miller City village 145 142 141 0.4%Ottawa village 4,406 4,408 4,481 -0.3%Ottoville village 976 972 985 -0.1%Pandora village 1,148 1,146 1,164 -0.2%West Leipsic village 198 198 202 -0.3%Balance of Putnam County 18,095 18,091 18,291 -0.2%
Blanchard township 1,234 1,237 1,272 -0.5% Gilboa village 184 184 187 -0.3% Balance of Blanchard township 1,050 1,053 1,085 -0.5%Greensburg township 1,401 1,404 1,397 0.0%Jackson township 922 922 934 -0.2%Jennings township 1,932 1,932 1,974 -0.3% Fort Jennings village 484 481 488 -0.1% Balance of Jennings township 1,448 1,451 1,486 -0.4%Liberty township 1,543 1,537 1,535 0.1% Leipsic village (pt.) 0 0 0 n.a. West Leipsic village 198 198 202 -0.3% Balance of Liberty township 1,345 1,339 1,333 0.1%Monroe township 2,070 2,075 2,129 -0.4% Continental village 1,121 1,123 1,157 -0.5% Balance of Monroe township 949 952 972 -0.4%Monterey township 2,071 2,067 2,066 0.0% Ottoville village 976 972 985 -0.1% Balance of Monterey township 1,095 1,095 1,081 0.2%Ottawa township 7,803 7,792 7,838 -0.1% Glandorf village 1,007 1,007 992 0.2% Ottawa village 4,406 4,408 4,481 -0.3% Balance of Ottawa township 2,390 2,377 2,365 0.2%Palmer township 1,141 1,138 1,131 0.1% Miller City village 145 142 141 0.4% Balance of Palmer township 996 996 990 0.1%Perry township 1,133 1,131 1,166 -0.5% Cloverdale village 165 165 168 -0.3% Dupont village 300 300 317 -0.9% Balance of Perry township 668 666 681 -0.3%Pleasant township 3,699 3,700 3,804 -0.4% Columbus Grove village 2,086 2,084 2,144 -0.4% Balance of Pleasant township 1,613 1,616 1,660 -0.5%
Continued
Population

Putnam County2016 Population Estimates For Cities, Villages, and Townships
Estimates Average AnnualEstimate Estimate Base Rate of Change
Name 7/1/16 7/1/15 4/1/10 (a) From 2010 (b)
Riley township 2,078 2,079 2,127 -0.4% Pandora village 1,148 1,146 1,164 -0.2% Balance of Riley township 930 933 963 -0.6%Sugar Creek township 1,156 1,159 1,204 -0.6%Union township 3,093 3,084 3,052 0.2% Kalida village 1,564 1,557 1,537 0.3% Balance of Union township 1,529 1,527 1,515 0.1%Van Buren township 2,780 2,781 2,868 -0.5% Belmore village 145 145 148 -0.3% Leipsic village (pt.) 2,032 2,035 2,095 -0.5% Balance of Van Buren township 603 601 625 -0.6%
n.a. - Could not calculate. Division by zero.
(a) Used for calculating average annual rate of change. (b) Average annual rate of change from April 1, 2010 to July 1, 2016.
Source: Population Estimates Division, U.S. Census Bureau. Prepared by: Office of Research, Ohio Development Services Agency.
Population

Richland County2016 Population Estimates For Cities, Villages, and Townships
Estimates Average AnnualEstimate Estimate Base Rate of Change
Name 7/1/16 7/1/15 4/1/10 (a) From 2010 (b)
Richland County 121,107 121,581 124,475 -0.4%
Bellville village 1,871 1,873 1,918 -0.4%Butler village 906 911 938 -0.6%Crestline village (pt.) 18 18 18 0.0% Also located in Crawford CountyGalion city (pt.) 0 0 0 n.a. Also located in Crawford County Also located in Morrow CountyLexington village 4,704 4,720 4,822 -0.4%Lucas village 592 596 615 -0.6%Mansfield city 46,678 46,865 47,821 -0.4%Ontario city 6,079 6,097 6,225 -0.4%Plymouth village (pt.) 916 920 948 -0.5% Also located in Huron CountyShelby city 9,030 9,066 9,317 -0.5%Shiloh village 622 626 649 -0.7%Balance of Richland County 49,691 49,889 51,204 -0.5%
Bloominggrove township 1,164 1,169 1,204 -0.5%Butler township 1,154 1,160 1,205 -0.7%Cass township 1,583 1,592 1,647 -0.6% Shelby city (pt.) 6 6 6 0.0% Shiloh village 622 626 649 -0.7% Balance of Cass township 955 960 992 -0.6%Franklin township 1,672 1,679 1,721 -0.5%Jackson township 3,470 3,481 3,552 -0.4% Shelby city (pt.) 1,061 1,064 1,082 -0.3% Balance of Jackson township 2,409 2,417 2,470 -0.4%Jefferson township 4,703 4,717 4,851 -0.5% Bellville village (pt.) 1,852 1,854 1,899 -0.4% Balance of Jefferson township 2,851 2,863 2,952 -0.6%Madison township 10,822 10,867 11,168 -0.5%Mansfield city 46,678 46,865 47,821 -0.4%Mifflin township 6,055 6,076 6,219 -0.4%Monroe township 2,645 2,656 2,723 -0.5% Lucas village 592 596 615 -0.6% Balance of Monroe township 2,053 2,060 2,108 -0.4%Perry township 1,409 1,415 1,456 -0.5%Plymouth township 2,014 2,024 2,083 -0.5% Plymouth village (pt.) 916 920 948 -0.5% Shelby city (pt.) 9 9 9 0.0% Balance of Plymouth township 1,089 1,095 1,126 -0.5%Sandusky township 960 965 993 -0.5% Crestline village (pt.) 18 18 18 0.0% Galion city (pt.) 0 0 0 n.a. Balance of Sandusky township 942 947 975 -0.5%Sharon township 8,827 8,865 9,125 -0.5% Shelby city (pt.) 7,954 7,987 8,220 -0.5% Balance of Sharon township 873 878 905 -0.6%
Continued
Population

Richland County2016 Population Estimates For Cities, Villages, and Townships
Estimates Average AnnualEstimate Estimate Base Rate of Change
Name 7/1/16 7/1/15 4/1/10 (a) From 2010 (b)
Springfield township 10,410 10,445 10,685 -0.4% Ontario city 6,079 6,097 6,225 -0.4% Balance of Springfield township 4,331 4,348 4,460 -0.5%Troy township 6,825 6,848 7,000 -0.4% Lexington village (pt.) 4,448 4,463 4,561 -0.4% Balance of Troy township 2,377 2,385 2,439 -0.4%Washington township 6,213 6,236 6,374 -0.4% Bellville village (pt.) 19 19 19 0.0% Lexington village (pt.) 256 257 261 -0.3% Balance of Washington township 5,938 5,960 6,094 -0.4%Weller township 1,730 1,737 1,780 -0.5%Worthington township 2,773 2,784 2,868 -0.5% Butler village 906 911 938 -0.6% Balance of Worthington township 1,867 1,873 1,930 -0.5%
n.a. - Could not calculate. Division by zero.
(a) Used for calculating average annual rate of change. (b) Average annual rate of change from April 1, 2010 to July 1, 2016.
Source: Population Estimates Division, U.S. Census Bureau. Prepared by: Office of Research, Ohio Development Services Agency.
Population

Ross County2016 Population Estimates For Cities, Villages, and Townships
Estimates Average AnnualEstimate Estimate Base Rate of Change
Name 7/1/16 7/1/15 4/1/10 (a) From 2010 (b)
Ross County 77,000 77,162 78,062 -0.2%
Adelphi village 373 375 380 -0.3%Bainbridge village 851 853 860 -0.2%Chillicothe city 21,725 21,742 21,903 -0.1%Clarksburg village 456 456 452 0.1%Frankfort village 1,061 1,063 1,064 0.0%Greenfield village (pt.) 0 0 0 n.a. Also located in Highland CountyKingston village 1,023 1,025 1,032 -0.1%South Salem village 206 206 204 0.2%Balance of Ross County 51,305 51,442 52,167 -0.3%
Buckskin township 2,071 2,066 2,037 0.3% Greenfield village (pt.) 0 0 0 n.a. South Salem village 206 206 204 0.2% Balance of Buckskin township 1,865 1,860 1,833 0.3%Colerain township 2,121 2,128 2,148 -0.2% Adelphi village 373 375 380 -0.3% Balance of Colerain township 1,748 1,753 1,768 -0.2%Concord township 4,433 4,442 4,460 -0.1% Frankfort village 1,061 1,063 1,064 0.0% Balance of Concord township 3,372 3,379 3,396 -0.1%Deerfield township 1,056 1,058 1,058 0.0% Clarksburg village 456 456 452 0.1% Balance of Deerfield township 600 602 606 -0.2%Franklin township 1,685 1,689 1,705 -0.2%Green township 4,889 4,898 4,918 -0.1% Kingston village 1,023 1,025 1,032 -0.1% Balance of Green township 3,866 3,873 3,886 -0.1%Harrison township 1,307 1,311 1,320 -0.2%Huntington township 6,119 6,137 6,220 -0.3%Jefferson township 986 989 991 -0.1%Liberty township 2,588 2,594 2,619 -0.2%Paint township 1,341 1,345 1,363 -0.3%Paxton township 2,099 2,103 2,116 -0.1% Bainbridge village 851 853 860 -0.2% Balance of Paxton township 1,248 1,250 1,256 -0.1%Scioto township 27,504 27,533 27,721 -0.1% Chillicothe city (pt.) 21,722 21,739 21,900 -0.1% Balance of Scioto township 5,782 5,794 5,821 -0.1%Springfield township 2,636 2,642 2,657 -0.1% Chillicothe city (pt.) 3 3 3 0.0% Balance of Springfield township 2,633 2,639 2,654 -0.1%Twin township 3,357 3,364 3,384 -0.1%Union township 12,808 12,863 13,345 -0.7%
n.a. - Could not calculate. Division by zero.
(a) Used for calculating average annual rate of change. (b) Average annual rate of change from April 1, 2010 to July 1, 2016.
Source: Population Estimates Division, U.S. Census Bureau. Prepared by: Office of Research, Ohio Development Services Agency.
Population

Sandusky County2016 Population Estimates For Cities, Villages, and Townships
Estimates Average AnnualEstimate Estimate Base Rate of Change
Name 7/1/16 7/1/15 4/1/10 (a) From 2010 (b)
Sandusky County 59,330 59,518 60,946 -0.4%
Bellevue city (pt.) 4,412 4,435 4,532 -0.4% Also located in Huron County Also located in Erie CountyBurgoon village 172 172 175 -0.3%Clyde city 6,221 6,254 6,414 -0.5%Elmore village (pt.) 0 0 0 n.a. Also located in Ottawa CountyFremont city 16,309 16,266 16,744 -0.4%Gibsonburg village 2,542 2,560 2,583 -0.3%Green Springs village (pt.) 713 718 738 -0.5% Also located in Seneca CountyHelena village 217 219 222 -0.4%Lindsey village 425 428 446 -0.8%Woodville village 2,064 2,078 2,135 -0.5%Balance of Sandusky County 26,255 26,388 26,957 -0.4%
Ballville township 5,851 5,870 5,983 -0.4%Bellevue city (pt.) 4,412 4,435 4,532 -0.4%Clyde city 6,221 6,254 6,414 -0.5%Fremont city 16,309 16,266 16,744 -0.4%Green Creek township 3,460 3,475 3,560 -0.5%Green Springs village (pt.) 713 718 738 -0.5%Jackson township 1,574 1,583 1,608 -0.3% Burgoon village 172 172 175 -0.3% Helena village (pt.) 130 131 133 -0.4% Balance of Jackson township 1,272 1,280 1,300 -0.3%Madison township 3,769 3,795 3,850 -0.3% Gibsonburg village (pt.) 2,542 2,560 2,583 -0.3% Balance of Madison township 1,227 1,235 1,267 -0.5%Rice township 1,323 1,329 1,370 -0.6%Riley township 1,196 1,203 1,226 -0.4%Sandusky township 3,512 3,533 3,614 -0.5%Scott township 1,447 1,451 1,437 0.1%Townsend township 1,561 1,572 1,623 -0.6%Washington township 2,239 2,255 2,329 -0.6% Elmore village (pt.) 0 0 0 n.a. Gibsonburg village (pt.) 0 0 0 n.a. Helena village (pt.) 87 88 89 -0.4% Lindsey village 425 428 446 -0.8% Balance of Washington township 1,727 1,739 1,794 -0.6%Woodville township 3,311 3,331 3,395 -0.4% Gibsonburg village (pt.) 0 0 0 n.a. Woodville village 2,064 2,078 2,135 -0.5% Balance of Woodville township 1,247 1,253 1,260 -0.2%York township 2,432 2,448 2,523 -0.6%
n.a. - Could not calculate. Division by zero.
(a) Used for calculating average annual rate of change. (b) Average annual rate of change from April 1, 2010 to July 1, 2016.
Source: Population Estimates Division, U.S. Census Bureau. Prepared by: Office of Research, Ohio Development Services Agency.
Population
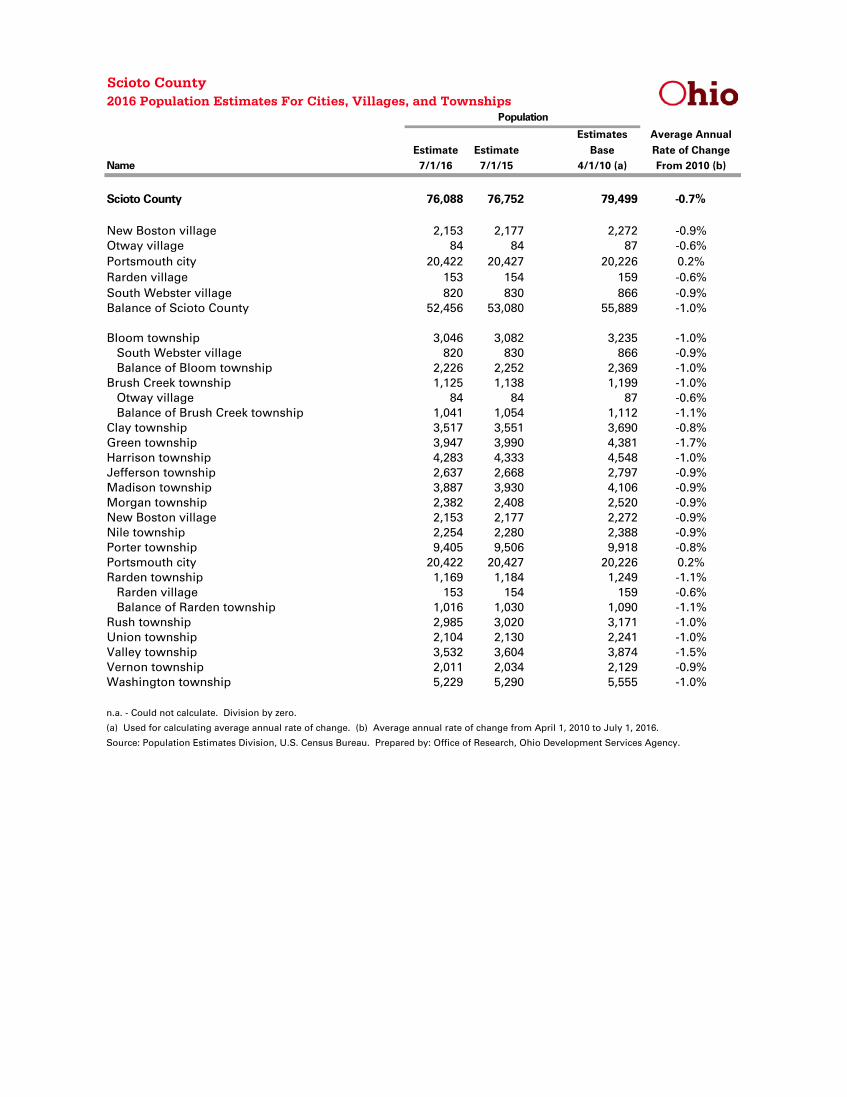
Scioto County2016 Population Estimates For Cities, Villages, and Townships
Estimates Average AnnualEstimate Estimate Base Rate of Change
Name 7/1/16 7/1/15 4/1/10 (a) From 2010 (b)
Scioto County 76,088 76,752 79,499 -0.7%
New Boston village 2,153 2,177 2,272 -0.9%Otway village 84 84 87 -0.6%Portsmouth city 20,422 20,427 20,226 0.2%Rarden village 153 154 159 -0.6%South Webster village 820 830 866 -0.9%Balance of Scioto County 52,456 53,080 55,889 -1.0%
Bloom township 3,046 3,082 3,235 -1.0% South Webster village 820 830 866 -0.9% Balance of Bloom township 2,226 2,252 2,369 -1.0%Brush Creek township 1,125 1,138 1,199 -1.0% Otway village 84 84 87 -0.6% Balance of Brush Creek township 1,041 1,054 1,112 -1.1%Clay township 3,517 3,551 3,690 -0.8%Green township 3,947 3,990 4,381 -1.7%Harrison township 4,283 4,333 4,548 -1.0%Jefferson township 2,637 2,668 2,797 -0.9%Madison township 3,887 3,930 4,106 -0.9%Morgan township 2,382 2,408 2,520 -0.9%New Boston village 2,153 2,177 2,272 -0.9%Nile township 2,254 2,280 2,388 -0.9%Porter township 9,405 9,506 9,918 -0.8%Portsmouth city 20,422 20,427 20,226 0.2%Rarden township 1,169 1,184 1,249 -1.1% Rarden village 153 154 159 -0.6% Balance of Rarden township 1,016 1,030 1,090 -1.1%Rush township 2,985 3,020 3,171 -1.0%Union township 2,104 2,130 2,241 -1.0%Valley township 3,532 3,604 3,874 -1.5%Vernon township 2,011 2,034 2,129 -0.9%Washington township 5,229 5,290 5,555 -1.0%
n.a. - Could not calculate. Division by zero.
(a) Used for calculating average annual rate of change. (b) Average annual rate of change from April 1, 2010 to July 1, 2016.
Source: Population Estimates Division, U.S. Census Bureau. Prepared by: Office of Research, Ohio Development Services Agency.
Population

Seneca County2016 Population Estimates For Cities, Villages, and Townships
Estimates Average AnnualEstimate Estimate Base Rate of Change
Name 7/1/16 7/1/15 4/1/10 (a) From 2010 (b)
Seneca County 55,353 55,579 56,742 -0.4%
Attica village 874 876 899 -0.5%Bettsville village 632 635 656 -0.6%Bloomville village 924 929 956 -0.5%Fostoria city (pt.) 9,319 9,345 9,484 -0.3% Also located in Wood County Also located in Hancock CountyGreen Springs village (pt.) 602 606 628 -0.7% Also located in Sandusky CountyNew Riegel village 244 245 249 -0.3%Republic village 526 529 549 -0.7%Tiffin city 17,545 17,657 17,961 -0.4%Balance of Seneca County 24,687 24,757 25,360 -0.4%
Adams township 1,283 1,287 1,320 -0.5%Big Spring township 1,715 1,723 1,769 -0.5% New Riegel village 244 245 249 -0.3% Balance of Big Spring township 1,471 1,478 1,520 -0.5%Bloom township 1,736 1,745 1,798 -0.6% Bloomville village 924 929 956 -0.5% Balance of Bloom township 812 816 842 -0.6%Clinton township 4,042 4,041 4,114 -0.3%Eden township 2,153 2,158 2,188 -0.3%Fostoria city (pt.) 9,319 9,345 9,484 -0.3%Green Springs village (pt.) 602 606 628 -0.7%Hopewell township 2,712 2,710 2,776 -0.4%Jackson township 1,474 1,481 1,510 -0.4%Liberty township 1,960 1,969 2,030 -0.6% Bettsville village 632 635 656 -0.6% Balance of Liberty township 1,328 1,334 1,374 -0.5%Loudon township 2,054 2,064 2,129 -0.6%Pleasant township 1,597 1,597 1,635 -0.4%Reed township 818 823 848 -0.6%Scipio township 1,676 1,685 1,729 -0.5% Republic village 526 529 549 -0.7% Balance of Scipio township 1,150 1,156 1,180 -0.4%Seneca township 1,569 1,576 1,622 -0.5%Thompson township 1,395 1,402 1,443 -0.5%Tiffin city 17,545 17,657 17,961 -0.4%Venice township 1,703 1,710 1,758 -0.5% Attica village 874 876 899 -0.5% Balance of Venice township 829 834 859 -0.6%
n.a. - Could not calculate. Division by zero.
(a) Used for calculating average annual rate of change. (b) Average annual rate of change from April 1, 2010 to July 1, 2016.
Source: Population Estimates Division, U.S. Census Bureau. Prepared by: Office of Research, Ohio Development Services Agency.
Population
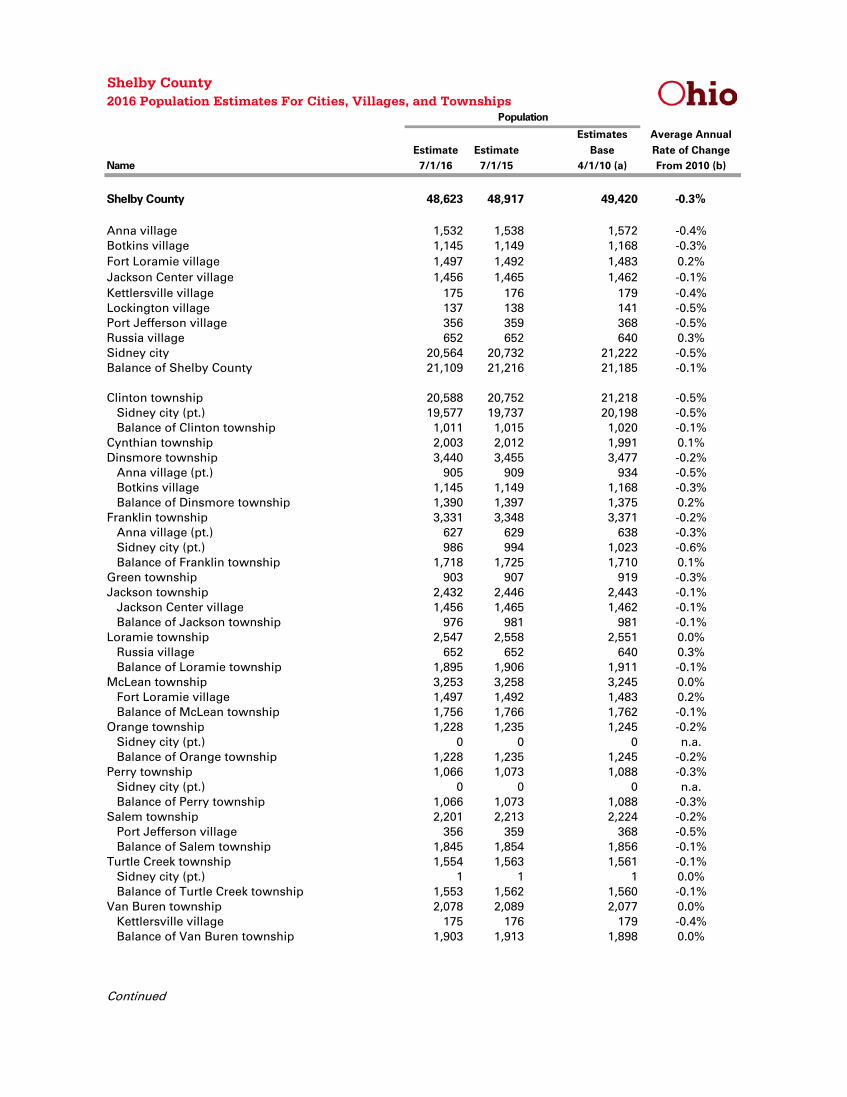
Shelby County2016 Population Estimates For Cities, Villages, and Townships
Estimates Average AnnualEstimate Estimate Base Rate of Change
Name 7/1/16 7/1/15 4/1/10 (a) From 2010 (b)
Shelby County 48,623 48,917 49,420 -0.3%
Anna village 1,532 1,538 1,572 -0.4%Botkins village 1,145 1,149 1,168 -0.3%Fort Loramie village 1,497 1,492 1,483 0.2%Jackson Center village 1,456 1,465 1,462 -0.1%Kettlersville village 175 176 179 -0.4%Lockington village 137 138 141 -0.5%Port Jefferson village 356 359 368 -0.5%Russia village 652 652 640 0.3%Sidney city 20,564 20,732 21,222 -0.5%Balance of Shelby County 21,109 21,216 21,185 -0.1%
Clinton township 20,588 20,752 21,218 -0.5% Sidney city (pt.) 19,577 19,737 20,198 -0.5% Balance of Clinton township 1,011 1,015 1,020 -0.1%Cynthian township 2,003 2,012 1,991 0.1%Dinsmore township 3,440 3,455 3,477 -0.2% Anna village (pt.) 905 909 934 -0.5% Botkins village 1,145 1,149 1,168 -0.3% Balance of Dinsmore township 1,390 1,397 1,375 0.2%Franklin township 3,331 3,348 3,371 -0.2% Anna village (pt.) 627 629 638 -0.3% Sidney city (pt.) 986 994 1,023 -0.6% Balance of Franklin township 1,718 1,725 1,710 0.1%Green township 903 907 919 -0.3%Jackson township 2,432 2,446 2,443 -0.1% Jackson Center village 1,456 1,465 1,462 -0.1% Balance of Jackson township 976 981 981 -0.1%Loramie township 2,547 2,558 2,551 0.0% Russia village 652 652 640 0.3% Balance of Loramie township 1,895 1,906 1,911 -0.1%McLean township 3,253 3,258 3,245 0.0% Fort Loramie village 1,497 1,492 1,483 0.2% Balance of McLean township 1,756 1,766 1,762 -0.1%Orange township 1,228 1,235 1,245 -0.2% Sidney city (pt.) 0 0 0 n.a. Balance of Orange township 1,228 1,235 1,245 -0.2%Perry township 1,066 1,073 1,088 -0.3% Sidney city (pt.) 0 0 0 n.a. Balance of Perry township 1,066 1,073 1,088 -0.3%Salem township 2,201 2,213 2,224 -0.2% Port Jefferson village 356 359 368 -0.5% Balance of Salem township 1,845 1,854 1,856 -0.1%Turtle Creek township 1,554 1,563 1,561 -0.1% Sidney city (pt.) 1 1 1 0.0% Balance of Turtle Creek township 1,553 1,562 1,560 -0.1%Van Buren township 2,078 2,089 2,077 0.0% Kettlersville village 175 176 179 -0.4% Balance of Van Buren township 1,903 1,913 1,898 0.0%
Continued
Population

Shelby County2016 Population Estimates For Cities, Villages, and Townships
Estimates Average AnnualEstimate Estimate Base Rate of Change
Name 7/1/16 7/1/15 4/1/10 (a) From 2010 (b)
Washington township 1,999 2,008 2,010 -0.1% Lockington village 137 138 141 -0.5% Sidney city (pt.) 0 0 0 n.a. Balance of Washington township 1,862 1,870 1,869 -0.1%
n.a. - Could not calculate. Division by zero.
(a) Used for calculating average annual rate of change. (b) Average annual rate of change from April 1, 2010 to July 1, 2016.
Source: Population Estimates Division, U.S. Census Bureau. Prepared by: Office of Research, Ohio Development Services Agency.
Population

Stark County2016 Population Estimates For Cities, Villages, and Townships
Estimates Average AnnualEstimate Estimate Base Rate of Change
Name 7/1/16 7/1/15 4/1/10 (a) From 2010 (b)
Stark County 373,612 374,865 375,592 -0.1%
Alliance city (pt.) 21,865 22,007 22,289 -0.3% Also located in Mahoning CountyBeach City village 995 1,002 1,030 -0.6%Brewster village 2,156 2,163 2,169 -0.1%Canal Fulton city 5,433 5,466 5,464 -0.1%Canton city 71,323 71,865 73,053 -0.4%East Canton village 1,589 1,594 1,591 0.0%East Sparta village 807 808 815 -0.2%Hartville village 3,020 3,012 2,963 0.3%Hills and Dales village 229 230 231 -0.1%Limaville village 146 146 147 -0.1%Louisville city 9,356 9,356 9,256 0.2%Magnolia village (pt.) 714 715 714 0.0% Also located in Carroll CountyMassillon city 32,258 32,269 32,242 0.0%Meyers Lake village 567 568 568 0.0%Minerva village (pt.) 1,931 1,935 1,935 0.0% Also located in Carroll County Also located in Columbiana CountyNavarre village 1,909 1,922 1,960 -0.4%North Canton city 17,365 17,424 17,482 -0.1%Waynesburg village 916 918 918 0.0%Wilmot village 301 302 306 -0.3%Balance of Stark County 200,732 201,163 200,459 0.0%
Alliance city (pt.) 21,865 22,007 22,289 -0.3%Bethlehem township 5,251 5,275 5,350 -0.3% Navarre village (pt.) 1,860 1,872 1,910 -0.4% Balance of Bethlehem township 3,391 3,403 3,440 -0.2%Canton city 71,323 71,865 73,053 -0.4%Canton township 13,048 13,081 13,067 0.0% Meyers Lake village (pt.) 415 415 414 0.0% Balance of Canton township 12,633 12,666 12,653 0.0%Jackson township 40,588 40,655 40,383 0.1% Hills and Dales village 229 230 231 -0.1% North Canton city (pt.) 0 0 0 n.a. Balance of Jackson township 40,359 40,425 40,152 0.1%Lake township 30,126 30,166 29,959 0.1% Hartville village 3,020 3,012 2,963 0.3% Balance of Lake township 27,106 27,154 26,996 0.1%Lawrence township 13,705 13,756 13,733 0.0% Canal Fulton city 5,433 5,466 5,464 -0.1% Balance of Lawrence township 8,272 8,290 8,269 0.0%Lexington township 5,417 5,431 5,430 0.0% Limaville village 146 146 147 -0.1% Balance of Lexington township 5,271 5,285 5,283 0.0%Louisville city 9,356 9,356 9,256 0.2%Marlboro township 4,374 4,384 4,375 0.0%Massillon city 32,258 32,269 32,242 0.0%Nimishillen township 9,569 9,590 9,556 0.0%
Continued
Population

Stark County2016 Population Estimates For Cities, Villages, and Townships
Estimates Average AnnualEstimate Estimate Base Rate of Change
Name 7/1/16 7/1/15 4/1/10 (a) From 2010 (b)
Osnaburg township 5,615 5,631 5,625 0.0% East Canton village 1,589 1,594 1,591 0.0% Balance of Osnaburg township 4,026 4,037 4,034 0.0%Paris township 5,677 5,692 5,697 -0.1% Minerva village (pt.) 1,931 1,935 1,935 0.0% Balance of Paris township 3,746 3,757 3,762 -0.1%Perry township 28,364 28,430 28,342 0.0% Navarre village (pt.) 49 50 50 -0.3% Balance of Perry township 28,315 28,380 28,292 0.0%Pike township 3,930 3,941 3,960 -0.1% East Sparta village 807 808 815 -0.2% Balance of Pike township 3,123 3,133 3,145 -0.1%Plain township 52,501 52,632 52,540 0.0% Meyers Lake village (pt.) 152 153 154 -0.2% North Canton city (pt.) 17,365 17,424 17,482 -0.1% Balance of Plain township 34,984 35,055 34,904 0.0%Sandy township 3,660 3,670 3,675 -0.1% Magnolia village (pt.) 714 715 714 0.0% Waynesburg village 916 918 918 0.0% Balance of Sandy township 2,030 2,037 2,043 -0.1%Sugar Creek township 6,482 6,505 6,545 -0.2% Beach City village 995 1,002 1,030 -0.6% Brewster village 2,156 2,163 2,169 -0.1% Wilmot village 301 302 306 -0.3% Balance of Sugar Creek township 3,030 3,038 3,040 -0.1%Tuscarawas township 5,887 5,902 5,894 0.0%Washington township 4,616 4,627 4,621 0.0%
n.a. - Could not calculate. Division by zero.
(a) Used for calculating average annual rate of change. (b) Average annual rate of change from April 1, 2010 to July 1, 2016.
Source: Population Estimates Division, U.S. Census Bureau. Prepared by: Office of Research, Ohio Development Services Agency.
Population

Summit County2016 Population Estimates For Cities, Villages, and Townships
Estimates Average AnnualEstimate Estimate Base Rate of Change
Name 7/1/16 7/1/15 4/1/10 (a) From 2010 (b)
Summit County 540,300 541,316 541,782 0.0%
Akron city 197,633 198,244 199,079 -0.1%Barberton city 26,120 26,231 26,570 -0.3%Boston Heights village 1,294 1,297 1,300 -0.1%Clinton village 1,202 1,205 1,214 -0.2%Cuyahoga Falls city 49,206 49,340 49,594 -0.1%Fairlawn city 7,466 7,477 7,459 0.0%Green city 25,673 25,729 25,740 0.0%Hudson city 22,251 22,295 22,262 0.0%Lakemore village 3,060 3,070 3,058 0.0%Macedonia city 11,899 11,685 11,133 1.1%Mogadore village (pt.) 2,829 2,835 2,846 -0.1% Also located in Portage CountyMunroe Falls city 5,052 5,062 5,056 0.0%New Franklin city 14,149 14,187 14,222 -0.1%Northfield village 3,670 3,676 3,677 0.0%Norton city (pt.) 12,007 12,031 12,086 -0.1% Also located in Wayne CountyPeninsula village 563 564 565 -0.1%Reminderville village 4,109 3,983 3,404 3.1%Richfield village 3,640 3,648 3,648 0.0%Silver Lake village 2,498 2,504 2,521 -0.1%Stow city 34,711 34,770 34,837 -0.1%Tallmadge city (pt.) 17,247 17,287 17,282 0.0% Also located in Portage CountyTwinsburg city 18,877 18,870 18,796 0.1%Balance of Summit County 75,144 75,326 75,433 -0.1%
Akron city 197,633 198,244 199,079 -0.1%Barberton city 26,120 26,231 26,570 -0.3%Bath township 9,682 9,702 9,702 0.0%Boston township 1,256 1,261 1,272 -0.2% Peninsula village 563 564 565 -0.1% Balance of Boston township 693 697 707 -0.3%Boston Heights village 1,294 1,297 1,300 -0.1%Clinton village 1,202 1,205 1,214 -0.2%Copley township 17,284 17,320 17,304 0.0%Coventry township 10,858 10,890 10,930 -0.1%Cuyahoga Falls city 49,206 49,340 49,594 -0.1%Fairlawn city 7,466 7,477 7,459 0.0%Green city 25,673 25,729 25,740 0.0%Hudson city 22,251 22,295 22,262 0.0%Lakemore village 3,060 3,070 3,058 0.0%Macedonia city 11,899 11,685 11,133 1.1%Mogadore village (pt.) 2,829 2,835 2,846 -0.1%Munroe Falls city 5,052 5,062 5,056 0.0%New Franklin city 14,149 14,187 14,222 -0.1%Northfield village 3,670 3,676 3,677 0.0%Northfield Center township 5,830 5,842 5,839 0.0%Norton city 12,007 12,031 12,086 -0.1%Reminderville village 4,109 3,983 3,404 3.1%
Continued
Population
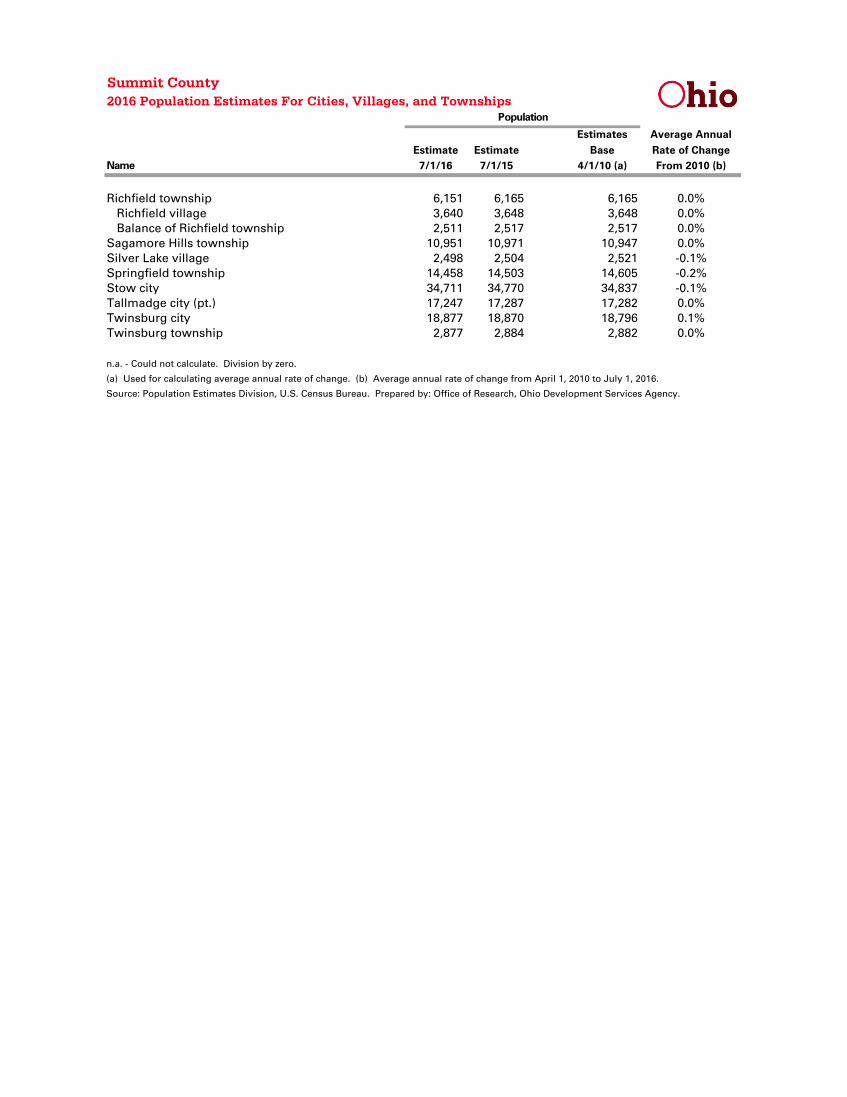
Summit County2016 Population Estimates For Cities, Villages, and Townships
Estimates Average AnnualEstimate Estimate Base Rate of Change
Name 7/1/16 7/1/15 4/1/10 (a) From 2010 (b)
Richfield township 6,151 6,165 6,165 0.0% Richfield village 3,640 3,648 3,648 0.0% Balance of Richfield township 2,511 2,517 2,517 0.0%Sagamore Hills township 10,951 10,971 10,947 0.0%Silver Lake village 2,498 2,504 2,521 -0.1%Springfield township 14,458 14,503 14,605 -0.2%Stow city 34,711 34,770 34,837 -0.1%Tallmadge city (pt.) 17,247 17,287 17,282 0.0%Twinsburg city 18,877 18,870 18,796 0.1%Twinsburg township 2,877 2,884 2,882 0.0%
n.a. - Could not calculate. Division by zero.
(a) Used for calculating average annual rate of change. (b) Average annual rate of change from April 1, 2010 to July 1, 2016.
Source: Population Estimates Division, U.S. Census Bureau. Prepared by: Office of Research, Ohio Development Services Agency.
Population

Trumbull County2016 Population Estimates For Cities, Villages, and Townships
Estimates Average AnnualEstimate Estimate Base Rate of Change
Name 7/1/16 7/1/15 4/1/10 (a) From 2010 (b)
Trumbull County 201,825 203,631 210,318 -0.7%
Cortland city 6,880 6,935 7,112 -0.5%Girard city 9,477 9,577 9,940 -0.8%Hubbard city 7,579 7,647 7,876 -0.6%Lordstown village 3,266 3,297 3,419 -0.7%McDonald village 3,118 3,148 3,261 -0.7%Newton Falls village 4,596 4,637 4,782 -0.6%Niles city 18,458 18,636 19,261 -0.7%Orangeville village 194 195 200 -0.5%Warren city 39,898 40,220 41,553 -0.6%West Farmington village 482 486 498 -0.5%Yankee Lake village 78 79 81 -0.6%Youngstown city (pt.) 11 11 11 0.0% Also located in Mahoning CountyBalance of Trumbull County 107,788 108,763 112,324 -0.7%
Bazetta township 5,647 5,695 5,862 -0.6%Bloomfield township 1,263 1,276 1,322 -0.7%Braceville township 2,734 2,762 2,860 -0.7%Bristol township 2,799 2,824 2,920 -0.7%Brookfield township 8,470 8,550 8,853 -0.7% Yankee Lake village 78 79 81 -0.6% Balance of Brookfield township 8,392 8,471 8,772 -0.7%Champion township 9,261 9,340 9,608 -0.6%Cortland city 6,880 6,935 7,112 -0.5%Farmington township 2,638 2,660 2,730 -0.5% West Farmington village 482 486 498 -0.5% Balance of Farmington township 2,156 2,174 2,232 -0.6%Fowler township 2,492 2,515 2,591 -0.6%Greene township 972 980 1,015 -0.7%Gustavus township 793 799 829 -0.7%Hartford township 1,990 2,008 2,069 -0.6%Howland township 18,415 18,574 19,123 -0.6% Niles city (pt.) 1,709 1,724 1,780 -0.6% Balance of Howland township 16,706 16,850 17,343 -0.6%Hubbard township 12,988 13,107 13,525 -0.6% Hubbard city 7,579 7,647 7,876 -0.6% Balance of Hubbard township 5,409 5,460 5,649 -0.7%Johnston township 1,870 1,888 1,952 -0.7%Kinsman township 1,794 1,811 1,873 -0.7%Liberty township 21,071 21,272 21,988 -0.7% Girard city (pt.) 9,445 9,544 9,907 -0.8% Balance of Liberty township 11,626 11,728 12,081 -0.6%Lordstown village 3,266 3,297 3,419 -0.7%McDonald village 3,118 3,148 3,261 -0.7%Mecca township 2,562 2,585 2,674 -0.7%Mesopotamia township 3,247 3,278 3,380 -0.6%Newton township 8,516 8,593 8,876 -0.7% Newton Falls village 4,596 4,637 4,782 -0.6% Balance of Newton township 3,920 3,956 4,094 -0.7%Orangeville village 194 195 200 -0.5%
Continued
Population
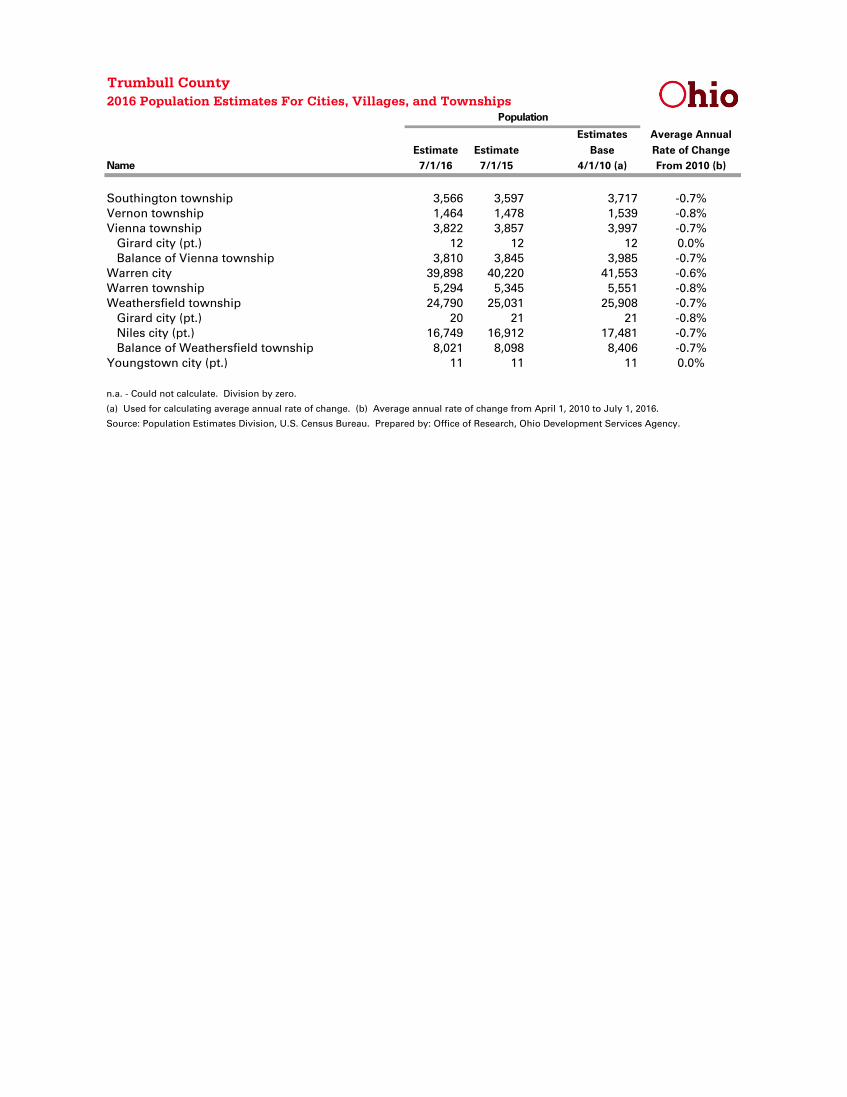
Trumbull County2016 Population Estimates For Cities, Villages, and Townships
Estimates Average AnnualEstimate Estimate Base Rate of Change
Name 7/1/16 7/1/15 4/1/10 (a) From 2010 (b)
Southington township 3,566 3,597 3,717 -0.7%Vernon township 1,464 1,478 1,539 -0.8%Vienna township 3,822 3,857 3,997 -0.7% Girard city (pt.) 12 12 12 0.0% Balance of Vienna township 3,810 3,845 3,985 -0.7%Warren city 39,898 40,220 41,553 -0.6%Warren township 5,294 5,345 5,551 -0.8%Weathersfield township 24,790 25,031 25,908 -0.7% Girard city (pt.) 20 21 21 -0.8% Niles city (pt.) 16,749 16,912 17,481 -0.7% Balance of Weathersfield township 8,021 8,098 8,406 -0.7%Youngstown city (pt.) 11 11 11 0.0%
n.a. - Could not calculate. Division by zero.
(a) Used for calculating average annual rate of change. (b) Average annual rate of change from April 1, 2010 to July 1, 2016.
Source: Population Estimates Division, U.S. Census Bureau. Prepared by: Office of Research, Ohio Development Services Agency.
Population
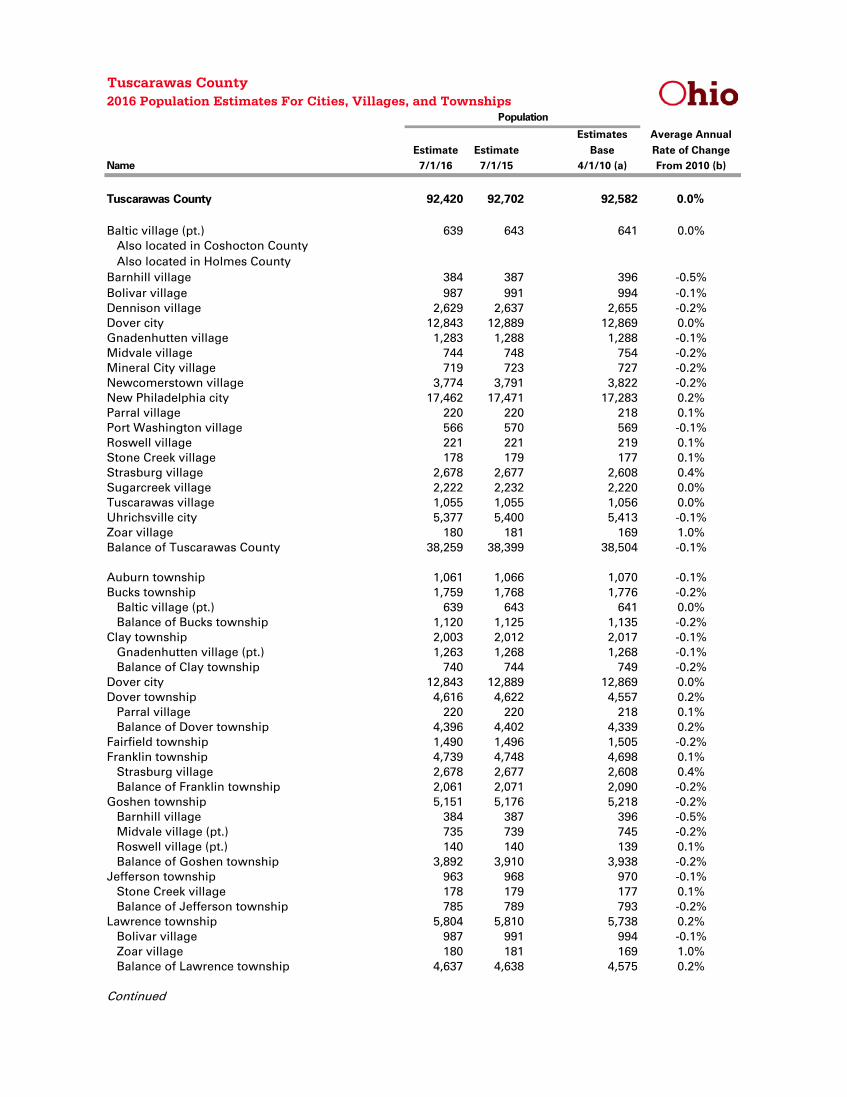
Tuscarawas County2016 Population Estimates For Cities, Villages, and Townships
Estimates Average AnnualEstimate Estimate Base Rate of Change
Name 7/1/16 7/1/15 4/1/10 (a) From 2010 (b)
Tuscarawas County 92,420 92,702 92,582 0.0%
Baltic village (pt.) 639 643 641 0.0% Also located in Coshocton County Also located in Holmes CountyBarnhill village 384 387 396 -0.5%Bolivar village 987 991 994 -0.1%Dennison village 2,629 2,637 2,655 -0.2%Dover city 12,843 12,889 12,869 0.0%Gnadenhutten village 1,283 1,288 1,288 -0.1%Midvale village 744 748 754 -0.2%Mineral City village 719 723 727 -0.2%Newcomerstown village 3,774 3,791 3,822 -0.2%New Philadelphia city 17,462 17,471 17,283 0.2%Parral village 220 220 218 0.1%Port Washington village 566 570 569 -0.1%Roswell village 221 221 219 0.1%Stone Creek village 178 179 177 0.1%Strasburg village 2,678 2,677 2,608 0.4%Sugarcreek village 2,222 2,232 2,220 0.0%Tuscarawas village 1,055 1,055 1,056 0.0%Uhrichsville city 5,377 5,400 5,413 -0.1%Zoar village 180 181 169 1.0%Balance of Tuscarawas County 38,259 38,399 38,504 -0.1%
Auburn township 1,061 1,066 1,070 -0.1%Bucks township 1,759 1,768 1,776 -0.2% Baltic village (pt.) 639 643 641 0.0% Balance of Bucks township 1,120 1,125 1,135 -0.2%Clay township 2,003 2,012 2,017 -0.1% Gnadenhutten village (pt.) 1,263 1,268 1,268 -0.1% Balance of Clay township 740 744 749 -0.2%Dover city 12,843 12,889 12,869 0.0%Dover township 4,616 4,622 4,557 0.2% Parral village 220 220 218 0.1% Balance of Dover township 4,396 4,402 4,339 0.2%Fairfield township 1,490 1,496 1,505 -0.2%Franklin township 4,739 4,748 4,698 0.1% Strasburg village 2,678 2,677 2,608 0.4% Balance of Franklin township 2,061 2,071 2,090 -0.2%Goshen township 5,151 5,176 5,218 -0.2% Barnhill village 384 387 396 -0.5% Midvale village (pt.) 735 739 745 -0.2% Roswell village (pt.) 140 140 139 0.1% Balance of Goshen township 3,892 3,910 3,938 -0.2%Jefferson township 963 968 970 -0.1% Stone Creek village 178 179 177 0.1% Balance of Jefferson township 785 789 793 -0.2%Lawrence township 5,804 5,810 5,738 0.2% Bolivar village 987 991 994 -0.1% Zoar village 180 181 169 1.0% Balance of Lawrence township 4,637 4,638 4,575 0.2%
Continued
Population

Tuscarawas County2016 Population Estimates For Cities, Villages, and Townships
Estimates Average AnnualEstimate Estimate Base Rate of Change
Name 7/1/16 7/1/15 4/1/10 (a) From 2010 (b)
Mill township 9,807 9,847 9,898 -0.1% Dennison village (pt.) 2,477 2,485 2,504 -0.2% Midvale village (pt.) 5 5 5 0.0% Uhrichsville city 5,377 5,400 5,413 -0.1% Balance of Mill township 1,948 1,957 1,976 -0.2%New Philadelphia city 17,462 17,471 17,283 0.2%Oxford township 4,899 4,921 4,964 -0.2% Newcomerstown village (pt.) 3,774 3,791 3,822 -0.2% Balance of Oxford township 1,125 1,130 1,142 -0.2%Perry township 432 435 440 -0.3%Rush township 862 866 880 -0.3% Gnadenhutten village (pt.) 0 0 0 n.a. Balance of Rush township 862 866 880 -0.3%Salem township 1,677 1,689 1,703 -0.2% Newcomerstown village (pt.) 0 0 0 n.a. Port Washington village 566 570 569 -0.1% Balance of Salem township 1,111 1,119 1,134 -0.3%Sandy township 2,951 2,957 2,979 -0.2% Mineral City village 719 723 727 -0.2% Balance of Sandy township 2,232 2,234 2,252 -0.1%Sugar Creek township 4,188 4,206 4,194 0.0% Sugarcreek village 2,222 2,232 2,220 0.0% Balance of Sugar Creek township 1,966 1,974 1,974 -0.1%Union township 1,485 1,491 1,502 -0.2% Dennison village (pt.) 152 152 151 0.1% Roswell village (pt.) 81 81 80 0.2% Balance of Union township 1,252 1,258 1,271 -0.2%Warren township 1,167 1,171 1,179 -0.2%Warwick township 2,778 2,787 2,803 -0.1% Gnadenhutten village (pt.) 20 20 20 0.0% Midvale village (pt.) 4 4 4 0.0% Tuscarawas village 1,055 1,055 1,056 0.0% Balance of Warwick township 1,699 1,708 1,723 -0.2%Washington township 815 819 824 -0.2%Wayne township 2,137 2,148 2,164 -0.2%York township 1,331 1,339 1,351 -0.2%
n.a. - Could not calculate. Division by zero.
(a) Used for calculating average annual rate of change. (b) Average annual rate of change from April 1, 2010 to July 1, 2016.
Source: Population Estimates Division, U.S. Census Bureau. Prepared by: Office of Research, Ohio Development Services Agency.
Population

Union County2016 Population Estimates For Cities, Villages, and Townships
Estimates Average AnnualEstimate Estimate Base Rate of Change
Name 7/1/16 7/1/15 4/1/10 (a) From 2010 (b)
Union County 55,457 54,315 52,267 1.0%
Dublin city (pt.) 2,487 2,468 2,346 0.9% Also located in Delaware County Also located in Franklin CountyMagnetic Springs village 281 277 268 0.8%Marysville city 23,406 22,831 22,098 0.9%Milford Center village 840 824 792 0.9%Plain City village (pt.) 841 843 828 0.2% Also located in Madison CountyRichwood village 2,316 2,272 2,232 0.6%Unionville Center village 237 237 237 0.0%Balance of Union County 25,049 24,563 23,466 1.0%
Allen township 2,421 2,372 2,263 1.1%Claibourne township 3,693 3,622 3,522 0.8% Richwood village 2,316 2,272 2,232 0.6% Balance of Claibourne township 1,377 1,350 1,290 1.0%Darby township 2,183 2,146 2,060 0.9% Marysville city (pt.) 17 17 17 0.0% Unionville Center village 237 237 237 0.0% Balance of Darby township 1,929 1,892 1,806 1.1%Dover township 2,301 2,255 2,158 1.0% Marysville city (pt.) 0 0 0 n.a. Balance of Dover township 2,301 2,255 2,158 1.0%Jackson township 1,022 1,003 966 0.9%Jerome township 7,974 7,867 7,514 1.0% Dublin city (pt.) 2,487 2,468 2,346 0.9% Plain City village (pt.) 841 843 828 0.2% Balance of Jerome township 4,646 4,556 4,340 1.1%Leesburg township 1,493 1,465 1,405 1.0% Magnetic Springs village 281 277 268 0.8% Balance of Leesburg township 1,212 1,188 1,137 1.0%Liberty township 2,074 2,034 1,948 1.0%Millcreek township 1,400 1,372 1,305 1.1% Marysville city (pt.) 6 6 6 0.0% Balance of Millcreek township 1,394 1,366 1,299 1.1%Paris township 25,065 24,457 23,645 0.9% Marysville city (pt.) 23,383 22,808 22,075 0.9% Balance of Paris township 1,682 1,649 1,570 1.1%Taylor township 1,664 1,631 1,560 1.0%Union township 1,873 1,839 1,763 1.0% Milford Center village 840 824 792 0.9% Balance of Union township 1,033 1,015 971 1.0%Washington township 871 856 824 0.9%York township 1,423 1,396 1,334 1.0%
n.a. - Could not calculate. Division by zero.
(a) Used for calculating average annual rate of change. (b) Average annual rate of change from April 1, 2010 to July 1, 2016.
Source: Population Estimates Division, U.S. Census Bureau. Prepared by: Office of Research, Ohio Development Services Agency.
Population
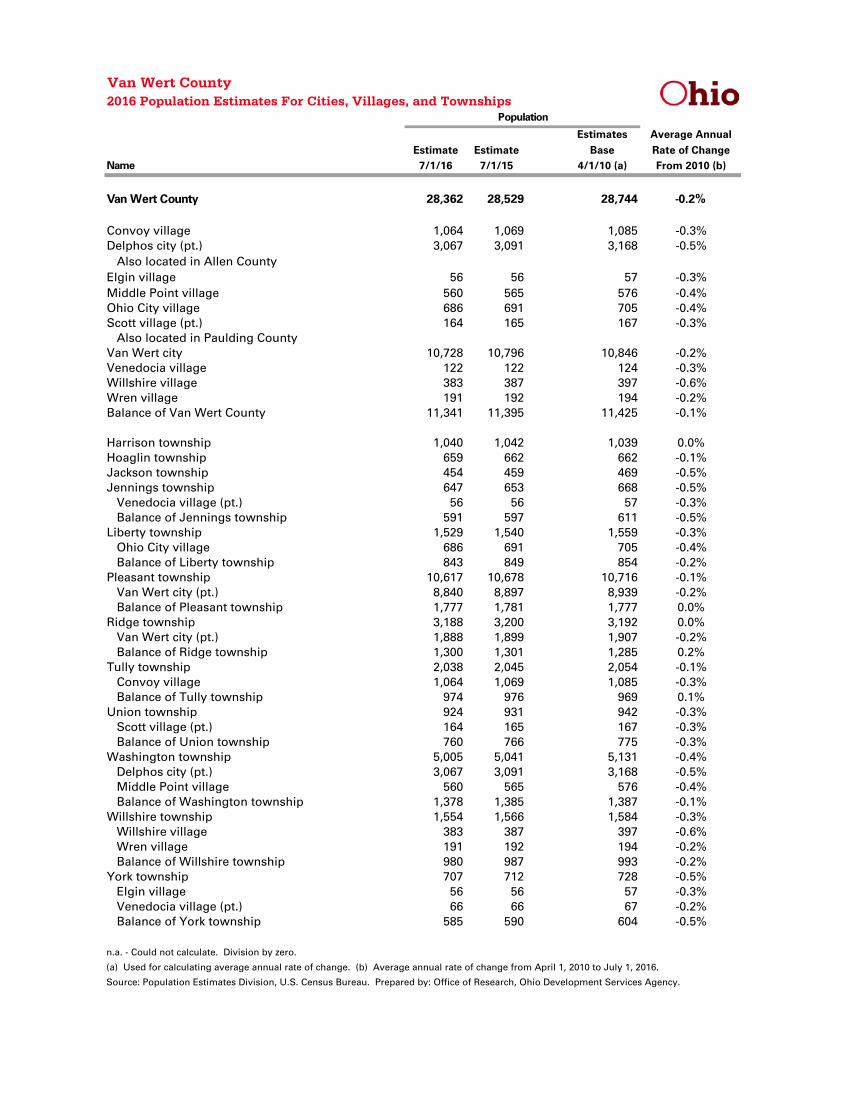
Van Wert County2016 Population Estimates For Cities, Villages, and Townships
Estimates Average AnnualEstimate Estimate Base Rate of Change
Name 7/1/16 7/1/15 4/1/10 (a) From 2010 (b)
Van Wert County 28,362 28,529 28,744 -0.2%
Convoy village 1,064 1,069 1,085 -0.3%Delphos city (pt.) 3,067 3,091 3,168 -0.5% Also located in Allen CountyElgin village 56 56 57 -0.3%Middle Point village 560 565 576 -0.4%Ohio City village 686 691 705 -0.4%Scott village (pt.) 164 165 167 -0.3% Also located in Paulding CountyVan Wert city 10,728 10,796 10,846 -0.2%Venedocia village 122 122 124 -0.3%Willshire village 383 387 397 -0.6%Wren village 191 192 194 -0.2%Balance of Van Wert County 11,341 11,395 11,425 -0.1%
Harrison township 1,040 1,042 1,039 0.0%Hoaglin township 659 662 662 -0.1%Jackson township 454 459 469 -0.5%Jennings township 647 653 668 -0.5% Venedocia village (pt.) 56 56 57 -0.3% Balance of Jennings township 591 597 611 -0.5%Liberty township 1,529 1,540 1,559 -0.3% Ohio City village 686 691 705 -0.4% Balance of Liberty township 843 849 854 -0.2%Pleasant township 10,617 10,678 10,716 -0.1% Van Wert city (pt.) 8,840 8,897 8,939 -0.2% Balance of Pleasant township 1,777 1,781 1,777 0.0%Ridge township 3,188 3,200 3,192 0.0% Van Wert city (pt.) 1,888 1,899 1,907 -0.2% Balance of Ridge township 1,300 1,301 1,285 0.2%Tully township 2,038 2,045 2,054 -0.1% Convoy village 1,064 1,069 1,085 -0.3% Balance of Tully township 974 976 969 0.1%Union township 924 931 942 -0.3% Scott village (pt.) 164 165 167 -0.3% Balance of Union township 760 766 775 -0.3%Washington township 5,005 5,041 5,131 -0.4% Delphos city (pt.) 3,067 3,091 3,168 -0.5% Middle Point village 560 565 576 -0.4% Balance of Washington township 1,378 1,385 1,387 -0.1%Willshire township 1,554 1,566 1,584 -0.3% Willshire village 383 387 397 -0.6% Wren village 191 192 194 -0.2% Balance of Willshire township 980 987 993 -0.2%York township 707 712 728 -0.5% Elgin village 56 56 57 -0.3% Venedocia village (pt.) 66 66 67 -0.2% Balance of York township 585 590 604 -0.5%
n.a. - Could not calculate. Division by zero.
(a) Used for calculating average annual rate of change. (b) Average annual rate of change from April 1, 2010 to July 1, 2016.
Source: Population Estimates Division, U.S. Census Bureau. Prepared by: Office of Research, Ohio Development Services Agency.
Population

Vinton County2016 Population Estimates For Cities, Villages, and Townships
Estimates Average AnnualEstimate Estimate Base Rate of Change
Name 7/1/16 7/1/15 4/1/10 (a) From 2010 (b)
Vinton County 12,921 13,020 13,430 -0.6%
Hamden village 855 861 879 -0.4%McArthur village 1,645 1,657 1,705 -0.6%Wilkesville village 147 148 149 -0.2%Zaleski village 263 266 278 -0.9%Balance of Vinton County 10,011 10,088 10,419 -0.6%
Brown township 278 281 293 -0.8%Clinton township 1,984 1,997 2,052 -0.5% Hamden village 855 861 879 -0.4% Balance of Clinton township 1,129 1,136 1,173 -0.6%Eagle township 671 676 704 -0.8%Elk township 3,188 3,212 3,306 -0.6% McArthur village 1,645 1,657 1,705 -0.6% Balance of Elk township 1,543 1,555 1,601 -0.6%Harrison township 1,028 1,035 1,068 -0.6%Jackson township 716 722 741 -0.5%Knox township 540 545 559 -0.6%Madison township 574 580 605 -0.8% Zaleski village 263 266 278 -0.9% Balance of Madison township 311 314 327 -0.8%Richland township 1,674 1,688 1,748 -0.7%Swan township 879 885 916 -0.7%Vinton township 530 534 548 -0.5%Wilkesville township 859 865 890 -0.6% Wilkesville village 147 148 149 -0.2% Balance of Wilkesville township 712 717 741 -0.6%
n.a. - Could not calculate. Division by zero.
(a) Used for calculating average annual rate of change. (b) Average annual rate of change from April 1, 2010 to July 1, 2016.
Source: Population Estimates Division, U.S. Census Bureau. Prepared by: Office of Research, Ohio Development Services Agency.
Population

Warren County2016 Population Estimates For Cities, Villages, and Townships
Estimates Average AnnualEstimate Estimate Base Rate of Change
Name 7/1/16 7/1/15 4/1/10 (a) From 2010 (b)
Warren County 227,063 224,439 212,868 1.0%
Blanchester village (pt.) 0 0 0 n.a. Also located in Clinton CountyButlerville village 166 166 165 0.1%Carlisle village (pt.) 5,128 5,066 4,736 1.3% Also located in Montgomery CountyCorwin village 444 439 416 1.0%Franklin city 11,780 11,782 11,769 0.0%Harveysburg village 556 551 547 0.3%Lebanon city 20,651 20,619 20,032 0.5%Loveland city (pt.) 816 807 774 0.8% Also located in Clermont County Also located in Hamilton CountyMaineville village 1,056 1,040 971 1.4%Mason city 33,037 32,657 30,857 1.1%Middletown city (pt.) 2,749 2,729 2,684 0.4% Also located in Butler CountyMonroe city (pt.) 142 142 131 1.3% Also located in Butler CountyMorrow village 1,272 1,257 1,182 1.2%Pleasant Plain village 160 158 149 1.1%South Lebanon village 4,402 4,346 4,094 1.2%Springboro city (pt.) 17,188 16,955 16,159 1.0% Also located in Montgomery CountyWaynesville village 3,039 2,998 2,813 1.2%Balance of Warren County 124,477 122,727 115,389 1.2%
Clear Creek township 32,518 32,071 30,281 1.1% Springboro city (pt.) 17,188 16,955 16,159 1.0% Balance of Clear Creek township 15,330 15,116 14,122 1.3%Deerfield township 39,209 38,650 36,036 1.4% South Lebanon village (pt.) 0 0 0 n.a. Balance of Deerfield township 39,209 38,650 36,036 1.4%Franklin township 31,695 31,454 30,309 0.7% Carlisle village (pt.) 5,128 5,066 4,736 1.3% Franklin city 11,780 11,782 11,769 0.0% Middletown city (pt.) 2,257 2,245 2,233 0.2% Balance of Franklin township 12,530 12,361 11,571 1.3%Hamilton township 25,541 25,186 23,556 1.3% Maineville village 1,056 1,040 971 1.4% South Lebanon village (pt.) 1,864 1,840 1,731 1.2% Balance of Hamilton township 22,621 22,306 20,854 1.3%Harlan township 5,082 5,015 4,704 1.2% Blanchester village (pt.) 0 0 0 n.a. Butlerville village 166 166 165 0.1% Pleasant Plain village 160 158 149 1.1% Balance of Harlan township 4,756 4,691 4,390 1.3%Lebanon city 20,651 20,619 20,032 0.5%Loveland city (pt.) 816 807 774 0.8%Mason city 33,037 32,657 30,857 1.1%
Continued
Population

Warren County2016 Population Estimates For Cities, Villages, and Townships
Estimates Average AnnualEstimate Estimate Base Rate of Change
Name 7/1/16 7/1/15 4/1/10 (a) From 2010 (b)
Massie township 1,200 1,187 1,141 0.8% Harveysburg village 556 551 547 0.3% Balance of Massie township 644 636 594 1.3%Salem township 4,731 4,671 4,390 1.2% Morrow village 1,272 1,257 1,182 1.2% Balance of Salem township 3,459 3,414 3,208 1.2%Turtlecreek township 15,711 15,478 15,168 0.6% Middletown city (pt.) 492 484 451 1.4% Monroe city (pt.) 142 142 131 1.3% Balance of Turtlecreek township 15,077 14,852 14,586 0.5%Union township 5,084 5,016 4,710 1.2% South Lebanon village (pt.) 2,538 2,506 2,363 1.1% Balance of Union township 2,546 2,510 2,347 1.3%Washington township 2,938 2,897 2,713 1.3%Wayne township 8,850 8,731 8,197 1.2% Corwin village 444 439 416 1.0% Waynesville village 3,039 2,998 2,813 1.2% Balance of Wayne township 5,367 5,294 4,968 1.2%
n.a. - Could not calculate. Division by zero.
(a) Used for calculating average annual rate of change. (b) Average annual rate of change from April 1, 2010 to July 1, 2016.
Source: Population Estimates Division, U.S. Census Bureau. Prepared by: Office of Research, Ohio Development Services Agency.
Population

Washington County2016 Population Estimates For Cities, Villages, and Townships
Estimates Average AnnualEstimate Estimate Base Rate of Change
Name 7/1/16 7/1/15 4/1/10 (a) From 2010 (b)
Washington County 60,610 61,071 61,778 -0.3%
Belpre city 6,461 6,475 6,441 0.0%Beverly village 1,316 1,308 1,313 0.0%Lowell village 545 548 549 -0.1%Lower Salem village 86 86 86 0.0%Macksburg village 186 187 186 0.0%Marietta city 13,650 13,878 14,085 -0.5%Matamoras village 881 886 896 -0.3%Balance of Washington County 37,485 37,703 38,222 -0.3%
Adams township 1,588 1,596 1,617 -0.3% Lowell village 545 548 549 -0.1% Balance of Adams township 1,043 1,048 1,068 -0.4%Aurelius township 410 412 422 -0.5% Macksburg village 186 187 186 0.0% Balance of Aurelius township 224 225 236 -0.8%Barlow township 2,565 2,581 2,614 -0.3%Belpre city 6,461 6,475 6,441 0.0%Belpre township 3,808 3,828 3,869 -0.3%Decatur township 1,263 1,272 1,303 -0.5%Dunham township 2,525 2,538 2,576 -0.3%Fairfield township 1,082 1,088 1,107 -0.4%Fearing township 877 882 891 -0.3%Grandview township 1,700 1,710 1,731 -0.3% Matamoras village 881 886 896 -0.3% Balance of Grandview township 819 824 835 -0.3%Independence township 336 339 348 -0.6%Lawrence township 884 889 901 -0.3%Liberty township 469 473 481 -0.4%Ludlow township 317 320 328 -0.5%Marietta city 13,650 13,878 14,085 -0.5%Marietta township 4,511 4,537 4,595 -0.3%Muskingum township 4,407 4,430 4,461 -0.2%Newport township 1,942 1,955 1,988 -0.4%Palmer township 550 554 564 -0.4%Salem township 1,122 1,128 1,137 -0.2% Lower Salem village 86 86 86 0.0% Balance of Salem township 1,036 1,042 1,051 -0.2%Warren township 3,966 3,989 4,045 -0.3%Waterford township 3,664 3,671 3,713 -0.2% Beverly village 1,316 1,308 1,313 0.0% Balance of Waterford township 2,348 2,363 2,400 -0.3%Watertown township 1,553 1,561 1,579 -0.3%Wesley township 960 965 982 -0.4%
n.a. - Could not calculate. Division by zero.
(a) Used for calculating average annual rate of change. (b) Average annual rate of change from April 1, 2010 to July 1, 2016.
Source: Population Estimates Division, U.S. Census Bureau. Prepared by: Office of Research, Ohio Development Services Agency.
Population

Wayne County2016 Population Estimates For Cities, Villages, and Townships
Estimates Average AnnualEstimate Estimate Base Rate of Change
Name 7/1/16 7/1/15 4/1/10 (a) From 2010 (b)
Wayne County 116,470 116,108 114,514 0.3%
Apple Creek village 1,186 1,183 1,173 0.2%Burbank village 208 208 207 0.1%Congress village 186 186 185 0.1%Creston village (pt.) 2,093 2,089 2,072 0.2% Also located in Medina CountyDalton village 1,854 1,849 1,830 0.2%Doylestown village 3,108 3,099 3,051 0.3%Fredericksburg village 420 421 423 -0.1%Marshallville village 760 760 756 0.1%Mount Eaton village 242 242 241 0.1%Norton city (pt.) 4 4 4 0.0% Also located in Summit CountyOrrville city 8,505 8,483 8,380 0.2%Rittman city (pt.) 6,479 6,460 6,379 0.2% Also located in Medina CountyShreve village 1,521 1,517 1,514 0.1%Smithville village 1,273 1,269 1,252 0.3%West Salem village 1,489 1,484 1,468 0.2%Wooster city 27,023 26,887 26,179 0.5%Balance of Wayne County 60,119 59,967 59,400 0.2%
Baughman township 4,584 4,574 4,536 0.2% Marshallville village (pt.) 562 562 559 0.1% Orrville city (pt.) 1,071 1,069 1,058 0.2% Balance of Baughman township 2,951 2,943 2,919 0.2%Canaan township * 4,925 4,916 4,875 0.2% Burbank village (pt.) 143 143 142 0.1% Creston village (pt.) 2,093 2,089 2,072 0.2% Balance of Canaan township 2,689 2,684 2,661 0.2%Chester township 3,101 3,094 3,066 0.2%Chippewa township 10,313 10,287 10,185 0.2% Doylestown village 3,108 3,099 3,051 0.3% Marshallville village (pt.) 198 198 197 0.1% Balance of Chippewa township 7,007 6,990 6,937 0.2%Clinton township 3,105 3,096 3,081 0.1% Shreve village 1,521 1,517 1,514 0.1% Balance of Clinton township 1,584 1,579 1,567 0.2%Congress township 4,576 4,566 4,533 0.2% Burbank village (pt.) 65 65 65 0.0% Congress village 186 186 185 0.1% West Salem village 1,489 1,484 1,468 0.2% Balance of Congress township 2,836 2,831 2,815 0.1%East Union township 6,896 6,879 6,821 0.2% Apple Creek village 1,186 1,183 1,173 0.2% Balance of East Union township 5,710 5,696 5,648 0.2%Franklin township 3,928 3,916 3,872 0.2%Green township 12,087 12,055 11,915 0.2% Orrville city (pt.) 7,434 7,414 7,322 0.2% Smithville village 1,273 1,269 1,252 0.3% Balance of Green township 3,380 3,372 3,341 0.2%
Continued
Population

Wayne County2016 Population Estimates For Cities, Villages, and Townships
Estimates Average AnnualEstimate Estimate Base Rate of Change
Name 7/1/16 7/1/15 4/1/10 (a) From 2010 (b)
Milton township 3,060 3,052 3,018 0.2%Norton city (pt.) 4 4 4 0.0%Paint township 3,249 3,241 3,209 0.2% Mount Eaton village 242 242 241 0.1% Balance of Paint township 3,007 2,999 2,968 0.2%Plain township 3,128 3,120 3,088 0.2%Rittman city (pt.) 6,479 6,460 6,379 0.2%Salt Creek township 4,370 4,357 4,309 0.2% Fredericksburg village 420 421 423 -0.1% Balance of Salt Creek township 3,950 3,936 3,886 0.3%Sugar Creek township 6,732 6,716 6,651 0.2% Dalton village 1,854 1,849 1,830 0.2% Balance of Sugar Creek township 4,878 4,867 4,821 0.2%Wayne township 4,144 4,135 4,096 0.2%Wooster city 27,023 26,887 26,179 0.5%Wooster township 4,766 4,753 4,697 0.2%
* - Canaan Township is also located in Medina County.n.a. - Could not calculate. Division by zero.
(a) Used for calculating average annual rate of change. (b) Average annual rate of change from April 1, 2010 to July 1, 2016.
Source: Population Estimates Division, U.S. Census Bureau. Prepared by: Office of Research, Ohio Development Services Agency.
Population

Williams County2016 Population Estimates For Cities, Villages, and Townships
Estimates Average AnnualEstimate Estimate Base Rate of Change
Name 7/1/16 7/1/15 4/1/10 (a) From 2010 (b)
Williams County 37,017 37,077 37,650 -0.3%
Blakeslee village 95 95 96 -0.2%Bryan city 8,434 8,441 8,549 -0.2%Edgerton village 1,995 1,988 2,014 -0.2%Edon village 820 822 840 -0.4%Holiday City village 52 52 52 0.0%Montpelier village 3,988 3,996 4,072 -0.3%Pioneer village 1,408 1,409 1,386 0.3%Stryker village 1,308 1,311 1,335 -0.3%West Unity village 1,645 1,647 1,678 -0.3%Balance of Williams County 17,272 17,316 17,628 -0.3%
Brady township 2,547 2,552 2,602 -0.3% West Unity village 1,645 1,647 1,678 -0.3% Balance of Brady township 902 905 924 -0.4%Bridgewater township 1,448 1,452 1,474 -0.3%Bryan city 8,434 8,441 8,549 -0.2%Center township 2,831 2,836 2,877 -0.3%Florence township 1,983 1,988 2,029 -0.4% Blakeslee village 95 95 96 -0.2% Edon village 820 822 840 -0.4% Balance of Florence township 1,068 1,071 1,093 -0.4%Jefferson township 1,884 1,888 1,920 -0.3% Holiday City village (pt.) 41 41 41 0.0% Balance of Jefferson township 1,843 1,847 1,879 -0.3%Madison township 962 966 985 -0.4% Holiday City village (pt.) 11 11 11 0.0% Balance of Madison township 951 955 974 -0.4%Mill Creek township 777 780 797 -0.4%Montpelier village 3,988 3,996 4,072 -0.3%Northwest township 1,204 1,207 1,236 -0.4%Pioneer village 1,408 1,409 1,386 0.3%Pulaski township 2,299 2,305 2,353 -0.4%St. Joseph township 2,789 2,785 2,830 -0.2% Edgerton village 1,995 1,988 2,014 -0.2% Balance of St. Joseph township 794 797 816 -0.4%Springfield township 3,096 3,102 3,147 -0.3% Stryker village 1,308 1,311 1,335 -0.3% Balance of Springfield township 1,788 1,791 1,812 -0.2%Superior township 1,367 1,370 1,393 -0.3%
n.a. - Could not calculate. Division by zero.
(a) Used for calculating average annual rate of change. (b) Average annual rate of change from April 1, 2010 to July 1, 2016.
Source: Population Estimates Division, U.S. Census Bureau. Prepared by: Office of Research, Ohio Development Services Agency.
Population

Wood County2016 Population Estimates For Cities, Villages, and Townships
Estimates Average AnnualEstimate Estimate Base Rate of Change
Name 7/1/16 7/1/15 4/1/10 (a) From 2010 (b)
Wood County 130,219 129,606 125,488 0.6%
Bairdstown village 134 134 130 0.5%Bloomdale village 685 685 678 0.2%Bowling Green city 31,588 31,372 30,052 0.8%Bradner village 1,018 1,014 985 0.5%Custar village 185 184 179 0.5%Cygnet village 617 615 597 0.5%Fostoria city (pt.) 1,054 1,050 1,038 0.2% Also located in Hancock County Also located in Seneca CountyGrand Rapids village 998 994 967 0.5%Haskins village 1,227 1,223 1,188 0.5%Hoytville village 307 306 303 0.2%Jerry City village 441 440 427 0.5%Luckey village 1,045 1,042 1,012 0.5%Millbury village 1,245 1,240 1,200 0.6%Milton Center village 149 148 144 0.5%North Baltimore village 3,529 3,517 3,432 0.4%Northwood city 5,394 5,372 5,221 0.5%Pemberville village 1,418 1,413 1,373 0.5%Perrysburg city 21,592 21,490 20,762 0.6%Portage village 466 460 438 1.0%Risingsun village 626 624 606 0.5%Rossford city 6,570 6,541 6,337 0.6%Tontogany village 382 381 370 0.5%Walbridge village 3,094 3,085 3,019 0.4%Wayne village 921 918 887 0.6%West Millgrove village 180 179 174 0.5%Weston village 1,631 1,625 1,590 0.4%Balance of Wood County 43,723 43,554 42,379 0.5%
Bloom township 2,680 2,673 2,609 0.4% Bairdstown village 134 134 130 0.5% Bloomdale village 685 685 678 0.2% Cygnet village 617 615 597 0.5% Jerry City village (pt.) 208 207 201 0.5% North Baltimore village (pt.) 0 0 0 n.a. Balance of Bloom township 1,036 1,032 1,003 0.5%Bowling Green city 31,588 31,372 30,052 0.8%Center township 1,245 1,240 1,201 0.6%Fostoria city (pt.) 1,054 1,050 1,038 0.2%Freedom township 2,817 2,807 2,727 0.5% Pemberville village 1,418 1,413 1,373 0.5% Balance of Freedom township 1,399 1,394 1,354 0.5%Grand Rapids township 1,659 1,653 1,607 0.5% Grand Rapids village 998 994 967 0.5% Balance of Grand Rapids township 661 659 640 0.5%Henry township 4,297 4,282 4,175 0.5% North Baltimore village (pt.) 3,529 3,517 3,432 0.4% Balance of Henry township 768 765 743 0.5%
Continued
Population

Wood County2016 Population Estimates For Cities, Villages, and Townships
Estimates Average AnnualEstimate Estimate Base Rate of Change
Name 7/1/16 7/1/15 4/1/10 (a) From 2010 (b)
Jackson township 812 809 792 0.4% Hoytville village 307 306 303 0.2% Balance of Jackson township 505 503 489 0.5%Lake township 11,333 11,288 10,972 0.5% Millbury village 1,245 1,240 1,200 0.6% Walbridge village 3,094 3,085 3,019 0.4% Balance of Lake township 6,994 6,963 6,753 0.6%Liberty township 1,820 1,812 1,766 0.5% Portage village (pt.) 143 141 133 1.2% Balance of Liberty township 1,677 1,671 1,633 0.4%Middleton township 4,621 4,602 4,455 0.6% Haskins village 1,227 1,223 1,188 0.5% Balance of Middleton township 3,394 3,379 3,267 0.6%Milton township 1,012 1,007 979 0.5% Custar village 185 184 179 0.5% Milton Center village 149 148 144 0.5% Weston village (pt.) 0 0 0 n.a. Balance of Milton township 678 675 656 0.5%Montgomery township 4,367 4,352 4,230 0.5% Bradner village 1,018 1,014 985 0.5% Risingsun village 626 624 606 0.5% Wayne village 921 918 887 0.6% Balance of Montgomery township 1,802 1,796 1,752 0.5%Northwood city 5,394 5,372 5,221 0.5%Perry township 1,661 1,654 1,605 0.6% West Millgrove village 180 179 174 0.5% Balance of Perry township 1,481 1,475 1,431 0.6%Perrysburg city 21,592 21,490 20,762 0.6%Perrysburg township 12,724 12,677 12,372 0.4%Plain township 1,688 1,682 1,644 0.4%Portage township 1,675 1,667 1,614 0.6% Jerry City village (pt.) 233 233 226 0.5% Portage village (pt.) 323 319 305 0.9% Balance of Portage township 1,119 1,115 1,083 0.5%Rossford city 6,570 6,541 6,337 0.6%Troy township 3,973 3,960 3,870 0.4% Luckey village 1,045 1,042 1,012 0.5% Balance of Troy township 2,928 2,918 2,858 0.4%Washington township 1,907 1,900 1,841 0.6% Tontogany village 382 381 370 0.5% Balance of Washington township 1,525 1,519 1,471 0.6%Webster township 1,328 1,323 1,283 0.6%Weston township 2,402 2,393 2,336 0.4% Weston village (pt.) 1,631 1,625 1,590 0.4% Balance of Weston township 771 768 746 0.5%
n.a. - Could not calculate. Division by zero.
(a) Used for calculating average annual rate of change. (b) Average annual rate of change from April 1, 2010 to July 1, 2016.
Source: Population Estimates Division, U.S. Census Bureau. Prepared by: Office of Research, Ohio Development Services Agency.
Population

Wyandot County2016 Population Estimates For Cities, Villages, and Townships
Estimates Average AnnualEstimate Estimate Base Rate of Change
Name 7/1/16 7/1/15 4/1/10 (a) From 2010 (b)
Wyandot County 22,118 22,241 22,615 -0.4%
Carey village 3,581 3,603 3,676 -0.4%Harpster village 199 200 204 -0.4%Kirby village 115 116 118 -0.4%Marseilles village 109 110 112 -0.4%Nevada village 740 742 760 -0.4%Sycamore village 831 838 861 -0.6%Upper Sandusky city 6,539 6,570 6,605 -0.2%Wharton village 350 352 358 -0.4%Balance of Wyandot County 9,654 9,710 9,921 -0.4%
Antrim township 1,208 1,212 1,243 -0.5% Nevada village (pt.) 466 466 479 -0.4% Balance of Antrim township 742 746 764 -0.5%Crane township 7,425 7,461 7,514 -0.2% Upper Sandusky city (pt.) 6,535 6,566 6,601 -0.2% Balance of Crane township 890 895 913 -0.4%Crawford township 4,664 4,692 4,789 -0.4% Carey village 3,581 3,603 3,676 -0.4% Balance of Crawford township 1,083 1,089 1,113 -0.4%Eden township 1,059 1,065 1,092 -0.5% Nevada village (pt.) 274 276 281 -0.4% Balance of Eden township 785 789 811 -0.5%Jackson township 548 551 561 -0.4% Kirby village (pt.) 64 65 66 -0.5% Balance of Jackson township 484 486 495 -0.4%Marseilles township 468 472 480 -0.4% Marseilles village 109 110 112 -0.4% Balance of Marseilles township 359 362 368 -0.4%Mifflin township 781 785 804 -0.5% Kirby village (pt.) 51 51 52 -0.3% Balance of Mifflin township 730 734 752 -0.5%Pitt township 989 994 1,012 -0.4% Harpster village 199 200 204 -0.4% Upper Sandusky city (pt.) 4 4 4 0.0% Balance of Pitt township 786 790 804 -0.4%Richland township 849 854 871 -0.4% Wharton village 350 352 358 -0.4% Balance of Richland township 499 502 513 -0.4%Ridge township 512 515 524 -0.4%Salem township 977 983 1,001 -0.4% Upper Sandusky city (pt.) 0 0 0 n.a. Balance of Salem township 977 983 1,001 -0.4%Sycamore township 1,551 1,562 1,600 -0.5% Sycamore village 831 838 861 -0.6% Balance of Sycamore township 720 724 739 -0.4%Tymochtee township 1,087 1,095 1,124 -0.5%
n.a. - Could not calculate. Division by zero.
(a) Used for calculating average annual rate of change. (b) Average annual rate of change from April 1, 2010 to July 1, 2016.
Source: Population Estimates Division, U.S. Census Bureau. Prepared by: Office of Research, Ohio Development Services Agency.
Population