2016 state of wind development in the united states by … · 2016 state of wind development in the...
TRANSCRIPT

WIND DEVELOPMENT IN THE UNITED STATESBY REGION
2016 STATE OF
NREL is a national laboratory of the U.S. Department of EnergyOffi ce of Energy Effi ciency and Renewable EnergyOperated by the Alliance for Sustainable Energy, LLC
For more information, visit:http://apps2.eere.energy.gov/wind/windexchange/
National Renewable Energy Laboratory15013 Denver West Parkway Golden, CO 80401
303-275-3000 • www.nrel.gov
NREL is a national laboratory of the U.S. Department of Energy, Office of Energy Efficiency and Renewable Energy, operated by the Alliance for Sustainable Energy, LLC.
TP-5000-67624 • April 2017
NREL prints on paper that contains recycled content.
April 2017

NREL is a national laboratory of the U.S. Department of Energy Office of Energy Efficiency & Renewable Energy Operated by the Alliance for Sustainable Energy, LLC
This report is available at no cost from the National Renewable Energy Laboratory (NREL) at www.nrel.gov/publications.
Contract No. DE-AC36-08GO28308
National Renewable Energy Laboratory 15013 Denver West Parkway Golden, CO 80401 303-275-3000 • www.nrel.gov
2016 State of Wind Development in the United States by Region Ruth Baranowski, Frank Oteri, Ian Baring-Gould, and Suzanne Tegen National Renewable Energy Laboratory
Prepared under Task No. WE14.BB01
Technical Report NREL/TP-5000-67624 April 2017

NOTICE
This report was prepared as an account of work sponsored by an agency of the United States government. Neither the United States government nor any agency thereof, nor any of their employees, makes any warranty, express or implied, or assumes any legal liability or responsibility for the accuracy, completeness, or usefulness of any information, apparatus, product, or process disclosed, or represents that its use would not infringe privately owned rights. Reference herein to any specific commercial product, process, or service by trade name, trademark, manufacturer, or otherwise does not necessarily constitute or imply its endorsement, recommendation, or favoring by the United States government or any agency thereof. The views and opinions of authors expressed herein do not necessarily state or reflect those of the United States government or any agency thereof.
This report is available at no cost from the National Renewable Energy Laboratory (NREL) at www.nrel.gov/publications.
Available electronically at SciTech Connect http:/www.osti.gov/scitech
Available for a processing fee to U.S. Department of Energy and its contractors, in paper, from:
U.S. Department of Energy Office of Scientific and Technical Information P.O. Box 62 Oak Ridge, TN 37831-0062 OSTI http://www.osti.gov Phone: 865.576.8401 Fax: 865.576.5728 Email: [email protected]
Available for sale to the public, in paper, from:
U.S. Department of Commerce National Technical Information Service 5301 Shawnee Road Alexandria, VA 22312 NTIS http://www.ntis.gov Phone: 800.553.6847 or 703.605.6000 Fax: 703.605.6900 Email: [email protected]
NREL prints on paper that contains recycled content.

iii
This report is available at no cost from the National Renewable Energy Laboratory at www.nrel.gov/publications
Acknowledgments The authors thank the U.S. Department of Energy (DOE) Wind Energy Technologies Office for funding the Regional Resource Centers, this report, and broader stakeholder engagement and education efforts such as the WINDExchange initiative. The authors also thank DOE’s Jocelyn Brown-Saracino, Maggie Yancey, Amber Passmore, Lillie Ghobrial, and Devan Willemsen for their leadership and guidance.
Thanks to the Regional Resource Centers for their work and contributions to this document:
• Four Corners Wind Resource Center: Fletcher Wilkinson, Amanda Ormond, Sarah Propst, Sarah Wright, Karin Wadsack, Meghan Dutton
• Islanded Grid Resource Center: Suzanne MacDonald, Stephanie Nowers, Chris Rose, Brooks Winner
• Midwest Wind Energy Center: Lisa Daniels, Dan Turner, Tom Wind
• Northeast Wind Resource Center: Deborah Donovan, Benjamin Brown, Bob Patton, Jake McDermott, Val Stori
• Northwest Wind Resource and Action Center: Mia Devine, Jennifer Grove, Julie Peacock, Rachel Shimshak, David Wolf, Cameron Yourkowski
• Southeast Wind Energy Resource Center: Paul Gayes, Mary Hallisey Hunt, Katharine Kollins, Jon Miles.
Thanks to Brian Smith and Daniel Laird from the National Renewable Energy Laboratory and DOE’s Hoyt Battey for their review of this report. Also thanks to Corrie Christol and Bethany Straw who work to support our regional stakeholder engagement projects.

iv
This report is available at no cost from the National Renewable Energy Laboratory at www.nrel.gov/publications
List of Abbreviations and Acronyms
4CWRC Four Corners Wind Resource Center
BLM Bureau of Land Management
BOEM Bureau of Ocean Energy Management
BPA Bonneville Power Administration
CAISO California Independent System Operator
CNMI Commonwealth of the Northern Mariana Islands
CPP Clean Power Plan
DOE U.S. Department of Energy
EPA Environmental Protection Agency
GCAMP Georgia Coastal and Marine Planner
IGRC Islanded Grid Resource Center
ISO independent system operator
JMU James Madison University
MW megawatt
MWEC Midwest Wind Energy Center
NAU Northern Arizona University
NREL National Renewable Energy Laboratory
NWRC Northeast Wind Resource Center
NW Wind Center Northwest Wind Resource and Action Center
NYSERDA New York State Energy Research and Development Authority
PTC Production Tax Credit
PURPA Public Utility Regulatory Policies Act
REAP Renewable Energy Alaska Project
v
This report is available at no cost from the National Renewable Energy Laboratory at www.nrel.gov/publications
REST Renewable Energy Standard and Tariff (Arizona)
RFP request for proposals
RPS renewable portfolio standard
RRC Regional Resource Center
SWERC Southeast Wind Energy Resource Center
UCS Union of Concerned Scientists
USFWS U.S. Fish and Wildlife Service

vi
This report is available at no cost from the National Renewable Energy Laboratory at www.nrel.gov/publications
Executive Summary Significant expansion of wind energy development will be required to achieve the scenarios outlined in the U.S. Department of Energy’s (DOE)’s Wind Vision: 20% wind energy by 2030 and 35% wind energy by 2050. Wind energy currently provides more than 5% of the nation's electricity but has the potential to provide much more. The wind industry and the DOE’s Wind Energy Technologies Office are addressing technical wind energy challenges, such as reducing turbine costs and increasing energy production and reliability.
The Office recognizes that public acceptance of wind energy can be challenging, depending on the proximity of proposed wind farms to local populations. Informed decision makers and communities equipped with unbiased information about the benefits and impacts of wind energy development are better prepared to navigate the sometimes contentious development process. In 2014, DOE established six Regional Resource Centers (RRCs) across the United States to communicate unbiased, credible information about wind energy to stakeholders through regional networks. The RRCs provide ready access to this information to familiarize the public with wind energy; raise awareness about potential benefits and issues; and disseminate data on siting considerations such as turbine sound and wildlife habitat protection.
Each U.S. region experiences unique wind energy development challenges due to many factors: wind resources and other natural resources, population density, community needs, and local wildlife species. Expanding the nation’s wind energy portfolio requires high-impact, regionally specific strategies to inform the policy and permitting processes and improve public discourse, thereby reducing conflict around development decisions and ultimately increasing the annual rate of responsible wind development. As a starting point to developing strategies, the RRCs identified a wide array of market challenges that have affected wind energy development. These issues include:
• Insufficient transmission capacity and the need for transmission improvements
• Power market conditions that limit wind development (such as small balancing areas, hard energy forecast requirements, and hour-ahead dispatching)
• Lack of local wind siting or zoning ordinances; ordinances that do not reflect best practices or do not allow the flexibility in wind development to address small, distributed, community, or utility-scale wind projects
• Grid interconnection and integration challenges and costs
• Lack of clear federal policy covering wind power-related initiatives and awareness of those policies
• Minimal past public education and engagement on wind siting issues, exacerbated by inaccurate information and negative public opinion regarding wind energy
• Lack of understanding about wind energy’s economic impacts, including local tax benefits, jobs and economic development, and turbine manufacturing
• Challenges with development on federal and native lands

vii
This report is available at no cost from the National Renewable Energy Laboratory at www.nrel.gov/publications
• Accurate wind information not being utilized in utility integrated resource and state-based clean energy planning (resulting in a need to advance the state of the art in power sector resource planning processes)
• Dearth of science-based resource planning in siting guidelines, especially for development in sage grouse and other environmentally sensitive areas
• Restricted access to capital; limited financing, funding, and technical assistance for small, community, and distributed wind development.
The RRCs also identified the following issues as unique to offshore wind energy development:
• The current high costs of offshore wind energy and lack of articulated benefits describing how initial high costs for early projects can lead to reduced costs for future projects
• Minimal independent information and outreach geared toward innovative regional procurement targets, limiting the ability of projects to attract financing, investigate alternative financing mechanisms, and initiate regional supply chain development
• The fact that there are few full-scale offshore wind turbines currently deployed in the United States and therefore limited U.S.-based research about actual offshore wind development. This limited research results in limited information regarding the offshore wind regulatory process; technical issues related to installation, interconnection, and operation; environmental and human use impacts; and public acceptance of offshore wind
• Lack of clear understanding of the regional and national market opportunity for offshore wind development.
The RRCs also identified distinct challenges unique to wind development in isolated, islanded power systems found primarily in Alaska, coastal New England, Hawaii, the Territories of the United States, and international locations. The primary development challenges include:
• The high up-front cost of deploying sophisticated wind technologies and associated hardware in an isolated, remote, or islanded area with relatively low technical and human capacity
• Excessive transportation and mobilization costs, much higher than costs for communities in other regions on the road system
• Limited ability to gain economies of scale due to the relatively small project size
• Lack of experience and extra costs of integrating wind into relatively weak, inflexible electric grids
• Lack of clear regulatory policy and examples that define the rules of engagement between small utilities and independent power producers that wish to develop wind energy supplied to small, typically municipal utilities

viii
This report is available at no cost from the National Renewable Energy Laboratory at www.nrel.gov/publications
• Specific challenges relating to expanded wind integration into the Railbelt transmission system1 in Alaska.
This document summarizes the status and drivers for U.S. wind energy development during 2016. RRC leaders provided a report of wind energy development in their regions, which was combined with findings from National Renewable Energy Laboratory (NREL) researchers to provide an account of the state of the regions, as well as updates on developments in individual states. NREL researchers and state partners added updates for all states that are not directly supported by an RRC. Accounts for each region include updates on renewable portfolio standards, workforce development, manufacturing and economic development, and individual state updates for installed wind capacity, ongoing policy developments, planned projects and their status, transmission progress reports, etc.
This report also highlights the efforts of the RRCs to engage stakeholders in their individual regions. The RRCs and the regions they serve are (in alphabetical order):
• Four Corners Wind Resource Center, serving Arizona, Colorado, New Mexico, Utah, Nevada, and part of Wyoming
• Islanded Grid Resource Center, serving Alaska, Maine, Massachusetts, Rhode Island, Hawaii, Guam, American Samoa, Commonwealth of Northern Marianas, and U.S. Virgin Islands
• Midwest Wind Energy Center, serving eastern Montana and Illinois, Indiana, Iowa, Michigan, Minnesota, Missouri, North Dakota, Ohio, South Dakota, and Wisconsin
• Northeast Wind Resource Center, serving New England (Connecticut, Maine, Massachusetts, New Hampshire, Rhode Island, and Vermont) and New York for land-based wind, and that same region plus New Jersey for offshore wind
• Northwest Wind Resource and Action Center, serving Washington, Oregon, Idaho, western Montana, and part of Wyoming
• Southeast Wind Energy Resource Center, serving North Carolina, Florida, Louisiana, South Carolina, Georgia, Alabama, Mississippi, Virginia, Kentucky, Tennessee, and Arkansas.
On the national level, DOE’s WINDExchange2 initiative (managed by NREL) provides additional information to the RRCs and supports states not covered by one of these regional organizations.
In their first year of operation, DOE’s RRCs had a tremendous impact on key stakeholders, distilling and disseminating large amounts of information and engaging numerous individuals regarding wind power issues in their communities and regions. In the second year of this initiative, the RRCs reported more than 95,000 “touches” with key stakeholders and have positively “engaged” more than 68,700 people, providing them with unbiased 1 A small, isolated transmission system in Alaska that covers the state’s population centers along the main railroad line, including the Seward, the Kenai, Anchorage, Wasilla, and north to Fairbanks. 2 http://apps2.eere.energy.gov/wind/windexchange/

ix
This report is available at no cost from the National Renewable Energy Laboratory at www.nrel.gov/publications
information about wind power as an option to address the nation’s long-term energy needs. Engagements were typically made through events such as meetings with identified stakeholders, interactive webinars, workshops, tours, and presentations at regional conferences. Additional efforts were undertaken through outreach products such as handouts, meeting materials, and newsletters, while direct engagement with regional media organizations was also supported. To date, more than 2.5 million people have been reached by RRC outreach efforts. More targeted efforts ensured that key stakeholders received information that allowed them to include wind technology in plans or policies that had either not included wind or that included outdated wind information.
Many notable RRC projects that may help support expanded wind development are underway. Examples include:
• After the Colorado Public Utility Commission denied approval for a 60-megawatt (MW) wind project, the Four Corners Wind Resource Center provided statements of support and filed public comments with the commission. After considering the public comments and filings, the Public Utility Commission approved the previously denied 60-MW wind project, and the Peak View Wind Project came online in November 2016.
• The Islanded Grid Resource Center worked closely with communities and developers to identify best practices for engaging coastal and island communities around offshore wind development to ensure local impacts and benefits are considered carefully. In December 2015, the RRC released Engaging Communities in Offshore Wind: Case Studies and Lessons Learned from New England Islands, a report that highlights key insights for designing good community engagement processes and demonstrates these best practices through case studies.
• The Midwest Wind Energy Center participated in the 2016 Minnesota State Fair’s Eco Experience from August 25 through September 5, hosting a wind-centric exhibit at the event. Supported by 60 trained volunteers, the Wind Energy Center addressed wind energy myths and misconceptions to increase public understanding and support for wind energy. Approximately 900 visitors interacted with exhibits and had conversations with volunteers.
• The Maine Governor’s Office, the Massachusetts Clean Energy Center, the Massachusetts Department of Energy Resources, the Rhode Island Office of Energy Resources, and the New York State Energy Research and Development Authority agreed to collaborate to develop a roadmap for speeding offshore wind development and reducing the cost of that development. The development of the regional roadmap collaboration was supported by the Northeast Wind Resource Center and the John Merck Fund. The New York State Energy Research and Development Authority received major funding from DOE’s State Energy Program for roadmap work, and in September 2015 a multi-state offshore wind roadmap project was featured at the White House Summit on Offshore Wind.

x
This report is available at no cost from the National Renewable Energy Laboratory at www.nrel.gov/publications
• The Northwest Wind Resource and Action Center worked with the Oregon Public Utility Commission to allow distributed wind to receive capacity credit and to dispute an anti-wind Public Utility Regulatory Policies Act ruling, which would eliminate distributed wind development.
• The Southeast Wind Energy Resource Center is working with local developers to educate communities about wind, laying the groundwork for Virginia’s first wind project, while ensuring that utilities in the Southeast understand emerging wind technologies (especially tall towers) and the role they play in allowing wind development in areas previously identified as not economically feasible for wind projects.
In states not represented by an RRC, significant developments include:
• In 2016, Texas produced more wind power in a given amount of time than ever in history: 48% of the total electricity load of the state’s main power grid.
• Trident Winds proposed California’s first offshore wind project in early 2016. If the 800-MW project were to move forward, it would consist of 100 floating turbines in Morro Bay and would contribute to the state meeting its new RPS goals (Lillian 2016).
• In Nebraska, commitments by local utilities are beginning to shape the state’s energy future. Nebraska Public Power District’s 225-mile-long R-Project3 will provide new transmission capacity for future renewable energy development. Construction is expected to begin in October 2017 with an October 2019 in-service date. Work continues on the Midwest Transmission Project,4 a 180-mile transmission line that will run from Nebraska City to Sibley, Missouri. Scheduled to be in service by summer 2017, the project will help advance renewable energy and increase system reliability (Omaha Public Power District 2015a). The Omaha Public Power District also confirmed its plan to have more than 30% of future retail generation provided by renewable resources (Omaha Public Power District 2015b).
According to the American Wind Energy Association, at the end of 2016 more than 18,300 MW of wind capacity are under construction or in advanced development. In 2017, uncertainty lingers around implementation of the federal Clean Power Plan, the wider role of energy in addressing climate change, state renewable portfolio standards, net metering, and other state-based incentives.
This state of the regions report will be updated annually to continue providing an account of the state of the U.S. wind industry in the regions.
3 http://www.nppd.com/rproject/ 4 http://midwesttransmissionproject.com/Default.htm

xi
This report is available at no cost from the National Renewable Energy Laboratory at www.nrel.gov/publications
Table of Contents
Acknowledgments _______________________________________________________ iii
List of Abbreviations and Acronyms __________________________________________iv
Executive Summary _______________________________________________________vi
1 Introduction __________________________________________________________ 1
2 Four Corners Region ___________________________________________________ 6
2.1 Renewable Portfolio Standards ____________________________________________ 7
2.2 Clean Power Plan _______________________________________________________ 8
2.3 Workforce Development _________________________________________________ 9
2.4 Manufacturing and Economic Development _________________________________ 10
2.5 Key Stakeholder Groups and Development Challenges ________________________ 11
2.6 Collaborating Organizations _____________________________________________ 13
2.7 State Updates _________________________________________________________ 14 2.7.1 Arizona _____________________________________________________________________ 14 2.7.2 Colorado ____________________________________________________________________ 16 2.7.3 Nevada _____________________________________________________________________ 19 2.7.4 New Mexico _________________________________________________________________ 20 2.7.5 Utah ________________________________________________________________________ 21
3 Islanded System Region _______________________________________________ 24
3.1 Renewable Portfolio Standards ___________________________________________ 26
3.2 Clean Power Plan ______________________________________________________ 27
3.3 Workforce Development ________________________________________________ 27
3.4 Manufacturing and Economic Development _________________________________ 29
3.5 Key Stakeholder Groups and Development Challenges ________________________ 30
3.6 Collaborating Organizations _____________________________________________ 32
3.7 State and Territory Updates _____________________________________________ 35 3.7.1 Alaska ______________________________________________________________________ 35 3.7.2 American Samoa ______________________________________________________________ 36 3.7.3 Hawaii ______________________________________________________________________ 37 3.7.4 Guam _______________________________________________________________________ 39 3.7.5 Commonwealth of the Northern Mariana Islands ____________________________________ 39 3.7.6 Northeast Island Communities ___________________________________________________ 40 3.7.7 U.S. Virgin Islands _____________________________________________________________ 42
xii
This report is available at no cost from the National Renewable Energy Laboratory at www.nrel.gov/publications
4 Midwest Region _____________________________________________________ 43
4.1 Renewable Portfolio Standards ___________________________________________ 45
4.2 Clean Power Plan ______________________________________________________ 46
4.3 Workforce Development ________________________________________________ 47
4.4 Manufacturing and Economic Development _________________________________ 48
4.5 Key Stakeholder Groups and Development Challenges ________________________ 51
4.6 Collaborating Organizations _____________________________________________ 53
4.7 State Updates _________________________________________________________ 54 4.7.1 Illinois ______________________________________________________________________ 54 4.7.2 Indiana ______________________________________________________________________ 54 4.7.3 Iowa ________________________________________________________________________ 56 4.7.4 Michigan ____________________________________________________________________ 58 4.7.5 Minnesota ___________________________________________________________________ 59 4.7.6 Missouri _____________________________________________________________________ 62 4.7.7 North Dakota _________________________________________________________________ 62 4.7.8 Ohio ________________________________________________________________________ 63 4.7.9 South Dakota _________________________________________________________________ 63 4.7.10 Wisconsin _________________________________________________________________ 64
5 Northeast Region ____________________________________________________ 66
5.1 Renewable Portfolio Standards ___________________________________________ 68
5.2 Clean Power Plan ______________________________________________________ 69
5.3 Regional Procurement __________________________________________________ 70
5.4 Regional Transmission __________________________________________________ 71
5.5 Workforce Development ________________________________________________ 73
5.6 Manufacturing and Economic Development _________________________________ 75
5.7 Key Stakeholder Groups and Development Challenges ________________________ 76
5.8 Collaborating Organizations _____________________________________________ 77
5.9 State Updates _________________________________________________________ 77 5.9.1 Connecticut __________________________________________________________________ 77 5.9.2 Maine ______________________________________________________________________ 77 5.9.3 Massachusetts _______________________________________________________________ 79 5.9.4 New Hampshire ______________________________________________________________ 81 5.9.5 New Jersey __________________________________________________________________ 82 5.9.6 New York ____________________________________________________________________ 82 5.9.7 Pennsylvania _________________________________________________________________ 84 5.9.8 Rhode Island _________________________________________________________________ 84 5.9.9 Vermont ____________________________________________________________________ 84

xiii
This report is available at no cost from the National Renewable Energy Laboratory at www.nrel.gov/publications
6 Northwest Region ____________________________________________________ 86
6.1 Renewable Portfolio Standards ___________________________________________ 87
6.2 Clean Power Plan ______________________________________________________ 88
6.3 Regional Transmission __________________________________________________ 90
6.4 Workforce Development ________________________________________________ 90
6.5 Manufacturing and Economic Development _________________________________ 91
6.6 Key Stakeholder Groups and Development Challenges ________________________ 92
6.7 Collaborating Organizations _____________________________________________ 94
6.8 State Updates _________________________________________________________ 94 6.8.1 Idaho _______________________________________________________________________ 94 6.8.2 Montana ____________________________________________________________________ 95 6.8.3 Oregon ______________________________________________________________________ 97 6.8.4 Washington _________________________________________________________________ 101 6.8.5 Wyoming ___________________________________________________________________ 102
7 Southeast Region ___________________________________________________ 103
7.1 Renewable Portfolio Standards __________________________________________ 105
7.2 Clean Power Plan _____________________________________________________ 106
7.3 Workforce Development _______________________________________________ 107
7.4 Manufacturing and Economic Development ________________________________ 108
7.5 Key Stakeholder Groups and Development Challenges _______________________ 109
7.6 Collaborating Organizations ____________________________________________ 113
7.7 State Updates ________________________________________________________ 113 7.7.1 Alabama ___________________________________________________________________ 113 7.7.2 Arkansas ___________________________________________________________________ 114 7.7.3 Florida _____________________________________________________________________ 115 7.7.4 Georgia ____________________________________________________________________ 115 7.7.5 Kentucky ___________________________________________________________________ 116 7.7.6 Louisiana ___________________________________________________________________ 116 7.7.7 Mississippi __________________________________________________________________ 117 7.7.8 North Carolina _______________________________________________________________ 118 7.7.9 South Carolina _______________________________________________________________ 121 7.7.10 Tennessee ________________________________________________________________ 121 7.7.11 Virginia __________________________________________________________________ 122
8 Updates for States Outside of RRC Regions _______________________________ 123
8.1 Clean Power Plan _____________________________________________________ 123

xiv
This report is available at no cost from the National Renewable Energy Laboratory at www.nrel.gov/publications
8.2 California____________________________________________________________ 124
8.3 Delaware ____________________________________________________________ 126
8.4 Kansas ______________________________________________________________ 127
8.5 Maryland ___________________________________________________________ 129
8.6 Nebraska ____________________________________________________________ 131
8.7 Oklahoma ___________________________________________________________ 132
8.8 Texas _______________________________________________________________ 134
8.9 West Virginia ________________________________________________________ 136
9 References _________________________________________________________ 138
Table of Figures
Figure 1. Map of Regional Resource Centers ...................................................................................... 2 Figure 2. Map of school wind turbine projects, educational programs, and locations with both
wind turbines and educational programs within the states served by the Four Corners Wind Resource Center ......................................................................................................................... 10
Figure 3. Northern Arizona University students with middle school students at the National KidWind Challenge and Collegiate Wind Competition in New Orleans in May 2016 ................ 16
Figure 4. Wind resource at 80 meters overlaid with federal lands .................................................. 19 Figure 5. Latigo Wind Park in San Juan County, Utah. Photo from sPower ...................................... 22 Figure 6. A view of the Kodiak Electric Association wind farm in Kodiak, Alaska. Coupled with
existing hydropower and a battery and flywheel system, this 9-MW wind farm has produced 99.7% of the utility's electricity since 2014. Photo courtesy of Kodiak Electric Association ..... 25
Figure 7. Map of school wind turbine projects, educational programs, and locations with both wind turbines and educational programs within the Islanded Grid Resource Center’s area .... 29
Figure 8. The IGRC published a report detailing lessons learned from island stakeholders on offshore wind community engagement. .................................................................................... 34
Figure 9. Wind turbines on Oahu. Photo from Chris Hoare, Flickr .................................................... 38 Figure 10. MWEC footprint and average wind speeds at 80 meters ................................................ 43 Figure 11. Map of school wind turbine projects, educational programs, and locations with both
wind turbines and educational programs within the Midwest Wind Energy Center’s area ...... 48 Figure 12. Minnesota West Technical College offers several programs that prepare students for
wind energy careers. Photos courtesy of Minnesota West Technical College ........................... 48 Figure 13. America’s first offshore wind farm under construction. Photo by Dennis Schroeder,
NREL 40398 ................................................................................................................................. 68

xv
This report is available at no cost from the National Renewable Energy Laboratory at www.nrel.gov/publications
Figure 14. Map of school wind turbine projects, educational programs, and locations with both wind turbines and educational programs within the Northeast Wind Resource Center’s area 73
Figure 15. The Wind Blade Challenge 2016 winners, who will receive an internship at the UMaine Composites Center. Left to right: Maine Composites Alliance Managing Director Steve Von Vogt, members of Bangor High School Team 1, and Bangor High School teacher John Cangelosi. Photo from the Northeast Wind Resource Center .................................................... 74
Figure 16. Windstorm Challenge 2016 winning team Falmouth High School students will receive an internship at the UMaine Composites Center. Left to right: Falmouth High School teacher Kim Blenk, team members, and Dr. Habib Dagher, executive director of the UMaine Advanced Structures and Composites Center. Photo from the Northeast Wind Resource Center ............. 74
Figure 17. The 34-MW Saddleback Ridge Wind Project in Carthage, Maine, was completed in 2015. Photo from Ken Boulier/Patriot Renewables, NREL 40575 ........................................................ 78
Figure 18. A turbine blade is delivered to the Wind Technology Testing Center Large Blade Test Facility in Boston. Photo from Massachusetts Clean Energy Center, Flickr................................ 81
Figure 19. Map of school wind turbine projects, educational programs, and locations with both wind turbines and educational programs within the Northwest Wind Resource and Action Center’s area .............................................................................................................................. 91
Figure 20. Wind turbines in Oregon. Photo from Bureau of Land Management, Flickr ................... 98 Figure 21. Map of potential wind capacity at a hub height of 140 meters. Increased hub heights
expand opportunities for wind development, especially in the Southeast and Gulf Coast regions ...................................................................................................................................... 105
Figure 22. Map of school wind turbine projects, educational programs, and locations with both wind turbines and educational programs within the Southeast Wind Energy Resource Center’s area ........................................................................................................................................... 108
Figure 23. Map of school wind turbine projects, educational programs, and locations with both wind turbines and educational programs in California ............................................................ 126
Figure 24. Map of sole educational program location in Delaware ............................................... 127 Figure 25. Map of school wind turbine projects, educational programs, and locations with both
wind turbines and educational programs in Kansas ................................................................ 128 Figure 26. Map of school wind turbine projects, educational programs, and locations with both
wind turbines and educational programs in Maryland ............................................................ 130 Figure 27. Map of school wind turbine projects, educational programs, and locations with both
wind turbines and educational programs in Nebraska ............................................................ 131 Figure 28. Map of school wind educational programs in Oklahoma .............................................. 133 Figure 29. Map of school wind turbine projects, educational programs, and locations with both
wind turbines and educational programs in Texas .................................................................. 135 Figure 30. Map of sole school wind educational program in West Virginia ................................... 137

xvi
This report is available at no cost from the National Renewable Energy Laboratory at www.nrel.gov/publications
Table of Tables
Table 1. Key Statistics for States in the Four Corners Wind Resource Center Region ........................ 7 Table 2. RPS Overview for States Served by the Four Corners Wind Resource Center ...................... 8 Table 3. Clean Power Plan Rate-Based Targets for States Served by the Four Corners Wind
Resource Center ........................................................................................................................... 8 Table 4. Clean Power Plan Targets for States Served by the Four Corners Wind Resource Center ... 9 Table 5. Wind-Related Manufacturing Overview for States Served by the Four Corners Wind
Resource Center ......................................................................................................................... 10 Table 6. Economic Impacts of Wind Development in States Served by the Four Corners Wind
Resource Center ......................................................................................................................... 11 Table 7. Key Statistics for the Islanded Grid Resource Center Region .............................................. 26 Table 8. RPS Overview for States and Territories Served by the Islanded Grid Resource Center .... 27 Table 9. Economic Impacts of Wind Development in States Served by the Islanded Grid Resource
Center ......................................................................................................................................... 29 Table 10. Key Statistics for States in the Midwest Wind Energy Center Region .............................. 44 Table 11. RPS Overview for States Served by the Midwest Wind Energy Center ............................ 45 Table 12. Clean Power Plan Rate-Based Targets for States Served by the Midwest Wind Energy
Center ......................................................................................................................................... 46 Table 13. Clean Power Plan Targets for States Served by the Midwest Wind Energy Center .......... 47 Table 14. Wind-Related Manufacturing Overview for States Served by the Midwest Wind Energy
Center ......................................................................................................................................... 49 Table 15. Economic Impacts of Wind Development in States Served by the Midwest Wind Energy
Center ......................................................................................................................................... 51 Table 16. Key Statistics for States in the Northeast Wind Resource Center Region ........................ 67 Table 17. RPS Overview for States Served by the Northeast Wind Resource Center ...................... 69 Table 18. Clean Power Plan Rate-Based Targets for States Served by the Northeast Wind Resource
Center ......................................................................................................................................... 69 Table 19. Clean Power Plan Targets for States Served by the Northeast Wind Resource Center .... 70 Table 20. Wind-Related Manufacturing Overview for States Served by the Northeast Wind
Resource Center ......................................................................................................................... 75 Table 21. Economic Impacts of Wind Development in States Served by the Northeast Wind
Resource Center ......................................................................................................................... 75 Table 22. Key Statistics for States in the Northwest Wind Resource and Action Center Region ..... 87 Table 23. RPS Overview for States Served by the Northwest Wind Resource and Action Center ... 88 Table 24. Clean Power Plan Rate-Based Targets for States Served by the Northwest Wind Resource
and Action Center ....................................................................................................................... 89 Table 25. Clean Power Plan Targets for States Served by the Northwest Wind Resource and Action
Center ......................................................................................................................................... 89 Table 26. Wind-Related Manufacturing Overview for States Served by the Northwest Wind
Resource and Action Center ....................................................................................................... 91
xvii
This report is available at no cost from the National Renewable Energy Laboratory at www.nrel.gov/publications
Table 27. Economic Impacts of Wind Development in States Served by the Northwest Resource and Action Center ....................................................................................................................... 92
Table 28. Key Statistics for States in the Southeast Wind Energy Resource Center Region .......... 103 Table 29. RPS Overview for States Served by the Southeast Wind Energy Resource Center......... 105 Table 30. Clean Power Plan Rate-Based Targets for States Served by the Southeast Wind Energy
Resource Center ....................................................................................................................... 106 Table 31. Clean Power Plan Targets for States Served by the Southeast Wind Resource Center .. 107 Table 32. Wind-Related Manufacturing Overview for States Served by the Southeast Wind Energy
Resource Center ....................................................................................................................... 109 Table 33. Economic Impacts of Wind Development in States Served by the Southeast Wind Energy
Resource Center ....................................................................................................................... 109 Table 34. Clean Power Plan Rate-Based Targets for States Not Directly Supported by a Regional
Resource Center ....................................................................................................................... 123 Table 35. Clean Power Plan Targets for States Not Directly Supported by a Regional Resource
Center ....................................................................................................................................... 124 Table 36. California Wind-Related Manufacturing Overview ......................................................... 126 Table 37. Kansas Wind-Related Manufacturing Overview ............................................................. 129 Table 38. Maryland Wind-Related Manufacturing Overview ......................................................... 130 Table 39. Oklahoma Wind-Related Manufacturing Overview ........................................................ 134 Table 40. Texas Wind-Related Manufacturing Overview ............................................................... 136

1
This report is available at no cost from the National Renewable Energy Laboratory at www.nrel.gov/publications
1 Introduction Significant expansion of wind energy development will be required to achieve the scenarios set in the U.S. Department of Energy’s (DOE)’s Wind Vision: 20% wind energy by 2030 and 35% wind energy by 2050. Wind energy currently provides more than 5% of the nation's electricity but has the potential to provide much more (U.S. DOE 2015d). The wind industry and DOE’s Wind Energy Technologies Office are addressing technical wind energy challenges, such as reducing turbine costs and increasing energy production and reliability.
At the end of 2015, the U.S. Congress passed a 5-year extension and phase-down of the wind Production Tax Credit (PTC) and the option to elect the investment tax credit for wind. The PTC was extended at the “full value” $0.023/kilowatt-hour level for projects that commence construction through 2016 and ramps down to 80% of full value in 2017, 60% in 2018, and 40% in 2019.5 The multi-year extension of the PTC combined with favorable Internal Revenue Service guidance on the definition of “commence construction” has galvanized project development activity in many states, which in turn supports supply chain manufacturing and related economic development.
Also in 2015, the U.S. Environmental Protection Agency released the final Clean Power Plan (CPP), which proposes to regulate the emissions of carbon dioxide from existing power plants. The proposed rate-based and mass-based emissions targets for states in each region are included in this report, as well as the percentage emissions reductions that the rule requires over the 2012 baseline. Although the CPP implementation is uncertain, many utilities are continuing plans and making progress toward goals outlined in the CPP. This is largely attributed to the fact that many regulators and utilities believe that although the rule may be delayed, ultimately carbon dioxide emission limits may be required in some form. Wind energy can play an important role in carbon reduction efforts.
The wind industry and the DOE Wind Energy Technologies Office are addressing technical challenges to increasing wind energy's contribution to the national grid (such as reducing turbine costs and increasing energy production and reliability), and they recognize that public acceptance issues and access to sound information to make good decisions about siting are barriers to wind energy development. Wind energy is a rapidly evolving technology that can play an important role in the U.S. energy generation mix, and credible information about it and the diversity of its possible applications should be communicated to a variety of stakeholders. In 2014, DOE established six Regional Resource Centers (RRCs) to fill this role, providing information to familiarize the public with wind energy, raising awareness about potential benefits and impacts, and disseminating data on siting considerations such as turbine sound and wildlife habitat protection. Figure 1 depicts the geographic coverage of the RRCs. Nationally, the DOE WINDExchange6 initiative provides additional information to the RRCs and states not supported by one of these organizations.
5 Learn more at http://energy.gov/savings/renewable-electricity-production-tax-credit-ptc 6 http://apps2.eere.energy.gov/wind/windexchange/

2
This report is available at no cost from the National Renewable Energy Laboratory at www.nrel.gov/publications
This report includes an update for all 50 states; states not served by an RRC are covered in Section 8. The RRCs are as follows (in alphabetical order here and in the report sections):
• Four Corners Wind Resource Center, serving Arizona, Colorado, New Mexico, Utah, Nevada, and part of Wyoming
• Islanded Grid Resource Center, serving Alaska, Maine, Massachusetts, Rhode Island, Hawaii, Guam, American Samoa, Commonwealth of Northern Marianas, and U.S. Virgin Islands
• Midwest Wind Energy Center, serving eastern Montana and Illinois, Indiana, Iowa, Michigan, Minnesota, Missouri, North Dakota, Ohio, South Dakota, and Wisconsin
• Northeast Wind Resource Center, serving New England (Connecticut, Maine, Massachusetts, New Hampshire, Rhode Island, and Vermont) and New York for land-based wind, and that same region plus New Jersey for offshore wind
• Northwest Wind Resource and Action Center, serving Washington, Oregon, Idaho, western Montana, and part of Wyoming
• Southeast Wind Energy Resource Center, serving North Carolina, Florida, Louisiana, South Carolina, Georgia, Alabama, Mississippi, Virginia, Kentucky, Tennessee, and Arkansas.
Figure 1. Map of Regional Resource Centers
3
This report is available at no cost from the National Renewable Energy Laboratory at www.nrel.gov/publications
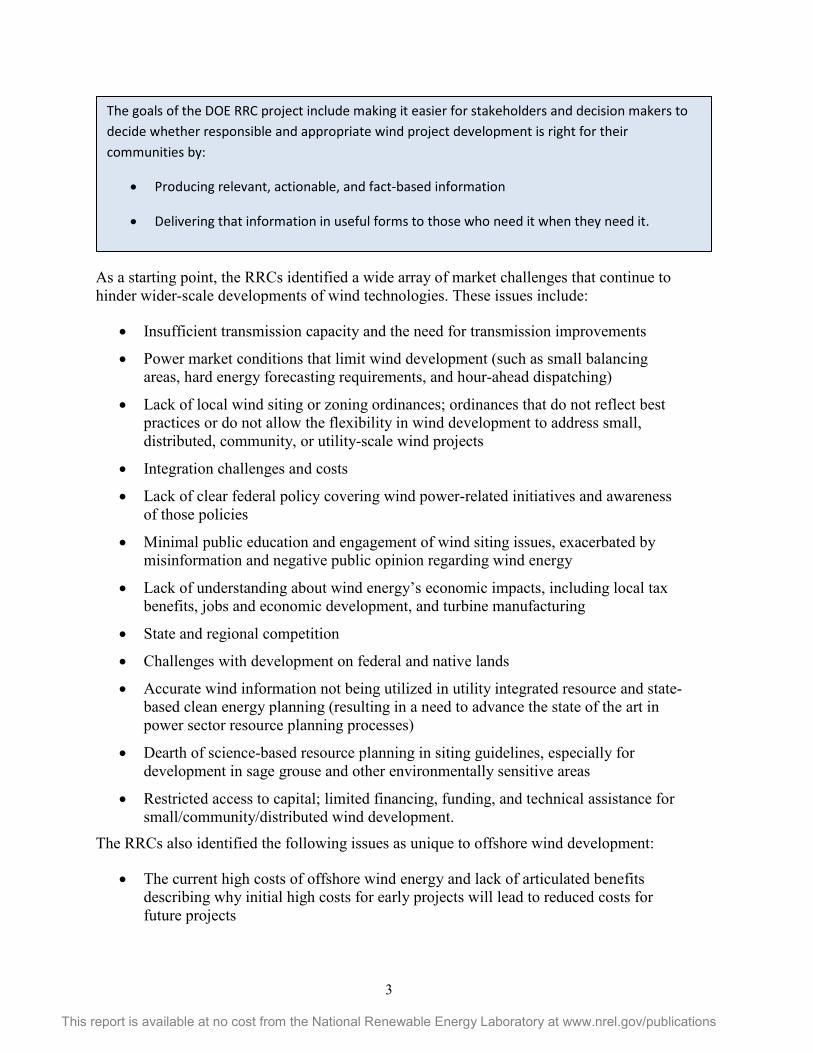
As a starting point, the RRCs identified a wide array of market challenges that continue to hinder wider-scale developments of wind technologies. These issues include:
• Insufficient transmission capacity and the need for transmission improvements
• Power market conditions that limit wind development (such as small balancing areas, hard energy forecasting requirements, and hour-ahead dispatching)
• Lack of local wind siting or zoning ordinances; ordinances that do not reflect best practices or do not allow the flexibility in wind development to address small, distributed, community, or utility-scale wind projects
• Integration challenges and costs
• Lack of clear federal policy covering wind power-related initiatives and awareness of those policies
• Minimal public education and engagement of wind siting issues, exacerbated by misinformation and negative public opinion regarding wind energy
• Lack of understanding about wind energy’s economic impacts, including local tax benefits, jobs and economic development, and turbine manufacturing
• State and regional competition
• Challenges with development on federal and native lands
• Accurate wind information not being utilized in utility integrated resource and state-based clean energy planning (resulting in a need to advance the state of the art in power sector resource planning processes)
• Dearth of science-based resource planning in siting guidelines, especially for development in sage grouse and other environmentally sensitive areas
• Restricted access to capital; limited financing, funding, and technical assistance for small/community/distributed wind development.
The RRCs also identified the following issues as unique to offshore wind development:
• The current high costs of offshore wind energy and lack of articulated benefits describing why initial high costs for early projects will lead to reduced costs for future projects
The goals of the DOE RRC project include making it easier for stakeholders and decision makers to decide whether responsible and appropriate wind project development is right for their communities by:
• Producing relevant, actionable, and fact-based information
• Delivering that information in useful forms to those who need it when they need it.
4
This report is available at no cost from the National Renewable Energy Laboratory at www.nrel.gov/publications
• Minimal independent information and outreach geared toward innovative regional procurement targets, limiting the ability of projects to attract financing, investigate alternative financing mechanisms, and initiate regional supply chain development
• The fact that there are few full-scale offshore wind turbines currently deployed in the United States and therefore limited U.S.-based research about actual offshore wind development. This limited research results in limited information regarding the offshore wind regulatory process; technical issues related to installation, interconnection, and operation; environmental and human use impacts; and public acceptance of offshore wind
• Lack of clear understanding of the regional and national market opportunity for offshore wind development.
The RRCs also identified distinct challenges unique to wind development in isolated, islanded power systems found primarily in Alaska, coastal New England, Hawaii, the Territories of the United States, and international locations. The primary development challenges include:
• The high up-front cost of deploying sophisticated wind technologies and associated hardware in an isolated, remote, or islanded area with relatively low technical and human capacity
• Excessive transportation and mobilization costs, much higher than costs for communities in other regions on the road system
• Limited ability to gain economies of scale due to the relatively small project size
• Lack of experience and extra costs of integrating wind into relatively weak, inflexible electric grids
• Lack of clear regulatory policy and examples that define the rules of engagement between small utilities and independent power producers that wish to develop wind energy supplied to small, typically municipal utilities
• Additional wind energy development challenges have been identified that relate to expanded wind integration into the Railbelt transmission system7 in Alaska, which are discussed in the state summary in this document.
Each RRC applies a unique regional context to identify key stakeholders who can help to address challenges identified for that region. Stakeholders may include, for example, county commissioners, state legislators, landowners, tribal authorities, and organizations such as utilities, schools, and non-profit agencies. During their second year of operations, the RRCs reached more than 1.3 million stakeholders with targeted activities; 93,000 of those were identified as key stakeholders. The RRCs indicated that approximately 68,700 of the more than 1.3 million stakeholders reached took actions, demonstrating a wider acceptance of wind technology development.
7 A small, isolated transmission system in Alaska that covers the state’s population centers along the main railroad line, including the Seward, the Kenai, Anchorage, Wasilla, and north to Fairbanks.

5
This report is available at no cost from the National Renewable Energy Laboratory at www.nrel.gov/publications
This report provides an overview of the state of the wind industry in each region of the United States. It describes the regional and state markets for wind development and current policies. The report also provides updates on the RRCs’ efforts to provide accurate and credible information for use in regional discussions and enable balanced consideration of potential developments in areas where wind projects could be built.
This document is intended to be a companion to the DOE’s annual Distributed Wind Market Report (U.S. DOE 2016a), annual Wind Technologies Market Report (U.S. DOE 2016b), and periodic Offshore Wind Technologies Market Report (NREL 2015), which provide assessments of the national wind markets for each of these technologies.
Please note that the authors anticipated that readers might only read the sections of the report that pertain to their regions; therefore, it was important that each section be able to stand alone. If a person reads the report from start to finish, he or she will note redundancies and duplicated content.

6
This report is available at no cost from the National Renewable Energy Laboratory at www.nrel.gov/publications
2 Four Corners Region Colleagues from the Four Corners Wind Resource Center and the National Renewable Energy Laboratory (NREL) collaborated to provide the following assessment of the state of the wind industry in this region.
The Four Corners Wind Resource Center (4CWRC)8 is managed by Utah Clean Energy in partnership with Interwest Energy Alliance9 and Northern Arizona University.10 The Regional Resource Center (RRC) engages and educates wind energy stakeholders in Arizona, Colorado, Nevada, New Mexico, Utah, and Wyoming.11 Collaborating in this region allows the 4CWRC to leverage the experience of states with more historic wind development experience—like Colorado, Wyoming, and New Mexico—to inform stakeholders and expand markets in Utah, Nevada, and Arizona, including on tribal lands. Additionally, the commonalities among the states enable a centralized approach to addressing wind barriers that further leverages resources and efforts within the region. For example, as the region experiences increasing droughts and water shortages, both of which are exacerbated by climate change, these arid Southwest states share an interest in water conservation and water-wise energy resources.
Similarly, air quality and haze related to the region’s fossil fuel-intensive energy mix are increasingly critical issues for Four Corners states. In light of federal regulations on greenhouse gas emissions and regional haze from existing and planned power plants, reducing the emissions and carbon intensity of the Western generation mix is increasingly pertinent.12 As such, the 4CWRC’s efforts focus on promoting the water-saving, air quality, and emissions mitigation benefits of wind energy along with the cost-effective opportunities this resource provides to meet the West’s growing energy needs. Coordination and engagement on relevant Western regional transmission, integration, and interconnection issues, including the implementation of an energy imbalance market13 and the emergence of a potential regional energy market,14 support regional and national efforts to address key barriers to expanding wind power in the Western market.
Total installed wind capacity in the 4CWRC region as of September 2016 is 4,888 megawatts (MW) (Table 1). The Wind Vision scenario central case projects a total installed capacity of approximately 21,000 MW by the year 2050 (U.S. Department of Energy 8 http://www.fourcornerswind.org/ 9 http://interwest.org/ 10 http://nau.edu/ 11 Although the 4CWRC contributes to engagement efforts in Wyoming, in this report the state’s overview is included in the Northwest Wind Resource and Action Center’s section. 12 Despite the U.S. Supreme Court’s stay of the Environmental Protection Agency’s Clean Power Plan pending review of the merits, the proposed regulations continue to influence and be cited in regulatory proceedings in the West. 13 An energy imbalance market is a means of supplying and dispatching electricity to balance fluctuations in generation and load. It aggregates the variability of generation and load over multiple balancing authority areas. 14 Western states and the California Independent System Operator are considering the benefits of a regional energy market to support better use of resources, especially renewables, to reduce system costs and greenhouse gas emissions from the electricity sector.

7
This report is available at no cost from the National Renewable Energy Laboratory at www.nrel.gov/publications
2015d). Stakeholders can consult the U.S. Department of Energy’s (DOE’s) interactive Wind Vision Study Scenario Viewer15 to learn more about state-specific impacts from wind energy development.
Table 1. Key Statistics for States in the Four Corners Wind Resource Center Region
AZ CO NM NV UT
Installed Wind (MW), End of 3Q1616 268 2,965 1,112 152 391
Percentage of In-State Energy Production (as of July 2016)17
.5%
16%
10%
1%
2%
2016 Wind Power Capacity Additions (MW)18 0 0 32 0 64 Wind Capacity under Construction (MW), end of 3Q1619 0 137 1,003 0 80 Projected Potential Capacity (MW), 80 m, 30% CF 10,904 387,220 492,083 7,247 13,103 Projected Potential Capacity (MW), 100 m, 30% CF 25,791 429,456 568,112 12,034 26,237
Distributed Wind Capacity (MW)20 3 29 37 12 1 Sources: American Wind Energy Association, U.S. DOE
2.1 Renewable Portfolio Standards Two of the states in the 4CWRC region have a renewable portfolio standard (RPS) targeting 2020 (Colorado and New Mexico), two have an RPS targeting 2025 (Arizona and Nevada), and Utah has a renewable portfolio goal instead of a standard (Table 2). Several RPSs in the region survived challenges brought in court, even as neighboring states (California and Washington) increased their RPSs.
Legislation to reduce or otherwise roll back the Colorado and New Mexico RPSs were introduced during the 2015 and 2016 legislative sessions but did not pass. In 2015, New Mexico’s House of Representatives voted in favor of reducing the 20% by 2020 renewable energy requirement. The effort stalled when the Senate’s Conservation Committee voted to keep the bill from advancing to a full Senate vote. Also in 2015, Colorado’s Senate Bill 44 intended to halve the state’s 30% by 2020 renewable requirement for large utilities while reducing the standard for rural electricity associations from 20% to 15% beginning in 2020. The state’s House of Representatives voted down the effort. The constitutionality of the state’s RPS was also upheld in the Tenth Circuit Court of Appeals, ending litigation that began in 2011.
15 http://en.openei.org/apps/wv_viewer/ 16 American Wind Energy Association 2016a 17 American Wind Energy Association 2016a 18 American Wind Industry Association 2016b 19 American Wind Industry Association 2016b 20 Distributed wind project installed capacity is defined as 2003-2015 cumulative capacity (DOE 2016a).

8
This report is available at no cost from the National Renewable Energy Laboratory at www.nrel.gov/publications
In Colorado’s 2016 legislative session, a few bills were introduced that could have directly or indirectly impacted the state’s RPS. SB16-007 would have created incentives for biomass electricity generation to meet RPS goals, without expanding the overall RPS.
Table 2. RPS Overview for States Served by the Four Corners Wind Resource Center
RPS
Arizona 15% by 2025
Colorado
30% by 2020 (investor-owned utilities) 20% by 2020 (co-ops serving 100,000 or more meters) 10% by 2020 (co-ops serving fewer than 100,000 meters and municipal utilities serving 40,000 or more customers)
Nevada 25% by 2025
New Mexico 20% x 2020 (investor-owned utilities) 10% x 2020 (electric co-ops)
Utah Goal of 20% by 2025 Source: Database of State Incentives for Renewables & Efficiency
2.2 Clean Power Plan In 2015, the U.S. Environmental Protection Agency (EPA) released the final Clean Power Plan (CPP), which proposes regulations on carbon dioxide emissions from existing power plants. The proposed rate-based emissions targets in the original plan for each state in the region are shown in Table 3 below, along with the percentage of emissions reductions that the rule would require over the 2012 baseline. Some utilities are continuing plans and making progress toward CPP goals. Although the CPP may be delayed or not implemented, ultimately some states and utilities will make decisions based on the carbon impacts of the power sector. The following EPA data represent the best available information on potential state-by-state carbon reductions; however, it is likely that final targets, if any, will be determined in the future.
Table 3. Clean Power Plan Rate-Based Targets for States Served by the Four Corners Wind Resource Center
2012 Rate-Based Baseline (lbs CO2/MWh)21
2022 Rate-Based Target (lbs CO2/MWh)
2030 Rate-Based Target (lbs CO2/MWh)
Final Emission Rate Reduction % (2030)
Arizona 1,552 1,263 1,031 34%
Colorado 1,973 1,476 1,174 40% Nevada 1,102 1,001 855 22% New Mexico 1,798 1,435 1,146 36% Utah 1,874 1,483 1,179 37%
Sources: EPA, Center for Climate and Energy Solutions
21 The rate-based approach is based on pounds of carbon dioxide emitted per megawatt-hour of generation; the mass-based approach is based on tons of carbon dioxide emitted per time period. See http://cdn.bipartisanpolicy.org/wp-content/uploads/2015/05/Rate-v-Mass.pdf for more information.

9
This report is available at no cost from the National Renewable Energy Laboratory at www.nrel.gov/publications
The Union of Concerned Scientists (UCS) performed an analysis of each state and its relative achievement of the CPP reduction targets under business-as-usual operations.22 Table 4 shows each state’s achievement of the CPP goals with little to no action beyond planned activities, based on UCS scenarios. Based on current trajectories and plans, states are already implementing policies and developing projects that will help them realize a lower-carbon scenario, regardless of federal policies. Of course, wind energy development contributes to this and other clean power plans.
Table 4. Clean Power Plan Targets for States Served by the Four Corners Wind Resource Center
UCS Analysis: Progress toward CPP 2022 Rate-Based Targets
UCS Analysis: Progress toward CPP 2030 Rate-Based Targets
UCS Analysis: Progress toward CPP 2022 Mass-Based Targets
UCS Analysis: Progress toward CPP 2030 Mass-Based Targets
Arizona 84% 37% 134% 49% Colorado 75% 38% 105% 48% Nevada >200% >200% >200% >200% New Mexico 127% 63% 193% 81% Utah 17% 60% 30% 78%
In Colorado, SB16-046 proposed to delay the state’s response to the Clean Power Plan (CPP). SB16-157 proposed to suspend all state agency work on the state’s implementation planning for the CPP until the stay is lifted. These bills were postponed indefinitely.
2.3 Workforce Development The region supported by the 4CWRC has a developed wind energy education infrastructure with colleges or universities active in all six states in the region. Stakeholders in Arizona and Colorado are active in wind energy workforce development and participate in DOE’s Wind for Schools Project and Collegiate Wind Competition; see each state section in this report for specifics. Also visit the WINDExchange website for information and interactive maps regarding workforce development, the DOE Collegiate Wind Competition, DOE’s Wind for Schools project, school wind project locations, and locations of education and training programs in the 4CWRC region and other states.23
22 http://www.ucsusa.org/sites/default/files/attach/2015/08/States-of-Progress-Update_State%20Tables.pdf 23 http://apps2.eere.energy.gov/wind/windexchange/schools/

10
This report is available at no cost from the National Renewable Energy Laboratory at www.nrel.gov/publications
Figure 2. Map of school wind turbine projects, educational programs, and locations with
both wind turbines and educational programs within the states served by the Four Corners Wind Resource Center
2.4 Manufacturing and Economic Development In the region supported by the 4CWRC, Nevada, New Mexico, and Utah do not have manufacturing facilities that support the wind industry. Arizona and Colorado have wind energy-related manufacturing facilities; Table 5 lists these facilities, compiled by NREL researchers as part of DOE’s annual wind market report effort (U.S. Department of Energy 2016b).
Table 5. Wind-Related Manufacturing Overview for States Served by the Four Corners Wind Resource Center
Name City State Component Cobham Slip Rings Prescott AZ Slip rings Copper State Bolt and Nut Phoenix AZ Fasteners Valley Forge Bolt and Manufacturing Phoenix AZ Fasteners Aluwind Castle Rock CO Tower internals Creative Foam Berthoud CO Blade cores O'Neal Steel Pueblo CO Tower internals PMC Technology Golden CO Hydraulics Primus Windpower Lakewood CO Distributed wind turbines SGB USA Wheat Ridge CO Electrical Vestas Brighton CO Blades Vestas Brighton CO Turbine (nacelle assembly) Vestas Pueblo CO Towers Vestas Windsor CO Blades

11
This report is available at no cost from the National Renewable Energy Laboratory at www.nrel.gov/publications
Additional economic impacts from wind development include the capital investment, jobs created, tax revenues paid, payments in lieu of taxes, and land lease payments made by wind developers during construction and the ongoing maintenance of wind plants. The American Wind Energy Association performs modeling work that identifies the impacts of all wind-related investment. Table 6 summarizes the total jobs (including construction jobs in 2015) and capital investment over time in wind farms in the region in which the 4CWRC operates. Examples of economic impacts are provided in each of the state overviews below.
Table 6. Economic Impacts of Wind Development in States Served by the Four Corners Wind Resource Center
State Direct and Indirect Jobs Supported Total Capital Investment
Arizona 501-1,000 $550 million Colorado 6,001-7,000 $5.5 billion Nevada 1-100 $290 million New Mexico 1,001-2,000 $1.8 billion Utah 101-500 $700 million
Source: American Wind Energy Association 2016a, as of 2015 2.5 Key Stakeholder Groups and Development Challenges The 4CWRC targets three stakeholder groups:
• Utility regulators, commissioners, utility representatives, and staff
• State, local, and tribal decision makers and staff
• Interested members of the public. The information provided to these stakeholder groups addresses the following wind energy development market barriers that are prevalent in this region. Each barrier is followed by a more detailed description specific to the Four Corners Region and an example of the 4CWRC’s work to address the barrier with their stakeholders.
Insufficient transmission capacity that can hinder wind growth in the region. Historical transmission capacity, built to deliver electricity from large fossil fuel power plants to load, was not designed to accommodate new wind development. In some cases, fossil fuel plants were not located in windy areas and/or the lines were not designed to have sufficient available capacity to add wind energy. Development of new wind energy projects in the region is limited without additional transmission lines and better use of existing lines.
Changes occurring in the 4CWRC region will make more transmission capacity available in the near future. This includes coal plant retirements, such as two units at the Four Corners Power Plant that will free up transmission capacity in the Four Corners Region. New transmission capacity is also being planned. The SunZia Southwest Transmission Project24 from New Mexico to Arizona received its federal permits. This transmission line 24 http://www.sunzia.net/

12
This report is available at no cost from the National Renewable Energy Laboratory at www.nrel.gov/publications
is expected to provide up to 3,000 MW of transfer capacity for wind (and solar) to Arizona with delivery possible to California. The 4CWRC hosted a number of educational webinars25 including the topic of transmission to share knowledge and lessons on the transmission expansion process as well as to share information on transmission capacity that is becoming available through coal unit retirements across the region. Information was shared regarding transmission expansion as well as how local stakeholders can shape the transmission planning process.
Lack of local wind siting ordinances or ordinances utilizing best practices. Across the West, counties are the regulatory bodies with jurisdiction over wind projects, yet they are frequently understaffed and do not have deep wind expertise.
The 4CWRC has developed close relationships with county planners and commissioners to support the development of sound wind regulatory documents (where appropriate), such as an initiative to provide wind development language to counties for use in state-required resource management plans.
Varying wind technology costs and outputs. Wind capacity factors vary across the West, and wind competes with low-cost natural gas and utility-scale solar photovoltaic power plants. Nevertheless, wind is increasingly competitive at the utility scale and continues to increase in value as a resource as technology advances and costs decline.
The 4CWRC has worked to deliver information about technological advances (through phone calls, webinars, and fact sheets) to decision makers in the region and to insert up-to-date cost information in regulatory proceedings. The 4CWRC developed state- and county-specific fact sheets26 demonstrating the increasing value of wind resources with taller towers and utilizes them in communications with regional stakeholders.
Integration challenges and costs. While the integration of renewables has necessarily increased and the level of expertise among utilities and independent system operators has also increased, there is still widespread concern about the costs and challenges of integrating variable generation. As has been proven in many states and countries, integrating 30% or 40% (or more) wind is possible and reasonable. Often the problems with integration are not technical in nature; people and institutions can be barriers.
The 4CWRC has worked with stakeholder groups and hosted webinars27 to educate on a range of wind integration topics, and the group also hosts technical resources on its website to share them with decision makers and the interested public. The 4CWRC also includes integration best-practice information as appropriate in regulatory proceedings.
Lack of clear policy direction supporting wind. There is no cohesive support for wind development articulated in policy at the federal, regional, and state levels. However, the
25 http://www.fourcornerswind.org/webinars 26 http://www.fourcornerswind.org/resources 27 http://www.fourcornerswind.org/webinars

13
This report is available at no cost from the National Renewable Energy Laboratory at www.nrel.gov/publications
extension of the federal wind Production Tax Credit (PTC) has provided much-needed certainty for wind energy economics.
The 4CWRC has worked with state and local decision makers to promote clear, science-based messages about wind energy development and its potential to deliver economic development and environmental benefits.
Misinformation and lack of public acceptance regarding wind energy. Anti-wind NIMBY28 groups are active in several states in the region and use misinformation available online to present cases against wind development when projects are in the public meeting stage of permitting.
The 4CWRC has developed close relationships with county planners and commissioners in the windy counties of the region and works with them to provide science-based, peer-reviewed research to counter unfounded arguments against wind development.
Wildlife issues. Wind development companies in western states typically perform pre-construction monitoring to determine the location of raptor nesting sites or the presence of protected wildlife, as well as the potential patterns of migrating avian and terrestrial wildlife. These pre-construction assessments can be extremely effective at identifying and helping to mitigate wildlife issues in the early stage of development. In Wyoming, the pace of wind development slowed due to issues with sage grouse habitat and potential Endangered Species Act listing of the species.
The 4CWRC works with federal and state wildlife protection agencies to determine areas of concern and to share the research resources of the American Wind Wildlife Institute.29
Challenges with development on federal land. Developing on federal land can be cumbersome due to the National Environmental Policy Act process or can be difficult in areas where wind development has not been designated as a priority (e.g., under the Bureau of Land Management’s [BLM’s] Wind Programmatic Environmental Impact Statement process30). The BLM finalized its rules for wind development31 in November 2016.
The 4CWRC worked with each of Utah’s 26 counties to encourage the inclusion of language supporting wind development on federal land in the counties’ required resource management plan documents. More information on these efforts is included in the Utah state section of this report.
2.6 Collaborating Organizations Organizations that have collaborated with the 4CWRC include Advanced Energy Economy; American Wind Energy Association; Arizona Commerce Authority; Arizona State University Energy Policy Innovation Council; Beaver County, Utah; California Independent System Operator; California Natural Resources Agency; Coconino County, 28 Not in my backyard 29 https://awwi.org/ 30 http://windeis.anl.gov/ 31 https://www.blm.gov/node/7653

14
This report is available at no cost from the National Renewable Energy Laboratory at www.nrel.gov/publications
Arizona; Colorado Energy Office; Colorado State University Center for the New Energy Economy; Distributed Wind Energy Association; Energy Imbalance Market Transitional Committee; GE Power and Water; Hopi Tribe Renewable Energy Office and Energy and Water Team of Tribal Council; Hualapai Tribe Planning Office; Iberdrola Renewables; Lawrence Berkeley National Laboratory; Lincoln County, Colorado; Navajo Nation Carbon Team and Energy Policy Implementation Task Force; New Mexico Renewable Energy Transmission Authority; NextEra Energy Resource/WindLogics; State of New Mexico Energy, Minerals and Natural Resources Department; State of Utah Office of Energy Development; Summit County Council, Utah; U.S. BLM; Utah Association of Counties and Associations of Governments; WestConnect; Western Area Power Administration; Western Grid Group; and Xcel Energy.
2.7 State Updates The following sections summarize the state of the wind energy industry in each of the states in the 4CWRC region. Note that although the 4CWRC contributes to engagement activities in Wyoming, in this report the state’s activities are listed in the Northwest Wind Resource and Action Center’s section.
2.7.1 Arizona By the end of September 2016, Arizona had 268 MW of installed wind capacity. In 2015, wind energy development accounted for $550 million of total capital investment within the state and supported 500 to 1,000 direct and indirect jobs (American Wind Energy Association 2016a).
Arizona’s Renewable Energy Standard and Tariff, or REST, is 15% by 2025, and utilities in the state are on track to comply with the standard.32 Wind energy development in Arizona slowed after the state utility RPS goals were fulfilled; contributing factors include the instability of the federal PTC; BP’s exit from renewable energy development; and the preference of many utilities, the Hualapai Tribe, Navajo Nation, and Hopi Tribe for solar development over wind. Development ceased on a number of projects that were well underway with feasibility or pre-construction studies. These include BP’s wind project (up to 500 MW), Gray Mountain (500 MW) and Big Boquillas (180 MW) on the Navajo Nation, and Hualapai (170 MW) and Hopi (100 MW) proposed projects. In addition, developers of the Sunshine Wind Project permitted for 40 MW for Foresight Renewables elected not to renew the county permit. Resource assessment is taking place in a number of counties, but there is no indication that projects will be built in the near term. It is unclear whether the federal PTC extension, combined with California’s RPS increase and Arizona Public Service’s entry into the energy imbalance market, will lead to renewed interest in Arizona wind development.
There are two major transmission projects in advanced stages of development, both of which will connect southern Arizona to renewable resources in New Mexico. The proposed SunZia Southwest Transmission Project will include 515 miles of 500-kV lines with a capacity of 3,000 MW (SunZia Southwest Transmission Project 2016). An economic 32 Arizona utilities’ annual REST compliance plans are available at http://www.azcc.gov/divisions/utilities/electric/environmental.asp

15
This report is available at no cost from the National Renewable Energy Laboratory at www.nrel.gov/publications
impact assessment prepared by The University of Arizona and New Mexico State University estimated that the SunZia project would create about 6,200 jobs during the 4-year construction period and generate state and local taxes totaling $25 million in Arizona and $65 million in New Mexico (Charney et al. 2011). The BLM and Arizona Corporation Commission approved the SunZia Project, and developers expect it to be operational by 2021. Additionally, the proposed Southline Transmission Project will extend and rebuild existing transmission lines with 367 miles of 345-kV line with a rated capacity of 1,000 MW. The BLM and Western Area Power Administration both issued records of decisions that authorize the proposal, and project developers expect to begin construction in 2017.
The 4CWRC is working with the Hopi Tribe on resource assessment activities and tribal council education on wind development steps and is supporting the Hualapai Tribe in pursuing additional wind resource assessment. RRC members also arranged meetings and briefings with Arizona Corporation Commission members to provide wind energy and transmission education.
As an example of collaborations in workforce development, Northern Arizona University (NAU) hosts the Arizona Wind for Schools project33 and also hosted an undergraduate team for the Collegiate Wind Competition for 2014, 2015, and 2016. The 2016 team took fourth place at the national competition in May 2016, which was co-located with the American Wind Energy Association’s WINDPOWER 2016 Conference & Exhibition and the National KidWind Challenge. Industry members from XZERES Corporation and Prometheus Renewable/Novakinetics advised the NAU team during the 2015-2016 year, allowing NAU students to tap the experience and expertise of seasoned industry professionals for the development of their wind turbine blades and their business and development plan. During the competition, NAU team members partnered with middle school students to participate in an impromptu “MacGyver Challenge” to build a windmill for weightlifting, and their collaborative team took first place (Figure 3). This activity was an opportunity for the university students to share their recently gained knowledge of wind turbines and general engineering design principles with younger students interested in wind industry careers.
Arizona is also participating in DOE’s Wind for Schools project.34 NAU has led the effort and the installation of 18 school systems in the state. NAU also participated in the 2014-2016 Collegiate Wind Competitions.35
33 http://nau.edu/cefns/engineering/mechanical/research-and-labs/energy/education/wind-for-schools/ 34 http://nau.edu/cefns/engineering/mechanical/research-and-labs/energy/education/wind-for-schools/ 35 http://energy.gov/eere/collegiatewindcompetition/downloads/northern-arizona-university-0

16
This report is available at no cost from the National Renewable Energy Laboratory at www.nrel.gov/publications
Figure 3. Northern Arizona University students with middle school students at the National KidWind Challenge and Collegiate Wind Competition in New Orleans in May 2016
2.7.2 Colorado The wind industry enjoys a thriving market in Colorado, with wind power providing more than 16% of the electricity generated in the state by the end of July 2016. By the end of September 2016, Colorado had 2,965 MW of utility-scale wind installed (American Wind Industry Association 2016a) and nearly 30 MW of distributed wind (U.S. Department of Energy 2016a). As of 2015, the wind industry in Colorado provided a total capital investment of $5.5 billion and supported 6,001 to 7,000 direct and indirect jobs (American Wind Industry Association 2016a). Colorado communities have long benefited from a broader tax base, which helps to pay for roads, schools, and other critical public projects.
Colorado’s RPS has helped to spur wind development in the state. The original RPS was established when Colorado voters approved Amendment 37 in 2004, and the legislature has made several adjustments over the years. Investor-owned utilities must meet a 30% by 2020 renewable standard. Legislation passed during the 2013 session increased the standard for electric co-ops serving 100,000 or more electric meters to 20% by 2020 and left the standard at 10% by 2020 for smaller co-ops and municipal utilities.
Two large wind projects totaling 399 MW were completed in Colorado in 2015. Other projects are currently in development, including Xcel Energy’s proposed $1 billion, 600-MW Rush Creek Wind Project, which would be the state’s largest wind farm. Proposed in 2016, the Rush Creek project includes a new 345-kV transmission line with additional capacity for new wind energy beyond this project. The project is the subject of an ongoing regulatory docket. If approved, the project will incorporate 300 Vestas turbines manufactured in Colorado (Xcel Energy 2016).
Continued low wind energy costs, concerns around emissions, and Public Service Company of Colorado’s ongoing improvements in integration and forecasting technology present opportunities for more Colorado wind power, spurring procurement over and above state RPS requirements. The state’s largest investor-owned utility, Public Service Company of Colorado, is on track to meet and likely exceed the 30% RPS and has been aggressive in seeking to acquire low-cost wind energy. The Colorado Public Utilities Commission

17
This report is available at no cost from the National Renewable Energy Laboratory at www.nrel.gov/publications
approved a 2011 Public Service Company of Colorado request to add 450 MW of new wind resources acquired at unprecedented low bid prices, finding that the wind energy would save ratepayers $231 million from the displacement of fuel and variable operating costs required by facilities powered by fossil fuels. Diversifying Colorado’s energy supply with wind provides long-term price stability, protecting consumers if other electricity resource prices were to suddenly increase.
Barriers to increased wind development in Colorado are primarily focused around interconnection and transmission constraints. Public Service Company of Colorado signed a memorandum of understanding with six other utilities36 to form a single regional transmission tariff, the Mountain West Transmission Group, with the potential to form or join a regional transmission energy imbalance market or existing market, which could provide additional opportunities for Colorado wind. Occasionally wind developers encounter local opposition to siting a project or associated transmission lines (e.g., the Golden West Wind Energy Center in El Paso County).
Over the past year, two Federal Energy Regulatory Commission rulings between Delta-Montrose Electric Association and Tri-State Generation and Transmission Association, Inc., allow rural electric co-ops to increase the amount of renewable energy they can purchase and provide to customers. Many co-ops are contractually obligated to purchase a certain percent of their electricity from their generation and transmission power provider. Under its contract, Delta Montrose Electric Association was required to purchase at least 95% of its power from Tri-State and was limited to owning or purchasing only 5% from other generation sources. The commission ruled that under the federal Public Utility Regulatory Policy Act, co-ops can purchase power from small renewable energy facilities within their service area, even if those purchases exceed contractual limits. This creates greater opportunity for small renewable energy developers to work with co-ops in under-served rural areas to increase the amount of clean energy available to consumers.
Colorado has been heavily engaged in wind energy education with university programs at Colorado State University and the Colorado School of Mines. These two educational institutions teamed with NREL and University of Colorado at Boulder to develop the Center for Research and Education in Wind,37 a research center under the Colorado Energy Research Collaboratory.38 The Colorado School of Mines also participated in the 2014 Collegiate Wind Competition.39 Colorado also participates in DOE’s Wind for Schools project; Colorado State University leads the effort with 13 school systems installed in the state.40 The Ecotech Institute in Aurora also hosts an extensive wind technician training program.
36 Signatories to the Mountain West Transmission Group include Public Service Company of Colorado, Western Area Power Administration, Tri-State Generation and Transmission Inc., Platte River Power Authority, Black Hills Corporation, Colorado Springs Utilities, and Basin Electric Power Cooperative. 37 http://crew.colorado.edu/ 38 http://www.coloradocollaboratory.org/ 39 http://energy.gov/eere/collegiatewindcompetition/downloads/colorado-school-mines 40 https://sites.google.com/a/rams.colostate.edu/csu-wac/services

18
This report is available at no cost from the National Renewable Energy Laboratory at www.nrel.gov/publications
Four Corners Wind Resource Center Supports New 60-MW Colorado Wind Farm, Helps Utility Reach State Goals For more than 30 years, renewable energy standards have defined the pathway for state-level energy diversification by requiring utility companies to incrementally increase energy production from renewable sources. In Colorado, the first state to initiate a renewable energy standard through a ballot initiative, a single wind project recently played a crucial role in keeping a local utility on target to meet the state’s mandated clean energy goal.
Black Hills Energy needed to substantially increase its 12% renewable generation within the state to remain on track to achieve the requirement of 30% renewable generation by 2020. As part of this effort, Black Hills issued a request for proposals (RFP) in November 2014 to acquire 60 MW of renewable generation. The utility was initially denied approval by the Colorado Public Utility Commission (PUC) members as they deemed that the proposals, including the potential acquisition of a 60-MW wind project in southern Colorado, were not cost-effective solutions. The PUC preferred that the utility purchase renewable energy credits to make up the deficit.
Following the PUC’s decision, the 4CWRC provided statements of support and filed public comments with the PUC pertaining to how the initial proposal was in fact a cost-effective implementation within the state’s renewable energy standard. Filed through Interwest Energy Alliance, a 4CWRC partner, these comments highlighted the long-term benefits of renewable energy production, the price stability brought by utility-owned renewable projects, the risks associated with renewable energy standard compliance in the short term through purchase of stand-alone renewable energy credits, and the benefits that would be unrealized if federal tax incentives were not acquired through a near-term wind acquisition. After considering the public comments and filings, the PUC announced it would allow Black Hills to re-file the previous bids once they were updated in terms of price and timing.
The PUC approved the previously denied 60-MW wind project on November 2, 2015. Known as the Peak View Wind Project, the development came online November 7, 2016, resulting in the utility achieving a total of 18% renewable generation. In addition to keeping Blacks Hills on the path of compliance with state renewable energy standards, the project provided economic benefits in Las Animas and Huerfano Counties during the construction period, and these benefits will continue for the foreseeable future. Peak View supported 100 jobs and provided a monetary boost to the community as workers filled hotel rooms and frequented local establishments while the project was under construction. Customers are expected to save more than $37 million during the first 20 years of operation, and the project will support five to 10 permanent positions throughout its lifetime.
Home to approximately 6,500 people, Huerfano County has 24 of the project’s 35 turbines within its borders. County Administrator John Galusha expects the Peak View Wind Project will add $80,000 in annual tax revenue to Huerfano County’s general fund throughout the 20-year project lifetime. With an annual budget of $4 million, Huerfano County welcomes the additional revenue.
“To run a county on $4 million per year is a pretty tough job, so we’ll be able to spend the money in a number of ways. We have about 100 employees, and last year was the first time we received pay increases in about 8 years,” Galusha said. “To be able to have the opportunity to maybe give additional pay increases is huge. To fix buildings that have fallen down is a pretty big deal. Park improvements could also be possible. There’s a ton of things we can spend that money on.”

19
This report is available at no cost from the National Renewable Energy Laboratory at www.nrel.gov/publications
2.7.3 Nevada Nevada’s first (and only) utility-scale wind project, Spring Valley, came online in 2012 near Ely. Spring Valley is a 152-MW project with total capital investment of approximately $290 million, providing 0.8% of the state’s electricity consumption and supporting between 1 and 100 direct and indirect jobs (American Wind Industry Association 2016a). While wind developers remain interested in Nevada, no wind projects are under construction there, and wind energy developers continue to face competition from the state’s strong solar and geothermal resources. However, NV Energy’s recent announcement that it plans to join the regional energy imbalance market, combined with California’s RPS increase, could help to create additional opportunities for Nevada wind power throughout the region.
The state still faces many hurdles regarding the wildlife impacts or perceived potential impacts associated with wind energy. Concerns include golden eagles, Mexican free-tailed bats, and desert tortoises. These hurdles have resulted in project delays and increased measures to reduce impacts from Spring Valley. An additional challenge related to the expansion of wind energy in Nevada pertains to siting issues on or near federal lands (which comprise 81.1% of Nevada’s total acreage). Although next-generation low-wind-speed technologies allow wind energy to be cost effectively deployed in locations with lower wind resources, the combination of fewer high-resource areas and the abundance of federal land complicate Nevada wind development. Figure 4 shows the U.S. wind resource at 80 meters overlaid with federal land.
Figure 4. Wind resource at 80 meters overlaid with federal lands

20
This report is available at no cost from the National Renewable Energy Laboratory at www.nrel.gov/publications
A number of major proposed transmission lines would deliver renewable electricity from states with high wind resources to Nevada and California. The proposed TransWest Express Transmission Project would construct more than 700 miles of 600-kV DC line with 3,000 MW of capacity to carry electricity from Wyoming to southern Nevada. The transmission line is part of the proposed 1,000-turbine Chokecherry and Sierra Madre Wind Energy Project,41 both of which are in advanced stages of development in Wyoming. The TransWest proposal has been in development since 2007; it passed major hurdles when the BLM published the Final Environmental Impact Statement in May 2015 and approved the project in December 2016. Developers hope to begin construction between 2017 and 2019 (TransWest Express 2016). This project does not create “on-ramps” for Nevada wind energy development to deliver power elsewhere, but it would deliver power to Nevada load and trading hubs. It is not clear what impacts these transmission projects would have on Nevada’s local wind market, but the role of geographic diversity to help defer variability concerns may support more local wind development.
2.7.4 New Mexico New Mexico is home to 1,112 MW of installed wind capacity, generating more than 9% of New Mexico’s electricity as of September 2016. To date, wind energy development in New Mexico has created $1.8 billion of total capital investment and supported between 1,000 and 2,000 direct and indirect jobs (American Wind Energy Association 2016a). Five wind farms are currently under construction in the state as of September 2016, totaling 920 MW (American Wind Energy Association 2016b).
State utilities are on track to meet a 20% by 2020 RPS for investor-owned utilities and 10% by 2020 for rural electric co-ops. In addition to the RPS, the state’s renewable energy production tax credit (available for wind, solar, and biomass) has contributed to wind project development in the state. The New Mexico Energy, Minerals & Natural Resources Department recently commissioned an economic analysis of the state renewable energy production tax credit.42 The study indicated that between 2003 and 2012, the state expended $61.6 million on the production tax credit (of which $54.2 million was for wind projects). For these same projects and time period, the study estimates the total labor income impacts to New Mexico’s economy were $434 million and more than 9,000 jobs, with more than 80% of the impact coming from wind facilities. The study estimates an additional value of more than $400 million of avoided emissions in the state (New Mexico Energy, Minerals & Natural Resources Department 2015). The tax credit is scheduled to expire at the end of 2017 unless the legislature extends it. Efforts to extend the tax credit during the past several legislative sessions have failed, in part due to the state’s declining fiscal situation due to low oil and gas prices.
New Mexico’s relatively slow economic recovery from the global recession combined with a small, rural population present challenges for finding in-state markets for new wind development. In addition, utilities serving New Mexico customers have often selected solar PV in relatively small megawatt procurements for RPS compliance. New Mexico’s state
41 http://www.powercompanyofwyoming.com/ 42 The report is available at http://www.emnrd.state.nm.us/ECMD/CleanEnergyTaxIncentives/documents/REPTCFinalReportFeb2015.pdf

21
This report is available at no cost from the National Renewable Energy Laboratory at www.nrel.gov/publications
utilities and the Public Regulation Commission have not demonstrated a willingness to consider beyond-RPS renewable energy purchases. The stipulated agreement regarding the retirement of two coal-fired units at San Juan Generating Station, approved by the New Mexico Public Regulation Commission in December 2015, calls for modest new solar energy and no wind energy, but it paves the way for reconsideration of the future of the remaining two units in the near term (starting in 2018). Should those remaining two units retire, there could be more significant opportunities for wind energy as replacement power.
The most significant opportunities for New Mexico wind are likely in western markets beyond its borders. While there are transmission constraints for exports, several major projects are underway, including the SunZia Southwest Transmission Project, Southline, and Western Spirit. Both the SunZia and Southline projects are in advanced stages of development. The proposed SunZia Southwest Transmission Project will include 515 miles of 500-kV lines with a capacity of 3,000 MW (SunZia Southwest Transmission Project 2016). An economic impact assessment prepared by The University of Arizona and New Mexico State University estimated that the SunZia project would create about 6,200 jobs during the 4-year construction period and generate state and local taxes totaling $25 million in Arizona and $65 million in New Mexico (Charney et al. 2011). The BLM and Arizona Corporation Commission approved the SunZia Project, and developers expect it to be operational by 2021. Additionally, the proposed Southline Transmission Project will extend and rebuild existing transmission lines with 367 miles of 345-kV line with a rated capacity of 1,000 MW. The BLM and Western Area Power Administration have both issued records of decisions that authorize the proposal, and project developers expect to begin construction in 2017.
Regarding wind energy education and workforce development, the Southwest Technology Development Institute based at New Mexico State University has a long history of outreach and development work focusing on distributed wind technologies.
2.7.5 Utah As of the end of September 2016, Utah had five wind projects online with a total of 391 MW of installed capacity generating about 2% of the state’s electricity. The industry provides more than $700 million of total capital investment in the state and supports between 101 and 500 direct and indirect jobs (American Wind Energy Association 2016a).
The 62-MW Latigo Wind Park (Figure 5) came online in March 2016. The Latigo Wind Park is the largest private investment on private land in San Juan County history, and it will contribute millions in tax revenues to the rural county over the life of the project (sPower 2016).
Challenges to wind development in Utah include the state’s weak renewable energy goal of 20% by 2025,43 lack of available transmission capacity, issues siting on or near federal lands that comprise 66.5% of Utah’s total acreage (Congressional Research Service 2014),
43 Utah’s renewable energy goal is required if cost effective when taking into account risk and other factors. However, the Utah goal has not driven deployment because the utility is allowed to meet the requirement through Renewable Energy Credits (RECs) dating back to 1995; thus the requirement is already met through these old RECs.

22
This report is available at no cost from the National Renewable Energy Laboratory at www.nrel.gov/publications
lack of wind siting ordinances, developer efforts focused on solar prior to the scheduled reduction of the federal investment tax credit for solar, and integration challenges (including costs).
Figure 5. Latigo Wind Park in San Juan County, Utah. Photo from sPower
The 4CWRC is working to address many of these challenges. For instance, the 4CWRC is working with officials in each of the Utah counties to encourage the inclusion of language supporting wind development on federal land in the counties’ required resource management plan documents. Under the Federal Land Policy and Management Act,44 the inclusion of this language in the counties’ management plans has the potential to impact federal land management decisions, including the siting and development of renewable energy.
Early termination of the state renewable energy tax credit was recently suggested by the state legislature. In response, the Utah Governor’s Office of Energy Development is leading a study of the cost of the tax credit to the state, the purpose and effectiveness of the tax credit, and the extent to which the state benefits from the tax credit. This study is in the early stages of development and scoping. It is not yet clear how possible early termination of the tax credit could impact wind development.
Rocky Mountain Power (a subsidiary of PacifiCorp) is Utah’s investor-owned utility that serves the majority of the population in the state. In 2015, Rocky Mountain Power filed an application to reduce the contract term for Public Utility Regulatory Policy Act power purchase agreements with qualifying facilities from 20 to 3 years.45 Similar efforts have been made in other states (Idaho, Oregon, and Wyoming) with varying success. In Utah, the Public Service Commission declined to reduce the contract term to 3 years but instead reduced the allowable term to 15 years.
44 http://www.blm.gov/flpma/ 45 Utah Public Service Commission Docket Number 15-035-53, available at http://www.psc.utah.gov/utilities/electric/elecindx/2015/1503553indx.html

23
This report is available at no cost from the National Renewable Energy Laboratory at www.nrel.gov/publications
It is unclear how the 15-year term will impact future wind energy development in the state or whether Rocky Mountain Power will seek further reductions in the contract term.
PacifiCorp’s recent announcements that it plans to join the regional energy imbalance market and explore the possibility of joining the California Independent System Operator could help to create additional opportunities for Utah wind power and throughout the region.
4CWRC Provides Expertise, Resources for Utah Counties to Meet State Resource Management Planning Mandate
Resource management plans are important for wind power because federal land management agencies, which have jurisdiction over half of Utah’s land mass, must consider the goals and policy of local jurisdictions when making new rules. Having language in place that supports responsible wind development will enable federal agencies to more easily support wind energy development and make it a priority in areas where it may not have been considered in the past. As new technology enables the economic development of lower-wind-speed resources, this revisiting of federal priorities can support development with stable policy and provide certainty for appropriate wind development on public land in Utah.
The 4CWRC worked with officials in all 26 Utah counties for more than a year in response to the Utah State Legislature’s 2015 and revised 2016 mandates that counties publish resource management plans articulating their priorities for development on and use of federal lands in their counties. The 4CWRC developed template language regarding wind resources, technology advancements, and development that met the requirements of the legislation. 4CWRC staff contacted officials in each county in Utah and the multi-county Associations of Governments and provided the language so that officials who were unfamiliar with wind energy would have appropriate language to meet their mandate. Each of the Associations of Governments shared the template language, and officials in a number of counties have requested it.

24
This report is available at no cost from the National Renewable Energy Laboratory at www.nrel.gov/publications
3 Islanded System Region Colleagues from the Islanded Grid Resource Center (IGRC) and NREL collaborated to provide the following assessment of the state of the wind industry in this region.
Interested parties of the IGRC46 are located in Alaska, Maine, Massachusetts, Rhode Island,47 Hawaii, Guam, American Samoa, Commonwealth of the Northern Mariana Islands (CNMI), and U.S. Virgin Islands (USVI). The three main focus areas of the Regional Resource Center (RRC) are wind-diesel systems, megawatt-scale systems on islanded grids, and support for island communities in close proximity to proposed commercial-scale offshore wind and other ocean energy projects.
Although located on opposite sides of the country and not linked geographically, islanded grid communities share common challenges and opportunities for wind development. Most have small populations with limited human capacity and sub-optimal infrastructure. Transportation and distribution costs tend to be higher than in other parts of the country, exacerbating financing challenges. Many of these communities have severe climates and/or are being impacted by climate change and rising sea levels. Most rely on expensive diesel fuel (subject to volatile price swings) to generate electricity and therefore share technical difficulties associated with wind integration. Reliance on diesel fuel comes with a host of environmental concerns, including meeting emissions standards, the need for bulk fuel storage, and the potential for fuel spills. However, many of the islanded grid communities have excellent wind resources (and other renewable energy resources), with some in close proximity to proposed offshore wind projects.
Because islanded communities are often remote and geographically distant, many of these jurisdictions have not traditionally communicated with each other about progress related to wind energy implementation. Also, stakeholders from islands and islanded regions have typically had few options for technical support. These regions cannot look to wind development on large-scale grid systems as models, and with limited funding and resources, they have limited ability to perform testing and development work on their own. However, the number of resources for these communities is growing as more entities become interested in the technologies and development of remote islanded grids and microgrid systems. In addition to the IGRC, these interested entities include the United Nations’ Sustainable Energy for All initiative;48 SIDS DOCK, an energy initiative of the Alliance of Small Island States;49 the Carbon War Room's Smart Island Economies work in the Caribbean,50 now housed at the Rocky Mountain Institute;51 the U.S. Department of Energy’s (DOE’s) Energy Transition Initiative;52 the Clinton Foundation’s Islands Energy
46 http://islandedgrid.org/ 47 Maine, Massachusetts, and Rhode Island are also part of the Northeast Wind Resource Center region. 48 http://www.se4all.org/ 49 http://sidsdock.org/ 50 http://carbonwarroom.com/content/smart-island-economies 51 http://www.rmi.org/ 52 http://energy.gov/eere/technology-to-market/energy-transition-initiative

25
This report is available at no cost from the National Renewable Energy Laboratory at www.nrel.gov/publications
Program;53 and NREL’s team of experts that manages the Renewable Energy Planning and Optimization (REopt) energy planning platform.54
As wind systems continue to operate and new systems are installed, there is a growing database of lessons learned and success stories that those developing or installing new systems can turn to for information and inspiration. One success story shared widely by the IGRC is that of Kodiak Island, Alaska (Figure 6). The scenic community of 15,000 known for its bears and fishing has now been 99.7% powered by renewables since 2014, with just more than 20% of its power coming from a 9-megawatt (MW) wind project and the remainder from hydro. Large battery and flywheel systems, combined with upgraded controls of the hydro facility and flexible wind controls, allow reliable system operation. The diesel engines that once provided one-fifth of the community’s electricity are now silent except for quarterly checks to make sure they will still operate if necessary and as backup during scheduled maintenance on the wind and hydro systems. The utility’s experience is a resource for anyone wanting to learn about the technical, human, and financial challenges of adding wind to a remote grid system.
Since 2009, when the first wind turbines were installed, the utility estimates its use of wind power has eliminated the equivalent of more than 10 million gallons of diesel, savings of about $35 million, based on a diesel cost of $3.50 a gallon (Kodiak Electric Association 2016). According to the IGRC, adding wind has also reduced the utility's carbon dioxide emissions by 62 million pounds a year, while shutting down the diesel engines has lowered maintenance costs and extended the life of those engines.
Figure 6. A view of the Kodiak Electric Association wind farm in Kodiak, Alaska. Coupled with existing hydropower and a battery and flywheel system, this 9-MW wind farm has produced 99.7% of the utility's electricity since 2014. Photo courtesy of Kodiak Electric
Association
53 https://www.clintonfoundation.org/our-work/clinton-climate-initiative/programs/islands-energy-program 54 http://www.nrel.gov/tech_deployment/tools_reopt.html

26
This report is available at no cost from the National Renewable Energy Laboratory at www.nrel.gov/publications
Realizing that not every community has the benefit of large hydro resources like Kodiak, as well as strong technical knowledge and expertise, the IGRC is developing other success stories to share with its network. There are more than 25 wind-diesel hybrid systems in Alaska that are operating in communities with fewer than 1,000 people without energy storage, and the IGRC is working with the Alaska Energy Authority to develop case studies of most of those projects. Over the past 2 years, the IGRC helped these communities to connect, building a network of islanded grids to share credible information about wind power and other energy solutions. Through events such as the Island Energy Conference55 and the Islanded Grid Wind Power Workshop,56 the IGRC continues to build a strong cohort of islanded grid power system operators, technical experts, and industry partners who share effective strategies to facilitate the development of energy solutions in isolated communities from Maine to Guam.
The following section provides an overview of key wind industry statistics in the IGRC region.
Table 7. Key Statistics for the Islanded Grid Resource Center Region
Alaska
CNMI Guam Hawaii
NE Islands57
Puerto Rico USVI
Installed Wind (MW), End of 3Q1658 62 ≥.159 .005 203 4.5 125 0 Percentage of In-State Energy Production (as of July 2016)60
3% <1%
<1%
6%
n/a 2%61 0
Distributed Wind Capacity (MW)62 13 <1% .005 1 4.5 1.163 1.164 Proposed Offshore Wind Projects (MW) 0 0 0 1,200 n/a 0 0
Sources: American Wind Energy Association, NREL, U.S. DOE
3.1 Renewable Portfolio Standards Alaska does not have a Renewable Portfolio Standard (RPS). The state has a renewable energy goal to obtain 50% of its electricity from renewable energy by 2025. Hawaii enacted an RPS in 2001 and includes wind as an eligible technology in its standard, and in 2014 it became the first state in the nation to enact a 100% (by 2045) renewable energy goal. Applicable sectors are investor-owned utilities and rural electric cooperatives. Each of
55 www.islandinstitute.org/2015iec 56 www.islandedgrid.org/may-6-2016-islanded-grid-wind-power-workshop/ 57 The Northeast islands are located off New Hampshire, Maine, Massachusetts, and Rhode Island. 58 American Wind Energy Association 2016a 59 As of June 2015: http://www.nrel.gov/docs/fy15osti/64293.pdf 60 American Wind Energy Association 2016a 61 As of March 2015: http://www.nrel.gov/docs/fy15osti/62708.pdf 62 Distributed wind project installed capacity is defined as 2003-2015 cumulative capacity (DOE 2016a). 63 Combined w/ USVI 64 Combined w/ Puerto Rico

27
This report is available at no cost from the National Renewable Energy Laboratory at www.nrel.gov/publications
the U.S. Territories covered by this RRC has an RPS with the exception of the U.S. Virgin Islands and American Samoa, which have renewable targets.
Table 8. RPS Overview for States and Territories Served by the Islanded Grid Resource Center
RPS
Alaska Target: 50% of electrical generation by 2050
American Samoa Target: 50% of electrical generation by 2025 and 100% by 2040
Guam 5% of net electricity sales from renewables by 2015 and 25% of sales by 2035
Hawaii 30% of net electricity sales by 2020/100% of sales by 2045
CNMI 20% of net electricity sales by 2016.
U.S. Virgin Islands
Targets: 20% by 2015; 25% by 2020; 30% by 2025; increasing until 51% of generating capacity is derived from renewable or alternative energy
Sources: Database of State Incentives for Renewables & Efficiency, NREL
3.2 Clean Power Plan In 2015, the U.S. Environmental Protection Agency (EPA) released the final Clean Power Plan (CPP), which proposes to regulate carbon dioxide emissions from existing power plants. Some utilities are making progress toward CPP goals. Although the CPP may be delayed or not implemented, ultimately some states and utilities will make decisions based on the carbon impacts of the power sector.
Although Alaska and Hawaii had targets in the proposed rule, in its final rule the EPA stated that Alaska, Hawaii, and the two U.S. territories with affected electricity generating units (Guam and Puerto Rico) are not required to submit state plans on the schedule required by the final rule because EPA “does not possess all of the information or analytical tools needed to quantify” the best system of emission reduction for these areas. EPA stated it will “determine how to address the requirements of section 111(d) with respect to these jurisdictions at a later time” (Ramseur and McCarthy 2015).
3.3 Workforce Development Human capacity and workforce development continue to be a challenge for islanded grids because of their remote locations and small populations. In Alaska, many remote communities may only have a few people in town who each have several jobs. Many of these communities are also plagued with socioeconomic difficulties, which make it challenging to cultivate and train local talent to operate and maintain community power systems. The Renewable Energy Alaska Project (REAP) is working across the state to educate teachers about energy curricula and build a new network among those educators, vocational and technical training centers, and university programs. Called the Alaska

28
This report is available at no cost from the National Renewable Energy Laboratory at www.nrel.gov/publications
Network for Energy Education and Employment,65 the organization’s goal is to create seamless career paths for energy professionals and operators in the state. REAP is also working with a variety of other stakeholders to find ways to increase human capacity in small villages to enhance the viability of the long-term operation and maintenance of wind systems in Alaska.
Alaska’s Institute of Technology66 supports technical curricula associated with the operation and maintenance of wind energy as part of its remote power system technician training curricula, supporting wind development in remote and islanded communities. Located in Seward, Alaska, the institute is not always the right fit for technicians from very remote communities seeking training. Ideally, this type of training would take place on a more regional basis. Another entity at the center of this effort is the Power Systems Integration Laboratory67 (formerly the Alaska Wind-Diesel Wind Application Center) operated by the Alaska Center for Energy and Power at the University of Alaska Fairbanks campus. The laboratory develops and maintains research facilities that allow the testing of new technologies that could be integrated into wind-diesel systems.
The University of Alaska Fairbanks also participated in the Collegiate Wind Competition and, in collaboration with REAP, supported a state Wind for Schools effort. See the map below for the locations of other school projects. The WINDExchange website also offers information and interactive maps regarding workforce development, the DOE Collegiate Wind Competition, DOE’s Wind for Schools project, school wind project locations, and locations of education and training programs in the Islanded Grid region and other states.68
In Maine, the IGRC leveraged support from an EPA Environmental Education award to work with island schools on educational programs, including organizing field trips for the Monhegan Island School and the Islesboro Central School to visit the 100-kW wind turbine at Camden Hills Regional High School69 and the 4.5-MW Fox Islands Wind Project.70 IGRC staff also participated in the 2016 Maine Wind Blade Challenge,71 judging student designs for wind turbine blades. For more information, see the feature story in Section 5.5.
65 http://alaskarenewableenergy.org/website2016/index.php/programs/education/ak-network-for-energy-education-and-employment/ 66 https://www.avtec.edu/ 67 http://acep.uaf.edu/facilities/power-systems-integration-lab.aspx 68 http://apps2.eere.energy.gov/wind/windexchange/schools/ 69 http://www1.eere.energy.gov/wind/news_detail.html?news_id=18612 70 https://dieselislandpost.wordpress.com/2015/10/28/trip-log-vinalhaven-and-camden-hills-regional-high-school/ 71 http://mainewindbladechallenge.com/
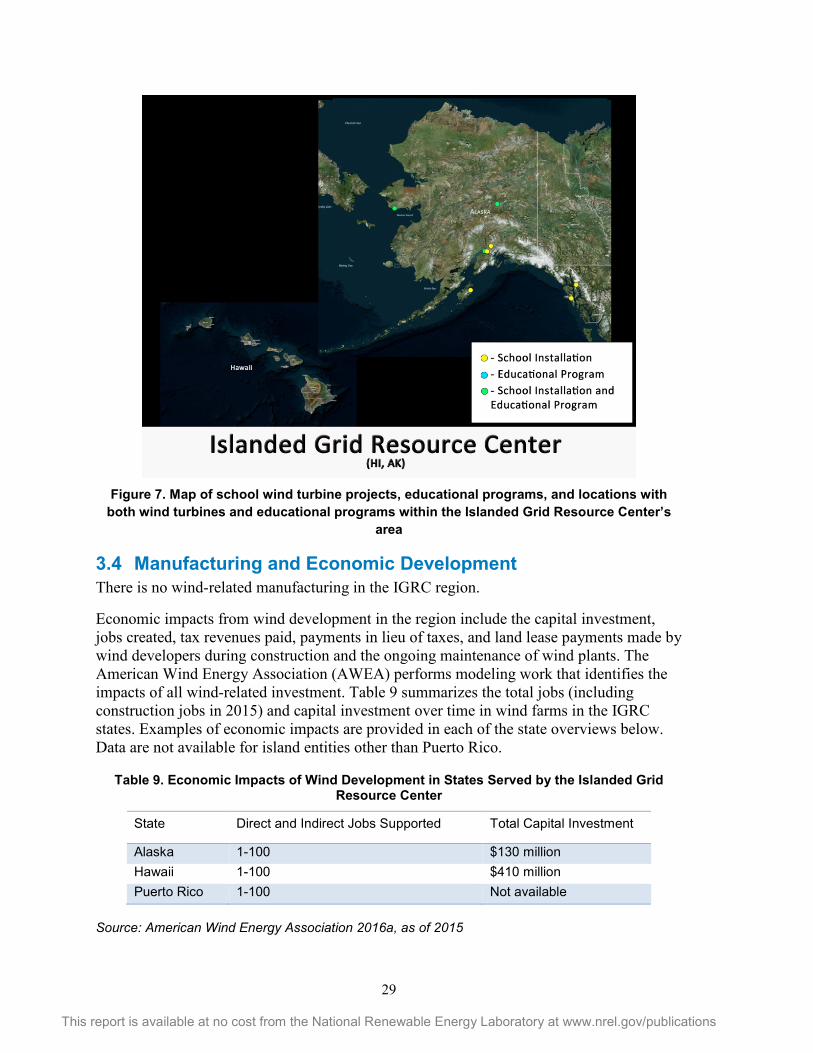
29
This report is available at no cost from the National Renewable Energy Laboratory at www.nrel.gov/publications
Figure 7. Map of school wind turbine projects, educational programs, and locations with
both wind turbines and educational programs within the Islanded Grid Resource Center’s area
3.4 Manufacturing and Economic Development There is no wind-related manufacturing in the IGRC region.
Economic impacts from wind development in the region include the capital investment, jobs created, tax revenues paid, payments in lieu of taxes, and land lease payments made by wind developers during construction and the ongoing maintenance of wind plants. The American Wind Energy Association (AWEA) performs modeling work that identifies the impacts of all wind-related investment. Table 9 summarizes the total jobs (including construction jobs in 2015) and capital investment over time in wind farms in the IGRC states. Examples of economic impacts are provided in each of the state overviews below. Data are not available for island entities other than Puerto Rico.
Table 9. Economic Impacts of Wind Development in States Served by the Islanded Grid Resource Center
State Direct and Indirect Jobs Supported Total Capital Investment
Alaska 1-100 $130 million Hawaii 1-100 $410 million Puerto Rico 1-100 Not available
Source: American Wind Energy Association 2016a, as of 2015
30
This report is available at no cost from the National Renewable Energy Laboratory at www.nrel.gov/publications
3.5 Key Stakeholder Groups and Development Challenges The IGRC targets these stakeholder groups:
• Utilities and operators of islanded power systems
• Researchers and technical experts
• Trade associations and non-profits
• Military
• Policymakers, elected and non-elected
• Manufacturers and supply chain businesses
• General public. The information provided to these stakeholder groups addresses the following wind energy development market barriers that are prevalent in this region. Each barrier is followed by a more detailed description specific to the Islanded Grid region and an example of the IGRC’s work to address the barrier with their stakeholders.
The upfront cost of deploying a sophisticated wind-diesel system in a remote area with limited technical and human capacity is steep. Since most of these grids are off the road system, transportation and mobilization costs are much higher than they are for communities in other regions on the road system. Another challenging cost driver is the small scale of the projects, with many communities having a load of less than 300 kilowatts. The systems are also quite complicated. The IGRC provides information on technical barriers, including control systems, secondary load control, and the use of energy storage.
The IGRC has worked with utility operators, policymakers, researchers, and partner affiliate organizations to promote the sharing of technical expertise and financial options through in-person contacts, meetings, events, webinars, and other means such as posting personal and project profiles on the IGRC website72 that highlight current information on islanded grid projects and allow operators and others separated by time zones and geography to connect with each other to share information about solutions and lessons learned. IGRC events such as the Island Energy Conference also address cost by connecting existing system operators (such as those in Alaska) with others outside Alaska to share information about their own projects and strategies for addressing the challenges associated with deploying renewable energy systems in remote locations. These events and the networks developed through them help to build human capacity and expertise that greatly benefit islanded grid operators. In Alaska, the IGRC also worked with legislators to reform the Power Cost Equalization program73 so that it would no longer discourage renewable power development by decreasing payments as more renewable power such as 72 www.islandedgrid.com 73 http://www.akenergyauthority.org/Programs/PCE. The program offers economic assistance to customers in rural areas of Alaska where the kilowatt-hour charge for electricity can be three to five times higher than the charge in more urban areas of the state.

31
This report is available at no cost from the National Renewable Energy Laboratory at www.nrel.gov/publications
wind is generated. This effort resulted in legislation being passed in the state legislature in 2016 that protected the corpus of the $1 billion Power Cost Equalization endowment and included provisions for excess endowment earnings to be placed in the state's Renewable Energy Fund. However, the IGRC is still engaged in efforts to ensure that grant funding of renewable projects in Alaska is consistent with the Power Cost Equalization program.
Through REAP, the IGRC is also working to build a network among K-12 energy education, related university programs, and clean energy workforce development in Alaska. In addition to its Wind for Schools and other K-12 energy education efforts, REAP recently received 3-year funding from the Office of Naval Research to launch the Alaska Network for Energy Education and Employment. Besides increasing overall energy literacy in Alaska and creating clean energy career paths for young people, a prime objective of the network is to improve and expand workforce training in Alaska that supports wind and wind-diesel applications, especially in the state's small, isolated grids.
Local utilities are hesitant to consider large-scale wind development. In the larger islanded grid markets, such as the islanded Railbelt transmission system74 in Alaska and the islanded power systems in Guam, CNMI, American Samoa, and the USVI, many of the concerns revolve around wind energy integration, but issues regarding local capacity, complicated siting challenges, and perceived or real public acceptance concerns also influence decision making. More information is provided in the following discussions. Although wind energy likely provides one of the best near-term options to significantly reduce the use of imported fuels for power generation, utilities and governments continue to defer considering wind development in place of generally smaller-scale solar projects.
In Alaska, the IGRC has worked to educate a variety of stakeholders and decision makers on the benefits of a single system operator in a region that now has six utilities operating independently in their own relatively small geography. Besides the economic benefits to consumers from region-wide economic dispatch, the IGRC points out that the expanded "balancing area" that would come with a single operator would make it much easier to integrate variable renewable energy resources like wind. The IGRC is also working to ensure that region-wide planning becomes the norm, rather than the present practice of each utility deciding on new generation independent of the decisions of the adjacent utilities that share an interconnected grid. To ensure a level playing field for wind energy, the IGRC educates decision makers on the benefits of having one, universal transmission tariff that charges the same price to move electrons across the grid, regardless of energy source. The IGRC has been working on this issue since 2014 by meeting with utility leaders, giving testimony to the state legislature, meeting with the Governor and his staff, and submitting written and oral public testimony to the Regulatory Commission of Alaska.
Since it issued findings and recommendations essentially agreeing with the IGRC on all these issues in June 2015, the Regulatory Commission of Alaska has been tracking the progress of the six Railbelt utilities to voluntarily establish a single system operator. In late 2016, those efforts were beginning to take shape as the four utilities serving Anchorage and
74 A small, isolated transmission system in Alaska that covers the main population centers of the state along the main railroad line including the Seward, the Kenai, Anchorage, Wasilla, and north to Fairbanks

32
This report is available at no cost from the National Renewable Energy Laboratory at www.nrel.gov/publications
the rest of south-central Alaska made plans to formalize a "tight power pool" among them. This new power pool will operate that portion of the Railbelt, where approximately 75% of the entire region's load is, as one, single dispatch area. By greatly expanding the balancing area in the Anchorage area, an immediate opportunity will be created to integrate more wind energy into the Railbelt. This includes the Fire Island II wind farm, proposed by local Alaska regional Native Corporation Cook Inlet Region, Incorporated (CIRI). The entity has been seeking a buyer for Fire Island II for more than 2 years.
In addition to the physical constraint on wind power that will be removed by the creation of a tight power pool and larger balancing area, the IGRC is also making progress on establishing a governance structure that will include clean energy stakeholders. As of December 2016, the expectation is that the tight power pool in the Anchorage area will expand into a system operator that will include the electric utilities in Homer and Fairbanks. In anticipation of that expansion, the utilities participating in the power pool have asked the IGRC to bring other energy stakeholders into a series of meetings with those utilities that will soon commence to discuss how a future system operator would be governed and what its functions would be. After more than 70 years of six utilities operating independently of each other, the prospect of this new development is a big step for Alaska and for the future of wind energy in the region.
Knowledge of best practices for community-developer engagement around proposed offshore wind projects is limited. New England island communities are geographically located at the forefront of the emerging offshore wind industry in the United States. As seen in land-based wind projects, the reaction of host communities to a proposed project is heavily influenced by the developer’s stakeholder engagement efforts. Many small New England island communities have little technical expertise on energy. Their economies are often based on marine resource and tourism, and members of these tightknit communities have a strong sense of independence. All of these characteristics, combined with larger seasonal populations that may only engage in local issues at certain times of the year, can create unique challenges for local leaders and utilities and offshore wind developers to navigate. Poorly implemented engagement efforts can lead to low levels of public acceptance for a project, thus creating significant barriers to development.
The IGRC has developed a strong network of New England island leaders and offshore wind developers by providing them with opportunities for in-person and peer-to-peer information exchange in their own communities. The IGRC Island Institute’s annual exchange trips and conference have created important opportunities for these stakeholders (who are actively shaping the future of offshore wind in the region) to connect and learn from each other. The Island Institute’s research into best practices for engagement, including community benefit agreements, are also enabling the IGRC to document the lessons learned in New England and elsewhere, and to then share it with a broader audience interested in offshore wind development and ocean planning via a comprehensive report and related webinars, conference presentations, and blog posts.
3.6 Collaborating Organizations Organizations that have collaborated with the IGRC include Alaska Center for Energy and Power; Alaska Congressional Delegation; Alaska Energy Authority; Alaska Federation of

33
This report is available at no cost from the National Renewable Energy Laboratory at www.nrel.gov/publications
Natives; Alaska Power and Telephone Company; Alaska Village Electric Cooperative; American Samoa Power Authority; American Wind Energy Association; Bergey Windpower; Chugach Electric Association; College of the Atlantic; Commonwealth Utilities Corporation (CNMI); Cook Inlet Region Inc.; Cuttyhunk Electric Light Association; Distributed Wind Energy Association; Endurance Wind Power; Fox Islands Electric Cooperative; Guam Power Authority; Hawaii Natural Energy Institute; HOMER Energy; Isle au Haut Electric Power Company; Kodiak Electric Association; Kotzebue Electric Association; Maine Congressional Delegation; Maine Public Utilities Commission; Marsh Creek LLC; Matinicus Plantation Electric Company; Matinicus Isle Plantation; Monhegan Plantation Power District; Naushon Trust; Navigant Consulting; Ocean Renewable Power Company; Rocky Mountain Institute; Sgurr Energy; Shoals Marine Laboratory; Solar Electric Light Fund; Star Island Corporation; State of Alaska; Swan's Island Electric Cooperative; Tanana Chiefs Conference; TechnoCentre éolien; Town of Nantucket; Town of New Shoreham; University of Alaska Anchorage Institute of Social & Economic Research; University of Maine; University of Massachusetts; U.S. Coast Guard; U.S. Virgin Islands Energy Office; U.S. Department of Agriculture Rural Development; Utility Variable-Generation Integration Group; and Vineyard Power.

34
This report is available at no cost from the National Renewable Energy Laboratory at www.nrel.gov/publications
IGRC Report Highlights Lessons Learned from Island Stakeholders on Offshore Wind Community Engagement
Community engagement and public acceptance are primary development challenges facing offshore wind projects near islands in the Northeast. The IGRC worked closely with communities and developers to identify best practices for engaging coastal and island communities around offshore wind development to ensure local impacts and benefits are considered carefully. In December 2015, the IGRC released Engaging Communities in Offshore Wind: Case Studies and Lessons Learned from New England Islands, a report that highlights key insights for designing good community engagement processes and demonstrates these best practices through case studies from Block Island (Rhode Island), Martha’s Vineyard (Massachusetts), and Monhegan (Maine).
Figure 8. The IGRC published a report detailing lessons learned from island stakeholders on
offshore wind community engagement.
The report and the webinar generated significant interest across the offshore wind space and have led to subsequent discussions with other islanded grid communities. For example, IGRC staff talked with staff from the Hawaii State Energy Office to discuss the report findings and lessons from New England that might inform community engagement efforts around three offshore wind projects proposed in Hawaii. The report was highlighted in an IGRC webinar hosted on December 15, 2015 and attended by 46 stakeholders including community leaders, islanded grid power system operators, developers, and federal and state agency staff (including those focused on offshore wind as well as ocean planning). The webinar featured insights from community members of the three islands featured in the report as well as Deepwater Wind and the Vineyard Power Cooperative.

35
This report is available at no cost from the National Renewable Energy Laboratory at www.nrel.gov/publications
3.7 State and Territory Updates 3.7.1 Alaska Alaska has two distinct markets for wind development: larger communities that are connected by the Railbelt and rural communities that are completely isolated from the state’s grid. As of September 2016, Alaska had 62 MW of installed wind capacity providing 2.6% of the state’s electricity (American Wind Energy Association 2016a). The Kodiak Island project, highlighted previously (Figure 6),75 contributes 9 MW. The wind industry provides more than $130 million of total capital investment in the state and supports fewer than 100 direct and indirect jobs (American Wind Energy Association 2016a).
Barriers to wind development in Alaska continue to be cost and technically complicated systems. The IGRC shares information on technical barriers, including control systems, secondary load control, and the use of energy storage. Other barriers include limited technical training, support, and human capacity-building for remote communities; limited financing; misalignment of the state’s Power Cost Equalization fuel subsidy and incentives to decrease diesel usage; complicated foundation technology (due to areas of permafrost); high mobilization, construction, and logistics costs; and lack of understanding of the long-term benefits and applicability of wind technology to reduce usage of imported fuel options.
In the past 2 years, the state has experienced a severe fiscal shock as the price of oil dropped precipitously and drastically reduced the state’s revenues. As a result, the Alaska Renewable Energy Fund, the state’s primary renewable energy driver, experienced major funding cuts by the state legislature. In 2016, the legislature did not appropriate any money for the fund for the first time since 2008. The Alaska Energy Authority is now leaning toward using a higher percentage of any future state funding for the high-risk feasibility and reconnaissance studies. In addition, several entities are now working to find ways to make private, alternative financing available by decreasing the risk of projects to private investors and public loan programs. Energy stakeholders are also working to reform the Power Cost Equalization program to provide incentives for communities to use less diesel by utilizing renewables and efficiency. When a bill introduced in 2016 to allocate some Power Cost Equalization money to fund long-term energy solutions for communities becomes law, a percentage of any excess earnings from the state's Power Cost Equalization Endowment will be allocated to the Renewable Energy Fund. This proposal highlights efforts to support long-term energy goals, not just provide temporary relief from high energy costs.
Several wind energy development challenges are specific to the large islanded Railbelt transmission system76 in Alaska, including the region’s six public utilities and a lack of clear regulatory policy that defines the rules of engagement between those utilities and 75 Learn more at http://islandedgrid.org/100-renewably-powered-alaskas-kodiak-island-goes-all-in-with-wind-and-hydro/ 76 A small, isolated transmission system in Alaska that covers the main population centers of the state along the main railroad line including the Seward, the Kenai, Anchorage, Wasilla, and north to Fairbanks

36
This report is available at no cost from the National Renewable Energy Laboratory at www.nrel.gov/publications
independent power producers that wish to develop wind. However, this lack of regulatory policy is being addressed. In April 2016, the Regulatory Commission of Alaska issued new regulations that redefine the calculation of avoided cost, and the commission is considering creating an independent system operator (ISO) for the region. An ISO would establish one universal transmission tariff for the region, as opposed to the "pancaking"77 tariffs that are currently allowed. Those tariffs have fouled the economics of a proposed 17.6-MW Phase II of the Fire Island Wind project owned by independent power producer Cook Inlet Region, Inc., a local Alaska Native Corporation that owns the island and sells power from Phase I to the state's largest utility. An ISO would also dispatch the Railbelt as one large balancing area, unlike the way the six sub-optimal utility service areas dispatch power today. The ISO would also be charged with regional planning for the Railbelt, something that does not occur today. The Regulatory Commission of Alaska is considering creating a transmission company for the region that would be responsible for upgrades on the relatively weak, inflexible grid and makes it more difficult to integrate variable wind power. Other challenges in the region include a dependence on natural gas-fired power that has resulted in more than enough gas-fired generation for the region being built since 2010.
As noted above, there has been significant progress in the past 12 months toward establishing an ISO in the Railbelt. Progress has also been made toward creating a private transmission company to finance needed transmission upgrades that would facilitate the ISO’s dispatch of wind power. Additionally, new regulations requiring utilities to use an incremental avoided cost methodology to determine their cost of power, which mirrors established Federal Energy Regulatory Commission requirements, will also help wind developers compete with existing natural gas-fired power. This is in contrast to the way the six utilities had calculated avoided cost for almost four decades, which allowed them to average a number of (often fully depreciated) generation resources to arrive at a target price for independent power producers. The new rules standardize the methodology for calculating cost avoidance and provide more certainty and transparency to the Railbelt market.
Alaskans are also connected to many efforts to continue optimizing wind-diesel hybrid systems, including the Arctic Remote Energy Networks Academy78 to create pan-Arctic training for small grids and a microgrid modernization effort led by four national laboratories.
3.7.2 American Samoa American Samoa, an unincorporated territory of the United States, is a group of five islands about halfway between Hawaii and New Zealand in the South Pacific Ocean. The territory’s only utility, the American Samoa Power Authority, provides electric, water, wastewater, and solid waste utility services for its 12,300 customers. American Samoa is almost completely dependent on fossil fuels for meeting its energy generation needs. In 2015, the peak load averaged about 23 MW with annual diesel generation totaling 154
77 The term “pancaking” refers to a situation in which wholesale electric customers pay each transmission owner a separate rate to “pass through.” 78 http://acep.uaf.edu/programs/arena.aspx
37
This report is available at no cost from the National Renewable Energy Laboratory at www.nrel.gov/publications
million kilowatt-hours. As of late 2015, American Samoa Power Authority obtained about 2.4% of its electricity from solar photovoltaic facilities.
A study79 conducted by AWS Truepower in 2014 and sponsored by American Samoa Power Authority identified some potential wind power sites around Tutuila, the primary island, and two 100-kilowatt turbines are slated to be installed as a pilot project. American Samoa Power Authority received a proposal for a wind power purchase agreement that will include 1 year of meteorological monitoring. The goal is to increase the total amount of wind energy deployed on Tutuila to as much as 12 MW by 2020 (Ness et al. 2016).
In 2013, the governor established the American Samoa Renewable Energy Committee, which developed a strategic energy plan and energy action plan. The plan includes a goal for the Manu’a Islands, American Samoa's easternmost group, to be 100% powered by renewables by 2016. The community is pursuing solar hybrid systems to reach this goal, and a contract has been awarded to Solar City to install a 1.41-MW photovoltaic solar system with 4.2 megawatt-hours of Tesla batteries with the goal of offsetting 85% of diesel consumption in Ta'u; construction began in December 2016.
3.7.3 Hawaii Hawaii's governor signed a law in 2015 requiring 100% of Hawaii's electricity to be generated by renewable sources by 2045, increasing the state's former renewable energy goal of 40% clean energy by 2030 (Hawaii Clean Energy Initiative 2015). The state interim goal was to have 15% of its electrical generation come from renewable energy by 2015. As of December 2015, Hawaii had already exceeded that goal, obtaining more than 21% of its electrical generation from renewable energy sources (State of Hawaii 2015).
The state has substantial renewable resources throughout the island chain and has a robust wind regime, with wind farm capacity factors exceeding those commonly found elsewhere. Utility-scale wind potential is found onshore and offshore, with the state's six commercial wind farms on Oahu, Maui, and the “Big Island” of Hawaii.
As of September 2016, Hawaii had an installed wind capacity of 203 MW, providing about 6% of the state’s electricity. The industry provides $410 million of total capital investment in the state and supports fewer than 100 direct and indirect jobs (American Wind Energy Association 2016a). One project is currently in the pipeline: the 3.3-MW Lalamilo Wells Wind Farm in South Kohala on the Big Island is nearing completion (American Wind Energy Association 2016b).
79Available at http://www.asrec.net/wp-content/uploads/2016/03/Wind-Resource-Study_2014_DRAFT_2014-10-27-4378826.pdf

38
This report is available at no cost from the National Renewable Energy Laboratory at www.nrel.gov/publications
Figure 9. Wind turbines on Oahu. Photo from Chris Hoare, Flickr
There are no offshore wind farms in Hawaii, but there are currently three proposals for offshore wind development. A.W. Hawaii Wind, a Texas company that is a subsidiary of Denmark-based Alpha Wind Energy, is proposing two offshore floating wind farms, each generating about 400 megawatts of energy with 50 turbines. One is proposed for the northwest side of Oahu, 12 miles off the coast of Kaena Point. The other proposed wind farm would be sited in waters 17 miles south of Diamond Head, also off Oahu. A second company, Progression Hawaii Offshore Wind, is also proposing a 400-MW wind farm using 40 to 50 floating turbines off Oahu's South Shore.
To analyze the employment and economic potential for floating offshore wind off Hawaii’s coasts, the Bureau of Ocean Energy Management commissioned the National Renewable Energy Laboratory (NREL) to analyze two hypothetical deployment scenarios for Hawaii: 400 MW of offshore wind by 2050 and 800 MW of offshore wind by 2050. Results show total state gross domestic product (GDP) impacts of $348 million in the 800-MW scenario or $203 million in the 400-MW scenario for the construction phases; and $993 million in the 800-MW deployment or $539 million in the 400-MW project for the operations phases (Jimenez et al. 2016a).
Hurdles to wind development in Hawaii include endangered avian and plant species that can complicate the siting and development of wind projects in Hawaii’s unique environments and U.S. military operations. Visual impacts can also be of concern, given the limited sites suitable for wind development in Hawaii. Potential impacts to military operations also pose a significant barrier to offshore development. The Hawaii Clean Energy Programmatic Environmental Impact Study released in September 2015 catalogued the various environmental impacts of both onshore and offshore utility-scale wind as well as other renewable energy technologies.80
80 http://energy.hawaii.gov/wp-content/uploads/2015/09/Final-PEIS-Summary_Sept2015.pdf

39
This report is available at no cost from the National Renewable Energy Laboratory at www.nrel.gov/publications
3.7.4 Guam Guam, the largest island in Micronesia, is located in the Pacific Ocean about three-fourths of the way from Hawaii to the Philippines. Surrounded by coral reef, Guam sits on the edge of the Mariana Trench and its Challenger Deep, the deepest known place on earth. The island’s population is estimated to be about 162,000, plus 12,000 to 14,000 military personnel and their dependents. Guam meets nearly all of its energy needs, including electricity, with petroleum products shipped in by tanker.
Guam has substantial wind potential but also unique siting issues. It is seismically active and is in the Pacific's Typhoon Alley, so wind turbines must be engineered to resist earthquakes and typhoon-force winds. Other barriers to wind development on Guam include limited land, concerns over aesthetics of wind turbines, a large amount of military land that may create issues with zoning variances, no local tax incentive, sensitive bat species, and other potential environmental impacts. Both the Navy and Guam Power Authority have conducted wind resource mapping and assessments. The Guam Power Authority installed a pilot project, a 275-kW Vergnet turbine on a tilt-up tower (Dumat-ol Daleno 2016). The turbine began supplying power to residents in early 2016 and is being used to test the viability of utility-scale wind on the island’s grid. The Guam Power Authority also deployed several grid-connected PV projects.
The Center for Island Sustainability at the University of Guam81 hosts an annual clean energy conference that brings participants from across the South Pacific to discuss the challenges and opportunities of deploying renewable energy on islanded grids.
Guam currently has a renewable energy portfolio goal that calls for 25% of net electricity sales to come from renewable energy resources by 2035.
3.7.5 Commonwealth of the Northern Mariana Islands The CNMI is a chain of 14 islands in the Pacific Ocean, located between Hawaii and the Philippines. The CNMI has three small electric grids, one on each of the three inhabited islands on the southern end of the island chain. Generating capacity is about 70 MW on Saipan, 20 MW on Tinian, and 4.5 MW on Rota. Approximately 90% of residents live on Saipan, the largest island. The total population, about 54,000 in the 2010 U.S. Census, has been shrinking. The islands meet nearly all of their energy demand through imported petroleum products, including 22 million to 24 million gallons of diesel fuel to run the islands’ five electricity-generating plants every year. The CNMI's electric system is owned and operated by Commonwealth Utilities Corporation, a public corporation of the CNMI government.
Saipan, Tinian, and Rota are believed to have prevailing wind resources suitable for commercial turbines. However, potential sites are limited because the islands are mountainous, land is scarce, and turbines may interfere with airstrip and military facilities. Initial site assessments have identified locations that could be assessed further, and researchers performed a technical assessment that details current energy consumption and
81 http://www.uog.edu/center-for-island-sustainability/center-for-island-sustainability-cis

40
This report is available at no cost from the National Renewable Energy Laboratory at www.nrel.gov/publications
production data to establish a baseline for the CNMI.82 There are also concerns about turbine impacts on several unique threatened bird species. Turbines must also be designed to withstand typhoons. In August 2015, Typhoon Soudelor struck Saipan and caused extensive damage, including to the island’s power generation and transmission infrastructure.
The CNMI's renewable portfolio standard requires 20% of net electricity sales to come from renewable energy resources by 2016 if cost-effective resources are available. So far, only small-scale wind and solar resources have been built, mostly at government and school facilities, and no assessments have been conducted to understand the costs of deploying large-scale solar or wind systems.
3.7.6 Northeast Island Communities Several New England island communities have investigated community-scale wind as a cost-effective option for reducing high, primarily diesel-based energy costs, but no wind power generation has been installed on the islands since the 4.5-MW Fox Islands Wind Project was constructed in 2009, for many of the reasons cited above.
Construction was completed on the 30-MW Deepwater Wind project off Block Island, Rhode Island, in August 2016, and the project came online in December 2016. It connects Block Island, an islanded grid, to the mainland grid, changing its grid status. The IGRC worked with Block Island community leaders and other island communities that face the potential development of large-scale offshore wind projects, sharing the lessons learned by the Monhegan Energy Task Force as it interacted with the Maine Aqua Ventus project, a one-turbine offshore wind project.
In May 2016, DOE announced that the Maine Aqua Ventus I offshore wind project (also called New England Aqua Ventus) would be considered a recipient of up to $40 million of funding, subject to progress reviews, to develop the 12-MW project proposed off Monhegan Island. The Monhegan Energy Task Force is working to inform the island community about the project and to represent it in communications with Maine Aqua Ventus. The task force is leading the community in a process to define local benefits from the project and to assess local priorities and concerns.
The Island Institute is also working to build on its existing partnership with DOE and NREL. Within DOE, the Island Institute will partner with the Energy Transition Initiative (ETI),83 a subset of the agency’s Technology to Market program that works with government entities and other stakeholders to establish a long-term energy vision and implement energy efficiency and renewable energy solutions. ETI provides a proven framework and technical resources and tools to help islands, states, and cities transition to a clean energy economy and achieve their clean energy goals. ETI programs available to the Island Institute and its partners include the Island Energy Playbook,84 a guide that any
82 http://www.nrel.gov/docs/fy11osti/50906.pdf 83 http://energy.gov/eere/technology-to-market/energy-transition-initiative 84 http://www.eere.energy.gov/islandsplaybook/

41
This report is available at no cost from the National Renewable Energy Laboratory at www.nrel.gov/publications
community can use to help successfully initiate, plan, and complete a transition to a clean energy system, as well as related tools, trainings, and technical assistance.
DOE’s ETI program also facilitated a partnership between the Island Institute and NREL’s Technology Deployment program, specifically its team of experts that manage NREL’s Renewable Energy Planning and Optimization (REopt)85 energy planning platform. REopt is being used to analyze cost-optimal paths to help Maine island communities reduce their fuel consumption and lower their energy costs through the utilization of high-contribution renewable energy systems and related measures. This type of in-depth analysis will provide insights on how to operate existing and incorporate new energy assets to reduce costs, meet energy or carbon goals, and improve resiliency. This work was featured on DOE’s Office of Energy Efficiency and Renewable Energy (EERE) blog in November 2016.86
85 http://www.nrel.gov/tech_deployment/tools_reopt.html 86 http://energy.gov/eere/articles/consider-lobster-and-electricity-helping-meet-energy-challenges-maines-small-islands
Island Institute and the IGRC Host Third Annual New England Island Energy Exchange
The Island Institute and the Islanded Grid Resource Center recently hosted the third annual New England Island Energy Exchange, bringing island energy leaders from Maine to learn from a series of well-established energy initiatives on the non-islanded grids of Martha’s Vineyard and Nantucket, Massachusetts. The exchange trip strengthened connections between the participating communities and led to many subsequent opportunities for information-sharing about islanded grid energy issues. For example, following the trip, members of the Monhegan Energy Task Force discussed strategies for engaging fishermen with the Vineyard Power Cooperative. Participants included islanded grid power system operators from Monhegan and Matinicus, as well as an operator from Isle au Haut, a community that is considering replacing its aging submarine transmission cable with a diesel-solar-storage hybrid microgrid and becoming an islanded grid. The delegation from the Maine islands visited the Nantucket Energy Office to learn about local energy initiatives including the Non-Wires Alternative project that is seeking to
avoid transmission upgrades through energy efficiency, as well as to discuss the complex local discussions about offshore wind development around the island.
Group members also visited the 100-kW wind turbine at Nantucket High School. They then traveled to Martha’s Vineyard to meet with representatives of the Vineyard Power Cooperative, a locally owned cooperative that develops local energy projects including offshore wind and solar, as well as the Martha’s Vineyard Commission, a county-level planning organization leading energy planning initiatives on the island.

42
This report is available at no cost from the National Renewable Energy Laboratory at www.nrel.gov/publications
3.7.7 U.S. Virgin Islands The U.S. Virgin Islands is a U.S. territory made up of three primary islands in the Caribbean, about 600 miles from Miami, Florida. The territory has two separate electricity grids, each with its own generation, managed by the Water and Power Authority, an independent government agency. Generating units include combustion, steam turbines, and backup diesel, all fueled by imported petroleum. The 199-MW St. Thomas system supplies nearby St. John and Water Island by underwater cable. The 122-MW St. Croix system, separated from St. Thomas by 40 miles of ocean, has its own grid. The USVI government's goal of reducing fossil fuel use 60% by 2025 has led to working with U.S. federal agencies and industry to find other energy sources. More than half of reductions are planned to come from energy efficiency, particularly in generation, transmission, street lighting, and desalination, with the balance coming from wind, solar, and biomass technologies, including waste-to-energy and landfill gas.
According to DOE’s ETI, the U.S. Virgin Islands have up to 34 MW of wind potential (National Renewable Energy Laboratory, Energy Transition Initiative 2015). There is potential for commercial wind energy resources, but finding the large sites needed for utility-scale projects on the islands has been challenging. The most promising locations for utility-scale wind projects are on high ridges and exposed capes. The Virgin Islands Water and Power Authority, in conjunction with the Virgin Islands Energy Office, completed wind studies to determine the economic feasibility of wind power development in the territory. Data collected in 2012 and 2013 at potential sites around Longford on St. Croix and the Bovoni Peninsula on St. Thomas found wind speeds suitable for large turbines that could help the U.S. Virgin Islands meet its 60% by 2025 goal. As of September 2016, the Water and Power Authority is preparing to negotiate with several Qualified Facilities proposing wind projects that were approved by the Public Services Commission pursuant to the Cogeneration and Small Power Production Act. The utility is currently creating a request for proposal for these Qualified Facilities in the near future. The size of the proposed wind farm is 7 to 10.5 MW (Joseph 2016).

43
This report is available at no cost from the National Renewable Energy Laboratory at www.nrel.gov/publications
4 Midwest Region Colleagues from the Midwest Wind Energy Center (MWEC) and the National Renewable Energy Laboratory (NREL) collaborated to provide the following assessment of the state of the wind industry in this region.
The MWEC87 serves the following states: Illinois, Indiana, Iowa, Michigan, Minnesota, Missouri, eastern Montana,88 North Dakota, Ohio, South Dakota, and Wisconsin. The MWEC’s main organizer is Windustry, along with key partners Tom Wind of Wind Utility Consulting and renewable energy consultant Dan Turner. The following section provides an overview of the wind industry in the Midwest region. The MWEC states are quite diverse from a wind development perspective. The states in the western portion of the region (Montana, the Dakotas, Iowa, and western Minnesota) have strong, world-class winds and vast rural areas (Figure 10). The states in the eastern portion of the region (Ohio, Missouri, Indiana, and Michigan) have moderate and low wind resources. Additionally, some states (Illinois, Ohio) have dense populations in some of their windiest areas and are limited in the extent of their land-based development (assuming 80-m hub heights).
Figure 10. MWEC footprint and average wind speeds at 80 meters
Six of the states in the MWEC region are in the top 15 in installed wind capacity (American Wind Energy Association 2016b), and the MWEC region is also a strong national leader in the deployment of distributed wind (Table 10).
Overall, the states in this region have vastly different energy demands, with many existing energy plants in transition. This region has historically relied heavily on central station coal and nuclear plants for most of its electricity generation. These plants are aging, and other energy sources such as wind and solar are abundant in this region.
87 http://www.midwestwindenergycenter.org/ 88 In this report, a Montana summary is provided in Section 6, which covers the Northwest region
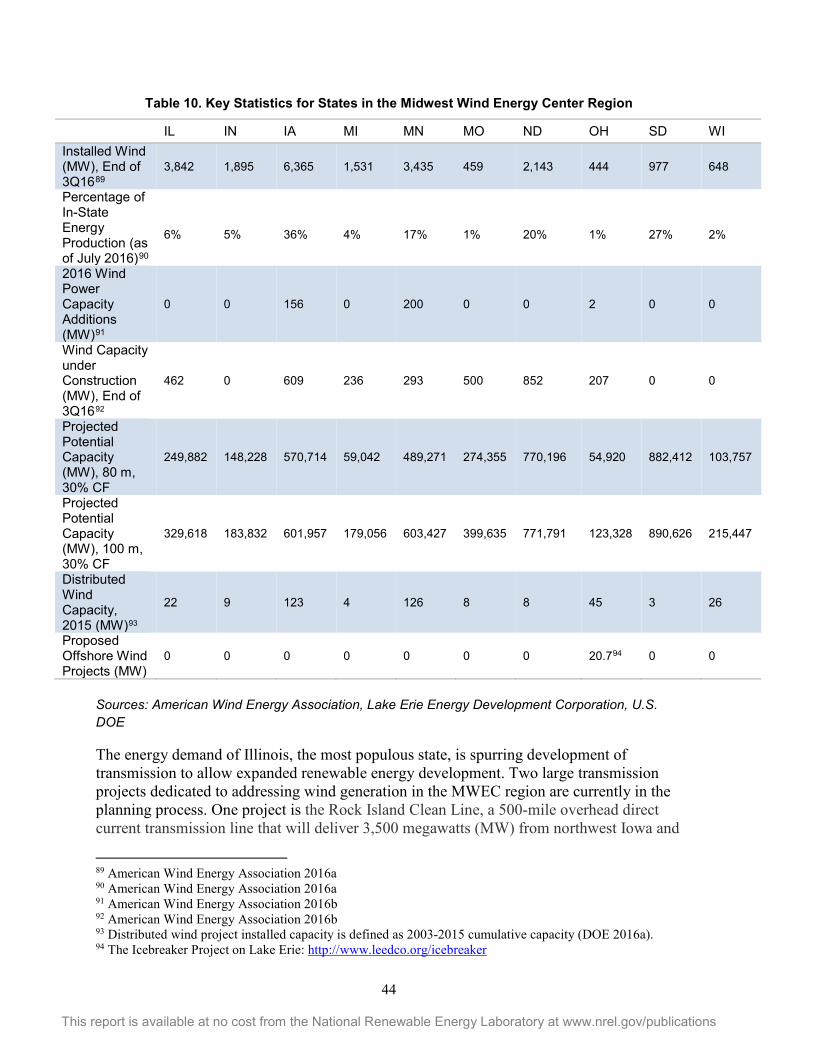
44
This report is available at no cost from the National Renewable Energy Laboratory at www.nrel.gov/publications
Table 10. Key Statistics for States in the Midwest Wind Energy Center Region
IL IN IA MI MN MO ND OH SD WI Installed Wind (MW), End of 3Q1689
3,842 1,895 6,365 1,531 3,435 459 2,143 444 977 648
Percentage of In-State Energy Production (as of July 2016)90
6%
5%
36%
4%
17%
1%
20%
1%
27%
2%
2016 Wind Power Capacity Additions (MW)91
0 0 156 0 200 0 0 2 0 0
Wind Capacity under Construction (MW), End of 3Q1692
462 0 609 236 293 500 852 207 0 0
Projected Potential Capacity (MW), 80 m, 30% CF
249,882 148,228 570,714 59,042 489,271 274,355 770,196 54,920 882,412 103,757
Projected Potential Capacity (MW), 100 m, 30% CF
329,618 183,832 601,957 179,056 603,427 399,635 771,791 123,328 890,626 215,447
Distributed Wind Capacity, 2015 (MW)93
22 9 123 4 126 8 8 45 3 26
Proposed Offshore Wind Projects (MW)
0 0 0 0 0 0 0 20.794 0 0
Sources: American Wind Energy Association, Lake Erie Energy Development Corporation, U.S. DOE
The energy demand of Illinois, the most populous state, is spurring development of transmission to allow expanded renewable energy development. Two large transmission projects dedicated to addressing wind generation in the MWEC region are currently in the planning process. One project is the Rock Island Clean Line, a 500-mile overhead direct current transmission line that will deliver 3,500 megawatts (MW) from northwest Iowa and
89 American Wind Energy Association 2016a 90 American Wind Energy Association 2016a 91 American Wind Energy Association 2016b 92 American Wind Energy Association 2016b 93 Distributed wind project installed capacity is defined as 2003-2015 cumulative capacity (DOE 2016a). 94 The Icebreaker Project on Lake Erie: http://www.leedco.org/icebreaker

45
This report is available at no cost from the National Renewable Energy Laboratory at www.nrel.gov/publications
the surrounding region to communities in Illinois and other states to the east. First proposed in 2010, Rock Island Clean Line developers worked for 6 years to secure needed regulatory approvals in Illinois. In 2014, the state’s utility regulator, the Illinois Commerce Commission, unanimously approved the project. Opposition from Commonwealth Edison and landowners groups resulted in the Third District Appellate Court reversing the approval. In September 2016, stakeholders asked the Illinois Supreme Court to take up the case (Clean Line Energy Partners 2016a). Another planned project is the Grain Belt Express Clean Line, a 750-mile direct-current transmission line that will connect the rich wind resources of Kansas to Missouri, Illinois, Indiana, and markets farther east. Developers are working to secure the final required regulatory approvals, and construction could begin as early as 2018 (Clean Line Energy Partners 2016b).
On the generation side, seven Sioux tribes in the Dakotas have launched an innovative wind development project by forming a partnership to develop wind farms on six reservations across South Dakota and North Dakota as part of a corporation, Oceti Sakowin Power Authority. The group received $400,000 in grants from private foundations and has performed some preliminary planning work with the support of the U.S. Department of Energy’s (DOE’s) Office of Indian Energy. The Oceti Sakowin Power Authority is also planning significant investments in transmission to move the wind power from the rural areas of South and North Dakota to more populous markets. Stakeholders can consult the DOE’s interactive Wind Vision Study Scenario Viewer95 to learn more about state-specific impacts from wind energy development.
4.1 Renewable Portfolio Standards In the MWEC region, eight states have a renewable portfolio standard (RPS) (Illinois, Iowa, Michigan, Minnesota, Missouri, Montana, Ohio, and Wisconsin), and three states have a renewable energy goal (Indiana, North Dakota, and South Dakota).
Table 11. RPS Overview for States Served by the Midwest Wind Energy Center
RPS Illinois 25% x 2026 Indiana Clean Energy Portfolio Goal of 10% x 2025 Iowa IOUs must contract for a total of 105 MW of renewables Michigan 10% x 2015
Minnesota
26.5% x 2025 (investor-owned utilities) 31.5% x 2020 (Xcel) 25% x 2025 (other utilities)
Missouri 15% x 2021 North Dakota Goal of 10% x 2015 Ohio 12.5% x 2026, but frozen at 2014 level of 2.5% until 2017 South Dakota Goal of 10% x 2015 Wisconsin 10% x 2015
Source: Database of State Incentives for Renewables & Efficiency
According to a recent Lawrence Berkeley National Laboratory publication (Kuckro 2016), RPSs are proving successful as 60% of renewable energy generation since 2000 is the
95 http://en.openei.org/apps/wv_viewer/

46
This report is available at no cost from the National Renewable Energy Laboratory at www.nrel.gov/publications
product of RPSs. Michigan, Montana, and Wisconsin have reached their RPS targets for 2015 (Iowa long ago surpassed its target.) Most of the other states in the region are aiming for their target goals, except for Ohio where the legislature imposed a freeze until 2017.
4.2 Clean Power Plan In 2015, the U.S. Environmental Protection Agency (EPA) released the final Clean Power Plan (CPP), which proposes to regulate carbon dioxide emissions from existing power plants. The proposed rate-based emissions targets in the original plan for each state in the region are shown in Table 12, along with the percentage of emissions reductions that the rule would require over the 2012 baseline. Some utilities are making progress toward the proposed CPP goals. Although the CPP may be delayed or not implemented, ultimately some states and utilities will make decisions based on the carbon impacts of the power sector. The following EPA data represent the best available information on potential state-by-state carbon reductions; however, it is likely that final targets, if any, will be determined in the future.
Table 12. Clean Power Plan Rate-Based Targets for States Served by the Midwest Wind Energy Center
2012 Rate-Based Baseline (lbs CO2/MWh)96
2022 Rate-Based Target (lbs CO2/MWh)
2030 Rate-Based Target (lbs CO2/MWh)
Final Emission Rate Reduction % (2030)
Illinois 2,208 1,582 1,245 44% Indiana 2,021 1,578 1,242 39% Iowa 2,195 1,638 1,283 42% Michigan 1,928 1,468 1,169 39% Minnesota 2,033 1,535 1,213 40% Missouri 2,008 1,621 1,272 37% North Dakota 2,368 1,671 1,305 45% Ohio 1,900 1,501 1,190 37% South Dakota 2,229 1,465 1,167 48% Wisconsin 1,996 1,479 1,176 41%
Sources: EPA, Center for Climate and Energy Solutions The Union of Concerned Scientists (UCS) performed an analysis of each state and its relative achievement of the CPP reduction targets under business-as-usual operations.97 Table 13 shows each state’s achievement of the CPP goals with little to no action beyond planned activities, based on UCS scenarios. Based on current trajectories and plans, states are already implementing policies and developing projects that will help them realize a lower-carbon scenario, regardless of federal policies. Of course, wind energy development contributes to this and other clean power plans.
96 The rate-based approach is based on pounds of carbon dioxide emitted per megawatt-hour of generation; the mass-based approach is based on tons of carbon dioxide emitted per time period. See http://cdn.bipartisanpolicy.org/wp-content/uploads/2015/05/Rate-v-Mass.pdf for more information. 97 http://www.ucsusa.org/sites/default/files/attach/2015/08/States-of-Progress-Update_State%20Tables.pdf

47
This report is available at no cost from the National Renewable Energy Laboratory at www.nrel.gov/publications
Table 13. Clean Power Plan Targets for States Served by the Midwest Wind Energy Center
UCS Analysis: Progress toward CPP 2022 Rate-Based Targets
UCS Analysis: Progress toward CPP 2030 Rate-Based Targets
UCS Analysis: Progress toward CPP 2022 Mass-Based Targets
UCS Analysis: Progress toward CPP 2030 Mass-Based Targets
Illinois 62% 48% 80% 58% Indiana 37% 18% 53% 22% Iowa 32% 14% 43% 17% Michigan 63% 37% 86% 46% Minnesota 169% 136% >200% 165% Missouri 64% 30% 101% 38% North Dakota 0% 0% 0% 0% Ohio 82% 44% 130% 56% South Dakota 6% 3% 9% 4% Wisconsin 55% 35% 71% 42%
4.3 Workforce Development Educating the future generations of wind energy technicians, engineers, and stakeholders plays a key role in developing the domestic wind workforce. Figure 11 shows the school installations and educational programs for wind energy in the MWEC area. Iowa Lakes Community College was one of the first in the country to offer a wind technician training program and has been providing wind energy education since 2003. Another established program in the region is Minnesota West Community and Technical College (Figure 12). Minnesota West offers the following programs: wind energy mechanic (diploma), wind energy technology (Associate of Applied Science degree), and windsmith (certificate). The University of Wisconsin Madison took part in the DOE Collegiate Wind Competition in 2016, and the University of Iowa and Iowa State University have been active members of the North American Wind Energy Academy.
Educational activities are described in more detail in the state sections below. The WINDExchange website also offers information and interactive maps regarding workforce development, DOE’s Collegiate Wind Competition, DOE’s Wind for Schools project, school wind project locations, and locations of education and training programs in the MWEC region and other states.98
98 http://apps2.eere.energy.gov/wind/windexchange/schools/

48
This report is available at no cost from the National Renewable Energy Laboratory at www.nrel.gov/publications
Figure 11. Map of school wind turbine projects, educational programs, and locations with both wind turbines and educational programs within the Midwest Wind Energy Center’s area
Figure 12. Minnesota West Technical College offers several programs that prepare students for wind energy careers. Photos courtesy of Minnesota West Technical College
4.4 Manufacturing and Economic Development Mirroring the large investments in wind deployment, the Midwest region has extensive wind manufacturing infrastructure. NREL researchers compiled the following wind energy manufacturing data for this region as part of DOE’s annual wind market report effort (U.S. Department of Energy 2016b).

49
This report is available at no cost from the National Renewable Energy Laboratory at www.nrel.gov/publications
Table 14. Wind-Related Manufacturing Overview for States Served by the Midwest Wind Energy Center
Name City State Component Brad Foote Gear Works Cicero IL Power transmission gears Siemens/Winergy Elgin IL Gear drive Centa Corp. Aurora IL Couplings Chicago Industrial Fasteners West Chicago IL Blade studs Deublin Company Waukegan IL Slip rings, hydraulic components Finkl and Sons Chicago IL Components HYDAC Glendale Heights IL Hydraulics, brake systems Randack Fasteners America Lake Zurich IL Bolts R&W America Bensenville IL Couplings SMF Minonk IL Embed rings, template rings Stanley Machining & Tool Corp. Carpentersville IL
Gear cases, torque arms, planetary carriers
Stanley Machining & Tool Corp. Hampshire IL
Gear cases, torque arms, planetary carriers
Trinity Structural Towers Clinton IL Towers Winergy Drive Systems Elgin IL Gear drive ATI Casting LaPorte IN Component castings Bedford Machine and Tool Bedford IN Rotor hubs and plates Carlisle Industrial Brakes and Friction Bloomington IN Brakes Oerlikon Fairfield Lafayette IN Gears D.A.D. Manufacturing Hiawatha IA Walkways, doors, components D.A.D. Manufacturing Lisbon IA Walkways, doors, components Goian North America Ankeny IA Elevation systems MM Composite Fort Madison IA Composite components Siemens Fort Madison IA Blades TPI Composites Newton IA Blades Trinity Structural Towers Newton IA Towers Akebono Corp. Farmington Hills MI Brakes ATI Castings Alpena MI Castings Citation Corporation Novi MI Gearbox covers and housings Creative Foam Fenton MI Blade cores Dokka Auburn Hills MI Fasteners
Dowding Industries Eaton Rapids MI Transmission housings, components
Genzink Steel Holland MI Generator frames Great Lakes Gear Technology Canton MI Gears K&M Machine Fabricating Cassopolis MI Hub and gearbox housings
Three M Tool and Machine Wixom MI Gearbox housings and forward housings
Three M Tool and Machine Commerce MI Gearbox housings and forward housings
Ventower Monroe MI Towers Columbia Gear Corporation Avon MN Gears
Millwood Metal Works Freeport MN Embed rings, template rings, forms
Remelle Engineering Big Lake MN Machine castings Rotary Systems Ramsey MN Slip rings

50
This report is available at no cost from the National Renewable Energy Laboratory at www.nrel.gov/publications
Name City State Component Ventera Wind Duluth MN Distributed wind Wind Turbine Industries Corp. Prior Lake MN Distributed wind Zero-Max Plymouth MN Couplings AZZ Inc Fulton MO Switch gears Continental Disc Corporation Liberty MO Brakes FAG Bearings Joplin MO Bearings Gasket Engineering Kansas City MO Blade components Vest-Fiber Moberly MO Components LM Wind Power Grand Forks ND Blades Trinity Structural Towers West Fargo ND Towers Advanced Manufacturing Cleveland OH Gearboxes The American Tank and Fabricating Company Cleveland OH Power transmission components The Benjamin Company Put-In-Bay OH Power transmission components Byrne Manufacturing Mansfield OH Speed increasers Canton Drop Forge Canton OH Gear blanks Cast Fab Cincinnati OH Ductile iron component castings CMC/BMC Utility Products Hamilton OH Power transmission components Dyson Corp. Painseville OH Fasteners Eaton Corp. Cleveland OH Electrical Edco Inc. Toledo OH Power transmission machining EGC Enterprises Chardon OH Fasteners Elyria Foundry Elyria OH Component castings Federal Gear Willoughby OH Gears Horsburgh and Scott Cleveland OH Gears HPM America Mount Gilead OH Hubs, bases, generator frames Industrial Nut Corporation Sandusky OH Fasteners Kalt Manufacturing North Ridgeville OH Large components Kaydon Bearing Avon OH Bearings Magna Machine Forest Park OH Rotor hubs, support bases Midwest Industrial Castings Minster OH Castings Milacron Inc Mount Orab OH Components Minster Wind Minster OH Machine castings, components Parker Hannifin Corp. Mayfield Heights OH Hydraulic components, brakes Rotek Inc. Aurora OH Slew bearings Swiger Coil Systems Cleveland OH Generators Marmen Brandon SD Towers Molded Fiber Glass Aberdeen SD Blades ABB New Berlin WI Motors, drives Applied Plastics Oak Creek WI Extrusions
Bassett Mechanical Kaukauna WI Embed rings, template rings, forms
Broadwind Manitowoc WI Towers Helwig Carbon Products Milwaukee WI Carbon brushes Ingeteam Milwaukee WI Generators
Lindquist Machine Green Bay WI Gearbox, pitch linkage, main shafts, gearbox rebuilds
MAG Giddings and Lewis Fond du Lac WI Turbine housing, gearbox, bearings
Matenaer Corporation West Bend WI Machined components Merit Gear Antigo WI Gears

51
This report is available at no cost from the National Renewable Energy Laboratory at www.nrel.gov/publications
Name City State Component Milwaukee Gear Company Milwaukee WI Gears Milwaukee Machine Works Milwaukee WI Gearbox housings Plexus Neenah WI Electronic components
Additional economic impacts from wind development include the capital investment, jobs created, tax revenues paid, payments in lieu of taxes, and land lease payments made by wind developers during construction and the ongoing maintenance of wind plants. The American Wind Energy Association performs modeling work that identifies the impacts of all wind-related investment. Table 15 summarizes the total jobs (including construction jobs in 2015) and capital investment over time in wind farms in the MWEC states. Examples of economic impacts are provided in each of the state overviews below.
Table 15. Economic Impacts of Wind Development in States Served by the Midwest Wind Energy Center
State Direct and Indirect Jobs Supported Total Capital Investment
Illinois 4,001 to 5,000 $7.7 billion Indiana 1,001 to 2,000 $4 billion Iowa 6,001 to 7,000 $11.8 billion Michigan 1,001 to 2,000 $3 billion Minnesota 2,001 to 3,000 $6 billion Missouri 501 to 1,000 $960 million North Dakota 2,001 to 3,000 $4.2 billion Ohio 1,001 to 2,000 $900 million South Dakota 1,001 to 2,000 $2 billion Wisconsin 501 to 1,000 $1.3 billion
Source: American Wind Energy Association 2016a; as of 2015 4.5 Key Stakeholder Groups and Development Challenges The MWEC focuses outreach efforts on the following stakeholder groups:
• Engaged citizens, including those impacted by existing or planned wind power projects, members of local energy committees, and community organizations supportive of or concerned about wind energy impacts
• Other stakeholders: educators, students, media, and members of the general public interested in learning more about wind energy
• Policy makers, including regulators, legislators, and administrators
• Policy implementers, including state, regional, and local regulatory/planning authorities, health department, municipal officials (e.g., planning board, economic development, etc.), siting and permitting officials and staff
• Utility representatives: municipal and investor-owned utilities
• Wind development community: developers, manufacturers, scientists.

52
This report is available at no cost from the National Renewable Energy Laboratory at www.nrel.gov/publications
The information provided to these stakeholder groups addresses the following wind energy development market barriers that are prevalent in this region. Each barrier is followed by a detailed description specific to the MWEC region and an example of the MWEC’s work to address the barrier with their stakeholders.
Insufficient transmission to tap the wind-rich resources of the region and lower the overall cost of electricity. Expanding the transmission system will also make it more robust. As discussed earlier in this section, the Rock Island Clean Line and Grain Belt Express Clean Line are in development. In addition, more wind development is underway as a result of the CapX2020 transmission expansion,99 which completes the various segments in Minnesota, North Dakota, South Dakota, and Wisconsin. This success story, in which 11 utilities serving the Upper Midwest worked collaboratively to plan, develop, build, expand, and update transmission, began in 2004 and is now close to completion. When the CapX2020 expansion started, many coal plants were proposed as part of utilities’ resource plans in the region. Now many of the proposed coal plants are uneconomic and have been removed from the dockets; many others have aged out of use, with several closings announced. Today new wind leases are being offered to farmers as the various segments of the transmission expansion are completed. Whereas this new collaborative model for the region’s energy planning was about the whole system and all types of generation, because of timing and the regulatory environment and many other factors, it is more beneficial to add additional capacity for utility-scale wind generation in parts of the Midwest. MWEC works to provide education and outreach about the transmission challenge to stakeholders in the region.
Permitting, zoning, and legislative challenges complicate proposed projects. A multitude of permitting issues can affect wind project in the MWEC region, ranging from wildlife listings as endangered or threatened, habitat, avian interaction, sound, aesthetics, and safety issues. As an example, laws and regulations for zoning of commercial wind farms from four states—Iowa, Minnesota, Nebraska, and Wisconsin—were found to be inconsistent and utilizing a patchwork of approaches (Doerr 2015), making it increasingly difficult for companies to work in this wind-rich zone. MWEC works to provide education and outreach about these challenges to stakeholders in the region.
Anti-wind groups spread misinformation and fear about wind energy projects to slow or stop developments. Public acceptance and legislative direction continue to be important throughout the region. Many states have faced legislative challenges to an existing RPS and other legislation supportive of renewables, which requires ongoing attention. Public perception is also heavily influenced by a lack of information and vocal opposition groups using information not based in science to influence local and state decision making. Negative false statements, myths, and misconception about wind energy are still repeated: wind turbines consume more power than they produce, they make people and farm animals sick, they make the grid less reliable, the electricity they produce is too expensive, etc. The general public has limited understanding about the actual impact that modern turbines have on wildlife. Local opposition is often expressed in terms of siting requirements, such as
99 http://www.capx2020.com/

53
This report is available at no cost from the National Renewable Energy Laboratory at www.nrel.gov/publications
unreasonably large setbacks or other permitting requirements. RRC members have seen these issues in Wisconsin, Minnesota, Illinois, Michigan, Indiana, and Ohio. Promoting education and awareness on the various actual vs. perceived risks for each wind project is a huge part of MWEC’s work in the region.
The general public has a poor understanding of wind energy’s economic impacts. There is also very little awareness of the positive economic impacts, in terms of jobs and value added, that wind development brings with it.
MWEC works to provide education and outreach for rural communities to consider wind energy as an opportunity to create sustainable, well-paying jobs in rural areas as well as provide an affordable renewable energy supply and well-paying jobs.
Limited financing and funding for small, community, and distributed wind. Net metering regulations continue to face challenges in several states, especially with rural electric co-ops and municipal utilities and where solar is active. The Federal Energy Regulatory Commission ruling that the generation and transmission co-ops that provide power to the nation’s retail power co-ops may not impose charges on members who purchase renewable energy makes it possible for larger distributed energy projects to move forward. The Commission made clear, in the first of two rulings, that retail co-ops are required by the Public Utility Regulatory Policies Act (PURPA) to buy power from qualifying facilities that wish to sell renewable energy to them. Their obligation under PURPA supersedes an all-requirements contract with a supplier (Uhlenhuth 2016b). The MWEC works to advance small, community, and distributed wind in the region.
Complex issues associated with wind development on Native lands. Tribal governance, federal engagement in project development, and restrictions on development complicate development efforts. The MWEC works to educate tribal stakeholders on the benefits of wind development and ways to implement it on Tribal lands.
4.6 Collaborating Organizations Organizations that have collaborated with the MWEC include American Wind Energy Association, Distributed Wind Energy Association, eFormative Options, Energy and Environmental Research Center, Great Lakes Wind Collaborative/Great Lakes Commission, Green Energy Ohio, Illinois Institute for Rural Affairs at Western Illinois University, Illinois State University, IndianaDG, Intertribal Council on Utility Policy, Iowa Economic Development Authority, Iowa Energy Center, Iowa Environmental Council, Iowa Lakes Community College, Iowa State University, Iowa Wind Energy Association, Juhl Energy, Lawrence Berkeley National Laboratory, Midwest Renewable Energy Association, Missouri Energy Initiative, Montana Department of Commerce, Navigant, North Dakota Alliance for Renewable Energy, Ohio Environmental Council, RENEW Wisconsin, Sand Creek Winds, Small Wind Certification Council, South Dakota Renewable Energy Association, South Dakota Wind Energy Association, and Wind on the Wires.

54
This report is available at no cost from the National Renewable Energy Laboratory at www.nrel.gov/publications
4.7 State Updates Due to the location of the east-west grid intertie, the MWEC covers wind energy engagement in eastern Montana while the Northwest Wind Resource and Action Center engages with stakeholders in the western part of the state. Since more of the state is covered under the western market, discussion of the Montana market is included in Section 6 of this document as part of the Northwest Wind Resource and Action Center’s reporting.
4.7.1 Illinois As of September 2016, Illinois has 3,842 MW of wind installed, equaling 6% of the state’s energy production. In 2015, the wind industry in the state provided a capital investment of nearly $7.7 billion and supported 4,001 to 5,000 direct and indirect jobs (American Wind Energy Association 2016a), with some new projects planned.
Illinois has several geographic advantages for wind. It has a strong wind resource located near urban centers and can take advantage of exporting energy to eastern markets through the PJM Interconnection. However, wind also faces competition from a strong nuclear sector.
The state has an ambitious RPS of 25% renewables by 2025. Nevertheless, financial complexities in the Illinois utility market have caused the state to be at high risk to not meet this standard. An unintended consequence of the deregulation of electric utilities in Illinois rendered the current RPS “toothless.” Therefore, addressing the RPS continues to be a top priority for the wind industry. An energy bill is possible because Exelon has a large nuclear plant in Illinois and has asked for state financial support. Compromise energy legislation has been negotiated during the past few years that may allow the RPS to be realized.
The Illinois Governor signed Senate Bill 2612 in August 2016 that extended a sunset provision in an existing law to ensure that rural communities continue to receive annual property tax revenue from wind farms. The legislation will now expire in 2021.
Illinois is also participating in the Wind for Schools project through the engagement of Western Illinois University, with seven school systems installed in the state.
Illinois did not join the lawsuit challenging the CPP; officials will continue to meet with interested stakeholders and evaluate the options.
4.7.2 Indiana Indiana has 1,895 MW of wind installed at the end of September 2016, generating about 5% of the state’s electricity. In 2015, wind energy development accounted for $4 billion of total capital investment within the state with between 1,000 to 2,000 direct and indirect jobs supported (American Wind Energy Association 2016a). Attempts to establish competitive procurement legislation have not been established.
A positive policy development for small wind occurred in Indiana on the regulatory side. Northern Indiana Public Service Co., an investor-owned utility, agreed to extend its successful voluntary feed-in tariff program, which will facilitate more small wind and renewables in northern Indiana.

55
This report is available at no cost from the National Renewable Energy Laboratory at www.nrel.gov/publications
Indiana is one of three states in the MWEC region with a modest renewable energy goal (10% by 2025) that is voluntary and thus not officially considered an RPS.
Indiana did not join the lawsuit challenging the CPP but suspended all activity that would be responsive to the CPP.
4.7.3 Iowa Iowa has 6,365 MW of wind installed at the end of September 2016 representing a capital investment of nearly $11.8 billion and supporting between 6,000 and 7,000 direct and
Wind Energy Development Means Jobs for Illinois
One of the many tasks of the RRCs is the dissemination of accurate wind energy information to regional stakeholders who are critical in state and local policy decisions. In an effort to continue and expand this portion of the engagement process, Illinois State University’s Center for Renewable Energy, an MWEC partner, featured a session dedicated to the economic benefits of wind development in Illinois during the 2016 Illinois Renewable Energy Conference. The session consisted of presentations by David Loomis, professor of economics at Illinois State University and member of MWEC’s advisory panel, and Dan Turner, principal member of MWEC. Loomis’ presentation highlighted findings from his June 2016 report, Economic Impact of Wind Farms in Illinois. According to the report’s economic analysis, the 25 largest wind farms in Illinois:
• Created approximately 20,173 full-time equivalent jobs during construction periods
• Supports approximately 869 permanent jobs in rural Illinois areas
• Supports local economies by generating $30.4 million in annual property taxes
• Generates $13.86 million annually in extra income for Illinois landowners who lease their land to wind farm developers
• Will generate a total economic benefit of $6.4 billion over the life of the projects.
Turner's presentation used NREL’s Jobs and Economic Development Impact (JEDI) model to estimate the economic impact of future wind development for Illinois that would meet the scenarios outlined in DOE’s Wind Vision report.
With more than 60 stakeholders in attendance, the session provided wind developers, local government officials, utility employees, and members of state agencies an opportunity to learn about the various jobs and economic impacts that wind development brings. After the July conference, Illinois passed the Future Energy Jobs Bill, a comprehensive bill that offers a solution to present and future energy challenges. Signed by Illinois Governor Bruce Rauner in December 2016, this legislation was influenced by the jobs case made for wind development within this MWEC activity.

56
This report is available at no cost from the National Renewable Energy Laboratory at www.nrel.gov/publications
indirect jobs (American Wind Energy Association 2016a). Iowa ranks second in the nation for installed capacity, behind Texas (American Wind Energy Association 2016b). One of the primary reasons for this high ranking is that Iowa is the headquarters of MidAmerican Energy, an investor-owned utility primarily owned by Warren Buffet, a vocal supporter of wind energy. In 2016, MidAmerican completed construction on the 154-MW Adams wind project, with the 301-MW Ida Grove and 250-MW O’Brien project under construction (American Wind Energy Association 2016b). Company officials also announced the 2,000-MW Wind XI project, which is the largest wind project ever planned in Iowa. In addition to the strong industry players, Iowa has a strong wind resource and is in a good location along the electrical grid to export electricity to eastern markets. It also enjoys high public acceptance and support from government leaders.
Iowa already produces more electricity than the state needs. The recent and future huge growth in wind capacity means that Iowa will eventually need more transmission lines to continue exporting its power. Experts predict that nearby states will purchase Iowa’s clean energy exports to use as credits to reach their own carbon emissions targets.
Iowa is home to several wind education programs, including those at Iowa State University and the University of Iowa. Iowa Lakes Community College was one of the first colleges in the country to offer a wind technician training program. The Des Moines Area Community College also has an active wind technician training program.
Iowa did not join the lawsuit challenging the CPP; stakeholders met in 2016 to develop a state plan.
MWEC Supports Iowa Energy Plan
In 2016, the MWEC participated in an effort that will help guide wind energy development in Iowa for the next decade. Known as the Iowa Energy Plan, this document establishes a clear vision, guiding principles, realistic objectives, and actionable strategies to maximize and realize Iowa’s economic potential by building on the past energy successes. Tom Wind, an MWEC partner, served on the Iowa Energy Plan’s Energy Resources Committee, one of four groups tasked with identifying the state’s current and future energy needs and options. As part of this effort, Wind provided the committee with details from DOE’s Wind Vision Report, which supported discussions about the importance of continued transmission development in Iowa and the Midwest, as well as the trajectory of the state’s current wind energy capacity comparative to DOE scenarios. The committee’s discussion about wind energy resulted in two key objectives that were included in the final report: increase utility-scale renewable energy generation in Iowa and support distributed renewable energy generation (including wind, solar, and other clean energy resources) in the state. Published in December 2016, the Iowa Energy Plan will encourage the continuation of progressive policies to encourage growth in all of Iowa’s energy sectors while emphasizing sustainable practices and economic development throughout the state, as well as supporting the research and development required to keep Iowa on the leading edge of energy innovation.

57
This report is available at no cost from the National Renewable Energy Laboratory at www.nrel.gov/publications
4.7.4 Michigan Michigan has 1,531 MW of wind installed at the end of September 2016, representing a capital investment of about $3 billion and supporting between 1,000 and 2,000 direct and indirect jobs (American Wind Energy Association 2016a). If offshore policy and technology advance, Michigan has good potential for offshore wind development. An important development in 2015 was the completion of a new high-voltage transmission line to serve the wind turbines in Michigan’s Thumb Area. ITC Transmission built this line to enable growth in the renewable energy market.
However, wind developers face obstacles in Michigan. One barrier is the uncertainty of dealing with unreceptive local governments because most zoning decisions are made at the township level. A second barrier is that the state’s RPS was challenged; although the challenge was not successful, it resulted in uncertainty in the market. Michigan met its 10% by 2015 goal and now must monitor and maintain the 10% target until it is changed or abolished; efforts are underway to abolish it and to increase it to 25% by 2025.
A recent development is the creation of the Michigan Agency for Energy by Governor Snyder via executive order. This agency will be housed under the Department of Licensing and Regulatory Affairs and will absorb the current Michigan Energy Office. A key task of the agency will be to coordinate efforts to replace the state’s coal power plants with cleaner energy sources. A pending legislative proposal for an integrated resource planning process for the state would help plan the future role of renewable energy as more of Michigan’s coal power plants are scheduled for closing.
Michigan joined the lawsuit challenging the CPP and suspended efforts to develop a state plan.
MWEC Supports Bloomfield, Iowa, in Setting Energy Independence and Net Zero Goals
Tom Wind, an Iowa-based electrical engineer and energy consultant and MWEC partner, recently completed a study of historical data for Bloomfield, Iowa, that suggests that the declining cost of renewable energy is “crossing the escalating cost of fossil fuel.” The study results are so compelling, Bloomfield’s town leaders have adopted it as a path forward and are working to achieve buy in from businesses and citizens. Funded by the Iowa Economic Development Authority and completed in late 2014, Wind’s study examined years of historical utility sales data, as well as local economic, demographic, and weather data. He developed statistics-based models for future electricity needs and projected an aggressive program for renewable energy and energy efficiency. Wind’s study presents three renewable energy scenarios: low, medium, and high intensity. Bloomfield could reduce the city's wholesale power purchases by 50%, 75%, and 100% by varying the amount of solar and wind capacity installed, and town leaders are researching potential projects that could make these projections a reality and serve as a model for other towns in the Midwest. DOE funding for the MWEC supports Wind’s continued work with the Bloomfield study, including siting, sizing, selecting, and projecting the performance and cost of potential wind turbine installations.

58
This report is available at no cost from the National Renewable Energy Laboratory at www.nrel.gov/publications
4.7.5 Minnesota Minnesota has 3,435 MW of wind installed as of September 2016 representing a capital investment of nearly $6 billion and supporting between 2,000 and 3,000 direct and indirect jobs (American Wind Energy Association 2016a). The state also has more than 125 MW of distributed wind installed (U.S. Department of Energy 2016a), which is the highest in the MWEC region. Minnesota began the 21st century as a leader in Midwestern wind, but even with several new projects planned, wind development has slowed in recent years.
Minnesota has a strong wind resource in the southwestern part of the state and enjoys relatively high public acceptance of wind energy. Although the state has enjoyed receptive leadership and policies conducive to wind development, all new energy policy updates were stalled during the 2015 and 2016 legislative sessions and clean energy advocates spent most of their time defending existing supportive policy such as Minnesota’s RPS and net metering law.
The ongoing CapX2020 transmission line project may allow increased renewable energy development in the near future. Two CapX2020 high-voltage transmission lines, the Brookings County-Hampton and Fargo-St. Cloud-Monticello lines, were energized in early 2015. The Hampton-Rochester-LaCrosse line was energized in September 2016, and the Big Stone South to Brookings County is scheduled to be energized in 2017. These two segments will complete the CapX2020 project, which is being heralded as a new model for siting and building new transmission (Monti et al. 2016).
Minnesota did not join the lawsuit challenging the CPP and continues to develop a state plan with regular stakeholder meetings.
Minnesota State Fair-Goers Learn about Wind Energy
With a primary focus on continuing and expanding general public wind energy outreach in Minnesota, the MWEC participated in the 2016 Minnesota State Fair’s Eco Experience from August 25 through September 5, hosting a wind energy exhibit throughout the event. Sixty trained volunteers at the Wind Energy Center addressed wind energy myths and misconceptions to increase public understanding and support for wind energy. Approximately 900 visitors interacted with exhibits, had conversations with volunteers, and signed postcards that stated their support of wind energy in Minnesota as new policy is being considered in the state. The postcards were delivered to Minnesota state legislators in February 2017. Attendees of the exhibit learned about net metering and distributed wind, wind energy and wildlife, sound issues, costs of wind development, micro-siting within a project, and the importance of supporting transmission for increasing the amount of large wind projects.

59
This report is available at no cost from the National Renewable Energy Laboratory at www.nrel.gov/publications
4.7.6 Missouri Missouri has 459 MW of wind installed at the end of September 2016 representing a capital investment of about $960 million and supporting between 500 and 1,000 direct and indirect jobs. One 200-MW wind project and one 300-MW wind project are under construction (American Wind Energy Association 2016b), so the installed capacity that has remained the same for several years will get a boost. Missouri has a strong but underutilized wind resource in the northwestern part of the state.
Eighty-two percent of Missouri's electricity comes from coal, nearly all of it shipped from Wyoming. However, Missouri has the potential to increase its energy independence and could even create its own renewable energy export industry. The DOE Wind Vision report suggests that Missouri could vastly increase its installed wind capacity in the coming decades and could produce as much wind energy as Minnesota and the Dakotas.
New solar initiatives moving forward in Missouri may lead the way to more in-state renewable energy development. There has been no new energy legislation, but the regulatory side had a docket in progress for revising the Certificate of Convenience and Necessity rule on transmission lines. Officials for the Grain Belt Express Clean Line transmission project100 re-filed an application. The Missouri Joint Municipal Electric Utility Commission, a public power agency that serves 67 municipalities throughout Missouri, announced that a group of their municipal utility members will buy transmission service on the project, and a few independent municipalities have subsequently followed. The municipalities cited cost savings and diversifying their power portfolios as the primary reasons to participate.
The state’s RPS is 15% by 2021. The terms of Missouri’s RPS are in dispute as some utilities are taking credit for old hydro facilities, one of which is not even located within the state. Clarification is needed (Uhlenhuth 2016a).
Missouri joined the lawsuit challenging the CPP and suspended development of a state plan.
4.7.7 North Dakota North Dakota has 2,143 MW of wind capacity installed at the end of September 2016, representing a capital investment of about $4.2 billion and supporting between 2,000 and 3,000 direct and indirect jobs (American Wind Energy Association 2016a). North Dakota has been involved in several multi-state transmission projects in recent years; new projects have been aided by 2015 legislation that extended wind tax credits. A sales and use tax expired at the end of 2016. An interim study committee recommended that the legislature enact a permanent extension in 2017.
North Dakota has a very strong wind resource, but the state’s leaders have been primarily focused on the economic benefits of traditional sources of energy. The state’s renewable energy goal (10% by 2015) is voluntary and was surpassed with approximately 20% in
100 http://www.grainbeltexpresscleanline.com/site/page/location

60
This report is available at no cost from the National Renewable Energy Laboratory at www.nrel.gov/publications
2015. No new goals have been set. Wildlife impacts pertaining to sage grouse, bats, and a variety of avian species remain a concern in the state.
North Dakota joined the lawsuit challenging the CPP and suspended development of a state plan.
4.7.8 Ohio Ohio has 444 MW of wind installed at the end of September 2016, representing a capital investment of about $900 million, which is the lowest in the MWEC region. The industry also supports between 1,000 and 2,000 direct and indirect jobs (American Wind Energy Association 2016a). However, it also has more than 37 MW of distributed wind installed in 2014, which is the third highest in the region. Despite the many challenges, some wind energy development continues to move forward in the state with the 250-MW Northwest Ohio wind project. DOE continues to provide support for the six-turbine, 20-MW Icebreaker pilot project on Lake Erie. The installation will likely be the nation’s first freshwater offshore wind farm. The Lake Erie Energy Development Corporation began taking core samples in September 2015 and has performed extensive resource assessment and engineering analysis work for the project (Funk 2015).
Ohio has a strong manufacturing sector, which can produce many renewable energy jobs, and it could host offshore wind projects if current technology improves. However, the state’s leadership has discouraged new wind developments through public policy. In 2014, Ohio became the first state in the nation to place a 2-year freeze on its RPS and energy efficiency standards. It also drastically increased setback requirements for large wind turbines. While these changes are in effect, they make it nearly impossible for developers to build any new wind farms in Ohio. Further legislative efforts in 2016 focused on extending the freeze and further weakening the state RPS by making changes to clean-energy standards that have been in place since 2008.
Case Western Reserve University in Cleveland has developed a strong offshore wind education collaborative with the Lake Erie Energy Development Corporation offshore wind project.
Ohio joined the lawsuit challenging the CPP and halted development of a state plan.
4.7.9 South Dakota Although South Dakota has only 977 MW of wind installed at the end of September 2016, representing a capital investment of about $2 billion and supporting between 1,000 and 2,000 direct and indirect jobs (American Wind Energy Association 2016a), the state has a very strong wind resource that has been developed without extensive state policy legislation: it is the only state in the region without a net metering policy, and the state did not meet its voluntary renewable energy goal (10% by 2015). South Dakota has an uncompetitive tax rate on wind compared to surrounding states, but tax rates were adjusted in a new bill passed in 2015. This bill reduced state taxes on wind to the levels of neighbors North Dakota and Minnesota to be more competitive. While not much is happening at the state legislature to support wind development, wind developers have South Dakota land

61
This report is available at no cost from the National Renewable Energy Laboratory at www.nrel.gov/publications
under wind easements; however, the in-state market is not growing, and transmission would be required for export.
As described earlier, a significant project is in the planning stages in South Dakota involving a partnership of Native American tribes. Seven Sioux tribes plan to jointly develop their wind resources. The resulting enterprise has the potential to become one of the largest utility-grade wind installations in the country, generating more than a gigawatt of power and building transmission to sell the power to distant markets. The project can provide economic self-sufficiency and political self-determination for the tribes, which occupy some of the poorest counties in the United States.
South Dakota participates in DOE’s Wind for Schools project, with South Dakota State University helping to install six school systems in the state.
South Dakota joined the lawsuit challenging the CPP and stopped development of a state plan.
4.7.10 Wisconsin Representing a capital investment of about $1.3 billion, Wisconsin has 648 MW of wind installed at the end of September 2016 with no projects under construction. The industry in the state supports between 500 and 1,000 direct and indirect jobs (American Wind Energy Association 2016a). Coal is the state’s main source of energy, and there are plans to increase it. Wisconsin met its RPS of 10% by 2015.
Two commercial-scale wind projects are in various planning phases. The 98-MW Quilt Block project in Lafayette County is fully permitted with a contract to sell power to Dairyland Electric. Dairyland’s CEO is pursuing wind development to diversify generation resources. In June 2016, Wisconsin Public Power Inc. (a municipal association) issued a request for proposals for 100 MW of renewable generation with a preference for it to be built in Wisconsin. The contract was scheduled to be awarded in 2016, but as of December no announcement had been made. These two projects arrive at the end of a 5-year period of no new wind activity, mostly due to public acceptance issues and politics (WPPI Energy 2016). The Wisconsin Focus on Energy program historically supported small and distributed wind projects but has been revised with new state leadership. Current funding is allocated for digesters and broadband with no incentives for wind.
Although the state has strong laws on wind siting and is well positioned for transmission to load centers, it suffers from weak public acceptance. Individual counties have even defied state regulations on siting. In 2014, Brown County declared wind turbines a health hazard. The state has dedicated public funding for a study of health issues related to wind turbines and plans to include documentation from sources that have not been peer reviewed. Concerns regarding bats and other wildlife also continue to impact development in the state. Wisconsin had a healthy small and distributed wind sector through 2012, but both markets have slowed down considerably in recent years (U.S. Department of Energy 2015a).

62
This report is available at no cost from the National Renewable Energy Laboratory at www.nrel.gov/publications
The University of Wisconsin-Madison participated in the DOE 2016 Collegiate Wind Competition.
Wisconsin joined the lawsuit challenging the CPP and suspended development of a state plan. The Governor issued an executive order prohibiting state agencies/actors from developing or promoting the development of a state plan until the expiration of the Supreme Court’s stay.

63
This report is available at no cost from the National Renewable Energy Laboratory at www.nrel.gov/publications
5 Northeast Region Colleagues from the Northeast Wind Resource Center (NWRC) and NREL collaborated to provide the following assessment of the state of the wind industry in this region.
The NWRC101 encompasses the following states: Connecticut, Maine, Massachusetts, New Hampshire, New Jersey, New York, Pennsylvania, Rhode Island, and Vermont.102 The NWRC spans offshore and land-based wind energy development at the commercial and community scale through interstate cooperation, information sharing, education, stakeholder engagement, knowledge transfer, and community dialogue. Clean Energy Group leads the offshore wind work; Sustainable Energy Advantage, LLC leads the land-based wind work; and the Maine Ocean and Wind Industry Initiative serves as a key liaison between the project and the wind industry. The NWRC is built on previous stakeholder engagement and educational activities, including the New England Wind Energy Education Project, the New England Wind Forum, and current projects such as the Offshore Wind Accelerator Project.103 The NWRC also coordinates efforts with the Island Institute, the New England lead for the Islanded Grid Resource Center, which focuses on energy issues for island communities, including the impact of offshore wind development.
The challenges and opportunities for wind energy development in the region vary from state to state. In addition, land-based wind and offshore wind face different challenges. Land-based wind’s biggest challenges across the region are public acceptance, project siting, and interconnection to the grid, while offshore wind’s major challenges include cost, infrastructure, regulatory barriers, and public acceptance. Most of the wind expansion in the region is expected to come online in the latter years of this decade, and projects that achieve permitting and financing will also be dependent on transmission expansion and energy renewable energy certificate offtake contracts.
Because of the Northeast’s demographics, population density, and land use and ownership patterns, community-scale and larger installations face unique challenges to development. More communities across the region are adopting strict zoning regulations or outright bans on land-based commercial wind installations and met towers. When doubt and uncertainty enter the debate, decision makers usually revert to the status quo (i.e., no wind project). Projects that progress beyond initial proposals are subject to potentially significant hurdles due to permitting appeals and lawsuits.
All states in the NWRC area have policies that incentivize clean energy development. Other factors contributing to the pace of wind development include transmission constraints, lack of power purchase agreements, developers’ financial challenges, and uncertain federal tax policy. The factors make siting and building projects, even appropriately located ones, progressively more challenging. Developers, some with long-term power purchase agreements, are stepping away from some proposed projects. Developments in Maine, New York, and Pennsylvania are the exceptions to this Northeast 101 http://www.northeastwindcenter.org/ 102 Island communities in coastal Maine, Massachusetts, and Rhode Island are represented by the Islanded Grid Resource Center. 103 http://www.cesa.org/projects/accelerating-offshore-wind-owap/

64
This report is available at no cost from the National Renewable Energy Laboratory at www.nrel.gov/publications
land-based wind development story. In the northern, lower-population areas of Maine, more than 1,500 MW in wind projects are in development. New York has 1,750 MW of wind, although only around 100 MW have been built since 2012. Pennsylvania, with just more than 1,300 MW of wind as of 2012 and no development since then, has less near-term development underway but also has many areas with a good wind resource and lower population density. Stakeholders can consult the U.S. Department of Energy’s (DOE’s) interactive Wind Vision Study Scenario Viewer104 to learn more about state-specific impacts from wind energy development. The high cost of offshore wind energy, a complex permitting process, and public acceptance are major barriers to offshore wind development. The Block Island Wind Farm in Rhode Island is officially America’s first offshore wind farm (Figure 13) and demonstrates that these challenges can be overcome. The following section provides an overview of the wind industry in the region.
Table 16. Key Statistics for States in the Northeast Wind Resource Center Region
CT ME MA NH NJ NY PA RI VT Installed Wind (MW), End of 3Q16105 5 656 115 185 9 1,749 1,340 21 119
Percentage of In-State Energy Production, 2015106
0% 12% .7% 2% 0% 3% 2% 0% 14%
2016 Wind Power Capacity Additions (MW)107
0 43 8 0 0 0 0 12 0
Wind Capacity under Construction (Land-Based, MW)108
0 268 0 0 0 79 40 3 30
Offshore Wind Projects Under Construction/ Permitted (MW)109
0 0 0 0 0 0 0 30 0
Projected Potential Capacity (MW), 80 m, 30% CF
27 11,251 1,028 2,135 132 25,781 3,307 47 2,949
Projected Potential Capacity (MW), 100 m, 30% CF
186 30,847 1,913 3,919 349 57,639 7,222 84 5,637
Distributed Wind Capacity (MW)110 5.5 7.7 65.5 1.7 10.9 12.4 5.9 9.3 12.1
Sources: American Wind Energy Association, U.S. DOE
104 http://en.openei.org/apps/wv_viewer/ 105 American Wind Energy Association 2016a 106 American Wind Energy Association 2016a 107 American Wind Energy Association 2016b 108 American Wind Energy Association 2016b 109 American Wind Energy Association 2016b 110 Distributed wind project installed capacity is defined as 2003-2015 cumulative capacity (U.S. Department of Energy 2016a).

65
This report is available at no cost from the National Renewable Energy Laboratory at www.nrel.gov/publications
5.1 Renewable Portfolio Standards In the NWRC's region, all nine states have a renewable portfolio standard (RPS) (Table 17). New York State finalized a Clean Energy Standard requiring public utilities to procure 50% of the state’s electricity from eligible clean energy sources by 2030 as part of Governor Cuomo’s Reforming the Energy Vision. Maine’s RPS requires 10% of generation to come from “new sources” by 2017, while 30% of generation can come from existing renewable sources. Through the 2010 Ocean Energy Act, Maine also adopted wind goals of at least 3,000 MW of installed capacity by 2020 (300 or more from offshore wind), and 8,000 MW installed capacity by 2030 (5,000 or more from offshore wind). New Jersey also has targets for offshore wind power (1,100 MW). In June 2016, Rhode Island’s Governor Raimondo signed into law an extension of the current RPS. Rhode Island’s RPS will continue until it reaches 40% by 2035, a significant increase over the previous target of 19.5% by 2019.
Installation of America’s First Offshore Wind Farm Complete Developer Deepwater Wind finished construction on America’s first offshore wind farm, the five-turbine, 30-MW Block Island Wind Farm off the coast of Rhode Island, in August 2016. In July 2015, Deepwater Wind began installing the first foundation components in the water. The foundations were transported from the Port of Providence to the offshore site, employing nearly 200 workers and dozens of crew ships and other vessels. By November, all five steel jacket foundations were fully installed 3 miles off the coast of the island. Over the winter, the turbine towers were assembled at ProvPort, where 240-foot long blades arrived from Denmark in June 2016. The subsea cable connecting the wind farm to Block Island has been installed, and the project came online in December 2016.
Figure 13. America’s first offshore wind farm under construction. Photo by Dennis Schroeder, NREL 40398
The NWRC provided outreach and information regarding the Block Island Wind Farm to its state steering committee. In addition, the NWRC highlighted the contributions of the Rhode Island Special Areas Management Plan process in engaging the public in an inclusive and efficient manner, leading to accelerated project development.

66
This report is available at no cost from the National Renewable Energy Laboratory at www.nrel.gov/publications
Table 17. RPS Overview for States Served by the Northeast Wind Resource Center
RPS Connecticut 27% x 2020 (Class I: 20%, Class I/II: 3%, Class III: 4%)
Maine 40% of net electricity sales by 2017 New RE: 10% x 2017
Massachusetts 22.1% x 2020 (Class I: 15%, Class II: 7.1%) (+1% annually after)
New Hampshire 24.8% x 2025 New RE: 15% x 2025
New Jersey 20.38% RE x 2021 + 4.1% solar x 2028
New York 50% x 2030 (as part of Clean Energy Standard) Pennsylvania 18% x 2021 (include non-renewable alternative resources) Rhode Island 40% x 2035 Vermont 55% by 2017 and 75% by 2032
Source: Database of State Incentives for Renewables & Efficiency
5.2 Clean Power Plan In 2015, the EPA released the final Clean Power Plan (CPP), which proposed to regulate carbon dioxide emissions from existing power plants. The proposed rate-based emissions targets in the original plan for each state in the region are shown in Table 18, along with the percentage of emissions reductions that the rule would require over the 2012 baseline.111 Some utilities are making progress toward the proposed CPP goals. Although the CPP may be delayed or not implemented, ultimately some states and utilities will make decisions based on the carbon impacts of the power sector. The following EPA data represent the best available information on potential state-by-state carbon reductions; however, it is likely that final targets, if any, will be determined in the future.
Table 18. Clean Power Plan Rate-Based Targets for States Served by the Northeast Wind Resource Center
2012 Rate-Based Baseline (lbs CO2/MWh)112
2022 Rate-Based Target (lbs CO2/MWh)
2030 Rate-Based Target (lbs CO2/MWh)
Final Emission Rate Reduction % (2030)
Connecticut 846 899 786 7% Maine 873 888 779 11% Massachusetts 1,003 956 824 18% New Hampshire 1,119 1,006 858 23% New Jersey 1,091 937 812 26% New York 1,140 1,095 918 20% Pennsylvania 1,682 1,359 1,095 35% Rhode Island 918 877 771 16%
Sources: EPA, Center for Climate and Energy Solutions
111 Note that the EPA did not propose a goal for Vermont. 112 The rate-based approach is based on pounds of carbon dioxide emitted per megawatt-hour of generation; the mass-based approach is based on tons of carbon dioxide emitted per time period. See http://cdn.bipartisanpolicy.org/wp-content/uploads/2015/05/Rate-v-Mass.pdf for more information.

67
This report is available at no cost from the National Renewable Energy Laboratory at www.nrel.gov/publications
The Union of Concerned Scientists (UCS) performed an analysis of each state and its relative achievement of the CPP reduction targets under business-as-usual operations.113 Table 19 shows each state’s achievement of the CPP goals with little to no action beyond planned activities, based on UCS scenarios. Based on current trajectories and plans, states are already implementing policies and developing projects that will help them realize a lower-carbon scenario, regardless of federal policies. Of course, wind energy development contributes to this and other clean power plans.
Table 19. Clean Power Plan Targets for States Served by the Northeast Wind Resource Center
UCS Analysis: Progress toward CPP 2022 Rate-Based Targets
UCS Analysis: Progress toward CPP 2030 Rate-Based Targets
UCS Analysis: Progress toward CPP 2022 Mass-Based Targets
UCS Analysis: Progress toward CPP 2030 Mass-Based Targets
Connecticut *in compliance >200% **in compliance **in compliance
Maine *in compliance 175% **in compliance **in compliance
Massachusetts >200% >200% **in compliance >200%
New Hampshire 159% 55% >200% 112%
New Jersey >200% 196% >200% >200%
New York >200% 45% **in compliance 92%
Pennsylvania 75% 30% 131% 40%
Rhode Island >200% 99% **in compliance >200% * “In compliance” reflects emissions rate reduction targets that are greater than baseline (2012) emission rates. ** “In compliance” reflects emissions targets that are greater than baseline (2012) emissions. 5.3 Regional Procurement The six New England states have been considering efforts to coordinate clean energy procurement in a way that can reach economies of scale and spur the construction of needed transmission investments. State agencies and distribution companies in Massachusetts, Connecticut, and Rhode Island issued a Clean Energy Request for Proposals in November 2015.
Under the joint solicitation, Massachusetts' distribution companies, Connecticut Department of Energy and Environmental Protection, and National Grid in Rhode Island seek to procure a combination of Class I RPS renewables, large hydro, and supporting transmission facilities under long-term contracts or Qualified Clean Energy Delivery Commitments under various existing authorities (detailed below, where relevant). Bids were submitted in January 2016; 23 responses consisted of various combinations of land-based wind, utility-scale solar, fuel cell, and large-scale hydroelectric supply, many combined with supporting transmission proposals. No offshore wind project bids were submitted.
113 http://www.ucsusa.org/sites/default/files/attach/2015/08/States-of-Progress-Update_State%20Tables.pdf

68
This report is available at no cost from the National Renewable Energy Laboratory at www.nrel.gov/publications
Many of the proposed projects are in early stages of development, which means that siting challenges, interconnection delays, and timing of delivery will be major factors in their viability to serve the needs of the procuring states as they seek to replace retiring coal and nuclear capacity. The bidder selection process is ongoing.
5.4 Regional Transmission Transmission capacity is constrained, and expanded transmission will be necessary to carry any significant future land-based wind development from the northern windy areas of the region to the load centers mostly located in the southern areas. In addition, interconnection remains a significant barrier to wind development. In ISO-New England,114 for example, there is a backlog of more than 20 large wind projects in the interconnection queue for which review has not yet started. Some projects have power purchase agreements with contractual development milestones that are threatened by the lack of movement on interconnection applications. The ISOs in New England and New York are working with stakeholders to address interconnection procedures with the goal of addressing these backlogs and delays.
Several transmission projects have been proposed, including Maine Green Line (wind from Maine/Canada to Massachusetts), Clean Power Link (wind from Canada to the Vermont/New England market), Northeast Energy Link (wind from Maine to Massachusetts), the Maine Power Express (wind from Maine to Massachusetts), and the Empire State Connector (Upstate New York to New York City). The three-state request for proposals (RFP) mentioned above also received responses from other transmission projects, of which four projects are under review, each one including wind-based generation as a portion of the transmission. Transmission projects include the Clean Energy Connect, Vermont Green Line, Maine Renewable Energy Interconnect, and Maine Clean Power Connection. Most of these projects are being proposed to carry wind and hydro power from the Quebec region.
Focusing on offshore wind development not only is creating the needed infrastructure to interconnect offshore wind farms to onshore substations potentially costly but also substations may require significant upgrades and modifications before they can accept output.
The 30-MW Block Island offshore wind farm connects directly to a new National Grid 34.5-kV substation on the island; during the island’s “off season,” a new 25-mile subsea cable also owned by National Grid will transmit the energy to the mainland electric grid. Deepwater Wind will sell the electricity through a contract to National Grid.
114 An independent, non-profit Regional Transmission Organization that serves Connecticut, Maine, Massachusetts, New Hampshire, Rhode Island, and Vermont
69
This report is available at no cost from the National Renewable Energy Laboratory at www.nrel.gov/publications
Proposed transmission lines for offshore wind within the region include the Bay State Offshore Wind Transmission System and the Atlantic Wind Connection, a proposed high-voltage offshore transmission system along the North Atlantic Coast. Key objectives of the Atlantic Wind Connection are to improve grid reliability and resiliency and to provide an efficient and cost-effective transmission of offshore wind power to onshore substations. Anbaric Transmission is the developer in charge of the Bay State Offshore Wind Transmission system. Anbaric sees the strong possibility for an offshore wind industry in Massachusetts due to a high potential wind resource off the coast and current onshore wind development challenges.
Northeast States Collaborate to Advance Regional Offshore Wind Development
A multi-state offshore wind roadmap project was featured at the September 2015 White House Summit on Offshore Wind. The multi-state project brings together Northeast states that are focused on cost reductions. Previous studies have shown that getting to scale is one of the key cost reduction drivers. Through this multi-state project, states are exploring if it is possible to get to scale as a region with cost reduction benefits and economic development opportunities for all.
Through the NWRC, the Clean Energy Group and its sister organization the Clean Energy States Alliance have worked with state agencies in the Northeast on mechanisms for reducing offshore wind barriers and developing an offshore wind market. In early 2015, the Clean Energy Group, Clean Energy States Alliance, and stakeholders from various Northeast states discussed the potential for cooperative action to develop offshore wind at scale to reduce costs. The Maine Governor’s Office, the Massachusetts Clean Energy Center, the Massachusetts Department of Energy Resources, the Rhode Island Office of Energy Resources, and the New York State Energy Research and Development Authority agreed to collaborate to develop a roadmap for speeding offshore wind development and reducing the cost of that development. The development of the regional roadmap collaboration was supported by the NWRC and the John Merck Fund. In 2015, the New York State Energy Research and Development Authority received major funding from DOE’s State Energy Program for roadmap work.
In its effort to develop a variety of policy options for regional collaboration, the multi-state group agreed that each state would evaluate its individual objectives and then the objectives of the region to scope out a near- and long-term offshore wind project pipeline on a regional scale using several penetration scenarios. State representatives agreed that they were interested in information that 1) includes baseline information on individual state activities and policies, 2) analyzes the energy needs of individual states and the region and the impacts of a larger market size on costs, and 3) explores the development of a regional supply chain. The group proposed two analytical reports: a regional market characterization report and a pipeline cost analysis report, both with solicited stakeholder feedback. The primary objective of the regional market characterization report is to develop an estimate of the potential future Northeast offshore wind market, expressed in installed capacity and associated energy production through 2030. The primary objective of the pipeline cost analysis is to analyze the impact on cost from increased competition and larger market size, and the impact on cost of capital from anticipated investors in a larger market. Both reports will provide data and analysis to inform a final regional roadmap that details policy options for states to explore.

70
This report is available at no cost from the National Renewable Energy Laboratory at www.nrel.gov/publications
5.5 Workforce Development Several institutions provide wind energy education in the region, including Pennsylvania State University, University of Massachusetts Amherst and Lowell, University of Delaware, University of Maine, Massachusetts Institute of Technology, Cornell University, and Cape Cod Community College. Educational activities are described in more detail in the state sections below. The WINDExchange website also offers information and interactive maps regarding workforce development, DOE’s Collegiate Wind Competition, DOE’s Wind for Schools project, school wind project locations, and locations of education and training programs in the NWRC region and other states.115
Figure 14. Map of school wind turbine projects, educational programs, and locations with both wind turbines and educational programs within the Northeast Wind Resource Center’s
area
115 http://apps2.eere.energy.gov/wind/windexchange/schools/

71
This report is available at no cost from the National Renewable Energy Laboratory at www.nrel.gov/publications
Maine Wind Blade Challenge and Windstorm Challenge
The Maine Composites Alliance, the Maine Ocean and Wind Industry Initiative, and the University of Maine’s Advanced Structures and Composites Center held the Maine Wind Blade Challenge and Windstorm Challenge in May 2016 at the University of Maine. The Northeast Wind Resource Center supports the Wind Blade Challenge as a way to educate Maine middle and high school students while informing the public and lawmakers about wind energy. The Maine Ocean and Wind Industry Initiative organizes the competition, in which students are tasked with designing and fabricating scale model wind blades that are then tested at the University of Maine's Advanced Structures and Composites Center and judged by representatives from wind industry companies. Each team's goal is to manufacture an assembly that will generate the most energy in 3 minutes or fewer. The Maine Wind Blade Challenge has been successfully operating for 8 years.
Figure 15. The Wind Blade Challenge 2016 winners, who will receive an internship at the UMaine Composites Center. Left to right: Maine Composites Alliance Managing Director
Steve Von Vogt, members of Bangor High School Team 1, and Bangor High School teacher John Cangelosi. Photo from the Northeast Wind Resource Center
The Windstorm Challenge engages students in floating offshore wind technology. Student teams design and build a scale-model floating wind turbine platform and deliver a sales pitch-style presentation to a panel of UMaine and industry judges. The teams' floating turbine models are tested under extreme winds and wave conditions, and the team with the most stable platform and strongest presentation is selected as the winner. This year was the fourth year of the Windstorm Challenge.
Figure 16. Windstorm Challenge 2016 winning team Falmouth High School students will
receive an internship at the UMaine Composites Center. Left to right: Falmouth High School teacher Kim Blenk, team members, and Dr. Habib Dagher, executive director of the UMaine
Advanced Structures and Composites Center. Photo from the Northeast Wind Resource Center

72
This report is available at no cost from the National Renewable Energy Laboratory at www.nrel.gov/publications
5.6 Manufacturing and Economic Development NREL researchers compiled the following wind energy manufacturing data for this region as part of DOE’s annual wind market report effort (U.S. Department of Energy 2016b).
Table 20. Wind-Related Manufacturing Overview for States Served by the Northeast Wind Resource Center
Name City State Component BJA Magnetics Rutland MA Magnetics Second Wind Somerville MA Anemometers, controllers, sensors Pika Energy Westbrook ME Distributed wind Hendrix Wire and Cable Milford NH Cable systems Mersen USA Boonton NJ Carbon brushes, sliprings Rotor Clip Company Somerset NJ Retaining rings Ioxus Oneonta NY Ultracapacitors UGE International New York NY Distributed wind Weaver Wind Energy Freeville NY Distributed wind Eickhoff Corporation Pittsburgh PA Gearbox Ellwood Group Irvine PA Main shaft bearings Hodge Foundry Greenville PA Component castings Superbolt Inc. Carnegie PA Fasteners Vacon Inc. Chambersburg PA A/C drives Windurance Seneca PA Pitch control systems Applied Bolting Technology Bellows Falls VT Bolts Northern Power Systems Barre VT Distributed wind
Additional economic impacts from wind development include the capital investment, jobs created, tax revenues paid, payments in lieu of taxes, and land lease payments made by wind developers during construction and the ongoing maintenance of wind plants. The American Wind Energy Association performs modeling work that identifies the impacts of all wind-related investment. Table 21 summarizes the total jobs (including construction jobs in 2015) and capital investment over time in wind farms in the NWRC states. Examples of economic impacts are provided in each of the state overviews below.
Table 21. Economic Impacts of Wind Development in States Served by the Northeast Wind Resource Center
State 2015 Direct and Indirect Jobs Supported
Total Capital Investment
Connecticut 1-100 $9 million Maine 1,001-2,000 $1.2 billion Massachusetts 101-500 $220 million New Hampshire 101-500 $380 million New Jersey 101-500 $10 million New York 1,001-2,000 $3.4 billion Pennsylvania 1,001-2,000 $2.7 billion Rhode Island 1-100 $20 million Vermont 101-500 $250 million
Source: American Wind Energy Association 2016a, as of 2015

73
This report is available at no cost from the National Renewable Energy Laboratory at www.nrel.gov/publications
5.7 Key Stakeholder Groups and Development Challenges The NWRC targets these stakeholder groups:
• For offshore wind, the NWRC is focused on state clean energy funds and the public utility commission as its primary stakeholders.
• For land-based wind, the NWRC focuses on state and local policy-makers, media, and members of the public.
• Through its industry partner the Maine Ocean Wind Industry Initiative, some offshore wind outreach is provided to industry stakeholders and the general Maine public.
The information provided to these stakeholder groups addresses the following wind energy development market barriers that are prevalent in this region. Each barrier is followed by a more detailed description specific to the NWRC region and an example of the NWRC’s work to address the barrier with its stakeholders.
Lack of public acceptance of offshore wind energy continues to stall many offshore wind projects. Public acceptance and lengthy litigation battles have been the main obstacles for the proposed Cape Wind Project off Massachusetts.
The Islanded Grid Resource Center reported that communities in coastal New England pursuing offshore wind projects face many development challenges, including navigating the regulatory process; addressing technical issues related to installation, interconnection, and operation; researching and mitigating environmental impacts; interacting with other human uses; and public acceptance. The fact that there are no full-scale offshore wind turbines currently deployed in the United States further complicates many of these challenges, as there are no domestic projects that can serve as examples to inform these topics. The NWRC also works with communities around the region to educate them about offshore wind development.
High costs and permitting of offshore wind. Offshore wind projects face high costs due to construction, installation, and operation at sea, as well as necessary modifications to turbines and foundations. Infrastructure barriers include transmission challenges, lack of deepwater ports, lack of specialized installation vessels, a workforce with limited experience, and a nascent supply chain. Complex permitting, lengthy site selection and leasing processes, and uncoordinated planning (jurisdiction by jurisdiction) pose regulatory challenges, also adding to project cost and development uncertainty.
The NWRC provides information on the high costs of offshore wind, the opportunities for cost reductions, and Europe’s experiences with cost reductions. The NWRC gears its information and outreach to the Clean Energy States Alliance’s state clean energy fund members, facilitating dialogue on procurement targets, regional financing, alternative financing through green banks and bonds, and regional supply chain development, all means to potentially reduce total project costs.

74
This report is available at no cost from the National Renewable Energy Laboratory at www.nrel.gov/publications
Land-based wind stakeholder groups require publications, guidelines, and other materials that can aid sound decision-making when considering new policies or wind project proposals. The NWRC is addressing this challenge through several means, including compiling information resources on its website as well as convening a working group that is developing evaluation criteria that can be applied to individual information resources so that stakeholders can discern their suitability for decision-making or journalistic coverage. The topics covered in the resource library include wind physiological and environmental impacts, along with technical, economic, financial, and operational issues.
5.8 Collaborating Organizations Organizations that have collaborated with the Northeast Wind Resource Center include Cape and Islands Self Reliance; Cape and Vineyard Electric Cooperative; Consensus Building Institute; Lawrence Berkeley National Laboratory; Massachusetts Clean Energy Center; Maine Governor’s Energy Office; New York State Energy Research and Development Authority (NYSERDA); Rhode Island Office of Energy Resources; Southeast Coastal Wind Coalition; UMass Wind Energy Center; and University of Rhode Island.
5.9 State Updates 5.9.1 Connecticut In September 2016, Connecticut had 5 MW of installed wind capacity. Total capital investment in wind energy in the state is $9 million, and the industry supports fewer than 100 direct and indirect jobs (American Wind Energy Association 2016a). The state is moving toward initiatives on regional procurement of clean energy resources in collaboration with other states. Connecticut, Massachusetts, and Rhode Island have issued an RFP that utility-scale wind resources responded to. The three states hope to complete the joint procurement process by the end of 2016. In 2014, the approval of wind siting guidelines ended an effective moratorium on wind development.
After a long legal battle, construction began on Connecticut’s first commercial wind turbines in 2015, and the project was finished by the fall. BNE Energy developed the Colebrook South Project, which consists of two turbines (Boughton 2015).
5.9.2 Maine With 656 MW of installed wind capacity at the end of September 2016, Maine is the regional leader in wind power development for New England. Wind power provides 10% of the state’s total electricity supply and development of large-scale, onshore projects continues to expand with 268 MW of additional capacity under construction. Total capital investment is $1.2 billion, and the wind industry in the state supports between 1,000 and 2,000 direct and indirect jobs (American Wind Energy Association 2016a). The development of community-scale wind projects has slowed in recent years due to an unstable political climate, interconnection challenges, and the competitive pricing of alternative renewables such as solar. Wind projects that recently began operating include Oakfield Wind (148 MW), Passadumkeag Wind (43 MW), and Saddleback Ridge Wind

75
This report is available at no cost from the National Renewable Energy Laboratory at www.nrel.gov/publications
Project (34 MW). Projects under construction include Bingham Wind (185 MW), Hancock Wind (51 MW), and Pisgah Wind (9 MW).
The fate of several previously announced projects under development by SunEdison is uncertain given the company’s recent bankruptcy announcement. The 72-MW Weaver Wind project was withdrawn. Bowers Wind (48 MW) is not expected to move forward after losing a court appeal. Several other projects are facing extended development timelines or suspension due to legal, permitting, contracting, and investment setbacks, including Number 9 Wind (250 MW), West Range (also called Fletcher Mountain), and Highland Wind. Permitting issues associated with visual and species impacts have emerged in the past year.
EDP Renewables’ Number Nine Wind Farm was one of two projects selected by the Connecticut Department of Energy and Environmental Protection under a competitive procurement pursuant to Section 6 of Public Act 13-303, which authorized the agency to seek new Class I renewable energy resources up to 4% of the state’s load under power purchase agreements up to 20 years. The wind project’s March 2016 quarterly progress report indicated that none of the power purchase agreement’s critical first-quarter 2016 milestones were met due to delays in the ISO-New England interconnection process. As a result, the Public Utilities Regulatory Authority approved a termination agreement and release of the two agreements previously approved by the Authority as requested by the project developer and the state’s two utilities. EDP Renewables explained that the project has experienced extreme, unforeseeable delays in the interconnection process, including a delay in the system impact study to be delivered by ISO-New England.
Figure 17. The 34-MW Saddleback Ridge Wind Project in Carthage, Maine, was completed in 2015. Photo from Ken Boulier/Patriot Renewables, NREL 40575
The Number Nine Wind Farm had been the largest advanced Class I RPS-eligible project in the region’s development pipeline to have an active power purchase agreement. It also comprised the vast majority of the supply contracted under the Connecticut Department of

76
This report is available at no cost from the National Renewable Energy Laboratory at www.nrel.gov/publications
Energy and Environmental Protection’s PA 13-303 Section 6 long-term contracting RFP. The project has been under development for an extended period, and EDP Renewables is expected to continue with the development process despite the setback as the project may be in a position to continue forward if it is selected under the New England Clean Energy RFP116 because that procurement process has longer lead times.
Maine established an expedited wind permitting area in 2008 to allow for an easier permitting process for wind projects being developed in unorganized territories in the state (Public Law 2007, Ch. 661). In 2015, the Maine Legislature passed a subsequent law allowing residents to petition for the removal of towns/townships/plantations from the expedited permitting area (Public Law 2015, Ch. 265). Removal from the expedited permitting area effectively makes wind development more difficult and requires a more in-depth permitting process for projects.
Between January 1, 2016 and June 30, 2016, the Maine Land Use Planning Commission accepted petitions for removal of areas from the expedited wind permitting area. More than 40 petitions for removal were submitted, and a number of locations have already been removed from the permitting area while other petitions are undergoing a substantive review process per the requests of landowners or project developers.
Notably, areas that contain previously permitted or formally proposed wind projects are ineligible for removal, so this proceeding should not have an effect on such projects. However, some projects in the early planning stages that have not yet submitted applications or received permits may be affected by the removal of these townships from the expedited permitting area. Projects that may be impacted include West Hills Wind (in Highland, Lexington, Concord, and Pleasant Ridge) and Highland Wind (in Highland), as well as an early-stage project in Trescott Township. In June 2016, the UMaine-led New England Aqua Ventus I project was onboarded into the DOE Advanced Technology Demonstration Program for Offshore Wind. This means that Aqua Ventus I is eligible for an additional $39.9 million in funding from DOE as long as the project continues to meet established milestones.
In 2014, the Maine Public Utilities Commission approved a term sheet for the Aqua Ventus project, calling on the offshore pilot project to sell electricity to Central Maine Power for 23 cents per kilowatt-hour. The total DOE funding for this demonstration project will be up to $50 million (subject to progress reviews), including $10.7 million already allocated to UMaine for design, development, and permitting activities. The New England Aqua Ventus I Project partners include Emera Inc., Cianbro Corporation, University of Maine and the Advanced Structures and Composites Center, and DCNS.
5.9.3 Massachusetts At the end of September 2016, Massachusetts had 115 MW of installed wind capacity. Wind generation is equal to 12% of in-state energy production. Total capital investments are $220 million, and the wind industry in the state supports between 100 and 500 direct and indirect jobs (American Wind Energy Association 2015a). The 8-MW Future
116 https://cleanenergyrfp.com/

77
This report is available at no cost from the National Renewable Energy Laboratory at www.nrel.gov/publications
Generation Wind project in Plymouth came online in 2016 (Mass Energy Consumers Alliance 2016).
The Massachusetts Clean Energy Center approved up to $1.8 million in relief assistance for the Town of Falmouth to financially assist the municipality as it attempts to navigate the impacts associated with reduced operations of the town’s wind project. Community concerns surrounding sound impacts led to curtailment and unanticipated costs (Massachusetts Clean Energy Center 2014).
The proposed Cape Wind project in Massachusetts was dealt a most likely fatal blow when the two utilities with power purchase agreements pulled their agreements after Cape Wind failed to obtain financing by the deadline. Without these power purchase agreements, the project cannot be built. Cape Wind brought the utilities’ action to court. Most recently, a federal appellate court overturned a lower court’s earlier ruling defending Cape Wind’s power purchase agreement, representing another potentially lethal setback for the project. The current energy bill in the Massachusetts house would preclude Cape Wind from participating in the 1,200-MW proposed requirement.
Two federal lease sales in a second Massachusetts Wind Energy Area occurred in January 2015; the leases went to RES Americas and Offshore MW. Both leases were sold much cheaper than other lease areas, possibly due to the deeper water at the site. RES Americas paid $281,285 for the lease, which covers 760 square kilometers and has the potential to generate more than 1 gigawatt of capacity. DONG Energy, a Danish developer and utility—and the largest offshore wind developer in the world—acquired RES Americas’ lease. This is encouraging news for the U.S. offshore wind sector.
As mentioned earlier in this report, Massachusetts is part of the three-state initiative for clean energy procurement described in the Connecticut section. Eversource, a state utility, is obligated to procure a replacement contract to backfill the power purchase agreement with Cape Wind, and that procurement obligation will be added to the clean energy procurement initiative.
Massachusetts has several wind energy education programs. The University of Massachusetts at Amherst has had an active wind energy program for more than 40 years. The University of Massachusetts at Lowell participated in the 2014 and 2016 Collegiate Wind Competition. University of Massachusetts at Amherst also participated in the 2016 Competition. Cape Cod Community College initiated a wind technician program focused on the offshore wind industry.
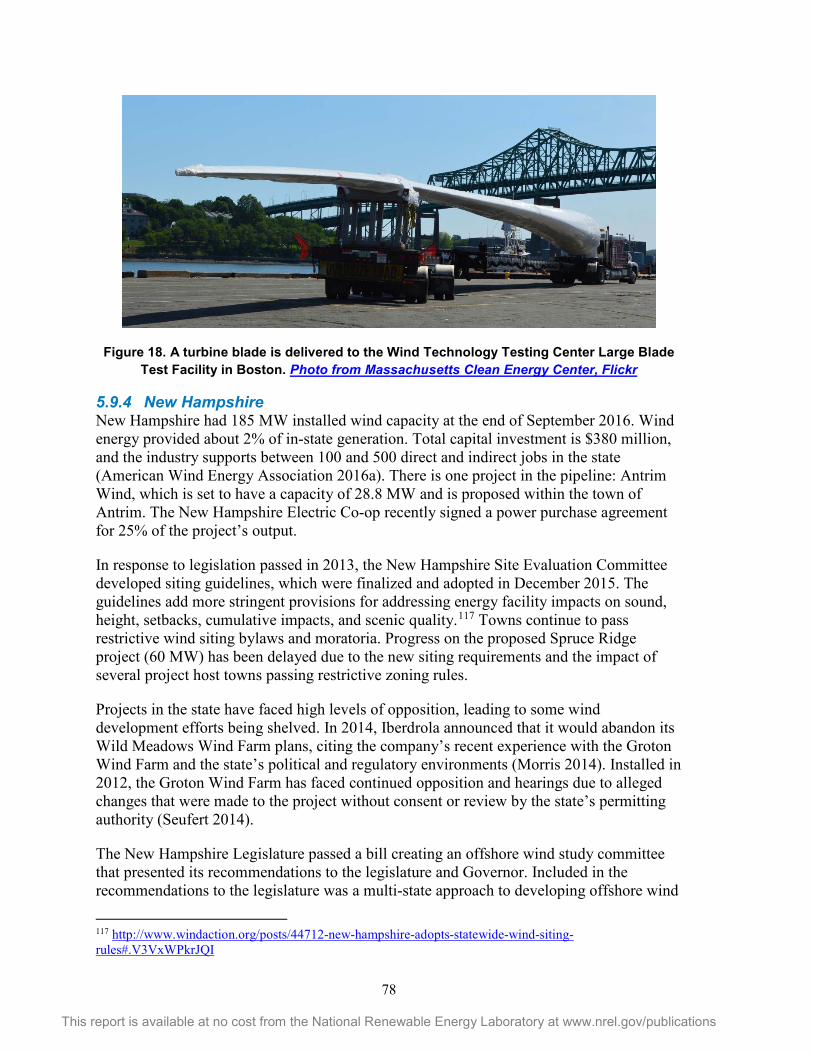
78
This report is available at no cost from the National Renewable Energy Laboratory at www.nrel.gov/publications
Figure 18. A turbine blade is delivered to the Wind Technology Testing Center Large Blade Test Facility in Boston. Photo from Massachusetts Clean Energy Center, Flickr
5.9.4 New Hampshire New Hampshire had 185 MW installed wind capacity at the end of September 2016. Wind energy provided about 2% of in-state generation. Total capital investment is $380 million, and the industry supports between 100 and 500 direct and indirect jobs in the state (American Wind Energy Association 2016a). There is one project in the pipeline: Antrim Wind, which is set to have a capacity of 28.8 MW and is proposed within the town of Antrim. The New Hampshire Electric Co-op recently signed a power purchase agreement for 25% of the project’s output.
In response to legislation passed in 2013, the New Hampshire Site Evaluation Committee developed siting guidelines, which were finalized and adopted in December 2015. The guidelines add more stringent provisions for addressing energy facility impacts on sound, height, setbacks, cumulative impacts, and scenic quality.117 Towns continue to pass restrictive wind siting bylaws and moratoria. Progress on the proposed Spruce Ridge project (60 MW) has been delayed due to the new siting requirements and the impact of several project host towns passing restrictive zoning rules.
Projects in the state have faced high levels of opposition, leading to some wind development efforts being shelved. In 2014, Iberdrola announced that it would abandon its Wild Meadows Wind Farm plans, citing the company’s recent experience with the Groton Wind Farm and the state’s political and regulatory environments (Morris 2014). Installed in 2012, the Groton Wind Farm has faced continued opposition and hearings due to alleged changes that were made to the project without consent or review by the state’s permitting authority (Seufert 2014).
The New Hampshire Legislature passed a bill creating an offshore wind study committee that presented its recommendations to the legislature and Governor. Included in the recommendations to the legislature was a multi-state approach to developing offshore wind
117 http://www.windaction.org/posts/44712-new-hampshire-adopts-statewide-wind-siting-rules#.V3VxWPkrJQI

79
This report is available at no cost from the National Renewable Energy Laboratory at www.nrel.gov/publications
and the designation of a Bureau of Ocean Energy Management multi-state task force to further explore the offshore wind potential in New Hampshire. One barrier for offshore wind in New Hampshire is its relative lack of a coastline. The state has one small coastal region between Seabrook and Portsmouth.
5.9.5 New Jersey Onshore and offshore developments have moved slowly in New Jersey, which is currently stalled at 9 MW of land-based installed wind energy (American Wind Energy Association 2015a). Total in-state generation by wind turbines is less than 1%. New Jersey has established an offshore wind requirement of 1,100 MW by 2021. Total capital investment in New Jersey is about $10 million, and the industry supports between 100 and 500 direct and indirect jobs (American Wind Energy Association 2015a). Fishermen’s Energy, a proposed five-turbine offshore project that DOE previously supported as one of its Offshore Wind Advanced Technology Demonstration Projects, did not receive approval from the New Jersey Board of Public Utilities to move forward. In a recent appellate court decision, the court backed the board’s rejection of the demonstration project, affirming that Fishermen’s Energy had not established the project’s financial viability. Fishermen’s Energy has pursued approval to move forward with the project since 2008. Another offshore wind project, a proposed 500-MW development, includes a lease secured by U.S. Wind Inc. RES America Developments Inc. acquired a commercial lease for southern lease area OCS-A-0499 in February 2016; RES America transferred its lease to DONG energy. The proposed project capacity is 1,000 MW.
The Atlantic Wind Connection was a proposed offshore transmission project linking northern New Jersey to southern Virginia, with points in between. The entire project could support the development of 6,000 MW of offshore wind power. Tax revenue from the project was estimated at about $18 million annually. The first phase of the project is the New Jersey Energy Link, linking south Jersey with north Jersey. However, the Atlantic Wind Connection is currently on hold. The New Jersey link, while still an undersea transmission system, does not mention connection to offshore wind farms in its proposal.
5.9.6 New York With 1,749 MW of installed wind, New York leads the Northeast in overall wind energy capacity. This amount of development equates to a $3.4 billion capital investment for the state, and the industry supports between 1,000 and 2,000 direct and indirect jobs. Wind energy provides New York with 3% of its total in-state energy production (American Wind Energy Association 2016a).
The small and distributed wind markets continue to be active in New York. While the main driver of this has historically been an incentive program provided through NYSERDA, third-party leasing is a new model that is expected to further advance this type of installation. United Wind, a leader in this area, reported that it financed five New York projects through third-party leasing in 2014; in 2015, more projects utilized this model. As of March 2016, nearly 200 projects had been commissioned using this financing mechanism (Chilson 2016).

80
This report is available at no cost from the National Renewable Energy Laboratory at www.nrel.gov/publications
Currently the state is re-designing its overall energy strategy. New York has adopted an aggressive goal of obtaining electricity from renewable sources, with RPS targets aimed at three groups: large-scale generators that sell power to the wholesale grid or in some cases generate power for onsite use; small-scale generators such as a wind turbine at a residence; and other market activities, such as individuals and businesses that choose to pay a premium on their electricity bill to support renewable energy (NYSERDA 2015). The state legislature established a new Clean Energy Standard that calls for 50% of electricity to come from renewable sources by 2030 (50 by 30) and will go into effect in 2017. In preparation for the Clean Energy Standard, NYSERDA produced Large Scale Renewable Energy Development in New York: Options and Assessment (NYSERDA 2015), which focused on the successor program to the current main tier RPS program slated to end after 2016. The paper explored and compared different approaches for procurement and financing on new renewables through long-term renewable energy credit purchases, bundled power purchase agreements, or utility-owned generation.
NYSERDA has invested nearly $10 million a year from 2012-2016 in efforts to reduce barriers and increase market acceptance of clean power generation in New York through its Technology and Market Development Program Initiatives.
New York is also reviewing the planning process for its transmission system, which currently is constrained and is affecting wind development and operation. In December 2015, the New York State Public Service Commission determined that there is a “transmission need driven by Public Policy Requirements for new 345-kV major electric transmission facilities to cross the central east and UPNY/SENY interfaces to provide additional transmission capacity to move power from upstate to downstate.”
Current land-based wind projects include the 449-MW Bull Run Wind Energy Center developed by Invenergy (estimated commercial operation date of 2019), the proposed 126-MW Cassadaga Wind Project by Everpower (filed for Article 10 Siting in May 2016), the 300-MW Baron Winds Wind Project by Everpower (yet to file for Article 10), and the 100-MW proposed Ball Hill Wind Energy Project by RES.
In New York, the Long Island Power Authority tried to procure 280 MW of wind power in 2013. In 2015, they released another RFP calling for an additional 210 MW of renewable power.
The Bureau of Ocean Energy Management hosted public open houses in June 2015 to share visual simulations of potential offshore wind development.118 In March 2016, agency officials announced that they had identified approximately 81,130 acres for potential offshore wind energy development. They released a draft environmental assessment to determine potential impacts associated with issuing a commercial lease. The comment period ended August 5, 2016; a commercial lease sale is underway in December 2016.
118 http://www.boem.gov/New-York-Visual-Simulations/

81
This report is available at no cost from the National Renewable Energy Laboratory at www.nrel.gov/publications
5.9.7 Pennsylvania As of September 2016, Pennsylvania had 1,340 MW of installed wind capacity. This amount of development equates to a $2.7 billion capital investment and supports between 1,000 and 2,000 direct and indirect jobs. Total in-state power generation from wind energy is about 2% (American Wind Energy Association 2016a). In 2004, Pennsylvania established its Alternative Energy Portfolio Standards Act, which requires18% of the state’s energy to be generated by clean, efficient sources by 2021 (Pennsylvania Public Utility Commission 2016). Despite this policy, no utility-scale wind farms have been installed in the state since 2012.
Wildlife issues, including wind energy’s impact on bats in the state, have hampered development, as have concerns related to sound, health, and property values. Another significant issue for the state is that many of the windiest, undeveloped locations are on state game lands, which thus far are not available for wind project development (S. Stewart, personal interview, December 2015).
Pennsylvania is also participating in the Wind for Schools project through the engagement of Pennsylvania State University and the installation of four school systems. Pennsylvania State University was the winner of the 2014 and 2016 Collegiate Wind Competitions.
5.9.8 Rhode Island Rhode Island has 9 MW of wind energy installed. Total capital investment is about $20 million with fewer than 100 direct and indirect jobs supported (American Wind Energy Association 2016a). As discussed earlier in this section, construction of the 30-MW Block Island offshore wind farm ended in August 2016. The $225 million project provides electricity to Block Island and Rhode Island customers.
Rhode Island is part of the three-state initiative for clean energy procurement described in the Connecticut section. In-state opposition exists, particularly in rural areas of Rhode Island. Recently in the town of North Smithfield, the local planning board placed a moratorium on new wind development until proper siting guidelines were established. Many of the town’s residents opposed the construction of a 2.5-MW turbine in the town.
The Rhode Island Office of Energy Resources recently proposed a set of land-based siting guidelines that would ideally assist local municipalities in developing local wind siting ordinances to streamline the development process. The guidelines are currently in draft form.
5.9.9 Vermont Vermont’s total wind energy capacity was 119 MW at the end of September 2016. Wind power provides approximately 14% of in-state electricity generation. Capital investments total $250 million, and the wind industry supports between 100 and 500 direct and indirect jobs (American Wind Energy Association 2016a). Issues concerning aesthetics, health impacts, wildlife (Ring 2015), and property value impacts (Preedom 2015) still prevail in the state, slowing development and leading to community resistance to hosting wind turbines.

82
This report is available at no cost from the National Renewable Energy Laboratory at www.nrel.gov/publications
The Vermont legislature passed an aggressive RPS (called the Renewable Energy Standard) starting at 55% by 2017 and then increasing by 4% every 3 years until reaching 75% by 2032 (DSIRE 2015b). Specifics are provided for distributed generation, retail electricity providers, and municipal utilities. Although the targets for the program are high, the emphasis on distributed generation, efficiency, and the ability for existing renewable generators to participate and compete with new renewable generators mean little incentive for utility-scale wind to participate.
The Energy Development Improvement Act is recently enacted legislation with several wind siting provisions that give an increased voice for citizens and regional planning commissions during the siting process and addresses wind impacts such as noise, lighting, and visual impacts. Local resistance to wind generation of any scale is further dampening new development. Projects such as Swanton (15 MW) and Kidder (5 MW) are facing strong local opposition. The 30-MW Deerfield wind project continues to advance through the permitting process.
83
This report is available at no cost from the National Renewable Energy Laboratory at www.nrel.gov/publications
6 Northwest Region Colleagues from the Northwest Wind Resource and Action Center (NW Wind Center) and the National Renewable Energy Laboratory (NREL) collaborated to provide the following assessment of the state of the wind industry in this region.
The NW Wind Center119 encompasses the following states: Idaho, western Montana, Oregon, Washington, and Wyoming. Renewable Northwest Project is the principal investigator. Northwest Sustainable Energy for Economic Development (Northwest SEED) facilitates committee activities related to distributed and community wind. The Oregon Department of Energy leads the offshore wind efforts while the Commerce Departments of Washington and Montana, along with Boise State University, serve on the steering committee.
All states in the region face barriers related to wildlife and project siting; depressed electric market prices; low natural gas costs; little load growth; and a combination of transmission constraints, a need for balancing area coordination, and better integration services markets. In addition, those states with renewable portfolio standards (RPSs) (Montana, Oregon, and Washington) see decreased market potential as utilities fulfill their near-term target requirements. These factors have slowed the pace for new project development, although a pipeline of approved projects exists once markets improve.
Recent events that could improve the market for wind energy in the region include:
• Passage of Oregon’s Clean Electricity and Coal Transition law (SB 1547-B), which increases the RPS targets for large investor-owned utilities to 50% by 2040 and eliminates the use of coal power by utilities in the state no later than 2035
• Scheduled closures of the Boardman (Oregon) and Centralia (Washington) coal plants, as well as other anticipated plant closures in the region
The following section provides an overview of the wind industry in the region. Stakeholders can consult the U.S. Department of Energy’s (DOE’s) interactive Wind Vision Study Scenario Viewer120 to learn more about state-specific impacts from wind energy development.
119 http://nwwindcenter.org/ 120 http://en.openei.org/apps/wv_viewer/

84
This report is available at no cost from the National Renewable Energy Laboratory at www.nrel.gov/publications
Table 22. Key Statistics for States in the Northwest Wind Resource and Action Center Region
ID MT121 OR WA WY
Installed Wind (MW), End of 3Q16122 973 665 3,163 3,075 1,410 Percentage of In-State Energy Production, 2015123 17% 8% 12% 7% 9% 2016 Wind Power Capacity Additions (MW)124 0 25 10 0 0 Wind Capacity under Construction (MW)125 0 266 50 0 80 Projected Potential Capacity (MW), 80 m, 30% CF 18,076 944,004 27,100 18,479 552,073 Projected Potential Capacity (MW), 100 m, 30% CF 44,770 1,012,355 50,566 32,606 593,769 Distributed Wind Capacity, 2015 (MW)126 2 5 5 13 6 Proposed Offshore Wind Projects (MW) n/a n/a 25127 0 n/a
Sources: American Wind Energy Association, U.S. DOE
6.1 Renewable Portfolio Standards In the NW Wind Center's region, Oregon, Washington, and Montana each have an RPS in place.
In 2005, Montana passed an RPS requiring large investor-owned utilities to acquire 15% of their energy from new renewable resources by 2015. In 2014, the Energy and Telecommunications Interim Committee reviewed the RPS and recommended the standard remain static at 15% for 2015 and beyond. Montana utilities met the 2015 target but will need to add renewable resources in the future to maintain compliance as current contracts expire. Montana also has a Community Renewable Energy Project provision in the state’s RPS that requires utilities to procure a certain amount of nameplate capacity of smaller (less than 25 megawatts [MW]), locally owned renewable energy projects, either wholly utility-owned or at least 50% owned by Montana investors. NorthWestern Energy is the only utility with a Community Renewable Energy Project obligation left in Montana and must procure roughly 45 MW. Satisfying the requirement has resulted in regulatory and project development challenges in recent years but remains a near-term driver for renewable energy projects in the state.
121 Montana is divided between two RRCs: Northwest Wind Resource and Action Center (western Montana) and Midwest Wind Energy Center (eastern Montana). For reporting purposes, a Montana summary is provided in this section. 122 American Wind Energy Association 2016a 123 American Wind Energy Association 2016a 124 American Wind Energy Association 2016b 125 American Wind Energy Association 2016b 126 Distributed wind project installed capacity is defined as 2003-2015 cumulative capacity (U.S. DOE 2016a). 127 Principle Power

85
This report is available at no cost from the National Renewable Energy Laboratory at www.nrel.gov/publications
The Oregon Renewable Energy Act (SB 838) was signed into law in June 2007. The Act establishes a Renewable Energy Standard that requires Oregon’s largest utilities to acquire 25% of their electricity from renewable energy sources by 2025. The passage in 2016 of the Clean Electricity and Coal Transition law (SB 1547-B) added a 2040 target of 50% for large investor-owned utilities to the RPS while also eliminating coal power from all utility portfolios no later than 2035. Smaller Oregon utilities must meet targets of 5% or 10% by 2025. Oregon utilities have met the 2015 targets but will need to acquire new resources to meet the targets for 2025 and beyond.
In November 2006, Washington voters passed Initiative 937 (I-937), the Clean Energy Initiative. I-937 enacts a renewable energy standard that requires Washington’s 17 largest utilities to get 15% of their electricity from homegrown renewable energy sources by 2020. Utilities are also required to pursue all cost-effective energy efficiency and conservation measures. Washington utilities met their interim 2012 targets of 3% and are on track to meet the 2016 target of 9%, but many will need to acquire additional resources to meet the 2020 target.
Two of the states in the region, Idaho and Wyoming, have no RPS.
Table 23. RPS Overview for States Served by the Northwest Wind Resource and Action Center
RPS Idaho None Montana 15% by 2015; met and remains in effect
Oregon
Large investor-owned utilities: 50% by 2040 Large consumer-owned utilities: 25% by 2025 Small utilities: 10% by 2025 Smallest utilities: 5% by 2025
Washington 15% renewables by 2020 Wyoming None
Source: Database of State Incentives for Renewables & Efficiency
6.2 Clean Power Plan In 2015, the U.S. Environmental Protection Agency (EPA) released the final Clean Power Plan (CPP), proposing to regulate carbon dioxide emissions from existing power plants. The proposed rate-based emissions targets in the original plan for each state in the region are shown in Table 24, along with the percentage of emissions reductions that the rule would require over the 2012 baseline. Some utilities are making progress toward the proposed CPP goals. Although the CPP may be delayed or not implemented, ultimately some states and utilities will make decisions based on the carbon impacts of the power sector. The following EPA data represent the best available forward-looking information on potential state-by-state carbon reductions; however, it is likely that final targets, if any, will be determined in the future.

86
This report is available at no cost from the National Renewable Energy Laboratory at www.nrel.gov/publications
Table 24. Clean Power Plan Rate-Based Targets for States Served by the Northwest Wind Resource and Action Center
2012 Rate-Based Baseline (lbs CO2/MWh)128
2022 Rate-Based Target (lbs CO2/MWh)
2030 Rate-Based Target (lbs CO2/MWh)
Final Emission Rate Reduction % (2030)
Idaho 858 877 771 10% Montana 2,481 1,671 1,305 47% Oregon 1,089 1,026 871 20% Washington 1,566 1,192 983 37% Wyoming 2,331 1,162 1,299 44%
Sources: EPA, Center for Climate and Energy Solutions The Union of Concerned Scientists (UCS) performed an analysis of each state and its relative achievement of the CPP reduction targets under business-as-usual operations.129 Table 25 shows each state’s achievement of the CPP goals with little to no action beyond planned activities, based on UCS scenarios. Based on current trajectories and plans, states are already implementing policies and developing projects that will help them realize a lower-carbon scenario, regardless of federal policies. Of course, wind energy development contributes to this and other clean power plans.
Table 25. Clean Power Plan Targets for States Served by the Northwest Wind Resource and Action Center
UCS Analysis: Progress toward CPP 2022 Rate-Based Targets
UCS Analysis: Progress toward CPP 2030 Rate-Based Targets
UCS Analysis: Progress toward CPP 2022 Mass-Based Targets
UCS Analysis: Progress toward CPP 2030 Mass-Based Targets
Idaho *In compliance 0% **In compliance **In compliance Montana 16% 10% 19% 11% Oregon >200% 171% **In compliance >200% Washington >200% 125% >200% 158% Wyoming 1% 0% 1% 1%
* “In compliance” reflects emissions rate reduction targets that are greater than baseline (2012) emission rates. ** “In compliance” reflects emissions targets that are greater than baseline (2012) emissions.
128 The rate-based approach is based on pounds of carbon dioxide emitted per megawatt-hour of generation; the mass-based approach is based on tons of carbon dioxide emitted per time period. See http://cdn.bipartisanpolicy.org/wp-content/uploads/2015/05/Rate-v-Mass.pdf for more information. 129 http://www.ucsusa.org/sites/default/files/attach/2015/08/States-of-Progress-Update_State%20Tables.pdf

87
This report is available at no cost from the National Renewable Energy Laboratory at www.nrel.gov/publications
6.3 Regional Transmission As noted earlier, transmission constraints are challenging for wind development in the region. In a development that will affect a number of states in the West, much activity has occurred around PacifiCorp’s interest in joining the California Independent System Operator (CAISO) and evolving the CAISO into a regional multi-state system operator. If successful, this expanded market would help to address wind integration issues and would use existing transmission lines much more effectively for bringing new wind to market.
Progress is being made in Idaho. Idaho Power has committed to join the CAISO Energy Imbalance Market, and approval from the Idaho Public Utilities Commission is anticipated over this coming year. Also, the Boardman-to-Hemmingway 500-kilovolt transmission line scored well in Idaho Power’s integrated resource plan, and work is nearly finished with the federal (Bureau of Land Management) and state (Idaho and Oregon) siting processes. This line will provide important connectivity between Wyoming and Idaho wind and the markets in Oregon and Washington.
6.4 Workforce Development Several long-standing educational programs exist within the region: Boise State University, University of Washington, and Montana State University. Colombia Gorge Community College hosts one of the oldest wind technician training programs. Educational activities are described in more detail in the state sections below. The WINDExchange website also offers information and interactive maps regarding workforce development, DOE’s Collegiate Wind Competition, DOE’s Wind for Schools project, school wind project locations, and locations of education and training programs in the NW Wind Center’s region and other states.130
130 http://apps2.eere.energy.gov/wind/windexchange/schools/

88
This report is available at no cost from the National Renewable Energy Laboratory at www.nrel.gov/publications
Figure 19. Map of school wind turbine projects, educational programs, and locations with both wind turbines and educational programs within the Northwest Wind Resource and
Action Center’s area
6.5 Manufacturing and Economic Development NREL researchers compiled the following wind energy manufacturing data for this region as part of DOE’s annual wind market report effort (U.S. Department of Energy 2016b).
Table 26. Wind-Related Manufacturing Overview for States Served by the Northwest Wind Resource and Action Center
Name City State Component
Moventas Portland OR Gearboxes XZERES Wind Wilsonville OR Distributed wind turbines
Additional economic impacts from wind development include the capital investment, jobs created, tax revenues paid, payments in lieu of taxes, and land lease payments made by wind developers during construction and the ongoing maintenance of wind plants. The American Wind Energy Association performs modeling work that identifies the impacts of all wind-related investment. Table 27 summarizes the total jobs (including construction jobs in 2015) and capital investment over time in wind farms in the NW Wind Center states. Examples of economic impacts are provided in each of the state overviews below.

89
This report is available at no cost from the National Renewable Energy Laboratory at www.nrel.gov/publications
Table 27. Economic Impacts of Wind Development in States Served by the Northwest Resource and Action Center
State 2015 Direct and Indirect Jobs Supported Total Capital Investment
Idaho 101-150 $1.9 billion Montana 101-500 $1.2 billion Oregon 1,001-2,000 $6.2 billion Washington 1,001-2,000 $5.8 billion Wyoming 101-500 $2.6 billion
Source: American Wind Energy Association 2016a, as of 2015 6.6 Key Stakeholder Groups and Development Challenges The NW Wind Center targets these stakeholder groups:
• Bonneville Power Administration
• County commissioners
• Developers
• Educational institutions (academia)
• Experts (researchers, technical)
• Federal agencies and government organizations (decision makers, elected officials, policy makers)
• Public interest groups (advisory, advocacy, affiliates, boards, committees, community, consumer, councils, non-governmental organizations, partner network, working group)
• Industry (manufacturers, supply chain, associated businesses) and industry trade groups
• Media
• Merchant energy suppliers
• Non-elected government officials
• Public (engaged citizens, interested and general public)
• Regulatory (public utility commissioners, decision makers, staff, interveners)
• State agencies and government organizations (decision makers, elected officials, governor staff, policy makers)
• Tribal governments and community members
• Utilities (power authorities, publics, municipals, co-ops, decision makers, staff) and utility trade groups.

90
This report is available at no cost from the National Renewable Energy Laboratory at www.nrel.gov/publications
The information provided to these stakeholder groups addresses the following wind energy development market barriers that are prevalent in this region. Each barrier is followed by a more detailed description specific to the Northwest region and an example of the NW Wind Center’s work to address the barrier with their stakeholders. These include:
Varying wind technology costs and outputs. Wind capacity factors vary across the West, and wind competes with low-cost natural gas and utility-scale solar photovoltaic power plants. Nevertheless, wind is increasingly competitive at the utility scale and continues to increase in value as a resource as technology advances and costs decline.
The NW Wind Center has worked to deliver information about technological advances (through phone calls, webinars, and fact sheets) to decision makers in the region and to insert up-to-date cost information in regulatory proceedings. This is particularly important in the regulatory sphere, with a need to address the state-of-the-art in resource planning processes and ensure accurate wind information is utilized in utility integrated resource planning.
Transmission constraints and outdated market operations. Through engagement of Bonneville Power Administration, utilities, and other key stakeholders, the NW Wind Center provides information and guidance to meet the need for transmission and energy market advances. These include a liquid bilateral market for integration resources, 15-minute scheduling, and development of a regional energy imbalance market and/or participation in existing energy imbalance markets in adjoining regions.
Uncertainty around wildlife impacts in the siting process. Across the West, the protection of wildlife and habitats, especially sage grouse and golden eagles, is an ongoing concern for wind development. The NW Wind Center is working to meet the need for science-based resource planning in siting guidelines, especially for development in sage grouse areas.
Lack of zoning and permitting best practices for distributed/community wind. Across the region, there is a need for improved zoning and permitting practices in jurisdictions with high distributed/community wind potential. In addition, technical assistance for potential community wind projects is lacking.
The NW Wind Center developed state-specific wind energy permitting toolkits and conducted outreach to counties to offer technical assistance for counties interested in exploring community wind projects.
Restricted access to capital and financial incentives for distributed/community wind development. The NW Wind Center provides assistance to stakeholders in understanding these issues and identifying available incentives and resources.
Lack of strong technical information baseline for offshore wind. The Northwest coast provides many challenges for offshore wind development, including deep water, limited transmission infrastructure, and the lack of a large load center on the coastline. While floating-platform technology has been proposed as a solution, the technology is new and there is a need to build credibility around the resource opportunity. The Northwest

91
This report is available at no cost from the National Renewable Energy Laboratory at www.nrel.gov/publications
Regional Resource Center (RRC) is working to make current information on the state of the offshore sector publicly available to help inform efforts to support an initial demonstration project in the region.
6.7 Collaborating Organizations Organizations that have collaborated with the Northwest Wind Resource and Action Center include American Wind Energy Association; Avangrid Renewables; Beneficial State Bank; Boise State University; Center for Energy Efficiency & Renewable Technology; Citizens’ Utility Board of Oregon; Columbia Gorge Community College; Community Renewable Energy Association; Distributed Wind Energy Association; DNV GL; EDF Renewable Energy; EDP Renewables North America; eFormative Options; Endurance Wind Power; Everpower; EWT Americas; Idaho National Laboratory; McKinstry; Montana Department of Environmental Quality; Montana Environmental Information Center; Montana Renewable Energy Association; Natural Resources Defense Council; Northwest Energy Coalition; Northwest National Marine Renewable Energy Center; Oregon State University; Oregon Tech; Oregon Wave Energy Trust; Orion Renewable Energy Group; Pacific Northwest National Laboratory; Principle Power; Puget Sound Energy; RES Americas Development; Vaisala/3Tier; Vestas Americas; and Western Resource Advocates.
6.8 State Updates 6.8.1 Idaho As of the end of November 2016, Idaho has a total installed wind capacity of 973 MW, with more than $1.9 billion in capital investment to the state and supporting between 101 and 500 direct and indirect jobs. In 2015, wind energy provided 17% of all in-state electricity production (American Wind Energy Association 2016a).
Idaho has a larger percentage of smaller projects compared to neighboring states as many of the wind projects were developed under the Public Utility Regulatory Policies Act (PURPA) limits. The major utility in the state, Idaho Power, has influenced policy changes at the Public Utilities Commission that limit project size and make changes to rates for standard PURPA contracts that increase costs for developers.
Opponents of wind development have also been very active, including billboard messaging on the I-84 corridor, focusing on areas with high concentrations of wind projects. The political climate has limited the effectiveness of messaging by wind proponents in a variety of venues. There are currently no projects under construction in the state, and more than 500 MW of proposed PURPA projects are stalled due to the current market.
Progress is being made in the areas of transmission and market development in the state. Idaho Power has committed to join the CAISO Energy Imbalance Market. Approval from the Idaho Public Utilities Commission is anticipated over this coming year. Also, the Boardman-to-Hemmingway 500-kilovolt transmission line scored well in Idaho Power’s integrated resource plan, and work is nearly finished with the federal (Bureau of Land Management) and state (Idaho and Oregon) siting processes. This line will provide important connectivity between Wyoming and Idaho wind and the markets in Oregon and Washington.

92
This report is available at no cost from the National Renewable Energy Laboratory at www.nrel.gov/publications
Idaho has 2.4 MW of distributed wind capacity installed and no community wind projects. The State of Idaho offers an income tax deduction for residential wind installations equal to 40% of the project cost in the first year and 20% in each of the following 3 years. The state’s investor-owned utilities allow for net metering of wind systems up to 100 kilowatts (kW) for commercial applications and 25 kW for residential applications.
Idaho participates in DOE’s Wind for Schools project through the engagement of Boise State University, with the installation of seven school systems in the state. Boise State University also participated in the 2014 and 2016 Collegiate Wind Competition.
6.8.2 Montana As of the end of November 2016, Montana had a total installed capacity of 690 MW of wind energy. These projects brought more than $1.2 billion in capital investment to the state and supported between 100 and 500 direct and indirect jobs. In 2015, wind energy provided 8% of all in-state electricity production (American Wind Energy Association 2016a).
One 25-MW Qualifying Facility/PURPA project came online in 2016. In addition, three 80-MW Qualifying Facilities in southern Carbon County were under construction in order to qualify for the Production Tax Credit and were expected to be completed in 2016. However, these projects have since been delayed by disputes with the off-taking utility about its obligation to take the power under PURPA (American Wind Energy Association 2016b). Another 25-MW project is technically under construction, although project development has been stalled as developers work with the utility on contract terms. More than 5,000 MW of proposed projects are unable to move forward due to market conditions and transmission constraints.
The state has a large wind resource, ranking third nationally in total wind energy potential, but the lack of transmission capacity to other states inhibits Montana from capturing it. This is especially problematic in eastern Montana, which has the lowest population and the highest wind resource. A growing local opportunity could be the ongoing load requirements from oil and gas development in the Bakken region. Although the oil and gas boom has–at least temporarily–busted, electric demand remains robust and could prove to be a growing market opportunity for wind, especially if the boom returns. Governor Steve Bullock supports energy development and recently announced a new energy blueprint for the state that focuses intensely on reducing barriers to developing Montana’s wind energy resource. The blueprint calls for increased regional engagement to solve transmission constraints and develop new markets for Montana’s wind energy resource. Governor Bullock holds a fairly conservative stance on carbon regulation, which would benefit wind but also impact Montana’s coal industry. Public support is overwhelmingly in favor of wind energy development but at the same time supportive of existing coal generation.
The Montana Public Service Commission has a mixed track record on wind energy development. In 2015, the commission approved a 25-MW negotiated Qualifying Facility/PURPA wind contract on NorthWestern Energy’s system. This year, the commission has again been asked to set contract terms for a 25-MW Qualifying Facility/PURPA wind contract. Qualifying Facility/PURPA wind energy development under a standard offer contract remains infeasible since the commission reduced the standard offer project capacity limit to 3 MW.

93
This report is available at no cost from the National Renewable Energy Laboratory at www.nrel.gov/publications
Physical transmission constraints and transmission and RPS policy barriers continue to be the primary obstacles to developing Montana’s wind resource. Bonneville Power Administration’s (BPA’s) Montana Intertie transmission rate (sometimes also referred to as the Eastern Intertie transmission rate) effectively increases the cost of Montana wind and strands existing transmission capacity from full utilization. Washington’s RPS appears to limit Montana wind from beyond BPA’s service footprint from qualifying for Washington’s RPS. However, an important recent opinion from Washington State Department of Commerce on the eligibility of dynamically transferred energy from beyond BPA’s footprint may open the door for Montana wind to play a role in meeting Washington’s renewable energy demand. A lack of market coordination and a lack of transmission infrastructure effectively limit the ability of Montana’s best wind resource to play a role in the nearby Midcontinent Independent System Operator market or the more distant CAISO market.
While opposition to new transmission lines still exists, improvements to the siting process and some legislative changes have created a more favorable climate over the past few years. In the case of the Mountain States Transmission Intertie line, creating a citizens-based study group helped the average person’s voice be heard in the siting process. Until recently, market forces have delayed development of the line and other major projects in the region, such as BPA’s Montana-to-Washington project. The passing of the Clean Electricity and Coal Transition law in Oregon, as well as policy advances in Washington on a state carbon cap and Puget Sound Energy’s ownership stake in Colstrip, have re-energized interest in these projects. The business case for BPA to finish the environmental work on the Montana-to-Washington project has grown stronger.
Recently other transmission developments have also moved forward. The Upper Great Plains region of the Western Area Power Administration (Western) joined the Southwest Power Pool’s organized market. Although Western’s transmission presence in Montana is currently weak, this could improve in the future, and the access to an organized market is an important development. Also, the owners of the Montana Alberta Tie Line have proposed an upgrade to that 230-kilovolt line from Montana to the Alberta Independent System Operator. Planned and potential coal plant retirements should also increase transmission capacity available for wind energy export over the next 2 to 5 years.
In addition, Northwestern Energy is studying the benefits of joining the CAISO Energy Imbalance Market. Joining would be an important development for improving the ability to efficiently integrate Montana wind into the grid.
Montana has a 15% by 2015 RPS. Northwestern Energy, the largest utility in the state, met the 2015 RPS target mostly through generation from seven wind projects with a total installed capacity of 213.4 MW, plus three small hydro projects totaling 15.5 MW. The 15% target remains in effect.
As in other western states, impact on sage grouse populations is an issue in terms of siting wind projects. Montana’s Sage Grouse Conservation Strategy, adopted in anticipation of Endangered Species Act listing decision by the U.S. Fish and Wildlife Service (USFWS), could affect wind energy development in Montana. The strategy calls for wind energy development to be avoided in all sage grouse core areas. Since then, in an action that provides some additional certainty for

94
This report is available at no cost from the National Renewable Energy Laboratory at www.nrel.gov/publications
wind development, the USFWS announced the results of its status review. The review found “that the greater sage-grouse remains relatively abundant and well-distributed across the species’ 173-million acre range” and “does not face the risk of extinction now or in the foreseeable future.” As a result, the USFWS concluded that the greater sage grouse should not be listed under the Endangered Species Act (U.S. Department of the Interior 2015).
Montana has 4.9 MW of distributed wind capacity installed, primarily consisting of turbines rated at 100 kW or less. Gordon Butte, the only community wind project, has an interconnection and power purchase agreement with NorthWestern Energy. Montana offers a tax credit up to $1,000 per household for the installation of a residential wind turbine. Montana law allows for net metering of wind systems up to 50 kW in capacity. During the 2015 legislative session, several bills were proposed that would help open the market for distributed wind projects, including aggregate net metering, neighborhood net metering, and increasing the net metering cap; however, these bills did not move forward. In 2015, the state legislature initiated a study on the costs and benefits of net metering, noting it is necessary to determine such impacts before moving forward with changes to the state net metering program. The study is complete but did not produce a concise conclusion regarding any potential cost shift between participating and non-participating net metering customers.
Montana participates in DOE’s Wind for Schools project131 through the engagement of Montana State University, with 11 school systems installed in the state. The University of Montana also provides wind energy curricula.
Note that Eastern Montana is also supported by the Midwest Regional Resource Center.
6.8.3 Oregon As of the end of November 2016, Oregon has a total installed capacity of 3,173 MW. These projects brought more than $6.2 billion in capital investment to the state in 2015 and supported between 1,000 and 2,000 direct and indirect jobs. In 2015, wind energy provided 12% of all in-state electricity production (American Wind Energy Association 2016a). A 10-MW project came online in Umatilla County in September 2016. A cluster of five 10-MW projects is currently under construction in Baker County and will come online in early 2017.
Despite this progress, new project development has stalled in recent years due to a number of factors, including depressed demand for power, low natural gas prices, uncertainty about the persistence of federal policy, and utilities fulfilling their near-term RPS compliance targets. Because of this delay in construction activity, some projects that were already approved through state and county processes need to apply for permit extensions or let their existing permits expire. In 2015 alone, two projects with a total capacity of 1,002 MW either withdrew their applications or let their notice of intent expire.
131 http://apps2.eere.energy.gov/wind/windexchange/schools_wfs_project.asp

95
This report is available at no cost from the National Renewable Energy Laboratory at www.nrel.gov/publications
Figure 20. Wind turbines in Oregon. Photo from Bureau of Land Management, Flickr
There is hope for a return of positive market conditions for wind development in the state. The passage in 2016 of the Clean Electricity and Coal Transition law (SB 1547-B) added a 2040 target of 50% to the RPS for large investor-owned. The RPS expansion legislation also included an incentive for taking early compliance action, which coincided with the extension of the federal Production Tax Credit; along with the scheduled retirement of the Boardman and Centralia coal generation facilities, this is already leading to an increased appetite for renewable energy resources in Oregon. In April and May 2015, both of the state’s major investor-owned utilities issued requests for proposals for potentially hundreds of megawatts of renewable generation. Portland General Electric issued a request for proposals (RFP) for about 500 megawatts of wind; however, a procedural requirement that the utility base its procurement on the needs identified in its last commission-acknowledged integration resource plan meant that the RFP did not receive regulatory approval; the RFP was cancelled. Portland General Electric intends to rectify this in its next integration resource plan, scheduled to be acknowledged by the commission in 2017, to be followed shortly after by a re-issued RFP. PacifiCorp also issued an RFP for renewable resources and received many positive responses. However, the utility chose to purchase a small amount of renewable energy credits in the near team and delay procurement to take advantage of falling renewable costs.
Inaccurate wind energy information also undermines long-term planning for new renewable resources in utility integrated resource planning. This is being addressed through active participation in the planning processes at the Oregon Public Utility Commission and by directly engaging with utilities.
The Oregon Public Utility Commission recently issued two orders preserving the integrity of PURPA in the state. The Oregon Commission rejected utility proposals to lower the contract length of PURPA projects from 20 years to 2 years, which would have had negative impacts on project financing. The commission found that the current 20-year contracts appropriately balanced the interests of PURPA developers, utilities and ratepayers. This comes at a critical time in the region as wind prices have fallen to a level comparable with that of natural gas.

96
This report is available at no cost from the National Renewable Energy Laboratory at www.nrel.gov/publications
Transmission and market issues in the region continue to impact wind development in the state, although a couple of developments do present hope for change. In late 2015, the Northwest Power Pool, which includes many large utilities in the region, and BPA announced that they would cease efforts to explore a Northwest energy imbalance market option. This led larger investor-owned utilities in the region to explore joining the energy imbalance market operated by CAISO as an alternative. Portland General Electric is scheduled to join the CAISO energy imbalance market in October 2017, improving the integration of its wind resources. A handful of public power utilities are also considering joining the energy imbalance market.
As in other Western states, impact on sage grouse populations is an issue in terms of siting wind projects. Oregon is developing a state plan for sage grouse conservation that will affect the potential for wind energy development in the southeastern quadrant of the state. Oregon is attempting to avoid the core area exclusion approach used in other states by formulating a new regulatory approach and enhancing the compensatory mitigation system. Towards that end, in September 2015, Governor Kate Brown signed an executive order adopting the Oregon Sage-Grouse Action Plan.132 That same month, in an action that provides some additional certainty for wind development, the USFWS announced the results of their status review. The review found “that the greater sage grouse remains relatively abundant and well-distributed across the species’ 173-million acre range” and “does not face the risk of extinction now or in the foreseeable future.” As a result, USFWS concluded that the greater sage grouse does not need to be listed under the Endangered Species Act (U.S. Department of the Interior 2015).
Oregon has 4.9 MW of distributed wind capacity installed, primarily located in territory covered by the Energy Trust of Oregon’s incentive program. Oregon has a single 9-MW community wind project, PaTu Wind, which sells power through a power purchase agreement with Portland General Electric and a long-term transmission contract with Bonneville Power. Like other states in the region, additional distributed wind projects are limited by high installed costs and community wind projects are challenged by low power purchase agreement prices and lack of the investment tax credit cash grant.
132 http://oe.oregonexplorer.info/ExternalContent/SageCon/SageCon_Action_Plan_Main_Body_FINAL.pdf

97
This report is available at no cost from the National Renewable Energy Laboratory at www.nrel.gov/publications
Principle Power stopped development of the 30-MW WindFloat Pacific project, Oregon’s only proposed offshore wind project. This project was formerly one of DOE’s Offshore Wind Advanced Technology Demonstration Projects. Interest in offshore wind on the West Coast has been limited because the water depth is too great for typical offshore turbine installations. This
NWRAC Supports Oregon PUC, Preserves PURPA Integrity
The Northwest Wind Resource Action Center provided the Oregon Public Utility Commission (OPUC) support in a long and often contentious battle that resulted in the issuance of two orders designed to preserve the integrity of the Public Utility Regulatory Policies Act (PURPA) in the state. These orders were in direct response to proposals by Idaho Power and PacifiCorp that would have lowered the eligibility cap of Qualifying Facilities (QF) projects in Oregon and reduced the contract length of QF power purchase agreements (PPAs).
Idaho Power’s April 2015 request sought to reduce the eligibility cap applicable to standard contracts from 10 MW to 100 kW for wind and solar QFs while reducing the contract term from 20 years to 2 years for all QF projects above 100 kW (Docket No. UM 1725).
PacifiCorp followed a month later with its own application to reduce the eligibility cap for standard QF pricing and PPAs to 100 kW for wind and solar QFs, and lower the fixed-price term of PPAs from 15 years to 3 years for all QFs (Docket No. UM1734).
If either of these proposals were successful, it would have a chilling effect on the PURPA wind market in Oregon. Small wind projects would have been required to negotiate contracts due to the reduced eligibility cap, adding burdensome legal and administrative costs. A reduction in contract term lengths would have impacted larger wind projects by making financing nearly impossible.
As a response to these actions, Renewable Northwest, a Northwest Wind Resource Action Center partner organization, filed briefs with OPUC relating to the stagnation of the PURPA market in states where the contract term length had been reduced in a similar manner, the lack of justification to a reduction of the project size threshold and the additional transaction costs that developers would be subjected to due to the proposed changes in these dockets.
On March 29, 2016, OPUC issued two orders rejecting the utilities’ requested 100-kW eligibility cap regarding wind energy, though the Commission did reduce the eligibility cap for avoided cost prices in standard contracts for solar QFs from 10 MW to 3 MW. OPUC also rejected the utilities’ request for a reduction of the length of QF PPAs. Instead, the commission found that the current policy (20-year PPAs with 15 years of fixed-prices) appropriately balances the interest of QFs, utilities, and ratepayers.
According to David Wolf, Administrative Director of Renewable Northwest, the dockets are just another example in a continuous sequence of utility proposals designed to undermine PURPA. Wolf also stated that the Northwest Wind Resource and Action Center is currently undertaking similar efforts to address this ongoing concern and expects the issue to increase as the cost of wind energy continues to drop.

98
This report is available at no cost from the National Renewable Energy Laboratory at www.nrel.gov/publications
demonstration project proposed using floating turbine platforms to address this issue. If successful, this approach could open up new areas for offshore development. Unfortunately, the high costs associated with development of this small demonstration project prevented it from obtaining a signed power purchase agreement.
To analyze the employment and economic potential for floating offshore wind along the West Coast, the Bureau of Ocean Energy Management (BOEM) commissioned the National Renewable Energy Laboratory (NREL) to analyze two hypothetical, large-scale deployment scenarios for Oregon: 5,500 MW of offshore wind deployment in Oregon by 2050 (Scenario A), and 2,900 MW of offshore wind by 2050 (Scenario B). According to the Scenario A analysis, deploying 5,500 MW of floating offshore wind in Oregon and assuming a modest in-state supply chain could support between $4.6 billion and $5.7 billion in construction-phase economic activity to Oregon’s gross domestic product (GDP) and support between 44,000 and 66,000 full-time equivalent (FTE) construction-phase job-years between 2020 and 2050 (Jimenez et al. 2016c). BOEM also commissioned NREL to conduct another economic impact analysis with the same parameters, this time focused on the impacts to the seven Oregon coastal counties: Clatsop, Tillamook, Lincoln, Lane, Douglas, Coos, and Curry. According to the Scenario A analysis, deploying 5,500 MW of floating offshore wind in Oregon could add $1.6 billion to $2.8 billion to the GDP of the coastal counties from 2020 to 2050 in construction-phase activities and support 18,000 to 33,000 FTE construction-phase job-years between 2020 and 2050 (Jimenez et al. 2016b).
Columbia Gorge Community College was one of the original colleges offering wind technician training programs: a 9-month certificate and a 2-year Associate of Applied Science degree in renewable energy. Recently they developed a “flipped classroom” component that offers a series of free videos on YouTube that cover all aspects of Columbia Gorge’s Renewable Energy Technology program.
Oregon Tech offers Bachelor of Science and Master of Science degree programs in Renewable Energy Engineering. The degree program was established in 2005 and expanded to include a master’s degree program in 2012.
6.8.4 Washington As of the end of November 2016, Washington has a total installed capacity of 3,075 MW. These projects brought more than $5.8 billion in capital investment to the state and supported between 1,000 and 2,000 direct and indirect jobs. In 2015, wind energy provided 7% of all in-state electricity production (American Wind Energy Association 2016a).
Similar to other states in the Northwest, new project development has slowed due to factors such as depressed demand for power, low natural gas prices, uncertainty about the persistence of federal policy, and utilities fulfilling their near-term RPS compliance targets. However, recent policy developments should create opportunities for wind in the state. The governor is developing a state-wide cap on greenhouse gas emissions (implementation targeted for 2017), and renewable energy credits from Washington projects are projected to be a least-cost compliance mechanism. Furthermore, planned coal retirements will create market opportunities for wind in the near- to mid-term future. Efforts to create opportunities for wind also continue

99
This report is available at no cost from the National Renewable Energy Laboratory at www.nrel.gov/publications
through active involvement in the integrated resource plans, ensuring that utilities use accurate wind energy information so that wind is fairly considered as a resource option.
Puget Sound Energy began transacting in the CAISO energy imbalance market in October 2016, improving its ability to integrate wind efficiently. Some Washington public power utilities are also considering joining the energy imbalance market. BPA has facilitated other utilities’ energy imbalance market participation by accommodating the new market’s use of the federal transmission system. BPA may also increase its ability to interact with the new market.
Washington has 12.8 MW of distributed wind capacity installed, of which 10.4 MW are also community wind projects (Coastal Energy Project and Swauk Wind). Washington State offers a production-based incentive of $0.12 per kilowatt-hour for net-metered wind systems up to 100 kW; however, the high installed cost of these systems remains a barrier. The incentive expires in June 2020, and efforts are underway to renew and expand this program to include community wind; previous efforts in the 2015 and 2016 legislative sessions were unsuccessful.
6.8.5 Wyoming By the end of November 2016, Wyoming had 1,410 MW of installed wind capacity, representing total capital investment of $2.6 billion and supporting between 100 and 500 direct and indirect jobs. In 2015, wind energy provided 9% of all in-state electricity production (American Wind Energy Association 2016a). One 80-MW project came online in October 2016, the first wind project completed in Wyoming since 2010. Wyoming has no RPS or renewable energy goals.
As with other states in the region, transmission constraints limit development, although three large transmission projects have been proposed to deliver power to larger markets. One of these, the 600-kV direct-current TransWest Express Transmission Line, is being designed to carry up to 3,000 MW from south-central Wyoming, near Rawlings, and ending southeast of Las Vegas (U.S. Bureau of Land Management 2016). Several large wind projects have been proposed for Wyoming to utilize that transmission capacity if the new lines move forward. More information on these projects is included in the Four Corners Region section.
Other siting considerations for wind development in Wyoming include a state tax on wind energy generated and wildlife concerns relating to sage grouse and eagles. Wind education programs in Wyoming include programs at the University of Wyoming and Larimer County Community College, one of the original colleges offering certificate programs for wind turbine technicians.
Wyoming has 5.9 MW of distributed wind capacity installed and no community wind projects. State law allows for net metering of wind systems up to 25 kW in capacity; however, there are no other state incentives for distributed wind.
Note that the Four Corners Wind Resource Center also supports activities in Wyoming; in this report, Wyoming updates are included in the Northwest Region’s section.

100
This report is available at no cost from the National Renewable Energy Laboratory at www.nrel.gov/publications
7 Southeast Region Colleagues from the Southeast Wind Energy Resource Center (SWERC) and NREL collaborated to provide the following assessment of the state of the wind industry in this region.
The SWERC133 encompasses the following states: Alabama, Arkansas, Florida, Georgia, Kentucky, Louisiana, Mississippi, North Carolina, South Carolina, Tennessee, and Virginia. The Regional Resource Center (RRC) works to advance the wind industry in the Southeast by providing fact-based information to stakeholders, engaging electric utilities, engaging on wind energy permitting processes, and preserving access to quality wind resources, both onshore and offshore. The RRC is a joint effort of the Southeastern Wind Coalition and several partners, including the North Carolina Clean Energy Technology Center at North Carolina State University, Clemson University, Coastal Carolina University, Georgia Institute of Technology, James Madison University (JMU), and Navigant Consulting. These partners are reliable sources of unbiased wind energy information and have a history of stakeholder engagement in the region.
The following section provides an overview of the wind industry in the region. Although wind development in the Southeast has been limited (Table 28), it should be noted that improved technology and accessing the wind resource at higher above-ground heights allow for geographic expansion of wind development into areas such as the Southeast, which historically was categorized as having a poor wind resource and little potential for wind development.
Table 28. Key Statistics for States in the Southeast Wind Energy Resource Center Region
AL AR FL GA KY LA MS NC SC TN VA Installed Wind (MW), End of 3Q16134,135 .1 .7 .5 .11 .20 .11 0 .3 0 29 1 2016 Wind Power Capacity Additions (MW)136 0 0 0 0 0 0 0 0 0 0 0 Wind Capacity under Construction (MW), End of 3Q16 0 0 0 0 0 0 0 208 0 0 0 Projected Potential Capacity (MW), 80 m, 30% CF 118 9,200 .4 130 61 410 0 808 185 309 1,793
133 http://www.sewind.org/ 134 American Wind Energy Association 2016a 135 With the exception of Tennessee, all states in the Southeast Wind Energy Resource Center’s region only have small distributed wind projects installed; U.S. Department of Energy 2016a 136 American Wind Energy Association 2016a

101
This report is available at no cost from the National Renewable Energy Laboratory at www.nrel.gov/publications
AL AR FL GA KY LA MS NC SC TN VA Projected Potential Capacity (MW), 100 m, 30% CF 568 49,962 .4 294 699 2,840 0 1,500 1,215 817 3,466 Wind Potential w/ Future Turbine Technology (Terawatt-Hours/Year) 715 839 576 698 525 693 721 366 393 449 258 Distributed Wind Capacity, 2015 (MW)137 .1 .7 .5 .11 .20 .11 0 .3 0 .1 1 Proposed Offshore Wind Projects (MW) 0 n/a 0 0 n/a 0 0 0 0 n/a 0
Sources: American Wind Energy Association, Southeastern Wind Coalition, U.S. DOE
New maps of potential wind capacity are available for a 2014 industry standard wind turbine installed on a 110-m tower, which represents plausible current technology options, and a wind turbine on a 140-m tower (Figure 21), which represents near-future technology options (WINDExchange 2016b). The 2015 DOE report Enabling Wind Power Nationwide provides extensive discussions on the expanding opportunities of wind development, particularly across the Southeast and Gulf Coast (U.S. Department of Energy 2015b). Stakeholders can also consult the Energy Department’s interactive Wind Vision Study Scenario Viewer138 to learn more about state-specific impacts from wind development.
137 Distributed wind project installed capacity is defined as 2003-2013 cumulative capacity (U.S. Department of Energy 2016a). 138 http://en.openei.org/apps/wv_viewer/

102
This report is available at no cost from the National Renewable Energy Laboratory at www.nrel.gov/publications
Figure 21. Map of potential wind capacity at a hub height of 140 meters. Increased hub heights expand opportunities for wind development, especially in the Southeast and Gulf Coast regions
7.1 Renewable Portfolio Standards Of the states located in the SWERC's area, only North Carolina has a renewable portfolio standard (RPS). South Carolina and Virginia have goals, and the remaining eight states have neither in place. No new RPS policies were proposed in 2016 in the Southeast.
Table 29. RPS Overview for States Served by the Southeast Wind Energy Resource Center
RPS Alabama None Arkansas None Florida None Georgia None Kentucky None Louisiana None Mississippi None
North Carolina 12.5% x 2021 (investor-owned utilities) 10% x 2018 (co-ops & munis)
South Carolina Goal of 2% by 2021 Tennessee None Virginia Goal of 15% x 2025
Source: Database of State Incentives for Renewables & Efficiency

103
This report is available at no cost from the National Renewable Energy Laboratory at www.nrel.gov/publications
7.2 Clean Power Plan In 2015, the U.S. Environmental Protection Agency (EPA) released the final Clean Power Plan (CPP), which proposes to regulate carbon dioxide emissions from existing power plants. The proposed rate-based emissions targets in the original plan for each state in the region are shown in Table 30, along with the percentage of emissions reductions that the rule would require over the 2012 baseline. Some utilities are making progress toward the proposed CPP goals. Although the CPP may be delayed or not implemented, ultimately some states and utilities will make decisions based on the carbon impacts of the power sector. The following EPA data represent the best available forward-looking information on potential state-by-state carbon reductions; however, it is likely that final targets, if any, will be determined in the future.
Table 30. Clean Power Plan Rate-Based Targets for States Served by the Southeast Wind Energy Resource Center
2012 Rate-Based Baseline (lbs CO2/MWh)139
2022 Rate-Based Target (lbs CO2/MWh)
2030 Rate-Based Target (lbs CO2/MWh)
Final Emission Rate Reduction % (2030)
Alabama 1,518 1,244 1,018 33%
Arkansas 1,779 1,411 1,130 36%
Florida 1,247 1,097 919 26% Georgia 1,600 1,290 1,049 34% Kentucky 2,166 1,643 1,286 41%
Louisiana 1,618 1,398 1,121 31%
Mississippi 1,185 1,136 945 20%
North Carolina 1,780 1,419 1,136 36% South Carolina 1,791 1,449 1,156 35%
Tennessee 2,015 1,531 1,211 40%
Virginia 1,477 1,120 934 37% Sources: EPA, Center for Climate and Energy Solutions The Union of Concerned Scientists (UCS) performed an analysis of each state and its relative achievement of the CPP reduction targets under business-as-usual operations.140 Table 31 shows each state’s achievement of the CPP goals with little to no action beyond planned activities, based on UCS scenarios. Based on current trajectories and plans, states are already implementing policies and developing projects that will help them realize a lower-carbon scenario, regardless of federal policies. Of course, wind energy development contributes to this and other clean power plans.
139 The rate-based approach is based on pounds of carbon dioxide emitted per megawatt-hour of generation; the mass-based approach is based on tons of carbon dioxide emitted per time period. See http://cdn.bipartisanpolicy.org/wp-content/uploads/2015/05/Rate-v-Mass.pdf for more information. 140 http://www.ucsusa.org/sites/default/files/attach/2015/08/States-of-Progress-Update_State%20Tables.pdf

104
This report is available at no cost from the National Renewable Energy Laboratory at www.nrel.gov/publications
Table 31. Clean Power Plan Targets for States Served by the Southeast Wind Resource Center
UCS Analysis: Progress toward CPP 2022 Rate-Based Targets
UCS Analysis: Progress toward CPP 2030 Rate-Based Targets
UCS Analysis: Progress toward CPP 2022 Mass-Based Targets
UCS Analysis: Progress toward CPP 2030 Mass-Based Targets
Alabama 84% 39% 138% 52% Arkansas 7% 0% 10% 0% Florida 23% 7% 191% 11% Georgia 160% 78% >200% 101% Kentucky 51% 25% 72% 31% Louisiana 0% 0% 0% 0% Mississippi *In compliance 18% **In compliance 42% North Carolina >200% 55% >200% 74% South Carolina >200% 165% >200% >200% Tennessee 176% 103% >200% 127% Virginia 35% 17% 57% 23%
* “In compliance” reflects emissions rate reduction targets that are greater than baseline (2012) emission rates. ** “In compliance” reflects emissions targets that are greater than baseline (2012) emissions.
7.3 Workforce Development Robust programs at JMU, land-based wind programs at Virginia Technical University, offshore wind programs at Clemson University and Georgia Technical University, and distributed wind programs at Appalachian State University provide a diversity of wind energy education in the region.
As part of the Wind for Schools project in Virginia, JMU works with seven affiliate primary and secondary schools,141 nine host schools,142 and six partner schools (partner schools host a meteorological tower for 1 year with the help of JMU students). In the past year, JMU staff members worked closely with two schools to help install wind technology on their campuses.
JMU staff members have also conducted teacher trainings and presented to students about wind energy. JMU houses an extensive lending library of energy classroom kits that cover topics from electricity basics to wind and solar energy generation. This year, JMU trained more than 175 teachers and loaned kits to five schools around the state. JMU staff reached more than 700 students through educational tours, events, and classroom visits, including two KidWind Challenges.143
141 Affiliate schools host wind turbines at their school that were not installed as part of the official Wind for Schools project. 142 Host schools operate small wind turbines on their campus with help from JMU staff 143 http://www.kidwindchallenge.org/

105
This report is available at no cost from the National Renewable Energy Laboratory at www.nrel.gov/publications
Figure 22. Map of school wind turbine projects, educational programs, and locations with both wind turbines and educational programs within the Southeast Wind Energy Resource Center’s
area
Lastly, JMU staff taught wind energy-related materials in two courses and advised two pairs of JMU senior capstone project students and two high school senior project students on wind-related research. JMU staff also advised five summer interns on wind-related work. Appalachian State University also had an active Wind for Schools program in North Carolina, providing teacher training and technical support to schools interested in installing wind turbines at their locations.
Clemson University’s South Carolina Electric & Gas Energy Innovation Center144 is a wind turbine drivetrain testing and grid simulator facility that completed construction in 2013. This past year saw thousands of visitors, ranging from students to professionals, touring the facility to learn about wind power and the engineering and testing behind turbines.
Additional educational activities are described in more detail in the state sections below. The WINDExchange website also offers information and interactive maps regarding workforce development, the DOE Collegiate Wind Competition, DOE’s Wind for Schools project, school wind project locations, and locations of education and training programs in the SWERC region and other states.145
7.4 Manufacturing and Economic Development Although wind development has not been prioritized in the Southeast, a robust manufacturing base has developed throughout the region. NREL researchers compiled the following wind energy manufacturing data for this region as part of DOE’s annual wind market report effort (U.S. Department of Energy 2016b).
144 http://clemsonenergy.com/ 145 http://apps2.eere.energy.gov/wind/windexchange/schools/

106
This report is available at no cost from the National Renewable Energy Laboratory at www.nrel.gov/publications
Table 32. Wind-Related Manufacturing Overview for States Served by the Southeast Wind Energy Resource Center
Name City State Component Molded Fiber Glass Opp AL Enclosures LM Wind Power Little Rock AR Blades GE Energy Pensacola FL Turbine (nacelle assembly) Hailo LLC Elberton GA Climbing devices ZF Group Gainesville GA Gearboxes American Roller Bearing Company Hiddenite NC Bearings American Roller Bearing Company Morganton NC Bearings Comer Industries Charlotte NC Yaw, pitch control systems Southwire Huntersville NC Electrical ILJIN Greer SC Bearings IMO Group Charleston SC Slew rings and drives Morgan AM&T Greensville SC Carbon brushes Timken Union SC Bearings Thomas & Betts Corp. Memphis TN Fasteners BGB Technology Chesterfield County VA Slipring assembly
Additional economic impacts from wind development include the capital investment, jobs created, tax revenues paid, payments in lieu of taxes, and land lease payments from wind developers during construction and the ongoing maintenance of wind plants. AWEA performs modeling work that identifies the impacts of wind-related investment. Table 33 summarizes the total jobs (including construction jobs in 2015) and capital investment in wind farms in the SWERC states. Examples of economic impacts are provided in the state overviews below.
Table 33. Economic Impacts of Wind Development in States Served by the Southeast Wind Energy Resource Center
State 2015 Direct and Indirect Jobs Supported Total Capital Investment
Alabama 101-500 n/a Arkansas 501-1,000 n/a Florida 1,001-2,000 n/a Georgia 101-500 n/a Kentucky 101-500 n/a Louisiana 101-500 n/a Mississippi 1-100 n/a North Carolina 501-1,000 n/a South Carolina 101-500 n/a Tennessee 1-100 $30 million Virginia 101-500 n/a
Source: American Wind Energy Association 2016a, as of 2015 7.5 Key Stakeholder Groups and Development Challenges The SWERC targets these stakeholder groups:
• Utilities: Electric utilities are a critical stakeholder for all market sectors of wind energy, especially in the Southeast. The large, vertically integrated, regulated utilities are major economic drivers and have connections at the highest levels of state leadership. As a

107
This report is available at no cost from the National Renewable Energy Laboratory at www.nrel.gov/publications
result, they have tremendous influence in energy policy and permitting, and that affects land-based, offshore, and distributed wind energy.
• Federal and state decision makers: State policies have been an important driver for renewable energy demand creation in the United States. So far in the Southeast, only North Carolina passed an enforceable RPS. However, the RRC sees broader interest from other states, creating possible demand signals for wind energy. The RPS may not be the policy of choice in every state, but whatever the chosen mechanisms, it is likely that state policy makers will play a leading role in advancing or holding back wind development in the region. The value and need for unbiased, relevant, and actionable information provided to state policy makers will prove critical in helping to insure the appropriate development of the region’s wind resources.
• Local decision makers: County commissioners, city managers, town managers, and other local leaders can have a tremendous influence on the ability to deploy wind energy in appropriately sited locations. They are often a “make or break” party for development projects. For example, a land-based project by Apex Wind in Alabama was effectively shut down by opposition from the county commission. This is a critical audience for delivering unbiased and fact-based information so that they are able to make informed decisions about wind energy projects and related policies in their jurisdiction.
• Industry: Wind industry developers, consultants, and service and supply chain companies are a strong and historically underutilized ally in efforts to advance responsible wind energy development. As the voice of jobs and economic development, they have considerable influence with decision makers and leaders. They are also a valuable source of technical information.
The SWERC works to provide information to address the following wind energy development market barriers that are prevalent in this region. Each barrier is followed by a more detailed description specific to the Southeast region and an example of the SWERC’s work to address the barrier with their stakeholders.
Policy makers are not aware of the wind industry jobs and assets in their jurisdictions. This lack of information makes it difficult for them to support expanded wind development, especially in the face of vocal opposition to a project.
SWERC activities to address this issue include outreach to state and local decision makers. As an example, the Southeastern Wind Coalition published the Southeast Wind Industry Supply Chain Database & Map146 in November 2015 that allows public access to suppliers across the value chain (education, research, engineers, services, etc., in addition to typical original equipment manufacturers and parts suppliers) to document manufacturing across the region.
Stakeholders in the region need credible, fact-based information to counter organized misinformation campaigns in the region. The Southeastern Wind Coalition provides fact-based information about wind power to various stakeholder groups. For example, information provided to county commissioners in Chowan and Perquimans Counties in North Carolina during the creation and modification of their wind ordinances directly resulted in the passage of
146 http://www.sewind.org/map

108
This report is available at no cost from the National Renewable Energy Laboratory at www.nrel.gov/publications
fair and reasonable ordinance measures. Anti-wind advocates had provided misinformation to these parties, making the fact-based information provided by the Southeastern Wind Coalition critical to further potential project development.
The Center for Wind Energy at JMU has been engaged with citizens and officials from Botetourt County, Virginia, since 2014 after county stakeholders initiated efforts to develop a wind ordinance and began discussions with Apex Clean Energy, a Charlottesville-based developer that was examining prospects in the county for utility-scale wind development. The Center provided technical guidance as well as wind farm tours, which helped influence the passage of an ordinance that was based on a model ordinance developed by the Virginia Department of Environmental Quality. After the ordinance passed, Apex Clean Energy officials presented a plan to the county to develop the state’s first utility-scale wind power project on parcels owned by a single landowner along a ridge in the northwestern part of the county. Apex’s project meets all of the guidelines outlined in the county ordinance and exceeds many of the county’s requirements. Apex is currently pursuing its permit by rule from the state.
Some anti-wind groups even published misinformation stating that wind energy projects hurt farming options. In response to this misinformation campaign, the SWERC published a fact sheet on the compatibility of wind farms with agriculture147 and distributed it to stakeholders, including the agriculture steering committee of the North Carolina Association of County Commissioners.
In March 2016, the Southeastern Wind Coalition hosted a proactive event in eastern North Carolina to educate county commissioners, county and town officials, economic developers, and others from an eight-county region around the Albemarle Sound about the benefits and impacts of wind power. Wind development in this region is economically viable, and a number of developers have begun discussions with county officials who are unfamiliar with wind development. The event featured House Representative Bob Steinburg, local Chamber officials, landowners from the state’s first wind project, and a county commissioner who has been supportive of wind. This event was an incredible success with more than 70 attendees and positive feedback from all attendees; the event helped increase their knowledge and excite them about potential wind development in their counties.
Navigating the potential conflicts with existing offshore activities is a challenge and requires significant engagement with many stakeholders. There is extensive interest in offshore wind development across the Southeast, but information is limited based on the lack of offshore development in this and similar regions. Issues from state and federal permitting to differing climatic conditions make it difficult to understand the potential development complications. Additional complications, such as the high cost of offshore development (especially for small-scale demonstration plants), make public communications difficult.
The SWERC is working to navigate these issues in Virginia, North Carolina, and South Carolina and has been involved at all levels of offshore wind development to coordinate activities and support across the region. Efforts to encourage policy that would allow utilities to rate base
147 http://www.sewind.org/images/fact_sheets/WindFarmsAg-Fact_Sheet-20160801.pdf

109
This report is available at no cost from the National Renewable Energy Laboratory at www.nrel.gov/publications
offshore wind in Southeastern states have not yet been successful but have brought attention to the sector.
The military is a large economic driver in many states in the Southeast; any conflicts with military operations—whether real, perceived, or just unknown—create uncertainty for development, especially in discussions between base commanders and local government officials. Particularly in North Carolina, the military has been involved in discussions with developers. Through these discussions, project developers, officials from local military bases, and the Department of Defense Wind Energy Clearinghouse have developed mutually agreeable solutions that allow wind development to coexist with military operations. However, military interests have also sparked proposed anti-wind legislative efforts in the state. The SWERC continues to educate stakeholders around the existing policies that protect military base preparedness, including the Clearinghouse. The Southeastern Wind Coalition also prepared a military and wind factsheet148 that was leveraged during the North Carolina General Assembly’s session in 2017.
Some level of utility support will be necessary for wind development to move forward in the Southeast. Because Southeast utilities are conservative by nature and they have no first-hand operating experience with wind energy, the unknowns are often extrapolated to “worst-case” perceived risks. That includes all of the typical questions that are still unanswered for Southeast development, such as diurnal wind patterns, ramp rates, seasonality, demand coincidence, transmission needs, O&M issues, etc. Issues with offshore wind only expand upon these concerns.
The SWERC is engaged in active discussions with nearly all Southeastern utilities to keep them informed of the latest industry developments and to answer questions. The strong relationships with utilities are one of the SWERC’s greatest strengths. The SWERC engages utilities through its Utility Advisory Group, which provides a forum for the utilities to discuss wind energy issues in the Southeast.
• The SWERC’s Utility Advisory Group gathered in Charleston, South Carolina, in November 2015 to review and provide feedback on the DOE report Enabling Wind Power Nationwide.149 Santee Cooper, Southern Company, and SCANA Corporation provided feedback. The Southeastern Wind Coalition provided the feedback to NREL for incorporation in the next round of Enabling Wind Power Nationwide. A tour of Clemson University’s drive train test facility was also included as part of the event.
• The Utility Advisory Group met in February 2016 in Atlanta, Georgia, to discuss forecasting and integration. In order for utilities to be open to additional wind power imports and local development, they must be comfortable with their ability to effectively manage this variable resource. Experts from the Utility Variable-Generation Integration Group, Southwest Power Pool, Midcontinent Independent System Operator, GE, Electric Reliability Council of Texas, and NREL spoke about the latest developments in forecasting, current wind power penetration levels in other areas of the country, and firsthand experience in effectively integrating large amounts of wind energy on the grid.
148 http://www.sewind.org/images/fact_sheets/Wind_And_Military_Factsheet.pdf 149 http://energy.gov/eere/wind/downloads/enabling-wind-power-nationwide

110
This report is available at no cost from the National Renewable Energy Laboratory at www.nrel.gov/publications
Representatives from Duke Energy, City of Tallahassee, Georgia Power, Alabama Power, Gulf Power, SCANA Corporation, Santee Cooper, Southern Company, and Municipal Electric Authority of Georgia attended the meeting.
7.6 Collaborating Organizations Organizations that have collaborated with the SWERC include ABB Inc.; American Council on Renewable Energy; American Planning Association; American Wind Energy Association; Apex Wind; Arkansas Advanced Energy; Arkansas Energy Office; AWS Truepower; AXYS Technologies; Blue Green Alliance Foundation; Business Network for Offshore Wind; Cape Fear Community College; Chambers for Innovation and Clean Energy; Chesapeake Climate Action Network; City of North Myrtle Beach; City of Tybee Island; Clean Line Energy; Coastal Carolina University; Consumer Energy Alliance; COWI; Distributed Wind Energy Association; Dominion Power; Duke Energy; Duke University; E4 Carolinas; eFormative Options; Electric Power Research Institute; Energy Foundation; Environment America; Fishermen's Energy; Florida Sea Grant; GE Renewables; Georgia Department of Natural Resources, Coastal Resources Division; Georgia Energy Center of Innovation; Georgia Energy Office; Georgia Environmental Finance Authority; Georgia Public Service Commission; Georgia Tech Strategic Energy Institute; Green Law; Gulf States Renewable Energy Association; Iberdrola Renewables; International Council for Local Energy Initiatives, Local Governments for Sustainability; K&L Gates; Kentucky Energy Office; Marsh; Mississippi & Alabama Sea Grant; Mountain Association for Community Economic Development; National Wildlife Federation; Natural Resources Defense Council; Navigant; Nicholas Institute; Normandeau Associates; North Carolina Conservation Network; North Carolina Energy Office; North Carolina Ports Authority; North Carolina Sea Grant; North Carolina Sustainable Energy Association; North Myrtle Beach Chamber of Commerce; Nucor Corporation; Ocean Isle Fishing Center; Parker Poe; Rural Energy for America Program; RES Americas; RES Environmental; Research Triangle Cleantech Cluster; Saertex; Santee Cooper; Savannah River National Laboratory; SCANA Corporation; ScottMadden; Siemens; Sierra Club; Signal Energy; South Carolina Clean Energy Business Alliance; South Carolina Coastal Conservation League; South Carolina Sea Grant; South Carolina State Ports Authority; Southeast Energy Efficiency Alliance; Southern Company; Tennessee Energy Office; Tetra Tech; University of Georgia; University of North Carolina Chapel Hill; University of North Carolina Charlotte (EPIC Center); U.S. Offshore Wind Collaborative; Utility Variable Integration Group; Vaisala; Virginia Conservation Network; Virginia Offshore Wind Coalition; and Wake Forest University.
7.7 State Updates 7.7.1 Alabama Alabama has no utility-scale wind installed with no public projects announced. According to the Southeastern Wind Coalition, at the time of publication the state is home to 25 companies and facilities that are involved in the full value chain of the wind energy industry (including headquarters); for current information, see the Wind Industry Supply Chain Database and Map.150 In 2015, the industry in the state supported between 100 and 500 direct and indirect jobs (American Wind Energy Association 2016a). Recent technology advances have made near- and long-term wind development in the state possible, with economically viable wind development
150 http://www.sewind.org/map/find-companies

111
This report is available at no cost from the National Renewable Energy Laboratory at www.nrel.gov/publications
available, primarily in the northeast corner of the state (U.S. Department of Energy 2015b). Development statewide would be possible using 140-m towers and near-future technology options (WINDExchange 2016b).
Instead of potentially higher-cost in-state development, Alabama Power has contracts to purchase 404 MW of wind energy from projects located in Kansas and Oklahoma. These contracts, put in place in 2011 and 2012, can provide power for up to 115,000 homes (Alabama Power 2016).
In September 2015, the Alabama Public Service Commission approved Alabama Power’s request for 500 MW of renewable energy (not technology-specific but open to wind energy). This latest request will be directed to customers with renewable energy goals, including the military (Pillion 2015).
7.7.2 Arkansas Arkansas does not have in-state wind development. According to the Southeastern Wind Coalition, at the time of publication the state is home to eight wind manufacturing facilities; for current information, see the Wind Industry Supply Chain Database and Map.151 Based on current wind technology, potential economically viable wind terrain extends across Arkansas, with strong potential across the eastern part of the state (WINDExchange 2016b). If near-term wind technology is deployed, development across the state is possible, with many areas of resource potential similar to the state’s wind-resource-rich western neighbors. However, power utilities are currently taking advantage of their proximity to these low-cost wind development regions to purchase wind instead of developing projects locally.
The Arkansas Electric Cooperative Corporation has three power purchase agreements for wind energy totaling approximately 309 MW from projects in Oklahoma and Kansas. These agreements, which were signed over the past few years, are as follows: a 2012 agreement to purchase 51 MW from the Flat Ridge 2 South Wind Farm in Kansas (Ozarks Electric Cooperative Corporation 2012), a 2013 agreement to purchase 150 MW from the Origin Wind Farm in Oklahoma (Electric Cooperatives of Arkansas 2014), and a 2015 agreement to purchase 108 MW from the Drift Sand Wind Farm in Oklahoma (Electric Cooperatives of Arkansas 2015).
Entergy Arkansas released a request for proposals (RFP) for long-term renewable energy generation in August 2016 (not technology specific but open to wind energy).
Arkansas will be home to a substation on the Plains & Eastern Clean Line,152 which will transmit 500 MW of wind resource from the Oklahoma Panhandle directly to Arkansas (the remaining 3,500 MW will be delivered to the Tennessee Valley Authority in Tennessee). DOE’s approval of the 700-mile high-voltage direct current line was a critical milestone in ensuring that this line will be permitted and built.
151 http://www.sewind.org/map/find-companies 152 http://www.plainsandeasterncleanline.com/site/home

112
This report is available at no cost from the National Renewable Energy Laboratory at www.nrel.gov/publications
7.7.3 Florida In June 2016, Gulf Power issued a request to the Florida Public Service Commission to add another 94 MW from its existing Kingfisher Wind Farm in Oklahoma. The Public Service Commission approved the initial 178 MW in May 2015. No wind projects have been installed in the state, and there are no projects under construction (American Wind Energy Association 2016b). Based on current technology, very limited land-based potential exists for near-term wind development. Several projects have been discussed, primarily in the northern parts of the state. Maps based on near-term future economic potential reveal that much of the state shows promise for expanded economic land-based wind development (WINDExchange 2016b).
Florida is headquarters to several major players in the wind energy industry. According to the Southeastern Wind Coalition, at the time of publication the state is home to approximately 50 facilities involved in the wind energy industry’s full value chain; for current information, see the Wind Industry Supply Chain Database and Map.153 NextEra Energy Resources, headquartered in Juno Beach, is the largest owner of wind power capacity in the United States, and major wind turbine manufacturer Siemens is based in Orlando. Florida has been successful in attracting manufacturing investment for the wind industry. Market leader General Electric has a wind turbine assembly facility in Pensacola, several other wind energy manufacturers have Florida facilities, and Siemens Energy opened a Wind Service Training Center in Orlando in September 2013.
7.7.4 Georgia In 2014, the Georgia Public Service Commission approved Georgia Power’s agreement to purchase 151 MW of wind energy from Blue Canyon II and 99 MW from Blue Canyon VI, two wind farms in Oklahoma, beginning in 2016 (Georgia Public Service Commission 2014). The Plains & Eastern Clean Line will allow Georgia to access even more wind energy through the substation in western Tennessee. During its 2016 integrated resource planning process, Georgia Power initially proposed an addition of 425 MW of utility-scale renewable energy scheduled to achieve commercial operation no later than December 31, 2019 (Georgia Power 2016). The plan was amended and then approved by the Georgia Public Service Commission in July 2016. The approved integrated resource plan calls for an additional 1,200 MW of renewable energy by 2021, with no more than 300 MW to be delivered from wind.
Georgia has limited terrain that would provide economically viable wind development given current technologies, primarily located north and west of Atlanta (WINDExchange 2016b). More important, however, Georgia could benefit greatly from near-term, future land-based wind technologies with taller towers and larger rotors (U.S. Department of Energy 2015b). Georgia also has very viable offshore wind potential for near- to mid-term development.
In February 2016, Georgia Power erected a meteorological tower marking the beginning of construction for a small wind demonstration project on the campus of the Skidaway Institute of Oceanography. For the next 2 years, data will be collected from the meteorological tower and three small-scale wind turbines that are yet to be installed (Skidaway Campus Notes 2016). In addition, Georgia Power plans to install a LIDAR system to collect wind data in northern
153 http://www.sewind.org/map/find-companies

113
This report is available at no cost from the National Renewable Energy Laboratory at www.nrel.gov/publications
Georgia’s mountain region. Georgia Power withdrew its application to pursue the interim policy lease to allow for meteorological measurement activities offshore from Tybee Island.
According to the Southeastern Wind Coalition, Georgia is home to more than 60 companies and facilities that are involved in the full value chain of the wind energy industry; for current information, see the Wind Industry Supply Chain Database and Map.154 Georgia Tech’s Strategic Energy Institute (which leads the Southeast’s RRC and the Georgia Wind Working Group), in partnership with the Georgia Tech Center for Geographic Information Systems and Georgia Department of Natural Resources, debuted the Georgia Coastal and Marine Planner (GCAMP)155 to state decision makers and other stakeholders engaged in activities in Georgia’s coastal region. A key component of the project is the hypothetical case study of the siting and licensing process to permit a potential offshore wind farm. The GCAMP viewer uses an ArcGIS StoryMap framework to streamline processes through which state and federal agencies can explore how to facilitate energy development in Georgia’s coastal waters. The hypothetical offshore wind farm case study allowed stakeholders interested in wind energy to come together in a state without a formal Bureau of Ocean Energy Management (BOEM) wind task force and further shape the policies that may exist in the future.
The RRC continued to host workshops in partnership with wind energy affiliates and bi-annual meetings to update wind energy stakeholders about the Georgia Power small wind demo project, GCAMP, the 2015 Georgia Tech Energy Expo, and Georgia Public Service Commission request for information. The RRC team brought key individuals and groups together through the Georgia Wind Working Group to inform them of issues associated with the request for information. The RRC team gave the regulator and the utility perspective, along with how the request for information process was progressing. This included status updates for non-governmental organizations interested in the progress and development opportunities for companies in the Georgia Wind Working Group.
7.7.5 Kentucky Kentucky has no wind farms. According to the Southeastern Wind Coalition, at the time of publication Kentucky is home to 17 companies and facilities that are involved in the full value chain of the wind energy industry; for current information, see the Wind Industry Supply Chain Database and Map.156 No development projects have been announced for the state; however, Kentucky will be able to take advantage of Oklahoma wind energy imported via the Plains & Eastern Clean Line at the substation in Tennessee.
Kentucky has good wind resources currently available across much of the western part of the state and borders states to the north and west that have extensive wind development (WINDExchange 2016b). Near-future technology on taller towers will provide even more impetus to initiate wind activities in the state.
7.7.6 Louisiana In May 2016, Louisiana Wind LLC announced it would develop a 150-MW project in central Louisiana (Texas A&M Engineering Experiment Station 2016). Project developers have 154 http://www.sewind.org/map/find-companies 155 http://carto.gis.gatech.edu/GCAMP/ 156 http://www.sewind.org/map/find-companies

114
This report is available at no cost from the National Renewable Energy Laboratory at www.nrel.gov/publications
completed land leases, a wind turbine generators assessment, a geotechnical assessment, environmental and permitting studies, and a long-term wind measurement. The project is expected to be completed in 2018 (Louisiana Wind 2016).
American Electric Power’s Southwestern Electric Power Company has power purchase agreements for 469 MW of wind energy from projects in Texas, Oklahoma, and Kansas (Southwestern Electric Power Company 2016). In 2016, company officials announced an RFP for an additional 200 MW of wind with plans to add 1,200 MW from 2017 to 2037. In May 2016, Entergy Louisiana released an RFP for 200 MW of renewable energy (not technology specific) (Southern Wind Energy Association 2016).
Based on current and near-term future wind technology, a potential economically viable wind terrain expands from along the Mississippi River Valley on the state’s eastern border to across the entire state (using taller turbine towers) (WINDExchange 2016b). The question of whether to develop local resources or continue to take advantage of close proximity to larger wind markets will be determined by local and state decision makers. Louisiana also has great offshore wind potential.
According to the Southeastern Wind Coalition, at the time of publication Louisiana is home to 12 companies and facilities that are involved in the full value chain of the wind energy industry; for current information, see the Wind Industry Supply Chain Database and Map.157 GE Renewables operates a modular blade facility, formerly known as Blade Dynamics, in New Orleans. The facility is primarily focused on research and development. Extensive oil and gas-related industries may also play an important role in future offshore wind development, especially in the Gulf Region.
7.7.7 Mississippi In June 2015, South Mississippi Power Association issued an RFP for 250 MW of wind (SNL 2015). This encouraging development demonstrates that utilities in Mississippi are willing to consider renewables and understand the economic benefits of bringing clean, inexpensive power onto their grids.
Based on current and near-term future wind technology, potential economically developable wind terrain extends from along the Mississippi River Valley on the state’s western border to across the entire state (using taller turbine towers) (WINDExchange 2016b). The question of whether to develop local resources or take advantage of close proximity to larger wind markets in more western states will need to be determined by Mississippi decision makers in the near future.
According to the Southeastern Wind Coalition, Mississippi is home to four companies and facilities that are involved in the full value chain of the wind energy industry; for current information, see the Wind Industry Supply Chain Database and Map.158 Although the state has no utility-scale wind installed, the potential for wind development at 110-m hub heights,
157 http://www.sewind.org/map/find-companies 158 http://www.sewind.org/map/find-companies

115
This report is available at no cost from the National Renewable Energy Laboratory at www.nrel.gov/publications
primarily along the western edge of the state, is significant with a potential of 143.6 terrawatt-hours per year.
7.7.8 North Carolina North Carolina is home to the recently completed Amazon Wind Farm U.S. East project, the first commercial wind farm project in the state. The initial phase of 208 MW is located in Pasquotank County and Perquimans County in the northeastern part of the state (American Wind Energy Association 2016b).
In 2013, the North Carolina legislature passed a state wind permitting bill that gives the North Carolina Department of Environmental Quality full permitting authority over a project after it has received all of its separate county approvals (North Carolina Office of the Governor 2013). The Amazon project was permitted prior to the state permitting legislation and was not required to utilize the new process (Murawski 2015). The state permitting bill is yet to be tested, but it appears unclear, duplicative, and leaves a significant amount of discretion in the department’s hands about a project’s status. For example, the process requires numerous studies but does not identify standards for the studies to meet (King et al. 2016).
A new report from the North Carolina Clean Energy Technology Center and North Carolina Sea Grant compares wind energy permitting regulations in North Carolina and six other states.159 Lead author James King, a law fellow at the North Carolina Coastal Resources Law, Planning, and Policy Center, compared the policies for Maine, Oklahoma, Oregon, Oklahoma, South Dakota, and Virginia with those for North Carolina. The authors sought to illuminate stakeholders’ concerns about a lack of clarity regarding North Carolina’s wind permitting rules, notes co-author Ethan Case of the North Carolina Clean Energy Technology Center. This report catalogs wind permitting policies in other states that have successfully attracted out-of-state investors to build wind farms.
North Carolina Wind Working Group stakeholders had suggested that state wind regulations might be deterring investors due to their lack of clarity. This comparative analysis shows numerous policy and regulatory options from other states that could be applied to North Carolina to clarify regulations and make project assessment more efficient. High-level actions to clarify regulations include:
• Providing additional information and guidance for state wind policy features unique to North Carolina
• Providing objective rather than subjective standards for permit approval
• Providing criteria for the evaluation of required information for permits. Two additional wind projects have been announced this year in North Carolina. Timbermill Wind Farm, an Apex Clean Energy project located near the Amazon project in Chowan and Perquimmans Counties, could host up to 105 turbines with a nameplate capacity up to 300 MW. The project could be built on both timberlands as well as private farmland (Apex Clean Energy
159 http://go.ncsu.edu/o7aak7

116
This report is available at no cost from the National Renewable Energy Laboratory at www.nrel.gov/publications
2016). RES Americas is developing the second project, Little Alligator, in Tyrrell County in eastern North Carolina.
North Carolina’s 2015 and 2016 legislative sessions have not been friendly to the wind industry. A number of bills intended to repeal the state RPS or place additional burdens on wind permitting and tall structure development have been proposed. HB 763 was introduced to ban all wind development across all possible flight paths in the state, regardless of any other factors. This kind of legislation would be detrimental to the industry, and although it was not passed in the 2016 legislative session, industry stakeholders expect similar efforts from anti-wind legislators in 2017. The industry and clean energy groups, including the SWERC, have been active in efforts to defeat the anti-wind legislation.
According to the Southeastern Wind Coalition, North Carolina is home to approximately 68 companies and facilities that are involved in the full value chain of the wind energy industry; for current information, see the Wind Industry Supply Chain Database and Map.160 The state has seen a significant increase in the number of companies serving the wind industry over the past year due to construction in eastern North Carolina. Additional wind projects in the state can help to strengthen and build the local supply chain. The Amazon project will provide an opportunity for communities in the Southeast to see firsthand the benefits of utility-scale wind.
Coastal North Carolina has several kilowatts of distributed wind, some of which are Wind for Schools project turbines. North Carolina participates in the Wind for Schools project through the engagement of Appalachian State University, with the installation of 11 school systems within the state.
Offshore wind in the state has revolved around the BOEM lease process. North Carolina has three lease areas, the largest of which is scheduled to begin its lease process this year. The areas at the southern end of the state off the coast of Wilmington will be combined with the South Carolina lease process due to proximity with South Carolina’s Grand Strand lease area.
160 http://www.sewind.org/map/find-companies

117
This report is available at no cost from the National Renewable Energy Laboratory at www.nrel.gov/publications
SWERC Combats Misinformation in North Carolina, First Wind Farm Comes Online
In an effort to ensure continued responsible wind energy development and the economic benefits it can provide to North Carolina and the rest of the region, the Southeast Wind Energy Resource Center (SWERC) recently participated in an effort to ensure that local wind energy development regulations in Perquimans and Chowan Counties simultaneously address the concerns of the surrounding community but also are based in facts. This effort resulted in North Carolina’s first commercial wind farm, Amazon Wind Farm US East, coming online in February 2017.
Though Perquimans County is home to a portion of the Amazon Wind Farm, county commissioners had considered making changes to the existing ordinance that would potentially restrict additional developments. Stricter proposed regulations included a 1-mile setback from all roads, homes, and property lines; decommissioning bonds equivalent to the value to the wind farm; and maximum sound restrictions of 35 dba.
In Chowan County, the planning board proposed similar changes for its wind energy ordinance. After a 3-2 vote by the board to increase restrictions to wind development, Chowan County commissioners were tasked with deciding what changes would be made and whether they were necessary.
Since the approval of the recently proposed 300-MW Timbermill Wind project rested on both counties’ decision, SWERC provided property value information in the form of an NREL impact study, health information from a Massachusetts study, and economic information in the form of SWERC’s impact fact sheets to combat misinformation campaigns that were becoming widespread in the state. SWERC also provided a strong opinion regarding the need for projects that can contribute to any future economic development in North Carolina's counties. In addition, the Southeastern Wind Coalition, host of SWERC, spoke in person at the Chowan County meeting where the wind ordinance vote was held to accurately portray the economic impacts of wind energy development and to discuss the validity of the planning board's recommendations.
Stricter ordinances would have effectively negated all wind development in Chowan and Perquimans Counties, rendering them unable to take additional advantage of the economic benefits that come with projects like the Amazon Wind Farm. In the case of Amazon, the project will have supported 250 construction positions and 14 permanent positions. With an average annual salary of $80,000, the permanent operations and maintenance positions pay well above the median household income of $43,709 in Perquimans County. The project will also provide more than 60 landowners a total of approximately $624,000 in annual land lease payments. In addition, the counties will receive a total of $520,000 in tax revenue over the first year that will increase on an annual basis. Because a portion of the Amazon project is also located in nearby Pasquotank County, $250,000 of the total amount will go to Perquimans County. Once the project is online, it will become the largest taxpayer in both Perquimans and Pasquotank Counties.
Chowan and Perquimans County commissioners rejected proposed changes and continue regulating wind energy development under the existing ordinances. What this will ultimately mean for Timbermill Wind is yet to be determined, but by allowing these standards to remain, the opportunity for continued wind energy development and access to the associated economic benefits exists.

118
This report is available at no cost from the National Renewable Energy Laboratory at www.nrel.gov/publications
7.7.9 South Carolina South Carolina has a few kilowatts of wind power capacity installed as a result of Wind for Schools projects deployed in North Carolina, as well as ongoing efforts for offshore wind in the state. The state has four Wind Energy Areas in BOEM’s lease process and is in the process of determining interest from developers.161 In 2014, the South Carolina General Assembly passed a resolution in support of wind energy in the state. The resolution acknowledges the state’s wind manufacturing assets, offshore wind resource potential, supportive local governments, and Clemson University’s large-scale wind turbine drivetrain testing facility in Charleston. Several local governments in the state (Charleston, North Charleston, and North Myrtle Beach) have also expressed support for wind energy.
As with many states in the Southeast, South Carolina has limited terrain (primarily located in the center of the state) that would allow economically viable wind development given current technologies (WINDExchange 2016b). More important, however, South Carolina could benefit greatly from near-term future land-based wind technologies with taller towers and larger rotors (U.S. Department of Energy 2015b). South Carolina, with its abundant coastline and shallow waters, also has great potential for near- to mid-term offshore wind development.
The SWERC worked with the South Carolina Coastal Conservation League to provide an economic development fact sheet specific to South Carolina for use in discussions about the benefits of land-based wind energy to the state.162 South Carolina has leveraged its manufacturing expertise to gain numerous suppliers to the wind industry. According to the Southeastern Wind Coalition, South Carolina is home to approximately 47 companies and facilities that are involved in the full value chain of the wind energy industry; for current information, see the Wind Industry Supply Chain Database and Map.163
7.7.10 Tennessee Tennessee is home to the Southeast’s first commercial wind farm, the 29-MW Buffalo Mountain project completed in 2004. According to the Southeastern Wind Coalition, Tennessee is home to approximately 26 companies and facilities that are involved in the full value chain of the wind energy industry; for current information, see the Wind Industry Supply Chain Database and Map.164 The Tennessee Valley Authority has nine contracts with nine wind farms for more than 1,500 MW of wind energy.165
The Plains & Eastern Clean Line will bring 2,500 MW of wind resource from the Oklahoma Panhandle to a substation on the Tennessee Valley Authority grid in Covington, Tennessee. DOE’s participation in the line, announced in March 2016, has been critical for the project finding a path forward. This line will allow Tennessee Valley Authority to further enhance its participation in the wind industry (Clean Line Energy 2013).
Local development continues to be an option for Tennessee as well. Based on current wind technology, several regions in the west and central parts of the state have resources to support
161 http://www.boem.gov/South-Carolina/ 162 http://www.sewind.org/images/fact_sheets/SC_Wind_Economic_Development.pdf 163 http://www.sewind.org/map/find-companies 164 http://www.sewind.org/map/find-companies 165 https://www.tva.gov/Energy/Renewable-Energy-Solutions/Wind-Energy-Contracts

119
This report is available at no cost from the National Renewable Energy Laboratory at www.nrel.gov/publications
economic wind development (WINDExchange 2016b). Near-future technology opens up development potential across the western part of the state, which would sidestep many of the local concerns around ridgeline development.
The 71-MW Crab Orchard project announced by Apex Clean Energy in January 2016 would be the state’s largest project. The project is located in Cumberland County, not far from the existing Buffalo Mountain project.
7.7.11 Virginia Virginia’s proposed land-based wind projects are making progress, notably Apex Clean Energy’s Rocky Forge Wind Energy Project in Botetourt County (Hammack 2016). As the first wind project to go through Virginia’s “permit by rule” process for wind farms between 5 MW and 100 MW, the Rocky Forge project serves as a crucial test for other prospective wind projects in Virginia. In addition, EDP Renewables continues to gather information and engage local stakeholders around its newly announced project in Carroll County. Despite the increased activity around land-based wind projects, much of the focus remains on solar energy.
Virginia Electric and Power Company was awarded an offshore wind energy lease for the Virginia Wind Energy Area (Bureau of Ocean Energy Management 2016), and Virginia’s Department of Mines, Minerals and Energy was awarded a research lease for the two-turbine Virginia Offshore Wind Technology Advancement Project. This project, led by Dominion Virginia Power, would deploy two direct-drive Alstom wind turbines 26 miles off the coast of Virginia Beach. The project, designed to reduce costs and uncertainty for a future large-scale project, is undertaking a review process to find a path forward for the project after it failed to meet established milestones and therefore lost the ability to qualify for $40 million in additional funding from DOE (Dominion Power 2016). Given the cost hurdles faced, it is unlikely that the project will proceed in the near future.
Potential ridgetop development in Virginia mirrors development that has taken place in West Virginia, clearly demonstrating the potential development opportunities in the western part of the state. When considering near-future technology, the taller towers and advanced wind turbines could open up the eastern part of the state to more conventional land-based wind development.
According to the Southeastern Wind Coalition, Virginia is home to approximately 33 companies and facilities that are involved in the full value chain of the wind energy industry; for current information, see the Wind Industry Supply Chain Database and Map.166
JMU and Virginia Technical University offer wind education programs in the state. JMU participated in the inaugural DOE Collegiate Wind Competition and, as stated previously, DOE’s Wind for Schools program, which is discussed in greater detail in Section 7.3: Workforce Development. Virginia Tech is also an organizing member of the North American Wind Energy Academy.
166 http://www.sewind.org/map/find-companies

120
This report is available at no cost from the National Renewable Energy Laboratory at www.nrel.gov/publications
8 Updates for States Outside of RRC Regions The WINDExchange team based at the National Renewable Energy Laboratory (NREL) researched the current state of wind energy in states not directly supported by a Regional Resource Center (RRC) and compiled the following summaries. The states not supported by an RRC are California, Delaware, Kansas, Maryland, Nebraska, Oklahoma, Texas, and West Virginia.167 Stakeholders can consult U.S. Department of Energy’s (DOE’s) interactive Wind Vision Study Scenario Viewer168 to learn more about state-specific impacts from wind development.
8.1 Clean Power Plan In 2015, the U.S. Environmental Protection Agency (EPA) released the final Clean Power Plan (CPP), which proposed to regulate carbon dioxide emissions from existing power plants. The proposed rate-based emissions targets in the original plan for each state in the region are shown in Table 34. Some utilities are making progress toward the proposed CPP goals. Although the CPP may be delayed or not implemented, ultimately some states and utilities will make decisions based on the carbon impacts of the power sector. The following EPA data represent the best available information on potential state-by-state carbon reductions; however, it is likely that final targets, if any, will be determined in the future.
Table 34. Clean Power Plan Rate-Based Targets for States Not Directly Supported by a Regional Resource Center
2012 Rate-Based Baseline (lbs CO2/MWh)169
2022 Rate-Based Target (lbs CO2/MWh)
2030 Rate-Based Target (lbs CO2/MWh)
California 963 907 828
Delaware 1,254 1,093 916
Kansas 2,319 1,519 1,293 Maryland 2,031 1,510 1,287
Nebraska 2,161 1,522 1,296 Oklahoma 1,565 1,223 1,068
Texas 1,566 1,188 1,042
West Virginia 2,064 1,534 1,305 Sources: EPA, Center for Climate and Energy Solutions The Union of Concerned Scientists (UCS) performed an analysis of each state and its relative achievement of the CPP reduction targets under business-as-usual operations.170 Table 35 shows
167 The WINDExchange team based at NREL provides technical support for states not directly supported by an RRC. 168 http://en.openei.org/apps/wv_viewer/ 169 The rate-based approach is based on pounds of carbon dioxide emitted per megawatt-hour of generation; the mass-based approach is based on tons of carbon dioxide emitted per time period. See http://cdn.bipartisanpolicy.org/wp-content/uploads/2015/05/Rate-v-Mass.pdf for more information. 170 http://www.ucsusa.org/sites/default/files/attach/2015/08/States-of-Progress-Update_State%20Tables.pdf

121
This report is available at no cost from the National Renewable Energy Laboratory at www.nrel.gov/publications
each state’s achievement of the CPP goals with little to no action beyond planned activities, based on UCS scenarios. Based on current trajectories and plans, states are already implementing policies and developing projects that will help them realize a lower-carbon scenario, regardless of federal policies. Of course, wind energy development contributes to this and other clean power plans.
Table 35. Clean Power Plan Targets for States Not Directly Supported by a Regional Resource Center
UCS Analysis: Progress toward CPP 2022 Rate-Based Targets
UCS Analysis: Progress toward CPP 2030 Rate-Based Targets
UCS Analysis: Progress toward CPP 2022 Mass-Based Targets
UCS Analysis: Progress toward CPP 2030 Mass-Based Targets
California In compliance* >200% In compliance** >200% Delaware >200% 93% >200% 151% Kansas 20% 16% 25% 19% Maryland >200% >200% >200% >200% Nebraska 15% 8% 21% 9% Oklahoma 28% 21% 53% 29% Texas 11% 5% 19% 7% West Virginia 36% 15% 58% 19%
* “In compliance” reflects emissions rate reduction targets that are greater than baseline (2012) emission rates. ** “In compliance” reflects emissions targets that are greater than baseline (2012) emissions.
8.2 California As of September 2016, California’s installed wind capacity was 5,662 megawatts (MW) (American Wind Energy Association 2016a), including 75.7 MW of distributed wind (U.S. Department of Energy 2016a). This amount of development equates to an $11.9 billion capital investment (American Wind Energy Association 2016a). California generated 12,180 gigawatt-hours from wind in 2015, equivalent to approximately 6.21% of the state’s gross system power (California Energy Commission 2016b).
In October 2015, Governor Jerry Brown signed SB-350, increasing the state’s renewable portfolio standard (RPS) to 50% renewable energy by 2030. California’s original RPS called for 20% renewables by 2020. It was increased to 33% in 2011 (California Energy Commission 2016a). Six cities in California have established their own renewable energy goals that stretch beyond the state RPS. Del Mar, Palo Alto, San Diego, San Francisco, San Jose, and Santa Monica have goals of achieving 100% of their electricity from renewable sources (Sierra Club 2016).
Although the state has strong offshore wind potential, many challenges must be overcome prior to any project development. These challenges include establishing a more streamlined regulatory process and establishing an environmental baseline for potential project locations to understand impacts on avian and marine wildlife. The current high cost of offshore wind compared to land-based wind and solar has also been a challenge, although costs are expected to decline in the next decade. California’s deep waters will require floating platforms for offshore wind projects, and

122
This report is available at no cost from the National Renewable Energy Laboratory at www.nrel.gov/publications
these platforms are still in the prototype stage (van Dam 2014).171 With the large amount of solar power deployed in California, utilities are looking for a power source that will quickly ramp up as the sun goes down. According to NREL modeling, offshore wind seems to complement wind well during this time, with wind speeds increasing as solar ramps down. NREL researchers have also devised two offshore wind development scenarios with state gross domestic product impacts of $16.2 billion in Scenario B or $39.7 billion in Scenario A for construction; and $3.5 billion in Scenario B or $7.9 billion in Scenario A for the operations phases (Speer et al. 2016).
Trident Winds proposed California’s first offshore wind project in early 2016. If the 800-MW project were to move forward, it would consist of 100 floating turbines in Morro Bay and would contribute to the state meeting its new RPS goals (Lillian 2016).
State officials have been working to build the necessary transmission to achieve its targets. Two transmission projects will play an integral role in the state meeting its RPS goal. The $2.1 billion Tehachapi Renewable Transmission Project (Edison International) is a 173-mile project that is essentially complete and, when energized, will have the ability to transmit 4,500 MW of wind energy to the state (Southern California Edison 2014).
Siting challenges in California include impacts to wildlife (particularly raptors), desert tortoises, and other species. The state released its Desert Renewable Energy Conservation Plan in November 2015 to help address this issue, but the impact of this plan on wind energy’s ability to move forward in the state raised concerns regarding future development as the plan permanently closes millions of acres to clean energy development (Roth 2015).
California ranks third among the top five states for wind energy generation (the other top five states are Texas, Iowa, Oklahoma, and Illinois) (American Wind Energy Association 2016b). California is home to between 3,000 and 4,000 direct and indirect jobs related to the wind energy industry (American Wind Energy Association 2016a), and it ranked among the top four states in 2015 in terms of adding distributed wind capacity (2.48 MW) (U.S. Department of Energy 2016a).
171 As of October 2016, there are six operational floating offshore wind turbine projects in the water in Japan and Europe.

123
This report is available at no cost from the National Renewable Energy Laboratory at www.nrel.gov/publications
Figure 23. Map of school wind turbine projects, educational programs, and locations with both wind turbines and educational programs in California
Two California schools participated in the DOE Collegiate Wind Competition, with the California Maritime Academy participating in the 2014 and 2016 Collegiate Wind Competitions. California State University Chico was also an entrant for the 2016 Competition. Several universities in the state (such as the University of California, Davis and University of California, Berkeley) have been at the forefront of wind energy research. Visit the WINDExchange website for information about school wind projects and educational programs in California and other states.172
NREL researchers compiled the California wind energy manufacturing data in Table 36 as part of DOE’s annual wind market report effort (U.S. Department of Energy 2016b).
Table 36. California Wind-Related Manufacturing Overview
Name City Component
PowerWorks Tracy Distributed wind turbines
8.3 Delaware Delaware has 2 MW of wind capacity installed (a distributed wind project at the University of Delaware’s Lewes campus), representing $4 million in capital investment. The state has no wind projects under construction and no manufacturing facilities supporting the wind industry (American Wind Energy Association 2016a). Offshore wind has had difficulty gaining traction 172 http://apps2.eere.energy.gov/wind/windexchange/schools/

124
This report is available at no cost from the National Renewable Energy Laboratory at www.nrel.gov/publications
in the state. In late 2011, development ceased on the proposed 200-MW Mid-Atlantic Wind Park (Maryland Coast Dispatch 2011). No additional offshore wind projects have been proposed in the state since.
Delaware has implemented an aggressive RPS that requires all retail electricity suppliers to purchase 25% of the electricity sold in the state from renewable sources by the end of the 2026 state fiscal year. However, the RPS requirements leading to wind energy projects are effectively reduced by a determination that provides a two-times renewable energy credit multiplier for the energy output of certain natural gas-powered fuel cells (State of Delaware Public Service Commission 2011).
Figure 24. Map of sole educational program location in Delaware
The University of Delaware has developed extensive capabilities in offshore wind technology and research involving the social acceptance of land-based and offshore wind technologies. Visit the WINDExchange website for information about school wind projects and educational programs in Delaware and other states.173
8.4 Kansas As of September 2016, Kansas had 3,836 MW of installed wind capacity (American Wind Energy Association 2016a), including 10.2 MW of distributed wind (U.S. Department of Energy 2016a). In 2015, wind provided 28% of all in-state electricity production. This amount of development equates to a $7 billion capital investment (American Wind Energy Association 2016a). Wind energy provides further economic development in the state through wind turbine manufacturing. Siemens operates a $50 million nacelle assembly facility in Hutchinson. Kansas generated 10,927 gigawatt-hours from wind in 2015. With 1,259 MW of wind projects under construction in 2016, the state is looking to expand capacity from this clean energy resource (American Wind Energy Association 2016a).
173 http://apps2.eere.energy.gov/wind/windexchange/schools/

125
This report is available at no cost from the National Renewable Energy Laboratory at www.nrel.gov/publications
Wind energy also provided a hedge to Kansas counties as declines in oil prices and property valuation negatively impacted local budgets. In Barber County, revenue from wind energy development has softened the blow to the local economy from lost oil-related revenue. On an annual basis, the county receives nearly $500,000 in payments in lieu of taxes for turbines associated with Phase I and II of the Flat Ridge Wind Project. The county also receives $2,000 per MW from the Flat Ridge I and $3,000 per MW from the Flat Ridge II (Rose 2016) wind projects.
The state enacted an RPS in May 2009 that requires certain utilities to generate or purchase 20% of their electricity from renewable resources by 2020 (American Wind Energy Association 2016i). The RPS was repealed in May 2015 and replaced with a voluntary goal of 20% electricity from renewable resources by 2020. One town in Kansas established its own renewable energy goals that stretch beyond the state RPS. Greensburg established a goal of 100% renewable energy in 2007 and met the goal in 2013 primarily through energy generated by the 12.5-MW Greensburg Wind Farm (Sierra Club 2016).
Several barriers inhibit wind development in Kansas. According to a survey conducted by Kansas State University in 2010, environmental concerns rated the highest. People are concerned about potential development in the Flint Hills; the proximity of wind turbines to the great wetlands of Cheyenne Bottoms and Quivera Wildlife Refuge, a popular stopover point for waterfowl and cranes; and the impact on prairie chicken species that are under threat in Kansas. Other concerns about developing wind power in Kansas include health impacts and property rights. An additional barrier to wind development in the state is a lack of transmission from the wind-rich western part of the state to load centers in the eastern part of the state (National Renewable Energy Laboratory 2013).
Figure 25. Map of school wind turbine projects, educational programs, and locations with both wind turbines and educational programs in Kansas

126
This report is available at no cost from the National Renewable Energy Laboratory at www.nrel.gov/publications
Kansas participates in the Wind for Schools project through the engagement of Kansas State University, with 26 school systems installed. The state’s Wind Application Center is working to get these systems collecting data and sending information to the OpenEI turbine database.174
Kansas State University participated in the 2014 and 2016 Collegiate Wind Competition, and the University of Kansas also participated in the 2014 Collegiate Wind Competition. Visit the WINDExchange website for information about school wind projects and educational programs in Kansas and other states.175
NREL researchers compiled the following Kansas wind energy manufacturing data as part of DOE’s annual wind market report effort (U.S. Department of Energy 2016b).
Table 37. Kansas Wind-Related Manufacturing Overview
Name City Component
J.R. Custom Metal Products Wichita Machined components
Jupiter Group Junction City Nacelle covers and spinners
Siemens Hutchinson Turbines
8.5 Maryland As of September 2016, Maryland had 190 MW of installed wind (American Wind Energy Association 2016a), including 1.2 MW of distributed wind (U.S. Department of Energy 2016a). In 2015, wind provided 1% of all in-state electricity production. This amount of development equates to a $380 million capital investment (American Wind Energy Association 2016a). Maryland currently has one project under construction at the Crisfield Wastewater Treatment Plant that will offset energy used at the facility and add 750 kilowatts to the state’s total installed capacity (American Wind Energy Association 2016b).
With an RPS of 20% by 2022, Maryland has many additional opportunities for land-based and offshore projects, although most of the attention is focused on offshore wind (American Wind Energy Association 2016m). The Bureau of Ocean Energy Management (BOEM), under the U.S. Department of the Interior, granted a competitive lease for sites in Maryland (U.S. Department of Energy 2015a). Nearly 80,000 acres of offshore federal waters were auctioned off in August 2014 with U.S. Wind Inc. attaining the rights. Preliminary project planning is underway, and a site assessment plan will be submitted to BOEM (Wheeler 2015a).
An attempt to increase the RPS to 25% by 2020 was approved by the state House and Senate but was vetoed by the governor in May 2016 (Walton 2016). One city in Maryland established its own renewable energy goals that stretch beyond the state RPS (Sierra Club 2016). Columbia, home to approximately 100,000 people, reached this goal in September 2015; approximately
174 http://en.openei.org/wiki/Wind_for_Schools_Portal 175 http://apps2.eere.energy.gov/wind/windexchange/schools/

127
This report is available at no cost from the National Renewable Energy Laboratory at www.nrel.gov/publications
75% of this goal was met by renewable energy credits associated with wind energy (SunEdison 2015).
Land-based wind development has recently been hampered due to concerns related to potential radar, wildlife, aesthetic, and property value impacts (Wheeler 2015b). For example, after years of work to bring Apex Clean Energy’s proposed Mills Branch Wind project online, developers recently proposed a technology switch from wind to solar to gain broader project support and utilize existing interconnection rights (Davilio 2015). The Maryland Public Service Commission denied approval for the solar project in January 2017.
Although Maryland does not have many wind energy educational programs, the University of Maryland participated in the 2016 Collegiate Wind Competition. Visit the WINDExchange website for information about school wind projects and educational programs in Maryland and other states.176
Figure 26. Map of school wind turbine projects, educational programs, and locations with both wind turbines and educational programs in Maryland
NREL researchers compiled the following Maryland wind energy manufacturing data as part of DOE’s annual wind market report effort (U.S. Department of Energy 2016b).
Table 38. Maryland Wind-Related Manufacturing Overview
Name City Component LAI International Westminster Bearing cages
176 http://apps2.eere.energy.gov/wind/windexchange/schools/

128
This report is available at no cost from the National Renewable Energy Laboratory at www.nrel.gov/publications
8.6 Nebraska As of September 2016, Nebraska had 926 MW of installed wind capacity (American Wind Energy Association 2016a), including 14.3 MW of distributed wind that was installed between 2003 and 2015 (U.S. Department of Energy 2016a). In 2015, wind provided 9% of all in-state electricity production. This amount of development equates to a $1.7 billion capital investment (American Wind Energy Association 2016a). The state has three projects with signed power purchase agreements under construction totaling more than 480 MW (Nebraska Energy Office 2016). When the last of these installations is online, the state will have 1,326 MW in operation.
Additional commitments by local utilities are beginning to shape Nebraska’s energy future. Nebraska Public Power District is working to achieve its goal of 10% energy from renewable resources by 2020. In 2015, it announced the final route for its $361 million R-Project. 177 The 220-plus-mile project will provide new transmission capacity to address future renewable generation (Nebraska Public Power District 2015). Construction is expected to begin in October 2017 with an October 2019 in-service date. The Omaha Public Power District board approved work to support the Midwest Transmission Project, 178 a 180-mile transmission line that will run from Nebraska City to Sibley, Missouri. Scheduled to be in service by summer 2017, the project will help advance renewable energy and increase system reliability (Omaha Public Power District 2015a). The Omaha Public Power District also confirmed its plan to have more than 30% of future retail generation provided by renewable resources (Omaha Public Power District 2015b).
Figure 27. Map of school wind turbine projects, educational programs, and locations with both wind turbines and educational programs in Nebraska
177 http://www.nppd.com/rproject/ 178 http://midwesttransmissionproject.com/Default.htm

129
This report is available at no cost from the National Renewable Energy Laboratory at www.nrel.gov/publications
The Nebraska Farmers Union and the American Corn Growers Foundation Wealth from the Wind program perform public outreach to communities and have found that customers and landowners are very supportive of wind energy. In addition, since 2008, volunteers from farmer and rancher organizations, state agencies, public power utilities, and higher education institutions have organized the annual Nebraska Wind and Solar Conference and Exhibition to advance these industries in the state.179
Nebraska does not have an RPS or a renewable energy goal. In 2016, state legislators passed LB 824 in an effort to reduce regulations associated with wind energy. Beginning in July 2016, private developers will no longer have to apply with the Nebraska Power Review Board for project approval. Instead, they must notify the Review Board within 30 days of construction, ensuring that the project complies with local decommissioning requirements; that the project will enter into a joint transmission development agreement for interconnection; and that the project developers have consulted with the Game and Parks Commission for avoidance and mitigation strategies regarding any impacts on endangered species. The bill also allows projects to commence construction prior to having a signed power purchase agreement. The new legislation is designed to make Nebraska regionally competitive and facilitate new wind development in the state (Baird Holm 2016).
Nebraska participated in the original Wind for Schools project through the engagement of the University of Nebraska-Lincoln, with the installation of 25 K-12 partner school systems in the state. The University of Nebraska Wind Applications Center works with those partner schools to enhance their curriculum, career development, and the overall operation of their existing small-scale wind turbines in 2016. Visit the WINDExchange website for information about school wind projects and educational programs in Nebraska and other states.180
Nebraska has no wind-related manufacturing.
8.7 Oklahoma Oklahoma had 5,453 MW of installed wind capacity as of September 2016 (American Wind Energy Association 2016a), including 1.8 MW of distributed wind that was installed between 2003 and 2015 (U.S. Department of Energy 2016a). As of July 2016, wind provided 18.43% of all in-state electricity production. At the end of 2015, wind development in Oklahoma represented $9.6 billion capital investment with 1,194 MW of wind projects under construction in 2016 (American Wind Energy Association 2016a).
In 2010, Oklahoma set a renewable energy target for 15% of total installed generation capacity for operating electric utilities to be renewable sources by 2015. No further expansion of this goal has been announced (DSIRE 2015a).
Barriers to wind development in the state include legislation for decommissioning requirements, siting requirements (specifically setbacks defined by Senate Bill 808 for wind energy projects near schools, hospitals, and airports), as well as notification requirements (Monies 2015b). Some landowners have used the provision established in SB 808 to slow development by registering
179 http://nebraskawindandsolarconference.com/ 180 http://apps2.eere.energy.gov/wind/windexchange/schools/

130
This report is available at no cost from the National Renewable Energy Laboratory at www.nrel.gov/publications
private airstrips on their property with the Federal Aviation Administration. As of May 2016, more than two dozen private airstrips had been registered (Monies 2016).
In other legislative news, a bid to end the state’s zero-emission tax credit 2 years earlier than its current January 1, 2021 expiration date failed in an Oklahoma House committee (Ellis 2016). The half-cent tax credit is provided for every kilowatt of electricity from zero-emissions sources (Ellis and Monies 2016).
Oklahoma wind energy developments export clean energy to multiple states, including Alabama, Nebraska, Arkansas, and Colorado (Teague 2015). In March 2016, DOE announced that it will participate in the development of the Plains & Eastern Clean Line Project (Clean Line), a major clean energy infrastructure project that if completed will transport up to 4,000 MW of low-cost wind generation resources in the Oklahoma and Texas panhandle regions to the mid-South and Southeast United States (U.S. Department of Energy 2016c).
Oklahoma also is home to a national example of the private sector owning, developing, or purchasing directly from wind projects. In 2015, Google announced that it would purchase energy from two new wind projects in Oklahoma to help power its data centers in the state (Monies 2015a).
Visit the WINDExchange website for information about school wind projects and educational programs in Oklahoma and other states.181
Figure 28. Map of school wind educational programs in Oklahoma
181 http://apps2.eere.energy.gov/wind/windexchange/schools/
131
This report is available at no cost from the National Renewable Energy Laboratory at www.nrel.gov/publications
NREL researchers compiled the following Oklahoma wind energy manufacturing data as part of DOE’s annual wind market report effort (U.S. Department of Energy 2016b).
Table 39. Oklahoma Wind-Related Manufacturing Overview
Name City Component Bergey Windpower Norman Distributed wind turbines
Trinity Structural Towers Tulsa Towers
8.8 Texas As of September 2016, Texas had an installed wind capacity of 18,531 MW (American Wind Energy Association 2016a), including 194.3 MW of distributed wind that was installed between 2003 and 2015 (U.S. Department of Energy 2016a), more than any other state in the nation (American Wind Energy Association 2016b). As of July 2016, wind provided 12% of all in-state electricity production. With 5,040 MW of wind projects under construction in 2016, the state is looking to expand capacity from this clean energy resource. At the end of 2015, wind development in the Lone Star State represented $32.7 billion capital investment (American Wind Energy Association 2016a). In fact, in 2016, Texas produced more wind power in a given amount of time than ever in history: 48% of the total electricity load of the state’s main power grid.
Texas established an RPS in 1999 and amended it in 2005. The current RPS requires 5,880 MW of renewable energy by 2015 and a target of 10,000 MW of renewable capacity by 2025 (which the wind energy industry met in 2010) (American Wind Energy Association 2016a).
New transmission continues to be proposed in the state. In March 2016, Sharyland Utilities proposed a $77.4 million, 166-mile expansion with the Public Utility Commission of Texas. The project is planned to serve developments that are expected to come online in December 2017 (Welch 2016). That same month, DOE announced that it will participate in the development of the Plains & Eastern Clean Line Project (Clean Line), a major clean energy infrastructure project that if completed will transport up to 4,000 MW of low-cost wind generation resources in the Oklahoma and Texas panhandle regions to the mid-South and Southeast United States (U.S. Department of Energy 2016c).
One city in Texas has established its own renewable energy goals that stretch beyond the state RPS. Georgetown, a small city 25 miles north of Austin, announced that its municipal utility, Georgetown Utility Systems, could get 100% of its electricity from renewable sources by 2017 (Sierra Club 2016). Part of this commitment will be achieved through the purchase of 144 MW from the Spinning Spur 3 wind farm in west Texas.
Corporate ownership and wind energy purchases have also been prevalent across the state, highlighting a market that is becoming more popular. Announced deals within Texas include those from 3M, Dow Chemical, Facebook, General Motors, Google, Hewlett-Packard, Ikea, Mars Global, Microsoft, Procter and Gamble, Wal-Mart, and others (Clark 2016).

132
This report is available at no cost from the National Renewable Energy Laboratory at www.nrel.gov/publications
In 2016, Texas produced more wind power in a given amount of time than ever in history. The state reached “peak wind” at 1:10 a.m. on March 23, when the state’s wind farms produced 13,154 MW of electricity, or 48.28% of the total 27,245 MW electricity load of the state’s main power grid (Trabish 2016). On November 27, wind electricity generation in Texas hit a new peak record, representing approximately 45% of total electric demand and topping 15,000 MW for the first time (S&P Global Platts 2016).
Texas has several educational programs that focus on wind energy at Texas Tech University; the University of Houston; and Texas State Technical College, West Texas. Visit the WINDExchange website for information about school wind projects and educational programs in Texas and other states.182
Figure 29. Map of school wind turbine projects, educational programs, and locations with both wind turbines and educational programs in Texas
NREL researchers compiled the following Texas wind energy manufacturing data as part of DOE’s annual wind market report effort (U.S. Department of Energy 2016b).
182 http://apps2.eere.energy.gov/wind/windexchange/schools/

133
This report is available at no cost from the National Renewable Energy Laboratory at www.nrel.gov/publications
Table 40. Texas Wind-Related Manufacturing Overview
Name City Component All-Pro Fasteners Arlington Bolts Alstom Power Amarillo Turbines Barr Fabrication Brownwood Tower internals Broadwind Abilene Towers CAB Inc. Nacogdoches Flanges CB Gear and Machine Houston Gears Diab Inc. Desoto Blade cores EMA Electromecanica Sweetwater Electronics Molded Fiber Glass Gainesville Blades RBC Bearings Houston Bearings NGC Renewables Fort Worth Gearboxes
8.9 West Virginia As of September 2016, West Virginia had 583 MW of installed wind capacity (American Wind Energy Association 2016a), including .1 MW of distributed wind capacity installed between 2003 and 2015 (U.S. Department of Energy 2016a). The vast majority of this clean generation comes from five wind projects that have been installed across the state. This amount of development equates to a $1.2 billion capital investment (American Wind Energy Association 2016a). A sixth wind farm, the 103-MW New Wind Creek project, is in development (Enbridge 2016).
In early 2015, West Virginia lawmakers repealed the state’s Alternative and Renewable Energy Portfolio Standard that required certain utilities to derive 25% of their sales from alternative and renewable energy resources by 2025 (Sadasivam 2015).
While wind energy accounted for 2% of the state’s net electricity generation as of July 2016 (American Wind Energy Association 2016a), coal-fired electric power plants continued to dominate in the state, accounting for 94% of net electricity generation (U.S. Energy Information Administration 2016). Increased diversification of the state’s energy generation was announced in 2015 as West Virginia’s utilities were required to release integrated resource plans to the public that identify energy sources to meet future demand. Although a majority of the state’s utilities intend to rely on continued coal generation, Appalachian Power anticipates 750 MW of wind generation that will help to diversify its energy portfolio while addressing future energy needs (Brown 2016). As part of this effort, the company announced that it would purchase 120 MW of wind power from NextEra’s Bluff Point Wind Energy Center in Indiana beginning when the project is completed in 2018 (Tincher 2016).
Wildlife concerns, primarily related to bats, continue to affect project development in the state. Land use issues regarding mountain top mining impacts in the southern part of the state have also created challenges (Dutton et al. 2014).

134
This report is available at no cost from the National Renewable Energy Laboratory at www.nrel.gov/publications
Figure 30. Map of sole school wind educational program in West Virginia
Visit the WINDExchange website183 for information about school wind projects and educational programs in West Virginia and other states.
183 http://apps2.eere.energy.gov/wind/windexchange/schools/

135
This report is available at no cost from the National Renewable Energy Laboratory at www.nrel.gov/publications
9 References Alabama Power. 2016. “Chisholm View, Buffalo Dunes projects provide cost-effective power.” Accessed October 22, 2016. http://www.alabamapower.com/environment/news/chisholm-view-project-provides-low-cost-power.asp
American Wind Energy Association. 2016a. “U.S. Wind Energy State Facts.” Accessed October 24, 2016. http://www.awea.org/resources/statefactsheets.aspx?itemnumber=890&navItemNumber=5067
American Wind Energy Association. 2016b. “U.S. Wind Industry Third Quarter 2016 Market Report.” Accessed October 24, 2016.
Apex Clean Energy. Timbermill Wind. Accessed December 9, 2016. http://www.timbermillwind.com/
Baird Holm. 2016. “Landmark Legislation Deregulates Development of Private Renewable Energy Facilities.” April 21. http://www.bairdholm.com/press-releases/entry/landmark-legislation-deregulates-development-of-private-renewable-energy-facilities.html
Boughton, Kathryn. 2015. “Wind Energy Turbines Rising.” Republican-American, August 4. http://rep-am.com/articles/2015/08/04/news/local/899126.txt
Brown, Andrew. 2016. “Appalachian Power Moves toward Renewables, Mon Power Considering More Investments in Coal.” Charleston Gazette Mail, January 9. http://www.wvgazettemail.com/business/20160109/appalachian-power-moves-toward-renewables-mon-power-considering-more-investments-in-coal
Bureau of Ocean Energy Management. 2016. Commercial Lease for Wind Energy Offshore Virginia. Accessed October 22, 2016. http://www.boem.gov/Renewable-Energy-Program/Commercial-Lease-Offshore-VA/
California Energy Commission. 2016a. California Renewable Energy Overview and Programs. http://www.energy.ca.gov/renewables/
California Energy Commission. 2016b. Wind Energy in California. Accessed September 1, 2016. http://www.energy.ca.gov/wind/
Charney, Alberta H., Valorie Rice, Marshall J. Vest, Anthony V. Popp, James Peach, and Leo Delgado. 2011. SunZia Southwest Transmission Project Economic Impact Assessment. Accessed July 13, 2016. http://www.sunzia.net/documents_pdfs/sunzia_eia_revised_final_jan_2012.pdf
Chilson, Morgan. 2016. “United Wind Introduces Third-Party Leasing to Wind Energy Market.” Topeka Capital-Journal, March 12. http://cjonline.com/news/business/2016-03-12/united-wind-introduces-third-party-leasing-wind-energy-market#
Clark, Jeffrey. 2016. “All in on Lone Star Wind.” North American Windpower, August. http://nawindpower.com/online/issues/NAW1608/FEAT_01_All-In-On-Lone-Star-Wind.html

136
This report is available at no cost from the National Renewable Energy Laboratory at www.nrel.gov/publications
Clean Line Energy. 2013. “Plains and Eastern Clean Line: Clean and Affordable Energy for the Mid-South and Southeast.” http://www.cleanlineenergy.com/sites/cleanline/media/TVPPA_handout_mar2013.pdf
Clean Line Energy Partners. 2016a. Clean Line Energy and Others Ask Illinois Supreme Court to Decide the fate of Wind Energy Power Line, September 14. Accessed September 20, 2016. http://www.cleanlineenergy.com/sites/cleanline/media/news/PLA_Filing_press_release.pdf
Clean Line Energy Partners. 2016b. Grain Belt Express Clean Line Schedule. Accessed September 20, 2016. http://www.grainbeltexpresscleanline.com/site/page/schedule
Congressional Research Service. (December 29, 2014). Federal Land Ownership: Overview and Data. https://www.fas.org/sgp/crs/misc/R42346.pdf
Davilio, Daniel. 2015. “Wind Project Converting to Solar.” MyEasternShoreMD, December 18. http://www.myeasternshoremd.com/news/kent_county/article_52d1e73d-0ed0-5270-ad74-c19ba83c98b7.html
Doerr, Alissa. 2015. Zoned Out: An Analysis of Wind Energy Zoning in Four Midwest States. Center for Rural Affairs. http://www.cfra.org/zoned-out-wind-energy-analysis
Dominion Power. 2016. “Dominion Virginia Power Considers Options for Offshore Wind Demonstration Project after Federal Grant Withdrawal.” https://www.dom.com/corporate/news/news-releases/137136
DSIRE. 2015a. Oklahoma Renewable Energy Goal, last modified December 15, 2015. http://programs.dsireusa.org/system/program/detail/4178
DSIRE. 2015b. Renewable Energy Standard Program Overview, last modified June 16, 2015. http://programs.dsireusa.org/system/program/detail/5786
Dumat-Ol Daleno, Gaynor. 2016. “GPA’s First Wind Turbine Begins Test Run.” Pacific Daily News, January 12. http://www.guampdn.com/story/news/2016/01/12/gpas-first-wind-turbine-begins-test-run/78670908/
Dutton, James; King, Adam; and Catrina Sedgwick. 2014. “Renewable Energy Source for West Virginia is Blowing in the Wind.” Mountaineer News Service, February 13. http://mountaineernewsservice.com/renewable-energy-source-for-west-virginia-is-blowing-in-the-wind/
Edison International. “Renewable Transmission.” Accessed February 11, 2016. https://www.sce.com/NR/rdonlyres/7A4E0141-E3F7-4092-8E14-3DF6189D211D/0/090318_SCE_Backgrounder_RAP.pdf

137
This report is available at no cost from the National Renewable Energy Laboratory at www.nrel.gov/publications
Electric Cooperatives of Arkansas. 2014. “Arkansas Electric Cooperative Corporation adds 150 megawatts of wind energy.” Accessed October 22, 2016. https://www.aecc.com/sites/aecc.com/files/Wind%20Capacity%2011-26-14.pdf
Electric Cooperatives of Arkansas. 2015. “Arkansas Electric Cooperative Corporation adds 108 megawatts of wind energy.” Accessed October 22, 2016. https://www.aecc.com/sites/aecc.com/files/Drift%20Sand.pdf
Ellis, Randy. 2016. “Oklahoma House Committee Defeats Bill to Speed up End of Wind Energy Tax Credit.” The Oklahoman, May 16. http://newsok.com/article/5498579
Ellis, Randy, and Paul Monies. 2016. “Tax Incentives for Oklahoma Wind Farms Are Getting Scrutiny.” The Oklahoman, April 24. http://newsok.com/article/5493853
Enbridge. 2016. New Creek Wind Project. Accessed September 10, 2016. http://www.enbridge.com/projects-and-infrastructure/projects/new-creek-wind-project
Funk, John. 2015. “Drilling for Wind: LEEDCo Fields International Geotechnical Team 10 Miles Offshore.” Cleveland Plain Dealer, September 3. http://www.cleveland.com/business/index.ssf/2015/09/drilling_for_wind_leedco_field.html
Georgia Power. 2016. Georgia Power Company’s 2016 Integrated Resource Plan and Application for Decertification of Plant Mitchell Units 3, 4A and 4B, Plant Kraft Unit 1CT, and Intercession City CT Docket No. 40161.” Accessed October 22, 2016. http://mediad.publicbroadcasting.net/p/wabe/files/201602/2016_irp_main_doc__pdf_.pdf
Georgia Public Service Commission. 2014. Commission Approves Wind Power Electric Generation as Part of Georgia Power Company’s Resource Mix. Accessed October 22, 2016. http://www.psc.state.ga.us/GetNewsRecordAttachment.aspx?ID=447
Hammack, Laurence. 2016. “Botetourt County approves wind farm permit unanimously.” The Roanoke Times, January 26. http://www.roanoke.com/news/local/botetourt_county/botetourt-county-approves-wind-farm-permit-unanimously/article_de52c1c7-6099-5894-8a3f-0d19a02f9c63.html
Hawaii Clean Energy Initiative. “Governor signs bill setting Hawaii’s renewable energy goal at 100%.” Last modified June 9, 2015. http://www.hawaiicleanenergyinitiative.org/governor-signs-bill-setting-hawaiis-renewable-energy-goal-at-100/
Jimenez, Tony; Keyser, David; and Suzanne Tegen. 2016a. Floating Offshore Wind in Hawaii: Potential for Jobs and Economic Impacts from Two Future Scenarios. NREL/TP-5000-65481. National Renewable Energy Laboratory (NREL), Golden, CO (US). http://www.nrel.gov/docs/fy16osti/65481.pdf

138
This report is available at no cost from the National Renewable Energy Laboratory at www.nrel.gov/publications
Jimenez, Tony; Keyser, David; and Suzanne Tegen. 2016b. Floating Offshore Wind in Oregon: Potential for Jobs and Economic Impacts in Oregon Coastal Counties from Two Future Scenarios. NREL/TP-5000-65432. National Renewable Energy Laboratory (NREL), Golden, CO (US). http://www.nrel.gov/docs/fy16osti/65432.pdf
Jimenez, Tony; Keyser, David; Tegen, Suzanne; and Bethany Speer. 2016c. Floating Offshore Wind in Oregon: Potential for Jobs and Economic Impacts from Two Future Scenarios. NREL/TP-5000-65421. National Renewable Energy Laboratory (NREL), Golden, CO (US). http://www.nrel.gov/docs/fy16osti/65421.pdf
Joseph, Carl. September 27, 2016. U.S. Virgin Islands Energy Office; personal conversation
King, James; Schiavanato, Lisa; and Ethan Case. 2016. Wind Energy Permitting in North Carolina and Six Other States: A Comparative Analysis. https://ncseagrant.ncsu.edu/ncseagrant_docs/products/2010s/NC_Wind_Analysis_Final.pdf
Kodiak Electric Association. Generation Statistics. Accessed September 19, 2016. http://www.kodiakelectric.com/generation.html
Kuckro, Rod. 2016. “Report: State Renewable Energy Standards Succeeding, at Little Cost.” EnergyWire, April 8. http://midwestenergynews.com/2016/04/08/report-state-renewable-energy-standards-succeeding-at-little-cost/
Lillian, Betsy. 2016. “BOEM Completes Initial Review of Huge Wind Farm Offshore California.” North American Windpower, March 21. http://nawindpower.com/boem-completes-initial-review-of-huge-wind-farm-offshore-california
Louisiana Wind. http://www.lawind.com/about. Accessed October 22, 2016.
Maryland Coast Dispatch. 2011. “Delaware Wind Contract Cancelled.” http://mdcoastdispatch.com/2011/12/29/del-wind-contract-cancelled/
Massachusetts Clean Energy Center. (March 26, 2014). “Energy Officials Approve Relief Funding for Falmouth Community Wind Project.” http://www.masscec.com/about-masscec/news/energy-officials-approve-relief-funding-falmouth-community-wind-project
Mass Energy Consumers Alliance. “Local Wind Turbines, Sources of Green Power for Our Members.” Accessed February 7, 2016. https://www.massenergy.org/renewable-energy/wind
Monies, Paul. 2015a. “Duke Energy, Google Announce Deals for Three Oklahoma Wind Power Projects.” The Oklahoman, December 4. http://newsok.com/article/5464636
Monti, Marti; Stephen Rose; Kimberley A. Mullins; Elizabeth J. Wilson. 2016. “Transmission Planning and CapX 2020: Building Trust to Build Regional Transmission Systems.” Accessed October 22, 2016. https://www.hhh.umn.edu/sites/hhh.umn.edu/files/capx2020_final_report.pdf

139
This report is available at no cost from the National Renewable Energy Laboratory at www.nrel.gov/publications
Monies, Paul. 2015b. “Oklahoma Bill Puts Siting Restrictions and Reporting Requirements on Wind Farms.” The Oklahoman, April 1. http://newsok.com/article/5406313
Monies, Paul. 2016. “Oklahoma Landowners Register Private Airstrips to Keep Wind Farms at Bay.” The Oklahoman, May 22. http://newsok.com/oklahoma-landowners-register-private-airstrips-to-keep-wind-farms-at-bay/article/5499575
Morris, Allie. 2014. “Iberdrola Abandons Wild Meadows Wind Farm, Raising Questions about Future of Wind Power in New Hampshire.” Concord Monitor, May 28. http://www.concordmonitor.com/news/nation/world/12150881-95/ibredrola-abandons-wild-meadows-wind-farm-raising-questions-about-future-of-wind-power-in
Mullin, Robert. 2016. “Governor Delays CAISO Regionalization Effort.” RTO Insider, August 9. https://www.rtoinsider.com/jerry-brown-caiso-regionalization-30124/
Murawski, John. 2015. “NC Coastal Residents Sue to Block Amazon Wind Farm.” The News & Observer, October 1. http://www.newsobserver.com/news/business/article37244796.html
National Renewable Energy Laboratory. (June 2013). Wind Powering America’s Regional Stakeholder Meetings and Priority State Reports. http://www.nrel.gov/docs/fy13osti/56289.pdf
National Renewable Energy Laboratory. 2015. Energy Transition Initiative: Energy Snapshot, U.S. Virgin Islands. http://www.nrel.gov/docs/fy15osti/62701.pdf
National Renewable Energy Laboratory. 2015. 2014-2015 U.S. Offshore Wind Technologies Market Report. NREL/TP-5000-64283. http://www.nrel.gov/docs/fy15osti/64283.pdf
Nebraska Energy Office. Wind Energy Generation in Nebraska. Last modified September 8, 2016. http://www.neo.ne.gov/statshtml/89.htm
Nebraska Public Power District. NPPD Announces Final R-Project Transmission Line Route. Last modified January 26, 2015. http://www.nppd.com/2015/nppd-announces-final-r-project-transmission-line-route/
Ness, Eric; Haase, Scott; and Misty Conrad. 2016. American Samoa Energy Action Plan. National Renewable Energy Laboratory. http://www.nrel.gov/docs/fy16osti/67091.pdf
New Mexico Energy, Minerals and Natural Resources Department. February 2015. Economic Analysis of the New Mexico Renewable Energy Production Tax Credit. http://www.emnrd.state.nm.us/ECMD/CleanEnergyTaxIncentives/documents/REPTCFinalReportFeb2015.pdf
New York State Energy Research and Development Authority. New York Renewable Portfolio Standard. Accessed February 11, 2016. http://www.nyserda.ny.gov/About/Renewable-Portfolio-Standard

140
This report is available at no cost from the National Renewable Energy Laboratory at www.nrel.gov/publications
North Carolina Office of the Governor. 2013. “Governor Pat McCrory signs wind energy bill into law in support of all-of-the-above energy plan.” May 17, http://governor.nc.gov/press-release/governor-pat-mccrory-signs-wind-energy-bill-law-support-%E2%80%9Call-above%E2%80%9D-energy-plan
Omaha Public Power District. 2015a. “OPPD Board Approves Work to Support Midwest Transmission Project,” August 14. http://www.oppd.com/news-resources/news-releases/2015/august/oppd-board-approves-work-to-support-midwest-transmission-project/
Omaha Public Power District. 2015b. “OPPD to Work with New Developer on Largest Wind Development in Nebraska,” April 30. http://www.oppd.com/news-resources/news-releases/2015/april/oppd-to-work-with-new-developer-on-largest-wind-development-in-nebraska/
Ozarks Electric Cooperative Corporation. 2012. “Arkansas Electric Cooperative Corporation Adds Wind Capacity.” Accessed October 22, 2016. http://www.ozarksecc.com/newsblog/arkansas-electric-cooperative-corporation-adds-wind-capacity
Pennsylvania Public Utility Commission 2016. Pennsylvania Alternative Energy Portfolio Standard Program. Accessed February 7, 2016. http://www.pennaeps.com/aboutaeps/
Pillion, Dennis. 2015. “PSC approves Alabama Power’s renewable energy project request, with modifications.” AL.com, September 1. http://www.al.com/news/index.ssf/2015/09/psc_approves_alabama_powers_re.html
Preedom, Matthew. 2015. “Wind Turbines: Do Property Values Fall?” Milton Independent, August 27. http://www.miltonindependent.com/wind-turbines-do-property-values-fall/
Ramseur, Jonathan L. and James E. McCarthy. (2015). EPA’s Clean Power Plan: Highlights of the Final Rule. Congressional Research Service, August 14. https://www.fas.org/sgp/crs/misc/R44145.pdf
Ring, Wilson. 2015. “Vermont Taking Breather from Wind Power.” Burlington Free Press, April 13. http://www.burlingtonfreepress.com/story/news/2015/04/13/vermont-taking-breather-from-wind-power/25700545/
Rose, Gale. 2016. “Wind Turbines Generate Revenue in Neighboring County.” The Pratt Tribune, February 27. http://www.pratttribune.com/news/20160227/wind-turbines-generate-revenue-in-neighboring-county
Roth, Sammy. 2015. “After 7 Years, Desert Renewable Energy Plan Finalized.” The Desert Sun, November 10. http://www.desertsun.com/story/tech/science/energy/2015/11/10/after-7-years-desert-renewable-energy-plan-finalized/75468628/

141
This report is available at no cost from the National Renewable Energy Laboratory at www.nrel.gov/publications
S&P Global Platts (2016). “ERCOT sets new wind output record of 15,033 MW.” http://www.platts.com/latest-news/electric-power/houston/ercot-sets-new-wind-output-record-of-15033-mw-21198056
Sadasivam, Naveena. 2015. “In W.Va., New GOP Majority Defangs Renewable Energy Law That Never Had a Bite.” Inside Climate News, February 5. http://insideclimatenews.org/news/20150205/wva-new-gop-majority-defangs-renewable-energy-law-never-had-bite
Seufert, Dan. 2014. “Plug Pulled on $150M Wind Farm over Unfriendly Political, Regulatory Climate.” New Hampshire Union Leader, May 27. http://www.unionleader.com/apps/pbcs.dll/article?AID=/20140527/NEWS05/140529161
Sierra Club. 2016. “Cities are Ready for 100% Renewable Energy.” https://www.sierraclub.org/sites/www.sierraclub.org/files/blog/RF100-Case-Studies-Cities-Report.pdf
Skidaway Campus Notes. 2016. “Meteorological tower erected on campus.”Accessed October 22, 2016. https://skidawaycampusnotes.com/tag/wind-energy/
SNL. 2015. “After dropping plans for Kemper IGCC stake, Mississippi co-op to buy wind power.” Accessed October 22, 2016. https://www.snl.com/Interactivex/article.aspx?CdId=A-32821399-10800
Southern California Edison. Tehachapi Renewable Transmission Project – Construction Update. Last modified December 2014. https://www.sce.com/wps/wcm/connect/0d5c70db-d283-4f5d-8a98-89ee7f2ecde2/TRTP_NewsletterQ42014_NLAK_mobile.pdf?MOD=AJPERES
Southern Wind Energy Association. 2016. Louisiana Wind Energy Opportunities. http://www.southernwind.org/uploads/1/9/8/9/19892499/swea_louisiana_fact_sheet_2016.pdf
Southwestern Electric Power Company. “Wind Power Purchases.” Accessed October 22, 2016. https://www.swepco.com/info/projects/WindPowerPurchase/
Speer, Bethany; Keyser, David; and Suzanne Tegen. 2016. Floating Offshore Wind in California: Gross Potential for Jobs and Economic Impacts from Two Future Scenarios. NREL/TP-5000-65352. National Renewable Energy Laboratory (NREL), Golden, CO (US). http://www.nrel.gov/docs/fy16osti/65352.pdf
sPower. (2016). “sPower Latigo Wind Park Commissioned, Generating Clean Energy.” Accessed September 19, 2016. http://www.spower.com/news_2016/news-2016-03-11.php
State of Delaware Public Service Commission. 2011. In the Matter of the Application of Delmarva Power and Light Company for Approval of PSC Docket No. 11-362 Qualified Fuel Cell Provider Project Tariffs. http://depsc.delaware.gov/orders/8079.pdf

142
This report is available at no cost from the National Renewable Energy Laboratory at www.nrel.gov/publications
State of Hawaii. 2015. Status and Progress of Clean Energy Initiatives and Analysis of the Environmental Response, Energy, and Food Security Tax. http://files.hawaii.gov/dbedt/annuals/2015/2015-seo-essf.pdf
SunEdison. 2015. “Columbia, Md. Now 100 Percent Renewable with Latest Solar Farm from SunEdison.” PR Newswire. http://www.prnewswire.com/news-releases/columbia-md-now-100-percent-renewable-with-latest-solar-farm-from-sunedison-300141481.html
SunZia Southwest Transmission Project. “Project Description.” Accessed July 13, 2016. http://www.sunzia.net/project_information.php
Teague, Michael. 2015. “Fossil-Fuel-Rich Oklahoma Digs into Wind Energy.” North American Windpower, January. http://nawindpower.com/online/issues/NAW1501/FEAT_03_Fossil-Fuel-Rich-Oklahoma-Digs-Into-Wind-Energy.html
Texas A&M Engineering Experiment Station. 2016. “Press Release: Louisiana wind developer announces 150-MW sustainable energy project in Evangeline Parish.”Accessed October 22, 2016. http://www.publicnow.com/view/2652F051A421488C80B29C2B43B75E753EE48D64?2016-05-20-22:00:51+01:00-xxx5819
Tincher, Sarah. 2016. “Appalachian Power Announces Plans to Add Wind Power to the Mix.” State Journal, June 2. http://www.statejournal.com/story/32123902/appalachian-power-announces-plans-to-add-wind-power-to-the-mix
Trabish, Herman K. 2016. “With Another Generation Record, Texas Edges Closer to 50% Wind Penetration.” Utility Dive, April 8. http://www.utilitydive.com/news/with-another-generation-record-texas-edges-closer-to-50-wind-penetration-1/417089/
TransWest Express. Accessed July 13, 2016. http://www.transwestexpress.net/index.shtml
Uhlenhuth, Karen. 2016a. “Group Challenges Missouri Utilities on Renewable Standard Compliance.” Midwest Energy News, June 28. http://midwestenergynews.com/2016/06/28/group-challenges-missouri-utilities-on-renewable-standard-compliance/
Uhlenhuth, Karen. 2016b. “Small Utilities More Likely to Seek Out Renewables after FERC Ruling.” Midwest Energy News, July 5. http://midwestenergynews.com/2016/07/05/small-utilities-more-likely-to-seek-out-renewables-after-ferc-ruling/
U.S. Bureau of Land Management. 2016. NEPA Hot Sheet Spring 2016: BLM Wyoming Land Use Plans and Proposed Projects. Accessed October 22, 2016. http://www.blm.gov/style/medialib/blm/wy/information/NEPA.Par.94494.File.dat/hot_sheet.pdf

143
This report is available at no cost from the National Renewable Energy Laboratory at www.nrel.gov/publications
U.S. Department of Energy. 2015b. Enabling Wind Power Nationwide. DOE/EE-1218. http://energy.gov/sites/prod/files/2015/05/f22/Enabling%20Wind%20Power%20Nationwide_18MAY2015_FINAL.pdf
U.S. Department of Energy. 2015d. Wind Vision: A New Era for Wind Power in the United States. DOE/GO-102015-4557. http://energy.gov/eere/wind/wind-vision
U.S. Department of Energy. 2016a. 2015 Distributed Wind Market Report. PNNL-25636. Pacific Northwest National Laboratory (PNNL), Richland, WA (US). http://energy.gov/sites/prod/files/2016/08/f33/2015-Distributed-Wind-Market-Report-08162016_0.pdf
U.S. Department of Energy. 2016b. 2015 Wind Technologies Market Report. DOE/GO-10216-4885. http://energy.gov/sites/prod/files/2016/08/f33/2015-Wind-Technologies-Market-Report-08162016.pdf
U.S. Department of Energy. 2016c. “Energy Department Announces Participation in Clean Line’s Large-Scale Energy Transmission Project.” http://energy.gov/articles/energy-department-announces-participation-clean-line-s-large-scale-energy-transmission-1
U.S. Department of the Interior. 2015. Historic Conservation Campaign Protects Greater Sage Grouse. Accessed September 24, 2016. https://www.doi.gov/pressreleases/historic-conservation-campaign-protects-greater-sage-grouse
U.S. Energy Information Association. West Virginia State Profile and Energy Estimates. Last modified July 21, 2016. http://www.eia.gov/state/?sid=WV
Welch, Kevin. 2016. “Wind Energy Boom Spurs $77.4 Million Expansion.” Amarillo Globe News, March 4. http://amarillo.com/news/latest-news/2016-03-03/wind-energy-boom-spurs-774m-expansion
WINDExchange. (2016). Installed Wind Capacity. U.S. Department of Energy. Accessed February 16, 2016. http://apps2.eere.energy.gov/wind/windexchange/wind_installed_capacity.asp
WINDExchange. (2016b). Potential Wind Capacity. U.S. Department of Energy. Accessed September 10, 2016. http://apps2.eere.energy.gov/wind/windexchange/windmaps/resource_potential.asp
Van Dam, C.P. “California Offshore Wind Energy: A Personal Vision.” BOEM Offshore Renewable Energy Workshop, July 29-30, 2014.
Walton, Robert. 2016. “Maryland Gov. Hogan Vetoes Increase to State's Renewable Energy Standard.” Utility Dive. May 31. http://www.utilitydive.com/news/maryland-gov-hogan-vetoes-increase-to-states-renewable-energy-standard/420034/

144
This report is available at no cost from the National Renewable Energy Laboratory at www.nrel.gov/publications
Wheeler, Timothy B. 2015a. “Planning for Maryland Offshore Wind Project Gets Underway.” Baltimore Sun, June 20. http://www.baltimoresun.com/features/green/blog/bs-md-offshore-wind-20150619-story.html
Wheeler, Timothy B. 2015b. “Shore Wind Project Scrapped amid Political Roadblocks.” Baltimore Sun, April 6. http://www.baltimoresun.com/features/green/blog/bs-md-wind-energy-hurdles-20150406-story.html
WPPI Energy. “WPPI Energy Seeks Additional Renewables.” Accessed October 22, 2016. https://wppienergy.org/News/NewsItem?item=42
Xcel Energy. Rush Creek Wind Project. Accessed July 13, 2016. https://www.xcelenergy.com/company/rates_&_regulations/filings/rush_creek_wind_project
WIND DEVELOPMENT IN THE UNITED STATESBY REGION
2016 STATE OF
NREL is a national laboratory of the U.S. Department of EnergyOffi ce of Energy Effi ciency and Renewable EnergyOperated by the Alliance for Sustainable Energy, LLC
For more information, visit: http://apps2.eere.energy.gov/wind/windexchange/
National Renewable Energy Laboratory15013 Denver West Parkway Golden, CO 80401
303-275-3000 • www.nrel.gov
NREL is a national laboratory of the U.S. Department of Energy, Office of Energy Efficiency and Renewable Energy, operated by the Alliance for Sustainable Energy, LLC.
TP-5000-67624 • April 2017
NREL prints on paper that contains recycled content.
April 2017